UNITED STATES
SECURITIES AND EXCHANGE COMMISSION
Washington, D.C. 20549
FORM N-CSR
CERTIFIED SHAREHOLDER REPORT OF REGISTERED MANAGEMENT INVESTMENT COMPANIES
Investment Company Act file number 811-21126
Name of Fund: BlackRock Municipal Income Trust II (BLE)
Fund Address: 100 Bellevue Parkway, Wilmington, DE 19809
Name and address of agent for service: John M. Perlowski, Chief Executive Officer, BlackRock Municipal Income Trust II, 55 East 52nd Street, New York, NY 10055
Registrant’s telephone number, including area code: (800) 882-0052, Option 4
Date of fiscal year end: 08/31/2016
Date of reporting period: 02/29/2016
| | |
| |
| Item 1 – | | Report to Stockholders |
FEBRUARY 29, 2016
| | | | |
SEMI-ANNUAL REPORT (UNAUDITED) | | | |  |
BlackRock Municipal Bond Investment Trust (BIE)
BlackRock Municipal Bond Trust (BBK)
BlackRock Municipal Income Investment Quality Trust (BAF)
BlackRock Municipal Income Quality Trust (BYM)
BlackRock Municipal Income Trust II (BLE)
BlackRock MuniHoldings Investment Quality Fund (MFL)
BlackRock MuniVest Fund, Inc. (MVF)
|
| Not FDIC Insured • May Lose Value • No Bank Guarantee |
| | | | | | |
| | | | | | | |
| 2 | | SEMI-ANNUAL REPORT | | FEBRUARY 29, 2016 | | |
Dear Shareholder,
Diverging monetary policies and shifting economic outlooks across regions have been the overarching themes driving financial markets over the past couple of years. With U.S. growth outpacing the global economic recovery while inflationary pressures remained low, investors spent most of 2015 anticipating the curtailment of the Federal Reserve’s near-zero interest rate policy, which ultimately came in December. In contrast, the European Central Bank and the Bank of Japan took measures to stimulate growth. In this environment, the U.S. dollar strengthened considerably, causing profit challenges for U.S. exporters and high levels of volatility in emerging market currencies and commodities.
Global market volatility increased in the latter part of 2015 and continued into early 2016. Oil prices collapsed in mid-2015 due to excess supply, and remained precarious while the world’s largest oil producers sought to negotiate a deal. Developing countries, many of which rely heavily on oil exports to sustain their economies, were particularly affected by falling oil prices. Meanwhile, China, one of the world’s largest oil consumers, exhibited further signs of slowing economic growth. This, combined with a depreciating yuan and declining confidence in the country’s policymakers, stoked worries about the potential impact of China’s weakness on the broader global economy.
Toward the end of the period, volatility abated as investors were relieved to find that conditions were not as bad as previously feared. While the recent selloff in risk assets has resulted in more reasonable valuations and some appealing entry points, investors continue to face mixed economic data and uncertainty relating to oil prices, corporate earnings and an unusual U.S. presidential election season.
For the 12-month period, higher quality assets such as U.S. Treasuries, municipal bonds and investment grade corporate bonds generated positive returns, while risk assets such as equities and high yield bonds broadly declined.
At BlackRock, we believe investors need to think globally, extend their scope across a broad array of asset classes and be prepared to move freely as market conditions change over time. We encourage you to talk with your financial advisor and visit blackrock.com for further insight about investing in today’s markets.
Sincerely,

Rob Kapito
President, BlackRock Advisors, LLC

Rob Kapito
President, BlackRock Advisors, LLC
| | | | | | | | |
| Total Returns as of February 29, 2016 | |
| | | 6-month | | | 12-month | |
U.S. large cap equities
(S&P 500® Index) | | | (0.92 | )% | | | (6.19 | )% |
U.S. small cap equities
(Russell 2000® Index) | | | (10.16 | ) | | | (14.97 | ) |
International equities
(MSCI Europe, Australasia,
Far East Index) | | | (9.48 | ) | | | (15.18 | ) |
Emerging market equities
(MSCI Emerging Markets Index) | | | (8.85 | ) | | | (23.41 | ) |
3-month Treasury bills
(BofA Merrill Lynch 3-Month
U.S. Treasury Bill Index) | | | 0.06 | | | | 0.08 | |
U.S. Treasury securities
(BofA Merrill Lynch
10-Year U.S. Treasury
Index) | | | 5.01 | | | | 4.11 | |
U.S. investment-grade bonds
(Barclays U.S.
Aggregate Bond Index) | | | 2.20 | | | | 1.50 | |
Tax-exempt municipal
bonds (S&P Municipal
Bond Index) | | | 3.56 | | | | 3.78 | |
U.S. high yield bonds
(Barclays U.S. Corporate
High Yield 2% Issuer
Capped Index) | | | (5.57 | ) | | | (8.26 | ) |
| Past performance is no guarantee of future results. Index performance is shown for illustrative purposes only. You cannot invest directly in an index. | |
| | | | | | |
| | | | | | | |
| | THIS PAGE NOT PART OF YOUR FUND REPORT | | | | 3 |
| | | | |
| Municipal Market Overview | | |
| | |
| For the Reporting Period Ended February 29, 2016 | | |
Municipal Market Conditions
Municipal bonds generated positive performance for the period, due to a favorable supply-and-demand environment. Interest rates were volatile in 2015 (bond prices rise as rates fall) leading up to a long-awaited rate hike from the U.S. Federal Reserve (the “Fed”) that ultimately came in December. However, ongoing reassurance from the Fed that rates would be increased gradually and would likely remain low overall resulted in strong demand for fixed income investments, with municipal bonds being one of the strongest-performing sectors. Investors favored the relative stability of municipal bonds amid bouts of volatility resulting from uneven U.S. economic data, falling oil prices, global growth concerns, geopolitical risks, and widening central bank divergence — i.e., policy easing outside the United States while the Fed was posturing to commence policy tightening. During the 12 months ended February 29, 2016, municipal bond funds garnered net inflows of approximately $18 billion (based on data from the Investment Company Institute).
For the same 12-month period, total new issuance remained relatively strong from a historical perspective at $390 billion (considerably higher than the $365 billion issued in the prior 12-month period). A noteworthy portion of new supply during this period was attributable to refinancing activity (roughly 60%) as issuers took advantage of low interest rates and a flatter yield curve to reduce their borrowing costs.
|
S&P Municipal Bond Index |
Total Returns as of February 29, 2016 |
6 months: 3.56% |
12 months: 3.78% |
A Closer Look at Yields
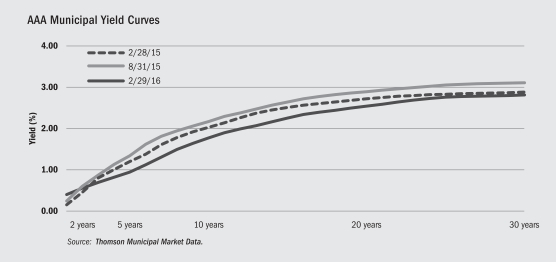
From February 28, 2015 to February 29, 2016, yields on AAA-rated 30-year municipal bonds decreased by 7 basis points (“bps”) from 2.87% to 2.80%, while 10-year rates fell by 26 bps from 2.02% to 1.76% and 5-year rates decreased 26 bps from 1.19% to 0.93% (as measured by Thomson Municipal Market Data). The municipal yield curve experienced significant flattening over the 12-month period with the spread between 2- and 30-year maturities flattening by 17 bps and the spread between 2- and 10-year maturities flattening by 36 bps.
During the same time period, on a relative basis, tax-exempt municipal bonds broadly outperformed U.S. Treasuries with the greatest outperformance experienced in longer-term issues. In absolute terms, the positive performance of municipal bonds was driven largely by a supply/demand imbalance within the municipal market as investors sought income and incremental yield in an environment where opportunities had become scarce. More broadly, municipal bonds benefited from the greater appeal of tax-exempt investing in light of the higher tax rates implemented in 2014. The asset class is known for its lower relative volatility and preservation of principal with an emphasis on income as tax rates rise.
Financial Conditions of Municipal Issuers
The majority of municipal credits remain strong, despite well-publicized distress among a few issuers. Four of the five states with the largest amount of debt outstanding — California, New York, Texas and Florida — have exhibited markedly improved credit fundamentals during the slow national recovery. However, several states with the largest unfunded pension liabilities have seen their bond prices decline noticeably and remain vulnerable to additional price deterioration. On the local level, Chicago’s credit quality downgrade is an outlier relative to other cities due to its larger pension liability and inadequate funding remedies. BlackRock maintains the view that municipal bond defaults will remain minimal and in the periphery while the overall market is fundamentally sound. We continue to advocate careful credit research and believe that a thoughtful approach to structure and security selection remains imperative amid uncertainty in a modestly improving economic environment.
The opinions expressed are those of BlackRock as of February 29, 2016, and are subject to change at any time due to changes in market or economic conditions. The comments should not be construed as a recommendation of any individual holdings or market sectors. Investing involves risk including loss of principal. Bond values fluctuate in price so the value of your investment can go down depending on market conditions. Fixed income risks include interest-rate and credit risk. Typically, when interest rates rise, there is a corresponding decline in bond values. Credit risk refers to the possibility that the bond issuer will not be able to make principal and interest payments. There may be less information on the financial condition of municipal issuers than for public corporations. The market for municipal bonds may be less liquid than for taxable bonds. Some investors may be subject to Alternative Minimum Tax (AMT). Capital gains distributions, if any, are taxable.
The Standard & Poor’s Municipal Bond Index, a broad, market value-weighted index, seeks to measure the performance of the U.S. municipal bond market. All bonds in the index are exempt from U.S. federal income taxes or subject to the alternative minimum tax. Past performance is no guarantee of future results. Index performance is shown for illustrative purposes only. It is not possible to invest directly in an index.
| | | | | | |
| | | | | | | |
| 4 | | SEMI-ANNUAL REPORT | | FEBRUARY 29, 2016 | | |
| | |
| The Benefits and Risks of Leveraging | | |
The Trusts may utilize leverage to seek to enhance the distribution rate on, and net asset value (“NAV”) of, their common shares (“Common Shares”). However, these objectives cannot be achieved in all interest rate environments.
In general, the concept of leveraging is based on the premise that the financing cost of leverage, which is based on short-term interest rates, is normally lower than the income earned by a Trust on its longer-term portfolio investments purchased with the proceeds from leverage. To the extent that the total assets of the Trusts (including the assets obtained from leverage) are invested in higher-yielding portfolio investments, the Trusts’ shareholders benefit from the incremental net income. The interest earned on securities purchased with the proceeds from leverage is paid to shareholders in the form of dividends, and the value of these portfolio holdings is reflected in the per share NAV.
To illustrate these concepts, assume a Trust’s Common Shares capitalization is $100 million and it utilizes leverage for an additional $30 million, creating a total value of $130 million available for investment in longer-term income securities. If prevailing short-term interest rates are 3% and longer-term interest rates are 6%, the yield curve has a strongly positive slope. In this case, a Trust’s financing costs on the $30 million of proceeds obtained from leverage are based on the lower short-term interest rates. At the same time, the securities purchased by a Trust with the proceeds from leverage earn income based on longer-term interest rates. In this case, a Trust’s financing cost of leverage is significantly lower than the income earned on a Trust’s longer-term investments acquired from leverage proceeds, and therefore the holders of Common Shares (“Common Shareholders”) are the beneficiaries of the incremental net income.
However, in order to benefit Common Shareholders, the return on assets purchased with leverage proceeds must exceed the ongoing costs associated with the leverage. If interest and other costs of leverage exceed the Trusts’ return on assets purchased with leverage proceeds, income to shareholders is lower than if the Trusts had not used leverage. Furthermore, the value of the Trusts’ portfolio investments generally varies inversely with the direction of long-term interest rates, although other factors can influence the value of portfolio investments. In contrast, the value of the Trusts’ obligations under their respective leverage arrangements generally does not fluctuate in relation to interest rates. As a result, changes in interest rates can influence the Trusts’ NAVs positively or negatively. Changes in the future direction of interest rates are very
difficult to predict accurately, and there is no assurance that a Trust’s intended leveraging strategy will be successful.
Leverage also generally causes greater changes in the Trusts’ NAVs, market prices and dividend rates than comparable portfolios without leverage. In a declining market, leverage is likely to cause a greater decline in the NAV and market price of a Trust’s Common Shares than if the Trusts were not leveraged. In addition, the Trusts may be required to sell portfolio securities at inopportune times or at distressed values in order to comply with regulatory requirements applicable to the use of leverage or as required by the terms of leverage instruments, which may cause the Trusts to incur losses. The use of leverage may limit a Trust’s ability to invest in certain types of securities or use certain types of hedging strategies. The Trusts incur expenses in connection with the use of leverage, all of which are borne by Common Shareholders and may reduce income to the Common Shares. Moreover, to the extent the calculation of the Trusts’ investment advisory fees includes assets purchased with the proceeds of leverage, the investment advisory fees payable to the Trusts’ investment advisor will be higher than if the Trusts did not use leverage.
To obtain leverage, each Trust has issued Variable Rate Demand Preferred Shares (“VRDP Shares”) or Variable Rate Muni Term Preferred Shares (“VMTP Shares”) (collectively, “Preferred Shares”) and/or leveraged its assets through the use of tender option bond trusts (“TOB Trusts”) as described in the Notes to Financial Statements.
Under the Investment Company Act of 1940, as amended (the “1940 Act”), each Trust is permitted to issue debt up to 33 1/3% of its total managed assets or equity securities (e.g., Preferred Shares) up to 50% of its total managed assets. A Trust may voluntarily elect to limit its leverage to less than the maximum amount permitted under the 1940 Act. In addition, a Trust may also be subject to certain asset coverage, leverage or portfolio composition requirements imposed by the Preferred Shares’ governing instruments or by agencies rating the Preferred Shares, which may be more stringent than those imposed by the 1940 Act.
If a Trust segregates or designates on its books and records cash or liquid assets having a value not less than the value of a Trust’s obligations under the TOB Trust (including accrued interest), a TOB Trust is not considered a senior security and is not subject to the foregoing limitations and requirements under the 1940 Act.
| | | | |
| Derivative Financial Instruments | | |
The Trusts may invest in various derivative financial instruments. Derivative financial instruments are used to obtain exposure to a security, index and/or market without owning or taking physical custody of securities or to manage market, equity, credit, interest rate, foreign currency exchange rate, commodity and/or other risks. Derivative financial instruments may give rise to a form of economic leverage. Derivative financial instruments also involve risks, including the imperfect correlation between the value of a derivative financial instrument and the underlying asset, possible default of the counterparty to the transaction or illiquidity of the
derivative financial instrument. The Trusts’ ability to use a derivative financial instrument successfully depends on the investment advisor’s ability to predict pertinent market movements accurately, which cannot be assured. The use of derivative financial instruments may result in losses greater than if they had not been used, may limit the amount of appreciation a Trust can realize on an investment and/or may result in lower distributions paid to shareholders. The Trusts’ investments in these instruments, if any, are discussed in detail in the Notes to Financial Statements.
| | | | | | |
| | | | | | | |
| | SEMI-ANNUAL REPORT | | FEBRUARY 29, 2016 | | 5 |
| | |
| Trust Summary as of February 29, 2016 | | BlackRock Municipal Bond Investment Trust |
BlackRock Municipal Bond Investment Trust’s (BIE) (the “Trust”) investment objective is to provide current income exempt from regular federal income tax and Florida intangible personal property tax. The Trust seeks to achieve its investment objective by investing at least 80% of its assets in municipal bonds the interest of which is exempt from federal income taxes (except that the interest may be subject to the federal alternative minimum tax) and Florida intangible personal property tax. Under normal market conditions, the Trust invests at least 80% of its assets in municipal bonds that are investment grade quality at the time of investment. The Trust may invest directly in such securities or synthetically through the use of derivatives. Due to the repeal of the Florida intangible personal property tax, in September 2008, the Board gave approval to permit the Trust the flexibility to invest in municipal obligations regardless of geographic location since municipal obligations issued by any state or municipality that provides income exempt from regular federal income tax would now satisfy the foregoing objective and policy.
On December 18, 2015, the Boards of the Trust and BlackRock Municipal Income Investment Trust (“BBF’’) approved the reorganization of the Trust with and into BBF, with BBF continuing as the surviving fund after the reorganization. At a special shareholder meeting on March 21, 2016, the shareholders of the Trust approved the reorganization of the Trust with and into BBF, which is expected to be completed in May 2016.
No assurance can be given that the Trust’s investment objective will be achieved.
| | |
Symbol on New York Stock Exchange (“NYSE”) | | BIE |
Initial Offering Date | | April 30, 2002 |
Yield on Closing Market Price as of February 29, 2016 ($15.54)1 | | 5.87% |
Tax Equivalent Yield2 | | 10.37% |
Current Monthly Distribution per Common Share3 | | $0.076 |
Current Annualized Distribution per Common Share3 | | $0.912 |
Economic Leverage as of February 29, 20164 | | 39% |
| | 1 | | Yield on closing market price is calculated by dividing the current annualized distribution per share by the closing market price. Past performance does not guarantee future results. |
| | 2 | | Tax equivalent yield assumes the maximum marginal federal tax rate of 43.4%, which includes the 3.8% Medicare tax. Actual tax rates will vary based on income, exemptions and deductions. Lower taxes will result in lower tax equivalent yields. |
| | 3 | | The distribution rate is not constant and is subject to change. |
| | 4 | | Represents VRDP Shares and TOB Trusts as a percentage of total managed assets, which is the total assets of the Trust, including any assets attributable to VRDP Shares and TOB Trusts, minus the sum of accrued liabilities. For a discussion of leveraging techniques utilized by the Trust, please see The Benefits and Risks of Leveraging on page 5. |
Returns for the six months ended February 29, 2016 were as follows:
| | | | | | | | |
| | | Returns Based On | |
| | | Market Price | | | NAV | |
BIE1,2 | | | 13.63 | % | | | 4.46 | % |
Lipper General & Insured Municipal Debt Funds (Leveraged)3 | | | 11.72 | % | | | 5.87 | % |
| | 1 | | All returns reflect reinvestment of dividends and/or distributions. |
| | 2 | | The Trust’s discount to NAV, which narrowed during the period, accounts for the difference between performance based on price and performance based on NAV. |
The following discussion relates to the Trust’s absolute performance based on NAV:
| • | | Tax-exempt bonds performed well during the six-month period, as the combination of falling U.S. Treasury yields and improving municipal finances created healthy buying interest in the asset class. (Prices rise as yields fall.) In addition, municipal bonds benefited from a general “flight to quality” caused by elevated volatility in the higher-risk segments of the financial markets. |
| • | | The Trust’s position in A-rated bonds, which outperformed higher-rated bonds amid investors’ continued search for yield, made a positive contribution to its six-month results. This was especially true with regard to the Trust’s position in longer-dated, A-rated bonds in the transportation, utilities and tax-backed local sectors. |
| • | | At a time in which yields declined, the Trust’s longer-duration holdings contributed positively to its performance. (Duration is a measure of interest rate sensitivity.) Income in the form of coupon payments made a meaningful contribution to the Trust’s total return. Leverage also amplifies the effect of interest rate movements, which was a positive for Trust performance during the past six months. |
| • | | The Trust’s positions in shorter-dated holdings, such as pre-refunded issues and bonds with very short call dates, detracted from performance. The Trust’s use of U.S. Treasury futures contracts to manage interest rate risk had a slightly negative impact on performance due to the overall strength in bond prices. |
| | | | | | |
| | | | | | | |
| 6 | | SEMI-ANNUAL REPORT | | FEBRUARY 29, 2016 | | |
| | |
| | | BlackRock Municipal Bond Investment Trust |
| | |
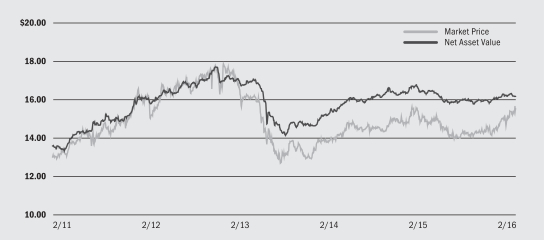
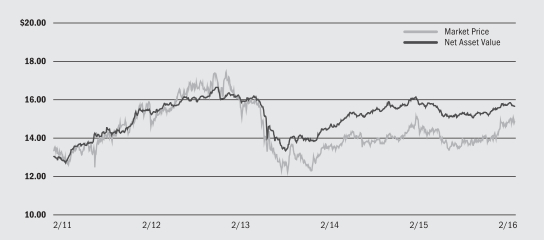
| Market Price and Net Asset Value Per Share Summary | | |
| | | | | | | | | | | | | | | | | | | | |
| | | 2/29/16 | | | 8/31/15 | | | Change | | | High | | | Low | |
Market Price | | $ | 15.54 | | | $ | 14.10 | | | | 10.21 | % | | $ | 15.70 | | | $ | 14.07 | |
Net Asset Value | | $ | 16.16 | | | $ | 15.95 | | | | 1.32 | % | | $ | 16.31 | | | $ | 15.76 | |
|
| Market Price and Net Asset Value History For the Past Five Years |
|
| Overview of the Trust’s Total Investments* |
| | | | | | | | |
| Sector Allocation | | | | | | |
| | | 2/29/16 | | | 8/31/15 | |
Transportation | | | 26 | % | | | 28 | % |
County/City/Special District/School District | | | 23 | | | | 24 | |
Utilities | | | 16 | | | | 15 | |
Health | | | 12 | | | | 12 | |
Education | | | 11 | | | | 8 | |
State | | | 7 | | | | 8 | |
Tobacco | | | 3 | | | | 3 | |
Corporate | | | 1 | | | | 1 | |
Housing | | | 1 | | | | 1 | |
| | | | |
| Call/Maturity Schedule3 | | | |
Calendar Year Ended December 31, | | | | |
2016 | | | 2 | % |
2017 | | | 1 | |
2018 | | | 16 | |
2019 | | | 30 | |
2020 | | | 12 | |
| | 3 | | Scheduled maturity dates and/or bonds that are subject to potential calls by issuers over the next five years. |
| | | | | | | | |
| Credit Quality Allocation1 | | | | | | |
| | | 2/29/16 | | | 8/31/15 | |
AAA/Aaa | | | 6 | % | | | 7 | % |
AA/Aa | | | 59 | | | | 60 | |
A | | | 25 | | | | 24 | |
BBB/Baa | | | 6 | | | | 6 | |
BB/Ba | | | 1 | | | | 1 | |
B | | | — | 2 | | | 1 | |
N/R | | | 3 | | | | 1 | |
| | 1 | | For financial reporting purposes, credit quality ratings shown above reflect the highest rating assigned by either Standard & Poor’s (“S&P”) or Moody’s Investors Service (“Moody’s”) if ratings differ. These rating agencies are independent, nationally recognized statistical rating organizations and are widely used. Investment grade ratings are credit ratings of BBB/Baa or higher. Below investment grade ratings are credit ratings of BB/Ba or lower. Investments designated N/R are not rated by either rating agency. Unrated investments do not necessarily indicate low credit quality. Credit quality ratings are subject to change. |
| | 2 | | Represents less than 1% of total investments. |
| | * | | Excludes short-term securities. |
| | | | | | |
| | | | | | | |
| | SEMI-ANNUAL REPORT | | FEBRUARY 29, 2016 | | 7 |
| | | | |
| Trust Summary as of February 29, 2016 | | BlackRock Municipal Bond Trust |
BlackRock Municipal Bond Trust’s (BBK) (the “Trust”) investment objective is to provide current income exempt from regular federal income tax. The Trust seeks to achieve its investment objective by investing primarily in municipal bonds exempt from regular federal income taxes (except that the interest may be subject to the federal alternative minimum tax). The Trust invests, under normal market conditions, at least 80% of its assets in municipal bonds that are investment grade quality. The Trust may invest directly in such securities or synthetically through the use of derivatives.
No assurance can be given that the Trust’s investment objective will be achieved.
| | |
Symbol on NYSE | | BBK |
Initial Offering Date | | April 30, 2002 |
Yield on Closing Market Price as of February 29, 2016 ($16.78)1 | | 5.36% |
Tax Equivalent Yield2 | | 9.47% |
Current Monthly Distribution per Common Share3 | | $0.075 |
Current Annualized Distribution per Common Share3 | | $0.900 |
Economic Leverage as of February 29, 20164 | | 36% |
| | 1 | | Yield on closing market price is calculated by dividing the current annualized distribution per share by the closing market price. Past performance does not guarantee future results. |
| | 2 | | Tax equivalent yield assumes the maximum marginal federal tax rate of 43.4%, which includes the 3.8% Medicare tax. Actual tax rates will vary based on income, exemptions and deductions. Lower taxes will result in lower tax equivalent yields. |
| | 3 | | The distribution rate is not constant and is subject to change. |
| | 4 | | Represents VMTP Shares and TOB Trusts as a percentage of total managed assets, which is the total assets of the Trust, including any assets attributable to VMTP Shares and TOB Trusts, minus the sum of accrued liabilities. For a discussion of leveraging techniques utilized by the Trust, please see The Benefits and Risks of Leveraging on page 5. |
Returns for the six months ended February 29, 2016 were as follows:
| | | | | | | | |
| | | Returns Based On | |
| | | Market Price | | | NAV | |
BBK1,2 | | | 13.39 | % | | | 5.85 | % |
Lipper General & Insured Municipal Debt Funds (Leveraged)3 | | | 11.72 | % | | | 5.87 | % |
| | 1 | | All returns reflect reinvestment of dividends and/or distributions. |
| | 2 | | The Trust’s discount to NAV, which narrowed during the period, accounts for the difference between performance based on price and performance based on NAV. |
The following discussion relates to the Trust’s absolute performance based on NAV:
| • | | Tax-exempt bonds performed well during the six-month period, as the combination of falling U.S. Treasury yields and improving municipal finances created healthy buying interest in the asset class. (Prices rise as yields fall.) In addition, municipal bonds benefited from a general “flight to quality” caused by elevated volatility in the higher-risk segments of the financial markets. |
| • | | The Trust’s longer duration bonds generally delivered the best performance during the past six months, reflecting the overall decline in yields. (Duration is a measure of interest rate sensitivity.) On a sector basis, the Trust’s positions in the education, health care, transportation and utilities segments were key contributors to performance. The Trust’s allocation to higher-yielding bonds also contributed positively, reflecting the fact that the middle-to-lower investment-grade quality categories of A and BBB generated the strong returns. |
| • | | Income in the form of coupon payments made a meaningful contribution to the Trust’s total return. Leverage also amplifies the effect of interest rate movements, which was a positive for Trust performance during the past six months. |
| • | | The Trust’s use of U.S. Treasury futures contracts to manage interest rate risk had a slightly negative impact on performance due to the overall strength in bond prices. |
| | | | | | |
| | | | | | | |
| 8 | | SEMI-ANNUAL REPORT | | FEBRUARY 29, 2016 | | |
| | |
| | | BlackRock Municipal Bond Trust |
| | | | | | | | | | | | | | | | | | | | |
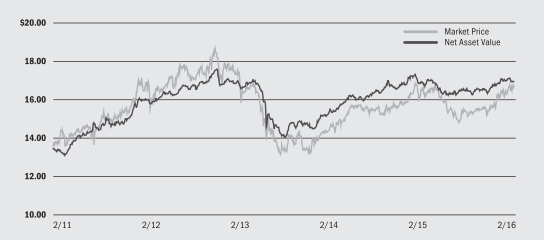
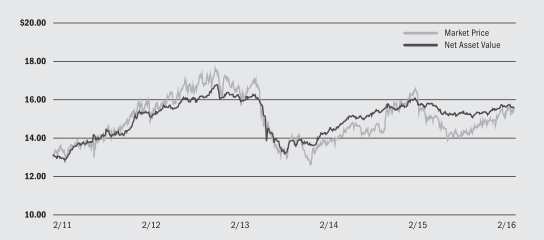
| Market Price and Net Asset Value Per Share Summary | |
| | | 2/29/16 | | | 8/31/15 | | | Change | | | High | | | Low | |
Market Price | | | $16.78 | | | | $15.23 | | | | 10.18% | | | | $16.85 | | | | $15.21 | |
Net Asset Value | | | $16.96 | | | | $16.49 | | | | 2.85% | | | | $17.15 | | | | $16.28 | |
|
| Market Price and Net Asset Value History For the Past Five Years |
|
| Overview of the Trust’s Total Investments* |
| | | | | | | | |
| Sector Allocation | | | | | | |
| | | 2/29/16 | | | 8/31/15 | |
Health | | | 20 | % | | | 23 | % |
County/City/Special District/School District | | | 17 | | | | 16 | |
Transportation | | | 15 | | | | 13 | |
Education | | | 15 | | | | 16 | |
Utilities | | | 13 | | | | 13 | |
State | | | 9 | | | | 9 | |
Corporate | | | 7 | | | | 6 | |
Tobacco | | | 3 | | | | 3 | |
Housing | | | 1 | | | | 1 | |
| | | | |
| Call/Maturity Schedule3 | | | |
Calendar Year Ended December 31, | | | | |
2016 | | | 1 | % |
2017 | | | 1 | |
2018 | | | 3 | |
2019 | | | 2 | |
2020 | | | 2 | |
| | 3 | | Scheduled maturity dates and/or bonds that are subject to potential calls by issuers over the next five years. |
| | | | | | | | |
| Credit Quality Allocation1 | | | | | | |
| | | 2/29/16 | | | 8/31/15 | |
AAA/Aaa | | | 5 | % | | | 6 | % |
AA/Aa | | | 45 | | | | 43 | |
A | | | 25 | | | | 27 | |
BBB/Baa | | | 12 | | | | 11 | |
BB/Ba | | | 4 | | | | 6 | |
B | | | 1 | | | | — | |
N/R2 | | | 8 | | | | 7 | |
| | 1 | | For financial reporting purposes, credit quality ratings shown above reflect the highest rating assigned by either S&P’s or Moody’s if ratings differ. These rating agencies are independent, nationally recognized statistical rating organizations and are widely used. Investment grade ratings are credit ratings of BBB/Baa or higher. Below investment grade ratings are credit ratings of BB/Ba or lower. Investments designated N/R are not rated by either rating agency. Unrated investments do not necessarily indicate low credit quality. Credit quality ratings are subject to change. |
| | 2 | | The investment advisor evaluates the credit quality of unrated investments based upon certain factors including, but not limited to, credit ratings for similar investments and financial analysis of sectors and individual investments. Using this approach, the investment advisor has deemed certain of these unrated securities as investment grade quality. As of February 29, 2016 and August 31, 2015, the market value of unrated securities deemed by the investment advisor to be investment grade represents 3% and 2%, respectively, of the Trust’s total investments. |
| | * | | Excludes short-term securities. |
| | | | | | |
| | | | | | | |
| | SEMI-ANNUAL REPORT | | FEBRUARY 29, 2016 | | 9 |
| | |
| Trust Summary as of February 29, 2016 | | BlackRock Municipal Income Investment Quality Trust |
BlackRock Municipal Income Investment Quality Trust’s (BAF) (the “Trust”) investment objective is to provide current income exempt from federal income tax, including the alternative minimum tax and Florida intangible property tax. The Trust seeks to achieve its investment objective by investing, under normal circumstances, at least 80% of its assets in municipal bonds exempt from federal income taxes, including the alternative minimum tax. The Trust also invests at least 80% of its assets in municipal bonds that are investment grade quality at the time of investment. The Trust may invest directly in such securities or synthetically through the use of derivatives. Due to the repeal of the Florida intangible personal property tax, in September 2008, the Board gave approval to permit the Trust the flexibility to invest in municipal obligations regardless of geographic location since municipal obligations issued by any state or municipality that provides income exempt from regular federal income tax would now satisfy the foregoing objective and policy.
No assurance can be given that the Trust’s investment objective will be achieved.
| | |
Symbol on NYSE | | BAF |
Initial Offering Date | | October 31, 2002 |
Yield on Closing Market Price as of February 29, 2016 ($15.21)1 | | 5.40% |
Tax Equivalent Yield2 | | 9.54% |
Current Monthly Distribution per Common Share3 | | $0.0685 |
Current Annualized Distribution per Common Share3 | | $0.8220 |
Economic Leverage as of February 29, 20164 | | 36% |
| | 1 | | Yield on closing market price is calculated by dividing the current annualized distribution per share by the closing market price. Past performance does not guarantee future results. |
| | 2 | | Tax equivalent yield assumes the maximum marginal federal tax rate of 43.4%, which includes the 3.8% Medicare tax. Actual tax rates will vary based on income, exemptions and deductions. Lower taxes will result in lower tax equivalent yields. |
| | 3 | | The distribution rate is not constant and is subject to change. |
| | 4 | | Represents VMTP Shares and TOB Trusts as a percentage of total managed assets, which is the total assets of the Trust, including any assets attributable to VMTP Shares and TOB Trusts, minus the sum of accrued liabilities. For a discussion of leveraging techniques utilized by the Trust, please see The Benefits and Risks of Leveraging on page 5. |
Returns for the six months ended February 29, 2016 were as follows:
| | | | | | | | |
| | | Returns Based On | |
| | | Market Price | | | NAV | |
BAF1,2 | | | 12.59 | % | | | 5.30 | % |
Lipper General & Insured Municipal Debt Funds (Leveraged)3 | | | 11.72 | % | | | 5.87 | % |
| | 1 | | All returns reflect reinvestment of dividends and/or distributions. |
| | 2 | | The Trust’s discount to NAV, which narrowed during the period, accounts for the difference between performance based on price and performance based on NAV. |
The following discussion relates to the Trust’s absolute performance based on NAV:
| • | | Tax-exempt bonds performed well during the six-month period, as the combination of falling U.S. Treasury yields and improving municipal finances created healthy buying interest in the asset class. (Prices rise as yields fall.) In addition, municipal bonds benefited from a general “flight to quality” caused by elevated volatility in the higher-risk segments of the financial markets. |
| • | | The Trust’s position in A-rated bonds, which outperformed higher-rated bonds amid investors’ continued search for yield, made a positive contribution to its six-month results. This was especially true with regard to the Trust’s position in longer-dated, A-rated bonds in the transportation, utilities and tax-backed local sectors. |
| • | | At a time in which yields declined, the Trust’s longer-duration holdings contributed positively to its performance. (Duration is a measure of interest rate sensitivity.) Income in the form of coupon payments made a meaningful contribution to the Trust’s total return. Leverage also amplifies the effect of interest rate movements, which was a positive for trust performance during the past six months. |
| • | | The Trust’s positions in shorter-dated holdings, such as pre-refunded issues and bonds with very short call dates, detracted from performance. The Trust’s use of U.S. Treasury futures contracts to manage interest rate risk had a slightly negative impact on performance due to the overall strength in bond prices. |
| | | | | | |
| | | | | | | |
| 10 | | SEMI-ANNUAL REPORT | | FEBRUARY 29, 2016 | | |
| | |
| | | BlackRock Municipal Income Investment Quality Trust |
| | | | | | | | | | | | | | | | | | | | |
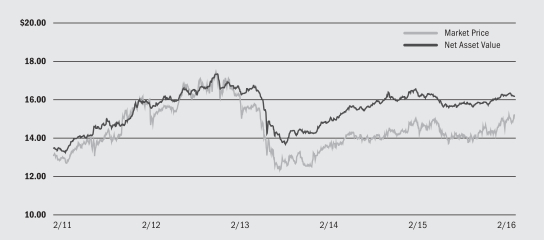
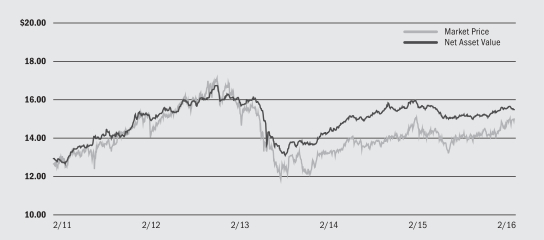
| Market Price and Net Asset Value Per Share Summary | | | | | | | | | | | | | | | |
| | | 2/29/16 | | | 8/31/15 | | | Change | | | High | | | Low | |
Market Price | | | $15.21 | | | | $13.89 | | | | 9.50% | | | | $15.23 | | | | $13.81 | |
Net Asset Value | | | $16.18 | | | | $15.80 | | | | 2.41% | | | | $16.35 | | | | $15.63 | |
|
| Market Price and Net Asset Value History For the Past Five Years |
|
| Overview of the Trust’s Total Investments* |
| | | | | | | | |
| Sector Allocation | | | | | | |
| | | 2/29/16 | | | 8/31/15 | |
Transportation | | | 31 | % | | | 28 | % |
County/City/Special District/School District | | | 28 | | | | 31 | |
Utilities | | | 14 | | | | 17 | |
Health | | | 12 | | | | 13 | |
State | | | 8 | | | | 6 | |
Education | | | 4 | | | | 3 | |
Tobacco | | | 1 | | | | 1 | |
Corporate | | | 1 | | | | — | |
Housing | | | 1 | | | | 1 | |
| | | | | | | | |
| Credit Quality Allocation1 | | | | | | |
| | | 2/29/16 | | | 8/31/15 | |
AAA/Aaa | | | 3 | % | | | 3 | % |
AA/Aa | | | 74 | | | | 74 | |
A | | | 20 | | | | 20 | |
BBB/Baa | | | 3 | | | | 3 | |
| | 1 | | For financial reporting purposes, credit quality ratings shown above reflect the highest rating assigned by either S&P’s or Moody’s if ratings differ. These rating agencies are independent, nationally recognized statistical rating organizations and are widely used. Investment grade ratings are credit ratings of BBB/Baa or higher. Below investment grade ratings are credit ratings of BB/Ba or lower. Investments designated N/R are not rated by either rating agency. Unrated investments do not necessarily indicate low credit quality. Credit quality ratings are subject to change. |
| | | | |
| Call/Maturity Schedule2 | | | |
Calendar Year Ended December 31, | | | | |
2016 | | | — | |
2017 | | | — | |
2018 | | | 14 | % |
2019 | | | 18 | |
2020 | | | 3 | |
| | 2 | | Scheduled maturity dates and/or bonds that are subject to potential calls by issuers over the next five years. |
| | * | | Excludes short-term securities. |
| | | | | | |
| | | | | | | |
| | SEMI-ANNUAL REPORT | | FEBRUARY 29, 2016 | | 11 |
| | | | |
| Trust Summary as of February 29, 2016 | | BlackRock Municipal Income Quality Trust |
BlackRock Municipal Income Quality Trust’s (BYM) (the “Trust”) investment objective is to provide current income exempt from federal income taxes, including the alternative minimum tax. The Trust seeks to achieve its investment objective by investing, under normal circumstances, at least 80% of its assets in municipal bonds exempt from federal income taxes, including the alternative minimum tax. The Trust also invests at least 80% of its assets in municipal bonds that are investment grade quality at the time of investment. The Trust may invest directly in such securities or synthetically through the use of derivatives.
No assurance can be given that the Trust’s investment objective will be achieved.
| | |
Symbol on NYSE | | BYM |
Initial Offering Date | | October 31, 2002 |
Yield on Closing Market Price as of February 29, 2016 ($14.85)1 | | 5.78% |
Tax Equivalent Yield2 | | 10.21% |
Current Monthly Distribution per Common Share3 | | $0.0715 |
Current Annualized Distribution per Common Share3 | | $0.8580 |
Economic Leverage as of February 29, 20164 | | 36% |
| | 1 | | Yield on closing market price is calculated by dividing the current annualized distribution per share by the closing market price. Past performance does not guarantee future results. |
| | 2 | | Tax equivalent yield assumes the maximum marginal federal tax rate of 43.4%, which includes the 3.8% Medicare tax. Actual tax rates will vary based on income, exemptions and deductions. Lower taxes will result in lower tax equivalent yields. |
| | 3 | | The monthly distribution per Common Share, declared on March 1, 2016, was decreased to $0.0685 per share. The yield on closing market price, current monthly distribution per Common Share and current annualized distribution per Common Share do not reflect the new distribution rate. The new distribution rate is not constant and is subject to change in the future. |
| | 4 | | Represents VMTP Shares and TOB Trusts as a percentage of total managed assets, which is the total assets of the Trust, including any assets attributable to VMTP Shares and TOB Trusts, minus the sum of accrued liabilities. For a discussion of leveraging techniques utilized by the Trust, please see The Benefits and Risks of Leveraging on page 5. |
Returns for the six months ended February 29, 2016 were as follows:
| | | | | | | | |
| | | Returns Based On | |
| | | Market Price | | | NAV | |
BYM1,2 | | | 11.90 | % | | | 5.99 | % |
Lipper General & Insured Municipal Debt Funds (Leveraged)3 | | | 11.72 | % | | | 5.87 | % |
| | 1 | | All returns reflect reinvestment of dividends and/or distributions. |
| | 2 | | The Trust’s discount to NAV, which narrowed during the period, accounts for the difference between performance based on price and performance based on NAV. |
The following discussion relates to the Trust’s absolute performance based on NAV:
| • | | Tax-exempt bonds performed well during the six-month period, as the combination of falling U.S. Treasury yields and improving municipal finances created healthy buying interest in the asset class. (Prices rise as yields fall.) In addition, municipal bonds benefited from a general “flight to quality” caused by elevated volatility in the higher-risk segments of the financial markets. |
| • | | At a time in which yields declined, the Trust’s longer-duration exposure contributed positively to performance. (Duration is a measure of interest rate sensitivity.) Income in the form of coupon payments made a meaningful contribution to the Trust’s total return. Leverage amplifies the effect of interest rate movements, which was a positive for Trust performance during the past six months. The Trust also benefited from its exposure to the tax-backed local sector. |
| • | | The Trust’s use of U.S. Treasury futures contracts to manage interest rate risk had a slightly negative impact on performance due to the overall strength in bond prices. |
| | | | | | |
| | | | | | | |
| 12 | | SEMI-ANNUAL REPORT | | FEBRUARY 29, 2016 | | |
| | |
| | | BlackRock Municipal Income Quality Trust |
| | | | | | | | | | | | | | | | | | | | |
| Market Price and Net Asset Value Per Share Summary | | | | | | | | | | | | | | | |
| | | 2/29/16 | | | 8/31/15 | | | Change | | | High | | | Low | |
Market Price | | | $14.85 | | | | $13.67 | | | | 8.63 | % | | $ | 15.06 | | | $ | 13.56 | |
Net Asset Value | | | $15.65 | | | | $15.21 | | | | 2.89 | % | | $ | 15.83 | | | $ | 15.05 | |
|
| Market Price and Net Asset Value History For the Past Five Years |
|
| Overview of the Trust’s Total Investments* |
| | | | | | | | |
| Sector Allocation | | | | | | |
| | | 2/29/16 | | | 8/31/15 | |
County/City/Special District/School District | | | 29 | % | | | 27 | % |
Transportation | | | 27 | | | | 25 | |
Utilities | | | 12 | | | | 11 | |
Health | | | 10 | | | | 13 | |
State | | | 10 | | | | 11 | |
Education | | | 7 | | | | 7 | |
Tobacco | | | 3 | | | | 3 | |
Corporate | | | 2 | | | | 3 | |
| | | | | | | | |
| Credit Quality Allocation1 | | | | | | |
| | | 2/29/16 | | | 8/31/15 | |
AAA/Aaa | | | 11 | % | | | 15 | % |
AA/Aa | | | 54 | | | | 57 | |
A | | | 26 | | | | 21 | |
BBB/Baa | | | 6 | | | | 6 | |
N/R | | | 3 | | | | 1 | |
| | 1 | | For financial reporting purposes, credit quality ratings shown above reflect the highest rating assigned by either S&P’s or Moody’s if ratings differ. These rating agencies are independent, nationally recognized statistical rating organizations and are widely used. Investment grade ratings are credit ratings of BBB/Baa or higher. Below investment grade ratings are credit ratings of BB/Ba or lower. Investments designated N/R are not rated by either rating agency. Unrated investments do not necessarily indicate low credit quality. Credit quality ratings are subject to change. |
| | | | |
| Call/Maturity Schedule2 | | | |
Calendar Year Ended December 31, | | | | |
2016 | | | 5 | % |
2017 | | | 7 | |
2018 | | | 16 | |
2019 | | | 8 | |
2020 | | | 8 | |
| | 2 | | Scheduled maturity dates and/or bonds that are subject to potential calls by issuers over the next five years. |
| | * | | Excludes short-term securities. |
| | | | | | |
| | | | | | | |
| | SEMI-ANNUAL REPORT | | FEBRUARY 29, 2016 | | 13 |
| | |
| Trust Summary as of February 29, 2016 | | BlackRock Municipal Income Trust II |
BlackRock Municipal Income Trust II’s (BLE) (the “Trust”) investment objective is to provide current income exempt from regular federal income tax. The Trust seeks to achieve its investment objective by investing primarily in municipal bonds exempt from federal income taxes (except that the interest may be subject to the federal alternative minimum tax). The Trust invests, under normal market conditions, at least 80% of its assets in municipal bonds that are investment grade quality at the time of investment. The Trust may invest directly in such securities or synthetically through the use of derivatives.
No assurance can be given that the Trust’s investment objective will be achieved.
| | |
Symbol on NYSE MKT | | BLE |
Initial Offering Date | | July 30, 2002 |
Yield on Closing Market Price as of February 29, 2016 ($15.57)1 | | 6.09% |
Tax Equivalent Yield2 | | 10.76% |
Current Monthly Distribution per Common Share3 | | $0.079 |
Current Annualized Distribution per Common Share3 | | $0.948 |
Economic Leverage as of February 29, 20164 | | 38% |
| | 1 | | Yield on closing market price is calculated by dividing the current annualized distribution per share by the closing market price. Past performance does not guarantee future results. |
| | 2 | | Tax equivalent yield assumes the maximum marginal federal tax rate of 43.4%, which includes the 3.8% Medicare tax. Actual tax rates will vary based on income, exemptions and deductions. Lower taxes will result in lower tax equivalent yields. |
| | 3 | | The distribution rate is not constant and is subject to change. |
| | 4 | | Represents VMTP Shares and TOB Trusts as a percentage of total managed assets, which is the total assets of the Trust, including any assets attributable to VMTP Shares and TOB Trusts, minus the sum of accrued liabilities. For a discussion of leveraging techniques utilized by the Trust, please see The Benefits and Risks of Leveraging on page 5. |
Returns for the six months ended February 29, 2016 were as follows:
| | | | | | | | |
| | | Returns Based On | |
| | | Market Price | | | NAV | |
BLE1,2 | | | 13.28 | % | | | 5.46 | % |
Lipper General & Insured Municipal Debt Funds (Leveraged)3 | | | 11.72 | % | | | 5.87 | % |
| | 1 | | All returns reflect reinvestment of dividends and/or distributions. |
| | 2 | | The Trust’s discount to NAV, which narrowed during the period, accounts for the difference between performance based on price and performance based on NAV. |
The following discussion relates to the Trust’s absolute performance based on NAV:
| • | | Tax-exempt bonds performed well during the six-month period, as the combination of falling U.S. Treasury yields and improving municipal finances created healthy buying interest in the asset class. (Prices rise as yields fall.) In addition, municipal bonds benefited from a general “flight to quality” caused by elevated volatility in the higher-risk segments of the financial markets. |
| • | | Income in the form of coupon payments made a meaningful contribution to the Trust’s total return. Leverage also amplifies the effect of interest rate movements, which was a positive for Trust performance during the past six months. |
| • | | Long-dated securities with maturities 20 years and above, which comprised the largest proportion of the Trust’s holdings, aided Trust performance given the decline in longer-term yields. Additionally, the Trust’s long duration positioning contributed positively to its performance. (Duration is a measure of interest-rate sensitivity.) |
| • | | The Trust’s positions in securities rated BBB, A and AA generated strong returns, reflecting an environment in which lower-rated issues generally outperformed. The Trust’s large allocations to the transportation and utilities sectors also had a positive impact on performance. |
| • | | The Trust’s use of U.S. Treasury futures contracts to manage interest rate risk had a slightly negative impact on performance due to the overall strength in bond prices. |
| | | | | | |
| | | | | | | |
| 14 | | SEMI-ANNUAL REPORT | | FEBRUARY 29, 2016 | | |
| | |
| | | BlackRock Municipal Income Trust II |
| | | | | | | | | | | | | | | | | | | | |
| Market Price and Net Asset Value Per Share Summary | | | | | | | | | | | | | | | |
| | | 2/29/16 | | | 8/31/15 | | | Change | | | High | | | Low | |
Market Price | | | $15.57 | | | | $14.18 | | | | 9.80% | | | | $15.74 | | | | $14.18 | |
Net Asset Value | | | $15.59 | | | | $15.25 | | | | 2.23% | | | | $15.75 | | | | $15.07 | |
|
| Market Price and Net Asset Value History For the Past Five Years |
|
| Overview of the Trust’s Total Investments* |
| | | | | | | | |
| Sector Allocation | | | | | | |
| | | 2/29/16 | | | 8/31/15 | |
Transportation | | | 21 | % | | | 22 | % |
Utilities | | | 17 | | | | 16 | |
County/City/Special District/School District | | | 13 | | | | 15 | |
Health | | | 12 | | | | 12 | |
Corporate | | | 10 | | | | 10 | |
State | | | 10 | | | | 9 | |
Education | | | 10 | | | | 9 | |
Tobacco | | | 6 | | | | 5 | |
Housing | | | 1 | | | | 2 | |
| | | | |
| Call/Maturity Schedule3 | | | |
Calendar Year Ended December 31, | | | | |
2016 | | | 9 | % |
2017 | | | 3 | |
2018 | | | 5 | |
2019 | | | 17 | |
2020 | | | 14 | |
| | 3 | | Scheduled maturity dates and/or bonds that are subject to potential calls by issuers over the next five years. |
| | | | | | | | |
| Credit Quality Allocation1 | | | | | | |
| | | 2/29/16 | | | 8/31/15 | |
AAA/Aaa | | | 6 | % | | | 7 | % |
AA/Aa | | | 41 | | | | 40 | |
A | | | 22 | | | | 23 | |
BBB/Baa | | | 15 | | | | 15 | |
BB/Ba | | | 5 | | | | 5 | |
B | | | 1 | | | | 1 | |
N/R2 | | | 10 | | | | 9 | |
| | 1 | | For financial reporting purposes, credit quality ratings shown above reflect the highest rating assigned by either S&P’s or Moody’s if ratings differ. These rating agencies are independent, nationally recognized statistical rating organizations and are widely used. Investment grade ratings are credit ratings of BBB/Baa or higher. Below investment grade ratings are credit ratings of BB/Ba or lower. Investments designated N/R are not rated by either rating agency. Unrated investments do not necessarily indicate low credit quality. Credit quality ratings are subject to change. |
| | 2 | | The investment advisor evaluates the credit quality of unrated investments based upon certain factors including, but not limited to, credit ratings for similar investments and financial analysis of sectors and individual investments. Using this approach, the investment advisor has deemed certain of these unrated securities as investment grade quality. As of February 29, 2016 and August 31, 2015, the market value of unrated securities deemed by the investment advisor to be investment grade represents 3% and 2%, respectively, of the Trust’s total investments. |
| | * | | Excludes short-term securities. |
| | | | | | |
| | | | | | | |
| | SEMI-ANNUAL REPORT | | FEBRUARY 29, 2016 | | 15 |
| | | | |
| Trust Summary as of February 29, 2016 | | BlackRock MuniHoldings Investment Quality Fund |
BlackRock MuniHoldings Investment Quality Fund’s (MFL) (the “Trust”) investment objective is to provide shareholders with current income exempt from federal income tax and to provide shareholders with the opportunity to own shares the value of which is exempt from Florida intangible personal property tax. The Trust seeks to achieve its investment objective by investing primarily in long-term, investment grade municipal obligations exempt from federal income taxes (except that the interest may be subject to the federal alternative minimum tax). Under normal market conditions, the Trust invests at least 80% of its assets in municipal obligations with remaining maturities of one year or more at the time of investment. The Trust may invest directly in such securities or synthetically through the use of derivatives. Due to the repeal of the Florida intangible personal property tax, in September 2008, the Board gave approval to permit the Trust the flexibility to invest in municipal obligations regardless of geographic location since municipal obligations issued by any state or municipality that provides income exempt from regular federal income tax would now satisfy the foregoing objective and policy.
No assurance can be given that the Trust’s investment objective will be achieved.
| | |
Symbol on NYSE | | MFL |
Initial Offering Date | | September 26, 1997 |
Yield on Closing Market Price as of February 29, 2016 ($15.03)1 | | 5.71% |
Tax Equivalent Yield2 | | 10.09% |
Current Monthly Distribution per Common Share3 | | $0.0715 |
Current Annualized Distribution per Common Share3 | | $0.8580 |
Economic Leverage as of February 29, 20164 | | 38% |
| | 1 | | Yield on closing market price is calculated by dividing the current annualized distribution per share by the closing market price. Past performance does not guarantee future results. |
| | 2 | | Tax equivalent yield assumes the maximum marginal federal tax rate of 43.4%, which includes the 3.8% Medicare tax. Actual tax rates will vary based on income, exemptions and deductions. Lower taxes will result in lower tax equivalent yields. |
| | 3 | | The distribution rate is not constant and is subject to change. |
| | 4 | | Represents VRDP Shares and TOB Trusts as a percentage of total managed assets, which is the total assets of the Trust, including any assets attributable to VRDP Shares and TOB Trusts, minus the sum of accrued liabilities. For a discussion of leveraging techniques utilized by the Trust, please see The Benefits and Risks of Leveraging on page 5. |
Returns for the six months ended February 29, 2016 were as follows:
| | | | | | | | |
| | | Returns Based On | |
| | | Market Price | | | NAV | |
MFL1,2 | | | 10.08 | % | | | 5.28 | % |
Lipper General & Insured Municipal Debt Funds (Leveraged)3 | | | 11.72 | % | | | 5.87 | % |
| | 1 | | All returns reflect reinvestment of dividends and/or distributions. |
| | 2 | | The Trust’s discount to NAV, which narrowed during the period, accounts for the difference between performance based on price and performance based on NAV. |
The following discussion relates to the Trust’s absolute performance based on NAV:
| • | | Tax-exempt bonds performed well during the six-month period, as the combination of falling U.S. Treasury yields and improving municipal finances created healthy buying interest in the asset class. (Prices rise as yields fall.) In addition, municipal bonds benefited from a general “flight to quality” caused by elevated volatility in the higher-risk segments of the financial markets. |
| • | | The Trust’s position in A-rated bonds, which outperformed higher-rated bonds amid investors’ continued search for yield, made a positive contribution to its six-month results. This was especially true with regard to the Trust’s position in longer-dated, A-rated bonds in the transportation, utilities and tax-backed local sectors. |
| • | | At a time in which yields declined, the Trust’s longer-duration holdings contributed positively to its performance. (Duration is a measure of interest rate sensitivity.) Income in the form of coupon payments made a meaningful contribution to the Trust’s total return. Leverage also amplifies the effect of interest rate movements, which was a positive for Trust performance during the past six months. |
| • | | The Trust’s positions in shorter-dated holdings, such as pre-refunded issues and bonds with very short call dates, detracted from performance. The Trust’s use of U.S. Treasury futures contracts to manage interest rate risk had a slightly negative impact on performance due to the overall strength in bond prices. |
| | | | | | |
| | | | | | | |
| 16 | | SEMI-ANNUAL REPORT | | FEBRUARY 29, 2016 | | |
| | |
| | | BlackRock MuniHoldings Investment Quality Fund |
| | |
| Market Price and Net Asset Value Per Share Summary | | |
| | | | | | | | | | | | | | | | | | | | |
| | | 2/29/16 | | | 8/31/15 | | | Change | | | High | | | Low | |
Market Price | | | $15.03 | | | | $14.06 | | | | 6.90% | | | | $15.08 | | | | $13.85 | |
Net Asset Value | | | $15.52 | | | | $15.18 | | | | 2.24% | | | | $15.69 | | | | $15.02 | |
|
| Market Price and Net Asset Value History For the Past Five Years |
|
| Overview of the Trust’s Total Investments* |
| | | | | | | | |
| Sector Allocation | | | | | | | | |
| | | 2/29/16 | | | 8/31/15 | |
Transportation | | | 40 | % | | | 36 | % |
Utilities | | | 17 | | | | 17 | |
County/City/Special District/School District | | | 14 | | | | 18 | |
State | | | 11 | | | | 9 | |
Health | | | 10 | | | | 10 | |
Education | | | 6 | | | | 5 | |
Tobacco | | | 1 | | | | 1 | |
Housing | | | 1 | | | | 2 | |
Corporate | | | — | 1 | | | 2 | |
| | 1 | | Represents less than 1% of total investments. |
| | | | | | | | |
| Credit Quality Allocation2 | | | | | | |
| | | 2/29/16 | | | 8/31/15 | |
AAA/Aaa | | | 5 | % | | | 5 | % |
AA/Aa | | | 61 | | | | 62 | |
A | | | 31 | | | | 29 | |
BBB/Baa | | | 2 | | | | 4 | |
N/R | | | 1 | | | | — | |
| | 2 | | For financial reporting purposes, credit quality ratings shown above reflect the highest rating assigned by either S&P’s or Moody’s if ratings differ. These rating agencies are independent, nationally recognized statistical rating organizations and are widely used. Investment grade ratings are credit ratings of BBB/Baa or higher. Below investment grade ratings are credit ratings of BB/Ba or lower. Investments designated N/R are not rated by either rating agency. Unrated investments do not necessarily indicate low credit quality. Credit quality ratings are subject to change. |
| | | | |
| Call/Maturity Schedule3 | | | |
Calendar Year Ended December 31, | | | | |
2016 | | | 1 | % |
2017 | | | 3 | |
2018 | | | 14 | |
2019 | | | 25 | |
2020 | | | 4 | |
| | 3 | | Scheduled maturity dates and/or bonds that are subject to potential calls by issuers over the next five years. |
| | * | | Excludes short-term securities. |
| | | | | | |
| | | | | | | |
| | SEMI-ANNUAL REPORT | | FEBRUARY 29, 2016 | | 17 |
| | |
| Trust Summary as of February 29, 2016 | | BlackRock MuniVest Fund, Inc. |
BlackRock MuniVest Fund, Inc.’s (MVF) (the “Trust”) investment objective is to provide shareholders with as high a level of current income exempt from federal income taxes as is consistent with its investment policies and prudent investment management. The Trust seeks to achieve its investment objective by investing at least 80% of its assets in municipal obligations exempt from federal income taxes (except that the interest may be subject to the federal alternative minimum tax). Under normal market conditions, the Trust primarily invests in long term municipal obligations rated investment grade at the time of investment and in long term municipal obligations with maturities of more than ten years at the time of investment. The Trust may invest up to 20% of its total assets in securities rated below investment grade or deemed equivalent at the time of purchase. The Trust may invest directly in such securities or synthetically through the use of derivatives.
No assurance can be given that the Trust’s investment objective will be achieved.
| | |
Symbol on NYSE MKT | | MVF |
Initial Offering Date | | September 29, 1988 |
Yield on Closing Market Price as of February 29, 2016 ($10.60)1 | | 6.06% |
Tax Equivalent Yield2 | | 10.71% |
Current Monthly Distribution per Common Share3 | | $0.0535 |
Current Annualized Distribution per Common Share3 | | $0.6420 |
Economic Leverage as of February 29, 20164 | | 38% |
| | 1 | | Yield on closing market price is calculated by dividing the current annualized distribution per share by the closing market price. Past performance does not guarantee future results. |
| | 2 | | Tax equivalent yield assumes the maximum marginal federal tax rate of 43.4%, which includes the 3.8% Medicare tax. Actual tax rates will vary based on income, exemptions and deductions. Lower taxes will result in lower tax equivalent yields. |
| | 3 | | The distribution rate is not constant and is subject to change. |
| | 4 | | Represents VMTP Shares and TOB Trusts as a percentage of total managed assets, which is the total assets of the Trust, including any assets attributable to VMTP Shares and TOB Trusts, minus the sum of accrued liabilities. For a discussion of leveraging techniques utilized by the Trust, please see The Benefits and Risks of Leveraging on page 5. |
Returns for the six months ended February 29, 2016 were as follows:
| | | | | | | | |
| | | Returns Based On | |
| | | Market Price | | | NAV | |
MVF1,2 | | | 13.40 | % | | | 4.68 | % |
Lipper General & Insured Municipal Debt Funds (Leveraged)3 | | | 11.72 | % | | | 5.87 | % |
| | 1 | | All returns reflect reinvestment of dividends and/or distributions. |
| | 2 | | The Trust moved from a discount to NAV to a premium during the period, which accounts for the difference between performance based on price and performance based on NAV. |
The following discussion relates to the Trust’s absolute performance based on NAV:
| • | | Tax-exempt bonds performed well during the six-month period, as the combination of falling U.S. Treasury yields and improving municipal finances created healthy buying interest in the asset class. (Prices rise as yields fall.) In addition, municipal bonds benefited from a general “flight to quality” caused by elevated volatility in the higher-risk segments of the financial markets. |
| • | | At a time in which yields declined, the Trust’s duration exposure contributed positively to performance. (Duration is a measure of interest rate sensitivity.) The Trust’s positions in long-maturity bonds, which outperformed short-term issues, also added value. The Trust’s exposure to zero-coupon bonds, which delivered better returns than current-coupon bonds, further aided returns. Income in the form of coupon payments made a meaningful contribution to the Trust’s total return. Leverage also amplifies the effect of interest rate movements, which was a positive for Trust performance during the past six months. On a sector basis, the Trust’s positions in the health care and transportation segments were key positive contributors to performance. |
| • | | The Trust’s use of U.S. Treasury futures contracts to manage interest rate risk had a slightly negative impact on performance due to the overall strength in bond prices. |
| | | | | | |
| | | | | | | |
| 18 | | SEMI-ANNUAL REPORT | | FEBRUARY 29, 2016 | | |
| | |
| | | BlackRock MuniVest Fund, Inc. |
| | | | | | | | | | | | | | | | | | | | |
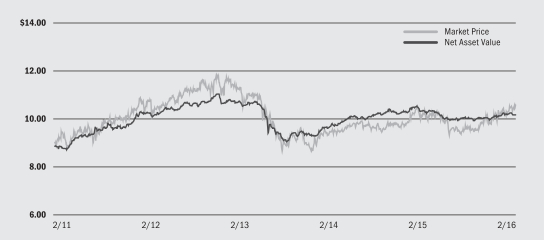
| Market Price and Net Asset Value Per Share Summary | | | | | | | | | | | | | | | |
| | | 2/29/16 | | | 8/31/15 | | | Change | | | High | | | Low | |
Market Price | | $ | 10.60 | | | $ | 9.65 | | | | 9.84% | | | $ | 10.63 | | | $ | 9.44 | |
Net Asset Value | | $ | 10.18 | | | $ | 10.04 | | | | 1.39% | | | $ | 10.27 | | | $ | 9.94 | |
|
| Market Price and Net Asset Value History For the Past Five Years |
|
| Overview of the Trust’s Total Investments* |
| | | | | | | | |
| Sector Allocation | | | | | | |
| | | 2/29/16 | | | 8/31/15 | |
Transportation | | | 23 | % | | | 22 | % |
Health | | | 23 | | | | 24 | |
County/City/Special District/School District | | | 11 | | | | 10 | |
Education | | | 10 | | | | 11 | |
Utilities | | | 10 | | | | 10 | |
Corporate | | | 10 | | | | 11 | |
Housing | | | 5 | | | | 4 | |
State | | | 4 | | | | 4 | |
Tobacco | | | 4 | | | | 4 | |
| | | | | | | | |
| Credit Quality Allocation1 | | | | | | |
| | | 2/29/16 | | | 8/31/15 | |
AAA/Aaa | | | 9 | % | | | 9 | % |
AA/Aa | | | 46 | | | | 46 | |
A | | | 21 | | | | 23 | |
BBB/Baa | | | 14 | | | | 13 | |
BB/Ba | | | 3 | | | | 3 | |
B | | | 1 | | | | 1 | |
N/R2 | | | 6 | | | | 5 | |
| | 1 | | For financial reporting purposes, credit quality ratings shown above reflect the highest rating assigned by either S&P’s or Moody’s if ratings differ. These rating agencies are independent, nationally recognized statistical rating organizations and are widely used. Investment grade ratings are credit ratings of BBB/Baa or higher. Below investment grade ratings are credit ratings of BB/Ba or lower. Investments designated N/R are not rated by either rating agency. Unrated investments do not necessarily indicate low credit quality. Credit quality ratings |
| | 2 | | The investment advisor evaluates the credit quality of unrated investments based upon certain factors including, but not limited to, credit ratings for similar investments and financial analysis of sectors and individual investments. Using this approach, the investment advisor has deemed certain of these unrated securities as investment grade quality. As of February 29, 2016 and August 31, 2015, the market value of unrated securities deemed by the investment advisor to be investment grade representing 3% and 2%, respectively, of the Trust’s total investments. |
| | | | |
| Call/Maturity Schedule3 | | | |
Calendar Year Ended December 31, | | | | |
2016 | | | 7 | % |
2017 | | | 7 | |
2018 | | | 15 | |
2019 | | | 20 | |
2020 | | | 16 | |
| | 3 | | Scheduled maturity dates and/or bonds that are subject to potential calls by issuers over the next five years. |
| | * | | Excludes short-term securities. |
| | | | | | |
| | | | | | | |
| | SEMI-ANNUAL REPORT | | FEBRUARY 29, 2016 | | 19 |
| | |
Schedule of Investments February 29, 2016 (Unaudited) | | BlackRock Municipal Bond Investment Trust (BIE) (Percentages shown are based on Net Assets) |
| | | | | | | | |
| Municipal Bonds | | Par
(000) | | | Value | |
Alabama — 0.3% | | | | | |
City of Selma Alabama IDB, RB, Gulf Opportunity Zone, International Paper Co. Project, Series A, 5.38%, 12/01/35 | | $ | 145 | | | $ | 161,049 | |
Alaska — 0.3% | | | | | |
Northern Tobacco Securitization Corp., Refunding RB, Tobacco Settlement, Asset-Backed, Series A, 5.00%, 6/01/46 | | | 180 | | | | 152,991 | |
California — 13.8% | | | | | |
California Educational Facilities Authority, RB, University of Southern California, Series A, 5.25%, 10/01/38 | | | 700 | | | | 777,406 | |
California Health Facilities Financing Authority, Refunding RB, Catholic Healthcare West, Series A, 6.00%, 7/01/39 | | | 120 | | | | 137,308 | |
City of Los Angeles California Department of Water & Power, RB, Power System, Sub-Series A-1, 5.25%, 7/01/38 | | | 760 | | | | 832,534 | |
Kern Community College District, GO, Safety, Repair & Improvement, Series C, 5.50%, 11/01/33 | | | 410 | | | | 510,922 | |
Riverside County Public Financing Authority, RB, Capital Facilities Project, 5.25%, 11/01/40 | | | 1,000 | | | | 1,182,110 | |
San Diego Regional Building Authority, RB, County Operations Center & Annex, Series A,
5.38%, 2/01/19 (a) | | | 850 | | | | 961,954 | |
State of California, GO, Various Purposes, 6.00%, 3/01/33 | | | 685 | | | | 812,917 | |
State of California Public Works Board, LRB, Various Capital Projects, Series I, 5.50%, 11/01/31 | | | 500 | | | | 616,680 | |
State of California Public Works Board, RB, Department of Corrections & Rehabilitation, Series F, 5.25%, 9/01/33 | | | 210 | | | | 251,042 | |
Township of Washington California Health Care District, GO, Election of 2004, Series B, 5.50%, 8/01/40 | | | 160 | | | | 192,342 | |
University of California, Refunding RB, The Regents of Medical Center, Series J, 5.25%, 5/15/38 | | | 1,000 | | | | 1,186,060 | |
| | | | | | | | |
| | | | | | | | 7,461,275 | |
Colorado — 2.9% | | | | | |
City & County of Denver Colorado Airport System, ARB, Sub-System, Series B, 5.25%, 11/15/32 | | | 750 | | | | 893,887 | |
Colorado Health Facilities Authority, Refunding RB, Catholic Health Initiative, Series A, 5.50%, 7/01/34 | | | 580 | | | | 653,051 | |
| | | | | | | | |
| | | | | | | | 1,546,938 | |
Florida — 8.7% | | | | | |
City of Jacksonville Florida, Refunding RB, Series A, 5.25%, 10/01/33 | | | 105 | | | | 125,727 | |
City of Miami Beach Florida Parking Revenue, RB, 5.00%, 9/01/45 | | | 455 | | | | 517,672 | |
County of Miami-Dade Florida, RB, Seaport, Series A, 6.00%, 10/01/38 | | | 1,875 | | | | 2,279,737 | |
County of Miami-Dade Florida Educational Facilities Authority, Refunding RB, University of Miami, Series A, 5.00%, 4/01/45 | | | 1,255 | | | | 1,418,163 | |
| | | | | | | | |
| Municipal Bonds | | Par
(000) | | | Value | |
Florida (continued) | | | | | | | | |
Reedy Creek Improvement District, GO, Series A, 5.25%, 6/01/32 | | $ | 305 | | | $ | 361,663 | |
| | | | | | | | |
| | | | | | | | 4,702,962 | |
Georgia — 1.2% | | | | | |
Municipal Electric Authority of Georgia, Refunding RB, Project One, Sub-Series D, 6.00%, 1/01/23 | | | 555 | | | | 623,953 | |
Illinois — 16.8% | | | | | |
City of Chicago Illinois, GARB, O’Hare International Airport, 3rd Lien, Series C, 6.50%, 1/01/41 | | | 1,590 | | | | 1,914,312 | |
City of Chicago Illinois Transit Authority, RB, Sales Tax Receipts: | | | | | | | | |
5.25%, 12/01/36 | | | 500 | | | | 548,505 | |
5.25%, 12/01/40 | | | 750 | | | | 817,028 | |
County of Cook Illinois Community College District No. 508, GO, City College of Chicago: | | | | | | | | |
5.50%, 12/01/38 | | | 250 | | | | 288,275 | |
5.25%, 12/01/43 | | | 1,000 | | | | 1,122,240 | |
Illinois Finance Authority, RB, Carle Foundation, Series A, 6.00%, 8/15/41 | | | 750 | | | | 884,895 | |
Illinois Finance Authority, Refunding RB, Northwestern Memorial Hospital, Series A, 6.00%, 8/15/39 | | | 1,000 | | | | 1,158,190 | |
Metropolitan Pier & Exposition Authority, Hyatt Regency McCormick Place, Refunding RB, Series B-2, 5.25%, 6/15/50 | | | 250 | | | | 261,903 | |
Railsplitter Tobacco Settlement Authority, RB: | | | | | | | | |
5.50%, 6/01/23 | | | 365 | | | | 430,455 | |
6.00%, 6/01/28 | | | 105 | | | | 125,589 | |
State of Illinois, GO: | | | | | | | | |
5.25%, 2/01/31 | | | 255 | | | | 277,172 | |
5.25%, 2/01/32 | | | 500 | | | | 540,300 | |
5.50%, 7/01/33 | | | 500 | | | | 547,930 | |
5.50%, 7/01/38 | | | 110 | | | | 119,161 | |
| | | | | | | | |
| | | | | | | | 9,035,955 | |
Indiana — 2.5% | | | | | |
Indiana Municipal Power Agency, RB, Series B, 6.00%, 1/01/19 (a) | | | 1,190 | | | | 1,362,609 | |
Kansas — 1.9% | | | | | |
Kansas Development Finance Authority, Refunding RB, Adventist Health System/Sunbelt Obligated Group, Series C, 5.50%, 11/15/29 | | | 900 | | | | 1,033,326 | |
Kentucky — 1.7% | | | | | |
County of Louisville & Jefferson Kentucky Metropolitan Government Parking Authority, RB, Series A, 5.75%, 12/01/34 | | | 800 | | | | 930,528 | |
Louisiana — 1.5% | | | | | |
Louisiana Local Government Environmental Facilities & Community Development Authority, RB, Westlake Chemical Corp. Project, Series A-1, 6.50%, 11/01/35 | | | 380 | | | | 444,623 | |
Tobacco Settlement Financing Corp., Refunding RB, Asset-Backed, Series A, 5.50%, 5/15/29 | | | 315 | | | | 345,945 | |
| | | | | | | | |
| | | | | | | | 790,568 | |
| | | | | | | | | | |
| AGC | | Assured Guarantee Corp. | | EDA | | Economic Development Authority | | ISD | | Independent School District |
| AGM | | Assured Guaranty Municipal Corp. | | EDC | | Economic Development Corp. | | LRB | | Lease Revenue Bonds |
| AMBAC | | American Municipal Bond Assurance Corp. | | ERB | | Education Revenue Bonds | | M/F | | Multi-Family |
| AMT | | Alternative Minimum Tax (subject to) | | GARB | | General Airport Revenue Bonds | | NPFGC | | National Public Finance Guarantee Corp. |
| ARB | | Airport Revenue Bonds | | GO | | General Obligation Bonds | | PILOT | | Payment in Lieu of Taxes |
| BARB | | Building Aid Revenue Bonds | | HFA | | Housing Finance Agency | | PSF-GTD | | Permanent School Fund Guaranteed |
| BHAC | | Berkshire Hathaway Assurance Corp. | | HRB | | Housing Revenue Bonds | | RB | | Revenue Bonds |
| CAB | | Capital Appreciation Bonds | | IDA | | Industrial Development Authority | | S/F | | Single-Family |
| COP | | Certificates of Participation | | IDB | | Industrial Development Board | | | | |
| | | | | | |
| | | | | | | |
| 20 | | SEMI-ANNUAL REPORT | | FEBRUARY 29, 2016 | | |
See Notes to Financial Statements.
| | |
Schedule of Investments (continued) | | BlackRock Municipal Bond Investment Trust (BIE) |
| | | | | | | | |
| Municipal Bonds | | Par
(000) | | | Value | |
Maine — 1.5% | | | | | |
Maine Health & Higher Educational Facilities Authority, RB, Maine General Medical Center, 7.50%, 7/01/32 | | $ | 675 | | | $ | 807,577 | |
Massachusetts — 2.2% | | | | | |
Massachusetts Development Finance Agency, Refunding RB, Trustees of Deerfield Academy, 5.00%, 10/01/40 | | | 375 | | | | 430,965 | |
Massachusetts Port Authority, Refunding RB, Series A, 5.00%, 7/01/45 | | | 360 | | | | 418,252 | |
Metropolitan Boston Transit Parking Corp., Refunding RB, 5.25%, 7/01/36 | | | 300 | | | | 351,204 | |
| | | | | | | | |
| | | | | | | | 1,200,421 | |
Michigan — 3.3% | | | | | |
City of Lansing Michigan, RB, Board of Water & Light Utilities System, Series A, 5.50%, 7/01/41 | | | 485 | | | | 572,829 | |
Michigan State Building Authority, Refunding RB, Facilities Program Series: | | | | | | | | |
6.00%, 10/15/18 (a) | | | 305 | | | | 346,779 | |
6.00%, 10/15/38 | | | 195 | | | | 218,917 | |
Royal Oak Hospital Finance Authority Michigan, Refunding RB, William Beaumont Hospital, Series V, 8.25%, 9/01/18 (a) | | | 530 | | | | 629,062 | |
| | | | | | | | |
| | | | | | | | 1,767,587 | |
Mississippi — 2.5% | | | | | |
Mississippi Development Bank, RB, Jackson Water & Sewer System Project (AGM), 6.88%, 12/01/40 | | | 1,000 | | | | 1,339,350 | |
Nevada — 4.3% | | | | | |
City of Las Vegas Nevada, GO, Limited Tax, Performing Arts Center, 6.00%, 4/01/34 | | | 1,000 | | | | 1,156,520 | |
County of Clark Nevada Airport System, ARB, Series B, 5.75%, 7/01/42 | | | 1,000 | | | | 1,158,760 | |
| | | | | | | | |
| | | | | | | | 2,315,280 | |
New Jersey — 5.7% | | | | | |
New Jersey EDA, Refunding RB, School Facilities Construction, Series AA, 5.50%, 12/15/29 | | | 750 | | | | 818,265 | |
New Jersey Housing & Mortgage Finance Agency, RB, S/F Housing, Series CC, 5.25%, 10/01/29 | | | 610 | | | | 647,588 | |
New Jersey Transportation Trust Fund Authority, RB, Transportation System: | | | | | | | | |
Series A, 5.88%, 12/15/38 | | | 695 | | | | 757,960 | |
Series AA, 5.50%, 6/15/39 | | | 760 | | | | 832,968 | |
| | | | | | | | |
| | | | | | | | 3,056,781 | |
New York — 4.5% | | | | | |
County of New York Tobacco Trust IV, Refunding RB, Settlement Pass-Through Turbo, Series A, 6.25%, 6/01/41 (b) | | | 300 | | | | 312,891 | |
Hudson Yards Infrastructure Corp., RB, Series A, 5.75%, 2/15/47 | | | 620 | | | | 720,570 | |
Metropolitan Transportation Authority, RB, Series A, 5.25%, 11/15/38 | | | 500 | | | | 593,325 | |
Metropolitan Transportation Authority, Refunding RB, Series A-1, 5.25%, 11/15/56 | | | 220 | | | | 255,623 | |
New York Liberty Development Corp., Refunding RB, 2nd Priority, Bank of America Tower at One Bryant Park Project, Class 3, 6.38%, 7/15/49 | | | 500 | | | | 562,785 | |
| | | | | | | | |
| | | | | | | | 2,445,194 | |
Ohio — 2.8% | | | | | |
County of Allen Ohio Hospital Facilities, Refunding RB, Catholic Healthcare Partners, Series A, 5.25%, 6/01/38 | | | 840 | | | | 939,876 | |
State of Ohio Turnpike Commission, RB, Junior Lien, Infrastructure Projects, Series A-1, 5.25%, 2/15/31 | | | 500 | | | | 596,145 | |
| | | | | | | | |
| | | | | | | | 1,536,021 | |
| | | | | | | | |
| Municipal Bonds | | Par
(000) | | | Value | |
Pennsylvania — 7.3% | | | | | |
Pennsylvania Economic Development Financing Authority, RB, American Water Co. Project, 6.20%, 4/01/39 | | $ | 300 | | | $ | 341,478 | |
Pennsylvania Turnpike Commission, RB: | | | | | | | | |
Sub-Series A, 6.00%, 12/01/16 (a) | | | 1,500 | | | | 1,563,645 | |
Sub-Series A, 5.63%, 12/01/31 | | | 750 | | | | 876,060 | |
Sub-Series C (AGC), 6.25%, 6/01/18 (a) | | | 500 | | | | 561,645 | |
Township of Bristol Pennsylvania School District, GO, 5.25%, 6/01/37 | | | 530 | | | | 609,447 | |
| | | | | | | | |
| | | | | | | | 3,952,275 | |
Puerto Rico — 0.2% | | | | | |
Children’s Trust Fund Tobacco Settlement, Refunding RB, Asset-Backed, 5.63%, 5/15/43 | | | 95 | | | | 95,241 | |
Rhode Island — 2.1% | | | | | |
Tobacco Settlement Financing Corp., Refunding RB, Series B: | | | | | | | | |
4.50%, 6/01/45 | | | 990 | | | | 999,653 | |
5.00%, 6/01/50 | | | 125 | | | | 129,106 | |
| | | | | | | | |
| | | | | | | | 1,128,759 | |
South Carolina — 3.5% | | | | | |
County of Charleston South Carolina, RB, Special Source, 5.25%, 12/01/38 | | | 635 | | | | 750,519 | |
State of South Carolina Public Service Authority, Refunding RB: | | | | | | | | |
Series C, 5.00%, 12/01/46 | | | 500 | | | | 561,730 | |
Series E, 5.25%, 12/01/55 | | | 500 | | | | 568,215 | |
| | | | | | | | |
| | | | | | | | 1,880,464 | |
Tennessee — 0.1% | | | | | |
Metropolitan Government Nashville & Davidson County Health & Educational Facilities Board, Refunding RB, 5.00%, 10/01/41 (c) | | | 55 | | | | 61,456 | |
Texas — 9.1% | | | | | |
Central Texas Regional Mobility Authority, Refunding RB, Senior Lien, 6.00%, 1/01/41 | | | 890 | | | | 1,053,386 | |
City of Beaumont Texas, GO, Certificates of Obligation, 5.25%, 3/01/37 | | | 395 | | | | 460,819 | |
Conroe Texas ISD, GO, School Building, Series A, 5.75%, 2/15/18 (a) | | | 470 | | | | 516,657 | |
County of Tarrant Texas Cultural Education Facilities Finance Corp., RB, Scott & White Healthcare: | | | | | | | | |
6.00%, 8/15/20 (a) | | | 75 | | | | 91,405 | |
6.00%, 8/15/45 | | | 945 | | | | 1,123,331 | |
North Texas Tollway Authority, RB, Special Projects, Series A, 5.50%, 9/01/41 | | | 500 | | | | 591,090 | |
North Texas Tollway Authority, Refunding RB, 1st Tier, Series K-1 (AGC), 5.75%, 1/01/38 | | | 250 | | | | 279,342 | |
Red River Education Financing Corp., RB, Texas Christian University Project, 5.25%, 3/15/38 | | | 180 | | | | 207,765 | |
Texas Private Activity Bond Surface Transportation Corp., RB, Senior Lien, NTE Mobility Partners LLC, North Tarrant Express Managed Lanes Project, 6.88%, 12/31/39 | | | 500 | | | | 589,965 | |
| | | | | | | | |
| | | | | | | | 4,913,760 | |
Virginia — 0.7% | | | | | |
City of Lexington Virginia IDA, RB, Washington & Lee University, 5.00%, 1/01/43 | | | 145 | | | | 164,659 | |
Virginia Public School Authority, RB, Fluvanna County School Financing, 6.50%, 12/01/18 (a) | | | 200 | | | | 231,630 | |
| | | | | | | | |
| | | | | | | | 396,289 | |
Wisconsin — 1.8% | | | | | |
Wisconsin Health & Educational Facilities Authority, Refunding RB, Froedtert & Community Health, Inc., Series C, 5.25%, 4/01/39 | | | 890 | | | | 963,959 | |
| Total Municipal Bonds — 103.2% | | | | 55,662,568 | |
See Notes to Financial Statements.
| | | | | | |
| | | | | | | |
| | SEMI-ANNUAL REPORT | | FEBRUARY 29, 2016 | | 21 |
| | |
Schedule of Investments (continued) | | BlackRock Municipal Bond Investment Trust (BIE) |
| | | | | | | | |
Municipal Bonds Transferred to
Tender Option Bond Trusts (d) | | Par
(000) | | | Value | |
California — 19.3% | |
California Educational Facilities Authority, RB, University of Southern California, Series B,
5.25%, 10/01/39 (e) | | $ | 1,005 | | | $ | 1,116,133 | |
Grossmont Union High School District, GO, Election of 2008, Series B, 5.00%, 8/01/40 | | | 1,300 | | | | 1,488,110 | |
Los Angeles Community College District California, GO, Election of 2008, Series C, 5.25%, 8/01/39 (e) | | | 1,410 | | | | 1,641,515 | |
Los Angeles Community College District California, GO, Refunding, Election of 2008, Series A, 6.00%, 8/01/19 (a) | | | 2,079 | | | | 2,446,155 | |
Los Angeles Unified School District California, GO, Series I, 5.00%, 1/01/34 | | | 200 | | | | 225,012 | |
San Diego Public Facilities Financing Authority Water, RB, Series B, 5.50%, 8/01/39 | | | 2,234 | | | | 2,552,617 | |
University of California, RB, Series O, 5.75%, 5/15/19 (a) | | | 810 | | | | 938,209 | |
| | | | | | | | |
| | | | | | | | 10,407,751 | |
District of Columbia — 3.4% | | | | | |
District of Columbia, RB, Series A, 5.50%, 12/01/30 (e) | | | 735 | | | | 858,698 | |
District of Columbia Water & Sewer Authority, Refunding RB, Senior Lien, Series A, 5.50%, 10/01/18 (a) | | | 899 | | | | 1,008,923 | |
| | | | | | | | |
| | | | | | | | 1,867,621 | |
Illinois — 7.2% | | | | | |
State of Illinois Finance Authority, RB, University of Chicago, Series B, 6.25%, 7/01/18 (a) | | | 1,500 | | | | 1,692,405 | |
State of Illinois Toll Highway Authority, RB, Senior Priority, Series B, 5.50%, 1/01/18 (a) | | | 2,000 | | | | 2,176,650 | |
| | | | | | | | |
| | | | | | | | 3,869,055 | |
Nevada — 3.1% | | | | | |
County of Clark Nevada Water Reclamation District, GO, Limited Tax, 6.00%, 7/01/18 (a) | | | 1,500 | | | | 1,684,470 | |
New Hampshire — 1.2% | | | | | |
New Hampshire Health & Education Facilities Authority, RB, Dartmouth College, 5.25%, 6/01/39 (e) | | | 585 | | | | 661,814 | |
New Jersey — 3.6% | | | | | |
New Jersey Transportation Trust Fund Authority, RB, Transportation System: | | | | | | | | |
Series A (AMBAC), 5.00%, 12/15/32 | | | 1,000 | | | | 1,050,130 | |
Series B, 5.25%, 6/15/36 (e) | | | 840 | | | | 892,688 | |
| | | | | | | | |
| | | | | | | | 1,942,818 | |
New York — 13.9% | | | | | |
City of New York New York Municipal Water Finance Authority, RB, Water & Sewer System, Fiscal 2009, Series A, 5.75%, 6/15/40 | | | 750 | | | | 832,026 | |
City of New York New York Municipal Water Finance Authority, Refunding RB, Water & Sewer System, 2nd General Resolution: | | | | | | | | |
Series FF, 5.00%, 6/15/45 | | | 1,000 | | | | 1,145,627 | |
Series FF-2, 5.50%, 6/15/40 | | | 990 | | | | 1,123,782 | |
| | | | | | | | |
Municipal Bonds Transferred to
Tender Option Bond Trusts (d) | | Par
(000) | | | Value | |
New York (continued) | | | | | | | | |
City of New York New York Transitional Finance Authority, BARB, Fiscal 2009, Series S-3, 5.25%, 1/15/39 | | $ | 1,000 | | | $ | 1,109,557 | |
New York Liberty Development Corp., RB, 1 World Trade Center Port Authority Consolidated Bonds, 5.25%, 12/15/43 | | | 1,170 | | | | 1,354,792 | |
New York Liberty Development Corp., Refunding RB, 4 World Trade Center Project, 5.75%, 11/15/51 (e) | | | 680 | | | | 792,227 | |
New York State Dormitory Authority, ERB, Personal Income Tax, Series B, 5.25%, 3/15/38 | | | 1,000 | | | | 1,122,440 | |
| | | | | | | | |
| | | | | | | | 7,480,451 | |
Texas — 5.2% | | | | | |
City of San Antonio Texas Public Service Board, Refunding RB, Series A, 5.25%, 2/01/31 (e) | | | 1,050 | | | | 1,171,071 | |
County of Harris Texas Cultural Education Facilities Finance Corp., RB, Texas Children’s Hospital Project, 5.50%, 10/01/39 | | | 1,450 | | | | 1,646,171 | |
| | | | | | | | |
| | | | | | | | 2,817,242 | |
Virginia — 1.0% | | | | | |
County of Fairfax Virginia IDA, Refunding RB, Health Care, Inova Health System, Series A, 5.50%, 5/15/35 | | | 460 | | | | 519,281 | |
Total Municipal Bonds Transferred to
Tender Option Bond Trusts — 57.9% | | | | 31,250,503 | |
Total Long-Term Investments (Cost — $77,666,668) — 161.1% | | | | 86,913,071 | |
| | | | | | | | |
| | |
| | |
| Short-Term Securities | | Shares | | | | |
BlackRock Liquidity Funds, MuniCash, 0.02% (f)(g) | | | 135,473 | | | | 135,473 | |
Total Short-Term Securities (Cost — $135,473) — 0.3% | | | | 135,473 | |
| Total Investments (Cost — $77,802,141) — 161.4% | | | | 87,048,544 | |
| Other Assets Less Liabilities — 1.7% | | | | 932,414 | |
Liability for TOB Trust Certificates, Including Interest
Expense and Fees Payable — (30.1)% | | | | (16,237,349 | ) |
| VRDP Shares, at Liquidation Value — (33.0)% | | | | | | | (17,800,000 | ) |
| | | | | | | | |
| Net Assets Applicable to Common Shares — 100.0% | | | $ | 53,943,609 | |
| | | | | |
|
| Notes to Schedule of investments |
| (a) | | U.S. Government securities, held in escrow, are used to pay interest on this security, as well as to retire the bond in full at the date indicated, typically at a premium to par. |
| (b) | | Security exempt from registration pursuant to Rule 144A under the Securities Act of 1933, as amended. These securities may be resold in transactions exempt from registration to qualified institutional investors. |
| (c) | | When-issued security. |
| (d) | | Represent bonds transferred to a TOB Trust in exchange of cash and residual certificates received by the Trust. These bonds serve as collateral in a secured borrowing. See Note 4 of the Notes to Financial Statements for details. |
| (e) | | All or a portion of security is subject to a recourse agreement. The aggregate maximum potential amount the Trust could ultimately be required to pay under the agreements, which expire between October 1, 2016 to November 15, 2019, is $4,102,787. See Note 4 of the Notes to Financial Statements for details. |
See Notes to Financial Statements.
| | | | | | |
| | | | | | | |
| 22 | | SEMI-ANNUAL REPORT | | FEBRUARY 29, 2016 | | |
| | |
Schedule of Investments (continued) | | BlackRock Municipal Bond Investment Trust (BIE) |
��
| (f) | | During the six months ended February 29, 2016, investments in issuers considered to be affiliates of the Trust for purposes of Section 2(a)(3) of the Investment Company Act of 1940, as amended, were as follows: |
| | | | | | | | | | | | | | | | |
| Affiliate | | Shares Held
at August 31,
2015 | | | Net
Activity | | | Shares Held
at February 29,
2016 | | | Income | |
BlackRock Liquidity Funds, MuniCash | | | — | | | | 135,473 | | | | 135,473 | | | | — | |
FFI Institutional Tax-Exempt Fund | | | 860,286 | | | | (860,286 | ) | | | — | | | $ | 59 | |
Total | | | | | | | | | | | 135,473 | | | $ | 59 | |
| | | | | | | | | | | | |
| (g) | | Current yield as of period end. |
|
| Derivative Financial Instruments Outstanding as of Period End |
| | | | | | | | | | | | | | | | | | | | |
| Financial Futures Contracts | | | |
Contracts
Short | | | Issue | | | Expiration | | | Notional
Value | | | Unrealized
Appreciation | | | |
| | (12) | | | | 5-Year U.S. Treasury Note | | | | June 2016 | | | $ | 1,451,813 | | | | $ 3,579 | | | |
| | (10) | | | | 10-Year U.S. Treasury Note | | | | June 2016 | | | $ | 1,305,156 | | | | 6,550 | | | |
| | (4) | | | | Long U.S. Treasury Bond | | | | June 2016 | | | $ | 658,125 | | | | 3,180 | | | |
| | (1) | | | | Ultra U.S. Treasury Bond | | | | June 2016 | | | $ | 173,156 | | | | 2,091 | | | |
| Total | | | $ | 15,400 | | | |
| | | | | | | | | | | | | | | | | | | | |
|
| Derivative Financial Instruments Categorized by Risk Exposure |
As of period end, the fair values of derivative financial instruments located in the Statements of Assets and Liabilities were as follows:
| | | | | | | | | | | | | | | | | | | | | | | | | | | | | | |
| Assets — Derivative Financial Instruments | | | | Commodity
Contracts | | | Credit
Contracts | | | Equity
Contracts | | | Foreign
Currency
Exchange
Contracts | | | Interest
Rate
Contracts | | | Other
Contracts | | | Total | |
Financial futures contracts | | Net unrealized appreciation1 | | | — | | | | — | | | | — | | | | — | | | $ | 15,400 | | | | — | | | $ | 15,400 | |
1 Includes cumulative appreciation (depreciation) on financial futures contracts, if any, as reported in the Schedule of Investments. Only current day’s variation margin is reported within the Statements of Assets and Liabilities. | |
| For the six months ended February 29, 2016, the effect of derivative financial instruments in the Statements of Operations was as follows: | |
| Net Realized Gain (Loss) from: | | | | Commodity
Contracts | | | Credit
Contracts | | | Equity
Contracts | | | Foreign
Currency
Exchange
Contracts | | | Interest
Rate
Contracts | | | Other
Contracts | | | Total | |
Financial futures contracts | | | | | — | | | | — | | | | — | | | | — | | | $ | (156,495 | ) | | | — | | | $ | (156,495 | ) |
| | | | | | | | |
Net Change in Unrealized
Appreciation (Depreciation) on: | | | | | | | | | | | | | | | | | | | | | | | |
Financial futures contracts | | | | | — | | | | — | | | | — | | | | — | | | $ | (3,046 | ) | | | — | | | $ | (3,046 | ) |
|
| Average Quarterly Balances of Outstanding Derivative Financial Instruments |
| | | | | | | | | | | | | | | | |
| Financial futures contracts: | | | | | | | | | | | | | | | |
Average notional value of contracts — short | | $ | 3,190,699 | |
For more information about the Trust‘s investment risks regarding derivative financial instruments, refer to the Notes to Financial Statements.
See Notes to Financial Statements.
| | | | | | |
| | | | | | | |
| | SEMI-ANNUAL REPORT | | FEBRUARY 29, 2016 | | 23 |
| | |
Schedule of Investments (concluded) | | BlackRock Municipal Bond Investment Trust (BIE) |
|
| Fair Value Hierarchy as of Period End |
Various inputs are used in determining the fair value of investments and derivative financial instruments. For information about the Trust’s policy regarding valuation of investments and derivative financial instruments, refer to the Notes to Financial Statements.
The following tables summarize the Trust’s investments and derivative financial instruments categorized in the disclosure hierarchy:
| | | | | | | | | | | | | | |
| | | Level 1 | | | Level 2 | | | Level 3 | | Total | |
Assets: | | | | | | | | | | | | | | |
| Investments: | | | | | | | | | | | | | | |
Long-Term Investments 1 | | | — | | | $ | 86,913,071 | | | — | | $ | 86,913,071 | |
Short-Term Securities | | $ | 135,473 | | | | — | | | — | | | 135,473 | |
| | | | | | | | | | | | | | |
Total | | $ | 135,473 | | | $ | 86,913,071 | | | — | | $ | 87,048,544 | |
| | | | | | | | | | | | | | |
1 See above Schedule of Investments for values in each state or political subdivision. | |
| | | | | | | | | | | | |
| | | Level 1 | | | Level 2 | | Level 3 | | Total | |
| Derivative Financial Instruments 1 | | | | | | |
Assets: | | | | | | | | | | | | |
Interest rate contracts | | $ | 15,400 | | | — | | — | | $ | 15,400 | |
1 Derivative financial instruments are financial futures contracts, which are valued at the unrealized appreciation (depreciation) on the instrument. | |
The Trust may hold assets and/or liabilities in which the fair value approximates the carrying amount for financial statement purposes. As of period end, such assets and/or liabilities are categorized within the disclosure hierarchy as follows:
| | | | | | | | | | | | | | |
| | | Level 1 | | | Level 2 | | | Level 3 | | Total | |
Assets: | | | | | | | | | | | | | | |
Cash pledged for financial futures contracts | | $ | 45,950 | | | | — | | | — | | $ | 45,950 | |
Liabilities: | | | | | | | | | | | | | | |
TOB Trust Certificates | | | — | | | $ | (16,235,837 | ) | | — | | | (16,235,837 | ) |
VRDP Shares | | | — | | | | (17,800,000 | ) | | — | | | (17,800,000 | ) |
| | | | | | | | | | | | | | |
Total | | $ | 45,950 | | | $ | (34,035,837 | ) | | — | | $ | (33,989,887 | ) |
| | | | | | | | | | | | | | |
During the six months ended February 29, 2016, there were no transfers between levels.
See Notes to Financial Statements.
| | | | | | |
| | | | | | | |
| 24 | | SEMI-ANNUAL REPORT | | FEBRUARY 29, 2016 | | |
| | |
Schedule of Investments February 29, 2016 (Unaudited) | | BlackRock Municipal Bond Trust (BBK) (Percentages shown are based on Net Assets) |
| | | | | | | | |
| Municipal Bonds | | Par
(000) | | | Value | |
Alabama — 1.8% | |
City of Birmingham Alabama Special Care Facilities Financing Authority, RB, Children’s Hospital (AGC) (a): | | | | | | | | |
6.00%, 6/01/19 | | $ | 1,600 | | | $ | 1,853,632 | |
City of Hoover Alabama Board of Education, Refunding, Special Tax, Capital Outlay Warrants, 4.25%, 2/15/40 | | | 1,275 | | | | 1,320,581 | |
| | | | | | | | |
| | | | | | | | 3,174,213 | |
Arizona — 7.3% | |
Arizona Health Facilities Authority, Refunding RB, Phoenix Children’s Hospital, Series A, 5.00%, 2/01/42 | | | 2,200 | | | | 2,379,960 | |
City of Phoenix Arizona IDA, Refunding RB, Basis Schools, Inc. Projects, Series A, 5.00%, 7/01/45 (b) | | | 460 | | | | 473,814 | |
County of Pinal Arizona Electric District No. 3, Refunding RB, Electric System, 4.75%, 7/01/31 | | | 3,750 | | | | 4,205,250 | |
Salt Verde Financial Corp., RB, Senior: | | | | | | | | |
5.00%, 12/01/32 | | | 1,500 | | | | 1,766,580 | |
5.00%, 12/01/37 | | | 2,065 | | | | 2,439,653 | |
University Medical Center Corp., RB,
6.50%, 7/01/19 (a) | | | 500 | | | | 591,525 | |
University Medical Center Corp., Refunding RB, 6.00%, 7/01/21 (a) | | | 900 | | | | 1,124,856 | |
| | | | | | | | |
| | | | | | | | 12,981,638 | |
Arkansas — 3.5% | |
City of Benton Arkansas, RB, 4.00%, 6/01/39 | | | 905 | | | | 961,182 | |
City of Fort Smith Arkansas Water & Sewer Revenue, Refunding RB, 4.00%, 10/01/40 | | | 1,240 | | | | 1,287,232 | |
City of Hot Springs Arkansas, RB, Wastewater, 5.00%, 12/01/38 | | | 1,200 | | | | 1,367,592 | |
City of Little Rock Arkansas, RB, 4.00%, 7/01/41 | | | 2,025 | | | | 2,089,901 | |
County of Pulaski Arkansas Public Facilities Board, RB, 5.00%, 12/01/42 | | | 465 | | | | 525,390 | |
| | | | | | | | |
| | | | | | | | 6,231,297 | |
California — 21.3% | |
California Health Facilities Financing Authority, RB, Sutter Health: | | | | | | | | |
Series A, 3.25%, 11/15/36 | | | 820 | | | | 809,004 | |
Series B, 5.88%, 8/15/31 | | | 1,900 | | | | 2,292,977 | |
California HFA, RB, Home Mortgage, Series G, AMT, 5.05%, 2/01/29 | | | 2,285 | | | | 2,320,669 | |
California Infrastructure & Economic Development Bank, Refunding RB, 4.00%, 11/01/45 | | | 3,350 | | | | 3,456,898 | |
Carlsbad California Unified School District, GO, Election of 2006, Series B, 0.00%, 5/01/34 (c) | | | 1,000 | | | | 1,027,220 | |
City of San Jose California, Refunding ARB, Series A-1, AMT, 5.75%, 3/01/34 | | | 2,000 | | | | 2,355,040 | |
Dinuba California Unified School District, GO, Election of 2006 (AGM), 5.75%, 8/01/33 | | | 500 | | | | 571,160 | |
Hartnell Community College District California, GO, CAB, Election of 2002, Series D, 0.00%, 8/01/34 (c) | | | 1,650 | | | | 1,464,161 | |
Norwalk-La Mirada Unified School District, GO, Refunding, CAB, Election of 2002, Series E (AGC), 0.00%, 8/01/38 (d) | | | 8,000 | | | | 3,241,440 | |
Palomar Community College District, GO, CAB, Election of 2006, Series B: | | | | | | | | |
0.00%, 8/01/30 (d) | | | 1,500 | | | | 951,660 | |
0.00%, 8/01/33 (d) | | | 4,000 | | | | 1,530,240 | |
0.00%, 8/01/39 (c) | | | 2,000 | | | | 1,729,860 | |
San Diego Community College District, GO, CAB, Election of 2002, 0.00%, 8/01/33 (c) | | | 2,800 | | | | 3,095,260 | |
State of California, GO, Refunding, Various Purposes: | | | | | | | | |
5.00%, 2/01/38 | | | 3,000 | | | | 3,476,010 | |
4.00%, 10/01/44 | | | 1,080 | | | | 1,146,074 | |
| | | | | | | | |
| Municipal Bonds | | Par
(000) | | | Value | |
California (continued) | |
State of California, GO, Various Purposes: | | | | | | | | |
5.75%, 4/01/31 | | $ | 2,000 | | | $ | 2,273,140 | |
6.00%, 3/01/33 | | | 1,000 | | | | 1,186,740 | |
6.50%, 4/01/33 | | | 1,950 | | | | 2,275,397 | |
5.50%, 3/01/40 | | | 2,350 | | | | 2,720,054 | |
| | | | | | | | |
| | | | | | | | 37,923,004 | |
Colorado — 1.2% | |
Colorado Health Facilities Authority, RB, Catholic Health Initiatives, Series D, 6.25%, 10/01/33 | | | 1,070 | | | | 1,200,743 | |
Park Creek Metropolitan District, Refunding RB, Senior Limited Property Tax (AGM), 6.00%, 12/01/20 (a) | | | 750 | | | | 917,910 | |
| | | | | | | | |
| | | | | | | | 2,118,653 | |
Connecticut — 0.7% | |
Connecticut State Health & Educational Facility Authority, Refunding RB: | | | | | | | | |
4.00%, 7/01/38 | | | 570 | | | | 600,883 | |
Lawrence & Memorial Hospital, Series F, 5.00%, 7/01/36 | | | 550 | | | | 604,439 | |
Trinity Health Corp., 3.25%, 12/01/36 | | | 100 | | | | 97,922 | |
| | | | | | | | |
| | | | | | | | 1,303,244 | |
Delaware — 2.6% | |
County of Sussex Delaware, RB, NRG Energy, Inc., Indian River Power LLC Project, 6.00%, 10/01/40 | | | 1,200 | | | | 1,300,968 | |
Delaware Transportation Authority, RB: | | | | | | | | |
5.00%, 6/01/45 | | | 2,000 | | | | 2,303,620 | |
5.00%, 6/01/55 | | | 950 | | | | 1,068,180 | |
| | | | | | | | |
| | | | | | | | 4,672,768 | |
Florida — 4.2% | |
Capital Trust Agency, Inc., RB, M/F Housing, The Gardens Apartment Project, Series A, 4.75%, 7/01/40 | | | 600 | | | | 609,012 | |
County of Miami-Dade Florida, RB, AMT, Seaport Department, Series B, 6.00%, 10/01/31 | | | 4,135 | | | | 5,097,504 | |
County of Miami-Dade Florida Educational Facilities Authority, Refunding RB, University of Miami, Series A, 5.00%, 4/01/45 | | | 920 | | | | 1,039,609 | |
County of Orange Florida Health Facilities Authority, Refunding RB, Mayflower Retirement Center, 5.00%, 6/01/36 | | | 125 | | | | 134,420 | |
Stevens Plantation Community Development District, Special Assessment, Series A, 7.10%, 5/01/35 (e)(f) | | | 910 | | | | 636,882 | |
| | | | | | | | |
| | | | | | | | 7,517,427 | |
Georgia — 2.6% | |
City of Atlanta Georgia Water & Wastewater Revenue, 5.00%, 11/01/43 | | | 4,000 | | | | 4,619,800 | |
Hawaii — 0.2% | |
Hawaii State Department of Budget & Finance, Refunding RB, Special Purpose, Senior Living, Kahala Nui, 5.25%, 11/15/37 | | | 400 | | | | 439,516 | |
Idaho — 2.5% | |
Idaho Health Facilities Authority, RB: | | | | | | | | |
St. Lukes Health System Project Series A, 5.00%, 3/01/39 | | | 900 | | | | 1,012,932 | |
Trinity Health Corp., Series 2016 ID, 4.00%, 12/01/45 | | | 1,300 | | | | 1,345,331 | |
Idaho Health Facilities Authority, Refunding RB, Trinity Health Group, Series B, 6.25%, 12/01/18 (a) | | | 1,750 | | | | 2,013,795 | |
| | | | | | | | |
| | | | | | | | 4,372,058 | |
Illinois — 4.7% | |
City of Chicago Illinois, Refunding ARB, O’Hare International Airport Passenger Facility Charge, Series B, AMT, 4.00%, 1/01/29 | | | 1,600 | | | | 1,640,320 | |
See Notes to Financial Statements.
| | | | | | |
| | | | | | | |
| | SEMI-ANNUAL REPORT | | FEBRUARY 29, 2016 | | 25 |
| | |
Schedule of Investments (continued) | | BlackRock Municipal Bond Trust (BBK) |
| | | | | | | | |
| Municipal Bonds | | Par
(000) | | | Value | |
Illinois (continued) | |
City of Chicago Illinois Midway International Airport, Refunding GARB, 2nd Lien, Series A, 5.00%, 1/01/41 | | $ | 870 | | | $ | 947,543 | |
City of Chicago Illinois Transit Authority, RB, Sales Tax Receipts, 5.25%, 12/01/40 | | | 665 | | | | 724,431 | |
Illinois Finance Authority, RB, Rush University Medical Center, Series C, 6.63%, 5/01/19 (a) | | | 650 | | | | 767,683 | |
Illinois Finance Authority, Refunding RB: | | | | | | | | |
OSF Healthcare System, Series A, 6.00%, 5/15/39 | | | 1,010 | | | | 1,164,399 | |
Roosevelt University Project, 6.50%, 4/01/44 | | | 1,000 | | | | 1,095,010 | |
Railsplitter Tobacco Settlement Authority, RB, 6.00%, 6/01/28 | | | 1,150 | | | | 1,375,503 | |
State of Illinois, GO, 5.00%, 2/01/39 | | | 665 | | | | 697,319 | |
| | | | | | | | |
| | | | | 8,412,208 | |
Iowa — 0.9% | |
Iowa Higher Education Loan Authority, Refunding RB, Private College Facility, Upper Iowa University Project: | | | | | | | | |
5.75%, 9/01/30 | | | 500 | | | | 524,400 | |
6.00%, 9/01/39 | | | 1,000 | | | | 1,046,860 | |
| | | | | | | | |
| | | | | 1,571,260 | |
Kansas — 2.5% | |
County of Seward Kansas Unified School District No. 480, GO, Refunding, 5.00%, 9/01/39 | | | 4,000 | | | | 4,484,680 | |
Kentucky — 1.9% | |
Kentucky Economic Development Finance Authority, RB, Catholic Health Initiatives, Series A, 5.38%, 1/01/40 | | | 1,830 | | | | 2,071,468 | |
Kentucky Public Transportation Infrastructure Authority, RB, Downtown Crossing Project, Convertible CAB, 1st Tier, Series C (c): | | | | | | | | |
0.00%, 7/01/34 | | | 500 | | | | 389,750 | |
0.00%, 7/01/39 | | | 830 | | | | 630,327 | |
0.00%, 7/01/43 | | | 270 | | | | 203,024 | |
| | | | | | | | |
| | | | | 3,294,569 | |
Louisiana — 2.2% | |
City of Alexandria Louisiana Utilities, RB, 5.00%, 5/01/39 | | | 860 | | | | 969,848 | |
Louisiana Local Government Environmental Facilities & Community Development Authority, RB, Westlake Chemical Corp. Project, Series A-1, 6.50%, 11/01/35 | | | 1,050 | | | | 1,228,563 | |
Louisiana Public Facilities Authority, RB, Belle Chasse Educational Foundation Project, 6.50%, 5/01/31 | | | 400 | | | | 442,932 | |
Louisiana Public Facilities Authority, Refunding RB, 4.00%, 11/01/45 | | | 1,305 | | | | 1,302,690 | |
| | | | | | | | |
| | | | | 3,944,033 | |
Maryland — 0.9% | |
County of Anne Arundel Maryland Consolidated, Special Tax District, Villages at Two Rivers Project: | | | | | | | | |
5.13%, 7/01/36 | | | 170 | | | | 175,163 | |
5.25%, 7/01/44 | | | 170 | | | | 174,842 | |
County of Montgomery Maryland, RB, Trinity Health Credit Group, 5.00%, 12/01/45 | | | 1,000 | | | | 1,167,700 | |
| | | | | | | | |
| | | | | 1,517,705 | |
Massachusetts — 1.2% | |
Massachusetts Development Finance Agency, Refunding RB: | | | | | | | | |
Emerson College, 5.00%, 1/01/41 | | | 1,600 | | | | 1,778,464 | |
International Charter School, 5.00%, 4/15/40 | | | 400 | | | | 432,224 | |
| | | | | | | | |
| | | | | 2,210,688 | |
| | | | | | | | |
| Municipal Bonds | | Par
(000) | | | Value | |
Michigan — 2.2% | |
Michigan Finance Authority, RB, Detroit Water & Sewage Disposal System, Senior Lien, Series 2014 C-2, AMT, 5.00%, 7/01/44 | | $ | 240 | | | $ | 255,242 | |
Michigan State Hospital Finance Authority, Refunding RB, Trinity Health Credit Group, Series C, 4.00%, 12/01/32 | | | 2,100 | | | | 2,225,034 | |
State of Michigan Building Authority, Refunding RB, Facilities Program, Series I: | | | | | | | | |
6.25%, 10/15/18 (a) | | | 755 | | | | 863,327 | |
6.25%, 10/15/38 | | | 495 | | | | 558,900 | |
| | | | | | | | |
| | | | | 3,902,503 | |
Minnesota — 3.3% | |
City of Minneapolis Minnesota, Refunding RB, Fairview Health Services, Series B (AGC): | | | | | | | | |
6.50%, 11/15/18 (a) | | | 710 | | | | 818,261 | |
6.50%, 11/15/38 | | | 3,890 | | | | 4,398,228 | |
Minnesota Higher Education Facilities Authority, Refunding RB (g): | | | | | | | | |
3.00%, 4/01/36 | | | 260 | | | | 246,605 | |
4.00%, 4/01/39 | | | 380 | | | | 399,285 | |
| | | | | | | | |
| | | | | 5,862,379 | |
Mississippi — 3.2% | |
County of Warren Mississippi, RB, Gulf Opportunity Zone Bonds, International Paper Co. Project, Series A, 5.38%, 12/01/35 | | | 400 | | | | 444,272 | |
Mississippi Development Bank, RB, Special Obligation: | | | | | | | | |
CAB, Hinds Community College District (AGM), 5.00%, 4/01/36 | | | 845 | | | | 928,790 | |
County of Jackson Limited Tax Note (AGC), 5.50%, 7/01/32 | | | 1,750 | | | | 1,963,133 | |
University of Southern Mississippi, RB, Campus Facilities Improvements Project, 5.38%, 9/01/19 (a) | | | 2,100 | | | | 2,428,566 | |
| | | | | | | | |
| | | | | 5,764,761 | |
Missouri — 2.3% | |
Missouri Development Finance Board, RB, Annual Appropriation Sewer System, Series B, 5.00%, 11/01/41 | | | 900 | | | | 978,030 | |
Missouri State Health & Educational Facilities Authority, RB: | | | | | | | | |
A.T. Still University of Health Sciences, 5.25%, 10/01/31 | | | 500 | | | | 573,845 | |
A.T. Still University of Health Sciences, 4.25%, 10/01/32 | | | 320 | | | | 344,707 | |
A.T. Still University of Health Sciences, 5.00%, 10/01/39 | | | 500 | | | | 565,955 | |
Heartland Regional Medical Center, 4.13%, 2/15/43 | | | 400 | | | | 413,668 | |
University of Central Missouri, Series C-2, 5.00%, 10/01/34 | | | 1,000 | | | | 1,147,240 | |
| | | | | | | | |
| | | | | 4,023,445 | |
Nebraska — 3.7% | |
Central Plains Energy Project Nebraska, RB, Gas Project No. 3, 5.00%, 9/01/42 | | | 600 | | | | 646,926 | |
County of Douglas Hospital Authority No. 2, RB, Madonna Rehabilitation Hospital Project, 4.00%, 5/15/33 | | | 1,095 | | | | 1,125,846 | |
County of Douglas Hospital Authority No. 3, Refunding RB, Health Facilities Nebraska Methodist Health System, 5.00%, 11/01/45 | | | 400 | | | | 448,504 | |
Lincoln Airport Authority, Refunding RB, Series A, 4.00%, 7/01/40 | | | 520 | | | | 547,534 | |
Minden Public Schools, GO, 4.00%, 12/15/39 | | | 500 | | | | 511,045 | |
See Notes to Financial Statements.
| | | | | | |
| | | | | | | |
| 26 | | SEMI-ANNUAL REPORT | | FEBRUARY 29, 2016 | | |
| | |
Schedule of Investments (continued) | | BlackRock Municipal Bond Trust (BBK) |
| | | | | | | | |
| Municipal Bonds | | Par
(000) | | | Value | |
Nebraska (continued) | |
Nebraska Public Power District, Refunding RB, Series A: | | | | | | | | |
5.00%, 1/01/32 | | $ | 250 | | | $ | 291,130 | |
4.00%, 1/01/44 | | | 400 | | | | 415,912 | |
Omaha School District, GO, 4.00%, 12/15/39 | | | 2,500 | | | | 2,624,750 | |
| | | | | | | | |
| | | | | 6,611,647 | |
Nevada — 1.6% | |
City of Las Vegas Nevada, Special Assessment, No. 809 Summerlin Area, 5.65%, 6/01/23 | | | 1,110 | | | | 1,118,925 | |
County of Clark Nevada, Refunding ARB, Department of Aviation, Subordinate Lien, Series A-2, 4.25%, 7/01/36 | | | 1,000 | | | | 1,058,580 | |
County of Clark Nevada, Refunding RB, Alexander Dawson School Nevada Project, 5.00%, 5/15/29 | | | 575 | | | | 580,744 | |
| | | | | | | | |
| | | | | 2,758,249 | |
New Jersey — 13.1% | |
County of Middlesex New Jersey Improvement Authority, RB, Heldrich Center Hotel, Sub-Series B, 6.25%, 1/01/37 (e)(f) | | | 915 | | | | 36,325 | |
New Jersey EDA, RB, AMT: | | | | | | | | |
Continental Airlines, Inc. Project, Series B, 5.63%, 11/15/30 | | | 660 | | | | 745,978 | |
The Goethals Bridge Replacement Project (AGM), 5.13%, 7/01/42 | | | 200 | | | | 219,514 | |
New Jersey EDA, Refunding RB, Special Assessment, Kapkowski Road Landfill Project, 6.50%, 4/01/28 | | | 7,500 | | | | 9,177,825 | |
New Jersey Educational Facilities Authority, Refunding RB: | | | | | | | | |
The College of New Jersey, 3.50%, 7/01/31 | | | 1,225 | | | | 1,252,036 | |
University of Medicine & Dentistry, Series B, 7.13%, 6/01/19 (a) | | | 630 | | | | 753,619 | |
University of Medicine & Dentistry, Series B, 7.50%, 6/01/19 (a) | | | 800 | | | | 966,568 | |
New Jersey Health Care Facilities Financing Authority, Refunding RB, St. Barnabas Health Care System, Series A: | | | | | | | | |
4.63%, 7/01/23 | | | 510 | | | | 574,571 | |
5.00%, 7/01/25 | | | 500 | | | | 582,245 | |
5.63%, 7/01/37 | | | 1,700 | | | | 1,970,368 | |
New Jersey Housing & Mortgage Finance Agency, RB, S/F Housing, Series AA, 6.50%, 10/01/38 | | | 100 | | | | 103,600 | |
New Jersey State Turnpike Authority, RB, Series E, 5.00%, 1/01/45 | | | 1,860 | | | | 2,112,848 | |
New Jersey Transportation Trust Fund Authority, RB: | | | | | | | | |
CAB, Transportation System, Series A, 0.00%, 12/15/35 (d) | | | 1,000 | | | | 369,040 | |
Transportation Program, Series AA, 5.00%, 6/15/44 | | | 3,030 | | | | 3,174,319 | |
Transportation Program, Series AA, 5.00%, 6/15/45 | | | 900 | | | | 946,386 | |
Transportation Program, Series AA, 5.00%, 6/15/46 | | | 400 | | | | 420,304 | |
| | | | | | | | |
| | | | | 23,405,546 | |
New Mexico — 0.3% | |
New Mexico Hospital Equipment Loan Council, Refunding RB, Presbyterian Healthcare Services, 5.00%, 8/01/44 | | | 450 | | | | 515,034 | |
New York — 8.1% | |
City of New York New York, GO, Fiscal 2014, Sub-Series A-1, 5.00%, 8/01/35 | | | 1,580 | | | | 1,870,704 | |
City of New York New York Industrial Development Agency, ARB, American Airlines, Inc., JFK International Airport Project, AMT, 7.75%, 8/01/31 (h) | | | 3,165 | | | | 3,284,447 | |
| | | | | | | | |
| Municipal Bonds | | Par
(000) | | | Value | |
New York (continued) | |
City of New York New York Industrial Development Agency, RB, PILOT, Queens Baseball Stadium (AMBAC), 5.00%, 1/01/39 | | $ | 925 | | | $ | 945,452 | |
City of New York New York Municipal Water Finance Authority, Refunding RB, Water & Sewer System, Series A, 3.00%, 6/15/36 (g) | | | 1,920 | | | | 1,879,891 | |
County of New York Tobacco Trust IV, Refunding RB, Settlement Pass-Through Turbo, Series A, 6.25%, 6/01/41 (b) | | | 900 | | | | 938,673 | |
Erie Tobacco Asset Securitization Corp., Refunding RB, Asset-Backed, Series A, 5.00%, 6/01/45 | | | 1,160 | | | | 1,125,223 | |
Metropolitan Transportation Authority, RB, Series B, 5.25%, 11/15/39 | | | 2,300 | | | | 2,690,471 | |
New York Liberty Development Corp., Refunding RB: | | | | | | | | |
2nd Priority, Bank of America Tower at One Bryant Park Project, Class 3, 6.38%, 7/15/49 | | | 800 | | | | 900,456 | |
3 World Trade Center Project, Class 2, 5.38%, 11/15/40 (b) | | | 405 | | | | 441,552 | |
Niagara Area Development Corp., Refunding RB, Solid Waste Disposal Facility, Covanta Energy Project, Series A, AMT, 5.25%, 11/01/42 (b) | | | 400 | | | | 405,752 | |
| | | | | | | | |
| | | | | | | | 14,482,621 | |
North Carolina — 2.0% | |
County of Gaston North Carolina Industrial Facilities & Pollution Control Financing Authority, RB, Exempt Facilities, National Gypsum Co. Project, AMT, 5.75%, 8/01/35 | | | 2,695 | | | | 2,700,120 | |
North Carolina Medical Care Commission, Refunding RB, University Health System, Series D, 6.25%, 12/01/18 (a) | | | 800 | | | | 920,792 | |
| | | | | | | | |
| | | | | | | | 3,620,912 | |
North Dakota — 0.5% | |
City of Fargo, GO, Series D, 4.00%, 5/01/37 | | | 225 | | | | 238,284 | |
County of Burleigh North Dakota, Refunding RB, St. Alexius Medical Center Project, Series A, 5.00%, 7/01/21 (a) | | | 480 | | | | 575,146 | |
| | | | | | | | |
| | | | | | | | 813,430 | |
Ohio — 1.2% | |
City of Dayton Ohio Airport Revenue, Refunding ARB, James M Cox Dayton International Airport, AMT, 4.00%, 12/01/32 | | | 2,000 | | | | 2,072,700 | |
Oklahoma — 1.4% | |
Oklahoma City Public Property Authority, Refunding RB, 5.00%, 10/01/39 | | | 720 | | | | 815,458 | |
Oklahoma Municipal Power Authority, RB, Power Supply System, Series A, 4.00%, 1/01/38 | | | 620 | | | | 649,450 | |
Oklahoma Water Resources Board, RB, 4.00%, 4/01/40 | | | 990 | | | | 1,053,617 | |
| | | | | | | | |
| | | | | | | | 2,518,525 | |
Oregon — 3.0% | |
County of Jackson Oregon Airport Revenue, Refunding RB: | | | | | | | | |
3.00%, 12/01/35 | | | 150 | | | | 145,157 | |
3.13%, 12/01/37 | | | 110 | | | | 106,559 | |
County of Umatilla Pendleton Oregon School District No. 16R, GO, Series A, 4.00%, 6/15/38 | | | 125 | | | | 134,495 | |
Lane County School District No. 19 Springfield, GO, CAB, Series B, 0.00%, 6/15/40 (d) | | | 1,000 | | | | 396,370 | |
Oregon Health & Science University, RB, Series A, 5.75%, 7/01/19 (a) | | | 750 | | | | 871,253 | |
Oregon Health & Science University, Refunding RB, Series B, 4.00%, 7/01/46 | | | 1,155 | | | | 1,206,732 | |
See Notes to Financial Statements.
| | | | | | |
| | | | | | | |
| | SEMI-ANNUAL REPORT | | FEBRUARY 29, 2016 | | 27 |
| | |
Schedule of Investments (continued) | | BlackRock Municipal Bond Trust (BBK) |
| | | | | | | | |
| Municipal Bonds | | Par
(000) | | | Value | |
Oregon (continued) | |
State of Oregon State Facilities Authority, Refunding RB, Series A, 5.00%, 4/01/45 | | $ | 2,220 | | | $ | 2,495,657 | |
| | | | | | | | |
| | | | | | | | 5,356,223 | |
Pennsylvania — 4.3% | |
County of Allegheny Pennsylvania IDA, Refunding RB, U.S. Steel Corp. Project, 6.55%, 12/01/27 | | | 1,695 | | | | 1,000,813 | |
Delaware County Authority, RB, Villanova University, 4.00%, 8/01/45 | | | 2,000 | | | | 2,085,840 | |
Delaware River Port Authority, RB: | | | | | | | | |
4.50%, 1/01/32 | | | 1,500 | | | | 1,680,555 | |
Series D (AGM), 5.00%, 1/01/40 | | | 2,600 | | | | 2,895,958 | |
| | | | | | | | |
| | | | | | | | 7,663,166 | |
Rhode Island — 4.7% | |
Rhode Island Health & Educational Building Corp., RB, Hospital Financing, LifeSpan Obligation, Series A (AGC), 7.00%, 5/15/39 | | | 1,000 | | | | 1,157,430 | |
Rhode Island Infrastructure Bank, RB, Series A: | | | | | | | | |
3.00%, 10/01/31 | | | 200 | | | | 203,172 | |
3.00%, 10/01/32 | | | 80 | | | | 80,747 | |
Rhode Island Turnpike & Bridge Authority, Refunding RB, Series A: | | | | | | | | |
4.00%, 10/01/36 | | | 780 | | | | 820,349 | |
5.00%, 10/01/40 | | | 1,155 | | | | 1,329,798 | |
State of Rhode Island, COP, School for the Deaf Project, Series C (AGC), 5.38%, 4/01/28 | | | 900 | | | | 1,000,764 | |
Tobacco Settlement Financing Corp., Refunding RB: | | | | | | | | |
Series A, 5.00%, 6/01/40 | | | 1,000 | | | | 1,063,920 | |
Series B, 4.50%, 6/01/45 | | | 2,730 | | | | 2,756,618 | |
| | | | | | | | |
| | | | | | | | 8,412,798 | |
Tennessee — 2.7% | |
Chattanooga Health Educational & Housing Facility Board, RB, Catholic Health Initiatives, Series A, 5.25%, 1/01/40 | | | 1,950 | | | | 2,189,889 | |
County of Chattanooga-Hamilton Tennessee Hospital Authority, Refunding RB, 5.00%, 10/01/44 | | | 875 | | | | 975,047 | |
County of Memphis-Shelby Tennessee Sports Authority, Inc., Refunding RB, Memphis Arena Project, Series A, 5.38%, 11/01/28 | | | 275 | | | | 315,744 | |
Johnson City Health & Educational Facilities Board, RB, Mountain States Health, Series A, 5.00%, 8/15/42 | | | 800 | | | | 870,288 | |
Metropolitan Government of Nashville & Davidson County Health & Educational Facilities Board, Refunding RB, Lipscomb University Project, Series A, 5.00%, 10/01/45 (g) | | | 385 | | | | 428,763 | |
| | | | | | | | |
| | | | | | | | 4,779,731 | |
Texas — 9.5% | |
County of Harris Texas Health Facilities Development Corp., Refunding RB, Memorial Hermann Healthcare System, Series B (a): | | | | | | | | |
7.13%, 12/01/18 | | | 500 | | | | 586,985 | |
7.25%, 12/01/18 | | | 1,750 | | | | 2,060,415 | |
County of Harris Texas Houston Sports Authority, Refunding RB, CAB, Senior Lien, Series G (NPFGC), 0.00%, 11/15/41 (d) | | | 11,690 | | | | 3,400,504 | |
County of Matagorda Texas Navigation District No. 1, Refunding RB, Central Power & Light Co., Project, Series A, 6.30%, 11/01/29 | | | 1,500 | | | | 1,705,755 | |
County of Midland Texas Fresh Water Supply District No. 1, RB, CAB, City of Midland Project, Series A, 0.00%, 9/15/38 (d) | | | 10,760 | | | | 4,135,714 | |
Leander ISD, GO, Refunding, CAB Series D, 0.00%, 8/15/35 (d) | | | 4,000 | | | | 1,819,520 | |
| | | | | | | | |
| Municipal Bonds | | Par
(000) | | | Value | |
Texas (continued) | |
Red River Education Financing Corp., RB, Texas Christian University Project, 5.25%, 3/15/38 | | $ | 760 | | | $ | 877,230 | |
Texas Private Activity Bond Surface Transportation Corp., RB, Senior Lien, LBJ Infrastructure Group LLC, LBJ Freeway Managed Lanes Project, 7.00%, 6/30/40 | | | 2,000 | | | | 2,417,920 | |
| | | | | | | | |
| | | | | | | | 17,004,043 | |
U.S. Virgin Islands — 0.8% | |
Virgin Islands Public Finance Authority, Refunding RB, Virgin Islands Gross Receipts, Series C, 4.50%, 10/01/44 | | | 1,360 | | | | 1,398,012 | |
Utah — 0.2% | |
Utah State Charter School Finance Authority, Refunding RB, Mountainville Academy, 4.00%, 4/15/42 | | | 400 | | | | 406,588 | |
Vermont — 2.7% | |
University of Vermont & State Agricultural College, Refunding RB, 4.00%, 10/01/37 | | | 2,360 | | | | 2,491,664 | |
Vermont Educational & Health Buildings Financing Agency, Refunding RB, Fletcher Allen Health Hospital, Series B (AGM), 5.00%, 6/01/18 (a) | | | 1,190 | | | | 1,304,062 | |
Vermont Student Assistance Corp., RB, Series A, 4.13%, 6/15/30 | | | 1,000 | | | | 1,045,050 | |
| | | | | | | | |
| | | | | | | | 4,840,776 | |
Virginia — 0.6% | |
Virginia Small Business Financing Authority, RB, Senior Lien, Elizabeth River Crossings OpCo LLC Project, AMT, 6.00%, 1/01/37 | | | 880 | | | | 1,017,966 | |
Washington — 0.9% | |
Washington Health Care Facilities Authority, RB, MultiCare Health System, Series B (AGC), 6.00%, 8/15/19 (a) | | | 1,400 | | | | 1,645,140 | |
Wisconsin — 0.4% | |
WPPI Energy Power Supply Systems, Refunding RB, Series A, 5.00%, 7/01/37 | | | 665 | | | | 765,102 | |
| Total Municipal Bonds — 134.9% | | | | | | | 240,430,058 | |
| | | | | | | | |
| | |
|
Municipal Bonds Transferred to
Tender Option Bond Trusts (i) | |
Colorado — 2.3% | |
Colorado Health Facilities Authority, RB, Catholic Health, Series C-7 (AGM), 5.00%, 5/01/18 (a) | | | 3,750 | | | | 4,097,287 | |
Connecticut — 1.7% | |
Connecticut State Health & Educational Facility Authority, Refunding RB, Trinity Health Credit Group, 5.00%, 12/01/45 | | | 2,611 | | | | 3,014,165 | |
New Jersey — 0.8% | |
New Jersey Transportation Trust Fund Authority, RB, Transportation System, Series B,
5.25%, 6/15/36 (j) | | | 1,400 | | | | 1,487,813 | |
New York — 14.3% | | | | | |
City of New York New York, GO, Fiscal 2015, Series B, 4.00%, 8/01/32 | | | 3,990 | | | | 4,312,711 | |
City of New York New York Municipal Water Finance Authority, RB, Water & Sewer System, Fiscal 2009, Series A, 5.75%, 6/15/40 | | | 450 | | | | 499,216 | |
City of New York New York Municipal Water Finance Authority, Refunding RB, Water & Sewer System: | | | | | | | | |
2nd General Resolution, Fiscal 2013, Series CC, 5.00%, 6/15/47 | | | 6,000 | | | | 6,938,506 | |
See Notes to Financial Statements.
| | | | | | |
| | | | | | | |
| 28 | | SEMI-ANNUAL REPORT | | FEBRUARY 29, 2016 | | |
| | |
Schedule of Investments (continued) | | BlackRock Municipal Bond Trust (BBK) |
| | | | | | | | |
Municipal Bonds Transferred to
Tender Option Bond Trusts (i) | | Par
(000) | | | Value | |
New York (continued) | | | | | |
City of New York New York Municipal Water Finance Authority, Refunding RB, Water & Sewer System: (continued) | | | | | | | | |
2nd General Resolution, Series FF-2, 5.50%, 6/15/40 | | $ | 405 | | | $ | 459,729 | |
Series A, 4.75%, 6/15/30 | | | 3,000 | | | | 3,149,880 | |
Hudson Yards Infrastructure Corp., RB, Fiscal 2012, Series A, 5.75%, 2/15/47 (j) | | | 2,500 | | | | 2,905,267 | |
New York Liberty Development Corp., RB, 1 World Trade Center Port Authority Consolidated Bonds, 5.25%, 12/15/43 | | | 2,505 | | | | 2,900,645 | |
State of New York Dormitory Authority, RB, New York University, Series A, 5.00%, 7/01/18 (a) | | | 2,199 | | | | 2,416,271 | |
State of New York Thruway Authority, Refunding RB, Transportation, Personal Income Tax, Series A, 5.00%, 3/15/31 | | | 1,560 | | | | 1,833,874 | |
| | | | | | | | |
| | | | | | | | 25,416,099 | |
Ohio — 1.9% | | | | | |
County of Montgomery Ohio, RB, Catholic Health, Series C-1 (AGM), 5.00%, 4/28/18 (a) | | | 1,260 | | | | 1,325,092 | |
Ohio Higher Educational Facility Commission, RB, Cleveland Clinic Health, Series A, 5.25%, 1/01/33 | | | 2,000 | | | | 2,153,700 | |
| | | | | | | | |
| | | | | | | | 3,478,792 | |
| | | | | | | | |
Municipal Bonds Transferred to
Tender Option Bond Trusts (i) | | Par
(000) | | | Value | |
Texas — 1.0% | | | | | |
City of San Antonio Texas Public Service Board, RB, Electric & Gas Systems, Junior Lien, 5.00%, 2/01/43 | | $ | 1,580 | | | $ | 1,766,740 | |
Total Municipal Bonds Transferred to
Tender Option Bond Trusts — 22.0% | | | | 39,260,896 | |
Total Long-Term Investments
(Cost — $253,858,772) — 156.9% | | | | 279,690,954 | |
| | | | | | | | |
| | |
| | |
| Short-Term Securities | | Shares | | | | |
BlackRock Liquidity Funds, MuniCash, 0.02% (k)(l) | | | 328,750 | | | | 328,750 | |
Total Short-Term Securities
(Cost — $328,750) — 0.2% | | | | | | | 328,750 | |
| Total Investments (Cost — $254,187,522) — 157.1% | | | | 280,019,704 | |
| Liabilities in Excess of Other Assets — (0.4)% | | | | (647,819 | ) |
Liability for TOB Trust Certificates, Including Interest
Expense and Fees Payable — (11.9)% | | | | (21,239,679 | ) |
| VMTP Shares, at Liquidation Value — (44.8)% | | | | | | | (79,900,000 | ) |
| | | | | | | | |
| Net Assets Applicable to Common Shares — 100.0% | | | $ | 178,232,206 | |
| | | | | |
|
| Notes to Schedule of investments |
| (a) | | U.S. Government securities, held in escrow, are used to pay interest on this security, as well as to retire the bond in full at the date indicated, typically at a premium to par. |
| (b) | | Security exempt from registration pursuant to Rule 144A under the Securities Act of 1933, as amended. These securities may be resold in transactions exempt from registration to qualified institutional investors. |
| (c) | | Step-up bond that pays an initial coupon rate for the first period and then a higher coupon rate for the following periods. Rate as of period end. |
| (e) | | Issuer filed for bankruptcy and/or is in default of interest payments. |
| (f) | | Non-income producing security. |
| (g) | | When-issued security. |
| (h) | | Variable rate security. Rate as of period end. |
| (i) | | Represent bonds transferred to a TOB Trust in exchange of cash and residual certificates received by the Trust. These bonds serve as collateral in a secured borrowing. See Note 4 of the Notes to Financial Statements for details. |
| (j) | | All or a portion of security is subject to a recourse agreement. The aggregate maximum potential amount the Trust could ultimately be required to pay under the agreements, which expire between February 15, 2019 and June 15, 2019, is $2,411,645. See Note 4 of the Notes to Financial Statements for details. |
| (k) | | During the six months ended February 29, 2016, investments in issuers considered to be affiliates of the Trust for purposes of Section 2(a)(3) of the Investment Company Act of 1940, as amended, were as follows: |
| | | | | | | | | | | | | | | | |
| Affiliate | | Shares Held
at August 31,
2015 | | | Net
Activity | | | Shares Held
at February 29,
2016 | | | Income | |
BlackRock Liquidity Funds, MuniCash | | | — | | | | 328,750 | | | | 328,750 | | | | — | |
FFI Institutional Tax Exempt Fund | | | 6,015,344 | | | | (6,015,344 | ) | | | — | | | $ | 331 | |
Total | | | | | | | | | | | 328,750 | | | $ | 331 | |
| | | | | | | | | | | | | | | | |
| (l) | | Current yield as of period end. |
See Notes to Financial Statements.
| | | | | | |
| | | | | | | |
| | SEMI-ANNUAL REPORT | | FEBRUARY 29, 2016 | | 29 |
| | |
Schedule of Investments (continued) | | BlackRock Municipal Bond Trust (BBK) |
|
| Derivative Financial Instruments Outstanding as of Period End |
| | | | | | | | | | | | | | | | |
| Financial Futures Contracts | | | |
Contracts
Short | | | Issue | | Expiration | | Notional
Value | | | Unrealized
Appreciation (Depreciation) | | | |
| | (37 | ) | | 5-Year U.S. Treasury Note | | June 2016 | | $ | 4,476,422 | | | $ | 2,565 | | | |
| | (52 | ) | | 10-Year U.S. Treasury Note | | June 2016 | | $ | 6,786,813 | | | | (5,712 | ) | | |
| | (32 | ) | | Long U.S. Treasury Bond | | June 2016 | | $ | 5,265,000 | | | | 30,797 | | | |
| | (9 | ) | | Ultra U.S. Treasury Bond | | June 2016 | | $ | 1,558,406 | | | | 7,860 | | | |
| | Total | | | | | | | | | | | $ | 35,510 | | | |
| | | | | | | | | | | | | |
|
| Derivative Financial Instruments Categorized by Risk Exposure |
As of period end, the fair values of derivative financial instruments located in the Statements of Assets and Liabilities were as follows:
| | | | | | | | | | | | | | | | | | | | | | | | | | | | | | |
| Assets — Derivative Financial Instruments | | Commodity
Contracts | | | Credit
Contracts | | | Equity
Contracts | | | Foreign
Currency
Exchange
Contracts | | | Interest
Rate
Contracts | | | Other
Contracts | | | Total | |
Financial futures contracts | | Net unrealized appreciation1 | | | — | | | | — | | | | — | | | | — | | | $ | 41,222 | | | | — | | | $ | 41,222 | |
| | | | | | | | |
| Liabilities — Derivative Financial Instruments | | | | | | | | | | | | | | | | | | | | | |
Financial futures contracts | | Net unrealized depreciation1 | | | — | | | | — | | | | — | | | | — | | | $ | (5,712 | ) | | | — | | | $ | (5,712 | ) |
1 Includes cumulative appreciation (depreciation) on financial futures contracts, if any, as reported in the Schedule of Investments. Only current day’s variation margin is reported within the Statements of Assets and Liabilities. | |
| For the six months ended February 29, 2016, the effect of derivative financial instruments in the Statements of Operations was as follows: | |
| Net Realized Gain (Loss) from: | | | | Commodity
Contracts | | | Credit
Contracts | | | Equity
Contracts | | | Foreign
Currency
Exchange
Contracts | | | Interest
Rate
Contracts | | | Other
Contracts | | | Total | |
Financial futures contracts | | | | | — | | | | — | | | | — | | | | — | | | $ | (666,155 | ) | | | — | | | $ | (666,155 | ) |
| | | | | | | | |
Net Change in Unrealized
Appreciation (Depreciation) on: | | | | | | | | | | | | | | | | | | | | | | | |
Financial futures contracts | | | | | — | | | | — | | | | — | | | | — | | | $ | 5,891 | | | | — | | | $ | 5,891 | |
| | |
| Average Quarterly Balances of Outstanding Derivative Financial Instruments | | |
| | | | |
| Financial futures contracts: | | | |
Average notional value of contracts — short | | $ | 11,715,215 | |
For more information about the Trust‘s investment risks regarding derivative financial instruments, refer to the Notes to Financial Statements.
See Notes to Financial Statements.
| | | | | | |
| | | | | | | |
| 30 | | SEMI-ANNUAL REPORT | | FEBRUARY 29, 2016 | | |
| | |
Schedule of Investments (concluded) | | BlackRock Municipal Bond Trust (BBK) |
| | |
| Fair Value Hierarchy as of Period End | | |
Various inputs are used in determining the fair value of investments and derivative financial instruments. For information about the Trust’s policy regarding valuation of investments and derivative financial instruments, refer to the Notes to Financial Statements.
The following tables summarize the Trust’s investments and derivative financial instruments categorized in the disclosure hierarchy:
| | | | | | | | | | | | | | |
| | | Level 1 | | | Level 2 | | | Level 3 | | Total | |
Assets: | | | | | | | | | | | | | | |
| Investments: | | | | | | | | | | | | | | |
Long-Term Investments 1 | | | — | | | $ | 279,690,954 | | | — | | $ | 279,690,954 | |
Short-Term Securities | | $ | 328,750 | | | | — | | | — | | | 328,750 | |
| | | | |
Total | | $ | 328,750 | | | $ | 279,690,954 | | | — | | $ | 280,019,704 | |
| | | | |
1 See above Schedule of Investments for values in each state or political subdivision. | |
| | | | | | | | | | | | | | |
| | | Level 1 | | | Level 2 | | | Level 3 | | Total | |
| Derivative Financial Instruments 1 | | | | | | | |
Assets: | | | | | | | | | | | | | | |
Interest rate contracts | | $ | 41,222 | | | | — | | | — | | $ | 41,222 | |
Liabilities: | | | | | | | | | | | | | | |
Interest rate contracts | | | (5,712 | ) | | | — | | | — | | | (5,712 | ) |
| | | | |
Total | | $ | 35,510 | | | | — | | | — | | $ | 35,510 | |
| | | | |
1 Derivative financial instruments are financial futures contracts, which are valued at the unrealized appreciation (depreciation) on the instrument. | |
| | | | | | | | | | | | | | |
| The Trust may hold assets and/or liabilities in which the fair value approximates the carrying amount for financial statement purposes. As of period end, such assets and/or liabilities are categorized within the disclosure hierarchy as follows: | |
| | | Level 1 | | | Level 2 | | | Level 3 | | Total | |
Assets: | | | | | | | | | | | | | | |
Cash pledged for financial futures contracts | | $ | 275,050 | | | | — | | | — | | $ | 275,050 | |
Liabilities: | | | | | | | | | | | | | | |
TOB Trust Certificates | | | — | | | $ | (21,235,789 | ) | | — | | | (21,235,789 | ) |
VMTP Shares | | | — | | | | (79,900,000 | ) | | — | | | (79,900,000 | ) |
| | | | |
Total | | $ | 275,050 | | | $ | (101,135,789 | ) | | — | | $ | (100,860,739 | ) |
| | | | |
During the six months ended February 29, 2016, there were no transfers between levels.
See Notes to Financial Statements.
| | | | | | |
| | | | | | | |
| | SEMI-ANNUAL REPORT | | FEBRUARY 29, 2016 | | 31 |
| | |
Schedule of Investments February 29, 2016 (Unaudited) | | BlackRock Municipal Income Investment Quality Trust (BAF) (Percentages shown are based on Net Assets) |
| | | | | | | | |
| Municipal Bonds | | Par
(000) | | | Value | |
Alabama — 1.9% | | | | | | | | |
City of Birmingham Alabama Special Care Facilities Financing Authority, RB, Children’s Hospital (AGC) (a): | | | | | | | | |
6.00%, 6/01/19 | | $ | 1,000 | | | $ | 1,158,451 | |
6.13%, 6/01/19 | | | 1,000 | | | | 1,162,510 | |
City of Selma Alabama IDB, RB, Gulf Opportunity Zone, International Paper Co. Project, Series A, 5.38%, 12/01/35 | | | 335 | | | | 372,078 | |
| | | | | | | | |
| | | | | | | | 2,693,039 | |
California — 14.7% | | | | | | | | |
California Educational Facilities Authority, RB, University of Southern California, Series A, 5.25%, 10/01/38 | | | 2,155 | | | | 2,393,300 | |
California Health Facilities Financing Authority, RB, Sutter Health, Series B, 6.00%, 8/15/42 | | | 1,120 | | | | 1,343,653 | |
City of Los Angeles California Department of Water & Power, RB, Power System, Sub-Series A-1, 5.25%, 7/01/38 | | | 1,175 | | | | 1,287,142 | |
County of Sacramento California, ARB, Senior Series A (AGC), 5.50%, 7/01/41 | | | 1,400 | | | | 1,538,250 | |
Kern Community College District, GO, Safety, Repair & Improvement, Series C, 5.50%, 11/01/33 | | | 1,025 | | | | 1,277,304 | |
Los Angeles Municipal Improvement Corp., Refunding LRB, Real Property, Series B (AGC), 5.50%, 4/01/39 | | | 3,210 | | | | 3,603,931 | |
Redondo Beach Unified School District, GO, Election of 2008, Series E, 5.50%, 8/01/34 | | | 1,000 | | | | 1,181,950 | |
San Diego Public Facilities Financing Authority Water, Refunding RB, Series B (AGC), 5.38%, 8/01/34 | | | 1,125 | | | | 1,276,538 | |
State of California Public Works Board, LRB, Various Capital Projects, Series I: | | | | | | | | |
5.50%, 11/01/30 | | | 1,000 | | | | 1,239,740 | |
5.50%, 11/01/31 | | | 1,500 | | | | 1,850,040 | |
State of California Public Works Board, RB, Department of Corrections & Rehabilitation, Series F, 5.25%, 9/01/33 | | | 505 | | | | 603,697 | |
Township of Washington California Health Care District, GO, Election of 2004, Series B, 5.50%, 8/01/40 | | | 380 | | | | 456,813 | |
University of California, Refunding RB, The Regents of Medical Center, Series J, 5.25%, 5/15/38 | | | 2,355 | | | | 2,793,171 | |
| | | | | | | | |
| | | | | | | | 20,845,529 | |
Colorado — 3.9% | | | | | | | | |
City & County of Denver Colorado Airport System, ARB, Sub-System, Series B, 5.25%, 11/15/32 | | | 3,250 | | | | 3,873,512 | |
Colorado Health Facilities Authority, RB, Hospital, NCMC, Inc. Project, Series B (AGM), 6.00%, 5/15/26 | | | 1,425 | | | | 1,595,858 | |
| | | | | | | | |
| | | | | | | | 5,469,370 | |
Florida — 8.2% | | | | | | | | |
City of Jacksonville Florida, RB, Series A, 5.25%, 10/01/31 | | | 4,525 | | | | 5,324,432 | |
City of Jacksonville Florida, Refunding RB, Series A, 5.25%, 10/01/33 | | | 205 | | | | 245,467 | |
County of Miami-Dade Florida, RB, Seaport, Series A, 6.00%, 10/01/38 | | | 4,215 | | | | 5,124,850 | |
Reedy Creek Improvement District, GO, Series A, 5.25%, 6/01/32 | | | 745 | | | | 883,406 | |
| | | | | | | | |
| | | | | | | | 11,578,155 | |
Georgia — 2.1% | | | | | | | | |
City of Atlanta Georgia Department of Aviation, Refunding GARB, Series C, 6.00%, 1/01/30 | | | 2,500 | | | | 3,020,550 | |
Illinois — 22.0% | | | | | | | | |
City of Chicago Illinois, GARB, O’Hare International Airport, 3rd Lien: | | | | | | | | |
Series A, 5.75%, 1/01/39 | | | 825 | | | | 961,595 | |
Series C, 6.50%, 1/01/41 | | | 3,740 | | | | 4,502,848 | |
| | | | | | | | |
| Municipal Bonds | | Par
(000) | | | Value | |
Illinois (continued) | | | | | | | | |
City of Chicago Illinois, Refunding GARB, O’Hare International Airport, 3rd Lien, Series C (AGC), 5.25%, 1/01/30 | | $ | 1,000 | | | $ | 1,131,760 | |
City of Chicago Illinois Transit Authority, RB: | | | | | | | | |
Federal Transit Administration, Section 5309, Series A (AGC), 6.00%, 12/01/18 (a) | | | 1,300 | | | | 1,485,510 | |
Sales Tax Receipts, 5.25%, 12/01/36 | | | 3,185 | | | | 3,493,977 | |
Sales Tax Receipts, 5.25%, 12/01/40 | | | 3,000 | | | | 3,268,110 | |
City of Chicago Illinois Transit Authority, Refunding RB, Federal Transit Administration, Section 5309 (AGM), 5.00%, 6/01/28 | | | 3,000 | | | | 3,230,010 | |
City of Chicago Illinois Wastewater Transmission, RB, 2nd Lien, 5.00%, 1/01/42 | | | 1,480 | | | | 1,571,346 | |
County of Cook Illinois Community College District No. 508, GO, City College of Chicago: | | | | | | | | |
5.50%, 12/01/38 | | | 1,250 | | | | 1,441,375 | |
5.25%, 12/01/43 | | | 3,000 | | | | 3,366,720 | |
Illinois Finance Authority, RB, Carle Foundation, Series A, 6.00%, 8/15/41 | | | 1,885 | | | | 2,224,036 | |
Railsplitter Tobacco Settlement Authority, RB: | | | | | | | | |
5.50%, 6/01/23 | | | 915 | | | | 1,079,087 | |
6.00%, 6/01/28 | | | 260 | | | | 310,983 | |
State of Illinois, GO: | | | | | | | | |
5.25%, 2/01/31 | | | 610 | | | | 663,039 | |
5.25%, 2/01/32 | | | 1,000 | | | | 1,080,600 | |
5.50%, 7/01/33 | | | 1,000 | | | | 1,095,860 | |
5.50%, 7/01/38 | | | 270 | | | | 292,486 | |
| | | | | | | | |
| | | | | | | | 31,199,342 | |
Indiana — 1.9% | | | | | | | | |
Indianapolis Local Public Improvement Bond Bank, Refunding RB, Waterworks Project, Series A (AGC), 5.50%, 1/01/38 | | | 2,415 | | | | 2,719,121 | |
Louisiana — 1.0% | | | | | | | | |
City of New Orleans Louisiana Aviation Board, Refunding GARB, Restructuring (AGC): | | | | | | | | |
Series A-1, 6.00%, 1/01/23 | | | 375 | | | | 424,972 | |
Series A-2, 6.00%, 1/01/23 | | | 150 | | | | 169,269 | |
Tobacco Settlement Financing Corp., Refunding RB, Asset-Backed, Series A, 5.50%, 5/15/29 | | | 790 | | | | 867,610 | |
| | | | | | | | |
| | | | | | | | 1,461,851 | |
Maryland — 0.2% | | | | | | | | |
Maryland Economic Development Corp., Refunding RB, University Of Maryland, College Park Projects, 5.00%, 6/01/35 (b) | | | 195 | | | | 226,083 | |
Michigan — 2.4% | | | | | | | | |
City of Detroit Michigan Water Supply System, RB, 2nd Lien, Series B (AGM), 6.25%, 7/01/36 | | | 1,700 | | | | 1,912,806 | |
Royal Oak Hospital Finance Authority Michigan, Refunding RB, William Beaumont Hospital, Series V, 8.25%, 9/01/18 (a) | | | 1,205 | | | | 1,430,227 | |
| | | | | | | | |
| | | | | | | | 3,343,033 | |
Minnesota — 3.0% | | | | | | | | |
City of Minneapolis Minnesota, Refunding RB, Fairview Health Services, Series B (AGC): | | | | | | | | |
6.50%, 11/15/18(a) | | | 565 | | | | 651,151 | |
6.50%, 11/15/38 | | | 3,115 | | | | 3,521,975 | |
| | | | | | | | |
| | | | | | | | 4,173,126 | |
Mississippi — 2.2% | | | | | | | | |
Mississippi Development Bank, RB, Jackson Water & Sewer System Project (AGM), 6.88%, 12/01/40 | | | 1,500 | | | | 2,009,025 | |
See Notes to Financial Statements.
| | | | | | |
| | | | | | | |
| 32 | | SEMI-ANNUAL REPORT | | FEBRUARY 29, 2016 | | |
| | |
Schedule of Investments (continued) | | BlackRock Municipal Income Investment Quality Trust (BAF) |
| | | | | | | | |
| Municipal Bonds | | Par
(000) | | | Value | |
Mississippi (continued) | | | | | | | | |
Mississippi State University Educational Building Corp., Refunding RB, Mississippi State University Improvement Project, 5.25%, 8/01/38 | | $ | 1,000 | | | $ | 1,168,980 | |
| | | | | | | | |
| | | | | | | | 3,178,005 | |
Nevada — 5.7% | | | | | | | | |
County of Clark Nevada, GO, Limited Tax, 5.00%, 6/01/38 | | | 5,410 | | | | 5,846,208 | |
County of Clark Nevada Water Reclamation District, GO, Series A, 5.25%, 7/01/34 | | | 2,000 | | | | 2,258,720 | |
| | | | | | | | |
| | | | | | | | 8,104,928 | |
New Jersey — 5.0% | | | | | | | | |
New Jersey Health Care Facilities Financing Authority, RB, Virtua Health, Series A (AGC), 5.50%, 7/01/38 | | | 1,300 | | | | 1,459,653 | |
New Jersey Housing & Mortgage Finance Agency, RB, S/F Housing, Series CC, 5.25%, 10/01/29 | | | 1,540 | | | | 1,634,895 | |
New Jersey Transportation Trust Fund Authority, RB, Transportation System: | | | | | | | | |
Series A (AGC), 5.50%, 12/15/38 | | | 2,000 | | | | 2,182,060 | |
Series AA, 5.50%, 6/15/39 | | | 1,620 | | | | 1,775,536 | |
| | | | | | | | |
| | | | | | | | 7,052,144 | |
New York — 4.1% | | | | | | | | |
City of New York New York Transitional Finance Authority, BARB, Fiscal 2009, Series S-4 (AGC), 5.50%, 1/15/29 | | | 2,465 | | | | 2,789,049 | |
Metropolitan Transportation Authority, RB: | | | | | | | | |
Series A, 5.25%, 11/15/38 | | | 1,565 | | | | 1,857,107 | |
Series A-1, 5.25%, 11/15/39 | | | 1,000 | | | | 1,174,880 | |
| | | | | | | | |
| | | | | | | | 5,821,036 | |
Ohio — 0.4% | | | | | | | | |
State of Ohio Turnpike Commission, RB, Junior Lien, Infrastructure Projects, Series A-1, 5.25%, 2/15/31 | | | 470 | | | | 560,376 | |
Pennsylvania — 5.0% | | | | | | | | |
Pennsylvania Turnpike Commission, RB: | | | | | | | | |
Series B, 5.00%, 12/01/45 | | | 3,000 | | | | 3,382,260 | |
Series C, 5.00%, 12/01/43 | | | 1,720 | | | | 1,947,470 | |
Township of Bristol Pennsylvania School District, GO, 5.25%, 6/01/37 | | | 1,500 | | | | 1,724,850 | |
| | | | | | | | |
| | | | | | | | 7,054,580 | |
South Carolina — 2.9% | | | | | | | | |
County of Charleston South Carolina, RB, Special Source, 5.25%, 12/01/38 | | | 1,525 | | | | 1,802,428 | |
State of South Carolina Public Service Authority, Refunding RB: | | | | | | | | |
Series C, 5.00%, 12/01/46 | | | 1,000 | | | | 1,123,460 | |
Series E, 5.25%, 12/01/55 | | | 1,000 | | | | 1,136,430 | |
| | | | | | | | |
| | | | | | | | 4,062,318 | |
Texas — 14.7% | | | | | | | | |
Austin Community College District Public Facility Corp., RB, Educational Facilities Project, Round Rock Campus, 5.25%, 8/01/18 (a) | | | 2,000 | | | | 2,217,400 | |
City of Beaumont Texas, GO, Certificates of Obligation, 5.25%, 3/01/37 | | | 980 | | | | 1,143,297 | |
City of Frisco Texas ISD, GO, School Building (AGC), 5.50%, 8/15/41 | | | 3,365 | | | | 3,855,112 | |
City of Houston Texas Utility System, Refunding RB, Combined 1st Lien, Series A (AGC): | | | | | | | | |
6.00%, 11/15/35 | | | 2,600 | | | | 3,025,360 | |
6.00%, 11/15/36 | | | 2,215 | | | | 2,577,374 | |
5.38%, 11/15/38 | | | 1,000 | | | | 1,120,800 | |
| | | | | | | | |
| Municipal Bonds | | Par
(000) | | | Value | |
Texas (continued) | | | | | | | | |
County of Tarrant Texas Cultural Education Facilities Finance Corp., Refunding RB, Christus Health, Series A (AGC): | | | | | | | | |
6.50%, 1/01/19 (a) | | $ | 205 | | | $ | 236,853 | |
6.50%, 7/01/37 | | | 795 | | | | 895,814 | |
Dallas Area Rapid Transit, Refunding RB, Series A, 5.00%, 12/01/48 | | | 1,045 | | | | 1,220,581 | |
Lower Colorado River Authority, Refunding RB, 5.50%, 5/15/33 | | | 1,000 | | | | 1,184,470 | |
North Texas Tollway Authority, Refunding RB, 1st Tier: | | | | | | | | |
(AGM), 6.00%, 1/01/43 | | | 1,000 | | | | 1,182,570 | |
Series K-1 (AGC), 5.75%, 1/01/38 | | | 1,500 | | | | 1,676,055 | |
Red River Education Financing Corp., RB, Texas Christian University Project, 5.25%, 3/15/38 | | | 440 | | | | 507,870 | |
| | | | | | | | |
| | | | | | | | 20,843,556 | |
Virginia — 1.1% | | | | | | | | |
City of Lexington Virginia IDA, RB, Washington & Lee University, 5.00%, 1/01/43 | | | 370 | | | | 420,165 | |
Virginia Public School Authority, RB, Fluvanna County School Financing, 6.50%, 12/01/18 (a) | | | 1,000 | | | | 1,158,150 | |
| | | | | | | | |
| | | | | | | | 1,578,315 | |
Washington — 1.5% | | | | | | | | |
City of Seattle Washington Municipal Light & Power, Refunding RB, Series A, 5.25%, 2/01/36 | | | 1,025 | | | | 1,191,234 | |
State of Washington, GO, Various Purposes, Series B, 5.25%, 2/01/36 | | | 795 | | | | 930,063 | |
| | | | | | | | |
| | | | | | | | 2,121,297 | |
| Total Municipal Bonds — 103.9% | | | | | | | 147,105,754 | |
| | | | | | | | |
| | | | | | | | | |
|
Municipal Bonds Transferred to
Tender Option Bond Trusts (e) | |
California — 8.9% | | | | | | | | |
San Marcos Unified School District, GO, Election of 2010, Series A, 5.25%, 8/01/31 | | | 10,680 | | | | 12,637,324 | |
Connecticut — 1.1% | | | | | | | | |
Connecticut State Health & Educational Facility Authority, Refunding RB, Trinity Health Credit Group, 5.00%, 12/01/45 | | | 1,306 | | | | 1,507,082 | |
District of Columbia — 0.6% | | | | | | | | |
District of Columbia Water & Sewer Authority, Refunding RB, Senior Lien, Series A, 6.00%, 10/01/18 (a)(f) | | | 760 | | | | 862,203 | |
Illinois — 5.7% | | | | | | | | |
State of Illinois Toll Highway Authority, RB, Senior: | | | | | | | | |
Priority, Series A, 5.00%, 1/01/40 | | | 825 | | | | 944,185 | |
Priority, Series B, 5.50%, 1/01/18 (a) | | | 2,999 | | | | 3,264,975 | |
Series B, 5.00%, 1/01/40 | | | 3,329 | | | | 3,818,874 | |
| | | | | | | | |
| | | | | | | | 8,028,034 | |
Kentucky — 0.7% | | | | | | | | |
Kentucky State Property & Building Commission, Refunding RB, Project No. 93 (AGC), 5.25%, 2/01/27 | | | 898 | | | | 1,005,764 | |
Michigan — 2.1% | | | | | | | | |
Michigan State Building Authority, Refunding RB, Facilities Program, Series I, 5.00%, 10/15/45 | | | 2,650 | | | | 3,016,548 | |
Nevada — 5.0% | | | | | | | | |
County of Clark Nevada Water Reclamation District, GO, Limited Tax, 6.00%, 7/01/18 (a) | | | 2,000 | | | | 2,245,960 | |
See Notes to Financial Statements.
| | | | | | |
| | | | | | | |
| | SEMI-ANNUAL REPORT | | FEBRUARY 29, 2016 | | 33 |
| | |
Schedule of Investments (continued) | | BlackRock Municipal Income Investment Quality Trust (BAF) |
| | | | | | | | |
Municipal Bonds Transferred to
Tender Option Bond Trusts (e) | | Par
(000) | | | Value | |
Nevada (continued) | | | | | | | | |
Las Vegas Valley Water District Nevada, GO, Refunding, Series 2016, 11.02%, 6/01/28 (a) | | $ | 4,100 | | | $ | 4,817,828 | |
| | | | | | | | |
| | | | | | | | 7,063,788 | |
New Jersey — 6.4% | | | | | | | | |
New Jersey EDA, RB, School Facilities Construction (AGC): | | | | | | | | |
6.00%, 12/15/18 (a) | | | 329 | | | | 383,766 | |
6.00%, 12/15/34 | | | 671 | | | | 761,889 | |
New Jersey State Turnpike Authority, RB, Series A, 5.00%, 1/01/38 (f) | | | 6,020 | | | | 6,829,028 | |
New Jersey Transportation Trust Fund Authority, RB, Transportation System, Series B, 5.25%, 6/15/36 (f) | | | 1,000 | | | | 1,062,723 | |
| | | | | | | | |
| | | | | | | | 9,037,406 | |
New York — 12.0% | | | | | | | | |
City of New York New York Municipal Water Finance Authority, Refunding RB, Water & Sewer System, 2nd General Resolution: | | | | | | | | |
Series BB, 5.25%, 6/15/44 | | | 4,993 | | | | 5,918,925 | |
Series FF, 5.00%, 6/15/45 | | | 3,019 | | | | 3,459,794 | |
City of New York New York Transitional Finance Authority, BARB, Fiscal 2009, Series S-3, 5.25%, 1/15/39 | | | 900 | | | | 998,601 | |
Hudson Yards Infrastructure Corp., RB, Fiscal 2012, Series A, 5.75%, 2/15/47 (f) | | | 1,000 | | | | 1,162,107 | |
New York Liberty Development Corp., RB, 1 World Trade Center Port Authority Consolidated Bonds, 5.25%, 12/15/43 | | | 2,955 | | | | 3,421,719 | |
New York Liberty Development Corp., Refunding RB, 4 World Trade Center Project, 5.75%, 11/15/51 (f) | | | 1,740 | | | | 2,027,169 | |
| | | | | | | | |
| | | | | | | | 16,988,315 | |
North Carolina — 2.0% | | | | | | | | |
North Carolina Capital Facilities Finance Agency, Refunding RB, Duke University Project, Series B, 5.00%, 10/01/55 | | | 2,400 | | | | 2,784,336 | |
| | | | | | | | |
Municipal Bonds Transferred to
Tender Option Bond Trusts (e) | | Par
(000) | | | Value | |
Texas — 5.5% | | | | | | | | |
County of Tarrant Texas Cultural Education Facilities Finance Corp., RB, Baylor Health Care System Project, Series A, 5.00%, 11/15/38 | | $ | 4,456 | | | $ | 5,061,141 | |
North Texas Tollway Authority, RB, Special Projects System, Series A, 5.50%, 9/01/41 | | | 2,310 | | | | 2,730,836 | |
| | | | | | | | |
| | | | | | | | 7,791,977 | |
Utah — 0.8% | | | | | | | | |
City of Riverton Utah, RB, IHC Health Services, Inc., 5.00%, 8/15/41 | | | 1,005 | | | | 1,095,174 | |
Total Municipal Bonds Transferred to
Tender Option Bond Trusts — 50.8% | | | | 71,817,951 | |
Total Long-Term Investments (Cost — $197,182,911) — 154.7% | | | | 218,923,705 | |
| | | | | | | | |
| | | | | | | | | |
| | |
| Short-Term Securities Shares | | Shares | | | | |
BlackRock Liquidity Funds, MuniCash, 0.02% (g)(h) | | | 1,151,976 | | | | 1,151,976 | |
Total Short-Term Securities (Cost — $1,151,976) — 0.8% | | | | | | | 1,151,976 | |
| Total Investments (Cost — $ 198,334,887) — 155.5% | | | | 220,075,681 | |
| Other Assets Less Liabilities — 1.0% | | | | 1,448,732 | |
Liability for TOB Trust Certificates, Including Interest
Expense and Fees Payable — (26.7)% | | | | (37,764,047 | ) |
| VMTP Shares, at Liquidation Value — (29.8)% | | | | (42,200,000 | ) |
| | | | | | | | |
| Net Assets Applicable to Common Shares — 100.0% | | | $ | 141,560,366 | |
| | | | | | | | |
|
| Notes to Schedule of Investments |
| (a) | | U.S. Government securities, held in escrow, are used to pay interest on this security, as well as to retire the bond in full at the date indicated, typically at a premium to par. |
| (b) | | When-issued security. |
| (c) | | Variable rate security. Rate as of period end. |
| (d) | | Security exempt from registration pursuant to Rule 144A under the Securities Act of 1933, as amended. These securities may be resold in transactions exempt from registration to qualified institutional investors. |
| (e) | | Represent bonds transferred to a TOB Trust in exchange of cash and residual certificates received by the Trust. These bonds serve as collateral in a secured borrowing. See Note 4 of the Notes to Financial Statements for details. |
| (f) | | All or a portion of security is subject to a recourse agreement. The aggregate maximum potential amount the Trust could ultimately be required to pay under the agreements, which expire between October 1, 2016 to July 1, 2020, is $7,486,048. See Note 4 of the Notes to Financial Statements for details. |
| (g) | | During the six months ended February 29, 2016, investments in issuers considered to be affiliates of the Trust for purposes of Section 2(a)(3) of the Investment Company Act of 1940, as amended, were as follows: |
| | | | | | | | | | | | | | | | |
| Affiliate | | Shares Held
at August 31,
2015 | | | Net
Activity | | | Shares Held
at February 29,
2016 | | | Income | |
BlackRock Liquidity Funds, MuniCash | | | — | | | | 1,151,976 | | | | 1,151,976 | | | $ | 30 | |
FFI Institutional Tax-Exempt Fund | | | 953,611 | | | | (953,611 | ) | | | — | | | | 116 | |
Total | | | | | | | | | | | 1,151,976 | | | $ | 146 | |
| | | | | | | | | | | | | | | | |
| (h) | | Current yield as of period end. |
See Notes to Financial Statements.
| | | | | | |
| | | | | | | |
| 34 | | SEMI-ANNUAL REPORT | | FEBRUARY 29, 2016 | | |
| | |
Schedule of Investments (continued) | | BlackRock Municipal Income Investment Quality Trust (BAF) |
|
| Derivative Financial Instruments Outstanding as of Period End |
Financial Futures Contracts
| | | | | | | | | | | | | | | | | | | | |
Contracts
Short | | | Issue | | | Expiration | | | Notional Value | | | Unrealized
Appreciation | | | |
| | (28) | | | | 5-Year U.S. Treasury Note | | | | June 2016 | | | $ | 3,387,563 | | | $ | 2,174 | | | |
| | (34) | | | | 10-Year U.S. Treasury Note | | | | June 2016 | | | $ | 4,437,531 | | | | 2,646 | | | |
| | (13) | | | | Long U.S. Treasury Bond | | | | June 2016 | | | $ | 2,138,906 | | | | 12,502 | | | |
| | (2) | | | | Ultra U.S. Treasury Bond | | | | June 2016 | | | $ | 346,313 | | | | 1,372 | | | |
| Total | | | $ | 18,694 | | | |
| | | | | | | | | | | | | | | | | |
|
| Derivative Financial Instruments Categorized by Risk Exposure |
As of period end, the fair values of derivative financial instruments located in the Statements of Assets and Liabilities were as follows:
| | | | | | | | | | | | | | | | | | | | | | | | | | | | | | |
| Assets – Derivative Financial Instruments | | Commodity
Contracts | | | Credit
Contracts | | | Equity
Contracts | | | Foreign
Currency
Exchange
Contracts | | | Interest Rate
Contracts | | | Other
Contracts | | | Total | |
Financial futures contracts | | Net unrealized appreciation1 | | | — | | | | — | | | | — | | | | — | | | $ | 18,694 | | | | — | | | $ | 18,694 | |
1 Includes cumulative appreciation (depreciation) on financial futures contracts, if any, as reported in the Schedule of Investments. Only current day’s variation margin is reported within the Statements of Assets and Liabilities. | |
| For the six months ended February 29, 2016, the effect of derivative financial instruments in the Statements of Operations was as follows: | |
| Net Realized Gain (Loss) from: | | | | Commodity
Contracts | | | Credit
Contracts | | | Equity
Contracts | | | Foreign
Currency
Exchange
Contracts | | | Interest Rate
Contracts | | | Other
Contracts | | | Total | |
Financial futures contracts | | | | | — | | | | — | | | | — | | | | — | | | $ | (403,471 | ) | | | — | | | | $ (403,471) | |
| | | | | | | | |
Net Change in Unrealized
Appreciation (Depreciation) on: | | | | | | | | | | | | | | | | | | | | | | | |
Financial futures contracts | | | | | — | | | | — | | | | — | | | | — | | | $ | (30,775 | ) | | | — | | | | $ (30,775) | |
|
| Average Quarterly Balances of Outstanding Derivative Financial Instruments |
| | | | |
| Financial futures contracts: | | | |
Average notional value of contracts — long | | $ | 4,595,063 | 1 |
Average notional value of contracts — short | | $ | 7,247,957 | |
1 Actual amounts for the period are shown due to limited outstanding derivative financial instruments as of each quarter end. | | | | |
For more information about the Trust‘s investment risks regarding derivative financial instruments, refer to the Notes to Financial Statements.
|
| Fair Value Hierarchy as of Period End |
Various inputs are used in determining the fair value of investments and derivative financial instruments. For information about the Trust’s policy regarding valuation of investments and derivative financial instruments, refer to the Notes to Financial Statements.
The following tables summarize the Trust’s investments and derivative financial instruments categorized in the disclosure hierarchy:
| | | | | | | | | | | | | | |
| | | Level 1 | | | Level 2 | | | Level 3 | | Total | |
Assets: | | | | | | | | | | | | | | |
| Investments: | | | | | | | | | | | | | | |
Long-Term Investments 1 | | | — | | | $ | 218,923,705 | | | — | | $ | 218,923,705 | |
Short-Term Securities | | $ | 1,151,976 | | | | — | | | — | | | 1,151,976 | |
| | | | |
Total | | $ | 1,151,976 | | | $ | 218,923,705 | | | — | | $ | 220,075,681 | |
| | | | |
1 See above Schedule of Investments for values in each state or political subdivision. | |
See Notes to Financial Statements.
| | | | | | |
| | | | | | | |
| | SEMI-ANNUAL REPORT | | FEBRUARY 29, 2016 | | 35 |
| | |
Schedule of Investments (concluded) | | BlackRock Municipal Income Investment Quality Trust (BAF) |
| | | | | | | | | | | | |
| | | Level 1 | | | Level 2 | | Level 3 | | Total | |
| Derivative Financial Instruments 1 | | | | | | |
Assets: | | | | | | | | | | | | |
Interest rate contracts | | $ | 18,694 | | | — | | — | | $ | 18,694 | |
1 Derivative financial instruments are financial futures contracts, which are valued at the unrealized appreciation (depreciation) on the instrument. | |
The Trust may hold assets and/or liabilities in which the fair value approximates the carrying amount for financial statement purposes. As of period end, such assets and/or liabilities are categorized within the disclosure hierarchy as follows:
| | | | | | | | | | | | | | |
| | | Level 1 | | | Level 2 | | | Level 3 | | Total | |
Assets: | | | | | | | | | | | | | | |
Cash pledged for financial futures contracts | | $ | 132,800 | | | | — | | | — | | $ | 132,800 | |
Liabilities: | | | | | | | | | | | | | | |
TOB Trust Certificates | | | — | | | $ | (37,759,323 | ) | | — | | | (37,759,323 | ) |
VMTP Shares | | | — | | | | (42,200,000 | ) | | — | | | (42,200,000 | ) |
| | | | | | | | | | | | | | |
Total | | $ | 132,800 | | | $ | (79,959,323 | ) | | — | | $ | (79,826,523 | ) |
| | | | | | | | | | | | | | |
During the six months ended February 29, 2016, there were no transfers between levels.
See Notes to Financial Statements.
| | | | | | |
| | | | | | | |
| 36 | | SEMI-ANNUAL REPORT | | FEBRUARY 29, 2016 | | |
| | |
Schedule of Investments February 29, 2016 (Unaudited) | | BlackRock Municipal Income Quality Trust (BYM) (Percentages shown are based on Net Assets) |
| | | | | | | | |
| Municipal Bonds | | Par
(000) | | | Value | |
Alabama — 4.1% | | | | | | | | |
City of Birmingham Alabama Airport Authority, ARB, (AGM), 5.50%, 7/01/40 | | $ | 5,800 | | | $ | 6,635,536 | |
City of Birmingham Alabama Special Care Facilities Financing Authority, RB, Children’s Hospital (AGC), 6.00%, 6/01/19 (a) | | | 1,495 | | | | 1,731,987 | |
City of Birmingham Albama, GO, Convertible CAB, Series A1, 0.00%, 3/01/45 (b) | | | 1,165 | | | | 1,145,335 | |
County of Jefferson Alabama, RB, Limited Obligation School, Series A, 4.75%, 1/01/25 | | | 2,800 | | | | 2,820,328 | |
State of Alabama Docks Department, Refunding RB, 6.00%, 10/01/40 | | | 3,800 | | | | 4,466,406 | |
| | | | | | | | |
| | | | | | | | 16,799,592 | |
Alaska — 0.3% | | | | | | | | |
Alaska Industrial Development & Export Authority, RB, Providence Health Services, Series A, 5.50%, 10/01/41 | | | 1,070 | | | | 1,222,636 | |
Arizona — 0.4% | | | | | | | | |
State of Arizona, COP, Department of Administration, Series A (AGM): | | | | | | | | |
5.00%, 10/01/27 | | | 1,250 | | | | 1,393,588 | |
5.25%, 10/01/28 | | | 250 | | | | 280,885 | |
| | | | | | | | |
| | | | | | | | 1,674,473 | |
California — 15.0% | | | | | | | | |
California Health Facilities Financing Authority, RB, St. Joseph Health System, Series A, 5.75%, 7/01/39 | | | 625 | | | | 714,475 | |
California Infrastructure & Economic Development Bank, RB, Bay Area Toll Bridges, 1st Lien, Series A (AMBAC), 5.00%, 1/01/28 (a) | | | 10,100 | | | | 13,329,778 | |
California State University, Refunding RB, Systemwide, Series A, (AGM): | | | | | | | | |
5.00%, 5/01/17 (a) | | | 3,040 | | | | 3,201,029 | |
5.00%, 11/01/32 | | | 4,960 | | | | 5,171,544 | |
California Statewide Communities Development Authority, RB, Kaiser Permanente, Series A, 5.00%, 4/01/42 | | | 1,620 | | | | 1,841,519 | |
Coast Community College District, GO, CAB, Election of 2002, Series C (AGM) (a): | | | | | | | | |
0.00%, 8/01/16 (c) | | | 4,200 | | | | 1,416,618 | |
5.00%, 8/01/18 | | | 7,450 | | | | 8,223,384 | |
Monterey Peninsula Community College District, GO, CAB, Series C (AGM) (c): | | | | | | | | |
0.00%, 8/01/31 | | | 13,575 | | | | 6,556,725 | |
0.00%, 8/01/32 | | | 14,150 | | | | 6,496,123 | |
Mount San Antonio Community College District, GO, Refunding, CAB, Election of 2008, Series A, 0.00%, 8/01/43 (b) | | | 1,580 | | | | 1,170,875 | |
San Diego California Unified School District, GO, Election of 2008 (c): | | | | | | | | |
CAB, Series C, 0.00%, 7/01/38 | | | 2,000 | | | | 858,860 | |
CAB, Series G, 0.00%, 7/01/34 | | | 725 | | | | 326,315 | |
CAB, Series G, 0.00%, 7/01/35 | | | 775 | | | | 327,747 | |
CAB, Series G, 0.00%, 7/01/36 | | | 1,155 | | | | 459,309 | |
CAB, Series G, 0.00%, 7/01/37 | | | 770 | | | | 288,042 | |
San Diego California Unified School District, GO, Refunding, CAB, Series R-1, 0.00%, 7/01/31 (c) | | | 1,400 | | | | 835,968 | |
State of California, GO, Refunding, Various Purposes, 5.00%, 10/01/41 | | | 1,100 | | | | 1,268,630 | |
State of California, GO, Various Purposes, 5.00%, 4/01/42 | | | 3,000 | | | | 3,452,190 | |
State of California Public Works Board, LRB, Various Capital Projects, Series I, 5.50%, 11/01/33 | | | 1,415 | | | | 1,740,705 | |
Yosemite Community College District, GO, CAB, Election of 2004, Series D, 0.00%, 8/01/37 (c) | | | 10,000 | | | | 4,335,100 | |
| | | | | | | | |
| | | | | | | | 62,014,936 | |
| | | | | | | | |
| Municipal Bonds | | Par
(000) | | | Value | |
Colorado — 0.6% | | | | | | | | |
Regional Transportation District, COP, Refunding, Series A, 5.38%, 6/01/31 | | $ | 960 | | | $ | 1,102,944 | |
Regional Transportation District, COP, Series A, 5.00%, 6/01/39 | | | 1,305 | | | | 1,476,712 | |
| | | | | | | | |
| | | | | | | | 2,579,656 | |
District of Columbia — 2.3% | | | | | | | | |
District of Columbia Tobacco Settlement Financing Corp., Refunding RB, Asset-Backed, 6.75%, 5/15/40 | | | 9,500 | | | | 9,548,735 | |
Florida — 15.3% | | | | | | | | |
City of Tallahassee FL Energy System Revenue, RB, 5.00%, 10/01/37 | | | 5,000 | | | | 5,295,850 | |
County of Brevard Florida Health Facilities Authority, Refunding RB, Health First, Inc. Project, 5.00%, 4/01/39 | | | 1,795 | | | | 2,004,638 | |
County of Broward Florida School Board, COP, Series A (AGM), 5.25%, 7/01/33 | | | 1,400 | | | | 1,522,402 | |
County of Broward Florida Water & Sewer Utility, Refunding RB, Series A, 5.25%, 10/01/18 (a) | | | 6,750 | | | | 7,537,455 | |
County of Duval Florida School Board, COP, Master Lease Program (AGM), 5.00%, 7/01/17 (a) | | | 3,475 | | | | 3,681,936 | |
County of Miami-Dade Florida, RB: | | | | | | | | |
CAB, Special Obligation, Sub-Series A (NPFGC), 0.00%, 10/01/38 (c) | | | 15,000 | | | | 4,653,750 | |
Seaport, Series A, 6.00%, 10/01/38 | | | 2,770 | | | | 3,367,932 | |
County of Miami-Dade Florida Aviation, Refunding ARB: | | | | | | | | |
Aviation, Miami International Airport, Series A-1, 5.50%, 10/01/41 | | | 5,000 | | | | 5,727,500 | |
Series A, 5.50%, 10/01/36 | | | 5,000 | | | | 5,710,300 | |
County of Miami-Dade Florida Educational Facilities Authority, RB, University Miami, Series A, 5.00%, 4/01/40 | | | 3,910 | | | | 4,441,330 | |
County of Miami-Dade Florida Transit System, RB, Surtax (AGM), 5.00%, 7/01/35 | | | 1,300 | | | | 1,405,898 | |
County of Orange Florida School Board, COP, Series A, 5.00%, 8/01/16 (a) | | | 6,000 | | | | 6,119,400 | |
County of Sarasota Florida Public Hospital District, RB, Sarasota Memorial Hospital Project, Series A, 5.63%, 7/01/39 | | | 300 | | | | 332,178 | |
Florida State Department of Environmental Protection, RB, Florida Forever Project, Series B (NPFGC), 5.00%, 7/01/27 | | | 6,150 | | | | 6,537,881 | |
Reedy Creek Improvement District, GO, Series A, 5.25%, 6/01/33 | | | 1,340 | | | | 1,584,054 | |
South Florida Water Management District, COP, (AMBAC), 5.00%, 10/01/16 (a) | | | 1,000 | | | | 1,027,390 | |
Tohopekaliga Water Authority, Refunding RB, Series A, 5.25%, 10/01/36 | | | 2,000 | | | | 2,353,340 | |
| | | | | | | | |
| | | | | | | | 63,303,234 | |
Georgia — 2.9% | | | | | | | | |
City of Atlanta Georgia Department of Aviation, Refunding GARB, Series C, 6.00%, 1/01/30 | | | 7,500 | | | | 9,061,650 | |
County of Burke Georgia Development Authority, Refunding RB, Oglethorpe Power-Vogtle Project, Series C, 5.70%, 1/01/43 | | | 1,250 | | | | 1,343,612 | |
County of Gainesville Georgia & Hall Hospital Authority, Refunding RB, Northeast Georgia Health System, Inc. Project, Series A, 5.50%, 8/15/54 | | | 545 | | | | 646,234 | |
Private Colleges & Universities Authority, RB, Savannah College of Art & Design: | | | | | | | | |
5.00%, 4/01/33 | | | 155 | | | | 175,331 | |
5.00%, 4/01/44 | | | 595 | | | | 652,989 | |
| | | | | | | | |
| | | | | | | | 11,879,816 | |
See Notes to Financial Statements.
| | | | | | |
| | | | | | | |
| | SEMI-ANNUAL REPORT | | FEBRUARY 29, 2016 | | 37 |
| | |
Schedule of Investments (continued) | | BlackRock Municipal Income Quality Trust (BYM) |
| | | | | | | | |
| Municipal Bonds | | Par
(000) | | | Value | |
Hawaii — 1.4% | | | | | | | | |
State of Hawaii Harbor System, RB, Series A, 5.50%, 7/01/35 | | $ | 5,000 | | | $ | 5,698,050 | |
Illinois — 14.1% | | | | | | | | |
City of Chicago Illinois, GO, Refunding, Series A: | | | | | | | | |
5.00%, 1/01/34 | | | 4,305 | | | | 4,147,222 | |
Project, 5.25%, 1/01/33 | | | 1,315 | | | | 1,306,189 | |
City of Chicago Illinois, Refunding RB, Sales Tax Receipts, Series A, 5.00%, 1/01/41 | | | 4,875 | | | | 5,087,647 | |
City of Chicago Illinois O’Hare International Airport, Refunding GARB, Senior Lien, Series D, 5.25%, 1/01/34 | | | 9,800 | | | | 11,405,828 | |
City of Chicago Illinois O’Hare International Airport, GARB, 3rd Lien, Series A, 5.63%, 1/01/35 | | | 1,525 | | | | 1,768,786 | |
City of Chicago Illinois Transit Authority, RB: | | | | | | | | |
5.25%, 12/01/49 | | | 3,500 | | | | 3,933,020 | |
Sales Tax Receipts, 5.25%, 12/01/36 | | | 650 | | | | 713,057 | |
County of Cook Illinois Community College District No. 508, GO, City College of Chicago: | | | | | | | | |
5.13%, 12/01/38 | | | 7,700 | | | | 8,542,996 | |
5.50%, 12/01/38 | | | 1,000 | | | | 1,153,100 | |
County of Cook Illinois Forest Preserve District, GO, Refunding, Limited Tax Project, Series B, 5.00%, 12/15/37 | | | 210 | | | | 229,383 | |
Illinois Finance Authority, Refunding RB, Silver Cross Hospital and Medical Centers: | | | | | | | | |
4.13%, 8/15/37 | | | 3,130 | | | | 3,220,207 | |
5.00%, 8/15/44 | | | 390 | | | | 429,503 | |
Metropolitan Pier & Exposition Authority, Refunding RB, McCormick Place Expansion Project, Series B, 4.25%, 6/15/42 | | | 255 | | | | 252,006 | |
Railsplitter Tobacco Settlement Authority, RB, 6.00%, 6/01/28 | | | 710 | | | | 849,224 | |
State of Illinois, GO: | | | | | | | | |
5.25%, 2/01/33 | | | 2,435 | | | | 2,624,419 | |
5.50%, 7/01/33 | | | 880 | | | | 964,357 | |
5.25%, 2/01/34 | | | 5,910 | | | | 6,349,054 | |
5.50%, 7/01/38 | | | 1,475 | | | | 1,597,838 | |
5.00%, 2/01/39 | | | 2,200 | | | | 2,306,920 | |
University of Illinois, RB, Auxiliary Facilities System, Series A, 5.00%, 4/01/39 | | | 1,020 | | | | 1,133,016 | |
| | | | | | | | |
| | | | | | | | 58,013,772 | |
Indiana — 1.9% | | | | | | | | |
Indiana Finance Authority, RB, CWA Authority Project, 1st Lien, Series A, 5.25%, 10/01/38 | | | 1,100 | | | | 1,296,251 | |
Indianapolis Local Public Improvement Bond Bank, Refunding RB, Waterworks Project, Series A (AGC), 5.50%, 1/01/38 | | | 5,750 | | | | 6,474,097 | |
| | | | | | | | |
| | | | | | | | 7,770,348 | |
Iowa — 2.2% | | | | | | | | |
Iowa Finance Authority, RB, Iowa Health Care Facilities: | | | | | | | | |
Genesis Health System, 5.50%, 7/01/33 | | | 3,000 | | | | 3,584,370 | |
Series A (AGC), 5.63%, 8/15/37 | | | 5,000 | | | | 5,634,350 | |
| | | | | | | | |
| | | | | | | | 9,218,720 | |
Kentucky — 0.4% | | | | | | | | |
State of Kentucky Property & Building Commission, Refunding RB, Project No. 93 (AGC), 5.25%, 2/01/29 | | | 1,500 | | | | 1,667,850 | |
Louisiana — 1.2% | | | | | | | | |
State of Louisiana Gasoline & Fuels Tax, RB, Series A (AGM), 5.00%, 5/01/16 (a) | | | 5,000 | | | | 5,040,950 | |
Massachusetts — 0.4% | | | | | | | | |
Massachusetts School Building Authority, RB, Dedicated Sales Tax, Senior Series A, 5.00%, 5/15/43 | | | 1,395 | | | | 1,609,830 | |
| | | | | | | | |
| Municipal Bonds | | Par
(000) | | | Value | |
Michigan — 5.4% | | | | | | | | |
City of Detroit Michigan Sewage Disposal System, Refunding RB, 2nd Lien, Series E (BHAC), 5.75%, 7/01/31 | | $ | 3,000 | | | $ | 3,259,320 | |
City of Lansing Michigan, RB, Board of Water & Light Utilities System, Series A, 5.50%, 7/01/41 | | | 1,100 | | | | 1,299,199 | |
Michigan Finance Authority, RB, Beaumont Health Credit Group, 4.00%, 11/01/46 | | | 430 | | | | 431,010 | |
Michigan Finance Authority, Refunding RB, Trinity Health Credit Group: | | | | | | | | |
5.00%, 12/01/21(a) | | | 30 | | | | 36,426 | |
5.00%, 12/01/39 | | | 9,020 | | | | 10,077,866 | |
Royal Oak Hospital Finance Authority Michigan, Refunding RB, William Beaumont Hospital, Series D, 5.00%, 9/01/39 | | | 1,560 | | | | 1,749,899 | |
State of Michigan Building Authority, Refunding RB, Facilities Program: | | | | | | | | |
Series I-A, 5.38%, 10/15/36 | | | 2,000 | | | | 2,312,340 | |
Series I-A, 5.38%, 10/15/41 | | | 800 | | | | 924,936 | |
Series II-A, 5.38%, 10/15/36 | | | 1,500 | | | | 1,734,255 | |
Western Michigan University, Refunding RB, General, University and College Improvements (AGM), 5.00%, 11/15/39 | | | 430 | | | | 482,813 | |
| | | | | | | | |
| | | | | | | | 22,308,064 | |
Nebraska — 1.7% | | | | | | | | |
Central Plains Energy Project Nebraska, RB, Gas Project No. 3, 5.25%, 9/01/37 | | | 6,345 | | | | 7,048,787 | |
Nevada — 1.9% | | | | | | | | |
County of Clark Nevada, ARB, Las Vegas-McCarran International Airport, Series A: | | | | | | | | |
5.25%, 7/01/42 | | | 3,000 | | | | 3,364,380 | |
(AGM), 5.25%, 7/01/39 | | | 4,100 | | | | 4,599,585 | |
| | | | | | | | |
| | | | | | | | 7,963,965 | |
New Jersey — 6.5% | | | | | | | | |
New Jersey EDA, RB, Series WW: | | | | | | | | |
5.25%, 6/15/33 | | | 170 | | | | 184,289 | |
5.00%, 6/15/34 | | | 225 | | | | 237,478 | |
5.00%, 6/15/36 | | | 1,395 | | | | 1,464,722 | |
5.25%, 6/15/40 | | | 400 | | | | 428,204 | |
New Jersey Transportation Trust Fund Authority, RB: | | | | | | | | |
5.00%, 6/15/36 | | | 5,070 | | | | 5,322,283 | |
CAB, Transportation System, Series A, 0.00%, 12/15/38 (c) | | | 5,845 | | | | 1,830,011 | |
Transportation Program, Series AA, 5.25%, 6/15/33 | | | 1,660 | | | | 1,785,712 | |
Transportation Program, Series AA, 5.00%, 6/15/38 | | | 1,945 | | | | 2,043,184 | |
Transportation System, Series A, 5.50%, 6/15/41 | | | 3,000 | | | | 3,236,520 | |
Transportation System, Series AA, 5.50%, 6/15/39 | | | 3,785 | | | | 4,148,398 | |
Transportation System, Series B, 5.25%, 6/15/36 | | | 5,000 | | | | 5,312,400 | |
Transportation System, Series D, 5.00%, 6/15/32 | | | 900 | | | | 960,615 | |
| | | | | | | | |
| | | | | | | | 26,953,816 | |
New Mexico — 0.1% | | | | | | | | |
New Mexico Hospital Equipment Loan Council, Refunding RB, Presbyterian Healthcare Services, 5.00%, 8/01/44 | | | 405 | | | | 463,531 | |
New York — 2.7% | | | | | | | | |
City of New York New York Transitional Finance Authority, BARB, Fiscal 2009, Series S-4, 5.50%, 1/15/33 | | | 1,950 | | | | 2,199,073 | |
City of New York New York Transitional Finance Authority, Refunding RB, Future Tax Secured, Series B, 5.00%, 11/01/32 | | | 1,650 | | | | 1,950,927 | |
See Notes to Financial Statements.
| | | | | | |
| | | | | | | |
| 38 | | SEMI-ANNUAL REPORT | | FEBRUARY 29, 2016 | | |
| | |
Schedule of Investments (continued) | | BlackRock Municipal Income Quality Trust (BYM) |
| | | | | | | | |
| Municipal Bonds | | Par
(000) | | | Value | |
New York (continued) | | | | | | | | |
County of Erie New York Industrial Development Agency, RB, City School District of Buffalo, Series A (AGM), 5.75%, 5/01/17 (a) | | $ | 4,500 | | | $ | 4,781,070 | |
Hudson Yards Infrastructure Corp., RB, Series A, 5.75%, 2/15/47 | | | 770 | | | | 894,902 | |
State of New York Dormitory Authority, RB, Series B, 5.75%, 3/15/36 | | | 1,300 | | | | 1,487,395 | |
| | | | | | | | |
| | | | | | | | 11,313,367 | |
Ohio — 0.7% | | | | | | | | |
County of Lucas Ohio, Refunding RB, Promedica Healthcare, Series A, 6.50%, 11/15/37 | | | 610 | | | | 755,942 | |
State of Ohio Turnpike Commission, RB, Junior Lien, Infrastructure Projects, Series A-1: | | | | | | | | |
5.25%, 2/15/32 | | | 780 | | | | 925,018 | |
5.25%, 2/15/33 | | | 1,095 | | | | 1,294,728 | |
| | | | | | | | |
| | | | | | | | 2,975,688 | |
Pennsylvania — 2.5% | | | | | | | | |
Pennsylvania HFA, RB, S/F Housing Mortgage, Series 118B, 4.05%, 10/01/40 | | | 1,770 | | | | 1,828,463 | |
Pennsylvania Higher Educational Facilities Authority, Refunding RB, Thomas Jefferson University, Series A, 5.25%, 9/01/50 | | | 4,630 | | | | 5,232,178 | |
Pennsylvania Turnpike Commission, RB: | | | | | | | | |
Series A, 5.00%, 12/01/38 | | | 695 | | | | 785,871 | |
Series C, 5.50%, 12/01/33 | | | 630 | | | | 762,470 | |
Subordinate, Special Motor License Fund, 6.00%, 12/01/36 | | | 625 | | | | 734,819 | |
Pennsylvania Turnpike Commission, Refunding RB, Series A-1, 5.00%, 12/01/40 | | | 850 | | | | 959,335 | |
| | | | | | | | |
| | | | | | | | 10,303,136 | |
Rhode Island — 2.1% | | | | | | | | |
Rhode Island Turnpike & Bridge Authority, Refunding RB, Series A, 5.00%, 10/01/40 | | | 2,250 | | | | 2,590,515 | |
Tobacco Settlement Financing Corp., Refunding RB, Series B, 4.50%, 6/01/45 | | | 5,855 | | | | 5,912,086 | |
| | | | | | | | |
| | | | | | | | 8,502,601 | |
South Carolina — 4.5% | | | | | | | | |
South Carolina Jobs EDA, Refunding RB, Palmetto Health, Series A (AGM), 6.50%, 8/01/39 | | | 260 | | | | 316,103 | |
South Carolina State Ports Authority, RB, 5.25%, 7/01/40 | | | 5,000 | | | | 5,629,900 | |
State of South Carolina Public Service Authority, RB, Santee Cooper, Series E, 5.50%, 12/01/53 | | | 610 | | | | 699,835 | |
State of South Carolina Public Service Authority, Refunding RB: | | | | | | | | |
Santee Cooper, Series B, 5.00%, 12/01/38 | | | 2,360 | | | | 2,693,090 | |
Series E, 5.25%, 12/01/55 | | | 1,185 | | | | 1,346,670 | |
State of South Carolina Public Service Authority, RB, Santee Cooper, Series A, 5.50%, 12/01/54 | | | 6,960 | | | | 7,987,783 | |
| | | | | | | | |
| | | | | | | | 18,673,381 | |
Tennessee — 0.1% | | | | | | | | |
Metropolitan Government of Nashville & Davidson County Health & Educational Facilities Board, Refunding RB, Lipscomb University Project, Series A, 5.00%, 10/01/45 (f) | | | 470 | | | | 523,425 | |
Texas — 18.4% | | | | | | | | |
Central Texas Regional Mobility Authority, RB, Senior Lien, Series A, 5.00%, 1/01/40 | | | 570 | | | | 641,455 | |
Central Texas Turnpike System, Refunding RB, CAB, Series B, 0.00%, 8/15/37 (c) | | | 2,050 | | | | 832,197 | |
City of San Antonio Texas Public Service Board, RB, Junior Lien, 5.00%, 2/01/38 | | | 615 | | | | 693,400 | |
| | | | | | | | |
| Municipal Bonds | | Par
(000) | | | Value | |
Texas (continued) | | | | | | | | |
Coppell Texas ISD, GO, CAB, Refunding (PSF-GTD), 0.00%, 8/15/30 (c) | | $ | 10,030 | | | $ | 6,962,826 | |
County of Harris Texas, GO, Refunding, (NPFGC) (c): | | | | | | | | |
0.00%, 8/15/25 | | | 7,485 | | | | 6,201,996 | |
0.00%, 8/15/28 | | | 10,915 | | | | 8,307,734 | |
County of Harris Texas Houston Sports Authority, Refunding RB (c): | | | | | | | | |
3rd Lien, Series A-3 (NPFGC), 0.00%, 11/15/38 | | | 16,890 | | | | 5,004,338 | |
CAB, Junior Lien, Series H (NPFGC), 0.00%, 11/15/38 | | | 5,785 | | | | 1,853,398 | |
CAB, Junior Lien, Series H (NPFGC), 0.00%, 11/15/39 | | | 6,160 | | | | 1,853,914 | |
County of Midland Texas Fresh Water Supply District No. 1, RB, CAB, City of Midland Project, Series A, 0.00%, 9/15/36 (c) | | | 2,340 | | | | 1,007,019 | |
Dallas-Fort Worth International Airport, Refunding ARB, Series F, 5.25%, 11/01/33 | | | 1,090 | | | | 1,284,718 | |
Mansfield Texas ISD, GO, School Building (PSF-GTD), 5.00%, 2/15/17 (a) | | | 2,980 | | | | 3,109,064 | |
North Texas Tollway Authority, RB: | | | | | | | | |
CAB, Special Project System, Series B, 0.00%, 9/01/37 (c) | | | 1,975 | | | | 813,325 | |
Convertible CAB, Series C, 0.00%, 9/01/45 (b) | | | 2,500 | | | | 2,610,450 | |
Special Projects System, Series A, 6.00%, 9/01/41 | | | 1,000 | | | | 1,212,780 | |
North Texas Tollway Authority, Refunding RB: | | | | | | | | |
1st Tier System, Series A, 6.00%, 1/01/28 | | | 625 | | | | 712,619 | |
1st Tier System, Series S, 5.75%, 1/01/18 (a) | | | 11,615 | | | | 12,682,418 | |
1st Tier System, Series SE, 5.75%, 1/01/40 | | | 11,435 | | | | 12,328,188 | |
Series B, 5.00%, 1/01/40 | | | 2,270 | | | | 2,569,731 | |
Texas Municipal Gas Acquisition & Supply Corp. III, RB: | | | | | | | | |
5.00%, 12/15/32 | | | 2,540 | | | | 2,812,339 | |
Natural Gas Utility Improvements, 5.00%, 12/15/31 | | | 2,105 | | | | 2,334,761 | |
| | | | | | | | |
| | | | | | | | 75,828,670 | |
Utah — 1.7% | | | | | | | | |
Leander ISD, GO, Refunding, CAB, Series D, 0.00%, 8/15/38 (c) | | | 3,775 | | | | 1,446,089 | |
Utah Transit Authority, RB, Series A, 5.00%, 6/15/18 (a) | | | 5,000 | | | | 5,495,250 | |
| | | | | | | | |
| | | | | | | | 6,941,339 | |
Washington — 1.8% | | | | | | | | |
Washington Health Care Facilities Authority, RB: | | | | | | | | |
MultiCare Health System, Remarketing, Series B, 5.00%, 8/15/44 | | | 2,000 | | | | 2,202,480 | |
MultiCare Health System, Series C (AGC), 5.50%, 8/15/18 (a) | | | 4,000 | | | | 4,464,800 | |
Providence Health & Services, Series A, 5.25%, 10/01/39 | | | 675 | | | | 748,926 | |
| | | | | | | | |
| | | | | | | | 7,416,206 | |
Wisconsin — 0.4% | | | | | | | | |
State of Wisconsin Health & Educational Facilities Authority, RB, Ascension Health Senior Credit Group, Series E, 5.00%, 11/15/33 | | | 1,500 | | | | 1,696,186 | |
| Total Municipal Bonds — 113.0% | | | | | | | 466,954,760 | |
| | | | | | | | |
| | | | | | | | | |
|
Municipal Bonds Transferred to Tender Option Bond Trusts (g) | |
Arizona — 0.7% | | | | | | | | |
City of Phoenix Arizona Civic Improvement Corp., Refunding RB, Water System, Junior Lien, Series A, 5.00%, 7/01/34 | | | 1,300 | | | | 1,447,628 | |
See Notes to Financial Statements.
| | | | | | |
| | | | | | | |
| | SEMI-ANNUAL REPORT | | FEBRUARY 29, 2016 | | 39 |
| | |
Schedule of Investments (continued) | | BlackRock Municipal Income Quality Trust (BYM) |
| | | | | | | | |
Municipal Bonds Transferred to Tender Option Bond Trusts (g) | | Par
(000) | | | Value | |
Arizona (continued) | | | | | | | | |
Salt River Project Agricultural Improvement & Power District, RB, Electric System, Series A, 5.00%, 1/01/38 | | $ | 1,500 | | | $ | 1,596,255 | |
| | | | | | | | |
| | | | | | | | 3,043,883 | |
California — 3.6% | | | | | | | | |
California State University, RB, Systemwide, Series A (AGM), 5.00%, 11/01/33 (h) | | | 3,379 | | | | 3,673,521 | |
Los Angeles Community College District California, GO, Election of 2001, Series A (AGM), 5.00%, 8/01/17 (a) | | | 5,000 | | | | 5,321,750 | |
San Diego Community College District California, GO, Election of 2002, 5.25%, 8/01/33 | | | 449 | | | | 510,978 | |
San Diego County Water Authority Financing Corp., COP, Refunding, Series A (AGM): | | | | | | | | |
5.00%, 5/01/18 (a) | | | 808 | | | | 883,008 | |
5.00%, 5/01/33 | | | 4,062 | | | | 4,403,426 | |
| | | | | | | | |
| | | | | | | | 14,792,683 | |
Connecticut — 0.4% | | | | | | | | |
Connecticut State Health & Educational Facility Authority, Refunding RB, Trinity Health Credit Group, 5.00%, 12/01/45 | | | 1,561 | | | | 1,801,570 | |
District of Columbia — 0.3% | | | | | | | | |
District of Columbia, RB, Series A, 5.50%, 12/01/30 (h) | | | 1,080 | | | | 1,261,760 | |
Florida — 7.9% | | | | | | | | |
City of Miami Beach Florida, RB, 5.00%, 9/01/45 | | | 3,500 | | | | 3,997,420 | |
City of Tallahassee Florida, RB, Energy System (NPFGC), 5.00%, 10/01/32 (h) | | | 3,000 | | | | 3,183,870 | |
County of Highlands Florida Health Facilities Authority, RB, Adventist, Series C, 5.25%, 11/15/36 | | | 1,800 | | | | 1,863,108 | |
County of Miami-Dade Florida Transit Sales Surtax Revenue, Refunding RB, 11.03%, 7/01/20 (d)(e) | | | 975 | | | | 2,213,913 | |
County of Miami-Dade Florida Water & Sewer System (AGM), 5.00%, 10/01/39 | | | 10,101 | | | | 11,469,775 | |
County of Orange Florida School Board, COP, Series A (AGC), 5.50%, 8/01/34 | | | 6,096 | | | | 6,782,983 | |
State of Florida Board of Education, GO, Series D, 5.00%, 6/01/37 (h) | | | 2,999 | | | | 3,178,785 | |
| | | | | | | | |
| | | | | | | | 32,689,854 | |
Illinois — 10.5% | | | | | | | | |
City of Chicago Illinois, RB, Motor Fuel Tax Project, Series A (AGC), 5.00%, 1/01/38 | | | 8,310 | | | | 8,502,875 | |
Illinois Finance Authority, RB, The Carle Foundation, Series A (AGM), 6.00%, 8/15/41 | | | 2,400 | | | | 2,839,728 | |
Metropolitan Pier & Exposition Authority, RB, McCormick Place Expansion Project, Series A, 5.00%, 6/15/42 | | | 11,748 | | | | 12,269,029 | |
State of Illinois, RB, Build Illinois, Series B, 5.25%, 6/15/34 (h) | | | 1,400 | | | | 1,554,188 | |
State of Illinois Toll Highway Authority, RB: | | | | | | | | |
Senior Priority, Series A, 5.00%, 1/01/40 | | | 3,045 | | | | 3,484,900 | |
Senior Priority, Series B, 5.50%, 1/01/18 (a) | | | 4,499 | | | | 4,897,462 | |
Senior, Series B, 5.00%, 1/01/40 | | | 1,170 | | | | 1,341,766 | |
Series A, 5.00%, 1/01/38 | | | 7,714 | | | | 8,611,031 | |
| | | | | | | | |
| | | | | | | | 43,500,979 | |
Michigan — 0.9% | | | | | | | | |
Michigan Finance Authority, RB, Beaumont Health Credit Group, 5.00%, 11/01/44 | | | 2,220 | | | | 2,497,458 | |
Michigan State Building Authority, Refunding RB, Facilities Program, Series I, 5.00%, 10/15/45 | | | 960 | | | | 1,092,787 | |
| | | | | | | | |
| | | | | | | | 3,590,245 | |
Nevada — 1.7% | | | | | | | | |
City of Las Vegas Nevada, GO, Limited Tax, Performing Arts Center, 6.00%, 4/01/39 (h) | | | 4,197 | | | | 4,800,751 | |
| | | | | | | | |
Municipal Bonds Transferred to Tender Option Bond Trusts (g) | | Par
(000) | | | Value | |
Nevada (continued) | | | | | | | | |
County of Clark Nevada Water Reclamation District, GO, Limited Tax, Series B, 5.75%, 7/01/34 | | $ | 2,024 | | | $ | 2,329,274 | |
| | | | | | | | |
| | | | | | | | 7,130,025 | |
New Jersey — 0.5% | | | | | | | | |
New Jersey Transportation Trust Fund Authority, RB, Transportation System, Series B, 5.25%, 6/15/36 (h) | | | 2,000 | | | | 2,125,446 | |
New York — 9.8% | | | | | | | | |
City of New York New York Municipal Water Finance Authority, Refunding RB, Water & Sewer System, 2nd General Resolution, Fiscal 2013, Series CC, 5.00%, 6/15/47 | | | 6,240 | | | | 7,216,047 | |
City of New York New York Water & Sewer System, Refunding RB, 2nd General Resolution, Fiscal 2014, Series DD, 5.00%, 6/15/35 | | | 1,845 | | | | 2,180,938 | |
Metropolitan Transportation Authority, RB, Sub-Series D-1, 5.25%, 11/15/44 | | | 3,850 | | | | 4,509,543 | |
New York City Transitional Finance Authority, Refunding RB, Future Tax Secured, Series B, 5.00%, 11/01/30 | | | 12,500 | | | | 14,901,375 | |
New York State Urban Development Corp., RB, Personal Income Tax, General Purpose, Series A-1, 5.00%, 3/15/43 | | | 5,720 | | | | 6,590,469 | |
Triborough Bridge & Tunnel Authority, RB, General, Series A-2, 5.25%, 11/15/34 (h) | | | 4,500 | | | | 5,002,695 | |
| | | | | | | | |
| | | | | | | | 40,401,067 | |
Ohio — 0.2% | | | | | | | | |
State of Ohio, RB, Cleveland Clinic Health Obligated Group, Series B, 5.50%, 1/01/34 | | | 620 | | | | 699,193 | |
South Carolina — 0.2% | | | | | | | | |
State of South Carolina Public Service Authority, Refunding RB, Santee Cooper, Series A, 5.50%, 1/01/38 (h) | | | 600 | | | | 679,896 | |
Texas — 1.3% | | | | | | | | |
City of Houston Texas, Refunding RB, Airport System, Senior Lien, Series A, 5.50%, 7/01/34 | | | 4,167 | | | | 4,587,280 | |
County of Tarrant Texas Cultural Education Facilities Finance Corp., RB, Baylor Health Care System Project, Series A, 5.00%, 11/15/38 | | | 719 | | | | 817,045 | |
| | | | | | | | |
| | | | | | | | 5,404,325 | |
Virginia — 0.1% | | | | | | | | |
County of Fairfax Virginia IDA, Refunding RB, Health Care, Inova Health System, Series A, 5.50%, 5/15/35 | | | 400 | | | | 451,548 | |
Washington — 1.9% | | | | | | | | |
Central Puget Sound Regional Transit Authority, RB, Series A (AGM), 5.00%, 11/01/17 (a) | | | 3,494 | | | | 3,750,760 | |
Washington Health Care Facilities Authority, Refunding RB, Seattle Children’s Hospital, Series B, 5.00%, 10/01/38 | | | 3,210 | | | | 3,934,850 | |
| | | | | | | | |
| | | | | | | | 7,685,610 | |
Wisconsin — 1.6% | | | | | | | | |
Wisconsin Health & Educational Facilities Authority, Refunding RB, Froedtert & Community Health, Inc., Obligated Group: | | | | | | | | |
Series A, 5.00%, 4/01/42 | | | 3,520 | | | | 3,891,430 | |
Series C, 5.25%, 4/01/39 | | | 2,500 | | | | 2,707,750 | |
| | | | | | | | |
| | | | | | | | 6,599,180 | |
Total Municipal Bonds Transferred to Tender Option Bond Trusts — 41.6% | | | | 171,857,264 | |
Total Long-Term Investments (Cost — $580,286,116) — 154.6% | | | | 638,812,024 | |
See Notes to Financial Statements.
| | | | | | |
| | | | | | | |
| 40 | | SEMI-ANNUAL REPORT | | FEBRUARY 29, 2016 | | |
| | |
Schedule of Investments (continued) | | BlackRock Municipal Income Quality Trust (BYM) |
| | | | | | | | |
| Short-Term Securities — 1.2% | | Shares | | | Value | |
BlackRock Liquidity Funds, MuniCash, 0.02% (i)(j) | | | 5,032,305 | | | $ | 5,032,305 | |
Total Short-Term Securities (Cost — $5,032,305) — 1.2% | | | | | | | 5,032,305 | |
| Total Investments (Cost — $585,318,421) — 155.8% | | | | 643,844,329 | |
| Other Assets Less Liabilities — 1.0% | | | | 4,271,587 | |
Liability for TOB Trust Certificates, Including Interest
Expense and Fees Payable — (23.6)% | | | | (97,645,209 | ) |
| VMTP Shares, at Liquidation Value — (33.2)% | | | | (137,200,000 | ) |
| | | | | | | | |
| Net Assets Applicable to Common Shares — 100.0% | | | $ | 413,270,707 | |
| | | | | | | | |
|
| Notes to Schedule of investments |
| (a) | | U.S. Government securities, held in escrow, are used to pay interest on this security, as well as to retire the bond in full at the date indicated, typically at a premium to par. |
| (b) | | Step-up bond that pays an initial coupon rate for the first period and then a higher coupon rate for the following periods. Rate as of period end. |
| (d) | | Variable rate security. Rate as of period end. |
| (e) | | Security exempt from registration pursuant to Rule 144A under the Securities Act of 1933, as amended. These securities may be resold in transactions exempt from registration to qualified institutional investors. |
| (f) | | When-issued security. |
| (g) | | Represent bonds transferred to a TOB Trust in exchange of cash and residual certificates received by the Trust. These bonds serve as collateral in a secured borrowing. See Note 4 of the Notes to Financial Statements for details. |
| (h) | | All or a portion of security is subject to a recourse agreement. The aggregate maximum potential amount the Trust could ultimately be required to pay under the agreements, which expire between April 1, 2016 to December 1, 2029, is $13,670,982. See Note 4 of the Notes to Financial Statements for details. |
| (i) | | During the six months ended February 29, 2016, investments in issuers considered to be affiliates of the Trust for purposes of Section 2(a)(3) of the Investment Company Act of 1940, as amended, were as follows: |
| | | | | | | | | | | | | | | | |
| Affiliate | | Shares Held
at August 31,
2015 | | | Net
Activity | | | Shares Held
at February 29,
2016 | | | Income | |
BlackRock Liquidity Funds, MuniCash | | | — | | | | 5,032,305 | | | | 5,032,305 | | | $ | 5 | |
FFI Institutional Tax-Exempt Fund | | | 6,416,284 | | | | (6,416,284 | ) | | | — | | | | 516 | |
Total | | | | | | | | | | | 5,032,305 | | | $ | 521 | |
| | | | | | | | | | | | | | | | |
| (j) | | Current yield as of period end. |
|
| Derivative Financial Instruments Outstanding as of Period End |
Financial Futures Contracts
| | | | | | | | | | | | | | | | | | | | |
Contracts
Short | | | Issue | | | Expiration | | | Notional Value | | | Unrealized
Appreciation | | | |
| | (52) | | | | 5-Year U.S. Treasury Note | | | | June 2016 | | | $ | 6,291,188 | | | $ | 4,038 | | | |
| | (96) | | | | 10-Year U.S. Treasury Note | | | | June 2016 | | | $ | 12,529,500 | | | | 7,365 | | | |
| | (48) | | | | Long U.S. Treasury Bond | | | | June 2016 | | | $ | 7,897,500 | | | | 46,139 | | | |
| | (10) | | | | Ultra U.S. Treasury Bond | | | | June 2016 | | | $ | 1,731,562 | | | | 7,874 | | | |
| Total | | | $ | 65,416 | | | |
| | | | | | | | | | | | | | | | | |
|
| Derivative Financial Instruments Categorized by Risk Exposure |
As of period end, the fair values of derivative financial instruments located in the Statements of Assets and Liabilities were as follows:
| | | | | | | | | | | | | | | | | | | | | | | | | | | | | | |
| Assets — Derivative Financial Instruments | | | | Commodity
Contracts | | | Credit
Contracts | | | Equity
Contracts | | | Foreign
Currency
Exchange
Contracts | | | Interest Rate
Contracts | | | Other
Contracts | | | Total | |
Financial futures contracts | | Net unrealized
appreciation1 | | | — | | | | — | | | | — | | | | — | | | $ | 65,416 | | | | — | | | $ | 65,416 | |
1 Includes cumulative appreciation (depreciation) on financial futures contracts, if any, as reported in the Schedule of Investments. Only current day’s variation margin is reported within the Statements of Assets and Liabilities. | |
See Notes to Financial Statements.
| | | | | | |
| | | | | | | |
| | SEMI-ANNUAL REPORT | | FEBRUARY 29, 2016 | | 41 |
| | |
Schedule of Investments (concluded) | | BlackRock Municipal Income Quality Trust (BYM) |
For the six months ended February 29, 2016, the effect of derivative financial instruments in the Statements of Operations was as follows:
| | | | | | | | | | | | | | | | | | | | | | | | | | | | |
| Net Realized Gain (Loss) from: | | Commodity
Contracts | | | Credit
Contracts | | | Equity
Contracts | | | Foreign
Currency
Exchange
Contracts | | | Interest Rate
Contracts | | | Other
Contracts | | | Total | |
Financial futures contracts | | | — | | | | — | | | | — | | | | — | | | $ | (883,824 | ) | | | — | | | $ | (883,824 | ) |
| | | | | | | |
Net Change in Unrealized Appreciation (Depreciation) on: | | | | | | | | | | | | | | | | | | | | | |
Financial futures contracts | | | — | | | | — | | | | — | | | | — | | | $ | (35,476 | ) | | | — | | | $ | (35,476 | ) |
|
| Average Quarterly Balances of Outstanding Derivative Financial Instruments |
| | | | |
Financial futures contracts: | | | | |
Average notional value of contracts — short | | $ | 19,666,980 | |
For more information about the Trust’s investment risks regarding derivative financial instruments, refer to the Notes to Financial Statements.
|
| Fair Value Hierarchy as of Period End |
Various inputs are used in determining the fair value of investments and derivative financial instruments. For information about the Trust’s policy regarding valuation of investments and derivative financial instruments, refer to the Notes to Financial Statements.
The following tables summarize the Trust’s investments and derivative financial instruments categorized in the disclosure hierarchy:
| | | | | | | | | | | | | | |
| | | Level 1 | | | Level 2 | | | Level 3 | | Total | |
Assets: | | | | | | | | | | | | | | |
| Investments: | | | | | | | | | | | | | | |
Long-Term Investments 1 | | | — | | | $ | 638,812,024 | | | — | | $ | 638,812,024 | |
Short-Term Securities | | $ | 5,032,305 | | | | — | | | — | | | 5,032,305 | |
| | | | |
Total | | $ | 5,032,305 | | | $ | 638,812,024 | | | — | | $ | 643,844,329 | |
| | | | |
1 See above Schedule of Investments for values in each state or political subdivision. | |
| | | Level 1 | | | Level 2 | | | Level 3 | | Total | |
| Derivative Financial Instruments 1 | | | | | | | |
Assets: | | | | | | | | | | | | | | |
Interest rate contracts | | $ | 65,416 | | | | — | | | — | | $ | 65,416 | |
1 Derivative financial instruments are financial futures contracts, which are valued at the unrealized appreciation (depreciation) on the instrument. | |
The Trust may hold assets and/or liabilities in which the fair value approximates the carrying amount for financial statement purposes. As of period end, such assets and/or liabilities are categorized within the disclosure hierarchy as follows:
| | | | | | | | | | | | | | |
| | | Level 1 | | | Level 2 | | | Level 3 | | Total | |
Assets: | | | | | | | | | | | | | | |
Cash pledged for financial futures contracts | | $ | 417,050 | | | | — | | | — | | $ | 417,050 | |
Liabilities: | | | | | | | | | | | | | | |
TOB Trust Certificates | | | — | | | $ | (97,623,691 | ) | | — | | | (97,623,691 | ) |
VMTP Shares | | | — | | | | (137,200,000 | ) | | — | | | (137,200,000 | ) |
| | | | |
Total | | $ | 417,050 | | | $ | (234,823,691 | ) | | — | | $ | (234,406,641 | ) |
| | | | |
During the six months ended February 29, 2016, there were no transfers between levels.
See Notes to Financial Statements.
| | | | | | |
| | | | | | | |
| 42 | | SEMI-ANNUAL REPORT | | FEBRUARY 29, 2016 | | |
| | |
Schedule of Investments February 29, 2016 (Unaudited) | | BlackRock Municipal Income Trust II (BLE) (Percentages shown are based on Net Assets) |
| | | | | | | | |
| Municipal Bonds | | Par
(000) | | | Value | |
Alabama — 2.6% | |
County of Jefferson Alabama, RB, Limited Obligation School, Series A, 5.25%, 1/01/19 | | $ | 1,620 | | | $ | 1,635,811 | |
County of Jefferson Alabama Sewer, Refunding RB: | | | | | | | | |
Senior Lien, Series A (AGM), 5.00%, 10/01/44 | | | 540 | | | | 592,731 | |
Senior Lien, Series A (AGM), 5.25%, 10/01/48 | | | 1,320 | | | | 1,467,735 | |
Sub-Lien, Series D, 7.00%, 10/01/51 | | | 3,220 | | | | 3,992,639 | |
Lower Alabama Gas District, RB, Series A, 5.00%, 9/01/46 | | | 1,555 | | | | 1,815,400 | |
| | | | | | | | |
| | | | | | | | 9,504,316 | |
Arizona — 2.1% | |
Salt Verde Financial Corp., RB, Senior: | | | | | | | | |
5.00%, 12/01/32 | | | 5,635 | | | | 6,636,452 | |
5.00%, 12/01/37 | | | 1,000 | | | | 1,181,430 | |
| | | | | | | | |
| | | | | | | | 7,817,882 | |
California — 10.7% | |
Bay Area Toll Authority, Refunding RB, San Francisco Bay Area Toll Bridge, Series F-1, 5.63%, 4/01/19 (a) | | | 2,480 | | | | 2,848,875 | |
California Health Facilities Financing Authority, RB, Sutter Health, Series B, 6.00%, 8/15/42 | | | 3,500 | | | | 4,198,915 | |
California Health Facilities Financing Authority, Refunding RB, St. Joseph Health System, Series A, 5.00%, 7/01/33 | | | 1,365 | | | | 1,595,467 | |
California Municipal Finance Authority, RB, Senior, Caritas Affordable Housing, Inc. Projects, S/F Housing, Series A: | | | | | | | | |
5.25%, 8/15/39 | | | 160 | | | | 180,101 | |
5.25%, 8/15/49 | | | 395 | | | | 443,178 | |
California Pollution Control Financing Authority, RB, Poseidon Resources (Channel Side) LP Desalination Project, AMT, 5.00%, 11/21/45 (b) | | | 1,655 | | | | 1,802,907 | |
City of Los Angeles California Department of Airports, Refunding ARB, Los Angeles International Airport, Series A: Senior, | | | | | | | | |
5.00%, 5/15/40 | | | 6,500 | | | | 7,363,590 | |
5.25%, 5/15/39 | | | 860 | | | | 965,720 | |
City of Stockton California Public Financing Authority, RB, Delta Water Supply Project, Series A, 6.25%, 10/01/38 | | | 380 | | | | 472,439 | |
San Marcos Unified School District, GO, CAB, Election of 2010, Series B (c): | | | | | | | | |
0.00%, 8/01/33 | | | 3,000 | | | | 1,517,610 | |
0.00%, 8/01/43 | | | 2,500 | | | | 806,175 | |
State of California, GO, Various Purposes: | | | | | | | | |
6.00%, 3/01/33 | | | 1,760 | | | | 2,088,662 | |
6.50%, 4/01/33 | | | 10,645 | | | | 12,421,331 | |
State of California Public Works Board, LRB, Various Capital Projects: | | | | | | | | |
Series I, 5.00%, 11/01/38 | | | 825 | | | | 951,341 | |
Sub-Series I-1, 6.38%, 11/01/34 | | | 1,280 | | | | 1,534,093 | |
| | | | | | | | |
| | | | | | | | 39,190,404 | |
Colorado — 0.7% | | | | | | | | |
Colorado Health Facilities Authority, Refunding RB, Catholic Health Initiative, Series A, 5.50%, 7/01/34 | | | 2,330 | | | | 2,623,464 | |
Connecticut — 0.3% | | | | | | | | |
Connecticut State Health & Educational Facility Authority, RB, Ascension Health Senior Credit, Series A, 5.00%, 11/15/40 | | | 1,005 | | | | 1,111,148 | |
Delaware — 2.0% | | | | | | | | |
County of Sussex Delaware, RB, NRG Energy, Inc., Indian River Power LLC Project, 6.00%, 10/01/40 | | | 1,240 | | | | 1,344,334 | |
Delaware State EDA, RB, Exempt Facilities, Indian River Power LLC Project, 5.38%, 10/01/45 | | | 4,275 | | | | 4,405,473 | |
Delaware Transportation Authority, RB, 5.00%, 6/01/55 | | | 1,260 | | | | 1,416,744 | |
| | | | | | | | |
| | | | | | | | 7,166,551 | |
| | | | | | | | |
| Municipal Bonds | | Par
(000) | | | Value | |
District of Columbia — 5.3% | |
District of Columbia, Refunding RB, Kipp Charter School, Series A, 6.00%, 7/01/43 | | $ | 820 | | | $ | 949,322 | |
District of Columbia Tobacco Settlement Financing Corp., Refunding RB, Asset-Backed: | | | | | | | | |
6.50%, 5/15/33 | | | 3,250 | | | | 4,004,878 | |
6.75%, 5/15/40 | | | 11,500 | | | | 11,558,995 | |
Metropolitan Washington Airports Authority, Refunding RB, Dulles Toll Road, 1st Senior Lien, Series A: | | | | | | | | |
5.00%, 10/01/39 | | | 550 | | | | 610,390 | |
5.25%, 10/01/44 | | | 2,000 | | | | 2,232,260 | |
| | | | | | | | |
| | | | | | | | 19,355,845 | |
Florida — 5.7% | | | | | | | | |
City of Atlantic Beach Florida, RB, Health Care Facilities, Fleet Landing Project, Series B, 5.63%, 11/15/43 | | | 1,445 | | | | 1,615,655 | |
City of Jacksonville Florida Port Authority, Refunding RB, AMT, 5.00%, 11/01/38 | | | 1,665 | | | | 1,814,450 | |
County of Collier Florida Health Facilities Authority, Refunding RB, Series A, 5.00%, 5/01/45 | | | 1,450 | | | | 1,620,520 | |
County of Miami-Dade Florida Aviation, Refunding ARB, Miami International Airport: | | | | | | | | |
Series A, AMT (AGC), 5.25%, 10/01/38 | | | 2,855 | | | | 3,113,834 | |
Series A-1, 5.38%, 10/01/41 | | | 1,255 | | | | 1,430,788 | |
County of Miami-Dade Florida Water & Sewer System, RB, (AGM), 5.00%, 10/01/39 | | | 5,000 | | | | 5,677,350 | |
Mid-Bay Bridge Authority, RB, Springing Lien, Series A, 7.25%, 10/01/21 (a) | | | 3,300 | | | | 4,355,076 | |
Stevens Plantation Community Development District, Special Assessment, Series A, 7.10%, 5/01/35 (d)(e) | | | 1,895 | | | | 1,326,254 | |
| | | | | | | | |
| | | | | | | | 20,953,927 | |
Georgia — 1.7% | |
City of Atlanta Georgia Water & Wastewater, Refunding RB, 5.00%, 11/01/40 | | | 2,870 | | | | 3,327,162 | |
County of Gainesville Georgia & Hall Hospital Authority, Refunding RB, Northeast Georgia Health System, Inc. Project, Series A, 5.50%, 8/15/54 | | | 555 | | | | 658,091 | |
DeKalb Private Hospital Authority, Refunding RB, Children’s Healthcare, 5.25%, 11/15/39 | | | 915 | | | | 1,025,358 | |
Municipal Electric Authority of Georgia, RB, Plant Vogtle Units 3 & 4 Project, Series A, 5.00%, 7/01/60 | | | 1,220 | | | | 1,351,687 | |
| | | | | | | | |
| | | | | | | | 6,362,298 | |
Hawaii — 0.5% | |
State of Hawaii Harbor System, RB, Series A, 5.25%, 7/01/30 | | | 1,480 | | | | 1,688,177 | |
Illinois — 19.3% | | | | | | | | |
City of Chicago Illinois, GARB, O’Hare International Airport, 3rd Lien: | | | | | | | | |
Series A, 5.75%, 1/01/39 | | | 5,000 | | | | 5,827,850 | |
Series C, 6.50%, 1/01/41 | | | 6,430 | | | | 7,741,527 | |
City of Chicago Illinois, GO, Project, Series A, 5.00%, 1/01/34 | | | 3,050 | | | | 2,938,217 | |
City of Chicago Illinois, GO, Refunding, Project, Series A, 5.25%, 1/01/32 | | | 4,940 | | | | 4,918,610 | |
City of Chicago Illinois Transit Authority, RB, Sales Tax Receipts, 5.25%, 12/01/40 | | | 1,150 | | | | 1,252,775 | |
City of Chicago Illinois Waterworks, Refunding RB, 2nd Lien Project, 5.00%, 11/01/42 | | | 3,130 | | | | 3,320,961 | |
County of Cook Illinois Community College District No. 508, GO, City College of Chicago, 5.50%, 12/01/38 | | | 845 | | | | 974,370 | |
Illinois Finance Authority, Refunding RB: | | | | | | | | |
Ascension Health, Series A, 5.00%, 11/15/37 | | | 1,060 | | | | 1,208,050 | |
Central Dupage Health, Series B, 5.50%, 11/01/39 | | | 1,750 | | | | 1,987,055 | |
See Notes to Financial Statements.
| | | | | | |
| | | | | | | |
| | SEMI-ANNUAL REPORT | | FEBRUARY 29, 2016 | | 43 |
| | |
Schedule of Investments (continued) | | BlackRock Municipal Income Trust II (BLE) |
| | | | | | | | |
| Municipal Bonds | | Par
(000) | | | Value | |
Illinois (continued) | | | | | | | | |
Illinois Sports Facilities Authority, RB, State Tax Supported (AMBAC), 5.50%, 6/15/30 (f) | | $ | 7,445 | | | $ | 7,546,550 | |
Illinois State Toll Highway Authority, RB: | | | | | | | | |
Senior, Series C, 5.00%, 1/01/36 | | | 2,815 | | | | 3,237,363 | |
Senior, Series C, 5.00%, 1/01/37 | | | 3,005 | | | | 3,443,339 | |
Series A, 5.00%, 1/01/38 | | | 2,520 | | | | 2,812,925 | |
Metropolitan Pier & Exposition Authority, Refunding RB, McCormick Place Expansion Project: | | | | | | | | |
Series B (AGM), 5.00%, 6/15/50 | | | 6,725 | | | | 7,145,716 | |
Series B-2, 5.00%, 6/15/50 | | | 2,725 | | | | 2,822,691 | |
Railsplitter Tobacco Settlement Authority, RB: | | | | | | | | |
5.50%, 6/01/23 | | | 520 | | | | 613,252 | |
6.00%, 6/01/28 | | | 1,255 | | | | 1,501,093 | |
State of Illinois, GO: | | | | | | | | |
5.00%, 2/01/39 | | | 1,640 | | | | 1,719,704 | |
Series A, 5.00%, 4/01/35 | | | 2,500 | | | | 2,627,700 | |
Series A, 5.00%, 4/01/38 | | | 3,885 | | | | 4,061,573 | |
State of Illinois, RB, Build Illinois, Series B, 5.25%, 6/15/34 | | | 685 | | | | 760,672 | |
University of Illinois, RB, Auxiliary Facilities System, Series A: | | | | | | | | |
5.00%, 4/01/39 | | | 860 | | | | 955,288 | |
5.00%, 4/01/44 | | | 1,050 | | | | 1,159,316 | |
| | | | | | | | |
| | | | | | | | 70,576,597 | |
Indiana — 4.4% | | | | | | | | |
City of Valparaiso Indiana, RB, Exempt Facilities, Pratt Paper LLC Project, AMT: | | | | | | | | |
6.75%, 1/01/34 | | | 845 | | | | 1,031,153 | |
7.00%, 1/01/44 | | | 3,535 | | | | 4,341,192 | |
Indiana Finance Authority, RB, Series A: | | | | | | | | |
CWA Authority Project, 1st Lien, 5.25%, 10/01/38 | | | 3,510 | | | | 4,136,219 | |
Private Activity Bond, Ohio River Bridges East End Crossing Project, AMT, 5.25%, 1/01/51 | | | 435 | | | | 473,010 | |
Private Activity Bond, Ohio River Bridges East End Crossing Project, AMT, 5.00%, 7/01/44 | | | 485 | | | | 523,233 | |
Private Activity Bond, Ohio River Bridges East End Crossing Project, AMT, 5.00%, 7/01/48 | | | 1,610 | | | | 1,729,446 | |
Sisters of St. Francis Health Services, 5.25%, 11/01/39 | | | 915 | | | | 1,017,700 | |
Indiana Municipal Power Agency, RB, Series B, 6.00%, 1/01/19 (a) | | | 1,200 | | | | 1,374,060 | |
Indianapolis Local Public Improvement Bond Bank, RB, Series A, 5.00%, 1/15/40 | | | 1,380 | | | | 1,569,626 | |
| | | | | | | | |
| | | | | | | | 16,195,639 | |
Iowa — 2.4% | | | | | | | | |
Iowa Finance Authority, Refunding RB, Midwestern Disaster Area, Iowa Fertilizer Co. Project: | | | | | | | | |
5.00%, 12/01/19 | | | 1,040 | | | | 1,082,131 | |
5.50%, 12/01/22 | | | 2,550 | | | | 2,669,034 | |
5.25%, 12/01/25 | | | 500 | | | | 545,120 | |
Iowa Student Loan Liquidity Corp., Refunding RB, Student Loan, Senior Series A-1, AMT, 5.15%, 12/01/22 | | | 1,435 | | | | 1,528,246 | |
Iowa Tobacco Settlement Authority, Refunding RB, Asset-Backed, Series C, 5.63%, 6/01/46 | | | 3,095 | | | | 3,082,651 | |
| | | | | | | | |
| | | | | | | | 8,907,182 | |
Kentucky — 0.6% | | | | | | | | |
Kentucky Economic Development Finance Authority, RB, Catholic Health Initiatives, Series A, 5.25%, 1/01/45 | | | 1,060 | | | | 1,189,023 | |
Kentucky Public Transportation Infrastructure Authority, RB, Downtown Crossing Project, Convertible CAB, 1st Tier, Series C, 0.00%, 7/01/43 (f) | | | 1,280 | | | | 962,483 | |
| | | | | | | | |
| | | | | | | | 2,151,506 | |
| | | | | | | | |
| Municipal Bonds | | Par
(000) | | | Value | |
Louisiana — 2.7% | | | | | | | | |
Louisiana Local Government Environmental Facilities & Community Development Authority, RB, Westlake Chemical Corp. Project, Series A-1, 6.50%, 11/01/35 | | $ | 3,650 | | | $ | 4,270,719 | |
Tobacco Settlement Financing Corp., Refunding RB, Asset-Backed, Series A: | | | | | | | | |
5.50%, 5/15/30 | | | 1,100 | | | | 1,233,705 | |
5.25%, 5/15/31 | | | 935 | | | | 1,046,518 | |
5.25%, 5/15/32 | | | 1,195 | | | | 1,352,931 | |
5.25%, 5/15/33 | | | 1,300 | | | | 1,447,810 | |
5.25%, 5/15/35 | | | 545 | | | | 609,043 | |
| | | | | | | | |
| | | | | | | | 9,960,726 | |
Maryland — 1.1% | | | | | | | | |
Maryland EDC, RB, Transportation Facilities Project, Series A, 5.75%, 6/01/35 | | | 475 | | | | 518,990 | |
Maryland EDC, Refunding RB, CNX Marine Terminals, Inc., 5.75%, 9/01/25 | | | 800 | | | | 763,824 | |
Maryland Health & Higher Educational Facilities Authority, Refunding RB, Charlestown Community Project, 6.25%, 1/01/41 | | | 2,400 | | | | 2,715,264 | |
| | | | | | | | |
| | | | | | | | 3,998,078 | |
Massachusetts — 0.7% | |
Massachusetts Development Finance Agency, Refunding RB, Covanta Energy Project, Series C, AMT, 5.25%, 11/01/42 (b) | | | 1,530 | | | | 1,535,003 | |
Massachusetts Health & Educational Facilities Authority, Refunding RB, Partners Healthcare System, Series J1, 5.00%, 7/01/39 | | | 955 | | | | 1,063,784 | |
| | | | | | | | |
| | | | | | | | 2,598,787 | |
Michigan — 2.9% | |
City of Detroit Michigan Sewage Disposal System, Refunding RB, Senior Lien, Series A, 5.25%, 7/01/39 | | | 4,825 | | | | 5,338,621 | |
Kalamazoo Hospital Finance Authority, Refunding RB, Bronson Methodist Hospital, 5.50%, 5/15/36 | | | 1,500 | | | | 1,679,385 | |
Michigan Finance Authority, Refunding RB, Detroit Water & Sewage Department Project, Senior Lien, Series C-1, 5.00%, 7/01/44 | | | 940 | | | | 1,017,823 | |
Michigan State Hospital Finance Authority, Refunding RB, Henry Ford Health System, Series A, 5.25%, 11/15/46 | | | 2,305 | | | | 2,372,859 | |
| | | | | | | | |
| | | | | | | | 10,408,688 | |
Missouri — 1.9% | |
370/Missouri Bottom Road/Taussig Road Transportation Development District, RB, 7.20%, 5/01/33 | | | 6,000 | | | | 5,175,600 | |
Bi-State Development Agency of the Missouri-Illinois Metropolitan District, Refunding RB, Combined Lien, Series A, 5.00%, 10/01/44 | | | 275 | | | | 308,528 | |
State of Missouri Health & Educational Facilities Authority, RB, Senior Living Facilities, Lutheran Senior Services, 5.50%, 2/01/42 | | | 1,135 | | | | 1,227,866 | |
State of Missouri Health & Educational Facilities Authority, Refunding RB, St. Louis College of Pharmacy Project, 5.50%, 5/01/43 | | | 265 | | | | 292,859 | |
| | | | | | | | |
| | | | | | | | 7,004,853 | |
Multi-State — 2.0% | |
Centerline Equity Issuer Trust (b)(g): | | | | | | | | |
Series A-4-2, 6.00%, 5/15/19 | | | 3,500 | | | | 3,940,790 | |
Series B-3-2, 6.30%, 5/15/19 | | | 3,000 | | | | 3,402,450 | |
| | | | | | | | |
| | | | | | | | 7,343,240 | |
Nebraska — 1.6% | |
Central Plains Energy Project Nebraska, RB, Gas Project No. 3: | | | | | | | | |
5.25%, 9/01/37 | | | 895 | | | | 994,273 | |
5.00%, 9/01/42 | | | 1,570 | | | | 1,692,790 | |
See Notes to Financial Statements.
| | | | | | |
| | | | | | | |
| 44 | | SEMI-ANNUAL REPORT | | FEBRUARY 29, 2016 | | |
| | |
Schedule of Investments (continued) | | BlackRock Municipal Income Trust II (BLE) |
| | | | | | | | |
| Municipal Bonds | | Par
(000) | | | Value | |
Nebraska (continued) | |
County of Lancaster Nebraska Hospital Authority No. 1, Refunding RB, Immanuel Obligation Group, Health Facilities, 5.63%, 1/01/40 | | $ | 1,245 | | | $ | 1,397,201 | |
County of Sarpy Nebraska Hospital Authority No. 1, Refunding RB, Immanuel Obligation Group, 5.63%, 1/01/40 | | | 1,635 | | | | 1,795,067 | |
| | | | | | | | |
| | | | | | | | 5,879,331 | |
Nevada — 0.7% | |
County of Clark Nevada, Refunding RB, Alexander Dawson School Nevada Project, 5.00%, 5/15/29 | | | 2,465 | | | | 2,489,625 | |
New Jersey — 8.7% | |
Casino Reinvestment Development Authority, Refunding RB: | | | | | | | | |
5.25%, 11/01/39 | | | 1,100 | | | | 1,138,643 | |
5.25%, 11/01/44 | | | 1,640 | | | | 1,685,871 | |
County of Essex New Jersey Improvement Authority, RB, AMT, 5.25%, 7/01/45 (b) | | | 1,165 | | | | 1,183,454 | |
New Jersey EDA, RB, Continental Airlines, Inc. Project, AMT: | | | | | | | | |
4.88%, 9/15/19 | | | 870 | | | | 918,868 | |
5.13%, 9/15/23 | | | 2,130 | | | | 2,356,419 | |
5.25%, 9/15/29 | | | 2,130 | | | | 2,332,755 | |
New Jersey EDA, Refunding RB, Special Assessment, Kapkowski Road Landfill Project, 6.50%, 4/01/28 | | | 7,475 | | | | 9,147,232 | |
New Jersey State Turnpike Authority, RB: | | | | | | | | |
Series A, 5.00%, 1/01/43 | | | 2,160 | | | | 2,431,512 | |
Series E, 5.00%, 1/01/45 | | | 2,810 | | | | 3,191,991 | |
New Jersey Transportation Trust Fund Authority, RB: | | | | | | | | |
Transportation Program, Series AA, 5.00%, 6/15/44 | | | 3,760 | | | | 3,939,089 | |
Transportation System, Series B, 5.25%, 6/15/36 | | | 2,690 | | | | 2,858,071 | |
Rutgers — The State University of New Jersey, Refunding RB, Series L, 5.00%, 5/01/43 | | | 570 | | | | 653,345 | |
| | | | | | | | |
| | | | | | | | 31,837,250 | |
New York — 9.4% | |
City of New York New York Industrial Development Agency, ARB, American Airlines, Inc., JFK International Airport Project, AMT,
7.75%, 8/01/31 (h) | | | 6,700 | | | | 6,952,858 | |
City of New York New York Transitional Finance Authority, RB, Fiscal 2012, Sub-Series E-1, 5.00%, 2/01/42 | | | 2,680 | | | | 3,054,557 | |
County of New York Tobacco Trust IV, Refunding RB, Settlement Pass-Through Turbo, Series A, 6.25%, 6/01/41 (b) | | | 2,000 | | | | 2,085,940 | |
County of Westchester New York Healthcare Corp., RB, Senior Lien, Series A, 5.00%, 11/01/44 | | | 832 | | | | 932,288 | |
Metropolitan Transportation Authority, RB, Series B: | | | | | | | | |
5.25%, 11/15/38 | | | 2,555 | | | | 2,996,913 | |
5.25%, 11/15/39 | | | 910 | | | | 1,064,491 | |
New York Liberty Development Corp., Refunding RB: | | | | | | | | |
2nd Priority, Bank of America Tower at One Bryant Park Project, Class 3, 6.38%, 7/15/49 | | | 1,335 | | | | 1,502,636 | |
3 World Trade Center Project, Class 1, 5.00%, 11/15/44 (b) | | | 4,640 | | | | 4,932,552 | |
3 World Trade Center Project, Class 2, 5.15%, 11/15/34 (b) | | | 365 | | | | 392,262 | |
3 World Trade Center Project, Class 2, 5.38%, 11/15/40 (b) | | | 910 | | | | 992,127 | |
New York State Dormitory Authority, Refunding RB, General Purpose, Series A, 5.00%, 6/15/31 | | | 1,930 | | | | 2,300,135 | |
Niagara Area Development Corp., Refunding RB, Solid Waste Disposal Facility, Covanta Energy Project, Series A, AMT, 5.25%, 11/01/42 (b) | | | 1,145 | | | | 1,161,465 | |
Port Authority of New York & New Jersey, ARB, JFK International Air Terminal LLC Project, Series 8: | | | | | | | | |
6.00%, 12/01/42 | | | 1,635 | | | | 1,922,090 | |
Special Project, 6.00%, 12/01/36 | | | 1,410 | | | | 1,664,589 | |
| | | | | | | | |
| Municipal Bonds | | Par
(000) | | | Value | |
New York (continued) | |
Westchester Tobacco Asset Securitization, Refunding RB, 5.13%, 6/01/45 | | $ | 2,500 | | | $ | 2,481,050 | |
| | | | | | | | |
| | | | | | | | 34,435,953 | |
North Carolina — 3.2% | |
County of Gaston North Carolina Industrial Facilities & Pollution Control Financing Authority, RB, Exempt Facilities, National Gypsum Co. Project, AMT, 5.75%, 8/01/35 | | | 6,500 | | | | 6,512,350 | |
North Carolina Capital Facilities Finance Agency, Refunding RB, Solid Waste Disposal Facility, Duke Energy Carolinas Project, Series B, 4.63%, 11/01/40 | | | 1,000 | | | | 1,070,540 | |
North Carolina Medical Care Commission, RB, Health Care Facilities, Duke University Health System, Series A, 5.00%, 6/01/42 | | | 1,525 | | | | 1,696,791 | |
North Carolina Medical Care Commission, Refunding RB, 1st Mortgage: | | | | | | | | |
Aldersgate, 6.25%, 7/01/35 | | | 1,530 | | | | 1,701,727 | |
Retirement Facilities Whitestone Project, Series A, 7.75%, 3/01/41 | | | 625 | | | | 715,438 | |
| | | | | | | | |
| | | | | | | | 11,696,846 | |
Ohio — 2.4% | |
County of Allen Ohio Hospital Facilities, Refunding RB, Catholic Healthcare Partners, Series A, 5.25%, 6/01/38 | | | 3,405 | | | | 3,809,854 | |
County of Franklin Ohio, RB, Health Care Facilities Improvement, OPRS Communities Obligation Group, Series A, 6.13%, 7/01/40 | | | 710 | | | | 783,251 | |
County of Montgomery Ohio, Refunding RB, Catholic Health, Series A, 5.00%, 5/01/39 | | | 3,025 | | | | 3,267,605 | |
State of Ohio, RB, Portsmouth Bypass Project, AMT, 5.00%, 6/30/53 | | | 870 | | | | 943,376 | |
| | | | | | | | |
| | | | | | | | 8,804,086 | |
Pennsylvania — 2.8% | | | | | | | | |
Allentown Neighborhood Improvement Zone Development Authority, Refunding RB, Series A, 5.00%, 5/01/42 | | | 2,500 | | | | 2,641,000 | |
City of Philadelphia Pennsylvania Hospitals & Higher Education Facilities Authority, RB, Temple University Health System, Series A, 5.63%, 7/01/42 | | | 685 | | | | 736,423 | |
Pennsylvania Economic Development Financing Authority, RB: | | | | | | | | |
AMT, Pennsylvania Bridge Finco LP, 5.00%, 6/30/42 | | | 3,030 | | | | 3,316,547 | |
Aqua Pennsylvania, Inc. Project, Series B, 5.00%, 11/15/40 | | | 2,065 | | | | 2,298,985 | |
Pennsylvania Turnpike Commission, RB, Series A, 5.00%, 12/01/44 | | | 1,190 | | | | 1,334,038 | |
| | | | | | | | |
| | | | | | | | 10,326,993 | |
Rhode Island — 1.5% | |
Tobacco Settlement Financing Corp., Refunding RB, Series B: | | | | | | | | |
4.50%, 6/01/45 | | | 2,850 | | | | 2,877,787 | |
5.00%, 6/01/50 | | | 2,435 | | | | 2,514,990 | |
| | | | | | | | |
| | | | | | | | 5,392,777 | |
South Carolina — 3.9% | |
South Carolina State Ports Authority, RB: | | | | | | | | |
5.25%, 7/01/40 | | | 3,595 | | | | 4,047,898 | |
AMT, 5.25%, 7/01/55 | | | 1,390 | | | | 1,538,605 | |
State of South Carolina Public Service Authority, Refunding RB, Series E, 5.25%, 12/01/55 | | | 3,385 | | | | 3,846,815 | |
State of South Carolina Public Service Authority, RB, Santee Cooper, Series A, 5.50%, 12/01/54 | | | 4,170 | | | | 4,785,784 | |
| | | | | | | | |
| | | | | | | | 14,219,102 | |
See Notes to Financial Statements.
| | | | | | |
| | | | | | | |
| | SEMI-ANNUAL REPORT | | FEBRUARY 29, 2016 | | 45 |
| | |
Schedule of Investments (continued) | | BlackRock Municipal Income Trust II (BLE) |
| | | | | | | | |
| Municipal Bonds | | Par
(000) | | | Value | |
Tennessee — 0.5% | |
City of Chattanooga Tennessee Health Educational & Housing Facility Board, RB, Catholic Health Initiatives, Series A, 5.25%, 1/01/45 | | $ | 1,470 | | | $ | 1,648,928 | |
Texas — 11.7% | |
Brazos River Authority, RB, TXU Electric, Series A, AMT, 8.25%, 10/01/30 (d)(e) | | | 2,400 | | | | 60,000 | |
Central Texas Regional Mobility Authority, Refunding RB: | | | | | | | | |
Senior Lien, 6.25%, 1/01/46 | | | 2,350 | | | | 2,805,970 | |
Sub-Lien, 5.00%, 1/01/33 | | | 390 | | | | 430,026 | |
Central Texas Turnpike System, Refunding RB, Series C, 5.00%, 8/15/42 | | | 630 | | | | 695,766 | |
City of Austin Texas Airport System, ARB, Revenue, AMT, 5.00%, 11/15/39 | | | 665 | | | | 739,832 | |
City of Dallas Texas Waterworks & Sewer System, Refunding RB, 5.00%, 10/01/35 | | | 1,650 | | | | 1,899,398 | |
City of Houston Texas Airport System, Refunding ARB: | | | | | | | | |
Senior Lien, Series A, 5.50%, 7/01/39 | | | 1,675 | | | | 1,839,988 | |
United Airlines, Inc. Terminal E Project, AMT, 5.00%, 7/01/29 | | | 460 | | | | 499,114 | |
City of Houston Texas Utility System, Refunding RB, Combined 1st Lien, Series A (AGC), 6.00%, 11/15/35 | | | 9,145 | | | | 10,641,122 | |
County of Harris Texas Cultural Education Facilities Finance Corp., RB, 1st Mortgage, Brazos Presbyterian Homes, Inc. Project, Series B, 7.00%, 1/01/48 | | | 485 | | | | 572,159 | |
County of Harris Texas-Houston Sports Authority, Refunding RB, 3rd Lien, Series A-3 (NPFGC), 0.00%, 11/15/36 (c) | | | 25,375 | | | | 8,514,581 | |
County of Midland Texas Fresh Water Supply District No. 1, RB, CAB, City of Midland Projects, Series A, 0.00%, 9/15/37 (c) | | | 6,055 | | | | 2,453,183 | |
County of Tarrant Texas Cultural Education Facilities Finance Corp., RB, Scott & White Healthcare: | | | | | | | | |
6.00%, 8/15/20 (a) | | | 325 | | | | 396,087 | |
6.00%, 8/15/45 | | | 4,085 | | | | 4,855,880 | |
Texas Private Activity Bond Surface Transportation Corp., RB, Senior Lien: | | | | | | | | |
LBJ Infrastructure Group LLC, LBJ Freeway Managed Lanes Project, 7.00%, 6/30/40 | | | 3,000 | | | | 3,626,880 | |
NTE Mobility Partners LLC, North Tarrant Express Managed Lanes Project, 6.88%, 12/31/39 | | | 2,250 | | | | 2,654,843 | |
| | | | | | | | |
| | | | | | | | 42,684,829 | |
Utah — 0.2% | |
Utah State Charter School Finance Authority, RB, Ogden Preparatory Academy, Series A, 3.25%, 10/15/42 | | | 875 | | | | 834,190 | |
Virginia — 1.5% | |
Virginia Small Business Financing Authority, RB, Senior Lien, Elizabeth River Crossings OpCo LLC Project, AMT: | | | | | | | | |
5.25%, 1/01/32 | | | 1,755 | | | | 1,952,402 | |
6.00%, 1/01/37 | | | 3,180 | | | | 3,678,561 | |
| | | | | | | | |
| | | | | | | | 5,630,963 | |
Washington — 4.0% | |
City of Bellingham Washington Water & Sewer, RB, 5.00%, 8/01/36 | | | 5,050 | | | | 5,817,044 | |
Grant County Public Utility District No 2, Refunding RB, Series A: | | | | | | | | |
5.00%, 1/01/41 | | | 2,035 | | | | 2,345,724 | |
5.00%, 1/01/43 | | | 2,335 | | | | 2,689,383 | |
Port of Seattle Washington, RB, Series C, AMT, 5.00%, 4/01/40 | | | 815 | | | | 903,713 | |
Washington Health Care Facilities Authority, RB, Catholic Health Initiatives, Series A, 5.75%, 1/01/45 | | | 2,445 | | | | 2,887,643 | |
| | | | | | | | |
| | | | | | | | 14,643,507 | |
| | | | | | | | |
| Municipal Bonds | | Par
(000) | | | Value | |
Wisconsin — 0.3% | |
State of Wisconsin Health & Educational Facilities Authority, RB, Ascension Health Senior Credit Group, Series E, 5.00%, 11/15/33 | | $ | 910 | | | $ | 1,029,019 | |
Wyoming — 1.5% | |
County of Sweetwater Wyoming, Refunding RB, Idaho Power Co. Project, Remarketing, 5.25%, 7/15/26 | | | 3,355 | | | | 3,819,231 | |
Wyoming Municipal Power Agency, Inc., RB, Series A: | | | | | | | | |
5.50%, 1/01/33 | | | 800 | | | | 859,472 | |
5.50%, 1/01/38 | | | 750 | | | | 805,755 | |
| | | | | | | | |
| | | | | | | | 5,484,458 | |
Total Municipal Bonds — 123.5% | | | | 451,957,165 | |
| | | | | | | | |
| | | | | | | | | |
| | |
Municipal Bonds Transferred to
Tender Option Bond Trusts (i) | | | | | | |
Alabama — 0.7% | |
City of Birmingham Alabama Special Care Facilities Financing Authority, Refunding RB, Ascension Health, Senior Credit, Series C-2, 5.00%, 11/15/36 | | | 2,519 | | | | 2,594,757 | |
California — 5.3% | |
California Educational Facilities Authority, RB, University of Southern California, Series B, 5.25%, 10/01/39 (j) | | | 2,850 | | | | 3,165,153 | |
City & County of San Francisco California Public Utilities Commission, RB, Water Revenue, Series B, 5.00%, 11/01/39 | | | 10,335 | | | | 11,650,025 | |
Los Angeles Community College District California, GO, Election of 2001, Series A (AGM), 5.00%, 8/01/17 (a) | | | 2,530 | | | | 2,692,805 | |
San Diego Community College District California, GO, Election of 2002, 5.25%, 8/01/33 | | | 1,840 | | | | 2,095,012 | |
| | | | | | | | |
| | | | | | | | 19,602,995 | |
Colorado — 2.1% | |
Colorado Health Facilities Authority, RB, Catholic Health (AGM) (a): | | | | | | | | |
Series C-3, 5.10%, 4/29/18 | | | 4,230 | | | | 4,629,904 | |
Series C-7, 5.00%, 5/01/18 | | | 2,710 | | | | 2,960,973 | |
| | | | | | | | |
| | | | | | | | 7,590,877 | |
Connecticut — 3.0% | |
Connecticut State Health & Educational Facility Authority, RB, Yale University: | | | | | | | | |
Series T-1, 4.70%, 7/01/29 | | | 5,179 | | | | 5,434,574 | |
Series X-3, 4.85%, 7/01/37 | | | 5,143 | | | | 5,413,804 | |
| | | | | | | | |
| | | | | | | | 10,848,378 | |
Georgia — 1.4% | |
Private Colleges & Universities Authority, Refunding RB, Emory University, Series C, 5.00%, 9/01/38 | | | 4,638 | | | | 5,080,106 | |
Massachusetts — 0.8% | |
Massachusetts School Building Authority, RB, Senior, Series B, 5.00%, 10/15/41 | | | 2,461 | | | | 2,887,961 | |
New Hampshire — 0.7% | |
New Hampshire Health & Education Facilities Authority, RB, Dartmouth College, 5.25%, 6/01/39 (j) | | | 2,219 | | | | 2,511,501 | |
New York — 10.8% | |
City of New York New York Municipal Water Finance Authority, Refunding RB, Water & Sewer System, 2nd General Resolution: | | | | | | | | |
Series FF-2, 5.50%, 6/15/40 | | | 1,710 | | | | 1,941,077 | |
Series HH, 5.00%, 6/15/31 (j) | | | 9,150 | | | | 10,690,769 | |
Hudson Yards Infrastructure Corp., RB, Fiscal 2012, Series A, 5.75%, 2/15/47 (j) | | | 1,750 | | | | 2,033,687 | |
See Notes to Financial Statements.
| | | | | | |
| | | | | | | |
| 46 | | SEMI-ANNUAL REPORT | | FEBRUARY 29, 2016 | | |
| | |
Schedule of Investments (continued) | | BlackRock Municipal Income Trust II (BLE) |
| | | | | | | | |
Municipal Bonds Transferred to
Tender Option Bond Trusts (i) | | Par
(000) | | | Value | |
New York (continued) | |
New York Liberty Development Corp., RB, 1 World Trade Center Port Authority Consolidated Bonds, 5.25%, 12/15/43 | | $ | 11,670 | | | $ | 13,513,183 | |
New York Liberty Development Corp., Refunding RB, 4 World Trade Center Project, 5.75%, 11/15/51 (j) | | | 7,040 | | | | 8,201,878 | |
Port Authority of New York & New Jersey, Refunding ARB, 194th Series, 5.25%, 10/15/55 | | | 2,790 | | | | 3,285,644 | |
| | | | | | | | |
| | | | | | | | 39,666,238 | |
North Carolina — 0.9% | |
North Carolina Capital Facilities Finance Agency, Refunding RB, Duke University Project, Series B, 5.00%, 10/01/55 | | | 2,740 | | | | 3,178,784 | |
Texas — 3.0% | |
City of San Antonio Texas Public Service Board, RB, Electric & Gas Systems, Junior Lien, 5.00%, 2/01/43 | | | 2,660 | | | | 2,974,385 | |
County of Harris Texas Metropolitan Transit Authority, Refunding RB, Series A, 5.00%, 11/01/41 | | | 3,720 | | | | 4,306,793 | |
University of Texas, Refunding RB, Financing System, Series B, 5.00%, 8/15/43 | | | 3,347 | | | | 3,894,794 | |
| | | | | | | | |
| | | | | | | | 11,175,972 | |
Utah — 1.2% | |
City of Riverton Utah, RB, IHC Health Services, Inc., 5.00%, 8/15/41 | | | 3,959 | | | | 4,315,314 | |
Virginia — 1.7% | |
University of Virginia, Refunding RB, GO, 5.00%, 6/01/40 | | | 5,909 | | | | 6,427,842 | |
| | | | | | | | |
Municipal Bonds Transferred to
Tender Option Bond Trusts (i) | | Par
(000) | | | Value | |
Washington — 3.4% | |
Central Puget Sound Regional Transit Authority, RB, Series A (AGM), 5.00%, 11/01/17 (a) | | $ | 3,029 | | | $ | 3,251,731 | |
State of Washington, GO, Various Purposes, Series E, 5.00%, 2/01/19 | | | 8,113 | | | | 9,102,028 | |
| | | | | | | | |
| | | | | | | | 12,353,759 | |
Total Municipal Bonds Transferred to
Tender Option Bond Trusts — 35.0% | | | | 128,234,484 | |
Total Long-Term Investments (Cost — $531,001,101) — 158.5% | | | | 580,191,649 | |
| | | | | | | | |
| | |
| | |
| Short-Term Securities | | Shares | | | | |
BlackRock Liquidity Funds, MuniCash, 0.02% (k)(l) | | | 5,848,983 | | | | 5,848,983 | |
Total Short-Term Securities
(Cost — $5,848,983) — 1.6% | | | | 5,848,983 | |
| Total Investments (Cost — $536,850,084) — 160.1% | | | | 586,040,632 | |
| Other Assets Less Liabilities — 0.9% | | | | 3,133,841 | |
Liability for TOB Trust Certificates, Including Interest
Expense and Fees Payable — (19.7)% | | | | (71,933,824 | ) |
| VMTP Shares, at Liquidation Value — (41.3)% | | | | (151,300,000 | ) |
| | | | | | | | |
| Net Assets Applicable to Common Shares — 100.0% | | | $ | 365,940,649 | |
| | | | | | | | |
|
| Notes to Schedule of Investments |
| (a) | | U.S. Government securities, held in escrow, are used to pay interest on this security, as well as to retire the bond in full at the date indicated, typically at a premium to par. |
| (b) | | Security exempt from registration pursuant to Rule 144A under the Securities Act of 1933, as amended. These securities may be resold in transactions exempt from registration to qualified institutional investors. |
| (d) | | Issuer filed for bankruptcy and/or is in default of interest payments. |
| (e) | | Non-income producing security. |
| (f) | | Step-up bond that pays an initial coupon rate for the first period and then a higher coupon rate for the following periods. Rate as of period end. |
| (g) | | Represents a beneficial interest in a trust. The collateral deposited into the trust is federally tax-exempt revenue bonds issued by various state or local governments, or their respective agencies or authorities. The security is subject to remarketing prior to its stated maturity. |
| (h) | | Variable rate security. Rate as of period end. |
| (i) | | Represent bonds transferred to a TOB Trust in exchange of cash and residual certificates received by the Trust. These bonds serve as collateral in a secured borrowing. See Note 4 of the Notes to Financial Statements for details. |
| (j) | | All or a portion of security is subject to a recourse agreement. The aggregate maximum potential amount the Trust could ultimately be required to pay under the agreements, which expire between October 1, 2016 to November 15, 2019, is $14,496,598. See Note 4 of the Notes to Financial Statements for details. |
| (k) | | During the six months ended February 29, 2016, investments in issuers considered to be affiliates of the Trust for purposes of Section 2(a)(3) of the Investment Company Act of 1940, as amended, were as follows: |
| | | | | | | | | | | | | | | | |
| Affiliate | | Shares Held
at August 31,
2015 | | | Net
Activity | | | Shares Held
at February 29,
2016 | | | Income | |
BlackRock Liquidity Funds, MuniCash | | | — | | | | 5,848,983 | | | | 5,848,983 | | | $ | 46 | |
FFI Institutional Tax-Exempt Fund | | | 11,886,794 | | | | (11,886,794 | ) | | | — | | | | 425 | |
Total | | | | | | | | | | | 5,848,983 | | | $ | 471 | |
| | | | | | | | | | | | | | | | |
| (l) | | Current yield as of period end. |
See Notes to Financial Statements.
| | | | | | |
| | | | | | | |
| | SEMI-ANNUAL REPORT | | FEBRUARY 29, 2016 | | 47 |
| | |
Schedule of Investments (continued) | | BlackRock Municipal Income Trust II (BLE) |
|
| Derivative Financial Instruments Outstanding as of Period End |
| | | | | | | | | | | | | | | | |
| Financial Futures Contracts | | | |
Contracts
Short | | | Issue | | Expiration | | Notional
Value | | | Unrealized
Appreciation | | | |
| | (63 | ) | | 5-Year U.S. Treasury Note | | June 2016 | | $ | 7,622,016 | | | $ | 18,499 | | | |
| | (73 | ) | | 10-Year U.S. Treasury Note | | June 2016 | | $ | 9,527,641 | | | | 32,493 | | | |
| | (34 | ) | | Long U.S. Treasury Bond | | June 2016 | | $ | 5,594,063 | | | | 42,848 | | | |
| | (9 | ) | | Ultra U.S. Treasury Bond | | June 2016 | | $ | 1,558,406 | | | | 6,316 | | | |
| Total | | | $ | 100,156 | | | |
| | | | | | | | | | | | | |
|
| Derivative Financial Instruments Categorized by Risk Exposure |
As of period end, the fair values of derivative financial instruments located in the Statements of Assets and Liabilities were as follows:
| | | | | | | | | | | | | | | | | | | | | | | | | | | | | | |
| Assets — Derivative Financial Instruments | | | | Commodity
Contracts | | | Credit
Contracts | | | Equity
Contracts | | | Foreign
Currency
Exchange
Contracts | | | Interest Rate
Contracts | | | Other
Contracts | | | Total | |
Financial futures contracts | | Net unrealized
appreciation1 | | | — | | | | — | | | | — | | | | — | | | $ | 100,156 | | | | — | | | $ | 100,156 | |
1 Includes cumulative appreciation (depreciation) on financial futures contracts, if any, as reported in the Schedule of Investments. Only current day’s variation margin is reported within the Statements of Assets and Liabilities. | |
| For the six months ended February 29, 2016, the effect of derivative financial instruments in the Statements of Operations was as follows: | |
| Net Realized Gain (Loss) from: | | | | Commodity
Contracts | | | Credit
Contracts | | | Equity
Contracts | | | Foreign
Currency
Exchange
Contracts | | | Interest Rate
Contracts | | | Other
Contracts | | | Total | |
Financial futures contracts | | | | | — | | | | — | | | | — | | | | — | | | $ | (702,883 | ) | | | — | | | $ | (702,883 | ) |
| | | | | | | | | |
| Net Change in Unrealized Appreciation (Depreciation) on: | | | | | | | | | | | | | | | | | | | | | | | | | | | | | | |
Financial futures contracts | | | | | — | | | | — | | | | — | | | | — | | | $ | 62,241 | | | | — | | | $ | 62,241 | |
|
| Average Quarterly Balances of Outstanding Derivative Financial Instruments |
| | | | |
| Financial futures contracts: | |
Average notional value of contracts — short | | $ | 16,807,316 | |
For more information about the Trust’s investment risks regarding derivative financial instruments, refer to the Notes to Financial Statements.
|
| Fair Value Hierarchy as of Period End |
Various inputs are used in determining the fair value of investments and derivative financial instruments. For information about the Trust’s policy regarding valuation of investments and derivative financial instruments, refer to the Notes to Financial Statements.
The following tables summarize the Trust’s investments and derivative financial instruments categorized in the disclosure hierarchy:
| | | | | | | | | | | | | | | | |
| | | Level 1 | | | Level 2 | | | Level 3 | | | Total | |
Assets: | | | | | | | | | | | | | | | | |
| Investments: | | | | | | | | | | | | | | | | |
Long-Term Investments 1 | | | — | | | $ | 580,191,649 | | | | — | | | $ | 580,191,649 | |
Short-Term Securities | | $ | 5,848,983 | | | | — | | | | — | | | | 5,848,983 | |
| | | | |
Total | | $ | 5,848,983 | | | $ | 580,191,649 | | | | — | | | $ | 586,040,632 | |
| | | | |
1 See above Schedule of Investments for values in each state and political subdivision. | |
| | | Level 1 | | | Level 2 | | | Level 3 | | | Total | |
| Derivative Financial Instruments 1 | | | | | | | | | |
Assets: | | | | | | | | | | | | | | | | |
Interest rate contracts | | $ | 100,156 | | | | — | | | | — | | | $ | 100,156 | |
1 Derivative financial instruments are financial futures contracts, which are valued at the unrealized appreciation (depreciation) on the instrument. | |
See Notes to Financial Statements.
| | | | | | |
| | | | | | | |
| 48 | | SEMI-ANNUAL REPORT | | FEBRUARY 29, 2016 | | |
| | |
Schedule of Investments (concluded) | | BlackRock Municipal Income Trust II (BLE) |
The Trust may hold assets and/or liabilities in which the fair value approximates the carrying amount for financial statement purposes. As of period end, such assets and/or liabilities are categorized within the disclosure hierarchy as follows:
| | | | | | | | | | | | | | | | |
| | | Level 1 | | | Level 2 | | | Level 3 | | | Total | |
Assets: | | | | | | | | | | | | | | | | |
Cash pledged for financial futures contracts | | $ | 334,800 | | | | — | | | | — | | | $ | 334,800 | |
Liabilities: | | | | | | | | | | | | | | | | |
TOB Trust Certificates | | | — | | | $ | (71,925,067 | ) | | | — | | | | (71,925,067 | ) |
VMTP Shares | | | — | | | | (151,300,000 | ) | | | — | | | | (151,300,000 | ) |
| | | | |
Total | | $ | 334,800 | | | $ | (223,225,067 | ) | | | — | | | $ | (222,890,267 | ) |
| | | | |
During the six months ended February 29, 2016, there were no transfers between levels.
See Notes to Financial Statements.
| | | | | | |
| | | | | | | |
| | SEMI-ANNUAL REPORT | | FEBRUARY 29, 2016 | | 49 |
| | |
Schedule of Investments February 29, 2016 (Unaudited) | | BlackRock MuniHoldings Investment Quality Fund (MFL) (Percentages shown are based on Net Assets) |
| | | | | | | | |
| Municipal Bonds | | Par (000) | | | Value | |
Alabama — 3.5% | | | | | | | | |
City of Birmingham Alabama Special Care Facilities Financing Authority, RB, Children’s Hospital (AGC) (a): | | | | | | | | |
6.00%, 6/01/19 | | $ | 10,995 | | | $ | 12,737,927 | |
6.13%, 6/01/19 | | | 4,980 | | | | 5,789,288 | |
City of Selma Alabama IDB, RB, Gulf Opportunity Zone, International Paper Co. Project, Series A, 5.38%, 12/01/35 | | | 1,745 | | | | 1,938,137 | |
| | | | | | | | |
| | | | | | | | 20,465,352 | |
California — 24.6% | | | | | | | | |
California Educational Facilities Authority, RB, University of Southern California, Series A, 5.25%, 10/01/38 | | | 8,920 | | | | 9,906,374 | |
California Health Facilities Financing Authority, RB, Sutter Health, Series B, 6.00%, 8/15/42 | | | 5,370 | | | | 6,442,335 | |
California State University, Refunding RB, Systemwide, Series A, (AGM): | | | | | | | | |
5.00%, 5/01/17 (a) | | | 3,030 | | | | 3,190,499 | |
5.00%, 11/01/32 | | | 4,930 | | | | 5,140,264 | |
City & County of San Francisco California Airports Commission, Refunding ARB, AMT, Series A: | | | | | | | | |
2nd, 5.50%, 5/01/28 | | | 3,330 | | | | 4,029,966 | |
2nd, 5.25%, 5/01/33 | | | 2,600 | | | | 3,005,730 | |
5.00%, 5/01/44 | | | 3,430 | | | | 3,828,909 | |
City of Los Angeles California Department of Water & Power, RB, Power System, Sub-Series A-1, 5.25%, 7/01/38 | | | 5,000 | | | | 5,477,200 | |
City of Manteca California Financing Authority, RB, Manteca Sewer (AGC): | | | | | | | | |
5.63%, 12/01/33 | | | 2,450 | | | | 2,818,112 | |
5.75%, 12/01/36 | | | 3,285 | | | | 3,772,757 | |
City of San Jose California, Refunding ARB, Series A-1, AMT, 5.75%, 3/01/34 | | | 4,450 | | | | 5,239,964 | |
County of Sacramento California, ARB, Senior Series A (AGC), 5.50%, 7/01/41 | | | 5,600 | | | | 6,153,000 | |
Kern Community College District, GO, Safety, Repair & Improvement, Series C, 5.50%, 11/01/33 | | | 4,365 | | | | 5,439,445 | |
Los Angeles California Unified School District, GO, Election of 2002, Series D, 5.25%, 7/01/25 | | | 3,485 | | | | 4,004,892 | |
Los Angeles Community College District California, GO: | | | | | | | | |
Election of 2001, Series A (NPFGC), 5.00%, 8/01/17 (a) | | | 10,000 | | | | 10,643,500 | |
Election of 2008, Series C, 5.25%, 8/01/39 | | | 3,375 | | | | 3,929,074 | |
Los Angeles Municipal Improvement Corp., Refunding LRB, Real Property, Series B (AGC), 5.50%, 4/01/39 | | | 2,980 | | | | 3,345,706 | |
Redondo Beach Unified School District, GO, Election of 2008, Series E, 5.50%, 8/01/34 | | | 4,110 | | | | 4,857,814 | |
San Diego Public Facilities Financing Authority Water, Refunding RB, Series B (AGC), 5.38%, 8/01/34 | | | 4,690 | | | | 5,321,743 | |
State of California, GO, Various Purposes (AGC), 5.50%, 11/01/39 | | | 15,000 | | | | 17,199,300 | |
State of California Public Works Board, LRB, Various Capital Projects, Series I: | | | | | | | | |
5.50%, 11/01/30 | | | 4,500 | | | | 5,578,830 | |
5.50%, 11/01/31 | | | 2,615 | | | | 3,225,236 | |
5.50%, 11/01/33 | | | 2,000 | | | | 2,460,360 | |
State of California Public Works Board, RB, Department of Corrections & Rehabilitation, Series F, 5.25%, 9/01/33 | | | 2,240 | | | | 2,677,786 | |
Township of Washington California Health Care District, GO, Election of 2004, Series B, 5.50%, 8/01/40 | | | 1,685 | | | | 2,025,606 | |
University of California, Refunding RB, The Regents of Medical Center, Series J, 5.25%, 5/15/38 | | | 12,250 | | | | 14,529,235 | |
| | | | | | | | |
| | | | | | | | 144,243,637 | |
| | | | | | | | |
| Municipal Bonds | | Par (000) | | | Value | |
Colorado — 2.1% | | | | | | | | |
City & County of Denver Colorado Airport System, ARB, Series A, AMT: | | | | | | | | |
5.50%, 11/15/28 | | $ | 2,700 | | | $ | 3,200,013 | |
5.50%, 11/15/30 | | | 1,040 | | | | 1,225,692 | |
5.50%, 11/15/31 | | | 1,250 | | | | 1,466,463 | |
Colorado Health Facilities Authority, RB, Hospital, NCMC, Inc. Project, Series B (AGM), 6.00%, 5/15/26 | | | 5,925 | | | | 6,635,407 | |
| | | | | | | | |
| | | | | | | | 12,527,575 | |
Connecticut — 1.5% | | | | | | | | |
Connecticut State Health & Educational Facility Authority, Refunding RB, Quinnipiac University, Series L, 5.00%, 7/01/45 | | | 7,670 | | | | 8,624,992 | |
Florida — 9.1% | | | | | | | | |
City of Jacksonville Florida, Refunding RB, Series A, 5.25%, 10/01/33 | | | 1,250 | | | | 1,496,750 | |
City of Miami Beach Florida Parking Revenue, RB, 5.00%, 9/01/45 | | | 4,155 | | | | 4,727,310 | |
County of Broward Florida Airport System Revenue, ARB, Series A, AMT, 5.00%, 10/01/45 | | | 2,655 | | | | 2,965,476 | |
County of Hillsborough Florida Aviation Authority, Refunding ARB, Tampa International Airport, Series A, AMT: | | | | | | | | |
5.50%, 10/01/29 | | | 5,360 | | | | 6,319,011 | |
5.25%, 10/01/30 | | | 3,255 | | | | 3,766,002 | |
County of Lee Florida, Refunding ARB, Series A, AMT, 5.38%, 10/01/32 | | | 7,100 | | | | 7,985,370 | |
County of Lee Florida Housing Finance Authority, RB, S/F Housing, Multi-County Program, Series A-2, AMT (Ginnie Mae), 6.00%, 9/01/40 | | | 820 | | | | 844,165 | |
County of Manatee Florida Housing Finance Authority, RB, S/F Housing, Series A, AMT (Ginnie Mae, Fannie Mae & Freddie Mac), 5.90%, 9/01/40 | | | 350 | | | | 355,975 | |
County of Miami-Dade Florida, RB, Seaport: | | | | | | | | |
Series A, 5.38%, 10/01/33 | | | 3,145 | | | | 3,617,410 | |
Series B, AMT, 6.25%, 10/01/38 | | | 1,405 | | | | 1,736,454 | |
Series B, AMT, 6.00%, 10/01/42 | | | 1,885 | | | | 2,238,061 | |
County of Miami-Dade Florida, Refunding RB, Water & Sewer System, Series B, 5.25%, 10/01/29 | | | 2,870 | | | | 3,463,085 | |
County of Miami-Dade Florida Aviation, Refunding ARB, AMT, Series A: | | | | | | | | |
Miami International Airport (AGM), 5.50%, 10/01/41 | | | 3,500 | | | | 3,847,795 | |
5.00%, 10/01/31 | | | 5,465 | | | | 6,163,755 | |
Reedy Creek Improvement District, GO, Series A, 5.25%, 6/01/32 | | | 3,225 | | | | 3,824,140 | |
| | | | | | | | |
| | | | | | | | 53,350,759 | |
Hawaii — 1.9% | | | | | | | | |
State of Hawaii, Department of Transportation, COP, AMT: | | | | | | | | |
5.25%, 8/01/25 | | | 1,350 | | | | 1,609,713 | |
5.25%, 8/01/26 | | | 2,500 | | | | 2,970,825 | |
State of Hawaii, Department of Transportation, RB, Series A, AMT, 5.00%, 7/01/45 | | | 5,985 | | | | 6,669,385 | |
| | | | | | | | |
| | | | | | | | 11,249,923 | |
Illinois — 24.2% | | | | | | | | |
City of Chicago Illinois, GARB, O’Hare International Airport, 3rd Lien: | | | | | | | | |
Series A, 5.75%, 1/01/39 | | | 7,395 | | | | 8,619,390 | |
Series C, 6.50%, 1/01/41 | | | 16,800 | | | | 20,226,696 | |
City of Chicago Illinois Midway International Airport, Refunding ARB, 2nd Lien, Series A, AMT: | | | | | | | | |
5.50%, 1/01/30 | | | 6,500 | | | | 7,528,170 | |
5.50%, 1/01/32 | | | 6,275 | | | | 7,200,563 | |
See Notes to Financial Statements.
| | | | | | |
| | | | | | | |
| 50 | | SEMI-ANNUAL REPORT | | FEBRUARY 29, 2016 | | |
| | |
Schedule of Investments (continued) | | BlackRock MuniHoldings Investment Quality Fund (MFL) |
| | | | | | | | |
| Municipal Bonds | | Par (000) | | | Value | |
Illinois (continued) | | | | | | | | |
City of Chicago Illinois Midway International Airport, Refunding GARB, 2nd Lien, Series A, 5.00%, 1/01/41 | | $ | 8,020 | | | $ | 8,734,823 | |
City of Chicago Illinois Transit Authority, RB: | | | | | | | | |
Federal Transit Administration, Section 5309, Series A (AGC), 6.00%, 12/01/18 (a) | | | 6,315 | | | | 7,216,150 | |
Sales Tax Receipts, 5.25%, 12/01/36 | | | 1,960 | | | | 2,150,140 | |
Sales Tax Receipts, 5.25%, 12/01/40 | | | 10,960 | | | | 11,939,495 | |
City of Chicago Illinois Transit Authority, Refunding RB, Federal Transit Administration, Section 5309 (AGM), 5.00%, 6/01/28 | | | 7,735 | | | | 8,328,042 | |
County of Cook Illinois Community College District No. 508, GO, City College of Chicago: | | | | | | | | |
5.50%, 12/01/38 | | | 5,395 | | | | 6,220,975 | |
5.25%, 12/01/43 | | | 6,305 | | | | 7,075,723 | |
Illinois Finance Authority, RB, Carle Foundation, Series A, 6.00%, 8/15/41 | | | 4,000 | | | | 4,719,440 | |
Railsplitter Tobacco Settlement Authority, RB: | | | | | | | | |
5.50%, 6/01/23 | | | 4,365 | | | | 5,147,775 | |
6.00%, 6/01/28 | | | 1,245 | | | | 1,489,132 | |
State of Illinois, GO: | | | | | | | | |
5.25%, 2/01/31 | | | 2,700 | | | | 2,934,765 | |
5.25%, 2/01/32 | | | 5,525 | | | | 5,970,315 | |
5.50%, 7/01/33 | | | 7,820 | | | | 8,569,625 | |
5.50%, 7/01/38 | | | 1,295 | | | | 1,402,848 | |
5.00%, 2/01/39 | | | 5,000 | | | | 5,243,000 | |
State of Illinois Finance Authority, RB, University of Chicago, Series B, 5.50%, 7/01/18 (a) | | | 10,000 | | | | 11,109,000 | |
| | | | | | | | |
| | | | | 141,826,067 | |
Indiana — 3.5% | | | | | | | | |
Indiana Finance Authority, RB, Private Activity Bond, Ohio River Bridges, Series A, AMT, 5.00%, 7/01/40 | | | 1,240 | | | | 1,346,032 | |
Indiana Municipal Power Agency, Refunding RB, Series A: | | | | | | | | |
5.25%, 1/01/32 | | | 1,500 | | | | 1,755,225 | |
5.25%, 1/01/33 | | | 1,500 | | | | 1,751,970 | |
Indianapolis Local Public Improvement Bond Bank, Refunding RB, Waterworks Project, Series A (AGC), 5.50%, 1/01/38 | | | 14,105 | | | | 15,881,243 | |
| | | | | | | | |
| | | | | 20,734,470 | |
Louisiana — 0.9% | | | | | | | | |
City of New Orleans Louisiana Aviation Board, Refunding GARB, Restructuring (AGC): | | | | | | | | |
Series A-1, 6.00%, 1/01/23 | | | 500 | | | | 566,630 | |
Series A-2, 6.00%, 1/01/23 | | | 720 | | | | 812,491 | |
Tobacco Settlement Financing Corp., Refunding RB, Asset-Backed, Series A, 5.50%, 5/15/29 | | | 3,735 | | | | 4,101,927 | |
| | | | | | | | |
| | | | | 5,481,048 | |
Maryland — 0.2% | | | | | | | | |
Maryland Economic Development Corp., Refunding RB, University Of Maryland, College Park Projects, 5.00%, 6/01/35 (b) | | | 840 | | | | 973,896 | |
Massachusetts — 0.2% | | | | | | | | |
Massachusetts Educational Financing Authority, RB, Education Loan, Issue I, AMT, 5.00%, 1/01/27 | | | 1,000 | | | | 1,156,750 | |
Michigan — 3.6% | | | | | | | | |
City of Detroit Michigan Water Supply System, RB, 2nd Lien, Series B (AGM), 6.25%, 7/01/36 | | | 6,320 | | | | 7,111,137 | |
Hudsonville Public Schools, GO, School Building & Site, (Q-SBLF) 5.25%, 5/01/41 | | | 6,015 | | | | 6,954,904 | |
Royal Oak Hospital Finance Authority Michigan, Refunding RB, William Beaumont Hospital, Series V, 8.25%, 9/01/18 (a) | | | 5,780 | | | | 6,860,340 | |
| | | | | | | | |
| | | | | 20,926,381 | |
| | | | | | | | |
| Municipal Bonds | | Par (000) | | | Value | |
Minnesota — 1.9% | | | | | | | | |
City of Minneapolis Minnesota, Refunding RB, Fairview Health Services, Series B (AGC): | | | | | | | | |
6.50%, 11/15/18(a) | | $ | 1,525 | | | $ | 1,757,532 | |
6.50%, 11/15/38 | | | 8,375 | | | | 9,469,194 | |
| | | | | | | | |
| | | | | 11,226,726 | |
Mississippi — 2.9% | | | | | | | | |
Mississippi Development Bank, RB, Jackson Water & Sewer System Project (AGM): | | | | | | | | |
6.88%, 12/01/40 | | | 6,405 | | | | 8,578,537 | |
Special Obligation, 6.75%, 12/01/31 | | | 3,775 | | | | 5,022,449 | |
Special Obligation, 6.75%, 12/01/33 | | | 2,350 | | | | 3,126,557 | |
| | | | | | | | |
| | | | | 16,727,543 | |
Nevada — 5.3% | | | | | | | | |
County of Clark Nevada, ARB, Las Vegas-McCarran International Airport, Series A (AGM), 5.25%, 7/01/39 | | | 11,175 | | | | 12,536,674 | |
County of Clark Nevada, GO, Limited Tax, 5.00%, 6/01/38 | | | 11,245 | | | | 12,151,684 | |
County of Clark Nevada Water Reclamation District, GO, Series A, 5.25%, 7/01/34 | | | 5,850 | | | | 6,606,756 | |
| | | | | | | | |
| | | | | 31,295,114 | |
New Jersey — 7.2% | | | | | | | | |
New Jersey EDA, RB: | | | | | | | | |
Private Activity Bond, The Goethals Bridge Replacement Project, AMT, 5.38%, 1/01/43 | | | 7,000 | | | | 7,781,060 | |
School Facilities Construction (AGC), 6.00%, 12/15/18 (a) | | | 4,280 | | | | 4,904,366 | |
School Facilities Construction (AGC), 6.00%, 12/15/34 | | | 70 | | | | 79,089 | |
The Goethals Bridge Replacement Project, Private Activity Bond, AMT (AGM), 5.00%, 1/01/31 | | | 2,425 | | | | 2,715,418 | |
New Jersey Health Care Facilities Financing Authority, RB, Virtua Health, Series A (AGC), 5.50%, 7/01/38 | | | 6,500 | | | | 7,298,265 | |
New Jersey Higher Education Student Assistance Authority, Refunding RB, Series 1, AMT, 5.75%, 12/01/28 | | | 4,065 | | | | 4,561,784 | |
New Jersey Transportation Trust Fund Authority, RB, Transportation System: | | | | | | | | |
Series A, 5.50%, 6/15/41 | | | 5,410 | | | | 5,836,524 | |
Series AA, 5.50%, 6/15/39 | | | 8,175 | | | | 8,959,882 | |
| | | | | | | | |
| | | | | 42,136,388 | |
New York — 7.3% | | | | | | | | |
City of New York New York Municipal Water Finance Authority, Refunding RB: | | | | | | | | |
2nd General Resolution, Fiscal 2009, Series EE, 5.25%, 6/15/40 | | | 7,500 | | | | 8,451,750 | |
Water & Sewer System, 2nd General Resolution, Series EE, 5.38%, 6/15/43 | | | 3,475 | | | | 4,070,407 | |
Water & Sewer System, Series FF-2, 5.50%, 6/15/40 | | | 4,000 | | | | 4,541,160 | |
City of New York New York Transitional Finance Authority, BARB, Fiscal 2009, Series S-4 (AGC), 5.50%, 1/15/29 | | | 4,000 | | | | 4,525,840 | |
Metropolitan Transportation Authority, RB: | | | | | | | | |
Series A, 5.25%, 11/15/38 | | | 4,000 | | | | 4,746,600 | |
Series A-1, 5.25%, 11/15/39 | | | 4,490 | | | | 5,275,211 | |
Port Authority of New York & New Jersey, Refunding ARB, Consolidated, 166th Series, 5.25%, 7/15/36 | | | 10,000 | | | | 11,507,500 | |
| | | | | | | | |
| | | | | 43,118,468 | |
See Notes to Financial Statements.
| | | | | | |
| | | | | | | |
| | SEMI-ANNUAL REPORT | | FEBRUARY 29, 2016 | | 51 |
| | |
Schedule of Investments (continued) | | BlackRock MuniHoldings Investment Quality Fund (MFL) |
| | | | | | | | |
| Municipal Bonds | | Par (000) | | | Value | |
Ohio — 1.5% | | | | | | | | |
State of Ohio Turnpike Commission, RB, Junior Lien, Infrastructure Projects, Series A-1: | | | | | | | | |
5.25%, 2/15/31 | | $ | 5,145 | | | $ | 6,134,332 | |
5.25%, 2/15/32 | | | 2,250 | | | | 2,668,320 | |
| | | | | | | | |
| | | | | 8,802,652 | |
Pennsylvania — 2.9% | | | | | | | | |
Pennsylvania Turnpike Commission, RB: | | | | | | | | |
Series B, 5.00%, 12/01/45 | | | 7,605 | | | | 8,574,029 | |
Sub-Series A, 6.00%, 12/01/16 (a) | | | 4,945 | | | | 5,154,816 | |
Township of Bristol Pennsylvania School District, GO, 5.25%, 6/01/37 | | | 3,000 | | | | 3,449,700 | |
| | | | | | | | |
| | | | | 17,178,545 | |
South Carolina — 7.3% | | | | | | | | |
County of Charleston South Carolina, RB, Special Source, 5.25%, 12/01/38 | | | 6,735 | | | | 7,960,231 | |
County of Charleston South Carolina Airport District, ARB, Series A, AMT: | | | | | | | | |
5.25%, 7/01/25 | | | 4,490 | | | | 5,333,043 | |
5.50%, 7/01/38 | | | 3,000 | | | | 3,424,830 | |
6.00%, 7/01/38 | | | 5,270 | | | | 6,190,458 | |
5.50%, 7/01/41 | | | 4,170 | | | | 4,743,041 | |
South Carolina Ports Authority, RB, AMT, 5.25%, 7/01/50 | | | 3,445 | | | | 3,850,270 | |
State of South Carolina Public Service Authority, Refunding RB: | | | | | | | | |
Obligations, Series C, 5.00%, 12/01/46 | | | 4,530 | | | | 5,089,274 | |
Series E, 5.25%, 12/01/55 | | | 5,500 | | | | 6,250,365 | |
| | | | | | | | |
| | | | | 42,841,512 | |
Tennessee — 0.4% | | | | | | | | |
Metropolitan Nashville Airport Authority, RB, AMT, Series B, 5.00%, 7/01/43 | | | 2,000 | | | | 2,254,120 | |
Texas — 16.6% | | | | | | | | |
City of Beaumont Texas, GO, Certificates of Obligation, 5.25%, 3/01/37 | | | 4,190 | | | | 4,888,180 | |
City of Houston Texas Utility System, Refunding RB, Combined 1st Lien, Series A (AGC): | | | | | | | | |
6.00%, 11/15/35 | | | 12,700 | | | | 14,777,720 | |
6.00%, 11/15/36 | | | 9,435 | | | | 10,978,566 | |
5.38%, 11/15/38 | | | 5,000 | | | | 5,604,000 | |
County of Tarrant Texas Cultural Education Facilities Finance Corp., Refunding RB, Christus Health, Series A (AGC): | | | | | | | | |
6.50%, 1/01/19 (a) | | | 320 | | | | 369,722 | |
6.50%, 7/01/37 | | | 1,450 | | | | 1,633,875 | |
Dallas Area Rapid Transit, Refunding RB: | | | | | | | | |
Senior Lien, 5.25%, 12/01/18 (a) | | | 5,215 | | | | 5,859,105 | |
Senior Lien, 5.25%, 12/01/38 | | | 3,895 | | | | 4,322,087 | |
Series A, 5.00%, 12/01/48 | | | 4,455 | | | | 5,203,529 | |
Dallas-Fort Worth International Airport, ARB, Joint Improvement, AMT: | | | | | | | | |
Series A, 5.00%, 11/01/38 | | | 5,580 | | | | 6,124,720 | |
Series H, 5.00%, 11/01/37 | | | 4,575 | | | | 5,018,775 | |
Lower Colorado River Authority, Refunding RB, 5.50%, 5/15/33 | | | 3,735 | | | | 4,423,995 | |
North Texas Tollway Authority, Refunding RB, 1st Tier: | | | | | | | | |
(AGM), 6.00%, 1/01/43 | | | 5,555 | | | | 6,569,176 | |
Series K-1 (AGC), 5.75%, 1/01/38 | | | 12,150 | | | | 13,576,045 | |
Red River Education Financing Corp., RB, Texas Christian University Project, 5.25%, 3/15/38 | | | 7,170 | | | | 8,275,972 | |
| | | | | | | | |
| | | | | 97,625,467 | |
Virginia — 1.2% | | | | | | | | |
City of Lexington Virginia IDA, RB, Washington & Lee University, 5.00%, 1/01/43 | | | 1,750 | | | | 1,987,265 | |
| | | | | | | | |
| Municipal Bonds | | Par (000) | | | Value | |
Virginia (continued) | | | | | | | | |
Virginia Public School Authority, RB, Fluvanna County School Financing, 6.50%, 12/01/18 (a) | | $ | 4,300 | | | $ | 4,980,045 | |
| | | | | | | | |
| | | | | 6,967,310 | |
Washington — 1.5% | | | | | | | | |
City of Seattle Washington Municipal Light & Power, Refunding RB, Series A, 5.25%, 2/01/36 | | | 4,200 | | | | 4,881,156 | |
State of Washington, GO, Various Purposes, Series B, 5.25%, 2/01/36 | | | 3,290 | | | | 3,848,938 | |
| | | | | | | | |
| | | | | 8,730,094 | |
| Total Municipal Bonds – 131.3% | | | | 770,464,789 | |
| | | | | | | | |
| | | | | | | | | |
| | |
Municipal Bonds Transferred to
Tender Option Bond Trusts (c) | | | | | | |
California — 0.5% | | | | | | | | |
Los Angeles Unified School District California, GO, Series I, 5.00%, 1/01/34 | | | 2,400 | | | | 2,700,144 | |
District of Columbia — 0.6% | | | | | | | | |
District of Columbia Water & Sewer Authority, Refunding RB, Senior Lien, Series A, 6.00%, 10/01/18 (a)(d) | | | 3,378 | | | | 3,834,536 | |
Florida — 2.0% | | | | | | | | |
County of Hillsborough Florida Aviation Authority, ARB, Tampa International Airport, Series A, AMT (AGC), 5.50%, 10/01/38 | | | 10,657 | | | | 11,670,312 | |
Indiana — 1.8% | | | | | | | | |
Indiana Health & Educational Facilities Financing Authority, Refunding RB, St. Francis, Series E (AGM), 5.25%, 5/15/18 (a) | | | 9,850 | | | | 10,817,467 | |
Kentucky — 0.1% | | | | | | | | |
Kentucky State Property & Building Commission, Refunding RB, Project No. 93 (AGC), 5.25%, 2/01/27 | | | 404 | | | | 452,594 | |
Nevada — 2.5% | | | | | | | | |
County of Clark Nevada Water Reclamation District, GO: | | | | | | | | |
Limited Tax, 6.00%, 7/01/18 (a) | | | 8,000 | | | | 8,983,840 | |
Series B, 5.50%, 7/01/29 | | | 5,008 | | | | 5,727,354 | |
| | | | | | | | |
| | | | | 14,711,194 | |
New Jersey — 3.3% | | | | | | | | |
New Jersey Housing & Mortgage Finance Agency, RB, S/F Housing, Series CC, 5.25%, 10/01/29 | | | 7,402 | | | | 7,858,067 | |
New Jersey Transportation Trust Fund Authority, RB, Transportation System: | | | | | | | | |
Series A (AMBAC), 5.00%, 12/15/32 | | | 8,000 | | | | 8,401,040 | |
Series B, 5.25%, 6/15/36 (d) | | | 2,961 | | | | 3,145,661 | |
| | | | | | | | |
| | | | | 19,404,768 | |
New York — 10.8% | | | | | | | | |
City of New York New York Municipal Water Finance Authority, Refunding RB, Water & Sewer System, 2nd General Resolution, Series FF-2, 5.50%, 6/15/40 | | | 4,994 | | | | 5,669,989 | |
City of New York New York Transitional Finance Authority, BARB, Fiscal 2009, Series S-3, 5.25%, 1/15/39 | | | 5,619 | | | | 6,235,712 | |
Hudson Yards Infrastructure Corp., RB, Fiscal 2012, Series A, 5.75%, 2/15/47 (d) | | | 9,249 | | | | 10,749,490 | |
New York Liberty Development Corp., RB, 1 World Trade Center Port Authority Consolidated Bonds, 5.25%, 12/15/43 | | | 13,950 | | | | 16,153,291 | |
See Notes to Financial Statements.
| | | | | | |
| | | | | | | |
| 52 | | SEMI-ANNUAL REPORT | | FEBRUARY 29, 2016 | | |
| | |
Schedule of Investments (continued) | | BlackRock MuniHoldings Investment Quality Fund (MFL) |
| | | | | | | | |
Municipal Bonds Transferred to
Tender Option Bond Trusts (c) | | Par (000) | | | Value | |
New York (continued) | | | | | | | | |
New York Liberty Development Corp., Refunding RB, 4 World Trade Center Project, 5.75%, 11/15/51 (d) | | $ | 8,200 | | | $ | 9,553,324 | |
New York State Dormitory Authority, ERB, Personal Income Tax, Series B, 5.25%, 3/15/38 | | | 13,500 | | | | 15,152,940 | |
| | | | | | | | |
| | | | | 63,514,746 | |
Texas — 4.2% | | | | | | | | |
City of San Antonio Texas Public Service Board, Refunding RB, Series A, 5.25%, 2/01/31 (d) | | | 12,027 | | | | 13,417,131 | |
North Texas Tollway Authority, RB, Special Projects System, Series A, 5.50%, 9/01/41 | | | 9,640 | | | | 11,396,215 | |
| | | | | | | | |
| | | | | 24,813,346 | |
Utah — 1.2% | | | | | | | | |
City of Riverton Utah, RB, IHC Health Services, Inc., 5.00%, 8/15/41 | | | 6,373 | | | | 6,947,002 | |
Total Municipal Bonds Transferred to Tender Option Bond Trusts — 27.0% | | | | 158,866,109 | |
Total Long-Term Investments (Cost — $835,289,392) — 158.3% | | | | 929,330,898 | |
| | | | | | | | |
| Short-Term Securities | |
Shares | | | Value | |
BlackRock Liquidity Funds, MuniCash, 0.02% (e)(f) | | | 5,266,008 | | | $ | 5,266,008 | |
Total Short-Term Securities
(Cost — $5,266,008) — 0.9% | | | | 5,266,008 | |
| Total Investments (Cost — $840,555,400) — 159.2% | | | | 934,596,906 | |
| Other Assets Less Liabilities — 1.4% | | | | 7,821,358 | |
Liability for TOB Trust Certificates, Including Interest Expense and Fees Payable — (13.8)% | | | | (80,932,496 | ) |
| VRDP Shares, at Liquidation Value — (46.8)% | | | | | | | (274,600,000 | ) |
| | | | | | | | |
| Net Assets Applicable to Common Shares — 100.0% | | | $ | 586,885,768 | |
| | | | | | | | |
|
| Notes to Schedule of investments |
| (a) | | U.S. Government securities, held in escrow, are used to pay interest on this security, as well as to retire the bond in full at the date indicated, typically at a premium to par. |
| (b) | | When-issued security. |
| (c) | | Represent bonds transferred to a TOB Trust in exchange of cash and residual certificates received by the Trust. These bonds serve as collateral in a secured borrowing. See Note 4 of the Notes to Financial Statements for details. |
| (d) | | All or a portion of security is subject to a recourse agreement. The aggregate maximum potential amount the Trust could ultimately be required to pay under the agreements, which expire bewteen October 1, 2016 to November 15, 2019, is $22,519,127. See Note 4 of the Notes to Financial Statements for details. |
| (e) | | During the period ended February 29, 2016, investments in issuers considered to be affiliates of the Trust for purposes of Section 2(a)(3) of the 1940 Act, were as follows: |
| | | | | | | | | | | | | | | | |
| Affiliate | | Shares Held at August 31, 2015 | | | Net
Activity | | | Shares Held at February 29, 2016 | | | Income | |
BlackRock Liquidity Funds, MuniCash | | | — | | | | 5,266,008 | | | | 5,266,008 | | | $ | 40 | |
FFI Institutional Tax-Exempt Fund | | | 3,674,880 | | | | (3,674,880 | ) | | | — | | | | 392 | |
Total | | | | | | | | | | | 5,266,008 | | | $ | 432 | |
| | | | | | | | | | | | | | | | |
| (f) | | Current yield as of period end. |
|
| Derivative Financial Instruments Outstanding as of Period End |
| | | | | | | | | | | | | | | | |
| Financial Futures Contracts | | | | | | | | |
Contracts
Short | | | Issue | | Expiration | | Notional
Value | | | Unrealized
Appreciation | | | |
| | (119 | ) | | 5-Year U.S. Treasury Note | | June 2016 | | $ | 14,397,141 | | | $ | 9,240 | | | |
| | (139 | ) | | 10-Year U.S. Treasury Note | | June 2016 | | $ | 18,141,672 | | | | 10,818 | | | |
| | (49 | ) | | Long U.S. Treasury Bond | | June 2016 | | $ | 8,062,031 | | | | 47,122 | | | |
| | (8 | ) | | Ultra U.S. Treasury Bond | | June 2016 | | $ | 1,385,250 | | | | 5,487 | | | |
| Total | | | $ | 72,667 | | | |
| | | | | | | | | | | | | |
|
| Derivative Financial Instruments Categorized by Risk Exposure |
As of period end, the fair values of derivative financial instruments located in the Statements of Assets and Liabilities were as follows:
| | | | | | | | | | | | | | | | | | | | | | |
| Assets — Derivative Financial Instruments | | | | Commodity Contracts | | Credit Contracts | | Equity Contracts | | Foreign Currency Exchange Contracts | | Interest
Rate
Contracts | | | Other Contracts | | | Total | |
Financial futures contracts.. | | Net unrealized appreciation1 | | — | | — | | — | | — | | $ | 72,667 | | | | — | | | $ | 72,667 | |
1 Includes cumulative appreciation (depreciation) on financial futures contracts, if any, as reported in the Schedule of Investments. Only current day’s variation margin is reported within the Statements of Assets and Liabilities. | |
See Notes to Financial Statements.
| | | | | | |
| | | | | | | |
| | SEMI-ANNUAL REPORT | | FEBRUARY 29, 2016 | | 53 |
| | |
Schedule of Investments (concluded) | | BlackRock MuniHoldings Investment Quality Fund (MFL) |
| | | | | | | | | | | | | | | | | | | | | | | | | | | | | | |
| For the six months ended February 29, 2016, the effect of derivative financial instruments in the Statements of Operations was as follows: | | | | | |
| Net Realized Gain (Loss) from: | | | | Commodity Contracts | | | Credit Contracts | | | Equity Contracts | | | Foreign Currency Exchange Contracts | | | Interest Rate Contracts | | | Other Contracts | | | Total | |
Financial futures contracts | | | | | — | | | | — | | | | — | | | | — | | | $ | (1,447,375 | ) | | | — | | | $ | (1,447,375 | ) |
| | | | | | |
Net Change in Unrealized
Appreciation (Depreciation) on: | | | | | | | | | | | | | | | | | | | | | | | | | |
Financial futures contracts | | | | | — | | | | — | | | | — | | | | — | | | $ | (141,211 | ) | | | — | | | $ | (141,211 | ) |
|
| Average Quarterly Balances of Outstanding Derivative Financial Instruments |
| | |
| Financial futures contracts: | | |
Average notional value of contracts — short | | $29,104,289 |
For more information about the Trust’s investment risks regarding derivative financial instruments, refer to the Notes to Financial Statements.
|
| Fair Value Hierarchy as of Period End |
Various inputs are used in determining the fair value of investments and derivative financial instruments. For information about the Trust’s policy regarding valuation of investments and derivative financial instruments, refer to the Notes to Financial Statements.
The following tables summarize the Trust’s investments and derivative financial instruments categorized in the disclosure hierarchy:
| | | | | | | | | | | | | | | | |
| | | Level 1 | | | Level 2 | | | Level 3 | | | Total | |
Assets: | | | | | | | | | | | | | | | | |
| Investments: | | | | | | | | | | | | | | | | |
Long-Term Investments 1 | | | — | | | $ | 929,330,898 | | | | — | | | $ | 929,330,898 | |
Short-Term Securities | | $ | 5,266,008 | | | | — | | | | — | | | | 5,266,008 | |
| | | | | | | | | | | | | | | | |
Total | | $ | 5,266,008 | | | $ | 929,330,898 | | | | — | | | $ | 934,596,906 | |
| | | | | | | | | | | | | | | | |
1 See above Schedule of Investments for values in each state or political subdivision. | | | | | | | | | | | | | | | | |
| | | Level 1 | | | Level 2 | | | Level 3 | | | Total | |
| Derivative Financial Instruments 1 | | | | | | | | | | | | | | | | |
Assets: | | | | | | | | | | | | | | | | |
Interest rate contracts | | $ | 72,667 | | | | — | | | | — | | | $ | 72,667 | |
1 Derivative financial instruments are financial futures contracts, which are valued at the unrealized appreciation (depreciation) on the instrument. | |
The Trust may hold assets and/or liabilities in which the fair value approximates the carrying amount for financial statement purposes. As of period end, such assets and/or liabilities are categorized within the disclosure hierarchy as follows:
| | | | | | | | | | | | | | |
| | | Level 1 | | | Level 2 | | | Level 3 | | Total | |
Assets: | | | | | | | | | | | | | | |
Cash pledged for Financial Future Contracts | | $ | 529,150 | | | | — | | | — | | $ | 529,150 | |
Liabilities: | | | | | | | | | | | | | | |
TOB Trust Certificates | | | — | | | $ | (80,917,802 | ) | | — | | | (80,917,802 | ) |
VRDP Shares | | | — | | | | (274,600,000 | ) | | — | | | (274,600,000 | ) |
| | | | | | | | | | | | | | |
Total | | $ | 529,150 | | | $ | (355,517,802 | ) | | — | | $ | (354,988,652 | ) |
| | | | | | | | | | | | | | |
During the six months ended February 29, 2016, there were no transfers between levels.
See Notes to Financial Statements.
| | | | | | |
| | | | | | | |
| 54 | | SEMI-ANNUAL REPORT | | FEBRUARY 29, 2016 | | |
| | |
Schedule of Investments February 29, 2016 (Unaudited) | | BlackRock MuniVest Fund, Inc. (MVF) (Percentages shown are based on Net Assets) |
| | | | | | | | |
| Municipal Bonds | | Par (000) | | | Value | |
Alabama — 1.9% | |
City of Selma Alabama IDB, RB, Gulf Opportunity Zone, International Paper Co. Project, Series A: | | | | | | | | |
5.80%, 5/01/34 | | $ | 1,850 | | | $ | 2,101,378 | |
5.38%, 12/01/35 | | | 1,000 | | | | 1,110,680 | |
State of Alabama Docks Department, Refunding RB, 6.00%, 10/01/40 | | | 7,610 | | | | 8,944,566 | |
| | | | | | | | |
| | | | | | | | 12,156,624 | |
Alaska — 0.7% | |
City of Anchorage Alaska Electric Revenue, Refunding RB, Series A, 5.00%, 12/01/41 | | | 3,000 | | | | 3,402,000 | |
Northern Tobacco Securitization Corp., Refunding RB, Tobacco Settlement, Asset-Backed, Series A, 5.00%, 6/01/46 | | | 1,250 | | | | 1,062,437 | |
| | | | | | | | |
| | | | | | | | 4,464,437 | |
Arizona — 3.4% | |
City of Phoenix Arizona Civic Improvement Corp., Refunding RB, Junior Lien, Series A, 5.00%, 7/01/40 | | | 2,000 | | | | 2,241,500 | |
City of Phoenix Arizona IDA, RB, Candeo School, Inc. Project: | | | | | | | | |
6.63%, 7/01/33 | | | 2,245 | | | | 2,539,072 | |
6.88%, 7/01/44 | | | 3,440 | | | | 3,928,824 | |
City of Phoenix Arizona IDA, Refunding RB (a): | | | | | | | | |
Basis Schools, Inc. Projects, Series A, 5.00%, 7/01/35 | | | 600 | | | | 630,108 | |
Basis Schools, Inc. Projects, Series A, 5.00%, 7/01/45 | | | 760 | | | | 782,823 | |
Legacy Traditional School Projects, 5.00%, 7/01/45 | | | 700 | | | | 707,763 | |
County of Maricopa Arizona IDA, RB, Arizona Charter Schools Project, Series A, 6.75%, 7/01/29 | | | 1,150 | | | | 1,108,807 | |
County of Maricopa Arizona Pollution Control Corp., Refunding RB, Southern California Edison Co., Series A, 5.00%, 6/01/35 | | | 3,300 | | | | 3,707,220 | |
Salt Verde Financial Corp., RB, Senior, 5.00%, 12/01/37 | | | 5,725 | | | | 6,763,687 | |
| | | | | | | | |
| | | | | | | | 22,409,804 | |
California — 6.4% | |
California Health Facilities Financing Authority, RB: | | | | | | | | |
St. Joseph Health System, Series A, 5.75%, 7/01/39 | | | 5,000 | | | | 5,715,800 | |
Sutter Health, Series B, 6.00%, 8/15/42 | | | 5,600 | | | | 6,718,264 | |
California Health Facilities Financing Authority, Refunding RB, Dignity Health, Series A, 6.00%, 7/01/34 | | | 1,055 | | | | 1,213,493 | |
City of Los Angeles California Department of Airports, Refunding ARB, Los Angeles International Airport, Series A, 5.25%, 5/15/39 | | | 1,200 | | | | 1,347,516 | |
Los Angeles Community College District California, GO, Refunding, Election of 2008, Series A, 6.00%, 8/01/19 (b) | | | 9,585 | | | | 11,277,232 | |
Oakland Unified School District/Alameda County, GO, Series A, 5.00%, 8/01/40 | | | 1,000 | | | | 1,121,190 | |
Poway Unified School District, GO, Refunding, CAB, School Facilities Improvement District No. 2007-1, Election of 2008, Series B, 0.00%, 8/01/46 (c) | | | 10,000 | | | | 2,950,800 | |
State of California, GO, Various Purposes, 6.50%, 4/01/33 | | | 9,675 | | | | 11,289,467 | |
| | | | | | | | |
| | | | | | | | 41,633,762 | |
Colorado — 1.8% | |
Colorado Health Facilities Authority, RB, Catholic Health Initiatives, Series D, 6.25%, 10/01/33 | | | 2,500 | | | | 2,805,475 | |
| | | | | | | | |
| Municipal Bonds | | Par (000) | | | Value | |
Colorado (continued) | |
Colorado Health Facilities Authority, Refunding RB, Evangelical Lutheran Good Samaritan Society Project, 5.00%, 6/01/45 | | $ | 7,000 | | | $ | 7,644,210 | |
Copperleaf Metropolitan District No 2, GO, Refunding, 5.75%, 12/01/45 | | | 1,000 | | | | 1,050,070 | |
Regional Transportation District, COP, Refunding, Series A, 5.38%, 6/01/31 | | | 385 | | | | 442,326 | |
| | | | | | | | |
| | | | | | | | 11,942,081 | |
Delaware — 0.4% | |
County of Sussex Delaware, RB, NRG Energy, Inc., Indian River Power LLC Project, 6.00%, 10/01/40 | | | 2,500 | | | | 2,710,350 | |
District of Columbia — 0.2% | |
Metropolitan Washington Airports Authority, Refunding RB, Dulles Toll Road, 1st Senior Lien, Series A: | | | | | | | | |
5.00%, 10/01/39 | | | 415 | | | | 460,567 | |
5.25%, 10/01/44 | | | 650 | | | | 725,485 | |
| | | | | | | | |
| | | | | | | | 1,186,052 | |
Florida — 8.3% | |
City of Jacksonville Florida, Refunding RB, Brooks Rehabilitation Project, 4.00%, 11/01/40 | | | 1,770 | | | | 1,795,877 | |
County of Miami-Dade Florida, GO, Building Better Communities Program: | | | | | | | | |
Series B, 6.38%, 7/01/28 | | | 4,630 | | | | 5,232,734 | |
Series B-1, 5.63%, 7/01/38 | | | 5,000 | | | | 5,514,200 | |
County of Miami-Dade Florida, Refunding RB, Transit System Sales Surtax, 5.00%, 7/01/42 | | | 3,750 | | | | 4,257,525 | |
County of Miami-Dade Florida Aviation, Refunding ARB, Miami International Airport: | | | | | | | | |
Series A, AMT (AGC), 5.00%, 10/01/40 | | | 10,000 | | | | 10,484,800 | |
Series A-1, 5.38%, 10/01/41 | | | 10,290 | | | | 11,731,320 | |
County of Miami-Dade Florida Educational Facilities Authority, Refunding RB, University of Miami, Series A, 5.00%, 4/01/45 | | | 4,625 | | | | 5,226,296 | |
County of Miami-Dade Florida Expressway Authority, RB, Toll System, Series A (AGM), 5.00%, 7/01/35 | | | 8,900 | | | | 10,002,265 | |
| | | | | | | | |
| | | | | | | | 54,245,017 | |
Georgia — 1.4% | |
City of Atlanta Georgia Department of Aviation, Refunding GARB, Series B, AMT, 5.00%, 1/01/29 | | | 1,070 | | | | 1,182,425 | |
County of DeKalb Georgia Hospital Authority, Refunding RB, DeKalb Medical Center, Inc. Project, 6.13%, 9/01/40 | | | 3,570 | | | | 3,911,256 | |
DeKalb Private Hospital Authority, Refunding RB, Children’s Healthcare, 5.25%, 11/15/39 | | | 3,335 | | | | 3,737,235 | |
| | | | | | | | |
| | | | | | | | 8,830,916 | |
Hawaii — 0.9% | |
State of Hawaii Harbor System, RB, Series A, 5.50%, 7/01/35 | | | 5,000 | | | | 5,698,050 | |
Illinois — 9.9% | |
City of Chicago Illinois, Refunding RB, Sales Tax Receipts, Series A, 5.00%, 1/01/41 | | | 4,640 | | | | 4,842,397 | |
City of Chicago Illinois Transit Authority, RB, Sales Tax Receipts, 5.25%, 12/01/36 | | | 2,110 | | | | 2,314,691 | |
City of Chicago Illinois Wastewater Transmission, Refunding RB, 2nd Lien, Series C, 5.00%, 1/01/39 | | | 1,000 | | | | 1,082,300 | |
City of Chicago Illinois Waterworks, Refunding RB, 2nd Lien (AGM), 5.25%, 11/01/33 | | | 1,330 | | | | 1,399,240 | |
County of Cook Illinois Community College District No. 508, GO, University & College Improvements, 5.25%, 12/01/31 | | | 5,000 | | | | 5,600,350 | |
See Notes to Financial Statements.
| | | | | | |
| | | | | | | |
| | SEMI-ANNUAL REPORT | | FEBRUARY 29, 2016 | | 55 |
| | |
Schedule of Investments (continued) | | BlackRock MuniVest Fund, Inc. (MVF) |
| | | | | | | | |
| Municipal Bonds | | Par (000) | | | Value | |
Illinois (continued) | |
Illinois Finance Authority, RB: | | | | | | | | |
Advocate Health Care Network, Series D, 6.50%, 11/01/18 (b) | | $ | 9,700 | | | $ | 11,174,594 | |
Disposal Waste Management, Inc., Series A, AMT, 5.05%, 8/01/29 | | | 1,000 | | | | 1,013,990 | |
Memorial Health System, Series A, 5.25%, 7/01/44 | | | 1,785 | | | | 1,967,338 | |
Illinois Finance Authority, Refunding RB, Series A: | | | | | | | | |
Northwestern Memorial Hospital, 6.00%, 8/15/39 | | | 9,000 | | | | 10,423,710 | |
OSF Healthcare System, 6.00%, 5/15/39 | | | 4,990 | | | | 5,752,821 | |
Railsplitter Tobacco Settlement Authority, RB, 6.00%, 6/01/28 | | | 2,645 | | | | 3,163,658 | |
Regional Transportation Authority, RB: | | | | | | | | |
Series A (AMBAC), 7.20%, 11/01/20 | | | 1,930 | | | | 2,233,029 | |
Series C (NPFGC), 7.75%, 6/01/20 | | | 3,455 | | | | 3,970,624 | |
Village of Hodgkins Illinois, RB, Metropolitan Biosolids Management LLC Project, AMT, 6.00%, 11/01/23 | | | 10,000 | | | | 10,018,800 | |
| | | | | | | | |
| | | | | | | | 64,957,542 | |
Indiana — 1.4% | |
City of Valparaiso Indiana, RB, Exempt Facilities, Pratt Paper LLC Project, AMT, 6.75%, 1/01/34 | | | 2,250 | | | | 2,745,675 | |
Indiana Finance Authority, RB, Private Activity Bond, Ohio River Bridges, Series A, AMT, 5.00%, 7/01/40 | | | 2,640 | | | | 2,865,746 | |
Indiana Finance Authority, Refunding RB, Deaconess Health System, Series A, 5.00%, 3/01/39 | | | 3,000 | | | | 3,417,090 | |
| | | | | | | | |
| | | | | | | | 9,028,511 | |
Iowa — 1.4% | |
Iowa Finance Authority, Refunding RB, Midwestern Disaster Area, Iowa Fertilizer Co. Project, 5.25%, 12/01/25 | | | 4,500 | | | | 4,906,080 | |
Iowa Tobacco Settlement Authority, Refunding RB, Asset-Backed: | | | | | | | | |
CAB, Series B, 5.60%, 6/01/34 | | | 1,500 | | | | 1,500,570 | |
Series C, 5.63%, 6/01/46 | | | 2,500 | | | | 2,490,025 | |
| | | | | | | | |
| | | | | | | | 8,896,675 | |
Kansas — 0.6% | |
Wyandotte County-Kansas City Unified Government Utility System, RB, Series A, 5.00%, 9/01/40 | | | 3,700 | | | | 4,212,857 | |
Kentucky — 2.7% | |
County of Owen Kentucky, RB, Kentucky American Water Co. Project, Series B, 5.63%, 9/01/39 | | | 1,000 | | | | 1,114,220 | |
Kentucky Economic Development Finance Authority, Refunding RB, Hospital Facilities, St. Elizabeth Medical Center, Inc., Series A, 5.50%, 5/01/39 | | | 8,000 | | | | 8,934,880 | |
Lexington-Fayette Urban County Airport Board, Refunding GARB, Series A, 5.00%, 7/01/27 | | | 7,000 | | | | 7,869,190 | |
| | | | | | | | |
| | | | | | | | 17,918,290 | |
Louisiana — 3.2% | |
Louisiana Local Government Environmental Facilities & Community Development Authority, RB, Westlake Chemical Corp. Project, Series A-1, 6.50%, 11/01/35 | | | 2,615 | | | | 3,059,707 | |
Parish of St. Charles Louisiana, RB, Valero Energy Corp., 4.00%, 12/01/40 (d) | | | 2,210 | | | | 2,376,921 | |
Tobacco Settlement Financing Corp., Refunding RB, Asset-Backed, Series A: | | | | | | | | |
5.25%, 5/15/31 | | | 3,420 | | | | 3,827,904 | |
5.25%, 5/15/32 | | | 4,375 | | | | 4,953,200 | |
5.25%, 5/15/33 | | | 4,750 | | | | 5,290,075 | |
5.25%, 5/15/35 | | | 1,500 | | | | 1,676,265 | |
| | | | | | | | |
| | | | | | | | 21,184,072 | |
| | | | | | | | |
| Municipal Bonds | | Par (000) | | | Value | |
Maine — 1.0% | |
Maine Health & Higher Educational Facilities Authority, RB, Series A, 5.00%, 7/01/39 | | $ | 5,000 | | | $ | 5,519,600 | |
Portland Housing Development Corp., Refunding RB, Senior Living, Retirement Facilities, Series A, 6.00%, 2/01/34 | | | 1,190 | | | | 1,191,737 | |
| | | | | | | | |
| | | | | | | | 6,711,337 | |
Maryland — 2.9% | |
Maryland Community Development Administration, HRB, Series H, AMT, 5.10%, 9/01/37 | | | 1,605 | | | | 1,625,239 | |
Maryland Community Development Administration, Refunding, HRB, Residential, Series D, AMT, 4.90%, 9/01/42 | | | 3,250 | | | | 3,278,210 | |
Maryland Health & Higher Educational Facilities Authority, Refunding RB: | | | | | | | | |
Charlestown Community Project, 6.25%, 1/01/41 | | | 2,000 | | | | 2,262,720 | |
Meritus Medical Center Issue, 5.00%, 7/01/40 | | | 6,350 | | | | 7,049,453 | |
University of Maryland Medical System, 5.00%, 7/01/34 | | | 2,100 | | | | 2,274,111 | |
University of Maryland Medical System, 5.13%, 7/01/39 | | | 2,100 | | | | 2,264,955 | |
| | | | | | | | |
| | | | | | | | 18,754,688 | |
Massachusetts — 3.5% | |
Massachusetts Bay Transportation Authority, Refunding RB, General Transportation System, Series A, 7.00%, 3/01/19 | | | 1,100 | | | | 1,158,960 | |
Massachusetts HFA, RB, AMT: | | | | | | | | |
M/F Housing, Series A, 5.20%, 12/01/37 | | | 2,865 | | | | 2,904,050 | |
S/F Housing, Series 130, 5.00%, 12/01/32 | | | 2,115 | | | | 2,141,818 | |
Massachusetts HFA, Refunding RB, Series C, AMT, 5.35%, 12/01/42 | | | 6,550 | | | | 6,829,096 | |
Massachusetts Water Resources Authority, RB, Series A, 6.50%, 7/15/19 (e) | | | 9,240 | | | | 10,031,498 | |
| | | | | | | | |
| | | | | | | | 23,065,422 | |
Michigan — 3.7% | |
City of Detroit Michigan Water Supply System, RB, 2nd Lien, Series B (AGM), 6.25%, 7/01/36 | | | 2,500 | | | | 2,812,950 | |
Michigan State Hospital Finance Authority, Refunding RB, Series A: | | | | | | | | |
Henry Ford Health System, 5.25%, 11/15/46 | | | 7,950 | | | | 8,184,048 | |
McLaren Health Care, 5.75%, 5/15/18 (b) | | | 7,285 | | | | 8,087,006 | |
Royal Oak Hospital Finance Authority Michigan, Refunding RB, William Beaumont Hospital, Series V, 8.25%, 9/01/18 (b) | | | 4,100 | | | | 4,866,331 | |
| | | | | | | | |
| | | | | | | | 23,950,335 | |
Minnesota — 0.2% | |
City of Cologne Minnesota Charter School, LRB, Cologne Academy Project, Series A, 5.00%, 7/01/45 | | | 1,500 | | | | 1,538,355 | |
Mississippi — 5.0% | |
County of Lowndes Mississippi, Refunding RB, Solid Waste Disposal & Pollution Control, Weyerhaeuser Co. Project: | | | | | | | | |
Series A, 6.80%, 4/01/22 | | | 9,160 | | | | 11,392,109 | |
Series B, 6.70%, 4/01/22 | | | 4,500 | | | | 5,549,760 | |
Mississippi Business Finance Corp., Refunding RB, System Energy Resource, Inc. Project, 5.88%, 4/01/22 | | | 10,835 | | | | 11,183,887 | |
Mississippi Development Bank, Refunding RB, Municipal Energy Agency Of Mississippi, Series A (AGM), 4.00%, 3/01/41 | | | 4,500 | | | | 4,565,160 | |
| | | | | | | | |
| | | | | | | | 32,690,916 | |
See Notes to Financial Statements.
| | | | | | |
| | | | | | | |
| 56 | | SEMI-ANNUAL REPORT | | FEBRUARY 29, 2016 | | |
| | |
Schedule of Investments (continued) | | BlackRock MuniVest Fund, Inc. (MVF) |
| | | | | | | | |
| Municipal Bonds | | Par (000) | | | Value | |
Nebraska — 1.0% | |
Central Plains Energy Project Nebraska, RB, Gas Project No. 3, 5.00%, 9/01/42 | | $ | 6,200 | | | $ | 6,684,902 | |
New Hampshire — 0.8% | |
New Hampshire Housing Finance Authority, Refunding RB, S/F Housing, Acquisition, Series H, AMT, 5.15%, 1/01/40 | | | 4,885 | | | | 4,959,154 | |
New Jersey — 9.2% | |
Casino Reinvestment Development Authority, Refunding RB, 5.25%, 11/01/44 | | | 1,400 | | | | 1,439,158 | |
New Jersey EDA, RB: | | | | | | | | |
Continental Airlines, Inc. Project, Series A, AMT, 5.63%, 11/15/30 | | | 1,530 | | | | 1,729,084 | |
Private Activity Bond, The Goethals Bridge Replacement Project, AMT, 5.13%, 1/01/34 | | | 1,050 | | | | 1,172,136 | |
Private Activity Bond, The Goethals Bridge Replacement Project, AMT, 5.38%, 1/01/43 | | | 10,000 | | | | 11,115,800 | |
School Facilities Construction, Series UU, 5.00%, 6/15/40 | | | 3,390 | | | | 3,544,245 | |
New Jersey EDA, Refunding RB: | | | | | | | | |
5.25%, 6/15/19 (b) | | | 2,650 | | | | 3,024,498 | |
5.25%, 12/15/33 | | | 7,350 | | | | 7,662,816 | |
New Jersey Housing & Mortgage Finance Agency, RB, S/F Housing, Series AA, 6.38%, 10/01/28 | | | 375 | | | | 388,988 | |
New Jersey Transportation Trust Fund Authority, RB: | | | | | | | | |
CAB, Transportation System, Series A, 0.00%, 12/15/38 (c) | | | 7,260 | | | | 2,273,033 | |
Transportation Program, Series AA, 5.25%, 6/15/33 | | | 8,750 | | | | 9,412,637 | |
Transportation Program, Series AA, 5.25%, 6/15/41 | | | 780 | | | | 838,087 | |
Transportation Program, Series AA, 5.00%, 6/15/44 | | | 8,075 | | | | 8,459,612 | |
Transportation System, Series B, 5.50%, 6/15/31 | | | 8,000 | | | | 8,750,960 | |
| | | | | | | | |
| | | | | | | | 59,811,054 | |
New York — 6.5% | |
Build NYC Resource Corp., Refunding RB, Pratt Paper, Inc. Project, AMT, 5.00%, 1/01/35 (a) | | | 545 | | | | 586,856 | |
City of New York New York Municipal Water Finance Authority, Refunding RB, Water & Sewer System, Series FF-2, 5.50%, 6/15/40 | | | 4,150 | | | | 4,711,454 | |
County of New York Tobacco Trust IV, Refunding RB, Settlement Pass-Through Turbo, Series A, 6.25%, 6/01/41 (a) | | | 3,500 | | | | 3,650,395 | |
Erie Tobacco Asset Securitization Corp., Refunding RB, Asset-Backed, Series A, 5.00%, 6/01/45 | | | 4,435 | | | | 4,302,039 | |
Metropolitan Transportation Authority, RB, Series C: | | | | | | | | |
6.25%, 11/15/23 | | | 3,245 | | | | 3,732,139 | |
6.50%, 11/15/28 | | | 14,925 | | | | 17,261,360 | |
New York Liberty Development Corp., Refunding RB, 3 World Trade Center Project (a): | | | | | | | | |
Class 1, 5.00%, 11/15/44 | | | 2,735 | | | | 2,907,442 | |
Class 2, 5.15%, 11/15/34 | | | 460 | | | | 494,357 | |
Class 2, 5.38%, 11/15/40 | | | 1,145 | | | | 1,248,336 | |
Port Authority of New York & New Jersey, ARB, Special Project, JFK International Air Terminal LLC Project, Series 8, 6.00%, 12/01/36 | | | 3,165 | | | | 3,736,472 | |
| | | | | | | | |
| | | | | | | | 42,630,850 | |
North Carolina — 0.6% | |
County of Gaston North Carolina Industrial Facilities & Pollution Control Financing Authority, RB, Exempt Facilities, National Gypsum Co. Project, AMT, 5.75%, 8/01/35 | | | 4,105 | | | | 4,112,799 | |
| | | | | | | | |
| Municipal Bonds | | Par (000) | | | Value | |
Ohio — 3.9% | |
Buckeye Tobacco Settlement Financing Authority, RB, Asset-Backed, Senior Turbo Term, Series A-2, 6.50%, 6/01/47 | | $ | 1,125 | | | $ | 1,082,756 | |
County of Allen Ohio Hospital Facilities, Refunding RB, Catholic Healthcare Partners, Series A, 5.25%, 6/01/38 | | | 2,875 | | | | 3,216,837 | |
County of Franklin Ohio, RB, Health Care Facilities Improvement, OPRS Communities Obligation Group, Series A, 6.13%, 7/01/40 | | | 1,690 | | | | 1,864,357 | |
County of Lucas Ohio, Refunding RB, Promedica Healthcare, Series A, 6.50%, 11/15/37 | | | 1,915 | | | | 2,373,164 | |
County of Montgomery Ohio, RB, Catholic Health Initiatives, Series D-2, 5.45%, 10/01/38 | | | 9,230 | | | | 10,720,830 | |
County of Montgomery Ohio, Refunding RB, Catholic Health, Series A, 5.50%, 5/01/34 | | | 5,470 | | | | 6,136,301 | |
| | | | | | | | |
| | | | | | | | 25,394,245 | |
Pennsylvania — 2.4% | |
City of Philadelphia Pennsylvania IDA, RB, Retirement Facilities, Rieder House Project, Series A, 6.10%, 7/01/33 | | | 1,255 | | | | 1,256,669 | |
County of Delaware Pennsylvania IDA, Refunding RB, Covanta Project, 5.00%, 7/01/43 | | | 5,000 | | | | 5,055,000 | |
County of Montgomery Pennsylvania IDA, Refunding RB, Whitemarsh Continuing Care Retirement Community, 5.25%, 1/01/40 | | | 2,625 | | | | 2,674,061 | |
Delaware River Port Authority, RB, Series D, 5.00%, 1/01/40 | | | 195 | | | | 217,043 | |
Pennsylvania Economic Development Financing Authority, RB, Pennsylvania Bridge Finco LP, AMT, 5.00%, 12/31/38 | | | 2,565 | | | | 2,809,855 | |
Pennsylvania HFA, RB, S/F Housing Mortgage, Series 118B, 4.05%, 10/01/40 | | | 3,850 | | | | 3,977,166 | |
| | | | | | | | |
| | | | | | | | 15,989,794 | |
Rhode Island — 1.4% | |
Tobacco Settlement Financing Corp., Refunding RB, Series B: | | | | | | | | |
4.50%, 6/01/45 | | | 6,820 | | | | 6,886,495 | |
5.00%, 6/01/50 | | | 2,000 | | | | 2,065,700 | |
| | | | | | | | |
| | | | | | | | 8,952,195 | |
South Carolina — 0.7% | |
State of South Carolina Public Service Authority, Refunding RB, Series E, 5.25%, 12/01/55 | | | 3,800 | | | | 4,318,434 | |
Texas — 11.8% | |
Brazos River Authority, Refunding RB, Texas Utility Co., Series A, AMT, 7.70%, 4/01/33 (f)(g) | | | 3,055 | | | | 76,375 | |
Central Texas Regional Mobility Authority, RB, Senior Lien, Series A: | | | | | | | | |
5.00%, 1/01/40 | | | 1,215 | | | | 1,367,312 | |
5.00%, 1/01/45 | | | 3,500 | | | | 3,938,760 | |
Central Texas Regional Mobility Authority, Refunding RB, Senior Lien: | | | | | | | | |
5.75%, 1/01/31 | | | 1,000 | | | | 1,171,100 | |
6.00%, 1/01/41 | | | 4,300 | | | | 5,089,394 | |
Series A, 5.00%, 1/01/43 | | | 6,925 | | | | 7,420,969 | |
City of Houston Texas Airport System, Refunding ARB, United Airlines, Inc. Terminal E Project, AMT, 5.00%, 7/01/29 | | | 2,665 | | | | 2,891,605 | |
County of Harris Texas Cultural Education Facilities Finance Corp., RB, 1st Mortgage, Brazos Presbyterian Homes, Inc. Project, Series B, 7.00%, 1/01/43 | | | 850 | | | | 1,009,367 | |
See Notes to Financial Statements.
| | | | | | |
| | | | | | | |
| | SEMI-ANNUAL REPORT | | FEBRUARY 29, 2016 | | 57 |
| | |
Schedule of Investments (continued) | | BlackRock MuniVest Fund, Inc. (MVF) |
| | | | | | | | |
| Municipal Bonds | | Par (000) | | | Value | |
Texas (continued) | |
County of Harris Texas Health Facilities Development Corp., Refunding RB, Memorial Hermann Healthcare System, Series B (b): | | | | | | | | |
7.13%, 12/01/18 | | $ | 3,500 | | | $ | 4,108,895 | |
7.25%, 12/01/18 | | | 5,400 | | | | 6,357,852 | |
County of Tarrant Texas Cultural Education Facilities Finance Corp., RB, Scott & White Healthcare: | | | | | | | | |
6.00%, 8/15/20(b) | | | 370 | | | | 450,930 | |
6.00%, 8/15/45 | | | 4,630 | | | | 5,503,727 | |
County of Tarrant Texas Cultural Education Facilities Finance Corp., Refunding RB, Trinity Terrace Project, 5.00%, 10/01/44 | | | 875 | | | | 938,044 | |
La Vernia Higher Education Finance Corp., RB, KIPP, Inc., Series A, 6.25%, 8/15/19 (b) | | | 925 | | | | 1,092,397 | |
Love Field Airport Modernization Corp., RB, Southwest Airlines Co. Project, 5.25%, 11/01/40 | | | 3,600 | | | | 3,978,648 | |
New Hope Cultural Education Facilities Corp., RB, Collegiate Housing Tarleton State University Project, 5.00%, 4/01/35 | | | 500 | | | | 540,540 | |
New Hope Cultural Education Facilities Corp., Refunding RB, 1st Mortgage, Morningside Ministries Project, 6.25%, 1/01/33 | | | 1,600 | | | | 1,851,760 | |
North Texas Education Finance Corp., ERB, Uplift Education, Series A, 5.13%, 12/01/42 | | | 1,000 | | | | 1,056,550 | |
North Texas Tollway Authority, Refunding RB, Series A: | | | | | | | | |
1st Tier, 6.25%, 1/01/39 | | | 3,500 | | | | 3,955,070 | |
5.00%, 1/01/38 | | | 5,000 | | | | 5,683,800 | |
Texas Private Activity Bond Surface Transportation Corp., RB, Senior Lien: | | | | | | | | |
LBJ Infrastructure Group LLC, LBJ Freeway Managed Lanes Project, 7.00%, 6/30/40 | | | 10,000 | | | | 12,089,600 | |
NTE Mobility Partners LLC, North Tarrant Express Managed Lanes Project, 6.88%, 12/31/39 | | | 4,710 | | | | 5,557,470 | |
Texas State University System, RB, 5.00%, 3/15/16 (b) | | | 655 | | | | 656,408 | |
| | | | | | | | |
| | | | | | | | 76,786,573 | |
Vermont — 0.0% | |
Vermont Educational & Health Buildings Financing Agency, RB, Developmental & Mental Health, Series A, 6.38%, 6/15/22 | | | 30 | | | | 30,492 | |
Virginia — 3.6% | |
City of Portsmouth Virginia, GO, Refunding, Series D, 5.00%, 7/15/34 | | | 3,105 | | | | 3,542,432 | |
County of Fairfax Virginia EDA, Refunding RB, Goodwin House, Inc.: | | | | | | | | |
5.13%, 10/01/37 | | | 2,000 | | | | 2,076,480 | |
5.13%, 10/01/42 | | | 6,015 | | | | 6,231,660 | |
Tobacco Settlement Financing Corp., Refunding RB, Convertible, Senior, Series B2, 5.20%, 6/01/46 | | | 3,750 | | | | 3,069,863 | |
Virginia Small Business Financing Authority, RB, Senior Lien, Elizabeth River Crossings OpCo LLC Project, AMT: | | | | | | | | |
6.00%, 1/01/37 | | | 2,620 | | | | 3,030,764 | |
5.50%, 1/01/42 | | | 5,140 | | | | 5,694,966 | |
| | | | | | | | |
| | | | | | | | 23,646,165 | |
Washington — 4.3% | |
Energy Northwest, Refunding RB, Series B, 7.13%, 7/01/16 | | | 14,320 | | | | 14,652,654 | |
Washington Health Care Facilities Authority, RB, Catholic Health Initiatives, Series A, 5.75%, 1/01/45 | | | 4,010 | | | | 4,735,970 | |
Washington Health Care Facilities Authority, Refunding RB, Catholic Health Initiatives, Series D, 6.38%, 10/01/36 | | | 7,000 | | | | 7,882,280 | |
| | | | | | | | |
| Municipal Bonds | | Par (000) | | | Value | |
Washington (continued) | |
Washington State Housing Finance Commission, RB, Heron’s Key, Series A (a): | | | | | | | | |
6.75%, 7/01/35 | | $ | 265 | | | $ | 277,481 | |
Washington State Housing Finance Commission, RB, Heron’s Key, Series A (a) (continued): | | | | | | | | |
7.00%, 7/01/45 | | | 590 | | | | 615,370 | |
| | | | | | | | |
| | | | | | | | 28,163,755 | |
West Virginia — 0.4% | |
West Virginia Hospital Finance Authority, Refunding RB, Improvement, Charleston Area Medical Center, Inc., Series A, 5.63%, 9/01/32 | | | 2,500 | | | | 2,772,200 | |
Wisconsin — 1.0% | |
Wisconsin Health & Educational Facilities Authority, Refunding RB, Froedtert & Community Health, Inc., Series C, 5.25%, 4/01/39 | | | 6,100 | | | | 6,606,910 | |
Wyoming — 1.2% | |
County of Sweetwater Wyoming, Refunding RB, Idaho Power Co. Project, Remarketing, 5.25%, 7/15/26 | | | 4,500 | | | | 5,122,665 | |
Wyoming Community Development Authority, Refunding RB, Series 2 & 3, 4.05%, 12/01/38 | | | 2,545 | | | | 2,599,235 | |
| | | | | | | | |
| | | | | | | | 7,721,900 | |
| Total Municipal Bonds — 109.7% | | | | | | | 716,767,515 | |
| | | | | | | | |
| | |
|
Municipal Bonds Transferred to
Tender Option Bond Trusts (h) | |
Arizona — 0.6% | |
City of Phoenix Arizona Civic Improvement Corp., Refunding RB, Water System, Junior Lien, Series A, 5.00%, 7/01/34 | | | 3,500 | | | | 3,897,460 | |
California — 3.5% | |
University of California, RB, General, Series O: | | | | | | | | |
5.25%, 5/15/19(b) | | | 3,235 | | | | 3,694,377 | |
5.25%, 5/15/39 | | | 16,765 | | | | 18,845,023 | |
| | | | | | | | |
| | | | | | | | 22,539,400 | |
Connecticut — 1.9% | |
Connecticut State Health & Educational Facility Authority, RB, Yale University, Series Z-3, 5.05%, 7/01/42 | | | 12,000 | | | | 12,638,880 | |
District of Columbia — 1.3% | |
District of Columbia Water & Sewer Authority, Refunding RB, Senior Lien, Series A, 5.50%, 10/01/18 (b) | | | 7,495 | | | | 8,407,695 | |
Florida — 2.6% | |
County of Miami-Dade Florida Water & Sewer System (AGM), 5.00%, 10/01/39 | | | 14,747 | | | | 16,744,598 | |
Illinois — 4.8% | |
State of Illinois Finance Authority, RB, University of Chicago, Series B, 6.25%, 7/01/18 (b) | | | 10,000 | | | | 11,282,700 | |
State of Illinois Toll Highway Authority, RB, Series B, Senior: | | | | | | | | |
Priority, 5.50%, 1/01/18 (b) | | | 6,999 | | | | 7,618,275 | |
5.00%, 1/01/40 | | | 10,976 | | | | 12,591,963 | |
| | | | | | | | |
| | | | | | | | 31,492,938 | |
Kentucky — 1.6% | |
County of Louisville & Jefferson Kentucky Metropolitan Government Parking Authority, RB, River City, Inc., 1st Mortgage, Series A, 5.38%, 12/01/39 | | | 9,195 | | | | 10,467,680 | |
See Notes to Financial Statements.
| | | | | | |
| | | | | | | |
| 58 | | SEMI-ANNUAL REPORT | | FEBRUARY 29, 2016 | | |
| | |
Schedule of Investments (continued) | | BlackRock MuniVest Fund, Inc. (MVF) |
| | | | | | | | |
Municipal Bonds Transferred to
Tender Option Bond Trusts (h) | | Par (000) | | | Value | |
Maryland — 0.8% | |
State of Maryland Transportation Authority, RB, Transportation Facilities Project (AGM), 5.00%, 7/01/41 | | $ | 4,710 | | | $ | 5,105,028 | |
Nevada — 2.8% | |
County of Clark Nevada Water Reclamation District, GO, Limited Tax, Series B, 5.75%, 7/01/34 | | | 15,789 | | | | 18,168,336 | |
New York — 5.8% | |
City of New York New York Municipal Water Finance Authority, Refunding RB, Water & Sewer System, 2nd General Resolution, Series DD, 5.00%, 6/15/37 | | | 24,199 | | | | 26,399,677 | |
New York Liberty Development Corp., Refunding RB, 4 World Trade Center Project, 5.75%, 11/15/51 (i) | | | 10,001 | | | | 11,650,395 | |
| | | | | | | | |
| | | | | | | | 38,050,072 | |
North Carolina — 2.8% | |
North Carolina Capital Facilities Finance Agency, Refunding RB: | | | | | | | | |
Duke University Project, Series A, 5.00%, 10/01/41 | | | 12,678 | | | | 12,986,571 | |
Wake Forest University, 5.00%, 1/01/38 | | | 5,000 | | | | 5,512,400 | |
| | | | | | | | |
| | | | | | | | 18,498,971 | |
Ohio — 2.2% | |
Ohio Higher Educational Facility Commission, RB, Cleveland Clinic Health, Series A, 5.25%, 1/01/33 | | | 4,400 | | | | 4,738,140 | |
State of Ohio, RB, Cleveland Clinic Health Obligated Group, Series B, 5.50%, 1/01/34 | | | 8,500 | | | | 9,585,705 | |
| | | | | | | | |
| | | | | | | | 14,323,845 | |
Oregon — 2.0% | |
State of Oregon Housing & Community Services Department, HRB, M/F Housing, Series A, AMT, 4.95%, 7/01/30 | | | 12,295 | | | | 13,045,339 | |
South Carolina — 0.0% | |
State of South Carolina Housing Finance & Development Authority, Refunding RB, S/F Housing, Series B-1, 5.55%, 7/01/39 | | | 79 | | | | 81,268 | |
Texas — 7.5% | |
City of Houston Texas, Refunding RB, Airport System, Senior Lien, Series A, 5.50%, 7/01/34 | | | 8,333 | | | | 9,174,559 | |
City of Houston Texas Higher Education Finance Corp., RB, Rice University Project, Series A, 5.00%, 5/15/40 | | | 10,000 | | | | 11,332,997 | |
County of Harris Texas Health Facilities Development Corp., Refunding RB, School Health Care System, Series B, 5.75%, 7/01/27 (e) | | | 20,970 | | | | 26,950,224 | |
| | | | | | | | |
Municipal Bonds Transferred to
Tender Option Bond Trusts (h) | | Par (000) | | | Value | |
Texas (continued) | |
Texas Department of Housing & Community Affairs, RB, S/F Mortgage, Series B, AMT, 5.25%, 9/01/32 | | $ | 1,735 | | | $ | 1,762,500 | |
| | | | | | | | |
| | | | | | | | 49,220,280 | |
Virginia — 2.6% | |
County of Fairfax Virginia IDA, Refunding RB, Health Care, Inova Health System, Series A, 5.50%, 5/15/35 | | | 2,099 | | | | 2,370,629 | |
Virginia Commonwealth Transportation Board, RB, Capital Projects, 5.00%, 5/15/32 | | | 7,999 | | | | 9,296,799 | |
Virginia Small Business Financing Authority, Refunding RB, Sentara Healthcare, 5.00%, 11/01/40 | | | 5,002 | | | | 5,550,823 | |
| | | | | | | | |
| | | | | | | | 17,218,251 | |
Washington — 6.0% | |
Central Puget Sound Regional Transit Authority, RB, Series A (b): | | | | | | | | |
5.00%, 11/01/17 | | | 11,000 | | | | 11,807,180 | |
(AGM), 5.00%, 11/01/17 | | | 14,007 | | | | 15,035,233 | |
Washington Health Care Facilities Authority, Refunding RB, Seattle Children’s Hospital, Series B, 5.00%, 10/01/38 | | | 10,000 | | | | 12,258,100 | |
| | | | | | | | |
| | | | | | | | 39,100,513 | |
Total Municipal Bonds Transferred to Tender Option Bond Trusts — 48.8% | | | | 319,000,554 | |
Total Long-Term Investments (Cost — $941,506,120) — 158.5% | | | | 1,035,768,069 | |
| | | | | | | | |
| | |
| | |
| Short-Term Securities — 1.8% | | Shares | | | | |
BlackRock Liquidity Funds, MuniCash, 0.02% (j)(k) | | | 11,635,223 | | | | 11,635,223 | |
Total Short-Term Securities
(Cost — $11,635,223) — 1.8% | | | | 11,635,223 | |
| Total Investments (Cost — $953,141,343) — 160.3% | | | | 1,047,403,292 | |
| Other Assets Less Liabilities — 1.5% | | | | 9,670,569 | |
Liability for TOB Trust Certificates, Including Interest
Expense and Fees Payable — (24.5)% | | | | (159,985,201 | ) |
| VMTP Shares, at Liquidation Value — (37.3)% | | | | | | | (243,800,000 | ) |
| | | | | | | | |
| Net Assets Applicable to Common Shares — 100.0% | | | $ | 653,288,660 | |
| | | | | |
|
| Notes to Schedule of Investments |
| (a) | | Security exempt from registration pursuant to Rule 144A under the Securities Act of 1933, as amended. These securities may be resold in transactions exempt from registration to qualified institutional investors. |
| (b) | | U.S. Government securities, held in escrow, are used to pay interest on this security, as well as to retire the bond in full at the date indicated, typically at a premium to par. |
| (d) | | Variable rate security. Rate as of period end. |
| (e) | | Security is collateralized by municipal bonds or U.S. Treasury obligations. |
| (f) | | Non-income producing security. |
| (g) | | Issuer filed for bankruptcy and/or is in default of interest payments. |
| (h) | | Represent bonds transferred to a TOB Trust in exchange of cash and residual certificates received by the Trust. These bonds serve as collateral in a secured borrowing. See Note 4 of the Notes to Financial Statements for details. |
| (i) | | All or a portion of security is subject to a recourse agreement. The aggregate maximum potential amount the Trust could ultimately be required to pay under the agreement, which expires on November 15, 2019, is $5,295,502. See Note 4 of the Notes to Financial Statements for details. |
See Notes to Financial Statements.
| | | | | | |
| | | | | | | |
| | SEMI-ANNUAL REPORT | | FEBRUARY 29, 2016 | | 59 |
| | |
Schedule of Investments (continued) | | BlackRock MuniVest Fund, Inc. (MVF) |
| (j) | | During the period ended February 29, 2016, investments in issuers considered to be affiliates of the Trust for purposes of Section 2(a)(3) of the 1940 Act, were as follows: |
| | | | | | | | | | | | | | | | |
| Affiliate | | Shares Held
at August 31,
2015 | | | Net
Activity | | | Shares Held
at February 29,
2016 | | | Income | |
BlackRock Liquidity Funds, MuniCash | | | — | | | | 11,635,223 | | | | 11,635,223 | | | | — | |
FFI Institutional Tax-Exempt Fund | | | 8,611,512 | | | | (8,611,512 | ) | | | — | | | $ | 460 | |
Total | | | | | | | | | | | 11,635,223 | | | $ | 460 | |
| (k) | | Current yield as of period end. |
|
| Derivative Financial Instruments Outstanding as of Period End |
| | | | | | | | | | | | | | | | |
| Financial Futures Contracts | | | |
Contracts
Short | | | Issue | | Expiration | | Notional
Value | | | Unrealized
Appreciation | | | |
| | (126 | ) | | 5-Year U.S. Treasury Note | | June 2016 | | $ | 15,244,031 | | | $ | 18,545 | | | |
| | (122 | ) | | 10-Year U.S. Treasury Note | | June 2016 | | $ | 15,922,906 | | | | 9,875 | | | |
| | (49 | ) | | Long U.S. Treasury Bond | | June 2016 | | $ | 8,062,031 | | | | 47,122 | | | |
| | (12 | ) | | Ultra U.S. Treasury Bond | | June 2016 | | $ | 2,077,875 | | | | 8,230 | | | |
| | Total | | | | | | | | | | | $ | 83,772 | | | |
| | | | | | | | | | | | | |
|
| Derivative Financial Instruments Categorized by Risk Exposure |
As of period end, the fair values of derivative financial instruments located in the Statements of Assets and Liabilities were as follows:
| | | | | | | | | | | | | | | | | | | | | | | | | | | | | | |
| Assets — Derivative Financial Instruments | | Commodity
Contracts | | | Credit
Contracts | | | Equity
Contracts | | | Foreign
Currency
Exchange
Contracts | | | Interest
Rate
Contracts | | | Other
Contracts | | | Total | |
Financial futures contracts | | Net unrealized
appreciation1 | | | — | | | | — | | | | — | | | | — | | | $ | 83,772 | | | | — | | | $ | 83,772 | |
1 Includes cumulative appreciation (depreciation) on financial futures contracts, if any, as reported in the Schedule of Investments. Only current day’s variation margin is reported within the Statements of Assets and Liabilities. | |
| For the six months ended February 29, 2016, the effect of derivative financial instruments in the Statements of Operations was as follows: | |
| Net Realized Gain (Loss) from: | | | | Commodity
Contracts | | | Credit
Contracts | | | Equity
Contracts | | | Foreign
Currency
Exchange
Contracts | | | Interest
Rate
Contracts | | | Other
Contracts | | | Total | |
Financial futures contracts | | | | | — | | | | — | | | | — | | | | — | | | $ | (1,242,035 | ) | | | — | | | $ | (1,242,035 | ) |
| | | | | | | | |
Net Change in Unrealized
Appreciation (Depreciation) on: | | | | | | | | | | | | | | | | | | | | | | | | | | | | | | |
Financial futures contracts | | | | | — | | | | — | | | | — | | | | — | | | $ | 34,710 | | | | — | | | $ | 34,710 | |
|
| Average Quarterly Balances of Outstanding Derivative Financial Instruments |
| | | | |
| Financial futures contracts: | |
Average notional value of contracts – short | | $ | 28,654,227 | |
For more information about the Trust’s investment risks regarding derivative financial instruments, refer to the Notes to Financial Statements.
|
| Fair Value Hierarchy as of Period End |
Various inputs are used in determining the fair value of investments and derivative financial instruments. For information about the Trust’s policy regarding valuation of investments and derivative financial instruments, refer to the Notes to Financial Statements.
See Notes to Financial Statements.
| | | | | | |
| | | | | | | |
| 60 | | SEMI-ANNUAL REPORT | | FEBRUARY 29, 2016 | | |
| | |
Schedule of Investments (concluded) | | BlackRock MuniVest Fund, Inc. (MVF) |
The following tables summarize the Trust’s investments and derivative financial instruments categorized in the disclosure hierarchy:
| | | | | | | | | | | | | | | | |
| | | Level 1 | | | Level 2 | | | Level 3 | | | Total | |
Assets: | | | | | | | | | | | | | | | | |
| Investments: | | | | | | | | | | | | | | | | |
Long-Term Investments 1 | | | — | | | $ | 1,035,768,069 | | | | — | | | $ | 1,035,768,069 | |
Short-Term Securities | | $ | 11,635,223 | | | | — | | | | — | | | | 11,635,223 | |
| | | | |
Total | | $ | 11,635,223 | | | $ | 1,035,768,069 | | | | — | | | $ | 1,047,403,292 | |
| | | | |
1 See above Schedule of Investments for values in each state or political subdivision. | |
| | | Level 1 | | | Level 2 | | | Level 3 | | | Total | |
| Derivative Financial Instruments 1 | | | | | | | | | |
Assets: | | | | | | | | | | | | | | | | |
Interest rate contracts | | $ | 83,772 | | | | — | | | | — | | | $ | 83,772 | |
1 Derivative financial instruments are financial futures contracts, which are valued at the unrealized appreciation (depreciation) on the instrument. | |
|
| The Trust may hold assets and/or liabilities in which the fair value approximates the carrying amount for financial statement purposes. As of period end, such assets and/or liabilities are categorized within the disclosure hierarchy as follows: | |
| | | Level 1 | | | Level 2 | | | Level 3 | | | Total | |
Assets: | | | | | | | | | | | | | | | | |
Cash pledged for financial futures contracts | | $ | 532,500 | | | | — | | | | — | | | $ | 532,500 | |
Liabilities: | | | | | | | | | | | | | | | | |
TOB Trust Certificates | | | — | | | $ | (159,975,655 | ) | | | — | | | | (159,975,655 | ) |
VMTP Shares | | | — | | | | (243,800,000 | ) | | | — | | | | (243,800,000 | ) |
| | | | |
Total | | $ | 532,500 | | | $ | (403,775,655 | ) | | | — | | | $ | (403,243,155 | ) |
| | | | |
During the six months ended February 29, 2016, there were no transfers between levels.
See Notes to Financial Statements.
| | | | | | |
| | | | | | | |
| | SEMI-ANNUAL REPORT | | FEBRUARY 29, 2016 | | 61 |
| | |
| Statements of Assets and Liabilities | | |
| | | | | | | | | | | | | | | | |
| February 29, 2016 (Unaudited) | | BlackRock
Municipal Bond
Investment Trust
(BIE) | | | BlackRock
Municipal
Bond Trust
(BBK) | | | BlackRock
Municipal Income
Investment
Quality Trust
(BAF) | | | BlackRock
Municipal Income
Quality Trust
(BYM) | |
| | | | | | | | | | | | | | | | |
| Assets | |
Investments at value — unaffiliated1 | | $ | 86,913,071 | | | $ | 279,690,954 | | | $ | 218,923,705 | | | $ | 638,812,024 | |
Investments at value — affiliated2 | | | 135,473 | | | | 328,750 | | | | 1,151,976 | | | | 5,032,305 | |
Cash pledged for financial futures contracts | | | 45,950 | | | | 275,050 | | | | 132,800 | | | | 417,050 | |
| Receivables: | | | | | | | | | | | | | | | | |
Interest | | | 967,806 | | | | 3,023,732 | | | | 2,333,342 | | | | 6,313,960 | |
Investments sold | | | 632,822 | | | | 49,405 | | | | 1,145,608 | | | | 419,761 | |
Deferred offering costs | | | 111,610 | | | | — | | | | — | | | | — | |
Prepaid expenses | | | 46,276 | | | | 15,517 | | | | 12,949 | | | | 21,419 | |
Other assets | | | — | | | | — | | | | — | | | | 9,053 | |
| | | | |
Total assets | | | 88,853,008 | | | | 283,383,408 | | | | 223,700,380 | | | | 651,025,572 | |
| | | | |
| | | | | | | | | | | | | | | | |
| Accrued Liabilities | |
Payables: | | | | | | | | | | | | | | | | |
Investments purchased | | | 442,412 | | | | 2,945,636 | | | | 1,376,785 | | | | 522,988 | |
Income dividends — Common Shares | | | 253,740 | | | | 788,314 | | | | 599,335 | | | | 1,888,049 | |
Reorganization costs | | | 103,840 | | | | — | | | | — | | | | — | |
Investment advisory fees | | | 39,839 | | | | 144,387 | | | | 96,850 | | | | 283,423 | |
Officer’s and Trustees’ fees | | | 7,985 | | | | 25,487 | | | | 18,945 | | | | 59,123 | |
Variation margin on financial futures contracts | | | 4,031 | | | | 22,727 | | | | 11,688 | | | | 34,845 | |
Interest expense and fees | | | 1,565 | | | | 3,889 | | | | 4,917 | | | | 22,138 | |
Other accrued expenses | | | 20,150 | | | | 84,973 | | | | 72,171 | | | | 120,608 | |
| | | | |
Total accrued liabilities | | | 873,562 | | | | 4,015,413 | | | | 2,180,691 | | | | 2,931,174 | |
| | | | |
| | | | | | | | | | | | | | | | |
| Other Liabilities | |
TOB Trust Certificates | | | 16,235,837 | | | | 21,235,789 | | | | 37,759,323 | | | | 97,623,691 | |
VRDP Shares, at liquidation value of $100,000 per share3,4 | | | 17,800,000 | | | | — | | | | — | | | | — | |
VMTP Shares, at liquidation value of $100,000 per share3,4 | | | — | | | | 79,900,000 | | | | 42,200,000 | | | | 137,200,000 | |
| | | | |
Total other liabilities | | | 34,035,837 | | | | 101,135,789 | | | | 79,959,323 | | | | 234,823,691 | |
| | | | |
Total liabilities | | | 34,909,399 | | | | 105,151,202 | | | | 82,140,014 | | | | 237,754,865 | |
| | | | |
Net Assets Applicable to Common Shareholders | | $ | 53,943,609 | | | $ | 178,232,206 | | | $ | 141,560,366 | | | $ | 413,270,707 | |
| | | | |
| | | | | | | | | | | | | | | | |
| Net Assets Applicable to Common Shareholders Consist of | |
Paid-in capital5,6,7 | | $ | 47,238,805 | | | $ | 149,343,663 | | | $ | 124,019,631 | | | $ | 374,650,783 | |
Undistributed net investment income | | | 636,089 | | | | 2,541,279 | | | | 1,718,975 | | | | 3,548,276 | |
Undistributed net realized gain (accumulated net realized loss) | | | (3,193,088 | ) | | | 479,572 | | | | (5,937,728 | ) | | | (23,519,676 | ) |
Net unrealized appreciation (depreciation) | | | 9,261,803 | | | | 25,867,692 | | | | 21,759,488 | | | | 58,591,324 | |
| | | | |
Net Assets Applicable to Common Shareholders | | $ | 53,943,609 | | | $ | 178,232,206 | | | $ | 141,560,366 | | | $ | 413,270,707 | |
| | | | |
Net asset value per Common Share | | $ | 16.16 | | | $ | 16.96 | | | $ | 16.18 | | | $ | 15.65 | |
| | | | |
1 Investments at cost — unaffiliated | | $ | 77,666,668 | | | $ | 253,858,772 | | | $ | 197,182,911 | | | $ | 580,286,116 | |
2 Investments at cost — affiliated | | $ | 135,473 | | | $ | 328,750 | | | $ | 1,151,976 | | | $ | 5,032,305 | |
3 Preferred Shares outstanding, par value $ 0.001 per share | | | 178 | | | | 799 | | | | 422 | | | | 1,372 | |
4 Preferred Shares authorized, including Auction Market Rate Preferred Shares (“AMPS”) | | | unlimited | | | | unlimited | | | | unlimited | | | | unlimited | |
5 Par value per Common Share | | $ | 0.001 | | | $ | 0.001 | | | $ | 0.001 | | | $ | 0.001 | |
6 Common Shares outstanding | | | 3,338,684 | | | | 10,510,852 | | | | 8,749,418 | | | | 26,406,273 | |
7 Common Shares authorized | | | unlimited | | | | unlimited | | | | unlimited | | | | unlimited | |
| | | | | | |
| See Notes to Financial Statements. | | | | |
| | | | | | | |
| 62 | | SEMI-ANNUAL REPORT | | FEBRUARY 29, 2016 | | |
| | |
| Statements of Assets and Liabilities | | |
| | | | | | | | | | | | |
| February 29, 2016 (Unaudited) | | BlackRock
Municipal
Income Trust II
(BLE) | | | BlackRock
MuniHoldings
Investment
Quality Fund
(MFL) | | | BlackRock
MuniVest
Fund, Inc.
(MVF) | |
| | | | | | | | | | | | |
| Assets | |
Investments at value — unaffiliated1 | | $ | 580,191,649 | | | $ | 929,330,898 | | | $ | 1,035,768,069 | |
Investments at value — affiliated2 | | | 5,848,983 | | | | 5,266,008 | | | | 11,635,223 | |
Cash pledged for financial futures contracts | | | 334,800 | | | | 529,150 | | | | 532,500 | |
| Receivables: | | | | | | | | | | | | |
Interest | | | 6,870,968 | | | | 10,701,875 | | | | 12,882,045 | |
Investments sold | | | — | | | | 6,973,256 | | | | 432,226 | |
Deferred offering costs | | | — | | | | 429,260 | | | | — | |
Prepaid expenses | | | 26,143 | | | | 30,897 | | | | 49,032 | |
| | | | |
Total assets | | | 593,272,543 | | | | 953,261,344 | | | | 1,061,299,095 | |
| | | | |
| | | | | | | | | | | | |
| Accrued Liabilities | |
Payables: | | | | | | | | | | | | |
Investments purchased | | | 1,785,451 | | | | 7,293,603 | | | | — | |
Income dividends — Common Shares | | | 1,854,163 | | | | 2,703,256 | | | | 3,432,852 | |
Investment advisory fees | | | 257,409 | | | | 395,642 | | | | 420,212 | |
Officer’s and Trustees’ fees | | | 53,610 | | | | 222,727 | | | | 141,326 | |
Variation margin on financial futures contracts | | | 28,821 | | | | 47,134 | | | | 47,080 | |
Interest expense and fees | | | 9,444 | | | | 15,792 | | | | 9,546 | |
Other accrued expenses | | | 117,929 | | | | 179,620 | | | | 183,764 | |
| | | | |
Total accrued liabilities | | | 4,106,827 | | | | 10,857,774 | | | | 4,234,780 | |
| | | | |
| | | | | | | | | | | | |
| Other Liabilities | |
TOB Trust Certificates | | | 71,925,067 | | | | 80,917,802 | | | | 159,975,655 | |
VRDP Shares, at liquidation value of $100,000 per share3,4,5 | | | — | | | | 274,600,000 | | | | — | |
VMTP Shares, at liquidation value of $100,000 per share3,4,5 | | | 151,300,000 | | | | — | | | | 243,800,000 | |
| | | | |
Total other liabilities | | | 223,225,067 | | | | 355,517,802 | | | | 403,775,655 | |
| | | | |
Total liabilities | | | 227,331,894 | | | | 366,375,576 | | | | 408,010,435 | |
| | | | |
Net Assets Applicable to Common Shareholders | | $ | 365,940,649 | | | $ | 586,885,768 | | | $ | 653,288,660 | |
| | | | |
| | | | | | | | | | | | |
| Net Assets Applicable to Common Shareholders Consist of | |
Paid-in capital6,7,8 | | $ | 332,911,711 | | | $ | 525,907,131 | | | $ | 583,465,276 | |
Undistributed net investment income | | | 3,578,581 | | | | 9,114,076 | | | | 6,630,652 | |
Accumulated net realized loss | | | (19,840,347 | ) | | | (42,249,612 | ) | | | (31,152,989 | ) |
Net unrealized appreciation (depreciation) | | | 49,290,704 | | | | 94,114,173 | | | | 94,345,721 | |
| | | | |
Net Assets Applicable to Common Shareholders | | $ | 365,940,649 | | | $ | 586,885,768 | | | $ | 653,288,660 | |
| | | | |
Net asset value per Common Share | | $ | 15.59 | | | $ | 15.52 | | | $ | 10.18 | |
| | | | |
1 Investments at cost — unaffiliated | | $ | 531,001,101 | | | $ | 835,289,392 | | | $ | 941,506,120 | |
2 Investments at cost — affiliated | | $ | 5,848,983 | | | $ | 5,266,008 | | | $ | 11,635,223 | |
3 Preferred Shares outstanding, par value $0.001 per share | | | 1,513 | | | | — | | | | — | |
4 Preferred Shares outstanding, par value $0.01 per share | | | — | | | | 2,746 | | | | 2,438 | |
5 Preferred Shares authorized, including Auction Market Rate Preferred Shares (“AMPS”) | | | unlimited | | | | 1,000,000 | | | | 10,000,000 | |
6 Par Value per Common Share | | $ | 0.001 | | | $ | 0.10 | | | $ | 0.10 | |
7 Common Shares outstanding | | | 23,470,421 | | | | 37,807,776 | | | | 64,165,459 | |
8 Common Shares authorized | | | unlimited | | | | unlimited | | | | 150,000,000 | |
| | | | | | |
| See Notes to Financial Statements. | | | | |
| | | | | | | |
| | SEMI-ANNUAL REPORT | | FEBRUARY 29, 2016 | | 63 |
| | | | | | | | | | | | | | | | |
| Six Months Ended February 29, 2016 (Unaudited) | | BlackRock
Municipal Bond
Investment Trust
(BIE) | | | BlackRock
Municipal
Bond Trust
(BBK) | | | BlackRock
Municipal Income
Investment
Quality Trust
(BAF) | | | BlackRock
Municipal Income
Quality Trust
(BYM) | |
| | | | | | | | | | | | | | | | |
| Investment Income | |
Interest — unaffiliated | | $ | 1,999,411 | | | $ | 6,153,001 | | | $ | 4,710,562 | | | $ | 13,998,496 | |
Dividends — affiliated | | | 59 | | | | 331 | | | | 146 | | | | 521 | |
| | | | |
Total income | | | 1,999,470 | | | | 6,153,332 | | | | 4,710,708 | | | | 13,999,017 | |
| | | | |
| | | | | | | | | | | | | | | | |
| Expenses | |
Investment advisory | | | 283,175 | | | | 890,931 | | | | 594,922 | | | | 1,761,068 | |
Reorganization costs | | | 129,122 | | | | — | | | | — | | | | — | |
Professional | | | 27,860 | | | | 30,660 | | | | 28,476 | | | | 41,931 | |
Liquidity fees | | | 21,831 | | | | — | | | | — | | | | — | |
Rating agency | | | 20,428 | | | | 17,997 | | | | 17,962 | | | | 18,047 | |
Transfer agent | | | 8,400 | | | | 12,536 | | | | 10,965 | | | | 19,638 | |
Accounting services | | | 8,017 | | | | 22,379 | | | | 18,389 | | | | 29,989 | |
Custodian | | | 3,648 | | | | 8,400 | | | | 6,413 | | | | 14,539 | |
Registration | | | 3,038 | | | | 3,031 | | | | 3,036 | | | | 3,303 | |
Officer and Trustees | | | 2,855 | | | | 9,323 | | | | 7,489 | | | | 21,564 | |
Printing | | | 2,768 | | | | 3,974 | | | | 3,431 | | | | 5,786 | |
Remarketing fees on Preferred Shares | | | 2,521 | | | | — | | | | — | | | | — | |
Miscellaneous | | | 10,734 | | | | 17,876 | | | | 12,294 | | | | 22,833 | |
| | | | |
Total expenses excluding interest expense, fees and amortization of offering costs | | | 524,397 | | | | 1,017,107 | | | | 703,377 | | | | 1,938,698 | |
Interest expense, fees and amortization of offering costs1 | | | 119,473 | | | | 472,114 | | | | 342,000 | | | | 1,036,569 | |
| | | | |
Total expenses | | | 643,870 | | | | 1,489,221 | | | | 1,045,377 | | | | 2,975,267 | |
Less: | | | | | | | | | | | | | | | | |
Fees waived by the Manager | | | (34,860 | ) | | | (12 | ) | | | (32 | ) | | | (84 | ) |
Reorganization costs reimbursed by the Manager | | | (24,173 | ) | | | — | | | | — | | | | — | |
| | | | |
Total expenses after fees waived and/or reimbursed | | | 584,837 | | | | 1,489,209 | | | | 1,045,345 | | | | 2,975,183 | |
| | | | |
Net investment income | | | 1,414,633 | | | | 4,664,123 | | | | 3,665,363 | | | | 11,023,834 | |
| | | | |
| | | | | | | | | | | | | | | | |
| Realized and Unrealized Gain (Loss) | |
| Net realized gain (loss) from: | | | | | | | | | | | | | | | | |
Investments | | | 64,043 | | | | 1,177,003 | | | | 310,356 | | | | 222,942 | |
Financial futures contracts | | | (156,495 | ) | | | (666,155 | ) | | | (403,471 | ) | | | (883,824 | ) |
| | | | |
| | | (92,452 | ) | | | 510,848 | | | | (93,115 | ) | | | (660,882 | ) |
| | | | |
| Net change in unrealized appreciation (depreciation) on: | | | | | | | | | | | | | | | | |
Investments | | | 897,090 | | | | 4,559,501 | | | | 3,412,183 | | | | 12,735,434 | |
Financial futures contracts | | | (3,046 | ) | | | 5,891 | | | | (30,775 | ) | | | (35,476 | ) |
| | | | |
| | | 894,044 | | | | 4,565,392 | | | | 3,381,408 | | | | 12,699,958 | |
| | | | |
Net realized and unrealized gain | | | 801,592 | | | | 5,076,240 | | | | 3,288,293 | | | | 12,039,076 | |
| | | | |
Net Increase in Net Assets Applicable to Common Shareholders Resulting from Operations | | $ | 2,216,225 | | | $ | 9,740,363 | | | $ | 6,953,656 | | | $ | 23,062,910 | |
| | | | |
1 Related to TOB Trusts, VRDP Shares and/or VMTP Shares. | |
| | | | | | |
| See Notes to Financial Statements. | | | | |
| | | | | | | |
| 64 | | SEMI-ANNUAL REPORT | | FEBRUARY 29, 2016 | | |
| | | | | | | | | | | | |
| Six Months Ended February 29, 2016 (Unaudited) | | BlackRock
Municipal
Income Trust II
(BLE) | | | BlackRock
MuniHoldings
Investment
Quality Fund
(MFL) | | | BlackRock
MuniVest
Fund, Inc.
(MVF) | |
| | | | | | | | | | | | |
| Investment Income | |
Interest — unaffiliated | | $ | 13,602,572 | | | $ | 21,019,632 | | | $ | 24,755,101 | |
Dividends — affiliated | | | 471 | | | | 432 | | | | 460 | |
| | | | |
Total income | | | 13,603,043 | | | | 21,020,064 | | | | 24,755,561 | |
| | | | |
| | | | | | | | | | | | |
| Expenses | |
Investment advisory | | | 1,598,862 | | | | 2,566,423 | | | | 2,603,139 | |
Professional | | | 39,352 | | | | 54,855 | | | | 57,401 | |
Liquidity fees | | | — | | | | 13,945 | | | | — | |
Rating agency | | | 18,059 | | | | 18,174 | | | | 18,141 | |
Transfer agent | | | 19,328 | | | | 23,283 | | | | 27,540 | |
Accounting services | | | 29,989 | | | | 59,534 | | | | 64,275 | |
Custodian | | | 14,006 | | | | 19,885 | | | | 20,554 | |
Registration | | | 3,940 | | | | 4,787 | | | | 10,740 | |
Officer and Trustees | | | 19,233 | | | | 24,866 | | | | 32,702 | |
Printing | | | 5,508 | | | | 7,249 | | | | 7,495 | |
Remarketing fees on Preferred Shares | | | — | | | | 13,692 | | | | — | |
Miscellaneous | | | 23,049 | | | | 25,766 | | | | 28,647 | |
| | | | |
Total expenses excluding interest expense, fees and amortization of offering costs | | | 1,771,326 | | | | 2,832,459 | | | | 2,870,634 | |
Interest expense, fees and amortization of offering costs1 | | | 998,338 | | | | 1,540,077 | | | | 1,735,295 | |
| | | | |
Total expenses | | | 2,769,664 | | | | 4,372,536 | | | | 4,605,929 | |
Less fees waived by the Manager | | | (145 | ) | | | (122,549 | ) | | | (53 | ) |
| | | | |
Total expenses after fees waived | | | 2,769,519 | | | | 4,249,987 | | | | 4,605,876 | |
| | | | |
Net investment income | | | 10,833,524 | | | | 16,770,077 | | | | 20,149,685 | |
| | | | |
| | | | | | | | | | | | |
| Realized and Unrealized Gain (Loss) | |
| Net realized gain (loss) from: | | | | | | | | | | | | |
Investments | | | (1,022,020 | ) | | | 1,461,724 | | | | 622,114 | |
Financial futures contracts | | | (702,883 | ) | | | (1,447,375 | ) | | | (1,242,035 | ) |
| | | | |
| | | (1,724,903 | ) | | | 14,349 | | | | (619,921 | ) |
| | | | |
| Net change in unrealized appreciation (depreciation) on: | | | | | | | | | | | | |
Investments | | | 10,026,689 | | | | 12,576,594 | | | | 10,227,337 | |
Financial futures contracts | | | 62,241 | | | | (141,211 | ) | | | 34,710 | |
| | | | |
| | | 10,088,930 | | | | 12,435,383 | | | | 10,262,047 | |
| | | | |
Net realized and unrealized gain | | | 8,364,027 | | | | 12,449,732 | | | | 9,642,126 | |
| | | | |
Net Increase in Net Assets Applicable to Common Shareholders Resulting from Operations | | $ | 19,197,551 | | | $ | 29,219,809 | | | $ | 29,791,811 | |
| | | | |
1 Related to TOB Trusts, VRDP Shares and/or VMTP Shares. | |
| | | | | | |
| See Notes to Financial Statements. | | | | |
| | | | | | | |
| | SEMI-ANNUAL REPORT | | FEBRUARY 29, 2016 | | 65 |
| | |
| Statements of Changes in Net Assets | | |
| | | | | | | | | | | | | | | | | | |
| | | BlackRock Municipal Bond
Investment Trust (BIE) | | | | | BlackRock Municipal
Bond Trust (BBK) | |
| Increase (Decrease) in Net Assets Applicable to Common Shareholders: | | Six Months Ended
February 29, 2016
(Unaudited) | | | Year Ended August 31,
2015 | | | | | Six Months Ended
February 29, 2016
(Unaudited) | | | Year Ended
August 31,
2015 | |
| | | | | | | | | | | | | | | | | | |
| Operations | |
Net investment income | | $ | 1,414,633 | | | $ | 3,004,560 | | | | | $ | 4,664,123 | | | $ | 9,503,477 | |
Net realized gain (loss) | | | (92,452 | ) | | | (80,744 | ) | | | | | 510,848 | | | | 1,548,099 | |
Net change in unrealized appreciation (depreciation) | | | 894,044 | | | | (956,508 | ) | | | | | 4,565,392 | | | | (1,236,436 | ) |
| | | | | | | | | | |
Net increase in net assets applicable to Common Shareholders resulting from operations | | | 2,216,225 | | | | 1,967,308 | | | | | | 9,740,363 | | | | 9,815,140 | |
| | | | | | | | | | |
| | | | | | | | | | | | | | | | | | |
| Distributions to Common Shareholders1 | |
From net investment income | | | (1,522,440 | ) | | | (3,044,880 | ) | | | | | (4,729,884 | ) | | | (10,250,183 | ) |
From net realized gain | | | — | | | | — | | | | | | (141,550 | ) | | | — | |
| | | | | | | | | | |
Decrease in net assets resulting from distributions to shareholders | | | (1,522,440 | ) | | | (3,044,880 | ) | | | | | (4,871,434 | ) | | | (10,250,183 | ) |
| | | | | | | | | | |
| | | | | | | | | | | | | | | | | | |
| Net Assets Applicable to Common Shareholders | |
Total increase (decrease) in net assets applicable to Common Shareholders | | | 693,785 | | | | (1,077,572 | ) | | | | | 4,868,929 | | | | (435,043 | ) |
Beginning of period | | | 53,249,824 | | | | 54,327,396 | | | | | | 173,363,277 | | | | 173,798,320 | |
| | | | | | | | | | |
End of period | | $ | 53,943,609 | | | $ | 53,249,824 | | | | | $ | 178,232,206 | | | $ | 173,363,277 | |
| | | | | | | | | | |
Undistributed net investment income, end of period | | $ | 636,089 | | | $ | 743,896 | | | | | $ | 2,541,279 | | | $ | 2,607,040 | |
| | | | | | | | | | |
| | | |
| | | BlackRock Municipal Income
Investment Quality Trust (BAF) | | | | | BlackRock Municipal Income
Quality Trust (BYM) | |
| Increase (Decrease) in Net Assets Applicable to Common Shareholders: | | Six Months Ended
February 29,2016
(Unaudited) | | | Year Ended August 31,
2015 | | | | | Six Months Ended
February 29, 2016
(Unaudited) | | | Year Ended August 31,
2015 | |
| | | | | | | | | | | | | | | | | | |
| Operations | |
Net investment income | | $ | 3,665,363 | | | $ | 7,230,529 | | | | | $ | 11,023,834 | | | $ | 22,246,384 | |
Net realized gain (loss) | | | (93,115 | ) | | | 106,639 | | | | | | (660,882 | ) | | | (318,886 | ) |
Net change in unrealized appreciation (depreciation) | | | 3,381,408 | | | | (1,665,179 | ) | | | | | 12,699,958 | | | | (8,510,641 | ) |
| | | | | | | | | | |
Net increase in net assets applicable to Common Shareholders resulting from operations | | | 6,953,656 | | | | 5,671,989 | | | | | | 23,062,910 | | | | 13,416,857 | |
| | | | | | | | | | |
| | | | | | | | | | | | | | | | | | |
| Distributions to Common Shareholders1 | |
From net investment income | | | (3,596,011 | ) | | | (7,192,022 | ) | | | | | (11,328,291 | ) | | | (22,656,582 | ) |
| | | | | | | | | | |
| | | | | | | | | | | | | | | | | | |
| Net Assets Applicable to Common Shareholders | |
Total increase (decrease) in net assets applicable to Common Shareholders | | | 3,357,645 | | | | (1,520,033 | ) | | | | | 11,734,619 | | | | (9,239,725 | ) |
Beginning of period | | | 138,202,721 | | | | 139,722,754 | | | | | | 401,536,088 | | | | 410,775,813 | |
| | | | | | | | | | |
End of period | | $ | 141,560,366 | | | $ | 138,202,721 | | | | | $ | 413,270,707 | | | $ | 401,536,088 | |
| | | | | | | | | | |
Undistributed net investment income, end of period | | $ | 1,718,975 | | | $ | 1,649,623 | | | | | $ | 3,548,276 | | | $ | 3,852,733 | |
| | | | | | | | | | |
1 Distributions for annual periods determined in accordance with federal income tax regulations. | | | | | | | | | | | |
| | | | | | |
| See Notes to Financial Statements. | | | | |
| | | | | | | |
| 66 | | SEMI-ANNUAL REPORT | | FEBRUARY 29, 2016 | | |
| | |
| Statements of Changes in Net Assets | | |
| | | | | | | | | | | | | | | | | | |
| | | BlackRock Municipal
Income Trust II (BLE) | | | | | BlackRock MuniHoldings
Investment Quality Fund (MFL) | |
| Increase (Decrease) in Net Assets Applicable to Common Shareholders: | | Six Months Ended
February 29, 2016
(Unaudited) | | | Year Ended
August 31,
2015 | | | | | Six Months Ended
February 29, 2016
(Unaudited) | | | Year Ended
August 31,
2015 | |
| | | | | | | | | | | | | | | | | | |
| Operations | | | | | | | | | | | |
Net investment income | | $ | 10,833,524 | | | $ | 21,686,325 | | | | | $ | 16,770,077 | | | $ | 33,545,462 | |
Net realized gain (loss) | | | (1,724,903 | ) | | | (243,116 | ) | | | | | 14,349 | | | | 138,575 | |
Net change in unrealized appreciation (depreciation) | | | 10,088,930 | | | | (4,296,064 | ) | | | | | 12,435,383 | | | | (12,049,280 | ) |
| | | | | | | | | | |
Net increase in net assets applicable to Common Shareholders resulting from operations | | | 19,197,551 | | | | 17,147,145 | | | | | | 29,219,809 | | | | 21,634,757 | |
| | | | | | | | | | |
| | | | | | | | | | | | | | | | | | |
| Distributions to Common Shareholders1 | | | | | | | | | | | |
From net investment income | | | (11,124,980 | ) | | | (22,592,238 | ) | | | | | (16,219,536 | ) | | | (32,439,071 | ) |
| | | | | | | | | | |
| | | | | | | | | | | | | | | | | | |
| Capital Share Transactions | | | | | | | | | | | |
Reinvestment of common distributions | | | — | | | | 274,680 | | | | | | — | | | | — | |
| | | | | | | | | | |
| | | | | | | | | | | | | | | | | | |
| Net Assets Applicable to Common Shareholders | | | | | | | | | | | |
Total increase (decrease) in net assets applicable to Common Shareholders | | | 8,072,571 | | | | (5,170,413 | ) | | | | | 13,000,273 | | | | (10,804,314 | ) |
Beginning of period | | | 357,868,078 | | | | 363,038,491 | | | | | | 573,885,495 | | | | 584,689,809 | |
| | | | | | | | | | |
End of period | | $ | 365,940,649 | | | $ | 357,868,078 | | | | | $ | 586,885,768 | | | $ | 573,885,495 | |
| | | | | | | | | | |
Undistributed net investment income, end of period | | $ | 3,578,581 | | | $ | 3,870,037 | | | | | $ | 9,114,076 | | | $ | 8,563,535 | |
| | | | | | | | | | |
| | | | | | | | |
| | | BlackRock
MuniVest Fund, Inc. (MVF) | |
| Increase (Decrease) in Net Assets Applicable to Common Shareholders: | | Six Months Ended
February 29, 2016
(Unaudited) | | | Year Ended
August 31,
2015 | |
| | | | | | | | |
| Operations | |
Net investment income | | $ | 20,149,685 | | | $ | 39,487,957 | |
Net realized gain (loss) | | | (619,921 | ) | | | 2,335,707 | |
Net change in unrealized appreciation (depreciation) | | | 10,262,047 | | | | (15,316,394 | ) |
| | | | | | | | |
Net increase in net assets applicable to Common Shareholders resulting from operations | | | 29,791,811 | | | | 26,507,270 | |
| | | | | | | | |
| | | | | | | | |
| Distributions to Common Shareholders1 | |
From net investment income | | | (20,639,866 | ) | | | (41,164,637 | ) |
| | | | | | | | |
| | | | | | | | |
| Capital Share Transactions | |
Reinvestment of common distributions | | | 1,247,276 | | | | 624,769 | |
| | | | | | | | |
| | | | | | | | |
| Net Assets Applicable to Common Shareholders | |
Total increase (decrease) in net assets applicable to Common Shareholders | | | 10,399,221 | | | | (14,032,598 | ) |
Beginning of period | | | 642,889,439 | | | | 656,922,037 | |
| | | | | | | | |
End of period | | $ | 653,288,660 | | | $ | 642,889,439 | |
| | | | | | | | |
Undistributed net investment income, end of period | | $ | 6,630,652 | | | $ | 7,120,833 | |
| | | | | | | | |
1 Distributions for annual periods determined in accordance with federal income tax regulations. | |
| | | | | | |
| See Notes to Financial Statements. | | | | |
| | | | | | | |
| | SEMI-ANNUAL REPORT | | FEBRUARY 29, 2016 | | 67 |
| | | | | | | | | | | | | | | | |
| Six Months Ended February 29, 2016 (Unaudited) | | BlackRock
Municipal Bond
Investment Trust
(BIE) | | | BlackRock
Municipal
Bond Trust
(BBK) | | | BlackRock
Municipal Income
Investment
Quality Trust
(BAF) | | | BlackRock
Municipal Income
Quality Trust
(BYM) | |
| | | | | | | | | | | | | | | | |
| Cash Provided by (Used for) Operating Activities | | | | | | | | | | | | | | | | |
Net increase in net assets resulting from operations | | $ | 2,216,225 | | | $ | 9,740,363 | | | $ | 6,953,656 | | | $ | 23,062,910 | |
Adjustments to reconcile net increase in net assets resulting from operations to net cash provided by (used for) operating activities: | | | | | | | | | | | | | | | | |
Proceeds from sales of long-term investments | | | 6,594,489 | | | | 36,817,238 | | | | 33,415,586 | | | | 39,676,311 | |
Purchases of long-term investments | | | (7,198,542 | ) | | | (42,995,084 | ) | | | (37,399,432 | ) | | | (34,280,587 | ) |
Net proceeds from sales (purchases) of short-term securities | | | 724,813 | | | | 5,686,594 | | | | (198,365 | ) | | | 1,383,979 | |
Amortization of premium and accretion of discount on investments | | | 124,860 | | | | (305,704 | ) | | | 399,733 | | | | (948,097 | ) |
Net realized gain on investments | | | (68,344 | ) | | | (1,177,003 | ) | | | (310,356 | ) | | | (235,012 | ) |
Net unrealized gain on investments | | | (897,090 | ) | | | (4,559,501 | ) | | | (3,412,183 | ) | | | (12,735,434 | ) |
| (Increase) decrease in assets: | | | | | | | | | | | | | | | | |
Cash pledged for financial futures contracts | | | 4,000 | | | | (55,000 | ) | | | 13,000 | | | | 46,000 | |
| Receivables: | | | | | | | | | | | | | | | | |
Interest | | | (32,796 | ) | | | 91,138 | | | | (77,573 | ) | | | (72,750 | ) |
Variation margin on financial futures contracts | | | 5,203 | | | | 22,923 | | | | 14,063 | | | | 53,392 | |
Prepaid expenses | | | 13,420 | | | | 7,005 | | | | 9,246 | | | | 3,177 | |
Other assets | | | — | | | | — | | | | — | | | | (9,053 | ) |
| Increase (decrease) in liabilities: | | | | | | | | | | | | | | | | |
| Payables: | | | | | | | | | | | | | | | | |
Interest expense and fees | | | (1,219 | ) | | | (2,404 | ) | | | (2,149 | ) | | | (6,589 | ) |
Investment advisory fees | | | (44,662 | ) | | | (156,406 | ) | | | (101,440 | ) | | | (314,096 | ) |
Officer’s and Trustees’ fees | | | 384 | | | | (1,389 | ) | | | (1,089 | ) | | | (2,931 | ) |
Other accrued expenses | | | (29,035 | ) | | | (5,093 | ) | | | (8,099 | ) | | | (14,635 | ) |
Variation margin on financial futures contracts | | | 4,031 | | | | 22,727 | | | | 11,688 | | | | 34,845 | |
| | | | |
Net cash provided by (used for) operating activities | | | 1,415,737 | | | | 3,130,404 | | | | (693,714 | ) | | | 15,641,430 | |
| | | | |
| | | | | | | | | | | | | | | | |
| Cash Provided by (Used for) Financing Activities | | | | | | | | | | | | | | | | |
Cash distributions paid to Common Shareholders | | | (1,522,440 | ) | | | (4,871,434 | ) | | | (3,596,011 | ) | | | (11,328,291 | ) |
Payments for offering costs | | | 103,840 | | | | — | | | | — | | | | — | |
Repayments of TOB Trust Certificates | | | — | | | | — | | | | — | | | | (9,750,007 | ) |
Proceeds from TOB Trust Certificates | | | — | | | | 1,741,030 | | | | 4,289,725 | | | | 5,555,725 | |
Decrease in bank overdraft | | | — | | | | — | | | | — | | | | (118,857 | ) |
Amortization of deferred offering costs | | | 2,863 | | | | — | | | | — | | | | — | |
| | | | |
Net cash provided by (used for) financing activities | | | (1,415,737 | ) | | | (3,130,404 | ) | | | 693,714 | | | | (15,641,430 | ) |
| | | | |
| Cash | | | | | | | | | | | | | | | | |
Net increase in cash | | | — | | | | — | | | | — | | | | — | |
Cash at beginning of period | | | — | | | | — | | | | — | | | | — | |
| | | | |
Cash at end of period | | | — | | | | — | | | | — | | | | — | |
| | | | |
| | | | | | | | | | | | | | | | |
| Supplemental Disclosure of Cash Flow Information | | | | | | | | | | | | | | | | |
Cash paid during the period for interest expense | | $ | 117,829 | | | $ | 474,518 | | | $ | 344,149 | | | $ | 1,043,158 | |
| | | | |
| | | | | | |
| See Notes to Financial Statements. | | | | |
| | | | | | | |
| 68 | | SEMI-ANNUAL REPORT | | FEBRUARY 29, 2016 | | |
| | | | | | | | | | | | |
| Six Months Ended February 29, 2016 (Unaudited) | | BlackRock
Municipal
Income Trust II (BLE) | | | BlackRock
MuniHoldings
Investment
Quality Fund (MFL) | | | BlackRock
MuniVest
Fund, Inc. (MVF) | |
| | | | | | | | | | | | |
| Cash Provided by Operating Activities | | | | | | | | | | | | |
Net increase in net assets resulting from operations | | $ | 19,197,551 | | | $ | 29,219,809 | | | $ | 29,791,811 | |
Adjustments to reconcile net increase in net assets resulting from operations to net cash provided by operating activities: | | | | | | | | | | | | |
Proceeds from sales of long-term investments | | | 18,015,418 | | | | 111,210,255 | | | | 54,547,766 | |
Purchases of long-term investments | | | (26,223,039 | ) | | | (105,032,541 | ) | | | (62,461,189 | ) |
Net proceeds from sales (purchases) of short-term securities | | | 6,037,811 | | | | (1,591,128 | ) | | | (3,023,711 | ) |
Amortization of premium and accretion of discount on investments | | | 270,183 | | | | 1,450,570 | | | | 909,661 | |
Net realized (gain) loss on investments | | | 1,022,020 | | | | (1,461,724 | ) | | | (622,114 | ) |
Net unrealized gain on investments | | | (10,026,689 | ) | | | (12,576,594 | ) | | | (10,227,337 | ) |
| (Increase) decrease in assets: | | | | | | | | | | | | |
Cash pledged for financial futures contracts | | | (81,000 | ) | | | 50,000 | | | | (168,000 | ) |
Receivables: | | | | | | | | | | | | |
Interest | | | (69,453 | ) | | | (14,659 | ) | | | (44,229 | ) |
Variation margin on financial futures contracts | | | 26,456 | | | | 60,330 | | | | 37,970 | |
Prepaid expenses | | | (1,204 | ) | | | 44,804 | | | | (15,322 | ) |
| Increase (decrease) in liabilities: | | | | | | | | | | | | |
Payables: | | | | | | | | | | | | |
Interest expense and fees | | | (8,320 | ) | | | (9,435 | ) | | | (15,730 | ) |
Investment advisory fees | | | (282,952 | ) | | | (476,579 | ) | | | (458,836 | ) |
Officer’s and Trustees’ fees | | | (2,846 | ) | | | 538 | | | | (3,856 | ) |
Other accrued expenses | | | (11,245 | ) | | | (12,986 | ) | | | (15,271 | ) |
Variation margin on financial futures contracts | | | 28,821 | | | | 47,134 | | | | 47,080 | |
| | | | |
Net cash provided by operating activities | | | 7,891,512 | | | | 20,907,794 | | | | 8,278,693 | |
| | | | |
| | | | | | | | | | | | |
| Cash Used for Financing Activities | | | | | | | | | | | | |
Cash distributions paid to Common Shareholders | | | (11,124,980 | ) | | | (16,219,536 | ) | | | (19,386,012 | ) |
Repayments of TOB Trust Certificates | | | — | | | | (4,696,706 | ) | | | (1,542,300 | ) |
Proceeds from TOB Trust Certificates | | | 3,233,468 | | | | — | | | | 12,650,935 | |
Decrease in bank overdraft | | | — | | | | — | | | | (1,316 | ) |
Amortization of deferred offering costs | | | — | | | | 8,448 | | | | — | |
| | | | |
Net cash used for financing activities | | | (7,891,512 | ) | | | (20,907,794 | ) | | | (8,278,693 | ) |
| | | | |
| | | | | | | | | | | | |
| Cash | | | | | | | | | | | | |
Net increase in cash | | | — | | | | — | | | | — | |
Cash at beginning of period | | | — | | | | — | | | | — | |
| | | | |
Cash at end of period | | | — | | | | — | | | | — | |
| | | | |
| | | | | | | | | | | | |
| Supplemental Disclosure of Cash Flow Information | | | | | | | | | | | | |
Cash paid during the period for interest expense | | $ | 1,006,658 | | | $ | 1,541,064 | | | $ | 1,751,025 | |
| | | | |
| | | | | | | | | | | | |
| Non-Cash Financing Activities | | | | | | | | | | | | |
Capital shares issued in reinvestment of distributions paid to Common Shareholders | | | — | | | | — | | | | 1,247,276 | |
| | | | |
| | | | | | |
| See Notes to Financial Statements. | | | | |
| | | | | | | |
| | SEMI-ANNUAL REPORT | | FEBRUARY 29, 2016 | | 69 |
| | |
| Financial Highlights | | BlackRock Municipal Bond Investment Trust (BIE) |
| | | | | | | | | | | | | | | | | | | | | | | | |
| | | Six Months Ended
February 29,
2016 (Unaudited) | | | Year Ended August 31, | |
| | | | 2015 | | | 2014 | | | 2013 | | | 2012 | | | 2011 | |
| | | | | | | | | | | | | | | | | | | | | | | | |
| Per Share Operating Performance | | | | | | | | | | | | | | | | | | | | | | | | |
Net asset value, beginning of period | | $ | 15.95 | | | $ | 16.27 | | | $ | 14.27 | | | $ | 16.88 | | | $ | 14.67 | | | $ | 15.51 | |
| | | | |
Net investment income1 | | | 0.42 | | | | 0.90 | | | | 0.93 | | | | 0.90 | | | | 0.92 | | | | 1.03 | |
Net realized and unrealized gain (loss) | | | 0.25 | | | | (0.31 | ) | | | 1.98 | | | | (2.58 | ) | | | 2.26 | | | | (0.89 | ) |
Distributions to AMPS Shareholders from net investment income | | | — | | | | — | | | | — | | | | — | | | | (0.00 | )2 | | | (0.02 | ) |
| | | | |
Net increase (decrease) from investment operations | | | 0.67 | | | | 0.59 | | | | 2.91 | | | | (1.68 | ) | | | 3.18 | | | | 0.12 | |
| | | | |
Distributions to Common Shareholders from net investment income3 | | | (0.46 | ) | | | (0.91 | ) | | | (0.91 | ) | | | (0.93 | ) | | | (0.97 | ) | | | (0.96 | ) |
| | | | |
Net asset value, end of period | | $ | 16.16 | | | $ | 15.95 | | | $ | 16.27 | | | $ | 14.27 | | | $ | 16.88 | | | $ | 14.67 | |
| | | | |
Market price, end of period | | $ | 15.54 | | | $ | 14.10 | | | $ | 14.58 | | | $ | 13.14 | | | $ | 16.61 | | | $ | 14.22 | |
| | | | |
| | | | | | | | | | | | | | | | | | | | | | | | |
| Total Return Applicable to Common Shareholders4 | | | | |
Based on net asset value | | | 4.46% | 5 | | | 4.26% | | | | 21.64% | | | | (10.35)% | | | | 22.36% | | | | 1.29% | |
| | | | |
Based on market price | | | 13.63% | 5 | | | 2.85% | | | | 18.37% | | | | (16.10)% | | | | 24.21% | | | | (2.38)% | |
| | | | |
| | | | | | | | | | | | | | | | | | | | | | | | |
| Ratios to Average Net Assets Applicable to Common Shareholders | | | | |
Total expenses | | | 2.42% | 6 | | | 1.97% | | | | 2.07% | | | | 2.09% | | | | 2.21% | 7 | | | 1.81% | 7 |
| | | | |
Total expenses after fees waived and/or reimbursed and paid indirectly | | | 2.20% | 6 | | | 1.84% | | | | 1.94% | | | | 1.96% | | | | 2.12% | 7 | | | 1.66% | 7 |
| | | | |
Total expenses after fees waived and/or reimbursed and paid indirectly and excluding interest expense, fees, and amortization of offering costs8 | | | 1.75% | 6,9 | | | 1.56% | 9 | | | 1.63% | 9 | | | 1.60% | 9 | | | 1.72% | 7,9 | | | 1.39% | 7 |
| | | | |
Net investment income | | | 5.31% | 6 | | | 5.54% | | | | 6.05% | | | | 5.45% | | | | 5.78% | 7 | | | 7.25% | 7 |
| | | | |
Distributions to AMPS Shareholders | | | — | | | | — | | | | — | | | | — | | | | 0.01% | | | | 0.13% | |
| | | | |
Net investment income to Common Shareholders | | | 5.31% | 6 | | | 5.54% | | | | 6.05% | | | | 5.45% | | | | 5.77% | | | | 7.12% | |
| | | | |
| | | | | | | | | | | | | | | | | | | | | | | | |
| Supplemental Data | | | | |
Net assets applicable to Common Shareholders, end of period (000) | | $ | 53,944 | | | $ | 53,250 | | | $ | 54,327 | | | $ | 47,647 | | | $ | 56,331 | | | $ | 48,941 | |
| | | | |
AMPS outstanding at $25,000 liquidation preference, end of period (000) | | | — | | | | — | | | | — | | | | — | | | | — | | | $ | 17,850 | |
| | | | |
Asset coverage per AMPS at $25,000 liquidation preference, end of period | | | — | | | | — | | | | — | | | | — | | | | — | | | $ | 93,546 | |
| | | | |
VRDP Shares outstanding at $100,000 liquidation value, end of period (000) | | $ | 17,800 | | | $ | 17,800 | | | $ | 17,800 | | | $ | 17,800 | | | $ | 17,800 | | | | — | |
| | | | |
Asset coverage per VRDP Shares at $100,000 liquidation value, end of period | | $ | 403,054 | | | $ | 399,156 | | | $ | 405,210 | | | $ | 367,678 | | | $ | 416,465 | | | | — | |
| | | | |
Borrowings outstanding, end of period (000) | | $ | 16,236 | | | $ | 16,236 | | | $ | 16,236 | | | $ | 16,756 | | | $ | 18,585 | | | $ | 16,276 | |
| | | | |
Portfolio turnover rate | | | 8% | | | | 17% | | | | 18% | | | | 32% | | | | 36% | | | | 25% | |
| | | | |
| | 1 | | Based on average Common Shares outstanding. |
| | 2 | | Amount is greater than $(0.005) per share. |
| | 3 | | Distributions for annual periods determined in accordance with federal income tax regulations. |
| | 4 | | Total returns based on market price, which can be significantly greater or less than the net asset value, may result in substantially different returns. Where applicable, excludes the effects of any sales charges and assumes the reinvestment of distributions. |
| | 5 | | Aggregate total return. |
| | 7 | | Does not reflect the effect of distributions to AMPS Shareholders. |
| | 8 | | Interest expense, fees and amortization of offering costs related to TOB Trusts and/or VRDP Shares. See Note 4 and Note 10 of the Notes to Financial Statements for details. |
| | 9 | | For the six months ended February 29, 2016 and the years ended August 31, 2015, August 31, 2014, August 31, 2013 and August 31, 2012, the total expense ratio after fees waived and excluding interest expense, fees, amortization of offering costs, liquidity and remarketing fees was 1.66%, 1.24%, 1.27%, 1.27% and 1.42%, respectively. |
| | | | | | |
| See Notes to Financial Statements. | | | | |
| | | | | | | |
| 70 | | SEMI-ANNUAL REPORT | | FEBRUARY 29, 2016 | | |
| | |
| Financial Highlights | | BlackRock Municipal Bond Trust (BBK) |
| | | | | | | | | | | | | | | | | | | | | | | | |
| | | Six Months Ended
February 29,
2016 (Unaudited) | | | Year Ended August 31, | |
| | | | 2015 | | | 2014 | | | 2013 | | | 2012 | | | 2011 | |
| | | | | | | | | | | | | | | | | | | | | | | | |
| Per Share Operating Performance | | | | | | | | | | | | | | | | | | | | | | | | |
Net asset value, beginning of period | | $ | 16.49 | | | $ | 16.54 | | | $ | 14.18 | | | $ | 16.79 | | | $ | 14.48 | | | $ | 15.29 | |
| | | | |
Net investment income1 | | | 0.44 | | | | 0.90 | | | | 0.97 | | | | 0.96 | | | | 1.01 | | | | 1.14 | |
Net realized and unrealized gain (loss) | | | 0.49 | | | | 0.03 | | | | 2.43 | | | | (2.46 | ) | | | 2.37 | | | | (0.87 | ) |
Distributions to AMPS Shareholders from net investment income | | | — | | | | — | | | | — | | | | — | | | | (0.01 | ) | | | (0.03 | ) |
| | | | |
Net increase (decrease) from investment operations | | | 0.93 | | | | 0.93 | | | | 3.40 | | | | (1.50 | ) | | | 3.37 | | | | 0.24 | |
| | | | |
| Distributions to Common Shareholders:2 | | | | | | | | | | | | | | | | | | | | | | | | |
From net investment income | | | (0.45 | ) | | | (0.98 | ) | | | (0.96 | ) | | | (0.97 | ) | | | (1.06 | ) | | | (1.05 | ) |
From net realized gain | | | (0.01 | ) | | | — | | | | (0.08 | ) | | | (0.14 | ) | | | — | | | | — | |
| | | | |
Total distributions to Common Shareholders | | | (0.46 | ) | | | (0.98 | ) | | | (1.04 | ) | | | (1.11 | ) | | | (1.06 | ) | | | (1.05 | ) |
| | | | |
Net asset value, end of period | | $ | 16.96 | | | $ | 16.49 | | | $ | 16.54 | | | $ | 14.18 | | | $ | 16.79 | | | $ | 14.48 | |
| | | | |
Market price, end of period | | $ | 16.78 | | | $ | 15.23 | | | $ | 15.59 | | | $ | 13.49 | | | $ | 17.16 | | | $ | 14.86 | |
| | | | |
| | | | | | | | | | | | | | | | | | | | | | | | |
| Total Return Applicable to Common Shareholders3 | | | | | | | | | | | | | | | | | | | | | | | | |
Based on net asset value | | | 5.85% | 4 | | | 5.96% | | | | 25.27% | | | | (9.52)% | | | | 23.96% | | | | 2.02% | |
| | | | |
Based on market price | | | 13.39% | 4 | | | 3.83% | | | | 24.11% | | | | (15.78)% | | | | 23.45% | | | | 1.38% | |
| | | | |
| | | | | | | | | | | | | | | | | | | | | | | | |
| Ratios to Average Net Assets Applicable to Common Shareholders | | | | | | | | | | | | | | | | | | | | | | | | |
Total expenses | | | 1.70% | 5 | | | 1.73% | | | | 1.84% | | | | 1.82% | | | | 1.69% | 6 | | | 1.33% | 6 |
| | | | |
Total expenses after fees waived and paid indirectly | | | 1.70% | 5 | | | 1.73% | | | | 1.84% | | | | 1.82% | | | | 1.64% | 6 | | | 1.19% | 6 |
| | | | |
Total expenses after fees waived and paid indirectly and excluding interest expense, fees and amortization of offering costs7 | | | 1.16% | 5 | | | 1.16% | | | | 1.19% | | | | 1.17% | | | | 1.18% | 6,8 | | | 1.16% | 6 |
| | | | |
Net investment income | | | 5.33% | 5 | | | 5.41% | | | | 6.29% | | | | 5.85% | | | | 6.39% | 6 | | | 8.15% | 6 |
| | | | |
Distributions to AMPS Shareholders | | | — | | | | — | | | | — | | | | — | | | | 0.04% | | | | 0.19% | |
| | | | |
Net investment income to Common Shareholders | | | 5.33% | 5 | | | 5.41% | | | | 6.29% | | | | 5.85% | | | | 6.35% | | | | 7.96% | |
| | | | |
| | | | | | | | | | | | | | | | | | | | | | | | |
| Supplemental Data | | | | | | | | | | | | | | | | | | | | | | | | |
Net assets applicable to Common Shareholders, end of period (000) | | $ | 178,232 | | | $ | 173,363 | | | $ | 173,798 | | | $ | 149,003 | | | $ | 176,216 | | | $ | 151,471 | |
| | | | |
AMPS outstanding at $25,000 liquidation preference, end of period (000) | | | — | | | | — | | | | — | | | | — | | | | — | | | $ | 79,900 | |
| | | | |
Asset coverage per AMPS at $25,000 liquidation preference, end of period | | | — | | | | — | | | | — | | | | — | | | | — | | | $ | 72,394 | |
| | | | |
VMTP Shares outstanding at $100,000 liquidation value, end of period (000) | | $ | 79,900 | | | $ | 79,900 | | | $ | 79,900 | | | $ | 79,900 | | | $ | 79,900 | | | | — | |
| | | | |
Asset coverage per VMTP Shares at $100,000 liquidation value, end of period | | $ | 323,069 | | | $ | 316,975 | | | $ | 317,520 | | | $ | 286,487 | | | $ | 320,545 | | | | — | |
| | | | |
Borrowings outstanding, end of period (000) | | $ | 21,236 | | | $ | 19,495 | | | $ | 19,495 | | | $ | 17,039 | | | $ | 14,489 | | | $ | 7,399 | |
| | | | |
Portfolio turnover rate | | | 13% | | | | 34% | | | | 32% | | | | 32% | | | | 46% | | | | 27% | |
| | | | |
| | 1 | | Based on average Common Shares outstanding. |
| | 2 | | Distributions for annual periods determined in accordance with federal income tax regulations. |
| | 3 | | Total returns based on market price, which can be significantly greater or less than the net asset value, may result in substantially different returns. Where applicable, excludes the effects of any sales charges and assumes the reinvestment of distributions. |
| | 4 | | Aggregate total return. |
| | 6 | | Does not reflect the effect of distributions to AMPS Shareholders. |
| | 7 | | Interest expense, fees and amortization of offering costs related to TOB Trusts and/or VMTP Shares. See Note 4 and Note 10 of the Notes to Financial Statements for details. |
| | 8 | | For the year ended August 31, 2012, the total expense ratio after fees waived and paid indirectly and excluding interest expense, fees, amortization of offering costs, liquidity and remarketing fees was 1.16%. |
| | | | | | |
| See Notes to Financial Statements. | | | | |
| | | | | | | |
| | SEMI-ANNUAL REPORT | | FEBRUARY 29, 2016 | | 71 |
| | |
| Financial Highlights | | BlackRock Municipal Income Investment Quality Trust (BAF) |
| | | | | | | | | | | | | | | | | | | | | | | | |
| | | Six Months Ended
February 29,
2016 (Unaudited) | | | Year Ended August 31, | |
| | | | 2015 | | | 2014 | | | 2013 | | | 2012 | | | 2011 | |
| | | | | | | | | | | | | | | | | | | | | | | | |
| Per Share Operating Performance | | | | | | | | | | | | | | | | | | | | | | | | |
Net asset value, beginning of period | | $ | 15.80 | | | $ | 15.97 | | | $ | 13.83 | | | $ | 16.53 | | | $ | 14.50 | | | $ | 15.08 | |
| | | | |
Net investment income1 | | | 0.42 | | | | 0.83 | | | | 0.83 | | | | 0.81 | | | | 0.83 | | | | 0.91 | |
Net realized and unrealized gain (loss) | | | 0.37 | | | | (0.18 | ) | | | 2.13 | | | | (2.68 | ) | | | 2.09 | | | | (0.58 | ) |
Distributions to AMPS Shareholders from net investment income | | | — | | | | — | | | | — | | | | — | | | | (0.00 | )2 | | | (0.02 | ) |
| | | | |
Net increase (decrease) from investment operations | | | 0.79 | | | | 0.65 | | | | 2.96 | | | | (1.87 | ) | | | 2.92 | | | | 0.31 | |
| | | | |
Distributions to Common Shareholders from net investment income3 | | | (0.41 | ) | | | (0.82 | ) | | | (0.82 | ) | | | (0.83 | ) | | | (0.89 | ) | | | (0.89 | ) |
| | | | |
Net asset value, end of period | | $ | 16.18 | | | $ | 15.80 | | | $ | 15.97 | | | $ | 13.83 | | | $ | 16.53 | | | $ | 14.50 | |
| | | | |
Market price, end of period | | $ | 15.21 | | | $ | 13.89 | | | $ | 14.18 | | | $ | 12.82 | | | $ | 16.24 | | | $ | 13.92 | |
| | | | |
| | | | | | | | | | | | | | | | | | | | | | | | |
| Total Return Applicable to Common Shareholders4 | | | | |
Based on net asset value | | | 5.30% | 5 | | | 4.71% | | | | 22.67% | | | | (11.69)% | | | | 20.76% | | | | 2.62% | |
| | | | |
Based on market price | | | 12.59% | 5 | | | 3.68% | | | | 17.50% | | | | (16.68)% | | | | 23.59% | | | | (5.01)% | |
| | | | |
| | | | | | | | | | | | | | | | | | | | | | | | |
| Ratios to Average Net Assets Applicable to Common Shareholders | | | | |
Total expenses | | | 1.50% | 6 | | | 1.50% | | | | 1.58% | | | | 1.63% | | | | 1.49% | 7 | | | 1.25% | 7 |
| | | | |
Total expenses after fees waived and paid indirectly | | | 1.50% | 6 | | | 1.50% | | | | 1.58% | | | | 1.63% | | | | 1.49% | 7 | | | 1.23% | 7 |
| | | | |
Total expenses after fees waived and paid indirectly and excluding interest expense, fees and amortization of offering costs8 | | | 1.01% | 6 | | | 1.00% | | | | 1.03% | | | | 1.03% | | | | 1.06% | 7,9 | | | 1.09% | 7 |
| | | | |
Net investment income | | | 5.27% | 6 | | | 5.16% | | | | 5.56% | | | | 5.02% | | | | 5.31% | 7 | | | 6.51% | 7 |
| | | | |
Distributions to AMPS Shareholders | | | — | | | | — | | | | — | | | | — | | | | 0.02% | | | | 0.12% | |
| | | | |
Net investment income to Common Shareholders | | | 5.27% | 6 | | | 5.16% | | | | 5.56% | | | | 5.02% | | | | 5.29% | | | | 6.39% | |
| | | | |
| | | | | | | | | | | | | | | | | | | | | | | | |
| Supplemental Data | | | | |
Net assets applicable to Common Shareholders, end of period (000) | | $ | 141,560 | | | $ | 138,203 | | | $ | 139,723 | | | $ | 120,962 | | | $ | 144,587 | | | $ | 126,783 | |
| | | | |
AMPS outstanding at $25,000 liquidation preference, end of period (000) | | | — | | | | — | | | | — | | | | — | | | | — | | | $ | 42,275 | |
| | | | |
Asset coverage per AMPS at $25,000 liquidation preference, end of period | | | — | | | | — | | | | — | | | | — | | | | — | | | $ | 99,975 | |
| | | | |
VMTP Shares outstanding at $100,000 liquidation value, end of period (000) | | $ | 42,200 | | | $ | 42,200 | | | $ | 42,200 | | | $ | 42,200 | | | $ | 42,200 | | | | — | |
| | | | |
Asset coverage per VMTP Shares at $100,000 liquidation value, end of period | | $ | 435,451 | | | $ | 427,495 | | | $ | 431,097 | | | $ | 386,639 | | | $ | 442,624 | | | | — | |
| | | | |
Borrowings outstanding, end of period (000) | | $ | 37,759 | | | $ | 33,470 | | | $ | 32,345 | | | $ | 33,845 | | | $ | 36,497 | | | $ | 22,266 | |
| | | | |
Portfolio turnover rate | | | 16% | | | | 13% | | | | 26% | | | | 43% | | | | 51% | | | | 33% | |
| | | | |
| | 1 | | Based on average Common Shares outstanding. |
| | 2 | | Amount is greater than $(0.005) per share. |
| | 3 | | Distributions for annual periods determined in accordance with federal income tax regulations. |
| | 4 | | Total returns based on market price, which can be significantly greater or less than the net asset value, may result in substantially different returns. Where applicable, excludes the effects of any sales charges and assumes the reinvestment of distributions. |
| | 5 | | Aggregate total return. |
| | 7 | | Does not reflect the effect of distributions to AMPS Shareholders. |
| | 8 | | Interest expense, fees and amortization of offering costs related to TOB Trusts and/or VMTP Shares. See Note 4 and Note 10 of the Notes to Financial Statements for details. |
| | 9 | | For the year ended August 31, 2012, the total expense ratio after fees waived and paid indirectly and excluding interest expense, fees, amortization of offering costs, liquidity and remarketing fees was 1.05%. |
| | | | | | |
| See Notes to Financial Statements. | | | | |
| | | | | | | |
| 72 | | SEMI-ANNUAL REPORT | | FEBRUARY 29, 2016 | | |
| | |
| Financial Highlights | | BlackRock Municipal Income Quality Trust (BYM) |
| | | | | | | | | | | | | | | | | | | | | | | | |
| | | Six Months Ended
February 29,
2016 (Unaudited) | | | Year Ended August 31, | |
| | | | 2015 | | | 2014 | | | 2013 | | | 2012 | | | 2011 | |
| | | | | | | | | | | | | | | | | | | | | | | | |
| Per Share Operating Performance | | | | | | | | | | | | | | | | | | | | | | | | |
Net asset value, beginning of period | | $ | 15.21 | | | $ | 15.56 | | | $ | 13.46 | | | $ | 16.11 | | | $ | 14.09 | | | $ | 14.64 | |
| | | | |
Net investment income1 | | | 0.42 | | | | 0.84 | | | | 0.86 | | | | 0.91 | | | | 0.93 | | | | 0.97 | |
Net realized and unrealized gain (loss) | | | 0.45 | | | | (0.33 | ) | | | 2.16 | | | | (2.62 | ) | | | 2.02 | | | | (0.58 | ) |
Distributions to AMPS Shareholders from net investment income | | | — | | | | — | | | | — | | | | — | | | | (0.00 | )2 | | | (0.02 | ) |
| | | | |
Net increase (decrease) from investment operations | | | 0.87 | | | | 0.51 | | | | 3.02 | | | | (1.71 | ) | | | 2.95 | | | | 0.37 | |
| | | | |
Distributions to Common Shareholders from net investment income3 | | | (0.43 | ) | | | (0.86 | ) | | | (0.92 | ) | | | (0.94 | ) | | | (0.93 | ) | | | (0.92 | ) |
| | | | |
Net asset value, end of period | | $ | 15.65 | | | $ | 15.21 | | | $ | 15.56 | | | $ | 13.46 | | | $ | 16.11 | | | $ | 14.09 | |
| | | | |
Market price, end of period | | $ | 14.85 | | | $ | 13.67 | | | $ | 13.96 | | | $ | 12.59 | | | $ | 16.73 | | | $ | 13.85 | |
| | | | |
| | | | | | | | | | | | | | | | | | | | | | | | |
| Total Return Applicable to Common Shareholders4 | | | | |
Based on net asset value | | | 5.99% | 5 | | | 3.85% | | | | 23.69% | | | | (11.13)% | | | | 21.54% | | | | 3.09% | |
| | | | |
Based on market price | | | 11.90% | 5 | | | 4.03% | | | | 18.65% | | | | (19.96)% | | | | 28.40% | | | | (2.79)% | |
| | | | |
| | | | | | | | | | | | | | | | | | | | | | | | |
| Ratios to Average Net Assets Applicable to Common Shareholders | | | | |
Total expenses | | | 1.47% | 6 | | | 1.47% | | | | 1.55% | | | | 1.55% | | | | 1.46% | 7 | | | 1.25% | 7 |
| | | | |
Total expenses after fees waived and paid indirectly | | | 1.47% | 6 | | | 1.47% | | | | 1.55% | | | | 1.55% | | | | 1.46% | 7 | | | 1.24% | 7 |
| | | | |
Total expenses after fees waived and paid indirectly and excluding interest expense, fees and amortization of offering costs8 | | | 0.96% | 6 | | | 0.96% | | | | 0.98% | | | | 0.96% | | | | 1.00% | 7,9 | | | 1.07% | 7 |
| | | | |
Net investment income | | | 5.43% | 6 | | | 5.42% | | | | 5.89% | | | | 5.77% | | | | 6.12% | 7 | | | 7.15% | 7 |
| | | | |
Distributions to AMPS Shareholders | | | — | | | | — | | | | — | | | | — | | | | 0.03% | | | | 0.14% | |
| | | | |
Net investment income to Common Shareholders | | | 5.43% | 6 | | | 5.42% | | | | 5.89% | | | | 5.77% | | | | 6.09% | | | | 7.01% | |
| | | | |
| | | | | | | | | | | | | | | | | | | | | | | | |
| Supplemental Data | | | | |
Net assets applicable to Common Shareholders, end of period (000) | | $ | 413,271 | | | $ | 401,536 | | | $ | 410,776 | | | $ | 355,372 | | | $ | 424,785 | | | $ | 371,014 | |
| | | | |
AMPS outstanding at $25,000 liquidation preference, end of period (000) | | | — | | | | — | | | | — | | | | — | | | | — | | | $ | 137,250 | |
| | | | |
Asset coverage per AMPS at $25,000 liquidation preference, end of period | | | — | | | | — | | | | — | | | | — | | | | — | | | $ | 92,580 | |
| | | | |
VMTP Shares outstanding at $100,000 liquidation value, end of period (000) | | $ | 137,200 | | | $ | 137,200 | | | $ | 137,200 | | | $ | 137,200 | | | $ | 137,200 | | | | — | |
| | | | |
Asset coverage per VMTP Shares at $100,000 liquidation value, end of period | | $ | 401,218 | | | $ | 392,665 | | | $ | 399,399 | | | $ | 359,018 | | | $ | 409,610 | | | | — | |
| | | | |
Borrowings outstanding, end of period (000) | | $ | 97,624 | | | $ | 101,818 | | | $ | 93,816 | | | $ | 114,948 | | | $ | 105,454 | | | $ | 85,964 | |
| | | | |
Portfolio turnover rate | | | 5% | | | | 12% | | | | 20% | | | | 24% | | | | 17% | | | | 19% | |
| | | | |
| | 1 | | Based on average Common Shares outstanding. |
| | 2 | | Amount is greater than $(0.005) per share. |
| | 3 | | Distributions for annual periods determined in accordance with federal income tax regulations. |
| | 4 | | Total returns based on market price, which can be significantly greater or less than the net asset value, may result in substantially different returns. Where applicable, excludes the effects of any sales charges and assumes the reinvestment of distributions. |
| | 5 | | Aggregate total return. |
| | 7 | | Does not reflect the effect of distributions to AMPS Shareholders. |
| | 8 | | Interest expense, fees and amortization of offering costs related to TOB Trusts and/or VMTP Shares. See Note 4 and Note 10 of the Notes to Financial Statements for details. |
| | 9 | | For the year ended August 31, 2012, the total expense ratio after fees waived and paid indirectly and excluding interest expense, fees, amortization of offering costs, liquidity and remarketing fees was 0.99%. |
| | | | | | |
| See Notes to Financial Statements. | | | | |
| | | | | | | |
| | SEMI-ANNUAL REPORT | | FEBRUARY 29, 2016 | | 73 |
| | |
| Financial Highlights | | BlackRock Municipal Income Trust II (BLE) |
| | | | | | | | | | | | | | | | | | | | | | | | |
| | | Six Months Ended
February 29,
2016 (Unaudited) | | | Year Ended August 31, | |
| | | | 2015 | | | 2014 | | | 2013 | | | 2012 | | | 2011 | |
| | | | | | | | | | | | | | | | | | | | | | | | |
| Per Share Operating Performance | | | | | | | | | | | | | | | | | | | | | | | | |
Net asset value, beginning of period | | $ | 15.25 | | | $ | 15.48 | | | $ | 13.32 | | | $ | 16.10 | | | $ | 13.96 | | | $ | 14.63 | |
| | | | |
Net investment income1 | | | 0.46 | | | | 0.92 | | | | 0.93 | | | | 0.97 | | | | 1.02 | | | | 1.08 | |
Net realized and unrealized gain (loss) | | | 0.35 | | | | (0.19 | ) | | | 2.22 | | | | (2.72 | ) | | | 2.14 | | | | (0.73 | ) |
Distributions to AMPS Shareholders from net investment income | | | — | | | | — | | | | — | | | | — | | | | (0.01 | ) | | | (0.02 | ) |
| | | | |
Net increase (decrease) from investment operations | | | 0.81 | | | | 0.73 | | | | 3.15 | | | | (1.75 | ) | | | 3.15 | | | | 0.33 | |
| | | | |
Distributions to Common Shareholders from net investment income2 | | | (0.47 | ) | | | (0.96 | ) | | | (0.99 | ) | | | (1.03 | ) | | | (1.01 | ) | | | (1.00 | ) |
| | | | |
Net asset value, end of period | | $ | 15.59 | | | $ | 15.25 | | | $ | 15.48 | | | $ | 13.32 | | | $ | 16.10 | | | $ | 13.96 | |
| | | | |
Market price, end of period | | $ | 15.57 | | | $ | 14.18 | | | $ | 14.70 | | | $ | 13.20 | | | $ | 16.74 | | | $ | 14.13 | |
| | | | |
| | | | | | | | | | | | | | | | | | | | | | | | |
| Total Return Applicable to Common Shareholders3 | | | | |
Based on net asset value | | | 5.46% | 4 | | | 5.01% | | | | 24.73% | | | | (11.60)% | | | | 23.25% | | | | 2.70% | |
| | | | |
Based on market price | | | 13.28% | 4 | | | 2.83% | | | | 19.52% | | | | (15.75)% | | | | 26.61% | | | | (0.07)% | |
| | | | |
| | | | | | | | | | | | | | | | | | | | | | | | |
| Ratios to Average Net Assets Applicable to Common Shareholders | | | | |
Total expenses | | | 1.54% | 5 | | | 1.55% | | | | 1.64% | | | | 1.67% | | | | 1.55% | 6 | | | 1.18% | 6 |
| | | | |
Total expenses after fees waived and paid indirectly | | | 1.54% | 5 | | | 1.55% | | | | 1.64% | | | | 1.67% | | | | 1.48% | 6 | | | 1.10% | 6 |
| | | | |
Total expenses after fees waived and paid indirectly and excluding interest expense, fees and amortization of offering costs7 | | | 0.98% | 5 | | | 0.98% | | | | 1.01% | | | | 1.00% | | | | 0.96% | 6,8 | | | 1.01% | 6 |
| | | | |
Net investment income | | | 6.01% | 5 | | | 5.94% | | | | 6.49% | | | | 6.17% | | | | 6.74% | 6 | | | 7.94% | 6 |
| | | | |
Distributions to AMPS Shareholders | | | — | | | | — | | | | — | | | | — | | | | 0.03% | | | | 0.17% | |
| | | | |
Net investment income to Common Shareholders | | | 6.01% | 5 | | | 5.94% | | | | 6.49% | | | | 6.17% | | | | 6.71% | | | | 7.77% | |
| | | | |
| | | | | | | | | | | | | | | | | | | | | | | | |
| Supplemental Data | | | | |
Net assets applicable to Common Shareholders, end of period (000) | | $ | 365,941 | | | $ | 357,868 | | | $ | 363,038 | | | $ | 312,329 | | | $ | 376,774 | | | $ | 325,713 | |
| | | | |
AMPS outstanding at $25,000 liquidation preference, end of period (000) | | | — | | | | — | | | | — | | | | — | | | | — | | | $ | 151,300 | |
| | | | |
Asset coverage per AMPS at $25,000 liquidation preference, end of period | | | — | | | | — | | | | — | | | | — | | | | — | | | $ | 78,819 | |
| | | | |
VMTP Shares outstanding at $100,000 liquidation value, end of period (000) | | $ | 151,300 | | | $ | 151,300 | | | $ | 151,300 | | | $ | 151,300 | | | $ | 151,300 | | | | — | |
| | | | |
Asset coverage per VMTP Shares at $100,000 liquidation value, end of period | | $ | 341,864 | | | $ | 336,529 | | | $ | 339,946 | | | $ | 306,430 | | | $ | 349,025 | | | | — | |
| | | | |
Borrowings outstanding, end of period (000) | | $ | 71,925 | | | $ | 68,692 | | | $ | 68,692 | | | $ | 73,531 | | | $ | 88,876 | | | $ | 43,451 | |
| | | | |
Portfolio turnover rate | | | 3% | | | | 10% | | | | 16% | | | | 17% | | | | 24% | | | | 16% | |
| | | | |
| | 1 | | Based on average Common Shares outstanding. |
| | 2 | | Distributions for annual periods determined in accordance with federal income tax regulations. |
| | 3 | | Total returns based on market price, which can be significantly greater or less than the net asset value, may result in substantially different returns. Where applicable, excludes the effects of any sales charges and assumes the reinvestment of distributions. |
| | 4 | | Aggregate total return. |
| | 6 | | Does not reflect the effect of distributions to AMPS Shareholders. |
| | 7 | | Interest expense, fees and amortization of offering costs related to TOB Trusts and/or VMTP Shares. See Note 4 and Note 10 of the Notes to Financial Statements for details. |
| | 8 | | For the year ended August 31, 2012, the total expense ratio after fees waived and paid indirectly and excluding interest expense, fees, amortization of offering costs, liquidity and remarketing fees was 0.94%. |
| | | | | | |
| See Notes to Financial Statements. | | | | |
| | | | | | | |
| 74 | | SEMI-ANNUAL REPORT | | FEBRUARY 29, 2016 | | |
| | |
| Financial Highlights | | BlackRock MuniHoldings Investment Quality Fund (MFL) |
| | | | | | | | | | | | | | | | | | | | | | | | |
| | | Six Months Ended
February 29,
2016 (Unaudited) | | | Year Ended August 31, | |
| | | | 2015 | | | 2014 | | | 2013 | | | 2012 | | | 2011 | |
| | | | | | | | | | | | | | | | | | | | | | | | |
| Per Share Operating Performance | | | | | | | | | | | | | | | | | | | | | | | | |
Net asset value, beginning of period | | $ | 15.18 | | | $ | 15.46 | | | $ | 13.27 | | | $ | 15.96 | | | $ | 14.00 | | | $ | 14.69 | |
| | | | |
Net investment income1 | | | 0.44 | | | | 0.89 | | | | 0.89 | | | | 0.87 | | | | 0.86 | | | | 0.95 | |
Net realized and unrealized gain (loss) | | | 0.33 | | | | (0.31 | ) | | | 2.16 | | | | (2.66 | ) | | | 2.02 | | | | (0.71 | ) |
Distributions to AMPS Shareholders from net investment income | | | — | | | | — | | | | — | | | | — | | | | — | | | | (0.02 | ) |
| | | | |
Net increase (decrease) from investment operations | | | 0.77 | | | | 0.58 | | | | 3.05 | | | | (1.79 | ) | | | 2.88 | | | | 0.22 | |
| | | | |
Distributions to Common Shareholders from net investment income2 | | | (0.43 | ) | | | (0.86 | ) | | | (0.86 | ) | | | (0.90 | ) | | | (0.92 | ) | | | (0.91 | ) |
| | | | |
Net asset value, end of period | | $ | 15.52 | | | $ | 15.18 | | | $ | 15.46 | | | $ | 13.27 | | | $ | 15.96 | | | $ | 14.00 | |
| | | | |
Market price, end of period | | $ | 15.03 | | | $ | 14.06 | | | $ | 13.92 | | | $ | 12.59 | | | $ | 16.13 | | | $ | 13.84 | |
| | | | |
| | | | | | | | | | | | | | | | | | | | | | | | |
| Total Return Applicable to Common Shareholders3 | | | | |
Based on net asset value | | | 5.28% | 4 | | | 4.29% | | | | 24.24% | | | | (11.70)% | | | | 21.22% | | | | 2.01% | |
| | | | |
Based on market price | | | 10.08% | 4 | | | 7.28% | | | | 17.91% | | | | (17.11)% | | | | 23.93% | | | | 1.12% | |
| | | | |
| | | | | | | | | | | | | | | | | | | | | | | | |
| Ratios to Average Net Assets Applicable to Common Shareholders | | | | |
Total expenses | | | 1.51% | 5 | | | 1.54% | | | | 1.64% | | | | 1.71% | | | | 1.87% | | | | 1.37% | 6 |
| | | | |
Total expenses after fees waived and paid indirectly | | | 1.47% | 5 | | | 1.49% | | | | 1.57% | | | | 1.62% | | | | 1.80% | | | | 1.30% | 6 |
| | | | |
Total expenses after fees waived and paid indirectly and excluding interest expense, fees and amortization of offering costs7 | | | 0.94% | 5,8 | | | 0.95% | 8 | | | 1.19% | 8 | | | 1.29% | 8 | | | 1.39% | 8 | | | 1.14% | 6 |
| | | | |
Net investment income | | | 5.81% | 5 | | | 5.73% | | | | 6.18% | | | | 5.55% | | | | 5.76% | | | | 7.03% | 6 |
| | | | |
Distributions to AMPS Shareholders | | | — | | | | — | | | | — | | | | — | | | | — | | | | 0.18% | |
| | | | |
Net investment income to Common Shareholders | | | 5.81% | 6 | | | 5.73% | | | | 6.18% | | | | 5.55% | | | | 5.76% | | | | 6.85% | |
| | | | |
| | | | | | | | | | | | | | | | | | | | | | | | |
| Supplemental Data | | | | |
Net assets applicable to Common Shareholders, end of period (000) | | $ | 586,886 | | | $ | 573,885 | | | $ | 584,690 | | | $ | 501,810 | | | $ | 602,780 | | | $ | 528,173 | |
| | | | |
VRDP Shares outstanding at $100,000 liquidation value, end of period (000) | | $ | 274,600 | | | $ | 274,600 | | | $ | 274,600 | | | $ | 274,600 | | | $ | 274,600 | | | $ | 274,600 | |
| | | | |
Asset coverage per VRDP Shares at $100,000 liquidation value, end of period | | $ | 313,724 | | | $ | 308,990 | | | $ | 312,924 | | | $ | 282,742 | | | $ | 319,152 | | | $ | 292,343 | |
| | | | |
Borrowings outstanding, end of period (000) | | $ | 80,918 | | | $ | 85,502 | | | $ | 89,157 | | | $ | 95,959 | | | $ | 131,323 | | | $ | 74,965 | |
| | | | |
Portfolio turnover rate | | | 12% | | | | 13% | | | | 25% | | | | 59% | | | | 44% | | | | 32% | |
| | | | |
| | 1 | | Based on average Common Shares outstanding. |
| | 2 | | Distributions for annual periods determined in accordance with federal income tax regulations. |
| | 3 | | Total returns based on market price, which can be significantly greater or less than the net asset value, may result in substantially different returns. Where applicable, excludes the effects of any sales charges and assumes the reinvestment of distributions. |
| | 4 | | Aggregate total return. |
| | 6 | | Does not reflect the effect of distributions to AMPS Shareholders. |
| | 7 | | Interest expense, fees and amortization of offering costs related to TOB Trusts and/or VRDP Shares. See Note 4 and Note 10 of the Notes to Financial Statements for details. |
| | 8 | | For the six months ended February 29, 2016 and the years ended August 31, 2015, August 31, 2014, August 31, 2013 and August 31, 2012, the total expense ratio after fees waived and paid indirectly and excluding interest expense, fees, amortization of offering costs, liquidity and remarketing fees was 0.93%, 0.94%, 0.95%, 0.92%, and 0.99%. |
| | | | | | |
| See Notes to Financial Statements. | | | | |
| | | | | | | |
| | SEMI-ANNUAL REPORT | | FEBRUARY 29, 2016 | | 75 |
| | |
| Financial Highlights | | BlackRock MuniVest Fund, Inc. (MVF) |
| | | | | | | | | | | | | | | | | | | | | | | | |
| | | Six Months Ended
February 29,
2016 (Unaudited) | | | Year Ended August 31, | |
| | | | 2015 | | | 2014 | | | 2013 | | | 2012 | | | 2011 | |
| | | | | | | | | | | | | | | | | | | | | | | | |
| Per Share Operating Performance | | | | | | | | | | | | | | | | | | | | | | | | |
Net asset value, beginning of period | | $ | 10.04 | | | $ | 10.27 | | | $ | 9.14 | | | $ | 10.68 | | | $ | 9.55 | | | $ | 10.01 | |
| | | | |
Net investment income1 | | | 0.31 | | | | 0.62 | | | | 0.63 | | | | 0.67 | | | | 0.69 | | | | 0.73 | |
Net realized and unrealized gain (loss) | | | 0.15 | | | | (0.21 | ) | | | 1.18 | | | | (1.50 | ) | | | 1.16 | | | | (0.47 | ) |
Distributions to AMPS Shareholders from net investment income | | | — | | | | — | | | | — | | | | — | | | | (0.01 | ) | | | (0.02 | ) |
| | | | |
Net increase (decrease) from investment operations | | | 0.46 | | | | 0.41 | | | | 1.81 | | | | (0.83 | ) | | | 1.84 | | | | 0.24 | |
| | | | |
Distributions to Common Shareholders from net investment income2 | | | (0.32 | ) | | | (0.64 | ) | | | (0.68 | ) | | | (0.71 | ) | | | (0.71 | ) | | | (0.70 | ) |
| | | | |
Net asset value, end of period | | $ | 10.18 | | | $ | 10.04 | | | $ | 10.27 | | | $ | 9.14 | | | $ | 10.68 | | | $ | 9.55 | |
| | | | |
Market price, end of period | | $ | 10.60 | | | $ | 9.65 | | | $ | 9.83 | | | $ | 8.91 | | | $ | 11.28 | | | $ | 9.73 | |
| | | | |
| | | | | | | | | | | | | | | | | | | | | | | | |
| Total Return Applicable to Common Shareholders3 | | | | |
Based on net asset value | | | 4.68% | 4 | | | 4.27% | | | | 20.70% | | | | (8.39)% | | | | 19.85% | | | | 2.90% | |
| | | | |
Based on market price | | | 13.40% | 4 | | | 4.71% | | | | 18.50% | | | | (15.45)% | | | | 24.24% | | | | 1.11% | |
| | | | |
| | | | | | | | | | | | | | | | | | | | | | | | |
| Ratios to Average Net Assets Applicable to Common Shareholders | | | | |
Total expenses | | | 1.43% | 5 | | | 1.43% | | | | 1.49% | | | | 1.54% | | | | 1.51% | 6 | | | 1.28% | 6 |
| | | | |
Total expenses after fees waived and paid indirectly | | | 1.43% | 5 | | | 1.43% | | | | 1.49% | | | | 1.54% | | | | 1.51% | 6 | | | 1.28% | 6 |
| | | | |
Total expenses after fees waived and paid indirectly and excluding interest expense, fees and amortization of offering costs7 | | | 0.89% | 5 | | | 0.89% | | | | 0.91% | | | | 0.91% | | | | 0.98% | 6,8 | | | 1.05% | 6 |
| | | | |
Net investment income | | | 6.25% | 5 | | | 6.03% | | | | 6.53% | | | | 6.43% | | | | 6.79% | 6 | | | 7.93% | 6 |
| | | | |
Distributions to AMPS Shareholders | | | — | | | | — | | | | — | | | | — | | | | 0.05% | | | | 0.18% | |
| | | | |
Net investment income to Common Shareholders | | | 6.25% | 5 | | | 6.03% | | | | 6.53% | | | | 6.43% | | | | 6.74% | | | | 7.75% | |
| | | | |
| | | | | | | | | | | | | | | | | | | | | | | | |
| Supplemental Data | | | | |
Net assets applicable to Common Shareholders, end of period (000) | | $ | 653,289 | | | $ | 642,889 | | | $ | 656,922 | | | $ | 584,718 | | | $ | 679,207 | | | $ | 602,234 | |
| | | | |
AMPS outstanding at $25,000 liquidation preference, end of period (000) | | | — | | | | — | | | | — | | | | — | | | | — | | | $ | 243,825 | |
| | | | |
Asset coverage per AMPS at $25,000 liquidation preference, end of period | | | — | | | | — | | | | — | | | | — | | | | — | | | $ | 86,749 | |
| | | | |
VMTP Shares outstanding at $100,000 liquidation value, end of period (000) | | $ | 243,800 | | | $ | 243,800 | | | $ | 243,800 | | | $ | 243,800 | | | $ | 243,800 | | | | — | |
| | | | |
Asset coverage per VMTP Shares at $100,000 liquidation value, end of period | | $ | 367,961 | | | $ | 363,695 | | | $ | 369,451 | | | $ | 339,835 | | | $ | 378,592 | | | | — | |
| | | | |
Borrowings outstanding, end of period (000) | | $ | 159,976 | | | $ | 148,867 | | | $ | 145,111 | | | $ | 149,085 | | | $ | 199,256 | | | $ | 173,251 | |
| | | | |
Portfolio turnover rate | | | 5% | | | | 18% | | | | 14% | | | | 11% | | | | 11% | | | | 10% | |
| | | | |
| | 1 | | Based on average Common Shares outstanding. |
| | 2 | | Distributions for annual periods determined in accordance with federal income tax regulations. |
| | 3 | | Total returns based on market price, which can be significantly greater or less than the net asset value, may result in substantially different returns. Where applicable, excludes the effects of any sales charges and assumes the reinvestment of distributions. |
| | 4 | | Aggregate total return. |
| | 6 | | Does not reflect the effect of distributions to AMPS Shareholders. |
| | 7 | | Interest expense, fees and amortization of offering costs related to TOB Trusts and/or VMTP Shares. See Note 4 and Note 10 of the Notes to Financial Statements for details of municipal bonds transferred to TOB Trusts and VMTP Shares, respectively. |
| | 8 | | For the year ended August 31, 2012, the total expense ratio after fees waived and paid indirectly and excluding interest expense, fees, amortization of offering costs, liquidity and remarketing fees was 0.96%. |
| | | | | | |
| See Notes to Financial Statements. | | | | |
| | | | | | | |
| 76 | | SEMI-ANNUAL REPORT | | FEBRUARY 29, 2016 | | |
| | |
| Notes to Financial Statements (Unaudited) | | |
1. Organization:
The following are registered under the Investment Company Act of 1940, as amended (the “1940 Act”), as closed-end management investment companies and are referred to herein collectively as the “Trusts”, or individually, a “Trust”:
| | | | | | | | |
| Trust Name | | Herein Referred To As | | | Organized | | Diversification
Classification |
BlackRock Municipal Bond Investment Trust | | | BIE | | | Delaware | | Non-diversified |
BlackRock Municipal Bond Trust | | | BBK | | | Delaware | | Diversified |
BlackRock Municipal Income Investment Quality Trust | | | BAF | | | Delaware | | Non-diversified |
BlackRock Municipal Income Quality Trust | | | BYM | | | Delaware | | Diversified |
BlackRock Municipal Income Trust II | | | BLE | | | Delaware | | Diversified |
BlackRock MuniHoldings Investment Quality Fund | | | MFL | | | Massachusetts | | Non-diversified |
BlackRock MuniVest Fund, Inc. | | | MVF | | | Maryland | | Non-diversified |
The Boards of Trustees/Directors of the Trusts are collectively referred to throughout this report as the “Board of Trustees” or the “Board,” and the trustees thereof are collectively referred to throughout this report as “Trustees.” The Trusts determine and make available for publication the NAVs of their Common Shares on a daily basis.
The Trusts, together with certain other registered investment companies advised by BlackRock Advisors, LLC (the “Manager”) or its affiliates, are included in a complex of closed-end funds referred to as the Closed-End Complex.
2. Significant Accounting Policies:
The financial statements are prepared in conformity with accounting principles generally accepted in the United States of America (“U.S. GAAP”), which may require management to make estimates and assumptions that affect the reported amounts of assets and liabilities in the financial statements, disclosure of contingent assets and liabilities at the date of the financial statements and the reported amounts of increases and decreases in net assets from operations during the reporting period. Actual results could differ from those estimates. Each Trust is considered an investment company under U.S. GAAP and follows the accounting and reporting guidance applicable to investment companies. Below is a summary of significant accounting policies:
Segregation and Collateralization: In cases where a Trust enters into certain investments (e.g., financial futures contracts) or certain borrowings (e.g., TOB transactions) that would be treated as “senior securities” for 1940 Act purposes, a Trust may segregate or designate on its books and records cash or liquid assets having a market value at least equal to the amount of its future obligations under such investments or borrowings. Doing so allows the investment or borrowing to be excluded from treatment as a “senior security.” Furthermore, if required by an exchange or counterparty agreement, the Trusts may be required to deliver/deposit cash and/or securities to/with an exchange, or broker-dealer or custodian as collateral for certain investments or obligations.
Investment Transactions and Investment Income: For financial reporting purposes, investment transactions are recorded on the dates the transactions are entered into (the trade dates). Realized gains and losses on investment transactions are determined on the identified cost basis. Dividend income is recorded on the ex-dividend date. Interest income, including amortization and accretion of premiums and discounts on debt securities, is recognized on the accrual basis.
Distributions: Distributions from net investment income are declared and paid monthly. Distributions of capital gains are recorded on the ex-dividend date. The character and timing of distributions are determined in accordance with federal income tax regulations, which may differ from U.S. GAAP. Distributions to Preferred Shareholders are accrued and determined as described in Note 10.
Deferred Compensation Plan: Under the Deferred Compensation Plan (the “Plan”) approved by each Trust’s Board, the independent Trustees (“Independent Trustees”) may defer a portion of their annual complex-wide compensation. Deferred amounts earn an approximate return as though equivalent dollar amounts had been invested in common shares of certain other BlackRock Closed-End Funds selected by the Independent Trustees. This has the same economic effect for the Independent Trustees as if the Independent Trustees had invested the deferred amounts directly in certain other BlackRock Closed-End Funds.
The Plan is not funded and obligations thereunder represent general unsecured claims against the general assets of each Trust, if applicable. Deferred compensation liabilities are included in officer’s and trustees’ fees payable in the Statements of Assets and Liabilities and will remain as a liability of the Trusts until such amounts are distributed in accordance with the Plan.
Recent Accounting Standard: In April 2015, the Financial Accounting Standards Board issued guidance to simplify the presentation of debt issuance costs in financial statements. Under the new guidance, a Trust is required to present such costs in the Statements of Assets and Liabilities as a direct deduction from the carrying value of the related debt liability rather than as an asset.
The standard is effective for financial statements with fiscal years beginning after December 15, 2015 and interim periods within those fiscal years. Although the Manager is still evaluating the potential impacts of this new guidance, the Trusts’ adoption will be limited to the reclassification of any unamortized debt issuance costs on the Statements of Assets and Liabilities and modification to disclosures in the Notes to Financial Statements.
| | | | | | |
| | | | | | | |
| | SEMI-ANNUAL REPORT | | FEBRUARY 29, 2016 | | 77 |
| | |
| Notes to Financial Statements (continued) | | |
Indemnifications: In the normal course of business, a Trust enters into contracts that contain a variety of representations that provide general indemnification. A Trust’s maximum exposure under these arrangements is unknown because it involves future potential claims against a Trust, which cannot be predicted with any certainty.
Other: Expenses directly related to a Trust are charged to that Trust. Other operating expenses shared by several funds, including other funds managed by the Manager, are prorated among those funds on the basis of relative net assets or other appropriate methods.
The Trusts have an arrangement with their custodian whereby fees may be reduced by credits earned on uninvested cash balances, which, if applicable, are shown as fees paid indirectly in the Statements of Operations. The custodian imposes fees on overdrawn cash balances, which can be offset by accumulated credits earned or may result in additional custody charges. Effective October 2015, the custodian is imposing fees on certain uninvested cash balances.
3. Investment Valuation and Fair Value Measurements:
Investment Valuation Policies: The Trusts’ investments are valued at fair value (also referred to as “market value” within the financial statements) as of the close of trading on the New York Stock Exchange (“NYSE”) (generally 4:00 p.m., Eastern time). U.S. GAAP defines fair value as the price the Trusts would receive to sell an asset or pay to transfer a liability in an orderly transaction between market participants at the measurement date. The Trusts determine the fair values of their financial instruments using independent dealers or pricing services under policies approved by the Board. The BlackRock Global Valuation Methodologies Committee (the “Global Valuation Committee”) is the committee formed by management to develop global pricing policies and procedures and to provide oversight of the pricing function for the Trusts for all financial instruments.
Fair Value Inputs and Methodologies: The following methods (or “techniques”) and inputs are used to establish the fair value of each Trust’s assets and liabilities:
| • | | Municipal investments (including commitments to purchase such investments on a “when-issued” basis) are valued on the basis of prices provided by dealers or pricing services. In determining the value of a particular investment, pricing services may use certain information with respect to transactions in such investments, quotations from dealers, pricing matrixes, market transactions in comparable investments and information with respect to various relationships between investments. |
| • | | Investments in open-end U.S. mutual funds are valued at NAV each business day. |
| • | | Financial futures contracts traded on exchanges are valued at their last sale price. |
If events (e.g., a company announcement, market volatility or a natural disaster) occur that are expected to materially affect the value of such instruments, or in the event that the application of these methods of valuation results in a price for an investment that is deemed not to be representative of the market value of such investment, or if a price is not available, the investment will be valued by the Global Valuation Committee, or its delegate, in accordance with a policy approved by the Board as reflecting fair value (“Fair Valued Investments”). When determining the price for Fair Valued Investments, the Global Valuation Committee, or its delegate, seeks to determine the price that each Trust might reasonably expect to receive or pay from the current sale or purchase of that asset or liability in an arm’s-length transaction. Fair value determinations shall be based upon all available factors that the Global Valuation Committee, or its delegate, deems relevant consistent with the principles of fair value measurement. The pricing of all Fair Valued Investments is subsequently reported to the Board or a committee thereof on a quarterly basis.
Fair Value Hierarchy: Various inputs are used in determining the fair value of investments and derivative financial instruments. These inputs to valuation techniques are categorized into a fair value hierarchy consisting of three broad levels for financial statement purposes as follows:
| • | | Level 1 — unadjusted price quotations in active markets/exchanges for identical assets or liabilities that each Trust has the ability to access |
| • | | Level 2 — other observable inputs (including, but not limited to, quoted prices for similar assets or liabilities in markets that are active, quoted prices for identical or similar assets or liabilities in markets that are not active, inputs other than quoted prices that are observable for the assets or liabilities (such as interest rates, yield curves, volatilities, prepayment speeds, loss severities, credit risks and default rates) or other market–corroborated inputs) |
| • | | Level 3 — unobservable inputs based on the best information available in the circumstances, to the extent observable inputs are not available (including each Trust’s own assumptions used in determining the fair value of investments and derivative financial instruments) |
The hierarchy gives the highest priority to unadjusted quoted prices in active markets for identical assets or liabilities (Level 1 measurements) and the lowest priority to unobservable inputs (Level 3 measurements). Accordingly, the degree of judgment exercised in determining fair value is greatest for instruments categorized in Level 3. The inputs used to measure fair value may fall into different levels of the fair value hierarchy. In such cases, for disclosure purposes, the fair value hierarchy classification is determined based on the lowest level input that is significant to the fair value measurement in its entirety. The significant unobservable inputs used by the Global Valuation Committee in determining the price for Fair Valued Investments are typically categorized as Level 3. The fair value hierarchy for each Trust’s investments and derivative financial instruments have been included in the Schedules of Investments.
| | | | | | |
| | | | | | | |
| 78 | | SEMI-ANNUAL REPORT | | FEBRUARY 29, 2016 | | |
| | | | |
| Notes to Financial Statements (continued) | | |
Changes in valuation techniques may result in transfers into or out of an assigned level within the hierarchy. In accordance with each Trust’s policy, transfers between different levels of the fair value hierarchy are deemed to have occurred as of the beginning of the reporting period. The categorization of a value determined for investments and derivative financial instruments is based on the pricing transparency of the investments and derivative financial instruments and is not necessarily an indication of the risks associated with investing in those securities.
4. Securities and Other Investments:
Zero-Coupon Bonds: Zero-coupon bonds are normally issued at a significant discount from face value and do not provide for periodic interest payments. These bonds may experience greater volatility in market value than other debt obligations of similar maturity which provide for regular interest payments.
Forward Commitments and When-Issued Delayed Delivery Securities: Certain Trusts may purchase securities on a when-issued basis and may purchase or sell securities on a forward commitment basis. Settlement of such transactions normally occurs within a month or more after the purchase or sale commitment is made. A Trust may purchase securities under such conditions with the intention of actually acquiring them, but may enter into a separate agreement to sell the securities before the settlement date. Since the value of securities purchased may fluctuate prior to settlement, a Trust may be required to pay more at settlement than the security is worth. In addition, a Trust is not entitled to any of the interest earned prior to settlement. When purchasing a security on a delayed delivery basis, a Trust assumes the rights and risks of ownership of the security, including the risk of price and yield fluctuations. In the event of default by the counterparty, a Trust’s maximum amount of loss is the unrealized appreciation of unsettled when-issued transactions.
Municipal Bonds Transferred to TOB Trusts: Certain Trusts leverage their assets through the use of TOB transactions. The Trusts transfer municipal bonds into a special purpose trust (a “TOB Trust”). A TOB Trust generally issues two classes of beneficial interests: short-term floating rate interests (“TOB Trust Certificates”), which are sold to third party investors, and residual inverse floating rate interests (“TOB Residuals”), which are generally issued to the participating Trusts that contributed the municipal bonds to the TOB Trust. The TOB Trust Certificates have interest rates that generally reset weekly and their holders have the option to tender such certificates to the TOB Trust for redemption at par and any accrued interest at each reset date. The TOB Residuals held by a Trust generally provide the Trust with the right to cause the holders of a proportional share of the TOB Trust Certificates to tender their certificates to the TOB Trust at par plus accrued interest. The Trusts may withdraw a corresponding share of the municipal bonds from the TOB Trust. Other funds managed by the investment advisor may also contribute municipal bonds to a TOB Trust into which each Trust has contributed bonds. If multiple BlackRock advised funds participate in the same TOB Trust, the economic rights and obligations under the TOB Residual will be shared among the funds ratably in proportion to their participation in the TOB Trust.
TOB Trusts are generally supported by a liquidity facility provided by a third party bank or other financial institution (the “Liquidity Provider”) that allows the holders of the TOB Trust Certificates to tender their certificates in exchange for payment of par plus accrued interest on any business day. The tendered TOB Trust Certificates may be purchased by the Liquidity Provider and are usually remarketed by a Remarketing Agent, which is typically an affiliated entity of the Liquidity Provider. The Remarketing Agent may also purchase the tendered TOB Trust Certificates for its own account in the event of a failed remarketing.
The TOB Trust may be collapsed without the consent of a Trust, upon the occurrence of tender option termination events (“TOTEs”) or mandatory termination events (“MTEs”), as defined in the TOB Trust agreements. TOTEs include the bankruptcy or default of the issuer of the municipal bonds held in the TOB Trust, a substantial downgrade in the credit quality of the issuer of the municipal bonds held in the TOB Trust, failure of any scheduled payment of principal or interest on the municipal bonds, and/or a judgment or ruling that interest on the municipal bond is subject to federal income taxation. MTEs may include, among other things, a failed remarketing of the TOB Trust Certificates, the inability of the TOB Trust to obtain renewal of the liquidity support agreement and a substantial decline in the market value of the municipal bonds held in the TOB Trust. Upon the occurrence of a TOTE or an MTE, the TOB Trust would be liquidated with the proceeds applied first to any accrued fees owed to the trustee of the TOB Trust, the Remarketing Agent and the Liquidity Provider (defined below). In the case of an MTE, after the payment of fees, the TOB Trust Certificate holders would be paid before the TOB Residual holders (i.e., the Trusts). In contrast, in the case of a TOTE, after payment of fees, the TOB Trust Certificate holders and the TOB Residual holders would be paid pro rata in proportion to the respective face values of their certificates. During the six months ended February 29, 2016, no TOB Trusts in which a Trust participated were terminated without the consent of a Trust.
While a Trust’s investment policies and restrictions expressly permit investments in inverse floating rate securities, such as TOB Residuals, they generally do not allow a Trust to borrow money for purposes of making investments. The Trusts’ management believes that a Trust’s restrictions on borrowings do not apply to the secured borrowings. Each Trust’s transfer of the municipal bonds to a TOB Trust is considered a secured borrowing for financial reporting purposes. The cash received by the TOB Trust from the sale of the TOB Trust Certificates, less certain transaction expenses, is paid to a Trust. A Trust typically invests the cash received in additional municipal bonds. The municipal bonds deposited into a TOB Trust are presented in a Trust’s Schedule of Investments and the TOB Trust Certificates are shown in Other Liabilities in the Statements of Assets and Liabilities. Any loans drawn by the TOB Trust to purchase tendered TOB Trust Certificates would be shown as Loan for TOB Trust Certificates.
| | | | | | |
| | | | | | | |
| | SEMI-ANNUAL REPORT | | FEBRUARY 29, 2016 | | 79 |
| | |
| Notes to Financial Statements (continued) | | |
Volcker Rule Impact: On December 10, 2013, regulators published final rules implementing section 619 of the Dodd-Frank Wall Street Reform and Consumer Protection Act (the “Volcker Rule”), which precludes banking entities and their affiliates from sponsoring and investing in TOB Trusts. Banking entities subject to the Volcker Rule were required to fully comply by July 21, 2015, with respect to investments in and relationships with TOB Trusts established after December 31, 2013 (“Non-Legacy TOB Trusts”), and by July 21, 2016, with respect to investments in and relationships with TOB Trusts established prior to December 31, 2013 (“Legacy TOB Trusts”).
As a result, a new structure for TOB Trusts has been designed to ensure that no banking entity is sponsoring the TOB Trust. Specifically, a Trust will establish, structure and “sponsor” the TOB Trusts in which it holds TOB Residuals. In such a structure, certain responsibilities that previously belonged to a third party bank will be performed by, or on behalf of, the Trusts. The Trusts have restructured any Non-Legacy TOB Trusts and are in the process of restructuring Legacy TOB Trusts in conformity with regulatory guidelines. Until all restructurings are completed, a Trust may, for a period of time, hold TOB Residuals in both Legacy TOB Trusts and non-bank sponsored restructured TOB Trusts.
Under the new TOB Trust structure, the Liquidity Provider or Remarketing Agent will no longer purchase the tendered TOB Trust Certificates even in the event of failed remarketing. This may increase the likelihood that a TOB Trust will need to be collapsed and liquidated in order to purchase the tendered TOB Trust Certificates. The TOB Trust may draw upon a loan from the Liquidity Provider to purchase the tendered TOB Trust Certificates. Any loans made by the Liquidity Provider will be secured by the purchased TOB Trust Certificates held by the TOB Trust and will be subject to an increased interest rate based on the number of days the loan is outstanding.
Accounting for TOB Trusts: The municipal bonds deposited into a TOB Trust are presented in a Trust’s Schedule of Investments and the TOB Trust Certificates are shown in Other Liabilities in the Statements of Assets and Liabilities. Any loans drawn by the TOB Trust to purchase tendered TOB Trust Certificates are shown as Loan for TOB Trust Certificates. The carrying amount of a Trust’s payable to the holder of the TOB Trust Certificates, as reported in the Statements of Assets and Liabilities as TOB Trust Certificates, approximates its fair value.
Interest income, including amortization and accretion of premiums and discounts, from the underlying municipal bonds is recorded by a Trust on an accrual basis. Interest expense incurred on the TOB transaction and other expenses related to remarketing, administration, trustee, liquidity and other services to a TOB Trust are shown as interest expense, fees and amortization of offering costs in the Statements of Operations. Fees paid upon creation of the TOB Trust are recorded as debt issuance costs and are amortized to interest expense, fees and amortization of offering costs in the Statements of Operations to the expected maturity of the TOB Trust. In connection with the restructurings of the TOB Trusts to comply with the Volcker Rule, a Trust incurred non-recurring, legal and restructuring fees, which are recorded as interest expense, fees and amortization of deferred offering costs in the Statements of Operations.
For the six months ended February 29, 2016, the following table is a summary of the Trusts’ TOB Trusts:
| | | | | | | | | | | | | | | | | | |
| | | Underlying
Municipal Bonds Transferred to TOB Trusts1 | | | Liability for TOB Trust
Certificates2 | | | Range of
Interest Rates | | Average TOB
Trust
Certificates
Outstanding | | | Daily
Weighted
Average
Interest Rate | |
BIE | | $ | 31,250,503 | | | $ | 16,235,838 | | | 0.01% - 0.26% | | $ | 16,235,837 | | | | 0.63% | |
BBK | | $ | 39,260,896 | | | $ | 21,235,789 | | | 0.01% - 0.21% | | $ | 19,896,506 | | | | 0.64% | |
BAF | | $ | 71,817,951 | | | $ | 37,759,323 | | | 0.01% - 0.21% | | $ | 35,486,642 | | | | 0.68% | |
BYM | | $ | 171,857,264 | | | $ | 97,623,691 | | | 0.01% - 0.55% | | $ | 98,392,905 | | | | 0.65% | |
BLE | | $ | 128,234,484 | | | $ | 71,925,067 | | | 0.01% - 0.21% | | $ | 70,883,937 | | | | 0.61% | |
MFL | | $ | 158,866,109 | | | $ | 80,917,802 | | | 0.01% - 0.26% | | $ | 82,801,118 | | | | 0.70% | |
MVF | | $ | 319,000,554 | | | $ | 159,975,655 | | | 0.01% - 0.12% | | $ | 155,541,155 | | | | 0.60% | |
| | 1 | | The municipal bonds transferred to a TOB Trust are generally high grade municipal bonds. In certain cases, when municipal bonds transferred are lower grade municipal bonds, the TOB transaction may include a credit enhancement feature that provides for the timely payment of principal and interest on the bonds to the TOB Trust by a credit enhancement provider in the event of default of the municipal bond. The TOB Trust would be responsible for the payment of the credit enhancement fee and the Trusts, as TOB Residual holders, would be responsible for reimbursement of any payments of principal and interest made by the credit enhancement provider. The municipal bonds transferred to TOB Trusts with a credit enhancement are identified in the Schedules of Investments including the maximum potential amounts owed by the Trusts. |
| | 2 | | The Trusts may invest in TOB Trusts on either a non-recourse or recourse basis. When a Trust invests in TOB Trusts on a non-recourse basis, and the Liquidity Provider is required to make a payment under the liquidity facility, the Liquidity Provider will typically liquidate all or a portion of the municipal bonds held in the TOB Trust and then fund the balance, if any, of the amount owed under the liquidity facility over the liquidation proceeds (the “Liquidation Shortfall”). If a Trust invests in a TOB Trust on a recourse basis, a Trust will usually enter into a reimbursement agreement with the Liquidity Provider where a Trust is required to reimburse the Liquidity Provider the amount of any Liquidation Shortfall. As a result, if a Trust invests in a recourse TOB Trust, a Trust will bear the risk of loss with respect to any Liquidation Shortfall. If multiple funds participate in any such TOB Trust, these losses will be shared ratably, including the maximum potential amounts owed by a Trust at February 29, 2016, in proportion to their participation in the TOB Trust. The recourse TOB Trusts are identified in the Schedules of Investments including the maximum potential amounts owed by a Trust at February 29, 2016. |
5. Derivative Financial Instruments:
The Trusts engage in various portfolio investment strategies using derivative contracts both to increase the returns of the Trusts and/or to manage economically their exposure to certain risks such as interest rate risk. These contracts may be transacted on an exchange or over-the-counter (“OTC”).
| | | | | | |
| | | | | | | |
| 80 | | SEMI-ANNUAL REPORT | | FEBRUARY 29, 2016 | | |
| | | | |
| Notes to Financial Statements (continued) | | |
Financial Futures Contracts: Certain Trusts invest in long and/or short positions in financial futures contracts and options on financial futures contracts to gain exposure to, or economically hedge against, changes in interest rates (interest rate risk). Financial futures contracts are agreements between the Trusts and a counterparty to buy or sell a specific quantity of an underlying instrument at a specified price and on a specified date. Depending on the terms of the particular contract, financial futures contracts are settled either through physical delivery of the underlying instrument on the settlement date or by payment of a cash settlement amount on the settlement date.
Upon entering into a financial futures contract, the Trusts are required to deposit initial margin with the broker in the form of cash or securities in an amount that varies depending on a contract’s size and risk profile. The initial margin deposit must then be maintained at an established level over the life of the contract. Securities deposited as initial margin are designated on the Schedules of Investments and cash deposited, if any, is recorded on the Statements of Assets and Liabilities as cash pledged for financial futures contracts. Pursuant to the contract, the Trusts agree to receive from or pay to the broker an amount of cash equal to the daily fluctuation in value of the contract. Such receipts or payments are known as variation margin. Variation margin is recorded by the Trusts as unrealized appreciation (depreciation) and, if applicable, as a receivable or payable for variation margin in the Statements of Assets and Liabilities.
When the contract is closed, the Trusts record a realized gain or loss equal to the difference between the value of the contract at the time it was opened and the value at the time it was closed. The use of financial futures contracts involves the risk of an imperfect correlation in the movements in the price of financial futures contracts, interest or foreign currency exchange rates and the underlying assets.
6. Investment Advisory Agreement and Other Transactions with Affiliates:
The PNC Financial Services Group, Inc. is the largest stockholder and an affiliate of BlackRock, Inc. (“BlackRock”) for 1940 Act purposes.
Investment Advisory Fees
Each Trust entered into an Investment Advisory Agreement with the Manager, the Trusts’ investment advisor, an indirect, wholly owned subsidiary of BlackRock, to provide investment advisory and administration services. The Manager is responsible for the management of each Trust’s portfolio and provides the personnel, facilities, equipment and certain other services necessary to the operations of each Trust. For such services, each Trust, except for MFL and MVF, pays the Manager a monthly fee based on a percentage of each Trust’s average weekly managed assets at the following annual rates:
| | | | | | | | | | | | | | | | | | | | |
| | | BIE | | | BBK | | | BAF | | | BYM | | | BLE | |
Investment advisory fee | | | 0.65% | | | | 0.65% | | | | 0.55% | | | | 0.55% | | | | 0.55% | |
MFL and MVF each pay the Manager a monthly fee based on a percentage of MFL’s and MVF’s, respective, average daily net assets at an annual rate of 0.55% and 0.50%, respectively.
“Managed assets” and “net assets” each mean the total assets of the Trust minus the sum of its accrued liabilities (which does not include liabilities represented by TOB Trusts and the liquidation preference of any outstanding preferred stock).
Waivers and Reimbursements
The Manager voluntarily agreed to waive its investment advisory fees by the amount of investment advisory fees each Trust pays to the Manager indirectly through its investment in affiliated money market funds. These amounts are included in fees waived by the Manager in the Statements of Operations. However, the Manager does not waive its investment advisory fees by the amount of investment advisory fees paid in connection with each Trust’s investments in other affiliated investment companies, if any.
For the six months ended February 29, 2016, the amounts waived were as follows:
| | | | | | | | | | | | | | | | | | | | | | | | | | | | |
| | | BIE | | | BBK | | | BAF | | | BYM | | | BLE | | | MFL | | | MVF | |
Amounts waived | | $ | 8 | | | $ | 12 | | | $ | 32 | | | $ | 84 | | | $ | 145 | | | $ | 97 | | | $ | 53 | |
The Manager voluntarily agreed to waive a portion of the investment advisory fees or other expenses, with respect to BIE, at the annual rate as a percentage of its average weekly managed assets of 0.08%. With respect to MFL, the Manager voluntarily agreed to waive its investment advisory fees on the proceeds of Preferred Shares and TOB Trusts that exceed 35% of its total assets minus the sum of its accrued liabilities (which does not include liabilities represented by TOB Trusts and the liquidation preference of Preferred Shares). The amounts waived are included in fees waived by the Manager in the Statements of Operations.
For the six months ended February 29, 2016, the amounts included in fees waived by Manager were as follows:
| | | | |
| | | Amounts Waived | |
BIE | | $ | 34,852 | |
MFL | | $ | 122,452 | |
| | | | | | |
| | | | | | | |
| | SEMI-ANNUAL REPORT | | FEBRUARY 29, 2016 | | 81 |
| | |
| Notes to Financial Statements (continued) | | |
These voluntary waivers may be reduced or discontinued at any time without notice.
The Manager reimbursed BIE $24,173, which is shown as reorganization costs reimbursed by the Manager in the Statements of Operations.
Officers and Trustees Fees
Certain officers and/or trustees of the Trusts are officers and/or directors of BlackRock or its affiliates. The Trusts reimburse the Manager for a portion of the compensation paid to the Trusts’ Chief Compliance Officer, which is included in Officer and Trustees in the Statements of Operations.
Other Transactions
The Trusts may purchase securities from, or sell securities to, an affiliated fund provided the affiliation is due solely to having a common investment advisor, common officers, or common trustees. For the six months ended February 29, 2016, the purchase and sale transactions with an affiliated fund in compliance with Rule 17a-7 under the 1940 Act were as follows:
7. Purchases and Sales:
For the six months ended February 29, 2016, purchases and sales of investments excluding short-term securities, were as follows:
| | | | | | | | | | | | | | | | | | | | | | | | | | | | |
| | | BIE | | | BBK | | | BAF | | | BYM | | | BLE | | | MFL | | | MVF | |
Purchases | | $ | 7,640,954 | | | $ | 42,576,480 | | | $ | 38,776,217 | | | $ | 34,084,365 | | | $ | 26,294,009 | | | $ | 111,370,110 | | | $ | 58,065,807 | |
Sales | | $ | 7,227,311 | | | $ | 35,169,201 | | | $ | 34,561,194 | | | $ | 38,614,688 | | | $ | 17,830,418 | | | $ | 118,011,463 | | | $ | 53,031,834 | |
8. Income Tax Information:
It is the Trusts’ policy to comply with the requirements of the Internal Revenue Code of 1986, as amended, applicable to regulated investment companies, and to distribute substantially all of their taxable income to their shareholders. Therefore, no federal income tax provision is required.
Each Trust files U.S. federal and various state and local tax returns. No income tax returns are currently under examination. The statute of limitations on each Trust’s U.S. federal tax returns remains open for each of the four years ended August 31, 2015. The statutes of limitations on each Trust’s state and local tax returns may remain open for an additional year depending upon the jurisdiction.
Management has analyzed tax laws and regulations and their application to the Trusts as of February 29, 2016, inclusive of the open tax return years, and does not believe there are any uncertain tax positions that require recognition of a tax liability in the Trusts’ financial statements.
As of February 29, 2016, the Trusts had capital loss carryforwards available to offset future realized capital gains through the indicated expiration dates as follows:
| | | | | | | | | | | | | | | | | | | | | | | | |
| Expires August 31, | | BIE | | | BAF | | | BYM | | | BLE | | | MFL | | | MVF | |
No expiration date1 | | $ | 1,724,333 | | | $ | 5,389,992 | | | $ | 6,417,022 | | | $ | 7,391,065 | | | $ | 26,574,973 | | | $ | 11,411,304 | |
2016 | | | — | | | | — | | | | 3,216,104 | | | | — | | | | — | | | | — | |
2017 | | | — | | | | — | | | | 6,430,212 | | | | 2,066,643 | | | | 1,863,647 | | | | 7,618,622 | |
2018 | | | 150,549 | | | | — | | | | 2,209,430 | | | | 4,366,226 | | | | 11,734,707 | | | | — | |
2019 | | | 718,157 | | | | — | | | | — | | | | 2,448,693 | | | | — | | | | 5,276,524 | |
| | | | | | | | | | | | | | | | | | | | | | | | |
Total | | $ | 2,593,039 | | | $ | 5,389,992 | | | $ | 18,272,768 | | | $ | 16,272,627 | | | $ | 40,173,327 | | | $ | 24,306,450 | |
| | | | | | | | | | | | | | | | | | | | | | | | |
| | 1 | | Must be utilized prior to losses subject to expiration. |
As of February 29, 2016, gross unrealized appreciation and depreciation based on cost for federal income tax purposes were as follows:
| | | | | | | | | | | | | | | | | | | | | | | | | | | | |
| | | BIE | | | BBK | | | BAF | | | BYM | | | BLE | | | MFL | | | MVF | |
Tax cost | | $ | 61,810,918 | | | $ | 232,810,374 | | | $ | 160,855,963 | | | $ | 490,537,693 | | | $ | 465,737,844 | | | $ | 760,693,977 | | | $ | 795,364,158 | |
| | | | | | | | | | | | | | | | | | | | | | | | | | | | |
Gross unrealized appreciation | | $ | 9,250,043 | | | $ | 27,749,396 | | | $ | 21,776,904 | | | $ | 58,926,363 | | | $ | 53,478,996 | | | $ | 94,201,329 | | | $ | 97,342,752 | |
Gross unrealized depreciation | | | (248,254 | ) | | | (1,775,855 | ) | | | (316,509 | ) | | | (3,243,418 | ) | | | (5,101,275 | ) | | | (1,216,202 | ) | | | (5,279,273 | ) |
| | | | | | | | | | | | | | | | | | | | | | | | | | | | |
Net unrealized appreciation | | $ | 9,001,789 | | | $ | 25,973,541 | | | $ | 21,460,395 | | | $ | 55,682,945 | | | $ | 48,377,721 | | | $ | 92,985,127 | | | $ | 92,063,479 | |
| | | | | | | | | | | | | | | | | | | | | | | | | | | | |
9. Principal Risks:
Many municipalities insure repayment of their bonds, which may reduce the potential for loss due to credit risk. The market value of these bonds may fluctuate for other reasons, including market perception of the value of such insurance, and there is no guarantee that the insurer will meet its obligation.
Inventories of municipal bonds held by brokers and dealers may decrease, which would lessen their ability to make a market in these securities. Such a reduction in market making capacity could potentially decrease a Trust’s ability to buy or sell bonds. As a result, a Trust may sell a security at a lower price,
| | | | | | |
| | | | | | | |
| 82 | | SEMI-ANNUAL REPORT | | FEBRUARY 29, 2016 | | |
| | | | |
| Notes to Financial Statements (continued) | | |
sell other securities to raise cash, or give up an investment opportunity, any of which could have a negative impact on performance. If a Trust needed to sell large blocks of bonds, those sales could further reduce the bonds’ prices and impact performance.
In the normal course of business, certain Trusts invest in securities and enter into transactions where risks exist due to fluctuations in the market (market risk) or failure of the issuer to meet all its obligations, including the ability to pay principal and interest when due (issuer credit risk). The value of securities held by the Trusts may decline in response to certain events, including those directly involving the issuers of securities owned by the Trusts. Changes arising from the general economy, the overall market and local, regional or global political and/or social instability, as well as currency, interest rate and price fluctuations, may also affect the securities’ value.
Each Trust may be exposed to prepayment risk, which is the risk that borrowers may exercise their option to prepay principal earlier than scheduled during periods of declining interest rates, which would force each Trust to reinvest in lower yielding securities. Each Trust may also be exposed to reinvestment risk, which is the risk that income from each Trust’s portfolio will decline if each Trust invests the proceeds from matured, traded or called fixed income securities at market interest rates that are below each Trust portfolio’s current earnings rate.
The Trusts may hold a significant amount of bonds subject to calls by the issuers at defined dates and prices. When bonds are called by issuers and the Trusts reinvest the proceeds received, such investments may be in securities with lower yields than the bonds originally held, and correspondingly, could adversely impact the yield and total return performance of a Trust.
The new TOB Trust structure resulting from the compliance with Volcker Rule remains untested. It is possible that regulators could take positions that could limit the market for such newly structured TOB Trust transactions or the Trusts’ ability to hold TOB Residuals. Under the new TOB Trust structure, the Trusts will have certain additional duties and responsibilities, which may give rise to certain additional risks including, but not limited to, compliance, securities law and operational risks.
There can be no assurance that the Trusts can successfully enter into restructured TOB Trust transactions in order to refinance their existing TOB Residual holdings prior to the compliance date for the Volcker Rule, which may require that the Trusts unwind existing TOB Trusts. There can be no assurance that alternative forms of leverage will be available to the Trusts and any alternative forms of leverage may be more or less advantageous to the Trusts than existing TOB leverage.
Should short-term interest rates rise, the Trusts’ investments in TOB transactions may adversely affect the Trusts’ net investment income and dividends to Common Shareholders. Also, fluctuations in the market value of municipal bonds deposited into the TOB Trust may adversely affect the Trusts’ NAVs per share.
The SEC and various federal banking and housing agencies recently adopted credit risk retention rules for securitizations (the “Risk Retention Rules”), which take effect in December 2016. The Risk Retention Rules would require the sponsor of a TOB Trust to retain at least 5% of the credit risk of the underlying assets supporting the TOB Trust’s municipal bonds. The Risk Retention Rules may adversely affect the Trusts’ ability to engage in TOB Trust transactions or increase the costs of such transactions in certain circumstances.
TOB Trust transactions constitute an important component of the municipal bond market. Accordingly, implementation of the Volcker Rule may adversely impact the municipal market, including through reduced demand for and liquidity of municipal bonds and increased financing costs for municipal issuers. Any such developments could adversely affect the Trusts. The ultimate impact of these rules on the TOB market and the overall municipal market is not yet certain.
Counterparty Credit Risk: Similar to issuer credit risk, the Trusts may be exposed to counterparty credit risk, or the risk that an entity may fail to or be unable to perform on its commitments related to unsettled or open transactions. The Trusts manage counterparty credit risk by entering into transactions only with counterparties that the Manager believes have the financial resources to honor their obligations and by monitoring the financial stability of those counterparties. Financial assets, which potentially expose the Trusts to market, issuer and counterparty credit risks, consist principally of financial instruments and receivables due from counterparties. The extent of the Trusts’ exposure to market, issuer and counterparty credit risks with respect to these financial assets is approximately their value recorded in the Statements of Assets and Liabilities, less any collateral held by the Trusts.
A derivative contract may suffer a mark-to-market loss if the value of the contract decreases due to an unfavorable change in the market rates or values of the underlying instrument. Losses can also occur if the counterparty does not perform under the contract.
With exchange-traded futures, there is less counterparty credit risk to the Trusts since the exchange or clearinghouse, as counterparty to such instruments, guarantees against a possible default. The clearinghouse stands between the buyer and the seller of the contract; therefore, credit risk is limited to failure of the clearinghouse. While offset rights may exist under applicable law, a Trust does not have a contractual right of offset against a clearing broker or clearinghouse in the event of a default (including the bankruptcy or insolvency). Additionally, credit risk exists in exchange-traded futures with respect to initial and variation margin that is held in a clearing broker’s customer accounts. While clearing brokers are required to segregate customer margin from their own assets, in the event that a clearing broker becomes insolvent or goes into bankruptcy and at that time there is a shortfall in the aggregate amount of margin held by the clearing broker for all its clients, typically the shortfall would be allocated on a pro rata basis across all the clearing broker’s customers, potentially resulting in losses to the Trusts.
| | | | | | |
| | | | | | | |
| | SEMI-ANNUAL REPORT | | FEBRUARY 29, 2016 | | 83 |
| | |
| Notes to Financial Statements (continued) | | |
Concentration Risk: BAF and MFL invest a substantial amount of their assets in issuers located in a single state or limited number of states. This may subject each Trust to the risk that economic, political or social issues impacting a particular state or group of states could have an adverse and disproportionate impact on the income from, or the value or liquidity of, the Trusts’ respective portfolios. Investment percentages in specific states or U.S. territories are presented in the Schedules of Investments.
As of period end, certain Trusts invested a significant portion of their assets in securities in the Transportation and County, City, Special District and School District sectors. Changes in economic conditions affecting such sectors would have a greater impact on the Trusts and could affect the value, income and/or liquidity of positions in such securities.
Certain Trusts invest a significant portion of their assets in fixed-income securities and/or use derivatives tied to the fixed-income markets. Changes in market interest rates or economic conditions may affect the value and/or liquidity of such investments. Interest rate risk is the risk that prices of bonds and other fixed-income securities will increase as interest rates fall and decrease as interest rates rise. The Trusts may be subject to a greater risk of rising interest rates due to the current period of historically low rates.
10. Capital Share Transactions:
Each of BIE, BBK, BAF, BYM and BLE is authorized to issue an unlimited number of shares, including Preferred Shares, par value $0.001 per share, all of which were initially classified as Common Shares. The Board is authorized, however, to reclassify any unissued Common Shares to Preferred Shares, including AMPS, without approval of Common Shareholders.
MFL is authorized to issue an unlimited number of shares, including 1 million Preferred Shares, including AMPS, par value $0.10 per share.
MVF is authorized to issue 160 million shares, 150 million of which were initially classified as Common Shares, par value $0.10 per share and 10 million of which were classified as Preferred Shares, including AMPS, par value $0.10 per share.
Common Shares
For the periods shown, shares issued and outstanding increased by the following amounts as a result of dividend reinvestment:
| | | | | | | | |
| | | BLE | | | MVF | |
Six months ended February 29, 2016 | | | — | | | | 122,956 | |
Year ended August 31, 2015 | | | 17,405 | | | | 60,265 | |
For the six months ended February 29, 2016 and for the year ended August 31, 2015, shares issued and outstanding remained constant for BIE, BBK, BAF, BYM and MFL.
Preferred Shares
Each Trust’s Preferred Shares rank prior to the Trust’s Common Shares as to the payment of dividends by the Trust and distribution of assets upon dissolution or liquidation of a Trust. The 1940 Act prohibits the declaration of any dividend on a Trust’s Common Shares or the repurchase of a Trust’s Common Shares if a Trust fails to maintain the asset coverage of at least 200% of the liquidation preference of the outstanding Preferred Shares. In addition, pursuant to the Preferred Shares’ governing instruments, a Trust is restricted from declaring and paying dividends on classes of shares ranking junior to or on parity with the Preferred Shares or repurchasing such shares if a Trust fails to declare and pay dividends on the Preferred Shares, redeem any Preferred Shares required to be redeemed under the Preferred Shares’ governing instruments or comply with the basic maintenance amount requirement of the agencies rating the Preferred Shares.
The holders of Preferred Shares have voting rights equal to the holders of Common Shares (one vote per share) and will vote together with holders of Common Shares (one vote per share) as a single class. However, the holders of Preferred Shares, voting as a separate class, are also entitled to elect two Trustees for each Trust. In addition, the 1940 Act requires that along with approval by shareholders that might otherwise be required, the approval of the holders of a majority of any outstanding Preferred Shares, voting separately as a class would be required to (a) adopt any plan of reorganization that would adversely affect the Preferred Shares, (b) change a Trust’s sub-classification as a closed-end investment company or change its fundamental investment restrictions or (c) change its business so as to cease to be an investment company.
VRDP Shares
BIE and MFL (collectively, the “VRDP Trusts”), have issued Series W-7 VRDP Shares, $100,000 liquidation value per share, in privately negotiated offerings. The VRDP Shares were offered to qualified institutional buyers as defined pursuant to Rule 144A under the Securities Act of 1933, as amended, (the “Securities Act”). The VRDP Shares include a liquidity feature and are currently in a special rate period, each as described below.
| | | | | | |
| | | | | | | |
| 84 | | SEMI-ANNUAL REPORT | | FEBRUARY 29, 2016 | | |
| | | | |
| Notes to Financial Statements (continued) | | |
As of period end, the VRDP Shares outstanding of each Trust were as follows:
| | | | | | | | | | | | | | | | |
| | | Issue Date | | | Shares Issued | | | Aggregate Principal | | | Maturity Date | |
BIE | | | 9/15/11 | | | | 178 | | | $ | 17,800,000 | | | | 10/01/41 | |
MFL | | | 6/30/11 | | | | 2,746 | | | $ | 274,600,000 | | | | 7/01/41 | |
Redemption Terms: Each VRDP Trust is required to redeem its VRDP Shares on the maturity date, unless earlier redeemed or repurchased. Six months prior to the maturity date, each VRDP Trust is required to begin to segregate liquid assets with the Trust’s custodian to fund the redemption. In addition, VRDP Trusts are required to redeem certain of their outstanding VRDP Shares if they fail to maintain certain asset coverage, basic maintenance amount or leverage requirements.
Subject to certain conditions, the VRDP Shares may also be redeemed, in whole or in part, at any time at the option of VRDP Trusts. The redemption price per VRDP Share is equal to the liquidation value per share plus any outstanding unpaid dividends. In the event of an optional redemption of the VRDP Shares prior to the initial termination date of the fee agreement, VRDP Trusts must pay the respective liquidity provider fees on such redeemed VRDP Shares for the remaining term of the fee agreement up to the initial termination date.
Liquidity Feature: Each VRDP Trust entered into a fee agreement with the liquidity provider that may require an initial commitment and a per annum liquidity fee payable to the liquidity provider. These fees, if applicable, are shown as liquidity fees in the Statements of Operations.
The fee agreement between BIE and the liquidity provider was scheduled to expire on December 4, 2015. In October 2015, in connection with the commencement of a special rate period (as described below), BIE extended the fee agreement to October 22, 2018 unless renewed or terminated in advance.
The fee agreement between MFL and the liquidity provider is for a three year term and is scheduled to expire on April 19, 2017 unless renewed or terminated in advance.
In the event the fee agreement is not renewed or is terminated in advance, and the VRDP Trusts do not enter into a fee agreement with an alternate liquidity provider, the VRDP Shares will be subject to mandatory purchase by the liquidity provider prior to the termination of the fee agreement. In the event of such mandatory purchase, the VRDP Trusts are required to redeem the VRDP Shares six months after the purchase date. Immediately after such mandatory purchase, the VRDP Trusts are required to begin to segregate liquid assets with their custodian to fund the redemption. There is no assurance the VRDP Trusts will replace such redeemed VRDP Shares with any other preferred shares or other form of leverage.
Remarketing: The VRDP Trusts may incur remarketing fees of 0.10% on the aggregate principal amount of all the VRDP Shares, which, if any, are included in remarketing fees on Preferred Shares in the Statements of Operations. No remarketing fees are incurred during the special rate period (as described below).
Dividends: Dividends on the VRDP Shares are payable monthly at a variable rate set weekly by the remarketing agent. Such dividend rates are generally based upon a spread over a base rate and cannot exceed a maximum rate. In the event of a failed remarketing, the dividend rate of the VRDP Shares will be reset to a maximum rate. The maximum rate is determined based on, among other things, the long-term preferred share rating assigned to the VRDP Shares and the length of time that the VRDP Shares fail to be remarketed. As of period end, the VRDP Shares were assigned a long-term rating of Aa1 from Moody’s under its new ratings methodology. The VRDP Shares continue to be assigned a long-term rating of AAA from Fitch.
For the six months ended February 29, 2016, the annualized dividend rates for the VRDP Shares were as follows:
Financial Reporting: The VRDP Shares are considered debt of the issuer; therefore, the liquidation value, which approximates fair value, of the VRDP Shares is recorded as a liability in the Statements of Assets and Liabilities. Unpaid dividends are included in interest expense and fees payable in the Statements of Assets and Liabilities, and the dividends accrued and paid on the VRDP Shares are included as a component of interest expense, fees and amortization of offering costs in the Statements of Operations. The VRDP Shares are treated as equity for tax purposes. Dividends paid to holders of the VRDP Shares are generally classified as tax-exempt income for tax-reporting purposes.
Ratings: The short-term ratings on the VRDP Shares are directly related to the short-term ratings of the liquidity provider for such VRDP Shares. Changes in the credit quality of the liquidity provider could cause a change in the short-term credit ratings of the VRDP Shares as rated by Moody’s, Fitch and/or S&P. A change in the short-term credit rating of the liquidity provider or the VRDP Shares may adversely affect the dividend rate paid on such shares, although the dividend rate paid on the VRDP Shares is not directly related based upon either short-term rating.
Special Rate Period: On April 17, 2014, MFL commenced a three-year term ending April 19, 2017 (“special rate period”) with respect to its VRDP Shares. The implementation of the special rate period resulted in a mandatory tender of the VRDP Shares prior to the commencement of the special rate period.
| | | | | | |
| | | | | | | |
| | SEMI-ANNUAL REPORT | | FEBRUARY 29, 2016 | | 85 |
| | |
| Notes to Financial Statements (continued) | | |
The mandatory tender event was not the result of a failed remarketing. The short-term ratings on the VRDP Shares for MFL were withdrawn by Moody’s, Fitch and/or S&P at the commencement of the special rate period. Prior to April 19, 2017, the holder of the VRDP Shares and MFL may mutually agree to extend the special rate period. If the special rate period is not extended, the VRDP Shares will revert back to remarketable securities and will be remarketed and available for purchase by qualified institutional investors. Short-term ratings may be re-assigned upon the termination of the special rate period when the VRDP Shares revert back to remarketable securities.
On October 22, 2015, BIE commenced a three-year special rate period ending April 18, 2018 (“special rate period”) with respect to its VRDP Shares. The implementation of the special rate period resulted in a mandatory tender of the VRDP Shares prior to the commencement of the special rate period. The mandatory tender event was not the result of a failed remarketing. The short-term ratings on the VRDP Shares for BIE were withdrawn by Moody’s, Fitch and/or S&P at the commencement of the special rate period. Prior to April 18, 2018, the holder of the VRDP Shares and BIE may mutually agree to extend the special rate period. If the special rate period is not extended, the VRDP Shares will revert back to remarketable securities and will be remarketed and available for purchase by qualified institutional investors. Short-term ratings may be re-assigned upon the termination of the special rate period when the VRDP Shares revert back to remarketable securities.
During the special rate periods, the liquidity and fee agreements remain in effect for the duration of the special rate periods and the VRDP Shares are still subject to mandatory redemption by MFL and BIE on maturity date. The VRDP Shares will not be remarketed or subject to optional or mandatory tender events during such time. During the special rate period, MFL and BIE are required to maintain the same asset coverage, basic maintenance amount and leverage requirements for the VRDP Shares. MFL will pay 0.01% liquidity and remarketing fees, and BIE will not pay any liquidity and remarketing fees during the special rate period and instead will pay dividends monthly based on the sum of Securities Industry and Financial Markets Association (SIFMA) Municipal Swap Index and a percentage per annum based on the long-term ratings assigned to the VRDP Shares.
If BIE redeems the VRDP Shares on a date that is one year or more before the end of the special rate period and the VRDP Shares are rated above A1/A by Moody’s and Fitch, respectively, then such redemption is subject to a redemption premium payable to the holder of the VRDP Shares based on the time remaining in the special rate period, subject to certain exceptions for redemptions that are required to maintain minimum asset coverage requirements.
For the six months ended February 29, 2016, VRDP Shares issued and outstanding of each Trust remained constant.
VMTP Shares
BBK, BAF, BYM, BLE and MVF (collectively, the “VMTP Trusts”), have issued Series W-7 VMTP Shares, $100,000 liquidation value per share, in privately negotiated offerings and sale of VMTP Shares exempt from registration under the Securities Act.
As of period end, the VMTP Shares outstanding of each Trust were as follows:
| | | | | | | | | | | | | | | | |
| | | Issue Date | | | Shares Issued | | | Aggregate Principal | | | Term Date | |
BBK | | | 12/16/11 | | | | 799 | | | $ | 79,900,000 | | | | 1/02/19 | |
BAF | | | 12/16/11 | | | | 422 | | | $ | 42,200,000 | | | | 1/02/19 | |
BYM | | | 12/16/11 | | | | 1,372 | | | $ | 137,200,000 | | | | 1/02/19 | |
BLE | | | 12/16/11 | | | | 1,513 | | | $ | 151,300,000 | | | | 1/02/19 | |
MVF | | | 12/16/11 | | | | 2,438 | | | $ | 243,800,000 | | | | 1/02/19 | |
Redemption Terms: Each VMTP Trust is required to redeem its VMTP Shares on the term date, unless earlier redeemed or repurchased or unless extended. There is no assurance that the term of a Trust’s VMTP Shares will be extended further or that a Trust’s VMTP Shares will be replaced with any other preferred shares or other form of leverage upon the redemption or repurchase of the VMTP Shares. Six months prior to term date, each VMTP Trust is required to begin to segregate liquid assets with the Trust’s custodian to fund the redemption. In addition, each VMTP Trust is required to redeem certain of its outstanding VMTP Shares if it fails to maintain certain asset coverage, basic maintenance amount or leverage requirements.
Subject to certain conditions, a Trust’s VMTP Shares may be redeemed, in whole or in part, at any time at the option of the Trust. The redemption price per VMTP Share is equal to the liquidation value per share plus any outstanding unpaid dividends and applicable redemption premium. If the Trust redeems the VMTP Shares on a date that is one year or more prior to the term date and the VMTP Shares are rated above A1/A+ by Moody’s and Fitch, respectively, then such redemption is subject to a prescribed redemption premium (up to 3% of the liquidation preference) payable to the holder of the VMTP Shares based on the time remaining to the term date, subject to certain exceptions for redemptions that are required to maintain minimum asset coverage requirements. The VMTP Shares are subject to certain restrictions on transfer, and a Trust may also be required to register the VMTP Shares for sale under the Securities Act under certain circumstances. In addition, amendments to the VMTP governing document generally require the consent of the holders of VMTP Shares.
Dividends: Dividends on the VMTP Shares are declared daily and payable monthly at a variable rate set weekly at a fixed rate spread to the Securities Industry and Financial Markets Association (“SIFMA”) Municipal Swap Index. The fixed spread is determined based on the long-term preferred share rating assigned to the VMTP Shares by Moody’s and Fitch. At the date of issuance, the VMTP Shares were assigned long-term ratings of Aaa from Moody’s and AAA from Fitch. Subsequent to the issuance of the VMTP Shares, Moody’s completed a review of its methodology for rating securities issued by registered
| | | | | | |
| | | | | | | |
| 86 | | SEMI-ANNUAL REPORT | | FEBRUARY 29, 2016 | | |
| | |
| Notes to Financial Statements (concluded) | | |
closed-end funds. As of period end, the VMTP Shares were assigned a long-term rating of Aa1 from Moody’s under its new rating methodology. The VMTP Shares continue to be assigned a long-term rating of AAA from Fitch. The dividend rate on the VMTP Shares is subject to a step-up spread if the Trusts fail to comply with certain provisions, including, among other things, the timely payment of dividends, redemptions or gross-up payments, and maintaining certain asset coverage and leverage requirements.
For the six months ended February 29, 2016, the average annualized dividend rates for the VMTP Shares were as follows:
| | | | | | | | | | | | | | | | | | | | |
| | | BBK | | | BAF | | | BYM | | | BLE | | | MVF | |
Rate | | | 1.00% | | | | 1.00% | | | | 1.00% | | | | 1.00% | | | | 1.00% | |
Financial Reporting: The VMTP Shares are considered debt of the issuer; therefore the liquidation value, which approximates fair value, of the VMTP Shares is recorded as a liability in the Statements of Assets and Liabilities. Unpaid dividends are included in interest expense and fees payable in the Statements of Assets and Liabilities, and the dividends accrued and paid on the VMTP Shares are included as a component of interest expense, fees and amortization of offering costs in the Statements of Operations. The VMTP Shares are treated as equity for tax purposes. Dividends paid to holders of the VMTP Shares are generally classified as tax-exempt income for tax-reporting purposes.
For the six months ended February 29, 2016, VMTP Shares issued and outstanding of each Trust remained constant.
Offering Costs: The Trusts incurred costs in connection with the issuance of VRDP Shares and/or VMTP Shares. For VRDP Shares, these costs were recorded as a deferred charge and will be amortized over the 30-year life of the VRDP Shares. For VMTP Shares, these costs were recorded as a deferred charge and will be amortized over the 3-year life of the VMTP Shares. Amortization of these costs is included in interest expense, fees and amortization of offering costs in the Statements of Operations.
11. Subsequent Events:
Management’s evaluation of the impact of all subsequent events on the Trusts’ financial statements was completed through the date the financial statements were issued and the following items were noted:
The Trusts paid a net investment income dividend in the following amounts per share on April 1, 2016 to Common Shareholders of record on March 15, 2016:
| | | | |
| | | Common Dividend
Per Share | |
BIE | | $ | 0.0760 | |
BBK | | $ | 0.0750 | |
BAF | | $ | 0.0685 | |
BYM | | $ | 0.0685 | |
BLE | | $ | 0.0790 | |
MFL | | $ | 0.0715 | |
MVF | | $ | 0.0535 | |
Additionally, the Trusts declared a net investment income dividend on April 1, 2016 payable to Common Shareholders of record on April 15, 2016 for the same amounts noted above.
The dividends declared on Preferred Shares for the period March 1, 2016 to March 31, 2016 for the Trusts were as follows:
| | | | | | | | | | | | |
| | | Preferred
Shares | | | Series | | | Dividend
Declared | |
BIE | | | VRDP Shares | | | | W-7 | | | $ | 15,475 | |
BBK | | | VMTP Shares | | | | W-7 | | | $ | 76,232 | |
BAF | | | VMTP Shares | | | | W-7 | | | $ | 40,263 | |
BYM | | | VMTP Shares | | | | W-7 | | | $ | 130,902 | |
BLE | | | VMTP Shares | | | | W-7 | | | $ | 144,355 | |
MFL | | | VRDP Shares | | | | W-7 | | | $ | 234,085 | |
MVF | | | VMTP Shares | | | | W-7 | | | $ | 232,609 | |
At a special shareholder meeting on March 21, 2016, the requisite shareholders of BIE and BlackRock Municipal Income Investment Trust (“BBF”) approved the reorganization of BIE with and into BBF, which is expected to be effective on May 16, 2016. Reorganization costs incurred by BIE in connection with the reorganization were expensed by BIE.
| | | | | | |
| | | | | | | |
| | SEMI-ANNUAL REPORT | | FEBRUARY 29, 2016 | | 87 |
Richard E. Cavanagh, Chair of the Board and Trustee
Karen P. Robards, Vice Chair of the Board, Chair of the Audit Committee and Trustee
Michael J. Castellano, Trustee and Member of the Audit Committee
Frank J. Fabozzi, Trustee and Member of the Audit Committee
Jerrold B. Harris, Trustee
R. Glenn Hubbard, Trustee
W. Carl Kester, Trustee and Member of the Audit Committee
Barbara G. Novick, Interested Trustee
John M. Perlowski, Interested Trustee, President and Chief Executive Officer
Jonathan Diorio, Vice President
Neal J. Andrews, Chief Financial Officer
Jay M. Fife, Treasurer
Charles Park, Chief Compliance Officer
Janey Ahn, Secretary
Effective December 31, 2015, Kathleen F. Feldstein and James T. Flynn retired as Trustees of the Trusts.
Effective January 11, 2016, Michael Perilli became a portfolio manager of BIE. The other portfolio managers are Ted Jaeckel and Walter O’Connor.
Effective March 1, 2016, Catherine A. Lynch was appointed to serve as a Trustee and a Member of the Audit Committee of the Trusts.
Effective April 1, 2016, Cynthia L. Egan was appointed to serve as a Trustee of the Trusts.
Effective April 6, 2016, Michael Perilli became a portfolio manager of BAF. The other portfolio managers are Ted Jaeckel and Walter O’Connor.
| | | | | | | | |
| | | | | |
Investment Advisor BlackRock Advisors, LLC Wilmington, DE 19809 | | Transfer Agent Computershare Trust Company, N.A. Canton, MA 02021 | | VRDP Liquidity Providers Bank of America, N.A.1 New York, NY 10036 Barclays Bank PLC2 New York, NY 10019 | | Custodian and Accounting Agent State Street Bank and Trust Company Boston, MA 02110 | | Legal Counsel Skadden, Arps, Slate, Meagher & Flom LLP Boston, MA 02116 |
| | | | |
| | VRDP Tender and Paying Agent and VMTP Redemption and Paying Agent The Bank of New York Mellon New York, NY 10289 | | VRDP Remarketing Agents Merrill Lynch, Pierce, Fenner & Smith Incorporated1 New York, NY 10036 Barclays Capital Inc.2 New York, NY 10019 | | Independent Registered Public Accounting Firm Deloitte & Touche LLP Boston, MA 02116 | | Address of the Trusts 100 Bellevue Parkway Wilmington, DE 19809 |
| | | | | | |
| | | | | | | |
| 88 | | SEMI-ANNUAL REPORT | | FEBRUARY 29, 2016 | | |
Certain Trusts are listed for trading on the NYSE and have filed with the NYSE their annual chief executive officer certification regarding compliance with the NYSE’s listing standards. The Trusts filed with the SEC the certification of its chief executive officer and chief financial officer required by section 302 of the Sarbanes-Oxley Act.
Each Trust’s dividend policy is to distribute all or a portion of its net investment income to its shareholders on a monthly basis. In order to provide shareholders with a more stable level of distributions, the Trusts may at times pay out less than the entire amount of net investment income earned in any particular month and may at times in any particular month pay out such accumulated but undistributed income in addition to net investment income earned in that month. As a result, the distributions paid by the Trusts for any particular month may be more or less than the amount of net investment income earned by the Trusts during such month. The Trusts’ current accumulated but undistributed net investment income, if any, is disclosed in the Statements of Assets and Liabilities, which comprises part of the financial information included in this report.
The Trusts do not make available copies of their Statements of Additional Information because the Trusts’ shares are not continuously offered, which means that the Statement of Additional Information of each Trust has not been updated after completion of the respective Trust’s offerings and the information contained in each Trust’s Statement of Additional Information may have become outdated.
During the period, there were no material changes in the Trusts’ investment objectives or policies or to the Trusts’ charters or by-laws that would delay or prevent a change of control of the Trusts that were not approved by the shareholders or in the principal risk factors associated with investment in the Trusts. There have been no changes in the persons who are primarily responsible for the day-to-day management of the Trusts’ portfolios.
Quarterly performance, semi-annual and annual reports, current net asset value and other information regarding the Trusts may be found on BlackRock’s website, which can be accessed at http://www.blackrock.com. This reference to BlackRock’s website is intended to allow investors public access to information regarding the Trusts and does not, and is not intended to, incorporate BlackRock’s website in this report.
Electronic Delivery
Shareholders can sign up for e-mail notifications of quarterly statements, annual and semi-annual shareholder reports by enrolling in the electronic delivery program. Electronic copies of shareholder reports are available on BlackRock’s website.
To enroll in electronic delivery:
Shareholders Who Hold Accounts with Investment Advisors, Banks or Brokerages:
Please contact your financial advisor. Please note that not all investment advisors, banks or brokerages may offer this service.
Householding
The Trusts will mail only one copy of shareholder documents, including annual and semi-annual reports and proxy statements, to shareholders with multiple accounts at the same address. This practice is commonly called “householding” and is intended to reduce expenses and eliminate duplicate mailings of shareholder documents. Mailings of your shareholder documents may be householded indefinitely unless you instruct us otherwise. If you do not want the mailing of these documents to be combined with those for other members of your household, please call the Trusts at (800) 882-0052.
Availability of Quarterly Schedule of Investments
The Trusts file their complete schedule of portfolio holdings with the SEC for the first and third quarters of each fiscal year on Form N-Q. The Trusts’ Forms N-Q are available on the SEC’s website at http://www.sec.gov and may also be reviewed and copied at the SEC’s Public Reference Room in Washington, D.C. Information on how to access documents on the SEC’s website without charge may be obtained by calling (800) SEC-0330. The Trusts’ Forms N-Q may also be obtained upon request and without charge by calling (800) 882-0052.
Availability of Proxy Voting Policies and Procedures
A description of the policies and procedures that the Trusts use to determine how to vote proxies relating to portfolio securities is available upon request and without charge (1) by calling (800) 882-0052; (2) at http://www.blackrock.com; and (3) on the SEC’s website at http://www.sec.gov.
Availability of Proxy Voting Record
Information about how the Trusts voted proxies relating to securities held in the Trusts’ portfolios during the most recent 12-month period ended June 30 is available upon request and without charge (1) at http://www.blackrock.com or by calling (800) 882-0052; and (2) on the SEC’s website at http://www.sec.gov.
| | | | | | |
| | | | | | | |
| | SEMI-ANNUAL REPORT | | FEBRUARY 29, 2016 | | 89 |
| | |
| Additional Information (concluded) | | |
|
| General Information (concluded) |
Availability of Trust Updates
BlackRock will update performance and certain other data for the Trusts on a monthly basis on its website in the “Closed-end Funds” section of http://www.blackrock.com as well as certain other material information as necessary from time to time. Investors and others are advised to check the website for updated performance information and the release of other material information about the Trusts. This reference to BlackRock’s website is intended to allow investors public access to information regarding the Trusts and does not, and is not intended to, incorporate BlackRock’s website in this report.
|
| BlackRock Privacy Principles |
BlackRock is committed to maintaining the privacy of its current and former fund investors and individual clients (collectively, “Clients”) and to safeguarding their non-public personal information. The following information is provided to help you understand what personal information BlackRock collects, how we protect that information and why in certain cases we share such information with select parties.
If you are located in a jurisdiction where specific laws, rules or regulations require BlackRock to provide you with additional or different privacy-related rights beyond what is set forth below, then BlackRock will comply with those specific laws, rules or regulations.
BlackRock obtains or verifies personal non-public information from and about you from different sources, including the following: (i) information we receive from you or, if applicable, your financial intermediary, on applications, forms or other documents; (ii) information about your transactions with us, our affiliates, or others; (iii) information we receive from a consumer reporting agency; and (iv) from visits to our websites.
BlackRock does not sell or disclose to non-affiliated third parties any non-public personal information about its Clients, except as permitted by law or as is necessary to respond to regulatory requests or to service Client accounts. These non-affiliated third parties are required to protect the confidentiality and security of this information and to use it only for its intended purpose.
We may share information with our affiliates to service your account or to provide you with information about other BlackRock products or services that may be of interest to you. In addition, BlackRock restricts access to non-public personal information about its Clients to those BlackRock employees with a legitimate business need for the information. BlackRock maintains physical, electronic and procedural safeguards that are designed to protect the non-public personal information of its Clients, including procedures relating to the proper storage and disposal of such information.
| | | | | | |
| | | | | | | |
| 90 | | SEMI-ANNUAL REPORT | | FEBRUARY 29, 2016 | | |
This report is intended for current holders. It is not a prospectus. Past performance results shown in this report should not be considered a representation of future performance. The Trusts have leveraged their Common Shares, which creates risks for Common Shareholders, including the likelihood of greater volatility of net asset value and market price of the Common Shares, and the risk that fluctuations in short-term interest rates may reduce the Common Shares’ yield. Statements and other information herein are as dated and are subject to change.

| | |
| CEF-NTL-7-2/16-SAR | |  |
| | |
| |
| Item 2 – | | Code of Ethics – Not Applicable to this semi-annual report |
| |
| Item 3 – | | Audit Committee Financial Expert – Not Applicable to this semi-annual report |
| |
| Item 4 – | | Principal Accountant Fees and Services – Not Applicable to this semi-annual report |
| |
| Item 5 – | | Audit Committee of Listed Registrants – Not Applicable to this semi-annual report |
| |
| Item 6 – | | Investments |
| | (a) The registrant’s Schedule of Investments is included as part of the Report to Stockholders filed under Item 1 of this Form. |
| | (b) Not Applicable due to no such divestments during the semi-annual period covered since the previous Form N-CSR filing. |
| |
| Item 7 – | | Disclosure of Proxy Voting Policies and Procedures for Closed-End Management Investment Companies – Not Applicable to this semi-annual report |
| |
| Item 8 – | | Portfolio Managers of Closed-End Management Investment Companies |
| | (a) Not Applicable to this semi-annual report |
| | (b) As of the date of this filing, there have been no changes in any of the portfolio managers identified in the most recent annual report on Form N-CSR. |
| |
| Item 9 – | | Purchases of Equity Securities by Closed-End Management Investment Company and Affiliated Purchasers – Not Applicable |
| |
| Item 10 – | | Submission of Matters to a Vote of Security Holders – There have been no material changes to these procedures. |
| |
| Item 11 – | | Controls and Procedures |
| |
| | (a) – The registrant’s principal executive and principal financial officers, or persons performing similar functions, have concluded that the registrant’s disclosure controls and procedures (as defined in Rule 30a-3(c) under the Investment Company Act of 1940, as amended (the “1940 Act”)) are effective as of a date within 90 days of the filing of this report based on the evaluation of these controls and procedures required by Rule 30a-3(b) under the 1940 Act and Rule 13a-15(b) under the Securities Exchange Act of 1934, as amended. |
| |
| | (b) – There were no changes in the registrant’s internal control over financial reporting (as defined in Rule 30a-3(d) under the 1940 Act) that occurred during the second fiscal quarter of the period covered by this report that have materially affected, or are reasonably likely to materially affect, the registrant’s internal control over financial reporting. |
| |
| Item 12 – | | Exhibits attached hereto |
| |
| | (a)(1) – Code of Ethics – Not Applicable to this semi-annual report |
| |
| | (a)(2) – Certifications – Attached hereto |
| |
| | (a)(3) – Not Applicable |
| |
| | (b) – Certifications – Attached hereto |
2
Pursuant to the requirements of the Securities Exchange Act of 1934 and the Investment Company Act of 1940, the registrant has duly caused this report to be signed on its behalf by the undersigned, thereunto duly authorized.
BlackRock Municipal Income Trust II
| | | | |
| By: | | /s/ John M. Perlowski | | |
| | John M. Perlowski |
| | Chief Executive Officer (principal executive officer) of |
| | BlackRock Municipal Income Trust II |
Date: May 2, 2016
Pursuant to the requirements of the Securities Exchange Act of 1934 and the Investment Company Act of 1940, this report has been signed below by the following persons on behalf of the registrant and in the capacities and on the dates indicated.
| | | | |
| By: | | /s/ John M. Perlowski | | |
| | John M. Perlowski |
| | Chief Executive Officer (principal executive officer) of |
| | BlackRock Municipal Income Trust II | | |
| |
Date: | | May 2, 2016 |
| | |
| By: | | /s/ Neal J. Andrews | | |
| | Neal J. Andrews |
| | Chief Financial Officer (principal financial officer) of |
| | BlackRock Municipal Income Trust II |
| |
| Date: | | May 2, 2016 |
3