| Name of Fund: | BlackRock Municipal Income Trust II (BLE) |
| Fund Address: | 100 Bellevue Parkway, Wilmington, DE 19809 |
 | JULY 31, 2022 |
| 2022 Annual Report | ||
Not FDIC Insured • May Lose Value • No Bank Guarantee |


| Total Returns as of July 31, 2022 | ||||
6-Month | 12-Month | |||
U.S. large cap equities (S&P 500 ® Index) | (7.81)% | (4.64)% | ||
U.S. small cap equities (Russell 2000 ® Index) | (6.42) | (14.29) | ||
| International equities (MSCI Europe, Australasia, Far East Index) | (11.27) | (14.32) | ||
| Emerging market equities (MSCI Emerging Markets Index) | (16.24) | (20.09) | ||
| 3-month Treasury bills (ICE BofA 3-Month U.S. Treasury Bill Index) | 0.21 | 0.22 | ||
| U.S. Treasury securities (ICE BofA 10-Year U.S. Treasury Index) | (6.38) | (10.00) | ||
| U.S. investment grade bonds (Bloomberg U.S. Aggregate Bond Index) | (6.14) | (9.12) | ||
| Tax-exempt municipal bonds (Bloomberg Municipal Bond Index) | (3.95) | (6.93) | ||
| U.S. high yield bonds (Bloomberg U.S. Corporate High Yield 2% Issuer Capped Index) | (6.58) | (8.03) | ||
| Past performance is not an indication of future results. Index performance is shown for illustrative purposes only. You cannot invest directly in an index. | ||||
| 2 | T H I S PA G E I S N O T PA R T O F YO U R FU N D RE P O R T |
Page | ||||
| 2 | ||||
| Annual Report: | ||||
| 4 | ||||
| 5 | ||||
| 5 | ||||
| 6 | ||||
| Financial Statements: | ||||
| 15 | ||||
| 42 | ||||
| 43 | ||||
| 45 | ||||
| 47 | ||||
| 50 | ||||
| 53 | ||||
| 64 | ||||
| 65 | ||||
| 69 | ||||
| 77 | ||||
| 80 | ||||
| 81 | ||||
| 84 | ||||
| 87 | ||||
| 3 |
Municipal Market Overview For the Reporting Period Ended July 31, 2022 |
| During the 12 months ended July 31, 2022, municipal bond funds experienced net outflows totaling $65 billion (based on data from the Investment Company Institute). The post-pandemic inflow cycle, which spanned 92-weeks and garnered $149 billion, ended abruptly in early-2022 as performance turned starkly negative. As a result, elevated bid-wanted activity weighed on the market as investors raised cash to meet redemptions. At the same time, the market absorbed $421 billion in issuance, below the $471 billion issued during the prior 12-months. New issue oversubscriptions waned late in the period as sentiment turned less constructive. | Bloomberg Municipal Bond Index Total Returns as of July 31, 2022 6 months: (3.95)% 12 months: (6.93)% | |||
AAA Municipal Yield Curves 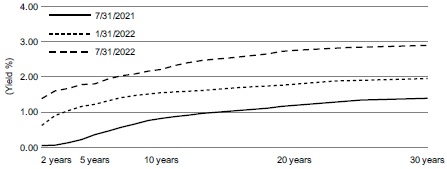 Source: Thomson Municipal Market Data. | From July 31, 2021 to July 31, 2022, yields on AAA-rated 30-year municipal bonds increased by 150 basis points (“bps”) from 1.39% to 2.89%, while ten-year rates increased by 139 bps from 0.82% to 2.21% and five-year rates increased by 144 bps from 0.36% to 1.80% (as measured by Thomson Municipal Market Data). As a result, the municipal yield curve flattened over the 12-month period with the spread between two- and 30-year maturities flattening by 4bps, lagging the 158 bps of flattening experienced in the U.S. Treasury curve. After maintaining historically tight valuations early in the period, the selloff experienced in early-2022 restored value to the asset class. Municipal-to-Treasury ratios are through their 5-year averages in the long-end of the curve, while municipals out yield both the S&P 500 and investment-grade corporates on an after-tax basis. |
| 4 | 2 0 2 2 BL A C K RO C K AN N U A L RE P O R T T O SH A R E H O L D E R S |
T H E BE N E F I T S A N D RI S K S O F LE V E R A G I N G / DE R I V A T I V E FI N A N C I A L IN S T R U M E N T S | 5 |
Trust Summary as of July 31, 2022 | BlackRock Municipal Income Quality Trust (BYM) |
| Symbol on New York Stock Exchange | BYM | |
| Initial Offering Date | October 31, 2002 | |
Yield on Closing Market Price as of July 31, 2022 ($13.34) (a) | 5.22% | |
Tax Equivalent Yield (b) | 8.82% | |
Current Monthly Distribution per Common Share (c) | $0.0580 | |
Current Annualized Distribution per Common Share (c) | $0.6960 | |
Leverage as of July 31, 2022 (d) | 39% |
| (a) | Yield on closing market price is calculated by dividing the current annualized distribution per share by the closing market price. Past performance is not an indication of future results. |
| (b) | Tax equivalent yield assumes the maximum marginal U.S. federal tax rate of 40.8%, which includes the 3.8% Medicare tax. Actual tax rates will vary based on income, exemptions and deductions. Lower taxes will result in lower tax equivalent yields. |
| (c) | The distribution rate is not constant and is subject to change. |
| (d) | Represents VMTP Shares and TOB Trusts as a percentage of total managed assets, which is the total assets of the Trust, including any assets attributable to VMTP Shares and TOB Trusts, minus the sum of its accrued liabilities. Does not reflect derivatives or other instruments that may give rise to economic leverage. For a discussion of leveraging techniques utilized by the Trust, please see The Benefits and Risks of Leveraging and Derivative Financial Instruments. |
| 07/31/22 | 07/31/21 | Change | High | Low | ||||||||||||||||
| Closing Market Price | $ | 13.34 | $ | 16.25 | (17.91 | )% | $ | 16.29 | $ | 11.52 | ||||||||||
| Net Asset Value | 13.56 | 16.16 | (16.09 | ) | 16.23 | 12.57 | ||||||||||||||
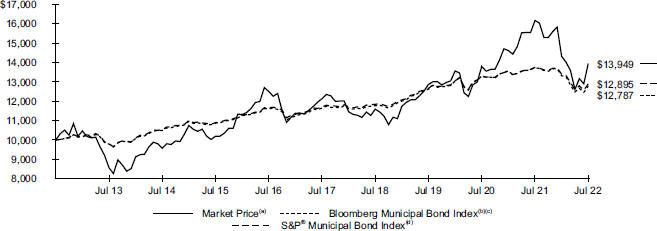
| (a) | Represents the Trust’s closing market price on the NYSE and reflects the reinvestment of dividends and/or distributions at actual reinvestment prices. |
| (b) | An unmanaged index that tracks the U.S. long term tax-exempt bond market, including state and local general obligation bonds, revenue bonds, pre-refunded bonds, and insured bonds. |
| (c) | Effective October 1, 2021, the Trust changed its reporting benchmark from S&P Municipal Bond Index to Bloomberg Municipal Bond Index. The investment adviser believes the new benchmark is a more appropriate reporting benchmark for the Trust. |
| (d) | A broad, market value-weighted index that seeks to measure the performance of the U.S. municipal bond market. |
| 6 | 2 0 2 2 BL A C K RO C K AN N U A L RE P O R T T O SH A R E H O L D E R S |
Trust Summary as of July 31, 2022 (continued) | BlackRock Municipal Income Quality Trust (BYM) |
| Average Annual Total Returns | ||||||||||||
| 1 Year | 5 Years | 10 Years | ||||||||||
Trust at NAV (a)(b) | (11.83 | )% | 2.38 | % | 3.67 | % | ||||||
Trust at Market Price (a)(b) | (13.74 | ) | 2.84 | 3.38 | ||||||||
Customized Reference Benchmark (c) | (7.03 | ) | 2.13 | N/A | ||||||||
| Bloomberg Municipal Bond Index | (6.93 | ) | 1.88 | 2.49 | ||||||||
S&P ® Municipal Bond Index | (6.18 | ) | 1.96 | 2.58 | ||||||||
Lipper General & Insured Municipal Debt Funds (Leveraged) at NAV (d) | (12.54 | ) | 1.96 | 3.52 | ||||||||
Lipper General & Insured Municipal Debt Funds (Leveraged) at Market Price (d) | (16.74 | ) | 1.58 | 2.90 | ||||||||
| (a) | All returns reflect reinvestment of dividends and/or distributions at actual reinvestment prices. Performance results reflect the Trust’s use of leverage. |
| (b) | The Trust moved from a premium to NAV to a discount during the period, which accounts for the difference between performance based on market price and performance based on NAV. |
| (c) | The Customized Reference Benchmark is comprised of the Bloomberg Municipal Bond Index Total Return Index Value Unhedged (90%) and the Bloomberg Municipal Bond: High Yield ex AMT (non-Investment Grade) Total Return Index (10%). Effective October 1, 2021, the Trust changed its reporting benchmarks from S&P Municipal Bond Index and Lipper General & Insured Municipal Debt Funds (Leveraged) to Bloomberg Municipal Bond Index and the Customized Reference Benchmark. The investment adviser believes the new benchmarks are more appropriate reporting benchmarks for the Trust. The Customized Reference Benchmark commenced on September 30, 2016. |
| (d) | Average return. Returns reflect reinvestment of dividends and/or distributions at NAV on the ex-dividend date as calculated by Lipper. |
T R U S T SU M M A R Y | 7 |
Trust Summary as of July 31, 2022 (continued) | BlackRock Municipal Income Quality Trust (BYM) |
Sector (a)(b) | 07/31/22 | |||
| County/City/Special District/School District | 22.4 | % | ||
| Health | 20.1 | |||
| Transportation | 15.4 | |||
| State | 14.5 | |||
| Utilities | 7.5 | |||
| Education | 7.2 | |||
| Tobacco | 6.8 | |||
| Housing | 3.8 | |||
| Corporate | 2.3 | |||
Calendar Year Ended December 31, (a)(c) | Percentage | |||
| 2022 | 3.6 | % | ||
| 2023 | 9.2 | |||
| 2024 | 6.2 | |||
| 2025 | 14.1 | |||
| 2026 | 8.0 | |||
Credit Rating (a)(d) | 07/31/22 | |||
| AAA/Aaa | 10.7 | % | ||
| AA/Aa | 38.9 | |||
| A | 26.2 | |||
| BBB/Baa | 10.2 | |||
| BB/Ba | 2.6 | |||
| B | 0.3 | |||
N/R (e) | 11.1 | |||
| (a) | Excludes short-term securities. |
| (b) | For Trust compliance purposes, the Trust’s sector classifications refer to one or more of the sector sub-classifications used by one or more widely recognized market indexes or rating group indexes, and/or as defined by the investment adviser. These definitions may not apply for purposes of this report, which may combine such sector sub-classifications for reporting ease. |
| (c) | Scheduled maturity dates and/or bonds that are subject to potential calls by issuers over the next five years. |
| (d) | For financial reporting purposes, credit quality ratings shown above reflect the highest rating assigned by either S&P Global Ratings or Moody’s Investors Service, Inc. if ratings differ. These rating agencies are independent, nationally recognized statistical rating organizations and are widely used. Investment grade ratings are credit ratings of BBB/Baa or higher. Below investment grade ratings are credit ratings of BB/Ba or lower. Investments designated N/R are not rated by either rating agency. Unrated investments do not necessarily indicate low credit quality. Credit quality ratings are subject to change. |
| (e) | The investment adviser evaluates the credit quality of unrated investments based upon certain factors including, but not limited to, credit ratings for similar investments and financial analysis of sectors and individual investments. Using this approach, the investment adviser has deemed certain of these unrated securities as investment grade quality. As of July 31, 2022, the market value of unrated securities deemed by the investment adviser to be investment grade represents 1.2% of the Trust’s total investments. |
| 8 | 2 0 2 2 BL A C K RO C K AN N U A L RE P O R T T O SH A R E H O L D E R S |
Trust Summary as of July 31, 2022 | BlackRock Municipal Income Trust II (BLE) |
| Symbol on New York Stock Exchange | BLE | |
| Initial Offering Date | July 30, 2002 | |
Yield on Closing Market Price as of July 31, 2022 ($11.77) (a) | 5.30% | |
Tax Equivalent Yield (b) | 8.95% | |
Current Monthly Distribution per Common Share (c) | $0.0520 | |
Current Annualized Distribution per Common Share (c) | $0.6240 | |
Leverage as of July 31, 2022 (d) | 40% |
| (a) | Yield on closing market price is calculated by dividing the current annualized distribution per share by the closing market price. Past performance is not an indication of future results. |
| (b) | Tax equivalent yield assumes the maximum marginal U.S. federal tax rate of 40.8%, which includes the 3.8% Medicare tax. Actual tax rates will vary based on income, exemptions and deductions. Lower taxes will result in lower tax equivalent yields. |
| (c) | The distribution rate is not constant and is subject to change. |
| (d) | Represents VMTP Shares and TOB Trusts as a percentage of total managed assets, which is the total assets of the Trust, including any assets attributable to VMTP Shares and TOB Trusts, minus the sum of its accrued liabilities. Does not reflect derivatives or other instruments that may give rise to economic leverage. For a discussion of leveraging techniques utilized by the Trust, please see The Benefits and Risks of Leveraging and Derivative Financial Instruments. |
| 07/31/22 | 07/31/21 | Change | High | Low | ||||||||||||||||
| Closing Market Price | $ | 11.77 | $ | 15.70 | (25.03 | )% | $ | 16.14 | $ | 10.57 | ||||||||||
| Net Asset Value | 12.60 | 15.38 | (18.08 | ) | 15.39 | 11.72 | ||||||||||||||
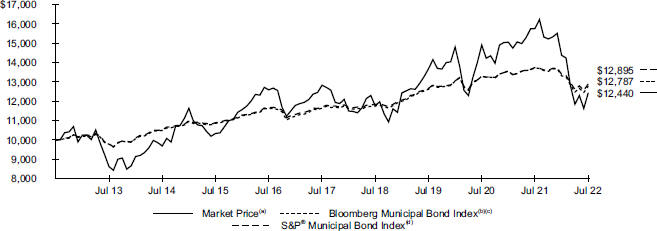
| (a) | Represents the Trust’s closing market price on the NYSE and reflects the reinvestment of dividends and/or distributions at actual reinvestment prices. |
| (b) | An unmanaged index that tracks the U.S. long term tax-exempt bond market, including state and local general obligation bonds, revenue bonds, pre-refunded bonds, and insured bonds. |
| (c) | Effective October 1, 2021, the Trust changed its reporting benchmark from S&P Municipal Bond Index to Bloomberg Municipal Bond Index. The investment adviser believes the new benchmark is a more appropriate reporting benchmarks for the Trust. |
| (d) | A broad, market value-weighted index that seeks to measure the performance of the U.S. municipal bond market. |
T R U S T SU M M A R Y | 9 |
Trust Summary as of July 31, 2022 (continued) | BlackRock Municipal Income Trust II (BLE) |
| Average Annual Total Returns | ||||||||||||
| 1 Year | 5 Years | 10 Years | ||||||||||
Trust at NAV (a)(b) | (13.72 | )% | 1.49 | % | 3.37 | % | ||||||
Trust at Market Price (a)(b) | (21.05 | ) | (0.61 | ) | 2.21 | |||||||
National Customized Reference Benchmark (c) | (7.05 | ) | 2.13 | N/A | ||||||||
| Bloomberg Municipal Bond Index | (6.93 | ) | 1.88 | 2.49 | ||||||||
S&P ® Municipal Bond Index | (6.18 | ) | 1.96 | 2.58 | ||||||||
Lipper General & Insured Municipal Debt Funds (Leveraged) at NAV (d) | (12.54 | ) | 1.96 | 3.52 | ||||||||
Lipper General & Insured Municipal Debt Funds (Leveraged) at Market Price (d) | (16.74 | ) | 1.58 | 2.90 | ||||||||
| (a) | All returns reflect reinvestment of dividends and/or distributions at actual reinvestment prices. Performance results reflect the Trust’s use of leverage. |
| (b) | The Trust moved from a premium to NAV to a discount during the period, which accounts for the difference between performance based on market price and performance based on NAV. |
| (c) | The National Customized Reference Benchmark is comprised of the Bloomberg Municipal Bond Index Total Return Index Value Unhedged (90%) and the Bloomberg Municipal Bond: High Yield (non-Investment Grade) Total Return Index (10%). Effective October 1, 2021, the Trust changed its reporting benchmarks from S&P Municipal Bond Index and Lipper General & Insured Municipal Debt Funds (Leveraged) to Bloomberg Municipal Bond Index and the National Customized Reference Benchmark. The investment adviser believes the new benchmarks are more appropriate reporting benchmarks for the Trust. The National Customized Reference Benchmark commenced on September 30, 2016. |
| (d) | Average return. Returns reflect reinvestment of dividends and/or distributions at NAV on the ex-dividend date as calculated by Lipper. |
| 10 | 2 0 2 2 BL A C K RO C K AN N U A L RE P O R T T O SH A R E H O L D E R S |
Trust Summary as of July 31, 2022 (continued) | BlackRock Municipal Income Trust II (BLE) |
Sector (a)(b) | 07/31/22 | |||
| Transportation | 21.0 | % | ||
| Health | 16.1 | |||
| County/City/Special District/School District | 13.6 | |||
| State | 13.5 | |||
| Education | 8.2 | |||
| Corporate | 7.9 | |||
| Utilities | 7.7 | |||
| Tobacco | 6.2 | |||
| Housing | 5.8 | |||
Credit Rating (a)(d) | 07/31/22 | |||||||
| AAA/Aaa | 4.6 | % | ||||||
| AA/Aa | 32.1 | |||||||
| A | 35.6 | |||||||
| BBB/Baa | 11.9 | |||||||
| BB/Ba | 4.9 | |||||||
| B | 0.9 | |||||||
N/R (e) | 10.0 | |||||||
Calendar Year Ended December 31, (a)(c) | Percentage | |||
| 2022 | 3.8 | % | ||
| 2023 | 12.2 | |||
| 2024 | 6.6 | |||
| 2025 | 6.0 | |||
| 2026 | 5.5 | |||
| (a) | Excludes short-term securities. |
| (b) | For Trust compliance purposes, the Trust’s sector classifications refer to one or more of the sector sub-classifications used by one or more widely recognized market indexes or rating group indexes, and/or as defined by the investment adviser. These definitions may not apply for purposes of this report, which may combine such sector sub-classifications for reporting ease. |
| (c) | Scheduled maturity dates and/or bonds that are subject to potential calls by issuers over the next five years. |
| (d) | For financial reporting purposes, credit quality ratings shown above reflect the highest rating assigned by either S&P Global Ratings or Moody’s Investors Service, Inc. if ratings differ. These rating agencies are independent, nationally recognized statistical rating organizations and are widely used. Investment grade ratings are credit ratings of BBB/Baa or higher. Below investment grade ratings are credit ratings of BB/Ba or lower. Investments designated N/R are not rated by either rating agency. Unrated investments do not necessarily indicate low credit quality. Credit quality ratings are subject to change. |
| (e) | The investment adviser evaluates the credit quality of unrated investments based upon certain factors including, but not limited to, credit ratings for similar investments and financial analysis of sectors and individual investments. Using this approach, the investment adviser has deemed certain of these unrated securities as investment grade quality. As of July 31, 2022, the market value of unrated securities deemed by the investment adviser to be investment grade represents 2.0% of the Trust’s total investments. |
T R U S T SU M M A R Y | 11 |
Trust Summary as of July 31, 2022 | BlackRock MuniVest Fund, Inc. (MVF) |
| Symbol on New York Stock Exchange | MVF | |
| Initial Offering Date | September 29, 1988 | |
Yield on Closing Market Price as of July 31, 2022 ($7.81) (a) | 5.15% | |
Tax Equivalent Yield (b) | 8.70% | |
Current Monthly Distribution per Common Share (c) | $0.0335 | |
Current Annualized Distribution per Common Share (c) | $0.4020 | |
Leverage as of July 31, 2022 (d) | 38% |
| (a) | Yield on closing market price is calculated by dividing the current annualized distribution per share by the closing market price. Past performance is not an indication of future results. |
| (b) | Tax equivalent yield assumes the maximum marginal U.S. federal tax rate of 40.8%, which includes the 3.8% Medicare tax. Actual tax rates will vary based on income, exemptions and deductions. Lower taxes will result in lower tax equivalent yields. |
| (c) | The distribution rate is not constant and is subject to change. |
| (d) | Represents VMTP Shares and TOB Trusts as a percentage of total managed assets, which is the total assets of the Trust, including any assets attributable to VMTP Shares and TOB Trusts, minus the sum of its accrued liabilities. Does not reflect derivatives or other instruments that may give rise to economic leverage. For a discussion of leveraging techniques utilized by the Trust, please see The Benefits and Risks of Leveraging and Derivative Financial Instruments. |
| 07/31/22 | 07/31/21 | Change | High | Low | ||||||||||||||||
| Closing Market Price | $ | 7.81 | $ | 9.72 | (19.65 | )% | $ | 9.89 | $ | 7.07 | ||||||||||
| Net Asset Value | 8.37 | 10.20 | (17.94 | ) | 10.21 | 7.84 | ||||||||||||||
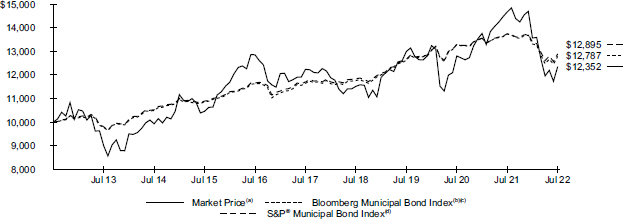
| (a) | Represents the Trust’s closing market price on the NYSE and reflects the reinvestment of dividends and/or distributions at actual reinvestment prices. |
| (b) | An unmanaged index that tracks the U.S. long term tax-exempt bond market, including state and local general obligation bonds, revenue bonds, pre-refunded bonds, and insured bonds. |
| (c) | Effective October 1, 2021, the Trust changed its reporting benchmark from S&P Municipal Bond Index to Bloomberg Municipal Bond Index. The investment adviser believes the new benchmark is a more appropriate reporting benchmarks for the Trust. |
| (d) | A broad, market value-weighted index that seeks to measure the performance of the U.S. municipal bond market. |
| 12 | 2 0 2 2 BL A C K RO C K AN N U A L RE P O R T T O SH A R E H O L D E R S |
Trust Summary as of July 31, 2022 (continued) | BlackRock MuniVest Fund, Inc. (MVF) |
| Average Annual Total Returns | ||||||||||||
| 1 Year | 5 Years | 10 Years | ||||||||||
Trust at NAV (a)(b) | (14.02 | )% | 1.98 | % | 3.34 | % | ||||||
Trust at Market Price (a)(b) | (15.82 | ) | 0.19 | 2.14 | ||||||||
National Customized Reference Benchmark (c) | (7.05 | ) | 2.13 | N/A | ||||||||
| Bloomberg Municipal Bond Index | (6.93 | ) | 1.88 | 2.49 | ||||||||
S&P ® Municipal Bond Index | (6.18 | ) | 1.96 | 2.58 | ||||||||
Lipper General & Insured Municipal Debt Funds (Leveraged) at NAV (d) | (12.54 | ) | 1.96 | 3.52 | ||||||||
Lipper General & Insured Municipal Debt Funds (Leveraged) at Market Price (d) | (16.74 | ) | 1.58 | 2.90 | ||||||||
| (a) | All returns reflect reinvestment of dividends and/or distributions at actual reinvestment prices. Performance results reflect the Trust’s use of leverage. |
| (b) | The Trust’s discount to NAV widened during the period, which accounts for the difference between performance based on market price and performance based on NAV. |
| (c) | The National Customized Reference Benchmark is comprised of the Bloomberg Municipal Bond Index Total Return Index Value Unhedged (90%) and the Bloomberg Municipal Bond: High Yield (non-Investment Grade) Total Return Index (10%). Effective October 1, 2021, the Trust changed its reporting benchmarks from S&P Municipal Bond Index and Lipper General & Insured Municipal Debt Funds (Leveraged) to Bloomberg Municipal Bond Index and the National Customized Reference Benchmark. The investment adviser believes the new benchmarks are more appropriate reporting benchmarks for the Trust. The National Customized Reference Benchmark commenced on September 30, 2016. |
| (d) | Average return. Returns reflect reinvestment of dividends and/or distributions at NAV on the ex-dividend date as calculated by Lipper. |
T R U S T SU M M A R Y | 13 |
Trust Summary as of July 31, 2022 (continued) | BlackRock MuniVest Fund, Inc. (MVF) |
Sector (a)(b) | 07/31/22 | |||
| Transportation | 24.1 | % | ||
| Health | 21.8 | |||
| State | 13.9 | |||
| County/City/Special District/School District | 11.0 | |||
| Utilities | 9.2 | |||
| Education | 6.2 | |||
| Tobacco | 5.3 | |||
| Corporate | 4.9 | |||
| Housing | 3.6 | |||
Credit Rating (a)(d) | 07/31/22 | |||||||
| AAA/Aaa | 2.1 | % | ||||||
| AA/Aa | 39.4 | |||||||
| A | 31.2 | |||||||
| BBB/Baa | 9.3 | |||||||
| BB/Ba | 4.2 | |||||||
| B | 1.8 | |||||||
N/R (e) | 12.0 | |||||||
Calendar Year Ended December 31, (a)(c) | Percentage | |||
| 2022 | 5.2 | % | ||
| 2023 | 5.1 | |||
| 2024 | 5.8 | |||
| 2025 | 7.0 | |||
| 2026 | 6.5 | |||
| (a) | Excludes short-term securities. |
| (b) | For Trust compliance purposes, the Trust’s sector classifications refer to one or more of the sector sub-classifications used by one or more widely recognized market indexes or rating group indexes, and/or as defined by the investment adviser. These definitions may not apply for purposes of this report, which may combine such sector sub-classifications for reporting ease. |
| (c) | Scheduled maturity dates and/or bonds that are subject to potential calls by issuers over the next five years. |
| (d) | For financial reporting purposes, credit quality ratings shown above reflect the highest rating assigned by either S&P Global Ratings or Moody’s Investors Service, Inc. if ratings differ. These rating agencies are independent, nationally recognized statistical rating organizations and are widely used. Investment grade ratings are credit ratings of BBB/Baa or higher. Below investment grade ratings are credit ratings of BB/Ba or lower. Investments designated N/R are not rated by either rating agency. Unrated investments do not necessarily indicate low credit quality. Credit quality ratings are subject to change. |
| (e) | The investment adviser evaluates the credit quality of unrated investments based upon certain factors including, but not limited to, credit ratings for similar investments and financial analysis of sectors and individual investments. Using this approach, the investment adviser has deemed certain of these unrated securities as investment grade quality. As of July 31, 2022, the market value of unrated securities deemed by the investment adviser to be investment grade represents 2.3% of the Trust’s total investments. |
| 14 | 2 0 2 2 BL A C K RO C K AN N U A L RE P O R T T O SH A R E H O L D E R S |
Schedule of Investments July 31, 2022 | BlackRock Municipal Income Quality Trust (BYM) (Percentages shown are based on Net Assets) |
| Security | Par (000) | Value | ||||||
| Municipal Bonds | ||||||||
| Alabama — 0.4% | ||||||||
City of Birmingham Alabama, GO, CAB, Series A-1, Convertible, 5.00%, 09/01/25 (a)(b) | $ | 1,165 | $ | 1,277,935 | ||||
Arizona (c) — 1.1% | ||||||||
| Arizona Industrial Development Authority, RB 4.38%, 07/01/39 | 725 | 691,334 | ||||||
| Series A, 5.00%, 07/01/39 | 610 | 614,756 | ||||||
| Series A, 5.00%, 07/01/49 | 690 | 690,930 | ||||||
| Series A, 5.00%, 07/01/54 | 530 | 530,243 | ||||||
| Industrial Development Authority of the County of Pima, Refunding RB, 5.00%, 06/15/52 | 595 | 590,974 | ||||||
| Maricopa County Industrial Development Authority, Refunding RB 5.00%, 07/01/39 | 255 | 261,390 | ||||||
| 5.00%, 07/01/54 | 590 | 595,662 | ||||||
| 3,975,289 | ||||||||
| California — 14.3% | ||||||||
California Community Housing Agency, RB, M/F Housing (c) Series A, 5.00%, 04/01/49 | 265 | 237,745 | ||||||
| Series A-2, 4.00%, 08/01/47 | 1,715 | 1,411,697 | ||||||
| California Health Facilities Financing Authority, Refunding RB Series A, 3.00%, 10/01/47 | 2,795 | 2,232,864 | ||||||
| Sub-Series A-2, 5.00%, 11/01/47 | 1,465 | 1,787,252 | ||||||
California Infrastructure & Economic Development Bank, RB, Series A, 1st Lien, (AMBAC), 5.00%, 01/01/28 (a) | 10,100 | 11,744,462 | ||||||
| California State Public Works Board, RB, Series I, 5.50%, 11/01/33 | 1,415 | 1,479,448 | ||||||
| California Statewide Communities Development Authority, Refunding RB, 4.00%, 03/01/48 | 3,175 | 3,071,454 | ||||||
CMFA Special Finance Agency XII, RB, M/F Housing, Series A, 3.25%, 02/01/57 (c) | 150 | 113,933 | ||||||
CSCDA Community Improvement Authority, RB, M/F Housing (c) 5.00%, 09/01/37 | 135 | 125,387 | ||||||
| 4.00%, 10/01/56 | 195 | 178,376 | ||||||
| 4.00%, 12/01/56 | 230 | 184,460 | ||||||
| 3.00%, 03/01/57 | 535 | 399,487 | ||||||
| Series A, Class 2, 4.00%, 06/01/58 | 1,170 | 1,006,576 | ||||||
| Senior Lien, 3.13%, 06/01/57 | 690 | 500,610 | ||||||
| Series A, Class 2, Senior Lien, 4.00%, 12/01/58 | 1,055 | 861,721 | ||||||
Golden State Tobacco Securitization Corp., Refunding RB, CAB, Series B, Subordinate, 0.00%, 06/01/66 (d) | 4,695 | 596,396 | ||||||
| Mount San Antonio Community College District, Refunding GO, CAB, Series A, Convertiable, Election 2008, 6.25%, 08/01/28 | 1,580 | 1,591,373 | ||||||
| Regents of the University of California Medical Center Pooled Revenue, RB, Series P, 4.00%, 05/15/53 | 4,100 | 4,133,202 | ||||||
| Riverside County Redevelopment Successor Agency, Refunding TA, Series A, (BAM), 4.00%, 10/01/39 | 3,700 | 3,720,213 | ||||||
| San Diego County Regional Airport Authority, ARB, Series A, Subordinate, 4.00%, 07/01/56 | 2,730 | 2,732,154 | ||||||
San Diego Unified School District, GO, CAB (d) Series K-2, 0.00%, 07/01/38 | 1,745 | 945,041 | ||||||
| Series K-2, 0.00%, 07/01/39 | 2,115 | 1,089,274 | ||||||
| Series K-2, 0.00%, 07/01/40 | 2,715 | 1,349,197 | ||||||
| Series C, Election 2008, 0.00%, 07/01/38 | 2,000 | 1,136,916 | ||||||
Series G, Election 2008, 0.00%, 07/01/34 (a) | 725 | 404,379 | ||||||
Series G, Election 2008, 0.00%, 07/01/35 (a) | 775 | 407,095 | ||||||
Series G, Election 2008, 0.00%, 07/01/36 (a) | 1,155 | 571,398 | ||||||
| Security | Par (000) | Value | ||||||
| California (continued) | ||||||||
San Diego Unified School District, GO, CAB (d) (continued)Series G, Election 2008, 0.00%, 07/01/37 (a) | $ | 770 | $ | 358,891 | ||||
San Diego Unified School District, Refunding GO, CAB, Series R-1, 0.00%, 07/01/31 (d) | 1,400 | 1,055,370 | ||||||
Yosemite Community College District, GO, Series D, Election 2004, 0.00%, 08/01/37 (d) | 10,000 | �� | 5,772,830 | |||||
| 51,199,201 | ||||||||
| Colorado — 1.9% | ||||||||
| City & County of Denver Colorado Airport System Revenue, Refunding ARB, Series B, 5.25%, 11/15/53 | 5,000 | 5,689,140 | ||||||
Sabell Metropolitan District, GO, Series A, 5.00%, 12/01/50 (c) | 1,055 | 973,747 | ||||||
| 6,662,887 | ||||||||
| Delaware — 0.8% | ||||||||
| County of Kent Delaware, RB Series A, 5.00%, 07/01/40 | 770 | 794,679 | ||||||
| Series A, 5.00%, 07/01/48 | 2,110 | 2,134,432 | ||||||
| 2,929,111 | ||||||||
| District of Columbia — 2.7% | ||||||||
| District of Columbia Tobacco Settlement Financing Corp., Refunding RB, 6.75%, 05/15/40 | 9,500 | 9,761,982 | ||||||
| Florida — 5.9% | ||||||||
| Brevard County Health Facilities Authority, Refunding RB, 5.00%, 04/01/39 | 1,795 | 1,885,163 | ||||||
Capital Trust Agency, Inc., RB (c) Series A, 5.00%, 06/01/45 | 615 | 569,566 | ||||||
| Series A, 5.50%, 06/01/57 | 220 | 208,499 | ||||||
County of Miami-Dade Seaport Department, ARB, Series A, 6.00%, 10/01/23 (a) | 2,770 | 2,908,137 | ||||||
| Florida Development Finance Corp., RB, Series A, 5.00%, 06/15/56 | 580 | 595,261 | ||||||
Florida Development Finance Corp., Refunding RB (c) 5.00%, 09/15/40 | 340 | 340,774 | ||||||
| 6.50%, 06/30/57 | 420 | 429,054 | ||||||
| Miami Beach Health Facilities Authority, RB, 3.00%, 11/15/51 | 425 | 325,930 | ||||||
| Miami-Dade County Educational Facilities Authority, Refunding RB, Series A, 5.00%, 04/01/40 | 3,910 | 4,107,349 | ||||||
| Miami-Dade County Health Facilities Authority, Refunding RB, 5.00%, 08/01/42 | 685 | 725,937 | ||||||
| Orange County Health Facilities Authority, RB, 4.00%, 10/01/52 | 4,000 | 3,913,884 | ||||||
| Orange County Health Facilities Authority, Refunding RB 5.00%, 08/01/41 | 630 | 665,069 | ||||||
| 5.00%, 08/01/47 | 1,845 | 1,949,798 | ||||||
| Preserve at South Branch Community Development District, SAB 4.00%, 11/01/39 | 300 | 279,340 | ||||||
| 4.00%, 11/01/50 | 500 | 436,337 | ||||||
Reedy Creek Improvement District, GO, Series A, 5.25%, 06/01/23 (a) | 1,340 | 1,381,208 | ||||||
Westside Haines City Community Development District, Refunding SAB (c) 4.10%, 05/01/37 | 260 | 248,982 | ||||||
| 4.13%, 05/01/38 | 260 | 248,350 | ||||||
| 21,218,638 | ||||||||
| Georgia — 2.6% | ||||||||
East Point Business & Industrial Development Authority, RB, Series A, 5.25%, 06/15/62 (c) | 245 | 250,292 | ||||||
S C H E D U L E O F IN V E S T M E N T S | 15 |
Schedule of Investments (continued) July 31, 2022 | BlackRock Municipal Income Quality Trust (BYM) (Percentages shown are based on Net Assets) |
| Security | Par (000) | Value | ||||||
| Georgia (continued) | ||||||||
Gainesville & Hall County Hospital Authority, Refunding RB, Series A, (GTD), 5.50%, 08/15/54 (a) | $ | 545 | $ | 595,807 | ||||
| Georgia Housing & Finance Authority, RB, S/F Housing | ||||||||
| Series A, 3.95%, 12/01/43 | 275 | 280,333 | ||||||
| Series A, 4.00%, 12/01/48 | 410 | 417,153 | ||||||
| Main Street Natural Gas, Inc., RB | ||||||||
| Series A, 5.00%, 05/15/38 | 595 | 649,365 | ||||||
| Series A, 5.00%, 05/15/43 | 775 | 803,988 | ||||||
Series A, 4.00%, 09/01/52 (e) | 3,065 | 3,115,248 | ||||||
Series C, 4.00%, 05/01/52 (e) | 2,385 | 2,433,623 | ||||||
Private Colleges & Universities Authority, RB (a) | ||||||||
| 5.00%, 04/01/33 | 155 | 163,410 | ||||||
| 5.00%, 04/01/44 | 595 | 627,579 | ||||||
| 9,336,798 | ||||||||
| Idaho — 0.4% | ||||||||
| Idaho Housing & Finance Association, RB, 5.50%, 05/01/57 | 1,510 | 1,588,404 | ||||||
| Illinois — 13.8% | ||||||||
| Chicago Board of Education, GO | ||||||||
| Series A, 5.00%, 12/01/37 | 1,265 | 1,338,015 | ||||||
| Series A, 5.00%, 12/01/38 | 515 | 542,742 | ||||||
| Series A, 5.00%, 12/01/39 | 1,390 | 1,463,881 | ||||||
| Series A, 5.00%, 12/01/47 | 605 | 637,792 | ||||||
| Chicago O’Hare International Airport, ARB, Series D, Senior Lien, 5.25%, 01/01/42 | 3,300 | 3,556,519 | ||||||
| Chicago Transit Authority Sales Tax Receipts Fund, RB, 5.25%, 12/01/49 | 3,500 | 3,635,401 | ||||||
| Cook County Community College District No.508, GO | ||||||||
| 5.13%, 12/01/38 | 7,700 | 7,879,448 | ||||||
| 5.50%, 12/01/38 | 1,000 | 1,035,065 | ||||||
| Illinois Finance Authority, RB | ||||||||
| Series A, 5.00%, 02/15/47 | 565 | 547,712 | ||||||
| Series A, 5.00%, 02/15/50 | 310 | 296,674 | ||||||
| Illinois Finance Authority, Refunding RB | ||||||||
| Series B, 4.00%, 08/15/41 | 900 | 884,437 | ||||||
| Series C, 4.13%, 08/15/37 | 3,130 | 3,131,578 | ||||||
| Series C, 5.00%, 08/15/44 | 390 | 402,295 | ||||||
| Illinois Housing Development Authority, RB, S/F Housing, Series A, (FHLMC, FNMA, GNMA), 3.75%, 10/01/43 | 3,000 | 2,935,410 | ||||||
| Illinois State Toll Highway Authority, RB, Series A, 5.00%, 01/01/40 | 7,020 | 7,526,837 | ||||||
| Metropolitan Pier & Exposition Authority, RB, Series A, 5.00%, 06/15/57 | 670 | 692,225 | ||||||
| State of Illinois, GO | ||||||||
| 5.25%, 07/01/29 | 8,345 | 8,563,572 | ||||||
| 5.50%, 07/01/33 | 880 | 903,965 | ||||||
| 5.50%, 07/01/38 | 1,475 | 1,512,124 | ||||||
| 5.50%, 05/01/39 | 1,840 | 2,035,609 | ||||||
| 49,521,301 | ||||||||
| Indiana — 0.1% | ||||||||
| Indiana Finance Authority, RB, Series A, 4.00%, 11/01/51 | 525 | 525,765 | ||||||
| Iowa — 0.9% | ||||||||
Iowa Finance Authority, RB, 5.50%, 07/01/23 (a) | 3,000 | 3,106,302 | ||||||
| Security | Par (000) | Value | ||||||
| Maryland — 1.6% | ||||||||
| County of Montgomery Maryland, RB, 4.00%, 12/01/44 | $ | 1,810 | $ | 1,808,139 | ||||
| Maryland Health & Higher Educational Facilities Authority, RB, 4.00%, 07/01/48 | 4,000 | 4,001,488 | ||||||
| 5,809,627 | ||||||||
| Massachusetts — 1.9% | ||||||||
| Massachusetts Development Finance Agency, RB | ||||||||
| 5.00%, 10/01/48 | 1,970 | 1,916,459 | ||||||
| Series A, 5.00%, 01/01/47 | 2,370 | 2,451,948 | ||||||
| Massachusetts Development Finance Agency, Refunding RB | ||||||||
| 5.00%, 07/01/37 | 190 | 200,131 | ||||||
| 5.00%, 09/01/43 | 1,750 | 1,837,395 | ||||||
| Massachusetts Housing Finance Agency, RB, M/F Housing, Series A, 3.85%, 06/01/46 | 490 | 471,806 | ||||||
| 6,877,739 | ||||||||
| Michigan — 3.0% | ||||||||
| Michigan Finance Authority, RB, Series S, 5.00%, 11/01/44 | 3,640 | 3,824,861 | ||||||
| Michigan Finance Authority, Refunding RB, 5.00%, 11/15/41 | 2,235 | 2,332,229 | ||||||
| Michigan State Housing Development Authority, RB, M/F Housing, Series A, 3.80%, 10/01/38 | 3,965 | 3,969,750 | ||||||
Western Michigan University, Refunding RB, (AGM), 5.00%, 11/15/23 (a) | 430 | 448,237 | ||||||
| 10,575,077 | ||||||||
| Minnesota — 0.4% | ||||||||
| City of Minneapolis Minnesota, Refunding RB, Series A, 5.00%, 11/15/49 | 1,315 | 1,386,817 | ||||||
| Nevada — 0.8% | ||||||||
| City of Las Vegas Nevada Special Improvement District No.611, SAB | ||||||||
| 4.00%, 06/01/40 | 450 | 410,383 | ||||||
| 4.13%, 06/01/50 | 1,150 | 996,224 | ||||||
| Tahoe-Douglas Visitors Authority, RB | ||||||||
| 5.00%, 07/01/40 | 360 | 377,150 | ||||||
| 5.00%, 07/01/45 | 450 | 464,913 | ||||||
| 5.00%, 07/01/51 | 480 | 490,754 | ||||||
| 2,739,424 | ||||||||
| New Hampshire — 0.1% | ||||||||
New Hampshire Business Finance Authority, Refunding RB, Series A, 3.63%, 07/01/43 (c)(e) | 450 | 391,732 | ||||||
| New Jersey — 9.2% | ||||||||
| New Jersey Economic Development Authority, RB | ||||||||
| Series DDD, 5.00%, 06/15/42 | 375 | 392,396 | ||||||
| Series WW, 5.25%, 06/15/33 | 170 | 183,123 | ||||||
| Series WW, 5.00%, 06/15/34 | 225 | 237,780 | ||||||
| Series WW, 5.00%, 06/15/36 | 1,395 | 1,457,701 | ||||||
| Series WW, 5.25%, 06/15/40 | 380 | 395,306 | ||||||
Series WW, 5.25%, 06/15/40 (a) | 20 | 21,933 | ||||||
| New Jersey Economic Development Authority, Refunding RB, Sub-Series A, 4.00%, 07/01/32 | 930 | 947,501 | ||||||
| New Jersey Health Care Facilities Financing Authority, RB, 3.00%, 07/01/51 | 3,525 | 2,879,523 | ||||||
| New Jersey Health Care Facilities Financing Authority, Refunding RB, 5.00%, 10/01/37 | 1,605 | 1,713,544 | ||||||
| New Jersey Transportation Trust Fund Authority, RB | ||||||||
| Series AA, 5.25%, 06/15/33 | 1,660 | 1,696,581 | ||||||
| Series AA, 5.00%, 06/15/36 | 5,070 | 5,190,149 | ||||||
| 16 | 2 0 2 2 BL A C K RO C K AN N U A L RE P O R T T O SH A R E H O L D E R S |
Schedule of Investments (continued) July 31, 2022 | BlackRock Municipal Income Quality Trust (BYM) (Percentages shown are based on Net Assets) |
| Security | Par (000) | Value | ||||||
| New Jersey (continued) | ||||||||
| New Jersey Transportation Trust Fund Authority, RB (continued) | ||||||||
| Series AA, 5.00%, 06/15/38 | $ | 945 | $ | 971,842 | ||||
| Series BB, 4.00%, 06/15/50 | 3,000 | 2,918,559 | ||||||
| Series D, 5.00%, 06/15/32 | 900 | 954,773 | ||||||
| Series S, 5.25%, 06/15/43 | 2,150 | 2,319,846 | ||||||
New Jersey Transportation Trust Fund Authority, RB, CAB, Series A, 0.00%, 12/15/38 (d) | 5,845 | 2,925,569 | ||||||
| New Jersey Transportation Trust Fund Authority, Refunding RB | ||||||||
| Series A, 5.00%, 12/15/36 | 340 | 366,840 | ||||||
| Series A, 4.00%, 06/15/40 | 1,690 | 1,682,016 | ||||||
| South Jersey Port Corp., ARB, Series A, 5.00%, 01/01/49 | 720 | 750,740 | ||||||
| Tobacco Settlement Financing Corp., Refunding RB | ||||||||
| Series A, 5.00%, 06/01/35 | 1,750 | 1,887,660 | ||||||
| Series A, 5.25%, 06/01/46 | 1,725 | 1,818,190 | ||||||
| Sub-Series B, 5.00%, 06/01/46 | 1,130 | 1,154,379 | ||||||
| 32,865,951 | ||||||||
| New Mexico — 0.1% | ||||||||
| City of Santa Fe New Mexico, RB, Series A, 5.00%, 05/15/49 | 220 | 199,135 | ||||||
| New York — 3.7% | ||||||||
| Metropolitan Transportation Authority, Refunding RB | ||||||||
| Series C-1, 5.25%, 11/15/55 | 1,135 | 1,206,934 | ||||||
| Series C-1, 5.00%, 11/15/56 | 1,690 | 1,739,578 | ||||||
| New York City Transitional Finance Authority Future Tax Secured Revenue, RB | ||||||||
Series A-1, Subordinate, 4.00%, 08/01/48 (f) | 1,320 | 1,314,729 | ||||||
| Series C-1, Class 1, Subordinate, 4.00%, 02/01/42 | 1,000 | 1,008,416 | ||||||
New York Liberty Development Corp., Refunding RB, Series 1, Class 1, 5.00%, 11/15/44 (c) | 1,240 | 1,243,855 | ||||||
| New York State Dormitory Authority, Refunding RB, Series A, 4.00%, 03/15/49 | 4,115 | 4,111,268 | ||||||
| State of New York Mortgage Agency, Refunding RB, S/F Housing, Series 211, 3.75%, 10/01/43 | 2,810 | 2,681,344 | ||||||
| 13,306,124 | ||||||||
| North Dakota — 0.1% | ||||||||
| North Dakota Housing Finance Agency, RB, S/F Housing, 3.70%, 01/01/46 | 500 | 480,258 | ||||||
| Ohio — 4.5% | ||||||||
| Buckeye Tobacco Settlement Financing Authority, Refunding RB | ||||||||
| Series A-2, Class 1, 3.00%, 06/01/48 | 4,495 | 3,603,439 | ||||||
| Series A-2, Class 1, 4.00%, 06/01/48 | 4,625 | 4,458,976 | ||||||
| Series B-2, Class 2, 5.00%, 06/01/55 | 5,345 | 5,325,758 | ||||||
| Northwest Local School District/Hamilton & Butler Counties, GO, 4.00%, 12/01/50 | 2,645 | 2,646,262 | ||||||
| 16,034,435 | ||||||||
| Oregon — 0.6% | ||||||||
Clackamas County School District No.12 North Clackamas, GO, CAB, Series A, (GTD), 0.00%, 06/15/38 (d) | 1,115 | 577,191 | ||||||
| Oregon State Facilities Authority, Refunding RB, Series A, 4.13%, 06/01/52 | 650 | 634,243 | ||||||
Washington & Multnomah Counties School District No. 48J Beaverton, GO, CAB, Series D, Convertible, (GTD), 5.00%, 06/15/36 (b) | 945 | 1,062,341 | ||||||
| 2,273,775 | ||||||||
| Security | Par (000) | Value | ||||||
| Pennsylvania — 6.0% | ||||||||
| Bucks County Industrial Development Authority, RB | ||||||||
| 4.00%, 07/01/46 | $ | 105 | $ | 85,056 | ||||
| 4.00%, 07/01/51 | 100 | 79,305 | ||||||
| Commonwealth Financing Authority, RB | ||||||||
| 5.00%, 06/01/33 | 790 | 870,953 | ||||||
| (AGM), 4.00%, 06/01/39 | 3,230 | 3,241,163 | ||||||
| Montgomery County Higher Education and Health Authority, Refunding RB, Series A, 4.00%, 09/01/49 | 1,145 | 1,147,967 | ||||||
| Pennsylvania Economic Development Financing Authority, Refunding RB, Series A, 4.00%, 02/15/52 | 800 | 792,613 | ||||||
| Pennsylvania Higher Educational Facilities Authority, Refunding RB, Series A, 5.25%, 09/01/50 | 4,245 | 4,428,745 | ||||||
| Pennsylvania Housing Finance Agency, Refunding RB, S/F Housing, Series 2022, 4.25%, 10/01/47 | 2,415 | 2,418,946 | ||||||
| Pennsylvania Turnpike Commission, RB | ||||||||
| Series A, 5.00%, 12/01/38 | 695 | 740,017 | ||||||
| Series A-1, 5.00%, 12/01/41 | 2,730 | 2,911,165 | ||||||
| Series B, 5.00%, 12/01/40 | 1,060 | 1,132,365 | ||||||
Series C, 5.50%, 12/01/33 (a) | 630 | 661,563 | ||||||
| Series A, Subordinate, 4.00%, 12/01/45 | 340 | 334,801 | ||||||
| Series A, Subordinate, 4.00%, 12/01/46 | 1,605 | 1,576,917 | ||||||
| Pennsylvania Turnpike Commission, Refunding RB, Series A-1, 5.00%, 12/01/40 | 850 | 892,169 | ||||||
| 21,313,745 | ||||||||
| Puerto Rico — 4.7% | ||||||||
| Puerto Rico Sales Tax Financing Corp. Sales Tax Revenue, RB | ||||||||
| Series A-1, Restructured, 4.75%, 07/01/53 | 5,112 | 5,092,886 | ||||||
| Series A-1, Restructured, 5.00%, 07/01/58 | 6,950 | 6,999,922 | ||||||
| Series A-2, Restructured, 4.33%, 07/01/40 | 1,688 | 1,671,061 | ||||||
| Series A-2, Restructured, 4.78%, 07/01/58 | 349 | 348,033 | ||||||
| Series B-1, Restructured, 4.75%, 07/01/53 | 536 | 532,986 | ||||||
| Series B-2, Restructured, 4.78%, 07/01/58 | 520 | 515,498 | ||||||
Puerto Rico Sales Tax Financing Corp. Sales Tax Revenue, RB, CAB, Series A-1, Restructured, 0.00%, 07/01/46 (d) | 6,226 | 1,799,208 | ||||||
| 16,959,594 | ||||||||
| Rhode Island — 1.4% | ||||||||
| Tobacco Settlement Financing Corp., Refunding RB, Series B, 4.50%, 06/01/45 | 5,085 | 5,091,072 | ||||||
| South Carolina — 5.2% | ||||||||
South Carolina Jobs-Economic Development Authority, RB, 5.00%, 01/01/55 (c) | 1,095 | 999,617 | ||||||
| South Carolina Public Service Authority, RB | ||||||||
| Series A, 5.50%, 12/01/54 | 6,960 | 7,208,757 | ||||||
| Series E, 5.50%, 12/01/53 | 1,610 | 1,655,978 | ||||||
| South Carolina Public Service Authority, Refunding RB | ||||||||
| 5.00%, 12/01/38 | 2,360 | 2,425,299 | ||||||
| Series B, (AGM-CR), 5.00%, 12/01/56 | 2,845 | 2,959,793 | ||||||
| Spartanburg Regional Health Services District, Refunding RB, Series A, 4.00%, 04/15/43 | 3,500 | 3,497,074 | ||||||
| 18,746,518 | ||||||||
| South Dakota — 0.5% | ||||||||
City of Rapid City South Dakota Sales Tax Revenue, RB, 4.00%, 12/01/26 (a) | 1,760 | 1,902,975 | ||||||
S C H E D U L E O F IN V E S T M E N T S | 17 |
Schedule of Investments (continued) July 31, 2022 | BlackRock Municipal Income Quality Trust (BYM) (Percentages shown are based on Net Assets) |
| Security | Par (000) | Value | ||||||
| Tennessee — 0.7% | ||||||||
| Metropolitan Government Nashville & Davidson County Health & Educational Facilities Board, RB, Series A, 5.00%, 07/01/40 | $ | 35 | $ | 37,002 | ||||
| Tennessee Housing Development Agency, Refunding RB, S/F Housing, Series 2, 4.35%, 01/01/48 | 2,500 | 2,530,510 | ||||||
| 2,567,512 | ||||||||
| Texas — 16.8% | ||||||||
| City of Lubbock Texas Electric Light & Power System Revenue, Refunding RB, 4.00%, 04/15/51 | 5,200 | 5,218,028 | ||||||
Coppell Independent School District, Refunding GO, (PSF), 0.00%, 08/15/30 (d) | 10,030 | 8,074,000 | ||||||
County of Harris Texas, Refunding GO (d) | ||||||||
| (NPFGC), 0.00%, 08/15/25 | 7,485 | 7,054,904 | ||||||
| (NPFGC), 0.00%, 08/15/28 | 10,915 | 9,470,902 | ||||||
| Dallas Fort Worth International Airport, Refunding RB, Series F, 5.25%, 11/01/33 | 1,090 | 1,130,598 | ||||||
Grand Parkway Transportation Corp., RB, CAB, Series B, Convertible, 5.80%, 10/01/46 (b) | 2,365 | 2,544,059 | ||||||
| Harris County Cultural Education Facilities Finance Corp., Refunding RB, 3.00%, 10/01/51 | 3,900 | 3,174,389 | ||||||
Harris County-Houston Sports Authority, Refunding RB (d) | ||||||||
Series A, 3rd Lien, (NPFGC), 0.00%, 11/15/24 (a) | 5,965 | 2,500,665 | ||||||
| Series A, 3rd Lien, (NPFGC), 0.00%, 11/15/38 | 10,925 | 4,390,495 | ||||||
Harris County-Houston Sports Authority, Refunding RB, CAB (d) | ||||||||
| Series H, Junior Lien, (NPFGC), 0.00%, 11/15/38 | 5,785 | 2,502,331 | ||||||
| Series H, Junior Lien, (NPFGC), 0.00%, 11/15/39 | 6,160 | 2,496,784 | ||||||
| Katy Independent School District, GO, (PSF), 4.00%, 02/15/52 | 3,000 | 3,033,504 | ||||||
Leander Independent School District, Refunding GO, CAB, Series D, (PSF-GTD), 0.00%, 08/15/38 (a)(d) | 3,775 | 1,863,770 | ||||||
Midland County Fresh Water Supply District No.1, RB, CAB, Series A, 0.00%, 09/15/36 (d) | 2,340 | 1,227,496 | ||||||
New Hope Cultural Education Facilities Finance Corp., RB, Series A, 5.00%, 08/15/50 (c) | 580 | 579,990 | ||||||
North Texas Tollway Authority, RB, CAB (a) | ||||||||
Series B, 0.00%, 09/01/31 (d) | 1,975 | 983,985 | ||||||
Series C, Convertible, 6.75%, 09/01/31 (b) | 2,500 | 3,426,877 | ||||||
| Texas City Industrial Development Corp., RB, Series 2012, 4.13%, 12/01/45 | 330 | 327,372 | ||||||
| 60,000,149 | ||||||||
Utah (c) — 0.2% | ||||||||
| Utah Charter School Finance Authority, RB, Series A, 5.00%, 06/15/49 | 235 | 230,924 | ||||||
| Utah Charter School Finance Authority, Refunding RB, 5.00%, 06/15/55 | 450 | 437,927 | ||||||
| 668,851 | ||||||||
| Virginia — 5.9% | ||||||||
| Hampton Roads Transportation Accountability Commission, RB, Series A, 4.00%, 07/01/52 | 5,215 | 5,264,850 | ||||||
| Henrico County Economic Development Authority, Refunding RB, 5.00%, 10/01/52 | 5,750 | 6,286,601 | ||||||
| Tobacco Settlement Financing Corp., Refunding RB, Series B-1, 5.00%, 06/01/47 | 1,225 | 1,203,404 | ||||||
| Virginia Beach Development Authority, Refunding RB | ||||||||
| 5.00%, 09/01/44 | 1,375 | 1,386,586 | ||||||
| 4.00%, 09/01/48 | 885 | 759,795 | ||||||
| Security | Par (000) | Value | ||||||
| Virginia (continued) | ||||||||
| Virginia College Building Authority, RB, 4.00%, 02/01/42 | $ | 5,000 | $ | 5,223,930 | ||||
| Virginia Housing Development Authority, RB, M/F Housing, Series B, 4.00%, 06/01/53 | 895 | 872,073 | ||||||
| 20,997,239 | ||||||||
| Washington — 2.2% | ||||||||
| Washington State Convention Center Public Facilities District RB, 3.00%, 07/01/58 | 8,690 | 6,384,560 | ||||||
Washington State Housing Finance Commission, Refunding RB, 5.00%, 01/01/38 (c) | 1,400 | 1,461,529 | ||||||
| 7,846,089 | ||||||||
| West Virginia — 0.8% | ||||||||
| West Virginia Hospital Finance Authority, RB, Series A, 4.00%, 06/01/51 | 3,050 | 2,976,358 | ||||||
| Wisconsin — 3.2% | ||||||||
Public Finance Authority, RB (c) | ||||||||
| 5.00%, 06/15/51 | 305 | 269,297 | ||||||
| 5.00%, 10/15/51 | 270 | 256,545 | ||||||
| 5.00%, 06/15/56 | 400 | 345,477 | ||||||
| Series A, 5.00%, 07/15/39 | 120 | 125,797 | ||||||
| Series A, 5.00%, 10/15/40 | 1,260 | 1,224,782 | ||||||
| Series A, 5.00%, 07/15/49 | 455 | 471,127 | ||||||
| Series A, 5.00%, 07/15/54 | 215 | 221,899 | ||||||
| Series A, 5.00%, 07/01/55 | 395 | 378,514 | ||||||
| Series A-1, 4.50%, 01/01/35 | 685 | 672,369 | ||||||
Public Finance Authority, Refunding RB, 5.00%, 09/01/39 (c) | 375 | 356,926 | ||||||
| Wisconsin Health & Educational Facilities Authority, Refunding RB | ||||||||
| 5.00%, 04/01/44 | 1,895 | 2,087,858 | ||||||
| Sereis C, 4.00%, 02/15/42 | 5,000 | 4,980,830 | ||||||
| 11,391,421 | ||||||||
| Total Municipal Bonds — 118.5% (Cost: $411,916,127) | 424,505,230 | |||||||
Municipal Bonds Transferred to Tender Option Bond Trusts (g) | ||||||||
| California — 1.1% | ||||||||
Los Angeles Unified School District, GO, Series B-1, Election 2008, 5.25%, 07/01/42(h) | 3,432 | 3,831,441 | ||||||
| Connecticut — 0.5% | ||||||||
| Connecticut State Health & Educational Facilities Authority, Refunding RB, 5.00%, 12/01/45 | 1,561 | 1,649,384 | ||||||
| Florida — 1.0% | ||||||||
| City of Miami Beach Florida, RB, 5.00%, 09/01/45 | 3,500 | 3,703,648 | ||||||
| Illinois — 2.0% | ||||||||
| Illinois State Toll Highway Authority, RB | ||||||||
| Series A, 5.00%, 01/01/40 | 3,045 | 3,265,378 | ||||||
| Series B, 5.00%, 01/01/40 | 1,170 | 1,261,834 | ||||||
| Series C, 5.00%, 01/01/38 | 2,658 | 2,805,684 | ||||||
| 7,332,896 | ||||||||
| Indiana — 3.0% | ||||||||
| Indiana Finance Authority, RB, Series A, 4.00%, 11/01/51 | 10,685 | 10,700,566 | ||||||
| Kansas — 1.7% | ||||||||
Wyandotte County Unified School District No.500 Kansas City, GO, Series A, 5.50%, 09/01/26 (a) | 5,363 | 6,148,624 | ||||||
| 18 | 2 0 2 2 BL A C K RO C K AN N U A L RE P O R T T O SH A R E H O L D E R S |
Schedule of Investments (continued) July 31, 2022 | BlackRock Municipal Income Quality Trust (BYM) (Percentages shown are based on Net Assets) |
| Security | Par (000) | Value | ||||||
| Maryland — 0.9% | ||||||||
| City of Baltimore Maryland, RB, Series A, 5.00%, 07/01/41 | $ | 3,139 | $ | 3,372,595 | ||||
| Massachusetts — 3.0% | ||||||||
| Massachusetts Development Finance Agency, Refunding RB, 4.00%, 07/01/35 | 7,070 | 7,263,349 | ||||||
Massachusetts School Building Authority, RB, Series B, 5.00%, 11/15/46 (h) | 3,300 | 3,576,387 | ||||||
| 10,839,736 | ||||||||
| Michigan — 0.9% | ||||||||
| Michigan Finance Authority, RB, Series A, 5.00%, 11/01/44 | 2,220 | 2,333,226 | ||||||
| Michigan State Building Authority, Refunding RB, Series I, 5.00%, 10/15/45 | 960 | 1,013,402 | ||||||
| 3,346,628 | ||||||||
| Nebraska — 1.6% | ||||||||
Central Plains Energy Project, RB, Series 1, 5.00%, 05/01/53 (e) | 5,220 | 5,623,008 | ||||||
| Nevada — 1.2% | ||||||||
| Las Vegas Valley Water District, Refunding GO, Series A, 5.00%, 06/01/46 | 3,900 | 4,150,725 | ||||||
| New York — 17.9% | ||||||||
| Metropolitan Transportation Authority, RB, Sub-Series D-1, 5.25%, 11/15/44 | 3,850 | 3,966,382 | ||||||
| New York City Municipal Water Finance Authority, RB, Series CC-1, Subordinate, 4.00%, 06/15/51 | 6,000 | 6,045,546 | ||||||
| New York City Transitional Finance Authority Future Tax Secured Revenue, RB | ||||||||
| Series B-1, 4.00%, 08/01/36 | 7,350 | 7,533,541 | ||||||
| Series F-1, Subordinate, 4.00%, 02/01/51 | 6,645 | 6,654,861 | ||||||
| New York City Water & Sewer System, Refunding RB | ||||||||
| Series DD, 5.00%, 06/15/35 | 1,845 | 1,955,557 | ||||||
| Series FF, 5.00%, 06/15/39 | 8,355 | 8,970,357 | ||||||
| New York State Dormitory Authority, Refunding RB, | ||||||||
| Series C, 4.00%, 07/01/49 | 8,955 | 8,992,571 | ||||||
| New York State Urban Development Corp., RB, Series A-1, 5.00%, 03/15/43 | 5,720 | 5,815,851 | ||||||
| Port Authority of New York & New Jersey, Refunding ARB Consolidated, 198th Series, 5.25%, 11/15/56 | 2,561 | 2,716,124 | ||||||
Series 230, 5.25%, 12/01/52 (h) | 10,000 | 11,332,940 | ||||||
| 63,983,730 | ||||||||
| Pennsylvania — 1.5% | ||||||||
| Pennsylvania Turnpike Commission, RB, Series A, 5.50%, 12/01/42 | 4,997 | 5,435,414 | ||||||
| Texas — 1.2% | ||||||||
| Tarrant County Cultural Education Facilities Finance Corp., Refunding RB, Series A, 5.00%, 02/15/41 | 3,920 | 4,183,628 | ||||||
| Security | Par (000) | Value | ||||||
| Virginia — 2.3% | ||||||||
| Hampton Roads Transportation Accountability Commission, RB, Series A, 4.00%, 07/01/57 | $ | 4,000 | $ | 4,004,822 | ||||
| Virginia Small Business Financing Authority, Refunding RB, Series A, 4.00%, 12/01/49 | 4,307 | 4,309,806 | ||||||
| 8,314,628 | ||||||||
| Washington — 1.0% | ||||||||
| Washington Health Care Facilities Authority, Refunding RB, Series A, 5.00%, 10/01/38 | 3,210 | 3,553,641 | ||||||
| Wisconsin — 1.0% | ||||||||
| Wisconsin Health & Educational Facilities Authority, Refunding RB, Series A, 5.00%, 04/01/42 | 3,520 | 3,542,167 | ||||||
| Total Municipal Bonds Transferred to Tender Option Bond Trusts — 41.8% (Cost: $ 147,898,503) | 149,712,459 | |||||||
| Total Investments — 160.3% (Cost: $ 559,814,630) | 574,217,689 | |||||||
| Other Assets Less Liabilities — 2.9% | 10,228,801 | |||||||
| Liability for TOB Trust Certificates, Including Interest Expense and Fees Payable — (24.9)% | (89,085,242 | ) | ||||||
| VMTP Shares at Liquidation Value, Net of Deferred Offering Costs — (38.3)% | (137,200,000 | ) | ||||||
| Net Assets Applicable to Common Shares — 100.0% | $ | 358,161,248 | ||||||
| (a) | U.S. Government securities held in escrow, are used to pay interest on this security as well as to retire the bond in full at the date indicated, typically at a premium to par. |
| (b) | Step coupon security. Coupon rate will either increase (step-up bond) or decrease (step-down bond) at regular intervals until maturity. Interest rate shown reflects the rate currently in effect. |
| (c) | Security exempt from registration pursuant to Rule 144A under the Securities Act of 1933, as amended. These securities may be resold in transactions exempt from registration to qualified institutional investors. |
| (d) | Zero-coupon bond. |
| (e) | Variable rate security. Interest rate resets periodically. The rate shown is the effective interest rate as of period end. Security description also includes the reference rate and spread if published and available. |
| (f) | When-issued security. |
| (g) | Represent bonds transferred to a TOB Trust in exchange of cash and residual certificates received by the Trust. These bonds serve as collateral in a secured borrowing. See Note 4 of the Notes to Financial Statements for details. |
| (h) | All or a portion of the security is subject to a recourse agreement. The aggregate maximum potential amount the Trust could ultimately be required to pay under the agreements, which expire between November 15, 2024 to June 1, 2030, is $ 11,874,471. See Note 4 of the Notes to Financial Statements for details. |
| Affiliated Issuer | Value at 08/31/21 | Purchases at Cost | Proceeds from Sales | Net Realized Gain (Loss) | Change in Unrealized Appreciation (Depreciation) | Value at 07/31/22 | Shares Held at 07/31/22 | Income | Capital Gain Distributions from Underlying Funds | |||||||||||||||||||||||||||
BlackRock Liquidity Funds, MuniCash, Institutional Class (a) | $ | 6,327,383 | $ | — | $ | (6,325,080 | ) (b) | $ | (2,133 | ) | $ | (170 | ) | $ | — | — | $ | 10,023 | $ | — | ||||||||||||||||
| (a) | As of period end, the entity is no longer held. |
| (b) | Represents net amount purchased (sold). |
S C H E D U L E O F IN V E S T M E N T S | 19 |
Schedule of Investments (continued) July 31, 2022 | BlackRock Municipal Income Quality Trust (BYM) |
| Description | Number of Contracts | Expiration Date | Notional Amount (000) | Value/ Unrealized Appreciation (Depreciation) | ||||||||||||
| Short Contracts | ||||||||||||||||
| 10-Year U.S. Treasury Note | 88 | 09/21/22 | $ | 10,651 | $ | (70,440 | ) | |||||||||
| U.S. Long Bond | 85 | 09/21/22 | 12,184 | (219,563 | ) | |||||||||||
| 5-Year U.S. Treasury Note | 91 | 09/30/22 | 10,351 | (46,868 | ) | |||||||||||
| $ | (336,871 | ) | ||||||||||||||
| Commodity Contracts | Credit Contracts | Equity Contracts | Foreign Currency Exchange Contracts | Interest Rate Contracts | Other Contracts | Total | ||||||||||||||||||||||
| Liabilities — Derivative Financial Instruments | ||||||||||||||||||||||||||||
| Futures contracts | ||||||||||||||||||||||||||||
Unrealized depreciation on futures contracts (a) | $ | — | $ | — | $ | — | $ | — | $ | 336,871 | $ | — | $ | 336,871 | ||||||||||||||
| (a) | Net cumulative unrealized appreciation (depreciation) on futures contracts and centrally cleared swaps, if any, are reported in the Schedule of Investments. In the Statements of Assets and Liabilities, only current day’s variation margin is reported in receivables or payables and the net cumulative unrealized appreciation (depreciation) is included in accumulated earnings (loss). |
| Commodity Contracts | Credit Contracts | Equity Contracts | Foreign Currency Exchange Contracts | Interest Rate Contracts | Other Contracts | Total | ||||||||||||||||||||||
| Net Realized Gain (Loss) from: | ||||||||||||||||||||||||||||
| Futures contracts | $ | — | $ | — | $ | — | $ | — | $ | 982,081 | $ | — | $ | 982,081 | ||||||||||||||
| Net Change in Unrealized Appreciation (Depreciation) on: | ||||||||||||||||||||||||||||
| Futures contracts | $ | — | $ | — | $ | — | $ | — | $ | (335,059 | ) | $ | — | $ | (335,059 | ) | ||||||||||||
| Futures contracts: | ||||
| Average notional value of contracts — short | $ | 27,257,482 |
| 20 | 2 0 2 2 BL A C K RO C K AN N U A L RE P O R T T O SH A R E H O L D E R S |
Schedule of Investments (continued) July 31, 2022 | BlackRock Municipal Income Quality Trust (BYM) |
| Level 1 | Level 2 | Level 3 | Total | |||||||||||||
| Assets | ||||||||||||||||
| Investments | ||||||||||||||||
| Long-Term Investments | ||||||||||||||||
| Municipal Bonds | $ | — | $ | 424,505,230 | $ | — | $ | 424,505,230 | ||||||||
| Municipal Bonds Transferred to Tender Option Bond Trusts | — | 149,712,459 | — | 149,712,459 | ||||||||||||
| $ | — | $ | 574,217,689 | $ | — | $ | 574,217,689 | |||||||||
| Derivative Financial Instruments | ||||||||||||||||
| Liabilities | ||||||||||||||||
| Interest Rate Contracts | $ | (336,871 | ) | $ | — | $ | — | $ | (336,871 | ) | ||||||
| Level 1 | Level 2 | Level 3 | Total | |||||||||||||
| Liabilities | ||||||||||||||||
| TOB Trust Certificates | $ | — | $ | (88,932,869 | ) | $ | — | $ | (88,932,869 | ) | ||||||
| VMTP Shares at Liquidation Value | — | (137,200,000 | ) | — | (137,200,000 | ) | ||||||||||
| $ | — | $ | (226,132,869 | ) | $ | — | $ | (226,132,869 | ) | |||||||
S C H E D U L E O F IN V E S T M E N T S | 21 |
Schedule of Investments July 31, 2022 | BlackRock Municipal Income Trust II (BLE) (Percentages shown are based on Net Assets) |
| Security | Par (000) | Value | ||||||
| Municipal Bonds | ||||||||
| Alabama — 4.2% | ||||||||
Black Belt Energy Gas District, RB, Series A, 4.00%, 12/01/52 (a) | $ | 2,565 | $ | 2,635,512 | ||||
| County of Jefferson Alabama Sewer Revenue, Refunding RB | ||||||||
| Series A, Senior Lien, (AGM), 5.00%, 10/01/44 | 540 | 565,362 | ||||||
| Series A, Senior Lien, (AGM), 5.25%, 10/01/48 | 1,320 | 1,384,217 | ||||||
| Series D, Sub Lien, 7.00%, 10/01/51 | 4,335 | 4,761,568 | ||||||
| Health Care Authority of the City of Huntsville, RB, Series B1, (AGM), 3.00%, 06/01/50 | 2,375 | 2,001,189 | ||||||
| Lower Alabama Gas District, RB, Series A, 5.00%, 09/01/46 | 1,170 | 1,306,874 | ||||||
Southeast Energy Authority A Cooperative District, RB (a) | ||||||||
| Series B, 4.00%, 12/01/51 | 7,255 | 7,344,614 | ||||||
| Series B-1, 5.00%, 05/01/53 | 5,290 | 5,678,312 | ||||||
| 25,677,648 | ||||||||
| Arizona — 2.6% | ||||||||
Arizona Industrial Development Authority, RB (b) | ||||||||
| 4.38%, 07/01/39 | 225 | 214,552 | ||||||
| Series A, 5.00%, 07/01/39 | 190 | 191,481 | ||||||
| Series A, 5.00%, 07/01/49 | 210 | 210,283 | ||||||
| Series A, 5.00%, 07/01/54 | 165 | 165,076 | ||||||
Arizona Industrial Development Authority, Refunding RB, Series A, 5.38%, 07/01/50 (b) | 1,185 | 1,208,104 | ||||||
| Glendale Industrial Development Authority, RB | ||||||||
| 5.00%, 05/15/41 | 100 | 100,710 | ||||||
| 5.00%, 05/15/56 | 400 | 390,800 | ||||||
| Industrial Development Authority of the City of Phoenix, RB | ||||||||
| 5.00%, 07/01/59 | 465 | 478,195 | ||||||
Series A, 5.00%, 07/01/46 (b) | 1,825 | 1,841,684 | ||||||
Industrial Development Authority of the City of Phoenix, Refunding RB, Series A, 5.00%, 07/01/35 (b) | 275 | 279,338 | ||||||
Industrial Development Authority of the County of Pima, RB, 5.00%, 07/01/49 (b) | 350 | 345,756 | ||||||
Maricopa County Industrial Development Authority, Refunding RB 5.00%, 07/01/39 (b) | 100 | 102,506 | ||||||
5.00%, 07/01/54 (b) | 210 | 212,015 | ||||||
| Series A, 4.13%, 09/01/38 | 820 | 836,312 | ||||||
| Maricopa County Pollution Control Corp., Refunding RB, Series B, 3.60%, 04/01/40 | 1,250 | 1,208,302 | ||||||
| Salt Verde Financial Corp., RB 5.00%, 12/01/32 | 5,635 | 6,265,461 | ||||||
| 5.00%, 12/01/37 | 2,000 | 2,217,432 | ||||||
| 16,268,007 | ||||||||
| Arkansas — 0.5% | ||||||||
Arkansas Development Finance Authority, RB, Series A, AMT, 4.50%, 09/01/49 (b) | 3,305 | 3,207,440 | ||||||
| California — 12.9% | ||||||||
California Community Choice Financing Authority, RB, Series B-1, 4.00%, 02/01/52 (a) | 11,505 | 11,759,893 | ||||||
| California County Tobacco Securitization Agency, Refunding RB, Series A, 5.00%, 06/01/36 | 350 | 350,074 | ||||||
| California Educational Facilities Authority, RB, Series V-1, 5.00%, 05/01/49 | 2,315 | 2,924,787 | ||||||
| Security | Par (000) | Value | ||||||
| California (continued) | ||||||||
| California Health Facilities Financing Authority, RB, 4.00%, 11/15/45 | $ | 1,460 | $ | 1,442,846 | ||||
| California Health Facilities Financing Authority, Refunding RB | ||||||||
| 5.00%, 08/01/50 | 1,000 | 1,083,571 | ||||||
Series A, 5.00%, 07/01/23 (c) | 1,765 | 1,820,043 | ||||||
| Series A, 4.00%, 03/01/39 | 890 | 890,707 | ||||||
| Series A, 4.00%, 04/01/45 | 1,220 | 1,202,237 | ||||||
| California Housing Finance Agency, RB, M/F Housing Class A, 3.25%, 08/20/36 | 2,609 | 2,467,753 | ||||||
| Series 2021-2, Class A, (FHLMC), 3.75%, 03/25/35 | 4,950 | 5,150,392 | ||||||
| California Municipal Finance Authority, ARB, AMT, Senior Lien, 4.00%, 12/31/47 | 780 | 704,311 | ||||||
| California Municipal Finance Authority, RB, S/F Housing | ||||||||
| Series A, 5.25%, 08/15/39 | 205 | 210,427 | ||||||
| Series A, 5.25%, 08/15/49 | 510 | 522,804 | ||||||
California Pollution Control Financing Authority, RB, Series A, AMT, 5.00%, 11/21/45 (b) | 2,130 | 2,134,939 | ||||||
California School Finance Authority, Refunding RB, Series A, 5.00%, 07/01/51 (b) | 1,700 | 1,747,051 | ||||||
| California State Public Works Board, RB | ||||||||
| Series F, 5.25%, 09/01/33 | 2,015 | 2,090,107 | ||||||
| Series I, 5.50%, 11/01/31 | 3,100 | 3,242,461 | ||||||
| Series I, 5.50%, 11/01/33 | 1,500 | 1,568,319 | ||||||
| Series I, 5.00%, 11/01/38 | 1,065 | 1,097,973 | ||||||
California Statewide Communities Development Authority, Refunding RB (b) | ||||||||
| Series A, 5.00%, 06/01/36 | 990 | 1,034,604 | ||||||
| Series A, 5.00%, 06/01/46 | 1,220 | 1,251,569 | ||||||
| City of Los Angeles Department of Airports, Refunding ARB | ||||||||
| AMT, 4.00%, 05/15/39 | 435 | 438,015 | ||||||
| AMT, 4.00%, 05/15/40 | 470 | 487,332 | ||||||
| AMT, 4.00%, 05/15/41 | 550 | 557,359 | ||||||
| Series A, AMT, 5.00%, 05/15/38 | 315 | 351,276 | ||||||
| Series A, AMT, 5.00%, 05/15/39 | 340 | 376,383 | ||||||
| Series A, AMT, 5.00%, 05/15/46 | 1,270 | 1,403,556 | ||||||
CMFA Special Finance Agency XII, RB, M/F Housing, Series A, 3.25%, 02/01/57 (b) | 525 | 398,766 | ||||||
CSCDA Community Improvement Authority, RB, M/F Housing (b) | ||||||||
| 4.00%, 10/01/56 | 245 | 224,114 | ||||||
| 4.00%, 12/01/56 | 355 | 284,710 | ||||||
| Series A, Class 2, 4.00%, 06/01/58 | 1,500 | 1,290,482 | ||||||
| Senior Lien, 3.13%, 06/01/57 | 1,290 | 935,923 | ||||||
| Series A, Class 2, Senior Lien, 4.00%, 12/01/58 | 755 | 616,682 | ||||||
| Indio Finance Authority, Refunding RB, Series A, 4.50%, 11/01/52 | 2,405 | 2,474,829 | ||||||
Kern Community College District, GO, Series C, 5.50%, 11/01/23 (c) | 2,155 | 2,254,087 | ||||||
| Regents of the University of California Medical Center Pooled Revenue, RB, Series P, 4.00%, 05/15/53 | 3,810 | 3,840,853 | ||||||
| Regents of the University of California Medical Center Pooled Revenue, Refunding RB | ||||||||
Series J, 5.25%, 05/15/23 (c) | 3,905 | 4,018,034 | ||||||
| Series J, 5.25%, 05/15/38 | 1,110 | 1,139,226 | ||||||
Riverside County Public Financing Authority, RB, 5.25%, 11/01/25 (c) | 2,000 | 2,224,976 | ||||||
| 22 | 2 0 2 2 BL A C K RO C K AN N U A L RE P O R T T O SH A R E H O L D E R S |
Schedule of Investments (continued) July 31, 2022 | BlackRock Municipal Income Trust II (BLE) (Percentages shown are based on Net Assets) |
| Security | Par (000) | Value | ||||||
| California (continued) | ||||||||
| Riverside County Transportation Commission, Refunding RB | ||||||||
| 2nd Lien, 4.00%, 06/01/47 | $ | 715 | $ | 692,129 | ||||
| Senior Lien, 4.00%, 06/01/46 | 2,255 | 2,238,446 | ||||||
| Senior Lien, 3.00%, 06/01/49 | 490 | 402,553 | ||||||
| San Diego County Regional Airport Authority, ARB, Series B, AMT, Subordinate, 4.00%, 07/01/56 | 1,445 | 1,401,183 | ||||||
| San Francisco City & County Airport Comm-San Francisco International Airport, Refunding ARB | ||||||||
| Series A, AMT, 5.50%, 05/01/28 | 720 | 737,646 | ||||||
| Series A, AMT, 5.25%, 05/01/33 | 560 | 572,513 | ||||||
San Marcos Unified School District, GO, CAB (d) | ||||||||
| Series B, Election 2010, 0.00%, 08/01/33 | 3,000 | 2,139,936 | ||||||
| Series B, Election 2010, 0.00%, 08/01/43 | 2,500 | 1,124,958 | ||||||
| State of California, Refunding GO, 3.00%, 12/01/46 | 550 | 483,105 | ||||||
Stockton Public Financing Authority, RB, Series A, 6.25%, 10/01/23 (c) | 490 | 516,038 | ||||||
| Washington Township Health Care District, GO, Series B, Election 2004, 5.50%, 08/01/40 | 830 | 876,419 | ||||||
| 79,198,397 | ||||||||
| Colorado — 2.5% | ||||||||
| Arapahoe County School District No.6 Littleton, GO, Series A, (SAW), 5.50%, 12/01/43 | 1,915 | 2,216,841 | ||||||
Centerra Metropolitan District No.1, TA, 5.00%, 12/01/47 (b) | 250 | 238,717 | ||||||
| City & County of Denver Colorado Airport System Revenue, ARB | ||||||||
| Series B, 5.25%, 11/15/32 | 1,750 | 1,819,563 | ||||||
| Series A, AMT, 5.50%, 11/15/28 | 500 | 520,598 | ||||||
| Series A, AMT, 5.50%, 11/15/30 | 225 | 234,169 | ||||||
| Series A, AMT, 5.50%, 11/15/31 | 270 | 280,941 | ||||||
| City & County of Denver Colorado Airport System Revenue, Refunding ARB | ||||||||
| Series A, AMT, 4.13%, 11/15/53 | 1,290 | 1,296,579 | ||||||
| Series A, AMT, 5.50%, 11/15/53 | 1,365 | 1,552,271 | ||||||
| City & County of Denver Colorado, RB, CAB, | ||||||||
Series A-2, 0.00%, 08/01/38 (d) | 1,835 | 956,832 | ||||||
Colorado Educational & Cultural Facilities Authority, RB, 5.00%, 03/01/50 (b) | 320 | 324,331 | ||||||
Colorado Educational & Cultural Facilities Authority, Refunding RB, Class A, 5.00%, 10/01/59 (b) | 425 | 416,155 | ||||||
| Colorado Health Facilities Authority, Refunding RB, Series A, 4.00%, 08/01/44 | 1,945 | 1,906,096 | ||||||
| Denver Convention Center Hotel Authority, Refunding RB, 5.00%, 12/01/40 | 1,325 | 1,369,248 | ||||||
| Denver International Business Center Metropolitan District No.1, GO, Series A, 4.00%, 12/01/48 | 495 | 492,046 | ||||||
| Haskins Station Metropolitan District, GO, Series A, 5.00%, 12/01/39 | 650 | 638,702 | ||||||
| State of Colorado, COP, BAB, Series O, 4.00%, 03/15/44 | 1,405 | 1,427,918 | ||||||
| 15,691,007 | ||||||||
| Connecticut — 0.7% | ||||||||
| State of Connecticut Special Tax Revenue, RB Series A, 4.00%, 05/01/36 | 365 | 381,644 | ||||||
| Security | Par (000) | Value | ||||||
| Connecticut (continued) | ||||||||
| State of Connecticut Special Tax Revenue, RB (continued) | ||||||||
| Series A, 4.00%, 05/01/39 | $ | 230 | $ | 235,990 | ||||
| State of Connecticut, GO, Series A, 4.00%, 01/15/38 | 3,435 | 3,546,287 | ||||||
| 4,163,921 | ||||||||
| Delaware — 0.2% | ||||||||
| Delaware Transportation Authority, RB, 5.00%, 06/01/55 | 1,260 | 1,310,995 | ||||||
| District of Columbia — 3.1% | ||||||||
| District of Columbia Housing Finance Agency, RB, M/F Housing, Series B-1, (FHA), 2.55%, 03/01/42 | 1,120 | 903,353 | ||||||
| District of Columbia Tobacco Settlement Financing Corp., Refunding RB, 6.75%, 05/15/40 | 11,500 | 11,817,136 | ||||||
| District of Columbia, Refunding RB | ||||||||
| 5.00%, 04/01/35 | 465 | 503,956 | ||||||
Series A, 6.00%, 07/01/43 (c) | 820 | 852,925 | ||||||
| Catholic Health Services, 5.00%, 10/01/48 | 2,525 | 2,671,639 | ||||||
| District of Columbia, TA, 5.13%, 06/01/41 | 690 | 691,669 | ||||||
| Metropolitan Washington Airports Authority Dulles Toll Road Revenue, Refunding RB, Series B, Subordinate, 4.00%, 10/01/49 | 1,995 | 1,876,567 | ||||||
| 19,317,245 | ||||||||
| Florida — 6.6% | ||||||||
| Brevard County Health Facilities Authority, Refunding RB, Series A, 5.00%, 04/01/52 | 3,310 | 3,601,621 | ||||||
| Capital Projects Finance Authority, Refunding RB | ||||||||
| Series A-1, 5.00%, 10/01/32 | 215 | 235,668 | ||||||
| Series A-1, 5.00%, 10/01/33 | 240 | 261,264 | ||||||
| Series A-1, 5.00%, 10/01/34 | 240 | 259,921 | ||||||
| Series A-1, 5.00%, 10/01/35 | 80 | 86,181 | ||||||
| Capital Trust Agency, Inc., RB | ||||||||
Series A, 5.00%, 06/01/45 (b) | 190 | 175,963 | ||||||
| Series A, 5.00%, 12/15/49 | 140 | 142,199 | ||||||
| Series A, 5.00%, 12/15/54 | 125 | 126,398 | ||||||
Series A, 5.50%, 06/01/57 (b) | 100 | 94,772 | ||||||
Celebration Pointe Community Development District, SAB (b) | ||||||||
| 5.00%, 05/01/32 | 215 | 220,630 | ||||||
| 5.00%, 05/01/48 | 530 | 534,465 | ||||||
| Collier County Health Facilities Authority, Refunding RB, Series A, 5.00%, 05/01/45 | 1,450 | 1,502,551 | ||||||
| County of Broward Florida Airport System Revenue, ARB | ||||||||
| Series A, AMT, 5.00%, 10/01/45 | 575 | 593,222 | ||||||
| Series A, AMT, 4.00%, 10/01/49 | 330 | 319,945 | ||||||
| County of Miami-Dade Florida Aviation Revenue, Refunding RB | ||||||||
| Series A, 4.00%, 10/01/37 | 355 | 360,314 | ||||||
| Series A, 4.00%, 10/01/38 | 355 | 359,121 | ||||||
| Series A, 4.00%, 10/01/39 | 265 | 268,104 | ||||||
Series A, AMT, 5.00%, 10/01/22 (c) | 2,165 | 2,177,611 | ||||||
County of Miami-Dade Florida Water & Sewer System Revenue, Refunding RB, Series B, 5.25%, 10/01/23 (c) | 500 | 520,866 | ||||||
County of Miami-Dade Seaport Department, ARB (c) | ||||||||
| Series A, 5.50%, 10/01/23 | 2,125 | 2,218,776 | ||||||
| Series A, 6.00%, 10/01/23 | 7,515 | 7,889,766 | ||||||
S C H E D U L E O F IN V E S T M E N T S | 23 |
Schedule of Investments (continued) July 31, 2022 | BlackRock Municipal Income Trust II (BLE) (Percentages shown are based on Net Assets) |
| Security | Par (000) | Value | ||||||
| Florida (continued) | ||||||||
County of Miami-Dade Seaport Department, ARB (c) (continued) | ||||||||
| Series B, AMT, 6.00%, 10/01/23 | $ | 1,775 | $ | 1,860,535 | ||||
| Series B, AMT, 6.25%, 10/01/23 | 310 | 325,671 | ||||||
County of Miami-Dade Seaport Department, Refunding RB, Series D, AMT, 6.00%, 10/01/23 (c) | 735 | 770,048 | ||||||
County of Osceola Florida Transportation Revenue, Refunding RB, CAB (d) | ||||||||
| Series A-2, 0.00%, 10/01/46 | 1,665 | 478,916 | ||||||
| Series A-2, 0.00%, 10/01/47 | 1,610 | 437,463 | ||||||
| Series A-2, 0.00%, 10/01/48 | 1,135 | 290,807 | ||||||
| Series A-2, 0.00%, 10/01/49 | 935 | 226,554 | ||||||
| Florida Development Finance Corp., RB | ||||||||
| Series A, 5.00%, 06/15/40 | 240 | 251,862 | ||||||
| Series A, 5.00%, 06/15/50 | 795 | 822,372 | ||||||
| Series A, 5.00%, 06/15/55 | 475 | 489,466 | ||||||
AMT, 5.00%, 05/01/29 (b) | 180 | 177,684 | ||||||
Series A, AMT, 5.00%, 08/01/29 (a)(b) | 100 | 100,000 | ||||||
Florida Development Finance Corp., Refunding RB (b) | ||||||||
| 6.50%, 06/30/57 | 750 | 766,169 | ||||||
| Series C, 5.00%, 09/15/50 | 105 | 102,145 | ||||||
Hillsborough County Aviation Authority, Refunding RB, Sub-Series A, AMT, 5.50%, 10/01/23 (c) | 1,170 | 1,219,089 | ||||||
Jacksonville Port Authority, Refunding ARB, AMT, 5.00%, 11/01/22 (c) | 1,665 | 1,679,272 | ||||||
| Lakewood Ranch Stewardship District, SAB | ||||||||
| 5.25%, 05/01/37 | 180 | 185,734 | ||||||
| 5.38%, 05/01/47 | 185 | 189,621 | ||||||
| Lee County Housing Finance Authority, RB, S/F Housing, Series A-2, AMT, (FHLMC, FNMA, GNMA), 6.00%, 09/01/40 | 25 | 25,059 | ||||||
| Miami Beach Health Facilities Authority, RB, 3.00%, 11/15/51 | 525 | 402,619 | ||||||
| Orange County Health Facilities Authority, Refunding RB, 5.00%, 08/01/41 | 1,000 | 1,055,665 | ||||||
| Osceola Chain Lakes Community Development District, SAB | ||||||||
| 4.00%, 05/01/40 | 270 | 261,678 | ||||||
| 4.00%, 05/01/50 | 260 | 240,481 | ||||||
| Palm Beach County Health Facilities Authority, RB | ||||||||
| Series A, 5.00%, 11/01/47 | 440 | 456,106 | ||||||
| Series A, 5.00%, 11/01/52 | 630 | 652,229 | ||||||
Reedy Creek Improvement District, GO, Series A, 5.25%, 06/01/23 (c) | 1,585 | 1,633,366 | ||||||
| Sarasota County Florida Utility System Revenue, RB, Series A, 5.00%, 10/01/50 | 715 | 785,659 | ||||||
Stevens Plantation Community Development District, SAB, Series A, 7.10%, 05/01/35 (e)(f) | 1,670 | 1,057,991 | ||||||
| Volusia County Educational Facility Authority, Refunding RB, 5.00%, 10/15/49 | 1,930 | 2,072,438 | ||||||
| 40,966,057 | ||||||||
| Georgia — 5.6% | ||||||||
East Point Business & Industrial Development Authority, RB, Series A, 5.25%, 06/15/62 (b) | 435 | 444,397 | ||||||
Gainesville & Hall County Hospital Authority, Refunding RB, Series A, (GTD), 5.50%, 08/15/54 (c) | 715 | 781,654 | ||||||
| Georgia Housing & Finance Authority, RB, S/F Housing, Series B, 2.50%, 06/01/50 | 795 | 611,753 | ||||||
| Main Street Natural Gas, Inc., RB | ||||||||
| Series A, 5.00%, 05/15/35 | 540 | 588,347 | ||||||
| Security | Par (000) | Value | ||||||
| Georgia (continued) | ||||||||
| Main Street Natural Gas, Inc., RB (continued) | ||||||||
| Series A, 5.00%, 05/15/36 | $ | 540 | $ | 584,606 | ||||
| Series A, 5.00%, 05/15/37 | 595 | 646,569 | ||||||
| Series A, 5.00%, 05/15/38 | 325 | 354,695 | ||||||
| Series A, 5.00%, 05/15/49 | 7,195 | 7,832,974 | ||||||
| Series B, 5.00%, 12/01/52 | 9,020 | 9,668,096 | ||||||
Series C, RB, 4.00%, 03/01/50 (a) | 2,755 | 2,837,606 | ||||||
| Municipal Electric Authority of Georgia, RB | ||||||||
| 4.00%, 01/01/49 | 3,585 | 3,423,661 | ||||||
| 4.00%, 01/01/59 | 3,525 | 3,355,507 | ||||||
| Series A, 5.00%, 07/01/52 | 1,870 | 1,977,499 | ||||||
| Municipal Electric Authority of Georgia, Refunding RB, Sub-Series A, 4.00%, 01/01/49 | 1,360 | 1,321,931 | ||||||
| 34,429,295 | ||||||||
| Hawaii — 0.3% | ||||||||
| State of Hawaii Airports System Revenue, ARB, Series A, AMT, 5.00%, 07/01/45 | 1,000 | 1,034,528 | ||||||
| State of Hawaii Airports System Revenue, ARB COP | ||||||||
| AMT, 5.25%, 08/01/25 | 250 | 257,525 | ||||||
| AMT, 5.25%, 08/01/26 | 810 | 833,824 | ||||||
| 2,125,877 | ||||||||
| Idaho — 1.7% | ||||||||
| Idaho Health Facilities Authority, RB | ||||||||
| 4.00%, 12/01/43 | 605 | 605,400 | ||||||
| Series 2017, 5.00%, 12/01/46 | 805 | 852,498 | ||||||
| Idaho Health Facilities Authority, Refunding RB, 3.00%, 03/01/51 | 2,845 | 2,232,705 | ||||||
| Idaho Housing & Finance Association, RB | ||||||||
| 5.00%, 08/15/41 | 1,725 | 2,006,658 | ||||||
| 5.00%, 08/15/42 | 685 | 796,839 | ||||||
| 5.50%, 05/01/52 | 1,250 | 1,319,362 | ||||||
| Idaho Housing & Finance Association, Refunding RB | ||||||||
| (GTD), 4.00%, 05/01/42 | 1,400 | 1,401,806 | ||||||
| (GTD), 4.00%, 05/01/52 | 1,095 | 1,048,007 | ||||||
| 10,263,275 | ||||||||
| Illinois — 10.6% | ||||||||
| Chicago Board of Education, GO | ||||||||
| Series A, 5.00%, 12/01/37 | 405 | 428,376 | ||||||
| Series A, 5.00%, 12/01/38 | 200 | 210,773 | ||||||
| Series A, 5.00%, 12/01/39 | 410 | 431,792 | ||||||
| Series A, 5.00%, 12/01/47 | 210 | 221,383 | ||||||
| Series C, 5.25%, 12/01/35 | 2,790 | 2,860,891 | ||||||
| Series D, 5.00%, 12/01/46 | 3,605 | 3,667,137 | ||||||
| Series H, 5.00%, 12/01/36 | 495 | 514,455 | ||||||
| Series H, 5.00%, 12/01/46 | 215 | 219,800 | ||||||
| Chicago Board of Education, Refunding GO | ||||||||
| Series C, 5.00%, 12/01/25 | 1,215 | 1,284,821 | ||||||
| Series D, 5.00%, 12/01/27 | 1,600 | 1,740,384 | ||||||
| Series D, 5.00%, 12/01/31 | 150 | 160,150 | ||||||
| Series F, 5.00%, 12/01/23 | 290 | 297,601 | ||||||
| Series G, 5.00%, 12/01/34 | 710 | 743,994 | ||||||
| Series G, 5.00%, 12/01/44 | 150 | 153,599 | ||||||
| Chicago Midway International Airport, Refunding ARB, Series A, AMT, 2nd Lien, 5.00%, 01/01/41 | 1,010 | 1,034,510 | ||||||
| Chicago Midway International Airport, Refunding RB, Series A, Senior Lien, 4.00%, 01/01/36 | 1,035 | 1,058,041 | ||||||
| Chicago Transit Authority Sales Tax Receipts Fund, Refunding RB, Series A, 2nd Lien, 4.00%, 12/01/49 | 2,210 | 2,158,470 | ||||||
| 24 | 2 0 2 2 BL A C K RO C K AN N U A L RE P O R T T O SH A R E H O L D E R S |
Schedule of Investments (continued) July 31, 2022 | BlackRock Municipal Income Trust II (BLE) (Percentages shown are based on Net Assets) |
| Security | Par (000) | Value | ||||||
| Illinois (continued) | ||||||||
| City of Chicago Illinois Wastewater Transmission Revenue, RB, 2nd Lien, 5.00%, 01/01/42 | $ | 1,375 | $ | 1,377,395 | ||||
| City of Chicago Illinois Waterworks Revenue, Refunding RB, 2nd Lien, 5.00%, 11/01/42 | 500 | 501,363 | ||||||
| Cook County Community College District No.508, GO | ||||||||
| 5.50%, 12/01/38 | 2,670 | 2,763,624 | ||||||
| 5.25%, 12/01/43 | 3,850 | 3,912,828 | ||||||
| Illinois Finance Authority, RB, Series A, 5.00%, 02/15/37 | 480 | 483,327 | ||||||
| Illinois Finance Authority, Refunding RB | ||||||||
| Series A, 4.00%, 05/15/50 | 600 | 580,306 | ||||||
| Series C, 5.00%, 02/15/41 | 1,600 | 1,705,054 | ||||||
| Illinois State Toll Highway Authority, RB | ||||||||
| Series A, 5.00%, 01/01/45 | 1,420 | 1,574,067 | ||||||
| Series A, 4.00%, 01/01/46 | 2,110 | 2,114,045 | ||||||
| Series C, 5.00%, 01/01/37 | 3,005 | 3,179,536 | ||||||
| Metropolitan Pier & Exposition Authority, RB | ||||||||
| Series A, 5.50%, 06/15/53 | 280 | 291,622 | ||||||
| Series A, 5.00%, 06/15/57 | 2,745 | 2,836,057 | ||||||
Metropolitan Pier & Exposition Authority, RB, CAB, (BAM-TCRS), 0.00%, 12/15/56 (d) | 2,165 | 454,611 | ||||||
| Metropolitan Pier & Exposition Authority, Refunding RB | ||||||||
| 4.00%, 06/15/50 | 2,315 | 2,181,684 | ||||||
Series B, (AGM), 0.00%, 06/15/44 (d) | 2,980 | 1,147,288 | ||||||
Metropolitan Pier & Exposition Authority, Refunding RB, CAB (d) | ||||||||
| Series B, (AGM), 0.00%, 06/15/43 | 5,700 | 2,309,423 | ||||||
| Series B, 0.00%, 12/15/54 | 3,020 | 627,991 | ||||||
| State of Illinois, GO | ||||||||
| 5.25%, 02/01/31 | 730 | 759,421 | ||||||
| 5.25%, 02/01/32 | 2,500 | 2,599,570 | ||||||
| 5.50%, 07/01/33 | 3,000 | 3,081,699 | ||||||
| 5.50%, 07/01/38 | 620 | 635,605 | ||||||
| 5.00%, 02/01/39 | 1,640 | 1,666,038 | ||||||
| Series A, 5.00%, 04/01/35 | 3,500 | 3,557,593 | ||||||
| Series A, 5.00%, 04/01/38 | 5,020 | 5,099,522 | ||||||
| Series D, 5.00%, 11/01/28 | 505 | 548,757 | ||||||
| State of Illinois, GO, BAB, Series C, 4.00%, 11/01/43 | 440 | 424,196 | ||||||
| State of Illinois, Refunding GO, Series B, 5.00%, 10/01/27 | 180 | 196,977 | ||||||
| University of Illinois, RB, Series A, 5.00%, 04/01/44 | 1,360 | 1,392,886 | ||||||
| 65,188,662 | ||||||||
| Indiana — 1.9% | ||||||||
| City of Valparaiso Indiana, RB | ||||||||
| AMT, 6.75%, 01/01/34 | 1,090 | 1,156,920 | ||||||
| AMT, 7.00%, 01/01/44 | 4,625 | 4,892,186 | ||||||
Indiana Finance Authority, RB (c) | ||||||||
| Series A, AMT, 5.00%, 07/01/23 | 3,075 | 3,152,023 | ||||||
| Series A, AMT, 5.25%, 07/01/23 | 560 | 575,622 | ||||||
| Indianapolis Local Public Improvement Bond Bank, RB, Series A, 5.00%, 01/15/40 | 1,780 | 1,803,129 | ||||||
| 11,579,880 | ||||||||
| Iowa — 0.1% | ||||||||
| Iowa Student Loan Liquidity Corp., Refunding RB, Series B, AMT, 3.00%, 12/01/39 | 400 | 351,964 | ||||||
| Security | Par (000) | Value | ||||||
| Kansas — 0.1% | ||||||||
| City of Lenexa Kansas, Refunding RB, Series A, 5.00%, 05/15/43 | $ | 475 | $ | 475,513 | ||||
| Kentucky — 1.9% | ||||||||
Kentucky Economic Development Finance Authority, RB, Series A, Catholic Health Services, 5.25%, 01/01/23 (c) | 1,385 | 1,407,623 | ||||||
Kentucky Economic Development Finance Authority, Refunding RB, Series B, (NPFGC), 0.00%, 10/01/24 (d) | 5,000 | 4,774,400 | ||||||
Kentucky Public Energy Authority, RB, Series A-1, 4.00%, 08/01/52 (a) | 3,500 | 3,556,241 | ||||||
| Kentucky Public Transportation Infrastructure Authority, RB, CAB, Series C, Convertible, 6.75%, 07/01/43 | 1,655 | 1,808,678 | ||||||
| 11,546,942 | ||||||||
| Louisiana — 0.6% | ||||||||
| Lake Charles Harbor & Terminal District, ARB, | ||||||||
| Series B, AMT, (AGM), 5.50%, 01/01/29 | 1,000 | 1,045,882 | ||||||
| Tobacco Settlement Financing Corp., Refunding RB | ||||||||
| Series A, 5.25%, 05/15/33 | 1,450 | 1,475,091 | ||||||
| Series A, 5.25%, 05/15/35 | 955 | 979,857 | ||||||
| 3,500,830 | ||||||||
| Maryland — 0.4% | ||||||||
| City of Baltimore Maryland, Refunding RB, Series A, 4.50%, 09/01/33 | 135 | 136,412 | ||||||
| Maryland Economic Development Corp., RB, Class B, AMT, 5.25%, 06/30/47 | 1,550 | 1,693,948 | ||||||
| Maryland Health & Higher Educational Facilities Authority, RB, Series 2017, 5.00%, 12/01/46 | 455 | 487,326 | ||||||
| 2,317,686 | ||||||||
| Massachusetts — 2.3% | ||||||||
| Massachusetts Development Finance Agency, RB, Series A, 5.00%, 01/01/47 | 1,975 | 2,043,290 | ||||||
| Massachusetts Development Finance Agency, Refunding RB | ||||||||
| 5.00%, 01/01/41 | 525 | 537,075 | ||||||
| 5.00%, 01/01/45 | 375 | 382,559 | ||||||
| Series A, 4.00%, 07/01/44 | 685 | 657,227 | ||||||
| Massachusetts Housing Finance Agency, RB, M/F Housing, Series A-1, (FHA), 3.10%, 06/01/60 | 2,645 | 2,104,394 | ||||||
| Massachusetts Port Authority, ARB | ||||||||
| Series E, AMT, 5.00%, 07/01/46 | 6,320 | 6,903,494 | ||||||
| Series E, AMT, 5.00%, 07/01/51 | 1,220 | 1,326,651 | ||||||
| 13,954,690 | ||||||||
| Michigan — 1.0% | ||||||||
| City of Detroit Michigan Water Supply System Revenue, RB, Series B, 2nd Lien, (AGM), 6.25%, 07/01/36 | 5 | 5,015 | ||||||
| Grand Traverse County Hospital Finance Authority, RB, Series A, 5.00%, 07/01/44 | 1,110 | 1,188,085 | ||||||
| Michigan Finance Authority, Refunding RB, Series A, 4.00%, 12/01/49 | 895 | 885,935 | ||||||
| Michigan State Housing Development Authority, RB, M/F Housing, Series A, 2.70%, 10/01/56 | 1,890 | 1,378,509 | ||||||
S C H E D U L E O F IN V E S T M E N T S | 25 |
Schedule of Investments (continued) July 31, 2022 | BlackRock Municipal Income Trust II (BLE) (Percentages shown are based on Net Assets) |
| Security | Par (000) | Value | ||||||
| Michigan (continued) | ||||||||
| Michigan State University, Refunding RB, Series B, 5.00%, 02/15/48 | $ | 1,100 | $ | 1,203,572 | ||||
| Michigan Strategic Fund, RB, AMT, 5.00%, 06/30/48 | 1,680 | 1,694,038 | ||||||
| 6,355,154 | ||||||||
| Minnesota — 2.4% | ||||||||
| City of Minneapolis Minnesota, Refunding RB, Series A, 5.00%, 11/15/49 | 1,790 | 1,887,759 | ||||||
| Duluth Economic Development Authority, Refunding RB | ||||||||
| Series A, 4.25%, 02/15/48 | 7,760 | 7,603,605 | ||||||
| Series A, 5.25%, 02/15/53 | 2,230 | 2,357,436 | ||||||
| Series A, 5.25%, 02/15/58 | 1,435 | 1,513,816 | ||||||
| Minnesota Higher Education Facilities Authority, RB, Series A, 5.00%, 10/01/47 | 1,495 | 1,590,360 | ||||||
| 14,952,976 | ||||||||
| Mississippi — 0.2% | ||||||||
| Mississippi Development Bank, RB, (AGM), 6.88%, 12/01/40 | 1,190 | 1,253,631 | ||||||
Mississippi State University Educational Building Corp., Refunding RB, 5.25%, 08/01/23 (c) | 260 | 269,412 | ||||||
| 1,523,043 | ||||||||
| Missouri — 2.2% | ||||||||
370/Missouri Bottom Road/Taussig Road Transportation Development District, RB, 7.20%, 05/01/33 (e)(f) | 6,000 | 1,800,000 | ||||||
| Health & Educational Facilities Authority of the State of Missouri, RB, 4.00%, 06/01/53 | 3,180 | 3,091,052 | ||||||
| Health & Educational Facilities Authority of the State of Missouri, Refunding RB 5.50%, 05/01/43 | 345 | 353,921 | ||||||
| Series A, 4.00%, 07/01/46 | 2,485 | 2,482,763 | ||||||
| Kansas City Industrial Development Authority, ARB | ||||||||
| AMT, (AGM), 4.00%, 03/01/57 | 975 | 951,134 | ||||||
| Class B, AMT, 5.00%, 03/01/54 | 3,435 | 3,588,994 | ||||||
| Missouri Housing Development Commission, RB, S/F Housing | ||||||||
| (FHLMC, FNMA, GNMA), 2.35%, 11/01/46 | 425 | 354,982 | ||||||
| (FHLMC, FNMA, GNMA), 2.40%, 11/01/51 | 440 | 356,332 | ||||||
| St. Louis County Industrial Development Authority, Refunding RB, 5.00%, 09/01/37 | 500 | 487,203 | ||||||
| 13,466,381 | ||||||||
| Montana — 0.5% | ||||||||
| City of Kalispell Montana, Refunding RB, Series A, 5.25%, 05/15/37 | 125 | 126,589 | ||||||
| Montana State Board of Regents, Refunding RB | ||||||||
| Series G, 3.00%, 11/15/43 | 1,020 | 870,987 | ||||||
| Series G, 4.00%, 11/15/46 | 2,250 | 2,265,199 | ||||||
| 3,262,775 | ||||||||
| Nebraska — 0.2% | ||||||||
| Central Plains Energy Project, Refunding RB, 5.25%, 09/01/37 | 1,155 | 1,158,092 | ||||||
New Hampshire (b) — 0.6% | ||||||||
| New Hampshire Business Finance Authority, Refunding RB Series B, 4.63%, 11/01/42 | 2,350 | 2,268,725 | ||||||
| Security | Par (000) | Value | ||||||
| New Hampshire (continued) | ||||||||
| New Hampshire Business Finance Authority, Refunding RB (continued) | ||||||||
Series B, AMT, 3.75%, 07/01/45 (a) | $ | 270 | $ | 235,625 | ||||
| Series C, AMT, 4.88%, 11/01/42 | 1,260 | 1,250,316 | ||||||
| 3,754,666 | ||||||||
| New Jersey — 13.9% | ||||||||
| Casino Reinvestment Development Authority, Inc., Refunding RB | ||||||||
| 5.25%, 11/01/39 | 2,390 | 2,477,395 | ||||||
| 5.25%, 11/01/44 | 2,250 | 2,314,994 | ||||||
| Hudson County Improvement Authority, RB, 4.00%, 10/01/46 | 1,830 | 1,853,581 | ||||||
| Middlesex County Improvement Authority, RB, | ||||||||
Series B, 6.25%, 01/01/37 (e)(f) | 645 | 12,900 | ||||||
| New Jersey Economic Development Authority, ARB, AMT, 5.13%, 09/15/23 | 1,705 | 1,723,533 | ||||||
| New Jersey Economic Development Authority, RB | ||||||||
| 4.00%, 11/01/38 | 560 | 563,195 | ||||||
| 4.00%, 11/01/39 | 450 | 450,783 | ||||||
| 5.00%, 06/15/49 | 2,535 | 2,694,852 | ||||||
| Series EEE, 5.00%, 06/15/43 | 3,710 | 3,928,489 | ||||||
| Series EEE, 5.00%, 06/15/48 | 4,020 | 4,256,473 | ||||||
| AMT, (AGM), 5.00%, 01/01/31 | 530 | 548,569 | ||||||
| AMT, 5.38%, 01/01/43 | 1,500 | 1,533,438 | ||||||
| New Jersey Economic Development Authority, Refunding ARB, AMT, 5.00%, 10/01/47 | 1,570 | 1,628,892 | ||||||
New Jersey Economic Development Authority, Refunding RB, Series BBB, 5.50%, 06/15/31 (c) | 775 | 895,236 | ||||||
| New Jersey Economic Development Authority, Refunding SAB | ||||||||
| 6.50%, 04/01/28 | 7,187 | 7,484,107 | ||||||
| 5.75%, 04/01/31 | 705 | 684,824 | ||||||
| New Jersey Health Care Facilities Financing Authority, RB, 3.00%, 07/01/51 | 4,980 | 4,068,092 | ||||||
| New Jersey Higher Education Student Assistance Authority, Refunding RB | ||||||||
| Sub-Series C, AMT, 3.63%, 12/01/49 | 665 | 582,071 | ||||||
| Series C, AMT, Subordinate, 4.25%, 12/01/50 | 1,810 | 1,682,686 | ||||||
| New Jersey Housing & Mortgage Finance Agency, Refunding RB, M/F Housing, Series A, (HUD SECT 8), 2.30%, 11/01/40 | 1,150 | 924,177 | ||||||
| New Jersey Transportation Trust Fund Authority, RB | ||||||||
| Series A, 5.00%, 06/15/28 | 500 | 544,403 | ||||||
| Series AA, 5.50%, 06/15/39 | 3,845 | 3,935,192 | ||||||
| Series AA, 5.00%, 06/15/44 | 2,085 | 2,112,649 | ||||||
| Series AA, 4.00%, 06/15/45 | 855 | 846,713 | ||||||
| Series AA, 5.00%, 06/15/45 | 415 | 426,544 | ||||||
| Series AA, 4.00%, 06/15/50 | 1,730 | 1,692,526 | ||||||
| Series BB, 5.00%, 06/15/50 | 5,395 | 5,743,625 | ||||||
| Series S, 5.25%, 06/15/43 | 1,145 | 1,235,453 | ||||||
| Series S, 5.00%, 06/15/46 | 2,930 | 3,100,116 | ||||||
| New Jersey Turnpike Authority, RB | ||||||||
| Series A, 4.00%, 01/01/42 | 800 | 817,356 | ||||||
| Series A, 4.00%, 01/01/48 | 1,190 | 1,200,917 | ||||||
| Series E, 5.00%, 01/01/45 | 2,810 | 2,958,924 | ||||||
Rutgers The State University of New Jersey, Refunding RB, Series L, 5.00%, 05/01/23 (c) | 735 | 753,669 | ||||||
| State of New Jersey, GO, Series A, 4.00%, 06/01/31 | 620 | 681,857 | ||||||
| 26 | 2 0 2 2 BL A C K RO C K AN N U A L RE P O R T T O SH A R E H O L D E R S |
Schedule of Investments (continued) July 31, 2022 | BlackRock Municipal Income Trust II (BLE) (Percentages shown are based on Net Assets) |
| Security | Par (000) | Value | ||||||
| New Jersey (continued) | ||||||||
| Tobacco Settlement Financing Corp., Refunding RB | ||||||||
| Series A, 5.00%, 06/01/35 | $ | 1,605 | $ | 1,731,254 | ||||
| Series A, 5.25%, 06/01/46 | 4,415 | 4,653,512 | ||||||
| Sub-Series B, 5.00%, 06/01/46 | 12,780 | 13,055,716 | ||||||
| 85,798,713 | ||||||||
| New Mexico — 0.0% | ||||||||
| City of Santa Fe New Mexico, RB, Series A, 5.00%, 05/15/44 | 100 | 93,280 | ||||||
| New York — 18.3% | ||||||||
| Buffalo & Erie County Industrial Land Development Corp., Refunding RB, Series A, 5.00%, 06/01/35 | 500 | 522,111 | ||||||
| City of New York, GO | ||||||||
| Series C, 5.00%, 08/01/43 | 1,870 | 2,096,147 | ||||||
| Series D-1, 4.00%, 03/01/44 | 515 | 519,661 | ||||||
| Series F-1, 4.00%, 03/01/47 | 4,410 | 4,426,793 | ||||||
| Metropolitan Transportation Authority, RB | ||||||||
| Series B, 5.25%, 11/15/38 | 3,305 | 3,426,750 | ||||||
| Series B, 5.25%, 11/15/39 | 910 | 940,490 | ||||||
| Series C, 4.00%, 11/15/33 | 100 | 100,169 | ||||||
| Metropolitan Transportation Authority, Refunding RB | ||||||||
| Series B, 5.00%, 11/15/22 | 400 | 403,728 | ||||||
| Series C-1, 5.00%, 11/15/25 | 100 | 106,885 | ||||||
| Series C-1, 5.00%, 11/15/26 | 65 | 70,414 | ||||||
| Series C-1, 4.75%, 11/15/45 | 6,795 | 7,042,576 | ||||||
| Series C-1, 5.00%, 11/15/50 | 575 | 604,873 | ||||||
| Series C-1, 5.25%, 11/15/55 | 845 | 898,554 | ||||||
| Monroe County Industrial Development Corp., Refunding RB | ||||||||
| 4.00%, 12/01/46 | 1,090 | 1,009,240 | ||||||
| Series A, 4.00%, 07/01/50 | 1,175 | 1,165,634 | ||||||
| New York City Housing Development Corp., RB, M/F Housing | ||||||||
| Series A, 3.00%, 11/01/55 | 3,375 | 2,750,146 | ||||||
| Series C-1A, 4.20%, 11/01/44 | 3,000 | 3,004,995 | ||||||
| Series H, 2.55%, 11/01/45 | 925 | 739,243 | ||||||
| New York City Housing Development Corp., Refunding RB, M/F Housing, Series D-1-B, (FHA 542 (C)), 2.50%, 11/01/55 | 1,500 | 1,091,191 | ||||||
| New York City Industrial Development Agency, Refunding RB (AGM), 3.00%, 03/01/49 | 2,060 | 1,636,320 | ||||||
| 3.00%, 03/01/49 | 1,645 | 1,241,817 | ||||||
| Series A, Class A, (AGM), 3.00%, 01/01/37 | 235 | 211,158 | ||||||
| Series A, Class A, (AGM), 3.00%, 01/01/39 | 235 | 205,927 | ||||||
| Series A, Class A, (AGM), 3.00%, 01/01/40 | 165 | 142,923 | ||||||
| New York City Transitional Finance Authority Future Tax Secured Revenue RB, Series B-1, Subordinate, 4.00%, 08/01/48 | 2,500 | 2,502,482 | ||||||
| New York City Transitional Finance Authority Future Tax Secured Revenue, RB | ||||||||
| Sub-Series B-1, 4.00%, 11/01/45 | 5,000 | 5,016,660 | ||||||
| Sub-Series E-1, 5.00%, 02/01/42 | 925 | 927,063 | ||||||
| Subordinate, 3.00%, 05/01/46 | 3,020 | 2,640,833 | ||||||
Series A-1, Subordinate, 4.00%, 08/01/48 (g) | 2,240 | 2,231,056 | ||||||
| Series C, Subordinate, 4.00%, 05/01/45 | 1,200 | 1,208,389 | ||||||
| Series F-1, Subordinate, 4.00%, 02/01/51 | 3,095 | 3,099,593 | ||||||
| Series F-1, Subordinate, 5.00%, 02/01/51 | 4,185 | 4,668,405 | ||||||
| Sub-Series C-1, Subordinate, 4.00%, 05/01/40 | 480 | 492,646 | ||||||
| New York Counties Tobacco Trust IV, Refunding RB, | ||||||||
Series A, 6.25%, 06/01/41 (b) | 3,300 | 3,313,890 | ||||||
| Security | Par (000) | Value | ||||||
| New York (continued) | ||||||||
| New York Liberty Development Corp., Refunding RB | ||||||||
Series 1, Class 1, 5.00%, 11/15/44 (b) | $ | 6,110 | $ | 6,128,996 | ||||
Series 2, Class 2, 5.15%, 11/15/34 (b) | 470 | 477,591 | ||||||
Series 2, Class 2, 5.38%, 11/15/40 (b) | 1,175 | 1,198,117 | ||||||
| Series A, 2.88%, 11/15/46 | 5,210 | 4,118,370 | ||||||
| Series A, 3.00%, 11/15/51 | 1,190 | 925,626 | ||||||
| New York Power Authority, Refunding RB, Series A, 4.00%, 11/15/60 | 1,225 | 1,220,036 | ||||||
| New York State Dormitory Authority, Refunding RB | ||||||||
| Series A, 5.00%, 03/15/45 | 1,530 | 1,665,582 | ||||||
| Series A, 4.00%, 03/15/46 | 2,100 | 2,121,661 | ||||||
| Series A, 4.00%, 03/15/47 | 6,650 | 6,692,626 | ||||||
| New York State Environmental Facilities Corp., RB, Series B, Subordinate, 5.00%, 06/15/48 | 1,945 | 2,157,906 | ||||||
| New York State Housing Finance Agency, RB, M/F Housing, Series G, (SONYMA), 2.60%, 11/01/46 | 2,205 | 1,659,322 | ||||||
| New York State Thruway Authority, Refunding RB, Series B, Subordinate, 4.00%, 01/01/45 | 3,110 | 3,031,998 | ||||||
| New York State Urban Development Corp., RB, Series A, 3.00%, 03/15/50 | 1,420 | 1,191,763 | ||||||
| New York Transportation Development Corp., ARB | ||||||||
| AMT, 5.00%, 12/01/39 | 2,250 | 2,402,264 | ||||||
| Series A, AMT, 5.25%, 01/01/50 | 1,600 | 1,625,806 | ||||||
| New York Transportation Development Corp., RB | ||||||||
| AMT, 5.00%, 10/01/35 | 640 | 664,717 | ||||||
| AMT, 5.00%, 10/01/40 | 1,825 | 1,876,469 | ||||||
| AMT, 4.00%, 04/30/53 | 425 | 370,439 | ||||||
| Port Authority of New York & New Jersey, ARB | ||||||||
| 4.00%, 09/01/45 | 2,500 | 2,532,285 | ||||||
| 4.00%, 09/01/49 | 1,500 | 1,505,361 | ||||||
| Port Authority of New York & New Jersey, Refunding ARB, Series 223, AMT, 4.00%, 07/15/46 | 1,500 | 1,486,990 | ||||||
| State of New York Mortgage Agency, RB, S/F Housing, Series 239, (SONYMA), 2.60%, 10/01/44 | 2,145 | 1,696,770 | ||||||
| Triborough Bridge & Tunnel Authority Sales Tax Revenue, RB, Series A, 5.25%, 05/15/57 | 1,640 | 1,862,917 | ||||||
| Triborough Bridge & Tunnel Authority, RB | ||||||||
| Series A, 5.00%, 11/15/49 | 945 | 1,050,453 | ||||||
| Series A, 4.00%, 11/15/54 | 1,085 | 1,086,548 | ||||||
| Westchester County Healthcare Corp., RB, Series A, Senior Lien, 5.00%, 11/01/44 | 1,000 | 1,026,931 | ||||||
| Westchester Tobacco Asset Securitization Corp., Refunding RB, Sub-Series C, 4.00%, 06/01/42 | 210 | 214,015 | ||||||
| 112,450,321 | ||||||||
| North Carolina — 0.7% | ||||||||
| County of Union North Carolina Enterprise System Revenue, RB, 3.00%, 06/01/51 | 2,255 | 2,003,576 | ||||||
| North Carolina Medical Care Commission, RB | ||||||||
| Series A, 4.00%, 10/01/40 | 125 | 116,075 | ||||||
| Series A, 5.00%, 10/01/40 | 190 | 200,681 | ||||||
| Series A, 4.00%, 10/01/45 | 565 | 507,410 | ||||||
| Series A, 5.00%, 10/01/45 | 340 | 356,075 | ||||||
| Series A, 4.00%, 10/01/50 | 145 | 127,742 | ||||||
| Series A, 5.00%, 10/01/50 | 380 | 396,798 | ||||||
| University of North Carolina at Chapel Hill, RB, 5.00%, 02/01/49 | 590 | 723,913 | ||||||
| 4,432,270 | ||||||||
| North Dakota — 0.2% | ||||||||
| County of Cass North Dakota, Refunding RB, Series B, 5.25%, 02/15/58 | 1,035 | 1,097,955 | ||||||
S C H E D U L E O F IN V E S T M E N T S | 27 |
Schedule of Investments (continued) July 31, 2022 | BlackRock Municipal Income Trust II (BLE) (Percentages shown are based on Net Assets) |
| Security | Par (000) | Value | ||||||
| Ohio — 3.2% | ||||||||
| Buckeye Tobacco Settlement Financing Authority, Refunding RB | ||||||||
| Series A-2, Class 1, 4.00%, 06/01/37 | $ | 315 | $ | 316,128 | ||||
| Series A-2, Class 1, 4.00%, 06/01/38 | 315 | 314,968 | ||||||
| Series A-2, Class 1, 4.00%, 06/01/39 | 315 | 314,253 | ||||||
| Series A-2, Class 1, 4.00%, 06/01/48 | 825 | 795,385 | ||||||
| Series B-2, Class 2, 5.00%, 06/01/55 | 8,165 | 8,135,606 | ||||||
| County of Allen Ohio Hospital Facilities Revenue, Refunding RB, Series A, 4.00%, 11/01/44 | 450 | 446,209 | ||||||
| County of Franklin Ohio, RB | ||||||||
| Series 2017, 5.00%, 12/01/46 | 435 | 465,629 | ||||||
| Series A, 4.00%, 12/01/44 | 555 | 556,818 | ||||||
| County of Hamilton Ohio, Refunding RB | ||||||||
| 4.00%, 08/15/50 | 2,415 | 2,408,494 | ||||||
| Series A, 3.75%, 08/15/50 | 1,155 | 1,102,575 | ||||||
Ohio Air Quality Development Authority, RB, AMT, 5.00%, 07/01/49 (b) | 960 | 945,984 | ||||||
| Ohio Turnpike & Infrastructure Commission, Refunding RB, Series A-1, Junior Lien, 5.25%, 02/15/31 | 2,885 | 2,941,145 | ||||||
| State of Ohio, RB, AMT, 5.00%, 06/30/53 | 870 | 885,880 | ||||||
| 19,629,074 | ||||||||
| Oklahoma — 1.3% | ||||||||
| Norman Regional Hospital Authority, Refunding RB, 5.00%, 09/01/37 | 400 | 415,801 | ||||||
| Oklahoma Development Finance Authority, RB, Series B, 5.25%, 08/15/48 | 2,225 | 2,074,167 | ||||||
| Oklahoma Turnpike Authority, RB | ||||||||
| Series A, 4.00%, 01/01/48 | 2,230 | 2,169,674 | ||||||
| Series C, 4.00%, 01/01/42 | 2,120 | 2,079,498 | ||||||
| Tulsa County Industrial Authority, Refunding RB, 5.25%, 11/15/45 | 1,435 | 1,458,069 | ||||||
| 8,197,209 | ||||||||
| Oregon — 0.7% | ||||||||
Clackamas County School District No.12 North Clackamas, GO, CAB, Series A, (GTD), 0.00%, 06/15/38 (d) | 1,445 | 748,019 | ||||||
Multnomah & Clackamas Counties School District No.10JT Gresham-Barlow, GO, CAB, Series A, (GTY), 0.00%, 06/15/38 (d) | 470 | 252,519 | ||||||
| Oregon State Facilities Authority, Refunding RB, Series A, 4.13%, 06/01/52 | 960 | 936,729 | ||||||
| Port of Portland Oregon Airport Revenue, Refunding ARB, Series 27-A, AMT, 5.00%, 07/01/45 | 1,980 | 2,135,883 | ||||||
| 4,073,150 | ||||||||
| Pennsylvania — 3.5% | ||||||||
Allentown Neighborhood Improvement Zone Development Authority, RB (b) | ||||||||
| 5.00%, 05/01/42 | 420 | 430,619 | ||||||
| Subordinate, 5.00%, 05/01/28 | 70 | 73,107 | ||||||
| Subordinate, 5.13%, 05/01/32 | 100 | 105,610 | ||||||
| Subordinate, 5.38%, 05/01/42 | 145 | 151,755 | ||||||
Bristol Township School District, GO, (SAW), 5.25%, 06/01/23 (c) | 1,530 | 1,577,181 | ||||||
| Montgomery County Higher Education and Health Authority, Refunding RB | ||||||||
| 4.00%, 09/01/49 | 2,765 | 2,764,768 | ||||||
| 4.00%, 09/01/51 | 2,260 | 2,247,480 | ||||||
| Series A, 5.00%, 09/01/43 | 1,350 | 1,450,946 | ||||||
| Security | Par (000) | Value | ||||||
| Pennsylvania (continued) | ||||||||
| Montgomery County Higher Education and Health Authority, Refunding RB (continued) | ||||||||
| Series A, 4.00%, 09/01/49 | $ | 615 | $ | 616,593 | ||||
| Pennsylvania Economic Development Financing Authority, RB, AMT, 5.00%, 06/30/42 | 3,680 | 3,797,808 | ||||||
| Pennsylvania Economic Development Financing Authority, Refunding RB, AMT, 5.50%, 11/01/44 | 480 | 490,381 | ||||||
| Pennsylvania Higher Educational Facilities Authority, RB, 4.00%, 08/15/44 | 3,695 | 3,720,004 | ||||||
| Pennsylvania Turnpike Commission, RB | ||||||||
| Series A, 5.00%, 12/01/44 | 1,535 | 1,601,579 | ||||||
| Series A, Subordinate, 4.00%, 12/01/45 | 435 | 428,348 | ||||||
| Series A, Subordinate, 4.00%, 12/01/46 | 2,065 | 2,028,869 | ||||||
| 21,485,048 | ||||||||
| Puerto Rico — 5.3% | ||||||||
| Children’s Trust Fund, Refunding RB | ||||||||
| 5.50%, 05/15/39 | 715 | 725,322 | ||||||
| 5.63%, 05/15/43 | 1,755 | 1,783,610 | ||||||
| Puerto Rico Sales Tax Financing Corp. Sales Tax Revenue, RB | ||||||||
| Series A-1, Restructured, 4.75%, 07/01/53 | 5,224 | 5,204,467 | ||||||
| Series A-1, Restructured, 5.00%, 07/01/58 | 15,367 | 15,477,381 | ||||||
| Series A-2, Restructured, 4.33%, 07/01/40 | 2,333 | 2,309,588 | ||||||
| Series A-2, Restructured, 4.78%, 07/01/58 | 3,256 | 3,246,981 | ||||||
| Series B-1, Restructured, 4.75%, 07/01/53 | 164 | 163,078 | ||||||
| Series B-2, Restructured, 4.78%, 07/01/58 | 159 | 157,623 | ||||||
Puerto Rico Sales Tax Financing Corp. Sales Tax Revenue, RB, CAB, Series A-1, Restructured, 0.00%, 07/01/46 (d) | 12,023 | 3,474,443 | ||||||
| 32,542,493 | ||||||||
| Rhode Island — 2.2% | ||||||||
| Rhode Island Student Loan Authority, RB, Series A, AMT, 3.63%, 12/01/37 | 260 | 232,564 | ||||||
| Tobacco Settlement Financing Corp., Refunding RB | ||||||||
| Series A, 5.00%, 06/01/35 | 1,690 | 1,741,060 | ||||||
| Series A, 5.00%, 06/01/40 | 950 | 970,981 | ||||||
| Series B, 4.50%, 06/01/45 | 5,685 | 5,691,788 | ||||||
| Series B, 5.00%, 06/01/50 | 4,880 | 4,983,373 | ||||||
| 13,619,766 | ||||||||
| South Carolina — 6.0% | ||||||||
| Charleston County Airport District, ARB | ||||||||
| Series A, AMT, 5.50%, 07/01/26 | 1,810 | 1,867,375 | ||||||
| Series A, AMT, 6.00%, 07/01/38 | 1,155 | 1,193,486 | ||||||
| Series A, AMT, 5.50%, 07/01/41 | 1,000 | 1,028,370 | ||||||
County of Charleston South Carolina, ARB, 5.25%, 12/01/23 (c) | 3,295 | 3,445,591 | ||||||
South Carolina Jobs-Economic Development Authority, RB (b) | ||||||||
| 5.00%, 01/01/40 | 385 | 372,600 | ||||||
| 5.00%, 01/01/55 | 335 | 305,819 | ||||||
| South Carolina Jobs-Economic Development Authority, Refunding RB | ||||||||
| 5.00%, 02/01/38 | 2,710 | 2,857,538 | ||||||
| Series A, 5.00%, 05/01/43 | 2,430 | 2,584,154 | ||||||
| Series A, 5.00%, 05/01/48 | 4,620 | 4,887,808 | ||||||
South Carolina Ports Authority, ARB (c) | ||||||||
| AMT, 5.25%, 07/01/25 | 335 | 364,988 | ||||||
| AMT, 5.25%, 07/01/50 | 750 | 818,602 | ||||||
| 28 | 2 0 2 2 BL A C K RO C K AN N U A L RE P O R T T O SH A R E H O L D E R S |
Schedule of Investments (continued) July 31, 2022 | BlackRock Municipal Income Trust II (BLE) (Percentages shown are based on Net Assets) |
| Security | Par (000) | Value | ||||||
| South Carolina (continued) | ||||||||
| South Carolina Public Service Authority, RB | ||||||||
| Series A, 5.50%, 12/01/54 | $ | 4,810 | $ | 4,981,914 | ||||
| Series E, 5.50%, 12/01/53 | 2,040 | 2,098,258 | ||||||
| South Carolina Public Service Authority, Refunding RB | ||||||||
| Series A, 4.00%, 12/01/33 | 2,225 | 2,300,136 | ||||||
| Series A, 5.00%, 12/01/50 | 1,755 | 1,809,849 | ||||||
| Series A, 5.00%, 12/01/55 | 465 | 478,835 | ||||||
| Series C, 5.00%, 12/01/46 | 1,795 | 1,832,855 | ||||||
| Series E, 5.25%, 12/01/55 | 3,750 | 3,913,466 | ||||||
| 37,141,644 | ||||||||
| South Dakota — 0.2% | ||||||||
| South Dakota Health & Educational Facilities Authority, Refunding RB, Series A, 4.00%, 09/01/50 | 1,295 | 1,185,370 | ||||||
| Tennessee — 1.2% | ||||||||
Chattanooga Health Educational & Housing Facility Board, RB, Series A, Catholic Health Services, 5.25%, 01/01/23 (c) | 1,910 | 1,939,727 | ||||||
| Chattanooga Health Educational & Housing Facility Board, Refunding RB, Series A, 4.00%, 08/01/44 | 170 | 165,894 | ||||||
| Metropolitan Government Nashville & Davidson County Health & Educational Facilities Board, RB, Series A, 5.00%, 07/01/40 | 740 | 782,326 | ||||||
| Metropolitan Government Nashville & Davidson County Health & Educational Facilities Board, Refunding RB | ||||||||
| Series A, 4.00%, 10/01/49 | 445 | 414,518 | ||||||
| Series A, 5.25%, 10/01/58 | 3,840 | 4,087,215 | ||||||
Tennessee Energy Acquisition Corp., RB, Series A, 5.00%, 05/01/52 (a) | 295 | 319,751 | ||||||
| 7,709,431 | ||||||||
| Texas — 8.3% | ||||||||
| Brazos Higher Education Authority, Inc., RB, Series 1B, AMT, Subordinate, 3.00%, 04/01/40 | 380 | 300,192 | ||||||
| Central Texas Regional Mobility Authority, RB, Series E, Senior Lien, 4.00%, 01/01/50 | 2,390 | 2,315,872 | ||||||
Central Texas Regional Mobility Authority, Refunding RB, Sub Lien, 5.00%, 01/01/23 (c) | 505 | 512,817 | ||||||
| City of Austin Texas Airport System Revenue, ARB, AMT, 5.00%, 11/15/39 | 665 | 692,098 | ||||||
City of Beaumont Texas, GO, 5.25%, 03/01/23 (c) | 2,070 | 2,118,289 | ||||||
| City of Houston Texas Airport System Revenue, ARB, Series A, AMT, 6.63%, 07/15/38 | 150 | 150,155 | ||||||
| City of Houston Texas Airport System Revenue, Refunding ARB, AMT, 5.00%, 07/15/27 | 100 | 102,871 | ||||||
| City of Houston Texas Airport System Revenue, Refunding RB AMT, 5.00%, 07/01/29 | 595 | 602,356 | ||||||
| Series A, AMT, 5.00%, 07/01/27 | 100 | 103,372 | ||||||
| City of San Antonio Texas Electric & Gas Systems Revenue, Refunding RB, Series A, 5.00%, 02/01/48 | 1,260 | 1,379,748 | ||||||
| Clifton Higher Education Finance Corp., RB, 6.00%, 08/15/43 | 230 | 239,274 | ||||||
| Dallas Fort Worth International Airport, Refunding RB, Series E, AMT, 5.50%, 11/01/27 | 2,500 | 2,607,585 | ||||||
Harris County Cultural Education Facilities Finance Corp., RB, Series B, 7.00%, 01/01/23 (c) | 630 | 645,082 | ||||||
Harris County-Houston Sports Authority, Refunding RB (d) | ||||||||
Series A, 3rd Lien, (NPFGC), 0.00%, 11/15/24 (c) | 2,300 | 1,087,353 | ||||||
| Security | Par (000) | Value | ||||||
| Texas (continued) | ||||||||
Harris County-Houston Sports Authority, Refunding RB (d) (continued) | ||||||||
| Series A, 3rd Lien, (NPFGC), 0.00%, 11/15/36 | $ | 13,075 | $ | 5,937,540 | ||||
Harris County-Houston Sports Authority, Refunding RB, CAB, Series A, Senior Lien, (AGM, NPFGC), 0.00%, 11/15/38 (d) | 4,750 | 2,022,412 | ||||||
| Lower Colorado River Authority, Refunding RB, 5.50%, 05/15/33 | 730 | 750,560 | ||||||
Midland County Fresh Water Supply District No.1, RB, CAB, Series A, 0.00%, 09/15/37 (d) | 10,540 | 5,347,089 | ||||||
New Hope Cultural Education Facilities Finance Corp., RB, Series A, 5.00%, 08/15/50 (b) | 180 | 179,997 | ||||||
North Texas Tollway Authority, RB, CAB, Series B, 0.00%, 09/01/31 (c)(d) | 640 | 318,861 | ||||||
| North Texas Tollway Authority, Refunding RB, 4.25%, 01/01/49 | 3,185 | 3,236,460 | ||||||
Red River Education Finance Corp., RB, 5.25%, 03/15/23 (c) | 940 | 962,061 | ||||||
| San Antonio Water System, Refunding RB, Series A, Junior Lien, 5.00%, 05/15/48 | 1,370 | 1,503,442 | ||||||
| Tarrant County Cultural Education Facilities Finance Corp., RB, Series B, 5.00%, 07/01/48 | 4,955 | 5,231,410 | ||||||
| Texas City Industrial Development Corp., RB, Series 2012, 4.13%, 12/01/45 | 95 | 94,243 | ||||||
| Texas Private Activity Bond Surface Transportation | ||||||||
| Corp., RB, AMT, Senior Lien, 5.00%, 12/31/55 | 975 | 984,348 | ||||||
| Texas Transportation Commission, RB, Series A, | ||||||||
| 5.00%, 08/01/57 | 1,715 | 1,796,962 | ||||||
Texas Transportation Commission, RB, CAB (d) | ||||||||
| 0.00%, 08/01/40 | 500 | 214,470 | ||||||
| 0.00%, 08/01/41 | 2,000 | 809,522 | ||||||
| 0.00%, 08/01/42 | 2,345 | 895,011 | ||||||
| Texas Water Development Board, RB, Series A, 4.00%, 10/15/49 | 7,600 | 7,731,138 | ||||||
| 50,872,590 | ||||||||
| Utah — 0.5% | ||||||||
| County of Utah, RB | ||||||||
| Series A, 4.00%, 05/15/43 | 240 | 244,261 | ||||||
| Series A, 3.00%, 05/15/50 | 1,085 | 894,873 | ||||||
| Salt Lake City Corp. Airport Revenue, ARB | ||||||||
| Series A, AMT, 5.00%, 07/01/47 | 995 | 1,040,935 | ||||||
| Series A, AMT, 5.00%, 07/01/48 | 955 | 1,001,697 | ||||||
Utah Charter School Finance Authority, RB, Series A, 5.00%, 06/15/39 (b) | 100 | 100,373 | ||||||
Utah Charter School Finance Authority, Refunding RB, 5.00%, 06/15/40 (b) | 135 | 136,245 | ||||||
| 3,418,384 | ||||||||
| Vermont — 0.7% | ||||||||
| Vermont Educational & Health Buildings Financing Agency, Refunding RB | ||||||||
| 5.00%, 11/01/49 | 1,915 | 2,103,371 | ||||||
| 4.00%, 11/01/50 | 1,725 | 1,734,831 | ||||||
| Vermont Student Assistance Corp., RB, Series A, AMT, 3.38%, 06/15/36 | 285 | 281,867 | ||||||
| 4,120,069 | ||||||||
| Virginia — 0.7% | ||||||||
| Ballston Quarter Community Development Authority, TA Series A, 5.00%, 03/01/26 | 370 | 357,603 | ||||||
S C H E D U L E O F IN V E S T M E N T S | 29 |
Schedule of Investments (continued) July 31, 2022 | BlackRock Municipal Income Trust II (BLE) (Percentages shown are based on Net Assets) |
| Security | Par (000) | Value | ||||||
| Virginia (continued) | ||||||||
| Ballston Quarter Community Development Authority, TA (continued) | ||||||||
| Series A, 5.13%, 03/01/31 | $ | 790 | $ | 688,829 | ||||
| Front Royal & Warren County Industrial Development Authority, RB, 4.00%, 01/01/50 | 865 | 869,015 | ||||||
| Henrico County Economic Development Authority, Refunding RB, 4.00%, 10/01/45 | 305 | 299,763 | ||||||
| Tobacco Settlement Financing Corp., Refunding RB, Series B-1, 5.00%, 06/01/47 | 1,010 | 992,195 | ||||||
| Virginia Housing Development Authority, RB, M/F Housing, Series 1, (FHLMC, FNMA, GNMA), 2.55%, 11/01/50. | 1,520 | 1,137,041 | ||||||
| 4,344,446 | ||||||||
| Washington — 2.2% | ||||||||
Grant County Public Utility District No.2 Priest Rapids Hydroelectric Project, Refunding RB, Series A, 5.00%, 01/01/26 (c) | 2,335 | 2,588,936 | ||||||
| Port of Seattle Washington, ARB | ||||||||
| Series A, AMT, 5.00%, 05/01/43 | 1,615 | 1,693,153 | ||||||
| Series C, AMT, 5.00%, 04/01/40 | 1,050 | 1,090,530 | ||||||
Washington Health Care Facilities Authority, RB, Series A, Catholic Health Services, 5.75%, 01/01/23 (c) | 3,160 | 3,220,230 | ||||||
| Washington Health Care Facilities Authority, Refunding RB, Series A, 4.00%, 08/01/44 | 375 | 365,469 | ||||||
| Washington State Housing Finance Commission, RB, M/F Housing, Series A-1, 3.50%, 12/20/35 | 1,947 | 1,876,377 | ||||||
Washington State Housing Finance Commission, Refunding RB (b) | ||||||||
| 5.00%, 01/01/43 | 1,000 | 1,037,799 | ||||||
| 5.00%, 01/01/48 | 1,405 | 1,452,202 | ||||||
| 13,324,696 | ||||||||
| West Virginia — 0.1% | ||||||||
| City of Martinsburg West Verginia, RB, M/F Housing, Series A-1, 4.63%, 12/01/43 | 570 | 580,772 | ||||||
| Wisconsin — 1.4% | ||||||||
| Public Finance Authority, RB | ||||||||
| Series A, 5.00%, 11/15/41 | 205 | 220,119 | ||||||
Series A, 5.00%, 07/01/55 (b) | 120 | 114,992 | ||||||
Series A-1, 4.50%, 01/01/35 (b) | 210 | 206,128 | ||||||
| AMT, 4.00%, 03/31/56 | 3,760 | 3,171,601 | ||||||
Public Finance Authority, Refunding RB (b) | ||||||||
| 5.25%, 05/15/52 | 735 | 686,112 | ||||||
| 5.00%, 09/01/54 | 115 | 100,650 | ||||||
| Wisconsin Health & Educational Facilities Authority, Refunding RB, 4.00%, 12/01/51 | 3,280 | 3,237,911 | ||||||
| Wisconsin Housing & Economic Development Authority, RB, M/F Housing, Series A, 4.70%, 07/01/47 | 660 | 680,093 | ||||||
| 8,417,606 | ||||||||
| Total Municipal Bonds — 136.5% (Cost: $854,228,705) | 840,542,705 | |||||||
Municipal Bonds Transferred to Tender Option Bond Trusts (h) | ||||||||
| California — 3.0% | ||||||||
Bay Area Toll Authority, Refunding RB, 4.00%, 04/01/42 (i) | 3,358 | 3,387,887 | ||||||
| Security | Par (000) | Value | ||||||
| California (continued) | ||||||||
| City of Los Angeles Department of Airports, ARB, Series B, AMT, 5.00%, 05/15/46 | $ | 4,050 | $ | 4,233,716 | ||||
| Fremont Union High School District, Refunding GO, Series A, 4.00%, 08/01/46 | 1,839 | 1,874,094 | ||||||
| Sacramento Area Flood Control Agency, Refunding SAB | ||||||||
| 5.00%, 10/01/47 | 3,344 | 3,606,833 | ||||||
| Series A, 5.00%, 10/01/43 | 4,725 | 5,141,619 | ||||||
| 18,244,149 | ||||||||
| Colorado — 1.2% | ||||||||
City & County of Denver Colorado Airport System Revenue, Refunding ARB, Series A, AMT, 5.25%, 12/01/48 (i) | 2,463 | 2,662,841 | ||||||
Colorado Health Facilities Authority, Refunding RB, Series A, 4.00%, 08/01/49 (i) | 3,920 | 3,796,220 | ||||||
| County of Adams Colorado, Refunding COP, 4.00%, 12/01/45 | 1,180 | 1,192,244 | ||||||
| 7,651,305 | ||||||||
| Connecticut — 0.2% | ||||||||
| Connecticut State Health & Educational Facilities Authority, Refunding RB, 5.00%, 12/01/45 | 1,216 | 1,284,617 | ||||||
| District of Columbia — 1.5% | ||||||||
| District of Columbia Housing Finance Agency, RB, M/F Housing, Series B-2, (FHA), 4.10%, 09/01/39 | 2,361 | 2,384,703 | ||||||
| Metropolitan Washington Airports Authority Dulles Toll Road Revenue, Refunding RB, Series B, Subordinate, (AGM), 4.00%, 10/01/53 | 6,986 | 6,920,671 | ||||||
| 9,305,374 | ||||||||
| Florida — 0.9% | ||||||||
Escambia County Health Facilities Authority, Refunding RB, 4.00%, 08/15/45 (i) | 5,672 | 5,416,863 | ||||||
| Georgia — 1.0% | ||||||||
| Dalton Whitfield County Joint Development Authority, RB, 4.00%, 08/15/48 | 4,396 | 4,307,884 | ||||||
| Georgia Housing & Finance Authority, Refunding RB, Series A, 3.60%, 12/01/44 | 1,582 | 1,580,601 | ||||||
| 5,888,485 | ||||||||
| Idaho — 0.8% | ||||||||
Idaho State Building Authority, RB, Series A, 4.00%, 09/01/27 (c) | 4,800 | 5,265,252 | ||||||
| Illinois — 1.0% | ||||||||
| Illinois Finance Authority, Refunding RB | ||||||||
Series C, 4.00%, 02/15/27 (c) | 4 | 3,912 | ||||||
| Series C, 4.00%, 02/15/41 | 1,540 | 1,559,739 | ||||||
| Illinois State Toll Highway Authority, RB, Series C, | ||||||||
| 5.00%, 01/01/38 | 4,244 | 4,481,084 | ||||||
| 6,044,735 | ||||||||
| Iowa — 0.4% | ||||||||
| Iowa Finance Authority, Refunding RB, Series E, 4.00%, 08/15/46 | 2,730 | 2,643,720 | ||||||
| Massachusetts — 1.4% | ||||||||
| Commonwealth of Massachusetts Transportation Fund Revenue, RB, Series A, 4.00%, 06/01/45 | 2,238 | 2,268,654 | ||||||
| 30 | 2 0 2 2 BL A C K RO C K AN N U A L RE P O R T T O SH A R E H O L D E R S |
Schedule of Investments (continued) July 31, 2022 | BlackRock Municipal Income Trust II (BLE) (Percentages shown are based on Net Assets) |
| Security | Par (000) | Value | ||||||
| Massachusetts (continued) | ||||||||
| Massachusetts Development Finance Agency, Refunding RB, 5.00%, 07/01/47 | $ | 4,979 | $ | 5,246,571 | ||||
| Massachusetts Housing Finance Agency, Refunding RB, Series A, AMT, 4.50%, 12/01/47 | 1,138 | 1,147,189 | ||||||
| 8,662,414 | ||||||||
| Michigan — 1.5% | ||||||||
| Michigan Finance Authority, RB, 4.00%, 02/15/47 | 4,380 | 4,337,532 | ||||||
| Michigan State Housing Development Authority, RB, M/F Housing, Series A, 4.15%, 10/01/53 | 5,000 | 5,011,856 | ||||||
| 9,349,388 | ||||||||
| Nebraska — 0.9% | ||||||||
| Central Plains Energy Project, RB, Series 1, 5.00%, 05/01/53 | 5,241 | 5,645,835 | ||||||
| New York — 5.9% | ||||||||
City of New York, GO, Series D, 5.00%, 12/01/43 (i) | 2,380 | 2,625,818 | ||||||
| New York City Housing Development Corp., Refunding RB, Series A, 4.15%, 11/01/38 | 5,159 | 5,212,439 | ||||||
| New York Power Authority, Refunding RB, Series A, | ||||||||
| 4.00%, 11/15/60 | 1,459 | 1,452,719 | ||||||
| New York State Dormitory Authority, Refunding RB | ||||||||
| Series A, 4.00%, 03/15/49 | 3,300 | 3,297,008 | ||||||
| Series D, 4.00%, 02/15/47 | 6,576 | 6,641,908 | ||||||
| New York State Thruway Authority, Refunding RB, | ||||||||
| Series B, Subordinate, 4.00%, 01/01/50 | 3,165 | 3,135,659 | ||||||
| New York State Urban Development Corp., RB, | ||||||||
| Series A, 4.00%, 03/15/46 | 7,217 | 7,257,744 | ||||||
| Port Authority of New York & New Jersey, Refunding ARB | ||||||||
| 194th Series, 5.25%, 10/15/55 | 3,600 | 3,788,684 | ||||||
| Series 221, AMT, 4.00%, 07/15/55 | 2,820 | 2,716,746 | ||||||
| 36,128,725 | ||||||||
| North Carolina — 0.7% | ||||||||
North Carolina Capital Facilities Finance Agency, Refunding RB, Series B, 5.00%, 10/01/25 (c) | 3,540 | 3,881,888 | ||||||
| North Carolina Housing Finance Agency, RB, S/F Housing, Series 39-B, (FHLMC, FNMA, GNMA), | ||||||||
| 4.00%, 01/01/48 | 505 | 478,745 | ||||||
| 4,360,633 | ||||||||
| Pennsylvania — 3.2% | ||||||||
| County of Lehigh Pennsylvania, Refunding RB, | ||||||||
Series A, 4.00%, 07/01/49 (i) | 7,498 | 7,256,028 | ||||||
| Pennsylvania Turnpike Commission, RB, Series A, | ||||||||
| 5.50%, 12/01/42 | 7,078 | 7,698,905 | ||||||
| Pennsylvania Turnpike Commission, Refunding RB, | ||||||||
| Sub-Series B-2, (AGM), 5.00%, 06/01/35 | 3,110 | 3,441,167 | ||||||
| Westmoreland County Municipal Authority, Refunding RB, (BAM), 5.00%, 08/15/38 | 1,034 | 1,109,745 | ||||||
| 19,505,845 | ||||||||
| Rhode Island — 0.9% | ||||||||
| Rhode Island Health and Educational Building Corp., RB, Series A, 4.00%, 09/15/47 | 5,571 | 5,584,702 | ||||||
| Texas — 1.8% | ||||||||
| Board of Regents of the University of Texas System, Refunding RB, Series B, 5.00%, 08/15/43 | 4,322 | 4,328,513 | ||||||
| Security | Par (000) | Value | ||||||
| Texas (continued) | ||||||||
City of San Antonio Texas Electric & Gas Systems Revenue, RB, Junior Lien, 5.00%, 02/01/23 (c) | $ | 3,440 | $ | 3,505,549 | ||||
| Texas Department of Housing & Community Affairs, RB, S/F Housing | ||||||||
| Series A, (GNMA), 3.63%, 09/01/44 | 1,966 | 1,966,257 | ||||||
| Series A, (GNMA), 3.75%, 09/01/49 | 1,396 | 1,396,590 | ||||||
| 11,196,909 | ||||||||
| Virginia — 2.6% | ||||||||
Hampton Roads Transportation Accountability Commission, RB (i) | ||||||||
| Series A, Senior Lien, 5.50%, 01/01/28 | 4,553 | 5,383,949 | ||||||
| Series A, Senior Lien, 4.00%, 07/01/60 | 5,115 | 5,120,032 | ||||||
| Virginia Small Business Financing Authority, Refunding RB, Series A, 4.00%, 12/01/49 | 5,312 | 5,315,590 | ||||||
| 15,819,571 | ||||||||
| West Virginia — 0.7% | ||||||||
Morgantown Utility Board, Inc., RB, Series B, 4.00%, 12/01/48 (i) | 4,222 | 4,232,812 | ||||||
| Wisconsin — 1.5% | ||||||||
| Wisconsin Health & Educational Facilities Authority, Refunding RB, 4.00%, 12/01/46 | 3,072 | 3,073,254 | ||||||
| Wisconsin Housing & Economic Development Authority, RB, M/F Housing | ||||||||
| Series A, 4.10%, 11/01/43 | 2,658 | 2,701,478 | ||||||
| Series A, 4.45%, 05/01/57 | 3,322 | 3,376,848 | ||||||
| 9,151,580 | ||||||||
| Total Municipal Bonds Transferred to Tender Option Bond Trusts — 31.1% | ||||||||
| (Cost: $194,336,150) | 191,382,914 | |||||||
| Total Long-Term Investments — 167.6% (Cost: $1,048,564,855) | 1,031,925,619 | |||||||
| Shares | ||||||||
| Short-Term Securities | ||||||||
| Money Market Funds — 0.5% | ||||||||
BlackRock Liquidity Funds, MuniCash, Institutional Class, 0.96% (j)(k) | 2,825,225 | 2,826,073 | ||||||
| Total Short-Term Securities — 0.5% (Cost: $2,825,440) | 2,826,073 | |||||||
| Total Investments — 168.1% (Cost: $1,051,390,295) | 1,034,751,692 | |||||||
| Liabilities in Excess of Other Assets — (0.4)% | (2,426,136 | ) | ||||||
| Liability for TOB Trust Certificates, Including Interest Expense and Fees Payable — (18.5)% | (113,983,296 | ) | ||||||
| VMTP Shares at Liquidation Value, Net of Deferred Offering Costs — (49.2)% | (302,700,000 | ) | ||||||
| Net Assets Applicable to Common Shares — 100.0% | $ | 615,642,260 | ||||||
| (a) | Variable rate security. Interest rate resets periodically. The rate shown is the effective interest rate as of period end. Security description also includes the reference rate and spread if published and available. |
| (b) | Security exempt from registration pursuant to Rule 144A under the Securities Act of 1933, as amended. These securities may be resold in transactions exempt from registration to qualified institutional investors. |
S C H E D U L E O F IN V E S T M E N T S | 31 |
Schedule of Investments (continued) July 31, 2022 | BlackRock Municipal Income Trust II (BLE) |
| (c) | U.S. Government securities held in escrow, are used to pay interest on this security as well as to retire the bond in full at the date indicated, typically at a premium to par. |
| (d) | Zero-coupon bond. |
| (e) | Issuer filed for bankruptcy and/or is in default. |
| (f) | Non-income producing security. |
| (g) | When-issued security. |
| (h) | Represent bonds transferred to a TOB Trust in exchange of cash and residual certificates received by the Trust. These bonds serve as collateral in a secured borrowing. See Note 4 of the Notes to Financial Statements for details. |
| (i) | All or a portion of the security is subject to a recourse agreement. The aggregate maximum potential amount the Trust could ultimately be required to pay under the agreements, which expire between April 1, 2025 to July 1, 2028, is $24,574,782. See Note 4 of the Notes to Financial Statements for details. |
| (j) | Affiliate of the Trust. |
| (k) | Annualized 7-day yield as of period end. |
| Affiliated Issuer | Value at 08/31/21 | Purchases at Cost | Proceeds from Sales | Net Realized Gain (Loss) | Change in Unrealized Appreciation (Depreciation) | Value at 07/31/22 | Shares Held at 07/31/22 | Income | Capital Gain Distributions from Underlying Funds | |||||||||||||||||||||||||||
| BlackRock Liquidity Funds, MuniCash, Institutional Class | $ | 15,829,553 | $ | — | $ | (13,003,818 | ) (a) | $ | (295 | ) | $ | 633 | $ | 2,826,073 | 2,825,225 | $ | 9,846 | $ | — | |||||||||||||||||
| (a) | Represents net amount purchased (sold). |
| Description | Number of Contracts | Expiration Date | Notional Amount (000) | Value/ Unrealized Appreciation (Depreciation) | ||||||||||||
| Short Contracts | ||||||||||||||||
| 10-Year U.S. Treasury Note | 372 | 09/21/22 | $ | 45,024 | $ | (862,194 | ) | |||||||||
| U.S. Long Bond | 421 | 09/21/22 | 60,348 | (2,140,517 | ) | |||||||||||
| 5-Year U.S. Treasury Note | 318 | 09/30/22 | 36,170 | (493,919 | ) | |||||||||||
| $ | (3,496,630 | ) | ||||||||||||||
| Commodity Contracts | Credit Contracts | Equity Contracts | Foreign Currency Exchange Contracts | Interest Rate Contracts | Other Contracts | Total | ||||||||||||||||||||||
| Liabilities — Derivative Financial Instruments | ||||||||||||||||||||||||||||
| Futures contracts | ||||||||||||||||||||||||||||
Unrealized depreciation on futures contracts (a) | $ | — | $ | — | $ | — | $ | — | $ | 3,496,630 | $ | — | $ | 3,496,630 | ||||||||||||||
| (a) | Net cumulative unrealized appreciation (depreciation) on futures contracts and centrally cleared swaps, if any, are reported in the Schedule of Investments. In the Statements of Assets and Liabilities, only current day’s variation margin is reported in receivables or payables and the net cumulative unrealized appreciation (depreciation) is included in accumulated earnings (loss). |
| 32 | 2 0 2 2 BL A C K RO C K AN N U A L RE P O R T T O SH A R E H O L D E R S |
Schedule of Investments (continued) July 31, 2022 | BlackRock Municipal Income Trust II (BLE) |
| Commodity Contracts | Credit Contracts | Equity Contracts | Foreign Currency Exchange Contracts | Interest Rate Contracts | Other Contracts | Total | ||||||||||||||||||||||
| Net Realized Gain (Loss) from: | ||||||||||||||||||||||||||||
| Futures contracts | $ | — | $ | — | $ | — | $ | — | $ | 10,696,611 | $ | — | $ | 10,696,611 | ||||||||||||||
| Net Change in Unrealized Appreciation (Depreciation) on: | ||||||||||||||||||||||||||||
| Futures contracts | $ | — | $ | — | $ | — | $ | — | $ | (3,155,422 | ) | $ | — | $ | (3,155,422 | ) | ||||||||||||
| Futures contracts: | ||||
| Average notional value of contracts — short | $ | 111,909,973 |
| Level 1 | Level 2 | Level 3 | Total | |||||||||||||
| Assets | ||||||||||||||||
| Investments | ||||||||||||||||
| Long-Term Investments | ||||||||||||||||
| Municipal Bonds | $ | — | $ | 840,542,705 | $ | — | $ | 840,542,705 | ||||||||
| Municipal Bonds Transferred to Tender Option Bond Trusts | — | 191,382,914 | — | 191,382,914 | ||||||||||||
| Short-Term Securities | ||||||||||||||||
| Money Market Funds | 2,826,073 | — | — | 2,826,073 | ||||||||||||
| $ | 2,826,073 | $ | 1,031,925,619 | $ | — | $ | 1,034,751,692 | |||||||||
Derivative Financial Instruments (a) | ||||||||||||||||
| Liabilities | ||||||||||||||||
| Interest Rate Contracts | $ | (3,496,630 | ) | $ | — | $ | — | $ | (3,496,630 | ) | ||||||
| (a) | Derivative financial instruments are futures contracts. Futures contracts are valued at the unrealized appreciation (depreciation) on the instrument. |
Level 1 | Level 2 | Level 3 | Total | |||||||||||||
| Liabilities | ||||||||||||||||
| TOB Trust Certificates | $ | — | $ | (113,751,753 | ) | $ | — | $ | (113,751,753 | ) | ||||||
| VMTP Shares at Liquidation Value | — | (302,700,000 | ) | — | (302,700,000 | ) | ||||||||||
| $ | — | $ | (416,451,753 | ) | $ | — | $ | (416,451,753 | ) | |||||||
S C H E D U L E O F IN V E S T M E N T S | 33 |
Schedule of Investments July 31, 2022 | BlackRock MuniVest Fund, Inc. (MVF) (Percentages shown are based on Net Assets) |
Security | Par (000) | Value | ||||||
Municipal Bonds | ||||||||
Alabama — 0.7% | ||||||||
Black Belt Energy Gas District, RB, Series B-2, 1.95%, 12/01/48 (a) | $ | 2,500 | $ | 2,491,997 | ||||
Tuscaloosa County Industrial Development Authority, Refunding RB, Series A, 4.50%, 05/01/32 (b) | 1,555 | 1,444,845 | ||||||
| 3,936,842 | ||||||||
Arizona — 4.6% | ||||||||
| Arizona Industrial Development Authority, RB, Series A, (BAM), 4.00%, 06/01/44 | 1,435 | 1,362,345 | ||||||
Arizona Industrial Development Authority, Refunding RB (b) | ||||||||
| Series A, 5.38%, 07/01/50 | 2,500 | 2,548,742 | ||||||
| Series G, 5.00%, 07/01/47 | 715 | 722,281 | ||||||
| Glendale Industrial Development Authority, RB, 5.00%, 05/15/56 | 1,030 | 1,006,310 | ||||||
Industrial Development Authority of the City of Phoenix, RB (c) | ||||||||
| 6.63%, 07/01/23 | 2,245 | 2,346,050 | ||||||
| 6.88%, 07/01/23 | 3,440 | 3,602,605 | ||||||
Industrial Development Authority of the City of Phoenix, Refunding RB (b) | ||||||||
| 5.00%, 07/01/35 | 600 | 609,464 | ||||||
| 5.00%, 07/01/45 | 700 | 705,109 | ||||||
| Series A, 5.00%, 07/01/35 | 1,125 | 1,142,745 | ||||||
| Salt Verde Financial Corp., RB, 5.00%, 12/01/37 | 9,805 | 10,870,960 | ||||||
| 24,916,611 | ||||||||
Arkansas — 0.7% | ||||||||
Arkansas Development Finance Authority, RB, Series A, AMT, 4.50%, 09/01/49 (b) | 3,790 | 3,678,123 | ||||||
California — 5.6% | ||||||||
Bay Area Toll Authority, Refunding RB, 1.78%, 04/01/56 (a) | 1,000 | 977,040 | ||||||
California Community Choice Financing Authority, RB, Series A, 4.00%, 10/01/52 (a) | 1,500 | 1,561,062 | ||||||
| California Health Facilities Financing Authority, | ||||||||
| Refunding RB, Series A, 3.00%, 08/15/51 | 5,395 | 4,595,429 | ||||||
| California Housing Finance Agency, RB, M/F Housing | ||||||||
| Class A, 3.25%, 08/20/36 | 1,144 | 1,080,305 | ||||||
| Series 2021-1, Class A, 3.50%, 11/20/35 | 1,265 | 1,232,658 | ||||||
| California Municipal Finance Authority, ARB, AMT, | ||||||||
| Senior Lien, 5.00%, 12/31/43 | 2,800 | 2,890,804 | ||||||
CMFA Special Finance Agency XII, RB, M/F Housing, Series A, 3.25%, 02/01/57 (b) | 445 | 338,001 | ||||||
CSCDA Community Improvement Authority, RB, M/F Housing (b) | ||||||||
| 4.00%, 10/01/56 | 205 | 187,524 | ||||||
| 4.00%, 12/01/56 | 315 | 252,630 | ||||||
| Series A, Class 2, 4.00%, 06/01/58 | 1,270 | 1,092,608 | ||||||
| Senior Lien, 3.13%, 06/01/57 | 1,080 | 783,564 | ||||||
| Series A, Class 2, Senior Lien, 4.00%, 12/01/58 | 635 | 518,666 | ||||||
Poway Unified School District, Refunding GO, CAB, Series B, 0.00%, 08/01/46 (d) | 10,000 | 3,754,720 | ||||||
Security | Par (000) | Value | ||||||
California (continued) | ||||||||
| San Francisco Bay Area Rapid Transit District Sales Tax Revenue, RB, Series A, 3.00%, 07/01/44 | $ | 6,600 | $ | 5,766,308 | ||||
| San Francisco City & County Airport Comm-San Francisco International Airport, Refunding ARB, | ||||||||
| Series E, AMT, 5.00%, 05/01/50 | 5,000 | 5,313,680 | ||||||
| 30,344,999 | ||||||||
Colorado — 2.8% | ||||||||
Centerra Metropolitan District No.1, TA, 5.00%, 12/01/47 (b) | 1,025 | 978,741 | ||||||
| City & County of Denver Colorado Airport System Revenue, Refunding ARB, Series A, AMT, 5.00%, 12/01/48 | 3,300 | 3,517,509 | ||||||
Colorado Health Facilities Authority, RB, Series D, 1.00%, 05/15/61 (a) | 2,515 | 2,515,000 | ||||||
| Colorado Health Facilities Authority, Refunding RB 4.00%, 11/15/43 | 2,320 | 2,324,554 | ||||||
| Series A, 5.00%, 08/01/44 | 3,840 | 4,108,616 | ||||||
| E-470 Public Highway Authority, Refunding RB, | ||||||||
Series B, 1.88%, 09/01/39 (a) | 510 | 507,853 | ||||||
Serenity Ridge Metropolitan District No.2, GO, Series A, 5.13%, 12/01/23 (c) | 1,000 | 1,074,138 | ||||||
| 15,026,411 | ||||||||
Connecticut — 0.7% | ||||||||
| State of Connecticut, GO, Series A, 5.00%, 04/15/38 | 3,325 | 3,696,828 | ||||||
Delaware — 0.5% | ||||||||
| Delaware State Health Facilities Authority, RB, 5.00%, 06/01/43 | 2,780 | 2,958,634 | ||||||
Florida — 10.8% | ||||||||
Celebration Pointe Community Development District, SAB (b) | ||||||||
| 5.00%, 05/01/32 | 860 | 882,519 | ||||||
| 5.00%, 05/01/48 | 2,160 | 2,178,196 | ||||||
| Central Florida Expressway Authority, Refunding RB, | ||||||||
| Senior Lien, 5.00%, 07/01/48 | 9,370 | 10,106,838 | ||||||
| Florida Development Finance Corp., Refunding RB, | ||||||||
6.50%, 06/30/57 (b) | 645 | 658,905 | ||||||
| Greater Orlando Aviation Authority, ARB, Series A, AMT, 4.00%, 10/01/49 | 10,000 | 9,834,890 | ||||||
| JEA Electric System Revenue, Refunding RB, | ||||||||
Series B-3, 1.35%, 10/01/36 (a) | 7,405 | 7,405,000 | ||||||
| Lakewood Ranch Stewardship District, SAB | ||||||||
| 4.63%, 05/01/27 | 255 | 259,169 | ||||||
| 5.25%, 05/01/37 | 470 | 484,971 | ||||||
| 5.38%, 05/01/47 | 770 | 789,235 | ||||||
| Miami-Dade County Educational Facilities Authority, Refunding RB, Series A, 5.00%, 04/01/45 | 4,625 | 4,797,975 | ||||||
| Miami-Dade County Expressway Authority, Refunding RB, Series A, (AGM), 5.00%, 07/01/35 | 8,900 | 8,914,712 | ||||||
| Miami-Dade County Seaport Department, Refunding RB 4.00%, 10/01/49 | 4,680 | 4,635,517 | ||||||
| Series A-1, AMT, (AGM), 4.00%, 10/01/45 | 6,400 | 6,297,811 | ||||||
| Palm Beach County Health Facilities Authority, RB | ||||||||
| Series A, 5.00%, 11/01/47 | 375 | 388,726 | ||||||
| Series A, 5.00%, 11/01/52 | 540 | 559,053 | ||||||
| 34 | 2 0 2 2 BL A C K RO C K AN N U A L RE P O R T T O SH A R E H O L D E R S |
Schedule of Investments (continued) July 31, 2022 | BlackRock MuniVest Fund, Inc. (MVF) (Percentages shown are based on Net Assets) |
Security | Par (000) | Value | ||||||
Florida (continued) | ||||||||
| Palm Beach County Health Facilities Authority, RB (continued) | ||||||||
| Series B, 4.00%, 11/15/41 | $ | 300 | $ | 286,101 | ||||
| Series B, 5.00%, 11/15/42 | 135 | 144,595 | ||||||
| 58,624,213 | ||||||||
Georgia — 2.1% | ||||||||
| Development Authority for Fulton County, RB, 4.00%, 06/15/49 | 1,575 | 1,615,154 | ||||||
East Point Business & Industrial Development Authority, RB, Series A, 5.25%, 06/15/62 (b) | 375 | 383,101 | ||||||
| Main Street Natural Gas, Inc., RB | ||||||||
| Series A, 5.00%, 05/15/49 | 1,855 | 2,019,481 | ||||||
Series B, 5.00%, 12/01/52 (a) | 4,035 | 4,324,919 | ||||||
| Municipal Electric Authority of Georgia, RB, 5.00%, 01/01/48 | 2,745 | 2,917,128 | ||||||
| 11,259,783 | ||||||||
Illinois — 10.2% | ||||||||
| Chicago Board of Education, GO | ||||||||
| Series C, 5.25%, 12/01/35 | 2,785 | 2,855,764 | ||||||
| Series D, 5.00%, 12/01/46 | 3,570 | 3,631,526 | ||||||
| Series H, 5.00%, 12/01/36 | 865 | 898,997 | ||||||
| Chicago Board of Education, Refunding GO | ||||||||
| Series C, 5.00%, 12/01/25 | 1,200 | 1,268,959 | ||||||
| Series D, 5.00%, 12/01/25 | 1,560 | 1,649,647 | ||||||
| Series G, 5.00%, 12/01/34 | 865 | 906,415 | ||||||
| Chicago O’Hare International Airport, ARB, Series D, AMT, Senior Lien, 5.00%, 01/01/42 | 1,450 | 1,515,505 | ||||||
| City of Chicago Illinois Wastewater Transmission Revenue, Refunding RB, Series C, 2nd Lien, 5.00%, 01/01/39 | 1,000 | 1,042,676 | ||||||
| Cook County Community College District No.508, GO, 5.25%, 12/01/31 | 5,000 | 5,168,910 | ||||||
Illinois Finance Authority, RB, Series A, 5.25%, 07/01/23 (c) | 1,785 | 1,844,366 | ||||||
| Illinois Finance Authority, Refunding RB | ||||||||
| Series A, 4.00%, 05/01/45 | 2,525 | 2,302,126 | ||||||
| Series C, 5.00%, 02/15/41 | 3,600 | 3,836,372 | ||||||
| Illinois State Toll Highway Authority, RB, Series A, 5.00%, 01/01/42 | 7,990 | 8,692,912 | ||||||
| Metropolitan Pier & Exposition Authority, RB, Series A, 5.00%, 06/15/57 | 2,515 | 2,598,428 | ||||||
Metropolitan Pier & Exposition Authority, RB, CAB, (BAM-TCRS), 0.00%, 12/15/56 (d) | 8,755 | 1,838,392 | ||||||
| Metropolitan Pier & Exposition Authority, Refunding RB, 4.00%, 06/15/50 | 1,285 | 1,210,999 | ||||||
Metropolitan Pier & Exposition Authority, Refunding RB, CAB, Series B, (BAM-TCRS), 0.00%, 12/15/54 (d) | 12,215 | 2,811,869 | ||||||
| State of Illinois, GO | ||||||||
| Series A, 4.00%, 03/01/41 | 45 | 43,588 | ||||||
| Series D, 5.00%, 11/01/28 | 6,965 | 7,568,503 | ||||||
| Village of Hodgkins Illinois, RB, AMT, 6.00%, 11/01/23 | 3,725 | 3,736,440 | ||||||
| 55,422,394 | ||||||||
Security | Par (000) | Value | ||||||
Indiana — 0.9% | ||||||||
| City of Valparaiso Indiana, RB, AMT, 6.75%, 01/01/34 | $ | 2,250 | $ | 2,388,136 | ||||
Indiana Finance Authority, RB, Series A, AMT, 5.00%, 07/01/23 (c) | 2,640 | 2,711,473 | ||||||
| 5,099,609 | ||||||||
Iowa — 1.4% | ||||||||
| Iowa Finance Authority, RB | ||||||||
| 5.00%, 05/15/36 | 1,050 | 1,056,029 | ||||||
| Series A, 5.00%, 05/15/48 | 6,750 | 6,615,108 | ||||||
| 7,671,137 | ||||||||
Kansas — 1.1% | ||||||||
| City of Lenexa Kansas, Refunding RB, Series A, 5.00%, 05/15/43 | 1,965 | 1,967,120 | ||||||
| Wyandotte County-Kansas City Unified Government Utility System Revenue, RB, Series A, 5.00%, 09/01/40 | 3,700 | 3,897,762 | ||||||
| 5,864,882 | ||||||||
Maryland — 2.7% | ||||||||
| City of Baltimore Maryland, Refunding RB, Series A, 4.50%, 09/01/33 | 545 | 550,699 | ||||||
| Howard County Housing Commission, RB, M/F Housing, 5.00%, 12/01/42 | 4,935 | 5,243,665 | ||||||
| Maryland Health & Higher Educational Facilities Authority, RB, Series B, 4.00%, 04/15/45 | 2,560 | 2,548,984 | ||||||
| Maryland Health & Higher Educational Facilities Authority, Refunding RB, 5.00%, 07/01/40 | 6,350 | 6,548,755 | ||||||
| 14,892,103 | ||||||||
Massachusetts — 2.4% | ||||||||
| Commonwealth of Massachusetts, GO, Series B, 3.00%, 04/01/49 | 2,680 | 2,191,530 | ||||||
| Massachusetts Development Finance Agency, RB | ||||||||
| Series A, 5.25%, 01/01/42 | 1,895 | 1,991,421 | ||||||
| Series A, 5.00%, 01/01/47 | 845 | 874,218 | ||||||
| Massachusetts Development Finance Agency, Refunding RB, Series A, 5.00%, 01/01/40 | 1,620 | 1,701,250 | ||||||
| Massachusetts Port Authority, Refunding ARB, Series A, AMT, 4.00%, 07/01/44 | 6,180 | 6,094,728 | ||||||
| 12,853,147 | ||||||||
Michigan — 3.0% | ||||||||
| Michigan Finance Authority, Refunding RB | ||||||||
2.08%, 04/15/47 (a) | 5,595 | 5,769,978 | ||||||
| 4.00%, 09/01/50 | 855 | 834,967 | ||||||
| Series C, Class 1, 4.00%, 06/01/49 | 2,500 | 2,365,290 | ||||||
| Michigan State Housing Development Authority, RB, M/F Housing | ||||||||
| Series A, 0.55%, 04/01/25 | 340 | 327,709 | ||||||
| Series A, 2.55%, 10/01/51 | 6,890 | 5,091,083 | ||||||
| Michigan Strategic Fund, RB, AMT, 5.00%, 06/30/48 | 1,775 | 1,789,832 | ||||||
| 16,178,859 | ||||||||
Minnesota — 0.8% | ||||||||
| City of Cologne Minnesota,RB, Series A, 5.00%, 07/01/45 | 1,500 | 1,500,131 | ||||||
S C H E D U L E O F IN V E S T M E N T S | 35 |
Schedule of Investments (continued) July 31, 2022 | BlackRock MuniVest Fund, Inc. (MVF) (Percentages shown are based on Net Assets) |
Security | Par (000) | Value | ||||||
Minnesota (continued) | ||||||||
Housing & Redevelopment Authority of The City of St. Paul Minnesota, RB, Series A, 5.50%, 07/01/52 (b) | $ | 695 | $ | 702,768 | ||||
| Housing & Redevelopment Authority of The City of St. Paul Minnesota, Refunding RB, Series A, 4.00%, 11/15/43 | 1,940 | 1,884,211 | ||||||
| 4,087,110 | ||||||||
Mississippi — 1.8% | ||||||||
| Mississippi Development Bank, Refunding RB, Series A, (AGM), 4.00%, 03/01/41 | 3,000 | 3,017,952 | ||||||
| State of Mississippi, RB | ||||||||
| Series A, 5.00%, 10/15/37 | 1,105 | 1,209,075 | ||||||
| Series A, 4.00%, 10/15/38 | 5,535 | 5,578,666 | ||||||
| 9,805,693 | ||||||||
Montana — 0.1% | ||||||||
| Montana Board of Housing, RB, S/F Housing | ||||||||
| Series B-2, 3.50%, 12/01/42 | 215 | 217,156 | ||||||
| Series B-2, 3.60%, 12/01/47 | 335 | 341,623 | ||||||
| 558,779 | ||||||||
Nebraska — 1.5% | ||||||||
Central Plains Energy Project, RB, Series 1, 5.00%, 05/01/53 (a) | 4,765 | 5,132,882 | ||||||
| Central Plains Energy Project, Refunding RB, 5.00%, 09/01/42 | 3,200 | 3,207,904 | ||||||
| 8,340,786 | ||||||||
Nevada — 2.6% | ||||||||
| City of Carson City Nevada, Refunding RB, 5.00%, 09/01/42 | 2,250 | 2,355,944 | ||||||
| City of Reno Nevada, Refunding RB | ||||||||
| Series A-1, (AGM), 4.00%, 06/01/43 | 5,230 | 5,264,664 | ||||||
| Series A-1, (AGM), 4.00%, 06/01/46 | 245 | 245,412 | ||||||
| County of Clark Nevada, GO | ||||||||
| Series A, 5.00%, 06/01/36 | 4,080 | 4,586,964 | ||||||
| Series A, 5.00%, 06/01/37 | 1,500 | 1,672,769 | ||||||
| 14,125,753 | ||||||||
New Jersey — 11.2% | ||||||||
| Casino Reinvestment Development Authority, Inc., Refunding RB, 5.25%, 11/01/44 | 1,400 | 1,440,440 | ||||||
| New Jersey Economic Development Authority, ARB, Series A, AMT, 5.63%, 11/15/30 | 1,530 | 1,576,613 | ||||||
| New Jersey Economic Development Authority, RB | ||||||||
| Series UU, 5.00%, 06/15/40 | 2,755 | 2,823,905 | ||||||
| AMT, 5.13%, 01/01/34 | 1,050 | 1,078,913 | ||||||
| AMT, 5.38%, 01/01/43 | 10,000 | 10,222,920 | ||||||
| New Jersey Higher Education Student Assistance Authority, Refunding RB | ||||||||
| Series B, AMT, 4.00%, 12/01/41 | 2,305 | 2,269,305 | ||||||
| Series C, AMT, Subordinate, 5.00%, 12/01/52 | 2,615 | 2,710,338 | ||||||
| New Jersey Housing & Mortgage Finance Agency, Refunding RB, S/F Housing, Series A, AMT, 3.80%, 10/01/32 | 3,855 | 3,914,849 | ||||||
| New Jersey Transportation Trust Fund Authority, RB | ||||||||
| 4.00%, 06/15/50 | 1,000 | 973,860 | ||||||
| Series AA, 5.25%, 06/15/33 | 8,750 | 8,942,824 | ||||||
| Series AA, 5.25%, 06/15/41 | 780 | 814,352 | ||||||
| Series AA, 5.00%, 06/15/44 | 4,450 | 4,531,938 | ||||||
| Series BB, 4.00%, 06/15/50 | 4,795 | 4,664,830 | ||||||
Security | Par (000) | Value | ||||||
New Jersey (continued) | ||||||||
New Jersey Transportation Trust Fund Authority, RB, CAB, Series A, 0.00%, 12/15/38 (d) | $ | 7,260 | $ | 3,633,811 | ||||
| New Jersey Transportation Trust Fund Authority, Refunding RB, Series A, 5.00%, 12/15/32 | 5,430 | 5,929,962 | ||||||
| Tobacco Settlement Financing Corp., Refunding RB | ||||||||
| Series A, 5.00%, 06/01/46 | 4,550 | 4,729,520 | ||||||
| Sub-Series B, 5.00%, 06/01/46 | 665 | 679,347 | ||||||
| 60,937,727 | ||||||||
New York — 10.0% | ||||||||
Build NYC Resource Corp., Refunding RB, AMT, 5.00%, 01/01/35 (b) | 2,145 | 2,286,137 | ||||||
| City of New York, GO | ||||||||
| Series C, 4.00%, 08/01/37 | 4,000 | 4,106,216 | ||||||
| Series F-1, 4.00%, 08/01/41 | 4,355 | 4,414,245 | ||||||
| Erie Tobacco Asset Securitization Corp., Refunding RB, Series A, 5.00%, 06/01/45 | 4,435 | 4,434,570 | ||||||
| Monroe County Industrial Development Corp., Refunding RB, 4.00%, 12/01/46 | 1,400 | 1,296,271 | ||||||
| New York City Transitional Finance Authority Future Tax Secured Revenue, RB, Series F-1, Subordinate, 5.00%, 02/01/47 | 990 | 1,109,835 | ||||||
| New York Counties Tobacco Trust IV, Refunding RB | ||||||||
| Series A, 5.00%, 06/01/38 | 3,640 | 3,640,087 | ||||||
Series A, 6.25%, 06/01/41 (b) | 3,300 | 3,313,890 | ||||||
| New York Liberty Development Corp., Refunding RB | ||||||||
| Series 1, 4.00%, 02/15/43 | 4,250 | 4,236,511 | ||||||
Series 2, Class 2, 5.15%, 11/15/34 (b) | 460 | 467,429 | ||||||
Series 2, Class 2, 5.38%, 11/15/40 (b) | 1,145 | 1,167,527 | ||||||
| Series A, 3.00%, 11/15/51 | 415 | 322,802 | ||||||
| New York State Dormitory Authority, Refunding RB | ||||||||
| Series A, 4.00%, 03/15/41 | 3,750 | 3,792,281 | ||||||
| Series A, 4.00%, 03/15/46 | 1,800 | 1,818,567 | ||||||
| Series A, 4.00%, 03/15/47 | 5,700 | 5,736,537 | ||||||
| New York State Thruway Authority, RB, 4.13%, | ||||||||
| 03/15/56 | 3,325 | 3,332,591 | ||||||
| New York Transportation Development Corp., RB | ||||||||
| AMT, 5.00%, 10/01/35 | 665 | 690,682 | ||||||
| AMT, 5.00%, 10/01/40 | 1,875 | 1,927,879 | ||||||
| AMT, 4.00%, 04/30/53 | 1,175 | 1,024,154 | ||||||
| New York Transportation Development Corp., Refunding RB, Series A, Class A, AMT, 4.00%, 12/01/39 | 500 | 478,032 | ||||||
| TSASC, Inc., Refunding RB, Series A, 5.00%, 06/01/41 | 1,785 | 1,874,994 | ||||||
| Westchester Tobacco Asset Securitization Corp., Refunding RB, Sub-Series C, 5.13%, 06/01/51 | 2,740 | 2,772,269 | ||||||
| 54,243,506 | ||||||||
North Carolina — 2.4% | ||||||||
| North Carolina Medical Care Commission, RB | ||||||||
| Series A, 4.00%, 10/01/50 | 365 | 321,556 | ||||||
| Series A, 5.00%, 10/01/50 | 980 | 1,023,320 | ||||||
| North Carolina Turnpike Authority, RB, Senior Lien, (AGM), 4.00%, 01/01/55 | 1,045 | 1,040,487 | ||||||
| University of North Carolina at Chapel Hill, RB, 5.00%, 02/01/49 | 525 | 644,160 | ||||||
University of North Carolina at Chapel Hill, Refunding RB, Series A, 2.18%, 12/01/41 (a) | 9,935 | 10,028,409 | ||||||
| 13,057,932 | ||||||||
| 36 | 2 0 2 2 BL A C K RO C K AN N U A L RE P O R T T O SH A R E H O L D E R S |
Schedule of Investments (continued) July 31, 2022 | BlackRock MuniVest Fund, Inc. (MVF) (Percentages shown are based on Net Assets) |
Security | Par (000) | Value | ||||||
North Dakota — 0.2% | ||||||||
| University of North Dakota, COP, Series A, (AGM), 4.00%, 06/01/46 | $ | 990 | $ | 1,005,639 | ||||
Ohio — 4.5% | ||||||||
| Allen County Port Authority, Refunding RB, Series A, 4.00%, 12/01/40 | 950 | 879,550 | ||||||
| Buckeye Tobacco Settlement Financing Authority, Refunding RB, Series B-2, Class 2, 5.00%, 06/01/55 | 7,470 | 7,443,108 | ||||||
| Cleveland-Cuyahoga County Port Authority, RB | ||||||||
| 4.00%, 07/01/46 | 490 | 496,771 | ||||||
| 4.00%, 07/01/51 | 425 | 426,754 | ||||||
County of Montgomery Ohio, RB, Catholic Health Services, 5.45%, 10/01/38 (c) | 7,430 | 7,776,907 | ||||||
Ohio Air Quality Development Authority, RB, AMT, 5.00%, 07/01/49 (b) | 585 | 576,459 | ||||||
| Ohio Air Quality Development Authority, Refunding RB, 3.25%, 09/01/29 | 2,500 | 2,366,820 | ||||||
| State of Ohio, Refunding RB, Series A, 4.00%, 01/15/50 | 4,420 | 4,345,094 | ||||||
| 24,311,463 | ||||||||
Oklahoma — 0.4% | ||||||||
| Oklahoma Development Finance Authority, RB, Series B, 5.25%, 08/15/48 | 2,205 | 2,055,523 | ||||||
Oregon — 1.0% | ||||||||
| Oregon Health & Science University, RB, Series A, 5.00%, 07/01/42 | 800 | 865,754 | ||||||
| Port of Portland Oregon Airport Revenue, Refunding ARB, Series 27-A, AMT, 4.00%, 07/01/50 | 5,000 | 4,799,045 | ||||||
| 5,664,799 | ||||||||
Pennsylvania — 14.1% | ||||||||
Allegheny County Hospital Development Authority, RB, 2.03%, 11/15/47 (a) | 2,600 | 2,623,657 | ||||||
Allentown Neighborhood Improvement Zone Development Authority, RB, 5.00%, 05/01/42 (b) | 1,725 | 1,768,615 | ||||||
| City of Philadelphia Pennsylvania Water & Wastewater Revenue, RB, Series B, 5.00%, 11/01/49 | 6,030 | 6,628,556 | ||||||
| Geisinger Authority, Refunding RB, 4.00%, 04/01/39 | 4,260 | 4,251,587 | ||||||
| Hospitals & Higher Education Facilities Authority of Philadelphia, Refunding RB, (AGM), 4.00%, 07/01/40 | 2,360 | 2,383,848 | ||||||
| Montgomery County Higher Education and Health Authority, Refunding RB | ||||||||
| 4.00%, 09/01/49 | 6,750 | 6,749,433 | ||||||
| 5.00%, 05/01/57 | 6,310 | 6,890,589 | ||||||
| Series A, 5.00%, 09/01/48 | 3,330 | 3,566,597 | ||||||
| Montgomery County Industrial Development Authority, Refunding RB, 5.25%, 01/01/40 | 4,170 | 4,220,482 | ||||||
| Northampton County General Purpose Authority, Refunding RB, 4.00%, 11/01/38 | 1,855 | 1,895,893 | ||||||
| Pennsylvania Economic Development Financing Authority, RB, AMT, 5.00%, 12/31/38 | 2,565 | 2,656,873 | ||||||
| Pennsylvania Housing Finance Agency, RB, S/F Housing | ||||||||
| Series 137, 2.45%, 10/01/41 | 410 | 324,115 | ||||||
| Series 125B, AMT, 3.65%, 10/01/42 | 7,000 | 6,570,942 | ||||||
| Pennsylvania Turnpike Commission, RB | ||||||||
| Series A-1, 5.00%, 12/01/41 | 440 | 469,199 | ||||||
| Sub-Series B-1, 5.25%, 06/01/47 | 5,680 | 6,025,242 | ||||||
| Series A, Subordinate, 5.00%, 12/01/39 | 1,670 | 1,815,515 | ||||||
Security | Par (000) | Value | ||||||
Pennsylvania (continued) | ||||||||
| Pennsylvania Turnpike Commission, RB (continued) | ||||||||
| Series A, Subordinate, 5.00%, 12/01/44 | $ | 2,870 | $ | 3,082,948 | ||||
| Pennsylvania Turnpike Commission, Refunding RB, 2nd Series, 5.00%, 12/01/41 | 1,700 | 1,848,170 | ||||||
| Pittsburgh School District, GO, (SAW), 3.00%, 09/01/41 | 2,315 | 1,996,734 | ||||||
| Springfield School District/Delaware County, GO | ||||||||
| (SAW), 5.00%, 03/01/40 | 2,955 | 3,313,781 | ||||||
| (SAW), 5.00%, 03/01/43 | 2,145 | 2,384,249 | ||||||
| Westmoreland County Municipal Authority, Refunding RB, (BAM), 5.00%, 08/15/36 | 4,385 | 4,852,507 | ||||||
| 76,319,532 | ||||||||
Puerto Rico — 5.0% | ||||||||
| Children’s Trust Fund, Refunding RB | ||||||||
| 5.50%, 05/15/39 | 1,340 | 1,359,344 | ||||||
| 5.63%, 05/15/43 | 1,335 | 1,356,763 | ||||||
| Puerto Rico Sales Tax Financing Corp. Sales Tax Revenue, RB | ||||||||
| Series A-1, Restructured, 4.75%, 07/01/53 | 3,376 | 3,363,377 | ||||||
| Series A-1, Restructured, 5.00%, 07/01/58 | 12,657 | 12,747,916 | ||||||
| Series A-2, Restructured, 4.33%, 07/01/40 | 2,240 | 2,217,522 | ||||||
| Series A-2, Restructured, 4.78%, 07/01/58 | 3,133 | 3,124,322 | ||||||
Puerto Rico Sales Tax Financing Corp. Sales Tax Revenue, RB, CAB, Series A-1, Restructured, 0.00%, 07/01/46 (d) | 10,130 | 2,927,398 | ||||||
| 27,096,642 | ||||||||
Rhode Island — 1.5% | ||||||||
| Rhode Island Turnpike & Bridge Authority, RB, Series A, 3.00%, 10/01/39 | 240 | 213,302 | ||||||
| Tobacco Settlement Financing Corp., Refunding RB | ||||||||
| Series B, 4.50%, 06/01/45 | 5,920 | 5,927,069 | ||||||
| Series B, 5.00%, 06/01/50 | 2,000 | 2,042,366 | ||||||
| 8,182,737 | ||||||||
South Carolina — 1.8% | ||||||||
| South Carolina Jobs-Economic Development Authority, Refunding RB, Series A, 5.00%, 05/01/43 | 2,690 | 2,860,648 | ||||||
| South Carolina Public Service Authority, Refunding RB, Series E, 5.25%, 12/01/55 | 6,450 | 6,731,162 | ||||||
| 9,591,810 | ||||||||
Texas — 6.3% | ||||||||
| City of Houston Texas Airport System Revenue, Refunding RB | ||||||||
| Sub-Series D, 5.00%, 07/01/37 | 4,005 | 4,468,310 | ||||||
| AMT, 5.00%, 07/01/29 | 2,135 | 2,161,395 | ||||||
| County of Nueces Texas, Refunding GO | ||||||||
| 4.00%, 02/15/37 | 575 | 593,641 | ||||||
| 4.00%, 02/15/39 | 1,205 | 1,233,268 | ||||||
Harris County Cultural Education Facilities Finance Corp., RB, Series B, 7.00%, 01/01/43 (c) | 850 | 870,033 | ||||||
| North Texas Tollway Authority, Refunding RB | ||||||||
| Series A, 5.00%, 01/01/38 | 5,000 | 5,335,220 | ||||||
| Series A, 5.00%, 01/01/48 | 5,350 | 5,723,735 | ||||||
| Tarrant County Cultural Education Facilities Finance Corp., Refunding RB, Series A-1, 5.00%, 10/01/44 | 3,500 | 3,585,379 | ||||||
| Texas Municipal Gas Acquisition & Supply Corp. III, Refunding RB 5.00%, 12/15/29 | 2,260 | 2,485,781 | ||||||
S C H E D U L E O F IN V E S T M E N T S | 37 |
Schedule of Investments (continued) July 31, 2022 | BlackRock MuniVest Fund, Inc. (MVF) (Percentages shown are based on Net Assets) |
Security | Par (000) | Value | ||||||
Texas (continued) | ||||||||
| Texas Municipal Gas Acquisition & Supply Corp. III, Refunding RB (continued) | ||||||||
| 5.00%, 12/15/31 | $ | 3,480 | $ | 3,843,041 | ||||
| Texas Private Activity Bond Surface Transportation Corp., RB, AMT, 5.00%, 06/30/58 | 3,575 | 3,665,655 | ||||||
| 33,965,458 | ||||||||
Virginia — 2.4% | ||||||||
| Ballston Quarter Community Development Authority, TA | ||||||||
| Series A, 5.38%, 03/01/36 | 430 | 357,893 | ||||||
| Series A, 5.50%, 03/01/46 | 1,475 | 1,109,906 | ||||||
| Tobacco Settlement Financing Corp., Refunding RB, Series B-1, 5.00%, 06/01/47 | 3,665 | 3,600,390 | ||||||
| Virginia Small Business Financing Authority, RB, AMT, 5.00%, 12/31/52 | 7,895 | 8,155,227 | ||||||
| 13,223,416 | ||||||||
Washington — 4.4% | ||||||||
Central Puget Sound Regional Transit Authority, RB, Series 2015, 1.53%, 11/01/45 (a) | 6,000 | 5,817,840 | ||||||
| Port of Seattle Washington, ARB | ||||||||
| Series A, AMT, 5.00%, 05/01/43 | 1,295 | 1,357,668 | ||||||
| Series C, AMT, Intermediate Lien, 5.00%, 05/01/37 | 4,905 | 5,289,513 | ||||||
| State of Washington, COP | ||||||||
| Series B, 5.00%, 07/01/36 | 1,725 | 1,943,618 | ||||||
| Series B, 5.00%, 07/01/38 | 2,300 | 2,570,609 | ||||||
Washington Health Care Facilities Authority, RB, Series A, Catholic Health Services, 5.75%, 01/01/23 (c) | 4,010 | 4,086,430 | ||||||
| Washington Health Care Facilities Authority, Refunding RB, 4.00%, 09/01/45 | 3,000 | 3,036,348 | ||||||
| 24,102,026 | ||||||||
Wisconsin — 2.4% | ||||||||
| Public Finance Authority, RB | ||||||||
Series A, 5.00%, 06/01/36 (b) | 200 | 201,047 | ||||||
| Series A, 4.00%, 11/15/37 | 325 | 316,746 | ||||||
| Series A, 5.00%, 11/15/41 | 2,180 | 2,340,775 | ||||||
Series A, 5.00%, 06/01/51 (b) | 680 | 656,792 | ||||||
Series A, 5.00%, 06/01/61 (b) | 870 | 825,468 | ||||||
| Public Finance Authority, Refunding RB, Series A, 5.00%, 11/15/49 | 1,095 | 1,134,968 | ||||||
State of Wisconsin, GO, Series A, 1.75%, 05/01/25 (a) | 3,000 | 3,049,944 | ||||||
| Wisconsin Health & Educational Facilities Authority, Refunding RB, 5.00%, 04/01/44 | 4,080 | 4,495,230 | ||||||
| 13,020,970 | ||||||||
Wyoming — 0.4% | ||||||||
| Wyoming Community Development Authority, Refunding RB, Series 2, AMT, 4.05%, 12/01/38 | 2,170 | 2,182,898 | ||||||
Total Municipal Bonds — 125.0% (Cost: $679,997,314) | 678,304,774 | |||||||
Municipal Bonds Transferred to Tender Option Bond Trusts (e) | ||||||||
Arizona — 1.8% | ||||||||
| Maricopa County Industrial Development Authority, RB, Series 2017D, 4.00%, 01/01/48 | 10,000 | 9,910,335 | ||||||
Security | Par (000) | Value | ||||||
California — 3.0% | ||||||||
| Sacramento Area Flood Control Agency, Refunding SAB, 5.00%, 10/01/47 | $ | 14,998 | $ | 16,174,140 | ||||
Colorado (f) — 1.9% | ||||||||
| City & County of Denver Colorado Airport System Revenue, Refunding ARB, Series A, AMT, 5.25%, 12/01/43 | 6,504 | 7,069,121 | ||||||
| Colorado Health Facilities Authority, Refunding RB, Series A, 4.00%, 08/01/49 | 3,290 | 3,186,113 | ||||||
| 10,255,234 | ||||||||
Illinois — 2.2% | ||||||||
| Illinois State Toll Highway Authority, RB, Series B, 5.00%, 01/01/40 | 10,976 | 11,841,828 | ||||||
Louisiana — 3.1% | ||||||||
| City of Shreveport Louisiana Water & Sewer Revenue, RB | ||||||||
| Series B, Junior Lien, (AGM), 4.00%, 12/01/44 | 5,542 | 5,625,606 | ||||||
| Series B, Junior Lien, (AGM), 4.00%, 12/01/49 | 11,133 | 11,301,630 | ||||||
| 16,927,236 | ||||||||
Maryland — 2.1% | ||||||||
| City of Baltimore Maryland, RB, Series A, 5.00%, 07/01/46 | 4,898 | 5,125,611 | ||||||
| Maryland Stadium Authority, RB, (NPFGC), 5.00%, 05/01/47 | 5,509 | 6,161,823 | ||||||
| 11,287,434 | ||||||||
Michigan (f) — 2.6% | ||||||||
| Michigan Finance Authority, RB | ||||||||
| 4.00%, 02/15/47 | 7,434 | 7,396,701 | ||||||
| Series A, 4.00%, 02/15/44 | 6,646 | 6,612,540 | ||||||
| 14,009,241 | ||||||||
New Jersey — 2.4% | ||||||||
| South Jersey Transportation Authority, RB, Series A, (BAM-TCRS), 4.00%, 11/01/50 | 13,590 | 13,098,640 | ||||||
New York — 1.9% | ||||||||
| New York State Dormitory Authority, Refunding RB, Series A, 4.00%, 03/15/46 | 10,000 | 10,103,155 | ||||||
Oregon — 0.1% | ||||||||
| State of Oregon Housing & Community Services Department, RB, M/F Housing, Series A, AMT, 4.95%, 07/01/30 | 600 | 600,470 | ||||||
Pennsylvania — 3.9% | ||||||||
Commonwealth of Pennsylvania, GO, 1st Series, 4.00%, 03/01/38 (f) | 7,250 | 7,503,018 | ||||||
County of Lehigh Pennsylvania, Refunding RB, Series A, 4.00%, 07/01/49 (f) | 10,007 | 9,661,902 | ||||||
| Westmoreland County Municipal Authority, Refunding RB, (BAM), 5.00%, 08/15/38 | 3,925 | 4,212,260 | ||||||
| 21,377,180 | ||||||||
Texas — 3.7% | ||||||||
Harris County Health Facilities Development Corp., Refunding RB, Series B, 5.75%, 07/01/27 (g) | 17,655 | 19,820,039 | ||||||
| 38 | 2 0 2 2 BL A C K RO C K AN N U A L RE P O R T T O SH A R E H O L D E R S |
Schedule of Investments (continued) July 31, 2022 | BlackRock MuniVest Fund, Inc. (MVF) (Percentages shown are based on Net Assets) |
Security | Par (000) | Value | ||||||
Virginia — 1.4% | ||||||||
Fairfax County Economic Development Authority, RB, 5.00%, 04/01/47 (f) | $ | 6,960 | $ | 7,501,210 | ||||
Washington — 2.0% | ||||||||
| Washington Health Care Facilities Authority, Refunding RB, Series A, 5.00%, 10/01/38 | 10,000 | 11,070,530 | ||||||
Total Municipal Bonds Transferred to Tender Option Bond Trusts — 32.1% | ||||||||
(Cost: $177,554,960) | 173,976,672 | |||||||
Total Long-Term Investments — 157.1% (Cost: $857,552,274) | 852,281,446 | |||||||
Shares | ||||||||
Short-Term Securities | ||||||||
Money Market Funds — 1.7% | ||||||||
BlackRock Liquidity Funds, MuniCash, Institutional Class, 0.96% (h)(i) | 9,000,303 | 9,003,003 | ||||||
Total Short-Term Securities — 1.7% (Cost: $9,001,566) | 9,003,003 | |||||||
Total Investments — 158.8% (Cost: $866,553,840) | 861,284,449 | |||||||
Other Assets Less Liabilities — 3.4% | 19,058,025 | |||||||
Liability for TOB Trust Certificates, Including Interest Expense and Fees Payable — (17.3)% | (94,072,042 | ) | ||||||
VMTP Shares at Liquidation Value, Net of Deferred Offering Costs — (44.9)% | (243,800,000 | ) | ||||||
Net Assets Applicable to Common Shares — 100.0% | $ | 542,470,432 | ||||||
| (a) | Variable rate security. Interest rate resets periodically. The rate shown is the effective interest rate as of period end. Security description also includes the reference rate and spread if published and available. |
| (b) | Security exempt from registration pursuant to Rule 144A under the Securities Act of 1933, as amended. These securities may be resold in transactions exempt from registration to qualified institutional investors. |
| (c) | U.S. Government securities held in escrow, are used to pay interest on this security as well as to retire the bond in full at the date indicated, typically at a premium to par. |
| (d) | Zero-coupon bond. |
| (e) | Represent bonds transferred to a TOB Trust in exchange of cash and residual certificates received by the Trust. These bonds serve as collateral in a secured borrowing. See Note 4 of the Notes to Financial Statements for details. |
| (f) | All or a portion of the security is subject to a recourse agreement. The aggregate maximum potential amount the Trust could ultimately be required to pay under the agreements, which expire between October 1, 2024 to August 1, 2027, is $26,782,302. See Note 4 of the Notes to Financial Statements for details. |
| (g) | Security is collateralized by municipal bonds or U.S. Treasury obligations. |
| (h) | Affiliate of the Trust. |
| (i) | Annualized 7-day yield as of period end. |
Affiliated Issuer | Value at 08/31/21 | Purchases at Cost | Proceeds from Sales | Net Realized Gain (Loss) | Change in Unrealized Appreciation (Depreciation) | Value at 07/31/22 | Shares Held at 07/31/22 | Income | Capital Gain Distributions from Underlying Funds | |||||||||||||||||||||||||||
| BlackRock Liquidity Funds, MuniCash, Institutional Class | $ | 977,136 | $ | 8,019,694 | (a) | $ | — | $ | 4,887 | $ | 1,286 | $ | 9,003,003 | 9,000,303 | $ | 26,600 | $ | — | ||||||||||||||||||
| (a) | Represents net amount purchased (sold). |
Description | Number of Contracts | Expiration Date | Notional Amount (000) | Value/ Unrealized Appreciation (Depreciation) | ||||||||||||
| Short Contracts | ||||||||||||||||
| 10-Year U.S. Treasury Note | 189 | 09/21/22 | $ | 22,875 | $ | (354,983 | ) | |||||||||
| U.S. Long Bond | 210 | 09/21/22 | 30,102 | (670,524 | ) | |||||||||||
| 5-Year U.S. Treasury Note | 179 | 09/30/22 | 20,360 | (231,184 | ) | |||||||||||
| $ | (1,256,691 | ) | ||||||||||||||
S C H E D U L E O F IN V E S T M E N T S | 39 |
Schedule of Investments (continued) July 31, 2022 | BlackRock MuniVest Fund, Inc. (MVF) |
Commodity Contracts | Credit Contracts | Equity Contracts | Foreign Currency Exchange Contracts | Interest Rate Contracts | Other Contracts | Total | ||||||||||||||||||||||
Liabilities — Derivative Financial Instruments | ||||||||||||||||||||||||||||
| Futures contracts | ||||||||||||||||||||||||||||
Unrealized depreciation on futures contracts (a) | $ | — | $ | — | $ | — | $ | — | $ | 1,256,691 | $ | — | $ | 1,256,691 | ||||||||||||||
| (a) | Net cumulative unrealized appreciation (depreciation) on futures contracts and centrally cleared swaps, if any, are reported in the Schedule of Investments. In the Statements of Assets and Liabilities, only current day’s variation margin is reported in receivables or payables and the net cumulative unrealized appreciation (depreciation) is included in accumulated earnings (loss). |
Commodity Contracts | Credit Contracts | Equity Contracts | Foreign Currency Exchange Contracts | Interest Rate Contracts | Other Contracts | Total | ||||||||||||||||||||||
Net Realized Gain (Loss) from: | ||||||||||||||||||||||||||||
| Futures contracts | $ | — | $ | — | $ | — | $ | — | $ | 1,467,513 | $ | — | $ | 1,467,513 | ||||||||||||||
Net Change in Unrealized Appreciation (Depreciation) on: | ||||||||||||||||||||||||||||
| Futures contracts | $ | — | $ | — | $ | — | $ | — | $ | (1,161,349 | ) | $ | — | $ | (1,161,349 | ) | ||||||||||||
| Futures contracts: | ||||
| Average notional value of contracts — short | $ | 48,363,883 |
Level 1 | Level 2 | Level 3 | Total | |||||||||||||
| Assets | ||||||||||||||||
| Investments | ||||||||||||||||
| Long-Term Investments | ||||||||||||||||
| Municipal Bonds | $ | — | $ | 678,304,774 | $ | — | $ | 678,304,774 | ||||||||
| Municipal Bonds Transferred to Tender Option Bond Trusts | — | 173,976,672 | — | 173,976,672 | ||||||||||||
| Short-Term Securities | ||||||||||||||||
| Money Market Funds | 9,003,003 | — | — | 9,003,003 | ||||||||||||
| $ | 9,003,003 | $ | 852,281,446 | $ | — | $ | 861,284,449 | |||||||||
Derivative Financial Instruments (a) | ||||||||||||||||
| Liabilities | ||||||||||||||||
| Interest Rate Contracts | $ | (1,256,691 | ) | $ | — | $ | — | $ | (1,256,691 | ) | ||||||
| (a) | Derivative financial instruments are futures contracts. Futures contracts are valued at the unrealized appreciation (depreciation) on the instrument. |
| 40 | 2 0 2 2 BL A C K RO C K AN N U A L RE P O R T T O SH A R E H O L D E R S |
Schedule of Investments (continued) July 31, 2022 | BlackRock MuniVest Fund, Inc. (MVF) |
Level 1 | Level 2 | Level 3 | Total | |||||||||||||
| Liabilities | ||||||||||||||||
| TOB Trust Certificates | $ | — | $ | (93,901,857 | ) | $ | — | $ | (93,901,857 | ) | ||||||
| VMTP Shares at Liquidation Value | — | (243,800,000 | ) | — | (243,800,000 | ) | ||||||||||
| $ | — | $ | (337,701,857 | ) | $ | — | $ | (337,701,857 | ) | |||||||
S C H E D U L E O F IN V E S T M E N T S | 41 |
Statements of Assets and Liabilities July 31, 2022 |
| BYM | BLE | MVF | ||||||||||
ASSETS | ||||||||||||
Investments, at value — unaffiliated (a) | $ | 574,217,689 | $ | 1,031,925,619 | $ | 852,281,446 | ||||||
Investments, at value — affiliated (b) | — | 2,826,073 | 9,003,003 | |||||||||
| Cash pledged for futures contracts | 612,000 | 2,369,000 | 1,403,000 | |||||||||
| Receivables: | ||||||||||||
| Investments sold | 5,602,270 | 16,490 | 20,094,047 | |||||||||
| TOB Trust | 3,479,008 | 2,624,962 | — | |||||||||
| Dividends — affiliated | 1,493 | 3,501 | 10,255 | |||||||||
| Interest — unaffiliated | 4,596,085 | 10,281,361 | 7,610,048 | |||||||||
| Deferred offering costs | — | 114,854 | — | |||||||||
| Prepaid expenses | 28,220 | 20,635 | 20,940 | |||||||||
| Total assets | 588,536,765 | 1,050,182,495 | 890,422,739 | |||||||||
ACCRUED LIABILITIES | ||||||||||||
| Bank overdraft | 557,420 | 18,830 | 15,353 | |||||||||
| Payables: | ||||||||||||
| Investments purchased | 1,246,724 | 14,026,736 | 6,788,509 | |||||||||
| Accounting services fees | 46,031 | 46,029 | 89,519 | |||||||||
| Custodian fees | 4,574 | 8,223 | 7,218 | |||||||||
| Income dividend distributions — Common Shares | 1,532,086 | 2,540,546 | 2,172,018 | |||||||||
| Interest expense and fees | 152,373 | 231,543 | 170,185 | |||||||||
| Investment advisory fees | 516,942 | 862,511 | 710,275 | |||||||||
| Offering costs | — | 10,764 | — | |||||||||
| Trustees’ and Officer’s fees | 60,092 | 96,754 | 121,819 | |||||||||
| Other accrued expenses | 13,552 | 74,260 | 12,084 | |||||||||
| Professional fees | 66,237 | 96,145 | 70,673 | |||||||||
| Transfer agent fees | 24,388 | 36,490 | 40,363 | |||||||||
| Variation margin on futures contracts | 22,229 | 39,651 | 52,434 | |||||||||
| Total accrued liabilities | 4,242,648 | 18,088,482 | 10,250,450 | |||||||||
OTHER LIABILITIES | ||||||||||||
| TOB Trust Certificates | 88,932,869 | 113,751,753 | 93,901,857 | |||||||||
VMTP Shares, at liquidation value of $100,000 per share, net of deferred offering costs (c)(d)(e) | 137,200,000 | 302,700,000 | 243,800,000 | |||||||||
| Total other liabilities | 226,132,869 | 416,451,753 | 337,701,857 | |||||||||
| Total liabilities | 230,375,517 | 434,540,235 | 347,952,307 | |||||||||
| NET ASSETS APPLICABLE TO COMMON SHAREHOLDERS | $ | 358,161,248 | $ | 615,642,260 | $ | 542,470,432 | ||||||
NET ASSETS APPLICABLE TO COMMON SHAREHOLDERS CONSIST OF | ||||||||||||
Paid-in capital (f)(g)(h) | $ | 362,939,577 | $ | 669,290,945 | $ | 577,197,773 | ||||||
| Accumulated loss | (4,778,329 | ) | (53,648,685 | ) | (34,727,341 | ) | ||||||
| NET ASSETS APPLICABLE TO COMMON SHAREHOLDERS | $ | 358,161,248 | $ | 615,642,260 | $ | 542,470,432 | ||||||
| Net asset value per Common Share | $ | 13.56 | $ | 12.60 | $ | 8.37 | ||||||
(a) Investments, at cost — unaffiliated | $ | 559,814,630 | $ | 1,048,564,855 | $ | 857,552,274 | ||||||
(b) Investments, at cost — affiliated | $ | — | $ | 2,825,440 | $ | 9,001,566 | ||||||
(c) Preferred Shares outstanding | 1,372 | 3,027 | 2,438 | |||||||||
(d) Preferred Shares authorized | Unlimited | Unlimited | 10,000,000 | |||||||||
(e) Par value per Preferred Share | $ | 0.001 | $ | 0.001 | $ | 0.10 | ||||||
(f) Common Shares outstanding | 26,415,271 | 48,856,664 | 64,836,371 | |||||||||
(g) Common Shares authorized | Unlimited | Unlimited | 150,000,000 | |||||||||
(h) Par value per Common Share | $ | 0.001 | $ | 0.001 | $ | 0.10 | ||||||
| 42 | 2 0 2 2 BL A C K RO C K AN N U A L RE P O R T T O SH A R E H O L D E R S |
| BYM | BLE | |||||||||||||||
Period from 09/01/21 to 07/31/22 | Year Ended 08/31/21 | Period from 09/01/21 to 07/31/22 | Year Ended 08/31/21 | |||||||||||||
INVESTMENT INCOME | ||||||||||||||||
| Dividends — affiliated | $ | 10,023 | $ | 765 | $ | 9,846 | $ | 983 | ||||||||
| Interest — unaffiliated | 21,295,424 | 24,677,008 | 38,540,889 | 30,736,544 | ||||||||||||
| Total investment income | 21,305,447 | 24,677,773 | 38,550,735 | 30,737,527 | ||||||||||||
| EXPENSES | ||||||||||||||||
| Investment advisory | 3,147,703 | 3,707,439 | 5,596,205 | 4,521,408 | ||||||||||||
| Accounting services | 62,982 | 68,555 | 51,979 | 78,877 | ||||||||||||
| Transfer agent | 29,121 | 40,800 | 18,048 | 49,124 | ||||||||||||
| Trustees and Officer | 16,774 | 42,803 | 29,059 | 50,311 | ||||||||||||
| Registration | 8,084 | 9,053 | 21,794 | 8,419 | ||||||||||||
| Custodian | 5,977 | 6,413 | 11,016 | 360 | ||||||||||||
| Reorganization costs | — | — | — | 188,460 | ||||||||||||
| Miscellaneous | 148,982 | 145,603 | 110,648 | 287,722 | ||||||||||||
| Total expenses excluding interest expense, fees and amortization of offering costs | 3,419,623 | 4,020,666 | 5,838,749 | 5,184,681 | ||||||||||||
Interest expense, fees and amortization of offering costs (a) | 2,519,989 | 2,219,028 | 4,905,469 | 2,861,749 | ||||||||||||
| Total expenses | 5,939,612 | 6,239,694 | 10,744,218 | 8,046,430 | ||||||||||||
| Less: | ||||||||||||||||
| Fees waived and/or reimbursed by the Manager | (3,650 | ) | (4,040 | ) | (2,916 | ) | (154,693 | ) | ||||||||
| Total expenses after fees waived and/or reimbursed | 5,935,962 | 6,235,654 | 10,741,302 | 7,891,737 | ||||||||||||
| Net investment income | 15,369,485 | 18,442,119 | 27,809,433 | 22,845,790 | ||||||||||||
REALIZED AND UNREALIZED GAIN (LOSS) | ||||||||||||||||
| Net realized gain (loss) from: | ||||||||||||||||
| Investments — unaffiliated | (6,535,533 | ) | 58,511 | (12,006,729 | ) | 1,160,136 | ||||||||||
| Investments — affiliated | (2,133 | ) | (225 | ) | (295 | ) | 523 | |||||||||
| Futures contracts | 982,081 | 1,071,784 | 10,696,611 | (2,246,093 | ) | |||||||||||
| (5,555,585 | ) | 1,130,070 | (1,310,413 | ) | (1,085,434 | ) | ||||||||||
| Net change in unrealized appreciation (depreciation) on: | ||||||||||||||||
| Investments — unaffiliated | (55,779,533 | ) | 8,576,553 | (118,403,231 | ) | 15,397,784 | ||||||||||
| Investments — affiliated | (170 | ) | 170 | 633 | (431 | ) | ||||||||||
| Futures contracts | (335,059 | ) | (1,812 | ) | (3,155,422 | ) | (341,208 | ) | ||||||||
| (56,114,762 | ) | 8,574,911 | (121,558,020 | ) | 15,056,145 | |||||||||||
| Net realized and unrealized gain (loss) | (61,670,347 | ) | 9,704,981 | (122,868,433 | ) | 13,970,711 | ||||||||||
| NET INCREASE (DECREASE) IN NET ASSETS APPLICABLE TO COMMON SHAREHOLDERS RESULTING FROM OPERATIONS | $ | (46,300,862 | ) | $ | 28,147,100 | $ | (95,059,000 | ) | $ | 36,816,501 | ||||||
| (a) | Related to TOB Trusts and/or VMTP Shares. |
F I N A N C I A L ST A T E M E N T S | 43 |
| MVF | ||||||||
Period from 09/01/21 to 07/31/22 | Year Ended 08/31/21 | |||||||
INVESTMENT INCOME | ||||||||
| Dividends — affiliated | $ | 26,600 | $ | 1,731 | ||||
| Interest — unaffiliated | 31,368,399 | 35,332,958 | ||||||
| Total investment income | 31,394,999 | 35,334,689 | ||||||
| EXPENSES | ||||||||
| Investment advisory | 4,330,110 | 4,945,029 | ||||||
| Accounting services | 128,891 | 125,896 | ||||||
| Transfer agent | 45,197 | 57,892 | ||||||
| Trustees and Officer | 22,853 | 70,172 | ||||||
| Registration | 19,846 | 22,284 | ||||||
| Custodian | 10,411 | 8,545 | ||||||
| Miscellaneous | 163,918 | 172,184 | ||||||
| Total expenses excluding interest expense, fees and amortization of offering costs | 4,721,226 | 5,402,002 | ||||||
Interest expense, fees and amortization of offering costs (a) | 3,879,813 | 3,200,012 | ||||||
| Total expenses | 8,601,039 | 8,602,014 | ||||||
| Less: | ||||||||
| Fees waived and/or reimbursed by the Manager | (5,155 | ) | (10,478 | ) | ||||
| Total expenses after fees waived and/or reimbursed | 8,595,884 | 8,591,536 | ||||||
| Net investment income | 22,799,115 | 26,743,153 | ||||||
REALIZED AND UNREALIZED GAIN (LOSS) | ||||||||
| Net realized gain (loss) from: | ||||||||
| Investments — unaffiliated | (9,162,516 | ) | 1,309,050 | |||||
| Investments — affiliated | 4,887 | (1,627 | ) | |||||
| Futures contracts | 1,467,513 | 936,356 | ||||||
| (7,690,116 | ) | 2,243,779 | ||||||
| Net change in unrealized appreciation (depreciation) on: | ||||||||
| Investments — unaffiliated | (101,328,069 | ) | 28,178,258 | |||||
| Investments — affiliated | 1,286 | (430 | ) | |||||
| Futures contracts | (1,161,349 | ) | (95,342 | ) | ||||
| (102,488,132 | ) | 28,082,486 | ||||||
| Net realized and unrealized gain (loss) | (110,178,248 | ) | 30,326,265 | |||||
| NET INCREASE (DECREASE) IN NET ASSETS APPLICABLE TO COMMON SHAREHOLDERS RESULTING FROM OPERATIONS | $ | (87,379,133 | ) | $ | 57,069,418 | |||
| (a) | Related to TOB Trusts and/or VMTP Shares. |
| 44 | 2 0 2 2 BL A C K RO C K AN N U A L RE P O R T T O SH A R E H O L D E R S |
| BYM | BLE | |||||||||||||||||||||||
Period from 09/01/21 to 07/31/22 | Year Ended August 31, | Period from 09/01/21 to 07/31/22 | Year Ended August 31, | |||||||||||||||||||||
| 2021 | 2020 | 2021 | 2020 | |||||||||||||||||||||
INCREASE (DECREASE) IN NET ASSETS APPLICABLE TO COMMON SHAREHOLDERS | ||||||||||||||||||||||||
OPERATIONS | ||||||||||||||||||||||||
| Net investment income | $ | 15,369,485 | $ | 18,442,119 | $ | 17,439,536 | $ | 27,809,433 | $ | 22,845,790 | $ | 17,130,420 | ||||||||||||
| Net realized gain (loss) | (5,555,585 | ) | 1,130,070 | (3,971,202 | ) | (1,310,413 | ) | (1,085,434 | ) | (1,790,228 | ) | |||||||||||||
| Net change in unrealized appreciation (depreciation) | (56,114,762 | ) | 8,574,911 | (2,247,404 | ) | (121,558,020 | ) | 15,056,145 | (7,435,630 | ) | ||||||||||||||
| Net increase (decrease) in net assets applicable to Common Shareholders resulting from operations | (46,300,862 | ) | 28,147,100 | 11,220,930 | (95,059,000 | ) | 36,816,501 | 7,904,562 | ||||||||||||||||
DISTRIBUTIONS TO COMMON SHAREHOLDERS (a) | ||||||||||||||||||||||||
| Decrease in net assets resulting from distributions to Common Shareholders | (16,852,955 | ) | (18,114,969 | ) | (15,210,013 | ) | (30,868,262 | ) | (23,759,629 | ) | (16,527,555 | ) | ||||||||||||
CAPITAL SHARE TRANSACTIONS | ||||||||||||||||||||||||
| Net proceeds from the issuance of common shares | — | — | — | 2,684,598 | — | — | ||||||||||||||||||
| Net proceeds from the issuance of common shares due to reorganization | — | — | — | — | 376,530,043 | — | ||||||||||||||||||
| Reinvestment of common distributions | 70,326 | 74,214 | — | 371,902 | 598,608 | 302,128 | ||||||||||||||||||
| Redemption of common shares | — | — | — | — | (379 | ) | — | |||||||||||||||||
| Net increase in net assets derived from capital share transactions | 70,326 | 74,214 | — | 3,056,500 | 377,128,272 | 302,128 | ||||||||||||||||||
NET ASSETS APPLICABLE TO COMMON SHAREHOLDERS | ||||||||||||||||||||||||
| Total increase (decrease) in net assets applicable to Common Shareholders | (63,083,491 | ) | 10,106,345 | (3,989,083 | ) | (122,870,762 | ) | 390,185,144 | (8,320,865 | ) | ||||||||||||||
| Beginning of period | 421,244,739 | 411,138,394 | 415,127,477 | 738,513,022 | 348,327,878 | 356,648,743 | ||||||||||||||||||
| End of period | $ | 358,161,248 | $ | 421,244,739 | $ | 411,138,394 | $ | 615,642,260 | $ | 738,513,022 | $ | 348,327,878 | ||||||||||||
| (a) | Distributions for annual periods determined in accordance with U.S. federal income tax regulations. |
F I N A N C I A L ST A T E M E N T S | 45 |
| MVF | ||||||||||||
Period from 09/01/21 to 07/31/22 | Year Ended August 31, | |||||||||||
| 2021 | 2020 | |||||||||||
INCREASE (DECREASE) IN NET ASSETS APPLICABLE TO COMMON SHAREHOLDERS | ||||||||||||
OPERATIONS | ||||||||||||
| Net investment income | $ | 22,799,115 | $ | 26,743,153 | $ | 27,610,848 | ||||||
| Net realized gain (loss) | (7,690,116 | ) | 2,243,779 | (7,463,442 | ) | |||||||
| Net change in unrealized appreciation (depreciation) | (102,488,132 | ) | 28,082,486 | (8,423,790 | ) | |||||||
| Net increase (decrease) in net assets applicable to Common Shareholders resulting from operations | (87,379,133 | ) | 57,069,418 | 11,723,616 | ||||||||
DISTRIBUTIONS TO COMMON SHAREHOLDERS (a) | ||||||||||||
| Decrease in net assets resulting from distributions to Common Shareholders | (23,905,170 | ) | (26,064,221 | ) | (26,610,402 | ) | ||||||
NET ASSETS APPLICABLE TO COMMON SHAREHOLDERS | ||||||||||||
| Total increase (decrease) in net assets applicable to Common Shareholders | (111,284,303 | ) | 31,005,197 | (14,886,786 | ) | |||||||
| Beginning of period | 653,754,735 | 622,749,538 | 637,636,324 | |||||||||
| End of period | $ | 542,470,432 | $ | 653,754,735 | $ | 622,749,538 | ||||||
| (a) | Distributions for annual periods determined in accordance with U.S. federal income tax regulations. |
| 46 | 2 0 2 2 BL A C K RO C K AN N U A L RE P O R T T O SH A R E H O L D E R S |
| Statements of Cash Flows |
| BYM | BLE | |||||||||||||||
| Period from 09/01/21 to 07/31/22 | Year Ended 08/31/21 | Period from 09/01/21 to 07/31/22 | Year Ended 08/31/21 | |||||||||||||
| CASH PROVIDED BY OPERATING ACTIVITIES | ||||||||||||||||
| Net increase (decrease) in net assets resulting from operations | $ | (46,300,862 | ) | $ | 28,147,100 | $ | (95,059,000 | ) | $ | 36,816,501 | ||||||
| Adjustments to reconcile net increase (decrease) in net assets resulting from operations to net cash provided by operating activities: | ||||||||||||||||
| Proceeds from sales of long-term investments | 212,309,098 | 49,101,892 | 310,872,608 | 118,584,352 | ||||||||||||
| Purchases of long-term investments | (198,752,689 | ) | (32,039,703 | ) | (290,578,709 | ) | (105,312,829 | ) | ||||||||
| Net proceeds from sales (purchases) of short-term securities | 6,325,080 | (5,860,955 | ) | 13,003,818 | (1,432,786 | ) | ||||||||||
| Amortization of premium and accretion of discount on investments and other fees | 813,635 | 838,858 | 3,257,233 | 2,668,415 | ||||||||||||
| Net realized (gain) loss on investments | 6,537,666 | (58,286 | ) | 12,007,024 | (1,160,659 | ) | ||||||||||
| Net unrealized (appreciation) depreciation on investments | 55,779,703 | (8,576,723 | ) | 118,402,598 | (15,397,353 | ) | ||||||||||
| (Increase) Decrease in Assets | ||||||||||||||||
| Receivables | ||||||||||||||||
| Dividends — affiliated | (1,420 | ) | (63 | ) | (3,451 | ) | 112 | |||||||||
| From the Manager | — | — | 96,582 | (96,582 | ) | |||||||||||
| Interest — unaffiliated | 1,702,926 | 243,799 | 1,769,986 | 776,914 | ||||||||||||
| Variation margin on futures contracts | 1,494 | (1,494 | ) | 113,713 | (113,713 | ) | ||||||||||
| Prepaid expenses | (6,348 | ) | 7,580 | (46,969 | ) | (4,438 | ) | |||||||||
| Deferred offering costs | — | — | (114,854 | ) | — | |||||||||||
| Increase (Decrease) in Liabilities | ||||||||||||||||
| Payables | ||||||||||||||||
| Accounting services fees | (23,000 | ) | 28,597 | (112,989 | ) | 28,420 | ||||||||||
| Custodian fees | (2,105 | ) | 1,633 | (6,600 | ) | (4,990 | ) | |||||||||
| Interest expense and fees | 127,123 | (84,058 | ) | 199,304 | (25,270 | ) | ||||||||||
| Investment advisory fees | 203,657 | (737 | ) | 301,336 | (101,229 | ) | ||||||||||
| Trustees’ and Officer’s fees | (32,205 | ) | 18,014 | (46,291 | ) | 23,496 | ||||||||||
| Other accrued expenses | 4,583 | (736 | ) | 43,853 | 5,492 | |||||||||||
| Professional fees | 18,025 | 8,155 | (13,968 | ) | (11,657 | ) | ||||||||||
| Reorganization costs | — | — | — | (274,973 | ) | |||||||||||
| Transfer agent fees | 10,200 | 4,560 | (1,926 | ) | 5,944 | |||||||||||
| Variation margin on futures contracts | 18,900 | 3,329 | 39,651 | — | ||||||||||||
| Net cash provided by operating activities | 38,733,461 | 31,780,762 | 74,122,949 | 34,973,167 | ||||||||||||
| CASH USED FOR FINANCING ACTIVITIES | ||||||||||||||||
| Cash dividends paid to Common Shareholders | (16,782,373 | ) | (17,776,426 | ) | (30,972,362 | ) | (23,316,431 | ) | ||||||||
| Payments for offering costs | — | — | 10,764 | — | ||||||||||||
| Repayments of TOB Trust Certificates | (63,401,160 | ) | (13,671,622 | ) | (52,110,686 | ) | (11,625,875 | ) | ||||||||
| Repayments of Loan for TOB Trust Certificates | — | — | (361,424 | ) | — | |||||||||||
| Net payments on Common Shares redeemed | — | — | — | (379 | ) | |||||||||||
| Proceeds from TOB Trust Certificates | 41,497,308 | — | 7,249,073 | 1,580,000 | ||||||||||||
| Proceeds from Loan for TOB Trust Certificates | — | — | 361,424 | — | ||||||||||||
| Increase (decrease) in bank overdraft | 557,420 | (325,370 | ) | 18,830 | (326,459 | ) | ||||||||||
| Amortization of deferred offering costs | — | — | 81,811 | — | ||||||||||||
| Proceeds from issuance of Common Shares | — | — | 2,684,598 | — | ||||||||||||
| Net cash used for financing activities | (38,128,805 | ) | (31,773,418 | ) | (73,037,972 | ) | (33,689,144 | ) | ||||||||
F I N A N C I A L ST A T E M E N T S | 47 |
| BYM | BLE | |||||||||||||||
| Period from 09/01/21 to 07/31/22 | Year Ended 08/31/21 | Period from 09/01/21 to 07/31/22 | Year Ended 08/31/21 | |||||||||||||
| CASH | ||||||||||||||||
| Net increase in restricted and unrestricted cash | $ | 604,656 | $ | 7,344 | $ | 1,084,977 | $ | 1,284,023 | ||||||||
| Restricted and unrestricted cash at beginning of period | 7,344 | — | 1,284,023 | — | ||||||||||||
| Restricted and unrestricted cash at end of period | $ | 612,000 | $ | 7,344 | $ | 2,369,000 | $ | 1,284,023 | ||||||||
| SUPPLEMENTAL DISCLOSURE OF CASH FLOW INFORMATION | ||||||||||||||||
| Cash paid during the period for interest expense | $ | 2,392,866 | $ | 2,303,086 | $ | 4,624,354 | $ | 2,887,019 | ||||||||
NON-CASH FINANCING ACTIVITIES | ||||||||||||||||
| Reinvestment of common distributions | $ | 70,326 | $ | 74,214 | $ | 371,902 | $ | 598,608 | ||||||||
| Fair value of investments and derivatives acquired through reorganization | — | — | — | 604,357,916 | ||||||||||||
| Net proceeds from the issuance of common shares due to reorganization | — | — | — | 376,530,043 | ||||||||||||
| Net proceeds from the issuance of preferred shares due to reorganization | — | — | — | 151,400,000 | ||||||||||||
| RECONCILIATION OF RESTRICTED AND UNRESTRICTED CASH AT THE END OF PERIOD TO THE STATEMENTS OF ASSETS AND LIABILITIES | ||||||||||||||||
| Cash | $ | — | $ | 7,344 | $ | — | $ | 2,023 | ||||||||
| Cash pledged | ||||||||||||||||
| Futures contracts | 612,000 | — | 2,369,000 | 1,282,000 | ||||||||||||
| $ | 612,000 | $ | 7,344 | $ | 2,369,000 | $ | 1,284,023 | |||||||||
| 48 | 2 0 2 2 BL A C K RO C K AN N U A L RE P O R T T O SH A R E H O L D E R S |
| MVF | ||||||||
| Period from 09/01/21 to 07/31/22 | Year Ended 08/31/21 | |||||||
| CASH PROVIDED BY OPERATING ACTIVITIES | ||||||||
| Net increase (decrease) in net assets resulting from operations | $ | (87,379,133 | ) | $ | 57,069,418 | |||
| Adjustments to reconcile net increase (decrease) in net assets resulting from operations to net cash provided by operating activities: | ||||||||
| Proceeds from sales of long-term investments | 256,064,074 | 122,917,441 | ||||||
| Purchases of long-term investments | (242,067,047 | ) | (158,327,725 | ) | ||||
| Net proceeds from sales (purchases) of short-term securities | (8,019,694 | ) | 20,852,458 | |||||
| Amortization of premium and accretion of discount on investments and other fees | 4,893,497 | 4,753,972 | ||||||
| Net realized (gain) loss on investments | 9,157,629 | (1,307,423 | ) | |||||
| Net unrealized (appreciation) depreciation on investments | 101,326,783 | (28,177,828 | ) | |||||
| (Increase) Decrease in Assets | ||||||||
| Receivables | ||||||||
| Dividends — affiliated | (10,240 | ) | 175 | |||||
| Interest — unaffiliated | 2,659,032 | 241,182 | ||||||
| Variation margin on futures contracts | 30,704 | (30,704 | ) | |||||
| Prepaid expenses | (20,940 | ) | 34,032 | |||||
| Increase (Decrease) in Liabilities | ||||||||
| Payables | ||||||||
| Accounting services fees | (38,429 | ) | 50,633 | |||||
| Custodian fees | (2,590 | ) | 1,871 | |||||
| Interest expense and fees | 149,070 | (56,697 | ) | |||||
| Investment advisory fees | 282,611 | 17,993 | ||||||
| Trustees’ and Officer’s fees | (41,065 | ) | 24,207 | |||||
| Other accrued expenses | (3,237 | ) | 4,068 | |||||
| Professional fees | 15,841 | 1,677 | ||||||
| Transfer agent fees | 18,512 | 9,144 | ||||||
| Variation margin on futures contracts | 52,434 | — | ||||||
| Net cash provided by operating activities | 37,067,812 | 18,077,894 | ||||||
| CASH USED FOR FINANCING ACTIVITIES | ||||||||
| Cash dividends paid to Common Shareholders | (23,905,170 | ) | (26,064,222 | ) | ||||
| Repayments of TOB Trust Certificates | (20,417,732 | ) | (8,031,669 | ) | ||||
| Repayments of Loan for TOB Trust Certificates | (1,620,737 | ) | — | |||||
| Proceeds from TOB Trust Certificates | 8,290,737 | 16,795,000 | ||||||
| Proceeds from Loan for TOB Trust Certificates | 1,620,737 | — | ||||||
| Increase (decrease) in bank overdraft | 15,353 | (425,003 | ) | |||||
| Net cash used for financing activities | (36,016,812 | ) | (17,725,894 | ) | ||||
| CASH | ||||||||
| Net increase in restricted and unrestricted cash | 1,051,000 | 352,000 | ||||||
| Restricted and unrestricted cash at beginning of period | 352,000 | — | ||||||
| Restricted and unrestricted cash at end of period | $ | 1,403,000 | $ | 352,000 | ||||
| SUPPLEMENTAL DISCLOSURE OF CASH FLOW INFORMATION | ||||||||
| Cash paid during the period for interest expense | $ | 3,730,743 | $ | 3,256,709 | ||||
| RECONCILIATION OF RESTRICTED AND UNRESTRICTED CASH AT THE END OF PERIOD TO THE STATEMENTS OF ASSETS AND LIABILITIES | ||||||||
| Cash pledged | ||||||||
| Futures contracts | 1,403,000 | 352,000 | ||||||
| $ | 1,403,000 | $ | 352,000 | |||||
F I N A N C I A L ST A T E M E N T S | 49 |
Financial Highlights (For a share outstanding throughout each period) | ||
| BYM | ||||||||||||||||||||||||||||
Period from 09/01/21 to 07/31/22 | Year Ended August 31, | |||||||||||||||||||||||||||
| 2021 | 2020 | 2019 | 2018 | 2017 | ||||||||||||||||||||||||
| Net asset value, beginning of period | $ | 15.95 | $ | 15.57 | $ | 15.72 | $ | 14.70 | $ | 15.32 | $ | 16.22 | ||||||||||||||||
Net investment income (a) | 0.58 | 0.70 | 0.66 | 0.61 | 0.67 | 0.75 | ||||||||||||||||||||||
| Net realized and unrealized gain (loss) | (2.33 | ) | 0.37 | (0.23 | ) | 1.04 | (0.62 | ) | (0.87 | ) | ||||||||||||||||||
| Net increase (decrease) from investment operations | (1.75 | ) | 1.07 | 0.43 | 1.65 | 0.05 | (0.12 | ) | ||||||||||||||||||||
Distributions to Common Shareholders from net investment income (b) | (0.64 | ) | (0.69 | ) | (0.58 | ) | (0.63 | ) | (0.67 | ) | (0.78 | ) | ||||||||||||||||
| Net asset value, end of period | $ | 13.56 | $ | 15.95 | $ | 15.57 | $ | 15.72 | $ | 14.70 | $ | 15.32 | ||||||||||||||||
| Market price, end of period | $ | 13.34 | $ | 16.06 | $ | 14.19 | $ | 14.19 | $ | 13.09 | $ | 14.84 | ||||||||||||||||
Total Return Applicable to Common Shareholders (c) | ||||||||||||||||||||||||||||
| Based on net asset value | (10.99 | )% (d) | 7.14 | % | 3.20 | % | 12.12 | % | 0.80 | % | (0.30 | )% | ||||||||||||||||
| Based on market price | (13.04 | )% (d) | 18.36 | % | 4.19 | % | 13.66 | % | (7.34 | )% | 0.74 | % | ||||||||||||||||
Ratios to Average Net Assets Applicable to Common Shareholders (e) | ||||||||||||||||||||||||||||
| Total expenses | 1.68 | % (f) | 1.49 | % | 2.02 | % | 2.53 | % | 2.23 | % | 1.93 | % | ||||||||||||||||
| Total expenses after fees waived and/or reimbursed | 1.68 | % (f) | 1.49 | % | 2.02 | % | 2.53 | % | 2.23 | % | 1.93 | % | ||||||||||||||||
Total expenses after fees waived and/or reimbursed and excluding interest expense, fees and amortization of offering costs (g) | 0.97 | % (f) | 0.96 | % | 0.98 | % | 0.98 | % | 0.97 | % | 0.97 | % | ||||||||||||||||
| Net investment income to Common Shareholders | 4.35 | % (f) | 4.41 | % | 4.31 | % | 4.13 | % | 4.50 | % | 4.95 | % | ||||||||||||||||
| Supplemental Data | ||||||||||||||||||||||||||||
| Net assets applicable to Common Shareholders, end of period (000) | $ | 358,161 | $ | 421,245 | $ | 411,138 | $ | 415,127 | $ | 388,149 | $ | 404,474 | ||||||||||||||||
| VMTP Shares outstanding at $100,000 liquidation value, end of period (000) | $ | 137,200 | $ | 137,200 | $ | 137,200 | $ | 137,200 | $ | 137,200 | $ | 137,200 | ||||||||||||||||
| Asset coverage per VMTP Shares at $100,000 liquidation value, end of period | $ | 258,385 | $ | 407,030 | $ | 399,664 | $ | 402,571 | $ | 382,907 | $ | 394,806 | ||||||||||||||||
| TOB Trust Certificates, end of period (000) | $ | 88,933 | $ | 107,358 | $ | 121,029 | $ | 118,726 | $ | 111,781 | $ | 101,288 | ||||||||||||||||
Asset coverage per $1,000 of TOB Trust Certificates, end of period (h) | $ | 6,570 | N/A | N/A | N/A | N/A | N/A | |||||||||||||||||||||
| Portfolio turnover rate | 32 | % | 5 | % | 13 | % | 15 | % | 30 | % | 18 | % | ||||||||||||||||
| (a) | Based on average Common Shares outstanding. |
| (b) | Distributions for annual periods determined in accordance with U.S. federal income tax regulations. |
| (c) | Total returns based on market price, which can be significantly greater or less than the net asset value, may result in substantially different returns. Where applicable, excludes the effects of any sales charges and assumes the reinvestment of distributions at actual reinvestment prices. |
| (d) | Aggregate total return. |
| (e) | Excludes fees and expenses incurred indirectly as a result of investments in underlying funds. |
| (f) | Annualized. |
| (g) | Interest expense, fees and amortization of offering costs related to TOB Trusts and/or VMTP Shares. See Note 4 and Note 10 of the Notes to Financial Statements for details. |
| (h) | Effective July 18, 2022, TOB Trust Certificates are treated as senior securities pursuant to Rule 18f-4 of the 1940 Act. |
| 50 | 2 0 2 2 BL A C K RO C K AN N U A L RE P O R T T O SH A R E H O L D E R S |
| BLE | ||||||||||||||||||||||||||||
Period from 09/01/21 to 07/31/22 | Year Ended August 31, | |||||||||||||||||||||||||||
| 2021 | 2020 | 2019 | 2018 | 2017 | ||||||||||||||||||||||||
| Net asset value, beginning of period | $ | 15.18 | $ | 14.79 | $ | 15.16 | $ | 14.55 | $ | 15.17 | $ | 16.12 | ||||||||||||||||
Net investment income (a) | 0.57 | 0.69 | 0.73 | 0.71 | 0.76 | 0.83 | ||||||||||||||||||||||
| Net realized and unrealized gain (loss) | (2.52 | ) | 0.44 | (0.40 | ) | 0.60 | (0.60 | ) | (0.89 | ) | ||||||||||||||||||
| Net increase (decrease) from investment operations | (1.95 | ) | 1.13 | 0.33 | 1.31 | 0.16 | (0.06 | ) | ||||||||||||||||||||
Distributions to Common Shareholders from net investment income (b) | (0.63 | ) | (0.74 | ) | (0.70 | ) | (0.70 | ) | (0.78 | ) | (0.89 | ) | ||||||||||||||||
| Net asset value, end of period | $ | 12.60 | $ | 15.18 | $ | 14.79 | $ | 15.16 | $ | 14.55 | $ | 15.17 | ||||||||||||||||
| Market price, end of period | $ | 11.77 | $ | 16.10 | $ | 14.83 | $ | 15.48 | $ | 13.77 | $ | 15.45 | ||||||||||||||||
Total Return Applicable to Common Shareholders (c) | ||||||||||||||||||||||||||||
| Based on net asset value | (12.94 | )% (d) | 7.82 | % | 2.37 | % | 9.52 | % | 1.35 | % | (0.18 | )% | ||||||||||||||||
| Based on market price | (23.32 | )% (d) | 14.05 | % | 0.52 | % | 18.17 | % | (5.82 | )% | 0.29 | % | ||||||||||||||||
Ratios to Average Net Assets Applicable to Common Shareholders (e) | ||||||||||||||||||||||||||||
| Total expenses | 1.74 | % (f) | 1.60 | % (g) | 2.03 | % (h) | 2.55 | % | 2.32 | % | 2.02 | % | ||||||||||||||||
| Total expenses after fees waived and/or reimbursed | 1.74 | % (f) | 1.57 | % (g) | 2.00 | % (h) | 2.55 | % | 2.31 | % | 2.02 | % | ||||||||||||||||
Total expenses after fees waived and/or reimbursed and excluding interest expense, fees and amortization of offering costs (i) | 0.94 | % (f) | 1.00 | % (g) | 0.99 | % (h) | 0.98 | % | 0.98 | % | 0.99 | % | ||||||||||||||||
| Net investment income to Common Shareholders | 4.50 | % (f) | 4.54 | % | 4.96 | % | 4.86 | % | 5.12 | % | 5.47 | % | ||||||||||||||||
| Supplemental Data | ||||||||||||||||||||||||||||
| Net assets applicable to Common Shareholders, end of period (000) | $ | 615,642 | $ | 738,513 | $ | 348,328 | $ | 356,649 | $ | 342,437 | $ | 356,901 | ||||||||||||||||
| VMTP Shares outstanding at $100,000 liquidation value, end of period (000) | $ | 302,700 | $ | 302,700 | $ | 151,300 | $ | 151,300 | $ | 151,300 | $ | 151,300 | ||||||||||||||||
| Asset coverage per VMTP Shares at $100,000 liquidation value, end of period | $ | 247,830 | $ | 343,975 | $ | 330,223 | $ | 335,723 | $ | 326,330 | $ | 335,890 | ||||||||||||||||
| TOB Trust Certificates, end of period (000) | $ | 113,752 | $ | 155,988 | $ | 73,763 | $ | 59,519 | $ | 67,497 | $ | 71,274 | ||||||||||||||||
Asset coverage per $1,000 of TOB Trust Certificates, end of period (j) | $ | 9,073 | N/A | N/A | N/A | N/A | N/A | |||||||||||||||||||||
| Portfolio turnover rate | 27 | % | 15 | % | 19 | % | 18 | % | 7 | % | 9 | % | ||||||||||||||||
| (a) | Based on average Common Shares outstanding. |
| (b) | Distributions for annual periods determined in accordance with U.S. federal income tax regulations. |
| (c) | Total returns based on market price, which can be significantly greater or less than the net asset value, may result in substantially different returns. Where applicable, excludes the effects of any sales charges and assumes the reinvestment of distributions at actual reinvestment prices. |
| (d) | Aggregate total return. |
| (e) | Excludes fees and expenses incurred indirectly as a result of investments in underlying funds. |
| (f) | Annualized. |
| (g) | Includes non-recurring expenses of reorganization costs. Without these costs, total expenses, total expenses after fees waived and/or reimbursed and total expenses after fees waived and/or reimbursed and excluding interest expense, fees, and amortization of offering costs would have been 1.56%, 1.56% and 0.99%, respectively |
| (h) | Includes non-recurring expenses of reorganization costs. Without these costs, total expenses, total expenses after fees waived and/or reimbursed and total expenses after fees waived and/or reimbursed and excluding interest expense, fees, and amortization of offering costs would have been 2.00%, 2.00% and 0.98%, respectively. |
| (i) | Interest expense, fees and amortization of offering costs related to TOB Trusts and/or VMTP Shares. See Note 4 and Note 10 of the Notes to Financial Statements for details. |
| (j) | Effective July 18, 2022, TOB Trust Certificates are treated as senior securities pursuant to Rule 18f-4 of the 1940 Act. |
F I N A N C I A L HI G H L I G H T S | 51 |
| MVF | ||||||||||||||||||||||||||||
| Period from 09/01/21 to 07/31/22 | Year Ended August 31, | |||||||||||||||||||||||||||
| 2021 | 2020 | 2019 | 2018 | 2017 | ||||||||||||||||||||||||
| Net asset value, beginning of period | $ | 10.08 | $ | 9.60 | $ | 9.83 | $ | 9.35 | $ | 9.75 | $ | 10.38 | ||||||||||||||||
Net investment income (a) | 0.35 | 0.41 | 0.43 | 0.44 | 0.51 | 0.56 | ||||||||||||||||||||||
| Net realized and unrealized gain (loss) | (1.69 | ) | 0.47 | (0.25 | ) | 0.50 | (0.39 | ) | (0.62 | ) | ||||||||||||||||||
| Net increase (decrease) from investment operations | (1.34 | ) | 0.88 | 0.18 | 0.94 | 0.12 | (0.06 | ) | ||||||||||||||||||||
Distributions to Common Shareholders from net investment income (b) | (0.37 | ) | (0.40 | ) | (0.41 | ) | (0.46 | ) | (0.52 | ) | (0.57 | ) | ||||||||||||||||
| Net asset value, end of period | $ | 8.37 | $ | 10.08 | $ | 9.60 | $ | 9.83 | $ | 9.35 | $ | 9.75 | ||||||||||||||||
| Market price, end of period | $ | 7.81 | $ | 9.80 | $ | 8.77 | $ | 9.49 | $ | 8.81 | $ | 9.84 | ||||||||||||||||
Total Return Applicable to Common Shareholders (c) | ||||||||||||||||||||||||||||
| Based on net asset value | (13.30 | )% (d) | 9.62 | % | 2.30 | % | 10.76 | % | 1.52 | % | (0.38 | )% | ||||||||||||||||
| Based on market price | (16.79 | )% (d) | 16.66 | % | (3.19 | )% | 13.47 | % | (5.22 | )% | (3.10 | )% | ||||||||||||||||
Ratios to Average Net Assets Applicable to Common Shareholders (e) | ||||||||||||||||||||||||||||
| Total expenses | 1.58 | % (f) | 1.34 | % | 1.77 | % | 2.29 | % | 2.16 | % | 1.92 | % | ||||||||||||||||
| Total expenses after fees waived and/or reimbursed | 1.58 | % (f) | 1.34 | % | 1.77 | % | 2.29 | % | 2.16 | % | 1.92 | % | ||||||||||||||||
Total expenses after fees waived and/or reimbursed and excluding interest expense, fees and amortization of offering costs (g) | 0.86 | % (f) | 0.84 | % | 0.85 | % | 0.87 | % | 0.89 | % | 0.91 | % | ||||||||||||||||
| Net investment income to Common Shareholders | 4.18 | % (f) | 4.17 | % | 4.48 | % | 4.74 | % | 5.35 | % | 5.71 | % | ||||||||||||||||
| Supplemental Data | ||||||||||||||||||||||||||||
| Net assets applicable to Common Shareholders, end of period (000) | $ | 542,470 | $ | 653,755 | $ | 622,750 | $ | 637,636 | $ | 605,972 | $ | 630,489 | ||||||||||||||||
| VMTP Shares outstanding at $100,000 liquidation value, end of period (000) | $ | 243,800 | $ | 243,800 | $ | 243,800 | $ | 243,800 | $ | 243,800 | $ | 243,800 | ||||||||||||||||
| Asset coverage per VMTP Shares at $100,000 liquidation value, end of period | $ | 260,636 | $ | 368,152 | $ | 355,435 | $ | 361,541 | $ | 348,553 | $ | 358,609 | ||||||||||||||||
| TOB Trust Certificates, end of period (000) | $ | 93,902 | $ | 106,029 | $ | 97,266 | $ | 100,463 | $ | 112,817 | $ | 139,989 | ||||||||||||||||
Asset coverage per $1,000 of TOB Trust Certificates, end of period (h) | $ | 9,373 | N/A | N/A | N/A | N/A | N/A | |||||||||||||||||||||
| Portfolio turnover rate | 26 | % | 13 | % | 18 | % | 31 | % | 21 | % | 26 | % | ||||||||||||||||
| (a) | Based on average Common Shares outstanding. |
| (b) | Distributions for annual periods determined in accordance with U.S. federal income tax regulations. |
| (c) | Total returns based on market price, which can be significantly greater or less than the net asset value, may result in substantially different returns. Where applicable, excludes the effects of any sales charges and assumes the reinvestment of distributions at actual reinvestment prices. |
| (d) | Aggregate total return. |
| (e) | Excludes fees and expenses incurred indirectly as a result of investments in underlying funds. |
| (f) | Annualized. |
| (g) | Interest expense, fees and amortization of offering costs related to TOB Trusts and/or VMTP Shares. See Note 4 and Note 10 of the Notes to Financial Statements for details. |
| (h) | Effective July 18, 2022, TOB Trust Certificates are treated as senior securities pursuant to Rule 18f-4 of the 1940 Act. |
| 52 | 2 0 2 2 BL A C K RO C K AN N U A L RE P O R T T O SH A R E H O L D E R S |
| Trust Name | Herein Referred To As | Organized | Diversification Classification | |||
| BlackRock Municipal Income Quality Trust | BYM | Delaware | Diversified | |||
| BlackRock Municipal Income Trust II | BLE | Delaware | Diversified | |||
| BlackRock MuniVest Fund, Inc. | MVF | Maryland | Diversified |
| Target Funds | Target Fund’s Share Class | Shares Prior to Reorganization | Conversion Ratio | BLE’s Share Class | Shares of BLE | |||||||||||||||
| BSD | Common | 7,309,381 | 0.97816190 | Common | 7,149,748 | (a) | ||||||||||||||
| MFT | Common | 8,481,587 | 0.95690286 | Common | 8,116,045 | (a) | ||||||||||||||
| BBF | Common | 10,232,375 | 0.95732884 | Common | 9,795,743 | (a) | ||||||||||||||
| BSD | VMTP | 429 | 1 | VMTP | 429 | |||||||||||||||
| MFT | VMTP | 565 | 1 | VMTP | 565 | |||||||||||||||
| BBF | VMTP | 520 | 1 | VMTP | 520 | |||||||||||||||
| (a) | Net of fractional shares redeemed. |
| BSD | MFT | BBF | ||||||||||
| Net assets applicable to Common Shareholders | $ | 107,419,054 | $ | 121,937,458 | $ | 147,173,531 | ||||||
Paid-in-capital | 94,046,930 | 113,183,132 | 133,279,579 | |||||||||
| Accumulated earnings | 13,372,124 | 8,754,326 | 13,893,952 | |||||||||
| Target Funds | Fair Value of Investments | Cost of Investments | TOB Trust Certificates | Preferred Shares Value | ||||||||||||
| BSD | $ | 175,642,719 | $ | 160,134,612 | $ | 29,381,544 | $ | 42,900,000 | ||||||||
| MFT | 199,974,622 | 183,080,385 | 27,570,183 | 56,500,000 | ||||||||||||
| BBF | 228,740,575 | 208,822,701 | 35,319,194 | 52,000,000 | ||||||||||||
N O T E S T O FI N A N C I A L ST A T E M E N T S | 53 |
| • | Net investment income (loss): $33,072,194 |
| • | Net realized and change in unrealized gain/loss on investments: $24,768,855 |
| • | Net increase in net assets resulting from operations: $57,841,049 |
| 54 | 2 0 2 2 BL A C K RO C K AN N U A L RE P O R T T O SH A R E H O L D E R S |
| • | Fixed-income investments for which market quotations are readily available are generally valued using the last available bid price or current market quotations provided by independent dealers or third-party pricing services. Pricing services generally value fixed-income securities assuming orderly transactions of an institutional round lot size, but a fund may hold or transact in such securities in smaller, odd lot sizes. Odd lots may trade at lower prices than institutional round lots. The pricing services may use matrix pricing or valuation models that utilize certain inputs and assumptions to derive values, including transaction data (e.g., recent representative bids and offers), market data, credit quality information, perceived market movements, news, and other relevant information. Certain fixed-income securities, including asset-backed and mortgage related securities may be valued based on valuation models that consider the estimated cash flows of each tranche of the entity, establish a benchmark yield and develop an estimated tranche specific spread to the benchmark yield based on the unique attributes of the tranche. The amortized cost method of valuation may be used with respect to debt obligations with sixty days or less remaining to maturity unless the Manager determines such method does not represent fair value. |
| • | Investments in open-end U.S. mutual funds (including money market funds) are valued at that day’s published NAV. |
| • | Futures contracts are valued based on that day’s last reported settlement or trade price on the exchange where the contract is traded. |
| • | Level 1 – Unadjusted price quotations in active markets/exchanges for identical assets or liabilities that each Trust has the ability to access; |
| • | Level 2 – Other observable inputs (including, but not limited to, quoted prices for similar assets or liabilities in markets that are active, quoted prices for identical or similar assets or liabilities in markets that are not active, inputs other than quoted prices that are observable for the assets or liabilities (such as interest rates, yield curves, volatilities, prepayment speeds, loss severities, credit risks and default rates) or other market–corroborated inputs); and |
| • | Level 3 – Unobservable inputs based on the best information available in the circumstances, to the extent observable inputs are not available (including the Global Valuation Committee’s assumptions used in determining the fair value of financial instruments). |
N O T E S T O FI N A N C I A L ST A T E M E N T S | 55 |
| Trust Name | Interest Expense | Liquidity Fees | Other Expenses | Total | ||||||||||||
| BYM | $ | 320,485 | $ | 390,551 | $ | 125,080 | $ | 836,116 | ||||||||
| BLE | 423,566 | 496,333 | 187,483 | 1,107,382 | ||||||||||||
| MVF | 352,647 | 396,943 | 137,336 | 886,926 | ||||||||||||
Trust Name | | Underlying Municipal Bonds Transferred to TOB Trusts | (a) | Liability for TOB Trust Certificates | (b) | | Range of Interest Rates on TOB Trust Certificates at Period End | | Average TOB Trust Certificates Outstanding | | Daily Weighted Average Rate of Interest and Other Expenses on TOB Trusts | | ||||||||
| BYM | $ | 149,712,459 | $ | 88,932,869 | 1.36% — 1.51 | % | $ | 101,962,832 | 0.90 | % | ||||||||||
| BLE | 191,382,914 | 113,751,753 | 1.34 — 1.50 | 134,008,424 | 0.90 | |||||||||||||||
| MVF | 173,976,672 | 93,901,857 | 1.36 — 1.63 | 106,322,864 | 0.91 |
| (a) | The municipal bonds transferred to a TOB Trust are generally high grade municipal bonds. In certain cases, when municipal bonds transferred are lower grade municipal bonds, the TOB Trust transaction may include a credit enhancement feature that provides for the timely payment of principal and interest on the bonds to the TOB Trust by a credit enhancement provider in the event of default of the municipal bond. The TOB Trust would be responsible for the payment of the credit enhancement fee and the Trusts, as TOB Residuals holders, would be responsible for reimbursement of any payments of principal and interest made by the credit enhancement provider. The maximum potential amounts owed by the Trusts, for such reimbursements, as applicable, are included in the maximum potential amounts disclosed for recourse TOB Trusts in the Schedules of Investments. |
| 56 | 2 0 2 2 BL A C K RO C K AN N U A L RE P O R T T O SH A R E H O L D E R S |
| (b) | TOB Trusts may be structured on a non-recourse or recourse basis. When a Trust invests in TOB Trusts on anon-recourse basis, the Liquidity Provider may be required to make a payment under the liquidity facility to allow the TOB Trust to repurchase TOB Trust Certificates. The Liquidity Provider will be reimbursed from the liquidation of bonds held in the TOB Trust. If a Trust invests in a TOB Trust on a recourse basis, a Trust enters into a reimbursement agreement with the Liquidity Provider where a Trust is required to reimburse the Liquidity Provider for any shortfall between the amount paid by the Liquidity Provider and proceeds received from liquidation of municipal bonds held in the TOB Trust (the “Liquidation Shortfall”). As a result, if a Trust invests in a recourse TOB Trust, a Trust will bear the risk of loss with respect to any Liquidation Shortfall. If multiple funds participate in any such TOB Trust, these losses will be shared ratably, including the maximum potential amounts owed by a Trust at July 31, 2022, in proportion to their participation in the TOB Trust. The recourse TOB Trusts are identified in the Schedules of Investments including the maximum potential amounts owed by a Trust at July 31, 2022. |
| Trust Name | Loans Outstanding at Period End | Range of Interest Rates on Loans at Period End | Average Loans Outstanding | Daily Weighted Average Rate of Interest and Other Expenses on Loans | ||||||||||||
| BLE | $ | — | — | % | $ | 8,657 | 0.71 | % | ||||||||
| MVF | — | — | 38,820 | 0.71 | ||||||||||||
5. | DERIVATIVE FINANCIAL INSTRUMENTS |
6. | INVESTMENT ADVISORY AGREEMENT AND OTHER TRANSACTIONS WITH AFFILIATES |
| Trust Name | Investment Advisory Fees | |||
| BYM | 0.55 | % | ||
| BLE | 0.55 | |||
N O T E S T O FI N A N C I A L ST A T E M E N T S | 57 |
| Amounts Waived | ||||||||
| Trust Name | Period from 09/01/21 to 07/31/22 | Year Ended 08/31/21 | ||||||
| BYM | $ | 3,650 | $ | 4,040 | ||||
| BLE | 2,916 | 5,479 | ||||||
| MVF | 5,155 | 10,478 | ||||||
7. | PURCHASES AND SALES |
| Trust Name | Purchases | Sales | ||||||
| BYM | $ | 197,155,300 | $ | 214,441,368 | ||||
| BLE | 293,542,770 | 307,578,536 | ||||||
| MVF | 241,754,285 | 276,158,121 | ||||||
8. | INCOME TAX INFORMATION |
| Trust Name | Paid-in Capital | Accumulated Earnings (Loss) | ||||||||||
| BLE | $ | (81,811 | ) | $ | 81,811 | |||||||
| Trust Name | Period from 09/01/21 to 07/31/22 | Year Ended 08/31/21 | Year Ended 08/31/20 | |||||||||
| BYM | ||||||||||||
Tax-exempt income | $ | 18,536,828 | $ | 19,515,934 | $ | 17,488,919 | ||||||
| Ordinary income | — | 766 | 8,726 | |||||||||
| $ | 18,536,828 | $ | 19,516,700 | $ | 17,497,645 | |||||||
| 58 | 2 0 2 2 BL A C K RO C K AN N U A L RE P O R T T O SH A R E H O L D E R S |
| Trust Name | Period from 09/01/21 to 07/31/22 | Year Ended 08/31/21 | Year Ended 08/31/20 | |||||||||
| BLE | ||||||||||||
Tax-exempt income | $ | 34,546,170 | $ | 25,894,836 | $ | 19,045,703 | ||||||
| Ordinary income | 38,368 | 12,881 | 4,584 | |||||||||
| $ | 34,584,538 | $ | 25,907,717 | $ | 19,050,287 | |||||||
| MVF | ||||||||||||
Tax-exempt income | $ | 26,882,530 | $ | 28,554,249 | $ | 30,497,864 | ||||||
| Ordinary income | 15,527 | 802 | 190,992 | |||||||||
| $ | 26,898,057 | $ | 28,555,051 | $ | 30,688,856 | |||||||
| Trust Name | Undistributed Ordinary Income | Non-Expiring Capital Loss Carryforwards (a) | Net Unrealized Gains (Losses) (b) | Total | ||||||||||||
| BYM | $ | 4,801 | $ | (18,328,618 | ) | $ | 13,545,488 | $ | (4,778,329 | ) | ||||||
| BLE | 94,448 | (34,056,036 | ) | (19,687,097 | ) | (53,648,685 | ) | |||||||||
| MVF | 10,105 | (28,303,468 | ) | (6,433,978 | ) | (34,727,341 | ) | |||||||||
| (a) | Amounts available to offset future realized capital gains. |
| (b) | The difference between book-basis and tax-basis net unrealized gains (losses) was attributable primarily to the tax deferral of losses on wash sales and straddles, the realization for tax purposes of unrealized gains (losses) on certain futures contracts, amortization methods for premiums on fixed income securities, treatment of residual interests in tender option bond trusts, tax deferral of losses on straddles, the timing of distributions and the deferral of compensation to trustees. |
| Trust Name | Tax Cost | Gross Unrealized Appreciation | Gross Unrealized Depreciation | Net Unrealized Appreciation (Depreciation) | ||||||||||||
| BYM | $ | 471,374,799 | $ | 23,083,816 | $ | (9,173,790 | ) | $ | 13,910,026 | |||||||
| BLE | 938,084,045 | 23,010,114 | (40,094,220 | ) | (17,084,106 | ) | ||||||||||
| MVF | 773,381,696 | 16,437,947 | (22,437,051 | ) | (5,999,104 | ) | ||||||||||
N O T E S T O FI N A N C I A L ST A T E M E N T S | 59 |
| 60 | 2 0 2 2 BL A C K RO C K AN N U A L RE P O R T T O SH A R E H O L D E R S |
| Period from 09/01/21 | Year Ended | |||||||||||
| Trust Name | to 07/31/22 | 08/31/21 | 08/31/20 | |||||||||
| BYM | 4,409 | 4,589 | — | |||||||||
| BLE | 24,988 | 39,663 | 20,351 | |||||||||
| Trust Name | Issue Date | Shares Issued | Aggregate Principal | Term Redemption Date | Moody’s Rating | Fitch Rating | ||||||||||||||||||
| BYM | 12/16/11 | 1,372 | $ | 137,200,000 | 07/02/23 | Aa1 | AA | |||||||||||||||||
| BLE | 12/16/11 | 1,513 | 151,300,000 | 07/02/23 | Aa1 | AA | ||||||||||||||||||
| 04/12/21 | 1,514 | 151,400,000 | 07/02/23 | Aa1 | AA | |||||||||||||||||||
N O T E S T O FI N A N C I A L ST A T E M E N T S | 61 |
| Trust Name | Issue Date | Shares Issued | Aggregate Principal | Term Redemption Date | Moody’s Rating | Fitch Rating | ||||||||||||||||||
| MVF | 12/16/11 | 2,438 | $ | 243,800,000 | 07/02/23 | Aa1 | AA | |||||||||||||||||
| BYM | BLE | MVF | ||||||||||
| Dividend rates | 1.34 | % | 1.34 | % | 1.34 | % | ||||||
| Trust Name | Dividends Accrued | Deferred Offering Costs Amortization | ||||||
| BYM | $ | 1,683,873 | $ | — | ||||
| BLE | 3,716,276 | 81,811 | ||||||
| MVF | 2,992,887 | — | ||||||
11. | SUBSEQUENT EVENTS |
| Trust Name | Declaration Date | Record Date | Payable/ Paid Date | Dividend Per Common Share | ||||||||||||
| BYM | 08/01/22 | 08/15/22 | 09/01/22 | $ | 0.058000 | |||||||||||
| 09/01/22 | 09/15/22 | 10/03/22 | 0.058000 | |||||||||||||
| BLE | 08/01/22 | 08/15/22 | 09/01/22 | 0.052000 | ||||||||||||
| 09/01/22 | 09/15/22 | 10/03/22 | 0.052000 | |||||||||||||
| MVF | 08/01/22 | 08/15/22 | 09/01/22 | 0.033500 | ||||||||||||
| 62 | 2 0 2 2 BL A C K RO C K AN N U A L RE P O R T T O SH A R E H O L D E R S |
| Trust Name | Declaration Date | Record Date | Payable/ Paid Date | Dividend Per Common Share | ||||||||||||
| 09/01/22 | 09/15/22 | 10/03/22 | $ | 0.033500 | ||||||||||||
| Preferred Shares (a) | ||||||||||||
| Trust Name | Shares | Series | Declared | |||||||||
| BYM | VMTP | W-7 | $ | 319,164 | ||||||||
| BLE | VMTP | W-7 | 704,161 | |||||||||
| MVF | VMTP | W-7 | 567,144 | |||||||||
| (a) | Dividends declared for period August 1, 2022 to August 31, 2022. |
N O T E S T O FI N A N C I A L ST A T E M E N T S | 63 |
| 64 | 2 0 2 2 BL A C K RO C K AN N U A L RE P O R T T O SH A R E H O L D E R S |
D I S C L O S U R E O F I N V E S T M E N T A D V I S O R Y A G R E E M E N T S | 65 |
| 66 | 2 0 2 2 BL A C K RO C K AN N U A L RE P O R T T O SH A R E H O L D E R S |
D I S C L O S U R E O F I N V E S T M E N T A D V I S O R Y A G R E E M E N T S | 67 |
| 68 | 2 0 2 2 BL A C K RO C K AN N U A L RE P O R T T O SH A R E H O L D E R S |
I N V E S T M E N T O B J E C T I V E S , P O L I C I E S A N D R I S K S | 69 |
| 70 | 2 0 2 2 BL A C K RO C K AN N U A L RE P O R T T O SH A R E H O L D E R S |
I N V E S T M E N T O B J E C T I V E S , P O L I C I E S A N D R I S K S | 71 |
| 72 | 2 0 2 2 BL A C K RO C K AN N U A L RE P O R T T O SH A R E H O L D E R S |
| • | Interest Rate Risk — The market value of bonds and other fixed-income securities changes in response to interest rate changes and other factors. Interest rate risk is the risk that prices of bonds and other fixed-income securities will increase as interest rates fall and decrease as interest rates rise. |
| • | Credit Risk — Credit risk refers to the possibility that the issuer of a debt security (i.e., the borrower) will not be able to make payments of interest and principal when due. Changes in an issuer’s credit rating or the market’s perception of an issuer’s creditworthiness may also affect the value of the Fund’s investment in that issuer. The degree of credit risk depends on both the financial condition of the issuer and the terms of the obligation. |
| • | Extension Risk — When interest rates rise, certain obligations will be paid off by the obligor more slowly than anticipated, causing the value of these obligations to fall. |
| • | Prepayment Risk — When interest rates fall, certain obligations will be paid off by the obligor more quickly than originally anticipated, and the Fund may have to invest the proceeds in securities with lower yields. |
| • | General Obligation Bonds Risks — Timely payments depend on the issuer’s credit quality, ability to raise tax revenues and ability to maintain an adequate tax base. |
| • | Revenue Bonds Risks — These payments depend on the money earned by the particular facility or class of facilities, or the amount of revenues derived from another source. |
| • | Private Activity Bonds Risks — Municipalities and other public authorities issue private activity bonds to finance development of industrial facilities for use by a private enterprise. The private enterprise pays the principal and interest on the bond, and the issuer does not pledge its full faith, credit and taxing power for repayment. The Fund’s investments may consist of private activity bonds that may subject certain shareholders to an alternative minimum tax. |
| • | Moral Obligation Bonds Risks — Moral obligation bonds are generally issued by special purpose public authorities of a state or municipality. If the issuer is unable to meet its obligations, repayment of these bonds becomes a moral commitment, but not a legal obligation, of the state or municipality. |
| • | Municipal Notes Risks — Municipal notes are shorter term municipal debt obligations. If there is a shortfall in the anticipated proceeds, the notes may not be fully repaid and the Fund may lose money. |
| • | Municipal Lease Obligations Risks — In a municipal lease obligation, the issuer agrees to make payments when due on the lease obligation. Although the issuer does not pledge its unlimited taxing power for payment of the lease obligation, the lease obligation is secured by the leased property. |
| • | Tax-Exempt Status Risk — The Fund and its investment manager will rely on the opinion of issuers’ bond counsel and, in the case of derivative securities, sponsors’ counsel, on thetax-exempt status of interest on municipal bonds and payments under derivative securities. Neither the Fund nor its investment manager will independently review the bases for those tax opinions, which may ultimately be determined to be incorrect and subject the Fund and its shareholders to substantial tax liabilities. |
I N V E S T M E N T O B J E C T I V E S , P O L I C I E S A N D R I S K S | 73 |
| • | the likelihood of greater volatility of net asset value, market price and dividend rate of the common shares than a comparable portfolio without leverage; |
| • | the risk that fluctuations in interest rates or dividend rates on any leverage that the Fund must pay will reduce the return to the common shareholders; |
| • | the effect of leverage in a declining market, which is likely to cause a greater decline in the net asset value of the common shares than if the Fund were not leveraged, which may result in a greater decline in the market price of the common shares; |
| • | leverage may increase operating costs, which may reduce total return. |
| 74 | 2 0 2 2 BL A C K RO C K AN N U A L RE P O R T T O SH A R E H O L D E R S |
| • | Leverage Risk — The Fund’s use of derivatives can magnify the Fund’s gains and losses. Relatively small market movements may result in large changes in the value of a derivatives position and can result in losses that greatly exceed the amount originally invested. |
| • | Market Risk — Some derivatives are more sensitive to interest rate changes and market price fluctuations than other securities. The Fund could also suffer losses related to its derivatives positions as a result of unanticipated market movements, which losses are potentially unlimited. Finally, the Manager may not be able to predict correctly the direction of securities prices, interest rates and other economic factors, which could cause the Fund’s derivatives positions to lose value. |
| • | Counterparty Risk — : Derivatives are also subject to counterparty risk, which is the risk that the other party in the transaction will be unable or unwilling to fulfill its contractual obligation, and the related risks of having concentrated exposure to such a counterparty. |
| • | Illiquidity Risk — The possible lack of a liquid secondary market for derivatives and the resulting inability of the Fund to sell or otherwise close a derivatives position could expose the Fund to losses and could make derivatives more difficult for the Fund to value accurately. |
| • | Operational Risk — The use of derivatives includes the risk of potential operational issues, including documentation issues, settlement issues, systems failures, inadequate controls and human error. |
| • | Legal Risk — The risk of insufficient documentation, insufficient capacity or authority of counterparty, or legality or enforceability of a contract. |
| • | Volatility and Correlation Risk — Volatility is defined as the characteristic of a security, an index or a market to fluctuate significantly in price within a short time period. A risk of the Fund’s use of derivatives is that the fluctuations in their values may not correlate with the overall securities markets. |
| • | Valuation Risk — Valuation for derivatives may not be readily available in the market. Valuation may be more difficult in times of market turmoil since many investors and market makers may be reluctant to purchase complex instruments or quote prices for them. |
| • | Hedging Risk — Hedges are sometimes subject to imperfect matching between the derivative and the underlying security, and there can be no assurance that the Fund’s hedging transactions will be effective. The use of hedging may result in certain adverse tax consequences. |
| • | Tax Risk — Certain aspects of the tax treatment of derivative instruments, including swap agreements and commodity-linked derivative instruments, are currently unclear and may be affected by changes in legislation, regulations or other legally binding authority. Such treatment may be less favorable than that given to a direct investment in an underlying asset and may adversely affect the timing, character and amount of income the Fund realizes from its investments. |
| • | Regulatory Risk — Derivative contracts are subject to regulation under the Dodd-Frank Wall Street Reform and Consumer Protection Act (the “Dodd-Frank Act”) in the United States and under comparable regimes in Europe, Asia and other non-U.S. jurisdictions. Under the Dodd-Frank Act, with respect to uncleared swaps, swap dealers are required to collect variation margin from the Fund and may be required by applicable regulations to collect initial margin from the Fund. Both initial and variation margin may be comprised of cash and/or securities, subject to applicable regulatory haircuts. Shares of investment companies (other than certain money market funds) may not be posted as collateral under applicable regulations. In addition, regulations adopted by global prudential regulators that are now in effect require certain bank-regulated counterparties and certain of their affiliates to include in certain financial contracts, including many derivatives contracts, terms that delay or restrict the rights of counterparties, such as the Fund, to terminate such contracts, foreclose upon collateral, exercise other default rights or restrict transfers of credit support in the event that the counterparty and/or its affiliates are subject to certain types of resolution or insolvency proceedings. The implementation of these requirements with respect to derivatives, as well as regulations under the Dodd-Frank Act regarding clearing, mandatory trading and margining of other derivatives, may increase the costs and risks to the Fund of trading in these instruments and, as a result, may affect returns to investors in the Fund. |
I N V E S T M E N T O B J E C T I V E S , P O L I C I E S A N D R I S K S | 75 |
| 76 | 2 0 2 2 BL A C K RO C K AN N U A L RE P O R T T O SH A R E H O L D E R S |
BLE | ||||
Shareholder Transaction Expenses | ||||
Maximum Sales Load (as a percentage of offering price) (a) | 1.00 | % | ||
Offering expenses borne by BLE (as a percentage of offering price) (a) | 0.02 | |||
| Dividend Reinvestment Plan Fees | | $0.02 per share for open market purchases of common shares (b) | | |
| Dividend reinvestment plan sale transaction fee | $ 2.50 | (b) |
Estimated Annual Expenses | ||||
Investment advisory fees (c)(d) | 0.91 | % | ||
| Other expenses | 0.83 | |||
| Miscellaneous | 0.03 | |||
Interest expense (e) | 0.80 | |||
| Total annual expenses | 1.74 | |||
Fee waiver (d) | — | |||
Total annual fund operating expenses after fee waiver (d) | 1.74 |
| (a) | BLE shareholders will pay all offering expenses involved with this offering. |
| (b) | Computershare Trust Company, N.A.’s (the “Reinvestment Plan Agent”) fees for the handling of the reinvestment of dividends will be paid by BLE. However, shareholders will pay a $0.02 per share fee incurred in connection with open-market purchases, which will be deducted from the value of the dividend. Shareholders will also be charged a $2.50 sales fee and pay a $0.15 per share fee if you direct the Reinvestment Plan Agent to sell the common shares held in a dividend reinvestment account. Per share fees include any applicable brokerage commissions the Reinvestment Plan Agent is required to pay. |
| (c) | BLE currently pays the Manager a monthly fee at an annual contractual investment management fee rate of 0.55% of its average weekly managed assets. For purposes of calculating these fees, “managed assets” means the total assets of BLE (including any assets attributable to money borrowed for investment purposes) minus the sum of its accrued liabilities (other than money borrowed for investment purposes). |
| (d) | BLE and the Manager have entered into a fee waiver agreement (the “Fee Waiver Agreement”), pursuant to which the Manager has contractually agreed to waive the management fee with respect to any portion of BLE’s assets attributable to investments in any equity and fixed-income mutual funds and exchange-traded funds managed by the Manager or its affiliates that have a contractual management fee, through June 30, 2024. In addition, pursuant to the Fee Waiver Agreement, the Manager has contractually agreed to waive its management fees by the amount of investment advisory fees BLE pays to the Manager indirectly through its investment in money market funds managed by the Manager or its affiliates, through June 30, 2024. The Fee Waiver Agreement may be terminated at any time, without the payment of any penalty, only by BLE (upon the vote of a majority of the Trustees who are not “interested persons” (as defined in the Investment Company Act) of the Trust or a majority of the outstanding voting securities of BLE), upon 90 days’ written notice by BLE to the Manager. |
| (e) | The total expense table includes interest expense associated with BLE’s investments in TOBs (also known as “inverse floaters”). Although such interest expense is actually paid by special purpose vehicles in which BLE invests, it is recorded on BLE’s financial statements for accounting purposes. The total expense table also includes, in interest expense, dividends associated with the VMTP Shares, because the VMTP Shares are considered debt of BLE for financial reporting purposes. |
S H A R E H O L D E R UP D A T E | 77 |
| Total expenses incurred | 1 Year | 3 Years | 5 Years | 10 Years | ||||||||||||
| BLE | $ 28 | $ 64 | $ 104 | $ 213 |
NYSE Market Price Per Common Share | NAV per Common Share on Date of Market Price | Premium/ (Discount) on Date of Market Price | ||||||||||||||||||||||||||||||||||||
| During Quarter Ended | High | Low | High | Low | High | Low | Trading Volume | |||||||||||||||||||||||||||||||
| July 31, 2022 | $ 11.86 | $ 10.57 | $ 12.78 | $ 11.78 | (7.20 | )% | (10.27 | )% | 5,099,259 | |||||||||||||||||||||||||||||
| May 31, 2022 | 13.90 | 10.63 | 14.14 | 11.72 | (1.70 | ) | (9.30 | ) | 11,216,795 | |||||||||||||||||||||||||||||
| February 28, 2022 | 15.38 | 13.65 | 15.03 | 14.10 | 2.33 | (3.19 | ) | 8,082,836 | ||||||||||||||||||||||||||||||
| November 30, 2021 | 16.14 | 14.86 | 15.18 | 14.96 | 6.32 | (0.67 | ) | 4,325,591 | ||||||||||||||||||||||||||||||
| August 31, 2021 | 16.10 | 15.35 | 15.18 | 15.18 | 6.06 | 1.12 | 4,954,334 | |||||||||||||||||||||||||||||||
| May 31, 2021 | 15.83 | 14.78 | 15.18 | 14.82 | 5.46 | (0.67 | ) | 5,273,595 | ||||||||||||||||||||||||||||||
| February 26, 2021 | 16.16 | 15.00 | 15.46 | 14.83 | 4.53 | (0.07 | ) | 2,122,958 | ||||||||||||||||||||||||||||||
| November 30, 2020 | 15.66 | 14.28 | 14.98 | 14.51 | 6.10 | (1.65 | ) | 2,112,424 | ||||||||||||||||||||||||||||||
| August 31, 2020 | 15.78 | 14.15 | 15.10 | 14.15 | 7.73 | (1.86 | ) | 2,658,420 | ||||||||||||||||||||||||||||||
| May 29, 2020 | 15.41 | 10.40 | 15.52 | 12.41 | 1.44 | (24.14 | ) | 5,948,263 | ||||||||||||||||||||||||||||||
| February 28, 2020 | 16.12 | 14.78 | 15.55 | 14.91 | 5.93 | (4.89 | ) | 2,388,473 | ||||||||||||||||||||||||||||||
| November 29, 2019 | 15.48 | 14.40 | 15.16 | 14.81 | 2.81 | (3.95 | ) | 2,837,146 | ||||||||||||||||||||||||||||||
| 78 | 2 0 2 2 BL A C K RO C K AN N U A L RE P O R T T O SH A R E H O L D E R S |
| Fiscal Year Ended | | Total Amount Outstanding (000) | | | Asset Coverage | | | Liquidating Preference | (a) | | Average Market Value (000) | | | Type of Senior Security | | |||||
| July 31, 2022 | $ | 113,752 | $ | 9,073 | (b) | $ | N/A | $ | 134,008 | (c) | TOBs | |||||||||
| July 31, 2022 | 302,700 | 247,830 | (d) | 100,000 | N/A | VMTP Shares | ||||||||||||||
| August 31, 2021 | 302,700 | 343,975 | (e) | 100,000 | N/A | VMTP Shares | ||||||||||||||
| August 31, 2020 | 151,300 | 330,223 | (e) | 100,000 | N/A | VMTP Shares | ||||||||||||||
| August 31, 2019 | 151,300 | 335,723 | (e) | 100,000 | N/A | VMTP Shares | ||||||||||||||
| August 31, 2018 | 151,300 | 326,330 | (e) | 100,000 | N/A | VMTP Shares | ||||||||||||||
| August 31, 2017 | 151,300 | 335,890 | (e) | 100,000 | N/A | VMTP Shares | ||||||||||||||
| August 31, 2016 | 151,300 | 350,213 | (e) | 100,000 | N/A | VMTP Shares | ||||||||||||||
| August 31, 2015 | 151,300 | 336,529 | (e) | 100,000 | N/A | VMTP Shares | ||||||||||||||
| August 31, 2014 | 151,300 | 339,946 | (e) | 100,000 | N/A | VMTP Shares | ||||||||||||||
| August 31, 2013 | 151,300 | 306,430 | (e) | 100,000 | N/A | VMTP Shares | ||||||||||||||
| August 31, 2012 | 151,300 | 349,025 | (e) | 100,000 | N/A | VMTP Shares |
| (a) | Represents the amount to which a holder of preferred shares would be entitled upon the liquidation of BLE in preference to common shareholders, expressed as a dollar amount per preferred share. VMTP Shares are considered debt of the issuer; therefore, the liquidation preference approximates fair value. |
| (b) | Calculated by subtracting BLE’s total liabilities (not including VMTP Shares and TOBs) from BLE’s total assets and dividing this by the amount of TOBs, and by multiplying the results by 1,000. |
| (c) | Represents weighted average daily market value of TOBs. |
| (d) | Calculated by subtracting BLE’s total liabilities (not including VMTP Shares and TOBs) from BLE’s total assets and dividing this by the sum of the amount of TOBs and liquidation value of the VMTP Shares, and by multiplying the results by 100,000. Effective July 18, 2022, TOB Trust Certificates are treated as senior securities pursuant to Rule 18f-4 of the 1940 Act. |
| (e) | Calculated by subtracting BLE’s total liabilities (not including VMTP Shares) from BLE’s total assets and dividing this by the liquidation value of the VMTP Shares, and by multiplying the results by 100,000. |
S H A R E H O L D E R UP D A T E | 79 |
| 80 | 2 0 2 2 BL A C K RO C K AN N U A L RE P O R T T O SH A R E H O L D E R S |
Independent Trustees (a) | ||||||||
Name Year of Birth (b) | Position(s) Held (Length of Service) (c) | Principal Occupation(s) During Past Five Years | Number of BlackRock-Advised Registered Investment Companies (“RICs”) Consisting of Investment Portfolios (“Portfolios”) Overseen | Public Company and Other Investment Company Directorships Held During Past Five Years | ||||
R. Glenn Hubbard 1958 | Chair of the Board (Since 2022) Trustee (Since 2007) | Dean, Columbia Business School from 2004 to 2019; Faculty member, Columbia Business School since 1988. | 69 RICs consisting of 99 Portfolios | ADP (data and information services) 2004-2020; Metropolitan Life Insurance Company (insurance); KKR Financial Corporation (finance) from 2004 until 2014. | ||||
W. Carl Kester (d) 1951 | Vice Chair of the Board (Since 2022) Trustee (Since 2007) | George Fisher Baker Jr. Professor of Business Administration, Harvard Business School since 2008; Deputy Dean for Academic Affairs from 2006 to 2010; Chairman of the Finance Unit, from 2005 to 2006; Senior Associate Dean and Chairman of the MBA Program from 1999 to 2005; Member of the faculty of Harvard Business School since 1981. | 71 RICs consisting of 101 Portfolios | None | ||||
Cynthia L. Egan 1955 | Trustee (Since 2016) | Advisor, U.S. Department of the Treasury from 2014 to 2015; President, Retirement Plan Services, for T. Rowe Price Group, Inc. from 2007 to 2012; executive positions within Fidelity Investments from 1989 to 2007. | 69 RICs consisting of 99 Portfolios | Unum (insurance); The Hanover Insurance Group (Board Chair) (insurance); Huntsman Corporation (Lead Independent Director and non Executive Vice Chair of the Board) (chemical products); Envestnet (investment platform) from 2013 until 2016. | ||||
Frank J. Fabozzi (d) 1948 | Trustee (Since 2007) | Editor of The Journal of Portfolio Management since 1986; Professor of Finance, EDHEC Business School (France) from 2011 to 2022; Professor of Practice, Johns Hopkins University since 2021; Visiting Professor, Princeton University for the 2013 to 2014 academic year and Spring 2017 semester; Professor in the Practice of Finance, Yale University School of Management from 1994 to 2011 and currently a Teaching Fellow in Yale’s Executive Programs; Board Member, BlackRock Equity- Liquidity Funds from 2014 to 2016; affiliated professor Karlsruhe Institute of Technology from 2008 to 2011; Visiting Professor, Rutgers University for the Spring 2019 semester; Visiting Professor, New York University for the 2019 academic year; Adjunct Professor of Finance, Carnegie Mellon University in fall 2020 semester. | 71 RICs consisting of 101 Portfolios | None | ||||
Lorenzo A. Flores 1964 | Trustee (Since 2021) | Vice Chairman, Kioxia, Inc. since 2019; Chief Financial Officer, Xilinx, Inc. from 2016 to 2019; Corporate Controller, Xilinx, Inc. from 2008 to 2016. | 69 RICs consisting of 99 Portfolios | None | ||||
Stayce D. Harris 1959 | Trustee (Since 2021) | Lieutenant General, Inspector General, Office of the Secretary of the United States Air Force from 2017 to 2019; Lieutenant General, Assistant Vice Chief of Staff and Director, Air Staff, United States Air Force from 2016 to 2017; Major General, Commander, 22nd Air Force, AFRC, Dobbins Air Reserve Base, Georgia from 2014 to 2016; Pilot, United Airlines from 1990 to 2020. | 69 RICs consisting of 99 Portfolios | The Boeing Company. | ||||
T R U S T E E A N D OF F I C E R IN F O R M A T I O N | 81 |
Independent Trustees (a) (continued) | ||||||||
Name Year of Birth (b) | Position(s) Held (Length of Service) (c) | Principal Occupation(s) During Past Five Years | Number of BlackRock-Advised Registered Investment Companies (“RICs”) Consisting of Investment Portfolios (“Portfolios”) Overseen | Public Company and Other Investment Company Directorships Held During Past Five Years | ||||
J. Phillip Holloman 1955 | Trustee (Since 2021) | President and Chief Operating Officer, Cintas Corporation from 2008 to 2018. | 69 RICs consisting of 99 Portfolios | PulteGroup, Inc. (home construction); Rockwell Automation Inc. (industrial automation). | ||||
Catherine A. Lynch (d) 1961 | Trustee (Since 2016) | Chief Executive Officer, Chief Investment Officer and various other positions, National Railroad Retirement Investment Trust from 2003 to 2016; Associate Vice President for Treasury Management, The George Washington University from 1999 to 2003; Assistant Treasurer, Episcopal Church of America from 1995 to 1999. | 71 RICs consisting of 101 Portfolios | PennyMac Mortgage Investment Trust. | ||||
Interested Trustees (a)(e) | ||||||||
Name Year of Birth (b) | Position(s) Held (Length of Service) (c) | Principal Occupation(s) During Past Five Years | Number of BlackRock-Advised Registered Investment Companies (“RICs”) Consisting of Investment Portfolios (“Portfolios”) Overseen | Public Company and Other Investment Company Directorships Held During Past Five Years | ||||
Robert Fairbairn 1965 | Trustee (Since 2018) | Vice Chairman of BlackRock, Inc. since 2019; Member of BlackRock’s Global Executive and Global Operating Committees; Co-Chair of BlackRock’s Human Capital Committee; Senior Managing Director of BlackRock, Inc. from 2010 to 2019; oversaw BlackRock’s Strategic Partner Program and Strategic Product Management Group from 2012 to 2019; Member of the Board of Managers of BlackRock Investments, LLC from 2011 to 2018; Global Head of BlackRock’s Retail and iShares® businesses from 2012 to 2016. | 97 RICs consisting of 261 Portfolios | None | ||||
John M. Perlowski (d) 1964 | Trustee (Since 2015) President and Chief Executive Officer (Since 2010) | Managing Director of BlackRock, Inc. since 2009; Head of BlackRock Global Accounting and Product Services since 2009; Advisory Director of Family Resource Network (charitable foundation) since 2009. | 99 RICs consisting of 263 Portfolios | None | ||||
(a) The address of each Trustee is c/o BlackRock, Inc., 55 East 52nd Street, New York, New York 10055.(b) Each Independent Trustee holds office until his or her successor is duly elected and qualifies or until his or her earlier death, resignation, retirement or removal as provided by the Trust’sby-laws or charter or statute, or until December 31 of the year in which he or she turns 75. Trustees who are “interested persons,” as defined in the Investment Company Act serve until their successor is duly elected and qualifies or until their earlier death, resignation, retirement or removal as provided by the Trust’sby-laws or statute, or until December 31 of the year in which they turn 72. The Board may determine to extend the terms of Independent Trustees on acase-by-case (c) Following the combination of Merrill Lynch Investment Managers, L.P. (“MLIM”) and BlackRock, Inc. in September 2006, the various legacy MLIM and legacy BlackRock fund boards were realigned and consolidated into three new fund boards in 2007. Certain Independent Trustees first became members of the boards of other legacy MLIM or legacy BlackRock funds as follows: Frank J. Fabozzi, 1988; R. Glenn Hubbard, 2004; and W. Carl Kester, 1995.(d) Dr. Fabozzi, Dr. Kester, Ms. Lynch and Mr. Perlowski are also trustees of the BlackRock Credit Strategies Fund and BlackRock Private Investments Fund.(e) Mr. Fairbairn and Mr. Perlowski are both “interested persons,” as defined in the 1940 Act, of the Trust based on their positions with BlackRock, Inc. and its affiliates. Mr. Fairbairn and Mr. Perlowski are also board members of the BlackRock Multi-Asset Complex. | ||||||||
| 82 | 2 0 2 2 BL A C K RO C K AN N U A L RE P O R T T O SH A R E H O L D E R S |
Officers Who Are Not Trustees (a) | ||||||||
Name Year of Birth (b) | Position(s) Held (Length of Service) | Principal Occupation(s) During Past Five Years | ||||||
Jonathan Diorio 1980 | Vice President (Since 2015) | Managing Director of BlackRock, Inc. since 2015; Director of BlackRock, Inc. from 2011 to 2015. | ||||||
Trent Walker 1974 | Chief Financial Officer (Since 2021) | Managing Director of BlackRock, Inc. since September 2019; Executive Vice President of PIMCO from 2016 to 2019; Senior Vice President of PIMCO from 2008 to 2015; Treasurer from 2013 to 2019 and Assistant Treasurer from 2007 to 2017 of PIMCO Funds, PIMCO Variable Insurance Trust, PIMCO ETF Trust, PIMCO Equity Series, PIMCO Equity Series VIT, PIMCO Managed Accounts Trust, 2 PIMCO-sponsored interval funds and 21 PIMCO-sponsored closed-end funds. | ||||||
Jay M. Fife 1970 | Treasurer (Since 2007) | Managing Director of BlackRock, Inc. since 2007. | ||||||
Charles Park 1967 | Chief Compliance Officer (Since 2014) | Anti-Money Laundering Compliance Officer for certain BlackRock-advised Funds from 2014 to 2015; Chief Compliance Officer of BlackRock Advisors, LLC and the BlackRock-advised Funds in the BlackRock Multi-Asset Complex and the BlackRock Fixed-Income Complex since 2014; Principal of and Chief Compliance Officer for iShares ® Delaware Trust Sponsor LLC since 2012 and BlackRock Fund Advisors (“BFA”) since 2006; Chief Compliance Officer for theBFA-advised iShares® exchange traded funds since 2006; Chief Compliance Officer for BlackRock Asset Management International Inc. since 2012. | ||||||
Janey Ahn 1975 | Secretary (Since 2012) | Managing Director of BlackRock, Inc. since 2018; Director of BlackRock, Inc. from 2009 to 2017. | ||||||
(a) The address of each Officer is c/o BlackRock, Inc., 55 East 52nd Street, New York, New York 10055.(b) Officers of the Trust serve at the pleasure of the Board. | ||||||||
T R U S T E E A N D OF F I C E R IN F O R M A T I O N | 83 |
| Cynthia L. Egan | Robert Fairbairn | Stayce D. Harris | ||||||||||||||||||||||
| Trust Name | Votes For | Votes Withheld | Votes For | Votes Withheld | Votes For | Votes Withheld | ||||||||||||||||||
| BYM | 21,472,799 | 792,559 | 21,455,638 | 809,720 | 21,468,427 | 796,931 | ||||||||||||||||||
| BLE | 36,643,639 | 1,960,366 | 36,686,938 | 1,917,067 | 36,625,484 | 1,978,521 | ||||||||||||||||||
| MVF | 38,530,986 | 17,535,028 | 38,498,419 | 17,567,595 | 38,588,326 | 17,477,688 | ||||||||||||||||||
| 84 | 2 0 2 2 BL A C K RO C K AN N U A L RE P O R T T O SH A R E H O L D E R S |
A D D I T I O N A L IN F O R M A T I O N | 85 |
| 86 | 2 0 2 2 BL A C K RO C K AN N U A L RE P O R T T O SH A R E H O L D E R S |
| AGM | Assured Guaranty Municipal Corp. | |
| AGM-CR | AGM Insured Custodial Receipt | |
| AMBAC | AMBAC Assurance Corp. | |
| AMT | Alternative Minimum Tax | |
| ARB | Airport Revenue Bonds | |
| BAB | Build America Bond | |
| BAM | Build America Mutual Assurance Co. | |
| BAM-TCRS | Build America Mutual Assurance Co.- Transferable Custodial Receipts | |
| CAB | Capital Appreciation Bonds | |
| COP | Certificates of Participation | |
| FHA | Federal Housing Administration | |
| FHLMC | Federal Home Loan Mortgage Corp. | |
| FNMA | Federal National Mortgage Association | |
| GNMA | Government National Mortgage Association | |
| GO | General Obligation Bonds | |
| GTD | GTD Guaranteed | |
| HUD SECT 8 | U.S. Department of Housing and Urban Development | |
| Section 8 | ||
| M/F | Multi-Family | |
| NPFGC | National Public Finance Guarantee Corp. | |
| PSF | Permanent School Fund | |
| PSF-GTD | Permanent School Fund Guaranteed | |
| RB | Revenue Bond | |
| S/F | Single-Family | |
| SAB | Special Assessment Bonds | |
| SAW | State Aid Withholding | |
| SONYMA | State of New York Mortgage Agency | |
| TA | Tax Allocation | |
G L O S S A R Y O F TE R M S US E D I N TH I S RE P O R T | 87 |
|  |
(b) Not Applicable
| Item 2 – | Code of Ethics – The registrant (or the “Fund”) has adopted a code of ethics, as of the end of the period covered by this report, applicable to the registrant’s principal executive officer, principal financial officer, principal accounting officer or controller, or persons performing similar functions. During the period covered by this report, the code of ethics was amended to update certain information and to make other non-material changes. During the period covered by this report, there have been no waivers granted under the code of ethics. The registrant undertakes to provide a copy of the code of ethics to any person upon request, without charge, who calls 1-800-882-0052, option 4. |
| Item 3 – | Audit Committee Financial Expert – The registrant’s board of directors (the “board of directors”), has determined that (i) the registrant has the following audit committee financial experts serving on its audit committee and (ii) each audit committee financial expert is independent: |
Frank J. Fabozzi
Lorenzo A. Flores
Catherine A. Lynch
Under applicable securities laws, a person determined to be an audit committee financial expert will not be deemed an “expert” for any purpose, including without limitation for the purposes of Section 11 of the Securities Act of 1933, as a result of being designated or identified as an audit committee financial expert. The designation or identification of a person as an audit committee financial expert does not impose on such person any duties, obligations, or liabilities greater than the duties, obligations, and liabilities imposed on such person as a member of the audit committee and board of directors in the absence of such designation or identification. The designation or identification of a person as an audit committee financial expert does not affect the duties, obligations, or liability of any other member of the audit committee or board of directors.
| Item 4 – | Principal Accountant Fees and Services |
The following table presents fees billed by Deloitte & Touche LLP (“D&T”) in each of the last two fiscal years for the services rendered to the Fund:
| (a) Audit Fees | (b) Audit-Related Fees1 | (c) Tax Fees2 | (d) All Other Fees | |||||||||||||
| Entity Name | Current Fiscal Year End3 | Previous Fiscal Year End | Current Fiscal Year End3 | Previous Fiscal Year End | Current Fiscal Year End3 | Previous Fiscal Year End | Current Fiscal Year End3 | Previous Fiscal Year End | ||||||||
BlackRock Municipal Income Trust II | $32,742 | $32,421 | $4,000 | $10,614 | $15,500 | $33,200 | $218 | $0 | ||||||||
The following table presents fees billed by D&T that were required to be approved by the registrant’s audit committee (the “Committee”) for services that relate directly to the operations or financial reporting of the Fund and that are rendered on behalf of BlackRock Advisors, LLC (“Investment Adviser” or “BlackRock”) and entities controlling, controlled by, or under common control with
2
BlackRock (not including any sub-adviser whose role is primarily portfolio management and is subcontracted with or overseen by another investment adviser) that provide ongoing services to the Fund (“Affiliated Service Providers”):
| Current Fiscal Year End3 | Previous Fiscal Year End | |||
(b) Audit-Related Fees1 | $0 | $0 | ||
(c) Tax Fees2 | $0 | $0 | ||
(d) All Other Fees4 | $2,098,000 | $2,032,000 |
1 The nature of the services includes assurance and related services reasonably related to the performance of the audit or review of financial statements not included in Audit Fees, including accounting consultations, agreed-upon procedure reports, attestation reports, comfort letters, out-of-pocket expenses and internal control reviews not required by regulators.
2 The nature of the services includes tax compliance and/or tax preparation, including services relating to the filing or amendment of federal, state or local income tax returns, regulated investment company qualification reviews, taxable income and tax distribution calculations.
3The registrant changed its fiscal year end from August 31 to July 31 effective July 31, 2022 whereby this fiscal year consists of the eleven months ended July 31, 2022.
4Non-audit fees of $2,098,000 and $2,032,000 for the current fiscal year and previous fiscal year, respectively, were paid to the Fund’s principal accountant in their entirety by BlackRock, in connection with services provided to the Affiliated Service Providers of the Fund and of certain other funds sponsored and advised by BlackRock or its affiliates for a service organization review and an accounting research tool subscription. These amounts represent aggregate fees paid by BlackRock and were not allocated on a per fund basis.
(e)(1) Audit Committee Pre-Approval Policies and Procedures:
The Committee has adopted policies and procedures with regard to the pre-approval of services. Audit, audit-related and tax compliance services provided to the registrant on an annual basis require specific pre-approval by the Committee. The Committee also must approve other non-audit services provided to the registrant and those non-audit services provided to the Investment Adviser and Affiliated Service Providers that relate directly to the operations and the financial reporting of the registrant. Certain of these non-audit services that the Committee believes are (a) consistent with the SEC’s auditor independence rules and (b) routine and recurring services that will not impair the independence of the independent accountants may be approved by the Committee without consideration on a specific case-by-case basis (“general pre-approval”). The term of any general pre-approval is 12 months from the date of the pre-approval, unless the Committee provides for a different period. Tax or other non-audit services provided to the registrant which have a direct impact on the operations or financial reporting of the registrant will only be deemed pre-approved provided that any individual project does not exceed $10,000 attributable to the registrant or $50,000 per project. For this purpose, multiple projects will be aggregated to determine if they exceed the previously mentioned cost levels.
Any proposed services exceeding the pre-approved cost levels will require specific pre-approval by the Committee, as will any other services not subject to general pre-approval (e.g., unanticipated but permissible services). The Committee is informed of each service approved subject to general pre-approval at the next regularly scheduled in-person board meeting. At this meeting, an analysis of such services is presented to the Committee for ratification. The Committee may delegate to the Committee Chairman the authority to approve the provision of and fees for any specific engagement of permitted non-audit services, including services exceeding pre-approved cost levels.
(e)(2) None of the services described in each of Items 4(b) through (d) were approved by the Committee pursuant to the de minimis exception in paragraph (c)(7)(i)(C) of Rule 2-01 of Regulation S-X.
3
(f) Not Applicable
(g) The aggregate non-audit fees, defined as the sum of the fees shown under “Audit-Related Fees,” “Tax Fees” and “All Other Fees,” paid to the accountant for services rendered by the accountant to the registrant, the Investment Adviser and the Affiliated Service Providers were:
| Entity Name | Current Fiscal Year End1 | Previous Fiscal Year End | ||||
| BlackRock Municipal Income Trust II | $19,718 | $43,814 |
Additionally, the amounts billed by D&T in connection with services provided to the Affiliated Service Providers of the Fund and of other funds sponsored or advised by BlackRock or its affiliates during the current and previous fiscal years for a service organization review and an accounting research tool subscription were:
Current Fiscal Year End1 | Previous Fiscal Year End | |
| $2,098,000 | $2,032,000 |
These amounts represent aggregate fees paid by BlackRock and were not allocated on a per fund basis.
1The registrant changed its fiscal year end from August 31 to July 31 effective July 31, 2022 whereby this fiscal year consists of the eleven months ended July 31, 2022.
(h) The Committee has considered and determined that the provision of non-audit services that were rendered to the Investment Adviser, and the Affiliated Service Providers that were not pre-approved pursuant to paragraph (c)(7)(ii) of Rule 2-01 of Regulation S-X is compatible with maintaining the principal accountant’s independence.
(i) – Not Applicable
(j) – Not Applicable
| Item 5 – | Audit Committee of Listed Registrant |
| (a) | The following individuals are members of the registrant’s separately designated standing audit committee established in accordance with Section 3(a)(58)(A) of the Securities Exchange Act of 1934 (15 U.S.C. 78c(a)(58)(A)): |
Frank J. Fabozzi
Lorenzo A. Flores
J. Phillip Holloman
Catherine A. Lynch
4
(b) Not Applicable
| Item 6 – | Investments |
(a) The registrant’s Schedule of Investments is included as part of the Report to Stockholders filed under Item 1(a) of this Form.
(b) Not Applicable due to no such divestments during the semi-annual period covered since the previous Form N-CSR filing.
| Item 7 – | Disclosure of Proxy Voting Policies and Procedures for Closed-End Management Investment Companies – The board of directors has delegated the voting of proxies for the Fund’s portfolio securities to the Investment Adviser pursuant to the Investment Adviser’s proxy voting guidelines. Under these guidelines, the Investment Adviser will vote proxies related to Fund securities in the best interests of the Fund and its stockholders. From time to time, a vote may present a conflict between the interests of the Fund’s stockholders, on the one hand, and those of the Investment Adviser, or any affiliated person of the Fund or the Investment Adviser, on the other. In such event, provided that the Investment Adviser’s Equity Investment Policy Oversight Committee, or a sub-committee thereof (the “Oversight Committee”) is aware of the real or potential conflict or material non-routine matter and if the Oversight Committee does not reasonably believe it is able to follow its general voting guidelines (or if the particular proxy matter is not addressed in the guidelines) and vote impartially, the Oversight Committee may retain an independent fiduciary to advise the Oversight Committee on how to vote or to cast votes on behalf of the Investment Adviser’s clients. If the Investment Adviser determines not to retain an independent fiduciary, or does not desire to follow the advice of such independent fiduciary, the Oversight Committee shall determine how to vote the proxy after consulting with the Investment Adviser’s Portfolio Management Group and/or the Investment Adviser’s Legal and Compliance Department and concluding that the vote cast is in its client’s best interest notwithstanding the conflict. A copy of the Fund’s Proxy Voting Policy and Procedures are attached as Exhibit 99.PROXYPOL, a copy of the Fund’s Global Corporate Governance & Engagement Principles are attached as Exhibit 99.GLOBAL.CORP.GOV and a copy of the Fund’s Corporate Governance and Proxy Voting Guidelines for U.S. Securities are attached as Exhibit 99.US.CORP.GOV. Information on how the Fund voted proxies relating to portfolio securities during the most recent 12-month period ended June 30 is available without charge, (i) at www.blackrock.com and (ii) on the SEC’s website at http://www.sec.gov. |
| Item 8 – | Portfolio Managers of Closed-End Management Investment Companies |
(a)(1) As of the date of filing this Report:
The registrant is managed by a team of investment professionals comprised of Theodore R. Jaeckel, Jr., CFA, Managing Director at BlackRock, Walter O’Connor, CFA, Managing Director at BlackRock, Michael Perilli, CFA, Director at BlackRock, and Phillip Soccio, CFA, Director at BlackRock. Each of the foregoing investment professional is a member of BlackRock’s municipal tax-exempt management group and is jointly responsible for the day-to-day management of the registrant’s portfolio, which includes setting the registrant’s overall investment strategy, overseeing the management of the registrant and/or selection of its investments. Messrs. Jaeckel, O’Connor, Perilli and Soccio have been members of the registrant’s portfolio management team since 2006, 2006, 2022 and 2022, respectively. On or about March 1, 2023, Mr. Jaeckel will retire from BlackRock, Inc., and will no longer serve as a portfolio manager of the registrant.
5
| Portfolio Manager | Biography | |
Theodore R. Jaeckel, Jr., CFA1 | Managing Director of BlackRock since 2006; Managing Director of Merrill Lynch Investment Managers, L.P. (“MLIM”) from 2005 to 2006; Director of MLIM from 1997 to 2005. | |
Walter O’Connor, CFA | Managing Director of BlackRock since 2006; Managing Director of MLIM from 2003 to 2006; Director of MLIM from 1998 to 2003. | |
Michael Perilli, CFA | Director of BlackRock since 2021; Vice President of BlackRock from 2017 to 2020; Associate of BlackRock from 2008 to 2016. | |
Phillip Soccio, CFA | Director of BlackRock since 2009; Vice President of BlackRock from 2005 to 2008. |
1 On or about March 1, 2023, Theodore R. Jaeckel, Jr. will retire from BlackRock, Inc., and will no longer serve as a portfolio manager of the registrant.
(a)(2) As of July 31, 2022:
(ii) Number of Other Accounts Managed and Assets by Account Type | (iii) Number of Other Accounts and Assets for Which Advisory Fee is Performance-Based | |||||||||||
(i) Name of Portfolio Manager | Other Registered Investment Companies | Other Pooled Investment Vehicles | Other Accounts | Other Registered Investment Companies | Other Pooled Investment Vehicles | Other Accounts | ||||||
Theodore R. Jaeckel, Jr., CFA1 | 20 | 0 | 0 | 0 | 0 | 0 | ||||||
| $22.60 Billion | $0 | $0 | $0 | $0 | $0 | |||||||
Walter O’Connor, CFA | 19 | 0 | 0 | 0 | 0 | 0 | ||||||
| $26.97 Billion | $0 | $0 | $0 | $0 | $0 | |||||||
Michael Perilli, CFA | 14 | 0 | 0 | 0 | 0 | 0 | ||||||
| $7.48 Billion | $0 | $0 | $0 | $0 | $0 | |||||||
Phillip Soccio, CFA | 11 | 0 | 0 | 0 | 0 | 0 | ||||||
| $5.66 Billion | $0 | $0 | $0 | $0 | $0 | |||||||
1 On or about March 1, 2023, Theodore R. Jaeckel, Jr. will retire from BlackRock, Inc., and will no longer serve as a portfolio manager of the registrant.
(iv) Portfolio Manager Potential Material Conflicts of Interest
BlackRock has built a professional working environment, firm-wide compliance culture and compliance procedures and systems designed to protect against potential incentives that may favor one account over another. BlackRock has adopted policies and procedures that address the allocation of investment opportunities, execution of portfolio transactions, personal trading by employees and other potential conflicts of interest that are designed to ensure that all client accounts are treated equitably over time. Nevertheless, BlackRock furnishes investment management and advisory services to numerous clients in addition to the Fund, and BlackRock may, consistent with applicable law, make investment recommendations to other clients or accounts (including accounts which are hedge funds or have performance or higher fees paid to BlackRock, or in which portfolio managers have a personal interest in the receipt of such fees), which may be the same as or different from those made to the Fund. In addition, BlackRock, Inc., its affiliates and significant shareholders and any officer, director, shareholder or employee may or may not have an interest in the securities whose purchase and sale BlackRock recommends to the Fund. BlackRock, Inc., or any of its affiliates or significant shareholders, or any officer, director, shareholder, employee or any member of their families may take different actions than those recommended to the Fund by BlackRock with respect to the same securities. Moreover, BlackRock may refrain from rendering any advice or services concerning securities of companies of which any of BlackRock, Inc.’s (or its affiliates’ or significant shareholders’) officers, directors or employees are directors or officers, or companies as to which BlackRock, Inc. or any of its affiliates or significant shareholders or the officers, directors and employees of any of them has any substantial economic interest or possesses material non-public information. Certain portfolio managers also may manage accounts whose investment strategies may at times be opposed to the strategy utilized for a fund. It should also be noted that a portfolio manager
6
may be managing hedge fund and/or long only accounts, or may be part of a team managing hedge fund and/or long only accounts, subject to incentive fees. Such portfolio managers may therefore be entitled to receive a portion of any incentive fees earned on such accounts. Currently, the portfolio managers of this Fund are not entitled to receive a portion of incentive fees of other accounts.
As a fiduciary, BlackRock owes a duty of loyalty to its clients and must treat each client fairly. When BlackRock purchases or sells securities for more than one account, the trades must be allocated in a manner consistent with its fiduciary duties. BlackRock attempts to allocate investments in a fair and equitable manner among client accounts, with no account receiving preferential treatment. To this end, BlackRock, Inc. has adopted policies that are intended to ensure reasonable efficiency in client transactions and provide BlackRock with sufficient flexibility to allocate investments in a manner that is consistent with the particular investment discipline and client base, as appropriate.
(a)(3) As of July 31, 2022:
Portfolio Manager Compensation Overview
The discussion below describes the portfolio managers’ compensation as of July 31, 2022.
BlackRock’s financial arrangements with its portfolio managers, its competitive compensation and its career path emphasis at all levels reflect the value senior management places on key resources. Compensation may include a variety of components and may vary from year to year based on a number of factors. The principal components of compensation include a base salary, a performance-based discretionary bonus, participation in various benefits programs and one or more of the incentive compensation programs established by BlackRock.
Base Compensation. Generally, portfolio managers receive base compensation based on their position with the firm.
Discretionary Incentive Compensation. Discretionary incentive compensation is a function of several components: the performance of BlackRock, Inc., the performance of the portfolio manager’s group within BlackRock, the investment performance, including risk-adjusted returns, of the firm’s assets under management or supervision by that portfolio manager relative to predetermined benchmarks, and the individual’s performance and contribution to the overall performance of these portfolios and BlackRock. In most cases, these benchmarks are the same as the benchmark or benchmarks against which the performance of the Funds or other accounts managed by the portfolio managers are measured. Among other things, BlackRock’s Chief Investment Officers make a subjective determination with respect to each portfolio manager’s compensation based on the performance of the Funds and other accounts managed by each portfolio manager relative to the various benchmarks. Performance of fixed income funds is measured on a pre-tax and/or after-tax basis over various time periods including 1-, 3- and 5- year periods, as applicable. With respect to these portfolio managers, such benchmarks for the Fund and other accounts are: a combination of market-based indices (e.g., Bloomberg Municipal Bond Index), certain customized indices and certain fund industry peer groups.
7
Distribution of Discretionary Incentive Compensation. Discretionary incentive compensation is distributed to portfolio managers in a combination of cash, deferred BlackRock, Inc. stock awards, and/or deferred cash awards that notionally track the return of certain BlackRock investment products.
Portfolio managers receive their annual discretionary incentive compensation in the form of cash. Portfolio managers whose total compensation is above a specified threshold also receive deferred BlackRock, Inc. stock awards annually as part of their discretionary incentive compensation. Paying a portion of discretionary incentive compensation in the form of deferred BlackRock, Inc. stock puts compensation earned by a portfolio manager for a given year “at risk” based on BlackRock’s ability to sustain and improve its performance over future periods. In some cases, additional deferred BlackRock, Inc. stock may be granted to certain key employees as part of a long-term incentive award to aid in retention, align interests with long-term shareholders and motivate performance. Deferred BlackRock, Inc. stock awards are generally granted in the form of BlackRock, Inc. restricted stock units that vest pursuant to the terms of the applicable plan and, once vested, settle in BlackRock, Inc. common stock. The portfolio managers of this Fund have deferred BlackRock, Inc. stock awards.
For certain portfolio managers, a portion of the discretionary incentive compensation is also distributed in the form of deferred cash awards that notionally track the returns of select BlackRock investment products they manage, which provides direct alignment of portfolio manager discretionary incentive compensation with investment product results. Deferred cash awards vest ratably over a number of years and, once vested, settle in the form of cash. Only portfolio managers who manage specified products and whose total compensation is above a specified threshold are eligible to participate in the deferred cash award program.
Other Compensation Benefits. In addition to base salary and discretionary incentive compensation, portfolio managers may be eligible to receive or participate in one or more of the following:
Incentive Savings Plans — BlackRock, Inc. has created a variety of incentive savings plans in which BlackRock, Inc. employees are eligible to participate, including a 401(k) plan, the BlackRock Retirement Savings Plan (RSP), and the BlackRock Employee Stock Purchase Plan (ESPP). The employer contribution components of the RSP include a company match equal to 50% of the first 8% of eligible pay contributed to the plan capped at $5,000 per year, and a company retirement contribution equal to 3-5% of eligible compensation up to the Internal Revenue Service limit ($305,000 for 2022). The RSP offers a range of investment options, including registered investment companies and collective investment funds managed by the firm. BlackRock, Inc. contributions follow the investment direction set by participants for their own contributions or, absent participant investment direction, are invested into a target date fund that corresponds to, or is closest to, the year in which the participant attains age 65. The ESPP allows for investment in BlackRock, Inc. common stock at a 5% discount on the fair market value of the stock on the purchase date. Annual participation in the ESPP is limited to the purchase of 1,000 shares of common stock or a dollar value of $25,000 based on its fair market value on the purchase date. All of the eligible portfolio managers are eligible to participate in these plans.
(a)(4) Beneficial Ownership of Securities – As of July 31, 2022.
8
| Portfolio Manager | Dollar Range of Equity Securities of the Fund Beneficially Owned | |
Theodore R. Jaeckel, Jr., CFA1 | $100,001-$500,000 | |
Walter O’Connor, CFA | $1 - $10,000 | |
Michael Perilli, CFA | $1 - $10,000 | |
Phillip Soccio, CFA | $1 - $10,000 |
1 On or about March 1, 2023, Theodore R. Jaeckel, Jr. will retire from BlackRock, Inc., and will no longer serve as a portfolio manager of the registrant.
(b) Not Applicable
| Item 9 – | Purchases of Equity Securities by Closed-End Management Investment Company and Affiliated Purchasers – Not Applicable due to no such purchases during the period covered by this report. |
| Item 10 – | Submission of Matters to a Vote of Security Holders – There have been no material changes to these procedures. |
| Item 11 – | Controls and Procedures |
(a) The registrant’s principal executive and principal financial officers, or persons performing similar functions, have concluded that the registrant’s disclosure controls and procedures (as defined in Rule 30a-3(c) under the Investment Company Act of 1940, as amended (the “1940 Act”)) are effective as of a date within 90 days of the filing of this report based on the evaluation of these controls and procedures required by Rule 30a-3(b) under the 1940 Act and Rule 13a-15(b) under the Securities Exchange Act of 1934, as amended.
(b) There were no changes in the registrant’s internal control over financial reporting (as defined in Rule 30a-3(d) under the 1940 Act) that occurred during the period covered by this report that have materially affected, or are reasonably likely to materially affect, the registrant’s internal control over financial reporting.
| Item 12 – | Disclosure of Securities Lending Activities for Closed-End Management Investment Companies – Not Applicable |
| Item 13 – | Exhibits attached hereto |
(a)(1) Code of Ethics – See Item 2
(a)(2) Section 302 Certifications are attached
(a)(3) Any written solicitation to purchase securities under Rule 23c-1 – Not Applicable
(a)(4) Change in Registrant’s independent public accountant – Not Applicable
(b) Section 906 Certifications are attached
(c) Consent of Independent Registered Public Accounting Firm
9
Pursuant to the requirements of the Securities Exchange Act of 1934 and the Investment Company Act of 1940, the registrant has duly caused this report to be signed on its behalf by the undersigned, thereunto duly authorized.
BlackRock Municipal Income Trust II
| By: | /s/ John M. Perlowski | |||
| John M. Perlowski | ||||
| Chief Executive Officer (principal executive officer) of | ||||
| BlackRock Municipal Income Trust II |
Date: September 23, 2022
Pursuant to the requirements of the Securities Exchange Act of 1934 and the Investment Company Act of 1940, this report has been signed below by the following persons on behalf of the registrant and in the capacities and on the dates indicated.
| By: | /s/ John M. Perlowski | |||
| John M. Perlowski | ||||
| Chief Executive Officer (principal executive officer) of | ||||
| BlackRock Municipal Income Trust II |
Date: September 23, 2022
| By: | /s/ Trent Walker | |||
| Trent Walker | ||||
| Chief Financial Officer (principal financial officer) of | ||||
| BlackRock Municipal Income Trust II |
Date: September 23, 2022
10