UNITED STATES
SECURITIES AND EXCHANGE COMMISSION
Washington, D.C. 20549
FORM N-CSR
CERTIFIED SHAREHOLDER REPORT OF REGISTERED MANAGEMENT INVESTMENT COMPANIES
Investment Company Act file number 811-21128
Legg Mason Partners Variable Equity Trust
(Exact name of registrant as specified in charter)
55 Water Street, New York, NY 10041
(Address of principal executive offices) (Zip code)
Robert I. Frenkel, Esq.
Legg Mason & Co., LLC
300 First Stamford Place, 4th Floor
Stamford, CT 06902
(Name and address of agent for service)
Registrant’s telephone number, including area code: (800) 451-2010
Date of fiscal year end: December 31
Date of reporting period: June 30, 2008
ITEM 1. REPORT TO STOCKHOLDERS.
The Semi-Annual Report to Stockholders is filed herewith.
SEMI-ANNUAL REPORT / JUNE 30, 2008
Legg Mason Partners
Variable Capital
Portfolio
Managed by CLEARBRIDGE ADVISORS
INVESTMENT PRODUCTS: NOT FDIC INSURED • NO BANK GUARANTEE • MAY LOSE VALUE
Portfolio objective
The Portfolio seeks capital appreciation through investment in securities which the portfolio managers believe have above-average capital appreciation potential.
What’s inside
| | | |
| | | |
| Letter from the chairman | | I |
| | | |
| Portfolio at a glance | | 1 |
| | | |
| Portfolio expenses | | 2 |
| | | |
| Schedule of investments | | 4 |
| | | |
| Statement of assets and liabilities | | 7 |
| | | |
| Statement of operations | | 8 |
| | | |
| Statements of changes in net assets | | 9 |
| | | |
| Financial highlights | | 10 |
| | | |
| Notes to financial statements | | 11 |
Legg Mason Partners Fund Advisor, LLC (“LMPFA”) is the Portfolio’s investment manager and ClearBridge Advisors, LLC (“ClearBridge”) is the Portfolio’s subadviser. LMPFA and ClearBridge are wholly-owned subsidiaries of Legg Mason, Inc.
Letter from the chairman
R. Jay Gerken, CFA
Chairman, President and Chief Executive Officer
Dear Shareholder,
The U.S. economy was lackluster during the six-month reporting period ended June 30, 2008. Looking back, third quarter 2007 U.S. gross domestic product (“GDP”)i growth was 4.8%, its strongest showing in four years. However, continued weakness in the housing market, an ongoing credit crunch and soaring oil and food prices then took their toll on the economy. During the fourth quarter of 2007, GDP growth was -0.2%. First quarter 2008 GDP growth was a modest 0.9%. The advance estimate for second quarter 2008 GDP growth was 1.9%.
The debate continues as to whether or not the U.S. will fall into a recession. However, it is a moot point for many people, as the job market continues to weaken and soaring energy and food prices are tempering consumer spending. In terms of the employment picture, the U.S. Department of Labor reported that payroll employment declined in each of the first six months of 2008, and the unemployment rate rose to 5.5% in May, its highest level since October 2004. Oil prices surpassed $140 a barrel in June 2008, with the average price for a gallon of gas exceeding $4 for the first time ever.ii These factors, coupled with a sputtering housing market, contributed to the Consumer Confidence Index falling for the sixth consecutive month in June 2008, reaching its lowest level since 1992.iii
Ongoing issues related to the housing and subprime mortgage markets and seizing credit markets prompted the Federal Reserve Board (“Fed”)iv to take aggressive and, in some cases, unprecedented actions. Beginning in September 2007, the Fed reduced the federal funds ratev from 5.25% to 4.75%. This marked the first such reduction since June 2003. The Fed then reduced the federal funds rate on six additional occasions through April 2008, bringing the federal funds rate to 2.00%. However, the Fed then shifted gears in the face of mounting inflationary prices and a weakening U.S. dollar. At its meeting in June, the Fed held rates steady and stated: “Recent information indicates that overall economic activity continues to expand, partly reflecting some firming in household spending. However, labor markets have softened further and financial markets remain under considerable stress. Tight credit conditions, the ongoing housing
Legg Mason Partners Variable Capital Portfolio  I
I
Letter from the chairman continued
contraction, and the rise in energy prices are likely to weigh on economic growth over the next few quarters.”
In addition to the interest rate cuts, the Fed took several actions to improve liquidity in the credit markets. In March 2008, the Fed established a new lending program allowing certain brokerage firms, known as primary dealers, to also borrow from its discount window. The Fed also increased the maximum term for discount window loans from 30 to 90 days. Then, in mid-March, the Fed played a major role in facilitating the purchase of Bear Stearns by JPMorgan Chase.
The U.S. stock market was not for the faint of heart during the reporting period. Stock prices fell during the first three months of the reporting period due, in part, to the severe credit crunch, weakening corporate profits, rising inflation and fears of an impending recession. The market then reversed course and posted positive returns in April and May 2008. The market’s rebound was largely attributed to hopes that the U.S. would skirt a recession and that corporate profits would rebound as the year progressed. Stock prices then moved sharply lower in June, with the S&P 500 Indexvi falling 8.43% for the month. This represented its worst monthly performance since September 2002 and its weakest month of June since the Great Depression in 1930. All told, the S&P 500 Index returned -11.91% during the six-month reporting period ended June 30, 2008, and as of that date was almost 20% lower than its peak in October 2007.
Looking at the U.S. stock market more closely, mid-cap stocks outperformed their small- and large-cap counterparts, as the Russell Midcapvii, Russell 2000viii and Russell 1000ix Indexes returned -7.57%, -9.37% and -11.20%, respectively, during the six-month period ended June 30, 2008. From an investment style perspective, growth stocks outperformed value stocks on a relative basis, with the Russell 3000 Growthx and Russell 3000 Valuexi Indexes returning -9.04% and -13.28%, respectively.
II Legg Mason Partners Variable Capital Portfolio
Performance review
For the six months ended June 30, 2008, Legg Mason Partners Variable Capital Portfolio1 returned -8.14%. The Portfolio’s unmanaged benchmark, the Russell 3000 Indexxii, returned -11.05% for the same period. The Lipper Variable Multi-Cap Core Funds Category Average2 returned -11.15% over the same time frame.
| |
| | PERFORMANCE SNAPSHOT as of June 30, 2008 (unaudited) |
| | | | | |
| | | 6 MONTHS
|
| | | (not annualized) |
Variable Capital Portfolio1 | | | -8.14% | |
| | | | | |
| Russell 3000 Index | | | -11.05% | |
| | | | | |
Lipper Variable Multi-Cap Core Funds Category Average2 | | | -11.15% | |
| | | | | |
The performance shown represents past performance. Past performance is no guarantee of future results and current performance may be higher or lower than the performance shown above. Principal value and investment returns will fluctuate and investors’ shares, when redeemed, may be worth more or less than their original cost.
Portfolio returns assume the reinvestment of all distributions, including returns of capital, if any, at net asset value and the deduction of all Portfolio expenses.
Performance figures reflect expense reimbursements and/or fee waivers, without which the performance would have been lower.
| |
| | TOTAL ANNUAL OPERATING EXPENSES (unaudited) |
As of the Portfolio’s most current prospectus dated April 28, 2008, the gross total operating expense ratio was 1.11%.
As a result of an expense limitation, the ratio of expenses, other than interest, brokerage, taxes and extraordinary expenses, to average net assets will not exceed 1.00%. This expense limitation may be reduced or terminated at any time.
1 The Portfolio is an underlying investment option of various variable annuity and variable life insurance products. The Portfolio’s performance returns do not reflect the deduction of expenses imposed in connection with investing in variable annuity or variable life insurance contracts, such as administrative fees, account charges and surrender charges, which, if reflected, would reduce the performance of the Portfolio. Past performance is no guarantee of future results.
2 Lipper, Inc., a wholly-owned subsidiary of Reuters, provides independent insight on global collective investments. Returns are based on the six-month period ended June 30, 2008 including the reinvestment of all distributions, including returns of capital, if any, calculated among the 240 funds in the Portfolio’s Lipper Category.
Legg Mason Partners Variable Capital Portfolio III
Letter from the chairman continued
Special shareholder notices
Brian M. Angerame and Derek J. Deutsch, CFA, each of whom is a Managing Director and Portfolio Manager for ClearBridge Advisors, LLC, the Portfolio’s subadviser, manage the day-to-day operations of the Portfolio, including initiating buy/sell orders and coordinating with research personnel. Mr. Angerame has been a co-manager of the Portfolio since November 2007. Mr. Deutsch has been a co-manager of the Portfolio since April 2008. Mr. Angerame has been a Portfolio Manager since 2005 and was formerly a sector manager at the subadviser with coverage of Consumer Discretionary, Consumer Staples and Industrials. He joined the subadviser in 2000. Mr. Deutsch has been a Portfolio Manager since 2005 and was formerly a sector manager at the subadviser with coverage of Health Care. He joined the subadviser in 1999. Mr. Angerame and Mr. Deutsch have over 13 years and 10 years of investment industry experience, respectively.
Prior to November 12, 2007, the Portfolio operated under the name “Legg Mason Partners Variable Multiple Discipline Portfolio — All Cap Growth and Value,” had a different investment objective and followed different investment strategies.
Information about your portfolio
As you may be aware, several issues in the mutual fund industry have come under the scrutiny of federal and state regulators. Affiliates of the Portfolio’s manager have, in recent years, received requests for information from various government regulators regarding market timing, late trading, fees, and other mutual fund issues in connection with various investigations. The regulators appear to be examining, among other things, the Portfolio’s response to market timing and shareholder exchange activity, including compliance with prospectus disclosure related to these subjects. The Portfolio is not in a position to predict the outcome of these requests and investigations.
Important information with regard to recent regulatory developments that may affect the Portfolio is contained in the “Notes to financial statements” included in this report.
As always, thank you for your continued confidence in our stewardship of your assets. We look forward to helping you meet your financial goals.
Sincerely,
R. Jay Gerken, CFA
Chairman, President and Chief Executive Officer
July 31, 2008
IV Legg Mason Partners Variable Capital Portfolio
The information provided is not intended to be a forecast of future events, a guarantee of future results or investment advice. Views expressed may differ from those of the firm as a whole.
RISKS: Diversification does not assure against loss. Stocks are subject to market fluctuations. The Portfolio may invest in small- and mid-cap companies that may involve a higher degree of risk and volatility than investments in large-cap companies. The Portfolio may use derivatives, such as options and futures, which can be illiquid, may disproportionately increase losses, and have a potentially large impact on Portfolio performance. Please see the Portfolio’s prospectus for more information on these and other risks.
All index performance reflects no deduction for fees, expenses or taxes. Please note that an investor cannot invest directly in an index.
| | |
| i | | Gross domestic product (“GDP”) is the market value of all final goods and services produced within a country in a given period of time. |
| |
| ii | | Source: Bloomberg, 7/08. |
| |
| iii | | Source: The Conference Board, 7/08. |
| |
| iv | | The Federal Reserve Board (“Fed”) is responsible for the formulation of policies designed to promote economic growth, full employment, stable prices, and a sustainable pattern of international trade and payments. |
| |
| v | | The federal funds rate is the rate charged by one depository institution on an overnight sale of immediately available funds (balances at the Federal Reserve) to another depository institution; the rate may vary from depository institution to depository institution and from day to day. |
| |
| vi | | The S&P 500 Index is an unmanaged index of 500 stocks that is generally representative of the performance of larger companies in the U.S. |
| |
| vii | | The Russell Midcap Index measures the performance of the 800 smallest companies in the Russell 1000 Index, which represents approximately 25% of the total market capitalization of the Russell 1000 Index. |
| |
| viii | | The Russell 2000 Index measures the performance of the 2,000 smallest companies in the Russell 3000 Index, which represents approximately 8% of the total market capitalization of the Russell 3000 Index. |
| |
| ix | | The Russell 1000 Index measures the performance of the 1,000 largest companies in the Russell 3000 Index, which represents approximately 92% of the total market capitalization of the Russell 3000 Index. |
| |
| x | | The Russell 3000 Growth Index measures the performance of those Russell 3000 Index companies with higher price-to-book ratios and higher forecasted growth values. (A price-to-book ratio is the price of a stock compared to the difference between a company’s assets and liabilities.) |
| |
| xi | | The Russell 3000 Value Index measures the performance of those Russell 3000 Index companies with lower price-to-book ratios and lower forecasted growth values. |
| |
| xii | | The Russell 3000 Index measures the performance of the 3,000 largest U.S. companies based on total market capitalization, which represents approximately 98% of the U.S. equity market. |
Legg Mason Partners Variable Capital Portfolio V
(This page is intentionally left blank.)
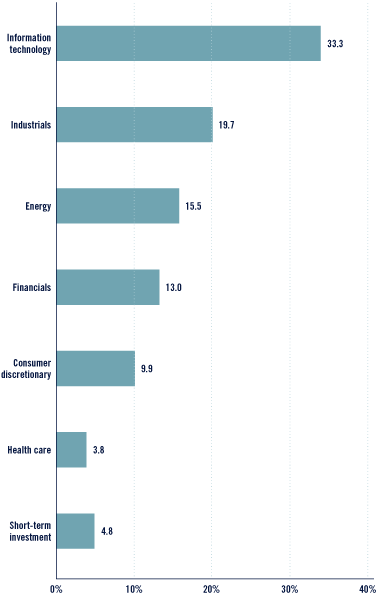
Portfolio at a glance (unaudited)
| |
| | INVESTMENT BREAKDOWN (%) As a percent of total investments — June 30, 2008 |
Legg Mason Partners Variable Capital Portfolio 2008 Semi-Annual Report 1
Portfolio expenses (unaudited)
Example
As a shareholder of the Portfolio, you may incur two types of costs: (1) transaction costs and (2) ongoing costs, including management fees and other Portfolio expenses. This example is intended to help you understand your ongoing costs (in dollars) of investing in the Portfolio and to compare these costs with the ongoing costs of investing in other mutual funds.
This example is based on an investment of $1,000 invested on January 1, 2008 and held for the six months ended June 30, 2008.
Actual expenses
The table below titled “Based on Actual Total Return” provides information about actual account values and actual expenses. You may use the information provided in this table, together with the amount you invested, to estimate the expenses that you paid over the period. To estimate the expenses you paid on your account, divide your ending account value by $1,000 (for example, an $8,600 ending account value divided by $1,000 = 8.6), then multiply the result by the number under the heading entitled “Expenses Paid During the Period”.
| |
| | BASED ON ACTUAL TOTAL RETURN1 |
| | | | | | | | | | | | | | | | | | | |
| | | BEGINNING
| | ENDING
| | ANNUALIZED
| | EXPENSES
|
ACTUAL TOTAL
| | ACCOUNT
| | ACCOUNT
| | EXPENSE
| | PAID DURING
|
| RETURN2 | | VALUE | | VALUE | | RATIO | | THE PERIOD3 |
| | (8.14 | )% | | $ | 1,000.00 | | | $ | 918.60 | | | | 1.00% | | | $ | 4.77 | |
| | | | | | | | | | | | | | | | | | | |
| | |
| 1 | | For the six months ended June 30, 2008. |
| |
| 2 | | Assumes reinvestment of all distributions, including returns of capital, if any, at net asset value. Total return is not annualized, as it may not be representative of the total return for the year. Total return does not reflect expenses associated with the separate account such as administrative fees, account charges and surrender charges, which, if reflected, would reduce the total return. Performance figures may reflect fee waivers and/or expense reimbursements. In the absence of fee waivers and/or expense reimbursements, the total return would have been lower. Past performance is no guarantee of future results. |
| |
| 3 | | Expenses (net of fee waivers and/or expense reimbursements) are equal to the Portfolio’s annualized expense ratio multiplied by the average account value over the period, multiplied by the number of days in the most recent fiscal half-year, then divided by 366. |
2 Legg Mason Partners Variable Capital Portfolio 2008 Semi-Annual Report
Hypothetical example for comparison purposes
The table below titled “Based on Hypothetical Total Return” provides information about hypothetical account values and hypothetical expenses based on the actual expense ratio and an assumed rate of return of 5.00% per year before expenses, which is not the Portfolio’s actual return. The hypothetical account values and expenses may not be used to estimate the actual ending account balance or expenses you paid for the period. You may use the information provided in this table to compare the ongoing costs of investing in the Portfolio and other funds. To do so, compare the 5.00% hypothetical example relating to the Portfolio with the 5.00% hypothetical examples that appear in the shareholder reports of the other funds.
Please note that the expenses shown in the table below are meant to highlight your ongoing costs only and do not reflect any transactional costs. Therefore, the table is useful in comparing ongoing costs only, and will not help you determine the relative total costs of owning different funds. In addition, if these transaction costs were included, your costs would have been higher.
| |
| | BASED ON HYPOTHETICAL TOTAL RETURN1 |
| | | | | | | | | | | | | | | | | | | |
HYPOTHETICAL
| | BEGINNING
| | ENDING
| | ANNUALIZED
| | EXPENSES
|
ANNUALIZED
| | ACCOUNT
| | ACCOUNT
| | EXPENSE
| | PAID DURING
|
| TOTAL RETURN | | VALUE | | VALUE | | RATIO | | THE PERIOD2 |
| | 5.00% | | | $ | 1,000.00 | | | $ | 1,019.89 | | | | 1.00% | | | $ | 5.02 | |
| | | | | | | | | | | | | | | | | | | |
| | |
| 1 | | For the six months ended June 30, 2008. |
| |
| 2 | | Expenses (net of fee waivers and/or expense reimbursements) are equal to the Portfolio’s annualized expense ratio, multiplied by the average account value over the period, multiplied by the number of days in the most recent fiscal half-year, then divided by 366. |
Legg Mason Partners Variable Capital Portfolio 2008 Semi-Annual Report 3
Schedule of investments (unaudited)
June 30, 2008
| |
| | LEGG MASON PARTNERS VARIABLE CAPITAL PORTFOLIO |
| | | | | | | | | |
| SHARES | | | SECURITY | | VALUE | |
| |
| COMMON STOCKS — 95.4% |
| | | | | | | | | |
| CONSUMER DISCRETIONARY — 9.9% |
| | | | | | | | | |
| | | | | Leisure Equipment & Products — 1.0% | | | | |
| | | | | | | | | |
| | 799,900 | | | Li Ning Co., Ltd. | | $ | 1,846,598 | |
| | | | | | | | | |
| | | | | Media — 6.2% | | | | |
| | | | | | | | | |
| | 275,000 | | | Lions Gate Entertainment Corp.* | | | 2,849,000 | |
| | | | | | | | | |
| | 360,000 | | | Warner Music Group Corp. | | | 2,570,400 | |
| | | | | | | | | |
| | 615,000 | | | WPP Group PLC | | | 5,928,576 | |
| | | | | | | | | |
| | | | | Total Media | | | 11,347,976 | |
| | | | | | | | | |
| | | | | Specialty Retail — 2.7% | | | | |
| | | | | | | | | |
| | 160,000 | | | American Eagle Outfitters Inc. | | | 2,180,800 | |
| | | | | | | | | |
| | 60,000 | | | Sherwin-Williams Co. | | | 2,755,800 | |
| | | | | | | | | |
| | | | | Total Specialty Retail | | | 4,936,600 | |
| | | | | | | | | |
| | | | | TOTAL CONSUMER DISCRETIONARY | | | 18,131,174 | |
| | | | | | | | | |
| ENERGY — 15.6% |
| | | | | | | | | |
| | | | | Energy Equipment & Services — 7.4% | | | | |
| | | | | | | | | |
| | 26,300 | | | Diamond Offshore Drilling Inc. | | | 3,659,382 | |
| | | | | | | | | |
| | 370,000 | | | ION Geophysical Corp.* | | | 6,456,500 | |
| | | | | | | | | |
| | 67,000 | | | Nabors Industries Ltd.* | | | 3,298,410 | |
| | | | | | | | | |
| | | | | Total Energy Equipment & Services | | | 13,414,292 | |
| | | | | | | | | |
| | | | | Oil, Gas & Consumable Fuels — 8.2% | | | | |
| | | | | | | | | |
| | 50,000 | | | Comstock Resources Inc.* | | | 4,221,500 | |
| | | | | | | | | |
| | 90,000 | | | El Paso Corp. | | | 1,956,600 | |
| | | | | | | | | |
| | 100,000 | | | Newfield Exploration Co.* | | | 6,525,000 | |
| | | | | | | | | |
| | 35,000 | | | SandRidge Energy Inc.* | | | 2,260,300 | |
| | | | | | | | | |
| | | | | Total Oil, Gas & Consumable Fuels | | | 14,963,400 | |
| | | | | | | | | |
| | | | | TOTAL ENERGY | | | 28,377,692 | |
| | | | | | | | | |
| FINANCIALS — 13.0% |
| | | | | | | | | |
| | | | | Capital Markets — 3.2% | | | | |
| | | | | | | | | |
| | 160,000 | | | Invesco Ltd. | | | 3,836,800 | |
| | | | | | | | | |
| | 105,000 | | | Lehman Brothers Holdings Inc. | | | 2,080,050 | |
| | | | | | | | | |
| | | | | Total Capital Markets | | | 5,916,850 | |
| | | | | | | | | |
| | | | | Consumer Finance — 3.2% | | | | |
| | | | | | | | | |
| | 155,000 | | | American Express Co. | | | 5,838,850 | |
| | | | | | | | | |
| | | | | Diversified Financial Services — 2.9% | | | | |
| | | | | | | | | |
| | 154,000 | | | JPMorgan Chase & Co. | | | 5,283,740 | |
| | | | | | | | | |
| | | | | Insurance — 2.2% | | | | |
| | | | | | | | | |
| | 150,500 | | | American International Group Inc. | | | 3,982,230 | |
| | | | | | | | | |
See Notes to Financial Statements.
4 Legg Mason Partners Variable Capital Portfolio 2008 Semi-Annual Report
| |
| | LEGG MASON PARTNERS VARIABLE CAPITAL PORTFOLIO |
| | | | | | | | | |
| SHARES | | | SECURITY | | VALUE | |
| | | | | Thrifts & Mortgage Finance — 1.5% | | | | |
| | | | | | | | | |
| | 90,000 | | | People’s United Financial Inc. | | $ | 1,404,000 | |
| | | | | | | | | |
| | 75,000 | | | Washington Federal Inc. | | | 1,357,500 | |
| | | | | | | | | |
| | | | | Total Thrifts & Mortgage Finance | | | 2,761,500 | |
| | | | | | | | | |
| | | | | TOTAL FINANCIALS | | | 23,783,170 | |
| | | | | | | | | |
| HEALTH CARE — 3.8% |
| | | | | | | | | |
| | | | | Health Care Providers & Services — 1.8% | | | | |
| | | | | | | | | |
| | 66,000 | | | Pediatrix Medical Group Inc.* | | | 3,249,180 | |
| | | | | | | | | |
| | | | | Pharmaceuticals — 2.0% | | | | |
| | | | | | | | | |
| | 75,000 | | | Shire Ltd., ADR | | | 3,684,750 | |
| | | | | | | | | |
| | | | | TOTAL HEALTH CARE | | | 6,933,930 | |
| | | | | | | | | |
| INDUSTRIALS — 19.8% |
| | | | | | | | | |
| | | | | Aerospace & Defense — 1.0% | | | | |
| | | | | | | | | |
| | 20,000 | | | L-3 Communications Holdings Inc. | | | 1,817,400 | |
| | | | | | | | | |
| | | | | Commercial Services & Supplies — 1.4% | | | | |
| | | | | | | | | |
| | 126,000 | | | Monster Worldwide Inc.* | | | 2,596,860 | |
| | | | | | | | | |
| | | | | Construction & Engineering — 6.2% | | | | |
| | | | | | | | | |
| | 140,000 | | | Quanta Services Inc.* | | | 4,657,800 | |
| | | | | | | | | |
| | 107,000 | | | Shaw Group Inc.* | | | 6,611,530 | |
| | | | | | | | | |
| | | | | Total Construction & Engineering | | | 11,269,330 | |
| | | | | | | | | |
| | | | | Electrical Equipment — 1.6% | | | | |
| | | | | | | | | |
| | 75,000 | | | Thomas & Betts Corp.* | | | 2,838,750 | |
| | | | | | | | | |
| | | | | Industrial Conglomerates — 9.6% | | | | |
| | | | | | | | | |
| | 339,500 | | | General Electric Co. | | | 9,061,255 | |
| | | | | | | | | |
| | 65,000 | | | McDermott International Inc.* | | | 4,022,850 | |
| | | | | | | | | |
| | 110,000 | | | Tyco International Ltd. | | | 4,404,400 | |
| | | | | | | | | |
| | | | | Total Industrial Conglomerates | | | 17,488,505 | |
| | | | | | | | | |
| | | | | TOTAL INDUSTRIALS | | | 36,010,845 | |
| | | | | | | | | |
| INFORMATION TECHNOLOGY — 33.3% |
| | | | | | | | | |
| | | | | Communications Equipment — 10.0% | | | | |
| | | | | | | | | |
| | 444,000 | | | Cisco Systems Inc.* | | | 10,327,440 | |
| | | | | | | | | |
| | 300,000 | | | Comverse Technology Inc.* | | | 5,085,000 | |
| | | | | | | | | |
| | 235,000 | | | Foundry Networks Inc.* | | | 2,777,700 | |
| | | | | | | | | |
| | | | | Total Communications Equipment | | | 18,190,140 | |
| | | | | | | | | |
| | | | | Computers & Peripherals — 6.9% | | | | |
| | 313,000 | | | EMC Corp.* | | | 4,597,970 | |
| | | | | | | | | |
| | 17,000 | | | International Business Machines Corp. | | | 2,015,010 | |
| | | | | | | | | |
| | 200,000 | | | NetApp Inc.* | | | 4,332,000 | |
| | | | | | | | | |
See Notes to Financial Statements.
Legg Mason Partners Variable Capital Portfolio 2008 Semi-Annual Report 5
Schedule of investments (unaudited) continued
June 30, 2008
| |
| | LEGG MASON PARTNERS VARIABLE CAPITAL PORTFOLIO |
| | | | | | | | | |
| SHARES | | | SECURITY | | VALUE | |
| | | | | Computers & Peripherals — 6.9% continued | | | | |
| | | | | | | | | |
| | 315,000 | | | Palm Inc. | | $ | 1,697,850 | |
| | | | | | | | | |
| | | | | Total Computers & Peripherals | | | 12,642,830 | |
| | | | | | | | | |
| | | | | Internet Software & Services — 1.3% | | | | |
| | | | | | | | | |
| | 63,000 | | | VeriSign Inc.* | | | 2,381,400 | |
| | | | | | | | | |
| | | | | IT Services — 5.5% | | | | |
| | | | | | | | | |
| | 245,000 | | | Accenture Ltd., Class A Shares | | | 9,976,400 | |
| | | | | | | | | |
| | | | | Semiconductors & Semiconductor Equipment — 6.0% | | | | |
| | | | | | | | | |
| | 950,000 | | | LSI Corp.* | | | 5,833,000 | |
| | | | | | | | | |
| | 180,000 | | | Texas Instruments Inc. | | | 5,068,800 | |
| | | | | | | | | |
| | | | | Total Semiconductors & Semiconductor Equipment | | | 10,901,800 | |
| | | | | | | | | |
| | | | | Software — 3.6% | | | | |
| | | | | | | | | |
| | 100,000 | | | Blackboard Inc.* | | | 3,823,000 | |
| | | | | | | | | |
| | 115,000 | | | Check Point Software Technologies Ltd.* | | | 2,722,050 | |
| | | | | | | | | |
| | | | | Total Software | | | 6,545,050 | |
| | | | | | | | | |
| | | | | TOTAL INFORMATION TECHNOLOGY | | | 60,637,620 | |
| | | | | | | | | |
| | | | | TOTAL INVESTMENTS BEFORE SHORT-TERM INVESTMENT
(Cost — $191,106,749) | | | 173,874,431 | |
| | | | | | | | | |
FACE
| | | | | | |
| AMOUNT | | | | | | |
| |
| SHORT-TERM INVESTMENT — 4.8% |
| | | | | | | | | |
| | | | | Repurchase Agreement — 4.8% | | | | |
| | | | | | | | | |
| $ | 8,845,000 | | | State Street Bank & Trust Co., dated 6/30/08, 1.120% due 7/1/08; Proceeds due at maturity — $8,845,275; (Fully collateralized by U.S. Treasury Notes, 2.125% due 1/31/10; Market value — 9,022,500) (Cost — $8,845,000) | | | 8,845,000 | |
| | | | | | | | | |
| | | | | TOTAL INVESTMENTS — 100.2%
(Cost — $199,951,749#) | | | 182,719,431 | |
| | | | | | | | | |
| | | | | Liabilities in Excess of Other Assets — (0.2)% | | | (433,783 | ) |
| | | | | | | | | |
| | | | | TOTAL NET ASSETS — 100.0% | | $ | 182,285,648 | |
| | | | | | | | | |
| | |
| * | | Non-income producing security. |
| |
| # | | Aggregate cost for federal income tax purposes is substantially the same. |
| |
| | Abbreviation used in this schedule: |
| |
| | | ADR — American Depositary Receipt |
See Notes to Financial Statements.
6 Legg Mason Partners Variable Capital Portfolio 2008 Semi-Annual Report
Statement of assets and liabilities (unaudited)
June 30, 2008
| | | | | |
| ASSETS: | | | | |
| | | | | |
| Investments, at value (Cost — $199,951,749) | | $ | 182,719,431 | |
| | | | | |
| Cash | | | 771 | |
| | | | | |
| Dividends and interest receivable | | | 239,280 | |
| | | | | |
| Prepaid expenses | | | 334 | |
| | | | | |
Total Assets | | | 182,959,816 | |
| | | | | |
| LIABILITIES: | | | | |
| | | | | |
| Payable for Portfolio shares repurchased | | | 432,723 | |
| | | | | |
| Investment management fee payable | | | 124,634 | |
| | | | | |
| Distribution fees payable | | | 23,656 | |
| | | | | |
| Trustees’ fees payable | | | 1,773 | |
| | | | | |
| Accrued expenses | | | 91,382 | |
| | | | | |
Total Liabilities | | | 674,168 | |
| | | | | |
| TOTAL NET ASSETS | | $ | 182,285,648 | |
| | | | | |
| NET ASSETS: | | | | |
| | | | | |
| Par value (Note 5) | | $ | 158 | |
| | | | | |
| Paid-in capital in excess of par value | | | 195,098,082 | |
| | | | | |
| Undistributed net investment income | | | 234,271 | |
| | | | | |
| Accumulated net realized gain on investments and options written | | | 4,183,434 | |
| | | | | |
| Net unrealized depreciation on investments options written and foreign currencies | | | (17,230,297 | ) |
| | | | | |
| TOTAL NET ASSETS | | $ | 182,285,648 | |
| | | | | |
Shares Outstanding: | | | 15,795,209 | |
| | | | | |
Net Asset Value: | | | $11.54 | |
| | | | | |
See Notes to Financial Statements.
Legg Mason Partners Variable Capital Portfolio 2008 Semi-Annual Report 7
Statement of operations (unaudited)
For the Six Months Ended June 30, 2008
| | | | | |
| INVESTMENT INCOME: | | | | |
| | | | | |
| Dividends | | $ | 1,178,462 | |
| | | | | |
| Interest | | | 87,137 | |
| | | | | |
Total Investment Income | | | 1,265,599 | |
| | | | | |
| EXPENSES: | | | | |
| | | | | |
| Investment management fee (Note 3) | | | 763,838 | |
| | | | | |
| Distribution fees (Note 3) | | | 254,613 | |
| | | | | |
| Shareholders reports | | | 102,637 | |
| | | | | |
| Legal fees | | | 18,575 | |
| | | | | |
| Audit and tax | | | 15,305 | |
| | | | | |
| Trustees’ fees | | | 6,402 | |
| | | | | |
| Insurance | | | 3,665 | |
| | | | | |
| Custody fees | | | 1,816 | |
| | | | | |
| Transfer agent fees | | | 50 | |
| | | | | |
| Miscellaneous expenses | | | 2,552 | |
| | | | | |
Total Expenses | | | 1,169,453 | |
| | | | | |
Less: Fee waivers and/or expense reimbursements (Note 3) | | | (151,004 | ) |
| | | | | |
Net Expenses | | | 1,018,449 | |
| | | | | |
| NET INVESTMENT INCOME | | | 247,150 | |
| | | | | |
| REALIZED AND UNREALIZED GAIN (LOSS) ON INVESTMENTS, OPTIONS WRITTEN AND FOREIGN CURRENCIES (NOTES 1 AND 4): | | | | |
| | | | | |
| Net Realized Gain From: | | | | |
| | | | | |
| Investment transactions | | | 4,129,159 | |
| | | | | |
| Options written | | | 143,368 | |
| | | | | |
Net Realized Gain | | | 4,272,527 | |
| | | | | |
| Change in Net Unrealized Appreciation/Depreciation From: | | | | |
| | | | | |
| Investments | | | (22,339,625 | ) |
| | | | | |
| Options written | | | (32,659 | ) |
| | | | | |
| Foreign currencies | | | 2,021 | |
| | | | | |
| Change in Net Unrealized Appreciation/Depreciation | | | (22,370,263 | ) |
| | | | | |
| Net Loss on Investments, Options Written and Foreign Currency Transactions | | | (18,097,736 | ) |
| | | | | |
| DECREASE IN NET ASSETS FROM OPERATIONS | | $ | (17,850,586 | ) |
| | | | | |
See Notes to Financial Statements.
8 Legg Mason Partners Variable Capital Portfolio 2008 Semi-Annual Report
Statements of changes in net assets
| | | | | | | | | |
FOR THE SIX MONTHS ENDED JUNE 30, 2008 (unaudited)
| | | | | | |
| AND THE YEAR ENDED DECEMBER 31, 2007 | | 2008 | | | 2007 | |
| OPERATIONS: | | | | | | | | |
| | | | | | | | | |
| Net investment income | | $ | 247,150 | | | $ | 1,109,697 | |
| | | | | | | | | |
| Net realized gain | | | 4,272,527 | | | | 50,117,339 | |
| | | | | | | | | |
| Change in net unrealized appreciation/depreciation | | | (22,370,263 | ) | | | (45,445,686 | ) |
| | | | | | | | | |
Increase (Decrease) in Net Assets From Operations | | | (17,850,586 | ) | | | 5,781,350 | |
| | | | | | | | | |
| DISTRIBUTIONS TO SHAREHOLDERS FROM (NOTE 1): | | | | | | | | |
| | | | | | | | | |
| Net investment income | | | (80,005 | ) | | | (975,019 | ) |
| | | | | | | | | |
| Net realized gains | | | (39,398,125 | ) | | | (13,110,062 | ) |
| | | | | | | | | |
Decrease in Net Assets From Distributions to Shareholders | | | (39,478,130 | ) | | | (14,085,081 | ) |
| | | | | | | | | |
| PORTFOLIO SHARE TRANSACTIONS (NOTE 5): | | | | | | | | |
| | | | | | | | | |
| Net proceeds from sale of shares | | | 965,537 | | | | 8,782,413 | |
| | | | | | | | | |
| Reinvestment of distributions | | | 39,478,130 | | | | 14,085,081 | |
| | | | | | | | | |
| Cost of shares repurchased | | | (34,332,145 | ) | | | (52,997,540 | ) |
| | | | | | | | | |
Increase (Decrease) in Net Assets From Portfolio Share Transactions | | | 6,111,522 | | | | (30,130,046 | ) |
| | | | | | | | | |
| DECREASE IN NET ASSETS | | | (51,217,194 | ) | | | (38,433,777 | ) |
| | | | | | | | | |
| NET ASSETS: | | | | | | | | |
| | | | | | | | | |
| Beginning of period | | | 233,502,842 | | | | 271,936,619 | |
| | | | | | | | | |
| End of period* | | $ | 182,285,648 | | | $ | 233,502,842 | |
| | | | | | | | | |
| * Includes undistributed net investment income of: | | | $234,271 | | | | $67,126 | |
| | | | | | | | | |
See Notes to Financial Statements.
Legg Mason Partners Variable Capital Portfolio 2008 Semi-Annual Report 9
Financial highlights
| |
| | FOR A SHARE OF BENEFICIAL OF INTEREST OUTSTANDING THROUGHOUT EACH YEAR ENDED DECEMBER 31, UNLESS OTHERWISE NOTED: |
| | | | | | | | | | | | | | | | | | | | | | | | | |
| | | 20081 | | | 20072 | | | 2006 | | | 2005 | | | 2004 | | | 20032 | |
| NET ASSET VALUE, BEGINNING OF PERIOD | | | $15.76 | | | | $16.42 | | | | $15.24 | | | | $14.82 | | | | $13.99 | | | | $10.65 | |
| | | | | | | | | | | | | | | | | | | | | | | | | |
| INCOME (LOSS) FROM OPERATIONS: |
| | | | | | | | | | | | | | | | | | | | | | | | | |
| Net investment income | | | 0.02 | | | | 0.07 | | | | 0.10 | | | | 0.05 | | | | 0.04 | | | | 0.02 | |
| | | | | | | | | | | | | | | | | | | | | | | | | |
| Net realized and unrealized gain (loss) | | | (1.12 | ) | | | 0.25 | | | | 1.97 | | | | 0.73 | | | | 0.89 | | | | 3.33 | |
| | | | | | | | | | | | | | | | | | | | | | | | | |
Total income (loss) from operations | | | (1.10 | ) | | | 0.32 | | | | 2.07 | | | | 0.78 | | | | 0.93 | | | | 3.35 | |
| | | | | | | | | | | | | | | | | | | | | | | | | |
| LESS DISTRIBUTIONS FROM: | | | | | | | | | | | | | | | | | | | | | | | | |
| | | | | | | | | | | | | | | | | | | | | | | | | |
| Net investment income | | | (0.01 | ) | | | (0.07 | ) | | | (0.10 | ) | | | (0.05 | ) | | | (0.05 | ) | | | (0.01 | ) |
| | | | | | | | | | | | | | | | | | | | | | | | | |
| Net realized gains | | | (3.11 | ) | | | (0.91 | ) | | | (0.79 | ) | | | (0.31 | ) | | | (0.05 | ) | | | (0.00 | )3 |
| | | | | | | | | | | | | | | | | | | | | | | | | |
Total distributions | | | (3.12 | ) | | | (0.98 | ) | | | (0.89 | ) | | | (0.36 | ) | | | (0.10 | ) | | | (0.01 | ) |
| | | | | | | | | | | | | | | | | | | | | | | | | |
| NET ASSET VALUE, END OF PERIOD | | | $11.54 | | | | $15.76 | | | | $16.42 | | | | $15.24 | | | | $14.82 | | | | $13.99 | |
| | | | | | | | | | | | | | | | | | | | | | | | | |
Total return4 | | | (8.14 | )% | | | 1.85 | % | | | 13.62 | % | | | 5.25 | % | | | 6.64 | % | | | 31.44 | % |
| | | | | | | | | | | | | | | | | | | | | | | | | |
NET ASSETS,
END OF PERIOD (000s) | | | $182,286 | | | | $233,503 | | | | $271,937 | | | | $284,380 | | | | $246,342 | | | | $103,769 | |
| | | | | | | | | | | | | | | | | | | | | | | | | |
| RATIOS TO AVERAGE NET ASSETS: | | | | | | | | | | | | | | | | | | | | | | | | |
| | | | | | | | | | | | | | | | | | | | | | | | | |
| Gross expenses | | | 1.15 | %5 | | | 1.07 | % | | | 1.10 | %6 | | | 1.06 | % | | | 1.07 | % | | | 1.31 | % |
| | | | | | | | | | | | | | | | | | | | | | | | | |
Net expenses7,8 | | | 1.00 | 5 | | | 0.95 | | | | 0.98 | 6 | | | 0.96 | | | | 0.95 | | | | 1.00 | |
| | | | | | | | | | | | | | | | | | | | | | | | | |
| Net investment income (loss) | | | 0.24 | 5 | | | 0.43 | | | | 0.57 | | | | 0.38 | | | | 0.43 | | | | 0.17 | |
| | | | | | | | | | | | | | | | | | | | | | | | | |
| PORTFOLIO TURNOVER RATE | | | 29 | % | | | 85 | % | | | 14 | % | | | 22 | % | | | 9 | % | | | 3 | % |
| | | | | | | | | | | | | | | | | | | | | | | | | |
| | |
| 1 | | For the six months ended June 30, 2008 (unaudited). |
| |
| 2 | | Per share amounts have been calculated using the average shares method. |
| |
| 3 | | Amount represents less than $0.01 per share. |
| |
| 4 | | Performance figures may reflect fee waivers and/or expense reimbursements. In the absence of fee waivers and/or expense reimbursements, the total return would have been lower. Total returns do not reflect expenses associated with the separate accounts such as administrative fees, account charges and surrender charges which, if reflected, would reduce the total return for all periods shown. Past performance is no guarantee of future results. Total returns for periods of less than one year are not annualized. |
| |
| 5 | | Annualized. |
| |
| 6 | | Included in the expense ratios are certain non-recurring restructuring (and reorganization, if applicable) fees that were incurred by the Portfolio during the period. Without these fees, the gross and net expense ratios would have been 1.09% and 0.95%, respectively. |
| |
| 7 | | As a result of a voluntary expense limitation, the ratio of expenses, other than interest, brokerage, taxes and extraordinary expenses, to average net assets of the Portfolio will not exceed 1.00%. |
| |
| 8 | | Reflects fee waivers and/or expense reimbursements. |
See Notes to Financial Statements.
10 Legg Mason Partners Variable Capital Portfolio 2008 Semi-Annual Report
Notes to financial statements (unaudited)
| |
| 1. | Organization and significant accounting policies |
Legg Mason Partners Variable Capital Portfolio (the “Portfolio”) is a separate diversified investment series of Legg Mason Partners Variable Equity Trust (the “Trust”). The Trust, a Maryland business trust, is registered under the Investment Company Act of 1940, as amended (the “1940 Act”), as an open-end management investment company.
Shares of the Portfolio may only be purchased or redeemed through variable annuity contracts and variable life insurance policies offered by the separate accounts of participating insurance companies or through eligible pension or other qualified plans.
The following are significant accounting policies consistently followed by the Portfolio and are in conformity with U.S. generally accepted accounting principles (“GAAP”). Estimates and assumptions are required to be made regarding assets, liabilities and changes in net assets resulting from operations when financial statements are prepared. Changes in the economic environment, financial markets and any other parameters used in determining these estimates could cause actual results to differ.
(a) Repurchase agreements. When entering into repurchase agreements, it is the Portfolio’s policy that its custodian or a third party custodian take possession of the underlying collateral securities, the market value of which, at all times, at least equals the principal amount of the repurchase transaction, including accrued interest. To the extent that any repurchase transaction exceeds one business day, the value of the collateral is marked-to-market to ensure the adequacy of the collateral. If the seller defaults, and the market value of the collateral declines or if bankruptcy proceedings are commenced with respect to the seller of the security, realization of the collateral by the Portfolio may be delayed or limited.
(b) Written options. When the Portfolio writes an option, an amount equal to the premium received by the Portfolio is recorded as a liability, the value of which is marked-to-market daily to reflect the current market value of the option written. If the option expires, the Portfolio realizes a gain from investments equal to the amount of the premium received. When a written call option is exercised, the difference between the premium received plus the option exercise price and the Portfolio’s basis in the underlying security (in the case of a covered written call option), or the cost to purchase the underlying security (in the case of an uncovered written call option), including brokerage commission, is treated as a realized gain or loss. When a written put option is exercised, the amount of the premium received is added to the cost of the security purchased by the Portfolio from the exercise of the written put option to form the Portfolio’s basis in the underlying security purchased. The writer or buyer of an option traded on an exchange can liquidate the position before the exercise of the option by entering into a closing transaction. The cost of a
Legg Mason Partners Variable Capital Portfolio 2008 Semi-Annual Report 11
Notes to financial statements (unaudited) continued
closing transaction is deducted from the original premium received resulting in a realized gain or loss to the Portfolio.
The risk in writing a covered call option is that the Portfolio may forego the opportunity of profit if the market price of the underlying security increases and the option is exercised. The risk in writing a put option is that the Portfolio may incur a loss if the market price of the underlying security decreases and the option is exercised. The risk in writing a call option is that the Portfolio is exposed to the risk of loss if the market price of the underlying security increases. In addition, there is the risk that the Portfolio may not be able to enter into a closing transaction because of an illiquid secondary market.
(c) Security transactions and investment income. Security transactions are accounted for on a trade date basis. Interest income, adjusted for amortization of premium and accretion of discount, is recorded on the accrual basis. Dividend income is recorded on the ex-dividend date. The cost of investments sold is determined by use of the specific identification method. To the extent any issuer defaults on an expected interest payment, the Portfolio’s policy is to generally halt any additional interest income accruals and consider the realizability of interest accrued up to the date of default.
(d) Distributions to shareholders. Distributions from net investment income and distributions of net realized gains, if any, are declared at least annually. Distributions to shareholders of the Portfolio are recorded on the ex-dividend date and are determined in accordance with income tax regulations, which may differ from GAAP.
(e) Federal and other taxes. It is the Portfolio’s policy to comply with the federal income and excise tax requirements of the Internal Revenue Code of 1986, as amended, applicable to regulated investment companies. Accordingly, the Portfolio intends to distribute substantially all of its taxable income and net realized gains, if any, to shareholders each year. Therefore, no federal income tax provision is required in the Portfolio’s financial statements.
Management has analyzed the Portfolio’s tax positions taken on federal income tax returns for all open tax years and has concluded that as of June 30, 2008, no provision for income tax would be required in the Portfolio’s financial statements. The Portfolio’s federal and state income and federal excise tax returns for tax years for which the applicable statutes of limitations have not expired are subject to examination by the Internal Revenue Service and state departments of revenue.
(f) Reclassification. GAAP requires that certain components of net assets be adjusted to reflect permanent differences between financial and tax reporting. These reclassifications have no effect on net assets or net asset values per share.
12 Legg Mason Partners Variable Capital Portfolio 2008 Semi-Annual Report
Effective January 1, 2008, the Portfolio adopted Statement of Financial Accounting Standards No. 157 (“FAS 157”). FAS 157 establishes a single definition of fair value, creates a three-tier hierarchy as a framework for measuring fair value based on inputs used to value the Portfolio’s investments, and requires additional disclosure about fair value. The hierarchy of inputs is summarized below.
| |
| • | Level 1 — quoted prices in active markets for identical investments |
| |
| • | Level 2 — other significant observable inputs (including quoted prices for similar investments, interest rates, prepayment speeds, credit risk, etc.) |
| |
| • | Level 3 — significant unobservable inputs (including the Portfolio’s own assumptions in determining the fair value of investments) |
Equity securities for which market quotations are available are valued at the last reported sales price or official closing price on the primary market or exchange on which they trade. Debt securities are valued at the mean between the last quoted bid and asked prices provided by an independent pricing service that are based on transactions in debt obligations, quotations from bond dealers, market transactions in comparable securities and various other relationships between securities. When prices are not readily available, or are determined not to reflect fair value, such as when the value of a security has been significantly affected by events after the close of the exchange or market on which the security is principally traded, but before the Portfolio calculates its net asset value, the Portfolio may value these securities at fair value as determined in accordance with the procedures approved by the Portfolio’s Board of Trustees. Short-term obligations with maturities of 60 days or less are valued at amortized cost, which approximates fair value.
The following is a summary of the inputs used in valuing the Portfolio’s assets carried at fair value:
| | | | | | | | | | | | | | | | | |
| | | | | | | | | SIGNIFICANT
|
| | | | | | | OTHER SIGNIFICANT
| | UNOBSERVABLE
|
| | | | | QUOTED PRICES
| | OBSERVABLE INPUTS
| | INPUTS
|
| | | June 30, 2008 | | (LEVEL 1) | | (LEVEL 2) | | (LEVEL 3) |
Investments in
Securities | | $ | 182,719,431 | | | $ | 173,874,431 | | | $ | 8,845,000 | | | | — | |
| | | | | | | | | | | | | | | | | |
3. Investment management agreement and other transactions with affiliates
Legg Mason Partners Fund Advisor, LLC (“LMPFA”) is the Portfolio’s investment manager and ClearBridge Advisors, LLC (“ClearBridge”) is the Portfolio’s subadviser. LMPFA and ClearBridge are wholly-owned subsidiaries of Legg Mason, Inc. (“Legg Mason”).
Legg Mason Partners Variable Capital Portfolio 2008 Semi-Annual Report 13
Notes to financial statements (unaudited) continued
Under the investment management agreement, the Portfolio pays an investment management fee, calculated daily and paid monthly, at an annual rate of 0.75% of the Portfolio’s average daily net assets.
LMPFA provides administrative and certain oversight services to the Portfolio. LMPFA delegates to the subadviser the day-to-day portfolio management of the Portfolio. For its services, LMPFA pays ClearBridge 70% of the net management fee it receives from the Portfolio.
During the six months ended June 30, 2008, the Portfolio had a voluntary expense limitation in place of 1.00%.
During the six months ended June 30, 2008, LMPFA waived a portion of its fee in the amount of $49,159.
Effective January 1, 2008, the manager is permitted to recapture amounts previously voluntarily forgone or reimbursed by the manager to the Portfolio during the same fiscal year if the Portfolio’s total annual operating expenses have fallen to a level below the voluntary fee waiver/reimbursement (“expense cap”) shown in the fee table of the Portfolio’s prospectus. In no case will the manager recapture any amount that would result, on any particular business day of the Portfolio, in the Portfolio’s total annual operating expenses exceeding the expense cap.
Legg Mason Investor Services, LLC (“LMIS”), a wholly-owned broker-dealer subsidiary of Legg Mason, serves as the Portfolio’s sole and exclusive distributor.
The Portfolio has adopted a Rule 12b-1 distribution plan and under that plan the Portfolio pays a distribution fee of 0.25% of the Portfolio’s average daily net assets. This fee is calculated daily and paid monthly.
During the period ended June 30, 2008, LMIS waived a portion of its distribution fees equal to 0.10% of the average daily net assets of the Portfolio, resulting in a waiver of $101,845.
Certain officers and one Trustee of the Trust are employees of Legg Mason or its affiliates and do not receive compensation from the Trust.
During the six months ended June 30, 2008, the aggregate cost of purchases and proceeds from sales of investments (excluding short-term investments) were as follows:
| | | | | |
| | | | | |
| Purchases | | $ | 56,913,876 | |
| | | | | |
| Sales | | | 90,032,204 | |
| | | | | |
14 Legg Mason Partners Variable Capital Portfolio 2008 Semi-Annual Report
At June 30, 2008, the aggregate gross unrealized appreciation and depreciation of investments for federal income tax purposes were substantially as follows:
| | | | | |
| Gross unrealized appreciation | | $ | 11,342,296 | |
| | | | | |
| Gross unrealized depreciation | | | (28,574,614 | ) |
| | | | | |
| Net unrealized depreciation | | $ | (17,232,318 | ) |
| | | | | |
During the six months ended June 30, 2008, written option transactions for the Portfolio were as follows:
| | | | | | | | | |
| | | NUMBER OF
| | PREMIUMS
|
| | | CONTRACTS | | RECEIVED |
| Options written, outstanding December 31, 2007 | | | 230 | | | $ | 43,009 | |
| | | | | | | | | |
| Options written | | | 490 | | | | 117,301 | |
| | | | | | | | | |
| Options closed | | | (620 | ) | | | (150,097 | ) |
| | | | | | | | | |
| Options expired | | | (100 | ) | | | (10,213 | ) |
| | | | | | | | | |
| Options written, outstanding June 30, 2008 | | | — | | | | — | |
| | | | | | | | | |
| |
| 5. | Shares of beneficial interest |
At June 30, 2008, the Trust had an unlimited number of shares of beneficial interest authorized with a par value of $0.00001 per share. Prior to April 30, 2007, the Trust had an unlimited number of shares authorized with a par value of $0.001 per share.
Transactions in shares of the Portfolio were as follows:
| | | | | | | | | |
| | | SIX MONTHS ENDED
| | YEAR ENDED
|
| | | JUNE 30, 2008 | | DECEMBER 31, 2007 |
| Shares sold | | | 63,107 | | | | 516,682 | |
| | | | | | | | | |
| Shares issued on reinvestment | | | 3,227,975 | | | | 870,511 | |
| | | | | | | | | |
| Shares repurchased | | | (2,310,702 | ) | | | (3,133,686 | ) |
| | | | | | | | | |
| Net increase (decrease) | | | 980,380 | | | | (1,746,493 | ) |
| | | | | | | | | |
On May 31, 2005, the U.S. Securities and Exchange Commission (the “SEC”) issued an order in connection with the settlement of an administrative proceeding against Smith Barney Fund Management LLC (“SBFM”), a wholly-owned subsidiary of Legg Mason and Citigroup Global Markets Inc. (“CGM”), a former distributor of the Portfolio, relating to the appointment of an affiliated transfer agent for the Smith Barney family of mutual funds, including the Portfolio (the “Affected Funds”).
Legg Mason Partners Variable Capital Portfolio 2008 Semi-Annual Report 15
Notes to financial statements (unaudited) continued
The SEC order found that SBFM and CGM willfully violated Section 206(1) of the Investment Advisers Act of 1940, as amended, and the rules promulgated thereunder (the “Advisers Act”). Specifically, the order found that SBFM and CGM knowingly or recklessly failed to disclose to the boards of the Affected Funds in 1999 when proposing a new transfer agent arrangement with an affiliated transfer agent that: First Data Investors Services Group (“First Data”), the Affected Funds’ then-existing transfer agent, had offered to continue as transfer agent and do the same work for substantially less money than before; and that Citigroup Asset Management (“CAM”), the Citigroup business unit that, at the time, included the Affected Funds’ investment manager and other investment advisory companies, had entered into a side letter with First Data under which CAM agreed to recommend the appointment of First Data as subtransfer agent to the affiliated transfer agent in exchange for, among other things, a guarantee by First Data of specified amounts of asset management and investment banking fees to CAM and CGM. The order also found that SBFM and CGM willfully violated Section 206(2) of the Advisers Act by virtue of the omissions discussed above and other misrepresentations and omissions in the materials provided to the Affected Funds’ boards, including the failure to make clear that the affiliated transfer agent would earn a high profit for performing limited functions while First Data continued to perform almost all of the transfer agent functions, and the suggestion that the proposed arrangement was in the Affected Funds’ best interests and that no viable alternatives existed.
SBFM and CGM do not admit or deny any wrongdoing or liability. The settlement does not establish wrongdoing or liability for purposes of any other proceeding. The SEC censured SBFM and CGM and ordered them to cease and desist from violations of Sections 206(1) and 206(2) of the Advisers Act. The order required Citigroup to pay $208.1 million, including $109 million in disgorgement of profits, $19.1 million in interest, and a civil money penalty of $80 million. Approximately $24.4 million has already been paid to the Affected Funds, primarily through fee waivers. The remaining $183.7 million, including the penalty, has been paid to the U.S. Treasury and will be distributed pursuant to a plan submitted for the approval of the SEC. At this time, there is no certainty as to how the above described proceeds of the settlement will be distributed, to whom such distributions will be made, the methodology by which such distributions will be allocated, and when such distributions will be made. The order also required that transfer agency fees received from the Affected Funds since December 1, 2004, less certain expenses, be placed in escrow and provided that a portion of such fees might be subsequently distributed in accordance with the terms of the order. On April 3, 2006, an aggregate amount of approximately $9 million held in escrow was distributed to the Affected Funds.
The order required SBFM to recommend a new transfer agent contract to the Affected Funds’ Boards within 180 days of the entry of the order; if a Citigroup
16 Legg Mason Partners Variable Capital Portfolio 2008 Semi-Annual Report
affiliate submitted a proposal to serve as transfer agent or subtransfer agent, SBFM and CGM would have been required, at their expense, to engage an independent monitor to oversee a competitive bidding process. On November 21, 2005, and within the specified timeframe, the Affected Funds’ Boards selected a new transfer agent for the Affected Funds. No Citigroup affiliate submitted a proposal to serve as transfer agent. Under the order, SBFM also must comply with an amended version of a vendor policy that Citigroup instituted in August 2004.
Although there can be no assurance, the manager does not believe that this matter will have a material adverse effect on the Affected Funds.
On December 1, 2005, Citigroup completed the sale of substantially all of its global asset management business, including SBFM, to Legg Mason.
Beginning in June 2004, class action lawsuits alleging violations of the federal securities laws were filed against CGM, a former distributor of the Portfolio, and other affiliated funds (collectively, the “Funds”) and a number of its then affiliates, including SBFM and Salomon Brothers Asset Management Inc (“SBAM”), which were then investment adviser or manager to certain of the Funds (the “Managers”), substantially all of the mutual funds then managed by the Managers (the “Defendant Funds”), and Board members of the Defendant Funds (collectively, the “Defendants”). The complaints alleged, among other things, that CGM created various undisclosed incentives for its brokers to sell Smith Barney and Salomon Brothers funds. In addition, according to the complaints, the Managers caused the Defendant Funds to pay excessive brokerage commissions to CGM for steering clients towards proprietary funds. The complaints also alleged that the Defendants breached their fiduciary duty to the Defendant Funds by improperly charging Rule 12b-1 fees and by drawing on fund assets to make undisclosed payments of soft dollars and excessive brokerage commissions. The complaints also alleged that the Defendant Funds failed to adequately disclose certain of the allegedly wrongful conduct. The complaints sought injunctive relief and compensatory and punitive damages, rescission of the Defendant Funds’ contracts with the Managers, recovery of all fees paid to the Managers pursuant to such contracts and an award of attorneys’ fees and litigation expenses.
On December 15, 2004, a consolidated amended complaint (the “Complaint”) was filed alleging substantially similar causes of action. On May 27, 2005, all of the Defendants filed motions to dismiss the Complaint. On July 26, 2006, the court issued a decision and order (1) finding that plaintiffs lacked standing to sue on behalf of the shareholders of the Funds in which none of the plaintiffs had invested and dismissing those Funds from the case (although stating that they could be brought back into the case if standing as to them could be
Legg Mason Partners Variable Capital Portfolio 2008 Semi-Annual Report 17
Notes to financial statements (unaudited) continued
established), and (2) other than one stayed claim, dismissing all of the causes of action against the remaining Defendants, with prejudice, except for the cause of action under Section 36(b) of the 1940 Act, which the court granted plaintiffs leave to repeal as a derivative claim.
On October 16, 2006, plaintiffs filed their Second Consolidated Amended Complaint (“Second Amended Complaint”) which alleges derivative claims on behalf of nine funds identified in the Second Amended Complaint, under Section 36(b) of the 1940 Act, against CAM, SBAM and SBFM as investment advisers to the identified funds, as well as CGM as a distributor for the identified funds (collectively, the “Second Amended Complaint Defendants”). The Portfolio was not identified in the Second Amended Complaint. The Second Amended Complaint alleges no claims against any of the funds or any of their Board Members. Under Section 36(b), the Second Amended Complaint alleges similar facts and seeks similar relief against the Second Amended Complaint Defendants as the Complaint.
On December 3, 2007, the court granted the Defendants’ motion to dismiss, with prejudice. On January 2, 2008, the plaintiffs filed a notice of appeal to the Second Circuit Court of Appeals.
Additional lawsuits arising out of these circumstances and presenting similar allegations and requests for relief may be filed in the future.
* * *
Beginning in August 2005, five class action lawsuits alleging violations of federal securities laws and state law were filed against CGM and SBFM, (collectively, the “Defendants”) based on the May 31, 2005 settlement order issued against the Defendants by the SEC as described in Note 6. The complaints seek injunctive relief and compensatory and punitive damages, removal of SBFM as the investment manager for the Smith Barney family of funds, rescission of the funds’ management and other contracts with SBFM, recovery of all fees paid to SBFM pursuant to such contracts, and an award of attorneys’ fees and litigation expenses. The five actions were subsequently consolidated, and a consolidated complaint was filed.
On September 26, 2007, the United States District Court for the Southern District of New York issued an order dismissing the consolidated complaint, and judgement was later entered. An appeal has been filed and is pending before the U.S. Court of Appeals for the Second Circuit.
18 Legg Mason Partners Variable Capital Portfolio 2008 Semi-Annual Report
| |
| 8. | Recent accounting pronouncement |
In March 2008, the Financial Accounting Standards Board issued the Statement of Financial Accounting Standards No. 161, Disclosures about Derivative Instruments and Hedging Activities (“FAS 161”). FAS 161 is effective for fiscal years and interim periods beginning after November 15, 2008. FAS 161 requires enhanced disclosures about the Portfolio’s derivative and hedging activities, including how such activities are accounted for and their effect on the Portfolio’s financial position, performance and cash flows. Management is currently evaluating the impact the adoption of FAS 161 will have on the Portfolio’s financial statements and related disclosures.
Legg Mason Partners Variable Capital Portfolio 2008 Semi-Annual Report 19
(This page is intentionally left blank.)
(This page is intentionally left blank.)
Legg Mason Partners
Variable Capital Portfolio
Trustees
Paul R. Ades
Andrew L. Breech
Dwight B. Crane
Robert M. Frayn, Jr.
R. Jay Gerken, CFA
Chairman
Frank G. Hubbard
Howard J. Johnson
David E. Maryatt
Jerome H. Miller
Ken Miller
John J. Murphy
Thomas F. Schlafly
Jerry A. Viscione
Investment manager
Legg Mason Partners Fund
Advisor, LLC
Subadviser
ClearBridge Advisors, LLC
Distributor
Legg Mason Investor Services, LLC
Custodian
State Street Bank and Trust
Company
Transfer agent
PNC Global Investment Servicing (formerly, PFPC Inc.)
4400 Computer Drive
Westborough, Massachusetts 01581
Independent registered public
accounting firm
KPMG LLP
345 Park Avenue
New York, New York 10154
Legg Mason Partners Variable Capital Portfolio
The Portfolio is a separate investment series of Legg Mason Partners Variable Equity Trust, a Maryland business trust.
LEGG MASON PARTNERS VARIABLE CAPITAL PORTFOLIO
Legg Mason Partners Funds
55 Water Street
New York, New York 10041
The Portfolio files its complete schedule of portfolio holdings with the Securities and Exchange Commission (“SEC”) for the first and third quarters of each fiscal year on Form N-Q. The Portfolio’s Forms N-Q are available on the SEC’s website at www.sec.gov. The Portfolio’s Forms N-Q may be reviewed and copied at the SEC’s Public Reference Room in Washington, D.C., and information on the operation of the Public Reference Room may be obtained by calling 1-800-SEC-0330. To obtain information on Form N-Q from the Portfolio, shareholders can call Legg Mason Partners Shareholder Services at 1-800-451-2010.
Information on how the Portfolio voted proxies relating to portfolio securities during the prior 12-month period ended June 30th of each year and a description of the policies and procedures that the Portfolio uses to determine how to vote proxies related to portfolio transactions are available (1) without charge, upon request, by calling 1-800-451-2010, (2) on the Portfolio’s website at www.leggmason.com/individualinvestors and (3) on the SEC’s website at www.sec.gov.
This report is submitted for the general information of the shareholders of Legg Mason Partners Variable Capital Portfolio. This report is not authorized for distribution to prospective investors in the Portfolio unless preceded or accompanied by a current prospectus.
Investors should consider the Portfolio’s investment objectives, risks, charges and expenses carefully before investing. The prospectus contains this and other important information about the Portfolio. Please read the prospectus carefully before investing.
www.leggmason.com/individualinvestors
©2008 Legg Mason Investor Services, LLC
Member FINRA, SIPC
| | | |
BUILT TO WINSM | |  |
At Legg Mason, we’ve assembled a collection of experienced investment management firms and empowered each of them with the tools, the resources and, most importantly, the independence to pursue the strategies they know best.
• Each was purposefully chosen for their commitment to investment excellence.
• Each is focused on specific investment styles and asset classes.
• Each exhibits thought leadership in their chosen area of focus.
Together, we’ve built a powerful portfolio of solutions for financial advisors and their clients. And it has made us a world leader in money management.*
| | | |
| | * | In the Pensions & Investments May 27, 2008 ranking, Legg Mason is the 9th largest asset manager in the world based on worldwide assets under management as of December 31, 2007. | |
www.leggmason.com/individualinvestors
©2008 Legg Mason Investor Services, LLC Member FINRA, SIPC
FDXX011194 8/08 SR08-643
NOT PART OF THE SEMI-ANNUAL REPORT
ITEM 2. CODE OF ETHICS.
Not applicable.
ITEM 3. AUDIT COMMITTEE FINANCIAL EXPERT.
Not applicable.
ITEM 4. Principal Accountant Fees and Services
Not applicable.
ITEM 5. AUDIT COMMITTEE OF LISTED REGISTRANTS.
Not applicable.
ITEM 6. SCHEDULE OF INVESTMENTS.
Included herein under Item 1.
ITEM 7. DISCLOSURE OF PROXY VOTING POLICIES AND PROCEDURES FOR CLOSED-END MANAGEMENT INVESTMENT COMPANIES.
Not applicable.
ITEM 8. PORTFOLIO MANAGERS OF CLOSED-END MANAGEMENT INVESTMENT COMPANIES.
Not applicable.
ITEM 9. PURCHASES OF EQUITY SECURITIES BY CLOSED-END MANAGEMENT INVESTMENT COMPANY AND AFFILIATED PURCHASERS.
Not applicable.
ITEM 10. SUBMISSION OF MATTERS TO A VOTE OF SECURITY HOLDERS.
Not applicable.
ITEM 11. CONTROLS AND PROCEDURES.
| | (a) | | The registrant’s principal executive officer and principal financial officer have concluded that the registrant’s disclosure controls and procedures (as defined in Rule 30a- 3(c) under the Investment Company Act of 1940, as amended (the “1940 Act”)) are effective as of a date within 90 days of the filing date of this report that includes the disclosure required by this paragraph, based on their evaluation of the disclosure controls and procedures required by Rule 30a-3(b) under the 1940 Act and 15d-15(b) under the Securities Exchange Act of 1934. |
| |
| | (b) | | There were no changes in the registrant’s internal control over financial reporting (as defined in Rule 30a-3(d) under the 1940 Act) that occurred during the registrant’s last fiscal half-year (the registrant’s second fiscal half-year in the case of an annual report) that have materially affected, or are likely to materially affect the registrant’s internal control over financial reporting. |
ITEM 12. EXHIBITS.
(a) (1) Not applicable.
Exhibit 99.CODE ETH
(a) (2) Certifications pursuant to section 302 of the Sarbanes-Oxley Act of 2002 attached hereto.
Exhibit 99.CERT
(b) Certifications pursuant to Section 906 of the Sarbanes-Oxley Act of 2002 attached hereto.
Exhibit 99.906CERT
SIGNATURES
Pursuant to the requirements of the Securities Exchange Act of 1934 and the Investment Company Act of 1940, the registrant has duly caused this Report to be signed on its behalf by the undersigned, there unto duly authorized.
Legg Mason Partners Variable Equity Trust
| | | | | |
| By: | | /s/ R. Jay Gerken | | |
| | | (R. Jay Gerken) | | |
| | | Chief Executive Officer of | | |
| | | Legg Mason Partners Variable Equity Trust | | |
Date: August 28, 2008
Pursuant to the requirements of the Securities Exchange Act of 1934 and the Investment Company Act of 1940, this report has been signed below by the following persons on behalf of the registrant and in the capacities and on the dates indicated.
| | | | | |
| By: | | /s/ R. Jay Gerken | | |
| | | (R. Jay Gerken) | | |
| | | Chief Executive Officer of | | |
| | | Legg Mason Partners Variable Equity Trust | | |
Date: August 28, 2008
| | | | | |
| By: | | /s/ Kaprel Ozsolak | | |
| | | (Kaprel Ozsolak) | | |
| | | Chief Financial Officer of | | |
| | | Legg Mason Partners Variable Equity Trust | | |
Date: August 28, 2008