UNITED STATES
SECURITIES AND EXCHANGE COMMISSION
Washington, D.C. 20549
FORM N-CSR
CERTIFIED SHAREHOLDER REPORT OF REGISTERED MANAGEMENT INVESTMENT COMPANIES
Investment Company Act file number 811-21128
Legg Mason Partners Variable Equity Trust
(Exact name of registrant as specified in charter)
125 Broad Street, New York, NY 10004
(Address of principal executive offices) (Zip code)
Robert I. Frenkel, Esq.
Legg Mason & Co., LLC
300 First Stamford Place
Stamford, CT 06902
(Name and address of agent for service)
Registrant’s telephone number, including area code: (800) 451-2010
Date of fiscal year end: January 31
Date of reporting period: July 31, 2007
ITEM 1. | REPORT TO STOCKHOLDERS. |
The Semi-Annual Report to Stockholders is filed herewith.

Legg Mason Partners
Variable Equity Trust
Legg Mason Partners
Variable Lifestyle
Allocation 85%
Legg Mason Partners
Variable Lifestyle
Allocation 70%
Legg Mason Partners
Variable Lifestyle
Allocation 50%
S E M I - A N N U A L
R E P O R T
JULY 31, 2007
INVESTMENT PRODUCTS: NOT FDIC INSURED • NO BANK GUARANTEE • MAY LOSE VALUE
| Letter from the Chairman
|

R. JAY GERKEN, CFA Chairman, President and
Chief Executive Officer | Dear Shareholder, The U.S. economy was mixed during the six-month reporting period ended July 31, 2007. U.S. gross domestic product (“GDP”)i expanded 2.1% in the fourth quarter of 2006.ii In the first quarter of 2007, GDP growth was a tepid 0.6%, according to the U.S. Commerce Department. This is the lowest growth rate since the fourth quarter of 2002. While consumer spending remained fairly solid, ongoing troubles in the housing market continued to negatively impact the economy. The economy then rebounded, as the preliminary estimate for second quarter 2007 GDP growth was a solid 4.0%, its highest rate since the first quarter of 2006. While consumer spending moderated, this was offset by a sharp increase in business spending and exports. After increasing the federal funds rateiii to 5.25% in June 2006 — the 17th consecutive rate hike — the Federal Reserve Board (“Fed”)iv held rates steady at its last nine meetings. In its statement accompanying the August 2007 meeting, the Fed stated: “Financial markets have been volatile in recent weeks, credit conditions have become tighter for some households and businesses, and the housing correction is ongoing. Nevertheless, the economy seems likely to continue to expand at a moderate pace over coming quarters, supported by solid growth in employment and incomes and a robust global economy”. After a strong start, the stock market weakened as the reporting period progressed and produced only a modest gain during the six-month reporting period. After rising in three of the first four months of the period, the market reversed course in June and July 2007. Earlier in the period, stock prices rose on the back of solid corporate profits, an active merger and acquisition (“M&A”) environment and hopes that the Fed would lower short-term interest rates in 2007. However, the markets began to lose steam in June 2007 due to continued weakness in the housing market, troubles in |
Legg Mason Partners Variable Equity Trust | I |
| the subprime mortgage market and expectations that the Fed would not lower short-term interest rates in the foreseeable future. While stock prices rebounded somewhat in early July 2007, the major indices then fell sharply during the last two weeks of the month, falling more than 5% from their peak earlier in the period. All told, the S&P 500 Indexv returned 2.10% during the six months ended July 31, 2007. During the six-month reporting period, both short- and long-term Treasury yields experienced periods of volatility. After falling early in the reporting period, yields moved steadily higher over much of the second quarter of 2007. This was due, in part, to inflationary fears, a solid job market and mounting expectations that the Fed would not be cutting short-term rates in the foreseeable future. Two-year Treasury yields spiked to 5.10% on June 14th, versus 4.58% when the second quarter began. Ten-year Treasury yields moved up even more dramatically, cresting at 5.26% on June 12th — their highest rate in five years. In contrast, 10-year Treasury yields were 4.65% at the end of March 2007. After their highs in mid June, yields then moved sharply lower, as general economic concerns regarding the subprime mortgage market triggered a “flight to quality”. As of July 31, 2007, the yields on two- and 10-year Treasuries were 4.56% and 4.78%, respectively. Looking at the six-month period as a whole, the overall bond market, as measured by the Lehman Brothers U.S. Aggregate Indexvi, returned 1.86%. Since the close of the reporting period, the U.S. fixed-income markets have experienced a period of extreme volatility which has negatively impacted market liquidity conditions. Initially, the concern on the part of market participants was limited to the subprime segment of the mortgage-backed market. However, these concerns have since broadened to include a wider range of financial institutions and markets. As a result, other fixed income instruments, as well as domestic and international equity markets, have also experienced heightened volatility in recent weeks. |
II | Legg Mason Partners Variable Equity Trust |
| Performance Review |
| Legg Mason Partners Variable Lifestyle Allocation 85% |
| For the six months ended July 31, 2007, Legg Mason Partners Variable Lifestyle Allocation 85% (“Variable Lifestyle Allocation 85%”)1 returned 1.49%. In comparison, the Portfolio’s unmanaged benchmarks, the Lehman Brothers U.S. Aggregate Index, the Russell 3000 Indexvii and the Lifestyle Allocation 85% Composite Benchmarkviii, returned 1.86%, 1.53% and 2.14%, respectively, for the same period. The Lipper Variable Multi-Cap Core Funds Category Average2 increased 2.83%. |
| Legg Mason Partners Variable Lifestyle Allocation 70% |
| For the six months ended July 31, 2007, Legg Mason Partners Variable Lifestyle Allocation 70% (“Variable Lifestyle Allocation 70%”)1 returned 1.36%. In comparison, the Portfolio’s unmanaged benchmarks, the Lehman Brothers U.S. Aggregate Index, the Russell 3000 Index and the Lifestyle Allocation 70% Composite Benchmarkix, returned 1.86%, 1.53% and 2.06%, respectively, for the same period. The Lipper Variable Multi-Cap Core Funds Category Average2 increased 2.83%. |
| Legg Mason Partners Variable Lifestyle Allocation 50% |
| For the six months ended July 31, 2007, Legg Mason Partners Variable Lifestyle Allocation 50% (“Variable Lifestyle Allocation 50%”)1 returned 0.91%. In comparison, the Portfolio’s unmanaged benchmarks, the Lehman Brothers U.S. Aggregate Index, the Russell 1000 Indexx and the Lifestyle Allocation 50% Composite Benchmarkxi, returned 1.86%, 1.91% and 1.81%, respectively, for the same period. The Lipper Variable Mixed-Asset Target Allocation Funds Category Average3 increased 2.90%. |
1 | The Portfolio is an underlying investment option of various variable annuity and variable life insurance products. The Portfolio’s performance returns do not reflect the deduction of initial sales charges and expenses imposed in connection with investing in variable annuity or variable life insurance contracts, such as administrative fees, account charges, and surrender charges, which, if reflected, would reduce the performance of the Portfolio. Past performance is no guarantee of future results. |
2 | Lipper, Inc. is a major independent mutual-fund tracking organization. Returns are based on the six-month period ended July 31, 2007, including the reinvestment of all distributions, including returns of capital, if any, calculated among the 217 funds in the Portfolio’s Lipper category. |
3 | Lipper, Inc. is a major independent mutual-fund tracking organization. Returns are based on the six-month period ended July 31, 2007, including the reinvestment of all distributions, including returns of capital, if any, calculated among the 179 funds in the Portfolio’s Lipper category. |
Legg Mason Partners Variable Equity Trust | III |
| Performance Snapshot as of July 31, 2007 (unaudited) | | | |
| | | Six Months | |
|
|
|
| Variable Lifestyle Allocation 85%1 | | 1.49% | |
|
|
|
| Lehman Brothers U.S. Aggregate Index | | 1.86% | |
|
|
|
| Russell 3000 Index | | 1.53% | |
|
|
|
| Lifestyle Allocation 85% Composite Benchmark | | 2.14% | |
|
|
|
| Lipper Variable Multi-Cap Core Funds Category Average | | 2.83% | |
|
|
|
| Variable Lifestyle Allocation 70%1 | | 1.36% | |
|
|
|
| Lehman Brothers U.S. Aggregate Index | | 1.86% | |
|
|
|
| Russell 3000 Index | | 1.53% | |
|
|
|
| Lifestyle Allocation 70% Composite Benchmark | | 2.06% | |
|
|
|
| Lipper Variable Multi-Cap Core Funds Category Average | | 2.83% | |
|
|
|
| Variable Lifestyle Allocation 50%1 | | 0.91% | |
|
|
|
| Lehman Brothers U.S. Aggregate Index | | 1.86% | |
|
|
|
| Russell 1000 Index | | 1.91% | |
|
|
|
| Lifestyle Allocation 50% Composite Benchmark | | 1.81% | |
|
|
|
| Lipper Variable Mixed-Asset Target Allocation Funds Category Average | | 2.90% | |
|
|
|
| The performance shown represents past performance. Past performance is no guarantee of future results and current performance may be higher or lower than the performance shown above. Principal value and investment returns will fluctuate and investors’ shares, when redeemed, may be worth more or less than their original cost. | |
| Portfolio returns assume the reinvestment of all distributions, including returns of capital, if any, at net asset value and the deduction of all Portfolio expenses. | |
| | | |
| Total Annual Operating Expenses† (unaudited) | | | |
| As of the Variable Lifestyle Allocation 85% Portfolio’s most current prospectus dated April 30, 2007, the gross total operating expenses for the Portfolio were 1.04%. | |
| As of the Variable Lifestyle Allocation 70% Portfolio’s most current prospectus dated April 30, 2007, the gross total operating expenses for the Portfolio were 1.03%. | |
| As of the Variable Lifestyle Allocation 50% Portfolio’s most current prospectus dated April 30, 2007, the gross total operating expenses for the Portfolio were 1.00%.
| |
1 | The Portfolio is an underlying investment option of various variable annuity and variable life insurance products. The Portfolio’s performance returns do not reflect the deduction of initial sales charges and expenses imposed in connection with investing in variable annuity or variable life insurance contracts, such as administrative fees, account charges, and surrender charges, which, if reflected, would reduce the performance of the Portfolio. Past performance is no guarantee of future results. |
† | Includes expenses of the Underlying Funds in which the Portfolio invests. |
IV | Legg Mason Partners Variable Equity Trust |
| Special Shareholder Notices |
| With a goal of moving the mutual funds formerly advised by Citigroup Asset Management (“CAM”) to a more cohesive and rational operating platform, Legg Mason, Inc. (“Legg Mason”) recommended a number of governance- and investment-related proposals to streamline and restructure the funds. The Boards of Directors/Trustees of the affected funds have carefully considered and approved these proposals and, where required, have obtained shareholder approval. As such, the following changes became effective during the month of April 2007: |
| • Funds Redomiciled and Single Form of Organization Adopted: The legacy CAM funds have been redomiciled to a single jurisdiction and a single form of corporate structure has been introduced. Equity funds have been grouped for organizational and governance purposes with other funds in the fund complex that are predominantly equity funds, and fixed-income funds have been grouped with other funds that are predominantly fixed-income funds. Additionally, the funds have adopted a single form of organization as a Maryland business trust, with all funds operating under uniform charter documents. |
| • New Boards Elected: New Boards have been elected for the legacy CAM funds. The 10 Boards previously overseeing the funds have been realigned and consolidated into 2 Boards, with the remaining Boards each overseeing a distinct asset class or product type: equity or fixed income. |
| • Revised Fundamental Investment Policies Instituted: A uniform set of fundamental investment policies has been instituted for most funds, to the extent appropriate. Please note, however, that each fund will continue to be managed in accordance with its prospectus and statement of additional information, as well as any policies or guidelines that may have been established by the fund’s Board or investment manager. |
Legg Mason Partners Variable Equity Trust | V |
| Effective April 30, 2007, the Portfolios’ subadviser is Legg Mason Global Asset Allocation, LLC. (“LMGAA”). LMGAA has offices at 399 Park Avenue, New York, New York and is a recently organized investment adviser that has been formed to provide asset allocation advisory services for the Portfolios. Prior to April 30, 2007, ClearBridge Advisors, LLC (“ClearBridge”) was the Portfolios’ subadviser. LMGAA and ClearBridge are wholly-owned subsidiaries of Legg Mason. Please consult the Portfolios’ current prospectus for more information. |
| Information About Your Portfolios |
| As you may be aware, several issues in the mutual fund industry have come under the scrutiny of federal and state regulators. Affiliates of the Portfolios’ manager have, in recent years, received requests for information from various government regulators regarding market timing, late trading, fees, and other mutual fund issues in connection with various investigations. The regulators appear to be examining, among other things, the Portfolios’ response to market timing and shareholder exchange activity, including compliance with prospectus disclosure related to these subjects. The Portfolios are not in a position to predict the outcome of these requests and investigations. |
| Important information with regard to recent regulatory developments that may affect the Portfolios is contained in the Notes to Financial Statements included in this report. |
| As always, thank you for your continued confidence in our stewardship of your assets. We look forward to helping you meet your financial goals. |
| Sincerely, 
R. Jay Gerken, CFA
Chairman, President and Chief Executive Officer
August 30, 2007 |
| |
VI | Legg Mason Partners Variable Equity Trust | |
The information provided is not intended to be a forecast of future events, a guarantee of future results or investment advice. Views expressed may differ from those of the firm as a whole.
RISKS: Variable Lifestyle Allocation 85%, Variable Lifestyle Allocation 70%, Variable Lifestyle Allocation 50%: Foreign securities are subject to certain risks of overseas investing including currency fluctuations and changes in political and economic conditions, which could result in significant market fluctuations. Investments in small- and mid-capitalization companies may involve a higher degree of risk and volatility than investments in larger, more established companies. As interest rates rise, bond prices fall, reducing the value of the Portfolio’s share prices. High yield bonds involve greater credit and liquidity risks than investment grade bonds. There are additional risks and other expenses associated with investing in other mutual funds rather than directly in portfolio securities. Certain underlying funds may use derivatives, such as options and futures, which can be illiquid, may disproportionately increase losses, and have a potentially large impact on Portfolio performance. Please see the Portfolios’ prospectus for more information on these and other risks.
All index performance reflects no deduction for fees, expenses or taxes. Please note that an investor cannot invest directly in an index.
i | Gross domestic product (“GDP”) is the market value of all final goods and services produced within a country in a given period of time. |
ii | Source: U.S. Department of Commerce Bureau of Economic Analysis, 8/30/07. |
iii | The federal funds rate is the rate charged by one depository institution on an overnight sale of immediately available funds (balances at the Federal Reserve) to another depository institution; the rate may vary from depository institution to depository institution and from day to day. |
iv | The Federal Reserve Board (“Fed”) is responsible for the formulation of policies designed to promote economic growth, full employment, stable prices, and a sustainable pattern of international trade and payments. |
v | The S&P 500 Index is an unmanaged index of 500 stocks that is generally representative of the performance of larger companies in the U.S. |
vi | The Lehman Brothers U.S. Aggregate Index is a broad-based bond index comprised of government, corporate, mortgage and asset-backed issues, rated investment grade or higher, and having at least one year to maturity. |
vii | The Russell 3000 Index measures the performance of the 3,000 largest U.S. companies based on total market capitalization, which represents approximately 98% of the U.S. equity market. |
viii | The Lifestyle Allocation 85% Composite Benchmark is a hypothetical representation of the performance of the Portfolio’s major asset classes. It consists of 45% Russell 1000 Index, 20% Russell 2000 Index, 20% MSCI EAFE Index, 10% Lehman Brothers U.S. Aggregate Index and 5% Lehman Brothers U.S. High Yield - 2% Issuer Cap Index. The Russell 1000 Index consists of the 1,000 largest U.S. companies based on total market capitalization. The Russell 2000 Index is a broad-based unmanaged capitalization weighted index of small-capitalization companies. The Morgan Stanley Capital International EAFE Index (MSCI EAFE) is a broad-based unmanaged index of foreign stocks. The Lehman Brothers U.S. Aggregate Index represents securities that are publicly-registered, taxable, and dollar denominated; it covers the U.S. investment gra de fixed rate bond market, with index components for government and corporate securities, mortgage pass-through securities and asset-backed securities. The Lehman Brothers U.S. High Yield - 2% Issuer Cap Index is the 2% Issuer Cap component of the Lehman Brothers U.S. Corporate High Yield Index, which covers the universe of fixed rate, non-investment grade debt. |
ix | The Lifestyle Allocation 70% Composite Benchmark is a hypothetical representation of the performance of the Portfolio’s major asset classes. It consists of 40% Russell 1000 Index, 15% Russell 2000 Index, 15% MSCI EAFE Index, 25% Lehman Brothers U.S. Aggregate Index and 5% Lehman Brothers U.S. High Yield - 2% Issuer Cap Index. The Russell 1000 Index consists of the 1,000 largest U.S. companies based on total market capitalization. The Russell 2000 Index is a broad-based unmanaged capitalization weighted index of small-capitalization companies. The Morgan Stanley Capital International EAFE Index (MSCI EAFE) is a broad-based unmanaged index of foreign stocks. The Lehman Brothers U.S. Aggregate Index represents securities that are publicly-registered, taxable and dollar denominated; it covers the U.S. investment grad e fixed rate bond market, with index components for government and corporate securities, mortgage pass-through securities and asset-backed securities. The Lehman Brothers U.S. High Yield - 2% Issuer Cap Index is the 2% Issuer Cap component of the Lehman Brothers U.S. Corporate High Yield Index, which covers the universe of fixed rate, non-investment grade debt. |
x | The Russell 1000 Index measures the performance of the 1,000 largest companies in the Russell 3000 Index, which represents approximately 92% of the total market capitalization of the Russell 3000 Index. |
xi | The Lifestyle Allocation 50% Composite Benchmark is a hypothetical representation of the performance of the Portfolio’s major asset classes. It consists of 28% Russell 1000 Index, 12% Russell 2000 Index, 10% MSCI EAFE Index, 43% Lehman Brothers U.S. Aggregate Index and 7% Lehman Brothers U.S. High Yield - 2% Issuer Cap Index. The Russell 1000 Index consists of the 1,000 largest U.S. companies based on total market capitalization. The Russell 2000 Index is a broad-based unmanaged capitalization weighted index of small-capitalization companies. The Morgan Stanley Capital International EAFE Index (MSCI EAFE) is a broad-based unmanaged index of foreign stocks. The Lehman Brothers U.S. Aggregate Index represents securities that are publicly-registered, taxable and dollar denominated; it covers the U.S. investment grad e fixed rate bond market, with index components for government and corporate securities, mortgage pass-through securities and asset-backed securities. The Lehman Brothers U.S. High Yield - 2% Issuer Cap Index is the 2% Issuer Cap component of the Lehman Brothers U.S. Corporate High Yield Index, which covers the universe of fixed rate, non-investment grade debt. |
Legg Mason Partners Variable Equity Trust | VII |
(This page intentionally left blank.)

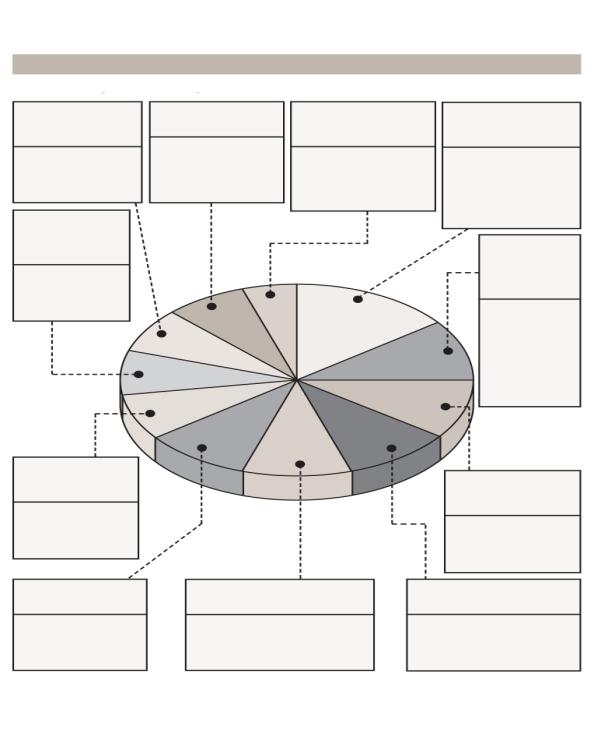
Fund at a Glance (unaudited)
Legg Mason Partners Variable Lifestyle Allocation 85% Breakdown (as of 7/31/07)*
As a Percentage of Total Long-Term Investments
5.0% Legg Mason Partners Equity Trust –
Legg Mason Partners Appreciation Fund,
Class I Shares
5.0% Legg Mason Investment
Trust, Inc. – Legg Mason
Opportunity Trust,
Institutional Class Shares
4.6% Western Asset Funds, Inc. –
Western Asset Core Plus Bond
Portfolio, Institutional Class Shares
15.0% Legg Mason Partners
Equity Trust –
Legg Mason Partners
Aggressive Growth Fund,
Class I Shares
Top 5 Sectors:
Financials
Information Technology
Industrials
Energy
Consumer Staples
Top 5 Sectors:
Consumer Discretionary
Materials
Telecommunication
Services
Information Technology
Industrials
Top 5 Sectors:
U.S. Government Agency
Mortgage-Backed
Securities
U.S. Government and Agency
Obligations
Corporate Bonds and Notes
Mortgage-Backed Securities
Asset-Backed Securities
Top 5 Sectors:
Health Care
Energy
Consumer Discretionary
Information Technology
Financials
5.0% Legg Mason Investors Trust, Inc.
– Legg Mason American Leading Cos.
Trust, Institutional Class Shares
Top 5 Sectors:
Information Technology
Financials
Industrials
Consumer Discretionary
Health Care
10.2% Legg Mason Global
Trust, Inc. – Legg Mason
International Equity Trust,
Institutional Class Shares
Top 5 Sectors:
Financials
Industrials
Energy
Consumer Discretionary
Materials
5.1% Western Asset Funds,
Inc. – Western Asset Absolute
Return Portfolio,
Institutional Class Shares
Top 5 Sectors:
U.S. Government Agency
Mortgage-Backed
Securities
Corporate Bonds and Notes
Mortgage-Backed Securities
Loan Participations and
Assignments
U.S. Government and
Agency Obligations
5.1% Western Asset Funds,
Inc. – Western Asset High Yield
Portfolio, Institutional
Class Shares
Top 5 Sectors:
Corporate Bonds and Notes
Yankee Bonds
Preferred Stocks
Mortgage-Backed Securities
Common Stocks and Equity
Interests
7.5% Legg Mason Partners Equity
Trust – Legg Mason Partners Small
Cap Growth Fund, Class I Shares†
Top 5 Sectors:
Information Technology
Industrials
Health Care
Consumer Discretionary
Energy
7.6% The Royce Fund-Royce Value
Fund, Institutional Class Shares
Top 5 Sectors:
Natural Resources
Industrial Products
Industrial Services
Consumer Products
Consumer Services
9.9% Legg Mason Partners Equity
Trust – Legg Mason Partners Large
Cap Growth Fund, Class I Shares
Top 5 Sectors:
Information Technology
Health Care
Consumer Discretionary
Financials
Consumer Staples
10.1% Legg Mason Partners Equity
Trust – Legg Mason Partners
International All Cap Opportunity
Fund, Class I Shares
Top 5 Sectors:
Financials
Consumer Discretionary
Industrials
Materials
Information Technology
9.9% Legg Mason Value Trust,
Inc., Institutional Class Shares
Top 5 Sectors:
Consumer Discretionary
Information Technology
Health Care
Financials
Telecommunication Services
* Subject to change at any time.
Effective March 2, 2007, Legg Mason Partners Small Cap Growth Fund I was renamed Legg Mason Partners Small Cap Growth Fund.
†
Legg Mason Partners Variable Equity Trust 2007 Semi-Annual Report | 1 |
7.4% Legg Mason Partners
Equity Trust – Legg Mason
Partners Small Cap Growth
Fund, Class I Shares†
Top 5 Sectors:
Information Technology
Industrials
Health Care
Consumer Discretionary
Energy
7.5% The Royce
Fund-Royce Value Fund,
Institutional Class Shares
Top 5 Sectors:
Natural Resources
Industrial Products
Industrial Services
Consumer Products
Consumer Services
5.1% Western Asset Funds,
Inc. – Western Asset
High Yield Portfolio,
Institutional Class Shares
14.8% Western Asset Funds,
Inc. – Western Asset Core
Plus Bond Portfolio,
Institutional Class Shares
Top 5 Sectors:
Corporate Bonds and Notes
Yankee Bonds
Preferred Stocks
Mortgage-Backed Securities
Common Stocks and Equity
Interests
Top 5 Sectors:
U.S. Government Agency
Mortgage-Backed Securities
U.S. Government and Agency
Obligations
Corporate Bonds and Notes
Mortgage-Backed Securities
Asset-Backed Securities
7.6% Legg Mason Partners
Equity Trust – Legg Mason
Partners International All
Cap Opportunity Fund,
Class I Shares
Top 5 Sectors:
Financials
Consumer Discretionary
Industrials
Materials
��Information Technology
10.1% Western Asset
Funds, Inc. – Western
Asset Absolute
Return Portfolio,
Institutional Class
Shares
7.6% Legg Mason Global Trust,
Inc. – Legg Mason International
Equity Trust,
Institutional Class Shares
Top 5 Sectors:
Financials
Industrials
Energy
Consumer Discretionary
Materials
9.9% Legg Mason
Value Trust, Inc.,
Institutional Class Shares
Top 5 Sectors:
Consumer Discretionary
Information Technology
Health Care
Financials
Telecommunication Services
10.0% Legg Mason Partners
Equity Trust – Legg Mason Partners
Appreciation Fund, Class I Shares
Top 5 Sectors:
Financials
Information Technology
Industrials
Energy
Consumer Staples
Top 5 Sectors:
Health Care
Energy
Consumer Discretionary
Information Technology
Financials
10.0% Legg Mason Partners
Equity Trust – Legg Mason Partners
Aggressive Growth Fund, Class I Shares
Top 5 Sectors:
Financials
Information Technology
Consumer Discretionary
Health Care
Industrials
10.0% Legg Mason Partners
Equity Trust – Legg Mason
Partners Fundamental Value
Fund, Class I Shares
Top 5 Sectors:
U.S. Government
Agency Mortgage-
Backed Securities
Corporate Bonds and
Notes
Mortgage-Backed
Securities
Loan Participations
and Assignments
U.S. Government and
Agency Obligations
Legg Mason Partners Variable Lifestyle Allocation 70% Breakdown (as of 7/31/07)*
As a Percentage of Total Long-Term Investments
Fund at a Glance (unaudited) (continued)
* Subject to change at any time.
†
Effective March 2, 2007, Legg Mason Partners Small Cap Growth Fund I was renamed Legg Mason Partners Small Cap Growth Fund.
2 | Legg Mason Partners Variable Equity Trust 2007 Semi-Annual Report |

6.0% Legg Mason Partners Equity
Trust – Legg Mason Partners Small Cap
Growth Fund, Class I Shares†
6.0% The Royce Fund-Royce
Value Fund, Institutional
Class Shares
5.0% Legg Mason Global Trust,
Inc. – Legg Mason International
Equity Trust, Institutional
Class Shares
5.0% Legg Mason Partners Equity
Trust – Legg Mason Partners
International All Cap Opportunity
Fund, Class I Shares
Top 5 Sectors:
Information Technology
Industrials
Health Care
Consumer Discretionary
Energy
Top 5 Sectors:
Natural Resources
Industrial Products
Industrial Services
Consumer Products
Consumer Services
Top 5 Sectors:
Financials
Industrials
Energy
Consumer Discretionary
Materials
Top 5 Sectors:
Financials
Consumer Discretionary
Industrials
Materials
Information Technology
6.9% Legg Mason Partners
Equity Trust – Legg Mason
Partners Aggressive Growth
Fund, Class I Shares
Top 5 Sectors:
Health Care
Energy
Consumer Discretionary
Information Technology
Financials
29.9% Western Asset Funds,
Inc. – Western Asset Core
Plus Bond Portfolio,
Institutional Class Shares
Top 5 Sectors:
U.S. Government Agency
Mortgage-Backed
Securities
U.S. Government and
Agency Obligations
Corporate Bonds and
Notes
Mortgage-Backed
Securities
Asset-Backed Securities
6.9% Legg Mason Value Trust, Inc.,
Institutional Class Shares
Top 5 Sectors:
Consumer Discretionary
Information Technology
Health Care
Financials
Telecommunication Services
13.2% Western Asset Funds,
Inc. – Western Asset Absolute
Return Portfolio, Institutional
Class Shares
Top 5 Sectors:
U.S. Government Agency
Mortgage-Backed Securities
Corporate Bonds and Notes
Mortgage-Backed Securities
Loan Participations and
Assignments
U.S. Government and Agency
Obligations
7.0% Legg Mason Partners Equity
Trust – Legg Mason Partners
Appreciation Fund, Class I Shares
7.0% Legg Mason Partners Equity
Trust – Legg Mason Partners
Fundamental Value Fund, Class I Shares
7.1% Western Asset Funds,
Inc. – Western Asset High Yield Portfolio,
Institutional Class Shares
Top 5 Sectors:
Financials
Information Technology
Industrials
Energy
Consumer Staples
Top 5 Sectors:
Financials
Information Technology
Consumer Discretionary
Health Care
Industrials
Top 5 Sectors:
Corporate Bonds and Notes
Yankee Bonds
Preferred Stocks
Mortgage-Backed Securities
Common Stocks and Equity Interests
Fund at a Glance (unaudited) (continued)
Legg Mason Partners Variable Lifestyle Allocation 50% (as of 7/31/07)*
As a Percentage of Total Long-Term Investments
* Subject to change at any time.
†
Effective March 2, 2007, Legg Mason Partners Small Cap Growth Fund I was renamed Legg Mason Partners Small Cap Growth Fund.
Legg Mason Partners Variable Equity Trust 2007 Semi-Annual Report | 3 |
Fund Expenses (unaudited)
Example
As a shareholder of the Funds, you may incur two types of costs: (1) transaction cost and (2) ongoing costs, including management fees; and other Fund expenses. This example is intended to help you understand your ongoing costs (in dollars) of investing in the Funds and to compare these costs with the ongoing costs of investing in other mutual funds.
This example is based on an investment of $1,000 invested on February 1, 2007 and held for the six months ended July 31, 2007.
Actual Expenses
The table below titled “Based on Actual Total Return” provides information about actual account values and actual expenses. You may use the information provided in this table, together with the amount you invested, to estimate the expenses that you paid over the period. To estimate the expenses you paid on your account, divide your ending account value by $1,000 (for example, an $8,600 ending account value divided by $1,000 = 8.6), then multiply the result by the number under the heading entitled “Expenses Paid During the Period”.
| Based on Actual Total Return(1) | |
|
| | | Actual Total
Return(2) | | Beginning
Account
Value | | Ending
Account
Value | | Annualized
Expense
Ratio(3) | | Expenses
Paid During
the Period(4) | |
|
|
|
| Legg Mason Partners Variable Lifestyle Allocation 85% | | 1.49 | % | | $ | 1,000.00 | | $ | 1,014.90 | | 0.35 | % | | $ | 1.75 | |
|
|
|
| Legg Mason Partners Variable Lifestyle Allocation 70% | | 1.36 | | | | 1,000.00 | | | 1,013.60 | | 0.35 | | | | 1.75 | |
|
|
|
| Legg Mason Partners Variable Lifestyle Allocation 50% | | 0.91 | | | | 1,000.00 | | | 1,009.10 | | 0.35 | | | | 1.74 | |
|
|
|
(1) | For the six months ended July 31, 2007. |
(2) | Assumes reinvestment of all distributions, including returns of capital, if any, at net asset value. Total return is not annualized, as it may not be representative of the total return for the year. Total returns do not reflect expenses associated with the separate account such as administrative fees, account charges and surrender charges, which, if reflected, would reduce the total returns. Performance figures may reflect fee waivers and/or expense reimbursements. In the absence of fee waivers and/or expense reimbursements, the total return would have been lower. Past performance is no guarantee of future results. |
(3) | The expense ratios do not include expenses of the Underlying Funds in which the Funds invest. |
(4) | Expenses (net of fee waivers and/or expense reimbursements) are equal to each Fund’s annualized expense ratio multiplied by the average account value over the period, multiplied by the number of days in the most recent fiscal half-year, then divided by 365. |
4 | Legg Mason Partners Variable Equity Trust 2007 Semi-Annual Report |
Fund Expenses (unaudited) (continued)
Hypothetical Example for Comparison Purposes
The table below titled “Based on Hypothetical Total Return” provides information about hypothetical account values and hypothetical expenses based on the actual expense ratio and an assumed rate of return of 5.00% per year before expenses, which is not each Fund’s actual return. The hypothetical account values and expenses may not be used to estimate the actual ending account balance or expenses you paid for the period. You may use the information provided in this table to compare the ongoing costs of investing in the Funds and other funds. To do so, compare the 5.00% hypothetical example relating to the Funds with the 5.00% hypothetical examples that appear in the shareholder reports of the other funds.
Please note that the expenses shown in the table below are meant to highlight your ongoing costs only and do not reflect any transactional costs, such as front-end or back-end sales charges (loads). Therefore, the table is useful in comparing ongoing costs only, and will not help you determine the relative total costs of owning different funds. In addition, if these transaction costs were included, your costs would have been higher.
| Based on Hypothetical Total Return(1) | |
|
| | | Hypothetical
Annualized
Total Return | | Beginning
Account
Value | | Ending
Account
Value | | Annualized
Expense
Ratio(2) | | Expenses
Paid During
the Period(3) | |
|
|
|
| Legg Mason Partners Variable Lifestyle Allocation 85% | | 5.00 | % | | $ | 1,000.00 | | $ | 1,023.06 | | 0.35 | % | | $ | 1.76 | |
|
|
|
| Legg Mason Partners Variable Lifestyle Allocation 70% | | 5.00 | | | | 1,000.00 | | | 1,023.06 | | 0.35 | | | | 1.76 | |
|
|
|
| Legg Mason Partners Variable Lifestyle Allocation 50% | | 5.00 | | | | 1,000.00 | | | 1,023.06 | | 0.35 | | | | 1.76 | |
|
|
|
(1) | For the six months ended July 31, 2007. |
(2) | The expense ratios do not include expenses of the Underlying Funds in which the Funds invest. |
(3) | Expenses (net of fee waivers and/or expense reimbursements) are equal to each Fund’s annualized expense ratio multiplied by the average account value over the period, multiplied by the number of days in the most recent fiscal half-year, then divided by 365. |
Legg Mason Partners Variable Equity Trust 2007 Semi-Annual Report | 5 |
| Schedules of Investments (July 31, 2007) (unaudited) |
| LEGG MASON PARTNERS VARIABLE LIFESTYLE ALLOCATION 85% |
|
|
|
| Shares | | Security | | Value | |
|
|
|
| INVESTMENTS IN UNDERLYING FUNDS — 99.4% | | | | |
| | 367,813 | | Legg Mason Global Trust, Inc. – Legg Mason International Equity Trust, Institutional Class Shares | | $ | 7,970,500 | |
| | 184,923 | | Legg Mason Investment Trust, Inc. – Legg Mason Opportunity Trust, Institutional Class Shares | | | 3,879,683 | |
| | 147,318 | | Legg Mason Investors Trust, Inc. – Legg Mason American Leading Cos. Trust, Institutional Class Shares | | | 3,920,122 | |
| | | | Legg Mason Partners Equity Trust: | | | | |
| | 97,014 | | Legg Mason Partners Aggressive Growth Fund, Class I Shares * | | | 11,740,570 | |
| | 248,028 | | Legg Mason Partners Appreciation Fund, Class I Shares | | | 3,928,765 | |
| | 528,220 | | Legg Mason Partners International All Cap Opportunity Fund, Class I Shares * | | | 7,944,433 | |
| | 306,873 | | Legg Mason Partners Large Cap Growth Fund, Class I Shares * | | | 7,754,677 | |
| | 346,566 | | Legg Mason Partners Small Cap Growth Fund, Class I Shares † | | | 5,874,294 | |
| | 98,011 | | Legg Mason Value Trust, Inc., Institutional Class Shares | | | 7,749,708 | |
| | 500,312 | | The Royce Fund – Royce Value Fund, Institutional Class Shares | | | 5,933,702 | |
| | | | Western Asset Funds, Inc.: | | | | |
| | 401,746 | | Western Asset Absolute Return Portfolio, Institutional Class Shares | | | 3,997,377 | |
| | 356,411 | | Western Asset Core Plus Bond Portfolio, Institutional Class Shares | | | 3,603,318 | |
| | 403,684 | | Western Asset High Yield Portfolio, Institutional Class Shares | | | 4,012,621 | |
|
|
|
| | | | TOTAL INVESTMENTS IN UNDERLYING FUNDS BEFORE SHORT-TERM INVESTMENT
(Cost — $65,591,008) | | | 78,309,770 | |
|
|
|
| Face | | | | | | |
| Amount | | | | | | |
|
|
|
| SHORT-TERM INVESTMENT — 0.2% | | | | |
| Repurchase Agreement — 0.2% | | | | |
| $ | 180,000 | | Interest in $493,653,000 joint tri-party repurchase agreement dated 7/31/07 with Greenwich Capital Markets Inc., 5.290% due 8/1/07; Proceeds at maturity — $180,026; (Fully collateralized by various U.S. government agency obligations, 5.500% to 6.000% due 3/1/37 to 8/1/37; Market value — $183,601)
(Cost — $180,000) | | | 180,000 | |
|
|
|
| | | | TOTAL INVESTMENTS — 99.6% (Cost — $65,771,008#) | | | 78,489,770 | |
| | | | Other Assets in Excess of Liabilities — 0.4% | | | 339,463 | |
|
|
|
| | | | TOTAL NET ASSETS — 100.0% | | $ | 78,829,233 | |
|
|
|
* | Non-income producing security. |
† | Effective March 2, 2007, Legg Mason Partners Small Cap Growth Fund I was renamed Legg Mason Partners Small Cap Growth Fund. |
# | Aggregate cost for federal income tax purposes is substantially the same. |
See Notes to Financial Statements.
6 | Legg Mason Partners Variable Equity Trust 2007 Semi-Annual Report |
| Schedules of Investments (July 31, 2007) (unaudited) (continued) | |
| LEGG MASON PARTNERS VARIABLE LIFESTYLE ALLOCATION 70% | |
|
|
|
| Shares | | Security | | Value | |
|
|
|
| INVESTMENTS IN UNDERLYING FUNDS — 99.4% | | | | |
| | 425,445 | | Legg Mason Global Trust, Inc.– Legg Mason International Equity Trust, Institutional Class Shares | | $ | 9,219,392 | |
| | | | Legg Mason Partners Equity Trust: | | | | |
| | 99,752 | | Legg Mason Partners Aggressive Growth Fund, Class I Shares * | | | 12,071,951 | |
| | 765,079 | | Legg Mason Partners Appreciation Fund, Class I Shares | | | 12,118,844 | |
| | 719,649 | | Legg Mason Partners Fundamental Value Fund, Class I Shares | | | 12,118,897 | |
| | 611,008 | | Legg Mason Partners International All Cap Opportunity Fund, Class I Shares * | | | 9,189,551 | |
| | 534,490 | | Legg Mason Partners Small Cap Growth Fund, Class I Shares † | | | 9,059,611 | |
| | 151,155 | | Legg Mason Value Trust, Inc., Institutional Class Shares | | | 11,951,848 | |
| | 771,433 | | The Royce Fund – Royce Value Fund, Institutional Class Shares | | | 9,149,196 | |
| | | | Western Asset Funds, Inc.: | | | | |
| | 1,239,289 | | Western Asset Absolute Return Portfolio, Institutional Class Shares | | | 12,330,928 | |
| | 1,772,078 | | Western Asset Core Plus Bond Portfolio, Institutional Class Shares | | | 17,915,708 | |
| | 622,605 | | Western Asset High Yield Portfolio, Institutional Class Shares | | | 6,188,697 | |
|
|
|
| | | | TOTAL INVESTMENTS IN UNDERLYING FUNDS
BEFORE SHORT-TERM INVESTMENT
(Cost — $112,289,665) | | | 121,314,623 | |
|
|
|
| Face | | | | | | |
| Amount | | | | | | |
|
|
|
| SHORT-TERM INVESTMENT — 0.4% | | | | |
| Repurchase Agreement — 0.4% | | | | |
| $ | 538,000 | | Interest in $493,653,000 joint tri-party repurchase agreement dated 7/31/07 with Greenwich Capital Markets Inc., 5.290% due 8/1/07; Proceeds at maturity — $538,079; (Fully collateralized by various U.S. government agency obligations, 5.500% to 6.000% due 3/1/37 to 8/1/37; Market value — $548,762)
(Cost — $538,000) | | | 538,000 | |
|
|
|
| | | | TOTAL INVESTMENTS — 99.8% (Cost — $112,827,665#) | | | 121,852,623 | |
| | | | Other Assets in Excess of Liabilities — 0.2% | | | 204,837 | |
|
|
|
| | | | TOTAL NET ASSETS — 100.0% | | $ | 122,057,460 | |
|
|
|
* | Non-income producing security. |
† | Effective March 2, 2007, Legg Mason Partners Small Cap Growth Fund I was renamed Legg Mason Partners Small Cap Growth Fund. |
# | Aggregate cost for federal income tax purposes is substantially the same. |
See Notes to Financial Statements.
Legg Mason Partners Variable Equity Trust 2007 Semi-Annual Report | 7 |
| Schedules of Investments (July 31, 2007) (unaudited) (continued) | | | | |
|
| LEGG MASON PARTNERS VARIABLE LIFESTYLE ALLOCATION 50% | | | | |
|
|
|
| Shares | | Security | | | Value | |
|
|
|
| INVESTMENTS IN UNDERLYING FUNDS — 99.3% | | | | |
| | 505,587 | | Legg Mason Global Trust, Inc. – Legg Mason International Equity Trust, | | | | |
| | | | Institutional Class Shares | | $ | 10,956,066 | |
| | | | Legg Mason Partners Equity Trust: | | | | |
| | 124,460 | | Legg Mason Partners Aggressive Growth Fund, Class I Shares * | | | 15,062,156 | |
| | 954,516 | | Legg Mason Partners Appreciation Fund, Class I Shares | | | 15,119,537 | |
| | 897,847 | | Legg Mason Partners Fundamental Value Fund, Class I Shares | | | 15,119,739 | |
| | 726,054 | | Legg Mason Partners International All Cap Opportunity Fund, Class I Shares * | | | 10,919,854 | |
| | 762,000 | | Legg Mason Partners Small Cap Growth Fund, Class I Shares † | | | 12,915,897 | |
| | 188,611 | | Legg Mason Value Trust, Inc., Institutional Class Shares | | | 14,913,473 | |
| | 1,099,949 | | The Royce Fund – Royce Value Fund, Institutional Class Shares | | | 13,045,402 | |
| | | | Western Asset Funds, Inc.: | | | | |
| | 2,871,690 | | Western Asset Absolute Return Portfolio, Institutional Class Shares | | | 28,573,313 | |
| | 6,426,613 | | Western Asset Core Plus Bond Portfolio, Institutional Class Shares | | | 64,973,059 | |
| | 1,553,592 | | Western Asset High Yield Portfolio, Institutional Class Shares | | | 15,442,702 | |
|
|
|
| | | | TOTAL INVESTMENTS IN UNDERLYING FUNDS
BEFORE SHORT-TERM INVESTMENT | | | | |
| | | | (Cost — $209,905,290) | | | 217,041,198 | |
|
|
|
| Face
Amount | | | | | | |
|
|
|
| SHORT-TERM INVESTMENT — 0.5% | | | | |
| Repurchase Agreement — 0.5% | | | | |
| $ | 1,091,000 | | Interest in $493,653,000 joint tri-party repurchase agreement dated 7/31/07 | | | | |
| | | | with Greenwich Capital Markets Inc., 5.290% due 8/1/07; Proceeds at | | | | |
| | | | maturity — $1,091,160; (Fully collateralized by various U.S. government | | | | |
| | | | agency obligations, 5.500% to 6.000% due 3/1/37 to 8/1/37; Market | | | | |
| | | | value — $1,112,823) (Cost — $1,091,000) | | | 1,091,000 | |
|
|
|
| | | | TOTAL INVESTMENTS — 99.8% (Cost — $210,996,290#) | | | 218,132,198 | |
| | | | Other Assets in Excess of Liabilities — 0.2% | | | 415,585 | |
|
|
|
| | | | TOTAL NET ASSETS — 100.0% | | $ | 218,547,783 | |
|
|
* | Non-income producing security. |
† | Effective March 2, 2007, Legg Mason Partners Small Cap Growth Fund I was renamed Legg Mason Partners Small Cap Growth Fund. |
# | Aggregate cost for federal income tax purposes is substantially the same. |
See Notes to Financial Statements.
8 | Legg Mason Partners Variable Equity Trust 2007 Semi-Annual Report |
Statements of Assets and Liabilities (July 31, 2007) (unaudited) |
| | | Legg Mason
Partners
Variable
Lifestyle
Allocation
85% | | Legg Mason
Partners
Variable
Lifestyle
Allocation
70% | | Legg Mason
Partners
Variable
Lifestyle
Allocation
50% | |
| | | | | | | | | | | |
| | | | | | | | | | | |
| | | | | | | | | | | |
| ASSETS: | | | | | | | | | | |
| Investments, at cost | | $ | 65,771,008 | | $ | 112,827,665 | | $ | 210,996,290 | |
| | | | | | | | | | | |
| | | | | | | | | | | |
| | | | | | | | | | | |
| Investments, at value | | | 78,489,770 | | | 121,852,623 | | | 218,132,198 | |
| Cash | | | 815 | | | 391 | | | 97 | |
| Receivable for securities sold | | | 220,665 | | | 79,487 | | | 8,180 | |
| Receivable for Fund shares sold | | | 100,286 | | | 45,690 | | | 322,846 | |
| Dividends and interest receivable | | | 32,552 | | | 133,937 | | | 424,608 | |
| | | | | | | | | | | |
| | | | | | | | | | | |
| | | | | | | | | | | |
| Total Assets | | | 78,844,088 | | | 122,112,128 | | | 218,887,929 | |
| | | | | | | | | | | |
| | | | | | | | | | | |
| | | | | | | | | | | |
| LIABILITIES: | | | | | | | | | | |
| Investment management fee payable | | | 9,039 | | | 20,670 | | | 45,223 | |
| Payable for Fund shares repurchased | | | 5,816 | | | 33,998 | | | 294,923 | |
| | | | | | | | | | | |
| | | | | | | | | | | |
| | | | | | | | | | | |
| Total Liabilities | | | 14,855 | | | 54,668 | | | 340,146 | |
| | | | | | | | | | | |
| | | | | | | | | | | |
| | | | | | | | | | | |
| Total Net Assets | | $ | 78,829,233 | | $ | 122,057,460 | | $ | 218,547,783 | |
| | | | | | | | | | | |
| | | | | | | | | | | |
| | | | | | | | | | | |
| NET ASSETS: | | | | | | | | | | |
| Par value (Note 4) | | $ | 58 | | $ | 105 | | $ | 173 | |
| Paid-in capital in excess of par value | | | 89,624,570 | | | 143,398,050 | | | 209,819,768 | |
| Undistributed net investment income | | | 324,445 | | | 1,042,725 | | | 3,247,968 | |
| Accumulated net realized loss on
Underlying Funds, capital gain distributions from Underlying Funds and foreign currency transactions | | | (23,838,602 | ) | | (31,408,378 | ) | | (1,656,034 | ) |
| Net unrealized appreciation on Underlying Funds | | | 12,718,762 | | | 9,024,958 | | | 7,135,908 | |
| | | | | | | | | | | |
| | | | | | | | | | | |
| | | | | | | | | | | |
| | | | | | | | | | | |
| | | | | | | | | | | |
| | | | | | | | | | | |
| Total Net Assets | | $ | 78,829,233 | | $ | 122,057,460 | | $ | 218,547,783 | |
| | | | | | | | | | | |
| | | | | | | | | | | |
| | | | | | | | | | | |
| Shares Outstanding | | | 5,762,277 | | | 10,540,435 | | | 17,301,864 | |
| | | | | | | | | | | |
| | | | | | | | | | | |
| | | | | | | | | | | |
| Net Asset Value | |
| $13.68 | | | $11.58 | | | $12.63 | |
| | | | | | | | | | | |
| | | | | | | | | | | |
| | | | | | | | | | | |
See Notes to Financial Statements.
| Legg Mason Partners Variable Equity Trust 2007 Semi-Annual Report | 9 |
Statements of Operations (For the six months ended July 31, 2007) (unaudited) |
| | | Legg Mason
Partners
Variable
Lifestyle
Allocation
85% | | Legg Mason
Partners
Variable
Lifestyle
Allocation
70% | | Legg Mason
Partners
Variable
Lifestyle
Allocation
50% | |
| | | | | | | | | | | |
| | | | | | | | | | | |
| | | | | | | | | | | |
| INVESTMENT INCOME: | | | | | | | | | | |
| Income distributions from Underlying Funds | | $ | 470,831 | | $ | 1,288,623 | | $ | 3,661,125 | |
| Interest | | | 7,081 | | | 13,849 | | | 20,722 | |
| | | | | | | | | | | |
| | | | | | | | | | | |
| | | | | | | | | | | |
| Total Investment Income | | | 477,912 | | | 1,302,472 | | | 3,681,847 | |
| | | | | | | | | | | |
| | | | | | | | | | | |
| | | | | | | | | | | |
| EXPENSES: | | | | | | | | | | |
| Investment management fees (Note 2) | | | 140,595 | | | 220,746 | | | 389,324 | |
| | | | | | | | | | | |
| | | | | | | | | | | |
| | | | | | | | | | | |
| Total Expenses | | | 140,595 | | | 220,746 | | | 389,324 | |
| | | | | | | | | | | |
| | | | | | | | | | | |
| | | | | | | | | | | |
| Net Investment Income | | | 337,317 | | | 1,081,726 | | | 3,292,523 | |
| | | | | | | | | | | |
| | | | | | | | | | | |
| | | | | | | | | | | |
| REALIZED AND UNREALIZED GAIN (LOSS) ON
UNDERLYING FUNDS, CAPITAL GAIN
DISTRIBUTIONS FROM UNDERLYING
FUNDS AND FOREIGN CURRENCY
TRANSACTIONS (NOTES 1 AND 3): | | | | | | | | | | |
| Net Realized Gain From: | | | | | | | | | | |
| Underlying Funds | | | 638,918 | | | 519,774 | | | 694,949 | |
| Capital gain distributions from Underlying Funds | | | 298,012 | | | 488,976 | | | 738,210 | |
| Foreign currency transactions | | | 268 | | | 414 | | | — | |
| | | | | | | | | | | |
| | | | | | | | | | | |
| | | | | | | | | | | |
| Net Realized Gain | | | 937,198 | | | 1,009,164 | | | 1,433,159 | |
| | | | | | | | | | | |
| | | | | | | | | | | |
| | | | | | | | | | | |
| Change in Net Unrealized Appreciation/Depreciation From Underlying Funds | | | (82,315 | ) | | (229,199 | ) | | (2,666,060 | ) |
| | | | | | | | | | | |
| | | | | | | | | | | |
| | | | | | | | | | | |
| Net Gain (Loss) on Underlying Funds,
Capital Gain Distributions From Underlying Funds and Foreign Currency Transactions | | | 854,883 | | | 779,965 | | | (1,232,901 | ) |
| | | | | | | | | | | |
| | | | | | | | | | | |
| | | | | | | | | | | |
| Increase in Net Assets From Operations | | $ | 1,192,200 | | $ | 1,861,691 | | $ | 2,059,622 | |
| | | | | | | | | | | |
| | | | | | | | | | | |
| | | | | | | | | | | |
See Notes to Financial Statements.
10 | Legg Mason Partners Variable Equity Trust 2007 Semi-Annual Report |
| Statements of Changes in Net Assets | | | | | | | |
| For the six months ended July 31, 2007 (unaudited)
and the year ended January 31, 2007 | | | | | | | |
| | | | | | | | |
| Legg Mason Partners Variable Lifestyle Allocation 85% | | | July 31 | | | January 31 | |
| | | | | | | | |
| | | | | | | | |
| | | | | | | | |
| OPERATIONS: | | | | | | | |
| Net investment income | | $ | 337,317 | | $ | 823,277 | |
| Net realized gain | | | 937,198 | | | 13,652,541 | |
| Change in net unrealized appreciation/depreciation | | | (82,315 | ) | | (8,277,157 | ) |
| | | | | | | | |
| | | | | | | | |
| | | | | | | | |
| Increase in Net Assets From Operations | | | 1,192,200 | | | 6,198,661 | |
| | | | | | | | |
| | | | | | | | |
| | | | | | | | |
| DISTRIBUTIONS TO SHAREHOLDERS FROM (NOTE 1): | | | | | | | |
| Net investment income | | | (20,002 | ) | | (848,122 | ) |
| Net realized gains | | | (5,093,952 | ) | | — | |
| | | | | | | | |
| | | | | | | | |
| | | | | | | | |
| Decrease in Net Assets From Distributions to Shareholders | | | (5,113,954 | ) | | (848,122 | ) |
| | | | | | | | |
| | | | | | | | |
| | | | | | | | |
| FUND SHARE TRANSACTIONS (NOTE 4): | | | | | | | |
| Net proceeds from sale of shares | | | 4,063,942 | | | 811,062 | |
| Reinvestment of distributions | | | 5,113,954 | | | 848,122 | |
| Cost of shares repurchased | | | (8,380,962 | ) | | (19,118,130 | ) |
| | | | | | | | |
| | | | | | | | |
| | | | | | | | |
| Increase (Decrease) in Net Assets From Fund Share Transactions | | | 796,934 | | | (17,458,946 | ) |
| | | | | | | | |
| | | | | | | | |
| | | | | | | | |
| Decrease in Net Assets | | | (3,124,820 | ) | | (12,108,407 | ) |
| NET ASSETS: | | | | | | | |
| Beginning of period | | | 81,954,053 | | | 94,062,460 | |
| | | | | | | | |
| | | | | | | | |
| | | | | | | | |
| End of period * | | $ | 78,829,233 | | $ | 81,954,053 | |
| | | | | | | | |
| | | | | | | | |
| * Includes undistributed net investment income of: | | | $324,445 | | | $7,130 | |
| | | | | | | | |
| | | | | | | | |
See Notes to Financial Statements.
| Legg Mason Partners Variable Equity Trust 2007 Semi-Annual Report | 11 |
| Statements of Changes in Net Assets (continued) | | | | | | | |
| For the six months ended July 31, 2007 (unaudited)
and the year ended January 31, 2007 | | | | | | | |
| | | | | | | | |
| Legg Mason Partners Variable Lifestyle Allocation 70% | | | July 31 | | | January 31 | |
| | | | | | | | |
| | | | | | | | |
| | | | | | | | |
| OPERATIONS: | | | | | | | |
| Net investment income | | $ | 1,081,726 | | $ | 2,443,662 | |
| Net realized gain | | | 1,009,164 | | | 18,183,031 | |
| Change in net unrealized appreciation/depreciation | | | (229,199 | ) | | (10,695,583 | ) |
| | | | | | | | |
| | | | | | | | |
| | | | | | | | |
| Increase in Net Assets From Operations | | | 1,861,691 | | | 9,931,110 | |
| | | | | | | | |
| | | | | | | | |
| | | | | | | | |
| DISTRIBUTIONS TO SHAREHOLDERS FROM (NOTE 1): | | | | | | | |
| Net investment income | | | (150,004 | ) | | (2,463,115 | ) |
| Net realized gains | | | (1,984,918 | ) | | — | |
| | | | | | | | |
| | | | | | | | |
| | | | | | | | |
| Decrease in Net Assets From Distributions to Shareholders | | | (2,134,922 | ) | | (2,463,115 | ) |
| | | | | | | | |
| | | | | | | | |
| | | | | | | | |
| FUND SHARE TRANSACTIONS (NOTE 4): | | | | | | | |
| Net proceeds from sale of shares | | | 3,914,617 | | | 1,103,416 | |
| Reinvestment of distributions | | | 2,134,922 | | | 2,463,115 | |
| Cost of shares repurchased | | | (13,414,200 | ) | | (27,981,101 | ) |
| | | | | | | | |
| | | | | | | | |
| | | | | | | | |
| Decrease in Net Assets From Fund Share Transactions | | | (7,364,661 | ) | | (24,414,570 | ) |
| | | | | | | | |
| | | | | | | | |
| | | | | | | | |
| Decrease in Net Assets | | | (7,637,892 | ) | | (16,946,575 | ) |
| NET ASSETS: | | | | | | | |
| Beginning of period | | | 129,695,352 | | | 146,641,927 | |
| | | | | | | | |
| | | | | | | | |
| | | | | | | | |
| End of period * | | $ | 122,057,460 | | $ | 129,695,352 | |
| | | | | | | | |
| | | | | | | | |
| * Includes undistributed net investment income of: | | | $1,042,725 | | | $111,003 | |
| | | | | | | | |
| | | | | | | | |
| | | | | | | | |
| | | | | | | | |
See Notes to Financial Statements.
12 | Legg Mason Partners Variable Equity Trust 2007 Semi-Annual Report |
Statements of Changes in Net Assets (continued) |
For the six months ended July 31, 2007 (unaudited)
and the year ended January 31, 2007
| Legg Mason Partners Variable Lifestyle Allocation 50% | | July 31 | | January 31 | |
|
|
|
| OPERATIONS: | | | | | | | |
| Net investment income | | $ | 3,292,523 | | $ | 6,234,346 | |
| Net realized gain | | | 1,433,159 | | | 17,934,862 | |
| Change in net unrealized appreciation/depreciation | | | (2,666,060 | ) | | (6,627,642 | ) |
|
|
|
| Increase in Net Assets From Operations | | | 2,059,622 | | | 17,541,566 | |
|
|
|
| DISTRIBUTIONS TO SHAREHOLDERS FROM (NOTE 1): | | | | | | | |
| Net investment income | | | (400,014 | ) | | (6,319,915 | ) |
| Net realized gains | | | (1,259,746 | ) | | — | |
|
|
|
| Decrease in Net Assets From Distributions to Shareholders | | | (1,659,760 | ) | | (6,319,915 | ) |
|
|
|
| FUND SHARE TRANSACTIONS (NOTE 4): | | | | | | | |
| Net proceeds from sale of shares | | | 9,947,325 | | | 5,692,218 | |
| Reinvestment of distributions | | | 1,659,760 | | | 6,319,915 | |
| Cost of shares repurchased | | | (18,389,658 | ) | | (45,773,006 | ) |
|
|
|
| Decrease in Net Assets From Fund Share Transactions | | | (6,782,573 | ) | | (33,760,873 | ) |
|
|
|
| Decrease in Net Assets | | | (6,382,711 | ) | | (22,539,222 | ) |
| NET ASSETS: | | | | | | | |
| Beginning of period | | | 224,930,494 | | | 247,469,716 | |
|
|
|
| End of period * | | $ | 218,547,783 | | $ | 224,930,494 | |
| | | | | | | | |
| | | | | | | | |
| * Includes undistributed net investment income of: | | | $3,247,968 | | | $355,459 | |
|
|
See Notes to Financial Statements.
Legg Mason Partners Variable Equity Trust 2007 Semi-Annual Report | 13 |
For a share of beneficial interest outstanding throughout each year ended January 31, unless otherwise noted:
|
|
|
| Legg Mason Partners Variable
Lifestyle Allocation 85% | | | 2007(1) | 2007(2) | 2006(2) | 2005(2) | 2004(2) | 2003(2) |
|
|
|
| Net Asset Value, Beginning of Period | | | $14.39 | | | $13.46 | | | $12.06 | | | $11.62 | | | $ 8.07 | | | $10.72 | |
|
|
|
| Income (Loss) From Operations: | | | | | | | | | | | | | | | | | | | |
| Net investment income(3) | | | 0.06 | | | 0.14 | | | 0.06 | | | 0.05 | | | 0.05 | | | 0.04 | |
| Net realized and unrealized gain (loss) | | | 0.18 | | | 0.94 | | | 1.40 | | | 0.44 | | | 3.56 | | | (2.58 | ) |
|
|
|
| Total Income (Loss) From Operations | | | 0.24 | | | 1.08 | | | 1.46 | | | 0.49 | | | 3.61 | | | (2.54 | ) |
|
|
|
| Less Distributions From: | | | | | | | | | | | | | | | | | | |
| Net investment income | | | (0.00 | )(4) | | (0.15 | ) | | (0.06 | ) | | (0.05 | ) | | (0.06 | ) | | (0.11 | ) |
| Net realized gains | | | (0.95 | ) | | — | | | — | | | — | | | — | | | — | |
|
|
|
| Total Distributions | | | (0.95 | ) | | (0.15 | ) | | (0.06 | ) | | (0.05 | ) | | (0.06 | ) | | (0.11 | ) |
|
|
|
| Net Asset Value, End of Period | | | $13.68 | | | $14.39 | | | $13.46 | | | $12.06 | | | $11.62 | | | $ 8.07 | |
|
|
|
| Total Return(5) | | | 1.49 | % | | 8.02 | % | | 12.11 | % | | 4.18 | % | | 44.79 | % | | (23.69 | )% |
|
|
|
| Net Assets, End of Period (000s) | | $ | 78,829 | | $ | 81,954 | | $ | 94,062 | | $ | 100,318 | | $ | 110,156 | | $ | 86,800 | |
|
|
|
| Ratios to Average Net Assets: | | | | | | | | | | | | | | | | | | | |
| Gross expenses(6) | | | 0.35 | %(7) | | 0.38 | %(8) | | 0.35 | % | | 0.35 | % | | 0.35 | % | | 0.35 | % |
| Net expenses(6) | | | 0.35 | (7) | | 0.37 | (8)(9) | | 0.35 | | | 0.35 | (9) | | 0.35 | | | 0.35 | |
| Net investment income | | | 0.84 | (7) | | 0.97 | | | 0.50 | | | 0.38 | | | 0.50 | | | 0.32 | |
|
|
|
| Portfolio Turnover Rate | | | 4 | % | | 108 | % | | 50 | % | | 4 | % | | 2 | % | | 1 | % |
|
|
(1) | For the six months ended July 31, 2007 (unaudited). |
(2) | Represents a share of capital stock outstanding prior to April 30, 2007. |
(3) | Net investment income per share includes short-term capital gain distributions from Underlying Funds. |
(4) | Amount represents less than $0.01 per share. |
(5) | Performance figures may reflect fee waivers and/or expense reimbursements. In the absence of fee waivers and/or expense reimbursements, the total return would have been lower. Total returns do not reflect expenses associated with the separate accounts such as administrative fees, account charges and surrender charges which, if reflected, would reduce the total return for all periods shown. Past performance is no guarantee of future results. Total returns for periods of less than one year are not annualized. |
(6) | Does not include expenses of the Underlying Funds in which the Fund invests. |
(8) | Included in the expense ratios are certain non-recurring restructuring (and reorganization, if applicable) fees that were incurred by the Fund during the period. Without these fees, the gross and net expense ratios both would have been 0.35% (Note 9). |
(9) | Reflects fee waivers and/or expense reimbursements. |
See Notes to Financial Statements.
14 | Legg Mason Partners Variable Equity Trust 2007 Semi-Annual Report |
Financial Highlights (continued) |
For a share of beneficial interest outstanding throughout each year ended January 31, unless otherwise noted:
|
|
|
|
| Legg Mason Partners Variable
Lifestyle Allocation 70% | | 2007(1) | | 2007(2) | | 2006(2) | | 2005(2) | | 2004(2) | | 2003(2) | |
|
|
|
| Net Asset Value, Beginning of Period | | $11.62 | | $10.96 | | $10.20 | | $ 9.98 | | $7.47 | | $11.29 | |
|
|
|
| Income (Loss) From Operations: | | | | | | | | | | | | | |
| Net investment income(3) | | 0.10 | | 0.22 | | 0.16 | | 0.16 | | 0.15 | | 0.16 | |
| Net realized and unrealized gain (loss) | | 0.06 | | 0.66 | | 0.76 | | 0.22 | | 2.51 | | (2.20 | ) |
|
|
|
| Total Income (Loss) From Operations | | 0.16 | | 0.88 | | 0.92 | | 0.38 | | 2.66 | | (2.04 | ) |
|
|
|
| Less Distributions From: | | | | | | | | | | | | | |
| Net investment income | | (0.01 | ) | (0.22 | ) | (0.16 | ) | (0.16 | ) | (0.15 | ) | (1.15 | ) |
| Net realized gains | | (0.19 | ) | — | | — | | — | | — | | (0.63 | ) |
|
|
|
| Total Distributions | | (0.20 | ) | (0.22 | ) | (0.16 | ) | (0.16 | ) | (0.15 | ) | (1.78 | ) |
|
|
|
| Net Asset Value, End of Period | | $11.58 | | $11.62 | | $10.96 | | $10.20 | | $9.98 | | $ 7.47 | |
|
|
|
| Total Return(4) | | 1.36 | % | 8.06 | % | 9.08 | % | 3.81 | % | 35.66 | % | (18.04 | )% |
|
|
|
| Net Assets, End of Period (000s) | | $122,057 | | $129,695 | | $146,642 | | $158,804 | | $173,641 | | $145,783 | |
|
|
|
| Ratios to Average Net Assets: | | | | | | | | | | | | | |
| Gross expenses(5) | | 0.35 | %(6) | 0.38 | %(7) | 0.35 | % | 0.35 | % | 0.35 | % | 0.35 | % |
| Net expenses(5) | | 0.35 | (6) | 0.37 | (7)(8) | 0.35 | | 0.35 | (8) | 0.35 | | 0.35 | |
| Net investment income | | 1.72 | (6) | 1.82 | | 1.47 | | 1.54 | | 1.67 | | 1.66 | |
|
|
|
| Portfolio Turnover Rate | | 2 | % | 123 | % | 53 | % | 5 | % | 0 | %(9) | 3 | % |
| | | | | | | | | | | | | | | | | |
|
|
|
(1) | For the six months ended July 31, 2007 (unaudited). |
(2) | Represents a share of capital stock outstanding prior to April 30, 2007. |
(3) | Net investment income per share includes short-term capital gain distributions from Underlying Funds. |
(4) | Performance figures may reflect fee waivers and/or expense reimbursements. In the absence of fee waivers and/or expense reimbursements, the total return would have been lower. Total returns do not reflect expenses associated with the separate accounts such as administrative fees, account charges and surrender charges which, if reflected, would reduce the total return for all periods shown. Past performance is no guarantee of future results. Total returns for periods of less than one year are not annualized. |
(5) | Does not include expenses of the Underlying Funds in which the Fund invests. |
(7) | Included in the expense ratios are certain non-recurring restructuring (and reorganization, if applicable) fees that were incurred by the Fund during the period. Without these fees, the gross and net expense ratios both would have been 0.35% (Note 9). |
(8) | Reflects fee waivers and/or expense reimbursements. |
(9) | Amount represents less than 1%. |
See Notes to Financial Statements.
Legg Mason Partners Variable Equity Trust 2007 Semi-Annual Report | 15 |
Financial Highlights (continued) |
For a share of beneficial interest outstanding throughout each year ended January 31, unless otherwise noted:
|
|
|
|
| Legg Mason Partners Variable
Lifestyle Allocation 50% | | 2007(1) | | 2007(2) | | 2006(2) | | 2005(2) | | 2004(2) | | 2003(2) | | |
|
|
|
| Net Asset Value, Beginning of Period | | $12.61 | | $12.00 | | $11.71 | | $11.54 | | $ 9.59 | | $11.02 | | |
|
|
|
| Income (Loss) From Operations: | | | | | | | | | | | | | | |
| Net investment income(3) | | 0.19 | | 0.35 | | 0.28 | | 0.28 | | 0.30 | | 0.34 | | |
| Net realized and unrealized gain (loss) | | (0.08 | ) | 0.62 | | 0.29 | | 0.17 | | 1.93 | | (1.04 | ) | |
|
|
|
| Total Income (Loss) From Operations | | 0.11 | | 0.97 | | 0.57 | | 0.45 | | 2.23 | | (0.70 | ) | |
|
|
|
| Less Distributions From: | | | | | | | | | | | | | | |
| Net investment income | | (0.02 | ) | (0.36 | ) | (0.28 | ) | (0.28 | ) | (0.28 | ) | (0.70 | ) | |
| Net realized gains | | (0.07 | ) | — | | — | | — | | — | | — | | |
| Return of capital | | — | | — | | — | | — | | — | | (0.03 | ) | |
|
|
|
| Total Distributions | | (0.09 | ) | (0.36 | ) | (0.28 | ) | (0.28 | ) | (0.28 | ) | (0.73 | ) | |
|
|
|
| Net Asset Value, End of Period | | $12.63 | | $12.61 | | $12.00 | | $11.71 | | $11.54 | | $9.59 | | |
|
|
|
| Total Return(4) | | 0.91 | % | 8.09 | % | 4.87 | % | 3.88 | % | 23.35 | % | (6.21 | )% | |
|
|
|
| Net Assets, End of Period (000s) | | $218,548 | | $224,930 | | $247,470 | | $268,870 | | $272,629 | | $241,899 | | |
|
|
|
| Ratios to Average Net Assets: | | | | | | | | | | | | | | |
| Gross expenses(5) | | 0.35 | %(6) | 0.37 | %(7) | 0.35 | % | 0.35 | % | 0.35 | % | 0.35 | % | |
| Net expenses(5) | | 0.35 | (6) | 0.37 | (7)(8) | 0.35 | | 0.35 | (8) | 0.35 | | 0.35 | | |
| Net investment income | | 2.96 | (6) | 2.69 | | 2.24 | | 2.36 | | 2.76 | | 2.51 | | |
|
|
|
| Portfolio Turnover Rate | | 3 | % | 96 | % | 48 | % | 17 | % | 0 | %(9) | 7 | % | |
|
|
|
(1) | For the six months ended July 31, 2007 (unaudited). |
(2) | Represents a share of capital stock outstanding prior to April 30, 2007. |
(3) | Net investment income per share includes short-term capital gain distributions from Underlying Funds. |
(4) | Performance figures may reflect fee waivers and/or expense reimbursements. In the absence of fee waivers and/or expense reimbursements, the total return would have been lower. Total returns do not reflect expenses associated with the separate accounts such as administrative fees, account charges and surrender charges which, if reflected, would reduce the total return for all periods shown. Past performance is no guarantee of future results. Total returns for periods of less than one year are not annualized. |
(5) | Does not include expenses of the Underlying Funds in which the Fund invests. |
(7) | Included in the expense ratios are certain non-recurring restructuring (and reorganization, if applicable) fees that were incurred by the Fund during the period. Without these fees, the gross and net expense ratios both would have been 0.35% (Note 9). |
(8) | Reflects fee waivers and/or expense reimbursements. |
(9) | Amount represents less than 1%. |
See Notes to Financial Statements.
16 | Legg Mason Partners Variable Equity Trust 2007 Semi-Annual Report |
Notes to Financial Statements (unaudited)
1. | Organization and Significant Accounting Policies |
Legg Mason Partners Variable Lifestyle Allocation 85% (“Lifestyle Allocation 85%”), Legg Mason Partners Variable Lifestyle Allocation 70% (“Lifestyle Allocation 70%”) and Legg Mason Partners Variable Lifestyle Allocation 50% (“Lifestyle Allocation 50%”) (the “Funds”) are separate non-diversified investment series of Legg Mason Partners Variable Equity Trust (the “Trust”). The Trust, a Maryland business trust, is registered under the Investment Company Act of 1940, as amended (the “1940 Act”), as an open-end management investment company. Prior to April 30, 2007, the Funds were separate investment funds of Legg Mason Partners Lifestyle Series, Inc., a Maryland corporation, registered under the 1940 Act, as a non-diversified open-end management investment company and consisted of these Funds and six other funds. The Funds invest in other mutual funds (“Underlying Funds”) which are affiliated with Legg Mason, Inc. (“Legg Mason”). Shares of the Funds are offered to separate accounts sponsored by certain life insurance companies and qualified pension and retirement plans, including the affiliates of the investment manager.
The following are significant accounting policies consistently followed by the Funds and are in conformity with U.S. generally accepted accounting principles (“GAAP”). Estimates and assumptions are required to be made regarding assets, liabilities and changes in net assets resulting from operations when financial statements are prepared. Changes in the economic environment, financial markets and any other parameters used in determining these estimates could cause actual results to differ.
(a) Investment Valuation. Investments in the Underlying Funds are valued at the closing net asset value per share of each Underlying Fund on the day of valuation. Equity securities for which market quotations are available are valued at the last reported sales price or official closing price on the primary market or exchange on which they trade. Debt securities are valued at the mean between the last quoted bid and asked prices provided by an independent pricing service that are based on transactions in debt obligations, quotations from bond dealers, market transactions in comparable securities and various other relationships between securities. When prices are not readily available, or are determined not to reflect fair value, such as when the value of a security has been significantly affected by events after the close of the exchange or market on which the security is principally traded, but before the Funds calculate their net asset value, the Funds may value these securities at fair value as determined in accordance with the procedures approved by the Funds’ Board of Trustees. Short-term obligations with maturities of 60 days or less are valued at amortized cost, which approximates fair value.
(b) Repurchase Agreements. When entering into repurchase agreements, it is the Funds’ policy that their custodian or a third party custodian take possession of the underlying collateral securities, the market value of which, at all times, at least equals the principal amount of the repurchase transaction, including accrued interest. To the extent that any repurchase transaction exceeds one business day, the value of the collateral is marked-to-market to ensure the adequacy of the collateral. If the seller defaults, and the market value of the collateral declines or if bankruptcy proceedings are commenced with respect to the seller of the security, realization of the collateral by the Funds may be delayed or limited.
Legg Mason Partners Variable Equity Trust 2007 Semi-Annual Report | 17 |
Notes to Financial Statements (unaudited) (continued)
(c) Foreign Currency Translation. Investment securities and other assets and liabilities denominated in foreign currencies are translated into U.S. dollar amounts based upon prevailing exchange rates on the date of valuation. Purchases and sales of investment securities and income and expense items denominated in foreign currencies are translated into U.S. dollar amounts based upon prevailing exchange rates on the respective dates of such transactions.
The Funds do not isolate that portion of the results of operations resulting from changes in foreign exchange rates on investments from the fluctuations arising from changes in market prices of securities held. Such fluctuations are included with the net realized and unrealized gain or loss on investments.
Net realized foreign exchange gains or losses arise from sales of foreign currencies, including gains and losses on forward foreign currency contracts, currency gains or losses realized between the trade and settlement dates on securities transactions, and the difference between the amounts of dividends, interest, and foreign withholding taxes recorded on the Funds’ books and the U.S. dollar equivalent of the amounts actually received or paid. Net unrealized foreign exchange gains and losses arise from changes in the fair values of assets and liabilities, other than investments in securities, at the date of valuation, resulting from changes in exchange rates.
Foreign security and currency transactions may involve certain considerations and risks not typically associated with those of U.S. dollar denominated transactions as a result of, among other factors, the possibility of lower levels of governmental supervision and regulation of foreign securities markets and the possibility of political or economic instability.
(d) Security Transactions and Investment Income. Security transactions are accounted for on a trade date basis. Net investment income distributions and short-term capital gain distributions, if any, from the Underlying Funds are recorded on the ex-dividend date as investment income. Interest income is recorded on an accrual basis. Long-term capital gain distributions, if any, from the Underlying Funds are recorded on the ex-dividend date as realized gains. The cost of investments sold is determined by use of the specific identification method.
(e) Distributions to Shareholders. Distributions from net investment income and distributions of net realized gains, if any, are declared at least annually. Distributions to shareholders of the Funds are recorded on the ex-dividend date and are determined in accordance with income tax regulations, which may differ from GAAP.
(f) Federal and Other Taxes. It is the Funds’ policy to comply with the federal income and excise tax requirements of the Internal Revenue Code of 1986, as amended, applicable to regulated investment companies. Accordingly, the Funds intend to distribute substantially all of its taxable income and net realized gains on investments, if any, to shareholders each year. Therefore, no federal income tax provision is required in the Funds’ financial statements.
(g) Reclassification. GAAP requires that certain components of net assets be adjusted to reflect permanent differences between financial and tax reporting. These reclassifications have no effect on net assets or net asset values per share.
18 | Legg Mason Partners Variable Equity Trust 2007 Semi-Annual Report |
Notes to Financial Statements (unaudited) (continued)
2. | Investment Management Agreement and Other Transactions with Affiliates |
Legg Mason Partners Fund Advisor, LLC (“LMPFA”) is the Funds’ investment manager. Prior to April 30, 2007, ClearBridge Advisors, LLC (“ClearBridge”) was the Funds’ subadviser.
On April 30, 2007, Legg Mason Global Asset Allocation, LLC (“LMGAA”) became each Fund’s subadviser. LMPFA, LMGAA and ClearBridge are wholly-owned subsidiaries of Legg Mason.
Under the investment management agreement, each Fund pays an investment management fee, calculated daily and paid monthly, at an annual rate of 0.35% of each Fund’s average daily net assets. From this fee, all other expenses are paid by the manager.
LMPFA provides administrative and certain oversight services to the Funds. LMPFA delegates to the subadviser the day-to-day portfolio management of the Funds, except, in certain cases, for the management of cash and short-term instruments. For its services, LMPFA pays LMGAA 70% of the net management fee that it receives from the Funds.
In addition, the Funds indirectly pay management and/or administration fees to LMPFA and other wholly-owned subsidiaries of Legg Mason as a shareholder in the Underlying Funds. These management and administrative fees ranged from 0.41% to 1.00% of the average daily net assets of the Underlying Funds.
Citigroup Global Markets Inc. (“CGM”), PFS Investments Inc. (“PFS”) and Legg Mason Investor Services, LLC (“LMIS”) serve as distributors of the Funds. LMIS is a wholly owned broker-dealer subsidiary of Legg Mason.
Certain officers and one Trustee of the Trust are employees of Legg Mason or its affiliates and do not receive compensation from the Trust.
During the six months ended July 31, 2007, the aggregate cost of purchases and proceeds from sales of investments (excluding short-term investments) were as follows:
| | | Purchases | | Sales | |
| | | | | | |
| | | | | | |
| | | | | | |
| Lifestyle Allocation 85% | | $3,219,927 | | $ 7,183,843 | |
| | | | | | |
| | | | | | |
| | | | | | |
| Lifestyle Allocation 70% | | 2,872,555 | | 10,671,384 | |
| | | | | | |
| | | | | | |
| | | | | | |
| Lifestyle Allocation 50% | | 6,740,673 | | 12,342,667 | |
| | | | | | |
| | | | | | |
Legg Mason Partners Variable Equity Trust 2007 Semi-Annual Report | 19 |
Notes to Financial Statements (unaudited) (continued)
At July 31, 2007, the aggregate gross unrealized appreciation and depreciation of investments for federal income tax purposes were substantially as follows:
| | | Gross Unrealized | | Gross Unrealized | | Net Unrealized | |
| | | Appreciation | | Depreciation | | Appreciation | |
|
|
|
| Lifestyle Allocation 85% | | $ | 13,390,216 | | | $ | (671,454) | | | $ | 12,718,762 | | |
|
|
|
| Lifestyle Allocation 70% | | | 10,481,497 | | | | (1,456,539) | | | | 9,024,958 | | |
|
|
|
| Lifestyle Allocation 50% | | | 11,758,946 | | | | (4,623,038) | | | | 7,135,908 | | |
|
|
4. | Shares of Beneficial Interest |
At July 31, 2007, the Trust had an unlimited number of shares authorized with a par value of $0.00001 per share. Prior to April 30, 2007, the Trust had 6.1 billion shares of capital stock authorized with a par value of $0.001 per share.
Transactions in shares of each Fund were as follows:
| | | Six Months Ended | | Year Ended | |
| | | July 31, 2007 | | January 31, 2007 | |
|
|
|
| Lifestyle Allocation 85% | | | | | | | |
| Shares sold | | 281,865 | | | 59,233 | | |
| Shares issued on reinvestment | | 360,646 | | | 59,990 | | |
| Shares repurchased | | (574,498 | ) | | (1,415,501 | ) | |
|
|
|
| Net Increase (Decrease) | | 68,013 | | | (1,296,278 | ) | |
|
|
|
| Lifestyle Allocation 70% | | | | | | | |
| Shares sold | | 327,231 | | | 99,550 | | |
| Shares issued on reinvestment | | 178,954 | | | 215,813 | | |
| Shares repurchased | | (1,130,096 | ) | | (2,534,239 | ) | |
|
|
|
| Net Decrease | | (623,911 | ) | | (2,218,876 | ) | |
|
|
|
| Lifestyle Allocation 50% | | | | | | | |
| Shares sold | | 768,716 | | | 466,779 | | |
| Shares issued on reinvestment | | 128,365 | | | 507,228 | | |
| Shares repurchased | | (1,428,222 | ) | | (3,761,145 | ) | |
|
|
|
| Net Decrease | | (531,141 | ) | | (2,787,138 | ) | |
5. | Capital Loss Carryforward |
As of January 31, 2007, Lifestyle Allocation 85% had a net capital loss carryforward of approximately $23,887,654, of which $5,207,201 expires in 2011, $14,280,412 expires in 2012, $3,119,343 expires in 2013 and $1,280,698 expires in 2014. Lifestyle Allocation 70% had a net capital loss carryforward of approximately $32,414,956, of which $18,925,754 expires in 2012, $10,439,486 expires in 2013 and $3,049,716 expires in 2014. Lifestyle Allocation 50% had a net capital loss carryforward of approximately $1,156,413, all of which expires in 2013. These amounts will be available to offset any future taxable capital gains, subject to an annual limitation of $4,104,268 for Lifestyle Allocation 85% and $6,521,742 for Lifestyle Allocation 70% resulting from an ownership change the Funds experienced in the prior year.
20 | Legg Mason Partners Variable Equity Trust 2007 Semi-Annual Report |
Notes to Financial Statements (unaudited) (continued)
On May 31, 2005, the U.S. Securities and Exchange Commission (“SEC”) issued an order in connection with the settlement of an administrative proceeding against Smith Barney Fund Management LLC (“SBFM”), a wholly-owned subsidiary of Legg Mason and the then-investment adviser or manager to the Funds, and CGM, relating to the appointment of an affiliated transfer agent for the Smith Barney family of mutual funds, including the Funds (the “Affected Funds”).
The SEC order found that SBFM and CGM willfully violated Section 206(1) of the Investment Advisers Act of 1940, as amended, and the rules promulgated thereunder (the “Advisers Act”). Specifically, the order found that SBFM and CGM knowingly or recklessly failed to disclose to the boards of the Affected Funds in 1999 when proposing a new transfer agent arrangement with an affiliated transfer agent that: First Data Investors Services Group (“First Data”), the Affected Funds’ then-existing transfer agent, had offered to continue as transfer agent and do the same work for substantially less money than before; and that Citigroup Asset Management (“CAM”), the Citigroup business unit that, at the time, included the Affected Funds’ investment manager and other investment advisory companies, had entered into a side letter with First Data under which CAM agreed to recommend the appointment of First Data as sub-transfer agent to the affiliated transfer agent in exchange, among other things, for a guarantee by First Data of specified amounts of asset management and investment banking fees to CAM and CGM. The order also found that SBFM and CGM willfully violated Section 206(2) of the Advisers Act by virtue of the omissions discussed above and other misrepresentations and omissions in the materials provided to the Affected Funds’ boards, including the failure to make clear that the affiliated transfer agent would earn a high profit for performing limited functions while First Data continued to perform almost all of the transfer agent functions, and the suggestion that the proposed arrangement was in the Affected Funds’ best interests and that no viable alternatives existed.
SBFM and CGM do not admit or deny any wrongdoing or liability. The settlement does not establish wrongdoing or liability for purposes of any other proceeding. The SEC censured SBFM and CGM and ordered them to cease and desist from violations of Sections 206(1) and 206(2) of the Advisers Act. The order required Citigroup to pay $208.1 million, including $109 million in disgorgement of profits, $19.1 million in interest, and a civil money penalty of $80 million. Approximately $24.4 million has already been paid to the Affected Funds, primarily through fee waivers. The remaining $183.7 million, including the penalty, has been paid to the U.S. Treasury and will be distributed pursuant to a plan submitted for the approval of the SEC. At this time, there is no certainty as to how the above-described proceeds of the settlement will be distributed, to whom such distributions will be made, the methodology by which such distributions will be allocated, and when such distributions will be made. The order also required that transfer agency fees received from the Affected Funds since December 1, 2004, less certain expenses, be placed in escrow and provided that a portion of such fees might be subsequently distributed in accordance with the terms of the order. On April 3, 2006, an aggregate amount of approximately $9 million held in escrow was distributed to the Affected Funds.
Legg Mason Partners Variable Equity Trust 2007 Semi-Annual Report | 21 |
Notes to Financial Statements (unaudited) (continued)
The order required SBFM to recommend a new transfer agent contract to the Affected Funds’ boards within 180 days of the entry of the order; if a Citigroup affiliate submitted a proposal to serve as transfer agent or sub-transfer agent, SBFM and CGM would have been required, at their expense, to engage an independent monitor to oversee a competitive bidding process. On November 21, 2005, and within the specified timeframe, the Affected Funds’ boards selected a new transfer agent for the Affected Funds. No Citigroup affiliate submitted a proposal to serve as transfer agent. Under the order, SBFM also must comply with an amended version of a vendor policy that Citigroup instituted in August 2004.
Although there can be no assurance, SBFM does not believe that this matter will have a material adverse effect on the Affected Funds.
On December 1, 2005, Citigroup completed the sale of substantially all of its global asset management business, including SBFM, to Legg Mason.
Beginning in August 2005, five class action lawsuits alleging violations of federal securities laws and state law were filed against CGM and SBFM, (collectively, the “Defendants”) based on the May 31, 2005 settlement order issued against the Defendants by the SEC as described in Note 6. The complaints seek injunctive relief and compensatory and punitive damages, removal of SBFM as the investment manager for the Smith Barney family of funds, rescission of the Funds’ management and other contracts with SBFM, recovery of all fees paid to SBFM pursuant to such contracts, and an award of attorneys’ fees and litigation expenses.
On October 5, 2005, a motion to consolidate the five actions and any subsequently filed, related action was filed. That motion contemplates that a consolidated amended complaint alleging substantially similar causes of action will be filed in the future.
As of the date of this report, the Funds’ manager believes that resolution of the pending lawsuit will not have a material effect on the financial position or results of operations of the Funds or the ability of the Funds’ manager and its affiliates to continue to render services to the Funds under their respective contracts.
* * *
Beginning in June 2004, class action lawsuits alleging violations of the federal securities laws were filed against CGM and a number of its then affiliates, including SBFM and Salomon Brothers Asset Management Inc. (“SBAM”), which were then investment adviser or manager to certain of the Funds (the “Managers”), substantially all of the mutual funds then managed by the Managers (the “Defendant Funds”), and Board Members of the Defendant Funds (collectively, the “Defendants”). The complaints alleged, among other things, that CGM created various undisclosed incentives for its brokers to sell Smith Barney and Salomon Brothers funds. In addition, according to the complaints, the Managers caused the Defendant Funds to pay excessive brokerage commissions to CGM for steering clients towards proprietary funds. The complaints also alleged that the defendants breached their fiduciary duty to the Defendant Funds by improperly charging Rule 12b-1 fees and by drawing on fund assets to make undisclosed
22 | Legg Mason Partners Variable Equity Trust 2007 Semi-Annual Report |
Notes to Financial Statements (unaudited) (continued)
payments of soft dollars and excessive brokerage commissions. The complaints also alleged that the Defendant Funds failed to adequately disclose certain of the allegedly wrongful conduct. The complaints sought injunctive relief and compensatory and punitive damages, rescission of the Defendant Funds’ contracts with the Managers, recovery of all fees paid to the Managers pursuant to such contracts and an award of attorneys’ fees and litigation expenses.
On December 15, 2004, a consolidated amended complaint (the “Complaint”) was filed alleging substantially similar causes of action. On May 27, 2005, all of the Defendants filed motions to dismiss the Complaint. On July 26, 2006, the court issued a decision and order (1) finding that plaintiffs lacked standing to sue on behalf of the shareholders of the Funds in which none of the plaintiffs had invested and dismissing those Funds from the case (although stating that they could be brought back into the case if standing as to them could be established), and (2) other than one stayed claim, dismissing all of the causes of action against the remaining Defendants, with prejudice, except for the cause of action under Section 36(b) of the 1940 Act, which the court granted plaintiffs leave to replead as a derivative claim.
On October 16, 2006, plaintiffs filed their Second Consolidated Amended Complaint (“Second Amended Complaint”) which alleges derivative claims on behalf of nine funds identified in the Second Amended Complaint, under Section 36(b) of the 1940 Act, against CAM, SBAM, SBFM and CGM as investment advisers to the identified funds, as well as CGM as a distributor for the identified funds (collectively, the “Second Amended Complaint Defendants”). The Funds were not identified in the Second Amended Complaint. The Second Amended Complaint alleges no claims against any of the Funds or any of their Board Members. Under Section 36(b), the Second Amended Complaint alleges similar facts and seeks similar relief against the Second Amended Complaint Defendants as the Complaint. The Defendants have filed a motion to dismiss the Second Amended Complaint. It is uncertain when the court will decide the motion. No assurances can be given as to the outcome of this matter.
Additional lawsuits arising out of these circumstances and presenting similar allegations and requests for relief may be filed in the future.
On September 16, 2005, the staff of the SEC informed SBFM and SBAM that the staff is considering recommending that the SEC institute administrative proceedings against SBFM and SBAM for alleged violations of Section 19(a) and 34(b) of the 1940 Act (and related Rule 19a-1). The notification is a result of an industry wide inspection by the SEC and is based upon alleged deficiencies in disclosures regarding dividends and distributions paid to shareholders of certain funds. Section 19(a) and related Rule 19a-1 of the 1940 Act generally require funds that are making dividend and distribution payments to provide shareholders with a written statement disclosing the source of the dividends and distributions, and, in particular, the portion of the payments made from each of net investment income, undistributed net profits and/or paid-in capital. In connection with the contemplated proceedings, the staff may seek a cease and desist order and/or monetary damages from SBFM or SBAM.
Legg Mason Partners Variable Equity Trust 2007 Semi-Annual Report | 23 |
Notes to Financial Statements (unaudited) (continued)
Although there can be no assurance, the Funds’ manager believes that this matter is not likely to have a material adverse effect on the Funds.
9. | Special Shareholder Meeting and Reorganization |
Shareholders approved a number of initiatives designed to streamline and restructure the fund complex. These matters were implemented in early 2007. As noted in the proxy materials, Legg Mason paid for a portion of the costs related to these initiatives. The portions of the costs borne by the Funds were recognized in the period during which the expense was incurred. Such expenses relate to obtaining shareholder votes for proposals presented in the proxy, the election of board members, retirement of board members, as well as printing, mailing, and soliciting proxies.
10. | Recent Accounting Pronouncements |
During June 2006, the Financial Accounting Standards Board (“FASB”) issued FASB Interpretation 48 (“FIN 48” or the “Interpretation”), Accounting for Uncertainty in Income Taxes — an interpretation of FASB Statement 109. FIN 48 supplements FASB Statement 109, Accounting for Income Taxes, by defining the confidence level that a tax position must meet in order to be recognized in the financial statements. FIN 48 prescribes a comprehensive model for how a fund should recognize, measure, present, and disclose in its financial statements uncertain tax positions that the fund has taken or expects to take on a tax return. FIN 48 requires that the tax effects of a position be recognized only if it is “more likely than not” to be sustained based solely on its technical merits. Management must be able to conclude that the tax law, regulations, case law, and other objective information regarding the technical merits sufficiently support the position’s sustainability with a likelihood of more than 50 percent. FIN 48 is effective for fiscal periods beginning after December 15, 2006, which for these Funds was February 1, 2007. At adoption, the financial statements must be adjusted to reflect only those tax positions that are more likely than not to be sustained as of the adoption date. Management of the Funds has determined that adopting FIN 48 will not have a material impact on the Funds’ financial statements.
* * *
On September 20, 2006, FASB released Statement of Financial Accounting Standards No. 157, Fair Value Measurements (“FAS 157”). FAS 157 establishes an authoritative definition of fair value, sets out a framework for measuring fair value, and requires additional disclosures about fair value measurements. The application of FAS 157 is required for fiscal years beginning after November 15, 2007 and interim periods within those fiscal years. At this time, management is evaluating the implications of FAS 157 and its impact on the financial statements has not yet been determined.
24 | Legg Mason Partners Variable Equity Trust 2007 Semi-Annual Report |
Notes to Financial Statements (unaudited) (continued)
11. | Shareholder Information |
On July 24, 2007, NYSE Regulation, Inc. (“NYSE Regulation”) and the New Jersey Bureau of Securities (“NJBS”) announced they had censured and fined CGM for failing to supervise trading of mutual fund shares and variable annuity mutual fund sub-accounts, failing to prevent deceptive market timing by certain brokers on behalf of hedge-fund customers, and failing to maintain adequate books and records during the period from January 2000 to September 2003. Under the settlement with NYSE Regulation and NJBS, CGM agreed to pay a total of $50 million in disgorgement and penalties and neither admitted nor denied guilt. CGM is a distributor of the Funds. The Funds’ investment manager believes that this settlement will not have any effect on the financial position or results of operations of the Funds. The investment manager has been informed by CGM that the settlement will not affect the ability of CGM to continue to render services to the Funds under its contract.
Legg Mason Partners Variable Equity Trust 2007 Semi-Annual Report | 25 |
Board Approval of Subadvisory Agreements
(unaudited)
At a meeting held in person on March 13, 2007, the Funds’ Board, including a majority of the Board Members who are not “interested persons” of the Funds or LMPFA (the “Manager”) or any sub-investment adviser or proposed sub-investment adviser as defined in the Investment Company Act of 1940, as amended (the “1940 Act”) (the “Independent Board Members”), approved a new subadvisory agreement (the “New Subadvisory Agreement”), for each Fund between the Manager and LMGAA (the “Subadviser”). Each New Subadvisory Agreement replaced the Funds’ prior subadvisory agreements with ClearBridge and was entered into in connection with an internal reorganization of ClearBridge and the parent organization, Legg Mason. In approving each New Subadvisory Agreement, the Board, including the Independent Board Members, considered the factors discussed below, among other things.
The Board Members reviewed the qualifications, backgrounds and responsibilities of the senior personnel that will provide oversight and general management services and the portfolio management team that would be primarily responsible for the day-to-day management of the Funds. The Board Members noted that the portfolio management team was expected to be the same as then managing the Funds.
The Board Members received and considered information regarding the nature, extent and quality of services expected to be provided to the Funds by the Subadviser under each New Subadvisory Agreement. The Board Members’ evaluation of the services expected to be provided by the Subadviser took into account the Board Members’ knowledge and familiarity gained as Fund Board Members, including as to the scope and quality of Legg Mason’s investment management and other capabilities. The Board Members considered, among other things, information and assurances provided by Legg Mason as to the operations, facilities and organization of the Subadviser and the qualifications, backgrounds and responsibilities of its senior personnel. The Board Members further considered the financial resources available to the Subadviser and Legg Mason. The Board Members concluded that, overall, the nature, extent and quality of services expected to be provided under each New Subadvisory Agreement were acceptable.
The Board Members also received and considered performance information for the Funds as well as comparative information with respect to a peer group of funds (the “Performance Universe”) selected by Lipper, Inc. (“Lipper”), an independent provider of investment company data. The Board Members were provided with a description of the methodology Lipper used to determine the similarity of the Funds to the funds included in the Performance Universe. The Board Members noted that they had received and discussed with management, at periodic intervals, information comparing each Fund’s performance against, among other things, its benchmarks. Based on the Board Members’ review, which included careful consideration of the factors noted above, the Board Members concluded that the performance of each Fund under the circumstances, supported approval of each New Subadvisory Agreement.
In their deliberations, the Board Members also considered, and placed significant importance on, information that had been received and conclusions that had been reached by the Board in connection with the Board’s most recent approval of each Fund’s manage-
26 | Legg Mason Partners Variable Equity Trust |
Board Approval of Subadvisory Agreements
(unaudited) (continued)
ment agreement and prior subadvisory agreement, in addition to information provided in connection with the Board’s evaluation of the terms and conditions of each New Subadvisory Agreement.
The Board Members considered Legg Mason’s advice and the advice of its counsel that each New Subadvisory Agreement was being entered into in connection with an internal reorganization within Legg Mason and ClearBridge, which did not involve an actual change of control or management. The Board Members further noted that the terms and conditions of each New Subadvisory Agreement are substantially identical to those of the Funds’ previous subadvisory agreement except for the identity of the Subadviser, and that the initial term of each New Subadvisory Agreement (after which it will continue in effect only if such continuance is specifically approved at least annually by the Board, including a majority of the Independent Board Members) was the same as that under the prior subadvisory agreement.
In light of all of the foregoing, the Board, including the Independent Board Members, approved each New Subadvisory Agreement. No single factor reviewed by the Board Members was identified as the principal factor in determining whether to approve each New Subadvisory Agreement. The Independent Board Members were advised by separate independent legal counsel throughout the process. The Independent Board Members also discussed the proposed approval of each New Subadvisory Agreement in private sessions with their independent legal counsel at which no representatives of the Manager or Subadviser were present.
The Board did not request or receive information on fees, economies of scale or a profitability analysis of the Subadviser and its affiliates in providing services to the Fund. The Board intends to review these matters in connection with the approval of each Fund’s Management Agreement and Subadvisory Agreement at its next regular meeting in November of 2007.
Legg Mason Partners Variable Equity Trust | 27 |
(This page intentionally left blank.)
Legg Mason Partners
Variable Equity Trust
| | | | |
| | TRUSTEES | | INVESTMENT MANAGER |
| | Paul R. Ades | | Legg Mason Partners Fund |
| | Andrew L. Breech | | Advisor, LLC |
| | Dwight B. Crane | | |
| | Robert M. Frayn, Jr. | | SUBADVISER |
| | R. Jay Gerken, CFA | | Legg Mason Global Asset |
| | Chairman | | Allocation, LLC |
| | Frank G. Hubbard | | |
| | Howard J. Johnson | | DISTRIBUTORS |
| | David E. Maryatt | | Citigroup Global Markets Inc. |
| | Jerome H. Miller | | Legg Mason Investor Services, LLC |
| | Ken Miller | | PFS Investments Inc. |
| | John J. Murphy | | |
| | Thomas F. Schlafly | | CUSTODIAN |
| | Jerry A. Viscione | | State Street Bank and Trust |
| | | | Company |
| | | | |
| | | | TRANSFER AGENT |
| | | | PFPC Inc. |
| | | | 4400 Computer Drive |
| | | | Westborough, Massachusetts 01581 |
| | | | |
| | | | INDEPENDENT REGISTERED |
| | | | PUBLIC ACCOUNTING FIRM |
| | | | KPMG LLP |
| | | | 345 Park Avenue |
| | | | New York, New York 10154 |
| | | | |
| | | | |
| | | | |
| | | | |
| | | | |
| | | | |
| | | | |
| | | | |
| | | | |

This report is submitted for the general information of the shareholders of Legg Mason Partners Variable Equity Trust– Legg Mason Partners Variable Lifestyle Allocation 85%, Legg Mason Partners Variable Lifestyle Allocation 70% and Legg Mason Partners Variable Lifestyle Allocation 50%.
This report must be preceded or accompanied by a free prospectus. Investors should consider each Fund’s investment objectives, risks, charges and expenses carefully before investing. The prospectus contains this and other important information about each Fund. Please read the prospectus carefully before investing.
www.leggmason.com/InvestorServices
©2007 Legg Mason
Investor Services, LLC
Member FINRA, SIPC
FD0 1325 9/07 SR07-404
Legg Mason Partners
Variable Equity Trust
Legg Mason Partners Variable
Lifestyle Allocation 85%
Legg Mason Partners Variable
Lifestyle Allocation 70%
Legg Mason Partners Variable
Lifestyle Allocation 50%
The Funds are separate investment series of Legg Mason Partners Variable Equity Trust, a Maryland business trust.
LEGG MASON PARTNERS VARIABLE EQUITY TRUST
Legg Mason Partners Funds
125 Broad Street
10th Floor, MF-2
New York, New York 10004
The Funds file their complete schedule of portfolio holdings with the Securities and Exchange Commission (“SEC”) for the first and third quarters of each fiscal year on Form N-Q. The Funds’ Forms N-Q are available on the SEC’s website at www.sec.gov. The Funds’ Forms N-Q may be reviewed and copied at the SEC’s Public Reference Room in Washington D.C., and information on the operation of the Public Reference Room may be obtained by calling 1-800-SEC-0330. To obtain information on Form N-Q from the Funds, shareholders can call Legg Mason Partners Shareholder Services at 1-800-451-2010.
Information on how the Funds voted proxies relating to portfolio securities during the prior 12-month period ended June 30th of each year, and a description of the policies and procedures that the Funds use to determine how to vote proxies relating to portfolio transactions is available (1) without charge, upon request, by calling 1-800-451-2010, (2) on the Funds’ website at www.leggmason.com/InvestorServices and (3) on the SEC’s website at www.sec.gov.
Not applicable.
ITEM 3. | AUDIT COMMITTEE FINANCIAL EXPERT. |
Not applicable.
ITEM 4. | PRINCIPAL ACCOUNTANT FEES AND SERVICES. |
Not applicable.
ITEM 5. | AUDIT COMMITTEE OF LISTED REGISTRANTS. |
Not applicable.
ITEM 6. | SCHEDULES OF INVESTMENTS. |
Included herein under Item 1.
ITEM 7. | DISCLOSURE OF PROXY VOTING POLICIES AND PROCEDURES FOR CLOSED-END MANAGEMENT INVESTMENT COMPANIES. |
Not applicable.
ITEM 8. | PORTFOLIO MANAGERS OF CLOSED-END MANAGEMENT INVESTMENT COMPANIES. |
Not applicable.
ITEM 9. | PURCHASES OF EQUITY SECURITIES BY CLOSED-END MANAGEMENT INVESMTENT COMPANY AND AFFILIATED PURCHASERS. |
Not applicable.
ITEM 10. | SUBMISSION OF MATTERS TO A VOTE OF SECURITY HOLDERS. |
Not applicable.
ITEM 11. | CONTROLS AND PROCEDURES. |
(a) The registrant’s principal executive officer and principal financial officer have concluded that the registrant’s disclosure controls and procedures (as defined in Rule 30a- 3(c) under the Investment Company Act of 1940, as amended (the “1940 Act”)) are effective as of a date within 90 days of the filing date of this report that includes the disclosure required by this paragraph, based on their evaluation of the disclosure controls and procedures required by Rule 30a-3(b) under the 1940 Act and 15d-15(b) under the Securities Exchange Act of 1934.
(b) There were no changes in the registrant’s internal control over financial reporting (as defined in Rule 30a-3(d) under the 1940 Act) that occurred during the registrant’s last fiscal half-year
(the registrant’s second fiscal half-year in the case of an Semi-Annual report) that have materially affected, or are likely to materially affect the registrant’s internal control over financial reporting.
(a) (1) Not applicable.
Exhibit 99.CODE ETH
(a) (2) Certifications pursuant to section 302 of the Sarbanes-Oxley Act of 2002 attached hereto.
Exhibit 99.CERT
(b) Certifications pursuant to Section 906 of the Sarbanes-Oxley Act of 2002 attached hereto.
Exhibit 99.906CERT
SIGNATURES
Pursuant to the requirements of the Securities Exchange Act of 1934 and the Investment Company Act of 1940, the registrant has duly caused this Report to be signed on its behalf by the undersigned, there unto duly authorized.
Legg Mason Partners Variable Equity Trust |
By: |
/s/ R. Jay Gerken
|
| R. Jay Gerken |
| Chief Executive Officer of |
| Legg Mason Partners Variable Equity Trust |
Date: October 4, 2007
Pursuant to the requirements of the Securities Exchange Act of 1934 and the Investment Company Act of 1940, this report has been signed below by the following persons on behalf of the registrant and in the capacities and on the dates indicated.
By: |
/s/ R. Jay Gerken
|
| (R. Jay Gerken) |
| Chief Executive Officer of |
| Legg Mason Partners Variable Equity Trust |
Date: October 4, 2007
By: |
/s/ Kaprel Ozsolak
|
| (Kaprel Ozsolak) |
| Chief Financial Officer of |
| Legg Mason Partners Variable Equity Trust |
Date: October 4, 2007