UNITED STATES
SECURITIES AND EXCHANGE COMMISSION
Washington, D.C. 20549
FORM N-CSR
CERTIFIED SHAREHOLDER REPORT OF REGISTERED
MANAGEMENT INVESTMENT COMPANIES
Investment Company Act file number 811-21128
Smith Barney Multiple Discipline Trust
(Exact name of registrant as specified in charter)
| | |
125 Broad Street, New York, NY | | 10004 |
|
| (Address of principal executive offices) | | (Zip code) |
Robert I. Frenkel, Esq.
c/o Citigroup Asset Management
300 First Stamford Place, 4th Floor
Stamford, CT 06902
(Name and address of agent for service)
Registrant’s telephone number, including area code: (800) 451-2010
Date of fiscal year end: December 31
Date of reporting period: June 30, 2005
ITEM 1. REPORT TO STOCKHOLDERS.
The Semi-Annual Report to Stockholders is filed herewith.
SMITH BARNEY
MULTIPLE DISCIPLINE TRUST
SEMI-ANNUAL REPORT | JUNE 30, 2005
Multiple Discipline Portfolio — All Cap Growth and Value
Multiple Discipline Portfolio — Large Cap Growth and Value
Multiple Discipline Portfolio — Global All Cap Growth and Value
Multiple Discipline Portfolio — Balanced All Cap Growth and Value

NOT FDIC INSURED • NOT BANK GUARANTEED • MAY LOSE VALUE
WHAT’S INSIDE
LETTER FROM THE CHAIRMAN

R. JAY GERKEN, CFA
Chairman, President and Chief Executive Officer
Dear Shareholder,
The U.S. economy overcame a number of obstacles and continued to expand during the reporting period. Rising interest rates, record high oil prices, and geopolitical issues threatened to send the economy into a “soft patch.” However, when all was said and done, first quarter 2005 gross domestic product (“GDP”)i growth was 3.8%, mirroring the solid gain that occurred during the fourth quarter of 2004.
Given the overall strength of the economy, the Federal Reserve Board (“Fed”)ii continued to raise interest rates over the period in an attempt to ward off inflation. Following five rate hikes from June 2004 through December 2004, the Fed again increased its target for the federal funds rateiii in 0.25% increments four additional times during the reporting period. All told, the Fed’s nine rate hikes brought the target for the federal funds rate from 1.00% to 3.25%.
During the six months covered by this report, the U.S. stock market was relatively flat, with the S&P 500 Indexiv returning -0.81%. As was the case in the U.S., international equities largely treaded water during the six-month reporting period. During this time, international equities, as measured by the MSCI EAFE Index,v fell 1.17%. Lackluster economic news, record high oil prices, and a strengthening U.S. dollar all kept the international equity markets from generating momentum. An April 2005 International Monetary Fund World Economic Outlook projected a modest 1.6% growth rate for the Eurozone in 2005 and Japanese growth was expected to be 0.8% in 2005, compared to 2.6% in 2004. In addition, oil prices hit $60 a barrel and led to additional concerns regarding economic growth and a possible increase in inflation. Finally, after falling in 2004, the U.S. dollar surprisingly rose versus the yen and euro over the reporting period. This was bad news for Americans investing overseas, as returns from international securities then decline when translated back into U.S. dollars. Stocks were weak early in the reporting period, as the issues discussed above caused investors to remain on the sidelines. Equities then rallied in the second quarter of 2005, as the economy appeared to be on solid footing and inflation was largely under control. Looking at the reporting period as a whole, mid-cap stocks generated superior returns, with the Russell Midcap,vi Russell 1000,vii and Russell 2000viii Indexes returning 3.92%, 0.11%, and -1.25%, respectively. From a market style perspective, value-oriented stocks outperformed their growth counterparts.
During the reporting period, the fixed income market confounded many investors as short-term interest rates rose in concert with the Fed rate tightening, while longer-term rates, surprisingly, declined. When the period began, the federal fund target rate was 2.25% and the yield on the 10-year Treasury was 4.24%. When the reporting period ended, the federal funds rate rose to 3.25% and the 10-year yield fell to 3.92%. Declining long term rates, mixed economic data, and periodic flights to quality all supported bond prices. Looking at the six-month period as a whole, the overall bond market, as measured by the Lehman Brothers Aggregate Bond Index,ix returned 2.51%.
1 Smith Barney Multiple Discipline Trust | 2005 Semi-Annual Report
Within this environment, the Funds performed as follows:1
PERFORMANCE OF THE FUNDS
AS OF JUNE 30, 2005
(unaudited)
| | | |
| | | 6 Months | |
| | | | |
All Cap Growth and Value | | -1.75 | % |
| | | | |
Russell 3000 Index | | -0.01 | % |
| | | | |
S&P 500 Index | | -0.81 | % |
| | | | |
Lipper Variable Multi-Cap Core Funds Category Average | | -0.59 | % |
| | | | |
Large Cap Growth and Value | | -1.53 | % |
| | | | |
Russell 1000 Index | | 0.11 | % |
| | | | |
S&P 500 Index | | -0.81 | % |
| | | | |
Lipper Variable Large-Cap Core Funds Category Average | | -0.76 | % |
| | | | |
Global All Cap Growth and Value | | -1.88 | % |
| | | | |
Russell 3000 Index | | -0.01 | % |
| | | | |
MSCI EAFE Index | | -1.17 | % |
| | | | |
MSCI World Index | | -0.70 | % |
| | | | |
S&P 500 Index | | -0.81 | % |
| | | | |
Lipper Variable Large-Cap Core Funds Category Average | | -0.76 | % |
| | | | |
Balanced All Cap Growth and Value | | -0.99 | % |
| | | | |
Russell 1000 Index | | 0.11 | % |
| | | | |
Russell 3000 Growth Index | | -1.88 | % |
| | | | |
Russell 3000 Value Index | | 1.69 | % |
| | | | |
Lehman Brothers Intermediate Treasury Bond Index | | 1.55 | % |
| | | | |
S&P 500 Index | | -0.81 | % |
| | | | |
Lipper Variable Balanced Funds Category Average | | 0.51 | % |
The performance shown represents past performance. Past performance is no guarantee of future results and current performance may be higher or lower than the performance shown above. Principal value and investment returns will fluctuate and investors’ shares, when redeemed, may be worth more or less than their original cost. To obtain performance data current to the most recent month-end, please visit our website at www.citigroupam.com.
Current reimbursements and/or fee waivers for both All Cap Growth and Value, Large Cap Growth and Value, Balanced All Cap Growth and Value and Global All Cap Growth and Value are voluntary, and may be reduced or terminated at any time. Absent these reimbursements or waivers, performance would have been lower.
Fund returns assume the reinvestment of all distributions at net asset value and the deduction of all Fund expenses. Returns have not been adjusted to include sales charges that may apply when shares are purchased or the deduction of taxes that a shareholder would pay on Fund distributions.
Lipper, Inc. is a major independent mutual-fund tracking organization. Returns are based on the six-month period ended June 30, 2005 and include the reinvestment of dividends and capital gains distributions, if any. Returns were calculated among the 146 funds in the variable multi-cap core funds category. Returns were calculated among the 223 funds in the variable large-cap core funds category. Returns were calculated among the 98 funds in the variable balanced funds category.
| 1 | | The Funds are an underlying investment option of various variable annuity and variable life insurance products. The Funds’ performance returns do not reflect the deduction of initial sales charges and expenses imposed in connection with investing in variable annuity contracts, such as administrative fees, account charges and surrender charges which, if reflected, would reduce the performance of the Funds. Past performance is no guarantee of future results. |
2 Smith Barney Multiple Discipline Trust | 2005 Semi-Annual Report
All Cap Growth and Value2
For the six months ended June 30, 2005, the Smith Barney Multiple Discipline Trust — All Cap Growth and Value returned -1.75%. These shares underperformed the Fund’s unmanaged benchmarks, the Russell 3000 Indexx and the S&P 500 Index, which returned -0.01% and -0.81%, respectively, for the same period. The Lipper Variable Multi-Cap Core Funds Category Average3 decreased 0.59%.
Large Cap Growth and Value2
For the six months ended June 30, 2005, the Smith Barney Multiple Discipline Trust — Large Cap Growth and Value returned -1.53%. These shares underperformed the Fund’s unmanaged benchmarks, the Russell 1000 Index and the S&P 500 Index, which returned 0.11% and -0.81%, respectively, for the same period. The Lipper Variable Large-Cap Core Funds Category Average4 decreased 0.76%.
Global All Cap Growth and Value2
For the six months ended June 30, 2005, the Smith Barney Multiple Discipline Trust — Global All Cap Growth and Value returned -1.88%. These shares underperformed the Fund’s unmanaged benchmarks, the Russell 3000 Index,x the MSCI EAFE Index and the MSCI World Index,xi which returned -0.01%, -1.17% and -0.70%, respectively, for the same period. The Lipper Variable Large-Cap Core Funds Category Average5 decreased 0.76%.
Balanced All Cap Growth and Value2
For the six months ended June 30, 2005, the Smith Barney Multiple Discipline Trust — Balanced All Cap Growth and Value returned -0.99%. In comparison, the Fund’s unmanaged benchmarks, the Russell 1000 Index, the Russell 3000 Growth Index,xii the Russell 3000 Value Index,xiii the Lehman Brothers Intermediate Treasury Bond Indexxiv and the S&P 500 Index, which returned 0.11%, -1.88%, 1.69%, 1.55% and -0.81%, respectively, for the same period. The Lipper Variable Balanced Funds Category Average6 increased 0.51%.
Special Shareholder Notice
On June 24, 2005, Citigroup Inc. (“Citigroup”) announced that it has signed a definitive agreement under which Citigroup will sell substantially all of its worldwide asset management business to Legg Mason, Inc. (“Legg Mason”).
As part of this transaction, Smith Barney Fund Management LLC (the “Manager”), currently an indirect wholly owned subsidiary of Citigroup, would become an indirect wholly owned subsidiary of Legg Mason. The Manager is the investment manager to the Funds.
The transaction is subject to certain regulatory approvals, as well as other customary conditions to closing. Subject to such approvals and the satisfaction of the other conditions, Citigroup expects the transaction to be completed later this year.
Under the Investment Company Act of 1940, consummation of the transaction will result in the automatic termination of the investment management contract between the Funds and the Manager. Therefore, the Trust’s Board of Trustees will be
| 2 | | The Fund is an underlying investment option of various variable annuity and variable life insurance products. The Fund’s performance returns do not reflect the deduction of initial sales charges and expenses imposed in connection with investing in variable annuity contracts, such as administrative fees, account charges and surrender charges which, if reflected, would reduce the performance of the Fund. Past performance is no guarantee of future results. |
| 3 | | Lipper, Inc. is a major independent mutual-fund tracking organization. Returns are based on the six-month period ended June 30, 2005, including the reinvestment of dividends and capital gains distributions, if any, calculated among the 146 funds in the Fund’s Lipper category. |
| 4 | | Lipper, Inc. is a major independent mutual-fund tracking organization. Returns are based on the six-month period ended June 30, 2005, including the reinvestment of dividends and capital gains distributions, if any, calculated among the 223 funds in the Fund’s Lipper category. |
| 5 | | Lipper, Inc. is a major independent mutual-fund tracking organization. Returns are based on the six-month period ended June 30, 2005, including the reinvestment of dividends and capital gains distributions, if any, calculated among the 223 funds in the Fund’s Lipper category. |
| 6 | | Lipper, Inc. is a major independent mutual-fund tracking organization. Returns are based on the six-month period ended June 30, 2005, including the reinvestment of dividends and capital gains distributions, if any, calculated among the 98 funds in the Fund’s Lipper category. |
3 Smith Barney Multiple Discipline Trust | 2005 Semi-Annual Report
asked to approve a new investment management contract between the Funds and the Manager. If approved by the Board, the new investment management contract will be presented to the shareholders of the Funds for their approval.
Subsequently, on August 1, 2005, the Board approved the new investment management contract between the Fund and the Manager.
Information About Your Fund
As you may be aware, several issues in the mutual fund industry have recently come under the scrutiny of federal and state regulators. The Funds’ Manager and some of its affiliates have received requests for information from various government regulators regarding market timing, late trading, fees, and other mutual fund issues in connection with various investigations. The regulators appear to be examining, among other things, the Funds’ response to market timing and shareholder exchange activity, including compliance with prospectus disclosure related to these subjects. The Funds have been informed that the Manager and its affiliates are responding to those information requests, but are not in a position to predict the outcome of these requests and investigations.
Important information concerning the Funds and its Manager with regard to recent regulatory developments is contained in the “Additional Information” note in the Notes to the Financial Statements included in this report.
As always, thank you for your continued confidence in our stewardship of your assets. We look forward to helping you continue to meet your financial goals.
Sincerely,

R. Jay Gerken, CFA
Chairman, President and Chief Executive Officer
August 2, 2005
4 Smith Barney Multiple Discipline Trust | 2005 Semi-Annual Report
The information provided is not intended to be a forecast of future events, a guarantee of future results or investment advice. Views expressed may differ from those of the firm as a whole.
Portfolio holdings and breakdowns are as of June 30, 2005, and are subject to change. Please refer to pages 12 through 31 for a list and percentage breakdown of the Fund’s holdings.
RISKS:
All Cap Growth and Value: Diversification does not assure against loss. The Fund may invest in small- and mid-cap companies that may involve a higher degree of risk and volatility than investments in large-cap companies. The Fund may use derivatives, such as options and future, which can be illiquid, may disproportionately increase losses, and have a potentially large impact on Fund performance. Please see the Fund’s prospectus for more information on these and other risks.
Large Cap Growth and Value: Diversification does not assure against loss. The Fund may use derivatives, such as options and futures, which can be illiquid, may disproportionately increase losses, and have a potentially large impact on fund performance. Please see the Fund’s prospectus for more information on these and other risks.
Global All Cap Growth and Value: Diversification does not assure against loss. The Fund may invest in small- and mid-cap companies that may involve a higher degree of risk and volatility than investments in large-cap companies. The Fund may use derivatives, such as options and futures, which can be illiquid, may disproportionately increase losses, and have a potentially large impact on fund performance. Foreign stocks are subject to certain risks of overseas investing not associated with domestic investing such as currency fluctuations and changes in political and economic conditions, which could result in significant market fluctuation. These risks are magnified in emerging markets. Please see the Fund’s prospectus for more information on these and other risks.
Balanced All Cap Growth and Value: Diversification does not assure against loss. The Fund may invest in small- and mid-cap companies that may involve a higher degree of risk and volatility than investments in large-cap companies. Interest rates typically cause the prices of fixed income securities to decline and may, reduce the value of the Fund’s share price. The Fund may use derivatives, such as options and futures, which can be illiquid, may disproportionately increase losses, and have a potentially large impact on Fund performance. Please read the prospectus, which describes these and other investment risks in greater detail. Please see the Fund’s prospectus for more information on these and other risks.
All index performance reflects no deduction for fees, expenses or taxes. Please note that an investor cannot invest directly in an index.
| i | | Gross domestic product is a market value of goods and services produced by labor and property in a given country. |
| ii | | The Federal Reserve Board is responsible for the formulation of a policy designed to promote economic growth, full employment, stable prices, and a sustainable pattern of international trade and payments. |
| iii | | The federal funds rate is the interest rate that banks with excess reserves at a Federal Reserve district bank charge other banks that need overnight loans. |
| iv | | The S&P 500 Index is an unmanaged index of 500 stocks that is generally representative of the performance of larger companies in the U.S. |
| v | | The MSCI EAFE Index is an unmanaged index of common stocks of companies located in Europe, Australasia and the Far East. |
| vi | | The Russell Midcap Index measures the performance of the 800 smallest companies in the Russell 1000 Index whose average market capitalization was approximately $4.7 billion as of 6/24/05. |
| vii | | The Russell 1000 Index measures the performance of the 1,000 largest companies in the Russell 3000 Index, which represents approximately 92% of the total market capitalization of the Russell 3000 Index. |
| viii | | The Russell 2000 Index measures the performance of the 2,000 smallest companies in the Russell 3000 Index, which represents approximately 8% of the total market capitalization of the Russell 3000 Index. |
| ix | | The Lehman Brothers Aggregate Bond Index is a broad-based bond index comprised of Government, Corporate, Mortgage and Asset-backed issues, rated investment grade or higher, and having at least one year to maturity. |
| x | | The Russell 3000 Index measures the performance of the 3,000 largest U.S. companies based on total market capitalization, which represent approximately 98% of the U.S. equity market. |
| xi | | The MSCI World Index is a market capitalization weighted equity index of over 1,500 stocks traded in 22 world markets. |
| xii | | The Russell 3000 Growth Index measures the performance of those Russell 3000 Index companies with higher price-to-book ratios and higher forecasted growth values. |
| xiii | | The Russell 3000 Value Index measures the performance of those Russell 3000 Index companies with lower price-to-book ratios and lower forecasted growth values. (A price-to-book ratio is the price of a stock compared to the difference between a company’s assets and liabilities.) |
| xiv | | The Lehman Brothers Intermediate Treasury Bond Index is an unmanaged index of U.S. Treasury bonds with maturities between one and ten years. |
5 Smith Barney Multiple Discipline Trust | 2005 Semi-Annual Report
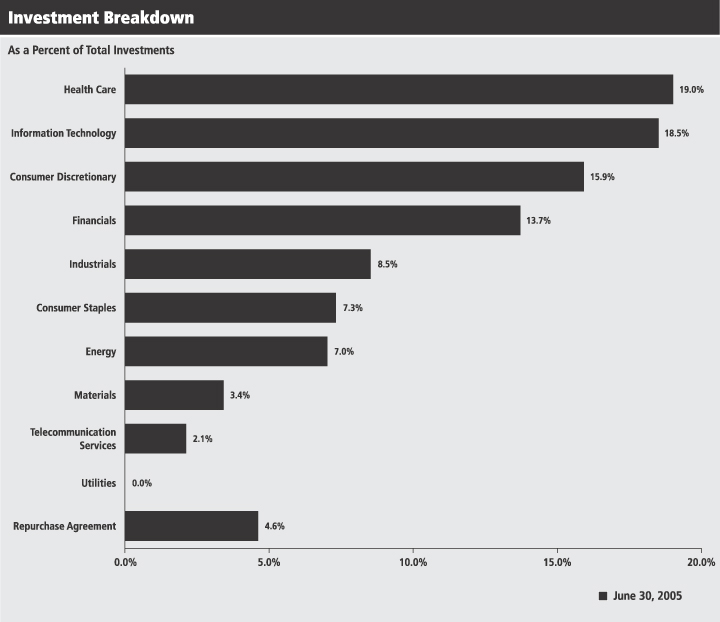
Multiple Discipline Portfolio — All Cap Growth and Value
Fund at a Glance (unaudited)
6 Smith Barney Multiple Discipline Trust | 2005 Semi-Annual Report
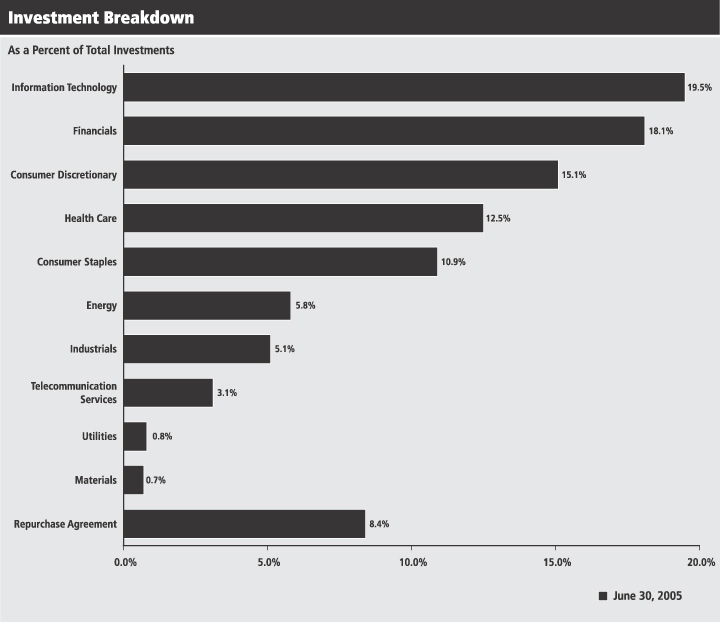
Multiple Discipline Portfolio — Large Cap Growth and Value
Fund at a Glance (unaudited)
7 Smith Barney Multiple Discipline Trust | 2005 Semi-Annual Report
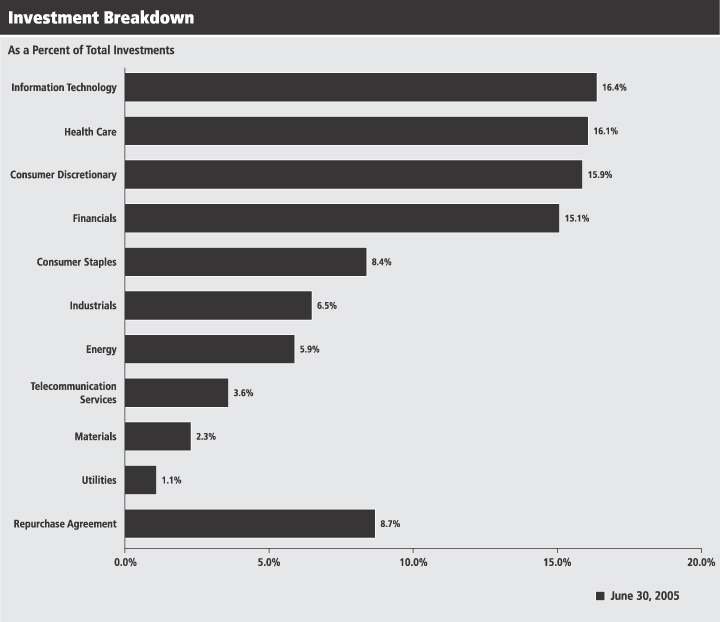
Multiple Discipline Portfolio — Global All Cap Growth and Value
Fund at a Glance (unaudited)
8 Smith Barney Multiple Discipline Trust | 2005 Semi-Annual Report
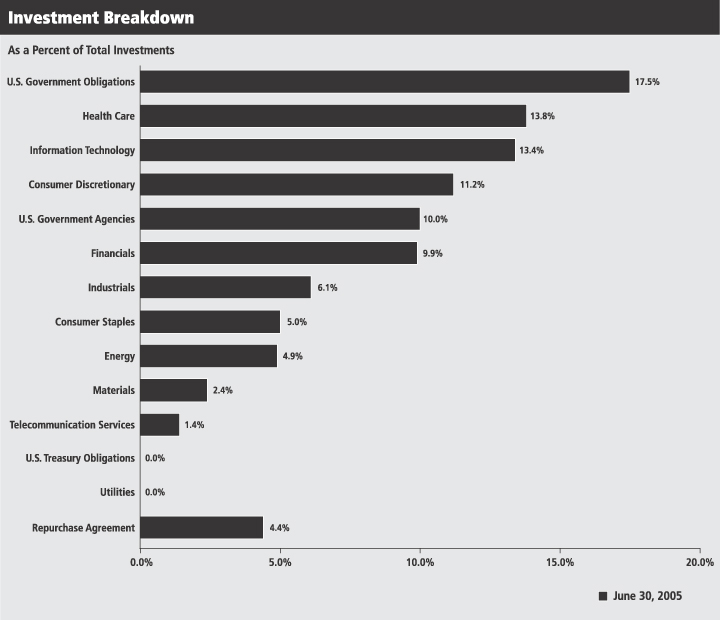
Multiple Discipline Portfolio — Balanced All Cap Growth and Value
Fund at a Glance (unaudited)
9 Smith Barney Multiple Discipline Trust | 2005 Semi-Annual Report
| | |
| Fund Expenses (unaudited) | | |
Example
As a shareholder of the Funds, you may incur two types of costs: (1) transaction costs and (2) ongoing costs, including management fees; distribution and/or service (12b-1) fees; and other Fund expenses. This example is intended to help you understand your ongoing costs (in dollars) of investing in the Fund and to compare these costs with the ongoing costs of investing in other mutual funds.
This example is based on an investment of $1,000 invested on January 1, 2005 and held for the six months ended June 30, 2005.
Actual Expenses
The table below titled “Based on Actual Total Return” provides information about actual account values and actual expenses. You may use the information provided in this table, together with the amount you invested, to estimate the expenses that you paid over the period. To estimate the expenses you paid on your account, divide your ending account value by $1,000 (for example, an $8,600 ending account value divided by $1,000 = 8.6), then multiply the result by the number under the heading entitled “Expenses Paid During the Period”.
Based on Actual Total Return(1)
| | | | | | | | | | | | | | | |
| | | Actual
Total
Return(2) | | | Beginning
Account
Value | | Ending
Account
Value | | Annualized
Expense
Ratios | | | Expenses
Paid During
the Period(3) |
All Cap Growth and Value | | (1.75 | )% | | $ | 1,000.00 | | $ | 982.50 | | 0.95 | % | | $ | 4.67 |
|
Large Cap Growth and Value | | (1.53 | ) | | | 1,000.00 | | | 984.70 | | 0.96 | | | | 4.72 |
|
Global All Cap Growth and Value | | (1.88 | ) | | | 1,000.00 | | | 981.20 | | 0.88 | | | | 4.32 |
|
Balanced All Cap Growth and Value | | (0.99 | ) | | | 1,000.00 | | | 990.10 | | 0.96 | | | | 4.74 |
|
| (1) | | For the six months ended June 30, 2005. |
| (2) | | Assumes reinvestment of dividends and capital gains distributions, if any, at net asset value. Total return is not annualized, as it may not be representative of the total return for the year. Total returns do not reflect expenses associated with the separate account such as administrative fees, account charges and surrender charges which, if reflected, would reduce the total returns. Performance figures may reflect voluntary fee waivers and/or expense reimbursements. Past performance is no guarantee of future results. In the absence of voluntary fee waivers and/or expense reimbursements, the total return would have been lower. |
| (3) | | Expenses (net of voluntary fee waiver) are equal to each Fund’s respective annualized expense ratio multiplied by the average account value over the period, multiplied by the number of days in the most recent fiscal half-year, then divided by 365. |
10 Smith Barney Multiple Discipline Trust | 2005 Semi-Annual Report
| | |
| Fund Expenses (unaudited) (continued) | | |
Hypothetical Example for Comparison Purposes
The table below titled “Based on Hypothetical Total Return” provides information about hypothetical account values and hypothetical expenses based on the actual expense ratio and an assumed rate of return of 5.00% per year before expenses, which is not the Fund’s actual return. The hypothetical account values and expenses may not be used to estimate the actual ending account balance or expenses you paid for the period. You may use the information provided in this table to compare the ongoing costs of investing in the Funds and other funds. To do so, compare the 5.00% hypothetical example relating to the Fund with the 5.00% hypothetical examples that appear in the shareholder reports of the other funds.
Please note that the expenses shown in the table below are meant to highlight your ongoing costs only and do not reflect any transactional costs. Therefore, this table is useful in comparing ongoing costs only, and will not help you determine the relative total costs of owning different funds. In addition, if these transaction costs were included, your costs would have been higher.
Based on Hypothetical Total Return(1)
| | | | | | | | | | | | | | | |
| | | Hypothetical
Annualized
Total Return | | | Beginning
Account
Value | | Ending
Account
Value | | Annualized
Expense
Ratios | | | Expenses
Paid During
the Period(2) |
All Cap Growth and Value | | 5.00 | % | | $ | 1,000.00 | | $ | 1,020.08 | | 0.95 | % | | $ | 4.76 |
|
Large Cap Growth and Value | | 5.00 | | | | 1,000.00 | | | 1,020.03 | | 0.96 | | | | 4.81 |
|
Global All Cap Growth and Value | | 5.00 | | | | 1,000.00 | | | 1,020.43 | | 0.88 | | | | 4.41 |
|
Balanced All Cap Growth and Value | | 5.00 | | | | 1,000.00 | | | 1,020.03 | | 0.96 | | | | 4.81 |
|
| (1) | | For the six months ended June 30, 2005. |
| (2) | | Expenses (net of voluntary fee waiver) are equal to each Fund’s respective annualized expense ratio multiplied by the average account value over the period, multiplied by the number of days in the most recent fiscal half-year, then divided by 365. |
11 Smith Barney Multiple Discipline Trust | 2005 Semi-Annual Report
| | |
| Schedules of Investments (unaudited) | | June 30, 2005 |
| | | | | |
| Multiple Discipline Portfolio — All Cap Growth and Value |
| | |
| SHARES | | SECURITY | | VALUE |
| COMMON STOCK — 96.1% | | | |
| CONSUMER DISCRETIONARY — 16.0% | | | |
| Hotels, Restaurants & Leisure — 0.6% | | | |
| 60,425 | | McDonald’s Corp. | | $ | 1,676,794 |
|
| Internet & Catalog Retail — 0.6% | | | |
| 47,500 | | Amazon.com, Inc.* | | | 1,571,300 |
|
| Leisure Equipment & Products — 1.2% | | | |
| 97,740 | | Hasbro, Inc. | | | 2,032,015 |
| 64,940 | | Mattel, Inc. | | | 1,188,402 |
|
| | | | | | 3,220,417 |
|
| Media — 10.5% | | | |
| 80,340 | | Cablevision Systems Corp., New York Group, Class A Shares* | | | 2,586,948 |
| 21,500 | | Clear Channel Communications, Inc. | | | 664,995 |
| 206,045 | | Comcast Corp., Special Class A Shares* | | | 6,171,048 |
| 52,500 | | Interpublic Group of Cos., Inc.* | | | 639,450 |
| 313,779 | | Liberty Media Corp., Series A Shares* | | | 3,197,408 |
| 115,090 | | News Corp., Class B Shares | | | 1,940,417 |
| 55,500 | | Pearson PLC, Sponsored ADR | | | 659,340 |
| 320,035 | | Time Warner, Inc.* | | | 5,347,785 |
| 51,500 | | Viacom, Inc., Class B Shares | | | 1,649,030 |
| 196,730 | | Walt Disney Co. | | | 4,953,661 |
|
| | | | | | 27,810,082 |
|
| Specialty Retail — 3.1% | | | |
| 42,500 | | Bed Bath & Beyond, Inc.* | | | 1,775,650 |
| 176,160 | | Charming Shoppes, Inc.* | | | 1,643,573 |
| 124,734 | | Home Depot, Inc. | | | 4,852,152 |
|
| | | | | | 8,271,375 |
|
| | | TOTAL CONSUMER DISCRETIONARY | | | 42,549,968 |
|
| CONSUMER STAPLES — 7.4% | | | |
| Beverages — 3.3% | | | |
| 92,963 | | Coca-Cola Co. | | | 3,881,205 |
| 91,573 | | PepsiCo, Inc. | | | 4,938,532 |
|
| | | | | | 8,819,737 |
|
| Food & Staples Retailing — 0.6% | | | |
| 65,700 | | Safeway, Inc. | | | 1,484,163 |
|
| Food Products — 1.9% | | | |
| 69,000 | | Unilever PLC, Sponsored ADR | | | 2,680,650 |
| 35,040 | | Wm. Wrigley Jr. Co. | | | 2,412,154 |
|
| | | | | | 5,092,804 |
|
| Personal Products — 1.6% | | | |
| 82,735 | | Gillette Co. | | | 4,188,873 |
|
| | | TOTAL CONSUMER STAPLES | | | 19,585,577 |
|
| ENERGY — 7.1% | | | |
| Energy Equipment & Services — 2.4% | | | |
| 26,500 | | Baker Hughes, Inc. | | | 1,355,740 |
| 32,640 | | GlobalSantaFe Corp. | | | 1,331,712 |
See Notes to Financial Statements.
12 Smith Barney Multiple Discipline Trust | 2005 Semi-Annual Report
| | |
| Schedules of Investments (unaudited) (continued) | | June 30, 2005 |
| | | | | |
| Multiple Discipline Portfolio — All Cap Growth and Value |
| | |
| SHARES | | SECURITY | | VALUE |
| Energy Equipment & Services — 2.4% (continued) | | | |
| 33,046 | | Grant Prideco, Inc.* | | $ | 874,067 |
| 48,200 | | Weatherford International Ltd.* | | | 2,794,636 |
|
| | | | | | 6,356,155 |
|
| Oil, Gas & Consumable Fuels — 4.7% | | | |
| 26,160 | | Anadarko Petroleum Corp. | | | 2,149,044 |
| 31,820 | | BP PLC, Sponsored ADR | | | 1,984,932 |
| 34,000 | | Chevron Corp. | | | 1,901,280 |
| 56,780 | | Exxon Mobil Corp. | | | 3,263,146 |
| 32,620 | | Murphy Oil Corp. | | | 1,703,743 |
| 74,300 | | Williams Cos., Inc. | | | 1,411,700 |
|
| | | | | | 12,413,845 |
|
| | | TOTAL ENERGY | | | 18,770,000 |
|
| FINANCIALS — 13.8% | | | |
| Diversified Financial Services — 7.5% | | | |
| 47,645 | | American Express Co. | | | 2,536,143 |
| 65,420 | | Bank of New York Co., Inc. | | | 1,882,788 |
| 81,832 | | JPMorgan Chase & Co. | | | 2,890,306 |
| 37,002 | | Lehman Brothers Holdings, Inc. | | | 3,673,559 |
| 82,520 | | MBNA Corp. | | | 2,158,723 |
| 70,304 | | Merrill Lynch & Co., Inc. | | | 3,867,423 |
| 25,000 | | Morgan Stanley | | | 1,311,750 |
| 34,530 | | State Street Corp. | | | 1,666,072 |
|
| | | | | | 19,986,764 |
|
| Insurance — 6.3% | | | |
| 23,315 | | Ambac Financial Group, Inc. | | | 1,626,454 |
| 111,485 | | American International Group, Inc. | | | 6,477,278 |
| 681 | | Berkshire Hathaway, Inc., Class B Shares* | | | 1,895,564 |
| 30,285 | | Chubb Corp. | | | 2,592,699 |
| 40,875 | | MGIC Investment Corp. | | | 2,665,868 |
| 35,000 | | PMI Group, Inc. | | | 1,364,300 |
|
| | | | | | 16,622,163 |
|
| | | TOTAL FINANCIALS | | | 36,608,927 |
|
| HEALTH CARE — 19.1% | | | |
| Biotechnology — 8.3% | | | |
| 2,746 | | Alkermes, Inc.* | | | 36,302 |
| 76,445 | | Amgen, Inc.* | | | 4,621,865 |
| 148,655 | | Biogen Idec, Inc.* | | | 5,121,165 |
| 99,590 | | Chiron Corp.* | | | 3,474,695 |
| 32,752 | | Genentech, Inc.* | | | 2,629,331 |
| 58,550 | | Genzyme Corp.* | | | 3,518,269 |
| 34,500 | | ImClone Systems, Inc.* | | | 1,068,465 |
| 183,120 | | Millennium Pharmaceuticals, Inc.* | | | 1,697,522 |
|
| | | | | | 22,167,614 |
|
| Health Care Equipment & Supplies — 0.1% | | | |
| 11,500 | | Boston Scientific Corp.* | | | 310,500 |
|
See Notes to Financial Statements.
13 Smith Barney Multiple Discipline Trust | 2005 Semi-Annual Report
| | |
| Schedules of Investments (unaudited) (continued) | | June 30, 2005 |
| | | | | |
| Multiple Discipline Portfolio — All Cap Growth and Value |
| | |
| SHARES | | SECURITY | | VALUE |
| Health Care Providers & Services — 1.6% | | | |
| 78,260 | | UnitedHealth Group, Inc. | | $ | 4,080,476 |
|
| Pharmaceuticals — 9.1% | | | |
| 58,090 | | Abbott Laboratories | | | 2,846,991 |
| 71,080 | | Forest Laboratories, Inc.* | | | 2,761,458 |
| 43,930 | | GlaxoSmithKline PLC, ADR | | | 2,131,045 |
| 89,724 | | Johnson & Johnson | | | 5,832,060 |
| 22,500 | | Novartis AG, ADR | | | 1,067,400 |
| 241,016 | | Pfizer, Inc. | | | 6,647,221 |
| 65,110 | | Wyeth | | | 2,897,395 |
|
| | | | | | 24,183,570 |
|
| | | TOTAL HEALTH CARE | | | 50,742,160 |
|
| INDUSTRIALS — 8.6% | | | |
| Aerospace & Defense — 1.7% | | | |
| 28,186 | | L-3 Communications Holdings, Inc. | | | 2,158,484 |
| 59,690 | | Raytheon Co. | | | 2,335,073 |
|
| | | | | | 4,493,557 |
|
| Airlines — 0.5% | | | |
| 96,230 | | Southwest Airlines Co. | | | 1,340,484 |
|
| Electrical Equipment — 1.0% | | | |
| 42,285 | | Emerson Electric Co. | | | 2,648,309 |
|
| Industrial Conglomerates — 3.9% | | | |
| 90,700 | | General Electric Co. | | | 3,142,755 |
| 63,460 | | Honeywell International, Inc. | | | 2,324,540 |
| 166,421 | | Tyco International Ltd. | | | 4,859,493 |
|
| | | | | | 10,326,788 |
|
| Machinery — 1.5% | | | |
| 18,941 | | Caterpillar, Inc. | | | 1,805,267 |
| 73,700 | | Pall Corp. | | | 2,237,532 |
|
| | | | | | 4,042,799 |
|
| | | TOTAL INDUSTRIALS | | | 22,851,937 |
|
| INFORMATION TECHNOLOGY — 18.6% | | | |
| Communications Equipment — 2.9% | | | |
| 229,175 | | Cisco Systems, Inc.* | | | 4,379,534 |
| 155,500 | | Lucent Technologies, Inc.* | | | 452,505 |
| 82,220 | | Motorola, Inc. | | | 1,501,337 |
| 92,210 | | Nokia OYJ, Sponsored ADR | | | 1,534,375 |
|
| | | | | | 7,867,751 |
|
| Computers & Peripherals — 2.9% | | | |
| 79,280 | | Dell, Inc.* | | | 3,132,353 |
| 27,310 | | Electronics for Imaging, Inc.* | | | 574,602 |
| 19,435 | | International Business Machines Corp. | | | 1,442,077 |
| 195,843 | | Maxtor Corp.* | | | 1,018,384 |
| 62,300 | | SanDisk Corp.* | | | 1,478,379 |
|
| | | | | | 7,645,795 |
|
See Notes to Financial Statements.
14 Smith Barney Multiple Discipline Trust | 2005 Semi-Annual Report
| | |
| Schedules of Investments (unaudited) (continued) | | June 30, 2005 |
| | | | | |
| Multiple Discipline Portfolio — All Cap Growth and Value |
| | |
| SHARES | | SECURITY | | VALUE |
| Electronic Equipment & Instruments — 1.1% | | | |
| 62,290 | | Agilent Technologies, Inc.* | | $ | 1,433,916 |
| 368,590 | | Solectron Corp.* | | | 1,396,956 |
|
| | | | | | 2,830,872 |
|
| Internet Software & Services — 1.2% | | | |
| 138,890 | | IAC/InterActiveCorp* | | | 3,340,304 |
|
| Semiconductors & Semiconductor Equipment — 7.0% | | | |
| 80,000 | | Applied Materials, Inc. | | | 1,294,400 |
| 829 | | Cabot Microelectronics Corp.* | | | 24,033 |
| 39,636 | | Cree, Inc.* | | | 1,009,529 |
| 188,990 | | Intel Corp. | | | 4,925,079 |
| 203,662 | | Micron Technology, Inc.* | | | 2,079,389 |
| 236,035 | | Taiwan Semiconductor Manufacturing Co., Ltd., Sponsored ADR | | | 2,152,639 |
| 251,710 | | Texas Instruments, Inc. | | | 7,065,500 |
|
| | | | | | 18,550,569 |
|
| Software — 3.5% | | | |
| 51,900 | | Advent Software, Inc.* | | | 1,051,494 |
| 40,820 | | Autodesk, Inc. | | | 1,402,983 |
| 70,000 | | Micromuse, Inc.* | | | 396,200 |
| 261,730 | | Microsoft Corp. | | | 6,501,373 |
| 5,170 | | RealNetworks, Inc.* | | | 25,695 |
|
| | | | | | 9,377,745 |
|
| | | TOTAL INFORMATION TECHNOLOGY | | | 49,613,036 |
|
| MATERIALS — 3.4% | | | |
| Chemicals — 1.6% | | | |
| 15,000 | | Dow Chemical Co. | | | 667,950 |
| 25,000 | | E.I. du Pont de Nemours and Co. | | | 1,075,250 |
| 93,180 | | Engelhard Corp. | | | 2,660,289 |
|
| | | | | | 4,403,489 |
|
| Metals & Mining — 0.9% | | | |
| 90,495 | | Alcoa, Inc. | | | 2,364,634 |
|
| Paper & Forest Products — 0.9% | | | |
| 36,975 | | Weyerhaeuser Co. | | | 2,353,459 |
|
| | | TOTAL MATERIALS | | | 9,121,582 |
|
| TELECOMMUNICATION SERVICES — 2.1% | | | |
| Diversified Telecommunication Services — 1.5% | | | |
| 6,938 | | Liberty Global, Inc., Series A Shares* | | | 323,797 |
| 80,280 | | SBC Communications, Inc. | | | 1,906,650 |
| 55,440 | | Verizon Communications, Inc. | | | 1,915,452 |
|
| | | | | | 4,145,899 |
|
| Wireless Telecommunication Services — 0.6% | | | |
| 61,360 | | Vodafone Group PLC, Sponsored ADR | | | 1,492,275 |
|
| | | TOTAL TELECOMMUNICATION SERVICES | | | 5,638,174 |
|
| | | TOTAL INVESTMENTS BEFORE SHORT-TERM INVESTMENT
(Cost — $237,454,425) | | | 255,481,361 |
|
See Notes to Financial Statements.
15 Smith Barney Multiple Discipline Trust | 2005 Semi-Annual Report
| | |
| Schedules of Investments (unaudited) (continued) | | June 30, 2005 |
| | | | | | |
| Multiple Discipline Portfolio — All Cap Growth and Value | |
FACE
AMOUNT | | SECURITY | | VALUE | |
| SHORT-TERM INVESTMENT — 4.6% | | | | |
| Repurchase Agreement — 4.6% | | | | |
| $12,331,000 | | State Street Bank & Trust Co., dated 6/30/05, 2.550% due 7/1/05, Proceeds at maturity — $12,331,873; (Fully collateralized by U.S. Treasury Bond, 8.125% due 8/15/19; Market value — $12,581,760)
(Cost — $12,331,000) | | $ | 12,331,000 | |
|
|
| | | TOTAL INVESTMENTS — 100.6% (Cost — $249,785,425#) | | | 267,812,361 | |
| | | Liabilities in Excess of Other Assets — (0.6)% | | | (1,734,854 | ) |
|
|
| | | TOTAL NET ASSETS — 100.0% | | $ | 266,077,507 | |
|
|
| * | | Non-income producing security. |
| # | | Aggregate cost for Federal income tax purposes is substantially the same. |
Abbreviation used in this schedule:
ADR — American Depositary Receipt
See Notes to Financial Statements.
16 Smith Barney Multiple Discipline Trust | 2005 Semi-Annual Report
| | |
| Schedules of Investments (unaudited) (continued) | | June 30, 2005 |
| | | | | |
| Multiple Discipline Portfolio — Large Cap Growth and Value |
| | |
| SHARES | | SECURITY | | VALUE |
| COMMON STOCK — 92.0% | | | |
| CONSUMER DISCRETIONARY — 15.1% | | | |
| Hotels, Restaurants & Leisure — 1.0% | | | |
| 12,200 | | McDonald’s Corp. | | $ | 338,550 |
|
| Household Durables — 0.7% | | | |
| 10,640 | | Newell Rubbermaid, Inc. | | | 253,658 |
|
| Internet & Catalog Retail — 0.9% | | | |
| 9,500 | | Amazon.com, Inc.* | | | 314,260 |
|
| Media — 8.4% | | | |
| 8,720 | | Comcast Corp., Class A Shares* | | | 267,704 |
| 5,000 | | EchoStar Communications Corp., Class A Shares | | | 150,750 |
| 33,340 | | Liberty Media Corp., Series A Shares* | | | 339,735 |
| 27,000 | | News Corp., Class B Shares | | | 455,220 |
| 60,800 | | Time Warner, Inc.* | | | 1,015,968 |
| 23,940 | | Walt Disney Co. | | | 602,809 |
|
| | | | | | 2,832,186 |
|
| Multi-Line Retail — 1.1% | | | |
| 4,050 | | J.C. Penney Co., Inc. | | | 212,949 |
| 3,215 | | Target Corp. | | | 174,928 |
|
| | | | | | 387,877 |
|
| Specialty Retail — 3.0% | | | |
| 8,000 | | Bed Bath & Beyond, Inc.* | | | 334,240 |
| 17,275 | | Home Depot, Inc. | | | 671,997 |
|
| | | | | | 1,006,237 |
|
| | | TOTAL CONSUMER DISCRETIONARY | | | 5,132,768 |
|
| CONSUMER STAPLES — 11.0% | | | |
| Beverages — 3.7% | | | |
| 18,420 | | Coca-Cola Co. | | | 769,035 |
| 8,960 | | PepsiCo, Inc. | | | 483,213 |
|
| | | | | | 1,252,248 |
|
| Food & Staples Retailing — 0.8% | | | |
| 13,440 | | Kroger Co.* | | | 255,763 |
|
| Food Products — 2.3% | | | |
| 13,300 | | Sara Lee Corp. | | | 263,473 |
| 7,290 | | Wm. Wrigley Jr. Co. | | | 501,844 |
|
| | | | | | 765,317 |
|
| Household Products — 0.6% | | | |
| 3,365 | | Kimberly-Clark Corp. | | | 210,615 |
|
| Personal Products — 2.1% | | | |
| 14,125 | | Gillette Co. | | | 715,149 |
|
| Tobacco — 1.5% | | | |
| 7,900 | | Altria Group, Inc. | | | 510,814 |
|
| | | TOTAL CONSUMER STAPLES | | | 3,709,906 |
|
See Notes to Financial Statements.
17 Smith Barney Multiple Discipline Trust | 2005 Semi-Annual Report
| | |
| Schedules of Investments (unaudited) (continued) | | June 30, 2005 |
| | | | | |
| Multiple Discipline Portfolio — Large Cap Growth and Value |
| | |
| SHARES | | SECURITY | | VALUE |
| ENERGY — 5.8% | | | |
| Energy Equipment & Services — 0.8% | | | |
| 1,500 | | Nabors Industries Ltd.* | | $ | 90,930 |
| 3,000 | | Noble Corp. | | | 184,530 |
|
| | | | | | 275,460 |
|
| Oil, Gas & Consumable Fuels — 5.0% | | | |
| 3,810 | | BP PLC, Sponsored ADR | | | 237,668 |
| 7,285 | | Exxon Mobil Corp. | | | 418,669 |
| 7,640 | | Royal Dutch Petroleum Co., New York Shares | | | 495,836 |
| 2,680 | | Suncor Energy, Inc. | | | 126,818 |
| 3,525 | | Total SA, Sponsored ADR | | | 411,896 |
|
| | | | | | 1,690,887 |
|
| | | TOTAL ENERGY | | | 1,966,347 |
|
| FINANCIALS — 18.2% | | | |
| Commercial Banks — 3.0% | | | |
| 10,352 | | Bank of America Corp. | | | 472,155 |
| 5,800 | | Wachovia Corp. | | | 287,680 |
| 6,380 | | Washington Mutual, Inc. | | | 259,602 |
|
| | | | | | 1,019,437 |
|
| Diversified Financial Services — 9.4% | | | |
| 4,905 | | American Express Co. | | | 261,093 |
| 7,050 | | Bank of New York Co., Inc. | | | 202,899 |
| 5,990 | | Capital One Financial Corp. | | | 479,260 |
| 4,000 | | Comerica, Inc. | | | 231,200 |
| 3,090 | | Goldman Sachs Group, Inc. | | | 315,242 |
| 9,165 | | JPMorgan Chase & Co. | | | 323,708 |
| 20,635 | | Merrill Lynch & Co., Inc. | | | 1,135,131 |
| 4,005 | | Morgan Stanley | | | 210,142 |
|
| | | | | | 3,158,675 |
|
| Insurance — 5.8% | | | |
| 22,160 | | American International Group, Inc. | | | 1,287,496 |
| 118 | | Berkshire Hathaway, Inc., Class B Shares* | | | 328,453 |
| 3,000 | | Chubb Corp. | | | 256,830 |
| 2,560 | | St. Paul Travelers Cos., Inc. | | | 101,197 |
|
| | | | | | 1,973,976 |
|
| | | TOTAL FINANCIALS | | | 6,152,088 |
|
| HEALTH CARE — 12.5% | | | |
| Biotechnology — 5.4% | | | |
| 13,190 | | Amgen, Inc.* | | | 797,468 |
| 14,620 | | Biogen Idec, Inc.* | | | 503,659 |
| 6,600 | | Genentech, Inc.* | | | 529,848 |
|
| | | | | | 1,830,975 |
|
| Health Care Providers & Services — 0.3% | | | |
| 1,110 | | Aetna, Inc. | | | 91,930 |
|
See Notes to Financial Statements.
18 Smith Barney Multiple Discipline Trust | 2005 Semi-Annual Report
| | |
| Schedules of Investments (unaudited) (continued) | | June 30, 2005 |
| | | | | |
| Multiple Discipline Portfolio — Large Cap Growth and Value |
| | |
| SHARES | | SECURITY | | VALUE |
| Pharmaceuticals — 6.8% | | | |
| 13,300 | | Johnson & Johnson | | $ | 864,500 |
| 3,500 | | Novartis AG, Sponsored ADR | | | 166,040 |
| 34,648 | | Pfizer, Inc. | | | 955,592 |
| 8,250 | | Sanofi-Aventis, ADR | | | 338,167 |
|
| | | | | | 2,324,299 |
|
| | | TOTAL HEALTH CARE | | | 4,247,204 |
|
| INDUSTRIALS — 5.1% | | | |
| Aerospace & Defense — 2.5% | | | |
| 4,140 | | Boeing Co. | | | 273,240 |
| 8,755 | | Honeywell International, Inc. | | | 320,696 |
| 6,550 | | Raytheon Co. | | | 256,236 |
|
| | | | | | 850,172 |
|
| Commercial Services & Supplies — 0.7% | | | |
| 4,500 | | Avery Dennison Corp. | | | 238,320 |
|
| Industrial Conglomerates — 1.9% | | | |
| 17,110 | | General Electric Co. | | | 592,861 |
| 760 | | Textron, Inc. | | | 57,646 |
|
| | | | | | 650,507 |
|
| | | TOTAL INDUSTRIALS | | | 1,738,999 |
|
| INFORMATION TECHNOLOGY — 19.6% | | | |
| Communications Equipment — 3.2% | | | |
| 34,705 | | Cisco Systems, Inc.* | | | 663,213 |
| 7,925 | | Comverse Technology, Inc.* | | | 187,426 |
| 13,855 | | Nokia OYJ, Sponsored ADR | | | 230,547 |
|
| | | | | | 1,081,186 |
|
| Computers & Peripherals — 4.8% | | | |
| 16,280 | | Dell, Inc.* | | | 643,223 |
| 11,075 | | Hewlett-Packard Co. | | | 260,373 |
| 5,100 | | International Business Machines Corp. | | | 378,420 |
| 5,700 | | Lexmark International, Inc., Class A Shares* | | | 369,531 |
|
| | | | | | 1,651,547 |
|
| Electronic Equipment & Instruments — 0.5% | | | |
| 44,000 | | Solectron Corp.* | | | 166,760 |
|
| Internet Software & Services — 2.0% | | | |
| 28,000 | | IAC/InterActiveCorp* | | | 673,400 |
|
| Semiconductors & Semiconductor Equipment — 5.4% | | | |
| 37,495 | | Intel Corp. | | | 977,120 |
| 30,110 | | Texas Instruments, Inc. | | | 845,188 |
|
| | | | | | 1,822,308 |
|
| Software — 3.7% | | | |
| 50,280 | | Microsoft Corp. | | | 1,248,955 |
|
| | | TOTAL INFORMATION TECHNOLOGY | | | 6,644,156 |
|
See Notes to Financial Statements.
19 Smith Barney Multiple Discipline Trust | 2005 Semi-Annual Report
| | |
| Schedules of Investments (unaudited) (continued) | | June 30, 2005 |
| | | | | | |
| Multiple Discipline Portfolio — Large Cap Growth and Value | |
| | |
| SHARES | | SECURITY | | VALUE | |
| MATERIALS — 0.7% | | | | |
| Chemicals — 0.7% | | | | |
| 4,200 | | Air Products & Chemicals, Inc. | | $ | 253,260 | |
|
|
| TELECOMMUNICATION SERVICES — 3.2% | | | | |
| Diversified Telecommunication Services — 2.1% | | | | |
| 6,541 | | AT&T Corp. | | | 124,541 | |
| 13,615 | | SBC Communications, Inc. | | | 323,356 | |
| 7,560 | | Verizon Communications, Inc. | | | 261,198 | |
|
|
| | | | | | 709,095 | |
|
|
| Wireless Telecommunication Services — 1.1% | | | | |
| 11,100 | | Nextel Communications, Inc., Class A Shares* | | | 358,641 | |
|
|
| | | TOTAL TELECOMMUNICATION SERVICES | | | 1,067,736 | |
|
|
| UTILITIES — 0.8% | | | | |
| Gas Utilities — 0.8% | | | | |
| 6,250 | | Sempra Energy | | | 258,187 | |
|
|
| | | TOTAL INVESTMENTS BEFORE SHORT-TERM INVESTMENT
(Cost — $29,599,639) | | | 31,170,651 | |
|
|
| | |
FACE
AMOUNT | | | | | |
| SHORT-TERM INVESTMENT — 8.5% | | | | |
| Repurchase Agreement — 8.5% | | | | |
| $2,877,000 | | State Street Bank & Trust Co., dated 6/30/05, 2.550% due 7/1/05; Proceeds at maturity — $2,877,204; (Fully collateralized by U.S. Treasury Bond, 8.125% due 8/15/19; Market value — $2,939,596)
(Cost — $2,877,000) | | | 2,877,000 | |
|
|
| | | TOTAL INVESTMENTS — 100.5% (Cost — $32,476,639#) | | | 34,047,651 | |
| | | Liabilities in Excess of Other Assets — (0.5)% | | | (162,252 | ) |
|
|
| | | TOTAL NET ASSETS — 100.0% | | $ | 33,885,399 | |
|
|
| * | | Non-income producing security. |
| # | | Aggregate cost for Federal income tax purposes is substantially the same. |
Abbreviation used in this schedule:
ADR — American Depositary Receipt
See Notes to Financial Statements.
20 Smith Barney Multiple Discipline Trust | 2005 Semi-Annual Report
| | |
| Schedules of Investments (unaudited) (continued) | | June 30, 2005 |
| | | | | |
| Multiple Discipline Portfolio — Global All Cap Growth and Value |
| | |
| SHARES | | SECURITY | | VALUE |
| COMMON STOCK — 91.8% | | | |
| CONSUMER DISCRETIONARY — 16.0% | | | |
| Automobiles — 0.4% | | | |
| 11,000 | | Honda Motor Co., Ltd., Sponsored ADR | | $ | 270,710 |
|
| Hotels, Restaurants & Leisure — 0.6% | | | |
| 14,000 | | McDonald’s Corp. | | | 388,500 |
|
| Household Durables — 0.8% | | | |
| 10,620 | | Koninklijke Philips Electronics NV, New York Registered Shares | | | 267,518 |
| 12,670 | | Newell Rubbermaid, Inc. | | | 302,053 |
|
| | | | | | 569,571 |
|
| Internet & Catalog Retail — 0.6% | | | |
| 12,000 | | Amazon.com, Inc.* | | | 396,960 |
|
| Leisure Equipment & Products — 0.4% | | | |
| 8,200 | | Fuji Photo Film Co., Ltd., Unsponsored ADR | | | 267,238 |
|
| Media — 9.8% | | | |
| 19,470 | | Cablevision Systems Corp., New York Group, Class A Shares* | | | 626,934 |
| 8,932 | | Comcast Corp., Class A Shares* | | | 274,212 |
| 31,225 | | Comcast Corp., Special Class A Shares* | | | 935,189 |
| 6,000 | | EchoStar Communications Corp., Class A Shares | | | 180,900 |
| 4,360 | | Grupo Televisa SA, Sponsored ADR | | | 270,712 |
| 118,385 | | Liberty Media Corp., Series A Shares* | | | 1,206,343 |
| 55,680 | | News Corp., Class B Shares | | | 938,765 |
| 72,235 | | Time Warner, Inc.* | | | 1,207,047 |
| 30,185 | | Walt Disney Co. | | | 760,058 |
| 5,090 | | WPP Group PLC, Sponsored ADR | | | 259,845 |
|
| | | | | | 6,660,005 |
|
| Multi-Line Retail — 1.1% | | | |
| 5,000 | | J.C. Penney Co., Inc. | | | 262,900 |
| 3,580 | | Target Corp. | | | 194,788 |
| 6,600 | | Wal-Mart de Mexico SA de CV, Series V Shares, Sponsored ADR | | | 268,950 |
|
| | | | | | 726,638 |
|
| Specialty Retail — 2.3% | | | |
| 9,810 | | Bed Bath & Beyond, Inc.* | | | 409,862 |
| 39,460 | | Charming Shoppes, Inc.* | | | 368,162 |
| 21,165 | | Home Depot, Inc. | | | 823,318 |
|
| | | | | | 1,601,342 |
|
| | | TOTAL CONSUMER DISCRETIONARY | | | 10,880,964 |
|
| CONSUMER STAPLES — 8.4% | | | |
| Beverages — 2.6% | | | |
| 23,330 | | Coca-Cola Co. | | | 974,027 |
| 4,200 | | Diageo PLC, Sponsored ADR | | | 249,060 |
| 10,245 | | PepsiCo, Inc. | | | 552,513 |
|
| | | | | | 1,775,600 |
|
| Food & Staples Retailing — 1.1% | | | |
| 15,650 | | Kroger Co.* | | | 297,820 |
See Notes to Financial Statements.
21 Smith Barney Multiple Discipline Trust | 2005 Semi-Annual Report
| | |
| Schedules of Investments (unaudited) (continued) | | June 30, 2005 |
| | | | | |
| Multiple Discipline Portfolio — Global All Cap Growth and Value |
| | |
| SHARES | | SECURITY | | VALUE |
| Food & Staples Retailing — 1.1% (continued) | | | |
| 7,630 | | Seven-Eleven Japan Co., Ltd., Unsponsored ADR | | $ | 212,078 |
| 15,350 | | Tesco PLC, Sponsored ADR | | | 265,939 |
|
| | | | | | 775,837 |
|
| Food Products — 2.3% | | | |
| 15,370 | | Groupe Danone, Sponsored ADR | | | 268,975 |
| 6,230 | | Nestle SA, Sponsored ADR | | | 397,785 |
| 15,800 | | Sara Lee Corp. | | | 312,998 |
| 8,790 | | Wm. Wrigley Jr. Co. | | | 605,104 |
|
| | | | | | 1,584,862 |
|
| Household Products — 0.4% | | | |
| 3,775 | | Kimberly-Clark Corp. | | | 236,277 |
|
| Personal Products — 1.2% | | | |
| 16,575 | | Gillette Co. | | | 839,192 |
|
| Tobacco — 0.8% | | | |
| 8,300 | | Altria Group, Inc. | | | 536,678 |
|
| | | TOTAL CONSUMER STAPLES | | | 5,748,446 |
|
| ENERGY — 5.9% | | | |
| Energy Equipment & Services — 1.5% | | | |
| 6,015 | | Grant Prideco, Inc.* | | | 159,097 |
| 2,500 | | Nabors Industries Ltd.* | | | 151,550 |
| 3,000 | | Noble Corp. | | | 184,530 |
| 9,935 | | Weatherford International Ltd.* | | | 576,031 |
|
| | | | | | 1,071,208 |
|
| Oil, Gas & Consumable Fuels — 4.4% | | | |
| 4,000 | | Anadarko Petroleum Corp. | | | 328,600 |
| 11,140 | | BP PLC, Sponsored ADR | | | 694,913 |
| 7,750 | | Exxon Mobil Corp. | | | 445,393 |
| 9,370 | | Royal Dutch Petroleum Co., New York Shares | | | 608,113 |
| 3,060 | | Suncor Energy, Inc. | | | 144,799 |
| 6,495 | | Total SA, Sponsored ADR | | | 758,941 |
|
| | | | | | 2,980,759 |
|
| | | TOTAL ENERGY | | | 4,051,967 |
|
| FINANCIALS — 15.2% | | | |
| Commercial Banks — 4.2% | | | |
| 11,912 | | Bank of America Corp. | | | 543,306 |
| 4,330 | | Bank of Ireland, Sponsored ADR | | | 283,182 |
| 4,000 | | Comerica, Inc. | | | 231,200 |
| 3,330 | | HSBC Holdings PLC, Sponsored ADR | | | 265,235 |
| 47,310 | | Mitsubishi Tokyo Financial Group, Inc., ADR | | | 401,189 |
| 4,090 | | UBS AG, Registered Shares | | | 318,406 |
| 15,380 | | United Overseas Bank Ltd., Sponsored ADR | | | 262,229 |
| 6,165 | | Wachovia Corp. | | | 305,784 |
| 6,425 | | Washington Mutual, Inc. | | | 261,433 |
|
| | | | | | 2,871,964 |
|
See Notes to Financial Statements.
22 Smith Barney Multiple Discipline Trust | 2005 Semi-Annual Report
| | |
| Schedules of Investments (unaudited) (continued) | | June 30, 2005 |
| | | | | |
| Multiple Discipline Portfolio — Global All Cap Growth and Value |
| | |
| SHARES | | SECURITY | | VALUE |
| Diversified Financial Services — 7.4% | | | |
| 5,990 | | American Express Co. | | $ | 318,848 |
| 6,685 | | Bank of New York Co., Inc. | | | 192,394 |
| 6,600 | | Capital One Financial Corp. | | | 528,066 |
| 3,080 | | Goldman Sachs Group, Inc. | | | 314,222 |
| 9,660 | | ING Groep NV, Sponsored ADR | | | 270,963 |
| 11,185 | | JPMorgan Chase & Co. | | | 395,054 |
| 8,285 | | Lehman Brothers Holdings, Inc. | | | 822,535 |
| 24,890 | | Merrill Lynch & Co., Inc. | | | 1,369,199 |
| 5,175 | | Morgan Stanley | | | 271,532 |
| 21,260 | | Nomura Holdings, Inc., ADR | | | 254,057 |
| 3,600 | | ORIX Corp., Sponsored ADR | | | 270,936 |
|
| | | | | | 5,007,806 |
|
| Insurance — 3.6% | | | |
| 26,700 | | American International Group, Inc. | | | 1,551,270 |
| 10,745 | | Axa, Sponsored ADR | | | 267,658 |
| 92 | | Berkshire Hathaway, Inc., Class B Shares* | | | 256,082 |
| 3,550 | | Chubb Corp. | | | 303,915 |
| 1,750 | | St. Paul Travelers Cos., Inc. | | | 69,178 |
|
| | | | | | 2,448,103 |
|
| | | TOTAL FINANCIALS | | | 10,327,873 |
|
| HEALTH CARE — 16.2% | | | |
| Biotechnology — 7.6% | | | |
| 730 | | Alkermes, Inc.* | | | 9,651 |
| 16,670 | | Amgen, Inc.* | | | 1,007,868 |
| 37,605 | | Biogen Idec, Inc.* | | | 1,295,492 |
| 22,240 | | Chiron Corp.* | | | 775,954 |
| 7,550 | | Genentech, Inc.* | | | 606,114 |
| 14,015 | | Genzyme Corp.* | | | 842,161 |
| 8,500 | | ImClone Systems, Inc.* | | | 263,245 |
| 45,630 | | Millennium Pharmaceuticals, Inc.* | | | 422,990 |
|
| | | | | | 5,223,475 |
|
| Health Care Equipment & Supplies — 0.4% | | | |
| 5,600 | | Smith & Nephew PLC, Sponsored ADR | | | 276,696 |
|
| Health Care Providers & Services — 1.5% | | | |
| 1,280 | | Aetna, Inc. | | | 106,010 |
| 17,340 | | UnitedHealth Group, Inc. | | | 904,107 |
|
| | | | | | 1,010,117 |
|
| Pharmaceuticals — 6.7% | | | |
| 17,590 | | Forest Laboratories, Inc.* | | | 683,371 |
| 8,280 | | GlaxoSmithKline PLC, ADR | | | 401,663 |
| 16,630 | | Johnson & Johnson | | | 1,080,950 |
| 9,560 | | Novartis AG, ADR | | | 453,526 |
| 5,140 | | Novo-Nordisk A/S, Sponsored ADR | | | 261,986 |
| 45,652 | | Pfizer, Inc. | | | 1,259,082 |
| 9,850 | | Sanofi-Aventis, ADR | | | 403,752 |
|
| | | | | | 4,544,330 |
|
| | | TOTAL HEALTH CARE | | | 11,054,618 |
|
See Notes to Financial Statements.
23 Smith Barney Multiple Discipline Trust | 2005 Semi-Annual Report
| | |
| Schedules of Investments (unaudited) (continued) | | June 30, 2005 |
| | | | | |
| Multiple Discipline Portfolio — Global All Cap Growth and Value |
| | |
| SHARES | | SECURITY | | VALUE |
| INDUSTRIALS — 6.6% | | | |
| Aerospace & Defense — 1.6% | | | |
| 3,920 | | Boeing Co. | | $ | 258,720 |
| 7,270 | | L-3 Communications Holdings, Inc. | | | 556,737 |
| 7,000 | | Raytheon Co. | | | 273,840 |
|
| | | | | | 1,089,297 |
|
| Commercial Services & Supplies — 0.5% | | | |
| 5,850 | | Avery Dennison Corp. | | | 309,816 |
|
| Industrial Conglomerates — 3.8% | | | |
| 20,275 | | General Electric Co. | | | 702,529 |
| 9,395 | | Honeywell International, Inc. | | | 344,139 |
| 6,070 | | Hutchison Whampoa Ltd., ADR | | | 274,212 |
| 930 | | Textron, Inc. | | | 70,540 |
| 13,800 | | Tomkins PLC, Sponsored ADR | | | 262,476 |
| 31,680 | | Tyco International Ltd. | | | 925,056 |
|
| | | | | | 2,578,952 |
|
| Machinery — 0.7% | | | |
| 16,540 | | Pall Corp. | | | 502,154 |
|
| | | TOTAL INDUSTRIALS | | | 4,480,219 |
|
| INFORMATION TECHNOLOGY — 16.4% | | | |
| Communications Equipment — 2.3% | | | |
| 40,070 | | Cisco Systems, Inc.* | | | 765,738 |
| 9,950 | | Comverse Technology, Inc.* | | | 235,317 |
| 33,015 | | Nokia OYJ, Sponsored ADR | | | 549,370 |
|
| | | | | | 1,550,425 |
|
| Computers & Peripherals — 3.7% | | | |
| 20,080 | | Dell, Inc.* | | | 793,361 |
| 10,605 | | Hewlett-Packard Co. | | | 249,323 |
| 6,150 | | International Business Machines Corp. | | | 456,330 |
| 6,900 | | Lexmark International, Inc., Class A Shares* | | | 447,327 |
| 42,370 | | Maxtor Corp.* | | | 220,324 |
| 16,300 | | SanDisk Corp.* | | | 386,799 |
|
| | | | | | 2,553,464 |
|
| Electronic Equipment & Instruments — 0.8% | | | |
| 8,825 | | Mettler-Toledo International, Inc.* | | | 411,069 |
| 40,000 | | Solectron Corp.* | | | 151,600 |
|
| | | | | | 562,669 |
|
| Internet Software & Services — 1.2% | | | |
| 33,330 | | IAC/InterActiveCorp* | | | 801,587 |
|
| Office Electronics — 0.6% | | | |
| 7,410 | | Canon, Inc., Sponsored ADR | | | 389,988 |
|
| Semiconductors & Semiconductor Equipment — 4.3% | | | |
| 150 | | Cabot Microelectronics Corp.* | | | 4,349 |
| 9,830 | | Cree, Inc.* | | | 250,370 |
| 43,870 | | Intel Corp. | | | 1,143,252 |
See Notes to Financial Statements.
24 Smith Barney Multiple Discipline Trust | 2005 Semi-Annual Report
| | |
| Schedules of Investments (unaudited) (continued) | | June 30, 2005 |
| | | | | |
| Multiple Discipline Portfolio — Global All Cap Growth and Value |
| | |
| SHARES | | SECURITY | | VALUE |
| Semiconductors & Semiconductor Equipment — 4.3% (continued) | | | |
| 50,940 | | Micron Technology, Inc.* | | $ | 520,097 |
| 36,470 | | Texas Instruments, Inc. | | | 1,023,713 |
|
| | | | | | 2,941,781 |
|
| Software — 3.5% | | | |
| 13,760 | | Advent Software, Inc.* | | | 278,777 |
| 7,580 | | Autodesk, Inc. | | | 260,525 |
| 59,420 | | Microsoft Corp. | | | 1,475,993 |
| 9,420 | | SAP AG, Sponsored ADR | | | 407,886 |
|
| | | | | | 2,423,181 |
|
| | | TOTAL INFORMATION TECHNOLOGY | | | 11,223,095 |
|
| MATERIALS — 2.3% | | | |
| Chemicals — 1.3% | | | |
| 5,100 | | Air Products & Chemicals, Inc. | | | 307,530 |
| 3,950 | | BASF AG, Sponsored ADR | | | 260,700 |
| 8,670 | | BOC Group PLC, Sponsored ADR | | | 314,981 |
|
| | | | | | 883,211 |
|
| Construction Materials — 0.6% | | | |
| 15,390 | | CRH PLC, Sponsored ADR | | | 399,678 |
|
| Metals & Mining — 0.4% | | | |
| 2,120 | | Rio Tinto PLC, Sponsored ADR | | | 258,471 |
|
| | | TOTAL MATERIALS | | | 1,541,360 |
|
| TELECOMMUNICATION SERVICES — 3.7% | | | |
| Diversified Telecommunication Services — 2.1% | | | |
| 6,251 | | AT&T Corp. | | | 119,019 |
| 1,074 | | Liberty Global, Inc., Series A Shares* | | | 50,124 |
| 13,695 | | Nippon Telegraph & Telephone Corp., ADR | | | 294,032 |
| 15,060 | | SBC Communications, Inc. | | | 357,675 |
| 5,602 | | Telefonica SA, Sponsored ADR | | | 273,949 |
| 9,050 | | Verizon Communications, Inc. | | | 312,677 |
|
| | | | | | 1,407,476 |
|
| Wireless Telecommunication Services — 1.6% | | | |
| 13,400 | | Nextel Communications, Inc., Class A Shares* | | | 432,954 |
| 12,760 | | SK Telecom Co., Ltd., ADR | | | 260,304 |
| 16,175 | | Vodafone Group PLC, Sponsored ADR | | | 393,376 |
|
| | | | | | 1,086,634 |
|
| | | TOTAL TELECOMMUNICATION SERVICES | | | 2,494,110 |
|
| UTILITIES — 1.1% | | | |
| Electric Utilities — 0.4% | | | |
| 11,740 | | Endesa, SA, Sponsored ADR | | | 269,081 |
|
| Gas Utilities — 0.2% | | | |
| 70,950 | | Hong Kong & China Gas, Sponsored ADR | | | 144,383 |
|
See Notes to Financial Statements.
25 Smith Barney Multiple Discipline Trust | 2005 Semi-Annual Report
| | |
| Schedules of Investments (unaudited) (continued) | | June 30, 2005 |
| | | | | | |
| Multiple Discipline Portfolio — Global All Cap Growth and Value | |
| | |
| SHARES | | SECURITY | | VALUE | |
| Multi-Utilities — 0.5% | | | | |
| 7,500 | | Sempra Energy | | $ | 309,825 | |
|
|
| | | TOTAL UTILITIES | | | 723,289 | |
|
|
| | | TOTAL INVESTMENTS BEFORE SHORT-TERM INVESTMENT
(Cost — $59,179,802) | | | 62,525,941 | |
|
|
| | |
FACE
AMOUNT | | | | | |
| SHORT-TERM INVESTMENT — 8.8% | | | | |
| Repurchase Agreement — 8.8% | | | | |
| $5,978,000 | | State Street Bank & Trust Co., dated 6/30/05, 2.550% due 7/1/05; Proceeds at maturity — $5,978,423;
(Fully collateralized by U.S. Treasury Bond, 8.125% due 8/15/19; Market value — $6,110,315)
(Cost — $5,978,000) | | | 5,978,000 | |
|
|
| | | TOTAL INVESTMENTS — 100.6% (Cost — $65,157,802#) | | | 68,503,941 | |
| | | Liabilities in Excess of Other Assets — (0.6)% | | | (385,334 | ) |
|
|
| | | TOTAL NET ASSETS — 100.0% | | $ | 68,118,607 | |
|
|
| * | | Non-income producing security. |
| # | | Aggregate cost for Federal income tax purposes is substantially the same. |
Abbreviation used in this schedule:
ADR — American Depositary Receipt
See Notes to Financial Statements.
26 Smith Barney Multiple Discipline Trust | 2005 Semi-Annual Report
| | |
| Schedules of Investments (unaudited) (continued) | | June 30, 2005 |
| | | | | |
| Multiple Discipline Portfolio — Balanced All Cap Growth and Value |
FACE
AMOUNT | | SECURITY | | VALUE |
| U.S. GOVERNMENT & AGENCY OBLIGATIONS — 27.3% | | | |
| U.S. Government Agencies — 9.9% | | | |
| $11,300,000 | | Federal Home Loan Mortgage Corp., 5.500% due 7/15/06 | | $ | 11,498,688 |
| | | Federal National Mortgage Association: | | | |
| 2,615,000 | | 5.750% due 2/15/08 | | | 2,739,317 |
| 5,555,000 | | 3.375% due 12/15/08 | | | 5,462,793 |
|
| | | | | | 19,700,798 |
|
| U.S. Government Obligations — 17.4% | | | |
| | | U.S. Treasury Notes: | | | |
| 12,175,000 | | 5.875% due 11/15/05 | | | 12,292,002 |
| 9,400,000 | | 3.125% due 4/15/09 | | | 9,214,576 |
| 6,200,000 | | 5.000% due 2/15/11 | | | 6,589,199 |
| 2,640,000 | | 4.250% due 8/15/14 | | | 2,703,938 |
| | | Inflation Indexed Notes: | | | |
| 1,427,502 | | 0.875% due 4/15/10 | | | 1,392,708 |
| 2,580,375 | | 2.000% due 7/15/14 | | | 2,659,703 |
|
| | | | | | 34,852,126 |
|
| | | TOTAL U.S. GOVERNMENT & AGENCY OBLIGATIONS
(Cost — $54,829,468) | | | 54,552,924 |
|
| | |
| SHARES | | | | |
| COMMON STOCK — 68.0% | | | |
| CONSUMER DISCRETIONARY — 11.2% | | | |
| Hotels, Restaurants & Leisure — 0.4% | | | |
| 31,700 | | McDonald’s Corp. | | | 879,675 |
|
| Internet & Catalog Retail — 0.4% | | | |
| 24,000 | | Amazon.com, Inc.* | | | 793,920 |
|
| Leisure Equipment & Products — 0.9% | | | |
| 51,680 | | Hasbro, Inc. | | | 1,074,427 |
| 33,900 | | Mattel, Inc. | | | 620,370 |
|
| | | | | | 1,694,797 |
|
| Media — 7.3% | | | |
| 40,765 | | Cablevision Systems Corp., New York Group, Class A Shares* | | | 1,312,633 |
| 11,000 | | Clear Channel Communications, Inc. | | | 340,230 |
| 107,870 | | Comcast Corp., Special Class A Shares* | | | 3,230,707 |
| 30,000 | | Interpublic Group of Cos., Inc.* | | | 365,400 |
| 165,085 | | Liberty Media Corp., Series A Shares* | | | 1,682,216 |
| 60,820 | | News Corp., Class B Shares | | | 1,025,425 |
| 31,000 | | Pearson PLC, Sponsored ADR | | | 368,280 |
| 167,395 | | Time Warner, Inc.* | | | 2,797,171 |
| 27,000 | | Viacom, Inc., Class B Shares | | | 864,540 |
| 104,230 | | Walt Disney Co. | | | 2,624,511 |
|
| | | | | | 14,611,113 |
|
| Specialty Retail — 2.2% | | | |
| 23,500 | | Bed Bath & Beyond, Inc.* | | | 981,830 |
| 96,160 | | Charming Shoppes, Inc.* | | | 897,173 |
See Notes to Financial Statements.
27 Smith Barney Multiple Discipline Trust | 2005 Semi-Annual Report
| | |
| Schedules of Investments (unaudited) (continued) | | June 30, 2005 |
| | | | | |
| Multiple Discipline Portfolio — Balanced All Cap Growth and Value |
| | |
| SHARES | | SECURITY | | VALUE |
| Specialty Retail — 2.2% (continued) | | | |
| 65,505 | | Home Depot, Inc. | | $ | 2,548,144 |
|
| | | | | | 4,427,147 |
|
| | | TOTAL CONSUMER DISCRETIONARY | | | 22,406,652 |
|
| CONSUMER STAPLES — 5.0% | | | |
| Beverages — 2.3% | | | |
| 49,655 | | Coca-Cola Co. | | | 2,073,096 |
| 47,235 | | PepsiCo, Inc. | | | 2,547,384 |
|
| | | | | | 4,620,480 |
|
| Food & Staples Retailing — 0.4% | | | |
| 34,070 | | Safeway, Inc. | | | 769,641 |
|
| Food Products — 1.3% | | | |
| 36,000 | | Unilever PLC, Sponsored ADR | | | 1,398,600 |
| 18,390 | | Wm. Wrigley Jr. Co. | | | 1,265,967 |
|
| | | | | | 2,664,567 |
|
| Personal Products — 1.0% | | | |
| 37,530 | | Gillette Co. | | | 1,900,144 |
|
| | | TOTAL CONSUMER STAPLES | | | 9,954,832 |
|
| ENERGY — 4.8% | | | |
| Energy Equipment & Services — 1.6% | | | |
| 15,000 | | Baker Hughes, Inc. | | | 767,400 |
| 17,760 | | GlobalSantaFe Corp. | | | 724,608 |
| 18,375 | | Grant Prideco, Inc.* | | | 486,019 |
| 23,520 | | Weatherford International Ltd.* | | | 1,363,689 |
|
| | | | | | 3,341,716 |
|
| Oil, Gas & Consumable Fuels — 3.2% | | | |
| 12,740 | | Anadarko Petroleum Corp. | | | 1,046,591 |
| 16,450 | | BP PLC, Sponsored ADR | | | 1,026,151 |
| 17,300 | | Chevron Corp. | | | 967,416 |
| 29,355 | | Exxon Mobil Corp. | | | 1,687,032 |
| 14,920 | | Murphy Oil Corp. | | | 779,272 |
| 44,850 | | Williams Cos., Inc. | | | 852,150 |
|
| | | | | | 6,358,612 |
|
| | | TOTAL ENERGY | | | 9,700,328 |
|
| FINANCIALS — 9.9% | | | |
| Diversified Financial Services — 4.9% | | | |
| 25,085 | | American Express Co. | | | 1,335,275 |
| 31,625 | | Bank of New York Co., Inc. | | | 910,167 |
| 38,554 | | JPMorgan Chase & Co. | | | 1,361,727 |
| 17,285 | | Lehman Brothers Holdings, Inc. | | | 1,716,055 |
| 38,990 | | MBNA Corp. | | | 1,019,978 |
| 36,460 | | Merrill Lynch & Co., Inc. | | | 2,005,665 |
| 15,000 | | Morgan Stanley | | | 787,050 |
| 16,380 | | State Street Corp. | | | 790,335 |
|
| | | | | | 9,926,252 |
|
See Notes to Financial Statements.
28 Smith Barney Multiple Discipline Trust | 2005 Semi-Annual Report
| | |
| Schedules of Investments (unaudited) (continued) | | June 30, 2005 |
| | | | | |
| Multiple Discipline Portfolio — Balanced All Cap Growth and Value |
| | |
| SHARES | | SECURITY | | VALUE |
| Insurance — 5.0% | | | |
| 13,425 | | Ambac Financial Group, Inc. | | $ | 936,528 |
| 71,550 | | American International Group, Inc. | | | 4,157,055 |
| 355 | | Berkshire Hathaway, Inc., Class B Shares* | | | 988,143 |
| 20,310 | | Chubb Corp. | | | 1,738,739 |
| 21,865 | | MGIC Investment Corp. | | | 1,426,035 |
| 18,000 | | PMI Group, Inc. | | | 701,640 |
|
| | | | | | 9,948,140 |
|
| | | TOTAL FINANCIALS | | | 19,874,392 |
|
| HEALTH CARE — 13.8% | | | |
| Biotechnology — 6.3% | | | |
| 1,690 | | Alkermes, Inc.* | | | 22,342 |
| 40,000 | | Amgen, Inc.* | | | 2,418,400 |
| 86,955 | | Biogen Idec, Inc.* | | | 2,995,600 |
| 52,545 | | Chiron Corp.* | | | 1,833,295 |
| 16,350 | | Genentech, Inc.* | | | 1,312,578 |
| 40,025 | | Genzyme Corp.* | | | 2,405,102 |
| 17,500 | | ImClone Systems, Inc.* | | | 541,975 |
| 109,150 | | Millennium Pharmaceuticals, Inc.* | | | 1,011,820 |
|
| | | | | | 12,541,112 |
|
| Health Care Equipment & Supplies — 0.2% | | | |
| 15,000 | | Boston Scientific Corp.* | | | 405,000 |
|
| Health Care Providers & Services — 1.0% | | | |
| 38,280 | | UnitedHealth Group, Inc. | | | 1,995,919 |
|
| Pharmaceuticals — 6.3% | | | |
| 27,910 | | Abbott Laboratories | | | 1,367,869 |
| 36,360 | | Forest Laboratories, Inc.* | | | 1,412,586 |
| 22,350 | | GlaxoSmithKline PLC, ADR | | | 1,084,199 |
| 44,875 | | Johnson & Johnson | | | 2,916,875 |
| 15,000 | | Novartis AG, ADR | | | 711,600 |
| 131,173 | | Pfizer, Inc. | | | 3,617,751 |
| 32,695 | | Wyeth | | | 1,454,928 |
|
| | | | | | 12,565,808 |
|
| | | TOTAL HEALTH CARE | | | 27,507,839 |
|
| INDUSTRIALS — 6.1% | | | |
| Aerospace & Defense — 1.2% | | | |
| 14,210 | | L-3 Communications Holdings, Inc. | | | 1,088,202 |
| 32,815 | | Raytheon Co. | | | 1,283,722 |
|
| | | | | | 2,371,924 |
|
| Airlines — 0.4% | | | |
| 51,800 | | Southwest Airlines Co. | | | 721,574 |
|
| Electrical Equipment — 0.7% | | | |
| 21,755 | | Emerson Electric Co. | | | 1,362,516 |
|
| Industrial Conglomerates — 2.8% | | | |
| 47,510 | | General Electric Co. | | | 1,646,222 |
| 35,500 | | Honeywell International, Inc. | | | 1,300,365 |
See Notes to Financial Statements.
29 Smith Barney Multiple Discipline Trust | 2005 Semi-Annual Report
| | |
| Schedules of Investments (unaudited) (continued) | | June 30, 2005 |
| | | | | |
| Multiple Discipline Portfolio — Balanced All Cap Growth and Value |
| | |
| SHARES | | SECURITY | | VALUE |
| Industrial Conglomerates — 2.8% (continued) | | | |
| 90,950 | | Tyco International Ltd. | | $ | 2,655,740 |
|
| | | | | | 5,602,327 |
|
| Machinery — 1.0% | | | |
| 10,415 | | Caterpillar, Inc. | | | 992,654 |
| 36,090 | | Pall Corp. | | | 1,095,692 |
|
| | | | | | 2,088,346 |
|
| | | TOTAL INDUSTRIALS | | | 12,146,687 |
|
| INFORMATION TECHNOLOGY — 13.4% | | | |
| Communications Equipment — 2.1% | | | |
| 120,010 | | Cisco Systems, Inc.* | | | 2,293,391 |
| 125,000 | | Lucent Technologies, Inc.* | | | 363,750 |
| 45,115 | | Motorola, Inc. | | | 823,800 |
| 46,740 | | Nokia OYJ, Sponsored ADR | | | 777,754 |
|
| | | | | | 4,258,695 |
|
| Computers & Peripherals — 2.0% | | | |
| 41,230 | | Dell, Inc.* | | | 1,628,997 |
| 15,450 | | Electronics for Imaging, Inc.* | | | 325,068 |
| 10,360 | | International Business Machines Corp. | | | 768,712 |
| 101,085 | | Maxtor Corp.* | | | 525,642 |
| 33,860 | | SanDisk Corp.* | | | 803,498 |
|
| | | | | | 4,051,917 |
|
| Electronic Equipment & Instruments — 0.7% | | | |
| 32,275 | | Agilent Technologies, Inc.* | | | 742,970 |
| 180,540 | | Solectron Corp.* | | | 684,247 |
|
| | | | | | 1,427,217 |
|
| Internet Software & Services — 1.0% | | | |
| 79,190 | | IAC/InterActiveCorp* | | | 1,904,519 |
|
| Semiconductors & Semiconductor Equipment — 5.0% | | | |
| 47,500 | | Applied Materials, Inc. | | | 768,550 |
| 505 | | Cabot Microelectronics Corp.* | | | 14,640 |
| 21,215 | | Cree, Inc.* | | | 540,346 |
| 104,790 | | Intel Corp. | | | 2,730,827 |
| 106,840 | | Micron Technology, Inc.* | | | 1,090,836 |
| 124,221 | | Taiwan Semiconductor Manufacturing Co., Ltd., Sponsored ADR | | | 1,132,896 |
| 130,900 | | Texas Instruments, Inc. | | | 3,674,363 |
|
| | | | | | 9,952,458 |
|
| Software — 2.6% | | | |
| 27,890 | | Advent Software, Inc.* | | | 565,051 |
| 18,740 | | Autodesk, Inc. | | | 644,094 |
| 65,000 | | Micromuse, Inc.* | | | 367,900 |
| 143,740 | | Microsoft Corp. | | | 3,570,502 |
| 4,140 | | RealNetworks, Inc.* | | | 20,576 |
|
| | | | | | 5,168,123 |
|
| | | TOTAL INFORMATION TECHNOLOGY | | | 26,762,929 |
|
See Notes to Financial Statements.
30 Smith Barney Multiple Discipline Trust | 2005 Semi-Annual Report
| | |
| Schedules of Investments (unaudited) (continued) | | June 30, 2005 |
| | | | | |
| Multiple Discipline Portfolio — Balanced All Cap Growth and Value |
| | |
| SHARES | | SECURITY | | VALUE |
| MATERIALS — 2.4% | | | |
| Chemicals — 1.2% | | | |
| 5,000 | | Dow Chemical Co. | | $ | 222,650 |
| 17,500 | | E.I. du Pont de Nemours and Co. | | | 752,675 |
| 49,080 | | Engelhard Corp. | | | 1,401,234 |
|
| | | | | | 2,376,559 |
|
| Metals & Mining — 0.6% | | | |
| 45,125 | | Alcoa, Inc. | | | 1,179,116 |
|
| Paper & Forest Products — 0.6% | | | |
| 18,340 | | Weyerhaeuser Co. | | | 1,167,341 |
|
| | | TOTAL MATERIALS | | | 4,723,016 |
|
| TELECOMMUNICATION SERVICES — 1.4% | | | |
| Diversified Telecommunication Services — 1.0% | | | |
| 3,554 | | Liberty Global, Inc., Series A Shares* | | | 165,865 |
| 40,230 | | SBC Communications, Inc. | | | 955,463 |
| 29,570 | | Verizon Communications, Inc. | | | 1,021,643 |
|
| | | | | | 2,142,971 |
|
| Wireless Telecommunication Services — 0.4% | | | |
| 32,070 | | Vodafone Group PLC, Sponsored ADR | | | 779,943 |
|
| | | TOTAL TELECOMMUNICATION SERVICES | | | 2,922,914 |
|
| | | TOTAL COMMON STOCK
(Cost — $126,572,899) | | | 135,999,589 |
|
| | | TOTAL INVESTMENTS BEFORE SHORT-TERM INVESTMENT
(Cost — $181,402,367) | | | 190,552,513 |
|
| | |
FACE
AMOUNT | | | | |
| SHORT-TERM INVESTMENT — 4.4% | | | |
| Repurchase Agreement — 4.4% | | | |
| $8,763,000 | | State Street Bank & Trust Co., dated 6/30/05, 2.550% due 7/1/05, Proceeds at maturity — $8,763,621; (Fully collateralized by U.S. Treasury Bonds, 8.125% due 8/15/19; Market value — $8,948,795)
(Cost — $8,763,000) | | | 8,763,000 |
|
| | | TOTAL INVESTMENTS — 99.7% (Cost — $190,165,367#) | | | 199,315,513 |
| | | Other Assets in Excess of Liabilities — 0.3% | | | 524,192 |
|
| | | TOTAL NET ASSETS — 100.0% | | $ | 199,839,705 |
|
| * | | Non-income producing security. |
| # | | Aggregate cost for Federal income tax purposes is substantially the same. |
Abbreviation used in this schedule:
ADR — American Depositary Receipt
See Notes to Financial Statements.
31 Smith Barney Multiple Discipline Trust | 2005 Semi-Annual Report
| | |
| Statement of Assets and Liabilities (unaudited) | | June 30, 2005 |
| | | | | | | | | | | | |
| | | All Cap
Growth and Value | | Large Cap
Growth and Value | | Global All Cap
Growth and Value | | Balanced All Cap
Growth and Value |
| ASSETS: | | | | | | | | | | | | |
Investments, at cost | | $ | 249,785,425 | | $ | 32,476,639 | | $ | 65,157,802 | | $ | 190,165,367 |
|
Investments, at value | | $ | 267,812,361 | | $ | 34,047,651 | | $ | 68,503,941 | | $ | 199,315,513 |
Cash | | | 907 | | | 324 | | | 1,447 | | | 1,506 |
Dividends and interest receivable | | | 233,102 | | | 34,413 | | | 88,106 | | | 813,590 |
Receivable for Fund shares sold | | | — | | | — | | | 49,558 | | | 601,583 |
Receivable for securities sold | | | — | | | 15,678 | | | — | | | — |
|
Total Assets | | | 268,046,370 | | | 34,098,066 | | | 68,643,052 | | | 200,732,192 |
|
| LIABILITIES: | | | | | | | | | | | | |
Payable for securities purchased | | | 1,641,932 | | | 138,807 | | | 451,434 | | | 722,037 |
Payable for Fund shares repurchased | | | 171,061 | | | 23,019 | | | 3,110 | | | — |
Management fees payable | | | 165,479 | | | 20,799 | | | 41,104 | | | 122,660 |
Distribution fees payable | | | 7,708 | | | — | | | — | | | 5,749 |
Trustees’ fees payable | | | 1,291 | | | 898 | | | 969 | | | 625 |
Transfer agent fees payable | | | 833 | | | 833 | | | 833 | | | 833 |
Accrued expenses | | | 50,559 | | | 28,311 | | | 26,995 | | | 40,583 |
|
Total Liabilities | | | 2,038,863 | | | 212,667 | | | 524,445 | | | 892,487 |
|
Total Net Assets | | $ | 266,007,507 | | $ | 33,885,399 | | $ | 68,118,607 | | $ | 199,839,705 |
|
| NET ASSETS: | | | | | | | | | | | | |
Par value (Note 4) | | $ | 18,273 | | $ | 2,388 | | $ | 4,497 | | $ | 15,325 |
Paid-in capital in excess of par value | | | 246,551,926 | | | 32,010,783 | | | 64,366,765 | | | 189,175,423 |
Undistributed net investment income | | | 500,779 | | | 113,420 | | | 254,113 | | | 1,265,847 |
Accumulated net realized gain on investment transactions | | | 909,593 | | | 187,796 | | | 147,093 | | | 232,964 |
Net unrealized appreciation of investments | | | 18,026,936 | | | 1,571,012 | | | 3,346,139 | | | 9,150,146 |
|
Total Net Assets | | $ | 266,007,507 | | $ | 33,885,399 | | $ | 68,118,607 | | $ | 199,839,705 |
|
Shares Outstanding | | | 18,273,162 | | | 2,387,904 | | | 4,497,001 | | | 15,324,899 |
|
Net Asset Value | | | $14.56 | | | $14.19 | | | $15.15 | | | $13.04 |
|
See Notes to Financial Statements.
32 Smith Barney Multiple Discipline Trust | 2005 Semi-Annual Report
| | |
| Statement of Operations (unaudited) | | For the Six Months Ended June 30, 2005 |
| | | | | | | | | | | | | | | | |
| | | All Cap
Growth
and Value | | | Large Cap
Growth
and Value | | | Global All Cap
Growth
and Value | | | Balanced All Cap
Growth
and Value | |
| INVESTMENT INCOME: | | | | | | | | | | | | | | | | |
Dividends | | $ | 1,402,119 | | | $ | 234,522 | | | $ | 438,129 | | | $ | 733,672 | |
Interest | | | 332,461 | | | | 33,103 | | | | 89,937 | | | | 1,429,343 | |
Less: Foreign taxes withheld | | | (20,307 | ) | | | (4,883 | ) | | | (21,513 | ) | | | (10,596 | ) |
|
|
Total Investment Income | | | 1,714,273 | | | | 262,742 | | | | 506,553 | | | | 2,152,419 | |
|
|
| EXPENSES: | | | | | | | | | | | | | | | | |
Management fees (Note 2) | | | 954,774 | | | | 116,002 | | | | 216,580 | | | | 693,274 | |
Distribution fees (Note 2) | | | 318,258 | | | | 38,667 | | | | 72,193 | | | | 231,091 | |
Shareholder reports | | | 19,082 | | | | 2,666 | | | | 4,589 | | | | 10,531 | |
Trustees’ fees | | | 16,668 | | | | 3,121 | | | | 4,378 | | | | 11,985 | |
Custody | | | 12,020 | | | | 6,512 | | | | 8,371 | | | | 10,185 | |
Audit and tax | | | 10,069 | | | | 11,504 | | | | 11,239 | | | | 11,654 | |
Legal fees | | | 4,574 | | | | 4,429 | | | | 4,113 | | | | 4,353 | |
Transfer agent fees (Note 2) | | | 2,539 | | | | 2,485 | | | | 2,485 | | | | 2,484 | |
Miscellaneous expense | | | 898 | | | | 2,276 | | | | 2,365 | | | | 1,711 | |
|
|
Total Expenses | | | 1,338,882 | | | | 187,662 | | | | 326,313 | | | | 977,268 | |
Less: Distribution fees waiver (Note 2) | | | (127,303 | ) | | | (38,667 | ) | | | (72,193 | ) | | | (92,437 | ) |
|
|
Net Expenses | | | 1,211,579 | | | | 148,995 | | | | 254,120 | | | | 884,831 | |
|
|
Net Investment Income | | | 502,694 | | | | 113,747 | | | | 252,433 | | | | 1,267,588 | |
|
|
| REALIZED AND UNREALIZED GAIN/(LOSS) ON INVESTMENTS (NOTES 1 AND 3): | | | | | | | | | | | | | | | | |
Net Realized Gain From Investments Transactions | | | 3,440,600 | | | | 355,203 | | | | 273,821 | | | | 1,585,195 | |
Change in Net Unrealized Appreciation/Depreciation
From Investments | | | (8,208,789 | ) | | | (834,857 | ) | | | (1,380,020 | ) | | | (4,409,412 | ) |
|
|
Net Loss on Investments | | | (4,768,189 | ) | | | (479,654 | ) | | | (1,106,199 | ) | | | (2,824,217 | ) |
|
|
Decrease in Net Assets From Operations | | $ | (4,265,495 | ) | | $ | (365,907 | ) | | $ | (853,766 | ) | | $ | (1,556,629 | ) |
|
|
See Notes to Financial Statements.
33 Smith Barney Multiple Discipline Trust | 2005 Semi-Annual Report
| | |
| Statements of Changes in Net Assets | | |
For the Six Months Ended June 30, 2005 (unaudited)
and the Year Ended December 31, 2004
| | | | | | | | |
| All Cap Growth and Value | | 2005 | | | 2004 | |
| OPERATIONS: | | | | | | | | |
Net investment income | | $ | 502,694 | | | $ | 726,237 | |
Net realized gain (loss) | | | 3,440,600 | | | | (1,633,787 | ) |
Change in net unrealized appreciation/depreciation | | | (8,208,789 | ) | | | 14,657,487 | |
|
|
Increase (Decrease) in Net Assets From Operations | | | (4,265,495 | ) | | | 13,749,937 | |
|
|
| DISTRIBUTIONS TO SHAREHOLDERS FROM (NOTE 1): | | | | | | | | |
Net investment income | | | — | | | | (749,787 | ) |
Net realized gains | | | — | | | | (875,440 | ) |
|
|
Decrease in Net Assets From Distributions to Shareholders | | | — | | | | (1,625,227 | ) |
|
|
| FUND SHARE TRANSACTIONS (NOTE 4): | | | | | | | | |
Net proceeds from sale of shares | | | 34,441,514 | | | | 134,343,764 | |
Reinvestment of distributions | | | — | | | | 1,625,227 | |
Cost of shares repurchased | | | (10,510,851 | ) | | | (5,520,042 | ) |
|
|
Increase in Net Assets From Fund Share Transactions | | | 23,930,663 | | | | 130,448,949 | |
|
|
Increase in Net Assets | | | 19,665,168 | | | | 142,573,659 | |
| | |
| NET ASSETS: | | | | | | | | |
Beginning of period | | | 246,342,339 | | | | 103,768,680 | |
|
|
End of period* | | $ | 266,007,507 | | | $ | 246,342,339 | |
|
|
* Includes undistributed (overdistributed) net investment income of: | | | $500,779 | | | | $(1,915 | ) |
|
|
See Notes to Financial Statements.
34 Smith Barney Multiple Discipline Trust | 2005 Semi-Annual Report
| | |
| Statements of Changes in Net Assets (continued) | | |
For the Six Months Ended June 30, 2005 (unaudited)
and the Year Ended December 31, 2004
| | | | | | | | |
| Large Cap Growth and Value | | 2005 | | | 2004 | |
| OPERATIONS: | | | | | | | | |
Net investment income | | $ | 113,747 | | | $ | 203,052 | |
Net realized gain | | | 355,203 | | | | 109,032 | |
Change in net unrealized appreciation/depreciation | | | (834,857 | ) | | | 1,219,735 | |
|
|
Increase (Decrease) in Net Assets From Operations | | | (365,907 | ) | | | 1,531,819 | |
|
|
| DISTRIBUTIONS TO SHAREHOLDERS FROM (NOTE 1): | | | | | | | | |
Net investment income | | | — | | | | (205,208 | ) |
Net realized gains | | | — | | | | (276,439 | ) |
|
|
Decrease in Net Assets From Distributions to Shareholders | | | — | | | | (481,647 | ) |
|
|
| FUND SHARE TRANSACTIONS (NOTE 4): | | | | | | | | |
Net proceeds from sale of shares | | | 8,219,942 | | | | 16,287,963 | |
Reinvestment of distributions | | | — | | | | 481,647 | |
Cost of shares repurchased | | | (1,552,939 | ) | | | (1,046,185 | ) |
|
|
Increase in Net Assets From Fund Share Transactions | | | 6,667,003 | | | | 15,723,425 | |
|
|
Increase in Net Assets | | | 6,301,096 | | | | 16,773,597 | |
| | |
| NET ASSETS: | | | | | | | | |
Beginning of period | | | 27,584,303 | | | | 10,810,706 | |
|
|
End of period* | | $ | 33,885,399 | | | $ | 27,584,303 | |
|
|
* Includes undistributed (overdistributed) net investment income of: | | | $113,420 | | | | $(327 | ) |
|
|
See Notes to Financial Statements.
35 Smith Barney Multiple Discipline Trust | 2005 Semi-Annual Report
| | |
| Statements of Changes in Net Assets (continued) | | |
For the Six Months Ended June 30, 2005 (unaudited)
and the Year Ended December 31, 2004
| | | | | | | | |
| Global All Cap Growth and Value | | 2005 | | | 2004 | |
| OPERATIONS: | | | | | | | | |
Net investment income | | $ | 252,433 | | | $ | 208,337 | |
Net realized gain | | | 273,821 | | | | 26,704 | |
Change in net unrealized appreciation/depreciation | | | (1,380,020 | ) | | | 3,436,625 | |
|
|
Increase (Decrease) in Net Assets From Operations | | | (853,766 | ) | | | 3,671,666 | |
|
|
| DISTRIBUTIONS TO SHAREHOLDERS FROM (NOTE 1): | | | | | | | | |
Net investment income | | | — | | | | (207,818 | ) |
Net realized gains | | | — | | | | (156,298 | ) |
|
|
Decrease in Net Assets From Distributions to Shareholders | | | — | | | | (364,116 | ) |
|
|
| FUND SHARE TRANSACTIONS (NOTE 4): | | | | | | | | |
Net proceeds from sale of shares | | | 21,168,102 | | | | 35,881,368 | |
Reinvestment of distributions | | | — | | | | 364,116 | |
Cost of shares repurchased | | | (1,576,384 | ) | | | (1,146,203 | ) |
|
|
Increase in Net Assets From Fund Share Transactions | | | 19,591,718 | | | | 35,099,281 | |
|
|
Increase in Net Assets | | | 18,737,952 | | | | 38,406,831 | |
| | |
| NET ASSETS: | | | | | | | | |
Beginning of period | | | 49,380,655 | | | | 10,973,824 | |
|
|
End of period* | | $ | 68,118,607 | | | $ | 49,380,655 | |
|
|
* Includes undistributed net investment income of: | | | $254,113 | | | | $1,680 | |
|
|
See Notes to Financial Statements.
36 Smith Barney Multiple Discipline Trust | 2005 Semi-Annual Report
| | |
| Statements of Changes in Net Assets (continued) | | |
For the Six Months Ended June 30, 2005 (unaudited)
and the Year Ended December 31, 2004
| | | | | | | | |
| Balanced All Cap Growth and Value | | 2005 | | | 2004 | |
| OPERATIONS: | | | | | | | | |
Net investment income | | $ | 1,267,588 | | | $ | 1,366,383 | |
Net realized gain (loss) | | | 1,585,195 | | | | (955,811 | ) |
Change in net unrealized appreciation/depreciation | | | (4,409,412 | ) | | | 7,101,829 | |
|
|
Increase (Decrease) in Net Assets From Operations | | | (1,556,629 | ) | | | 7,512,401 | |
|
|
| DISTRIBUTIONS TO SHAREHOLDERS FROM (NOTE 1): | | | | | | | | |
Net investment income | | | — | | | | (1,378,563 | ) |
Net realized gains | | | — | | | | (383,808 | ) |
|
|
Decrease in Net Assets From Distributions to Shareholders | | | — | | | | (1,762,371 | ) |
|
|
| FUND SHARE TRANSACTIONS (NOTE 4): | | | | | | | | |
Net proceeds from sale of shares | | | 33,542,186 | | | | 95,804,409 | |
Reinvestment of distributions | | | — | | | | 1,762,371 | |
Cost of shares repurchased | | | (7,068,066 | ) | | | (6,182,607 | ) |
|
|
Increase in Net Assets From Fund Share Transactions | | | 26,474,120 | | | | 91,384,173 | |
|
|
Increase in Net Assets | | | 24,917,491 | | | | 97,134,203 | |
| | |
| NET ASSETS: | | | | | | | | |
Beginning of period | | | 174,922,214 | | | | 77,788,011 | |
|
|
End of period* | | $ | 199,839,705 | | | $ | 174,922,214 | |
|
|
* Includes undistributed (overdistributed) net investment income of: | | | $1,265,847 | | | | $(1,741 | ) |
|
|
See Notes to Financial Statements.
37 Smith Barney Multiple Discipline Trust | 2005 Semi-Annual Report
For a share of each class of beneficial interest outstanding throughout each year ended December 31, unless otherwise noted:
| | | | | | | | | | | | |
| All Cap Growth and Value | | 2005(1) | | | 2004 | | | 2003(2) | | | 2002(2)(3) | |
Net Asset Value, Beginning of Period | | $14.82 | | | $13.99 | | | $10.65 | | | $10.00 | |
|
|
Income (Loss) From Operations: | | | | | | | | | | | | |
Net investment income | | 0.03 | | | 0.04 | | | 0.02 | | | 0.01 | |
Net realized and unrealized gain (loss) | | (0.29 | ) | | 0.89 | | | 3.33 | | | 0.64 | |
|
|
Total Income (Loss) From Operations | | (0.26 | ) | | 0.93 | | | 3.35 | | | 0.65 | |
|
|
Less Distributions From: | | | | | | | | | | | | |
Net investment income | | — | | | (0.05 | ) | | (0.01 | ) | | — | |
Net realized gains | | — | | | (0.05 | ) | | (0.00 | )(4) | | — | |
|
|
Total Distributions | | — | | | (0.10 | ) | | (0.01 | ) | | — | |
|
|
Net Asset Value, End of Period | | $14.56 | | | $14.82 | | | $13.99 | | | $10.65 | |
|
|
Total Return(5) | | (1.75 | )% | | 6.64 | % | | 31.44 | % | | 6.50 | % |
|
|
Net Assets, End of Period (000s) | | $266,008 | | | $246,342 | | | $103,769 | | | $3,330 | |
|
|
Ratios to Average Net Assets: | | | | | | | | | | | | |
Gross expenses | | 1.05 | %(6) | | 1.07 | % | | 1.31 | % | | 21.24 | %(6) |
Net expenses(8) | | 0.95 | (6) | | 0.95 | | | 1.00 | (7) | | 1.00 | (6)(7) |
Net investment income | | 0.39 | (6) | | 0.43 | | | 0.17 | | | 0.49 | (6) |
|
|
Portfolio Turnover Rate | | 7 | % | | 9 | % | | 3 | % | | 2 | % |
|
|
| (1) | | For the six months ended June 30, 2005 (unaudited). |
| (2) | | Per share amounts have been calculated using the average shares method. |
| (3) | | For the period October 1, 2002 (commencement of operations) to December 31, 2002. |
| (4) | | Amount represents less than $0.01 per share. |
| (5) | | Performance figures may reflect voluntary fee waivers and/or expense reimbursements. Past performance is no guarantee of future results. In the absence of voluntary fee waivers and/or expense reimbursements, the total return would be lower. Total returns do not reflect expenses associated with the separate accounts such as administrative fees, account charges and surrender charges which, if reflected, would reduce the total return for all periods shown. Total returns for periods of less than one year are not annualized. |
| (7) | | As a result of a voluntary expense limitation, the ratio of expenses to average net assets of the fund will not exceed 1.00%. |
| (8) | | The manager and distributor have voluntarily waived a portion of its fees. |
See Notes to Financial Statements.
38 Smith Barney Multiple Discipline Trust | 2005 Semi-Annual Report
| | |
| Financial Highlights (continued) | | |
For a share of each class of beneficial interest outstanding throughout each year ended December 31, unless otherwise noted:
| | | | | | | | | | | | |
| Large Cap Growth and Value | | 2005(1) | | | 2004 | | | 2003(2) | | | 2002(2)(3) | |
Net Asset Value, Beginning of Period | | $14.41 | | | $13.74 | | | $10.73 | | | $10.00 | |
|
|
Income (Loss) From Operations: | | | | | | | | | | | | |
Net investment income | | 0.05 | | | 0.11 | | | 0.02 | | | 0.01 | |
Net realized and unrealized gain (loss) | | (0.27 | ) | | 0.82 | | | 3.09 | | | 0.72 | |
|
|
Total Income (Loss) From Operations | | (0.22 | ) | | 0.93 | | | 3.11 | | | 0.73 | |
|
|
Less Distributions From: | | | | | | | | | | | | |
Net investment income | | — | | | (0.11 | ) | | (0.03 | ) | | — | |
Net realized gains | | — | | | (0.15 | ) | | (0.07 | ) | | — | |
|
|
Total Distributions | | — | | | (0.26 | ) | | (0.10 | ) | | — | |
|
|
Net Asset Value, End of Period | | $14.19 | | | $14.41 | | | $13.74 | | | $10.73 | |
|
|
Total Return(4) | | (1.53 | )% | | 6.75 | % | | 29.00 | % | | 7.30 | % |
|
|
Net Assets, End of Period (000s) | | $33,885 | | | $27,584 | | | $10,811 | | | $436 | |
|
|
Ratios to Average Net Assets: | | | | | | | | | | | | |
Gross expenses | | 1.21 | %(5) | | 1.36 | % | | 2.35 | % | | 119.99 | %(5) |
Net expenses(7) | | 0.96 | (5) | | 1.00 | (6) | | 1.00 | (6) | | 1.00 | (5)(6) |
Net investment income | | 0.74 | (5) | | 1.12 | | | 0.62 | | | 0.69 | (5) |
|
|
Portfolio Turnover Rate | | 12 | % | | 16 | % | | 5 | % | | 3 | % |
|
|
| (1) | | For the six months ended June 30, 2005 (unaudited). |
| (2) | | Per share amounts have been calculated using the average shares method. |
| (3) | | For the period October 1, 2002 (commencement of operations) to December 31, 2002. |
| (4) | | Performance figures may reflect voluntary fee waivers and/or expense reimbursements. Past performance is no guarantee of future results. In the absence of voluntary fee waivers and/or expense reimbursements, the total return would be lower. Total returns do not reflect expenses associated with the separate accounts such as administrative fees, account charges and surrender charges which, if reflected, would reduce the total return for all periods shown. Total returns for periods of less than one year are not annualized. |
| (6) | | As a result of a voluntary expense limitation, the ratio of expenses to average net assets of the fund will not exceed 1.00%. |
| (7) | | The manager and distributor have voluntarily waived all or a portion of its fees. |
See Notes to Financial Statements.
39 Smith Barney Multiple Discipline Trust | 2005 Semi-Annual Report
| | |
| Financial Highlights (continued) | | |
For a share of each class of beneficial interest outstanding throughout each year ended December 31, unless otherwise noted:
| | | | | | | | | | | | |
| Global All Cap Growth and Value | | 2005(1) | | | 2004 | | | 2003(2) | | | 2002(2)(3) | |
Net Asset Value, Beginning of Period | | $15.44 | | | $14.11 | | | $10.78 | | | $10.00 | |
|
|
Income (Loss) From Operations: | | | | | | | | | | | | |
Net investment income | | 0.06 | | | 0.07 | | | 0.04 | | | 0.01 | |
Net realized and unrealized gain (loss) | | (0.35 | ) | | 1.38 | | | 3.36 | | | 0.77 | |
|
|
Total Income (Loss) From Operations | | (0.29 | ) | | 1.45 | | | 3.40 | | | 0.78 | |
|
|
Less Distributions From: | | | | | | | | | | | | |
Net investment income | | — | | | (0.07 | ) | | (0.02 | ) | | — | |
Net realized gains | | — | | | (0.05 | ) | | (0.05 | ) | | — | |
|
|
Total Distributions | | — | | | (0.12 | ) | | (0.07 | ) | | — | |
|
|
Net Asset Value, End of Period | | $15.15 | | | $15.44 | | | $14.11 | | | $10.78 | |
|
|
Total Return(4) | | (1.88 | )% | | 10.25 | % | | 31.55 | % | | 7.80 | % |
|
|
Net Assets, End of Period (000s) | | $68,119 | | | $49,381 | | | $10,974 | | | $1,003 | |
|
|
Ratios to Average Net Assets: | | | | | | | | | | | | |
Gross expenses | | 1.13 | %(5) | | 1.28 | % | | 2.56 | % | | 52.11 | %(5) |
Net expenses(7) | | 0.88 | (5) | | 1.00 | (6) | | 1.00 | (6) | | 1.00 | (5)(6) |
Net investment income | | 0.87 | (5) | | 0.75 | | | 0.36 | | | 0.38 | (5) |
|
|
Portfolio Turnover Rate | | 5 | % | | 10 | % | | 6 | % | | 2 | % |
|
|
| (1) | | For the six months ended June 30, 2005 (unaudited). |
| (2) | | Per share amounts have been calculated using the average shares method. |
| (3) | | For the period October 1, 2002 (commencement of operations) to December 31, 2002. |
| (4) | | Performance figures may reflect voluntary fee waivers and/or expense reimbursements. Past performance is no guarantee of future results. In the absence of voluntary fee waivers and/or expense reimbursements, the total return would be lower. Total returns do not reflect expenses associated with the separate accounts such as administrative fees, account charges and surrender charges which, if reflected, would reduce the total return for all periods shown. Total returns for periods of less than one year are not annualized. |
| (6) | | As a result of a voluntary expense limitation, the ratio of expenses to average net assets of the fund will not exceed 1.00%. |
| (7) | | The manager and distributor have voluntarily waived all or a portion of its fees. |
See Notes to Financial Statements.
40 Smith Barney Multiple Discipline Trust | 2005 Semi-Annual Report
| | |
| Financial Highlights (continued) | | |
For a share of each class of beneficial interest outstanding throughout each year ended December 31, unless otherwise noted:
| | | | | | | | | | | | |
| Balanced All Cap Growth and Value | | 2005(1) | | | 2004 | | | 2003(2) | | | 2002(2)(3) | |
Net Asset Value, Beginning of Period | | $13.17 | | | $12.67 | | | $10.42 | | | $10.00 | |
|
|
Income (Loss) From Operations: | | | | | | | | | | | | |
Net investment income | | 0.08 | | | 0.10 | | | 0.08 | | | 0.02 | |
Net realized and unrealized gain (loss) | | (0.21 | ) | | 0.54 | | | 2.20 | | | 0.40 | |
|
|
Total Income (Loss) From Operations | | (0.13 | ) | | 0.64 | | | 2.28 | | | 0.42 | |
|
|
Less Distributions From: | | | | | | | | | | | | |
Net investment income | | — | | | (0.11 | ) | | (0.03 | ) | | — | |
Net realized gains | | — | | | (0.03 | ) | | (0.00 | )(4) | | — | |
|
|
Total Distributions | | — | | | (0.14 | ) | | (0.03 | ) | | — | |
|
|
Net Asset Value, End of Period | | $13.04 | | | $13.17 | | | $12.67 | | | $10.42 | |
|
|
Total Return(5) | | (0.99 | )% | | 5.01 | % | | 21.93 | % | | 4.20 | % |
|
|
Net Assets, End of Period (000s) | | $199,840 | | | $174,922 | | | $77,788 | | | $3,234 | |
|
|
Ratios to Average Net Assets: | | | | | | | | | | | | |
Gross expenses | | 1.06 | %(6) | | 1.08 | % | | 1.39 | % | | 23.28 | %(6) |
Net expenses(8) | | 0.96 | (6) | | 0.97 | | | 1.00 | (7) | | 1.00 | (6)(7) |
Net investment income | | 1.37 | (6) | | 1.09 | | | 0.69 | | | 1.28 | (6) |
|
|
Portfolio Turnover Rate | | 28 | % | | 49 | % | | 39 | % | | 7 | % |
|
|
| (1) | | For the six months ended June 30, 2005 (unaudited). |
| (2) | | Per share amounts have been calculated using the average shares method. |
| (3) | | For the period October 1, 2002 (commencement of operations) to December 31,2002. |
| (4) | | Amount represents less than $0.01 per share. |
| (5) | | Performance figures may reflect voluntary fee waivers and/or expense reimbursements. Past performance is no guarantee of future results. In the absence of voluntary fee waivers and/or expense reimbursements, the total return would be lower. Total returns do not reflect expenses associated with the separate accounts such as administrative fees, account charges and surrender charges which, if reflected, would reduce the total return for all periods shown. Total returns for periods of less than one year are not annualized. |
| (7) | | As a result of a voluntary expense limitation, the ratio of expenses to average net assets of the fund will not exceed 1.00%. |
| (8) | | The manager and distributor have voluntarily waived a portion of its fees. |
See Notes to Financial Statements.
41 Smith Barney Multiple Discipline Trust | 2005 Semi-Annual Report
Notes to Financial Statements (unaudited)
| 1. | Organization and Significant Accounting Policies |
The Multiple Discipline Portfolio — All Cap Growth and Value (“All Cap Growth and Value”), Multiple Discipline Portfolio — Large Cap Growth and Value (“Large Cap Growth and Value”), Multiple Discipline Portfolio — Global All Cap Growth and Value (“Global All Cap Growth and Value”) and Multiple Discipline Portfolio — Balanced All Cap Growth and Value (“Balanced All Cap Growth and Value”) (“Funds”) are separate diversified Investment Funds of Trust (Trust), a Massachusetts business trust, is registered under the Investment Company Act of 1940, as amended (“1940 Act”), as a diversified open-end management investment company. The Trust is offered exclusively for use with certain variable annuity and variable life insurance contracts offered through the separate accounts of various life insurance companies and qualified pension and retirement plans.
The following are significant accounting policies consistently followed by the Funds. These policies are in conformity with U.S. generally accepted accounting principles (“GAAP”). Estimates and assumptions are required to be made regarding assets, liabilities and changes in net assets resulting from operations when financial statements are prepared. Changes in the economic environment, financial markets and any other parameters used in determining these estimates could cause actual results to differ.
(a) Investment Valuation. Equity securities for which market quotations are available are valued at the last sale price or official closing price on the primary market or exchange on which they trade. Debt securities are valued at the mean between the bid and asked prices provided by an independent pricing service that are based on transactions in debt obligations, quotations from bond dealers, market transactions in comparable securities and various relationships between securities. When prices are not readily available, or are determined not to reflect fair value, such as when the value of a security has been significantly affected by events after the close of the exchange or market on which the security is principally traded, but before the Funds calculate its net asset value, the Funds may value these investments at fair value as determined in accordance with the procedures approved by the Funds’ Board of Trustees. Short-term obligations with maturities of 60 days or less are valued at amortized cost, which approximates market value.
(b) Repurchase Agreements. When entering into repurchase agreements, it is the Funds’ policy that its custodian or a third party custodian take possession of the underlying collateral securities, the market value of which at least equals the principal amount of the repurchase transaction, including accrued interest. To the extent that any repurchase transaction exceeds one business day, the value of the collateral is marked-to-market to ensure the adequacy of the collateral. If the seller defaults and the market value of the collateral declines or if bankruptcy proceedings are commenced with respect to the seller of the security, realization of the collateral by the Funds may be delayed or limited.
(c) Security Transactions and Investment Income. Security transactions are accounted for on a trade date basis. Interest income, adjusted for amortization of premium and accretion of discount, is recorded on the accrual basis. Dividend income is recorded on the ex-dividend date. Foreign dividend income is recorded on the ex-dividend date or as soon as practical after the Funds determine the existence of a dividend declaration after exercising reasonable due diligence. The cost of investments sold is determined by use of the specific identification method.
(d) Distributions to Shareholders. Distributions from net investment income and distributions of net realized gains, if any, are declared at least annually. Distributions to shareholders of the Funds are recorded on the ex-dividend date and are determined in accordance with income tax regulations, which may differ from GAAP.
(e) Federal and Other Taxes. It is the Funds’ policy to comply with the federal income and excise tax requirements of the Internal Revenue Code of 1986, as amended, applicable to regulated investment companies. Accordingly, the Funds intend to distribute substantially all of its taxable income and net realized gains on investments, if any, to shareholders each
42 Smith Barney Multiple Discipline Trust | 2005 Semi-Annual Report
Notes to Financial Statements (unaudited) (continued)
year. Therefore, no federal income tax provision is required in the Funds’ financial statements. Under the applicable foreign tax laws, a withholding tax may be imposed on interest, dividends and capital gains at various rates.
(f) Reclassification. GAAP requires that certain components of net assets be adjusted to reflect permanent differences between financial and tax reporting. These reclassifications have no effect on net assets or net asset values per share.
| 2. | Management Agreement and Other Transactions with Affiliates |
Smith Barney Fund Management LLC (“SBFM”), an indirect wholly-owned subsidiary of Citigroup Inc. (“Citigroup”), acts as investment manager to the Funds. Each Fund pays SBFM a manager fee calculated at the annual rate of 0.75% of their respective average daily net assets. These fees are calculated daily and paid monthly.
Citigroup Global Markets Inc. (“CGM”), another indirect wholly-owned subsidiary of Citigroup, acts as the Fund’s distributor. Each Fund has adopted a distribution plan (“Plan”) pursuant to Rule 12b-1 under the 1940 Act. The Plan provides that each Fund shall pay a distribution fee of 0.25% of the average daily net assets of each Fund, respectively. These fees are calculated daily and paid monthly. The Balanced All Cap Growth and Value and the All Cap Growth and Value Fund waived 0.10% of their distribution fees. The Large Cap Growth and Value Fund and the Global All Cap Growth and Value Fund continued to waive 100% of the distribution fees for the six months ended June 30, 2005.
During the six months ended June 30, 2005, the Funds had distribution fee waivers in place, resulting in the following fee waivers:
| | | | | | | | |
| | | All Cap
Growth and Value | | Large Cap
Growth and Value | | Global All Cap
Growth and Value | | Balanced All Cap
Growth and Value |
Distribution Fee Waiver | | $127,303 | | $38,667 | | $72,193 | | $92,437 |
|
The expense waivers and distribution plan fee waivers can be terminated at anytime by SBFM or CGM.
Citicorp Trust Bank, fsb. (“CTB”), another subsidiary of Citigroup, acts as the Funds’ transfer agent. PFPC Inc. (“PFPC”) acts as the Funds’ sub-transfer agent. CTB receives account fees and asset-based fees that vary according to the size and type of account. PFPC is responsible for shareholder recordkeeping and financial processing for all shareholder accounts and is paid by CTB. During the six months ended June 30, 2005, each Fund paid transfer agent fees of $2,500 to CTB.
All officers and one Trustee of the Trust are employees of Citigroup or its affiliates and do not receive compensation from the Trust.
During the six months ended June 30, 2005, the aggregate cost of purchases and proceeds from sales of investments (excluding short-term investments) were as follows:
| | | | | | | | |
| | | All Cap
Growth and Value | | Large Cap
Growth and Value | | Global All Cap
Growth and Value | | Balanced All Cap
Growth and Value |
Investments | | | | | | | | |
Purchases | | $64,698,714 | | $10,046,449 | | $23,015,671 | | $42,934,836 |
|
Sales | | 16,618,621 | | 3,278,315 | | 2,744,532 | | 12,457,281 |
|
U.S. Government and Agency Obligations | | | | | | | | |
Purchases | | — | | — | | — | | 44,248,575 |
|
Sales | | — | | — | | — | | 35,153,444 |
|
43 Smith Barney Multiple Discipline Trust | 2005 Semi-Annual Report
Notes to Financial Statements (unaudited) (continued)
At June 30, 2005, the aggregate gross unrealized appreciation and depreciation of investments for federal income tax purposes were substantially as follows:
| | | | | | | | | | | | | | | | |
| | | All Cap
Growth and Value | | | Large Cap
Growth and Value | | | Global All Cap
Growth and Value | | | Balanced All Cap
Growth and Value | |
Gross unrealized appreciation | | $ | 26,105,419 | | | $ | 2,431,010 | | | $ | 5,097,219 | | | $ | 13,343,546 | |
Gross unrealized depreciation | | | (8,078,483 | ) | | | (859,998 | ) | | | (1,751,080 | ) | | | (4,193,400 | ) |
|
|
Net unrealized appreciation | | $ | 18,026,936 | | | $ | 1,571,012 | | | $ | 3,346,139 | | | $ | 9,150,146 | |
|
|
| 4. | Dividends Subsequent to June 30, 2005 |
Global All Cap Growth and Value declared dividends in the amount of $0.000523 per share, payable on August 19, 2005 to shareholders of record on August 18, 2005.
| 5. | Shares of Beneficial Interest |
At June 30, 2005, the Trust had an unlimited number of shares authorized with a par value of $0.001 per share.
Transactions in shares of each Fund were as follows:
| | | | | | |
| | | Six Months Ended
June 30, 2005 | | | Year Ended
December 31, 2004 | |
All Cap Growth and Value | | | | | | |
Shares sold | | 2,381,120 | | | 9,481,857 | |
Shares issued on reinvestment | | — | | | 109,646 | |
Shares repurchased | | (730,421 | ) | | (388,694 | ) |
|
|
Net Increase | | 1,650,699 | | | 9,202,809 | |
|
|
Large Cap Growth and Value | | | | | | |
Shares sold | | 583,925 | | | 1,169,090 | |
Shares issued on reinvestment | | — | | | 33,355 | |
Shares repurchased | | (110,447 | ) | | (74,739 | ) |
|
|
Net Increase | | 473,478 | | | 1,127,706 | |
|
|
Global All Cap Growth and Value | | | | | | |
Shares sold | | 1,403,127 | | | 2,474,154 | |
Shares issued on reinvestment | | — | | | 23,589 | |
Shares repurchased | | (104,694 | ) | | (77,180 | ) |
|
|
Net Increase | | 1,298,433 | | | 2,420,563 | |
|
|
Balanced All Cap Growth and Value | | | | | | |
Shares sold | | 2,590,438 | | | 7,489,565 | |
Shares issued on reinvestment | | — | | | 133,841 | |
Shares repurchased | | (546,011 | ) | | (483,360 | ) |
|
|
Net Increase | | 2,044,427 | | | 7,140,046 | |
|
|
On May 31, 2005, the U.S. Securities and Exchange Commission (“SEC”) issued an order in connection with the settlement of an administrative proceeding against Smith Barney Fund Management LLC (“SBFM”) and Citigroup Global Markets Inc. (“CGMI”) relating to the appointment of an affiliated transfer agent for the Smith Barney family of mutual funds (the “Funds”).
44 Smith Barney Multiple Discipline Trust | 2005 Semi-Annual Report
Notes to Financial Statements (unaudited) (continued)
The SEC order finds that SBFM and CGMI willfully violated Section 206(1) of the Investment Advisers Act of 1940 (“Advisers Act”). Specifically, the order finds that SBFM and CGMI knowingly or recklessly failed to disclose to the boards of the Funds in 1999 when proposing a new transfer agent arrangement with an affiliated transfer agent that: First Data Investors Services Group (“First Data”), the Funds’ then-existing transfer agent, had offered to continue as transfer agent and do the same work for substantially less money than before; and that Citigroup Asset Management (“CAM”), the Citigroup business unit that includes the fund’s investment manager and other investment advisory companies, had entered into a side letter with First Data under which CAM agreed to recommend the appointment of First Data as sub-transfer agent to the affiliated transfer agent in exchange, among other things, for a guarantee by First Data of specified amounts of asset management and investment banking fees to CAM and CGMI. The order also finds that SBFM and CGMI willfully violated Section 206(2) of the Advisers Act by virtue of the omissions discussed above and other misrepresentations and omissions in the materials provided to the Funds’ boards, including the failure to make clear that the affiliated transfer agent would earn a high profit for performing limited functions while First Data continued to perform almost all of the transfer agent functions, and the suggestion that the proposed arrangement was in the Funds’ best interests and that no viable alternatives existed. SBFM and CGMI do not admit or deny any wrongdoing or liability. The settlement does not establish wrongdoing or liability for purposes of any other proceeding.
The SEC censured SBFM and CGMI and ordered them to cease and desist from violations of Sections 206(1) and 206(2) of the Advisers Act. The order requires Citigroup to pay $208.1 million, including $109 million in disgorgement of profits, $19.1 million in interest, and a civil money penalty of $80 million. Approximately $24.4 million has already been paid to the Funds, primarily through fee waivers. The remaining $183.7 million, including the penalty, has been paid to the U.S. Treasury and will be distributed pursuant to a plan to be prepared by Citigroup and submitted within 90 days of the entry of the order for approval by the SEC. The order also requires that transfer agency fees received from the Funds since December 1, 2004 less certain expenses be placed in escrow and provides that a portion of such fees may be subsequently distributed in accordance with the terms of the order.
The order requires SBFM to recommend a new transfer agent contract to the Fund boards within 180 days of the entry of the order; if a Citigroup affiliate submits a proposal to serve as transfer agent or sub-transfer agent, an independent monitor must be engaged at the expense of SBFM and CGMI to oversee a competitive bidding process. Under the order, Citigroup also must comply with an amended version of a vendor policy that Citigroup instituted in August 2004. That policy, as amended, among other things, requires that when requested by a Fund board, CAM will retain at its own expense an independent consulting expert to advise and assist the board on the selection of certain service providers affiliated with Citigroup.
At this time, there is no certainty as to how the proceeds of the settlement will be distributed, to whom such distributions will be made, the methodology by which such distributions will be allocated, and when such distributions will be made. Although there can be no assurance, Citigroup does not believe that this matter will have a material adverse effect on the Funds.
Beginning in June, 2004, class action lawsuits alleging violations of the federal securities laws were filed against Citigroup Global Markets Inc. (the “Distributor”) and a number of its affiliates, including Smith Barney Fund Management LLC and Salomon Brothers Asset Management Inc (the “Advisers”), substantially all of the mutual funds managed by the Advisers, including the Fund (the “Funds”), and directors or trustees of the Funds (collectively, the “Defendants”). The complaints alleged, among other things, that the Distributor created various undisclosed incentives for its brokers to sell Smith Barney and Salomon Brothers funds. In addition, according to the complaints, the Advisers caused the Funds to pay excessive
45 Smith Barney Multiple Discipline Trust | 2005 Semi-Annual Report
Notes to Financial Statements (unaudited) (continued)
brokerage commissions to the Distributor for steering clients towards proprietary funds. The complaints also alleged that the defendants breached their fiduciary duty to the Funds by improperly charging Rule 12b-1 fees and by drawing on fund assets to make undisclosed payments of soft dollars and excessive brokerage commissions. The complaints also alleged that the Funds failed to adequately disclose certain of the allegedly wrongful conduct. The complaints sought injunctive relief and compensatory and punitive damages, rescission of the Funds’ contracts with the Advisers, recovery of all fees paid to the Advisers pursuant to such contracts and an award of attorneys’ fees and litigation expenses.
On December 15, 2004, a consolidated amended complaint (the “Complaint”) was filed alleging substantially similar causes of action. While the lawsuit is in its earliest stages, to the extent that the Complaint purports to state causes of action against the Funds, Citigroup Asset Management believes the Funds have significant defenses to such allegations, which the Funds intend to vigorously assert in responding to the Complaint.
Additional lawsuits arising out of these circumstances and presenting similar allegations and requests for relief may be filed against the Defendants in the future.
As of the date of this report, Citigroup Asset Management and the Funds believe that the resolution of the pending lawsuit will not have a material effect on the financial position or results of operations of the Funds or the ability of the Advisers and their affiliates to continue to render services to the Funds under their respective contracts.
On June 24, 2005, Citigroup announced that it has signed a definitive agreement under which Citigroup will sell substantially all of its worldwide asset management business to Legg Mason, Inc. (“Legg Mason”).
As part of this transaction, SBFM (the “Manager”), currently an indirect wholly owned subsidiary of Citigroup, would become an indirect wholly owned subsidiary of Legg Mason. The Manager is the investment manager to the Funds.
The transaction is subject to certain regulatory approvals, as well as other customary conditions to closing. Subject to such approvals and the satisfaction of the other conditions, Citigroup expects the transaction to be completed later this year.
Under the Investment Company Act of 1940, consummation of the transaction will result in the automatic termination of the investment management contract between the Funds and the Manager. Therefore, the Trust’s Board of Trustees will be asked to approve a new investment management contract between the Funds and the Manager. If approved by the Board, the new investment management contract will be presented to the shareholders of the Funds for their approval.
Subsequently, on August 1, 2005, the Board approved the new investment management contract between the Fund and the Manager.
46 Smith Barney Multiple Discipline Trust | 2005 Semi-Annual Report
Board Approval of Management Agreement
Background
The members of the Board of Smith Barney Multiple Discipline Trust (the “Fund”), including the Fund’s independent, or non-interested, Board members (the “Independent Board Members”), received information from Smith Barney Fund Management LLC, the Fund’s manager (the “Manager”) to assist them in their consideration of the Fund’s management agreement (the “Management Agreement”). The Board received and considered a variety of information about the Manager, and the Fund’s distributor, as well as the advisory, and distribution arrangements for the Fund and other funds overseen by the Board, certain portions of which are discussed below.
The presentation made to the Board encompassed the Fund and all the funds for which the Board has responsibility. The Fund has an investment advisory agreement. The discussion below covers the advisory and administrative functions being rendered by the Manager.
Board Approval of Management Agreement
In approving the Management Agreement, the Fund’s Board, including the Independent Board Members, considered the following factors:
Nature, Extent and Quality of the Services under the Management Agreement
The Board received and considered information regarding the nature, extent and quality of services provided to the Fund by the Manager under the Management Agreement during the past year. The Board also received a description of the administrative and other services rendered to the Fund and its shareholders by the Manager. The Board noted information received at regular meetings throughout the year related to the services rendered by the Manager about the management of the Fund’s affairs and the Manager’s role in coordinating the activities of the Fund’s other service providers. The Board’s evaluation of the services provided by the Manager took into account the Board’s knowledge and familiarity gained as Board members of funds in the Citigroup Asset Management (“CAM”) fund complex, including the scope and quality of the Manager’s investment management and other capabilities and the quality of its administrative and other services. The Board observed that the scope of services provided by the Manager had expanded over time as a result of regulatory and other developments, including maintaining and monitoring its own and the Fund’s expanded compliance programs. The Board also considered the Manager’s response to recent regulatory compliance issues affecting it and the CAM fund complex. The Board reviewed information received from the Manager regarding the implementation to date of the Fund’s compliance policies and procedures established pursuant to Rule 38a-1 under the Investment Company Act of 1940.
The Board reviewed the qualifications, backgrounds and responsibilities of the Fund’s senior personnel and the portfolio management team primarily responsible for the day-to-day portfolio management of the Fund. The Board noted that the Manager’s Office of the Chief Investment Officer, composed of the senior officers of the investment teams managing the funds in the CAM complex, participates in reporting to the Board on investment matters. The Board also considered, based on its knowledge of the Manager and its affiliates, the financial resources available to CAM and its parent organization, Citigroup Inc.
The Board also considered the Manager’s brokerage policies and practices, the standards applied in seeking best execution, the Manager’s policies and practices regarding soft dollars, the use of a broker affiliated with the Manager and the existence of quality controls applicable to brokerage allocation procedures. In addition, management also reported to the Board on, among other things, its business plans, recent organizational changes and portfolio manager compensation plan.
At the Board’s request following the conclusion of the 2004 contract continuance discussions, the Manager prepared and provided to the Board in connection with the 2005 discussions an analysis to complex-wide management fees, which, among other things, set out a proposed framework of fees based on asset classes.
47 Smith Barney Multiple Discipline Trust | 2005 Semi-Annual Report
Board Approval of Management Agreement (continued)
The Board concluded that, overall, the nature, extent and quality of services provided (and expected to be provided) under the Management Agreement were acceptable.
Fund Performance
The Board received and considered performance information for the Fund as well as for a group of funds (the “Performance Universe”) selected by Lipper, Inc. (“Lipper”), an independent provider of investment company data. The Board was provided with a description of the methodology Lipper used to determine the similarity of the Fund with the funds included in the Performance Universe. The Board also noted that it had received and discussed with management information throughout the year at periodic intervals comparing the Fund’s performance against its benchmark(s).
Smith Barney Multiple Discipline Trust: Multiple Discipline Portfolio — All Cap Growth & Value
The information comparing the Fund’s performance to that of its Performance Universe, consisting of the Fund and all retail and institutional funds regardless of asset size or primary channel of distribution classified as “multi-cap core funds” by Lipper showed that the Fund’s performance for the 1-year period was lower than the median. The Board noted that the portfolio has only been in existence since October 2002 and that the short-term performance of the underlying disciplines trailed their respective peer groups. Based on their review, which included careful consideration of all of the factors noted above, the Board will continue to gauge the Fund’s performance and investment strategies.
Smith Barney Multiple Discipline Trust: Multiple Discipline Portfolio — Balanced All Cap Growth & Value
The information comparing the Fund’s performance to that of its Performance Universe, consisting of the Fund and all retail and institutional funds regardless of asset size or primary channel of distribution classified as “balanced funds” by Lipper showed that the Fund’s performance for the 1-year period was lower than the median. The Board noted that the portfolio has only been in existence since October 2002 and that the short-term performance of the underlying disciplines was trailed their respective peer groups. Based on their review, which included careful consideration of all of the factors noted above, the Board will continue to gauge the Fund’s performance and investment strategies.
Smith Barney Multiple Discipline Trust: Multiple Discipline Portfolio — Global All Cap Growth & Value
The information comparing the Fund’s performance to that of its Performance Universe, consisting of the Fund and all retail and institutional funds regardless of asset size or primary channel of distribution classified as “large-cap core funds” by Lipper showed that the Fund’s performance for the 1-year period was lower than the median. The Board noted that the portfolio has only been in existence since October 2002 and that the short-term performance of the underlying disciplines trailed their respective peer groups. Based on their review, which included careful consideration of all of the factors noted above, the Board will continue to gauge the Fund’s performance and investment strategies.
Smith Barney Multiple Discipline Trust: Multiple Discipline Portfolio — Large Cap Growth & Value
The information comparing the Fund’s performance to that of its Performance Universe, consisting of the Fund and all retail and institutional funds regardless of asset size or primary channel of distribution classified as “large-cap core funds” by Lipper showed that the Fund’s performance for the 1-year period was lower than the median. The Board noted that the portfolio has only been in existence since October 2002 and that the short-term performance of the underlying disciplines trailed their respective peer groups. Based on their review, which included careful consideration of all of the factors noted above, the Board will continue to gauge the Fund’s performance and investment strategies.
Management Fees and Expense Ratios
The Board reviewed and considered the contractual management fee (the “Contractual Management Fee”) payable by the Fund to the Manager in light of the nature, extent and quality of the management services provided by the Manager. The
48 Smith Barney Multiple Discipline Trust | 2005 Semi-Annual Report
Board Approval of Management Agreement (continued)
Board also reviewed and considered whether fee waiver and/or expense reimbursement arrangements are currently in place for the Fund and considered the actual fee rate (after taking any waivers and reimbursements into account) (the “Actual Management Fee”) and whether any fee waivers and reimbursements could be discontinued.
The Board received and considered information comparing the Fund’s Management Fees and the Fund’s overall expenses with those of funds in both the relevant expense group and a broader group of funds, each selected and provided by Lipper. The Board also reviewed information regarding fees charged by the Manager to other U.S. clients investing primarily in an asset class similar to that of the Fund including, where applicable, separate accounts. The Manager reviewed with the Board the significant differences in scope of services provided to the Fund and to these other clients, noting that the Fund is provided with administrative services, office facilities, Fund officers (including the Fund’s chief executive, chief financial and chief compliance officers), and that the Manager coordinates and oversees the provision of services to the Fund by other Fund providers. The Board considered the fee comparisons in light of the differences required to manage these different types of accounts. The Board received an analysis of complex-wide management fees provided by the Manager, which, among other things, set out a proposed framework of fees based on asset classes.
Management also discussed with the Board the Fund’s distribution arrangements. The Board was provided with information concerning revenues received by and certain expenses incurred by the Fund’s affiliated distributors and how the amounts received by the distributors are paid.
Smith Barney Multiple Discipline Trust: Multiple Discipline Portfolio — All Cap Growth & Value
The information comparing the Fund’s Contractual and Actual Management Fees and its actual total expense ratio to its Expense Group, consisting of 12 variable insurance portfolios (including the Fund) that are classified as “multi-cap core” or “multi-cap value funds” by Lipper, showed that the Fund’s Contractual and Actual Management Fees were within the range of management fees paid by the other funds in the Expense Group and, indeed, were better than the median. The Board noted that the Fund’s actual total expense ratio was also better than the median and concluded that it was acceptable.
Smith Barney Multiple Discipline Trust: Multiple Discipline Portfolio — Balanced All Cap Growth & Value
The information comparing the Fund’s Contractual and Actual Management Fees and its actual total expense ratio to its Expense Group, consisting of 13 variable insurance portfolios (including the Fund) that are classified as “balanced funds” by Lipper, showed that the Fund’s Contractual and Actual Management Fees were within the range of management fees paid by the other funds in the Expense Group and were within the median range. The Board noted that the Fund’s total expense ratio was better than the median and concluded that it was acceptable.
Smith Barney Multiple Discipline Trust: Multiple Discipline Portfolio — Global All Cap Growth & Value
The information comparing the Fund’s Contractual and Actual Management Fees and its actual total expense ratio to its Expense Group, consisting of 14 variable insurance portfolios (including the Fund) that are classified as “large-cap core funds” by Lipper, showed that the Fund’s Contractual and Actual Management Fees were within the range of management fees paid by the other funds in the Expense Group and that the Contractual Management Fees were within the median range while the Actual Management Fees were higher than the median. The Board noted that the Fund’s actual total expense ratio was also higher than the median. The Board will continue to monitor the management fees and total expenses of the Fund.
Smith Barney Multiple Discipline Trust: Multiple Discipline Portfolio — Large Cap Growth & Value
The information comparing the Fund’s Contractual and Actual Management Fees and its actual total expense ratio to its Expense Group, consisting of 14 variable insurance portfolios (including the Fund) that are classified as “large-cap core funds” by Lipper, showed that the Fund’s Contractual and Actual Management Fees were within the range of management
49 Smith Barney Multiple Discipline Trust | 2005 Semi-Annual Report
Board Approval of Management Agreement (continued)
fees paid by the other funds in the Expense Group and that the Contractual Management Fees were within median range while the Actual Management Fees were better than the median. The Board noted that the Fund’s actual total expense ratio was higher than the median. The Board will continue to monitor the management fees and total expenses of the Fund.
Taking all of the above into consideration, the Board determined that the Management Fee was reasonable in light of the nature, extent and quality of the services provided to the Fund under the Management Agreement.
Manager Profitability
The Board received and considered a profitability analysis of the Manager and its affiliates in providing services to the Fund. The Board also received profitability information with respect to the CAM fund complex as a whole. In addition, the Board received information with respect to the Manager’s allocation methodologies used in preparing this profitability data as well as a report from an outside consultant that had reviewed the Manager’s methodology. The Manager’s profitability was considered not excessive in light of the nature, extent and quality of the services provided to the Fund.
Economies of Scale
The Board received and discussed information concerning whether the Manager realizes economies of scale as the Fund’s assets grow beyond current levels. However, because of the nature of the Manager’s business, the Board could not reach definitive conclusions as to whether the Manager might realize economies of scale or how great they may be.
Other Benefits to the Manager
The Board considered other benefits received by the Manager, and their affiliates as a result of their relationship with the Fund, including soft dollar arrangements, receipt of brokerage and the opportunity to offer additional products and services to Fund shareholders.
In light of the costs of providing investment management and other services to the Fund and the Manager’s ongoing commitment to the Fund, the profits and other ancillary benefits that the Manager and its affiliates received were considered reasonable.
In light of all of the foregoing, the Board approved the Management Agreement to continue for another year.
No single factor reviewed by the Board was identified by the Board as the principal factor in determining whether to approve the Management Agreement. The Independent Board Members were advised by separate independent legal counsel throughout the process. The Board discussed the proposed continuance of the Management Agreement in a private session with their independent legal counsel at which no representatives of the Manager were present.
50 Smith Barney Multiple Discipline Trust | 2005 Semi-Annual Report
SMITH BARNEY
MULTIPLE DISCIPLINE TRUST
| | |
TRUSTEES H. John Ellis R. Jay Gerken, CFA
Chairman Armon E. Kamesar Stephen E. Kaufman John J. Murphy OFFICERS R. Jay Gerken, CFA President and Chief Executive Officer Andrew B. Shoup Senior Vice President and
Chief Administrative Officer Robert J. Brault Chief Financial Officer and Treasurer Kirstin Mobyed Investment Officer Roger Paradiso Investment Officer Andrew Beagley Chief Anti-Money Laundering Compliance Officer and Chief Compliance Officer Robert I. Frenkel Secretary and
Chief Legal Officer | | INVESTMENT MANAGER Smith Barney Fund
Management LLC DISTRIBUTOR Citigroup Global Markets Inc. CUSTODIAN State Street Bank and
Trust Company TRANSFER AGENT Citicorp Trust Bank, fsb. 125 Broad Street, 11th Floor New York, New York 10004 SUB-TRANSFER AGENT PFPC Inc. P.O. Box 9699 Providence, Rhode Island 02940-9699 |
Smith Barney Multiple Discipline Trust
Multiple Discipline Portfolio — All Cap Growth and Value
Multiple Discipline Portfolio — Large Cap Growth and Value
Multiple Discipline Portfolio — Global All Cap Growth and Value
Multiple Discipline Portfolio — Balanced All Cap Growth and Value
The Funds are separate investment funds of the Smith Barney Multiple Discipline Trust, a Massachusetts business trust.
The Funds file their complete schedule of portfolio holdings with the Securities and Exchange Commission for the first and third quarters of each fiscal year on the Form N-Q. The Funds’ Forms N-Q are available on the Commission’s website at www.sec.gov. The Funds’ Forms N-Q may be reviewed and copied at the Commission’s Public Reference Room in Washington D.C., and information on the operation of the Public Reference Room may be obtained by calling 1-800-SEC-0330. To obtain information on Form N-Q from the Funds, shareholders can call 1-800-451-2010.
Information on how the Funds voted proxies relating to portfolio securities during the most recent 12-month period ended June 30 and a description of the policies and procedures that the Funds use to determine how to vote proxies relating to portfolio securities is available (1) without charge, upon request, by calling 1-800-451-2010, (2) on the Funds’ website at www.citigroupam.com and (3) on the SEC’s website at www.sec.gov.
This report is submitted for the general information of the shareholders of the Smith Barney Multiple Discipline Trust: Multiple Discipline Portfolio — All Cap Growth and Value, Multiple Discipline Portfolio — Large Cap Growth and Value, Multiple Discipline Portfolio — Global All Cap Growth and Value and Multiple Discipline Portfolio — Balanced All Cap Growth and Value, and is not for use with the general public.
SMITH BARNEY MULTIPLE DISCIPLINE TRUST
Smith Barney Mutual Funds
125 Broad Street
10th Floor, MF-2
New York, New York 10004
This report must be preceded or accompanied by a free prospectus. Investors should consider the Funds investment objectives, risks, charges and expenses carefully before investing. The prospectus contains this and other information about the Funds. Please read the prospectus carefully before investing.
©2005 Citigroup Global Markets Inc. Member NASD, SIPC
ITEM 2. CODE OF ETHICS.
Not applicable.
ITEM 3. AUDIT COMMITTEE FINANCIAL EXPERT.
Not applicable.
ITEM 4. PRINCIPAL ACCOUNTANT FEES AND SERVICES.
Not applicable.
ITEM 5. AUDIT COMMITTEE OF LISTED REGISTRANTS.
Not applicable.
ITEM 6. SCHEDULE OF INVESTMENTS.
Not applicable.
ITEM 7. DISCLOSURE OF PROXY VOTING POLICIES AND PROCEDURES FOR CLOSED-END MANAGEMENT INVESTMENT COMPANIES.
Not applicable.
ITEM 8. [RESERVED]
ITEM 9. PURCHASES OF EQUITY SECURITIES BY CLOSED-END MANAGEMENT INVESTMENT COMPANY AND AFFILIATED PURCHASERS.
Not applicable.
ITEM 10. SUBMISSION OF MATTERS TO A VOTE OF SECURITY HOLDERS.
Not applicable.
ITEM 11. CONTROLS AND PROCEDURES.
| | (a) | The registrant’s principal executive officer and principal financial officer have concluded that the registrant’s disclosure controls and procedures (as defined in Rule 30a- 3(c) under the Investment Company Act of 1940, as amended (the “1940 Act”)) are effective as of a date within 90 days of the filing date of this report that includes the disclosure required by this paragraph, based on their evaluation of the disclosure controls and procedures required by Rule 30a-3(b) under the 1940 Act and 15d-15(b) under the Securities Exchange Act of 1934. |
| | (b) | There were no changes in the registrant’s internal control over financial reporting (as defined in Rule 30a-3(d) under the 1940 Act) that occurred during the registrant’s last fiscal half-year (the registrant’s second fiscal half-year in the case of an annual report) that have materially affected, or are likely to materially affect the registrant’s internal control over financial reporting. |
ITEM 12. EXHIBITS.
| | |
| Exhibit 99.CERT | | Certifications pursuant to section 302 of the Sarbanes-Oxley Act of 2002 |
| |
Exhibit 99.906CERT | | Certifications pursuant to Section 906 of the Sarbanes-Oxley Act of 2002 |
SIGNATURES
Pursuant to the requirements of the Securities Exchange Act of 1934 and the Investment Company Act of 1940, the registrant has duly caused this Report to be signed on its behalf by the undersigned, there unto duly authorized.
Smith Barney Multiple Discipline Trust
| | |
| |
By: | | /s/ R. Jay Gerken
|
| | | R. Jay Gerken |
| | | Chief Executive Officer of |
| | | Smith Barney Multiple Discipline Trust |
| |
Date: | | September 7, 2005 |
Pursuant to the requirements of the Securities Exchange Act of 1934 and the Investment Company Act of 1940, this report has been signed below by the following persons on behalf of the registrant and in the capacities and on the dates indicated.
| | |
By: | | /s/ R. Jay Gerken
|
| | | R. Jay Gerken |
| | | Chief Executive Officer of |
| | | Smith Barney Multiple Discipline Trust |
| |
Date: | | September 7, 2005 |
| |
By: | | /s/ Robert J. Brault
|
| | | (Robert J. Brault) |
| | | Chief Financial Officer of |
| | | Smith Barney Multiple Discipline Trust |
| |
Date: | | September 7, 2005 |