UNITED STATES
SECURITIES AND EXCHANGE COMMISSION
Washington, D.C. 20549
FORM N-CSR
CERTIFIED SHAREHOLDER REPORT OF REGISTERED
MANAGEMENT INVESTMENT COMPANIES
Investment Company Act file number 811-21128
Smith Barney Multiple Discipline Trust
(Exact name of registrant as specified in charter)
125 Broad Street, New York, NY 10004
(Address of principal executive offices) (Zip code)
Robert I. Frenkel, Esq.
Legg Mason & Co., LLC
300 First Stamford Place, 4th Floor
Stamford, CT 06902
(Name and address of agent for service)
Registrant’s telephone number, including area code: (800) 451-2010
Date of fiscal year end: December 31
Date of reporting period: December 31, 2005
ITEM 1. REPORT TO STOCKHOLDERS.
The Annual Report to Stockholders is filed herewith.
EXPERIENCE
ANNUAL REPORT
DECEMBER 31, 2005

Smith Barney
Multiple Discipline Trust
Multiple Discipline Portfolio — All Cap Growth and Value
Multiple Discipline Portfolio — Large Cap Growth and Value
Multiple Discipline Portfolio — Global All Cap Growth and Value
Multiple Discipline Portfolio — Balanced All Cap Growth and Value
INVESTMENT PRODUCTS: NOT FDIC INSURED Ÿ NO BANK GUARANTEE Ÿ MAY LOSE VALUE
Smith Barney Multiple Discipline Trust
Annual Report • December 31, 2005
What’s
Inside
Under a licensing agreement between Citigroup and Legg Mason, the names of funds, the names of any classes of shares of funds, and the names of investment managers of funds, as well as all logos, trademarks and service marks related to Citigroup or any of its affiliates (“Citi Marks”) are licensed for use by Legg Mason. Citi Marks include, but are not limited to, “Smith Barney,” “Salomon Brothers,” “Citi” and “Citigroup Asset Management”. Legg Mason and its affiliates, as well as the Fund’s investment manager, are not affiliated with Citigroup.
All Citi Marks are owned by Citigroup, and are licensed for use until no later than one year after the date of the licensing agreement.
Letter from the Chairman

R. JAY GERKEN, CFA
Chairman, President and Chief Executive Officer
Dear Shareholder,
Despite numerous obstacles, including rising short-term interest rates, surging oil prices, a destructive hurricane season, and geopolitical issues, the U.S. economy continued to expand at a healthy pace during the reporting period. After a 3.8% advance in the first quarter of 2005, gross domestic product (“GDP”)i growth was 3.3% during the second quarter and 4.1% in the third quarter. While fourth quarter figures have not yet been released, another slight gain is anticipated.
Given the strength of the economy and inflationary pressures, the Federal Reserve Board (“Fed”)ii continued to raise interest rates throughout the period. After raising rates five times from June 2004 through December 2004, the Fed increased its target for the federal funds rateiii in 0.25% increments eight additional times over the reporting period. This represents the longest sustained Fed tightening cycle since the 1970s. All told, the Fed’s thirteen rate hikes have brought the target for the federal funds rate from 1.00% to 4.25%. After the end of the Funds’ reporting period, at its January meeting, the Fed once again raised its target for the federal funds rate by 0.25% to 4.50%.
For the one-year period ended December 31, 2005, the U.S. stock market generated positive results, with the S&P 500 Indexiv returning 4.91%. While corporate profits remained strong during the year, they were often overshadowed by rising interest rates and higher oil prices. Looking at the fiscal year as a whole, mid-cap stocks outperformed their large- and small-cap counterparts, with the Russell Midcapv , Russell 1000vi , and Russell 2000vii Indexes returning 12.65%, 6.27%, and 4.55%, respectively. From an investment style perspective, value stocks outperformed growth stocks for the sixth consecutive calendar year, with the Russell 3000 Valueviii and Russell 3000 Growthix Indexes returning 6.85% and 5.17%, respectively, in 2005.
As the year began, it was widely expected that both short- and long-term yields would rise. This panned out with short-term rates, as two-year Treasury yields rose from 3.08% to 4.41% over the 12-month period ended December 31, 2005.
Smith Barney Multiple Discipline Trust I
Within this environment, the Funds performed as follows1:
| | | | |
| Performance Snapshot as of December 31, 2005 (unaudited) |
| | |
| | | 6 Months | | 12 Months |
| | | | | |
Multiple Discipline Portfolio—All Cap Growth and Value | | 7.13% | | 5.25% |
|
Russell 3000 Index | | 6.13% | | 6.12% |
|
S&P 500 Index | | 5.76% | | 4.91% |
|
Lipper Variable Multi-Cap Core Funds Category Average | | 7.41% | | 6.66% |
|
Multiple Discipline Portfolio—Large Cap Growth and Value | | 5.15% | | 3.55% |
|
Russell 1000 Index | | 6.15% | | 6.27% |
|
S&P 500 Index | | 5.76% | | 4.91% |
|
Lipper Variable Large-Cap Core Funds Category Average | | 6.56% | | 5.77% |
|
Multiple Discipline Portfolio—Global All Cap Growth and Value | | 8.58% | | 6.54% |
|
Russell 3000 Index | | 6.13% | | 6.12% |
|
MSCI EAFE Index | | 14.88% | | 13.54% |
|
MSCI World Index | | 10.25% | | 9.49% |
|
S&P 500 Index | | 5.76% | | 4.91% |
|
Lipper Variable Large-Cap Core Funds Category Average | | 6.56% | | 5.77% |
|
Multiple Discipline Portfolio—Balanced All Cap Growth and Value | | 5.29% | | 4.25% |
|
Russell 1000 Index | | 6.15% | | 6.27% |
|
Russell 3000 Growth Index | | 7.19% | | 5.17% |
|
Russell 3000 Value Index | | 5.07% | | 6.85% |
|
Lehman Brothers Intermediate Treasury Bond Index | | 0.01% | | 1.56% |
|
S&P 500 Index | | 5.76% | | 4.91% |
|
Lipper Variable Balanced Funds Category Average | | 4.29% | | 4.78% |
|
| The performance shown represents past performance. Past performance is no guarantee of future results and current performance may be higher or lower than the performance shown above. Principal value and investment returns will fluctuate and investors’ shares, when redeemed, may be worth more or less than their original cost. |
| Current reimbursements and/or fee waivers are voluntary, and may be reduced or terminated at any time. Absent these reimbursements or waivers, performance would have been lower. |
| Fund returns assume the reinvestment of all distributions, including returns of capital, if any, at net asset value and the deduction of all fund expenses. |
| Lipper, Inc. is a major independent mutual-fund tracking organization. Returns are based on the period ended December 31, 2005 and include the reinvestment of all distributions, including returns of capital, if any. Returns for the variable multi-cap core funds category were calculated among the 177 funds for the 6-month period and among the 167 funds for the 12-month period. Returns for the variable large-cap core funds category were calculated among the 223 funds for the 6-month period and among the 220 funds for the 12-month period. Returns for the variable balanced funds category were calculated among the 114 funds for the 6-month period and among the 105 funds for the 12-month period. |
| 1 | | The Funds are underlying investment options of various variable annuity and variable life insurance products. The Funds’ performance returns do not reflect the deduction of initial sales charges and expenses imposed in connection with investing in variable annuity or variable life insurance contracts, such as administrative fees, account charges, and surrender charges, which, if reflected, would reduce the performance of the Funds. Past performance is no guarantee of future results. |
II Smith Barney Multiple Discipline Trust
However, while there were periods of volatility, over the same period long-term yields experienced only a modest increase, moving from 4.24% to 4.37%. In late December, the yield curve inverted, as the yield on two-year Treasuries surpassed that of 10-year Treasuries. This anomaly has historically foreshadowed an economic slowdown or recession. Looking at the municipal market, its yield curve flattened during the reporting period but it did not invert.
Please read on for a more detailed look at prevailing economic and market conditions during the Portfolios’ fiscal year and to learn how those conditions have affected Portfolio performance.
Special Shareholder Notices
On December 1, 2005, Citigroup Inc. (“Citigroup”) completed the sale of substantially all of its asset management business, Citigroup Asset Management (“CAM”), to Legg Mason, Inc. (“Legg Mason”). As a result, the Funds’ investment adviser (the “Manager”), previously an indirect wholly-owned subsidiary of Citigroup, has become a wholly-owned subsidiary of Legg Mason. Completion of the sale caused the Funds’ existing investment management contract to terminate. The Funds’ shareholders previously approved a new investment management contract between the Funds and the Manager, which became effective on December 1, 2005.
On or about April 7, 2006, the Smith Barney Multiple Discipline Trust will be renamed Legg Mason Partners Variable Portfolios IV.
Information About Your Fund
As you may be aware, several issues in the mutual fund industry have recently come under the scrutiny of federal and state regulators. The Portfolios’ Manager and some of its affiliates have received requests for information from various government regulators regarding market timing, late trading, fees, and other mutual fund issues in connection with various investigations. The regulators appear to be examining, among other things, the Funds’ response to market timing and shareholder exchange activity, including compliance with prospectus disclosure related to these subjects. The Portfolios have been informed that the Manager and its affiliates are responding to those information requests, but are not in a position to predict the outcome of these requests and investigations.
Smith Barney Multiple Discipline Trust III
Important information concerning the Portfolios and their Manager with regard to recent regulatory developments is contained in the Notes to Financial Statements included in this report.
As always, thank you for your confidence in our stewardship of your assets. We look forward to helping you continue to meet your financial goals.
Sincerely,

R. Jay Gerken, CFA
Chairman, President and Chief Executive Officer
February 1, 2006
All index performance reflects no deduction for fees, expenses or taxes. Please note that an investor cannot invest directly in an index.
| | |
i | | Gross domestic product is a market value of goods and services produced by labor and property in a given country. |
| |
ii | | The Federal Reserve Board is responsible for the formulation of a policy designed to promote economic growth, full employment, stable prices, and a sustainable pattern of international trade and payments. |
| |
iii | | The federal funds rate is the interest rate that banks with excess reserves at a Federal Reserve district bank charge other banks that need overnight loans. |
| |
iv | | The S&P 500 Index is an unmanaged index of 500 stocks that is generally representative of the performance of larger companies in the U.S. |
| |
v | | The Russell Midcap Index measures the performance of the 800 smallest companies in the Russell 1000 Index whose average market capitalization was approximately $4.7 billion as of 6/24/05. |
| |
vi | | The Russell 1000 Index measures the performance of the 1,000 largest companies in the Russell 3000 Index, which represents approximately 92% of the total market capitalization of the Russell 3000 Index. |
| |
vii | | The Russell 2000 Index measures the performance of the 2,000 smallest companies in the Russell 3000 Index, which represents approximately 8% of the total market capitalization of the Russell 3000 Index. |
| |
viii | | The Russell 3000 Value Index measures the performance of those Russell 3000 Index companies with lower price-to-book ratios and lower forecasted growth values. (A price-to-book ratio is the price of a stock compared to the difference between a company’s assets and liabilities.) |
| |
ix | | The Russell 3000 Growth Index measures the performance of those Russell 3000 Index companies with higher price-to-book ratios and higher forecasted growth values. |
IV Smith Barney Multiple Discipline Trust
Manager Overview
Multiple Discipline Portfolio — All Cap Growth and Value
Special Shareholder Notice
On or about April 7, 2006, the Multiple Discipline Portfolio — All Cap Growth and Value will be renamed Legg Mason Partners Variable Multiple Discipline Portfolio — All Cap Growth and Value.
Q. What were the overall market conditions during the Fund’s reporting period?
A. A resilient U.S. economy provided a positive backdrop for the stock market in 2005. Businesses across America did their part, as corporate profit growth was expected to exceed 10% for the third consecutive year. However, this did not translate into superior stock market returns, as the S&P 500 Indexi gained a relatively modest 4.91% in 2005. After trading in a fairly narrow range for much of the period, there were hopes that a year-end rally, similar to what occurred in 2003 and 2004, would propel stocks higher. However, after strong gains in November, the market treaded water in December as investor sentiment weakened due to fears of continued rate hikes by the Federal Reserve Boardii. Looking more closely at the stock market’s returns in 2005, among the Dow Jones industrial categories, oil & gas stocks generated the best returns, followed at a distance by utilities, and health care companies. In contrast, telecommunications, consumer services, and consumer goods stocks produced weak returns.
Performance Update1
For the 12 months ended December 31, 2005 shares of the Multiple Discipline Portfolio — All Cap Growth and Value returned 5.25%. In comparison, the Fund’s unmanaged benchmarks, the Russell 3000 Indexiii and the S&P 500 Index, returned 6.12% and 4.91%, respectively, for the same period. The Fund’s Lipper Variable Multi-Cap Core Funds Category Average2 returned 6.66%.
Q. What were the most significant factors affecting Fund performance?
What were the leading contributors to performance?
A. The Fund’s outperformance versus the S&P 500 Index benchmark was predominantly the result of overweight positions in the information technology and health care sectors, as well as its positioning in consumer staples stocks.
In terms of individual holdings, the Fund’s largest contributors to performance were Texas Instruments Inc., a company that designs and supplies digital signal processors, SanDisk Corp., a company that produces flash memory data storage products, bio - -
| 1 | | The Fund is an underlying investment option of various variable annuity and variable life insurance products. The Fund’s performance returns do not reflect the deduction of initial sales charges and expenses imposed in connection with investing in variable annuity or variable life insurance contracts, such as administrative fees, account charges, and surrender charges, which, if reflected, would reduce the performance of the Fund. Past performance is no guarantee of future results. |
| 2 | | Lipper, Inc. is a major independent mutual-fund tracking organization. Returns are based on the 12-month period ended December 31, 2005, including the reinvestment of distributions, including returns of capital, if any, calculated among the 167 funds in the Fund’s Lipper category. |
Smith Barney Multiple Discipline Trust 2005 Annual Report 1
technology giant Genentech Inc., UnitedHealth Group Inc., a diversified health and well-being services company, and Grant Prideco Inc., a supplier of drill pipe and equipment.
What were the leading detractors from performance?
A. Areas that detracted from relative results included the Fund’s overweights in consumer discretionary stocks and underweights in the industrial and utilities sectors.
The largest detractors for the period were Comcast Corp., a cable and internet communications company, Biogen Idec Inc., a biotechnology company focusing on drug research and supply, computer giant Dell Inc., Liberty Media Corp., a holding company that specializes in electronic retailing, media, communications and entertainment, and media conglomerate Walt Disney Co.
Q. Were there any significant changes to the Fund during the reporting period?
A. There was no change in MDF sleeve weightings, nor was there a specific net change in sector or market weightings.
Thank you for your investment in the Multiple Discipline Portfolio—All Cap Growth and Value. As ever, we appreciate that you have chosen us to manage your assets and we remain focused on seeking to achieve the Fund’s investment goals.
Sincerely,
| | |
 | |  |
| Roger Paradiso | | Kirstin Mobyed |
| Coordinating Portfolio Manager | | Co-Coordinating Portfolio Manager |
February 1, 2006
2 Smith Barney Multiple Discipline Trust 2005 Annual Report
The information provided is not intended to be a forecast of future events, a guarantee of future results or investment advice. Views expressed may differ from those of the firm as a whole.
Portfolio holdings and breakdowns are as of December 31, 2005 and are subject to change and may not be representative of the portfolio manager’s current or future investments. The Fund’s top ten holdings (as a percentage of net assets) as of this date were: Texas Instruments Inc. (2.7%), Comcast Corp., Special Class A Shares (2.3%), Biogen Idec Inc. (2.2%), Microsoft Corp. (2.2%), Johnson & Johnson (2.2%), Pfizer Inc. (2.1%), Merrill Lynch & Co. Inc. (2.1%), Cisco Systems Inc. (2.0%), Time Warner Inc. (1.9%) and Home Depot (1.9%). Please refer to pages 23 through 27 for a list and percentage breakdown of the Fund’s holdings.
The mention of sector breakdowns is for informational purposes only and should not be construed as a recommendation to purchase or sell any securities. The information provided regarding such sectors is not a sufficient basis upon which to make an investment decision. Investors seeking financial advice regarding the appropriateness of investing in any securities or investment strategies discussed should consult their financial professional. Portfolio holdings are subject to change at any time and may not be representative of the portfolio manager’s current or future investments. The Fund’s top five sector holdings (as a percentage of net assets) as of December 31, 2005 were: Health Care (19.1%), Information Technology (17.8%), Consumer Discretionary (17.8%), Financials (13.6%) and Industrials (9.1%). The Fund’s portfolio composition is subject to change at any time.
RISKS: Diversification does not assure against loss. The Fund may invest in small- and mid-cap companies that may involve a higher degree of risk and volatility than investments in large-cap companies. The Fund may use derivatives, such as options and future, which can be illiquid, may disproportionately increase losses, and have a potentially large impact on Fund performance. Please see the Fund���s prospectus for more information on these and other risks.
All index performance reflects no deduction for fees, expenses or taxes. Please note that an investor cannot invest directly in an index.
| i | | The S&P 500 Index is an unmanaged index of 500 stocks that is generally representative of the performance of larger companies in the U.S. |
| ii | | The Federal Reserve Board is responsible for the formulation of a policy designed to promote economic growth, full employment, stable prices, and a sustainable pattern of international trade and payments. |
| iii | | The Russell 3000 Index measures the performance of the 3,000 largest U.S. companies based on total market capitalization, which represent approximately 98% of the U.S. equity market. |
Smith Barney Multiple Discipline Trust 2005 Annual Report 3
Fund at a Glance (unaudited)
Multiple Discipline Portfolio — All Cap Growth and Value

4 Smith Barney Multiple Discipline Trust 2005 Annual Report
Historical Performance (unaudited)
Multiple Discipline Portfolio — All Cap Growth and Value
Value of $10,000 Invested in Shares of the Multiple Discipline Portfolio — All Cap Growth and Value vs. Russell 3000 Index† (October 2002 — December 2005)
| † | | Hypothetical illustration of $10,000 invested in shares of the Multiple Discipline Portfolio — All Cap Growth and Value on October 1, 2002 (commencement of operations), assuming reinvestment of all distributions, including returns of capital, if any, at net asset value through December 31, 2005. The Russell 3000 Index measures the performance of the 3,000 largest U.S. companies based on total market capitalization, which represent approximately 98% of the U.S. equity market. The Index is unmanaged and is not subject to the same management and trading expenses of a mutual fund. Please note that an investor cannot invest directly in an index. |
The performance shown above represents past performance. Past performance is no guarantee of future results and current performance may be higher or lower than the performance shown above. Investment return and principal value of an investment will fluctuate so that an investor’s shares, when redeemed, may be worth more or less than their original cost. Total returns do not reflect expenses associated with the separate account such as administrative fees, account charges and surrender charges, which, if reflected, would reduce the total returns. Performance figures may reflect voluntary fee waivers and/or expense reimbursements. In the absence of voluntary fee waivers and/or expense reimbursements, the total return would have been lower. To obtain performance data current to the most recent month-end, please visit our website at www.citigroupam.com.
| | | |
| Average Annual Total Returns* (unaudited) | |
Twelve Months Ended 12/31/05 | | 5.25 | % |
|
|
10/1/02** through 12/31/05 | | 14.92 | |
|
|
| | | |
| Cumulative Total Return* (unaudited) | |
10/1/02** through 12/31/05 | | 57.12 | % |
|
|
| * | | Assumes reinvestment of all distributions, including returns of capital, if any, at net asset value. All figures represent past performance and are not a guarantee of future results. Investment return and principal value of an investment will fluctuate so that an investor’s shares, when redeemed, may be worth more or less than their original cost. Total returns do not reflect expenses associated with the separate account such as administrative fees, account charges and surrender charges, which, if reflected, would reduce the total returns. Performance figures may reflect voluntary fee waivers and/or expense reimbursements. In the absence of voluntary fee waivers and/or expense reimbursements, the total return would have been lower. |
| ** | | Commencement of operations. |
Smith Barney Multiple Discipline Trust 2005 Annual Report 5
Manager Overview
Multiple Discipline Portfolio — Large Cap Growth and Value
Special Shareholder Notice
On or about April 7, 2006, the Multiple Discipline Portfolio — Large Cap Growth and Value will be renamed Legg Mason Partners Variable Multiple Discipline Portfolio — Large Cap Growth and Value.
Q. What were the overall market conditions during the Fund’s reporting period?
A. A resilient U.S. economy provided a positive backdrop for the stock market in 2005. Businesses across America did their part, as corporate profit growth was expected to exceed 10% for the third consecutive year. However, this did not translate into superior stock market returns, as the S&P 500 Indexi gained a relatively modest 4.91% in 2005. After trading in a fairly narrow range for much of the period, there were hopes that a year-end rally, similar to what occurred in 2003 and 2004, would propel stocks higher. However, after strong gains in November, the market treaded water in December as investor sentiment weakened due to fears of continued rate hikes by the Federal Reserve Boardii. Looking more closely at the stock market’s returns in 2005, among the Dow Jones industrial categories, oil & gas stocks generated the best returns, followed at a distance by utilities, and health care companies. In contrast, telecommunications, consumer services, and consumer goods stocks produced weak returns.
Performance Update1
For the 12 months ended December 31, 2005 shares of the Multiple Discipline Portfolio—Large Cap Growth and Value returned 3.55%. In comparison, the Fund’s unmanaged benchmarks, the Russell 1000 Indexiii and the S&P 500 Index, returned 6.27% and 4.91%, respectively, for the same period. The Fund’s Lipper Variable Large-Cap Core Funds Category Average2 returned 5.77%.
Q. What were the most significant factors affecting Fund performance?
What were the leading contributors to performance?
A. Areas that were positive contributors to relative results included overweights in the consumer staples and health care sectors. In addition, the Fund’s positioning in telecommunication services enhanced relative performance versus the benchmark.
In terms of individual holdings, the Fund’s largest contributors to performance were Genentech Inc., a biotechnology company that discovers, develops, manufactures, and commercializes multiple biotherapeutic and biotechnology products, Texas Instruments Inc., a technology firm that seeks to meet customers’ real world signal processing requirements, Gillette Co., a company that manufactures and sells a variety of consumer products throughout the world, Amgen Inc., a global biotechnology company, and financial services company Merrill Lynch & Co. Inc.
| 1 | | The Fund is an underlying investment option of various variable annuity and variable life insurance products. The Fund’s performance returns do not reflect the deduction of initial sales charges and expenses imposed in connection with investing in variable annuity or variable life insurance contracts, such as administrative fees, account charges, and surrender charges, which, if reflected, would reduce the performance of the Fund. Past performance is no guarantee of future results. |
| 2 | | Lipper, Inc. is a major independent mutual-fund tracking organization. Returns are based on the 12-month period ended December 31, 2005, including the reinvestment of distributions, including returns of capital, if any, calculated among the 220 funds in the Fund’s Lipper category. |
6 Smith Barney Multiple Discipline Trust 2005 Annual Report
What were the leading detractors from performance?
A. The Fund lagged the Russell 1000 benchmark due largely to an underweight in the energy sector and overweight in the information technology sector. The Fund’s holdings in materials stocks also detracted from results.
The largest detractors for the period were Lexmark International Inc., a developer, manufacturer, and supplier of printing solutions for homes and offices, computer company Dell Inc., Time Warner Inc., an Internet-powered media and communications company, Comcast Corp., which is involved in the development, management and operation of broadband cable networks and Walt Disney Co., a diversified worldwide entertainment company.
Q. Were there any significant changes to the Fund during the reporting period?
A. There was no change in MDF sleeve weightings, nor was there a specific net change in sector or market weightings.
Thank you for your investment in the Multiple Discipline Portfolio—Large Cap Growth and Value. As ever, we appreciate that you have chosen us to manage your assets and we remain focused on seeking to achieve the Fund’s investment goals.
Sincerely,
| | |
| | |
| Roger Paradiso | | Kirstin Mobyed |
| Coordinating Portfolio Manager | | Co-Coordinating Portfolio Manager |
February 1, 2006
The information provided is not intended to be a forecast of future events, a guarantee of future results or investment advice. Views expressed may differ from those of the firm as a whole.
Portfolio holdings and breakdowns are as of December 31, 2005 and are subject to change and may not be representative of the portfolio manager’s current or future investments. The Fund’s top ten holdings (as a percentage of net assets) as of this date were: Merrill Lynch & Co. Inc. (3.5%), American International Group Inc. (3.3%), Microsoft Corp. (3.2%), Pfizer Inc. (3.1%), Time Warner Inc. (2.9%), Johnson & Johnson (2.6%), Amgen Inc. (2.5%), Texas Instruments Inc. (2.5%), General Electric Co. (2.0%) and Intel Corp. (2.0%). Please refer to pages 28 through 31 for a list and percentage breakdown of the Fund’s holdings.
The mention of sector breakdowns is for informational purposes only and should not be construed as a recommendation to purchase or sell any securities. The information provided regarding such sectors is not a sufficient basis upon which to make an investment decision. Investors seeking financial advice regarding the appropriateness of investing in any securities or investment strategies discussed should consult their financial professional. Portfolio holdings are subject to change at any time and may not be representative of the portfolio manager’s current or future investments. The Fund’s top five sector holdings (as a percentage of net assets) as of December 31, 2005 were: Financials (18.2%), Consumer Discretionary (16.5%), Health Care (16.1%), Information Technology (16.0%) and Consumer Staples (10.5%). The Fund’s portfolio composition is subject to change at any time.
RISKS: Diversification does not assure against loss. The Fund may use derivatives, such as options and futures, which can be illiquid, may disproportionately increase losses, and have a potentially large impact on fund performance. Please see the Fund’s prospectus for more information on these and other risks.
All index performance reflects no deduction for fees, expenses or taxes. Please note that an investor cannot invest directly in an index.
| i | | The S&P 500 Index is an unmanaged index of 500 stocks that is generally representative of the performance of larger companies in the U.S. |
| ii | | The Federal Reserve Board is responsible for the formulation of a policy designed to promote economic growth, full employment, stable prices, and a sustainable pattern of international trade and payments. |
| iii | | The Russell 1000 Index measures the performance of the 1,000 largest companies in the Russell 3000 Index, which represents approximately 92% of the total market capitalization of the Russell 3000 Index. |
Smith Barney Multiple Discipline Trust 2005 Annual Report 7
Fund at a Glance (unaudited)
Multiple Discipline Portfolio — Large Cap Growth and Value
8 Smith Barney Multiple Discipline Trust 2005 Annual Report
Historical Performance (unaudited)
Multiple Discipline Portfolio — Large Cap Growth and Value
Value of $10,000 Invested in Shares of the Multiple Discipline Portfolio — Large Cap Growth and Value vs. Russell 1000 Index† (October 2002 — December 2005)
| † | | Hypothetical illustration of $10,000 invested in shares of the Multiple Discipline Portfolio — Large Cap Growth and Value on October 1, 2002 (commencement of operations), assuming reinvestment of all distributions, including returns of capital, if any, at net asset value through December 31, 2005. The Russell 1000 Index measures the performance of the 1,000 largest companies in the Russell 3000 Index, which represents approximately 92% of the total market capitalization of the Russell 3000 Index. The Index is unmanaged and is not subject to the same management and trading expenses of a mutual fund. Please note that an investor cannot invest directly in an index. |
The performance shown above represents past performance. Past performance is no guarantee of future results and current performance may be higher or lower than the performance shown above. Investment return and principal value of an investment will fluctuate so that an investor’s shares, when redeemed, may be worth more or less than their original cost. Total returns do not reflect expenses associated with the separate account such as administrative fees, account charges and surrender charges, which, if reflected, would reduce the total returns. Performance figures may reflect voluntary fee waivers and/or expense reimbursements. In the absence of voluntary fee waivers and/or expense reimbursements, the total return would have been lower. To obtain performance data current to the most recent month-end, please visit our website at www.citigroupam.com.
| | | |
| Average Annual Total Returns* (unaudited) | |
Twelve Months Ended 12/31/05 | | 3.55 | % |
|
|
10/1/02** through 12/31/05 | | 13.98 | |
|
|
| | | |
| Cumulative Total Return* (unaudited) | |
10/1/02** through 12/31/05 | | 53.00 | % |
|
|
| * | | Assumes reinvestment of all distributions, including returns of capital, if any, at net asset value. All figures represent past performance and are not a guarantee of future results. Investment return and principal value of an investment will fluctuate so that an investor’s shares, when redeemed, may be worth more or less than their original cost. Total returns do not reflect expenses associated with the separate account such as administrative fees, account charges and surrender charges, which, if reflected, would reduce the total returns. Performance figures may reflect voluntary fee waivers and/or expense reimbursements. In the absence of voluntary fee waivers and/or expense reimbursements, the total return would have been lower. |
| ** | | Commencement of operations. |
Smith Barney Multiple Discipline Trust 2005 Annual Report 9
Manager Overview
Multiple Discipline Portfolio — Global All Cap Growth and Value
Special Shareholder Notice
On or about April 7, 2006, the Multiple Discipline Portfolio — Global All Cap Growth and Value will be renamed Legg Mason Partners Variable Multiple Discipline Portfolio — Global All Cap Growth and Value.
Q. What were the overall market conditions during the Fund’s reporting period?
A. A resilient U.S. economy provided a positive backdrop for the stock market in 2005. Businesses across America did their part, as corporate profit growth was expected to exceed 10% for the third consecutive year. However, this did not translate into superior stock market returns, as the S&P 500 Indexi gained a relatively modest 4.91% in 2005. After trading in a fairly narrow range for much of the period, there were hopes that a year-end rally, similar to what occurred in 2003 and 2004, would propel stocks higher. However, after strong gains in November, the market treaded water in December as investor sentiment weakened due to fears of continued rate hikes by the Federal Reserve Boardii. Looking more closely at the stock market’s returns in 2005, among the Dow Jones industrial categories, oil & gas stocks generated the best returns, followed at a distance by utilities, and health care companies. In contrast, telecommunications, consumer services, and consumer goods stocks produced weak returns.
Performance Update1
For the 12 months ended December 31, 2005 shares of the Multiple Discipline Portfolio—Global All Cap Growth and Value returned 6.54%. In comparison, the Fund’s unmanaged benchmarks, the Russell 3000 Index,iii the MSCI EAFE Index,iv the MSCI World Indexv and the S&P 500 Index, returned 6.12%, 13.54%, 9.49% and 4.91%, respectively, for the same period. The Fund’s Lipper Variable Large-Cap Core Funds Category Average2 returned 5.77%.
Q. What were the most significant factors affecting Fund performance?
What were the leading contributors to performance?
A. The Fund outperformed the Russell 3000 benchmark over the year, due largely to its positioning in the financials sector. The Fund’s overweight in the consumer staples and information technology sectors also enhanced results.
In terms of individual holdings, the Fund’s largest contributors to performance were UnitedHealth Group Inc., a diversified health and well-being services company,
| 1 | | The Fund is an underlying investment option of various variable annuity and variable life insurance products. The Fund’s performance returns do not reflect the deduction of initial sales charges and expenses imposed in connection with investing in variable annuity or variable life insurance contracts, such as administrative fees, account charges, and surrender charges, which, if reflected, would reduce the performance of the Fund. Past performance is no guarantee of future results. |
| 2 | | Lipper, Inc. is a major independent mutual-fund tracking organization. Returns are based on the 12-month period ended December 31, 2005, including the reinvestment of distributions, including returns of capital, if any, calculated among the 220 funds in the Fund’s Lipper category. |
10 Smith Barney Multiple Discipline Trust 2005 Annual Report
SanDisk Corp., which designs, develops and markets flash storage card products used in a wide variety of consumer electronics, Genentech Inc., a biotechnology company that discovers, develops, manufactures, and commercializes multiple biotherapeutic and biotechnology products, financial service company Lehman Brothers Holdings Inc. and Texas Instruments Inc., a technology firm that seeks to meet customers’ real world signal processing requirements.
What were the leading detractors from performance?
A. The Fund’s underweights in the industrials, energy and utilities sectors detracted from performance versus the benchmark.
The largest detractors for the period were Lexmark International Inc., a developer, manufacturer, and supplier of printing solutions for homes and offices, Biogen Idec Inc., a company that develops, manufactures and commercializes novel therapies, Comcast Corp., which is involved in the development, management and operation of broadband cable networks, computer company Dell Inc. and Liberty Media Corp., a holding company that, through its ownership of interests in subsidiaries and other companies, is primarily engaged in the electronic retailing, media, communications, and entertainment industries.
Q. Were there any significant changes to the Fund during the reporting period?
A. There was no change in MDF sleeve weightings, nor was there a specific net change in sector or market weightings.
Thank you for your investment in the Multiple Discipline Portfolio—Global All Cap Growth and Value. As ever, we appreciate that you have chosen us to manage your assets and we remain focused on seeking to achieve the Fund’s investment goals.
Sincerely,
| | |
| | |
| Roger Paradiso | | Kirstin Mobyed |
| Coordinating Portfolio Manager | | Co-Coordinating Portfolio Manager |
February 1, 2006
Smith Barney Multiple Discipline Trust 2005 Annual Report 11
The information provided is not intended to be a forecast of future events, a guarantee of future results or investment advice. Views expressed may differ from those of the firm as a whole.
Portfolio holdings and breakdowns are as of December 31, 2005 and are subject to change and may not be representative of the portfolio manager’s current or future investments. The Fund’s top ten holdings (as a percentage of net assets) as of this date were: UnitedHealth Group Inc. (2.1%), Pfizer Inc. (2.1%), Merrill Lynch & Co. Inc. (2.1%), Biogen Idec Inc. (2.0%), Microsoft Corp. (1.9%), American International Group Inc. (1.9%), Liberty Media Corp., Class A Shares (1.8%), Time Warner Inc. (1.7%), Johnson & Johnson (1.5%) and Texas Instruments Inc. (1.5%). Please refer to pages 32 through 37 for a list and percentage breakdown of the Fund’s holdings.
The mention of sector breakdowns is for informational purposes only and should not be construed as a recommendation to purchase or sell any securities. The information provided regarding such sectors is not a sufficient basis upon which to make an investment decision. Investors seeking financial advice regarding the appropriateness of investing in any securities or investment strategies discussed should consult their financial professional. Portfolio holdings are subject to change at any time and may not be representative of the portfolio manager’s current or future investments. The Fund’s top five sector holdings (as a percentage of net assets) as of December 31, 2005 were: Health Care (17.9%), Financials (16.3%), Consumer Discretionary (15.6%), Information Technology (14.5%) and Consumer Staples (8.2%). The Fund’s portfolio composition is subject to change at any time.
RISKS: Diversification does not assure against loss. The Fund may invest in small- and mid-cap companies that may involve a higher degree of risk and volatility than investments in large-cap companies. The Fund may use derivatives, such as options and futures, which can be illiquid, may disproportionately increase losses, and have a potentially large impact on fund performance. Foreign stocks are subject to certain risks of overseas investing not associated with domestic investing such as currency fluctuations and changes in political and economic conditions, which could result in significant market fluctuation. These risks are magnified in emerging markets. Please see the Fund’s prospectus for more information on these and other risks.
All index performance reflects no deduction for fees, expenses or taxes. Please note that an investor cannot invest directly in an index.
| i | | The S&P 500 Index is an unmanaged index of 500 stocks that is generally representative of the performance of larger companies in the U.S. |
| ii | | The Federal Reserve Board is responsible for the formulation of a policy designed to promote economic growth, full employment, stable prices, and a sustainable pattern of international trade and payments. |
| iii | | The Russell 3000 Index measures the performance of the 3,000 largest U.S. companies based on total market capitalization, which represent approximately 98% of the U.S. equity market. |
| iv | | The MSCI EAFE Index is an unmanaged index of common stocks of companies located in Europe, Australasia and the Far East. |
| v | | The MSCI World Index is a market capitalization weighted equity index of over 1,500 stocks traded in 22 world markets. |
12 Smith Barney Multiple Discipline Trust 2005 Annual Report
Fund at a Glance (unaudited)
Multiple Discipline Portfolio — Global All Cap Growth and Value
Smith Barney Multiple Discipline Trust 2005 Annual Report 13
Historical Performance (unaudited)
Multiple Discipline Portfolio — Global All Cap Growth and Value
Value of $10,000 Invested in Shares of the Multiple Discipline Portfolio — Global All Cap Growth and Value vs. Russell 3000 Index, MSCI EAFE Index and MSCI World Index† (October 2002 — December 2005)
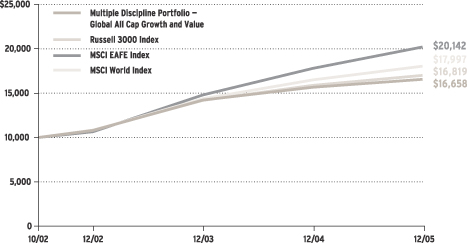
| † | | Hypothetical illustration of $10,000 invested in shares of the Multiple Discipline Portfolio — Global All Cap Growth and Value on October 1, 2002 (commencement of operations), assuming reinvestment of all distributions, including returns of capital, if any, at net asset value through December 31, 2005. The Russell 3000 Index measures the performance of the 3,000 largest U.S. companies based on total market capitalization, which represent approximately 98% of the U.S. equity market. The MSCI EAFE Index is an unmanaged index of common stocks of companies located in Europe, Australasia and the Far East. The MSCI World Index is a free float-adjusted market capitalization index that is designed to measure global developed market equity performance. The Indices are unmanaged and are not subject to the same management and trading expenses of a mutual fund. Please note that an investor cannot invest directly in an index. |
The performance shown above represents past performance. Past performance is no guarantee of future results and current performance may be higher or lower than the performance shown above. Investment return and principal value of an investment will fluctuate so that an investor’s shares, when redeemed, may be worth more or less than their original cost. Total returns do not reflect expenses associated with the separate account such as administrative fees, account charges and surrender charges, which, if reflected, would reduce the total returns. Performance figures may reflect voluntary fee waivers and/or expense reimbursements. In the absence of voluntary fee waivers and/or expense reimbursements, the total return would have been lower. To obtain performance data current to the most recent month-end, please visit our website at www.citigroupam.com.
| | | |
| Average Annual Total Returns* (unaudited) | |
Twelve Months Ended 12/31/05 | | 6.54 | % |
|
|
10/1/02** through 12/31/05 | | 17.01 | |
|
|
| | | |
| Cumulative Total Return* (unaudited) | |
10/1/02** through 12/31/05 | | 66.58 | % |
|
|
| * | | Assumes reinvestment of all distributions, including returns of capital, if any, at net asset value. All figures represent past performance and are not a guarantee of future results. Investment return and principal value of an investment will fluctuate so that an investor’s shares, when redeemed, may be worth more or less than their original cost. Total returns do not reflect expenses associated with the separate account such as administrative fees, account charges and surrender charges, which, if reflected, would reduce the total returns. Performance figures may reflect voluntary fee waivers and/or expense reimbursements. In the absence of voluntary fee waivers and/or expense reimbursements, the total return would have been lower. |
| ** | | Commencement of operations. |
14 Smith Barney Multiple Discipline Trust 2005 Annual Report
Manager Overview
Multiple Discipline Portfolio — Balanced All Cap Growth and Value
Special Shareholder Notice
On or about April 7, 2006, the Multiple Discipline Portfolio — Balanced All Cap Growth and Value will be renamed Legg Mason Partners Variable Multiple Discipline Portfolio — Balanced All Cap Growth and Value.
Q. What were the overall market conditions during the Fund’s reporting period?
A. A resilient U.S. economy provided a positive backdrop for the stock market in 2005. Businesses across America did their part, as corporate profit growth was expected to exceed 10% for the third consecutive year. However, this did not translate into superior stock market returns, as the S&P 500 Indexi gained a relatively modest 4.91% in 2005. After trading in a fairly narrow range for much of the period, there were hopes that a year-end rally, similar to what occurred in 2003 and 2004, would propel stocks higher. However, after strong gains in November, the market treaded water in December as investor sentiment weakened due to fears of continued rate hikes by the Federal Reserve Boardii. Looking more closely at the stock market’s returns in 2005, among the Dow Jones industrial categories, oil & gas stocks generated the best returns, followed at a distance by utilities, and health care companies. In contrast, telecommunications, consumer services, and consumer goods stocks produced weak returns.
Performance Update1
For the 12 months ended December 31, 2005 shares of the Multiple Discipline Portfolio —Balanced All Cap Growth and Value returned 4.25%. In comparison, the Fund’s unmanaged benchmarks, the Russell 1000 Indexiii, the Russell 3000 Growth Indexiv, the Russell 3000 Value Indexv, the Lehman Brothers Intermediate Treasury Bond Indexvi and the S&P 500 Index, returned 6.27%, 5.17%, 6.85%, 1.56% and 4.91%, respectively, for the same period. The Fund’s Lipper Variable Balanced Funds Category Average2 returned 4.78%.
Q. What were the most significant factors affecting Fund performance?
What were the leading contributors to performance?
A. Areas generating solid relative returns included the Fund’s holdings in the information technology, health care and consumer staples sectors.
In terms of individual equity holdings, the Fund’s largest contributors to performance were Texas Instruments Inc., a company that designs and supplies digital signal processors, SanDisk Corp. which develops flash memory data storage products, biotechnology giant Genentech Inc., Amgen Inc., a leading human therapeutics and biotechnology company, and UnitedHealth Group Inc., a health care service company.
| 1 | | The Fund is an underlying investment option of various variable annuity and variable life insurance products. The Fund’s performance returns do not reflect the deduction of initial sales charges and expenses imposed in connection with investing in variable annuity or variable life insurance contracts, such as administrative fees, account charges, and surrender charges, which, if reflected, would reduce the performance of the Fund. Past performance is no guarantee of future results. |
| 2 | | Lipper, Inc. is a major independent mutual-fund tracking organization. Returns are based on the 12-month period ended December 31, 2005, including the reinvestment of distributions, including returns of capital, if any, calculated among the 105 funds in the Fund’s Lipper category. |
Smith Barney Multiple Discipline Trust 2005 Annual Report 15
What were the leading detractors from performance?
A. The equity portion of the Fund lagged the Russell 3000 benchmark due largely to underweight positions in the energy and industrial sectors. In addition, its positioning in the financials sector detracted from results.
The largest equity detractors for the period were Comcast Corp., a cable and internet communications company, computer giant Dell Inc., Pfizer Inc., a research-based, global pharmaceutical company, Liberty Media Corp., a holding company that specializes in electronic retailing, media, communications and entertainment, and media conglomerate Walt Disney Co.
Q. Were there any significant changes to the Fund during the reporting period?
A. There was no change in MDF sleeve weightings, nor was there a specific net change in sector or market weightings.
Thank you for your investment in the Multiple Discipline Portfolio—Balanced All Cap Growth and Value. As ever, we appreciate that you have chosen us to manage your assets and we remain focused on seeking to achieve the Fund’s investment goals.
Sincerely,
| | |
| | |
| Roger Paradiso | | Kirstin Mobyed |
| Coordinating Portfolio Manager | | Co-Coordinating Portfolio Manager |
February 1, 2006
16 Smith Barney Multiple Discipline Trust 2005 Annual Report
The information provided is not intended to be a forecast of future events, a guarantee of future results or investment advice. Views expressed may differ from those of the firm as a whole.
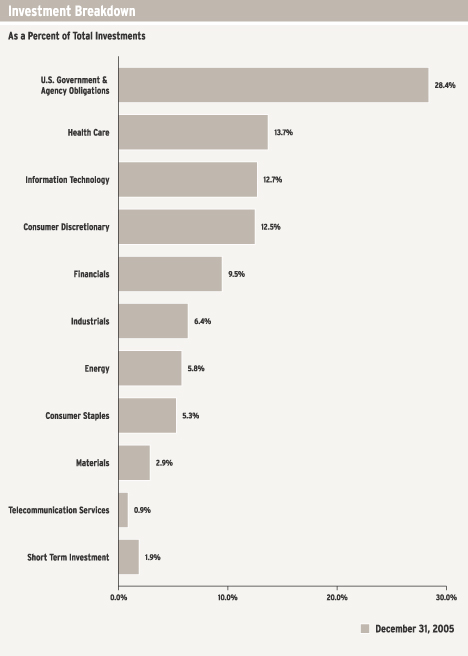
Portfolio holdings and breakdowns are as of December 31, 2005 and are subject to change and may not be representative of the portfolio manager’s current or future investments. The Fund’s top ten holdings (as a percentage of net assets) as of this date were: Federal Home Loan Mortgage Corp., 3.500% due 9/15/07 (5.8%), Federal National Mortgage Association, 3.375% due 12/15/08 (5.8%), United States Treasury Notes, 4.000% due 4/15/10 (4.3%), United States Treasury Notes, 4.625% due 5/15/06 (2.9%), United States Treasury Notes, 4.250% due 8/15/14 (2.6%), United States Treasury Notes, 5.000% due 2/15/11 (2.0%), Texas Instruments Inc. (1.9%), Biogen Idec Inc. (1.6%), Microsoft Corp. (1.6%) and Comcast Corp., Special Class A Shares (1.5%). Please refer to pages 38 through 43 for a list and percentage breakdown of the Fund’s holdings.
The mention of sector breakdowns is for informational purposes only and should not be construed as a recommendation to purchase or sell any securities. The information provided regarding such sectors is not a sufficient basis upon which to make an investment decision. Investors seeking financial advice regarding the appropriateness of investing in any securities or investment strategies discussed should consult their financial professional. Portfolio holdings are subject to change at any time and may not be representative of the portfolio manager’s current or future investments. The Fund’s top five sector holdings (as a percentage of net assets) as of December 31, 2005 were: U.S. Government & Agency Obligations (28.3%), Health Care (13.7%), Information Technology (12.6%), Consumer Discretionary (12.5%) and Financials (9.5%). The Fund’s portfolio composition is subject to change at any time.
RISKS: Diversification does not assure against loss. The Fund may invest in small- and mid-cap companies that may involve a higher degree of risk and volatility than investments in large-cap companies. Interest rates typically cause the prices of fixed income securities to decline and may reduce the value of the Fund’s share price. The Fund may use derivatives, such as options and futures, which can be illiquid, may disproportionately increase losses, and have a potentially large impact on Fund performance. Please read the prospectus, which describes these and other investment risks in greater detail. Please see the Fund’s prospectus for more information on these and other risks.
All index performance reflects no deduction for fees, expenses or taxes. Please note that an investor cannot invest directly in an index.
| i | | The S&P 500 Index is an unmanaged index of 500 stocks that is generally representative of the performance of larger companies in the U.S. |
| ii | | The Federal Reserve Board is responsible for the formulation of a policy designed to promote economic growth, full employment, stable prices, and a sustainable pattern of international trade and payments. |
| iii | | The Russell 1000 Index measures the performance of the 1,000 largest companies in the Russell 3000 Index, which represents approximately 92% of the total market capitalization of the Russell 3000 Index. |
| iv | | The Russell 3000 Growth Index measures the performance of those Russell 3000 Index companies with higher price-to-book ratios and higher forecasted growth values. |
| v | | The Russell 3000 Value Index measures the performance of those Russell 3000 Index companies with lower price-to-book ratios and lower forecasted growth values. (A price-to-book ratio is the price of a stock compared to the difference between a company’s assets and liabilities.) |
| vi | | The Lehman Brothers Intermediate Treasury Bond Index is an unmanaged index of U.S. Treasury bonds with maturities between one and ten years. |
Smith Barney Multiple Discipline Trust 2005 Annual Report 17
Fund at a Glance (unaudited)
Multiple Discipline Portfolio — Balanced All Cap Growth and Value
18 Smith Barney Multiple Discipline Trust 2005 Annual Report
Historical Performance (unaudited)
Multiple Discipline Portfolio — Balanced All Cap Growth and Value
Value of $10,000 Invested in Shares of the Multiple Discipline Portfolio — Balanced All Cap Growth and Value vs. Russell 1000 Index, Russell 3000 Growth Index, Russell 3000 Value Index and Lehman Brothers Intermediate Treasury Bond Index† (October 2002 — December 2005)
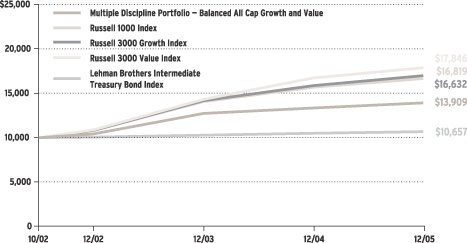
| † | | Hypothetical illustration of $10,000 invested in shares of the Multiple Discipline Portfolio — Balanced All Cap Growth and Value on October 1, 2002 (commencement of operations), assuming reinvestment of all distributions, including returns of capital, if any, at net asset value through December 31, 2005. The Russell 1000 Index measures the performance of the 1,000 largest companies in the Russell 3000 Index, which represents approximately 92% of the total market capitalization of the Russell 3000 Index. The Russell 3000 Growth Index measures the performance of those Russell 3000 Index companies with higher price-to-book ratios and higher forecasted growth values. (A price-to-book ratio is the price of a stock compared to the difference between a company’s assets and liabilities). The Russell 3000 Value Index measures the performance of those Russell 3000 Index companies with lower price-to-book ratios and lower forecasted growth values. The Lehman Brothers Intermediate Treasury Bond Index is an unmanaged index of U.S. Treasury bonds with maturities between one and ten years. The Indices are unmanaged and are not subject to the same management and trading expenses of a mutual fund. Please note that an investor cannot invest directly in an index. |
The performance shown above represent past performance. Past performance is no guarantee of future results and current performance may be higher or lower than the performance shown above. Investment return and principal value or an investment will fluctuate so that an investor’s shares, when redeemed, may be worth more or less than their original cost. The returns shown do not reflect the deduction of taxes that a shareholder would pay on fund distributions or the redemption of fund shares. Performance figures may reflect voluntary fee waivers and/or expense reimbursements. In the absence of voluntary fee waivers and/or expense reimbursements, the total return would have been lower. To obtain performance data current to the most recent month-end, please visit our website at www.citigroupam.com.
Smith Barney Multiple Discipline Trust 2005 Annual Report 19
Historical Performance (unaudited) (continued)
| | | |
| Average Annual Total Returns* (unaudited) | | | |
Twelve Months Ended 12/31/05 | | 4.25 | % |
|
|
10/1/02** through 12/31/05 | | 10.69 | |
|
|
| | | |
| Cumulative Total Return* (unaudited) | | | |
10/1/02** through 12/31/05 | | 39.09 | % |
|
|
| * | | Assumes reinvestment of all distributions, including returns of capital, if any, at net asset value. All figures represent past performance and are not a guarantee of future results. Investment return and principal value of an investment will fluctuate so that an investor’s shares, when redeemed, may be worth more or less than their original cost. Total returns do not reflect expenses associated with the separate account such as administrative fees, account charges and surrender charges, which, if reflected, would reduce the total returns. Performance figures may reflect voluntary fee waivers and/or expense reimbursements. In the absence of voluntary fee waivers and/or expense reimbursements, the total return would have been lower. |
| ** | | Commencement of operations. |
20 Smith Barney Multiple Discipline Trust 2005 Annual Report
Fund Expenses (unaudited)
Example
As a shareholder of the Funds, you may incur two types of costs: (1) transaction costs, including front-end and back-end sales charges (loads) on purchase payments, reinvested distributions, including returns of capital, if any; and (2) ongoing costs, including management fees; distribution and/or service (12b-1) fees; and other Fund expenses. This example is intended to help you understand your ongoing costs (in dollars) of investing in the Fund and to compare these costs with the ongoing costs of investing in other mutual funds.
This example is based on an investment of $1,000 invested on July 1, 2005 and held for the six months ended December 31, 2005.
Actual Expenses
The table below titled “Based on Actual Total Return” provides information about actual account values and actual expenses. You may use the information provided in this table, together with the amount you invested, to estimate the expenses that you paid over the period. To estimate the expenses you paid on your account, divide your ending account value by $1,000 (for example, an $8,600 ending account value divided by $1,000 = 8.6), then multiply the result by the number under the heading entitled “Expenses Paid During the Period”.
| | | | | | | | | | | | | | | |
| Based on Actual Total Return(1) | | | | | | | | | |
| | | | | |
| | | Actual
Total
Return(2) | | | Beginning
Account
Value | | Ending
Account
Value | | Annualized
Expense
Ratio | | | Expenses
Paid During
the Period(3) |
All Cap Growth and Value | | 7.13 | % | | $ | 1,000.00 | | $ | 1,071.30 | | 0.97 | % | | $ | 5.06 |
|
Large Cap Growth and Value | | 5.15 | | | | 1,000.00 | | | 1,051.50 | | 1.01 | | | | 5.22 |
|
Global All Cap Growth and Value | | 8.58 | | | | 1,000.00 | | | 1,085.80 | | 0.92 | | | | 4.84 |
|
Balanced All Cap Growth and Value | | 5.29 | | | | 1,000.00 | | | 1,052.90 | | 0.97 | | | | 5.02 |
|
| (1) | | For the six months ended December 31, 2005. |
| (2) | | Assumes reinvestment of all distributions, including returns of capital, if any, at net asset value. Total return is not annualized, as it may not be representative of the total return for the year. Total returns do not reflect expenses associated with the separate account such as administrative fees, account charges and surrender charges which, if reflected, would reduce the total returns. Performance figures may reflect voluntary fee waivers and/or expense reimbursements. Past performance is no guarantee of future results. In the absence of voluntary fee waivers and/or expense reimbursements, the total return would have been lower. |
| (3) | | Expenses (net of voluntary fee waiver) are equal to each Fund’s respective annualized expense ratio multiplied by the average account value over the period, multiplied by the number of days in the most recent fiscal half-year, then divided by 365. |
Smith Barney Multiple Discipline Trust 2005 Annual Report 21
Fund Expenses (unaudited) (continued)
Hypothetical Example for Comparison Purposes
The table below titled “Based on Hypothetical Total Return” provides information about hypothetical account values and hypothetical expenses based on the actual expense ratio and an assumed rate of return of 5.00% per year before expenses, which is not the Fund’s actual return. The hypothetical account values and expenses may not be used to estimate the actual ending account balance or expenses you paid for the period. You may use the information provided in this table to compare the ongoing costs of investing in the Funds and other funds. To do so, compare the 5.00% hypothetical example relating to the Fund with the 5.00% hypothetical examples that appear in the shareholder reports of the other funds.
Please note that the expenses shown in the table below are meant to highlight your ongoing costs only and do not reflect any transactional costs. Therefore, this table is useful in comparing ongoing costs only, and will not help you determine the relative total costs of owning different funds. In addition, if these transaction costs were included, your costs would have been higher.
| | | | | | | | | | | | | | | |
| Based on Hypothetical Total Return(1) | | | | | | | | | |
| | | | | |
| | | Hypothetical
Annualized
Total Return | | | Beginning
Account
Value | | Ending
Account
Value | | Annualized
Expense
Ratio | | | Expenses
Paid During
the Period(2) |
All Cap Growth and Value | | 5.00 | % | | $ | 1,000.00 | | $ | 1,020.31 | | 0.97 | % | | $ | 4.94 |
|
Large Cap Growth and Value | | 5.00 | | | | 1,000.00 | | | 1,020.11 | | 1.01 | | | | 5.14 |
|
Global All Cap Growth and Value | | 5.00 | | | | 1,000.00 | | | 1,020.56 | | 0.92 | | | | 4.69 |
|
Balanced All Cap Growth and Value | | 5.00 | | | | 1,000.00 | | | 1,020.31 | | 0.97 | | | | 4.94 |
|
| (1) | | For the six months ended December 31, 2005. |
| (2) | | Expenses (net of voluntary fee waiver) are equal to each Fund’s respective annualized expense ratio multiplied by the average account value over the period, multiplied by the number of days in the most recent fiscal half-year, then divided by 365. |
22 Smith Barney Multiple Discipline Trust 2005 Annual Report
Schedules of Investments (December 31, 2005)
ALL CAP GROWTH AND VALUE
| | | | | |
| | |
| Shares | | Security | | Value |
| | | | | | |
| COMMON STOCKS — 98.3% |
| CONSUMER DISCRETIONARY — 17.8% |
| Auto Components — 0.5% |
| 50,000 | | Lear Corp. | | $ | 1,423,000 |
|
| Hotels, Restaurants & Leisure — 1.2% |
| 66,945 | | Expedia Inc.* | | | 1,604,001 |
| 55,935 | | McDonald’s Corp. | | | 1,886,129 |
|
| | | Total Hotels, Restaurants & Leisure | | | 3,490,130 |
|
| Internet & Catalog Retail — 1.4% |
| 41,500 | | Amazon.com Inc.* | | | 1,956,725 |
| 66,945 | | IAC/InterActiveCorp.* | | | 1,895,213 |
|
| | | Total Internet & Catalog Retail | | | 3,851,938 |
|
| Leisure Equipment & Products — 1.1% |
| 108,740 | | Hasbro Inc. | | | 2,194,373 |
| 64,940 | | Mattel Inc. | | | 1,027,351 |
|
| | | Total Leisure Equipment & Products | | | 3,221,724 |
|
| Media — 10.7% |
| 92,340 | | Cablevision Systems Corp., New York Group, Class A Shares* | | | 2,167,220 |
| 21,500 | | Clear Channel Communications Inc. | | | 676,175 |
| 248,545 | | Comcast Corp., Special Class A Shares* | | | 6,385,121 |
| 32,377 | | Discovery Holding Co., Class A Shares* | | | 490,511 |
| 224,000 | | Interpublic Group of Cos. Inc.* | | | 2,161,600 |
| 6,938 | | Liberty Global Inc., Class A Shares* | | | 156,105 |
| 6,938 | | Liberty Global Inc., Series C Shares* | | | 147,086 |
| 433,779 | | Liberty Media Corp., Class A Shares* | | | 3,413,841 |
| 2,687 | | Live Nation* | | | 35,200 |
| 155,590 | | News Corp., Class B Shares | | | 2,584,350 |
| 120,000 | | Pearson PLC, Sponsored ADR | | | 1,424,400 |
| 316,535 | | Time Warner Inc. | | | 5,520,370 |
| 219,230 | | Walt Disney Co. | | | 5,254,943 |
|
| | | Total Media | | | 30,416,922 |
|
| Specialty Retail — 2.9% |
| 41,000 | | Bed Bath & Beyond Inc.* | | | 1,482,150 |
| 94,160 | | Charming Shoppes Inc.* | | | 1,242,912 |
| 132,234 | | Home Depot Inc. | | | 5,352,832 |
|
| | | Total Specialty Retail | | | 8,077,894 |
|
| | | TOTAL CONSUMER DISCRETIONARY | | | 50,481,608 |
|
| CONSUMER STAPLES — 7.6% |
| Beverages — 2.3% |
| 79,463 | | Coca-Cola Co. | | | 3,203,153 |
| 11,000 | | Molson Coors Brewing Co., Class B Shares | | | 736,890 |
| 44,013 | | PepsiCo Inc. | | | 2,600,288 |
|
| | | Total Beverages | | | 6,540,331 |
|
See Notes to Financial Statements.
Smith Barney Multiple Discipline Trust 2005 Annual Report 23
Schedules of Investments (December 31, 2005) (continued)
| | | | | |
| | |
| Shares | | Security | | Value |
| | | | | | |
| Food & Staples Retailing — 1.4% |
| 65,700 | | Safeway Inc. | | $ | 1,554,462 |
| 51,500 | | Wal-Mart Stores Inc. | | | 2,410,200 |
|
| | | Total Food & Staples Retailing | | | 3,964,662 |
|
| Food Products — 2.4% |
| 61,500 | | Kraft Foods Inc., Class A Shares | | | 1,730,610 |
| 68,700 | | Unilever PLC, Sponsored ADR | | | 2,756,244 |
| 36,040 | | Wm. Wrigley Jr. Co. | | | 2,396,300 |
|
| | | Total Food Products | | | 6,883,154 |
|
| Household Products — 1.5% |
| 73,841 | | Procter & Gamble Co. | | | 4,273,917 |
|
| | | TOTAL CONSUMER STAPLES | | | 21,662,064 |
|
| ENERGY — 7.9% | | | |
| Energy Equipment & Services — 2.7% | | | |
| 23,000 | | Baker Hughes Inc. | | | 1,397,940 |
| 31,640 | | GlobalSantaFe Corp. | | | 1,523,466 |
| 33,046 | | Grant Prideco Inc.* | | | 1,457,989 |
| 91,900 | | Weatherford International Ltd.* | | | 3,326,780 |
|
| | | Total Energy Equipment & Services | | | 7,706,175 |
|
| Oil, Gas & Consumable Fuels — 5.2% | | | |
| 42,260 | | Anadarko Petroleum Corp. | | | 4,004,135 |
| 31,820 | | BP PLC, Sponsored ADR | | | 2,043,480 |
| 19,800 | | Chevron Corp. | | | 1,124,046 |
| 66,780 | | Exxon Mobil Corp. | | | 3,751,033 |
| 33,620 | | Murphy Oil Corp. | | | 1,815,144 |
| 84,300 | | Williams Cos. Inc. | | | 1,953,231 |
|
| | | Total Oil, Gas & Consumable Fuels | | | 14,691,069 |
|
| | | TOTAL ENERGY | | | 22,397,244 |
|
| FINANCIALS — 13.6% | | | |
| Capital Markets — 4.5% | | | |
| 10,000 | | Goldman Sachs Group Inc. | | | 1,277,100 |
| 29,002 | | Lehman Brothers Holdings Inc. | | | 3,717,186 |
| 86,804 | | Merrill Lynch & Co. Inc. | | | 5,879,235 |
| 34,530 | | State Street Corp. | | | 1,914,343 |
|
| | | Total Capital Markets | | | 12,787,864 |
|
| Consumer Finance — 1.8% | | | |
| 56,145 | | American Express Co. | | | 2,889,222 |
| 77,520 | | MBNA Corp. | | | 2,104,668 |
|
| | | Total Consumer Finance | | | 4,993,890 |
|
| Diversified Financial Services — 1.2% | | | |
| 10,329 | | Ameriprise Financial Inc. | | | 423,489 |
| 76,332 | | JPMorgan Chase & Co. | | | 3,029,617 |
|
| | | Total Diversified Financial Services | | | 3,453,106 |
|
See Notes to Financial Statements.
24 Smith Barney Multiple Discipline Trust 2005 Annual Report
Schedules of Investments (December 31, 2005) (continued)
| | | | | |
| | |
| Shares | | Security | | Value |
| | | | | | |
| Insurance — 4.1% | | | |
| 20,315 | | Ambac Financial Group Inc. | | $ | 1,565,474 |
| 73,985 | | American International Group Inc. | | | 5,047,997 |
| 681 | | Berkshire Hathaway Inc., Class B Shares* | | | 1,999,075 |
| 31,785 | | Chubb Corp. | | | 3,103,805 |
|
| | | Total Insurance | | | 11,716,351 |
|
| Thrifts & Mortgage Finance — 2.0% | | | |
| 44,145 | | MGIC Investment Corp. | | | 2,905,624 |
| 70,000 | | PMI Group Inc. | | | 2,874,900 |
|
| | | Total Thrifts & Mortgage Finance | | | 5,780,524 |
|
| | | TOTAL FINANCIALS | | | 38,731,735 |
|
| HEALTH CARE — 19.1% | | | |
| Biotechnology — 8.4% | | | |
| 2,746 | | Alkermes Inc.* | | | 52,504 |
| 65,945 | | Amgen Inc.* | | | 5,200,423 |
| 138,655 | | Biogen Idec Inc.* | | | 6,285,231 |
| 94,590 | | Chiron Corp.* | | | 4,205,471 |
| 27,752 | | Genentech Inc.* | | | 2,567,060 |
| 23,550 | | Genzyme Corp.* | | | 1,666,869 |
| 65,000 | | ImClone Systems Inc.* | | | 2,225,600 |
| 183,120 | | Millennium Pharmaceuticals Inc.* | | | 1,776,264 |
|
| | | Total Biotechnology | | | 23,979,422 |
|
| Health Care Providers & Services — 1.5% |
| 69,260 | | UnitedHealth Group Inc. | | | 4,303,816 |
|
| Pharmaceuticals — 9.2% |
| 72,290 | | Abbott Laboratories | | | 2,850,395 |
| 28,000 | | Eli Lilly & Co. | | | 1,584,520 |
| 74,580 | | Forest Laboratories Inc.* | | | 3,033,914 |
| 43,130 | | GlaxoSmithKline PLC, Sponsored ADR | | | 2,177,202 |
| 103,224 | | Johnson & Johnson | | | 6,203,763 |
| 25,000 | | Novartis AG, Sponsored ADR | | | 1,312,000 |
| 258,016 | | Pfizer Inc. | | | 6,016,933 |
| 61,610 | | Wyeth | | | 2,838,373 |
|
| | | Total Pharmaceuticals | | | 26,017,100 |
|
| | | TOTAL HEALTH CARE | | | 54,300,338 |
|
| INDUSTRIALS — 9.1% | | | |
| Aerospace & Defense — 3.2% |
| 21,000 | | Boeing Co. | | | 1,475,040 |
| 71,960 | | Honeywell International Inc. | | | 2,680,510 |
| 30,186 | | L-3 Communications Holdings Inc. | | | 2,244,329 |
| 64,590 | | Raytheon Co. | | | 2,593,289 |
|
| | | Total Aerospace & Defense | | | 8,993,168 |
|
| Airlines — 0.7% |
| 129,830 | | Southwest Airlines Co. | | | 2,133,107 |
|
See Notes to Financial Statements.
Smith Barney Multiple Discipline Trust 2005 Annual Report 25
Schedules of Investments (December 31, 2005) (continued)
| | | | | |
| | |
| Shares | | Security | | Value |
| | | | | | |
| Electrical Equipment — 1.1% |
| 42,285 | | Emerson Electric Co. | | $ | 3,158,689 |
|
| Industrial Conglomerates — 2.7% |
| 99,200 | | General Electric Co. | | | 3,476,960 |
| 148,621 | | Tyco International Ltd. | | | 4,289,202 |
|
| | | Total Industrial Conglomerates | | | 7,766,162 |
|
| Machinery — 1.4% |
| 37,882 | | Caterpillar Inc. | | | 2,188,443 |
| 64,200 | | Pall Corp. | | | 1,724,412 |
|
| | | Total Machinery | | | 3,912,855 |
|
| | | TOTAL INDUSTRIALS | | | 25,963,981 |
|
| INFORMATION TECHNOLOGY — 17.8% | | | |
| Communications Equipment — 3.4% |
| 338,675 | | Cisco Systems Inc.* | | | 5,798,116 |
| 155,500 | | Lucent Technologies Inc.* | | | 413,630 |
| 82,220 | | Motorola Inc. | | | 1,857,350 |
| 92,210 | | Nokia Oyj, Sponsored ADR | | | 1,687,443 |
|
| | | Total Communications Equipment | | | 9,756,539 |
|
| Computers & Peripherals — 2.5% |
| 83,780 | | Dell Inc.* | | | 2,512,562 |
| 19,435 | | International Business Machines Corp. | | | 1,597,557 |
| 195,843 | | Maxtor Corp.* | | | 1,359,151 |
| 25,300 | | SanDisk Corp.* | | | 1,589,346 |
|
| | | Total Computers & Peripherals | | | 7,058,616 |
|
| Electronic Equipment & Instruments — 0.6% |
| 50,790 | | Agilent Technologies Inc.* | | | 1,690,799 |
|
| Internet Software & Services — 0.7% |
| 50,000 | | Yahoo! Inc.* | | | 1,959,000 |
|
| Semiconductors & Semiconductor Equipment — 6.8% |
| 80,000 | | Applied Materials Inc. | | | 1,435,200 |
| 829 | | Cabot Microelectronics Corp.* | | | 24,314 |
| 45,136 | | Cree Inc.* | | | 1,139,233 |
| 141,490 | | Intel Corp. | | | 3,531,590 |
| 180,162 | | Micron Technology Inc.* | | | 2,397,956 |
| 31,900 | | Novellus Systems Inc.* | | | 769,428 |
| 236,035 | | Taiwan Semiconductor Manufacturing Co., Ltd., Sponsored ADR | | | 2,339,107 |
| 236,710 | | Texas Instruments Inc. | | | 7,591,290 |
|
| | | Total Semiconductors & Semiconductor Equipment | | | 19,228,118 |
|
| Software — 3.8% |
| 42,900 | | Advent Software Inc.* | | | 1,240,239 |
| 25,820 | | Autodesk Inc. | | | 1,108,969 |
| 30,000 | | Electronic Arts Inc.* | | | 1,569,300 |
| 70,000 | | Micromuse Inc.* | | | 692,300 |
| 240,230 | | Microsoft Corp. | | | 6,282,015 |
|
| | | Total Software | | | 10,892,823 |
|
| | | TOTAL INFORMATION TECHNOLOGY | | | 50,585,895 |
|
See Notes to Financial Statements.
26 Smith Barney Multiple Discipline Trust 2005 Annual Report
Schedules of Investments (December 31, 2005) (continued)
| | | | | | | |
| | |
| Shares | | Security | | Value | |
| | MATERIALS — 4.1% | | | | |
| | Chemicals — 1.8% | |
| | 29,600 | | Dow Chemical Co. | | $ | 1,297,072 | |
| | 46,000 | | E.I. du Pont de Nemours & Co. | | | 1,955,000 | |
| | 62,180 | | Engelhard Corp. | | | 1,874,727 | |
|
|
|
| | | | Total Chemicals | | | 5,126,799 | |
|
|
|
| | Containers & Packaging — 0.2% | |
| | 48,500 | | Smurfit-Stone Container Corp.* | | | 687,245 | |
|
|
|
| | Metals & Mining — 1.0% | |
| | 97,495 | | Alcoa Inc. | | | 2,882,927 | |
|
|
|
| | Paper & Forest Products — 1.1% | |
| | 44,975 | | Weyerhaeuser Co. | | | 2,983,642 | |
|
|
|
| | | | TOTAL MATERIALS | | | 11,680,613 | |
|
|
|
| | TELECOMMUNICATION SERVICES — 1.3% | | | | |
| | Diversified Telecommunication Services — 0.7% | |
| | 64,440 | | Verizon Communications Inc. | | | 1,940,933 | |
|
|
|
| | Wireless Telecommunication Services — 0.6% | |
| | 82,860 | | Vodafone Group PLC, Sponsored ADR | | | 1,779,004 | |
|
|
|
| | | | TOTAL TELECOMMUNICATION SERVICES | | | 3,719,937 | |
|
|
|
| | | | TOTAL INVESTMENTS BEFORE SHORT-TERM INVESTMENT
(Cost — $248,603,196) | | | 279,523,415 | |
|
|
|
| | |
Face
Amount | | | | | |
| | SHORT-TERM INVESTMENT — 1.9% | | | | |
| | Repurchase Agreement — 1.9% | | | | |
| $ | 5,431,000 | | State Street Bank & Trust Co. dated 12/30/05, 3.050% due 1/3/06; Proceeds at maturity — $5,432,841; (Fully collateralized by U.S. Treasury Bond, 5.250% due 2/15/29; Market value — $5,545,022) (Cost — $5,431,000) | | | 5,431,000 | |
|
|
|
| | | | TOTAL INVESTMENTS — 100.2% (Cost — $254,034,196#) | | | 284,954,415 | |
| | | | Liabilities in Excess of Other Assets — (0.2)% | | | (573,993 | ) |
|
|
|
| | | | TOTAL NET ASSETS — 100.0% | | $ | 284,380,422 | |
|
|
|
| * | | Non-income producing security. |
| # | | Aggregate cost for federal income tax purposes is $254,141,963. |
| | |
Abbreviation used in this schedule:
|
| ADR — American Depositary Receipt |
See Notes to Financial Statements.
Smith Barney Multiple Discipline Trust 2005 Annual Report 27
Schedules of Investments (December 31, 2005) (continued)
LARGE CAP GROWTH AND VALUE
| | | | | |
| | |
| Shares | | Security | | Value |
| | | | | | |
| COMMON STOCKS — 94.3% |
| CONSUMER DISCRETIONARY — 16.5% |
| Hotels, Restaurants & Leisure — 1.8% |
| 14,750 | | Expedia Inc.* | | $ | 353,411 |
| 8,220 | | McDonald’s Corp. | | | 277,178 |
|
| | | Total Hotels, Restaurants & Leisure | | | 630,589 |
|
| Household Durables — 0.8% |
| 11,490 | | Newell Rubbermaid Inc. | | | 273,232 |
|
| Internet & Catalog Retail — 2.1% |
| 8,000 | | Amazon.com Inc.* | | | 377,200 |
| 13,750 | | IAC/InterActiveCorp.* | | | 389,263 |
|
| | | Total Internet & Catalog Retail | | | 766,463 |
|
| Media — 7.8% |
| 7,000 | | EchoStar Communications Corp., Class A Shares* | | | 190,190 |
| 44,790 | | Liberty Media Corp., Class A Shares* | | | 352,497 |
| 30,900 | | News Corp., Class B Shares | | | 513,249 |
| 60,050 | | Time Warner Inc. | | | 1,047,272 |
| 29,340 | | Walt Disney Co. | | | 703,280 |
|
| | | Total Media | | | 2,806,488 |
|
| Multiline Retail — 1.2% |
| 4,400 | | J.C. Penney Co. Inc. | | | 244,640 |
| 3,215 | | Target Corp. | | | 176,729 |
|
| | | Total Multiline Retail | | | 421,369 |
|
| Specialty Retail — 2.8% |
| 9,000 | | Bed Bath & Beyond Inc.* | | | 325,350 |
| 17,275 | | Home Depot Inc. | | | 699,292 |
|
| | | Total Specialty Retail | | | 1,024,642 |
|
| | | TOTAL CONSUMER DISCRETIONARY | | | 5,922,783 |
|
| CONSUMER STAPLES — 10.5% |
| Beverages — 3.4% |
| 17,320 | | Coca-Cola Co. | | | 698,169 |
| 8,960 | | PepsiCo Inc. | | | 529,357 |
|
| | | Total Beverages | | | 1,227,526 |
|
| Food & Staples Retailing — 1.0% |
| 18,990 | | Kroger Co.* | | | 358,531 |
|
| Food Products — 2.2% |
| 15,050 | | Sara Lee Corp. | | | 284,445 |
| 7,690 | | Wm. Wrigley Jr. Co. | | | 511,308 |
|
| | | Total Food Products | | | 795,753 |
|
See Notes to Financial Statements.
28 Smith Barney Multiple Discipline Trust 2005 Annual Report
Schedules of Investments (December 31, 2005) (continued)
| | | | | |
| | |
| Shares | | Security | | Value |
| | | | | | |
| Household Products — 2.2% |
| 4,665 | | Kimberly-Clark Corp. | | $ | 278,267 |
| 8,896 | | Procter & Gamble Co. | | | 514,901 |
|
| | | Total Household Products | | | 793,168 |
|
| Tobacco — 1.7% |
| 7,900 | | Altria Group Inc. | | | 590,288 |
|
| | | TOTAL CONSUMER STAPLES | | | 3,765,266 |
|
| ENERGY — 6.0% |
| Energy Equipment & Services — 1.4% |
| 4,810 | | Halliburton Co. | | | 298,028 |
| 3,000 | | Noble Corp. | | | 211,620 |
|
| | | Total Energy Equipment & Services | | | 509,648 |
|
| Oil, Gas & Consumable Fuels — 4.6% |
| 3,300 | | Burlington Resources Inc. | | | 284,460 |
| 7,285 | | Exxon Mobil Corp. | | | 409,198 |
| 4,140 | | Royal Dutch Shell PLC, ADR, Class A Shares | | | 254,569 |
| 3,650 | | Suncor Energy Inc. | | | 230,424 |
| 3,695 | | Total SA, Sponsored ADR | | | 467,048 |
|
| | | Total Oil, Gas & Consumable Fuels | | | 1,645,699 |
|
| | | TOTAL ENERGY | | | 2,155,347 |
|
| FINANCIALS — 18.2% |
| Capital Markets — 4.4% |
| 2,590 | | Goldman Sachs Group Inc. | | | 330,769 |
| 18,635 | | Merrill Lynch & Co. Inc. | | | 1,262,149 |
|
| | | Total Capital Markets | | | 1,592,918 |
|
| Commercial Banks — 3.8% |
| 11,602 | | Bank of America Corp. | | | 535,432 |
| 7,050 | | Wachovia Corp. | | | 372,663 |
| 7,500 | | Wells Fargo & Co. | | | 471,225 |
|
| | | Total Commercial Banks | | | 1,379,320 |
|
| Consumer Finance — 2.5% |
| 7,055 | | American Express Co. | | | 363,050 |
| 6,230 | | Capital One Financial Corp. | | | 538,272 |
|
| | | Total Consumer Finance | | | 901,322 |
|
| Diversified Financial Services — 1.1% |
| 10,215 | | JPMorgan Chase & Co. | | | 405,433 |
|
| Insurance — 5.5% |
| 17,160 | | American International Group Inc. | | | 1,170,827 |
| 118 | | Berkshire Hathaway Inc., Class B Shares* | | | 346,389 |
| 3,000 | | Chubb Corp. | | | 292,950 |
| 3,560 | | St. Paul Travelers Cos. Inc. | | | 159,025 |
|
| | | Total Insurance | | | 1,969,191 |
|
See Notes to Financial Statements.
Smith Barney Multiple Discipline Trust 2005 Annual Report 29
Schedules of Investments (December 31, 2005) (continued)
| | | | | |
| | |
| Shares | | Security | | Value |
| | | | | | |
| Thrifts & Mortgage Finance — 0.9% |
| 4,740 | | Golden West Financial Corp. | | $ | 312,840 |
| 80 | | Washington Mutual Inc. | | | 3,480 |
|
| | | Total Thrifts & Mortgage Finance | | | 316,320 |
|
| | | TOTAL FINANCIALS | | | 6,564,504 |
|
| HEALTH CARE — 16.1% | | | |
| Biotechnology — 5.8% |
| 11,440 | | Amgen Inc.* | | | 902,158 |
| 13,620 | | Biogen Idec Inc.* | | | 617,395 |
| 6,100 | | Genentech Inc.* | | | 564,250 |
|
| | | Total Biotechnology | | | 2,083,803 |
|
| Health Care Providers & Services — 2.2% |
| 6,950 | | UnitedHealth Group Inc. | | | 431,873 |
| 4,650 | | WellPoint Inc.* | | | 371,024 |
|
| | | Total Health Care Providers & Services | | | 802,897 |
|
| Pharmaceuticals — 8.1% |
| 5,500 | | Abbott Laboratories | | | 216,865 |
| 15,800 | | Johnson & Johnson | | | 949,580 |
| 4,650 | | Novartis AG, Sponsored ADR | | | 244,032 |
| 47,398 | | Pfizer Inc. | | | 1,105,321 |
| 8,650 | | Sanofi-Aventis, ADR | | | 379,735 |
|
| | | Total Pharmaceuticals | | | 2,895,533 |
|
| | | TOTAL HEALTH CARE | | | 5,782,233 |
|
| INDUSTRIALS — 5.4% |
| Aerospace & Defense — 1.6% | | | |
| 4,090 | | Boeing Co. | | | 287,282 |
| 7,050 | | Raytheon Co. | | | 283,057 |
|
| | | Total Aerospace & Defense | | | 570,339 |
|
| Commercial Services & Supplies — 0.8% |
| 4,950 | | Avery Dennison Corp. | | | 273,587 |
|
| Industrial Conglomerates — 3.0% |
| 20,610 | | General Electric Co. | | | 722,380 |
| 4,900 | | Textron Inc. | | | 377,202 |
|
| | | Total Industrial Conglomerates | | | 1,099,582 |
|
| | | TOTAL INDUSTRIALS | | | 1,943,508 |
|
| INFORMATION TECHNOLOGY — 16.0% | | | |
| Communications Equipment — 3.4% |
| 41,205 | | Cisco Systems Inc.* | | | 705,430 |
| 8,925 | | Comverse Technology Inc.* | | | 237,316 |
| 16,055 | | Nokia Oyj, Sponsored ADR | | | 293,806 |
|
| | | Total Communications Equipment | | | 1,236,552 |
|
See Notes to Financial Statements.
30 Smith Barney Multiple Discipline Trust 2005 Annual Report
Schedules of Investments (December 31, 2005) (continued)
| | | | | | | |
| | |
| Shares | | Security | | Value | |
| | | | | | | | |
| | Computers & Peripherals — 2.6% | |
| | 18,280 | | Dell Inc.* | | $ | 548,217 | |
| | 4,670 | | International Business Machines Corp. | | | 383,874 | |
|
|
|
| | | | Total Computers & Peripherals | | | 932,091 | |
|
|
|
| | Internet Software & Services — 1.3% | |
| | 11,700 | | Yahoo! Inc.* | | | 458,406 | |
|
|
|
| | Semiconductors & Semiconductor Equipment — 4.5% | |
| | 28,395 | | Intel Corp. | | | 708,739 | |
| | 27,670 | | Texas Instruments Inc. | | | 887,377 | |
|
|
|
| | | | Total Semiconductors & Semiconductor Equipment | | | 1,596,116 | |
|
|
|
| | Software — 4.2% | |
| | 6,950 | | Electronic Arts Inc.* | | | 363,555 | |
| | 44,310 | | Microsoft Corp. | | | 1,158,706 | |
|
|
|
| | | | Total Software | | | 1,522,261 | |
|
|
|
| | | | TOTAL INFORMATION TECHNOLOGY | | | 5,745,426 | |
|
|
|
| | MATERIALS — 0.8% | | | | |
| | Chemicals — 0.8% | |
| | 4,850 | | Air Products & Chemicals Inc. | | | 287,072 | |
|
|
|
| | TELECOMMUNICATION SERVICES — 3.9% | | | | |
| | Diversified Telecommunication Services — 1.5% | |
| | 21,761 | | SBC Communications Inc. | | | 532,927 | |
|
|
|
| | Wireless Telecommunication Services — 2.4% | |
| | 5,700 | | ALLTEL Corp. | | | 359,670 | |
| | 22,315 | | Sprint Nextel Corp. | | | 521,278 | |
|
|
|
| | | | Total Wireless Telecommunication Services | | | 880,948 | |
|
|
|
| | | | TOTAL TELECOMMUNICATION SERVICES | | | 1,413,875 | |
|
|
|
| | UTILITIES — 0.9% | |
| | Multi-Utilities — 0.9% | |
| | 7,100 | | Sempra Energy | | | 318,364 | |
|
|
|
| | | | TOTAL INVESTMENTS BEFORE SHORT-TERM INVESTMENT
(Cost — $30,961,744) | | | 33,898,378 | |
|
|
|
| | |
Face
Amount | | | | | |
| | SHORT-TERM INVESTMENT — 4.5% | |
| | Repurchase Agreement — 4.5% | |
| $ | 1,622,000 | | State Street Bank & Trust Co. dated 12/30/05, 3.050% due 1/3/06; Proceeds at maturity — $1,622,550; (Fully collateralized by U.S. Treasury Bond, 5.250% due 2/15/29; Market value — $1,656,232) (Cost — $1,622,000) | | | 1,622,000 | |
|
|
|
| | | | TOTAL INVESTMENTS — 98.8% (Cost — $32,583,744#) | | | 35,520,378 | |
| | | | Other Assets in Excess of Liabilities — 1.2% | | | 414,868 | |
|
|
|
| | | | TOTAL NET ASSETS — 100.0% | | $ | 35,935,246 | |
|
|
|
| * | | Non-income producing security. |
| # | | Aggregate cost for federal income tax purposes is $32,633,225. |
| | |
Abbreviation used in this schedule:
|
| ADR | | — American Depositary Receipt |
See Notes to Financial Statements.
Smith Barney Multiple Discipline Trust 2005 Annual Report 31
Schedules of Investments (December 31, 2005) (continued)
GLOBAL ALL CAP GROWTH AND VALUE
| | | | | |
| | |
| Shares | | Security | | Value |
| | | | | | |
| COMMON STOCKS — 92.8% |
| CONSUMER DISCRETIONARY — 15.6% |
| Automobiles — 0.4% |
| 11,450 | | Honda Motor Co., Ltd., Sponsored ADR | | $ | 331,706 |
|
| Hotels, Restaurants & Leisure — 1.1% |
| 21,125 | | Expedia Inc.* | | | 506,155 |
| 11,316 | | McDonald’s Corp. | | | 381,575 |
|
| | | Total Hotels, Restaurants & Leisure | | | 887,730 |
|
| Household Durables — 0.8% |
| 10,620 | | Koninklijke Philips Electronics NV, New York Registered Shares | | | 330,282 |
| 14,670 | | Newell Rubbermaid Inc. | | | 348,853 |
|
| | | Total Household Durables | | | 679,135 |
|
| Internet & Catalog Retail — 1.2% |
| 10,500 | | Amazon.com Inc.* | | | 495,075 |
| 17,165 | | IAC/InterActiveCorp.* | | | 485,941 |
|
| | | Total Internet & Catalog Retail | | | 981,016 |
|
| Media — 9.4% |
| 25,970 | | Cablevision Systems Corp., New York Group, Class A Shares* | | | 609,516 |
| 43,725 | | Comcast Corp., Special Class A Shares* | | | 1,123,295 |
| 8,599 | | Discovery Holding Co., Class A Shares* | | | 130,275 |
| 7,950 | | EchoStar Communications Corp., Class A Shares* | | | 216,001 |
| 4,560 | | Grupo Televisa SA, Sponsored ADR | | | 367,080 |
| 1,074 | | Liberty Global Inc., Class A Shares* | | | 24,165 |
| 1,074 | | Liberty Global Inc., Series C Shares* | | | 22,769 |
| 184,385 | | Liberty Media Corp., Class A Shares* | | | 1,451,110 |
| 69,180 | | News Corp., Class B Shares | | | 1,149,080 |
| 80,235 | | Time Warner Inc. | | | 1,399,298 |
| 39,115 | | Walt Disney Co. | | | 937,587 |
| 5,790 | | WPP Group PLC, Sponsored ADR | | | 312,660 |
|
| | | Total Media | | | 7,742,836 |
|
| Multiline Retail — 0.7% |
| 6,150 | | J.C. Penney Co. Inc. | | | 341,940 |
| 4,230 | | Target Corp. | | | 232,523 |
|
| | | Total Multiline Retail | | | 574,463 |
|
| Specialty Retail — 2.0% |
| 11,310 | | Bed Bath & Beyond Inc.* | | | 408,857 |
| 26,460 | | Charming Shoppes Inc.* | | | 349,272 |
| 23,165 | | Home Depot Inc. | | | 937,719 |
|
| | | Total Specialty Retail | | | 1,695,848 |
|
| | | TOTAL CONSUMER DISCRETIONARY | | | 12,892,734 |
|
See Notes to Financial Statements.
32 Smith Barney Multiple Discipline Trust 2005 Annual Report
Schedules of Investments (December 31, 2005) (continued)
| | | | | |
| | |
| Shares | | Security | | Value |
| | | | | | |
| CONSUMER STAPLES — 8.2% |
| Beverages — 2.4% |
| 24,030 | | Coca-Cola Co. | | $ | 968,649 |
| 5,250 | | Diageo PLC, Sponsored ADR | | | 306,075 |
| 12,145 | | PepsiCo Inc. | | | 717,527 |
|
| | | Total Beverages | | | 1,992,251 |
|
| Food & Staples Retailing — 1.4% |
| 26,150 | | Kroger Co.* | | | 493,712 |
| 19,150 | | Tesco PLC, Sponsored ADR | | | 333,210 |
| 6,450 | | Wal-Mart de Mexico SA de CV, Series V Shares, Sponsored ADR | | | 356,685 |
|
| | | Total Food & Staples Retailing | | | 1,183,607 |
|
| Food Products — 2.3% |
| 15,370 | | Groupe Danone, Sponsored ADR | | | 323,385 |
| 6,500 | | Nestle SA, Sponsored ADR | | | 485,225 |
| 19,250 | | Sara Lee Corp. | | | 363,825 |
| 10,390 | | Wm. Wrigley Jr. Co. | | | 690,831 |
|
| | | Total Food Products | | | 1,863,266 |
|
| Household Products — 1.4% |
| 5,725 | | Kimberly-Clark Corp. | | | 341,496 |
| 13,723 | | Procter & Gamble Co. | | | 794,287 |
|
| | | Total Household Products | | | 1,135,783 |
|
| Tobacco — 0.7% |
| 8,300 | | Altria Group Inc. | | | 620,176 |
|
| | | TOTAL CONSUMER STAPLES | | | 6,795,083 |
|
| ENERGY — 6.2% |
| Energy Equipment & Services — 2.1% |
| 6,015 | | Grant Prideco Inc.* | | | 265,382 |
| 5,800 | | Halliburton Co. | | | 359,368 |
| 3,000 | | Noble Corp. | | | 211,620 |
| 23,870 | | Weatherford International Ltd.* | | | 864,094 |
|
| | | Total Energy Equipment & Services | | | 1,700,464 |
|
| Oil, Gas & Consumable Fuels — 4.1% |
| 6,950 | | Anadarko Petroleum Corp. | | | 658,512 |
| 6,970 | | BP PLC, Sponsored ADR | | | 447,613 |
| 4,000 | | Burlington Resources Inc. | | | 344,800 |
| 7,750 | | Exxon Mobil Corp. | | | 435,318 |
| 4,950 | | Royal Dutch Shell PLC, ADR, Class A Shares | | | 304,376 |
| 4,400 | | Suncor Energy Inc. | | | 277,772 |
| 7,495 | | Total SA, Sponsored ADR | | | 947,368 |
|
| | | Total Oil, Gas & Consumable Fuels | | | 3,415,759 |
|
| | | TOTAL ENERGY | | | 5,116,223 |
|
See Notes to Financial Statements.
Smith Barney Multiple Discipline Trust 2005 Annual Report 33
Schedules of Investments (December 31, 2005) (continued)
| | | | | |
| | |
| Shares | | Security | | Value |
| | | | | | |
| FINANCIALS — 16.3% |
| Capital Markets — 4.9% |
| 3,080 | | Goldman Sachs Group Inc. | | $ | 393,347 |
| 8,285 | | Lehman Brothers Holdings Inc. | | | 1,061,889 |
| 25,440 | | Merrill Lynch & Co. Inc. | | | 1,723,051 |
| 21,010 | | Nomura Holdings Inc., ADR | | | 403,812 |
| 4,540 | | UBS AG, Registered Shares | | | 431,981 |
|
| | | Total Capital Markets | | | 4,014,080 |
|
| Commercial Banks — 3.9% |
| 16,062 | | Bank of America Corp. | | | 741,261 |
| 5,180 | | Bank of Ireland, Sponsored ADR | | | 327,946 |
| 5,600 | | Comerica Inc. | | | 317,856 |
| 4,070 | | HSBC Holdings PLC, Sponsored ADR | | | 327,513 |
| 16,500 | | National Bank of Greece SA, ADR | | | 141,240 |
| 17,380 | | United Overseas Bank Ltd., Sponsored ADR | | | 306,322 |
| 9,115 | | Wachovia Corp. | | | 481,819 |
| 9,500 | | Wells Fargo & Co. | | | 596,885 |
|
| | | Total Commercial Banks | | | 3,240,842 |
|
| Consumer Finance — 2.1% |
| 9,140 | | American Express Co. | | | 470,344 |
| 7,900 | | Capital One Financial Corp. | | | 682,560 |
| 4,400 | | ORIX Corp., Sponsored ADR | | | 560,120 |
|
| | | Total Consumer Finance | | | 1,713,024 |
|
| Diversified Financial Services — 1.7% |
| 10,310 | | ING Groep NV, Sponsored ADR | | | 358,994 |
| 13,185 | | JPMorgan Chase & Co. | | | 523,313 |
| 36,610 | | Mitsubishi UFJ Financial Group Inc., Sponsored ADR | | | 501,191 |
|
| | | Total Diversified Financial Services | | | 1,383,498 |
|
| Insurance — 3.2% |
| 22,450 | | American International Group Inc. | | | 1,531,763 |
| 11,095 | | AXA, Sponsored ADR | | | 358,701 |
| 92 | | Berkshire Hathaway Inc., Class B Shares* | | | 270,066 |
| 3,950 | | Chubb Corp. | | | 385,718 |
| 1,750 | | St. Paul Travelers Cos. Inc. | | | 78,173 |
|
| | | Total Insurance | | | 2,624,421 |
|
| Thrifts & Mortgage Finance — 0.5% |
| 6,500 | | Golden West Financial Corp. | | | 429,000 |
|
| | | TOTAL FINANCIALS | | | 13,404,865 |
|
| HEALTH CARE — 17.9% |
| Biotechnology — 7.4% |
| 730 | | Alkermes Inc.* | | | 13,957 |
| 14,970 | | Amgen Inc.* | | | 1,180,534 |
| 36,105 | | Biogen Idec Inc.* | | | 1,636,640 |
| 22,240 | | Chiron Corp.* | | | 988,790 |
See Notes to Financial Statements.
34 Smith Barney Multiple Discipline Trust 2005 Annual Report
Schedules of Investments (December 31, 2005) (continued)
| | | | | |
| | |
| Shares | | Security | | Value |
| | | | | | |
| Biotechnology — 7.4% (continued) |
| 8,050 | | Genentech Inc.* | | $ | 744,625 |
| 6,515 | | Genzyme Corp.* | | | 461,132 |
| 17,000 | | ImClone Systems Inc.* | | | 582,080 |
| 48,130 | | Millennium Pharmaceuticals Inc.* | | | 466,861 |
|
| | | Total Biotechnology | | | 6,074,619 |
|
| Health Care Equipment & Supplies — 0.4% |
| 7,100 | | Smith & Nephew PLC, Sponsored ADR | | | 329,085 |
|
| Health Care Providers & Services — 2.8% |
| 28,440 | | UnitedHealth Group Inc. | | | 1,767,262 |
| 6,300 | | WellPoint Inc.* | | | 502,677 |
|
| | | Total Health Care Providers & Services | | | 2,269,939 |
|
| Pharmaceuticals — 7.3% |
| 7,000 | | Abbott Laboratories | | | 276,010 |
| 20,790 | | Forest Laboratories Inc.* | | | 845,737 |
| 9,330 | | GlaxoSmithKline PLC, Sponsored ADR | | | 470,979 |
| 20,880 | | Johnson & Johnson | | | 1,254,888 |
| 12,300 | | Novartis AG, Sponsored ADR | | | 645,504 |
| 5,810 | | Novo-Nordisk A/S, Sponsored ADR | | | 327,335 |
| 75,152 | | Pfizer Inc. | | | 1,752,545 |
| 11,000 | | Sanofi-Aventis, ADR | | | 482,900 |
|
| | | Total Pharmaceuticals | | | 6,055,898 |
|
| | | TOTAL HEALTH CARE | | | 14,729,541 |
|
| INDUSTRIALS — 6.5% |
| Aerospace & Defense — 1.7% |
| 5,270 | | Boeing Co. | | | 370,165 |
| 8,770 | | L-3 Communications Holdings Inc. | | | 652,049 |
| 8,750 | | Raytheon Co. | | | 351,313 |
|
| | | Total Aerospace & Defense | | | 1,373,527 |
|
| Commercial Services & Supplies — 0.4% |
| 6,400 | | Avery Dennison Corp. | | | 353,728 |
|
| Industrial Conglomerates — 3.9% |
| 26,775 | | General Electric Co. | | | 938,464 |
| 6,820 | | Hutchison Whampoa Ltd., ADR | | | 324,632 |
| 6,350 | | Textron Inc. | | | 488,823 |
| 14,300 | | Tomkins PLC, Sponsored ADR | | | 294,723 |
| 40,285 | | Tyco International Ltd. | | | 1,162,625 |
|
| | | Total Industrial Conglomerates | | | 3,209,267 |
|
| Machinery — 0.5% |
| 16,540 | | Pall Corp. | | | 444,264 |
|
| | | TOTAL INDUSTRIALS | | | 5,380,786 |
|
See Notes to Financial Statements.
Smith Barney Multiple Discipline Trust 2005 Annual Report 35
Schedules of Investments (December 31, 2005) (continued)
| | | | | |
| | |
| Shares | | Security | | Value |
| | | | | | |
| INFORMATION TECHNOLOGY — 14.5% |
| Communications Equipment — 2.4% |
| 55,070 | | Cisco Systems Inc.* | | $ | 942,798 |
| 10,300 | | Comverse Technology Inc.* | | | 273,877 |
| 40,515 | | Nokia Oyj, Sponsored ADR | | | 741,425 |
|
| | | Total Communications Equipment | | | 1,958,100 |
|
| Computers & Peripherals — 2.3% |
| 23,580 | | Dell Inc.* | | | 707,164 |
| 6,150 | | International Business Machines Corp. | | | 505,530 |
| 42,370 | | Maxtor Corp.* | | | 294,048 |
| 6,200 | | SanDisk Corp.* | | | 389,484 |
|
| | | Total Computers & Peripherals | | | 1,896,226 |
|
| Electronic Equipment & Instruments — 0.6% |
| 9,015 | | Mettler-Toledo International Inc.* | | | 497,628 |
|
| Internet Software & Services — 0.6% |
| 13,000 | | Yahoo! Inc.* | | | 509,340 |
|
| Office Electronics — 0.6% |
| 8,810 | | Canon Inc., Sponsored ADR | | | 518,292 |
|
| Semiconductors & Semiconductor Equipment — 3.7% |
| 150 | | Cabot Microelectronics Corp.* | | | 4,400 |
| 11,830 | | Cree Inc.* | | | 298,589 |
| 37,870 | | Intel Corp. | | | 945,235 |
| 46,440 | | Micron Technology Inc.* | | | 618,116 |
| 37,970 | | Texas Instruments Inc. | | | 1,217,698 |
|
| | | Total Semiconductors & Semiconductor Equipment | | | 3,084,038 |
|
| Software — 4.3% |
| 11,760 | | Advent Software Inc.* | | | 339,982 |
| 7,380 | | Autodesk Inc. | | | 316,971 |
| 8,900 | | Electronic Arts Inc.* | | | 465,559 |
| 59,370 | | Microsoft Corp. | | | 1,552,525 |
| 10,470 | | SAP AG, Sponsored ADR | | | 471,883 |
| 9,500 | | Trend Micro Inc., Sponsored ADR* | | | 365,275 |
|
| | | Total Software | | | 3,512,195 |
|
| | | TOTAL INFORMATION TECHNOLOGY | | | 11,975,819 |
|
| MATERIALS — 2.4% |
| Chemicals — 1.3% |
| 6,200 | | Air Products & Chemicals Inc. | | | 366,978 |
| 4,250 | | BASF AG, Sponsored ADR | | | 325,040 |
| 9,620 | | BOC Group PLC, Sponsored ADR | | | 396,825 |
|
| | | Total Chemicals | | | 1,088,843 |
|
| Construction Materials — 0.6% |
| 17,740 | | CRH PLC, Sponsored ADR | | | 525,282 |
|
See Notes to Financial Statements.
36 Smith Barney Multiple Discipline Trust 2005 Annual Report
Schedules of Investments (December 31, 2005) (continued)
| | | | | | | |
| | |
| Shares | | Security | | Value | |
| | | | | | | | |
| | Metals & Mining — 0.5% | |
| | 2,070 | | Rio Tinto PLC, Sponsored ADR | | $ | 378,375 | |
|
|
|
| | | | TOTAL MATERIALS | | | 1,992,500 | |
|
|
|
| | TELECOMMUNICATION SERVICES — 3.9% | |
| | Diversified Telecommunication Services — 1.6% | |
| | 13,245 | | Nippon Telegraph & Telephone Corp., ADR | | | 302,119 | |
| | 29,608 | | SBC Communications Inc. | | | 725,100 | |
| | 6,802 | | Telefonica SA, Sponsored ADR | | | 306,226 | |
|
|
|
| | | | Total Diversified Telecommunication Services | | | 1,333,445 | |
|
|
|
| | Wireless Telecommunication Services — 2.3% | |
| | 7,250 | | ALLTEL Corp. | | | 457,475 | |
| | 15,710 | | SK Telecom Co., Ltd., Sponsored ADR | | | 318,756 | |
| | 29,484 | | Sprint Nextel Corp. | | | 688,746 | |
| | 20,675 | | Vodafone Group PLC, Sponsored ADR | | | 443,892 | |
|
|
|
| | | | Total Wireless Telecommunication Services | | | 1,908,869 | |
|
|
|
| | | | TOTAL TELECOMMUNICATION SERVICES | | | 3,242,314 | |
|
|
|
| | UTILITIES — 1.3% | |
| | Electric Utilities — 0.4% | |
| | 12,990 | | Endesa, SA, Sponsored ADR | | | 337,870 | |
|
|
|
| | Gas Utilities — 0.4% | |
| | 135,950 | | Hong Kong & China Gas, Sponsored ADR | | | 295,691 | |
|
|
|
| | Multi-Utilities — 0.5% | |
| | 9,800 | | Sempra Energy | | | 439,432 | |
|
|
|
| | | | TOTAL UTILITIES | | | 1,072,993 | |
|
|
|
| | | | TOTAL INVESTMENTS BEFORE SHORT-TERM INVESTMENT
(Cost — $68,089,530) | | | 76,602,858 | |
|
|
|
| | |
Face
Amount | | | | | |
| | SHORT-TERM INVESTMENT — 6.8% | |
| | Repurchase Agreement — 6.8% | |
| $ | 5,627,000 | | State Street Bank & Trust Co. dated 12/30/2005, 3.050% due 1/3/06; Proceeds at maturity — $5,628,907; (Fully collateralized by U.S. Treasury Bond,
5.250% due 2/15/29; Market value — $5,746,455) (Cost — $5,627,000) | | | 5,627,000 | |
|
|
|
| | | | TOTAL INVESTMENTS — 99.6% (Cost — $73,716,530#) | | | 82,229,858 | |
| | | | Other Assets in Excess of Liabilities — 0.4% | | | 334,020 | |
|
|
|
| | | | TOTAL NET ASSETS — 100.0% | | $ | 82,563,878 | |
|
|
|
| * | | Non-income producing security. |
| # | | Aggregate cost for federal income tax purposes is $74,043,856. |
| | |
Abbreviation used in this schedule:
|
| ADR | | — American Depositary Receipt |
See Notes to Financial Statements.
Smith Barney Multiple Discipline Trust 2005 Annual Report 37
Schedules of Investments (December 31, 2005) (continued)
BALANCED ALL CAP GROWTH AND VALUE
| | | | | | | |
| | |
Face
Amount | | Security | | Value | |
| | | | | | | | |
| | U.S. GOVERNMENT & AGENCY OBLIGATIONS — 28.3% | | | | |
| | U.S. Government Agencies — 13.0% | | | | |
| $ | 12,860,000 | | Federal Home Loan Mortgage Corp. (FHLMC), 3.500% due 9/15/07 | | $ | 12,616,882 | |
| | | | Federal National Mortgage Association (FNMA): | | | | |
| | 3,190,000 | | 3.800% due 1/18/08 | | | 3,130,829 | |
| | 12,955,000 | | 3.375% due 12/15/08 | | | 12,494,838 | |
|
|
|
| | | | Total U.S. Government Agencies | | | 28,242,549 | |
|
|
|
| | U.S. Government Obligations — 15.3% | | | | |
| | | | U.S. Treasury Notes: | | | | |
| | 6,325,000 | | 4.625% due 5/15/06 | | | 6,333,406 | |
| | 3,265,000 | | 3.375% due 9/15/09 | | | 3,156,977 | |
| | 9,400,000 | | 4.000% due 4/15/10 | | | 9,266,351 | |
| | 4,200,000 | | 5.000% due 2/15/11 | | | 4,327,151 | |
| | 5,790,000 | | 4.250% due 8/15/14 | | | 5,728,487 | |
| | | | Inflation Indexed: | | | | |
| | 1,566,616 | | 0.875% due 4/15/10 | | | 1,489,816 | |
| | 2,958,788 | | 2.000% due 7/15/14 | | | 2,943,186 | |
|
|
|
| | | | Total U.S. Government Obligations | | | 33,245,374 | |
|
|
|
| | | | TOTAL U.S. GOVERNMENT & AGENCY OBLIGATIONS
(Cost — $62,317,889) | | | 61,487,923 | |
|
|
|
| | |
| Shares | | | | | |
| | COMMON STOCKS — 69.6% | | | | |
| | CONSUMER DISCRETIONARY — 12.5% | | | | |
| | Auto Components — 0.3% | | | | |
| | 26,500 | | Lear Corp. | | | 754,190 | |
|
|
|
| | Hotels, Restaurants & Leisure — 0.9% | | | | |
| | 39,595 | | Expedia Inc.* | | | 948,696 | |
| | 28,920 | | McDonald’s Corp. | | | 975,183 | |
|
|
|
| | | | Total Hotels, Restaurants & Leisure | | | 1,923,879 | |
|
|
|
| | Internet & Catalog Retail — 1.0% | | | | |
| | 25,500 | | Amazon.com Inc.* | | | 1,202,325 | |
| | 33,595 | | IAC/InterActiveCorp.* | | | 951,075 | |
|
|
|
| | | | Total Internet & Catalog Retail | | | 2,153,400 | |
|
|
|
| | Leisure Equipment & Products — 0.8% | | | | |
| | 58,180 | | Hasbro Inc. | | | 1,174,072 | |
| | 33,900 | | Mattel Inc. | | | 536,298 | |
|
|
|
| | | | Total Leisure Equipment & Products | | | 1,710,370 | |
|
|
|
| | Media — 7.4% | | | | |
| | 46,765 | | Cablevision Systems Corp., New York Group, Class A Shares* | | | 1,097,574 | |
| | 11,000 | | Clear Channel Communications Inc. | | | 345,950 | |
See Notes to Financial Statements.
38 Smith Barney Multiple Discipline Trust 2005 Annual Report
Schedules of Investments (December 31, 2005) (continued)
| | | | | |
| | |
| Shares | | Security | | Value |
| | | | | | |
| Media — 7.4% (continued) | | | |
| 129,870 | | Comcast Corp., Special Class A Shares* | | $ | 3,336,360 |
| 16,958 | | Discovery Holding Co., Class A Shares* | | | 256,914 |
| 117,500 | | Interpublic Group of Cos. Inc.* | | | 1,133,875 |
| 3,554 | | Liberty Global Inc., Class A Shares* | | | 79,965 |
| 3,554 | | Liberty Global Inc., Series C Shares* | | | 75,345 |
| 226,585 | | Liberty Media Corp., Class A Shares* | | | 1,783,224 |
| 1,375 | | Live Nation* | | | 18,012 |
| 80,270 | | News Corp., Class B Shares | | | 1,333,285 |
| 61,000 | | Pearson PLC, Sponsored ADR | | | 724,070 |
| 171,195 | | Time Warner Inc. | | | 2,985,641 |
| 117,980 | | Walt Disney Co. | | | 2,827,981 |
|
| | | Total Media | | | 15,998,196 |
|
| Specialty Retail — 2.1% | | | |
| 23,500 | | Bed Bath & Beyond Inc.* | | | 849,525 |
| 48,660 | | Charming Shoppes Inc.* | | | 642,312 |
| 74,005 | | Home Depot Inc. | | | 2,995,722 |
|
| | | Total Specialty Retail | | | 4,487,559 |
|
| | | TOTAL CONSUMER DISCRETIONARY | | | 27,027,594 |
|
| CONSUMER STAPLES — 5.2% | | | |
| Beverages — 1.5% | | | |
| 41,605 | | Coca-Cola Co. | | | 1,677,098 |
| 6,000 | | Molson Coors Brewing Co., Class B Shares | | | 401,940 |
| 22,535 | | PepsiCo Inc. | | | 1,331,368 |
|
| | | Total Beverages | | | 3,410,406 |
|
| Food & Staples Retailing — 1.0% | | | |
| 34,070 | | Safeway Inc. | | | 806,096 |
| 28,500 | | Wal-Mart Stores Inc. | | | 1,333,800 |
|
| | | Total Food & Staples Retailing | | | 2,139,896 |
|
| Food Products — 1.7% | | | |
| 31,500 | | Kraft Foods Inc., Class A Shares | | | 886,410 |
| 38,000 | | Unilever PLC, Sponsored ADR | | | 1,524,560 |
| 19,390 | | Wm. Wrigley Jr. Co. | | | 1,289,241 |
|
| | | Total Food Products | | | 3,700,211 |
|
| Household Products — 1.0% | | | |
| 36,591 | | Procter & Gamble Co. | | | 2,117,887 |
|
| | | TOTAL CONSUMER STAPLES | | | 11,368,400 |
|
| ENERGY — 5.8% | | | |
| Energy Equipment & Services — 2.0% | | | |
| 15,000 | | Baker Hughes Inc. | | | 911,700 |
| 17,760 | | GlobalSantaFe Corp. | | | 855,144 |
| 18,375 | | Grant Prideco Inc.* | | | 810,705 |
| 47,040 | | Weatherford International Ltd.* | | | 1,702,848 |
|
| | | Total Energy Equipment & Services | | | 4,280,397 |
|
See Notes to Financial Statements.
Smith Barney Multiple Discipline Trust 2005 Annual Report 39
Schedules of Investments (December 31, 2005) (continued)
| | | | | |
| | |
| Shares | | Security | | Value |
| | | | | | |
| Oil, Gas & Consumable Fuels — 3.8% | | | |
| 22,220 | | Anadarko Petroleum Corp. | | $ | 2,105,345 |
| 17,450 | | BP PLC, Sponsored ADR | | | 1,120,639 |
| 15,300 | | Chevron Corp. | | | 868,581 |
| 38,855 | | Exxon Mobil Corp. | | | 2,182,485 |
| 19,420 | | Murphy Oil Corp. | | | 1,048,486 |
| 44,850 | | Williams Cos. Inc. | | | 1,039,175 |
|
| | | Total Oil, Gas & Consumable Fuels | | | 8,364,711 |
|
| | | TOTAL ENERGY | | | 12,645,108 |
|
| FINANCIALS — 9.5% | | | |
| Capital Markets — 3.0% | | | |
| 5,000 | | Goldman Sachs Group Inc. | | | 638,550 |
| 15,285 | | Lehman Brothers Holdings Inc. | | | 1,959,079 |
| 44,960 | | Merrill Lynch & Co. Inc. | | | 3,045,141 |
| 16,380 | | State Street Corp. | | | 908,107 |
|
| | | Total Capital Markets | | | 6,550,877 |
|
| Consumer Finance — 1.2% | | | |
| 30,085 | | American Express Co. | | | 1,548,174 |
| 41,990 | | MBNA Corp. | | | 1,140,029 |
|
| | | Total Consumer Finance | | | 2,688,203 |
|
| Diversified Financial Services — 0.9% | | | |
| 5,417 | | Ameriprise Financial Inc. | | | 222,097 |
| 40,554 | | JPMorgan Chase & Co. | | | 1,609,588 |
|
| | | Total Diversified Financial Services | | | 1,831,685 |
|
| Insurance — 2.9% |
| 11,925 | | Ambac Financial Group Inc. | | | 918,941 |
| 39,050 | | American International Group Inc. | | | 2,664,381 |
| 355 | | Berkshire Hathaway Inc., Class B Shares* | | | 1,042,103 |
| 17,310 | | Chubb Corp. | | | 1,690,321 |
|
| | | Total Insurance | | | 6,315,746 |
|
| Thrifts & Mortgage Finance — 1.5% |
| 24,365 | | MGIC Investment Corp. | | | 1,603,704 |
| 38,000 | | PMI Group Inc. | | | 1,560,660 |
|
| | | Total Thrifts & Mortgage Finance | | | 3,164,364 |
|
| | | TOTAL FINANCIALS | | | 20,550,875 |
|
| HEALTH CARE — 13.7% | | | |
| Biotechnology — 6.1% |
| 1,690 | | Alkermes Inc.* | | | 32,313 |
| 35,500 | | Amgen Inc.* | | | 2,799,530 |
| 75,455 | | Biogen Idec Inc.* | | | 3,420,375 |
| 52,545 | | Chiron Corp.* | | | 2,336,151 |
| 15,850 | | Genentech Inc.* | | | 1,466,125 |
| 14,425 | | Genzyme Corp.* | | | 1,021,001 |
See Notes to Financial Statements.
40 Smith Barney Multiple Discipline Trust 2005 Annual Report
Schedules of Investments (December 31, 2005) (continued)
| | | | | |
| | |
| Shares | | Security | | Value |
| | | | | | |
| Biotechnology — 6.1% (continued) |
| 33,500 | | ImClone Systems Inc.* | | $ | 1,147,040 |
| 96,650 | | Millennium Pharmaceuticals Inc.* | | | 937,505 |
|
| | | Total Biotechnology | | | 13,160,040 |
|
| Health Care Providers & Services — 1.1% |
| 38,780 | | UnitedHealth Group Inc. | | | 2,409,789 |
|
| Pharmaceuticals — 6.5% |
| 38,910 | | Abbott Laboratories | | | 1,534,221 |
| 15,000 | | Eli Lilly & Co. | | | 848,850 |
| 41,260 | | Forest Laboratories Inc.* | | | 1,678,457 |
| 23,350 | | GlaxoSmithKline PLC, Sponsored ADR | | | 1,178,708 |
| 53,875 | | Johnson & Johnson | | | 3,237,888 |
| 15,000 | | Novartis AG, Sponsored ADR | | | 787,200 |
| 139,673 | | Pfizer Inc. | | | 3,257,174 |
| 34,695 | | Wyeth | | | 1,598,399 |
|
| | | Total Pharmaceuticals | | | 14,120,897 |
|
| | | TOTAL HEALTH CARE | | | 29,690,726 |
|
| INDUSTRIALS — 6.4% | | | |
| Aerospace & Defense — 2.2% |
| 11,020 | | Boeing Co. | | | 774,045 |
| 38,000 | | Honeywell International Inc. | | | 1,415,500 |
| 16,560 | | L-3 Communications Holdings Inc. | | | 1,231,236 |
| 34,815 | | Raytheon Co. | | | 1,397,822 |
|
| | | Total Aerospace & Defense | | | 4,818,603 |
|
| Airlines — 0.5% |
| 74,800 | | Southwest Airlines Co. | | | 1,228,964 |
|
| Electrical Equipment — 0.8% |
| 22,505 | | Emerson Electric Co. | | | 1,681,124 |
|
| Industrial Conglomerates — 1.9% |
| 52,010 | | General Electric Co. | | | 1,822,950 |
| 78,950 | | Tyco International Ltd. | | | 2,278,497 |
|
| | | Total Industrial Conglomerates | | | 4,101,447 |
|
| Machinery — 1.0% |
| 20,830 | | Caterpillar Inc. | | | 1,203,349 |
| 34,090 | | Pall Corp. | | | 915,657 |
|
| | | Total Machinery | | | 2,119,006 |
|
| | | TOTAL INDUSTRIALS | | | 13,949,144 |
|
| INFORMATION TECHNOLOGY — 12.6% | | | |
| Communications Equipment — 2.4% | | | |
| 171,510 | | Cisco Systems Inc.* | | | 2,936,251 |
| 125,000 | | Lucent Technologies Inc.* | | | 332,500 |
| 45,115 | | Motorola Inc. | | | 1,019,148 |
| 46,740 | | Nokia Oyj, Sponsored ADR | | | 855,342 |
|
| | | Total Communications Equipment | | | 5,143,241 |
|
See Notes to Financial Statements.
Smith Barney Multiple Discipline Trust 2005 Annual Report 41
Schedules of Investments (December 31, 2005) (continued)
| | | | | |
| | |
| Shares | | Security | | Value |
| | | | | | |
| Computers & Peripherals — 1.8% | | | |
| 45,080 | | Dell Inc.* | | $ | 1,351,949 |
| 10,360 | | International Business Machines Corp. | | | 851,592 |
| 101,085 | | Maxtor Corp.* | | | 701,530 |
| 17,860 | | SanDisk Corp.* | | | 1,121,965 |
|
| | | Total Computers & Peripherals | | | 4,027,036 |
|
| Electronic Equipment & Instruments — 0.4% | | | |
| 28,775 | | Agilent Technologies Inc.* | | | 957,920 |
|
| Internet Software & Services — 0.5% | | | |
| 28,000 | | Yahoo! Inc.* | | | 1,097,040 |
|
| Semiconductors & Semiconductor Equipment — 4.7% | | | |
| 47,500 | | Applied Materials Inc. | | | 852,150 |
| 505 | | Cabot Microelectronics Corp.* | | | 14,812 |
| 23,215 | | Cree Inc.* | | | 585,947 |
| 73,290 | | Intel Corp. | | | 1,829,318 |
| 91,340 | | Micron Technology Inc.* | | | 1,215,735 |
| 15,000 | | Novellus Systems Inc.* | | | 361,800 |
| 124,222 | | Taiwan Semiconductor Manufacturing Co., Ltd., Sponsored ADR | | | 1,231,040 |
| 125,400 | | Texas Instruments Inc. | | | 4,021,578 |
|
| | | Total Semiconductors & Semiconductor Equipment | | | 10,112,380 |
|
| Software — 2.8% | | | |
| 22,890 | | Advent Software Inc.* | | | 661,750 |
| 13,240 | | Autodesk Inc. | | | 568,658 |
| 15,500 | | Electronic Arts Inc.* | | | 810,805 |
| 65,000 | | Micromuse Inc.* | | | 642,850 |
| 130,240 | | Microsoft Corp. | | | 3,405,776 |
|
| | | Total Software | | | 6,089,839 |
|
| | | TOTAL INFORMATION TECHNOLOGY | | | 27,427,456 |
|
| MATERIALS — 2.9% | | | |
| Chemicals — 1.3% | | | |
| 14,500 | | Dow Chemical Co. | | | 635,390 |
| 25,000 | | E.I. du Pont de Nemours & Co. | | | 1,062,500 |
| 34,080 | | Engelhard Corp. | | | 1,027,512 |
|
| | | Total Chemicals | | | 2,725,402 |
|
| Containers & Packaging — 0.2% | | | |
| 30,500 | | Smurfit-Stone Container Corp.* | | | 432,185 |
|
| Metals & Mining — 0.7% | | | |
| 51,035 | | Alcoa Inc. | | | 1,509,105 |
|
| Paper & Forest Products — 0.7% | | | |
| 23,340 | | Weyerhaeuser Co. | | | 1,548,375 |
|
| | | TOTAL MATERIALS | | | 6,215,067 |
|
See Notes to Financial Statements.
42 Smith Barney Multiple Discipline Trust 2005 Annual Report
Schedules of Investments (December 31, 2005) (continued)
| | | | | | | |
| | |
| Shares | | Security | | Value | |
| | | | | | | | |
| | TELECOMMUNICATION SERVICES — 1.0% | |
| | Diversified Telecommunication Services — 0.5% | |
| | 35,570 | | Verizon Communications Inc. | | $ | 1,071,368 | |
|
|
|
| | Wireless Telecommunication Services — 0.5% | | | | |
| | 48,570 | | Vodafone Group PLC, Sponsored ADR | | | 1,042,798 | |
|
|
|
| | | | TOTAL TELECOMMUNICATION SERVICES | | | 2,114,166 | |
|
|
|
| | | | TOTAL COMMON STOCKS
(Cost — $133,209,218) | | | 150,988,536 | |
|
|
|
| | | | TOTAL INVESTMENTS BEFORE SHORT-TERM INVESTMENT
(Cost — $195,527,107) | | | 212,476,459 | |
|
|
|
| | |
Face
Amount | | | | | |
| | SHORT-TERM INVESTMENT — 1.9% | | | | |
| | Repurchase Agreement — 1.9% | | | | |
| $ | 4,058,000 | | State Street Bank & Trust Co. dated 12/30/05, 3.050% due 1/3/06; Proceeds at maturity — $4,059,375; (Fully collateralized by U.S. Treasury Bond, 5.250% due 2/15/29; Market value — $4,146,177) (Cost — $4,058,000) | | | 4,058,000 | |
|
|
|
| | | | TOTAL INVESTMENTS — 99.8% (Cost — $199,585,107#) | | | 216,534,459 | |
| | | | Other Assets in Excess of Liabilities — 0.2% | | | 396,009 | |
|
|
|
| | | | TOTAL NET ASSETS — 100.0% | | $ | 216,930,468 | |
|
|
|
| * | | Non-income producing security. |
| # | | Aggregate cost for federal income tax purposes is $200,009,591. |
| | |
Abbreviation used in this schedule:
|
| ADR — American Depositary Receipt |
See Notes to Financial Statements.
Smith Barney Multiple Discipline Trust 2005 Annual Report 43
Statements of Assets and Liabilities (December 31, 2005)
| | | | | | | | | | | | | | | | |
| | | | |
| | | All Cap
Growth and
Value | | | Large Cap
Growth and
Value | | | Global All
Cap Growth
and Value | | | Balanced All
Cap Growth
and Value | |
| ASSETS: | | | | | | | | | | | | | | | | |
Investments, at cost | | $ | 254,034,196 | | | $ | 32,583,744 | | | $ | 73,716,530 | | | $ | 199,585,107 | |
|
|
Investments, at value | | $ | 284,954,415 | | | $ | 35,520,378 | | | $ | 82,229,858 | | | $ | 216,534,459 | |
Cash | | | 130 | | | | 1,389 | | | | 2,000 | | | | 1,946 | |
Dividends and interest receivable | | | 246,717 | | | | 39,912 | | | | 93,959 | | | | 694,348 | |
Receivable for Fund shares sold | | | 45,970 | | | | — | | | | — | | | | — | |
Receivable for securities sold | | | — | | | | 455,230 | | | | 451,062 | | | | — | |
Prepaid expenses | | | 3,433 | | | | 436 | | | | 860 | | | | 2,560 | |
|
|
Total Assets | | | 285,250,665 | | | | 36,017,345 | | | | 82,777,739 | | | | 217,233,313 | |
|
|
| LIABILITIES: | | | | | | | | | | | | | | | | |
Payable for Fund shares repurchased | | | 607,612 | | | | 18,525 | | | | 111,497 | | | | 95,654 | |
Management fee payable | | | 183,255 | | | | 23,093 | | | | 52,265 | | | | 138,841 | |
Distribution fees payable | | | 11,824 | | | | — | | | | — | | | | 8,967 | |
Trustees’ fees payable | | | 1,184 | | | | 905 | | | | 2,234 | | | | 1,023 | |
Accrued expenses | | | 66,368 | | | | 39,576 | | | | 47,865 | | | | 58,360 | |
|
|
Total Liabilities | | | 870,243 | | | | 82,099 | | | | 213,861 | | | | 302,845 | |
|
|
Total Net Assets | | $ | 284,380,422 | | | $ | 35,935,246 | | | $ | 82,563,878 | | | $ | 216,930,468 | |
|
|
| NET ASSETS: | | | | | | | | | | | | | | | | |
Par value (Note 4) | | $ | 18,660 | | | $ | 2,456 | | | $ | 5,107 | | | $ | 16,135 | |
Paid-in capital in excess of par value | | | 252,424,052 | | | | 33,012,986 | | | | 74,124,033 | | | | 200,033,096 | |
Undistributed net investment income | | | — | | | | — | | | | — | | | | 22,574 | |
Overdistributed net investment income | | | (1,196 | ) | | | (202 | ) | | | (80,288 | ) | | | — | |
Accumulated net realized gain (loss) on investments and foreign currency transactions | | | 1,018,687 | | | | (16,628 | ) | | | 1,698 | | | | (90,689 | ) |
Net unrealized appreciation on investments | | | 30,920,219 | | | | 2,936,634 | | | | 8,513,328 | | | | 16,949,352 | |
|
|
Total Net Assets | | $ | 284,380,422 | | | $ | 35,935,246 | | | $ | 82,563,878 | | | $ | 216,930,468 | |
|
|
Shares Outstanding | | | 18,660,364 | | | | 2,456,304 | | | | 5,106,955 | | | | 16,134,642 | |
|
|
Net Asset Value | | | $15.24 | | | | $14.63 | | | | $16.17 | | | | $13.45 | |
|
|
See Notes to Financial Statements.
44 Smith Barney Multiple Discipline Trust 2005 Annual Report
Statements of Operations (For the year ended December 31, 2005)
| | | | | | | | | | | | | | | | |
| | | | |
| | | All Cap
Growth and
Value | | | Large Cap
Growth
and Value | | | Global All
Cap Growth
and Value | | | Balanced All
Cap Growth
and Value | |
| INVESTMENT INCOME: | | | | | | | | | | | | | | | | |
Dividends | | $ | 3,099,718 | | | $ | 494,737 | | | $ | 894,365 | | | $ | 1,633,543 | |
Interest | | | 512,699 | | | | 64,597 | | | | 172,175 | | | | 2,875,739 | |
Less: Foreign taxes withheld | | | (20,014 | ) | | | (6,906 | ) | | | (33,382 | ) | | | (10,441 | ) |
|
|
Total Investment Income | | | 3,592,403 | | | | 552,428 | | | | 1,033,158 | | | | 4,498,841 | |
|
|
| EXPENSES: | | | | | | | | | | | | | | | | |
Management fee (Note 2) | | | 2,015,905 | | | | 250,343 | | | | 504,579 | | | | 1,496,007 | |
Distribution fees (Note 2) | | | 671,968 | | | | 83,447 | | | | 168,193 | | | | 498,669 | |
Shareholder reports | | | 47,651 | | | | 10,225 | | | | 18,614 | | | | 27,269 | |
Trustees’ fees | | | 32,030 | | | | 6,218 | | | | 10,757 | | | | 24,335 | |
Custody fees | | | 25,087 | | | | 13,088 | | | | 17,775 | | | | 23,253 | |
Audit and tax | | | 23,900 | | | | 23,200 | | | | 26,700 | | | | 25,700 | |
Legal fees | | | 19,582 | | | | 18,765 | | | | 19,205 | | | | 19,450 | |
Transfer agent fees (Note 2) | | | 5,083 | | | | 5,007 | | | | 5,005 | | | | 5,719 | |
Insurance | | | 2,214 | | | | 284 | | | | 570 | | | | 1,669 | |
Miscellaneous expenses | | | 2,521 | | | | 2,503 | | | | 2,550 | | | | 1,918 | |
|
|
Total Expenses | | | 2,845,941 | | | | 413,080 | | | | 773,948 | | | | 2,123,989 | |
|
|
Less: Distribution fee waiver (Note 2) | | | (268,787 | ) | | | (83,447 | ) | | | (168,193 | ) | | | (199,468 | ) |
|
|
Net Expenses | | | 2,577,154 | | | | 329,633 | | | | 605,755 | | | | 1,924,521 | |
|
|
Net Investment Income | | | 1,015,249 | | | | 222,795 | | | | 427,403 | | | | 2,574,320 | |
|
|
REALIZED AND UNREALIZED GAIN
ON INVESTMENTS AND FOREIGN CURRENCIES (NOTES 1 AND 3): | | | | | | | | | | | | | | | | |
Net Realized Gain From: | | | | | | | | | | | | | | | | |
Investments | | | 9,158,915 | | | | 634,887 | | | | 1,034,389 | | | | 3,158,471 | |
Foreign currency transactions | | | — | | | | 2 | | | | 2 | | | | — | |
|
|
Net Realized Gain | | | 9,158,915 | | | | 634,889 | | | | 1,034,391 | | | | 3,158,471 | |
|
|
Change in Net Unrealized Appreciation/Depreciation
From Investments | | | 4,684,494 | | | | 530,765 | | | | 3,787,169 | | | | 3,389,794 | |
|
|
Net Gain on Investments and Foreign Currencies | | | 13,843,409 | | | | 1,165,654 | | | | 4,821,560 | | | | 6,548,265 | |
|
|
Increase in Net Assets From Operations | | $ | 14,858,658 | | | $ | 1,388,449 | | | $ | 5,248,963 | | | $ | 9,122,585 | |
|
|
See Notes to Financial Statements.
Smith Barney Multiple Discipline Trust 2005 Annual Report 45
Statements of Changes in Net Assets (For the years ended December 31,)
| | | | | | | | |
| | |
| All Cap Growth and Value | | 2005 | | | 2004 | |
| OPERATIONS: | | | | | | | | |
Net investment income | | $ | 1,015,249 | | | $ | 726,237 | |
Net realized gain (loss) | | | 9,158,915 | | | | (1,633,787 | ) |
Change in net unrealized appreciation/depreciation | | | 4,684,494 | | | | 14,657,487 | |
|
|
Increase in Net Assets From Operations | | | 14,858,658 | | | | 13,749,937 | |
|
|
DISTRIBUTIONS TO SHAREHOLDERS
FROM (NOTES 1 AND 5): | | | | | | | | |
Net investment income | | | (1,000,008 | ) | | | (749,787 | ) |
Net realized gains | | | (5,609,221 | ) | | | (875,440 | ) |
|
|
Decrease in Net Assets From
Distributions to Shareholders | | | (6,609,229 | ) | | | (1,625,227 | ) |
|
|
| FUND SHARE TRANSACTIONS (NOTE 4): | | | | | | | | |
Net proceeds from sale of shares | | | 49,267,087 | | | | 134,343,764 | |
Reinvestment of distributions | | | 6,609,229 | | | | 1,625,227 | |
Cost of shares repurchased | | | (26,087,662 | ) | | | (5,520,042 | ) |
|
|
Increase in Net Assets From Fund Share Transactions | | | 29,788,654 | | | | 130,448,949 | |
|
|
Increase in Net Assets | | | 38,038,083 | | | | 142,573,659 | |
| NET ASSETS: | | | | | | | | |
Beginning of year | | | 246,342,339 | | | | 103,768,680 | |
|
|
End of year* | | $ | 284,380,422 | | | $ | 246,342,339 | |
|
|
* Includes overdistributed net investment income of: | | | $(1,196 | ) | | | $(1,915 | ) |
|
|
See Notes to Financial Statements.
46 Smith Barney Multiple Discipline Trust 2005 Annual Report
Statements of Changes in Net Assets (For the years ended December 31,) (continued)
| | | | | | | | |
| | |
| Large Cap Growth and Value | | 2005 | | | 2004 | |
| OPERATIONS: | | | | | | | | |
Net investment income | | $ | 222,795 | | | $ | 203,052 | |
Net realized gain | | | 634,889 | | | | 109,032 | |
Change in net unrealized appreciation/depreciation | | | 530,765 | | | | 1,219,735 | |
|
|
Increase in Net Assets From Operations | | | 1,388,449 | | | | 1,531,819 | |
|
|
DISTRIBUTIONS TO SHAREHOLDERS
FROM (NOTES 1 AND 5): | | | | | | | | |
Net investment income | | | (222,675 | ) | | | (205,208 | ) |
Net realized gains | | | (484,105 | ) | | | (276,439 | ) |
|
|
Decrease in Net Assets From
Distributions to Shareholders | | | (706,780 | ) | | | (481,647 | ) |
|
|
| FUND SHARE TRANSACTIONS (NOTE 4): | | | | | | | | |
Net proceeds from sale of shares | | | 11,085,447 | | | | 16,287,963 | |
Reinvestment of distributions | | | 706,780 | | | | 481,647 | |
Cost of shares repurchased | | | (4,122,953 | ) | | | (1,046,185 | ) |
|
|
Increase in Net Assets From Fund Share Transactions | | | 7,669,274 | | | | 15,723,425 | |
|
|
Increase in Net Assets | | | 8,350,943 | | | | 16,773,597 | |
| NET ASSETS: | | | | | | | | |
Beginning of year | | | 27,584,303 | | | | 10,810,706 | |
|
|
End of year* | | $ | 35,935,246 | | | $ | 27,584,303 | |
|
|
* Includes overdistributed net investment income of: | | | $(202 | ) | | | $(327 | ) |
|
|
See Notes to Financial Statements.
Smith Barney Multiple Discipline Trust 2005 Annual Report 47
Statements of Changes in Net Assets (For the years ended December 31,) (continued)
| | | | | | | | |
| | |
| Global All Cap Growth and Value | | 2005 | | | 2004 | |
| OPERATIONS: | | | | | | | | |
Net investment income | | $ | 427,403 | | | $ | 208,337 | |
Net realized gain | | | 1,034,391 | | | | 26,704 | |
Change in net unrealized appreciation/depreciation | | | 3,787,169 | | | | 3,436,625 | |
|
|
Increase in Net Assets From Operations | | | 5,248,963 | | | | 3,671,666 | |
|
|
DISTRIBUTIONS TO SHAREHOLDERS
FROM (NOTES 1 AND 5): | | | | | | | | |
Net investment income | | | (567,440 | ) | | | (207,818 | ) |
Net realized gains | | | (847,896 | ) | | | (156,298 | ) |
|
|
Decrease in Net Assets From
Distributions to Shareholders | | | (1,415,336 | ) | | | (364,116 | ) |
|
|
| FUND SHARE TRANSACTIONS (NOTE 4): | | | | | | | | |
Net proceeds from sale of shares | | | 32,026,581 | | | | 35,881,368 | |
Reinvestment of distributions | | | 1,415,336 | | | | 364,116 | |
Cost of shares repurchased | | | (4,092,321 | ) | | | (1,146,203 | ) |
|
|
Increase in Net Assets From Fund Share Transactions | | | 29,349,596 | | | | 35,099,281 | |
|
|
Increase in Net Assets | | | 33,183,223 | | | | 38,406,831 | |
| NET ASSETS: | | | | | | | | |
Beginning of year | | | 49,380,655 | | | | 10,973,824 | |
|
|
End of year* | | $ | 82,563,878 | | | $ | 49,380,655 | |
|
|
* Includes (overdistributed) undistributed net investment income, respectively, of: | | | $(80,288 | ) | | | $1,680 | |
|
|
See Notes to Financial Statements.
48 Smith Barney Multiple Discipline Trust 2005 Annual Report
Statements of Changes in Net Assets (For the years ended December 31,) (continued)
| | | | | | | | |
| | |
| Balanced All Cap Growth and Value | | 2005 | | | 2004 | |
| OPERATIONS: | | | | | | | | |
Net investment income | | $ | 2,574,320 | | | $ | 1,366,383 | |
Net realized gain (loss) | | | 3,158,471 | | | | (955,811 | ) |
Change in net unrealized appreciation/depreciation | | | 3,389,794 | | | | 7,101,829 | |
|
|
Increase in Net Assets From Operations | | | 9,122,585 | | | | 7,512,401 | |
|
|
DISTRIBUTIONS TO SHAREHOLDERS
FROM (NOTES 1 AND 5): | | | | | | | | |
Net investment income | | | (2,550,005 | ) | | | (1,378,563 | ) |
Net realized gains | | | (1,896,929 | ) | | | (383,808 | ) |
|
|
Decrease in Net Assets From
Distributions to Shareholders | | | (4,446,934 | ) | | | (1,762,371 | ) |
|
|
| FUND SHARE TRANSACTIONS (NOTE 4): | | | | | | | | |
Net proceeds from sale of shares | | | 48,478,002 | | | | 95,804,409 | |
Reinvestment of distributions | | | 4,446,934 | | | | 1,762,371 | |
Cost of shares repurchased | | | (15,592,333 | ) | | | (6,182,607 | ) |
|
|
Increase in Net Assets From Fund Share Transactions | | | 37,332,603 | | | | 91,384,173 | |
|
|
Increase in Net Assets | | | 42,008,254 | | | | 97,134,203 | |
| NET ASSETS: | | | | | | | | |
Beginning of year | | | 174,922,214 | | | | 77,788,011 | |
|
|
End of year* | | $ | 216,930,468 | | | $ | 174,922,214 | |
|
|
* Includes undistributed (overdistributed) net investment income, respectively, of: | | | $22,574 | | | | $(1,741 | ) |
|
|
See Notes to Financial Statements.
Smith Barney Multiple Discipline Trust 2005 Annual Report 49
Financial Highlights
For a share of beneficial interest outstanding throughout each year ended December 31, unless otherwise noted:
| | | | | | | | | | | | | | | | |
| | | | |
| All Cap Growth and Value | | 2005 | | | 2004 | | | 2003(1) | | | 2002(1)(2) | |
Net Asset Value, Beginning of Period | | $ | 14.82 | | | $ | 13.99 | | | | $10.65 | | | $ | 10.00 | |
|
|
Income From Operations: | | | | | | | | | | | | | | | | |
Net investment income | | | 0.05 | | | | 0.04 | | | | 0.02 | | | | 0.01 | |
Net realized and unrealized gain | | | 0.73 | | | | 0.89 | | | | 3.33 | | | | 0.64 | |
|
|
Total Income From Operations | | | 0.78 | | | | 0.93 | | | | 3.35 | | | | 0.65 | |
|
|
Less Distributions From: | | | | | | | | | | | | | | | | |
Net investment income | | | (0.05 | ) | | | (0.05 | ) | | | (0.01 | ) | | | — | |
Net realized gains | | | (0.31 | ) | | | (0.05 | ) | | | (0.00 | )(3) | | | — | |
|
|
Total Distributions | | | (0.36 | ) | | | (0.10 | ) | | | (0.01 | ) | | | — | |
|
|
Net Asset Value, End of Period | | | $15.24 | | | $ | 14.82 | | | | $13.99 | | | $ | 10.65 | |
|
|
Total Return(4) | | | 5.25 | % | | | 6.64 | % | | | 31.44 | % | | | 6.50 | % |
|
|
Net Assets, End of Period (000s) | | | $284,380 | | | | $246,342 | | | $ | 103,769 | | | | $3,330 | |
|
|
Ratios to Average Net Assets: | | | | | | | | | | | | | | | | |
Gross expenses | | | 1.06 | % | | | 1.07 | % | | | 1.31 | % | | | 21.24 | %(5) |
Net expenses(6) | | | 0.96 | (7) | | | 0.95 | (8) | | | 1.00 | (8) | | | 1.00 | (5)(8) |
Net investment income | | | 0.38 | | | | 0.43 | | | | 0.17 | | | | 0.49 | (5) |
|
|
Portfolio Turnover Rate | | | 22 | % | | | 9 | % | | | 3 | % | | | 2 | % |
|
|
| (1) | | Per share amounts have been calculated using the average shares method. |
| (2) | | For the period October 1, 2002 (commencement of operations) to December 31, 2002. |
| (3) | | Amount represents less than $0.01 per share. |
| (4) | | Performance figures may reflect voluntary fee waivers and/or expense reimbursements. Past performance is no guarantee of future results. In the absence of voluntary fee waivers and/or expense reimbursements, the total return would have been lower. Total returns do not reflect expenses associated with the separate accounts such as administrative fees, account charges and surrender charges which, if reflected, would reduce the total return for all periods shown. Total returns for periods of less than one year are not annualized. |
| (6) | | As a result of a voluntary expense limitation, the ratio of expenses to average net assets of the Fund will not exceed 1.00%. |
| (7) | | The Distributor has voluntarily waived a portion of its fees. |
| (8) | | The Manager and Distributor have voluntarily waived all or a portion of their fees. |
See Notes to Financial Statements.
50 Smith Barney Multiple Discipline Trust 2005 Annual Report
Financial Highlights (continued)
For a share of beneficial interest outstanding throughout each year ended December 31, unless otherwise noted:
| | | | | | | | | | | | | | | |
| | | | |
| Large Cap Growth and Value | | 2005 | | | 2004 | | | 2003(1) | | | 2002(1)(2) | |
Net Asset Value, Beginning of Period | | | $14.41 | | | | $13.74 | | | | $10.73 | | | $10.00 | |
|
|
Income From Operations: | | | | | | | | | | | | | | | |
Net investment income | | | 0.09 | | | | 0.11 | | | | 0.02 | | | 0.01 | |
Net realized and unrealized gain | | | 0.42 | | | | 0.82 | | | | 3.09 | | | 0.72 | |
|
|
Total Income From Operations | | | 0.51 | | | | 0.93 | | | | 3.11 | | | 0.73 | |
|
|
Less Distributions From: | | | | | | | | | | | | | | | |
Net investment income | | | (0.09 | ) | | | (0.11 | ) | | | (0.03 | ) | | — | |
Net realized gains | | | (0.20 | ) | | | (0.15 | ) | | | (0.07 | ) | | — | |
|
|
Total Distributions | | | (0.29 | ) | | | (0.26 | ) | | | (0.10 | ) | | — | |
|
|
Net Asset Value, End of Period | | | $14.63 | | | | $14.41 | | | | $13.74 | | | $10.73 | |
|
|
Total Return(3) | | | 3.55 | % | | | 6.75 | % | | | 29.00 | % | | 7.30 | % |
|
|
Net Assets, End of Period (000s) | | $ | 35,935 | | | $ | 27,584 | | | $ | 10,811 | | | $436 | |
|
|
Ratios to Average Net Assets: | | | | | | | | | | | | | | | |
Gross expenses | | | 1.24 | % | | | 1.36 | % | | | 2.35 | % | | 119.99 | %(4) |
Net expenses(5) | | | 0.99 | (6) | | | 1.00 | (7) | | | 1.00 | (7) | | 1.00 | (4)(7) |
Net investment income | | | 0.67 | | | | 1.12 | | | | 0.62 | | | 0.69 | (4) |
|
|
Portfolio Turnover Rate | | | 33 | % | | | 16 | % | | | 5 | % | | 3 | % |
|
|
| (1) | | Per share amounts have been calculated using the average shares method. |
| (2) | | For the period October 1, 2002 (commencement of operations) to December 31, 2002. |
| (3) | | Performance figures may reflect voluntary fee waivers and/or expense reimbursements. Past performance is no guarantee of future results. In the absence of voluntary fee waivers and/or expense reimbursements, the total return would have been lower. Total returns do not reflect expenses associated with the separate accounts such as administrative fees, account charges and surrender charges which, if reflected, would reduce the total return for all periods shown. Total returns for periods of less than one year are not annualized. |
| (5) | | As a result of a voluntary expense limitation, the ratio of expenses to average net assets of the Fund will not exceed 1.00%. |
| (6) | | The Distributor has voluntarily waived all of its fees. |
| (7) | | The Manager and Distributor have voluntarily waived all or a portion of their fees. |
See Notes to Financial Statements.
Smith Barney Multiple Discipline Trust 2005 Annual Report 51
Financial Highlights (continued)
For a share of beneficial interest outstanding throughout each year ended December 31, unless otherwise noted:
| | | | | | | | | | | | | | | | |
| | | | |
| Global All Cap Growth and Value | | 2005 | | | 2004 | | | 2003(1) | | | 2002(1)(2) | |
Net Asset Value, Beginning of Period | | | $15.44 | | | | $14.11 | | | | $10.78 | | | | $10.00 | |
|
|
Income From Operations: | | | | | | | | | | | | | | | | |
Net investment income | | | 0.10 | | | | 0.07 | | | | 0.04 | | | | 0.01 | |
Net realized and unrealized gain | | | 0.91 | | | | 1.38 | | | | 3.36 | | | | 0.77 | |
|
|
Total Income From Operations | | | 1.01 | | | | 1.45 | | | | 3.40 | | | | 0.78 | |
|
|
Less Distributions From: | | | | | | | | | | | | | | | | |
Net investment income | | | (0.11 | ) | | | (0.07 | ) | | | (0.02 | ) | | | — | |
Net realized gains | | | (0.17 | ) | | | (0.05 | ) | | | (0.05 | ) | | | — | |
|
|
Total Distributions | | | (0.28 | ) | | | (0.12 | ) | | | (0.07 | ) | | | — | |
|
|
Net Asset Value, End of Period | | | $16.17 | | | | $15.44 | | | | $14.11 | | | | $10.78 | |
|
|
Total Return(3) | | | 6.54 | % | | | 10.25 | % | | | 31.55 | % | | | 7.80 | % |
|
|
Net Assets, End of Period (000s) | | $ | 82,564 | | | $ | 49,381 | | | $ | 10,974 | | | $ | 1,003 | |
|
|
Ratios to Average Net Assets: | | | | | | | | | | | | | | | | |
Gross expenses | | | 1.15 | % | | | 1.28 | % | | | 2.56 | % | | | 52.11 | %(4) |
Net expenses(5) | | | 0.90 | (6) | | | 1.00 | (7) | | | 1.00 | (7) | | | 1.00 | (4)(7) |
Net investment income | | | 0.64 | | | | 0.75 | | | | 0.36 | | | | 0.38 | (4) |
|
|
Portfolio Turnover Rate | | | 18 | % | | | 10 | % | | | 6 | % | | | 2 | % |
|
|
| (1) | | Per share amounts have been calculated using the average shares method. |
| (2) | | For the period October 1, 2002 (commencement of operations) to December 31, 2002. |
| (3) | | Performance figures may reflect voluntary fee waivers and/or expense reimbursements. Past performance is no guarantee of future results. In the absence of voluntary fee waivers and/or expense reimbursements, the total return would have been lower. Total returns do not reflect expenses associated with the separate accounts such as administrative fees, account charges and surrender charges which, if reflected, would reduce the total return for all periods shown. Total returns for periods of less than one year are not annualized. |
| (5) | | As a result of a voluntary expense limitation, the ratio of expenses to average net assets of the Fund will not exceed 1.00%. |
| (6) | | The Distributor has voluntarily waived all of its fees. |
| (7) | | The Manager and Distributor have voluntarily waived all or a portion of their fees. |
See Notes to Financial Statements.
52 Smith Barney Multiple Discipline Trust 2005 Annual Report
Financial Highlights (continued)
For a share of beneficial interest outstanding throughout each year ended December 31, unless otherwise noted:
| | | | | | | | | | | | | | | | |
| | | | |
| Balanced All Cap Growth and Value | | 2005 | | | 2004 | | | 2003(1) | | | 2002(1)(2) | |
Net Asset Value, Beginning of Period | | | $13.17 | | | | $12.67 | | | | $10.42 | | | | $10.00 | |
|
|
Income From Operations: | | | | | | | | | | | | | | | | |
Net investment income | | | 0.16 | | | | 0.10 | | | | 0.08 | | | | 0.02 | |
Net realized and unrealized gain | | | 0.40 | | | | 0.54 | | | | 2.20 | | | | 0.40 | |
|
|
Total Income From Operations | | | 0.56 | | | | 0.64 | | | | 2.28 | | | | 0.42 | |
|
|
Less Distributions From: | | | | | | | | | | | | | | | | |
Net investment income | | | (0.16 | ) | | | (0.11 | ) | | | (0.03 | ) | | | — | |
Net realized gains | | | (0.12 | ) | | | (0.03 | ) | | | (0.00 | )(3) | | | — | |
|
|
Total Distributions | | | (0.28 | ) | | | (0.14 | ) | | | (0.03 | ) | | | — | |
|
|
Net Asset Value, End of Period | | | $13.45 | | | | $13.17 | | | | $12.67 | | | | $10.42 | |
|
|
Total Return(4) | | | 4.25 | % | | | 5.01 | % | | | 21.93 | % | | | 4.20 | % |
|
|
Net Assets, End of Period (000s) | | $ | 216,930 | | | $ | 174,922 | | | $ | 77,788 | | | $ | 3,234 | |
|
|
Ratios to Average Net Assets: | | | | | | | | | | | | | | | | |
Gross expenses | | | 1.06 | % | | | 1.08 | % | | | 1.39 | % | | | 23.28 | %(5) |
Net expenses(6) | | | 0.96 | (7) | | | 0.97 | (8) | | | 1.00 | (8) | | | 1.00 | (5)(8) |
Net investment income | | | 1.29 | | | | 1.09 | | | | 0.69 | | | | 1.28 | (5) |
|
|
Portfolio Turnover Rate | | | 61 | % | | | 49 | % | | | 39 | % | | | 7 | % |
|
|
| (1) | | Per share amounts have been calculated using the average shares method. |
| (2) | | For the period October 1, 2002 (commencement of operations) to December 31, 2002. |
| (3) | | Amount represents less than $0.01 per share. |
| (4) | | Performance figures may reflect voluntary fee waivers and/or expense reimbursements. Past performance is no guarantee of future results. In the absence of voluntary fee waivers and/or expense reimbursements, the total return would have been lower. Total returns do not reflect expenses associated with the separate accounts such as administrative fees, account charges and surrender charges which, if reflected, would reduce the total return for all periods shown. Total returns for periods of less than one year are not annualized. |
| (6) | | As a result of a voluntary expense limitation, the ratio of expenses to average net assets of the Fund will not exceed 1.00%. |
| (7) | | The Distributor has voluntarily waived a portion of its fees. |
| (8) | | The Manager and Distributor have voluntarily waived all or a portion of their fees. |
See Notes to Financial Statements.
Smith Barney Multiple Discipline Trust 2005 Annual Report 53
Notes to Financial Statements
| 1. | Organization and Significant Accounting Policies |
The Multiple Discipline Portfolio — All Cap Growth and Value (“All Cap Growth and Value”), Multiple Discipline Portfolio — Large Cap Growth and Value (“Large Cap Growth and Value”), Multiple Discipline Portfolio — Global All Cap Growth and Value (“Global All Cap Growth and Value”) and Multiple Discipline Portfolio — Balanced All Cap Growth and Value (“Balanced All Cap Growth and Value”) (the “Funds”) are separate diversified investment funds of the Smith Barney Multiple Discipline Trust (“Trust”). The Trust, a Massachusetts business trust, is registered under the Investment Company Act of 1940, as amended (the “1940 Act”), as an open-end management investment company. The Trust is offered exclusively for use with certain variable annuity and variable life insurance contracts offered through the separate accounts of various life insurance companies and qualified pension and retirement plans.
The following are significant accounting policies consistently followed by the Funds and are in conformity with U.S. generally accepted accounting principles (“GAAP”). Estimates and assumptions are required to be made regarding assets, liabilities and changes in net assets resulting from operations when financial statements are prepared. Changes in the economic environment, financial markets and any other parameters used in determining these estimates could cause actual results to differ.
(a) Investment Valuation. Equity securities for which market quotations are available are valued at the last sale price or official closing price on the primary market or exchange on which they trade. Debt securities are valued at the mean between the bid and asked prices provided by an independent pricing service that are based on transactions in debt obligations, quotations from bond dealers, market transactions in comparable securities and various relationships between securities. When prices are not readily available, or are determined not to reflect fair value, such as when the value of a security has been significantly affected by events after the close of the exchange or market on which the security is principally traded, but before the Funds calculate its net asset value, the Funds may value these investments at fair value as determined in accordance with the procedures approved by the Funds’ Board of Trustees. Short-term obligations with maturities of 60 days or less are valued at amortized cost, which approximates market value.
(b) Repurchase Agreements. When entering into repurchase agreements, it is the Funds’ policy that their custodian or a third party custodian takes possession of the underlying collateral securities, the market value of which at least equals the principal amount of the repurchase transaction, including accrued interest. To the extent that any repurchase transaction exceeds one business day, the value of the collateral is marked-to-market to ensure the adequacy of the collateral. If the seller defaults and the market value of the collateral declines or if bankruptcy proceedings are commenced with respect to the seller of the security, realization of the collateral by the Funds may be delayed or limited.
(c) Security Transactions and Investment Income. Security transactions are accounted for on a trade date basis. Interest income, adjusted for amortization of premium and accretion of discount, is recorded on the accrual basis. Dividend income is recorded on the ex-dividend date. Foreign dividend income is recorded on the ex-dividend date or as soon as practical after the Funds determine the existence of a dividend declaration after exercising
54 Smith Barney Multiple Discipline Trust 2005 Annual Report
Notes to Financial Statements (continued)
reasonable due diligence. The cost of investments sold is determined by use of the specific identification method. To the extent any issuer defaults on an expected interest payment, the Funds’ policy is to generally halt any additional interest income accruals and consider the realizability of interest accrued up to the date of default.
(d) Distributions to Shareholders. Distributions from net investment income and distributions of net realized gains, if any, are declared at least annually. Distributions to shareholders of the Funds are recorded on the ex-dividend date and are determined in accordance with income tax regulations, which may differ from GAAP.
(e) Foreign Currency Translation. Investment securities and other assets and liabilities denominated in foreign currencies are translated into U.S. dollar amounts based upon prevailing exchange rates on the date of valuation. Purchases and sales of investment securities and income and expense items denominated in foreign currencies are translated into U.S. dollar amounts based upon prevailing exchange rates on the respective dates of such transactions.
A Fund does not isolate that portion of the results of operations resulting from changes in foreign exchange rates on investments from the fluctuations arising from changes in market prices of securities held. Such fluctuations are included with the net realized and unrealized gain or loss on investments.
Net realized foreign exchange gains or losses arise from sales of foreign currencies, including gains and losses on forward foreign currency contracts, currency gains or losses realized between the trade and settlement dates on securities transactions and the difference between the amounts of dividends, interest and foreign withholding taxes recorded on a Fund’s books and the U.S. dollar equivalent of the amounts actually received or paid. Net unrealized foreign exchange gains and losses arise from changes in the fair values of assets and liabilities, other than investments in securities, at the date of valuation, resulting from changes in exchange rates.
Foreign security and currency transactions may involve certain considerations and risks not typically associated with those of U.S. dollar denominated transactions as a result of, among other factors, the possibility of lower levels of governmental supervision and regulation of foreign securities markets and the possibility of political or economic instability.
(f) Federal and Other Taxes. It is the Funds’ policy to comply with the federal income and excise tax requirements of the Internal Revenue Code of 1986, as amended, applicable to regulated investment companies. Accordingly, the Funds intend to distribute substantially all of their income and net realized gains on investments, if any, to shareholders each year. Therefore, no federal income tax provision is required in the Funds’ financial statements. Under the applicable foreign tax laws, a withholding tax may be imposed on interest, dividends and capital gains at various rates.
Smith Barney Multiple Discipline Trust 2005 Annual Report 55
Notes to Financial Statements (continued)
(g) Reclassification. GAAP requires that certain components of net assets be adjusted to reflect permanent differences between financial and tax reporting. These reclassifications have no effect on net assets or net asset values per share. There were no reclassifications during the current year for Balanced All Cap Growth and Value. Additionally, during the current year, the following reclassifications have been made:
| | | | | | | | | | | | | |
| | | |
| Fund | | (Over)/
Undistributed Net
Investment Income | | | Undistributed
Realized Gains | | | Paid-in Capital |
All Cap Growth and Value | | (a | ) | | $ | (14,522 | ) | | — | | | $ | 14,522 |
|
Large Cap Growth and Value | | (b | ) | | | 5 | | | (5 | ) | | | — |
|
Global All Cap Growth and Value | | (c | ) | | | 58,069 | | | (58,069 | ) | | | — |
|
| (a) | | Reclassifications are primarily due to distributions paid in connection with the redemption of Fund shares. |
| (b) | | Reclassifications are primarily due to foreign currency transactions treated as ordinary income for tax purposes. |
| (c) | | Reclassifications are primarily due to foreign currency transactions treated as ordinary income for tax purposes and book/tax differences in the treatment of passive foreign investment companies. |
| 2. | Management Agreement and Other Transactions with Affiliates |
On December 1, 2005, Citigroup Inc. (“Citigroup”) completed the sale of substantially all of its asset management business, Citigroup Asset Management (“CAM”), to Legg Mason, Inc. (“Legg Mason”). As a result, the Funds’ investment manager, Smith Barney Fund Management LLC (the “Manager”), previously an indirect wholly-owned subsidiary of Citigroup, has become a wholly-owned subsidiary of Legg Mason. Completion of the sale caused the Funds’ existing investment management contract to terminate. The Funds’ shareholders approved a new investment management contract between the Funds and the Manager, which became effective on December 1, 2005.
Legg Mason, whose principal executive offices are in Baltimore, Maryland, is a financial services holding company.
Prior to the transaction, the Funds paid the Manager a fee calculated at an annual rate of 0.75% of the Funds’ average daily net assets.
Under the new Investment Management agreement the Funds continue to pay the Manager a management fee calculated at an annual rate of 0.75% of the Funds’ average daily net assets.
The Funds’ Board has appointed the Funds’ current distributor, Citigroup Global Markets Inc. (“CGM”) and Legg Mason Investor Services, LLC (“LMIS”), a wholly-owned broker-dealer subsidiary of Legg Mason, as co-distributors of the Funds. The Funds’ Board has also approved amended and restated Rule 12b-1 Plans. The Plans provide that each Fund shall pay a distribution fee of 0.25% of the average daily net assets of each Fund, respectively. These fees are calculated daily and paid monthly. The Balanced All Cap Growth and Value and the All Cap Growth and Value waived 0.10% of their distribution fees. The Large Cap Growth and Value and the Global All Cap Growth and Value continued to waive 100% of the distribution fees for the year ended December 31, 2005.
56 Smith Barney Multiple Discipline Trust 2005 Annual Report
Notes to Financial Statements (continued)
During the year ended December 31, 2005, the Funds had distribution fee waivers in place, resulting in the following fee waivers:
| | | | | | | | | | | | |
| | | | |
| | | All Cap
Growth and Value | | Large Cap
Growth and Value | | Global All Cap
Growth and Value | | Balanced All Cap
Growth and Value |
Distribution Fee Waiver | | $ | 268,787 | | $ | 83,447 | | $ | 168,193 | | $ | 199,468 |
|
The distribution plan fee waivers can be terminated at anytime.
The Funds’ Board has approved PFPC Inc. (“PFPC”) to serve as transfer agent for the Funds, effective January 1, 2006. The principal business office of PFPC is located at 4400 Computer Drive, Westborough, MA 01581. During the period covered by this report, Citicorp Trust Bank, fsb. (“CTB”), a subsidiary of Citigroup, acted as the Funds’ transfer agent. PFPC acted as the Funds’ sub-transfer agent. CTB received account fees and asset-based fees that varied according to the size and type of account. PFPC was responsible for shareholder recordkeeping and financial processing for all shareholder accounts and was paid by CTB. For the period ended December 31, 2005, each Fund paid transfer agent fees of $4,583 to CTB.
In addition, for the period ended December 31, 2005, CGM and its affiliates received brokerage commissions of $1,860 and $960 from All Cap Growth and Value, and Balanced All Cap Growth and Value, respectively.
Certain officers and one Trustee of the Trust are employees of Legg Mason or its affiliates and do not receive compensation from the Trust.
During the year ended December 31, 2005, the aggregate cost of purchases and proceeds from sales of investments (excluding short-term investments) were as follows:
| | | | | | | | | | | | |
| | |
| | | Investments
| | U.S. Government &
Agency Obligations
|
| | | Purchases | | Sales | | Purchases | | Sales |
All Cap Growth and Value | | $ | 109,301,908 | | $ | 55,794,942 | | $ | — | | $ | — |
Large Cap Growth and Value | | | 17,984,113 | | | 10,124,333 | | | — | | | — |
Global All Cap Growth and Value | | | 39,631,457 | | | 11,199,817 | | | — | | | — |
Balanced All Cap Growth and Value | | | 68,962,932 | | | 34,046,635 | | | 97,456,688 | | | 80,424,819 |
|
At December 31, 2005, the aggregate gross unrealized appreciation and depreciation of investments for federal income tax purposes were as follows:
| | | | | | | | | | |
| | | |
| | | Gross Unrealized Appreciation | | Gross Unrealized
Depreciation | | | Net Unrealized
Appreciation |
All Cap Growth and Value | | $ | 38,349,466 | | $ | (7,537,014 | ) | | $ | 30,812,452 |
Large Cap Growth and Value | | | 3,553,191 | | | (666,038 | ) | | | 2,887,153 |
Global All Cap Growth and Value | | | 9,514,444 | | | (1,328,442 | ) | | | 8,186,002 |
Balanced All Cap Growth and Value | | | 20,922,665 | | | (4,397,797 | ) | | | 16,524,868 |
|
Smith Barney Multiple Discipline Trust 2005 Annual Report 57
Notes to Financial Statements (continued)
| 4. | Shares of Beneficial Interest |
At December 31, 2005, the Trust had an unlimited number of shares authorized with a par value of $0.001 per share.
Transactions in shares of each Fund were as follows:
| | | | | | |
| | |
| | | Year Ended
December 31, 2005 | | | Year Ended
December 31, 2004 | |
All Cap Growth and Value | | | | | | |
Shares sold | | 3,357,104 | | | 9,481,857 | |
Shares issued on reinvestment | | 430,288 | | | 109,646 | |
Shares repurchased | | (1,749,491 | ) | | (388,694 | ) |
|
|
Net Increase | | 2,037,901 | | | 9,202,809 | |
|
|
Large Cap Growth and Value | | | | | | |
Shares sold | | 778,434 | | | 1,169,090 | |
Shares issued on reinvestment | | 47,982 | | | 33,355 | |
Shares repurchased | | (284,538 | ) | | (74,739 | ) |
|
|
Net Increase | | 541,878 | | | 1,127,706 | |
|
|
Global All Cap Growth and Value | | | | | | |
Shares sold | | 2,083,470 | | | 2,474,154 | |
Shares issued on reinvestment | | 86,994 | | | 23,589 | |
Shares repurchased | | (262,077 | ) | | (77,180 | ) |
|
|
Net Increase | | 1,908,387 | | | 2,420,563 | |
|
|
Balanced All Cap Growth and Value | | | | | | |
Shares sold | | 3,701,338 | | | 7,489,565 | |
Shares issued on reinvestment | | 328,915 | | | 133,841 | |
Shares repurchased | | (1,176,083 | ) | | (483,360 | ) |
|
|
Net Increase | | 2,854,170 | | | 7,140,046 | |
|
|
| 5. | Income Tax Information and Distributions to Shareholders |
The tax character of distributions paid during the fiscal year ended December 31, 2005 were as follows:
| | | | | | | | | | | | |
| | | | |
| | | All Cap Growth
and Value | | Large Cap Growth
and Value | | Global All Cap
Growth and Value | | Balanced All Cap
Growth and Value |
| Distributions paid from: | | | | | | | | | | | | |
Ordinary Income | | $ | 1,000,008 | | $ | 222,675 | | $ | 567,440 | | $ | 2,550,005 |
Net Long-term Capital Gains | | | 5,609,221 | | | 484,105 | | | 847,896 | | | 1,896,929 |
|
| Total Distributions Paid | | $ | 6,609,229 | | $ | 706,780 | | $ | 1,415,336 | | $ | 4,446,934 |
|
58 Smith Barney Multiple Discipline Trust 2005 Annual Report
Notes to Financial Statements (continued)
The tax character of distributions paid during the fiscal year ended December 31, 2004 were as follows:
| | | | | | | | | | | | |
| | | | |
| | | All Cap Growth
and Value | | Large Cap Growth
and Value | | Global All Cap
Growth and Value | | Balanced All Cap
Growth and Value |
| Distributions paid from: | | | | | | | | | | | | |
Ordinary Income | | $ | 1,455,954 | | $ | 356,334 | | $ | 278,146 | | $ | 1,651,542 |
Net Long-term Capital Gains | | | 169,273 | | | 125,313 | | | 85,970 | | | 110,829 |
|
| Total Distributions Paid | | $ | 1,625,227 | | $ | 481,647 | | $ | 364,116 | | $ | 1,762,371 |
|
As of December 31, 2005, the components of accumulated earnings on a tax basis were as follows:
| | | | | | | | | | | | | | | | |
| | | | |
| | | All Cap Growth
and Value | | | Large Cap Growth
and Value | | | Global All Cap
Growth and Value | | | Balanced All Cap
Growth and Value | |
Undistributed ordinary income — net | | $ | — | | | $ | — | | | $ | 189,232 | | | $ | 23,662 | |
Undistributed long-term capital gains — net | | | 1,126,454 | | | | 32,856 | | | | 59,977 | | | | 333,795 | |
|
|
| Total undistributed earnings | | $ | 1,126,454 | | | $ | 32,856 | | | $ | 249,209 | | | $ | 357,457 | |
Other book/tax temporary differences | | | (1,196 | )(a) | | | (202 | )(a) | | | (473 | )(a) | | | (1,088 | )(a) |
Unrealized appreciation/(depreciation) | | | 30,812,452 | (b) | | | 2,887,150 | (b) | | | 8,186,002 | (c) | | | 16,524,868 | (b) |
|
|
Total accumulated earnings/
(losses) — net | | $ | 31,937,710 | | | $ | 2,919,804 | | | $ | 8,434,738 | | | $ | 16,881,237 | |
|
|
| (a) | Other book/tax temporary differences are attributable primarily to the differences in the book/tax treatment of organization costs. |
| (b) | The difference between book-basis and tax-basis unrealized appreciation/(depreciation) is attributable primarily to the tax deferral of losses on wash sales. |
| (c) | The difference between book-basis and tax-basis unrealized appreciation/(depreciation) is attributable primarily to the tax deferral of losses on wash sales and the realization for tax purposes of unrealized gains on investments in passive foreign investment companies. |
On May 31, 2005, the U.S. Securities and Exchange Commission (“SEC”) issued an order in connection with the settlement of an administrative proceeding against SBFM and CGM relating to the appointment of an affiliated transfer agent for the Smith Barney family of mutual funds (the “Funds”).
The SEC order finds that SBFM and CGM willfully violated Section 206(1) of the Investment Advisers Act of 1940 (“Advisers Act”). Specifically, the order finds that SBFM and CGM knowingly or recklessly failed to disclose to the boards of the Funds in 1999 when proposing a new transfer agent arrangement with an affiliated transfer agent that: First Data Investors Services Group (“First Data”), the Funds’ then-existing transfer agent, had offered to continue as transfer agent and do the same work for substantially less money than before; and that Citigroup Asset Management (“CAM”), the Citigroup business unit
Smith Barney Multiple Discipline Trust 2005 Annual Report 59
Notes to Financial Statements (continued)
that, at the time, included the fund’s investment manager and other investment advisory companies, had entered into a side letter with First Data under which CAM agreed to recommend the appointment of First Data as sub-transfer agent to the affiliated transfer agent in exchange for, among other things, a guarantee by First Data of specified amounts of asset management and investment banking fees to CAM and CGM. The order also finds that SBFM and CGM willfully violated Section 206(2) of the Advisers Act by virtue of the omissions discussed above and other misrepresentations and omissions in the materials provided to the Funds’ boards, including the failure to make clear that the affiliated transfer agent would earn a high profit for performing limited functions while First Data continued to perform almost all of the transfer agent functions, and the suggestion that the proposed arrangement was in the Funds’ best interests and that no viable alternatives existed. SBFM and CGM do not admit or deny any wrongdoing or liability. The settlement does not establish wrongdoing or liability for purposes of any other proceeding.
The SEC censured SBFM and CGM and ordered them to cease and desist from violations of Sections 206(1) and 206(2) of the Advisers Act. The order requires Citigroup to pay $208.1 million, including $109 million in disgorgement of profits, $19.1 million in interest, and a civil money penalty of $80 million. Approximately $24.4 million has already been paid to the Funds, primarily through fee waivers. The remaining $183.7 million, including the penalty, has been paid to the U.S. Treasury and will be distributed pursuant to a plan prepared and submitted for approval by the SEC. The order also requires that transfer agency fees received from the Funds since December 1, 2004 less certain expenses be placed in escrow and provides that a portion of such fees may be subsequently distributed in accordance with the terms of the order.
The order required SBFM to recommend a new transfer agent contract to the Funds’ boards within 180 days of the entry of the order; if a Citigroup affiliate submitted a proposal to serve as transfer agent or sub-transfer agent, SBFM and CGM would have been required, at their expense, to engage an independent monitor to oversee a competitive bidding process. On November 21, 2005, and within the specified timeframe, the Funds’ Board selected a new transfer agent for the Funds. No Citigroup affiliate submitted a proposal to serve as transfer agent. Under the order, SBFM also must comply with an amended version of a vendor policy that Citigroup instituted in August 2004.
At this time, there is no certainty as to how the proceeds of the settlement will be distributed, to whom such distributions will be made, the methodology by which such distributions will be allocated, and when such distributions will be made. Although there can be no assurance, SBFM does not believe that this matter will have a material adverse effect on the Funds.
On December 1, 2005, Citigroup completed the sale of substantially all of its global asset management business, including SBFM, to Legg Mason Inc.
Beginning in August 2005, five class action lawsuits alleging violations of federal securities laws and state law were filed against CGM and SBFM, (collectively, the “Defendants”) based on the May 31, 2005 settlement order issued against the Defendants by the SEC
60 Smith Barney Multiple Discipline Trust 2005 Annual Report
Notes to Financial Statements (continued)
based in Note 6. The complaints seek injunctive relief and compensatory and punitive damages, removal of SBFM as the advisor for the Smith Barney family of funds, rescission of the Funds’ management and other contracts with SBFM, recovery of all fees paid to SBFM pursuant to such contracts, and an award of attorneys’ fees and litigation expenses.
On October 5, 2005, a motion to consolidate the five actions and any subsequently-filed, related action was filed. That motion contemplates that a consolidated amended complaint alleging substantially similar causes of action will be filed in the future.
As of the date of this report, the Funds’ investment manager believes that resolution of the pending lawsuit will not have a material effect on the financial position or results of operations of the Funds or the ability of the Funds’ investment manager and it affiliates to continue to render services to the Funds under their respective contracts.
* * *
Beginning in June 2004, class action lawsuits alleging violations of the federal securities laws were filed against Citigroup Global Markets Inc. (the “Distributor”) and a number of its affiliates, including SBFM and Salomon Brothers Asset Management Inc (the “Advisers”), substantially all of the mutual funds managed by the Advisers, including the Funds (the “Funds”), and directors or trustees of the Funds (collectively, the “Defendants”). The complaints alleged, among other things, that CGM created various undisclosed incentives for its brokers to sell Smith Barney and Salomon Brothers funds. In addition, according to the complaints, the Advisers caused the Funds to pay excessive brokerage commissions to CGM for steering clients towards proprietary funds. The complaints also alleged that the defendants breached their fiduciary duty to the Funds by improperly charging Rule l2b-1 fees and by drawing on fund assets to make undisclosed payments of soft dollars and excessive brokerage commissions. The complaints also alleged that the Funds failed to adequately disclose certain of the allegedly wrongful conduct. The complaints sought injunctive relief and compensatory and punitive damages, rescission of the Funds’ contracts with the Advisers, recovery of all fees paid to the Advisers pursuant to such contracts and an award of attorneys’ fees and litigation expenses.
On December 15, 2004, a consolidated amended complaint (the “Complaint”) was filed alleging substantially similar causes of action. While the lawsuit is in its earliest stages, to the extent that the Complaint purports to state causes of action against the Funds, the Fund’s investment manager believes the Funds have significant defenses to such allegations, which the Funds intend to vigorously assert in responding to the Complaint.
Additional lawsuits arising out of these circumstances and presenting similar allegations and requests for relief may be filed against the Defendants in the future.
As of the date of this report, the Funds’ investment manager and the Funds believe that the resolution of the pending lawsuit will not have a material effect on the financial position or results of operations of the Funds or the ability of the Advisers and their affiliates to continue to render services to the Funds under their respective contracts.
The Defendants have moved to dismiss the Complaint. Those motions are pending before the court.
Smith Barney Multiple Discipline Trust 2005 Annual Report 61
Notes to Financial Statements (continued)
On September 16, 2005, the staff of the Securities and Exchange Commission (the “Commission”) informed SBFM and Salomon Brothers Asset Management Inc (“SBAM”) that the staff is considering recommending that the Commission institute administrative proceedings against SBFM and SBAM for alleged violations of Section 19(a) and 34(b) of the Investment Company Act (and related Rule 19a-1). The notification is a result of an industry wide inspection by the Commission and is based upon alleged deficiencies in disclosures regarding dividends and distributions paid to shareholders of certain funds. Section 19(a) and related Rule 19a-1 of the Investment Company Act generally require funds that are making dividend and distribution payments to provide shareholders with a written statement disclosing the source of the dividends and distributions, and, in particular, the portion of the payments made from each of net investment income, undistributed net profits and/or paid-in capital. In connection with the contemplated proceedings, the staff may seek a cease and desist order and/or monetary damages from SBFM or SBAM.
Although there can be no assurance, SBFM and SBAM believes that this matter is not likely to have a material adverse effect on the Fund or SBFM and SBAM’s ability to perform investment management services relating to the Fund.
62 Smith Barney Multiple Discipline Trust 2005 Annual Report
Report of Independent Registered Public Accounting Firm
The Shareholders and Board of Trustees
Smith Barney Multiple Discipline Trust:
We have audited the accompanying statements of assets and liabilities, including the schedules of investments, of Multiple Discipline Portfolio — All Cap Growth and Value, Multiple Discipline Portfolio — Large Cap Growth and Value, Multiple Discipline Portfolio — Global All Cap Growth and Value and Multiple Discipline Portfolio — Balanced All Cap Growth and Value, each a series of Smith Barney Multiple Discipline Trust, as of December 31, 2005, and the related statements of operations for the year then ended, the statements of changes in net assets for each of the years in the two-year period then ended, and the financial highlights for each of the years in the three-year period then ended, and for the period from October 1, 2002 (commencement of operations) to December 31, 2002. These financial statements and financial highlights are the responsibility of the Trust’s management. Our responsibility is to express an opinion on these financial statements and financial highlights based on our audits.
We conducted our audits in accordance with the standards of the Public Company Accounting Oversight Board (United States). Those standards require that we plan and perform the audit to obtain reasonable assurance about whether the financial statements and the financial highlights are free of material misstatement. An audit includes examining, on a test basis, evidence supporting the amounts and disclosures in the financial statements. Our procedures included confirmation of securities owned as of December 31, 2005, by correspondence with the custodian and brokers. An audit also includes assessing the accounting principles used and significant estimates made by management, as well as evaluating the overall financial statement presentation. We believe that our audits provide a reasonable basis for our opinion.
In our opinion, the financial statements and financial highlights referred to above present fairly, in all material respects, the financial position of Multiple Discipline Portfolio — All Cap Growth and Value, Multiple Discipline Portfolio — Large Cap Growth and Value, Multiple Discipline Portfolio — Global All Cap Growth and Value and Multiple Discipline Portfolio — Balanced All Cap Growth and Value as of December 31, 2005, and the results of their operations for the year then ended, changes in their net assets for each of the years in the two-year period then ended and the financial highlights for each of the years in the three-year period then ended and for the period from October 1, 2002 to December 31, 2002, in conformity with U.S. generally accepted accounting principles.

New York, New York
February 22, 2006
Smith Barney Multiple Discipline Trust 2005 Annual Report 63
Board Approval of Management Agreement (unaudited)
Background
The members of the Board of Smith Barney Multiple Discipline Trust (the “Fund”), including the Fund’s independent, or non-interested, Board members (the “Independent Board Members”), received information from Smith Barney Fund Management LLC, the Fund’s manager (the “Manager”) to assist them in their consideration of the Fund’s management agreement (the “Management Agreement”). The Board received and considered a variety of information about the Manager, and the Fund’s distributor, as well as the advisory, and distribution arrangements for the Fund and other funds overseen by the Board, certain portions of which are discussed below.
The presentation made to the Board encompassed the Fund and all the funds for which the Board has responsibility. The Fund has an investment advisory agreement. The discussion below covers the advisory and administrative functions being rendered by the Manager.
Board Approval of Management Agreement
In approving the Management Agreement, the Fund’s Board, including the Independent Board Members, considered the following factors:
Nature, Extent and Quality of the Services under the Management Agreement
The Board received and considered information regarding the nature, extent and quality of services provided to the Fund by the Manager under the Management Agreement during the past year. The Board also received a description of the administrative and other services rendered to the Fund and its shareholders by the Manager. The Board noted information received at regular meetings throughout the year related to the services rendered by the Manager about the management of the Fund’s affairs and the Manager’s role in coordinating the activities of the Fund’s other service providers. The Board’s evaluation of the services provided by the Manager took into account the Board’s knowledge and familiarity gained as Board members of funds in the Citigroup Asset Management (“CAM”) fund complex, including the scope and quality of the Manager’s investment management and other capabilities and the quality of its administrative and other services. The Board observed that the scope of services provided by the Manager had expanded over time as a result of regulatory and other developments, including maintaining and monitoring its own and the Fund’s expanded compliance programs. The Board also considered the Manager’s response to recent regulatory compliance issues affecting it and the CAM fund complex. The Board reviewed information received from the Manager regarding the implementation to date of the Fund’s compliance policies and procedures established pursuant to Rule 38a-1 under the Investment Company Act of 1940.
The Board reviewed the qualifications, backgrounds and responsibilities of the Fund’s senior personnel and the portfolio management team primarily responsible for the day-to-day portfolio management of the Fund. The Board noted that the Manager’s Office of the Chief Investment Officer, composed of the senior officers of the investment teams managing the
64 Smith Barney Multiple Discipline Trust 2005 Annual Report
Board Approval of Management Agreement (unaudited) (continued)
funds in the CAM complex, participates in reporting to the Board on investment matters. The Board also considered, based on its knowledge of the Manager and its affiliates, the financial resources available to CAM and its parent organization, Citigroup Inc.
The Board also considered the Manager’s brokerage policies and practices, the standards applied in seeking best execution, the Manager’s policies and practices regarding soft dollars, the use of a broker affiliated with the Manager and the existence of quality controls applicable to brokerage allocation procedures. In addition, management also reported to the Board on, among other things, its business plans, recent organizational changes and portfolio manager compensation plan.
At the Board’s request following the conclusion of the 2004 contract continuance discussions, the Manager prepared and provided to the Board in connection with the 2005 discussions an analysis of complex-wide management fees, which, among other things, set out a proposed framework of fees based on asset classes.
The Board concluded that, overall, the nature, extent and quality of services provided (and expected to be provided) under the Management Agreement were acceptable.
Fund Performance
The Board received and considered performance information for the Fund as well as for a group of funds (the “Performance Universe”) selected by Lipper, Inc. (“Lipper”), an independent provider of investment company data. The Board was provided with a description of the methodology Lipper used to determine the similarity of the Fund with the funds included in the Performance Universe. The Board also noted that it had received and discussed with management information throughout the year at periodic intervals comparing the Fund’s performance against its benchmark(s).
Smith Barney Multiple Discipline Trust: Multiple Discipline Portfolio — All Cap Growth & Value
The information comparing the Fund’s performance to that of its Performance Universe, consisting of the Fund and all retail and institutional funds regardless of asset size or primary channel of distribution classified as “multi-cap core funds” by Lipper showed that the Fund’s performance for the 1-year period was lower than the median. The Board noted that the portfolio has only been in existence since October 2002 and that the short-term performance of the underlying disciplines trailed their respective peer groups. Based on their review, which included careful consideration of all of the factors noted above, the Board will continue to gauge the Fund’s performance and investment strategies.
Smith Barney Multiple Discipline Trust: Multiple Discipline Portfolio — Balanced All Cap Growth & Value
The information comparing the Fund’s performance to that of its Performance Universe, consisting of the Fund and all retail and institutional funds regardless of asset size or primary channel of distribution classified as “balanced funds” by Lipper showed that the Fund’s performance for the 1-year period was lower than the median. The Board noted
Smith Barney Multiple Discipline Trust 2005 Annual Report 65
Board Approval of Management Agreement (unaudited) (continued)
that the portfolio has only been in existence since October 2002 and that the short-term performance of the underlying disciplines trailed their respective peer groups. Based on their review, which included careful consideration of all of the factors noted above, the Board will continue to gauge the Fund’s performance and investment strategies.
Smith Barney Multiple Discipline Trust: Multiple Discipline Portfolio — Global All Cap Growth & Value
The information comparing the Fund’s performance to that of its Performance Universe, consisting of the Fund and all retail and institutional funds regardless of asset size or primary channel of distribution classified as “large-cap core funds” by Lipper showed that the Fund’s performance for the 1-year period was lower than the median. The Board noted that the portfolio has only been in existence since October 2002 and that the short-term performance of the underlying disciplines trailed their respective peer groups. Based on their review, which included careful consideration of all of the factors noted above, the Board will continue to gauge the Fund’s performance and investment strategies.
Smith Barney Multiple Discipline Trust: Multiple Discipline Portfolio — Large Cap Growth & Value
The information comparing the Fund’s performance to that of its Performance Universe, consisting of the Fund and all retail and institutional funds regardless of asset size or primary channel of distribution classified as “large-cap core funds” by Lipper showed that the Fund’s performance for the 1-year period was lower than the median. The Board noted that the portfolio has only been in existence since October 2002 and that the short-term performance of the underlying disciplines trailed their respective peer groups. Based on their review, which included careful consideration of all of the factors noted above, the Board will continue to gauge the Fund’s performance and investment strategies.
Management Fees and Expense Ratios
The Board reviewed and considered the contractual management fee (the “Contractual Management Fee”) payable by the Fund to the Manager in light of the nature, extent and quality of the management services provided by the Manager. The Board also reviewed and considered whether fee waiver and/or expense reimbursement arrangements are currently in place for the Fund and considered the actual fee rate (after taking any waivers and reimbursements into account) (the “Actual Management Fee”) and whether any fee waivers and reimbursements could be discontinued.
The Board received and considered information comparing the Fund’s Management Fees and the Fund’s overall expenses with those of funds in both the relevant expense group and a broader group of funds, each selected and provided by Lipper. The Board also reviewed information regarding fees charged by the Manager to other U.S. clients investing primarily in an asset class similar to that of the Fund including, where applicable, separate accounts. The Manager reviewed with the Board the significant differences in scope of services provided to the Fund and to these other clients, noting that the Fund is provided
66 Smith Barney Multiple Discipline Trust 2005 Annual Report
Board Approval of Management Agreement (unaudited) (continued)
with administrative services, office facilities, Fund officers (including the Fund’s chief executive, chief financial and chief compliance officers), and that the Manager coordinates and oversees the provision of services to the Fund by other Fund providers. The Board considered the fee comparisons in light of the differences required to manage these different types of accounts. The Board received an analysis of complex-wide management fees provided by the Manager, which, among other things, set out a proposed framework of fees based on asset classes.
Management also discussed with the Board the Fund’s distribution arrangements. The Board was provided with information concerning revenues received by and certain expenses incurred by the Fund’s affiliated distributors and how the amounts received by the distributors are paid.
Smith Barney Multiple Discipline Trust: Multiple Discipline Portfolio — All Cap Growth & Value
The information comparing the Fund’s Contractual and Actual Management Fees and its actual total expense ratio to its Expense Group, consisting of 12 variable insurance portfolios (including the Fund) that are classified as “multi-cap core” or “multi-cap value funds” by Lipper, showed that the Fund’s Contractual and Actual Management Fees were within the range of management fees paid by the other funds in the Expense Group and, indeed, were better than the median. The Board noted that the Fund’s actual total expense ratio was also better than the median and concluded that it was acceptable.
Smith Barney Multiple Discipline Trust: Multiple Discipline Portfolio — Balanced All Cap Growth & Value
The information comparing the Fund’s Contractual and Actual Management Fees and its actual total expense ratio to its Expense Group, consisting of 13 variable insurance portfolios (including the Fund) that are classified as “balanced funds” by Lipper, showed that the Fund’s Contractual and Actual Management Fees were within the range of management fees paid by the other funds in the Expense Group and were within the median range. The Board noted that the Fund’s total expense ratio was better than the median and concluded that it was acceptable.
Smith Barney Multiple Discipline Trust: Multiple Discipline Portfolio — Global All Cap Growth & Value
The information comparing the Fund’s Contractual and Actual Management Fees and its actual total expense ratio to its Expense Group, consisting of 14 variable insurance portfolios (including the Fund) that are classified as “large-cap core funds” by Lipper, showed that the Fund’s Contractual and Actual Management Fees were within the range of management fees paid by the other funds in the Expense Group and that the Contractual Management Fees were within the median range while the Actual Management Fees were higher than the median. The Board noted that the Fund’s actual total expense ratio was also higher than the median. The Board will continue to monitor the management fees and total expenses of the Fund.
Smith Barney Multiple Discipline Trust 2005 Annual Report 67
Board Approval of Management Agreement (unaudited) (continued)
Smith Barney Multiple Discipline Trust: Multiple Discipline Portfolio — Large Cap Growth & Value
The information comparing the Fund’s Contractual and Actual Management Fees and its actual total expense ratio to its Expense Group, consisting of 14 variable insurance portfolios (including the Fund) that are classified as “large-cap core funds” by Lipper, showed that the Fund’s Contractual and Actual Management Fees were within the range of management fees paid by the other funds in the Expense Group and that the Contractual Management Fees were within median range while the Actual Management Fees were better than the median. The Board noted that the Fund’s actual total expense ratio was higher than the median. The Board will continue to monitor the management fees and total expenses of the Fund.
Taking all of the above into consideration, the Board determined that the Management Fee was reasonable in light of the nature, extent and quality of the services provided to the Fund under the Management Agreement.
Manager Profitability
The Board received and considered a profitability analysis of the Manager and its affiliates in providing services to the Fund. The Board also received profitability information with respect to the CAM fund complex as a whole. In addition, the Board received information with respect to the Manager’s allocation methodologies used in preparing this profitability data as well as a report from an outside consultant that had reviewed the Manager’s methodology. The Manager’s profitability was considered not excessive in light of the nature, extent and quality of the services provided to the Fund.
Economies of Scale
The Board received and discussed information concerning whether the Manager realizes economies of scale as the Fund’s assets grow beyond current levels. However, because of the nature of the Manager’s business, the Board could not reach definitive conclusions as to whether the Manager might realize economies of scale or how great they may be.
Other Benefits to the Manager
The Board considered other benefits received by the Manager, and their affiliates as a result of their relationship with the Fund, including soft dollar arrangements, receipt of brokerage and the opportunity to offer additional products and services to Fund shareholders.
In light of the costs of providing investment management and other services to the Fund and the Manager’s ongoing commitment to the Fund, the profits and other ancillary benefits that the Manager and its affiliates received were considered reasonable.
In light of all of the foregoing, the Board approved the Management Agreement to continue for another year.
No single factor reviewed by the Board was identified by the Board as the principal factor in determining whether to approve the Management Agreement. The Independent Board Members were advised by separate independent legal counsel throughout the
68 Smith Barney Multiple Discipline Trust 2005 Annual Report
Board Approval of Management Agreement (unaudited) (continued)
process. The Board discussed the proposed continuance of the Management Agreement in a private session with their independent legal counsel at which no representatives of the Manager were present.
Additional Information
On June 23, 2005, Citigroup Inc. entered into a definitive agreement (the “Transaction Agreement”) with Legg Mason, Inc. under which Citigroup agreed to sell substantially all of its asset management business, Citigroup Asset Management (“CAM”), which includes the Adviser, to Legg Mason in exchange for the broker-dealer and investment banking businesses of Legg Mason and certain other considerations (the “Transaction”). The Transaction closed on December 1, 2005.
The consummation of the Transaction resulted in the automatic termination of the Fund’s current management agreement in accordance with the Investment Company Act of 1940, as amended (the “1940 Act”). Prior to the closing of the Transaction, the Fund’s Board approved a new management agreement between the Funds and the Adviser (the “New Management Agreement”), and authorized the Funds’ officers to submit the New Management Agreement to shareholders for their approval.
On July 11, 2005, members of the Board discussed with CAM management and certain Legg Mason representatives the Transaction and Legg Mason’s general plans and intentions regarding CAM’s business and its combination with Legg Mason’s business. The Board Members also inquired about the plans for and anticipated roles and responsibilities of certain CAM employees and officers after the Transaction.
At a meeting held on August 1, 2005, the Funds’ Board, including a majority of the Board Members who are not “interested persons” of the Funds or the Adviser as defined in the 1940 Act (the “Independent Board Members”), approved the New Management Agreement. To assist the Board in its consideration of the New Management Agreement, Legg Mason provided materials and information about Legg Mason, including its financial condition, asset management capabilities and organization, and CAM provided materials and information about the Transaction between Legg Mason and Citigroup. Representatives of CAM and Legg Mason also made presentations to and responded to questions from the Board. The Independent Board Members, through their independent legal counsel, also requested and received additional information from CAM and Legg Mason in connection with their consideration of the New Management Agreement. The additional information was provided in advance of and at the August meeting. After the presentations and after reviewing the written materials provided, the Independent Board Members met in executive session with their counsel to consider the New Management Agreement. The Independent Board Members also conferred separately and with their counsel about the Transaction on a number of occasions, including in connection with the July and August meetings.
In their deliberations concerning the New Management Agreement, among other things, the Board Members considered:
(i) the reputation, financial strength and resources of Legg Mason and its investment advisory subsidiaries;
Smith Barney Multiple Discipline Trust 2005 Annual Report 69
Board Approval of Management Agreement (unaudited) (continued)
(ii) that, following the Transaction, CAM will be part of an organization focused on the asset management business;
(iii) that Legg Mason is an experienced and respected asset management firm, and that Legg Mason has advised the Board Members that (a) it may wish to combine certain CAM operations with those of certain Legg Mason subsidiaries; (b) it is expected that these combination processes will result in changes to portfolio managers or portfolio management teams for a number of the CAM funds, subject to Board oversight and appropriate notice to shareholders, and that, in other cases, the current portfolio managers or portfolio management teams will remain in place; and (c) in the future, it may recommend that Legg Mason subsidiaries be appointed as the adviser or subadviser to some or all of the CAM funds, subject to applicable regulatory requirements;
(iv) that CAM management had advised the Board that a number of portfolio managers and other key CAM personnel would be retained after the closing of the Transaction;
(v) that CAM management and Legg Mason have advised the Board that following the Transaction, there is not expected to be any diminution in the nature, quality and extent of services provided to the Funds and their shareholders by the Adviser, including compliance services;
(vi) that Legg Mason has advised the Board that it has no present intention to alter the expense waivers and reimbursements currently in effect and, while it reserves the right to do so in the future, it would consult with the Board before making any changes;
(vii) that under the Transaction Agreement, Citigroup and Legg Mason have agreed not to take any action that is not contemplated by the Transaction or fail to take any action that to their respective knowledge would cause any “undue burden” on Fund shareholders under applicable provisions of the 1940 Act;
(viii) the assurances from Citigroup and Legg Mason that, for a three-year period following the closing of the Transaction, Citigroup-affiliated broker-dealers will continue to offer the Funds as an investment product, and the potential benefits to Fund shareholders from this and other third-party distribution access;
(ix) the potential benefits to Fund shareholders from being part of a combined fund family with Legg Mason-sponsored funds;
(x) that Citigroup and Legg Mason would derive benefits from the Transaction and that, as a result, they have a financial interest in the matters that were being considered;
(xi) the potential effects of regulatory restrictions on the Funds if Citigroup-affiliated broker-dealers remain principal underwriters of the Funds after the closing of the Transaction;
(xii) the fact that the Funds’ total advisory and administrative fees will not increase by virtue of the New Management Agreement, but will remain the same;
70 Smith Barney Multiple Discipline Trust 2005 Annual Report
Board Approval of Management Agreement (unaudited) (continued)
(xiii) the terms and conditions of the New Management Agreement, including the differences from the current management agreement, and the benefits of a single, uniform form of agreement covering these services;
(xiv) that the Funds would not bear the costs of obtaining shareholder approval of the New Management Agreement;
(xv) that the Funds would avail themselves of permissions granted under certain licensing arrangements between Citigroup and Legg Mason that would permit the Funds (including any share classes thereof) to maintain their current name, as well as all logos, trademarks and service marks, related to Citigroup or any of its affiliates for some agreed upon time period after the closing of the Transaction ; and
(xvi) that, as discussed in detail above, within the past year the Board had performed a full annual review of the current management agreement as required by the 1940 Act. In that regard, the Board, in its deliberations concerning the New Management Agreement, considered the same factors regarding the nature, quality and extent of services provided, costs of services provided, profitability, fall-out benefits, fees and economies of scale and investment performance as it did when it renewed the current management agreement, and reached substantially the same conclusions.
Smith Barney Multiple Discipline Trust 2005 Annual Report 71
Additional Information (unaudited)
Information about Trustees and Officers
The business and affairs of the Multiple Discipline Portfolio — All Cap Growth and Value, Multiple Discipline Portfolio — Large Cap Growth and Value, Multiple Discipline Portfolio — Global All Cap Growth and Value and Multiple Discipline Portfolio —Balanced All Cap Growth and Value (“Funds”) are managed under the direction of the Smith Barney Multiple Discipline Trust’s (“Trust”) Board of Trustees. Information pertaining to the Trustees and officers of the Trust is set forth below. The Statement of Additional Information includes additional information about the Trustees and is available without charge, upon request by calling Shareholder Services at 1-800-451-2010.
| | | | | | | | | | |
| | | | | |
Name, Address and
Birth Year | | Position(s)
Held with
Fund | | Term of
Office* and Length
of Time
Served | | Principal
Occupation(s) During Past
Five Years | | Number of Portfolios in Fund
Complex Overseen by
Trustee | | Other Board
Memberships Held by
Trustee |
| Non-Interested Trustees: | | | | | | | | |
Walter E. Auch 6001 N 62nd Place Paradise Valley, AZ 85253 Year of Birth: 1921 | | Trustee | | Since 2005 | | Retired | | 23 | | Director, Nicholas Applegate Funds; Director, UBS Funds; Director, US Bancorp Advisory Group |
| | | | | |
H. John Ellis
858 East Crystal Downs Drive Frankfort, MI 49635
Year of Birth: 1927 | | Trustee | | Since 2002 | | Retired | | 23 | | None |
| | | | | |
Armon E. Kamesar 7328 Country Club Drive
LaJolla, CA 92037
Year of Birth: 1927 | | Trustee | | Since 2002 | | Chairman, TEC International; Trustee,
U.S. Bankruptcy Court | | 23 | | Inter Ocean Systems Inc. |
| | | | | |
Stephen E. Kaufman
Stephen E. Kaufman PC Co. 277 Park Avenue,
47th Floor New York, NY 10172 Year of Birth: 1932 | | Trustee | | Since 2002 | | Attorney | | 47 | | None |
| | | | | |
John J. Murphy
123 Prospect Street
Ridgewood, NJ 07450
Year of Birth: 1944 | | Trustee | | Since
2002 | | President, Murphy Capital Management | | 23 | | Barclays International Funds Group Ltd. and affiliated companies |
72 Smith Barney Multiple Discipline Trust 2005 Annual Report
Additional Information (unaudited) (continued)
| | | | | | | | | | |
| | | | | |
Name, Address and
Birth Year | | Position(s)
Held with
Fund | | Term of
Office* and Length
of Time
Served | | Principal
Occupation(s) During Past
Five Years | | Number of Portfolios in Fund
Complex Overseen by
Trustee | | Other Board
Memberships Held by
Trustee |
| Interested Trustee: | | | | | | | | | | |
R. Jay Gerken, CFA** Citigroup Asset Management (“CAM”) 399 Park Avenue,
4th Floor New York, NY 10022 Year of Birth: 1951 | | Chairman,
President and Chief Executive
Officer | | Since
2002 | | Managing Director of CAM; Chairman, President and Chief Executive Officer of Smith Barney Fund Management LLC (“SBFM”); President and Chief Executive Officer of certain mutual funds associated with CAM; Formerly Portfolio Manager of Smith Barney Allocation Series Inc. (from 1996 to 2001) and Smith Barney Growth and Income Fund (from 1996 to 2000); Chairman, President and Chief Executive Officer of Travelers Investment Adviser, Inc. (“TIA”) (from 2002 to 2005) | | 183 | | None |
| | | | | |
| Officers: | | | | | | | | | | |
Andrew B. Shoup CAM 125 Broad Street,
11th Floor New York, NY 10004 Year of Birth: 1956 | | Senior Vice President and Chief Administrative Officer | | Since
2003 | | Director of CAM; Senior Vice President and Chief Administrative Officer of mutual funds associated with CAM; Chief Financial Officer and Treasurer of certain mutual funds associated with CAM; Head of International Funds Administration of CAM (from 2001 to 2003); Director of Global Funds to Administration of CAM (from 2000 to 2001); Head of U.S. Citibank Funds Administration of CAM (from 1998 to 2000) | | N/A | | N/A |
Smith Barney Multiple Discipline Trust 2005 Annual Report 73
Additional Information (unaudited) (continued)
| | | | | | | | | | |
| | | | | |
Name, Address and
Birth Year | | Position(s)
Held with
Fund | | Term of
Office* and Length
of Time
Served | | Principal
Occupation(s) During Past
Five Years | | Number of Portfolios in Fund
Complex Overseen by
Trustee | | Other Board
Memberships Held by
Trustee |
Robert J. Brault CAM 125 Broad Street,
11th Floor New York, NY 10004 Year of Birth: 1965 | | Chief Financial Officer and Treasurer | | Since
2004 | | Director of CGM; Chief Financial Officer and Treasurer of certain mutual funds associated with CAM; Director of Internal Control for CAM U.S. Mutual Fund Administration (from 2002 to 2004); Director of Project Management & Information Systems for CAM U.S. Mutual Fund Administration (from 2000 to 2002); Vice President of Mutual Fund Administration at Investors Capital Services (from 1999 to 2000) | | N/A | | N/A |
| | | | | |
Kirstin Mobyed CAM 100 First Stamford Place, 2nd Floor Stamford, CT 06902 Year of Birth: 1969 | | Investment Officer | | Since
2003 | | Director of CAM (since 2003); Private Client Manager (since 2001) and analyst at CGM and its predecessor (since 1992) | | N/A | | N/A |
| | | | | |
Roger Paradiso CAM 100 First Stamford Place, 2nd Floor Stamford, CT 06902 Year of Birth: 1966 | | Investment Officer | | Since
2003 | | Managing Director of CAM | | N/A | | N/A |
| | | | | |
Valerie Bannon CAM
399 Park Avenue, 4th Floor
New York, NY 10022
Birth year: 1973 | | Vice President and Investment Officer | | Since
2004 | | Director of CAM; Investment Officer of SBFM and investment officer of certain mutual funds associated with CAM | | N/A | | N/A |
| | | | | |
Alan J. Blake CAM
399 Park Avenue, 4th Floor
New York, NY 10022
Birth year: 1949 | | Vice President and Investment Officer | | Since 2002 | | Managing Director of CAM; Investment Officer of SBFM and investment officer of certain mutual funds associated with CAM | | N/A | | N/A |
74 Smith Barney Multiple Discipline Trust 2005 Annual Report
Additional Information (unaudited) (continued)
| | | | | | | | | | |
| | | | | |
Name, Address and
Birth Year | | Position(s)
Held with
Fund | | Term of
Office* and Length
of Time
Served | | Principal
Occupation(s) During Past
Five Years | | Number of Portfolios in Fund
Complex Overseen by
Trustee | | Other Board
Memberships Held by
Trustee |
Ellen S. Cammer CAM
399 Park Avenue, 4th Floor
New York, NY 10022
Birth year: 1954 | | Vice President and Investment Officer | | Since
2002 | | Managing Director of CAM; Investment Officer of SBFM and investment officer of certain mutual funds associated with CAM | | N/A | | N/A |
| | | | | |
Robert Feitler, Jr. CAM
399 Park Avenue, 4th Floor
New York, NY 10022
Birth year: 1959 | | Vice President and Investment Officer | | Since
2004 | | Director of CAM; Investment Officer of SBFM; officer of certain mutual funds associated with CAM | | N/A | | N/A |
| | | | | |
Richard A. Freeman CAM
399 Park Avenue, 4th Floor
New York, NY 10022
Birth year: 1953 | | Vice President and Investment Officer | | Since
2002 | | Managing Director of CAM; Investment Officer of SBFM and investment officer of certain mutual funds associated with CAM | | N/A | | N/A |
| | | | | |
John Goode CAM One Sansome Street, 36th Floor San Francisco, CA 94104 Birth year: 1944 | | Vice President and Investment Officer | | Since 2002 | | Managing Director of CAM; Investment Officer of SBFM and investment officer of certain mutual funds associated with CAM | | N/A | | N/A |
| | | | | |
Peter J. Hable CAM One Sansome Street, 36th Floor San Francisco, CA 94104 Birth year: 1958 | | Vice President and Investment Officer | | Since 2002 | | Managing Director of CAM; Investment Officer of SBFM and investment officer of certain mutual funds associated with CAM | | N/A | | N/A |
| | | | | |
Mark J. McAllister CAM
399 Park Avenue, 4th Floor
New York, NY 10022
Birth year: 1962 | | Vice President and Investment Officer | | Since 2004 | | Managing Director of CAM; Investment Officer of SBFM; former Executive Vice President, JLW Capital Management Inc. (1998-1999); officer of certain mutual funds associated with CAM | | N/A | | N/A |
| | | | | |
Jeffrey Russell, CFA CAM 399 Park Avenue, 4th Floor New York, NY 10022 Birth year: 1957 | | Vice President and Investment Officer | | Since 2002 | | Managing Director of CAM; Investment Officer of SBFM; officer of certain mutual funds associated with CAM | | N/A | | N/A |
Smith Barney Multiple Discipline Trust 2005 Annual Report 75
Additional Information (unaudited) (continued)
| | | | | | | | | | |
| | | | | |
Name, Address and
Birth Year | | Position(s)
Held with
Fund | | Term of
Office* and Length
of Time
Served | | Principal
Occupation(s) During Past
Five Years | | Number of Portfolios in Fund
Complex Overseen by
Trustee | | Other Board
Memberships Held by
Trustee |
Ted P. Becker CAM 399 Park Avenue New York, NY 10022 Birth Year: 1951 | | Chief Compliance Officer | | Since
2006 | | Managing Director of Compliance at Legg Mason & Co., LLC, (2005-Present); Chief Compliance Officer with certain mutual funds associated with CAM (since 2006); Managing Director of Compliance at Citigroup Asset Management (2002-2005). Prior to 2002, Managing Director- Internal Audit & Risk Review at Citigroup Inc. | | N/A | | N/A |
| | | | | |
John Chiota CAM 100 First Stamford Place,
5th Floor Stamford, CT 06902 Birth Year: 1968 | | Chief Anti-Money Laundering Compliance Officer | | Since
2006 | | Vice President of CAM (since 2004); Chief Anti-Money Laundering Compliance Officer with certain mutual funds associated with CAM (since 2006); prior to August 2004, Chief AML Compliance Officer with TD Waterhouse. | | N/A | | N/A |
| | | | | |
Robert I. Frenkel CAM 300 First Stamford Place,
4th Floor Stamford, CT 06902 Year of Birth: 1954 | | Secretary and Chief Legal Officer | | Since
2003 | | Managing Director and General Counsel of Global Mutual Funds for CAM and its predecessor (since 1994); Secretary and Chief Legal Officer of mutual funds associated with CAM | | N/A | | N/A |
| * | | Each Trustee and Officer serves until his or her successor has been duly elected and qualified. |
| ** | | Mr. Gerken is an “interested person” of the Trust as defined in the Investment Company Act of 1940, as amended, because Mr. Gerken is an officer of SBFM and certain of its affiliates. |
76 Smith Barney Multiple Discipline Trust 2005 Annual Report
Additional Shareholder Information (unaudited)
Results of a Special Meeting of Shareholders
On November 15, 2005, a Special Meeting of Shareholders was held for the following purposes: 1) to approve a new management agreement and 2) to elect Trustees. The following table provides the number of votes cast for, against or withheld, as well as the number of abstentions and broker non-votes as to each matter voted on at the Special Meeting of Shareholders.
| | | | | | |
| Item Voted On | | Votes For | | Votes
Against/
Withheld | | Abstentions |
New Management Agreement: | | | | | | |
All Cap Growth and Value | | 17,197,853.650 | | 998,429.260 | | 153,098.120 |
Large Cap Growth and Value | | 2,342,314.571 | | 37,952.510 | | 38,353.930 |
Global All Cap Growth and Value | | 4,372,172.450 | | 152,032.760 | | 89,254.570 |
Balanced All Cap Growth and Value | | 14,855,626.060 | | 221,702.770 | | 490,651.710 |
|
| | | | | | |
| Election of Trustees | | | | | | |
Nominees: | | | | | | |
Walter E. Auch | | 39,055,497.971 | | 1,893,944.390 | | 0.000 |
H. John Ellis | | 39,052,010.801 | | 1,897,431.560 | | 0.000 |
Armon E. Kamesar | | 39,052,010.801 | | 1,897,431.560 | | 0.000 |
Stephen E. Kaufman | | 39,081,148.341 | | 1,868,294.020 | | 0.000 |
John J. Murphy | | 39,081,148.341 | | 1,868,294.020 | | 0.000 |
R. Jay Gerken | | 39,081,148.341 | | 1,868,294.020 | | 0.000 |
|
Smith Barney Multiple Discipline Trust 2005 Annual Report 77
Important Tax Information (unaudited)
The following information is provided with respect to the distributions paid during the taxable year ended December 31, 2005:
| | | | | | | | | | | | | | | | | | | | |
| | | | |
| | | All Cap
Growth and
Value | | | Large Cap
Growth and
Value | | | Global All Cap
Growth and Value | | | Balanced All
Cap Growth
and Value | |
Record Date: | | | 12/27/2005 | | | | 12/27/2005 | | | | 8/18/2005 | | | | 12/27/2005 | | | | 12/27/2005 | |
Payable Date: | | | 12/28/2005 | | | | 12/28/2005 | | | | 8/19/2005 | | | | 12/28/2005 | | | | 12/28/2005 | |
|
|
Ordinary Income Dividends: Dividends Qualifying for the Dividends Received Deduction for Corporations | | | 100.00 | % | | | 100.00 | % | | | 100.00 | % | | | 69.30 | % | | | 54.21 | % |
|
|
Long-Term Capital Gain Dividend | | $ | 0.306446 | | | $ | 0.200003 | | | $ | — | | | $ | 0.168788 | | | $ | 0.119969 | |
|
|
Also, Large Cap Growth and Value Fund hereby designates an additional $2,325 of long-term capital gains for the year ended December 31, 2005.
Please retain this information for your records.
78 Smith Barney Multiple Discipline Trust 2005 Annual Report
Smith Barney Multiple Discipline Trust
| | |
TRUSTEES Walter E. Auch H. John Ellis R. Jay Gerken, CFA
Chairman Armon E. Kamesar Stephen E. Kaufman John J. Murphy OFFICERS R. Jay Gerken, CFA President and Chief
Executive Officer Andrew B. Shoup Senior Vice President and
Chief Administrative Officer Robert J. Brault Chief Financial Officer and Treasurer Kirstin Mobyed Investment Officer Roger Paradiso Investment Officer Valerie Bannon Investment Officer Alan J. Blake Investment Officer Ellen S. Cammer Investment Officer Robert Feitler, Jr. Investment Officer Richard A. Freeman Investment Officer John Goode Investment Officer Peter J. Hable Investment Officer | | OFFICERS (continued) Mark J. McAllister Investment Officer Jeffrey Russell, CFA Investment Officer Ted P. Becker Chief Compliance Officer John Chiota Chief Anti-Money Laundering Compliance Officer Robert I. Frenkel Secretary and
Chief Legal Officer INVESTMENT MANAGER Smith Barney Fund
Management LLC DISTRIBUTORS Citigroup Global Markets Inc. Legg Mason Investor Services, LLC CUSTODIAN State Street Bank and
Trust Company TRANSFER AGENT PFPC Inc. 4400 Computer Drive Westborough, Massachusetts 01581 INDEPENDENT REGISTERED PUBLIC ACCOUNTING FIRM KPMG LLP 345 Park Avenue New York, New York 10154 |
This report is submitted for the general information of the shareholders of the Smith Barney Multiple Discipline Trust: Multiple Discipline Portfolio — All Cap Growth and Value, Multiple Discipline Portfolio — Large Cap Growth and Value, Multiple Discipline Portfolio — Global All Cap Growth and Value and Multiple Discipline Portfolio — Balanced All Cap Growth and Value, and is not for use with the general public.
This report must be preceded or accompanied by a free prospectus. Investors should consider the Funds’ investment objectives, risks, charges and expenses carefully before investing. The prospectus contains this and other information about the Funds. Please read the prospectus carefully before investing.
www.citigroupam.com
©2005 Legg Mason Investor Services, LLC
Member NASD, SIPC
Smith Barney Multiple Discipline Trust
Multiple Discipline Portfolio — All Cap Growth and Value
Multiple Discipline Portfolio — Large Cap Growth and Value
Multiple Discipline Portfolio — Global All Cap Growth and Value
Multiple Discipline Portfolio — Balanced All Cap Growth and Value
The Funds are separate investment funds of the Smith Barney Multiple Discipline Trust, a Massachusetts business trust.
SMITH BARNEY MULTIPLE DISCIPLINE TRUST
Smith Barney Mutual Funds
125 Broad Street
10th Floor, MF-2
New York, New York 10004
The Funds file their complete schedule of portfolio holdings with the Securities and Exchange Commission for the first and third quarters of each fiscal year on the Form N-Q. The Funds’ Forms N-Q are available on the Commission’s website at www.sec.gov. The Funds’ Forms N-Q may be reviewed and copied at the Commission’s Public Reference Room in Washington, D.C., and information on the operation of the Public Reference Room may be obtained by calling 1-800-SEC-0330. To obtain information on Form N-Q from the Funds, shareholders can call 1-800-451-2010.
Information on how the Funds voted proxies relating to portfolio securities during the most recent 12-month period ended June 30 and a description of the policies and procedures that the Funds use to determine how to vote proxies relating to portfolio securities is available (1) without charge, upon request, by calling 1-800-451-2010, (2) on the Funds’ website at www.citigroupam.com and (3) on the SEC’s website at www.sec.gov.
ITEM 2. CODE OF ETHICS.
The registrant has adopted a code of ethics that applies to the registrant’s principal executive officer, principal financial officer, principal accounting officer or controller.
ITEM 3. AUDIT COMMITTEE FINANCIAL EXPERT.
The Board of Directors of the registrant has determined that Armon Kamesar, a Member of the Board’s Audit Committee, possesses the technical attributes identified in Instruction 2(b) of Item 3 to Form N-CSR to qualify as an “audit committee financial expert,” and has designated Mr. Kamesar as the Audit Committee’s financial expert. Mr. Kamesar is an “independent” Director pursuant to paragraph (a)(2) of Item 3 to Form N-CSR.
ITEM 4. PRINCIPAL ACCOUNTANT FEES AND SERVICES.
a) Audit Fees. The aggregate fees billed in the last two fiscal years ending December 31, 2004 and December 31, 2005 (the “Reporting Periods”) for professional services rendered by the Registrant’s principal accountant (the “Auditor”) for the audit of the Registrant’s annual financial statements, or services that are normally provided by the Auditor in connection with the statutory and regulatory filings or engagements for the Reporting Periods, were $83,000 in 2004 and $83,000 in 2005.
b) Audit-Related Fees. There were no fees billed in the Reporting Periods for assurance and related services by the Auditor that are reasonably related to the performance of the audit of the Registrant’s financial statements and are not reported under paragraph (a) of this Item 4.
In addition, there were no Audit-Related Fees billed in the Reporting Period for assurance and related services by the Auditor to the Registrant’s investment adviser (not including any sub-adviser whose role is primarily portfolio management and is subcontracted with or overseen by another investment adviser), and any entity controlling, controlled by or under common control with the investment adviser that provides ongoing services to the Smith Barney Multiple Discipline Trust (“service affiliates”), that were reasonably related to the performance of the annual audit of the service affiliates. Accordingly, there were no such fees that required pre-approval by the Audit Committee for the Reporting Periods (prior to May 6, 2003 services provided by the Auditor were not required to be pre-approved).
(c) Tax Fees. The aggregate fees billed in the Reporting Periods for professional services rendered by the Auditor for tax compliance, tax advice and tax planning (“Tax Services”) were $9,900 in 2004 and $9,900 in 2005. These services consisted of (i) review or preparation of U.S. federal, state, local and excise tax returns; (ii) U.S. federal, state and local tax planning, advice and assistance regarding statutory, regulatory or administrative developments, and (iii) tax advice regarding tax qualification matters and/or treatment of various financial instruments held or proposed to be acquired or held.
There were no fees billed for tax services by the Auditors to service affiliates during the Reporting Periods that required pre-approval by the Audit Committee.
d) All Other Fees. There were no other fees billed in the Reporting Periods for products and services provided by the Auditor, other than the services reported in paragraphs (a) through (c) of this Item for the Smith Barney Multiple Discipline Trust.
All Other Fees. There were no other non-audit services rendered by the Auditor to Smith Barney Fund Management LLC (“SBFM”), and any entity controlling, controlled by or under common control with SBFM that provided ongoing services to Smith Barney Multiple Discipline Trust requiring pre-approval by the Audit Committee in the Reporting Period.
(e) Audit Committee’s pre–approval policies and procedures described in paragraph (c)(7) of Rule 2-01 of Regulation S-X.
(1) The Charter for the Audit Committee (the “Committee”) of the Board of each registered investment company (the “Fund”) advised by Smith Barney Fund Management LLC or Salomon Brothers Asset Management Inc. or one of their affiliates (each, an “Adviser”) requires that the Committee shall approve (a) all audit and permissible non-audit services to be provided to the Fund and (b) all permissible non-audit services to be provided by the Fund’s independent auditors to the Adviser and any Covered Service Providers if the engagement relates directly to the operations and financial reporting of the Fund. The Committee may implement policies and procedures by which such services are approved other than by the full Committee.
The Committee shall not approve non-audit services that the Committee believes may impair the independence of the auditors. As of the date of the approval of this Audit Committee Charter, permissible non-audit services include any professional services (including tax services), that are not prohibited services as described below, provided to the Fund by the independent auditors, other than those provided to the Fund in connection with an audit or a review of the financial statements of the Fund. Permissible non-audit services may not include: (i) bookkeeping or other services related to the accounting records or financial statements of the Fund; (ii) financial information systems design and implementation; (iii) appraisal or valuation services, fairness opinions or contribution-in-kind reports; (iv) actuarial services; (v) internal audit outsourcing services; (vi) management functions or human resources; (vii) broker or dealer, investment adviser or investment banking services; (viii) legal services and expert services unrelated to the audit; and (ix) any other service the Public Company Accounting Oversight Board determines, by regulation, is impermissible.
Pre-approval by the Committee of any permissible non-audit services is not required so long as: (i) the aggregate amount of all such permissible non-audit services provided to the Fund, the Adviser and any service providers controlling, controlled by or under common control with the Adviser that provide ongoing services to the Fund (“Covered Service Providers”) constitutes not more than 5% of the total amount of revenues paid to the independent auditors during the fiscal year in which the permissible non-audit services are provided to (a) the Fund, (b) the Adviser and (c) any entity controlling, controlled by or under common control with the Adviser that provides ongoing services to the Fund during the fiscal year in which the services are provided that would have to be approved by the Committee; (ii) the permissible non-audit services were not recognized by the Fund at the time of the engagement to be non-audit services; and (iii) such services are promptly brought to the attention of the Committee and approved by the Committee (or its delegate(s)) prior to the completion of the audit.
(2) For the Smith Barney Multiple Discipline Trust, the percentage of fees that were approved by the audit committee, with respect to: Audit-Related Fees were 100% and 100% for 2004 and 2005; Tax Fees were 100% and 100% for 2004 and 2005; and Other Fees were 100% and 100% for 2004 and 2005.
(f) N/A
(g) Non-audit fees billed by the Auditor for services rendered to Smith Barney Multiple Discipline Trust and CAM and any entity controlling, controlled by, or under common control with CAM that provides ongoing services to Smith Barney Multiple Discipline Trust during the reporting period were $0 in 2005 for fees related to the transfer agent matter as fully described in the notes the financial statements titled “additional information” and $75,000 for 2004.
(h) Yes. The Smith Barney Multiple Discipline Trust’ Audit Committee has considered whether the provision of non-audit services that were rendered to Service Affiliates which were not pre-approved (not requiring pre-approval) is compatible with maintaining the Accountant’s independence. All services provided by the Auditor to the Smith Barney Multiple Discipline Trust or to Service Affiliates, which were required to be pre-approved, were pre-approved as required.
ITEM 5. AUDIT COMMITTEE OF LISTED REGISTRANTS.
Not applicable.
ITEM 6. SCHEDULE OF INVESTMENTS.
Included herein under Item 1.
ITEM 7. DISCLOSURE OF PROXY VOTING POLICIES AND PROCEDURES FOR CLOSED-END MANAGEMENT INVESTMENT COMPANIES.
Not applicable.
ITEM 8. PORTFOLIO MANAGERS OF CLOSED-END MANAGEMENT INVESTMENT COMPANIES.
Not applicable.
ITEM 9. PURCHASES OF EQUITY SECURITIES BY CLOSED-END MANAGEMENT INVESTMENT COMPANY AND AFFILIATED PURCHASERS.
Not applicable.
ITEM 10. SUBMISSION OF MATTERS TO A VOTE OF SECURITY HOLDERS.
Not applicable.
ITEM 11. CONTROLS AND PROCEDURES.
| | (a) | The registrant’s principal executive officer and principal financial officer have concluded that the registrant’s disclosure controls and procedures (as defined in Rule 30a- 3(c) under the Investment Company Act of 1940, as amended (the “1940 Act”)) are effective as of a date within 90 days of the filing date of this report that includes the disclosure required by this paragraph, based on their evaluation of the disclosure controls and procedures required by Rule 30a-3(b) under the 1940 Act and 15d-15(b) under the Securities Exchange Act of 1934. |
| | (b) | There were no changes in the registrant’s internal control over financial reporting (as defined in Rule 30a-3(d) under the 1940 Act) that occurred during the registrant’s last fiscal half-year (the registrant’s second fiscal half-year in the case of an annual report) that have materially affected, or are likely to materially affect the registrant’s internal control over financial reporting. |
ITEM 12. EXHIBITS.
| | (a) | Code of Ethics attached hereto. |
Exhibit 99.CODE ETH
| | |
| Exhibit 99.CERT | | Certifications pursuant to section 302 of the Sarbanes-Oxley Act of 2002 |
| |
| Exhibit 99.906CERT | | Certifications pursuant to Section 906 of the Sarbanes-Oxley Act of 2002 |
SIGNATURES
Pursuant to the requirements of the Securities Exchange Act of 1934 and the Investment Company Act of 1940, the registrant has duly caused this Report to be signed on its behalf by the undersigned, there unto duly authorized.
Smith Barney Multiple Discipline Trust
| | |
| By: | | /s/ R. Jay Gerken
|
| | | R. Jay Gerken |
| | | Chief Executive Officer of |
| | | Smith Barney Multiple Discipline Trust |
|
| Date: March 13, 2006 |
Pursuant to the requirements of the Securities Exchange Act of 1934 and the Investment Company Act of 1940, this report has been signed below by the following persons on behalf of the registrant and in the capacities and on the dates indicated.
| | |
| By: | | /s/ R. Jay Gerken
|
| | | R. Jay Gerken |
| | | Chief Executive Officer of |
| | | Smith Barney Multiple Discipline Trust |
|
| Date: March 13, 2006 |
| |
| By: | | /s/ Robert J. Brault
|
| | | (Robert J. Brault) |
| | | Chief Financial Officer of |
| | | Smith Barney Multiple Discipline Trust |
|
| Date: March 13, 2006 |