UNITED STATES
SECURITIES AND EXCHANGE COMMISSION
Washington, D.C. 20549
FORM N-CSR
CERTIFIED SHAREHOLDER REPORT OF REGISTERED
MANAGEMENT INVESTMENT COMPANIES
| | |
Investment Company Act file number | | 811-21128 |
Legg Mason Partners Variable Equity Trust
|
| (Exact name of registrant as specified in charter) |
| | |
| 125 Broad Street, New York, NY | | 10004 |
| (Address of principal executive offices) | | (Zip code) |
Robert I. Frenkel, Esq.
Legg Mason & Co., LLC
300 First Stamford Place, 4th Floor
Stamford, CT 06902
|
| (Name and address of agent for service) |
Registrant’s telephone number, including area code: (800) 451-2010
Date of fiscal year end: December 31
Date of reporting period: June 30, 2007
| ITEM 1. | REPORT TO STOCKHOLDERS. |
The Semi-Annual Report to Stockholders is filed herewith.
SEMI-ANNUAL
REPORT
JUNE 30, 2007

Legg Mason Partners
Variable Small Cap Growth Portfolio
INVESTMENT PRODUCTS: NOT FDIC INSURED Ÿ NO BANK GUARANTEE Ÿ MAY LOSE VALUE
Legg Mason Partners Variable Small Cap Growth Portfolio
Semi-Annual Report • June 30, 2007
What’s
Inside
Portfolio Objective
The Portfolio seeks long-term growth of capital. This objective may be changed without shareholder approval.
Letter from the Chairman

R. JAY GERKEN, CFA
Chairman, President and Chief Executive Officer
Dear Shareholder,
The U.S. economy weakened during the six-month reporting period ended June 30, 2007. U.S. gross domestic product (“GDP”)i expanded 2.5% in the fourth quarter of 2006. In the first quarter of 2007, GDP growth was a tepid 0.6%, according to the U.S. Commerce Department. This is the lowest growth rate since the fourth quarter of 2002. While consumer spending remained fairly solid, ongoing troubles in the housing market continued to negatively impact the economy. The advance estimate for second quarter 2007 GDP growth was a solid 3.4%, its fastest rate since the first quarter of 2006. While consumer spending slowed, this was offset by a sharp increase in business spending and exports.
After increasing the federal funds rateii to 5.25% in June 2006—the 17th consecutive rate hike—the Federal Reserve Board (“Fed”)iii held rates steady at its last eight meetings. In its statement accompanying the June 2007 meeting, the Fed stated: “The economy seems likely to continue to expand at a moderate pace over coming quarters.… Readings on core inflation have improved modestly in recent months. However, a sustained moderation in inflation pressures has yet to be convincingly demonstrated.… In these circumstances, the Committee’s predominant policy concern remains the risk that inflation will fail to moderate as expected.”
Despite concerns regarding the economy and increased volatility in the financial markets, stock prices generally rose during the six-month reporting period. Stocks began the year on a positive note, as the S&P 500 Indexiv hit a six-year high in January 2007. Stock prices rose on the back of optimism for continued solid corporate profits and hopes for a soft economic landing. The U.S. stock market’s ascent continued during much of February 2007, before a sharp decline at the end of the month. This was, in part, triggered by an 8.8% fall in China’s stock market on February 28th, its worst one-day performance in 10 years. After a modest increase in March 2007, U.S. stock prices
Legg Mason Partners Variable Small Cap Growth Portfolio I
rallied in April and May, thanks, in part, to surprisingly strong first quarter corporate profits. Stocks then gave up some ground in June due to continued weakness in the housing market, troubles in the subprime mortgage market and expectations that the Fed would not lower short-term interest rates in 2007. All told, the S&P 500 Index returned 6.96% during the six months ended June 30, 2007.
Looking at the U.S. stock market more closely, mid-cap stocks outperformed their large- and small-cap counterparts, as the Russell Midcapv, Russell 1000vi, and Russell 2000vii Indexes returned 9.90%, 7.18% and 6.45%, respectively, for the six months ended June 30, 2007. From an investment style perspective, growth stocks outperformed value stocks, with the Russell 3000 Growthviii and Russell 3000 Valueix Indexes returning 8.22% and 6.01%, respectively.
Since the close of the reporting period, the U.S. fixed-income markets have experienced a period of extreme volatility which has negatively impacted market liquidity conditions. Initially, the concern on the part of market participants was limited to the subprime segment of the mortgage-backed market. However, these concerns have since broadened to include a wider range of financial institutions and markets. As a result, domestic and international equity markets have also experienced heightened volatility in recent weeks.
| | |
| Performance Snapshot as of June 30, 2007 (unaudited) |
| |
| | | Six Months |
| | |
Variable Small Cap Growth Portfolio1 — Class I shares | | 9.21% |
| |
Russell 2000 Growth Index | | 9.33% |
| |
Lipper Variable Small Cap Growth Funds Category Average | | 10.96% |
| |
| The performance shown represents past performance. Past performance is no guarantee of future results and current performance may be higher or lower than the performance shown above. Principal value and investment returns will fluctuate and investors’ shares, when redeemed, may be worth more or less than their original cost. Performance figures reflect expense reimbursements and/or fee waivers, without which the performance would have been lower. |
| Portfolio returns assume the reinvestment of all distributions, including returns of capital, if any, at net asset value and the deduction of all Portfolio expenses. All Class II shares of the Portfolio in existence as of April 27, 2007 converted to Class I shares of the Portfolio on April 27, 2007. Effective April 30, 2007, Class II A shares were renamed Class II shares. Performance of Class II shares is not shown because Class II shares only recently commenced operations. The return for Class II shares would be lower than that for Class I shares because Class II shares have higher expenses than Class I shares. |
| | |
| Total Annual Operating Expenses (unaudited) |
| As of the Portfolio’s most current prospectus dated April 30, 2007, the gross total operating expenses for Class I and Class II shares were 0.88% and 1.13%, respectively. |
1 | | The Portfolio is an underlying investment option of various variable annuity and variable life insurance products. The Portfolio’s performance returns do not reflect the deduction of initial sales charges and expenses imposed in connection with investing in variable annuity or variable life insurance contracts, such as administrative fees, account charges, and surrender charges, which, if reflected, would reduce the performance of the Portfolio. Past performance is no guarantee of future results. |
2 | | Lipper, Inc. is a major independent mutual-fund tracking organization. Returns are based on the six-month period ended June 30, 2007, including the reinvestment of all distributions, including returns of capital, if any, calculated among the 105 funds in the Portfolio’s Lipper category. |
II Legg Mason Partners Variable Small Cap Growth Portfolio
Performance Review
For the six months ended June 30, 2007, Class I shares of Legg Mason Partners Variable Small Cap Growth Portfolio1 returned 9.21%. In comparison, the Portfolio’s unmanaged benchmark, the Russell 2000 Growth Indexx, returned 9.33% and its Lipper Variable Small Cap Growth Funds Category Average2 increased 10.96% for the same period.
Special Shareholder Notices
With a goal of moving the mutual funds formerly advised by Citigroup Asset Management (“CAM”) to a more cohesive and rational operating platform, Legg Mason, Inc. recommended a number of governance- and investment-related proposals to streamline and restructure the funds. The Boards of Directors/Trustees of the affected funds have carefully considered and approved these proposals and, where required, have obtained shareholder approval. As such, the following changes became effective during the month of April 2007:
| | • | | Funds Redomiciled and Single Form of Organization Adopted: The legacy CAM funds have been redomiciled to a single jurisdiction and a single form of corporate structure has been introduced. Equity funds have been grouped for organizational and governance purposes with other funds in the fund complex that are predominantly equity funds, and fixed-income funds have been grouped with other funds that are predominantly fixed-income funds. Additionally, the funds have adopted a single form of organization as a Maryland business trust, with all funds operating under uniform charter documents. |
Legg Mason Partners Variable Small Cap Growth Portfolio III
| | • | | New Boards Elected: New Boards have been elected for the legacy CAM funds. The 10 Boards previously overseeing the funds have been realigned and consolidated into 2 Boards, with the remaining Boards each overseeing a distinct asset class or product type: equity or fixed income. |
| | • | | Revised Fundamental Investment Policies Instituted: A uniform set of fundamental investment policies has been instituted for most funds, to the extent appropriate. Please note, however, that each fund will continue to be managed in accordance with its prospectus and statement of additional information, as well as any policies or guidelines that may have been established by the fund’s Board or investment manager. |
Information About Your Portfolio
As you may be aware, several issues in the mutual fund industry have come under the scrutiny of federal and state regulators. Affiliates of the Portfolio’s manager have, in recent years, received requests for information from various government regulators regarding market timing, late trading, fees, and other mutual fund issues in connection with various investigations. The regulators appear to be examining, among other things, the Portfolio’s response to market timing and shareholder exchange activity, including compliance with prospectus disclosure related to these subjects. The Portfolio is not in a position to predict the outcome of these requests and investigations.
Important information with regard to recent regulatory developments that may affect the Portfolio is contained in the Notes to Financial Statements included in this report.
IV Legg Mason Partners Variable Small Cap Growth Portfolio
As always, thank you for your continued confidence in our stewardship of your assets. We look forward to helping you meet your financial goals.
Sincerely,

R. Jay Gerken, CFA
Chairman, President and Chief Executive Officer
July 27, 2007
The information provided is not intended to be a forecast of future events, a guarantee of future results or investment advice. Views expressed may differ from those of the firm as a whole.
RISKS: Investments in small capitalization companies may involve a higher degree of risk and volatility than investments in larger, more established companies. Please see the Portfolio’s prospectus for more information on these and other risks.
All index performance reflects no deduction for fees, expenses or taxes. Please note that an investor cannot invest directly in an index.
i | | Gross domestic product (“GDP”) is the market value of all final goods and services produced within a country in a given period of time. |
ii | | The federal funds rate is the rate charged by one depository institution on an overnight sale of immediately available funds (balances at the Federal Reserve) to another depository institution; the rate may vary from depository institution to depository institution and from day to day. |
iii | | The Federal Reserve Board (“Fed”) is responsible for the formulation of policies designed to promote economic growth, full employment, stable prices, and a sustainable pattern of international trade and payments. |
iv | | The S&P 500 Index is an unmanaged index of 500 stocks that is generally representative of the performance of larger companies in the U.S. |
v | | The Russell Midcap Index measures the performance of the 800 smallest companies in the Russell 1000 Index, which represents approximately 25% of the total market capitalization of the Russell 1000 Index. |
vi | | The Russell 1000 Index measures the performance of the 1,000 largest companies in the Russell 3000 Index, which represents approximately 92% of the total market capitalization of the Russell 3000 Index. |
vii | | The Russell 2000 Index measures the performance of the 2,000 smallest companies in the Russell 3000 Index, which represents approximately 8% of the total market capitalization of the Russell 3000 Index. |
viii | | The Russell 3000 Growth Index measures the performance of those Russell 3000 Index companies with higher price-to-book ratios and higher forecasted growth values. (A price-to-book ratio is the price of a stock compared to the difference between a company’s assets and liabilities.) |
ix | | The Russell 3000 Value Index measures the performance of those Russell 3000 Index companies with lower price-to-book ratios and lower forecasted growth values. |
x | | The Russell 2000 Growth Index measures the performance of those Russell 2000 companies with higher price-to-book ratios and higher forecasted growth values. |
Legg Mason Partners Variable Small Cap Growth Portfolio V
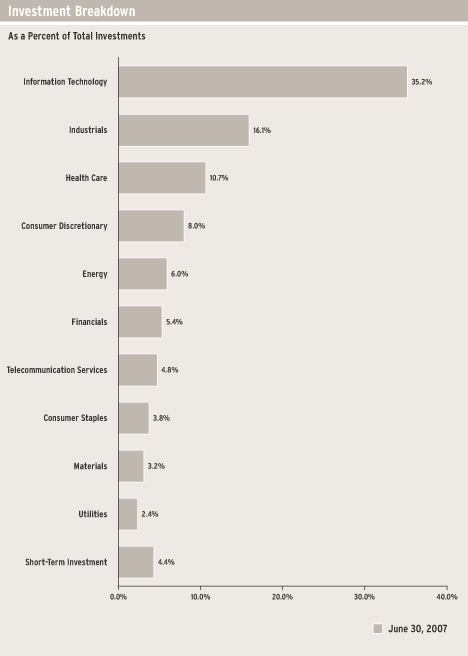
Fund at a Glance (unaudited)
Legg Mason Partners Variable Small Cap Growth Portfolio 2007 Semi-Annual Report 1
Fund Expenses (unaudited)
Example
As a shareholder of the Fund, you may incur two types of costs: (1) transaction costs and (2) ongoing costs, including management fees and other Fund expenses. This example is intended to help you understand your ongoing costs (in dollars) of investing in the Fund and to compare these costs with the ongoing costs of investing in other mutual funds.
This example is based on an investment of $1,000 invested on January 1, 2007 and held for the six months ended June 30, 2007.
Actual Expenses
The table below titled “Based on Actual Total Return” provides information about actual account values and actual expenses. You may use the information provided in this table, together with the amount you invested, to estimate the expenses that you paid over the period. To estimate the expenses you paid on your account, divide your ending account value by $1,000 (for example, an $8,600 ending account value divided by $1,000 = 8.6), then multiply the result by the number under the heading entitled “Expenses Paid During the Period”.
| | | | | | | | | | | | | | | |
| Based on Actual Total Return(1) |
| | | | | |
| | | Actual Total
Return(2) | | | Beginning
Account
Value | | Ending
Account
Value | | Annualized
Expense
Ratio | | | Expenses
Paid During
the Period(3) |
Class I | | 9.21 | % | | $ | 1,000.00 | | $ | 1,092.10 | | 0.85 | % | | $ | 4.41 |
| |
Class II(4) | | 4.85 | | | | 1,000.00 | | | 1,048.50 | | 0.88 | | | | 3.68 |
| |
(1) | | For the six months ended June 30, 2007, unless otherwise noted. |
(2) | | Assumes reinvestment of all distributions, including returns of capital, if any, at net asset value. Total return is not annualized, as it may not be representative of the total return for the year. Total returns do not reflect expenses associated with the separate account such as administrative fees, account charges and surrender charges, which, if reflected, would reduce the total returns. Performance figures may reflect fee waivers and/or expense reimbursements. In the absence of fee waivers and/or expense reimbursements, the total return would have been lower. Past performance is no guarantee of future results. |
(3) | | Expenses (net of fee waivers and/or expense reimbursements) are equal to each class’ respective annualized expense ratio multiplied by the average account value over the period, multiplied by the number of days in the most recent fiscal half-year, then divided by 365. |
(4) | | For the period February 2, 2007 (inception date) to June 30, 2007. |
2 Legg Mason Partners Variable Small Cap Growth Portfolio 2007 Semi-Annual Report
Fund Expenses (unaudited) (continued)
Hypothetical Example for Comparison Purposes
The table below titled “Based on Hypothetical Total Return” provides information about hypothetical account values and hypothetical expenses based on the actual expense ratio and an assumed rate of return of 5.00% per year before expenses, which is not the Fund’s actual return. The hypothetical account values and expenses may not be used to estimate the actual ending account balance or expenses you paid for the period. You may use the information provided in this table to compare the ongoing costs of investing in the Fund and other funds. To do so, compare the 5.00% hypothetical example relating to the Fund with the 5.00% hypothetical examples that appear in the shareholder reports of the other funds.
Please note that the expenses shown in the table below are meant to highlight your ongoing costs only and do not reflect any transactional costs. Therefore, the table is useful in comparing ongoing costs only, and will not help you determine the relative total costs of owning different funds. In addition, if these transaction costs were included, your costs would have been higher.
| | | | | | | | | | | | | | | |
| Based on Hypothetical Total Return(1) | | | | | | | | | |
| | | | | |
| | | Hypothetical
Annualized
Total Return | | | Beginning
Account
Value | | Ending
Account
Value | | Annualized
Expense
Ratio | | | Expenses
Paid During
the Period(2) |
Class I | | 5.00 | % | | $ | 1,000.00 | | $ | 1,020.58 | | 0.85 | % | | $ | 4.26 |
| |
Class II(3) | | 5.00 | | | | 1,000.00 | | | 1,016.82 | | 0.88 | | | | 3.62 |
| |
(1) | | For the six months ended June 30, 2007, unless otherwise noted. |
(2) | | Expenses (net of fee waivers and/or expense reimbursements) are equal to each class’ respective annualized expense ratio multiplied by the average account value over the period, multiplied by the number of days in the most recent fiscal half-year, then divided by 365. |
(3) | | For the period February 2, 2007 (inception date) to June 30, 2007. |
Legg Mason Partners Variable Small Cap Growth Portfolio 2007 Semi-Annual Report 3
Schedule of Investments (June 30, 2007) (unaudited)
LEGG MASON PARTNERS VARIABLE SMALL CAP GROWTH PORTFOLIO
| | | | | | |
| | |
| Shares | | Security | | Value | |
| | | | | | |
| COMMON STOCKS — 97.3% | |
| CONSUMER DISCRETIONARY — 8.1% | |
| Hotels, Restaurants & Leisure — 1.7% | |
| 28,445 | | Station Casinos Inc. | | $ | 2,469,026 | |
| | |
| Media — 3.6% | | | | |
| 43,370 | | Marvel Entertainment Inc.* | | | 1,105,068 | |
| 36,100 | | R.H. Donnelley Corp.* | | | 2,735,658 | |
| 92,830 | | Warner Music Group Corp. | | | 1,341,393 | |
| | |
| | Total Media | | | 5,182,119 | |
| | |
| Specialty Retail — 2.8% | | | | |
| 45,900 | | Coldwater Creek Inc.* | | | 1,066,257 | |
| 35,400 | | Men’s Wearhouse Inc. | | | 1,807,878 | |
| 51,800 | | Urban Outfitters Inc.* | | | 1,244,754 | |
| | |
| | Total Specialty Retail | | | 4,118,889 | |
| | |
| | TOTAL CONSUMER DISCRETIONARY | | | 11,770,034 | |
| | |
| CONSUMER STAPLES — 3.9% | | | | |
| Food & Staples Retailing — 1.8% | | | | |
| 62,950 | | Casey’s General Stores Inc. | | | 1,716,017 | |
| 31,800 | | United Natural Foods Inc.* | | | 845,244 | |
| | |
| | Total Food & Staples Retailing | | | 2,561,261 | |
| | |
| Personal Products — 2.1% | | | | |
| 68,300 | | Elizabeth Arden Inc.* | | | 1,656,958 | |
| 84,400 | | Nu Skin Enterprises Inc., Class A Shares | | | 1,392,600 | |
| | |
| | Total Personal Products | | | 3,049,558 | |
| | |
| | TOTAL CONSUMER STAPLES | | | 5,610,819 | |
| | |
| ENERGY — 6.1% | | | | |
| Energy Equipment & Services — 3.8% | | | | |
| 19,450 | | CARBO Ceramics Inc. | | | 852,104 | |
| 170,000 | | Input/Output Inc.* | | | 2,653,700 | |
| 58,400 | | Key Energy Services Inc.* | | | 1,082,152 | |
| 48,300 | | North American Energy Partners Inc.* | | | 978,558 | |
| | |
| | Total Energy Equipment & Services | | | 5,566,514 | |
| | |
| Oil, Gas & Consumable Fuels — 2.3% | | | | |
| 37,746 | | GMX Resources Inc.* | | | 1,306,012 | |
| 32,700 | | OPTI Canada Inc.* | | | 698,551 | |
| 34,300 | | Range Resources Corp. | | | 1,283,163 | |
| | |
| | Total Oil, Gas & Consumable Fuels | | | 3,287,726 | |
| | |
| | TOTAL ENERGY | | | 8,854,240 | |
| | |
See Notes to Financial Statements.
4 Legg Mason Partners Variable Small Cap Growth Portfolio 2007 Semi-Annual Report
Schedule of Investments (June 30, 2007) (unaudited) (continued)
| | | | | | |
| | |
| Shares | | Security | | Value | |
| | | | | | |
| FINANCIALS — 5.5% | | | | |
| Capital Markets — 1.7% | | | | |
| 19,560 | | Affiliated Managers Group Inc.* | | $ | 2,518,546 | |
| | |
| Commercial Banks — 1.4% | | | | |
| 22,470 | | Cullen/Frost Bankers Inc. | | | 1,201,471 | |
| 19,310 | | East-West Bancorp Inc. | | | 750,773 | |
| | |
| | Total Commercial Banks | | | 1,952,244 | |
| | |
| Real Estate Investment Trusts (REITs) — 1.8% | | | | |
| 9,859 | | Alexandria Real Estate Equities Inc. | | | 954,548 | |
| 37,710 | | Gramercy Capital Corp. | | | 1,038,534 | |
| 10,325 | | PS Business Parks Inc. | | | 654,295 | |
| | |
| | Total Real Estate Investment Trusts (REITs) | | | 2,647,377 | |
| | |
| Thrifts & Mortgage Finance — 0.6% | | | | |
| 80,580 | | NexCen Brands Inc.* | | | 897,661 | |
| | |
| | TOTAL FINANCIALS | | | 8,015,828 | |
| | |
| HEALTH CARE — 10.9% | |
| Biotechnology — 6.3% | |
| 38,200 | | Alexion Pharmaceuticals Inc.* | | | 1,721,292 | |
| 75,600 | | Arena Pharmaceuticals Inc.* | | | 830,844 | |
| 163,300 | | ARIAD Pharmaceuticals Inc.* | | | 896,517 | |
| 137,100 | | BioMarin Pharmaceutical Inc.* | | | 2,459,574 | |
| 29,100 | | Infinity Pharmaceuticals Inc.* | | | 316,608 | |
| 107,710 | | Senomyx Inc.* | | | 1,454,085 | |
| 90,940 | | Synta Pharmaceuticals Corp.* | | | 754,802 | |
| 23,900 | | Vertex Pharmaceuticals Inc.* | | | 682,584 | |
| | |
| | Total Biotechnology | | | 9,116,306 | |
| | |
| Health Care Equipment & Supplies — 1.1% | |
| 37,920 | | DJ Orthopedics Inc.* | | | 1,564,958 | |
| | |
| Health Care Providers & Services — 2.5% | |
| 56,300 | | LifePoint Hospitals Inc.* | | | 2,177,684 | |
| 19,400 | | Manor Care Inc. | | | 1,266,626 | |
| 7,520 | | Owens & Minor Inc. | | | 263,287 | |
| | |
| | Total Health Care Providers & Services | | | 3,707,597 | |
| | |
| Pharmaceuticals — 1.0% | |
| 40,790 | | Endo Pharmaceuticals Holdings Inc.* | | | 1,396,242 | |
| | |
| | TOTAL HEALTH CARE | | | 15,785,103 | |
| | |
| INDUSTRIALS — 16.4% | |
| Aerospace & Defense — 2.3% | |
| 160,857 | | Orbital Sciences Corp.* | | | 3,379,605 | |
| | |
| Building Products — 1.2% | |
| 37,000 | | NCI Building Systems Inc.* | | | 1,825,210 | |
| | |
See Notes to Financial Statements.
Legg Mason Partners Variable Small Cap Growth Portfolio 2007 Semi-Annual Report 5
Schedule of Investments (June 30, 2007) (unaudited) (continued)
| | | | | | |
| | |
| Shares | | Security | | Value | |
| | | | | | |
| Commercial Services & Supplies — 2.0% | |
| 65,300 | | Herman Miller Inc. | | $ | 2,063,480 | |
| 34,780 | | Taleo Corp., Class A Shares* | | | 783,593 | |
| | |
| | Total Commercial Services & Supplies | | | 2,847,073 | |
| | |
| Electrical Equipment — 1.5% | |
| 62,800 | | JA Solar Holdings Co. Ltd., ADR* | | | 2,118,244 | |
| | |
| Machinery — 5.6% | |
| 52,200 | | AGCO Corp.* | | | 2,266,002 | |
| 35,700 | | Crane Co. | | | 1,622,565 | |
| 67,150 | | IDEX Corp. | | | 2,587,961 | |
| 48,520 | | Mueller Industries Inc. | | | 1,671,029 | |
| | |
| | Total Machinery | | | 8,147,557 | |
| | |
| Trading Companies & Distributors — 3.5% | |
| 100,700 | | Grafton Group PLC* | | | 1,443,099 | |
| 66,310 | | MSC Industrial Direct Co. Inc., Class A Shares | | | 3,647,050 | |
| | |
| | Total Trading Companies & Distributors | | | 5,090,149 | |
| | |
| Transportation Infrastructure — 0.3% | |
| 21,630 | | Aegean Marine Petroleum Network Inc. | | | 411,403 | |
| | |
| | TOTAL INDUSTRIALS | | | 23,819,241 | |
| | |
| INFORMATION TECHNOLOGY — 35.8% | |
| Communications Equipment — 10.0% | |
| 534,950 | | 3Com Corp.* | | | 2,209,343 | |
| 121,700 | | ADC Telecommunications Inc.* | | | 2,230,761 | |
| 87,433 | | China Techfaith Wireless Communication Technology Ltd., ADR* | | | 487,876 | |
| 76,900 | | Comverse Technology Inc.* | | | 1,603,365 | |
| 254,200 | | ECI Telecom Ltd.* | | | 2,325,930 | |
| 369,330 | | Extreme Networks Inc.* | | | 1,495,787 | |
| 17,600 | | NETGEAR Inc.* | | | 638,000 | |
| 245,100 | | Tekelec* | | | 3,534,342 | |
| | |
| | Total Communications Equipment | | | 14,525,404 | |
| | |
| Computers & Peripherals — 3.2% | |
| 75,130 | | Avid Technology Inc.* | | | 2,655,845 | |
| 69,304 | | Electronics for Imaging Inc.* | | | 1,955,759 | |
| | |
| | Total Computers & Peripherals | | | 4,611,604 | |
| | |
| Electronic Equipment & Instruments — 0.8% | |
| 12,500 | | Mettler-Toledo International Inc.* | | | 1,193,875 | |
| | |
| Internet Software & Services — 9.8% | |
| 181,600 | | 24/7 Real Media Inc.* | | | 2,130,168 | |
| 13,900 | | Baidu.com Inc., ADR* | | | 2,334,922 | |
| 55,300 | | Digital River Inc.* | | | 2,502,325 | |
| 97,000 | | Online Resources Corp.* | | | 1,065,060 | |
| 63,000 | | SINA Corp.* | | | 2,637,180 | |
| 69,700 | | Sohu.com Inc.* | | | 2,229,703 | |
See Notes to Financial Statements.
6 Legg Mason Partners Variable Small Cap Growth Portfolio 2007 Semi-Annual Report
Schedule of Investments (June 30, 2007) (unaudited) (continued)
| | | | | | |
| | |
| Shares | | Security | | Value | |
| | | | | | |
| Internet Software & Services — 9.8% (continued) | |
| 149,759 | | SonicWALL Inc.* | | $ | 1,286,430 | |
| | |
| | Total Internet Software & Services | | | 14,185,788 | |
| | |
| IT Services — 1.0% | |
| 42,000 | | Wright Express Corp.* | | | 1,439,340 | |
| | |
| Semiconductors & Semiconductor Equipment — 1.7% | |
| 333,989 | | LSI Logic Corp.* | | | 2,508,257 | |
| | |
| Software — 9.3% | |
| 78,000 | | Blackboard Inc.* | | | 3,285,360 | |
| 65,600 | | Citrix Systems Inc.* | | | 2,208,752 | |
| 325,480 | | Lawson Software Inc.* | | | 3,218,997 | |
| 70,770 | | Sourcefire Inc.* | | | 990,073 | |
| 35,600 | | Take-Two Interactive Software Inc.* | | | 710,932 | |
| 195,919 | | TIBCO Software Inc.* | | | 1,773,067 | |
| 36,500 | | Ulticom Inc.* | | | 321,200 | |
| 32,440 | | Verint Systems Inc.* | | | 1,015,372 | |
| | |
| | Total Software | | | 13,523,753 | |
| | |
| | TOTAL INFORMATION TECHNOLOGY | | | 51,988,021 | |
| | |
| MATERIALS — 3.2% | | | | |
| Chemicals — 1.4% | |
| 32,000 | | Nalco Holding Co. | | | 878,400 | |
| 39,520 | | Valspar Corp. | | | 1,122,763 | |
| | |
| | Total Chemicals | | | 2,001,163 | |
| | |
| Metals & Mining — 1.8% | |
| 78,000 | | Compass Minerals International Inc. | | | 2,703,480 | |
| | |
| | TOTAL MATERIALS | | | 4,704,643 | |
| | |
| TELECOMMUNICATION SERVICES — 4.9% | |
| Diversified Telecommunication Services — 0.7% | |
| 66,070 | | Citizens Communications Co. | | | 1,008,889 | |
| | |
| Wireless Telecommunication Services — 4.2% | |
| 81,114 | | American Tower Corp., Class A Shares* | | | 3,406,788 | |
| 19,940 | | Crown Castle International Corp.* | | | 723,224 | |
| 184,000 | | Dobson Communications Corp., Class A Shares* | | | 2,044,240 | |
| | |
| | Total Wireless Telecommunication Services | | | 6,174,252 | |
| | |
| | TOTAL TELECOMMUNICATION SERVICES | | | 7,183,141 | |
| | |
| UTILITIES — 2.5% | |
| Electric Utilities — 2.1% | |
| 74,900 | | ITC Holdings Corp. | | | 3,043,187 | |
| | |
| Independent Power Producers & Energy Traders — 0.4% | |
| 15,600 | | Ormat Technologies Inc. | | | 587,808 | |
| | |
| | TOTAL UTILITIES | | | 3,630,995 | |
| | |
| | TOTAL INVESTMENTS BEFORE SHORT-TERM INVESTMENT
(Cost — $111,956,352) | | | 141,362,065 | |
| | |
See Notes to Financial Statements.
Legg Mason Partners Variable Small Cap Growth Portfolio 2007 Semi-Annual Report 7
Schedule of Investments (June 30, 2007) (unaudited) (continued)
| | | | | | | |
| | |
Face
Amount | | Security | | Value | |
| | | | | | | |
| | SHORT-TERM INVESTMENT — 4.5% | |
| | Repurchase Agreement — 4.5% | |
| $ | 6,495,000 | | Interest in $478,335,000 joint tri-party repurchase agreement dated 6/29/07 with Goldman Sachs & Co., 5.300% due 7/2/07; Proceeds at maturity — $6,497,869; (Fully collateralized by various U.S. government obligations, 0.000% to 7.250% due 9/13/07 to 8/15/22; Market value — $6,624,912)
(Cost — $6,495,000) | | $ | 6,495,000 | |
| | | |
| | | TOTAL INVESTMENTS — 101.8% (Cost — $118,451,352#) | | | 147,857,065 | |
| | | Liabilities in Excess of Other Assets — (1.8)% | | | (2,563,973 | ) |
| | | |
| | | TOTAL NET ASSETS — 100.0% | | $ | 145,293,092 | |
| | | |
| * | | Non-income producing security. |
| # | | Aggregate cost for federal income tax purposes is substantially the same. |
| | |
Abbreviation used in this schedule: |
| ADR | | — American Depositary Receipt |
See Notes to Financial Statements.
8 Legg Mason Partners Variable Small Cap Growth Portfolio 2007 Semi-Annual Report
Statement of Assets and Liabilities (June 30, 2007) (unaudited)
| | | | |
| ASSETS: | | | | |
Investments, at value (Cost — $118,451,352) | | $ | 147,857,065 | |
Cash | | | 978 | |
Receivable for securities sold | | | 1,107,613 | |
Receivable for Fund shares sold | | | 55,117 | |
Dividends and interest receivable | | | 50,035 | |
Prepaid expenses | | | 381 | |
| | |
Total Assets | | | 149,071,189 | |
| | |
| LIABILITIES: | | | | |
Payable for securities purchased | | | 3,402,002 | |
Payable for Fund shares repurchased | | | 181,252 | |
Investment management fee payable | | | 90,078 | |
Trustees’ fees payable | | | 5,715 | |
Accrued expenses | | | 99,050 | |
| | |
Total Liabilities | | | 3,778,097 | |
| | |
Total Net Assets | | $ | 145,293,092 | |
| | |
| NET ASSETS: | | | | |
Par value (Note 6) | | $ | 92 | |
Paid-in capital in excess of par value | | | 113,570,443 | |
Accumulated net investment loss | | | (367,271 | ) |
Accumulated net realized gain on investments, options written and foreign currency transactions | | | 2,684,115 | |
Net unrealized appreciation on investments | | | 29,405,713 | |
| | |
Total Net Assets | | $ | 145,293,092 | |
| | |
Shares Outstanding: | | | | |
Class I | | | 9,144,331 | |
| |
Class II | | | 85 | |
| |
Net Asset Value: | | | | |
Class I | | | $15.89 | |
| |
Class II | | | $15.89 | |
| | |
See Notes to Financial Statements.
Legg Mason Partners Variable Small Cap Growth Portfolio 2007 Semi-Annual Report 9
Statement of Operations (For the six months ended June 30, 2007) (unaudited)
| | | | |
| INVESTMENT INCOME: | | | | |
Dividends | | $ | 282,817 | |
Interest | | | 80,164 | |
| | |
Total Investment Income | | | 362,981 | |
| | |
| EXPENSES: | | | | |
Investment management fee (Note 2) | | | 387,286 | |
Legal fees | | | 28,829 | |
Shareholder reports (Note 4) | | | 23,719 | |
Trustees’ fees | | | 4,436 | |
Distribution fees (Note 4) | | | 3,243 | |
Audit and tax | | | 1,321 | |
Insurance | | | 1,082 | |
Custody fees | | | 339 | |
Transfer agent fees (Note 4) | | | 65 | |
Miscellaneous expenses | | | 698 | |
| | |
Total Expenses | | | 451,018 | |
Less: Fee waivers and/or expense reimbursements (Note 2) | | | (3 | ) |
| | |
Net Expenses | | | 451,015 | |
| | |
Net Investment Loss | | | (88,034 | ) |
| | |
| REALIZED AND UNREALIZED GAIN (LOSS) ON INVESTMENTS, OPTIONS WRITTEN AND FOREIGN CURRENCY TRANSACTIONS (NOTES 1 AND 3): | | | | |
Net Realized Gain (Loss) From: | | | | |
Investment transactions | | | 2,951,115 | |
Options written | | | 21,765 | |
Foreign currency transactions | | | (130 | ) |
| | |
Net Realized Gain | | | 2,972,750 | |
| | |
Change in Net Unrealized Appreciation/Depreciation From Investments | | | 5,415,123 | |
| | |
Net Gain on Investments, Options Written and Foreign Currency Transactions | | | 8,387,873 | |
| | |
Increase in Net Assets From Operations | | $ | 8,299,839 | |
| | |
See Notes to Financial Statements.
10 Legg Mason Partners Variable Small Cap Growth Portfolio 2007 Semi-Annual Report
Statements of Changes in Net Assets
| | | | | | | | |
For the six months ended June 30, 2007 (unaudited)
and the year ended December 31, 2006 | | | | | | | | |
| | |
| | | 2007 | | | 2006 | |
| OPERATIONS: | | | | | | | | |
Net investment loss | | $ | (88,034 | ) | | $ | (200,348 | ) |
Net realized gain | | | 2,972,750 | | | | 5,623,836 | |
Change in net unrealized appreciation/depreciation | | | 5,415,123 | | | | 3,423,143 | |
| | |
Increase in Net Assets From Operations | | | 8,299,839 | | | | 8,846,631 | |
| | |
| DISTRIBUTIONS TO SHAREHOLDERS FROM (NOTES 1 AND 5): | | | | | | | | |
Net realized gains | | | (1,093,421 | ) | | | (3,845,347 | ) |
| | |
Decrease in Net Assets From Distributions to Shareholders | | | (1,093,421 | ) | | | (3,845,347 | ) |
| | |
| FUND SHARE TRANSACTIONS (NOTE 6): | | | | | | | | |
Net proceeds from sale of shares | | | 9,640,500 | | | | 15,562,187 | |
Reinvestment of distributions | | | 1,093,421 | | | | 3,845,347 | |
Cost of shares repurchased | | | (14,422,601 | ) | | | (16,100,435 | ) |
Net assets of shares issued in connection with merger (Note 7) | | | 60,627,782 | | | | — | |
| | |
Increase in Net Assets From Fund Share Transactions | | | 56,939,102 | | | | 3,307,099 | |
| | |
Increase in Net Assets | | | 64,145,520 | | | | 8,308,383 | |
| NET ASSETS: | | | | | | | | |
Beginning of period | | | 81,147,572 | | | | 72,839,189 | |
| | |
End of period* | | $ | 145,293,092 | | | $ | 81,147,572 | |
| | |
* Includes accumulated net investment loss of: | | | $(367,271 | ) | | | $(125,642 | ) |
| | |
See Notes to Financial Statements.
Legg Mason Partners Variable Small Cap Growth Portfolio 2007 Semi-Annual Report 11
Financial Highlights
For a share of each class of beneficial interest outstanding throughout each year ended December 31, unless otherwise noted:
| | | | | | | | | | | | | | | | | | | | | | | | |
| | | | | | |
| Class I Shares | | 2007(1)(2) | | | 2006(1)† | | | 2005(1)† | | | 2004† | | | 2003(1)† | | | 2002† | |
Net Asset Value,
Beginning of Period | | $ | 14.66 | | | $ | 13.64 | | | $ | 14.09 | | | $ | 12.25 | | | $ | 8.22 | | | $ | 12.59 | |
| | |
Income (Loss) From Operations: | | | | | | | | | | | | | | | | | | | | | | | | |
Net investment loss | | | (0.01 | ) | | | (0.03 | ) | | | (0.01 | ) | | | (0.00 | )(3) | | | (0.06 | ) | | | (0.04 | ) |
Net realized and unrealized gain (loss) | | | 1.36 | | | | 1.78 | | | | 0.70 | | | | 1.84 | | | | 4.09 | | | | (4.33 | ) |
| | |
Total Income (Loss) From Operations | | | 1.35 | | | | 1.75 | | | | 0.69 | | | | 1.84 | | | | 4.03 | | | | (4.37 | ) |
| | |
Less Distributions From: | | | | | | | | | | | | | | | | | | | | | | | | |
Net realized gains | | | (0.12 | ) | | | (0.73 | ) | | | (1.14 | ) | | | — | | | | — | | | | — | |
| | |
Total Distributions | | | (0.12 | ) | | | (0.73 | ) | | | (1.14 | ) | | | — | | | | — | | | | — | |
| | |
Net Asset Value, End of Period | | $ | 15.89 | | | $ | 14.66 | | | $ | 13.64 | | | $ | 14.09 | | | $ | 12.25 | | | $ | 8.22 | |
| | |
Total Return(4) | | | 9.21 | % | | | 12.77 | % | | | 4.89 | % | | | 15.02 | % | | | 49.03 | %(5) | | | (34.71 | )% |
| | |
Net Assets, End of Period (000s) | | | $145,292 | | | | $77,815 | | | | $72,690 | | | | $66,350 | | | | $42,035 | | | | $16,047 | |
| | |
Ratios to Average Net Assets: | | | | | | | | | | | | | | | | | | | | | | | | |
Gross expenses | | | 0.85 | %(6) | | | 1.02 | %(7) | | | 0.97 | % | | | 1.03 | % | | | 1.26 | % | | | 1.30 | % |
Net expenses(8) | | | 0.85 | (6)(9) | | | 1.02 | (7)(9) | | | 0.97 | | | | 1.03 | | | | 1.26 | | | | 1.30 | |
Net investment income (loss) | | | (0.16 | )(6) | | | (0.23 | ) | | | (0.09 | ) | | | 0.01 | | | | (0.58 | ) | | | (0.47 | ) |
| | |
Portfolio Turnover Rate | | | 32 | % | | | 96 | % | | | 116 | % | | | 129 | % | | | 147 | % | | | 78 | % |
| | |
(1) | | Per share amounts have been calculated using the average shares method. |
(2) | | For the six months ended June 30, 2007 (unaudited). |
(3) | | Amount represents less than $0.01 per share. |
(4) | | Performance figures may reflect fee waivers and/or expense reimbursements. In the absence of fee waivers and/or expense reimbursements, the total return would have been lower. Past performance is no guarantee of future results. Total returns do not reflect expenses associated with the separate accounts such as administrative fees, account charges and surrender charges which, if reflected, would reduce the total return for all periods shown. Total returns for periods of less than one year are not annualized. |
(5) | | 0.12% of the Fund’s total return resulted from advisory reimbursements as a result of investments not meeting the investment policy of the Fund. |
(7) | | Included in the expense ratios are certain non-recurring restructuring (and reorganization, if applicable) fees that were incurred by the Fund during the period. Without these fees, the gross and net expense ratios would both have been 0.96% (Note 10). |
(8) | | As a result of a voluntary expense limitation, the ratio of expenses, other than interest, brokerage, taxes and extraordinary expenses, to average net assets of Class I shares will not exceed 1.00%. Prior to April 30, 2007, the expense limitation was 1.50%. |
(9) | | Reflects fee waivers and/or expense reimbursements. |
| † | | For a share of capital stock outstanding prior to April 30, 2007. |
See Notes to Financial Statements.
12 Legg Mason Partners Variable Small Cap Growth Portfolio 2007 Semi-Annual Report
Financial Highlights (continued)
For a share of each class of beneficial interest outstanding throughout each year ended December 31, unless otherwise noted:
| | | | |
| |
| Class II Shares(1)(2) | | 2007 | |
Net Asset Value, Beginning of Period | | $ | 15.27 | |
| | |
Income (Loss) From Operations: | | | | |
Net investment loss | | | (0.01 | ) |
Net realized and unrealized gain | | | 0.75 | |
| | |
Total Income From Operations | | | 0.74 | |
| | |
Less Distributions From: | | | | |
Net realized gains | | | (0.12 | ) |
| | |
Total Distributions | | | (0.12 | ) |
| | |
Net Asset Value, End of Period | | $ | 15.89 | |
| | |
Total Return(3) | | | 4.85 | % |
| | |
Net Assets, End of Period (000s) | | | $1 | |
| | |
Ratios to Average Net Assets: | | | | |
Gross expenses | | | 1.44 | %(4) |
Net expenses | | | 0.88 | (4)(5)(6) |
Net investment loss | | | (0.12 | )(4) |
| | |
Portfolio Turnover Rate | | | 32 | % |
| | |
(1) | | Per share amounts have been calculated using the average shares method. |
(2) | | For the period February 2, 2007 (inception date) to June 30, 2007. |
(3) | | Performance figures may reflect fee waivers and/or expense reimbursements. In the absence of fee waivers and/or expense reimbursements, the total return would have been lower. Past performance is no guarantee of future results. Total returns do not reflect expenses associated with the separate accounts such as administrative fees, account charges and surrender charges which, if reflected, would reduce the total return for all periods shown. Total returns for periods of less than one year are not annualized. |
(5) | | As a result of a voluntary expense limitation, the ratio of expenses, other than interest, brokerage, taxes and extraordinary expenses, to average net assets of Class II shares will not exceed 1.25%. |
(6) | | Reflects fee waivers and/or expense reimbursements. |
See Notes to Financial Statements.
Legg Mason Partners Variable Small Cap Growth Portfolio 2007 Semi-Annual Report 13
Notes to Financial Statements (unaudited)
| 1. | Organization and Significant Accounting Policies |
Legg Mason Partners Variable Small Cap Growth Portfolio (the “Fund”) is a separate diversified investment series of Legg Mason Partners Variable Equity Trust (the “Trust”). The Trust, a Maryland business trust, is registered under the Investment Company Act of 1940, as amended (the “1940 Act”), as an open-end management investment company. Prior to April 30, 2007, the Fund was a separate diversified investment fund of Legg Mason Partners Variable Portfolios I, Inc. (the “Company”). The Company, a Maryland corporation, was registered under the 1940 Act as an open-end management investment company. Shares of the Fund may only be purchased or redeemed through variable annuity contracts and variable life insurance policies offered by separate accounts of participating life insurance companies or through eligible pension or other qualified plans.
The following are significant accounting policies consistently followed by the Fund and are in conformity with U.S. generally accepted accounting principles (“GAAP”). Estimates and assumptions are required to be made regarding assets, liabilities and changes in net assets resulting from operations when financial statements are prepared. Changes in the economic environment, financial markets and any other parameters used in determining these estimates could cause actual results to differ.
(a) Investment Valuation. Equity securities for which market quotations are available are valued at the last reported sales price or official closing price on the primary market or exchange on which they trade. Debt securities are valued at the mean between the last quoted bid and asked prices provided by an independent pricing service that are based on transactions in debt obligations, quotations from bond dealers, market transactions in comparable securities and various other relationships between securities. When prices are not readily available, or are determined not to reflect fair value, such as when the value of a security has been significantly affected by events after the close of the exchange or market on which the security is principally traded, but before the Fund calculates its net asset value, the Fund may value these securities at fair value as determined in accordance with the procedures approved by the Fund’s Board of Trustees. Short-term obligations with maturities of 60 days or less are valued at amortized cost, which approximates fair value.
(b) Repurchase Agreements. When entering into repurchase agreements, it is the Fund’s policy that its custodian or a third party custodian take possession of the underlying collateral securities, the market value of which, at all times, at least equals the principal amount of the repurchase transaction, including accrued interest. To the extent that any repurchase transaction exceeds one business day, the value of the collateral is marked-to-market to ensure the adequacy of the collateral. If the seller defaults, and the market value of the collateral declines or if bankruptcy proceedings are commenced with respect to the seller of the security, realization of the collateral by the Fund may be delayed or limited.
(c) Written Options. When the Fund writes an option, an amount equal to the premium received by the Fund is recorded as a liability, the value of which is marked-to-market daily to reflect the current market value of the option written. If the option expires, the Fund realizes a gain from investments equal to the amount of the premium received. When a written call option is exercised, the difference between the premium received plus the option exercise price and the Fund’s basis in the underlying security (in the case of a covered written call
14 Legg Mason Partners Variable Small Cap Growth Portfolio 2007 Semi-Annual Report
Notes to Financial Statements (unaudited) (continued)
option), or the cost to purchase the underlying security (in the case of an uncovered written call option), including brokerage commission, is treated as a realized gain or loss. When a written put option is exercised, the amount of the premium received is added to the cost of the security purchased by the Fund from the exercise of the written put option to form the Fund’s basis in the underlying security purchased. The writer or buyer of an option traded on an exchange can liquidate the position before the exercise of the option by entering into a closing transaction. The cost of a closing transaction is deducted from the original premium received resulting in a realized gain or loss to the Fund.
The risk in writing a covered call option is that the Fund may forego the opportunity of profit if the market price of the underlying security increases and the option is exercised. The risk in writing a put option is that the Fund may incur a loss if the market price of the underlying security decreases and the option is exercised. The risk in writing a call option is that the Fund is exposed to the risk of loss if the market price of the underlying security increases. In addition, there is the risk that the Fund may not be able to enter into a closing transaction because of an illiquid secondary market.
(d) Foreign Currency Translation. Investment securities and other assets and liabilities denominated in foreign currencies are translated into U.S. dollar amounts based upon prevailing exchange rates on the date of valuation. Purchases and sales of investment securities and income and expense items denominated in foreign currencies are translated into U.S. dollar amounts based upon prevailing exchange rates on the respective dates of such transactions.
The Fund does not isolate that portion of the results of operations resulting from changes in foreign exchange rates on investments from the fluctuations arising from changes in market prices of securities held. Such fluctuations are included with the net realized and unrealized gain or loss on investments.
Net realized foreign exchange gains or losses arise from sales of foreign currencies, including gains and losses on forward foreign currency contracts, currency gains or losses realized between the trade and settlement dates on securities transactions, and the difference between the amounts of dividends, interest, and foreign withholding taxes recorded on the Fund’s books and the U.S. dollar equivalent of the amounts actually received or paid. Net unrealized foreign exchange gains and losses arise from changes in the fair values of assets and liabilities, other than investments in securities, at the date of valuation, resulting from changes in exchange rates.
Foreign security and currency transactions may involve certain considerations and risks not typically associated with those of U.S. dollar denominated transactions as a result of, among other factors, the possibility of lower levels of governmental supervision and regulation of foreign securities markets and the possibility of political or economic instability.
(e) Security Transactions and Investment Income. Security transactions are accounted for on a trade date basis. Interest income, adjusted for amortization of premium and accretion of discount, is recorded on the accrual basis. Dividend income is recorded on the ex-dividend date. The cost of investments sold is determined by use of the specific identification method. To the extent any issuer defaults on an expected interest payment, the Fund’s policy is to generally halt any additional interest income accruals and consider the realizability of interest accrued up to the date of default.
Legg Mason Partners Variable Small Cap Growth Portfolio 2007 Semi-Annual Report 15
Notes to Financial Statements (unaudited) (continued)
(f) Distributions to Shareholders. Distributions from net investment income and distributions of net realized gains, if any, are declared at least annually. Distributions to shareholders of the Fund are recorded on the ex-dividend date and are determined in accordance with income tax regulations, which may differ from GAAP.
(g) Class Accounting. Investment income, common expenses and realized/unrealized gain (loss) on investments are allocated to the various classes of the Fund on the basis of daily net assets of each class. Fees relating to a specific class are charged directly to that class.
(h) Expenses. Direct expenses are charged to the Fund; general expenses of the Trust are allocated to the funds within the Trust based on each fund’s relative net assets.
(i) Federal and Other Taxes. It is the Fund’s policy to comply with the federal income and excise tax requirements of the Internal Revenue Code of 1986, as amended, applicable to regulated investment companies. Accordingly, the Fund intends to distribute substantially all of its taxable income and net realized gains, if any, to shareholders each year. Therefore, no federal income tax provision is required in the Fund’s financial statements.
(j) Reclassification. GAAP requires that certain components of net assets be adjusted to reflect permanent differences between financial and tax reporting. These reclassifications have no effect on net assets or net asset values per share.
| 2. | Investment Management Agreement and Other Transactions with Affiliates |
Legg Mason Partners Fund Advisor, LLC (“LMPFA”) is the Fund’s investment manager and ClearBridge Advisors, LLC (“ClearBridge”) is the Fund’s subadviser. LMPFA and ClearBridge are wholly-owned subsidiaries of Legg Mason, Inc. (“Legg Mason”).
Under the investment management agreement, the Fund pays an investment management fee, calculated daily and paid monthly, at an annual rate of 0.75% of the Fund’s average daily net assets.
LMPFA provides administrative and certain oversight services to the Fund. LMPFA delegates to the subadviser the day-to-day portfolio management of the Fund, except for the management of cash and short-term investments. For its services, LMPFA pays ClearBridge 70% of the net management fee it receives from the Fund.
During the six months ended June 30, 2007, the Fund had voluntary expense limitations in place of 1.00% for Class I shares and 1.25% for Class II shares. Prior to April 30, 2007, the expense limitation for Class I shares was 1.50%.
During the six months ended June 30, 2007, LMPFA waived a portion of its investment management fee in the amount of $3.
Citigroup Global Markets Inc. (“CGM”) and Legg Mason Investor Services, LLC (“LMIS”) serve as co-distributors of the Fund. LMIS is a wholly owned broker-dealer of Legg Mason.
Certain officers and one Trustee of the Trust are employees of Legg Mason or its affiliates and do not receive compensation from the Trust.
16 Legg Mason Partners Variable Small Cap Growth Portfolio 2007 Semi-Annual Report
Notes to Financial Statements (unaudited) (continued)
During the six months ended June 30, 2007, the aggregate cost of purchases and proceeds from sales of investments (excluding short-term investments) were as follows:
| | | |
Purchases | | $ | 33,472,675 |
| |
Sales | | | 39,468,761 |
| |
At June 30, 2007, the aggregate gross unrealized appreciation and depreciation of investments for federal income tax purposes were substantially as follows:
| | | | |
Gross unrealized appreciation | | $ | 32,520,814 | |
Gross unrealized depreciation | | | (3,115,101 | ) |
| | |
Net unrealized appreciation | | $ | 29,405,713 | |
| | |
During the period ended June 30, 2007, written option transactions for the Fund were as follows:
| | | | | | | |
| | | Number of Contracts | | | Premiums Received | |
Options written, outstanding December 31, 2006 | | — | | | | — | |
Options written | | 169 | | | $ | 21,637 | |
Options closed | | (169 | ) | | | (21,637 | ) |
Options expired | | — | | | | — | |
| | |
Options written, outstanding June 30, 2007 | | — | | | | — | |
| | |
| 4. | Class Specific Expenses |
The Fund has adopted a Rule 12b-1 distribution plan and under that plan the Fund pays a distribution fee with respect to its Class II shares calculated at the annual rate of 0.25% of the average daily net assets of Class II. Distribution fees are accrued daily and paid monthly.
For the six months ended June 30, 2007, class specific expenses were as follows:
| | | | | | | | | |
| | | Distribution Fees | | Transfer Agent Fees | | Shareholder
Reports |
Class I | | | — | | $ | 12 | | $ | 23,115 |
Class II† | | $ | 3,242 | | | 51 | | | 602 |
Class II‡ | | | 1 | | | 2 | | | 2 |
| |
Total | | $ | 3,243 | | $ | 65 | | $ | 23,719 |
| |
| † | | Class II merged into Class I on April 27, 2007. |
| ‡ | | Class II A was renamed Class II on April 30, 2007. |
Legg Mason Partners Variable Small Cap Growth Portfolio 2007 Semi-Annual Report 17
Notes to Financial Statements (unaudited) (continued)
| 5. | Distributions to Shareholders by Class |
| | | | | | |
| | | Six Months Ended
June 30, 2007 | | Year Ended
December 31, 2006 |
Net Realized Gains: | | | | | | |
Class I | | $ | 1,093,411 | | $ | 3,683,374 |
Class II† | | | — | | | 161,973 |
Class II‡ | | | 10 | | | — |
| |
Total | | $ | 1,093,421 | | $ | 3,845,347 |
| |
| † | | Class II merged into Class I on April 27, 2007. |
| ‡ | | Class II A was renamed Class II on April 30, 2007. |
| 6. | Shares of Beneficial Interest |
At June 30, 2007, the Trust had an unlimited number of shares of beneficial interest authorized with a par value of $0.00001 per share. The Fund has the ability to issue multiple classes of shares. Each share of a class represents an identical interest in the Fund and has the same rights, except that each class bears certain direct expenses, specifically related to the distribution of its shares. Prior to April 30, 2007, the Fund had 10,000,000,000 shares of capital stock authorized with a par value of $0.001 per share.
Transactions in shares of each class were as follows:
| | | | | | | | | | | | | | |
| | |
| | | Six Months Ended
June 30, 2007 | | | Year Ended
December 31, 2006 | |
| | | Shares | | | Amount | | | Shares | | | Amount | |
Class I | | | | | | | | | | | | | | |
Shares sold | | 511,039 | | | $ | 7,996,327 | | | 761,442 | | | $ | 11,133,942 | |
Shares issued on reinvestment | | 69,116 | | | | 1,093,411 | | | 249,382 | | | | 3,683,374 | |
Shares repurchased | | (590,769 | ) | | | (9,153,349 | ) | | (1,034,005 | ) | | | (14,752,303 | ) |
Shares issued with merger | | 3,848,709 | | | | 60,627,782 | | | — | | | | — | |
| | |
Net Increase (Decrease) | | 3,838,095 | | | $ | 60,564,171 | | | (23,181 | ) | | $ | 65,013 | |
| | |
Class II† | | | | | | | | | | | | | | |
Shares sold | | 110,028 | | | $ | 1,642,873 | | | 301,247 | | | $ | 4,428,245 | |
Shares issued on reinvestment | | — | | | | — | | | 11,056 | | | | 161,973 | |
Shares repurchased | | (339,285 | ) | | | (5,269,244 | ) | | (93,953 | ) | | | (1,348,132 | ) |
| | |
Net Increase (Decrease) | | (229,257 | ) | | $ | (3,626,371 | ) | | 218,350 | | | $ | 3,242,086 | |
| | |
Class II‡ | | | | | | | | | | | | | | |
Shares sold | | 85 | | | $ | 1,300 | | | — | | | | — | |
Shares issued on reinvestment | | 1 | | | | 10 | | | — | | | | — | |
Shares repurchased | | (1 | ) | | | (8 | ) | | — | | | | — | |
| | |
Net Increase | | 85 | | | $ | 1,302 | | | — | | | | — | |
| | |
| † | | Class II merged into Class I on April 27, 2007. |
| ‡ | | Class II A was renamed Class II on April 30, 2007. |
18 Legg Mason Partners Variable Small Cap Growth Portfolio 2007 Semi-Annual Report
Notes to Financial Statements (unaudited) (continued)
On April 27, 2007, the Fund acquired the assets and certain liabilities of the Legg Mason Partners Variable Portfolios V—Legg Mason Partners Variable Small Cap Growth Opportunities Portfolio (“Acquired Fund”), pursuant to a plan of reorganization approved by the Acquired Fund shareholders on December 11, 2006. Total shares issued by the Fund and the total net assets of the Acquired Fund and the Fund on the date of the transfer were as follows:
| | | | | | | | |
| | | |
| Acquired Fund | | Shares Issued
by the Fund | | Total Net Assets of the
Legg Mason Partners
Variable Small Cap Growth
Opportunities Portfolio | | Total Net Assets
of the Fund |
Legg Mason Partners Variable Small Cap Growth Opportunities Portfolio | | 3,848,709 | | $ | 60,627,782 | | $ | 85,428,803 |
| |
The total net assets of the Acquired Fund before acquisition included unrealized appreciation of $11,433,331, accumulated net realized loss of $145,364 and accumulated net investment loss of $153,595. Total net assets of the Fund immediately after the transfer were $146,056,585. The transaction was structured to qualify as a tax-free reorganization under the Internal Revenue Code of 1986, as amended.
On May 31, 2005, the Securities and Exchange Commission (“SEC”) issued an order in connection with the settlement of an administrative proceeding against Smith Barney Fund Management LLC (“SBFM”), and CGM, relating to the appointment of an affiliated transfer agent for the Smith Barney family of mutual funds (the “Affected Funds”).
The SEC order found that SBFM and CGM willfully violated Section 206(1) of the Investment Advisers Act of 1940, as amended, and the rules promulgated thereunder (the “Advisers Act”). Specifically, the order found that SBFM and CGM knowingly or recklessly failed to disclose to the boards of the Affected Funds in 1999 when proposing a new transfer agent arrangement with an affiliated transfer agent that: First Data Investors Services Group (“First Data”), the Affected Funds’ then-existing transfer agent, had offered to continue as transfer agent and do the same work for substantially less money than before; and that Citigroup Asset Management (“CAM”), the Citigroup business unit that, at the time, included the Affected Funds’ investment manager and other investment advisory companies, had entered into a side letter with First Data under which CAM agreed to recommend the appointment of First Data as sub-transfer agent to the affiliated transfer agent in exchange, among other things, for a guarantee by First Data of specified amounts of asset management and investment banking fees to CAM and CGM. The order also found that SBFM and CGM willfully violated Section 206(2) of the Advisers Act by virtue of the omissions discussed above and other misrepresentations and omissions in the materials provided to the Affected Funds’ boards, including the failure to make clear that the affiliated transfer agent would earn a high profit for performing limited functions while First Data continued to perform almost all of the transfer agent functions, and the
Legg Mason Partners Variable Small Cap Growth Portfolio 2007 Semi-Annual Report 19
Notes to Financial Statements (unaudited) (continued)
suggestion that the proposed arrangement was in the Affected Funds’ best interests and that no viable alternatives existed.
SBFM and CGM do not admit or deny any wrongdoing or liability. The settlement does not establish wrongdoing or liability for purposes of any other proceeding. The SEC censured SBFM and CGM and ordered them to cease and desist from violations of Sections 206(1) and 206(2) of the Advisers Act. The order required Citigroup to pay $208.1 million, including $109 million in disgorgement of profits, $19.1 million in interest, and a civil money penalty of $80 million. Approximately $24.4 million has already been paid to the Affected Funds, primarily through fee waivers. The remaining $183.7 million, including the penalty, has been paid to the U.S. Treasury and will be distributed pursuant to a plan submitted for the approval of the SEC. At this time, there is no certainty as to how the above-described proceeds of the settlement will be distributed, to whom such distributions will be made, the methodology by which such distributions will be allocated, and when such distributions will be made. The order also required that transfer agency fees received from the Affected Funds since December 1, 2004, less certain expenses, be placed in escrow and provided that a portion of such fees might be subsequently distributed in accordance with the terms of the order. On April 3, 2006, an aggregate amount of approximately $9 million held in escrow was distributed to the Affected Funds.
The order required SBFM to recommend a new transfer agent contract to the Affected Funds’ boards within 180 days of the entry of the order; if a Citigroup affiliate submitted a proposal to serve as transfer agent or sub-transfer agent, SBFM and CGM would have been required, at their expense, to engage an independent monitor to oversee a competitive bidding process. On November 21, 2005, and within the specified timeframe, the Affected Funds’ boards selected a new transfer agent for the Affected Funds. No Citigroup affiliate submitted a proposal to serve as transfer agent. Under the order, SBFM also must comply with an amended version of a vendor policy that Citigroup instituted in August 2004.
Although there can be no assurance, SBFM does not believe that this matter will have a material adverse effect on the Affected Funds.
The Fund is not an Affected Fund and therefore did not implement the transfer agent arrangements described above and therefore will not receive any portion of distributions.
On December 1, 2005, Citigroup completed the sale of substantially all of its global asset management business, including SBFM, to Legg Mason.
On September 16, 2005, the staff of the SEC informed SBFM and Salomon Brothers Asset Management Inc. (“SBAM”) that the staff is considering recommending that the SEC institute administrative proceedings against SBFM and SBAM for alleged violations of Section 19(a) and 34(b) of the 1940 Act (and related Rule 19a-1). The notification is a result of an industry wide inspection by the SEC and is based upon alleged deficiencies in disclosures regarding dividends and distributions paid to shareholders of certain funds. Section 19(a) and related Rule 19a-1 of the 1940 Act generally require funds that are making dividend and distribution payments to provide shareholders with a written state-
20 Legg Mason Partners Variable Small Cap Growth Portfolio 2007 Semi-Annual Report
Notes to Financial Statements (unaudited) (continued)
ment disclosing the source of the dividends and distributions, and, in particular, the portion of the payments made from each of net investment income, undistributed net profits and/or paid-in capital. In connection with the contemplated proceedings, the staff may seek a cease and desist order and/or monetary damages from SBFM or SBAM.
Although there can be no assurance, the Fund’s manager believes that this matter is not likely to have a material adverse effect on the Fund.
| 10. | Special Shareholder Meeting and Reorganization |
Shareholders approved a number of initiatives designed to streamline and restructure the fund complex. These matters were implemented in early 2007. As noted in the proxy materials, Legg Mason paid for a portion of the costs related to these initiatives. The portion of the costs that are borne by the Fund were recognized in the period during which the expense was incurred. Such expenses relate to obtaining shareholder votes for proposals presented in the proxy, the election of board members, retirement of board members, as well as printing, mailing, and soliciting proxies.
| 11. | Recent Accounting Pronouncement |
During June 2006, the Financial Accounting Standards Board (“FASB”) issued FASB Interpretation 48 (“FIN 48” or the “Interpretation”), Accounting for Uncertainty in Income Taxes—an interpretation of FASB statement 109. FIN 48 supplements FASB Statement 109 Accounting for Income Taxes, by defining the confidence level that a tax position must meet in order to be recognized in the financial statements. FIN 48 prescribes a comprehensive model for how a fund should recognize, measure, present, and disclose in its financial statements uncertain tax positions that the fund has taken or expects to take on a tax return. FIN 48 requires that the tax effects of a position be recognized only if it is “more likely than not” to be sustained based solely on its technical merits. Management must be able to conclude that the tax law, regulations, case law, and other objective information regarding the technical merits sufficiently support the position’s sustainability with a likelihood of more than 50 percent. FIN 48 is effective for fiscal periods beginning after December 15, 2006, which for this Fund was January 1, 2007. At adoption, the financial statements must be adjusted to reflect only those tax positions that are more likely than not to be sustained as of the adoption date. Management of the Fund is currently evaluating the impact that FIN 48 will have on the financial statements.
* * *
On September 20, 2006, FASB released Statement of Financial Accounting Standards No. 157, Fair Value Measurements (“FAS 157”). FAS 157 establishes an authoritative definition of fair value, sets out a framework for measuring fair value, and requires additional disclosures about fair value measurements. The application of FAS 157 is required for fiscal years beginning after November 15, 2007 and interim periods within those fiscal years. At this time, management is evaluating the implications of FAS 157 and its impact on the financial statements has not yet been determined.
Legg Mason Partners Variable Small Cap Growth Portfolio 2007 Semi-Annual Report 21
Notes to Financial Statements (unaudited) (continued)
On July 24, 2007, NYSE Regulation, Inc. (“NYSE Regulation”) and the New Jersey Bureau of Securities (“NJBS”) announced they had censured and fined CGM for failing to supervise trading of mutual fund shares and variable annuity mutual fund sub-accounts, failing to prevent deceptive market timing by certain brokers on behalf of hedge-fund customers, and failing to maintain adequate books and records during the period from January 2000 to September 2003. Under the settlement with NYSE Regulation and NJBS, CGM agreed to pay a total of $50 million in disgorgement and penalties and neither admitted nor denied guilt. CGM is a distributor of the Fund. The Fund’s manager believes that this settlement will not have any effect on the financial position or results of operations of the Fund. The manager has been informed by CGM that the settlement will not affect the ability of CGM to continue to render services to the Fund under its contract.
22 Legg Mason Partners Variable Small Cap Growth Portfolio 2007 Semi-Annual Report
Legg Mason Partners Variable Small Cap Growth Portfolio
| | |
TRUSTEES Paul R. Ades Andrew L. Breech Dwight B. Crane Robert M. Frayn, Jr. R. Jay Gerken, CFA Chairman Frank G. Hubbard Howard J. Johnson David E. Maryatt Jerome H. Miller Ken Miller John J. Murphy Thomas F. Schlafly Jerry A. Viscione | | INVESTMENT MANAGER Legg Mason Partners Fund Advisor, LLC SUBADVISER ClearBridge Advisors, LLC DISTRIBUTORS Citigroup Global Markets Inc. Legg Mason Investor Services, LLC CUSTODIAN State Street Bank and
Trust Company TRANSFER AGENT PFPC Inc. 4400 Computer Drive Westborough, Massachusetts 01581 INDEPENDENT
REGISTERED PUBLIC ACCOUNTING FIRM KPMG LLP 345 Park Avenue New York, New York 10154 |
This report is submitted for the general information of the shareholders of Legg Mason Partners Variable Small Cap Growth Portfolio and is not for use with the general public.
This report must be preceded or accompanied by a free prospectus. Investors should consider the Fund’s investment objectives, risks, charges and expenses carefully before investing. The prospectus contains this and other important information about the Fund. Please read the prospectus carefully before investing.
©2007 Legg Mason
Investor Services, LLC
Member FINRA, SIPC
Legg Mason Partners Variable Small Cap Growth Portfolio
The Fund is a separate investment series of the Legg Mason Partners Variable Equity Trust, a Maryland Business Trust.
LEGG MASON PARTNERS VARIABLE SMALL CAP GROWTH PORTFOLIO
Legg Mason Partners Funds
125 Broad Street
10th Floor, MF-2
New York, New York 10004
The Fund files its complete schedule of portfolio holdings with Securities and Exchange Commission (“SEC”) for the first and third quarters of each fiscal year on Form N-Q. The Fund’s Forms N-Q are available on the SEC’S website at www.sec.gov. The Fund’s Forms N-Q may be reviewed and copied at the SEC’S Public Reference Room in Washington, D.C., and information on the operation of the Public Reference Room may be obtained by calling 1-800-SEC-0330. To obtain information on Form N-Q from the Fund, shareholders can call Legg Mason Partners Shareholder Services at 1-800-451-2010.
Information on how the Fund voted proxies relating to portfolio securities during the prior 12-month period ended June 30th of each year and a description of the policies and procedures that the Fund uses to determine how to vote proxies related to portfolio transactions are available (1) without charge, upon request, by calling 1-800-451-2010, (2) on the Fund’s website at www.leggmason.com/InvestorServices and (3) on the SEC’s website at www.sec.gov.
Not Applicable
| ITEM 3. | AUDIT COMMITTEE FINANCIAL EXPERT. |
Not Applicable
| ITEM 4. | Principal Accountant Fees and Services |
Not Applicable
| ITEM 5. | AUDIT COMMITTEE OF LISTED REGISTRANTS. |
Not applicable.
| ITEM 6. | SCHEDULE OF INVESTMENTS. |
Included herein under Item 1.
| ITEM 7. | DISCLOSURE OF PROXY VOTING POLICIES AND PROCEDURES FOR CLOSED-END MANAGEMENT INVESTMENT COMPANIES. |
Not applicable.
| ITEM 8. | PORTFOLIO MANAGERS OF CLOSED-END MANAGEMENT INVESTMENT COMPANIES. |
Not applicable.
| ITEM 9. | PURCHASES OF EQUITY SECURITIES BY CLOSED-END MANAGEMENT INVESTMENT COMPANY AND AFFILIATED PURCHASERS. |
Not applicable.
| ITEM 10. | SUBMISSION OF MATTERS TO A VOTE OF SECURITY HOLDERS. |
Not applicable.
| ITEM 11. | CONTROLS AND PROCEDURES. |
| | (a) | The registrant’s principal executive officer and principal financial officer have concluded that the registrant’s disclosure controls and procedures (as defined in Rule 30a- 3(c) under the Investment Company Act of 1940, as amended (the “1940 Act”)) are effective as of a date within 90 days of the filing date of this report that includes the disclosure required by this paragraph, based on their evaluation of the disclosure controls and procedures required by Rule 30a-3(b) under the 1940 Act and 15d-15(b) under the Securities Exchange Act of 1934. |
| | (b) | There were no changes in the registrant’s internal control over financial reporting (as defined in Rule 30a-3(d) under the 1940 Act) that occurred during the registrant’s last fiscal half-year (the registrant’s second fiscal half-year in the case of an annual report) that have materially affected, or are likely to materially affect the registrant’s internal control over financial reporting. |
(a) (1) Not applicable.
Exhibit 99.CODE ETH
(a) (2) Certifications pursuant to section 302 of the Sarbanes-Oxley Act of 2002 attached hereto.
Exhibit 99.CERT
(b) Certifications pursuant to Section 906 of the Sarbanes-Oxley Act of 2002 attached hereto.
Exhibit 99.906CERT
SIGNATURES
Pursuant to the requirements of the Securities Exchange Act of 1934 and the Investment Company Act of 1940, the registrant has duly caused this Report to be signed on its behalf by the undersigned, there unto duly authorized.
Legg Mason Partners Variable Equity Trust
| | |
| By: | | /s/ R. Jay Gerken |
| | (R. Jay Gerken) |
| | Chief Executive Officer of |
| | Legg Mason Partners Variable Equity Trust |
Date: August 28, 2007
Pursuant to the requirements of the Securities Exchange Act of 1934 and the Investment Company Act of 1940, this report has been signed below by the following persons on behalf of the registrant and in the capacities and on the dates indicated.
| | |
| By: | | /s/ R. Jay Gerken |
| | (R. Jay Gerken) |
| | Chief Executive Officer of |
| | Legg Mason Partners Variable Equity Trust |
Date: August 28, 2007
| | |
| By: | | /s/ Kaprel Ozsolak |
| | (Kaprel Ozsolak) |
| | Chief Financial Officer of |
| | Legg Mason Partners Variable Equity Trust |
Date: August 28, 2007