UNITED STATES
SECURITIES AND EXCHANGE COMMISSION
Washington, D.C. 20549
FORM N-CSR
CERTIFIED SHAREHOLDER REPORT OF REGISTERED
MANAGEMENT INVESTMENT COMPANIES
Investment Company Act file number 811-21128
Legg Mason Partners Variable Equity Trust
(Exact name of registrant as specified in charter)
55 Water Street, New York, NY 10041
(Address of principal executive offices) (Zip code)
Robert I. Frenkel, Esq.
Legg Mason & Co., LLC
100 First Stamford Place,
Stamford, CT 06902
(Name and address of agent for service)
Registrant’s telephone number, including area code:
Funds Investor Services at 1-800-822-5544
or
Institutional Shareholder Services at 1-888-425-6432
Date of fiscal year end: December 31
Date of reporting period: June 30, 2010
| ITEM 1. | REPORT TO STOCKHOLDERS. |
The Semi-Annual Report to Stockholders is filed herewith.
June 30, 2010

Semi-Annual Repor t
Legg Mason
ClearBridge
Variable Aggressive
Growth Portfolio
INVESTMENT PRODUCTS: NOT FDIC INSURED • NO BANK GUARANTEE • MAY LOSE VALUE
| | |
| II | | Legg Mason ClearBridge Variable Aggressive Growth Portfolio |
Portfolio objective
The Portfolio seeks capital appreciation.
Portfolio name change
Prior to November 2, 2009, the Portfolio was known as Legg Mason Partners Variable Aggressive Growth Portfolio. There was no change in the Portfolio’s investment objective or investment policies as a result of the name change.
| | |
| Letter from the chairman | |  |
Dear Shareholder,
We are pleased to provide the semi-annual report of Legg Mason ClearBridge Variable Aggressive Growth Portfolio for the six-month reporting period ended June 30, 2010.
Please read on for Portfolio performance information and a detailed look at prevailing economic and market conditions during the Portfolio’s reporting period. Important information with regard to recent regulatory developments that may affect the Portfolio is contained in the Notes to Financial Statements included in this report.
As always, we remain committed to providing you with excellent service and a full spectrum of investment choices. We also remain committed to supplementing the support you receive from your financial advisor. One way we accomplish this is through our website, www.leggmason.com/individualinvestors. Here you can gain immediate access to market and investment information, including:
| Ÿ | | Market insights and commentaries from our portfolio managers and |
| Ÿ | | A host of educational resources. |
We look forward to helping you meet your financial goals.
Sincerely,

R. Jay Gerken, CFA
Chairman, President and Chief Executive Officer
July 30, 2010
| | |
| Legg Mason ClearBridge Variable Aggressive Growth Portfolio | | III |
Investment commentary
Economic review
While the overall U.S. economy continued to expand over the six months ended June 30, 2010, several economic data points weakened toward the end of the reporting period. This, in combination with sovereign debt woes in Europe, caused investor sentiment to turn negative and had significant implications for the financial markets.
Looking back, the U.S. Department of Commerce reported that U.S. gross domestic product (“GDP”)i contracted four consecutive quarters, beginning in the third quarter of 2008 through the second quarter of 2009. Economic conditions then began to improve in the third quarter of 2009, as GDP growth was 1.6%. A variety of factors helped the economy to regain its footing, including the government’s $787 billion stimulus program. Economic growth then accelerated during the fourth quarter of 2009, as GDP growth was 5.0%. A slower drawdown in business inventories and renewed consumer spending were contributing factors spurring the economy’s higher growth rate. While the recovery continued during the first half of 2010, it did so at a more modest pace, as GDP growth was 3.7% during the first quarter of 2010 and an estimated 2.4% during the second quarter. The slower pace of growth in the second quarter was due, in part, to slower consumer spending, which rose an annualized 1.6% during the quarter, versus a 1.9% gain over the first three months of the year.
Even before GDP growth turned positive, there were signs that the economy was on the mend. The manufacturing sector, as measured by the Institute for Supply Management’s PMIii, rose to 52.8 in August 2009, the first time it surpassed 50 since January 2008 (a reading below 50 indicates a contraction, whereas a reading above 50 indicates an expansion). While June 2010’s PMI reading of 56.2 was lower than May’s reading of 59.7, manufacturing has now expanded eleven consecutive months according to PMI data. The manufacturing sector’s growth remained fairly broad-based with thirteen of the eighteen industries tracked by the Institute for Supply Management expanding during June.
After experiencing sharp job losses in 2009, the U.S. Department of Labor reported that over one million new positions were added during the first five months of 2010. Included in that total, however, were 700,000 temporary government jobs tied to the 2010 Census. In June, 225,000 of these temporary positions were eliminated, offsetting private sector growth and resulting in a net loss of 125,000 jobs for the month. However, the unemployment rate fell to 9.5% in June, versus 9.7% and 9.9% in May and April, respectively.
There was mixed news in the housing market during the period. According to the National Association of Realtors, existing home sales increased 7.0% and 8.0% in March and April, respectively, after sales had fallen for the period from December 2009 through February 2010. The rebound was largely attributed to people rushing to take advantage of the government’s $8,000 tax credit for first-time home buyers that expired at the end of April. However, with the end of the tax credit, existing home sales then declined 2.2% and 5.1% in May and June, respectively. In addition, the inventory of unsold homes increased 2.5% to 3.99 million in June. Looking at home prices, the S&P/Case-Shiller Home Price Indexiii indicated that month-to-month U.S. home prices rose 1.3% in May. This marked the second straight monthly increase following six consecutive months of declining prices.
Financial market overview
During the first half of the reporting period, the financial markets were largely characterized by healthy investor risk appetite and solid results by the stock market. However, the market experienced a sharp sell-off during the second half of the reporting period, during which risk aversion returned and investors flocked to the relative safety of U.S. Treasury securities.
Given certain pockets of weakness in the economy, including elevated unemployment in the U.S., the Federal Reserve Board (“Fed”)iv remained cautious. At its meeting in June 2010, the Fed said it “will maintain the target range for the federal funds ratev at 0 to 1/4 percent and continues to anticipate that economic conditions, including low rates of resource utilization, subdued inflation trends, and stable inflation expectations, are likely to warrant exceptionally low levels of the federal funds rate for an extended period.”
However, the Fed took several steps in reversing its accommodative monetary stance. On February 18, 2010, the Fed raised the discount rate, the interest rate it charges banks for temporary loans, from 1/2 to 3/4 percent. The Fed also concluded its $1.25 trillion mortgage securities purchase program at the end of the first quarter of 2010. However, the Fed left the door open for future stimulus measures if needed. In the minutes of its June meeting that were released on July 14th (after the reporting period ended), the Fed said, “In addition to continuing to develop and test instruments to exit from the period of unusually accommodative monetary policy, the Committee would need to consider whether further policy stimulus might become appropriate if the outlook were to worsen appreciably.”
| | |
| IV | | Legg Mason ClearBridge Variable Aggressive Growth Portfolio |
Investment commentary (cont’d)
Equity market review
After a solid start, the equity market, as measured by the S&P 500 Indexvi (the “Index”), fell sharply in May and June. This sell-off dragged the Index down into negative territory for the six months ended June 30, 2010. Looking back, after a brief setback in January 2010, the Index rose during the next three months of 2010 — advancing a total of 11.05%. There were a number of factors contributing to the stock market’s ascent, including improving economic conditions, strong investor demand and the accommodative monetary policy by the Fed.
However, robust investor appetite was replaced with heightened risk aversion in May and June. This was due to the escalating sovereign debt crisis in Europe, uncertainties regarding new financial reforms in the U.S. and some worse-than-expected economic data. After reaching a nineteen-month high on April 23, 2010, the market fell into “correction territory” in May, as it plunged more than 10%. This marked the first correction since November 2007. All told, the Index returned -6.65% over the six months ended June 30, 2010. While the Index on June 30, 2010 was more than 50% higher than its twelve-year low on March 9, 2009, it declined approximately 15% from its high on April 23, 2010.
The market’s weakness was broad-based, as virtually every major index fell into negative territory for the reporting period. Looking at the U.S. stock market more closely, small-cap stocks generated the best relative returns, with the Russell 2000 Indexvii returning -1.95% for the six-month reporting period. In contrast, the Russell Midcap Indexviii and the large-cap Russell 1000 Index ix returned -2.06% and -6.40%, respectively. From an investment style perspective, growth and value stocks, as measured by the Russell 3000 Growthx and Russell 3000 Valuexi Indices, returned -7.25% and -4.83%, respectively.
Performance review
For the six months ended June 30, 2010, Class I shares of Legg Mason ClearBridge Variable Aggressive Growth Portfolio 1 returned -7.09%. The Portfolio’s unmanaged benchmark, the Russell 3000
Growth Index, returned -7.25% over the same time frame. The Lipper Variable Multi-Cap Growth Funds Category Average2 returned -6.48% for the same period.
| | | |
| Performance Snapshot as of June 30, 2010 (unaudited) | |
| | | 6 months | |
Legg Mason ClearBridge Variable Aggressive
Growth Portfolio1: | | | |
Class I | | -7.09 | % |
Class II | | -7.24 | % |
| Russell 3000 Growth Index | | -7.25 | % |
| Lipper Variable Multi-Cap Growth Funds Category Average | | -6.48 | % |
The performance shown represents past performance. Past performance is no guarantee of future results and current performance may be higher or lower than the performance shown above. Principal value and investment returns will fluctuate and investors’ shares, when redeemed, may be worth more or less than their original cost.
All share class returns assume the reinvestment of all distributions, including returns of capital, if any, at net asset value and the deduction of all Portfolio expenses. Performance figures for periods shorter than one year represent cumulative figures and are not annualized.
Performance figures reflect expense reimbursements and/or fee waivers, without which the performance would have been lower.
|
| Total Annual Operating Expenses (unaudited) |
As of the Portfolio’s most current prospectus dated April 30, 2010, the gross total operating expense ratios for Class I and Class II shares were 0.81% and 1.09%, respectively.
Actual expenses may be higher. For example, expenses may be higher than those shown if average net assets decrease. Net assets are more likely to decrease and Portfolio expense ratios are more likely to increase when markets are volatile.
As always, thank you for your confidence in our stewardship of your assets.
Sincerely,
R. Jay Gerken, CFA
Chairman, President and Chief Executive Officer
July 30, 2010
| 1 | The Portfolio is an underlying investment option of various variable annuity and variable life insurance products. The Portfolio’s performance returns do not reflect the deduction of expenses imposed in connection with investing in variable annuity or variable life insurance contracts, such as administrative fees, account charges and surrender charges, which, if reflected, would reduce the performance of the Portfolio. Past performance is no guarantee of future results. |
| 2 | Lipper, Inc., a wholly-owned subsidiary of Reuters, provides independent insight on global collective investments. Returns are based on the six-month period ended June 30, 2010, including the reinvestment of all distributions, including returns of capital, if any, calculated among the 116 funds in the Portfolio’s Lipper category. |
| | |
| Legg Mason ClearBridge Variable Aggressive Growth Portfolio | | V |
RISKS : The Portfolio may invest a significant portion of its assets in small- and mid-cap companies which may be more volatile than an investment that focuses only on large-cap companies. The Portfolio may use derivatives, such as options and futures, which can be illiquid, may disproportionately increase losses, and have a potentially large impact on Portfolio performance. Please see the Portfolio’s prospectus for more information on these and other risks.
All investments are subject to risk including the possible loss of principal. All index performance reflects no deduction for fees, expenses or taxes. Please note that an investor cannot invest directly in an index.
The information provided is not intended to be a forecast of future events, a guarantee of future results or investment advice. Views expressed may differ from those of the firm as a whole.
| i | Gross domestic product (“GDP”) is the market value of all final goods and services produced within a country in a given period of time. |
| ii | The Institute for Supply Management's PMI is based on a survey of purchasing executives who buy the raw materials for manufacturing at more than 350 companies. It offers an early reading on the health of the manufacturing sector. |
| iii | The S&P/Case-Shiller Home Price Index measures the residential housing market, tracking changes in the value of the residential real estate market in twenty metropolitan regions across the United States. |
| iv | The Federal Reserve Board ("Fed") is responsible for the formulation of policies designed to promote economic growth, full employment, stable prices and a sustainable pattern of international trade and payments. |
| v | The federal funds rate is the rate charged by one depository institution on an overnight sale of immediately available funds (balances at the Federal Reserve) to another depository institution; the rate may vary from depository institution to depository institution and from day to day. |
| vi | The S&P 500 Index is an unmanaged index of 500 stocks and is generally representative of the performance of larger companies in the U.S. |
| vii | The Russell 2000 Index measures the performance of the 2,000 smallest companies in the Russell 3000 Index, which represents approximately 8% of the total market capitalization of the Russell 3000 Index. The Russell 3000 Index measures the performance of the 3,000 largest U.S. companies based on total market capitalization, which represents approximately 98% of the U.S. equity market. |
| viii | The Russell Midcap Index measures the performance of the 800 smallest companies in the Russell 1000 Index, which represents approximately 25% of the total market capitalization of the Russell 1000 Index. |
| ix | The Russell 1000 Index measures the performance of the 1,000 largest companies in the Russell 3000 Index, which represents approximately 92% of the total market capitalization of the Russell 3000 Index. |
| x | The Russell 3000 Growth Index measures the performance of those Russell 3000 Index companies with higher price-to-book ratios and higher forecasted growth values. (A price-to-book ratio is the price of a stock compared to the difference between a company’s assets and liabilities.) |
| xi | The Russell 3000 Value Index measures the performance of those Russell 3000 Index companies with lower price-to-book ratios and lower forecasted growth values. |
| | |
| Legg Mason ClearBridge Variable Aggressive Growth Portfolio 2010 Semi-Annual Report | | 1 |
Portfolio at a glance† (unaudited)
Investment breakdown (%) as a percent of total investments
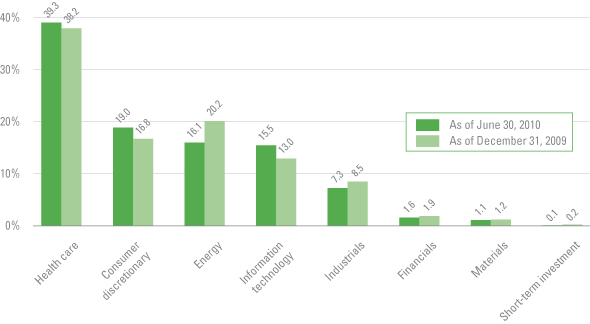
| † | The bar graph above represents the composition of the Portfolio’s investments as of June 30, 2010 and December 31, 2009. The Portfolio is actively managed. As a result, the composition of the Portfolio’s investments is subject to change at any time. |
| | |
| 2 | | Legg Mason ClearBridge Variable Aggressive Growth Portfolio 2010 Semi-Annual Report |
Portfolio expenses (unaudited)
Example
As a shareholder of the Portfolio, you may incur two types of costs: (1) transaction costs and (2) ongoing costs, including management fees and other Portfolio expenses. This example is intended to help you understand your ongoing costs (in dollars) of investing in the Portfolio and to compare these costs with the ongoing costs of investing in other mutual funds.
This example is based on an investment of $1,000 invested on January 1, 2010 and held for the six months ended June 30, 2010.
Actual expenses
The table below titled “Based on Actual Total Return” provides information about actual account values and actual expenses. You may use the information provided in this table, together with the amount you invested, to estimate the expenses that you paid over the period. To estimate the expenses you paid on your account, divide your ending account value by $1,000 (for example, an $8,600 ending account value divided by $1,000 = 8.6), then multiply the result by the number under the heading entitled “Expenses Paid During the Period”.
Hypothetical example for
comparison purposes
The table below titled “Based on Hypothetical Total Return” provides information about hypothetical account values and hypothetical expenses based on the actual expense ratio and an assumed rate of return of 5.00% per year before expenses, which is not the Portfolio’s actual return. The hypothetical account values and expenses may not be used to estimate the actual ending account balance or expenses you paid for the period. You may use the information provided in this table to compare the ongoing costs of investing in the Portfolio and other funds. To do so, compare the 5.00% hypothetical example relating to the Portfolio with the 5.00% hypothetical examples that appear in the shareholder reports of the other funds.
Please note that the expenses shown in the table below are meant to highlight your ongoing costs only and do not reflect any transactional costs. Therefore, the table is useful in comparing ongoing costs only, and will not help you determine the relative total costs of owning different funds. In addition, if these transaction costs were included, your costs would have been higher.
| | | | | | | | | | | | | | | | | | | | | | | | | | | | | | | | | | |
| Based on actual total return1 | | | | Based on hypothetical total return1 |
| | | Actual Total
Return2 | | | Beginning
Account
Value | | Ending
Account
Value | | Annualized
Expense
Ratio | | | Expenses
Paid
During
the
Period3 | | | | | | Hypothetical
Annualized Total Return | | | Beginning
Account
Value | | Ending
Account
Value | | Annualized
Expense
Ratio | | | Expenses
Paid
During
the
Period3 |
| Class I | | -7.09 | % | | $ | 1,000.00 | | $ | 929.10 | | 0.79 | % | | $ | 3.78 | | | | Class I | | 5.00 | % | | $ | 1,000.00 | | $ | 1,020.88 | | 0.79 | % | | $ | 3.96 |
| Class II | | -7.24 | | | | 1,000.00 | | | 927.60 | | 1.05 | | | | 5.02 | | | | Class II | | 5.00 | | | | 1,000.00 | | | 1,019.59 | | 1.05 | | | | 5.26 |
| 1 | For the six months ended June 30, 2010. |
| 2 | Assumes the reinvestment of all distributions, including returns of capital, if any, at net asset value. Total return is not annualized, as it may not be representative of the total return for the year. Total returns do not reflect expenses associated with the separate account such as administrative fees, account charges and surrender charges, which, if reflected, would reduce the total returns. Performance figures may reflect fee waivers and/or expense reimbursements. In the absence of fee waivers and/or expense reimbursements, the total return would have been lower. Past performance is no guarantee of future results. |
| 3 | Expenses are equal to each class’ respective annualized expense ratio multiplied by the average account value over the period, multiplied by the number of days in the most recent fiscal half-year (181), then divided by 365. |
| | |
| Legg Mason ClearBridge Variable Aggressive Growth Portfolio 2010 Semi-Annual Report | | 3 |
Schedule of investments (unaudited)
June 30, 2010
Legg Mason ClearBridge Variable Aggressive Growth Portfolio
| | | | | | | | | | |
| Security | | | | | | Shares | | Value | |
| Common Stocks — 100.1% | | | | | | | | | | |
| Consumer Discretionary — 19.1% | | | | | | | | | | |
Internet & Catalog Retail — 0.9% | | | | | | | | | | |
Liberty Media Holding Corp., Interactive Group, Series A Shares | | | | | | 540,950 | | $ | 5,679,975 | * |
Media — 18.0% | | | | | | | | | | |
Cablevision Systems Corp., New York Group, Class A Shares | | | | | | 1,316,625 | | | 31,612,166 | |
CBS Corp., Class B Shares | | | | | | 171,175 | | | 2,213,293 | |
Comcast Corp., Class A Shares | | | | | | 205,438 | | | 3,568,458 | |
Comcast Corp., Special Class A Shares | | | | | | 1,964,787 | | | 32,281,451 | |
DIRECTV, Class A Shares | | | | | | 369,922 | | | 12,547,754 | * |
Discovery Communications Inc., Class A Shares | | | | | | 96,440 | | | 3,443,872 | * |
Discovery Communications Inc., Class C Shares | | | | | | 106,440 | | | 3,292,189 | * |
Liberty Global Inc., Series A Shares | | | | | | 84,367 | | | 2,192,698 | * |
Liberty Global Inc., Series C Shares | | | | | | 85,560 | | | 2,223,704 | * |
Liberty Media — Starz, Series A Shares | | | | | | 48,584 | | | 2,518,595 | * |
Liberty Media Holding Corp., Capital Group, Series A Shares | | | | | | 98,690 | | | 4,136,098 | * |
Madison Square Garden Inc., Class A Shares | | | | | | 335,406 | | | 6,597,436 | * |
Viacom Inc., Class B Shares | | | | | | 171,175 | | | 5,369,760 | |
World Wrestling Entertainment Inc., Class A Shares | | | | | | 40,200 | | | 625,512 | |
Total Media | | | | | | | | | 112,622,986 | |
Specialty Retail — 0.2% | | | | | | | | | | |
Charming Shoppes Inc. | | | | | | 224,700 | | | 842,625 | * |
Total Consumer Discretionary | | | | | | | | | 119,145,586 | |
| Energy — 16.1% | | | | | | | | | | |
Energy Equipment & Services — 10.9% | | | | | | | | | | |
Core Laboratories NV | | | | | | 161,970 | | | 23,908,392 | |
National-Oilwell Varco Inc. | | | | | | 272,138 | | | 8,999,603 | |
Weatherford International Ltd. | | | | | | 2,678,900 | | | 35,200,746 | * |
Total Energy Equipment & Services | | | | | | | | | 68,108,741 | |
Oil, Gas & Consumable Fuels — 5.2% | | | | | | | | | | |
Anadarko Petroleum Corp. | | | | | | 903,135 | | | 32,594,142 | |
Total Energy | | | | | | | | | 100,702,883 | |
| Financials — 1.6% | | | | | | | | | | |
Capital Markets — 0.5% | | | | | | | | | | |
Cohen & Steers Inc. | | | | | | 160,400 | | | 3,326,696 | |
Thrifts & Mortgage Finance — 1.1% | | | | | | | | | | |
Astoria Financial Corp. | | | | | | 49,500 | | | 681,120 | |
New York Community Bancorp Inc. | | | | | | 379,415 | | | 5,793,667 | |
Total Thrifts & Mortgage Finance | | | | | | | | | 6,474,787 | |
Total Financials | | | | | | | | | 9,801,483 | |
| Health Care — 39.4% | | | | | | | | | | |
Biotechnology — 22.1% | | | | | | | | | | |
Alkermes Inc. | | | | | | 168,920 | | | 2,103,054 | * |
Amgen Inc. | | | | | | 754,985 | | | 39,712,211 | * |
Biogen Idec Inc. | | | | | | 926,546 | | | 43,964,608 | * |
Genzyme Corp. | | | | | | 795,436 | | | 40,384,286 | * |
Isis Pharmaceuticals Inc. | | | | | | 232,950 | | | 2,229,331 | * |
See Notes to Financial Statements.
| | |
| 4 | | Legg Mason ClearBridge Variable Aggressive Growth Portfolio 2010 Semi-Annual Report |
Schedule of investments (unaudited) (cont’d)
June 30, 2010
Legg Mason ClearBridge Variable Aggressive Growth Portfolio
| | | | | | | | | | |
| Security | | | | | | Shares | | Value | |
Biotechnology — continued | | | | | | | | | | |
Vertex Pharmaceuticals Inc. | | | | | | 282,050 | | $ | 9,279,445 | * |
Total Biotechnology | | | | | | | | | 137,672,935 | |
Health Care Equipment & Supplies — 2.8% | | | | | | | | | | |
Covidien PLC | | | | | | 439,741 | | | 17,668,793 | |
Health Care Providers & Services — 6.8% | | | | | | | | | | |
UnitedHealth Group Inc. | | | | | | 1,494,500 | | | 42,443,800 | |
Pharmaceuticals — 7.7% | | | | | | | | | | |
BioMimetic Therapeutics Inc. | | | | | | 208,410 | | | 2,317,519 | * |
Forest Laboratories Inc. | | | | | | 1,114,360 | | | 30,566,895 | * |
Teva Pharmaceutical Industries Ltd., ADR | | | | | | 84,238 | | | 4,379,534 | |
Valeant Pharmaceuticals International | | | | | | 210,520 | | | 11,008,091 | * |
Total Pharmaceuticals | | | | | | | | | 48,272,039 | |
Total Health Care | | | | | | | | | 246,057,567 | |
| Industrials — 7.3% | | | | | | | | | | |
Aerospace & Defense — 3.0% | | | | | | | | | | |
L-3 Communications Holdings Inc. | | | | | | 262,950 | | | 18,627,378 | |
Construction & Engineering — 0.1% | | | | | | | | | | |
Fluor Corp. | | | | | | 20,200 | | | 858,500 | |
Industrial Conglomerates — 2.5% | | | | | | | | | | |
Tyco International Ltd. | | | | | | 449,321 | | | 15,829,579 | |
Machinery — 1.7% | | | | | | | | | | |
Pall Corp. | | | | | | 310,590 | | | 10,674,978 | |
Total Industrials | | | | | | | | | 45,990,435 | |
| Information Technology — 15.5% | | | | | | | | | | |
Communications Equipment — 0.7% | | | | | | | | | | |
Arris Group Inc. | | | | | | 93,068 | | | 948,363 | * |
Nokia OYJ, ADR | | | | | | 414,685 | | | 3,379,683 | |
Total Communications Equipment | | | | | | | | | 4,328,046 | |
Computers & Peripherals — 5.0% | | | | | | | | | | |
SanDisk Corp. | | | | | | 529,980 | | | 22,296,259 | * |
Seagate Technology | | | | | | 692,657 | | | 9,032,247 | * |
Total Computers & Peripherals | | | | | | | | | 31,328,506 | |
Electronic Equipment, Instruments & Components — 2.2% | | | | | | | | | | |
Dolby Laboratories Inc., Class A Shares | | | | | | 40,000 | | | 2,507,600 | * |
Tyco Electronics Ltd. | | | | | | 448,701 | | | 11,388,031 | |
Total Electronic Equipment, Instruments & Components | | | | | | | | | 13,895,631 | |
Semiconductors & Semiconductor Equipment — 5.8% | | | | | | | | | | |
Broadcom Corp., Class A Shares | | | | | | 600,520 | | | 19,799,145 | |
Cree Inc. | | | | | | 140,110 | | | 8,410,803 | * |
Intel Corp. | | | | | | 409,329 | | | 7,961,449 | |
Standard Microsystems Corp. | | | | | | 15,700 | | | 365,496 | * |
Total Semiconductors & Semiconductor Equipment | | | | | | | | | 36,536,893 | |
Software — 1.8% | | | | | | | | | | |
Advent Software Inc. | | | | | | 111,800 | | | 5,250,128 | * |
Autodesk Inc. | | | | | | 241,850 | | | 5,891,466 | * |
Total Software | | | | | | | | | 11,141,594 | |
Total Information Technology | | | | | | | | | 97,230,670 | |
See Notes to Financial Statements.
| | |
| Legg Mason ClearBridge Variable Aggressive Growth Portfolio 2010 Semi-Annual Report | | 5 |
Legg Mason ClearBridge Variable Aggressive Growth Portfolio
| | | | | | | | | | | | |
| Security | | | | | ` | | Shares | | Value | |
| Materials — 1.1% | | | | | | | | | | | | |
Metals & Mining — 1.1% | | | | | | | | | | | | |
Freeport-McMoRan Copper & Gold Inc. | | | | | | | | 80,090 | | $ | 4,735,722 | |
Nucor Corp. | | | | | | | | 51,490 | | | 1,971,037 | |
Total Materials | | | | | | | | | | | 6,706,759 | |
Total Investments before Short-Term Investment (Cost — $543,174,191) | | | | | | | | | | | 625,635,383 | |
| | | | |
| | | Rate | | | Maturity
Date | | Face
Amount | | | |
| Short-Term Investment — 0.1% | | | | | | | | | | | | |
Repurchase Agreement — 0.1% | | | | | | | | | | | | |
Interest in $400,005,000 joint tri-party repurchase agreement dated 6/30/10 with RBS Securities Inc.; Proceeds at maturity — $388,000;
(Fully collateralized by various U.S. government agency obligations,
0.000% due 9/22/10 to 5/27/11; Market value — $395,763) (Cost — $388,000) | | 0.030 | % | | 7/1/10 | | $ | 388,000 | | | 388,000 | |
Total Investments — 100.2% (Cost — $543,562,191#) | | | | | | | | | | | 626,023,383 | |
Liabilities in Excess of Other Assets — (0.2)% | | | | | | | | | | | (1,151,874 | ) |
Total Net Assets — 100.0% | | | | | | | | | | $ | 624,871,509 | |
| * | Non-income producing security. |
| # | Aggregate cost for federal income tax purposes is substantially the same. |
| | |
Abbreviation used in this schedule: |
| ADR | | — American Depositary Receipt |
See Notes to Financial Statements.
| | |
| 6 | | Legg Mason ClearBridge Variable Aggressive Growth Portfolio 2010 Semi-Annual Report |
Statement of assets and liabilities (unaudited)
June 30, 2010
| | | |
| |
| Assets: | | | |
Investments, at value (Cost — $543,562,191) | | $ | 626,023,383 |
Cash | | | 374 |
Dividends receivable | | | 55,297 |
Receivable for Portfolio shares sold | | | 8,790 |
Total Assets | | | 626,087,844 |
| |
| Liabilities: | | | |
Payable for Portfolio shares repurchased | | | 590,444 |
Investment management fee payable | | | 381,458 |
Distribution fees payable | | | 8,169 |
Trustees’ fees payable | | | 4,109 |
Accrued expenses | | | 232,155 |
Total Liabilities | | | 1,216,335 |
| Total Net Assets | | $ | 624,871,509 |
| |
| Net Assets: | | | |
Par value (Note 7) | | $ | 515 |
Paid-in capital in excess of par value | | | 617,695,046 |
Overdistributed net investment income | | | (293,100) |
Accumulated net realized loss on investments | | | (74,992,144) |
Net unrealized appreciation on investments | | | 82,461,192 |
| Total Net Assets | | $ | 624,871,509 |
| |
| Shares Outstanding: | | | |
Class I | | | 48,352,911 |
Class II | | | 3,112,454 |
| |
| Net Asset Value: | | | |
Class I | | | $12.15 |
Class II | | | $12.05 |
See Notes to Financial Statements.
| | |
| Legg Mason ClearBridge Variable Aggressive Growth Portfolio 2010 Semi-Annual Report | | 7 |
Statement of operations (unaudited)
For the Six Months Ended June 30, 2010
| | | |
| |
| Investment Income: | | | |
Dividends | | $ | 2,907,673 |
Interest | | | 286 |
Less: Foreign taxes withheld | | | (40,998) |
Total Investment Income | | | 2,866,961 |
| |
| Expenses: | | | |
Investment management fee (Note 2) | | | 2,681,980 |
Distribution fees (Notes 2 and 5) | | | 53,201 |
Legal fees | | | 49,297 |
Shareholder reports | | | 46,801 |
Trustees’ fees | | | 27,712 |
Audit and tax | | | 14,306 |
Transfer agent fees (Note 5) | | | 9,619 |
Insurance | | | 7,274 |
Interest expense (Note 1) | | | 1,259 |
Custody fees | | | 876 |
Miscellaneous expenses | | | 3,720 |
Total Expenses | | | 2,896,045 |
Less: Fee waivers and/or expense reimbursements (Notes 2 and 5) | | | (26,185) |
Net Expenses | | | 2,869,860 |
| Net Investment Loss | | | (2,899) |
| |
| Realized and Unrealized Gain (Loss) on Investments (Notes 1 and 3): | | | |
Net Realized Loss From Investment Transactions | | | (2,149,057) |
Change in Net Unrealized Appreciation/Depreciation From Investments | | | (44,246,997) |
| Net Loss on Investments | | | (46,396,054) |
| Proceeds from Settlement of a Regulatory Matter (Note 9) | | | 20,706 |
| Decrease in Net Assets from Operations | | $ | (46,378,247) |
See Notes to Financial Statements.
| | |
| 8 | | Legg Mason ClearBridge Variable Aggressive Growth Portfolio 2010 Semi-Annual Report |
Statements of changes in net assets
| | | | | | | | |
For the Six Months Ended June 30, 2010 (unaudited), the Period Ended December 31, 2009 and the Year Ended October 31, 2009 | | 2010 | | 2009† | | 2009 |
| | | |
| Operations: | | | | | | | | |
Net investment income (loss) | | $ | (2,899) | | | $ 71,541 | | $ 53,525 |
Net realized gain (loss) | | | (2,149,057) | | | 3,827,811 | | (17,131,108) |
Change in net unrealized appreciation/depreciation | | | (44,246,997) | | | 75,077,568 | | 102,995,313 |
Proceeds from settlement of a regulatory matter (Note 9) | | | 20,706 | | | — | | — |
Increase (Decrease) in Net Assets From Operations | | | (46,378,247) | | | 78,976,920 | | 85,917,730 |
| | | |
| Distributions to Shareholders From (Notes 1 and 6): | | | | | | | | |
Net investment income | | | (125,030) | | | — | | — |
Decrease in Net Assets From Distributions to Shareholders | | | (125,030) | | | — | | — |
| | | |
| Portfolio Share Transactions (Note 7): | | | | | | | | |
Net proceeds from sale of shares | | | 14,697,017 | | | 3,767,201 | | 22,251,969 |
Reinvestment of distributions | | | 125,030 | | | — | | — |
Cost of shares repurchased | | | (67,297,300) | | | (17,184,370) | | (105,174,658) |
Decrease in Net Assets From Portfolio Share Transactions | | | (52,475,253) | | | (13,417,169) | | (82,922,689) |
Increase (Decrease) in Net Assets | | | (98,978,530) | | | 65,559,751 | | 2,995,041 |
| | | |
| Net Assets: | | | | | | | | |
Beginning of period | | | 723,850,039 | | | 658,290,288 | | 655,295,247 |
End of period* | | $ | 624,871,509 | | $ | 723,850,039 | | $658,290,288 |
* Includes overdistributed net investment income of: | | | $(293,100) | | | — | | — |
* Includes accumulated net investment loss of: | | | — | | | $(185,877) | | $(257,418) |
| † | For the period November 1, 2009 through December 31, 2009. |
See Notes to Financial Statements.
| | |
| Legg Mason ClearBridge Variable Aggressive Growth Portfolio 2010 Semi-Annual Report | | 9 |
Financial highlights
| | | | | | | | | | | | | | | | | | | | | |
| For a share of each class of beneficial interest outstanding throughout each year ended December 31, unless otherwise noted: | |
Class I Shares1 | | 20102 | | | 20093 | | | 20094 | | | 20084 | | | 20074 | | | 20064,5 | | | 20054,5 | |
| | | | | | | |
| Net asset value, beginning of period | | $13.08 | | | $11.67 | | | $10.15 | | | $17.13 | | | $16.05 | | | $14.26 | | | $12.24 | |
| | | | | | | |
| Income (loss) from operations: | | | | | | | | | | | | | | | | | | | | | |
Net investment income (loss) | | 0.00 | 6 | | 0.00 | 6 | | 0.00 | 6 | | (0.03) | | | (0.04) | | | (0.03) | | | (0.04) | |
Net realized and unrealized gain (loss) | | (0.93) | | | 1.41 | | | 1.52 | | | (6.86) | | | 1.14 | | | 1.82 | | | 2.11 | |
Total income (loss) from operations | | (0.93) | | | 1.41 | | | 1.52 | | | (6.89) | | | 1.10 | | | 1.79 | | | 2.07 | |
| | | | | | | |
| Less distributions from: | | | | | | | | | | | | | | | | | | | | | |
Net investment income | | (0.00) | 6 | | — | | | — | | | — | | | — | | | — | | | — | |
Net realized gains | | — | | | — | | | — | | | (0.09) | | | (0.02) | | | (0.00) | 6 | | (0.05) | |
Total distributions | | (0.00) | 6 | | — | | | — | | | (0.09) | | | (0.02) | | | (0.00) | 6 | | (0.05) | |
| | | | | | | |
| Net asset value, end of period | | $12.15 | | | $13.08 | | | $11.67 | | | $10.15 | | | $17.13 | | | $16.05 | | | $14.26 | |
Total return7 | | (7.09) | % | | 12.08 | % | | 14.98 | %8 | | (40.41) | % | | 6.84 | % | | 12.56 | % | | 16.94 | % |
| | | | | | | |
| Net assets, end of period (millions) | | $587 | | | $682 | | | $620 | | | $615 | | | $1,227 | | | $1,191 | | | $1,079 | |
| | | | | | | |
| Ratios to average net assets: | | | | | | | | | | | | | | | | | | | | | |
Gross expenses | | 0.79 | %9 | | 0.82 | %9 | | 0.81 | % | | 0.82 | % | | 0.78 | %10 | | 0.78 | % | | 0.82 | % |
Net expenses11,14 | | 0.79 | 9,12,13 | | 0.82 | 9 | | 0.81 | 12 | | 0.82 | | | 0.78 | 10, 13 | | 0.78 | 13 | | 0.82 | |
Net investment income (loss) | | 0.01 | 9 | | 0.08 | 9 | | 0.03 | | | (0.17) | | | (0.23) | | | (0.22) | | | (0.27) | |
| | | | | | | |
| Portfolio turnover rate | | 0 | % | | 0 | % | | 2 | % | | 2 | % | | 0 | % | | 4 | % | | 0 | % |
| 1 | Per share amounts have been calculated using the average shares method. |
| 2 | For the six months ended June 30, 2010 (unaudited). |
| 3 | For the period November 1, 2009 through December 31, 2009. |
| 4 | For the year ended October 31. |
| 5 | Represents a share of capital stock outstanding prior to April 30, 2007. |
| 6 | Amount represents less than $0.01 per share. |
| 7 | Performance figures may reflect fee waivers and/or expense reimbursements. In the absence of fee waivers and/or expense reimbursements, the total return would have been lower. Total returns do not reflect expenses associated with the separate accounts such as administrative fees, account charges and surrender charges which, if reflected, would reduce the total return for all periods shown. Past performance is no guarantee of future results Total returns for periods of less than one year are not annualized. |
| 8 | The total return includes gains from settlement of security litigations. Without these gains, the total return would have been 14.68%. |
| 10 | Included in the expense ratios are certain non-recurring restructuring (and reorganization, if applicable) fees that were incurred by the Portfolio during the period. Without these fees, the gross and net expense ratios would both have been 0.77%. |
| 11 | As a result of an expense limitation agreement, the ratio of expenses, other than interest, brokerage, taxes and extraordinary expenses, to average net assets of Class I shares will not exceed 1.00% until December 31, 2011. |
| 12 | The impact to the expense ratio was less than 0.01% as a result of interest expense. |
| 13 | Reflects fee waivers and/or expense reimbursements. |
| 14 | The impact of compensating balance arrangements, if any, was less than 0.01%. |
See Notes to Financial Statements.
| | |
| 10 | | Legg Mason ClearBridge Variable Aggressive Growth Portfolio 2010 Semi-Annual Report |
Financial highlights (cont’d)
| | | | | | | | | | | | | | | |
| For a share of each class of beneficial interest outstanding throughout each year ended December 31, unless otherwise noted: | |
Class II Shares1 | | 20102 | | | 20093 | | | 20094 | | | 20084 | | | 20075 | |
| | | | | |
| Net asset value, beginning of period | | $12.99 | | | $11.60 | | | $10.11 | | | $17.11 | | | $16.66 | |
| | | | | |
| Income (loss) from operations: | | | | | | | | | | | | | | | |
Net investment income (loss) | | (0.02) | | | (0.00) | 6 | | (0.03) | | | (0.06) | | | (0.07) | |
Net realized and unrealized gain (loss) | | (0.92) | | | 1.39 | | | 1.52 | | | (6.85) | | | 0.52 | |
Total income (loss) from operations | | (0.94) | | | 1.39 | | | 1.49 | | | (6.91) | | | 0.45 | |
| | | | | |
| Less distributions from: | | | | | | | | | | | | | | | |
Net realized gains | | — | | | — | | | — | | | (0.09) | | | — | |
Total distributions | | — | | | — | | | — | | | (0.09) | | | — | |
| | | | | |
| Net asset value, end of period | | $12.05 | | | $12.99 | | | $11.60 | | | $10.11 | | | $17.11 | |
Total return7 | | (7.24) | % | | 11.98 | % | | 14.74 | %8 | | (40.57) | % | | 2.70 | % |
| | | | | |
| Net assets, end of period (millions) | | $38 | | | $42 | | | $38 | | | $40 | | | $51 | |
| | | | | |
| Ratios to average net assets: | | | | | | | | | | | | | | | |
Gross expenses | | 1.06 | %9 | | 1.08 | %9 | | 1.09 | % | | 1.08 | % | | 1.10 | %9 |
Net expenses10,13 | | 1.05 | 9,11,12 | | 1.08 | 9 | | 1.09 | 11 | | 1.08 | | | 1.08 | 9,12 |
Net investment loss | | (0.25) | 9 | | (0.18) | 9 | | (0.26) | | | (0.42) | | | (0.52) | 9 |
| | | | | |
| Portfolio turnover rate | | 0 | % | | 0 | % | | 2 | % | | 2 | % | | 0 | % |
| 1 | Per share amounts have been calculated using the average shares method. |
| 2 | For the six months ended June 30, 2010 (unaudited). |
| 3 | For the period November 1, 2009 through December 31, 2009. |
| 4 | For the year ended October 31. |
| 5 | For the period February 2, 2007 (inception date) to October 31, 2007. |
| 6 | Amount represents less than $0.01 per share. |
| 7 | Performance figures may reflect fee waivers and/or expense reimbursements. In the absence of fee waivers and/or expense reimbursements, the total return would have been lower. Total returns do not reflect expenses associated with the separate accounts such as administrative fees, account charges and surrender charges which, if reflected, would reduce the total return for all periods shown. Past performance is no guarantee of future results. Total returns for periods of less than one year are not annualized. |
| 8 | The total return includes gains from settlement of security litigations. Without these gains, the total return would have been 14.44%. |
| 10 | As a result of an expense limitation agreement, the ratio of expenses, other than interest, brokerage, taxes and extraordinary expenses, to average net assets of Class II shares will not exceed 1.25% until December 31, 2011. |
| 11 | The impact to the expense ratio was less than 0.01% as a result of interest expense. |
| 12 | Reflects fee waivers and reimbursements. |
| 13 | The impact of compensating balance arrangements, if any, was less than 0.01%. |
See Notes to Financial Statements.
| | |
| Legg Mason ClearBridge Variable Aggressive Growth Portfolio 2010 Semi-Annual Report | | 11 |
Notes to financial statements (unaudited)
1. Organization and significant accounting policies
Legg Mason ClearBridge Variable Aggressive Growth Portfolio (the “Portfolio”) is a separate diversified investment series of the Legg Mason Partners Variable Equity Trust (the “Trust”). The Trust, a Maryland statutory trust, is registered under the Investment Company Act of 1940, as amended (the “1940 Act”), as an open-end management investment company.
Shares of the Portfolio may only be purchased or redeemed through variable annuity contracts and variable life insurance policies offered by the separate accounts of participating insurance companies or through eligible pension or other qualified plans.
The following are significant accounting policies consistently followed by the Portfolio and are in conformity with U.S. generally accepted accounting principles (“GAAP”). Estimates and assumptions are required to be made regarding assets, liabilities and changes in net assets resulting from operations when financial statements are prepared. Changes in the economic environment, financial markets and any other parameters used in determining these estimates could cause actual results to differ. Subsequent events have been evaluated through the date the financial statements were issued.
(a) Investment valuation. Equity securities for which market quotations are available are valued at the last reported sales price or official closing price on the primary market or exchange on which they trade. Debt securities are valued at the mean between the last quoted bid and asked prices provided by an independent pricing service, which are based on transactions in debt obligations, quotations from bond dealers, market transactions in comparable securities and various other relationships between securities. When prices are not readily available, or are determined not to reflect fair value, such as when the value of a security has been significantly affected by events after the close of the exchange or market on which the security is principally traded, but before the Portfolio calculates its net asset value, the Portfolio values these securities at fair value as determined in accordance with procedures approved by the Portfolio’s Board of Trustees. Short-term obligations with maturities of 60 days or less are valued at amortized cost, which approximates fair value.
The Portfolio has adopted Financial Accounting Standards Board Codification Topic 820 (“ASC Topic 820”). ASC Topic 820 establishes a single definition of fair value, creates a three-tier hierarchy as a framework for measuring fair value based on inputs used to value the Portfolio’s investments, and requires additional disclosure about fair value. The hierarchy of inputs is summarized below.
| Ÿ | | Level 1—quoted prices in active markets for identical investments |
| Ÿ | | Level 2—other significant observable inputs (including quoted prices for similar investments, interest rates, prepayment speeds, credit risk, etc.) |
| Ÿ | | Level 3—significant unobservable inputs (including the Portfolio’s own assumptions in determining the fair value of investments) |
The inputs or methodology used for valuing securities are not necessarily an indication of the risk associated with investing in those securities.
The Portfolio uses valuation techniques to measure fair value that are consistent with the market approach and/or income approach, depending on the type of the security and the particular circumstance. The market approach uses prices and other relevant information generated by market transactions involving identical or comparable securities. The income approach uses valuation techniques to convert future amounts of cash flow to a single present amount.
The following is a summary of the inputs used in valuing the Portfolio’s assets carried at fair value:
| | | | | | | | | | | |
| Description | | Quoted Prices
(Level 1) | | Other Significant
Observable Inputs
(Level 2) | | Significant
Unobservable
Inputs
(Level 3) | | Total |
| Common stocks | | $ | 625,635,383 | | | — | | — | | $ | 625,635,383 |
| Short-term investment† | | | — | | $ | 388,000 | | — | | | 388,000 |
| Total investments | | $ | 625,635,383 | | $ | 388,000 | | — | | $ | 626,023,383 |
| † | See Schedule of Investments for additional detailed categorizations. |
| | |
| 12 | | Legg Mason ClearBridge Variable Aggressive Growth Portfolio 2010 Semi-Annual Report |
Notes to financial statements (unaudited) (cont’d)
(b) Repurchase agreements. The Portfolio may enter into repurchase agreements with institutions that its investment adviser has determined are creditworthy. Each repurchase agreement is recorded at cost. Under the terms of a typical repurchase agreement, a portfolio takes possession of an underlying debt obligation subject to an obligation of the seller to repurchase, and of the portfolio to resell, the obligation at an agreed-upon price and time, thereby determining the yield during a portfolio’s holding period. When entering into repurchase agreements, it is the Portfolio’s policy that its custodian or a third party custodian, acting on the Portfolio’s behalf, take possession of the underlying collateral securities, the market value of which, at all times, at least equals the principal amount of the repurchase transaction, including accrued interest. To the extent that any repurchase transaction maturity exceeds one business day, the value of the collateral is marked to market and measured against the value of the agreement in an effort to ensure the adequacy of the collateral. If the counterparty defaults, the Portfolio generally has the right to use the collateral to satisfy the terms of the repurchase transaction. However, if the market value of the collateral declines during the period in which the Portfolio seeks to assert its rights or if bankruptcy proceedings are commenced with respect to the seller of the security, realization of the collateral by the Portfolio may be delayed or limited.
(c) Foreign currency translation. Investment securities and other assets and liabilities denominated in foreign currencies are translated into U.S. dollar amounts based upon prevailing exchange rates on the date of valuation. Purchases and sales of investment securities and income and expense items denominated in foreign currencies are translated into U.S. dollar amounts based upon prevailing exchange rates on the respective dates of such transactions.
The Portfolio does not isolate that portion of the results of operations resulting from fluctuations in foreign exchange rates on investments from the fluctuations arising from changes in market prices of securities held. Such fluctuations are included with the net realized and unrealized gain or loss on investments.
Net realized foreign exchange gains or losses arise from sales of foreign currencies, including gains and losses on forward foreign currency contracts, currency gains or losses realized between the trade and settlement dates on securities transactions, and the difference between the amounts of dividends, interest, and foreign withholding taxes recorded on the Portfolio’s books and the U.S. dollar equivalent of the amounts actually received or paid. Net unrealized foreign exchange gains and losses arise from changes in the values of assets and liabilities, other than investments in securities, on the date of valuation, resulting from changes in exchange rates.
Foreign security and currency transactions may involve certain considerations and risks not typically associated with those of U.S. dollar denominated transactions as a result of, among other factors, the possibility of lower levels of governmental supervision and regulation of foreign securities markets and the possibility of political or economic instability.
(d) Security transactions and investment income. Security transactions are accounted for on a trade date basis. Interest income, adjusted for amortization of premium and accretion of discount, is recorded on the accrual basis. Dividend income is recorded on the ex-dividend date. Foreign dividend income is recorded on the ex-dividend date or as soon as practicable after the Portfolio determines the existence of a dividend declaration after exercising reasonable due diligence. The cost of investments sold is determined by use of the specific identification method. To the extent any issuer defaults or a credit event occurs that impacts the issuer, the Portfolio may halt any additional interest income accruals and consider the realizability of interest accrued up to the date of default or credit event.
(e) Distributions to shareholders. Distributions from net investment income and distributions of net realized gains, if any, are declared at least annually. Distributions to shareholders of the Portfolio are recorded on the ex-dividend date and are determined in accordance with income tax regulations, which may differ from GAAP.
(f) Share class accounting. Investment income, common expenses and realized/unrealized gains (losses) on investments are allocated to the various classes of the Portfolio on the basis of daily net assets of each class. Fees relating to a specific class are charged directly to that share class.
(g) Compensating balance arrangements. The Portfolio has an arrangement with its custodian bank whereby a portion of the custodian’s fees is paid indirectly by credits earned on the Portfolio’s cash on deposit with the bank. Interest expense, if any, paid to the custodian related to cash overdrafts is included in interest expense in the Statement of Operations.
| | |
| Legg Mason ClearBridge Variable Aggressive Growth Portfolio 2010 Semi-Annual Report | | 13 |
(h) Federal and other taxes. It is the Portfolio’s policy to comply with the federal income and excise tax requirements of the Internal Revenue Code of 1986 (the “Code”), as amended, applicable to regulated investment companies. Accordingly, the Portfolio intends to distribute its taxable income and net realized gains, if any, to shareholders in accordance with timing requirements imposed by the Code. Therefore, no federal income tax provision is required in the Portfolio’s financial statements.
Management has analyzed the Portfolio’s tax positions taken on federal income tax returns for all open tax years and has concluded that as of June 30, 2010, no provision for income tax is required in the Portfolio’s financial statements. The Portfolio’s federal and state income and federal excise tax returns for tax years for which the applicable statutes of limitations have not expired are subject to examination by Internal Revenue Service and state departments of revenue.
Under the applicable foreign tax laws, a withholding tax may be imposed on interest, dividends and capital gains at various rates.
(i) Reclassification. GAAP requires that certain components of net assets be reclassified to reflect permanent differences between financial and tax reporting. These reclassifications have no effect on net assets or net asset value per share.
2. Investment management agreement and other transactions with affiliates
Legg Mason Partners Fund Advisor, LLC (“LMPFA”) is the Portfolio’s investment manager and ClearBridge Advisors, LLC (“ClearBridge”) is the Portfolio’s subadviser. LMPFA and ClearBridge are wholly-owned subsidiaries of Legg Mason, Inc. (“Legg Mason”).
Under the investment management agreement, the Portfolio pays an investment management fee, calculated daily and paid monthly, in accordance with the following breakpoint schedule:
| | | |
| Average Daily Net Assets | | Annual Rate | |
| First $1 billion | | 0.750 | % |
| Next $1 billion | | 0.725 | |
| Next $3 billion | | 0.700 | |
| Next $5 billion | | 0.675 | |
| Over $10 billion | | 0.650 | |
LMPFA provides administrative and certain oversight services to the Portfolio. LMPFA delegates to the subadviser the day-to-day portfolio management of the Portfolio, except for the management of cash and short-term instruments. For its services, LMPFA pays ClearBridge 70% of the net management fee it receives from the Portfolio.
As a result of expense limitation agreements between the Portfolio and LMPFA, the ratio of expenses, other than interest, brokerage, taxes and extraordinary expenses, to the average net assets of Class I and II shares will not exceed 1.00% and 1.25%, respectively. These expense limitations cannot be terminated prior to December 31, 2011 without the Board of Trustees’ consent.
During the six months ended June 30, 2010, fees waived and/or expenses reimbursed amounted to $26,185.
The manager is permitted to recapture amounts previously forgone or reimbursed to the Portfolio during the same fiscal year if the Portfolio’s total annual operating expenses have fallen to a level below the expense limitation (“expense cap”) in effect at the time the fees were earned or the expense incurred. In no case will the manager recapture any amount that would result, on any particular business day of the Portfolio, in the Portfolio’s total annual operating expenses exceeding the expense cap or any other lower limit then in effect.
Legg Mason Investor Services, LLC, a wholly-owned broker-dealer subsidiary of Legg Mason, serves as the Portfolio’s sole and exclusive distributor.
The Portfolio had adopted an unfunded, non-qualified deferred compensation plan (the “Plan”) which allowed non-interested trustees (“Independent Trustees”) to defer the receipt of all or a portion of their fees earned until a later date specified by the Independent Trustees. The deferred balances are reported in the
| | |
| 14 | | Legg Mason ClearBridge Variable Aggressive Growth Portfolio 2010 Semi-Annual Report |
Notes to financial statements (unaudited) (cont’d)
Statement of Assets and Liabilities under Trustees’ fees payable and are considered a general obligation of the Portfolio and any payments made pursuant to the Plan will be made from the Portfolio’s general assets. The Plan was terminated effective January 1, 2007. This change had no effect on fees previously deferred. As of June 30, 2010, the Portfolio had accrued $755 as deferred compensation payable.
All officers and one Trustee of the Trust are employees of Legg Mason or its affiliates and do not receive compensation from the Trust.
3. Investments
During the six months ended June 30, 2010, the aggregate cost of purchases and proceeds from sales of investments (excluding short-term investments) were as follows:
| | | |
| Purchases | | | — |
| Sales | | $ | 51,936,742 |
At June 30, 2010, the aggregate gross unrealized appreciation and depreciation of investments for federal income tax purposes were substantially as follows:
| | | |
| Gross unrealized appreciation | | $ | 162,784,903 |
| Gross unrealized depreciation | | | (80,323,711) |
| Net unrealized appreciation | | $ | 82,461,192 |
4. Derivative instruments and hedging activities
Financial Accounting Standards Board Codification Topic 815 requires enhanced disclosure about an entity’s derivative and hedging activities.
During the six months ended June 30, 2010, the Portfolio did not invest in any derivative instruments.
5. Class specific expenses, waivers and/or reimbursements
The Portfolio has adopted a Rule 12b-1 distribution plan and under that plan the Portfolio pays a distribution fee with respect to its Class II shares calculated at the annual rate of 0.25% of the average daily net assets of Class II shares. Distribution fees are accrued daily and paid monthly.
For the six months ended June 30, 2010, class specific expenses were as follows:
| | | | | | |
| | | Distribution
Fees | | Transfer Agent
Fees |
| Class I | | | — | | $ | 5,832 |
| Class II | | $ | 53,201 | | | 3,787 |
| Total | | $ | 53,201 | | $ | 9,619 |
For the six months ended June 30, 2010, waivers and/or reimbursements by class were as follows:
| | | |
| | | Waivers/
Reimbursements |
| Class I | | $ | 24,592 |
| Class II | | | 1,593 |
| Total | | $ | 26,185 |
6. Distributions to shareholders by class
| | | | | | | |
| | | Six Months Ended
June 30, 2010 | | Period Ended
December 31, 2009† | | Year Ended
October 31, 2009 |
| Net Investment Income: | | | | | | | |
| Class I | | $ | 125,030 | | — | | — |
| Class II | | | — | | — | | — |
| Total | | $ | 125,030 | | — | | — |
| † | For the period November 1, 2009 through December 31, 2009. |
| | |
| Legg Mason ClearBridge Variable Aggressive Growth Portfolio 2010 Semi-Annual Report | | 15 |
7. Shares of beneficial interest
At June 30, 2010, the Trust had an unlimited number of shares of beneficial interest authorized with a par value of $0.00001 per share. The Portfolio has the ability to issue multiple classes of shares. Each class of shares represents an identical interest and has the same rights except that each class bears certain direct expenses, including those specifically related to the distribution of its shares.
Transactions in shares of each class were as follows:
| | | | | | | | | | | | | | | |
| | | Six Months Ended
June 30, 2010 | | Period Ended
December 31, 2009† | | Year Ended
October 31, 2009 |
| | | Shares | | Amount | | Shares | | Amount | | Shares | | Amount |
| | | | | | |
| Class I | | | | | | | | | | | | | | | |
| Shares sold | | 630,651 | | $ | 8,653,181 | | 158,643 | | $ | 1,988,926 | | 1,515,361 | | $ | 15,542,139 |
| Shares issued on reinvestment | | 9,486 | | | 125,030 | | — | | | — | | — | | | — |
| Shares repurchased | | (4,417,080) | | | (59,895,632) | | (1,141,525) | | | (14,355,644) | | (9,012,004) | | | (91,442,483) |
| Net decrease | | (3,776,943) | | $ | (51,117,421) | | (982,882) | | $ | (12,366,718) | | (7,496,643) | | $ | (75,900,344) |
| | | | | | |
| Class II | | | | | | | | | | | | | | | |
| Shares sold | | 436,090 | | $ | 6,043,836 | | 143,706 | | $ | 1,778,275 | | 669,628 | | $ | 6,709,830 |
| Shares issued on reinvestment | | — | | | — | | — | | | — | | — | | | — |
| Shares repurchased | | (552,464) | | | (7,401,668) | | (226,090) | | | (2,828,726) | | (1,335,420) | | | (13,732,175) |
| Net decrease | | (116,374) | | $ | (1,357,832) | | (82,384) | | $ | (1,050,451) | | (665,792) | | $ | (7,022,345) |
| † | For the period November 1, 2009 through December 31, 2009. |
8. Capital loss carryforward
As of December 31, 2009, the Portfolio had a net capital loss carryforward of approximately $71,494,363, of which $54,313,848 expires in 2015 and $17,180,515 expires in 2016. These amounts will be available to offset any future taxable capital gains.
9. Regulatory matters
On May 31, 2005, the U.S. Securities and Exchange Commission (“SEC”) issued an order in connection with the settlement of an administrative proceeding against Smith Barney Fund Management LLC (“SBFM”), a wholly-owned subsidiary of Legg Mason and the then investment adviser or manager to the Portfolio, and Citigroup Global Markets Inc. (“CGM”), a former distributor of the Portfolio, relating to the appointment of an affiliated transfer agent for the Smith Barney family of mutual funds, including the Portfolio (the “Affected Funds”).
The SEC order found that SBFM and CGM willfully violated Section 206(1) of the Investment Advisers Act of 1940, as amended, and the rules promulgated there under (the “Advisers Act”). Specifically, the order found that SBFM and CGM knowingly or recklessly failed to disclose to the boards of the Affected Funds in 1999 when proposing a new transfer agent arrangement with an affiliated transfer agent that: First Data Investors Services Group (“First Data”), the Affected Funds’ then-existing transfer agent, had offered to continue as transfer agent and do the same work for substantially less money than before; and that Citigroup Asset Management (“CAM”), the Citigroup business unit that, at the time, included the Affected Funds’ investment manager and other investment advisory companies, had entered into a side letter with First Data under which CAM agreed to recommend the appointment of First Data as sub-transfer agent to the affiliated transfer agent in exchange for, among other things, a guarantee by First Data of specified amounts of asset management and investment banking fees to CAM and CGM. The order also found that SBFM and CGM willfully violated Section 206(2) of the Advisers Act by virtue of the omissions discussed above and other misrepresentations and omissions in the materials provided to the Affected Funds’ boards, including the failure to make clear that the affiliated transfer agent would earn a high profit for performing limited functions while First Data continued to perform almost all of the transfer agent functions, and the suggestion that the proposed arrangement was in the Affected Funds’ best interests and that no viable alternatives existed.
| | |
| 16 | | Legg Mason ClearBridge Variable Aggressive Growth Portfolio 2010 Semi-Annual Report |
Notes to financial statements (unaudited) (cont’d)
SBFM and CGM do not admit or deny any wrongdoing or liability. The settlement does not establish wrongdoing or liability for purposes of any other proceeding. The SEC censured SBFM and CGM and ordered them to cease and desist from violations of Sections 206(1) and 206(2) of the Advisers Act. The order required Citigroup to pay $208.1 million, including $109 million in disgorgement of profits, $19.1 million in interest, and a civil money penalty of $80 million. Approximately $24.4 million has already been paid to the Affected Funds, primarily through fee waivers. The remaining $183.7 million, including the penalty, has been paid to the U.S. Treasury and will be distributed pursuant to a plan submitted for the approval of the SEC. The order also required that transfer agency fees received from the Affected Funds since December 1, 2004, less certain expenses, be placed in escrow and provided that a portion of such fees might be subsequently distributed in accordance with the terms of the order. On April 3, 2006, an aggregate amount of approximately $9 million held in escrow was distributed to the Affected Funds.
The order required SBFM to recommend a new transfer agent contract to the Affected Funds’ Boards within 180 days of the entry of the order; if a Citigroup affiliate submitted a proposal to serve as transfer agent or sub-transfer agent, SBFM and CGM would have been required, at their expense, to engage an independent monitor to oversee a competitive bidding process. On November 21, 2005, and within the specified timeframe, the Affected Funds’ boards selected a new transfer agent for the Affected Funds. No Citigroup affiliate submitted a proposal to serve as transfer agent. Under the order, SBFM also must comply with an amended version of a vendor policy that Citigroup instituted in August 2004.
Although there can be no assurance, LMPFA does not believe that this matter will have a material adverse effect on the Affected Funds.
On December 1, 2005, Citigroup completed the sale of substantially all of its global asset management business, including SBFM, to Legg Mason.
On May 12, 2010, the SEC approved the disbursement of approximately $108.6 million previously paid to the U.S. Treasury, reflecting the disgorgement of Citigroup’s profits, plus interest. On May 26, 2010, these amounts were disbursed to the Affected Funds pursuant to a Plan of Distribution approved by the SEC. The Portfolio has received $20,706 for Class I, related to this distribution. All other amounts not previously distributed were retained by the U.S. Treasury.
10. Legal matters
Beginning in May 2004, class action lawsuits alleging violations of the federal securities laws were filed against CGM, a former distributor of the Portfolio, and other affiliated funds (collectively, the “Funds”) and a number of its then affiliates, including SBFM and Salomon Brothers Asset Management Inc. (“SBAM”), which were then investment adviser or manager to certain of the Funds (the “Managers”), substantially all of the mutual funds then managed by the Managers (the “Defendant Funds”), and Board members of the Defendant Funds (collectively, the “Defendants”). The complaints alleged, among other things, that CGM created various undisclosed incentives for its brokers to sell Smith Barney and Salomon Brothers funds. In addition, according to the complaints, the Managers caused the Defendant Funds to pay excessive brokerage commissions to CGM for steering clients towards proprietary funds. The complaints also alleged that the Defendants breached their fiduciary duty to the Defendant Funds by improperly charging Rule 12b-1 fees and by drawing on fund assets to make undisclosed payments of soft dollars and excessive brokerage commissions. The complaints also alleged that the Defendant Funds failed to adequately disclose certain of the allegedly wrongful conduct. The complaints sought injunctive relief and compensatory and punitive damages, rescission of the Defendant Funds’ contracts with the Managers, recovery of all fees paid to the Managers pursuant to such contracts and an award of attorneys’ fees and litigation expenses.
On December 15, 2004, a consolidated amended complaint (the “Complaint”) was filed alleging substantially similar causes of action. On May 27, 2005, all of the Defendants filed motions to dismiss the Complaint. On July 26, 2006, the court issued a decision and order (1) finding that plaintiffs lacked standing to sue on behalf of the shareholders of the Funds in which none of the plaintiffs had invested and dismissing those Funds from the case (although stating that they could be brought back into the case if standing as to them could be established), and (2) other than one stayed claim, dismissing all of the causes of action against the remaining Defendants, with prejudice, except for the cause of action under Section 36(b) of the 1940 Act, which the court granted plaintiffs leave to replead as a derivative claim.
| | |
| Legg Mason ClearBridge Variable Aggressive Growth Portfolio 2010 Semi-Annual Report | | 17 |
On October 16, 2006, plaintiffs filed their Second Consolidated Amended Complaint (“Second Amended Complaint”) which alleges derivative claims on behalf of nine funds identified in the Second Amended Complaint, under Section 36(b) of the 1940 Act, against CAM, SBAM and SBFM as investment advisers to the identified funds, as well as CGM as a distributor for the identified funds (collectively, the “Second Amended Complaint Defendants”). The Portfolio was not identified in the Second Amended Complaint. The Second Amended Complaint alleges no claims against any of the funds or any of their Board Members. Under Section 36(b), the Second Amended Complaint alleges similar facts and seeks similar relief against the Second Amended Complaint Defendants as the Complaint.
On December 3, 2007, the court granted the Defendants’ motion to dismiss, with prejudice. On January 2, 2008, the plaintiffs filed a notice of appeal to the Second Circuit Court of Appeals. The appeal was fully briefed and oral argument before the U.S. Court of Appeals for the Second Circuit took place on March 5, 2009. The parties currently are awaiting a decision from the U.S. Court of Appeals for the Second Circuit.
Additional lawsuits arising out of these circumstances and presenting similar allegations and requests for relief may be filed in the future.
Legg Mason ClearBridge
Variable Aggressive Growth Portfolio
Trustees
Paul R. Ades
Andrew L. Breech
Dwight B. Crane
R. Jay Gerken, CFA
Chairman
Frank G. Hubbard
Howard J. Johnson
David E. Maryatt
Jerome H. Miller
Ken Miller
John J. Murphy
Thomas F. Schlafly
Jerry A. Viscione
Investment manager
Legg Mason Partners Fund Advisor, LLC
Subadviser
ClearBridge Advisors, LLC
Distributor
Legg Mason Investor Services, LLC
Custodian
State Street Bank and Trust Company
Transfer agent
Boston Financial Data Services, Inc.
2000 Crown Colony Drive
Quincy, MA 02169
Independent registered public accounting firm
KPMG LLP
345 Park Avenue
New York, NY 10154
Legg Mason ClearBridge Variable Aggressive Growth Portfolio
The Portfolio is a separate investment series of Legg Mason Partners Variable Equity Trust, a Maryland statutory trust.
Legg Mason Clearbridge Variable Aggressive Growth Portfolio
Legg Mason Funds
55 Water Street
New York, NY 10041
The Portfolio files its complete schedule of portfolio holdings with the Securities and Exchange Commission (“SEC”) for the first and third quarters of each fiscal year on Form N-Q. The Portfolio’s Forms N-Q are available on the SEC’s website at www.sec.gov. The Portfolio’s Forms N-Q may be reviewed and copied at the SEC’s Public Reference Room in Washington, D.C., and information on the operation of the Public Reference Room may be obtained by calling 1-800-SEC-0330. To obtain information on Form N-Q from the Portfolio, shareholders can call Funds Investor Services at 1-800-822-5544 or Institutional Shareholder Services at 1-888-425-6432.
Information on how the Portfolio voted proxies relating to portfolio securities during the prior 12-month period ended June 30th of each year and a description of the policies and procedures that the Portfolio uses to determine how to vote proxies related to portfolio transactions are available (1) without charge, upon request, by calling Funds Investor Services at 1-800-822-5544 or Institutional Shareholder Services at 1-888-425-6432, (2) on the Portfolio’s website at www.leggmason.com/individualinvestors and (3) on the SEC’s website at www.sec.gov.
This report is submitted for the general information of the shareholders of Legg Mason ClearBridge Variable Aggressive Growth Portfolio. This report is not authorized for distribution to prospective investors in the Portfolio unless preceded or accompanied by a current prospectus.
Investors should consider the Portfolio’s investment objectives, risks, charges and expenses carefully before investing. The prospectus contains this and other important information about the Portfolio. Please read the prospectus carefully before investing.
www.leggmason.com/individualinvestors
© 2010 Legg Mason Investor Services, LLC
Member FINRA, SIPC
Privacy policy
We are committed to keeping nonpublic personal information about you secure and confidential. This notice is intended to help you understand how we fulfill this commitment. From time to time, we may collect a variety of personal information about you, including:
| Ÿ | | Information we receive from you on applications and forms, via the telephone, and through our websites; |
| Ÿ | | Information about your transactions with us, our affiliates, or others (such as your purchases, sales, or account balances); and |
| Ÿ | | Information we receive from consumer reporting agencies. |
We do not disclose nonpublic personal information about our customers or former customers, except to our affiliates (such as broker-dealers or investment advisers within the Legg Mason family of companies) or as is otherwise permitted by applicable law or regulation. For example, we may share this information with others in order to process your transactions or service an account. We may also provide this information to companies that perform marketing services on our behalf, such as printing and mailing, or to other financial institutions with whom we have joint marketing agreements. When we enter into such agreements, we will require these companies to protect the confidentiality of this information and to use it only to perform the services for which we hired them.
With respect to our internal security procedures, we maintain physical, electronic, and procedural safeguards to protect your nonpublic personal information, and we restrict access to this information.
If you decide at some point either to close your account(s) or become an inactive customer, we will continue to adhere to our privacy policies and practices with respect to your nonpublic personal information.
NOT PART OF THE SEMI-ANNUAL REPORT
At Legg Mason, we’ve assembled a collection of experienced investment management firms and empowered each of them with the tools, the resources and, most importantly, the independence to pursue the strategies they know best.
| Ÿ | | Each was purposefully chosen for their commitment to investment excellence. |
| Ÿ | | Each is focused on specific investment styles and asset classes. |
| Ÿ | | Each exhibits thought leadership in their chosen area of focus. |
Together, we’ve built a powerful portfolio of solutions for financial advisors and their clients. And it has made us a world leader in money management.*
| * | Ranked eighth-largest money manager in the world, according to Pensions & Investments, May 18, 2010, based on 12/31/09 worldwide institutional assets under management. |
www.leggmason.com/individualinvestors
©2010 Legg Mason Investor Services, LLC Member FINRA, SIPC
FD04228 8/10 SR10-1141
|
| NOT PART OF THE SEMI-ANNUAL REPORT |
Not applicable.
| ITEM 3. | AUDIT COMMITTEE FINANCIAL EXPERT. |
Not applicable.
| ITEM 4. | PRINCIPAL ACCOUNTANT FEES AND SERVICES. |
Not applicable.
| ITEM 5. | AUDIT COMMITTEE OF LISTED REGISTRANTS. |
Not applicable.
| ITEM 6. | SCHEDULE OF INVESTMENTS. |
Included herein under Item 1.
| ITEM 7. | DISCLOSURE OF PROXY VOTING POLICIES AND PROCEDURES FOR CLOSED-END MANAGEMENT INVESTMENT COMPANIES. |
Not applicable.
| ITEM 8. | PORTFOLIO MANAGERS OF CLOSED-END MANAGEMENT INVESTMENT COMPANIES. |
Not applicable.
| ITEM 9. | PURCHASES OF EQUITY SECURITIES BY CLOSED-END MANAGEMENT INVESTMENT COMPANY AND AFFILIATED PURCHASERS. |
Not applicable.
| ITEM 10. | SUBMISSION OF MATTERS TO A VOTE OF SECURITY HOLDERS. |
Not applicable.
| ITEM 11. | CONTROLS AND PROCEDURES. |
| | (a) | The registrant’s principal executive officer and principal financial officer have concluded that the registrant’s disclosure controls and procedures (as defined in Rule 30a- 3(c) under the Investment Company Act of 1940, as amended (the “1940 Act”)) are effective as of a date within 90 days of the filing date of this report that includes the disclosure required by this paragraph, based on their evaluation of the disclosure controls and procedures required by Rule 30a-3(b) under the 1940 Act and 15d-15(b) under the Securities Exchange Act of 1934. |
| | (b) | There were no changes in the registrant’s internal control over financial reporting (as defined in Rule 30a-3(d) under the 1940 Act) that occurred during the registrant’s last fiscal half-year (the registrant’s second fiscal half-year in the case of an annual report) that have materially affected, or are likely to materially affect the registrant’s internal control over financial reporting. |
(a) (1) Not applicable.
Exhibit 99.CODE ETH
(a) (2) Certifications pursuant to section 302 of the Sarbanes-Oxley Act of 2002 attached hereto.
Exhibit 99.CERT
(b) Certifications pursuant to Section 906 of the Sarbanes-Oxley Act of 2002 attached hereto.
Exhibit 99.906CERT
SIGNATURES
Pursuant to the requirements of the Securities Exchange Act of 1934 and the Investment Company Act of 1940, the registrant has duly caused this Report to be signed on its behalf by the undersigned, there unto duly authorized.
| | |
| Legg Mason Partners Variable Equity Trust |
| |
| By: | | /S/ R. JAY GERKEN |
| | (R. Jay Gerken) |
| | Chief Executive Officer of |
| | Legg Mason Partners Variable Equity Trust |
| |
| Date: | | August 26, 2010 |
Pursuant to the requirements of the Securities Exchange Act of 1934 and the Investment Company Act of 1940, this report has been signed below by the following persons on behalf of the registrant and in the capacities and on the dates indicated.
| | |
| By: | | /S/ R. JAY GERKEN |
| | (R. Jay Gerken) |
| | Chief Executive Officer of |
| | Legg Mason Partners Variable Equity Trust |
| |
| Date: | | August 26, 2010 |
| |
| By: | | /S/ KAPREL OZSOLAK |
| | (Kaprel Ozsolak) |
| | Chief Financial Officer of |
| | Legg Mason Partners Variable Equity Trust |
| |
| Date: | | August 26, 2010 |