UNITED STATES
SECURITIES AND EXCHANGE COMMISSION
Washington, D.C. 20549
FORM N-CSR
CERTIFIED SHAREHOLDER REPORT OF REGISTERED
MANAGEMENT INVESTMENT COMPANIES
Investment Company Act file number 811-21128
Legg Mason Partners Variable Equity Trust
(Exact name of registrant as specified in charter)
55 Water Street,
New York, NY 10041
(Address of principal executive offices) (Zip code)
Robert I. Frenkel, Esq.
Legg Mason & Co., LLC
100 First Stamford Place
Stamford, CT 06902
(Name and address of agent for service)
Registrant’s telephone number, including area code: 1-877-721-1926
Date of fiscal year end: December 31
Date of reporting period: June 30, 2011
| ITEM 1. | REPORT TO STOCKHOLDERS. |
The Semi-Annual Report to Stockholders is filed herewith.
June 30, 2011

Semi-Annual
Repor t
Legg Mason
Variable Lifestyle Series
Legg Mason Variable Lifestyle Allocation 85%
Legg Mason Variable Lifestyle Allocation 70%
Legg Mason Variable Lifestyle Allocation 50%
INVESTMENT PRODUCTS: NOT FDIC INSURED • NO BANK GUARANTEE • MAY LOSE VALUE
| | |
| II | | Legg Mason Variable Lifestyle Series |
Legg Mason Variable Lifestyle Series
Legg Mason Variable Lifestyle Series (“Variable Lifestyle Series”) consists of separate investment Portfolios, each with its own investment objective and policies. Each Portfolio offers different levels of potential return and involves different levels of risk.
The Portfolios are separate investment series of the Legg Mason Partners Variable Equity Trust, a Maryland statutory trust.
| | | | |
| Letter from the chairman | | |  | |
Dear Shareholder,
We are pleased to provide the semi-annual report of Legg Mason Variable Lifestyle Series for the six-month reporting period ended June 30, 2011. Please read on for performance information for each Portfolio and a detailed look at prevailing economic and market conditions during the Portfolios’ reporting period.
As always, we remain committed to providing you with excellent service and a full spectrum of investment choices. We also remain committed to supplementing the support you receive from your financial advisor. One way we accomplish this is through our website, www.leggmason.com/individualinvestors. Here you can gain immediate access to market and investment information, including:
| Ÿ | | Market insights and commentaries from our portfolio managers and |
| Ÿ | | A host of educational resources. |
We look forward to helping you meet your financial goals.
Sincerely,

R. Jay Gerken, CFA
Chairman, President and Chief Executive Officer
July 29, 2011
| | | | |
| Legg Mason Variable Lifestyle Series | | | III | |
Investment commentary
Economic review
Although the U.S. economy continued to grow over the six months ended June 30, 2011, the pace of the expansion was disappointing, which resulted in a significant shift in investor sentiment. During the first half of the period, there were expectations of a strengthening economy and generally robust investor risk appetite. However, as the reporting period progressed, weakening economic data triggered a flight to quality as investor risk aversion increased. Despite giving back a portion of their previous gains in late May and June, investors who took on additional risk in their portfolios during the reporting period were generally rewarded.
U.S. gross domestic product (“GDP”)i growth, as reported by the U.S. Department of Commerce, has been less robust than previously realized during most other periods exiting a severe recession. Revised GDP growth was 2.3% during the fourth quarter of 2010 and 3.0% for calendar 2010 as a whole. The Commerce Department then reported that first and second quarter 2011 GDP growth were 0.4% and 1.3%, respectively. This moderation in growth during the first half of the year was due to a variety of factors, including less robust export activity, a decline in government spending and a deceleration in consumer spending given higher oil and food prices.
Turning to the job market, while there was some improvement in the first half of the reporting period, unemployment again moved higher from April through June. After being 9.0% or higher since April 2009, the unemployment rate fell to 8.9% in February and 8.8% in March 2011. The job market then weakened, as unemployment rose to 9.0% in April, 9.1% in May and 9.2% in June. As of the end of the reporting period, approximately 14.1 million Americans looking for work had yet to find a job, and roughly 44% of these individuals have been out of work for more than six months. In June 2011, the Federal Reserve Board (“Fed”)ii projected that unemployment would moderate, but that it would remain elevated and between 7.8% and 8.2% at the end of 2012.
The long-ailing housing market continued to show signs of strain during the reporting period. Looking back, sales increased in the spring of 2010 largely due to the government’s $8,000 tax credit for first-time home buyers. This proved to be only a temporary boost, as sales subsequently weakened after the tax credit expired at the end of April. Existing-home sales did rebound somewhat toward the end of 2010 and in January 2011, as mortgage rates remained relatively low. However, according to the National
Association of Realtors (“NAR”), existing-home sales then declined a sharp 8.9% in February. After a 3.5% increase in March, existing-home sales fell 1.8%, 4.0% and 0.8% in April, May and June, respectively. At the end of June, the inventory of unsold homes was a 9.5 month supply at the current sales level, versus a 9.1 month supply in May. Existing-home prices were relatively stagnant versus a year ago, with the NAR reporting that the median existing-home price for all housing types was $184,300 in June 2011, up 0.8% from June 2010.
Even the manufacturing sector, one of the stalwarts of the economy in recent years, softened toward the end of the reporting period. Based on the Institute for Supply Management’s PMIiii, the manufacturing sector grew twenty-three consecutive months since it began expanding in August 2009 (a reading below 50 indicates a contraction, whereas a reading above 50 indicates an expansion). In January 2011, the manufacturing sector expanded at its fastest pace since May 2004, with a reading of 60.8 versus 58.5 for the previous month. Manufacturing activity remained strong during the next three months and was 60.4 in April. However, it then declined to 53.5 in May, the lowest reading in the past twelve months. This was attributed, in part, to supply disruptions triggered by the March earthquake and tsunami in Japan. Manufacturing activity then moved modestly higher in June to 55.3, although only twelve of the eighteen industries tracked by the Institute for Supply Management expanded during the month.
Outside of the U.S., economic news was largely dominated by the sovereign debt crisis in Europe, geopolitical events in the Middle East and Northern Africa (“MENA”), and the natural disasters in Japan. Political turmoil in the MENA region caused oil prices to rise above $100 a barrel in February 2011, the first such occurrence in roughly two years. This led to concerns that higher oil prices could temper economic growth in both developed and emerging market countries. The tragedy in Japan also impacted the global economy. The World Bank has projected damage in northeast Japan could reach $235 billion. Japan’s economy fell back into recession in the first quarter of 2011, with GDP contracting 0.9%. However, the World Bank stated, “As a result of the earthquake and tsunami, Japan’s real GDP growth will slow, but the slowdown will likely be temporary. Growth should start picking up after mid-2011 as reconstruction efforts get underway.” Elsewhere, Eurozone GDP growth was 0.8% during the first quarter, compared to a 0.3% expansion in the fourth quarter of 2010. Among the largest emerging market countries, GDP growth was 9.7% in
| | |
| IV | | Legg Mason Variable Lifestyle Series |
Investment commentary (cont’d)
China and 7.8% in India during the first quarter of 2011.
Financial market overview
While stocks and lower-quality bonds generated solid results during the reporting period, there were several periods of heightened volatility and periodic sell-offs. These were triggered by a variety of factors, including concerns regarding the global economy, geopolitical unrest, the natural disasters in Japan and the ongoing European sovereign debt crisis. During those periods, investors tended to favor the relative safety of U.S. Treasury securities. However, these setbacks proved to be only temporary and risk aversion was generally replaced with solid demand for riskier assets.
The Fed took a number of actions as it sought to meet its dual mandate of fostering maximum employment and price stability. In November 2010, prior to the beginning of the reporting period, the Fed announced a second round of quantitative easing (often referred to as “QE2”) to help stimulate the economy, entailing the purchase of $600 billion of long-term U.S. Treasury securities by the end of the second quarter of 2011. Also, as has been the case since December 2008, the Fed kept the federal funds rateiv at a historically low range between 0 and 1/4 percent.
Despite these efforts, at its meeting in June 2011, the Fed said, “Information received since the Federal Open Market Committee met in April indicates that the economic recovery is continuing at a moderate pace, though somewhat more slowly than the Committee had expected. . . . To promote the ongoing economic recovery and to help ensure that inflation, over time, is at levels consistent with its mandate, the Committee decided today to keep the target range for the federal funds rate at 0 to 1/4 percent. The Committee continues to anticipate that economic conditions — including low rates of resource utilization and a subdued outlook for inflation over the medium run — are likely to warrant exceptionally low levels for the federal funds rate for an extended period.”
In June, the Fed also announced that it would complete QE2 on schedule at the end of June. However, given ongoing strains in the economy, it made no overtures toward reversing any of its accommodative policies and the Fed said it would “maintain its existing policy of reinvesting principal payments from its securities holdings” rather than seeking to reduce the size of its balance sheet.
Given the economic challenges in the Eurozone, the European Central Bank (“ECB”) had not raised interest rates since July 2008. However, in early April 2011, the ECB raised interest rates from 1.00% to 1.25% and then to 1.50% in July (after the reporting period ended). In other developed countries, the Bank of England kept rates on hold at 0.50% during the reporting period, as did Japan at a range of zero to 0.10%, the lowest level since 2006. Elsewhere, a number of emerging market countries, including China, India and Brazil, raised interest rates during the reporting period in an effort to ward off inflation.
Equity market review
U.S. stock prices, as measured by the S&P 500 Indexv (the “Index”), moved higher during the reporting period. The market got off to a strong start in January and February 2011, as the Index returned 2.37% and 3.43%, respectively. Fueling the market’s ascent was optimism for the global economy and corporate profits that generally exceeded expectations. Despite geopolitical unrest in the Middle East, and the devastation in Japan, the market demonstrated resiliency in March and April, with the Index gaining 0.04% and 2.96%, respectively. The market took a step backward in May as the Index fell 1.13% amid concerns for the economy and future corporate profits. Stock prices then declined 1.67% in June due to weaker-than-expected economic data and a further escalation of the European sovereign debt crisis. All told, the Index returned 6.02% over the reporting period.
The international developed equity market, as measured by the MSCI EAFE Indexvi, also posted a positive return but lagged its U.S. counterpart, returning 4.98% during the six months ended June 30, 2011. This relative underperformance was the result of a number of factors, including concerns regarding the European sovereign debt crisis. Elsewhere, emerging market equities generated only a modest gain during the reporting period. Despite continued strong economic growth in many developing countries and higher oil prices, emerging market equities were dragged down at times given signs of decelerating growth in developed countries and concerns whether China could tame its rising inflation without adversely impacting its economic expansion. During the six months ended June 30, 2011, the MSCI Emerging Markets Indexvii returned 0.88%.
Fixed income market review
While volatility was elevated at times, the U.S. spread sectors (non-Treasuries) produced positive results during the reporting period. As was the case for much of 2010, the spread sectors generally out-
| | | | |
| Legg Mason Variable Lifestyle Series | | | V | |
performed equal-durationviii Treasuries during the first four months of the reporting period. A combination of positive economic growth, benign core inflation, rising corporate profits and overall robust investor demand supported the spread sectors from January through April 2011. Investor sentiment then began to shift in May, as optimism about the economic expansion waned and investor risk appetite started to be replaced with increased risk aversion. While the U.S. spread sectors generally posted positive results in May, they underperformed equal-duration Treasuries. Risk aversion then increased in June given a host of disappointing economic data and a further escalation of the European sovereign debt crisis. Against this backdrop, the spread sectors generated relatively poor results during most of June as investors fled the spread sectors in favor of Treasury securities.
Both short- and long-term Treasury yields fluctuated during the six months ended June 30, 2011. When the period began, two- and ten-year Treasury yields were 0.61% and 3.30%, respectively. Yields initially moved higher given expectations for stronger growth in 2011 and the potential for rising inflation. On February 14, 2011, two-year Treasury yields peaked at 0.87%, while ten-year Treasuries peaked at 3.75% on February 8, 2011. Treasury yields then declined as investor risk aversion increased given the uprising in Libya and, later, due to the tragic events in Japan. Yields briefly moved higher toward the end of March, but then generally declined from April through June given weakening economic data
and periodic flights to quality. In late June, two- and ten-year Treasury yields bottomed at 0.35% and 2.88%, respectively, and ended the period at 0.45% and 3.18%, respectively. For the six months ended June 30, 2011, the Barclays Capital U.S. Aggregate Indexix returned 2.72%. In comparison, the Barclays Capital Global Aggregate Index (Hedged)x returned 1.48% over the same time frame.
The U.S. high-yield bond market produced strong results during the first five months of the reporting period. High-yield prices moved higher against a backdrop of generally better-than-expected corporate profits and overall strong investor demand. However, the asset class gave back a portion of its gains in June during the flight to quality, with the high-yield market posting its first monthly loss since November 2010. All told, the Barclays Capital U.S. High Yield — 2% Issuer Cap Indexxi returned 4.98% for the six months ended June 30, 2011.
Despite periods of volatility, the emerging market debt asset class generated a solid return for the six-month reporting period. Investor concerns regarding interest rate hikes in China and unrest in the MENA region dragged the asset class down from November 2010 (prior to the beginning of the reporting period) through January 2011. Emerging market debt prices then largely stabilized in February and rallied from March through June. Overall, the JPMorgan Emerging Markets Bond Index Global (“EMBI Global”)xii returned 5.09% over the six months ended June 30, 2011.
| | |
| VI | | Legg Mason Variable Lifestyle Series |
Investment commentary (cont’d)
Legg Mason Variable Lifestyle Allocation 85%
Target Asset Allocation1
| | |
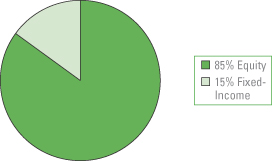 | | Legg Mason Variable Lifestyle Allocation 85% seeks capital appreciation by investing 85% of its assets in underlying funds that invest principally in equity securities and 15% in underlying funds that invest principally in fixed-income securities. |
Performance review
For the six months ended June 30, 2011, Legg Mason Variable Lifestyle Allocation 85%2 returned 5.64%. The Portfolio’s unmanaged benchmarks, the Barclays Capital U.S. Aggregate Index, the Russell 3000 Indexxiii and the Lifestyle Allocation 85% Composite Benchmarkxiv, returned 2.72%, 6.35% and 5.67%, respectively, over the same time frame. The Lipper Variable Mixed-Asset Target Allocation Growth Funds Category Average3 returned 4.89% for the same period.
| | | | |
| Performance Snapshot as of June 30, 2011 | |
(unaudited) | | 6 months | |
| Variable Lifestyle Allocation 85%2 | | | 5.64 | % |
| Barclays Capital U.S. Aggregate Index | | | 2.72 | % |
| Russell 3000 Index | | | 6.35 | % |
| Lifestyle Allocation 85% Composite Benchmark | | | 5.67 | % |
| Lipper Variable Mixed-Asset Target Allocation Growth Funds Category Average | | | 4.89 | % |
The performance shown represents past performance. Past performance is no guarantee of future results and current performance may be higher or lower than the performance shown above. Principal value and investment returns will fluctuate and investors’ shares, when redeemed, may be worth more or less than their original cost.
Portfolio return assumes the reinvestment of all distributions, including returns of capital, if any, at net asset value and the deduction of all Portfolio expenses. Performance figures for periods shorter than one year represent cumulative figures and are not annualized.
The portfolio managers periodically adjust the allocation of the Portfolio’s assets among different Legg Mason-affiliated funds depending upon the portfolio managers’ outlook for the equity and fixed-income markets in general, particular sectors of such markets and the performance outlook for the underlying funds. The Portfolio is not expected to be invested in all of the underlying funds at any time. The Portfolio may change its allocations among the underlying funds and may vary the allocation between equity and fixed-income funds within the Target Range4 without prior notice to shareholders.
Total Annual Operating Expenses† (unaudited)
As of the Portfolio’s current prospectus dated May 1, 2011, the gross total annual operating expense ratio for the Portfolio was 0.94%.
Actual expenses may be higher. For example, expenses may be higher than those shown if average net assets decrease. Net assets are more likely to decrease and Portfolio expense ratios are more likely to increase when markets are volatile.
| 1 | The Target Asset Allocation set forth above represents an approximate mix of investments for Legg Mason Variable Lifestyle Allocation 85%. The allocation and investment mix of the Portfolio may vary depending upon market conditions, cash flows in and out of the Portfolio and other factors. In addition, the allocation and investment range of the Portfolio may be changed, from time to time, without prior notice to shareholders. |
| 2 | The Portfolio is an underlying investment option of various variable annuity and variable life insurance products. The Portfolio’s performance returns do not reflect the deduction of expenses imposed in connection with investing in variable annuity or variable life insurance contracts, such as administrative fees, account charges and surrender charges, which, if reflected, would reduce the performance of the Portfolio. Past performance is no guarantee of future results. |
| 3 | Lipper, Inc., a wholly-owned subsidiary of Reuters, provides independent insight on global collective investments. Returns are based on the six-month period ended June 30, 2011, including the reinvestment of all distributions, including returns of capital, if any, calculated among the 263 funds in the Portfolio’s Lipper category. |
| 4 | The Target Range is the percentage range, as stated by the prospectus, within which the Portfolio may make tactical changes to its equity funds/fixed-income funds allocation. |
| † | Includes expenses of the underlying funds in which the Portfolio invests. |
| | | | |
| Legg Mason Variable Lifestyle Series | | | VII | |
Legg Mason Variable Lifestyle Allocation 70%
Target Asset Allocation1
| | |
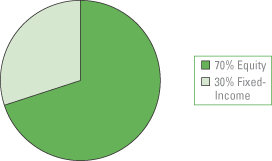 | | Legg Mason Variable Lifestyle Allocation 70% seeks long-term growth of capital by investing 70% of its assets in underlying funds that invest principally in equity securities and 30% in underlying funds that invest principally in fixed-income securities. |
Performance review
For the six months ended June 30, 2011, Legg Mason Variable Lifestyle Allocation 70%2 returned 5.03%. The Portfolio’s unmanaged benchmarks, the Barclays Capital U.S. Aggregate Index, the Russell 3000 Index and the Lifestyle Allocation 70% Composite Benchmarkxv, returned 2.72%, 6.35% and 5.20%, respectively, for the same period. The Lipper Variable Mixed-Asset Target Allocation Growth Funds Category Average3 returned 4.89% over the same time frame.
| | | | |
| Performance Snapshot as of June 30, 2011 | |
(unaudited) | | 6 months | |
| Variable Lifestyle Allocation 70%2 | | | 5.03 | % |
| Barclays Capital U.S. Aggregate Index | | | 2.72 | % |
| Russell 3000 Index | | | 6.35 | % |
| Lifestyle Allocation 70% Composite Benchmark | | | 5.20 | % |
Lipper Variable Mixed-Asset Target Allocation
Growth Funds Category Average | | | 4.89 | % |
The performance shown represents past performance. Past performance is no guarantee of future results and current performance may be higher or lower than the performance shown above. Principal value and investment returns will fluctuate and investors’ shares, when redeemed, may be worth more or less than their original cost.
Portfolio return assumes the reinvestment of all distributions, including returns of capital, if any, at net asset value and the
deduction of all Portfolio expenses. Performance figures for periods shorter than one year represent cumulative figures and are not annualized.
The portfolio managers periodically adjust the allocation of the Portfolio’s assets among different Legg Mason-affiliated funds depending upon the portfolio managers’ outlook for the equity and fixed-income markets in general, particular sectors of such markets and the performance outlook for the underlying funds. The Portfolio is not expected to be invested in all of the underlying funds at any time. The Portfolio may change its allocations among the underlying funds and may vary the allocation between equity and fixed-income funds within the Target Range4 without prior notice to shareholders.
Total Annual Operating Expenses† (unaudited)
As of the Portfolio’s current prospectus dated May 1, 2011, the gross total annual operating expense ratio for the Portfolio was 0.95%.
Actual expenses may be higher. For example, expenses may be higher than those shown if average net assets decrease. Net assets are more likely to decrease and Portfolio expense ratios are more likely to increase when markets are volatile.
As a result of an expense limitation arrangement, the ratio of expenses, other than brokerage, interest, taxes, extraordinary expenses and acquired fund fees and expenses, to average net assets is not expected to exceed 0.20%. This expense limitation arrangement cannot be terminated prior to December 31, 2012 without the Board of Trustees’ consent.
The manager is permitted to recapture amounts previously forgone or reimbursed to the Portfolio during the same fiscal year if the Portfolio’s total annual operating expenses have fallen to a level below the expense limitation in effect at the time the fees were earned or the expenses incurred.
| 1 | The Target Asset Allocation set forth above represents an approximate mix of investments for Legg Mason Variable Lifestyle Allocation 70%. The allocation and investment mix of the Portfolio may vary depending upon market conditions, cash flows in and out of the Portfolio and other factors. In addition, the allocation and investment ranges of the Portfolio may be changed, from time to time, without prior notice to shareholders. |
| 2 | The Portfolio is an underlying investment option of various variable annuity and variable life insurance products. The Portfolio’s performance returns do not reflect the deduction of expenses imposed in connection with investing in variable annuity or variable life insurance contracts, such as administrative fees, account charges and surrender charges, which, if reflected, would reduce the performance of the Portfolio. Past performance is no guarantee of future results. |
| 3 | Lipper, Inc., a wholly-owned subsidiary of Reuters, provides independent insight on global collective investments. Returns are based on the six-month period ended June 30, 2011, including the reinvestment of all distributions, including returns of capital, if any, calculated among the 263 funds in the Portfolio’s Lipper category. |
| 4 | The Target Range is the percentage range, as stated by the prospectus, within which the Portfolio may make tactical changes to its equity funds/fixed-income funds allocation. |
| † | Includes expenses of the underlying funds in which the Portfolio invests. |
| | |
| VIII | | Legg Mason Variable Lifestyle Series |
Investment commentary (cont’d)
Legg Mason Variable Lifestyle Allocation 50%
Target Asset Allocation1
| | |
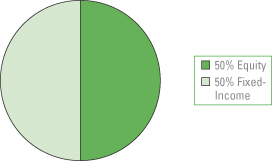 | | Legg Mason Variable Lifestyle Allocation 50% seeks a balance of growth of capital and income by investing 50% of its assets in underlying funds that invest principally in equity securities and 50% in underlying funds that invest principally in fixed-income securities. |
Performance review
For the six months ended June 30, 2011, Legg Mason Variable Lifestyle Allocation 50%2 returned 4.69%. The Portfolio’s unmanaged benchmarks, the Barclays Capital U.S. Aggregate Index, the Russell 1000 Indexxvi and the Lifestyle Allocation 50% Composite Benchmarkxvii, returned 2.72%, 6.37% and 4.59%, respectively, for the same period. The Lipper Variable Mixed-Asset Target Allocation Moderate Funds Category Average3 returned 4.25% over the same time frame.
| | | | |
| Performance Snapshot as of June 30, 2011 | | | |
(unaudited) | | 6 months | |
| Variable Lifestyle Allocation 50%2 | | | 4.69 | % |
| Barclays Capital U.S. Aggregate Index | | | 2.72 | % |
| Russell 1000 Index | | | 6.37 | % |
| Lifestyle Allocation 50% Composite Benchmark | | | 4.59 | % |
| Lipper Variable Mixed-Asset Target Allocation Moderate Funds Category Average | | | 4.25 | % |
The performance shown represents past performance. Past performance is no guarantee of future results and current performance may be higher or lower than the performance shown above. Principal value and investment returns will fluctuate and investors’ shares, when redeemed, may be worth more or less than their original cost.
Portfolio return assumes the reinvestment of all distributions, including returns of capital, if any, at net asset value and the deduction of all Portfolio expenses. Performance figures for periods shorter than one year represent cumulative figures and are not annualized.
The portfolio managers periodically adjust the allocation of the Portfolio’s assets among different Legg Mason-affiliated funds depending upon the portfolio managers’ outlook for the equity and fixed-income markets in general, particular sectors of such markets and the performance outlook for the underlying funds. The Portfolio is not expected to be invested in all of the underlying funds at any time. The Portfolio may change its allocations among the underlying funds and may vary the allocation between equity and fixed-income funds within the Target Range4 without prior notice to shareholders.
Total Annual Operating Expenses† (unaudited)
As of the Portfolio’s current prospectus dated May 1, 2011, the gross total annual operating expense ratio for the Portfolio was 0.82%.
Actual expenses may be higher. For example, expenses may be higher than those shown if average net assets decrease. Net assets are more likely to decrease and Portfolio expense ratios are more likely to increase when markets are volatile.
| 1 | The Target Asset Allocation set forth above represents an approximate mix of investments for Legg Mason Variable Lifestyle Allocation 50%. The allocation and investment mix of the Portfolio may vary depending upon market conditions, cash flows in and out of the Portfolio and other factors. In addition, the allocation and investment range of the Portfolio may be changed, from time to time, without prior notice to shareholders. |
| 2 | The Portfolio is an underlying investment option of various variable annuity and variable life insurance products. The Portfolio’s performance returns do not reflect the deduction of expenses imposed in connection with investing in variable annuity or variable life insurance contracts, such as administrative fees, account charges and surrender charges, which, if reflected, would reduce the performance of the Portfolio. Past performance is no guarantee of future results. |
| 3 | Lipper, Inc., a wholly-owned subsidiary of Reuters, provides independent insight on global collective investments. Returns are based on the six-month period ended June 30, 2011, including the reinvestment of all distributions, including returns of capital, if any, calculated among the 223 funds in the Portfolio’s Lipper category. |
| 4 | The Target Range is the percentage range, as stated by the prospectus, within which the Portfolio may make tactical changes to its equity funds/fixed-income funds allocation. |
| † | Includes expenses of the underlying funds in which the Portfolio invests. |
| | | | |
| Legg Mason Variable Lifestyle Series | | | IX | |
As always, thank you for your confidence in our stewardship of your assets.
Sincerely,
R. Jay Gerken, CFA
Chairman, President and Chief Executive Officer
July 29, 2011
RISKS: Equity securities are subject to price fluctuation. Fixed-income securities are subject to interest rate and credit risks. Foreign securities are subject to certain risks of overseas investing including currency fluctuations and changes in political and economic conditions, which could result in significant market fluctuations. These risks are magnified in emerging markets. Investments in small- and mid-capitalization companies may involve a higher degree
of risk and volatility than investments in larger, more established companies. As interest rates rise, bond prices fall, reducing the value of the Portfolios’ share prices. High-yield bonds involve greater credit and liquidity risks than investment grade bonds. There are additional risks and other expenses associated with investing in other mutual funds rather than directly in portfolio securities. Certain underlying funds may use derivatives, such as options and futures, which can be illiquid, may disproportionately increase losses, and have a potentially large impact on Portfolio performance. Please see the Portfolios’ prospectuses for a more complete discussion of these and other risks, and the Portfolios’ investment strategies.
All investments are subject to risk including the possible loss of principal. Past performance is no guarantee of future results. All index performance reflects no deduction for fees, expenses or taxes. Please note that an investor cannot invest directly in an index.
The information provided is not intended to be a forecast of future events, a guarantee of future results or investment advice. Views expressed may differ from those of the firm as a whole. Forecasts and predictions are inherently limited and should not be relied upon as an indication of actual or future performance.
| i | Gross domestic product (“GDP”) is the market value of all final goods and services produced within a country in a given period of time. |
| ii | The Federal Reserve Board (“Fed”) is responsible for the formulation of policies designed to promote economic growth, full employment, stable prices and a sustainable pattern of international trade and payments. |
| iii | The Institute for Supply Management’s PMI is based on a survey of purchasing executives who buy the raw materials for manufacturing at more than 350 companies. It offers an early reading on the health of the manufacturing sector. |
| iv | The federal funds rate is the rate charged by one depository institution on an overnight sale of immediately available funds (balances at the Federal Reserve) to another depository institution; the rate may vary from depository institution to depository institution and from day to day. |
| v | The S&P 500 Index is an unmanaged index of 500 stocks and is generally representative of the performance of larger companies in the U.S. |
| vi | The MSCI EAFE Index is a free float-adjusted market capitalization index designed to measure developed market equity performance, excluding the U.S. and Canada. |
| vii | The MSCI Emerging Markets Index is a free float-adjusted market capitalization index that is designed to measure equity market performance in the global emerging markets. |
| viii | Duration is the measure of the price sensitivity of a fixed-income security to an interest rate change of 100 basis points. Calculation is based on the weighted average of the present values for all cash flows. |
| ix | The Barclays Capital U.S. Aggregate Index is a broad-based bond index comprised of government, corporate, mortgage- and asset-backed issues, rated investment grade or higher, and having at least one year to maturity. |
| x | The Barclays Capital Global Aggregate Index (Hedged) is a broad-based bond index that measures a wide spectrum of global government, government-related agencies, corporate and securitized fixed-income investments, all with maturities greater than one year. |
| xi | The Barclays Capital U.S. High Yield — 2% Issuer Cap Index is an index of the 2% Issuer Cap component of the Barclays Capital U.S. Corporate High Yield Index, which covers the U.S. dollar-denominated, non-investment grade, fixed-rate, taxable corporate bond market. |
| xii | The JPMorgan Emerging Markets Bond Index Global (“EMBI Global”) tracks total returns for U.S. dollar-denominated debt instruments issued by emerging market sovereign and quasi-sovereign entities: Brady bonds, loans, Eurobonds and local market instruments. |
| xiii | The Russell 3000 Index measures the performance of the 3,000 largest U.S. companies based on total market capitalization, which represents approximately 98% of the U.S. equity market. |
| xiv | The Lifestyle Allocation 85% Composite Benchmark is a hypothetical representation of the performance of the Portfolio’s major asset classes. It consists of 45% Russell 1000 Index, 20% Russell 2000 Index, 20% MSCI EAFE Index, 10% Barclays Capital U.S. Aggregate Index and 5% Barclays Capital U.S. High Yield — 2% Issuer Cap Index. The Russell 2000 Index measures the performance of the 2,000 smallest companies in the Russell 3000 Index, which represents approximately 8% of the total market capitalization of the Russell 3000 Index. |
| xv | The Lifestyle Allocation 70% Composite Benchmark is a hypothetical representation of the performance of the Portfolio’s major asset classes. It consists of 40% Russell 1000 Index, 15% Russell 2000 Index, 15% MSCI EAFE Index, 25% Barclays Capital U.S. Aggregate Index and 5% Barclays Capital U.S. High Yield — 2% Issuer Cap Index. |
| xvi | The Russell 1000 Index measures the performance of the 1,000 largest companies in the Russell 3000 Index, which represents approximately 92% of the total market capitalization of the Russell 3000 Index. |
| xvii | The Lifestyle Allocation 50% Composite Benchmark is a hypothetical representation of the performance of the Portfolio’s major asset classes. It consists of 28% Russell 1000 Index, 12% Russell 2000 Index, 10% MSCI EAFE Index, 43% Barclays Capital U.S. Aggregate Index and 7% Barclays Capital U.S. High Yield — 2% Issuer Cap Index. |
| | | | |
| Legg Mason Variable Lifestyle Series 2011 Semi-Annual Report | | | 1 | |
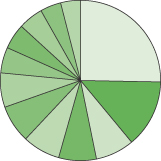
Portfolios at a glance (unaudited)
Legg Mason Variable Lifestyle Allocation 85% Breakdown† as of — June 30, 2011
As a Percent of Total Long-Term Investments

| | | | |
% of Total Long-Term
Investments | | Top 5 Sectors |
 | | 12.1 Legg Mason Partners Equity Trust — Legg Mason Batterymarch U.S. Large Cap Equity Fund, Class IS Shares | | Information Technology Health Care Industrials Financials Energy |
 | | 12.1 Legg Mason Partners Equity Trust — Legg Mason ClearBridge Appreciation Fund, Class IS Shares | | Information Technology Industrials Financials Energy Consumer Staples |
 | | 11.9 Legg Mason BW Diversified Large Cap Value Fund, Institutional Class Shares | | Financials Health Care Industrials Energy Consumer Discretionary |
 | | 11.2 Legg Mason Partners Equity Trust — Legg Mason ClearBridge Aggressive Growth Fund, Class IS Shares | | Health Care Consumer Discretionary Energy Information Technology Industrials |
 | | 10.0 Legg Mason Global Trust, Inc. — Legg Mason Batterymarch International Equity Trust, Class IS Shares | | Financials Industrials Materials Consumer Discretionary Energy |
 | | 9.8 Legg Mason Partners Equity Trust — Legg Mason Global Currents International All Cap Opportunity Fund, Class IS Shares | | Consumer Discretionary Financials Industrials Health Care Information Technology |
 | | 8.3 Legg Mason Partners Equity Trust — Legg Mason ClearBridge Small Cap Growth Fund, Class IS Shares | | Information Technology Health Care Industrials Consumer Discretionary Financials |
| † | Subject to change at any time. |
| | | | |
| |
% of Total Long-Term
Investments | | Top 5 Sectors |
 | | 8.0 The Royce Fund — Royce Value Fund, Institutional Class Shares | | Financials Materials Information Technology Consumer Discretionary Energy |
 | | 5.1 Legg Mason Partners Equity Trust — Legg Mason ClearBridge Mid Cap Core Fund, Class IS Shares | | Information Technology Financials Industrials Consumer Discretionary Health Care |
 | | 4.8 Western Asset Funds, Inc. — Western Asset High Yield Portfolio, Class IS Shares | | Consumer Discretionary Industrials Energy Financials Telecommunication Services |
 | | 4.7 Western Asset Funds, Inc. — Western Asset Absolute Return Portfolio, Class IS Shares | | U.S. Government & Agency Obligations Financials Collateralized Mortgage Obligations Consumer Discretionary Asset-Backed Securities |
 | | 2.0 Western Asset Funds, Inc. — Western Asset Core Plus Bond Portfolio, Class IS Shares | | Mortgage-Backed Securities Corporate Bonds & Notes Collateralized Mortgage Obligations U.S. Government & Agency Obligations Asset-Backed Securities |
| | |
| 2 | | Legg Mason Variable Lifestyle Series 2011 Semi-Annual Report |
Portfolios at a glance (unaudited) (cont’d)
Legg Mason Variable Lifestyle Allocation 70% Breakdown† as of — June 30, 2011
As a Percent of Total Long-Term Investments

| | | | |
% of Total Long-Term
Investments | | Top 5 Sectors |
| | | 10.9 Western Asset Funds, Inc. — Western Asset Absolute Return Portfolio, Class IS Shares | | U.S. Government & Agency Obligations Financials Collateralized Mortgage Obligations Consumer Discretionary Asset-Backed Securities |
| | | 10.8 Legg Mason Partners Equity Trust — Legg Mason Batterymarch U.S. Large Cap Equity Fund, Class IS Shares | | Information Technology Health Care Industrials Financials Energy |
| | | 10.7 Legg Mason Partners Equity Trust — Legg Mason ClearBridge Appreciation Fund, Class IS Shares | | Information Technology Industrials Financials Energy Consumer Staples |
| | | 10.7 Western Asset Funds, Inc. — Western Asset Core Plus Bond Portfolio, Class IS Shares | | Mortgage-Backed Securities Corporate Bonds & Notes Collateralized Mortgage Obligations U.S. Government & Agency Obligations Asset-Backed Securities |
| | | 10.5 Legg Mason BW Diversified Large Cap Value Fund, Institutional Class Shares | | Financials Health Care Industrials Energy Consumer Discretionary |
| | | 10.4 Legg Mason Partners Equity Trust — Legg Mason ClearBridge Aggressive Growth Fund, Class IS Shares | | Health Care Consumer Discretionary Energy Information Technology Industrials |
| † | Subject to change at any time. |
| | | | |
| |
% of Total Long-Term
Investments | | Top 5 Sectors |
| | | 7.5 Legg Mason Global Trust, Inc. — Legg Mason Batterymarch International Equity Trust, Class IS Shares | | Financials Industrials Materials Consumer Discretionary Energy |
| | | 7.4 Legg Mason Partners Equity Trust — Legg Mason Global Currents International All Cap Opportunity Fund, Class IS Shares | | Consumer Discretionary Financials Industrials Health Care Information Technology |
| | | 5.7 Legg Mason Partners Equity Trust — Legg Mason ClearBridge Small Cap Growth Fund, Class IS Shares | | Information Technology Health Care Industrials Consumer Discretionary Financials |
| | | 5.4 The Royce Fund — Royce Value Fund, Institutional Class Shares | | Financials Materials Information Technology Consumer Discretionary Energy |
| | | 5.1 Legg Mason Partners Equity Trust — Legg Mason ClearBridge Mid Cap Core Fund, Class IS Shares | | Information Technology Financials Industrials Consumer Discretionary Health Care |
| | | 4.9 Western Asset Funds, Inc. — Western Asset High Yield Portfolio, Class IS Shares | | Consumer Discretionary Industrials Energy Financials Telecommunication Services |
| | | | |
| Legg Mason Variable Lifestyle Series 2011 Semi-Annual Report | | | 3 | |
Legg Mason Variable Lifestyle Allocation 50% Breakdown† as of — June 30, 2011
As a Percent of Total Long-Term Investments
| | | | |
% of Total Long-Term
Investments | | Top 5 Sectors |
| | | 25.3 Western Asset Funds, Inc. — Western Asset Core Plus Bond Portfolio, Class IS Shares | | Mortgage-Backed Securities Corporate Bonds & Notes Collateralized Mortgage Obligations U.S. Government & Agency Obligations Asset-Backed Securities |
| | | 13.7 Western Asset Funds, Inc. — Western Asset Absolute Return Portfolio, Class IS Shares | | U.S. Government & Agency Obligations Financials Collateralized Mortgage Obligations Consumer Discretionary Asset-Backed Securities |
| | | 7.8 Legg Mason Partners Equity Trust — Legg Mason ClearBridge Aggressive Growth Fund, Class IS Shares | | Health Care Consumer Discretionary Energy Information Technology Industrials |
| | | 7.6 Legg Mason Partners Equity Trust — Legg Mason ClearBridge Appreciation Fund, Class IS Shares | | Information Technology Industrials Financials Energy Consumer Staples |
| | | 7.6 Legg Mason Partners Equity Trust — Legg Mason Batterymarch U.S. Large Cap Equity Fund, Class IS Shares | | Information Technology Health Care Industrials Financials Energy |
| | | 7.6 Legg Mason BW Diversified Large Cap Value Fund, Institutional Class Shares | | Financials Health Care Industrials Energy Consumer Discretionary |
| † | Subject to change at any time. |
| | | | |
| |
% of Total Long-Term
Investments | | Top 5 Sectors |
| | | 6.9 Western Asset Funds, Inc. — Western Asset High Yield Portfolio, Class IS Shares | | Consumer Discretionary Industrials Energy Financials Telecommunication Services |
| | | 5.2 Legg Mason Partners Equity Trust — Legg Mason ClearBridge Mid Cap Core Fund, Class IS Shares | | Information Technology Financials Industrials Consumer Discretionary Health Care |
| | | 5.1 Legg Mason Global Trust, Inc. — Legg Mason Batterymarch International Equity Trust, Class IS Shares | | Financials Industrials Materials Consumer Discretionary Energy |
| | | 5.0 Legg Mason Partners Equity Trust — Legg Mason Global Currents International All Cap Opportunity Fund, Class IS Shares | | Consumer Discretionary Financials Industrials Health Care Information Technology |
| | | 4.2 Legg Mason Partners Equity Trust — Legg Mason ClearBridge Small Cap Growth Fund, Class IS Shares | | Information Technology Health Care Industrials Consumer Discretionary Financials |
| | | 4.0 The Royce Fund — Royce Value Fund, Institutional Class Shares | | Financials Materials Information Technology Consumer Discretionary Energy |
| | |
| 4 | | Legg Mason Variable Lifestyle Series 2011 Semi-Annual Report |
Portfolios expenses (unaudited)
Example
As a shareholder of the Portfolios, you may incur two types of costs: (1) transaction costs and (2) ongoing costs, including management fees; and other Portfolio expenses. This example is intended to help you understand your ongoing costs (in dollars) of investing in the Portfolios and to compare these costs with the ongoing costs of investing in other mutual funds.
This example is based on an investment of $1,000 invested on January 1, 2011 and held for the six months ended June 30, 2011.
Actual expenses
The table below titled “Based on Actual Total Return” provides information about actual account values and actual expenses. You may use the information provided in this table, together with the amount you invested, to estimate the expenses that you paid over the period. To estimate the expenses you paid on your account, divide your ending account value by $1,000 (for example, an $8,600 ending account value divided by $1,000 = 8.6), then multiply the result by the number under the heading entitled “Expenses Paid During the Period”.
Hypothetical example for comparison purposes
The table below titled “Based on Hypothetical Total Return” provides information about hypothetical account values and hypothetical expenses based on the actual expense ratio and an assumed rate of return of 5.00% per year before expenses, which is not each Portfolio’s actual return. The hypothetical account values and expenses may not be used to estimate the actual ending account balance or expenses you paid for the period. You may use the information provided in this table to compare the ongoing costs of investing in the Portfolios and other portfolios. To do so, compare the 5.00% hypothetical example relating to the Portfolios with the 5.00% hypothetical examples that appear in the shareholder reports of the other funds.
Please note that the expenses shown in the table below are meant to highlight your ongoing costs only and do not reflect any transactional costs, such as front-end or back-end sales charges (loads). Therefore, the table is useful in comparing ongoing costs only, and will not help you determine the relative total costs of owning different funds. In addition, if these transaction costs were included, your costs would have been higher.
| | | | | | | | | | | | | | | | | | | | | | | | | | | | | | | | | | | | | | | | | | | | |
| Based on actual total return1 | | | | | Based on hypothetical total return1 | |
| | | Actual
Total
Return2 | | | Beginning
Account Value | | | Ending
Account Value | | | Annualized
Expense
Ratio3 | | | Expenses
Paid
During
the
Period4 | | | | | | | Hypothetical
Annualized
Total
Return | | | Beginning
Account Value | | | Ending
Account Value | | | Annualized
Expense
Ratio3 | | | Expenses
Paid During
the
Period4 | |
| Legg Mason Variable Lifestyle Allocation 85% | | | 5.64 | % | | $ | 1,000.00 | | | $ | 1,056.40 | | | | 0.12 | % | | $ | 0.61 | | | | | Legg Mason Variable Lifestyle Allocation 85% | | | 5.00 | % | | $ | 1,000.00 | | | $ | 1,024.20 | | | | 0.12 | % | | $ | 0.60 | |
Legg Mason Variable Lifestyle
Allocation 70% | | | 5.03 | | | | 1,000.00 | | | | 1,050.30 | | | | 0.17 | | | | 0.86 | | | | | Legg Mason Variable Lifestyle Allocation 70% | | | 5.00 | | | | 1,000.00 | | | | 1,023.95 | | | | 0.17 | | | | 0.85 | |
Legg Mason Variable Lifestyle
Allocation 50% | | | 4.69 | | | | 1,000.00 | | | | 1,046.90 | | | | 0.12 | | | | 0.61 | | | | | Legg Mason Variable Lifestyle Allocation 50% | | | 5.00 | | | | 1,000.00 | | | | 1,024.20 | | | | 0.12 | | | | 0.60 | |
| 1 | For the six months ended June 30, 2011. |
| 2 | Assumes the reinvestment of all distributions, including returns of capital, if any, at net asset value. Total return is not annualized, as it may not be representative of the total return for the year. Total returns do not reflect expenses associated with separate accounts such as administrative fees, account charges and surrender charges, which, if reflected, would reduce the total returns. Performance figures may reflect compensating balance arrangements, fees forgone and/or expense reimbursements. In the absence of fee compensating balance arrangements, fees forgone and/or expense reimbursements, the total return would have been lower. Past performance is no guarantee of future results. |
| 3 | The expense ratios do not include expenses of the underlying funds in which each Portfolio invests. |
| 4 | Expenses (net of fees forgone and/or expense reimbursements) are equal to each Portfolio’s annualized expense ratio multiplied by the average account value over the period, multiplied by the number of days in the most recent fiscal half-year (181), then divided by 365. |
| | | | |
| Legg Mason Variable Lifestyle Series 2011 Semi-Annual Report | | | 5 | |
Schedules of investments (unaudited)
June 30, 2011
Legg Mason Variable Lifestyle Allocation 85%
| | | | | | | | | | | | | | |
| Description | | | | | | | Shares | | | Value | |
| Investments in Underlying Funds — 100.0% | | | | | | | | | | | | | | |
Legg Mason BW Diversified Large Cap Value Fund, Institutional Class Shares | | | | | | | | | 880,327 | | | $ | 12,887,985 | |
Legg Mason Global Trust, Inc. — Legg Mason Batterymarch International Equity Trust, Class IS Shares | | | | | | | | | 776,066 | | | | 10,779,559 | |
Legg Mason Partners Equity Trust: | | | | | | | | | | | | | | |
Legg Mason Batterymarch U.S. Large Cap Equity Fund, Class IS Shares | | | | | | | | | 1,186,434 | | | | 13,086,368 | |
Legg Mason ClearBridge Aggressive Growth Fund, Class IS Shares | | | | | | | | | 91,454 | | | | 12,076,564 | * |
Legg Mason ClearBridge Appreciation Fund, Class IS Shares | | | | | | | | | 904,039 | | | | 13,000,083 | |
Legg Mason ClearBridge Mid Cap Core Fund, Class IS Shares | | | | | | | | | 226,636 | | | | 5,518,589 | * |
Legg Mason ClearBridge Small Cap Growth Fund, Class IS Shares | | | | | | | | | 461,558 | | | | 8,935,765 | * |
Legg Mason Global Currents International All Cap Opportunity Fund,
Class IS Shares | | | | | | | | | 1,166,011 | | | | 10,622,359 | |
The Royce Fund — Royce Value Fund, Institutional Class Shares | | | | | | | | | 641,921 | | | | 8,672,352 | |
Western Asset Funds, Inc.: | | | | | | | | | | | | | | |
Western Asset Absolute Return Portfolio, Class IS Shares | | | | | | | | | 495,760 | | | | 5,071,623 | |
Western Asset Core Plus Bond Portfolio, Class IS Shares | | | | | | | | | 196,453 | | | | 2,149,193 | |
Western Asset High Yield Portfolio, Class IS Shares | | | | | | | | | 589,050 | | | | 5,213,096 | |
Total Investments in Underlying Funds before Short-Term Investments (Cost — $94,233,972) | | | | 108,013,536 | |
| | | | |
| Security | | Rate | | | Maturity
Date | | Face
Amount | | | | |
| Short-Term Investments — 0.1% | | | | | | | | |
Repurchase Agreements — 0.1% | | | | | | | | | | | | | | |
Interest in $367,792,000 joint tri-party repurchase agreement dated 6/30/11 with Barclays Capital Inc.; Proceeds at maturity — $49,000; (Fully collateralized by various U.S. government agency obligations, 0.000% to 0.135% due 5/6/13 to 7/15/20; Market value — $49,980) (Cost — $49,000) | | | 0.020 | % | | 7/1/11 | | $ | 49,000 | | | | 49,000 | |
Total Investments — 100.1% (Cost — $94,282,972#) | | | | | | | | | | | | | 108,062,536 | |
Liabilities in Excess of Other Assets — (0.1)% | | | | | | | | | | | | | (90,493 | ) |
Total Net Assets — 100.0% | | | | | | | | | | | | $ | 107,972,043 | |
| * | Non-income producing security. |
| # | Aggregate cost for federal income tax purposes is substantially the same. |
See Notes to Financial Statements.
| | |
| 6 | | Legg Mason Variable Lifestyle Series 2011 Semi-Annual Report |
Schedules of investments (unaudited) (cont’d)
June 30, 2011
Legg Mason Variable Lifestyle Allocation 70%
| | | | | | | | | | | | | | |
| Description | | | | | | | Shares | | | Value | |
| Investments in Underlying Funds — 99.7% | |
Legg Mason BW Diversified Large Cap Value Fund, Institutional Class Shares | | | | | | | | | 465,325 | | | $ | 6,812,358 | |
Legg Mason Global Trust, Inc. — Legg Mason Batterymarch International Equity Trust, Class IS Shares | | | | | | | | | 352,657 | | | | 4,898,410 | |
Legg Mason Partners Equity Trust: | | | | | | | | | | | | | | |
Legg Mason Batterymarch U.S. Large Cap Equity Fund, Class IS Shares | | | | | | | | | 636,897 | | | | 7,024,977 | |
Legg Mason ClearBridge Aggressive Growth Fund, Class IS Shares | | | | | | | | | 51,090 | | | | 6,746,488 | * |
Legg Mason ClearBridge Appreciation Fund, Class IS Shares | | | | | | | | | 485,061 | | | | 6,975,177 | |
Legg Mason ClearBridge Mid Cap Core Fund, Class IS Shares | | | | | | | | | 138,193 | | | | 3,365,006 | * |
Legg Mason ClearBridge Small Cap Growth Fund, Class IS Shares | | | | | | | | | 193,372 | | | | 3,743,687 | * |
Legg Mason Global Currents International All Cap Opportunity Fund, Class IS Shares | | | | | | | | | 526,666 | | | | 4,797,929 | |
The Royce Fund — Royce Value Fund, Institutional Class Shares | | | | | | | | | 259,435 | | | | 3,504,968 | |
Western Asset Funds, Inc.: | | | | | | | | | | | | | | |
Western Asset Absolute Return Portfolio, Class IS Shares | | | | | | | | | 696,998 | | | | 7,130,293 | |
Western Asset Core Plus Bond Portfolio, Class IS Shares | | | | | | | | | 635,209 | | | | 6,949,181 | |
Western Asset High Yield Portfolio, Class IS Shares | | | | | | | | | 359,668 | | | | 3,183,060 | |
Total Investments in Underlying Funds before Short-Term Investments (Cost — $56,964,399) | | | | 65,131,534 | |
| | | | |
| Security | | Rate | | | Maturity
Date | | Face
Amount | | | | |
| Short-Term Investments — 0.3% | |
Repurchase Agreements — 0.3% | |
Interest in $367,792,000 joint tri-party repurchase agreement dated 6/30/11 with Barclays Capital Inc.; Proceeds at maturity — $165,000; (Fully collateralized by various U.S. government agency obligations, 0.000% to 0.135% due 5/16/13 to 7/15/20; Market value — $168,300) (Cost — $165,000) | | | 0.020 | % | | 7/1/11 | | $ | 165,000 | | | | 165,000 | |
Total Investments — 100.0 % (Cost — $57,129,399#) | | | | | | | | | | | | | 65,296,534 | |
Other Assets in Excess of Liabilities — 0.0% | | | | | | | | | | | | | 12,041 | |
Total Net Assets — 100.0% | | | | | | | | | | | | $ | 65,308,575 | |
| * | Non-income producing security. |
| # | Aggregate cost for federal income tax purposes is substantially the same. |
See Notes to Financial Statements.
| | | | |
| Legg Mason Variable Lifestyle Series 2011 Semi-Annual Report | | | 7 | |
Legg Mason Variable Lifestyle Allocation 50%
| | | | | | | | | | | | | | |
| Description | | | | | | | Shares | | | Value | |
| Investments in Underlying Funds — 99.9% | | | | | | | | | | | | | | |
Legg Mason BW Diversified Large Cap Value Fund, Institutional Class Shares | | | | | | | | | 648,624 | | | $ | 9,495,861 | |
Legg Mason Global Trust, Inc. — Legg Mason Batterymarch International Equity Trust, Class IS Shares | | | | | | | | | 460,394 | | | | 6,394,874 | |
Legg Mason Partners Equity Trust: | | | | | | | | | | | | | | |
Legg Mason Batterymarch U.S. Large Cap Equity Fund, Class IS Shares | | | | | | | | | 863,282 | | | | 9,522,003 | |
Legg Mason ClearBridge Aggressive Growth Fund, Class IS Shares | | | | | | | | | 73,647 | | | | 9,725,055 | * |
Legg Mason ClearBridge Appreciation Fund, Class IS Shares | | | | | | | | | 663,400 | | | | 9,539,695 | |
Legg Mason ClearBridge Mid Cap Core Fund, Class IS Shares | | | | | | | | | 265,298 | | | | 6,460,003 | * |
Legg Mason ClearBridge Small Cap Growth Fund, Class IS Shares | | | | | | | | | 271,424 | | | | 5,254,770 | * |
Legg Mason Global Currents International All Cap Opportunity Fund, Class IS Shares | | | | | | | | | 690,207 | | | | 6,287,783 | |
The Royce Fund — Royce Value Fund, Institutional Class Shares | | | | | | | | | 369,233 | | | | 4,988,337 | |
Western Asset Funds, Inc.: | | | | | | | | | | | | | | |
Western Asset Absolute Return Portfolio, Class IS Shares | | | | | | | | | 1,674,063 | | | | 17,125,666 | |
Western Asset Core Plus Bond Portfolio, Class IS Shares | | | | | | | | | 2,882,545 | | | | 31,535,040 | |
Western Asset High Yield Portfolio, Class IS Shares | | | | | | | | | 967,949 | | | | 8,566,351 | |
Total Investments in Underlying Funds before Short-Term Investments (Cost — $110,274,812) | | | | 124,895,438 | |
| | | | |
| Security | | Rate | | | Maturity
Date | | Face
Amount | | | | |
| Short-Term Investments — 0.1% | | | | | | | | | | | | | | |
Repurchase Agreements — 0.1% | | | | | | | | | | | | | | |
Interest in $367,792,000 joint tri-party repurchase agreement dated 6/30/11 with Barclays Capital Inc.; Proceeds at maturity — $129,000; (Fully collateralized by various U.S. government obligations, 0.000% to 0.135% due 5/16/13 to 7/15/20; Market value — $131,580) (Cost — $129,000) | | | 0.020 | % | | 7/1/11 | | $ | 129,000 | | | | 129,000 | |
Total Investments — 100.0% (Cost — $110,403,812#) | | | | | | | | | | 125,024,438 | |
Other Assets in Excess of Liabilities — 0.0% | | | | | | | | | | | | | 34,440 | |
Total Net Assets — 100.0% | | | | | | | | | | | | $ | 125,058,878 | |
| * | Non-income producing security. |
| # | Aggregate cost for federal income tax purposes is substantially the same. |
See Notes to Financial Statements.
| | |
| 8 | | Legg Mason Variable Lifestyle Series 2011 Semi-Annual Report |
Statements of assets and liabilities (unaudited)
June 30, 2011
| | | | | | | | | | | | |
| | | Legg Mason
Variable
Lifestyle
Allocation 85% | | | Legg Mason
Variable
Lifestyle
Allocation 70% | | | Legg Mason
Variable
Lifestyle
Allocation 50% | |
| | | |
| Assets: | | | | | | | | | | | | |
Investments, at cost | | $ | 94,282,972 | | | $ | 57,129,399 | | | $ | 110,403,812 | |
Investments, at value | | | 108,062,536 | | | | 65,296,534 | | | | 125,024,438 | |
Cash | | | 423 | | | | 775 | | | | 634 | |
Receivable for Underlying Funds | | | 30,948 | | | | 70,941 | | | | 242,828 | |
Receivable for Portfolio shares sold | | | 86 | | | | 78 | | | | 18,333 | |
Prepaid expenses | | | 277 | | | | 234 | | | | 2,228 | |
Total Assets | | | 108,094,270 | | | | 65,368,562 | | | | 125,288,461 | |
| | | |
| Liabilities: | | | | | | | | | | | | |
Payable for Portfolio shares repurchased | | | 68,087 | | | | 7,639 | | | | 162,934 | |
Trustees’ fees payable | | | 1,186 | | | | 1,308 | | | | 1,688 | |
Accrued expenses | | | 52,954 | | | | 51,040 | | | | 64,961 | |
Total Liabilities | | | 122,227 | | | | 59,987 | | | | 229,583 | |
| Total Net Assets | | $ | 107,972,043 | | | $ | 65,308,575 | | | $ | 125,058,878 | |
| | | |
| Net Assets: | | | | | | | | | | | | |
Par value (Note 5) | | $ | 85 | | | $ | 58 | | | $ | 103 | |
Paid-in capital in excess of par value | | | 119,503,920 | | | | 96,948,979 | | | | 138,607,556 | |
Undistributed net investment income | | | 236,885 | | | | 270,461 | | | | 1,120,180 | |
Accumulated net realized loss on Underlying Funds and foreign currency transactions | | | (25,548,411) | | | | (40,078,058) | | | | (29,289,587) | |
Net unrealized appreciation on Underlying Funds | | | 13,779,564 | | | | 8,167,135 | | | | 14,620,626 | |
| Total Net Assets | | $ | 107,972,043 | | | $ | 65,308,575 | | | $ | 125,058,878 | |
| | | |
| Shares Outstanding | | | 8,468,655 | | | | 5,823,864 | | | | 10,343,409 | |
| | | |
| Net Asset Value | | | $12.75 | | | | $11.21 | | | | $12.09 | |
See Notes to Financial Statements.
| | | | |
| Legg Mason Variable Lifestyle Series 2011 Semi-Annual Report | | | 9 | |
Statements of operations (unaudited)
For the Six Months Ended June 30, 2011
| | | | | | | | | | | | |
| | | Legg Mason
Variable
Lifestyle
Allocation 85% | | | Legg Mason
Variable
Lifestyle
Allocation 70% | | | Legg Mason
Variable
Lifestyle
Allocation 50% | |
| | | |
| Investment Income: | | | | | | | | | | | | |
Income distributions from Underlying Funds | | $ | 374,872 | | | $ | 411,149 | | | $ | 1,278,638 | |
Interest | | | 143 | | | | 81 | | | | 176 | |
Total Investment Income | | | 375,015 | | | | 411,230 | | | | 1,278,814 | |
| | | |
| Expenses: | | | | | | | | | | | | |
Shareholder reports | | | 21,840 | | | | 20,352 | | | | 25,289 | |
Audit and tax | | | 13,366 | | | | 13,258 | | | | 13,459 | |
Legal fees | | | 12,448 | | | | 12,424 | | | | 17,462 | |
Fund accounting fees | | | 5,334 | | | | 3,559 | | | | 6,384 | |
Trustees’ fees | | | 4,645 | | | | 3,366 | | | | 5,627 | |
Transfer agent fees (Note 5) | | | 3,239 | | | | 3,228 | | | | 3,199 | |
Insurance | | | 1,500 | | | | 1,226 | | | | 1,325 | |
Custody fees | | | 31 | | | | 17 | | | | 66 | |
Miscellaneous expenses | | | 32 | | | | 55 | | | | 34 | |
Total Expenses | | | 62,435 | | | | 57,485 | | | | 72,845 | |
| Net Investment Income | | | 312,580 | | | | 353,745 | | | | 1,205,969 | |
| | | |
| Realized and Unrealized Gain (Loss) on Sales of Investments and Underlying Funds, Underlying Funds and Foreign Currency Transactions (Notes 1 and 3): | | | | | | | | | | | | |
Net Realized Gain (Loss) From: | | | | | | | | | | | | |
Investment transactions (Note 6) | | | 46,173 | | | | 27,629 | | | | 44,690 | |
Sale of Underlying Funds | | | (255,207) | | | | (674,155) | | | | 3,253,195 | |
Foreign currency transactions (Note 6) | | | (155) | | | | (92) | | | | 22 | |
Net Realized Gain (Loss) | | | (209,189) | | | | (646,618) | | | | 3,297,907 | |
Change in Net Unrealized Appreciation on Underlying Funds | | | 5,684,793 | | | | 3,796,227 | | | | 1,346,148 | |
| Net Gain on Sales of Investments and Underlying Funds, Underlying Funds and Foreign Currency Transactions | | | 5,475,604 | | | | 3,149,609 | | | | 4,644,055 | |
| Increase in Net Assets from Operations | | $ | 5,788,184 | | | $ | 3,503,354 | | | $ | 5,850,024 | |
See Notes to Financial Statements.
| | |
| 10 | | Legg Mason Variable Lifestyle Series 2011 Semi-Annual Report |
Statements of changes in net assets
Legg Mason Variable Lifestyle Allocation 85%
| | | | | | | | |
For the Six Months Ended June 30, 2011 (unaudited)
and the Year Ended December 31, 2010 | | 2011 | | | 2010 | |
| | |
| Operations: | | | | | | | | |
Net investment income | | $ | 312,580 | | | $ | 1,536,708 | |
Net realized loss | | | (209,189) | | | | (2,695,407) | |
Change in net unrealized appreciation (depreciation) | | | 5,684,793 | | | | 15,232,803 | |
Proceeds from settlement of a regulatory matter | | | — | | | | 8,502 | |
Increase in Net Assets From Operations | | | 5,788,184 | | | | 14,082,606 | |
| | |
| Distributions to Shareholders From (Note 1): | | | | | | | | |
Net investment income | | | (350,008) | | | | (1,550,010) | |
Decrease in Net Assets From Distributions to Shareholders | | | (350,008) | | | | (1,550,010) | |
| | |
| Portfolio Share Transactions (Note 5): | | | | | | | | |
Net proceeds from sale of shares | | | 4,487,334 | | | | 9,353,247 | |
Reinvestment of distributions | | | 350,008 | | | | 1,550,010 | |
Cost of shares repurchased | | | (6,141,017) | | | | (9,061,714) | |
Increase (Decrease) in Net Assets From Portfolio Share Transactions | | | (1,303,675) | | | | 1,841,543 | |
Increase in Net Assets | | | 4,134,501 | | | | 14,374,139 | |
| | |
| Net Assets: | | | | | | | | |
Beginning of period | | | 103,837,542 | | | | 89,463,403 | |
End of period* | | $ | 107,972,043 | | | $ | 103,837,542 | |
* Includes undistributed net investment income of: | | | $236,885 | | | | $274,313 | |
See Notes to Financial Statements.
| | | | |
| Legg Mason Variable Lifestyle Series 2011 Semi-Annual Report | | | 11 | |
Legg Mason Variable Lifestyle Allocation 70%
| | | | | | | | |
For the Six Months Ended June 30, 2011 (unaudited)
and the Year Ended December 31, 2010 | | 2011 | | | 2010 | |
| | |
| Operations: | | | | | | | | |
Net investment income | | $ | 353,745 | | | $ | 1,392,506 | |
Net realized loss | | | (646,618) | | | | (3,225,503) | |
Change in net unrealized appreciation (depreciation) | | | 3,796,227 | | | | 11,380,327 | |
Proceeds from settlement of a regulatory matter | | | — | | | | 8,502 | |
Increase in Net Assets From Operations | | | 3,503,354 | | | | 9,555,832 | |
| | |
| Distributions to Shareholders From (Note 1): | | | | | | | | |
Net investment income | | | (400,005) | | | | (1,400,011) | |
Decrease in Net Assets From Distributions to Shareholders | | | (400,005) | | | | (1,400,011) | |
| | |
| Portfolio Share Transactions (Note 5): | | | | | | | | |
Net proceeds from sale of shares | | | 216,095 | | | | 436,460 | |
Reinvestment of distributions | | | 400,005 | | | | 1,400,011 | |
Cost of shares repurchased | | | (8,356,887) | | | | (12,028,438) | |
Decrease in Net Assets From Portfolio Share Transactions | | | (7,740,787) | | | | (10,191,967) | |
Decrease in Net Assets | | | (4,637,438) | | | | (2,036,146) | |
| | |
| Net Assets: | | | | | | | | |
Beginning of period | | | 69,946,013 | | | | 71,982,159 | |
End of period* | | $ | 65,308,575 | | | $ | 69,946,013 | |
* Includes undistributed net investment income of: | | | $270,461 | | | | $316,721 | |
See Notes to Financial Statements.
| | |
| 12 | | Legg Mason Variable Lifestyle Series 2011 Semi-Annual Report |
Statements of changes in net assets (cont’d)
Legg Mason Variable Lifestyle Allocation 50%
| | | | | | | | |
For the Six Months Ended June 30, 2011 (unaudited)
and the Year Ended December 31, 2010 | | 2011 | | | 2010 | |
| | |
| Operations: | | | | | | | | |
Net investment income | | $ | 1,205,969 | | | $ | 3,531,734 | |
Net realized gain (loss) | | | 3,297,907 | | | | (4,100,988) | |
Change in net unrealized appreciation (depreciation) | | | 1,346,148 | | | | 16,930,369 | |
Proceeds from settlement of a regulatory matter | | | — | | | | 13,301 | |
Increase in Net Assets From Operations | | | 5,850,024 | | | | 16,374,416 | |
| | |
| Distributions to Shareholders From (Note 1): | | | | | | | | |
Net investment income | | | (550,004) | | | | (3,650,011) | |
Decrease in Net Assets From Distributions to Shareholders | | | (550,004) | | | | (3,650,011) | |
| | |
| Portfolio Share Transactions (Note 5): | | | | | | | | |
Net proceeds from sale of shares | | | 6,864,347 | | | | 6,637,283 | |
Reinvestment of distributions | | | 550,004 | | | | 3,650,011 | |
Cost of shares repurchased | | | (12,969,993) | | | | (23,990,913) | |
Decrease in Net Assets From Portfolio Share Transactions | | | (5,555,642) | | | | (13,703,619) | |
Decrease in Net Assets | | | (255,622) | | | | (979,214) | |
| | |
| Net Assets: | | | | | | | | |
Beginning of period | | | 125,314,500 | | | | 126,293,714 | |
End of period* | | $ | 125,058,878 | | | $ | 125,314,500 | |
* Includes undistributed net investment income of: | | | $1,120,180 | | | | $464,215 | |
See Notes to Financial Statements.
| | | | |
| Legg Mason Variable Lifestyle Series 2011 Semi-Annual Report | | | 13 | |
Financial highlights
Legg Mason Variable Lifestyle Allocation 85%
| | | | | | | | | | | | | | | | | | | | | | | | | | | | |
| For a share of beneficial interest outstanding throughout each year ended December 31, unless otherwise noted: | |
| | | 20111 | | | 2010 | | | 20092 | | | 20093 | | | 20083 | | | 20073,4 | | | 20063,4 | |
| | | | | | | |
| Net asset value, beginning of period | | | $12.11 | | | | $10.63 | | | | $7.73 | | | | $12.75 | | | | $14.39 | | | | $13.46 | | | | $12.06 | |
| | | | | | | |
| Income (loss) from operations: | | | | | | | | | | | | | | | | | | | | | | | | | | | | |
Net investment income | | | 0.04 | | | | 0.18 | | | | 0.20 | 5 | | | 0.23 | 5 | | | 0.24 | 5 | | | 0.14 | 5 | | | 0.06 | 5 |
Net realized and unrealized gain (loss) | | | 0.64 | | | | 1.48 | | | | 2.92 | | | | (4.97) | | | | (0.71) | | | | 0.94 | | | | 1.40 | |
Total income (loss) from operations | | | 0.68 | | | | 1.66 | | | | 3.12 | | | | (4.74) | | | | (0.47) | | | | 1.08 | | | | 1.46 | |
| | | | | | | |
| Less distributions from: | | | | | | | | | | | | | | | | | | | | | | | | | | | | |
Net investment income | | | (0.04) | | | | (0.18) | | | | (0.22) | | | | (0.20) | | | | (0.22) | | | | (0.15) | | | | (0.06) | |
Net realized gains | | | — | | | | — | | | | — | | | | (0.08) | | | | (0.95) | | | | — | | | | — | |
Total distributions | | | (0.04) | | | | (0.18) | | | | (0.22) | | | | (0.28) | | | | (1.17) | | | | (0.15) | | | | (0.06) | |
| | | | | | | |
| Net asset value, end of period | | | $12.75 | | | | $12.11 | | | | $10.63 | | | | $7.73 | | | | $12.75 | | | | $14.39 | | | | $13.46 | |
Total return6 | | | 5.64 | % | | | 15.70 | %7 | | | 40.53 | % | | | (37.53) | %7 | | | (3.87) | % | | | 8.02 | % | | | 12.11 | % |
| | | | | | | |
| Net assets, end of period (000s) | | | $107,972 | | | | $103,838 | | | | $89,463 | | | | $59,371 | | | | $83,678 | | | | $81,954 | | | | $94,062 | |
| | | | | | | |
| Ratios to average net assets: | | | | | | | | | | | | | | | | | | | | | | | | | | | | |
Gross expenses8 | | | 0.12 | %9 | | | 0.15 | % | | | 0.21 | %9 | | | 0.15 | % | | | 0.32 | %10 | | | 0.38 | %11 | | | 0.35 | % |
Net expenses8,12 | | | 0.12 | 9,13 | | | 0.15 | 13 | | | 0.19 | 9,13,14 | | | 0.12 | 13,14 | | | 0.32 | 13,10 | | | 0.37 | 11,14 | | | 0.35 | |
Net investment income | | | 0.59 | 9 | | | 1.65 | | | | 2.52 | 9 | | | 2.30 | | | | 1.87 | | | | 0.97 | | | | 0.50 | |
| | | | | | | |
| Portfolio turnover rate | | | 26 | % | | | 17 | % | | | 10 | % | | | 34 | % | | | 19 | % | | | 108 | % | | | 50 | % |
| 1 | For the six months ended June 30, 2011 (unaudited). |
| 2 | For the period February 1, 2009 through December 31, 2009. |
| 3 | For the year ended January 31. |
| 4 | Represents a share of capital stock outstanding prior to April 30, 2007. |
| 5 | Net investment income per share includes short-term capital gain distributions from Underlying Funds. |
| 6 | Performance figures may reflect compensating balance arrangements, fees forgone and/or expense reimbursements. In the absence of compensating balance arrangements, fees forgone and/or expense reimbursements, the total return would have been lower. Total returns do not reflect expenses associated with separate accounts such as administrative fees, account charges and surrender charges which, if reflected, would reduce the total return for all periods shown. Past performance is no guarantee of future results. Total returns for periods of less than one year are not annualized. |
| 7 | The total return includes gains from settlement of investment litigations. Without these gains, the total return would have been 15.60% and 39.87% for the year ended December 31, 2010 and the period ended December 31, 2009, respectively. |
| 8 | Does not include expenses of the Underlying Funds in which the Portfolio invests. |
| 10 | The gross and net expense ratios include interest expense. Excluding interest expense, the gross and net expense ratios would have been the same. |
| 11 | Included in the expense ratios are certain non-recurring restructuring (and reorganization, if applicable) fees that were incurred by the Portfolio during the period. Without these fees, the gross and net expense ratios would have both been 0.35%. |
| 12 | The impact of compensating balance arrangements, if any, was less than 0.01%. |
| 13 | As a result of expense limitation arrangement, effective December 1, 2007, the ratio of expenses, other than brokerage, interest, taxes, extraordinary expenses and acquired fund fees and expenses, to average net assets of shares did not exceed 0.20%. This expense limitation arrangement cannot be terminated prior to December 31, 2012 without the Board of Trustees’ consent. |
| 14 | Reflects fees forgone and/or expense reimbursements. |
See Notes to Financial Statements.
| | |
| 14 | | Legg Mason Variable Lifestyle Series 2011 Semi-Annual Report |
Financial highlights (cont’d)
Legg Mason Variable Lifestyle Allocation 70%
| | | | | | | | | | | | | | | | | | | | | | | | | | | | |
| For a share of beneficial interest outstanding throughout each year ended December 31, unless otherwise noted: | |
| | | 20111 | | | 2010 | | | 20092 | | | 20093 | | | 20083 | | | 20073,4 | | | 20063,4 | |
| | | | | | | |
| Net asset value, beginning of period | | | $10.74 | | | | $9.53 | | | | $7.09 | | | | $10.94 | | | | $11.62 | | | | $10.96 | | | | $10.20 | |
| | | | | | | |
| Income (loss) from operations: | | | | | | | | | | | | | | | | | | | | | | | | | | | | |
Net investment income | | | 0.06 | | | | 0.22 | | | | 0.27 | 5 | | | 0.30 | 5 | | | 0.33 | 5 | | | 0.22 | 5 | | | 0.16 | 5 |
Net realized and unrealized gain (loss) | | | 0.48 | | | | 1.20 | | | | 2.47 | | | | (3.89) | | | | (0.50) | | | | 0.66 | | | | 0.76 | |
Total income (loss) from operations | | | 0.54 | | | | 1.42 | | | | 2.74 | | | | (3.59) | | | | (0.17) | | | | 0.88 | | | | 0.92 | |
| | | | | | | |
| Less distributions from: | | | | | | | | | | | | | | | | | | | | | | | | | | | | |
Net investment income | | | (0.07) | | | | (0.21) | | | | (0.30) | | | | (0.25) | | | | (0.32) | | | | (0.22) | | | | (0.16) | |
Net realized gains | | | — | | | | — | | | | — | | | | (0.01) | | | | (0.19) | | | | — | | | | — | |
Total distributions | | | (0.07) | | | | (0.21) | | | | (0.30) | | | | (0.26) | | | | (0.51) | | | | (0.22) | | | | (0.16) | |
| | | | | | | |
| Net asset value, end of period | | | $11.21 | | | | $10.74 | | | | $9.53 | | | | $7.09 | | | | $10.94 | | | | $11.62 | | | | $10.96 | |
Total return, based on NAV6 | | | 5.03 | % | | | 15.01 | %7 | | | 38.90 | %7 | | | (33.03) | % | | | (1.64) | % | | | 8.06 | % | | | 9.08 | % |
| | | | | | | |
| Net assets, end of period (000s) | | | $65,309 | | | | $69,946 | | | | $71,982 | | | | $59,526 | | | | $108,500 | | | | $129,695 | | | | $146,642 | |
| | | | | | | |
| Ratios to average net assets: | | | | | | | | | | | | | | | | | | | | | | | | | | | | |
Gross expenses8 | | | 0.17 | %9 | | | 0.20 | % | | | 0.23 | %9 | | | 0.14 | % | | | 0.32 | % | | | 0.38 | %10 | | | 0.35 | % |
Net expenses8,11 | | | 0.17 | 9,12 | | | 0.18 | 12,13 | | | 0.20 | 9,12,13 | | | 0.10 | 12,13 | | | 0.32 | 12 | | | 0.37 | 10,13 | | | 0.35 | |
Net investment income | | | 1.04 | 9 | | | 2.02 | | | | 3.32 | 9 | | | 2.89 | | | | 2.67 | | | | 1.82 | | | | 1.47 | |
| | | | | | | |
| Portfolio turnover rate | | | 20 | % | | | 14 | % | | | 11 | % | | | 26 | % | | | 15 | % | | | 123 | % | | | 53 | % |
| 1 | For the six months ended June 30, 2011 (unaudited). |
| 2 | For the period February 1, 2009 through December 31, 2009. |
| 3 | For the year ended January 31. |
| 4 | Represents a share of capital stock outstanding prior to April 30, 2007. |
| 5 | Net investment income per share includes short-term capital gain distributions from Underlying Funds. |
| 6 | Performance figures may reflect compensating balance arrangements, fees forgone and/or expense reimbursements. In the absence of compensating balance arrangements, fees forgone and/or expense reimbursements, the total return would have been lower. Total returns do not reflect expenses associated with separate accounts such as administrative fees, account charges and surrender charges which, if reflected, would reduce the total return for all periods shown. Past performance is no guarantee of future results. Total returns for periods of less than one year are not annualized. |
| 7 | The total return includes gains from settlement of investment litigations. Without these gains, the total return would have been 14.79% and 37.59% for the year ended December 31, 2010 and the period ended December 31, 2009, respectively. |
| 8 | Does not include expenses of the Underlying Funds in which the Portfolio invests. |
| 10 | Included in the expense ratios are certain non-recurring restructuring (and reorganization, if applicable) fees that were incurred by the Portfolio during the period. Without these fees, the gross and net expense ratios would have both been 0.35%. |
| 11 | The impact of compensating balance arrangements, if any, was less than 0.01%. |
| 12 | As a result of expense limitation arrangement, effective December 1, 2007, the ratio of expenses, other than brokerage, interest, taxes, extraordinary expenses and acquired fund fees and expenses, to average net assets of shares did not exceed 0.20%. This expense limitation arrangement cannot be terminated prior to December 31, 2012 without the Board of Trustees’ consent. |
| 13 | Reflects fees forgone and/or expense reimbursements. |
See Notes to Financial Statements.
| | | | |
| Legg Mason Variable Lifestyle Series 2011 Semi-Annual Report | | | 15 | |
Legg Mason Variable Lifestyle Allocation 50%
| | | | | | | | | | | | | | | | | | | | | | | | | | | | |
| For a share of beneficial interest outstanding throughout each year ended December 31, unless otherwise noted: | |
| | | 20111 | | | 2010 | | | 20092 | | | 20093 | | | 20083 | | | 20073,4 | | | 20063,4 | |
| | | | | | | |
| Net asset value, beginning of period | | | $11.60 | | | | $10.45 | | | | $8.06 | | | | $12.04 | | | | $12.61 | | | | $12.00 | | | | $11.71 | |
| | | | | | | |
| Income (loss) from operations: | | | | | | | | | | | | | | | | | | | | | | | | | | | | |
Net investment income | | | 0.11 | | | | 0.34 | | | | 0.43 | 5 | | | 0.46 | 5 | | | 0.47 | 5 | | | 0.35 | 5 | | | 0.28 | 5 |
Net realized and unrealized gain (loss) | | | 0.43 | | | | 1.15 | | | | 2.44 | | | | (3.65) | | | | (0.45) | | | | 0.62 | | | | 0.29 | |
Total income (loss) from operations | | | 0.54 | | | | 1.49 | | | | 2.87 | | | | (3.19) | | | | 0.02 | | | | 0.97 | | | | 0.57 | |
| | | | | | | |
| Less distributions from: | | | | | | | | | | | | | | | | | | | | | | | | | | | | |
Net investment income | | | (0.05) | | | | (0.34) | | | | (0.48) | | | | (0.40) | | | | (0.47) | | | | (0.36) | | | | (0.28) | |
Net realized gains | | | — | | | | — | | | | — | | | | (0.39) | | | | (0.12) | | | | — | | | | — | |
Total distributions | | | (0.05) | | | | (0.34) | | | | (0.48) | | | | (0.79) | | | | (0.59) | | | | (0.36) | | | | (0.28) | |
| | | | | | | |
| Net asset value, end of period | | | $12.09 | | | | $11.60 | | | | $10.45 | | | | $8.06 | | | | $12.04 | | | | $12.61 | | | | $12.00 | |
Total return, based on NAV6 | | | 4.69 | % | | | 14.35 | %7 | | | 35.93 | %7 | | | (27.51) | % | | | (0.01) | % | | | 8.09 | % | | | 4.87 | % |
| | | | | | | |
| Net assets, end of period (000s) | | | $125,059 | | | | $125,315 | | | | $126,294 | | | | $112,415 | | | | $198,862 | | | | $224,930 | | | | $247,470 | |
| | | | | | | |
| Ratios to average net assets: | | | | | | | | | | | | | | | | | | | | | | | | | | | | |
Gross expenses8 | | | 0.12 | %9 | | | 0.13 | % | | | 0.14 | %9 | | | 0.09 | % | | | 0.31 | % | | | 0.37 | %10 | | | 0.35 | % |
Net expenses8,11 | | | 0.12 | 9,12 | | | 0.13 | 12 | | | 0.14 | 9,12 | | | 0.07 | 12,13 | | | 0.31 | 12 | | | 0.37 | 10,13 | | | 0.35 | |
Net investment income | | | 1.92 | 9 | | | 2.89 | | | | 4.66 | 9 | | | 3.96 | | | | 3.53 | | | | 2.69 | | | | 2.24 | |
| | | | | | | |
| Portfolio turnover rate | | | 24 | % | | | 20 | % | | | 11 | % | | | 24 | % | | | 15 | % | | | 96 | % | | | 48 | % |
| 1 | For the six months ended June 30, 2011 (unaudited). |
| 2 | For the period February 1, 2009 through December 31, 2009. |
| 3 | For the year ended January 31. |
| 4 | Represents a share of capital stock outstanding prior to April 30, 2007. |
| 5 | Net investment income per share includes short-term capital gain distributions from Underlying Funds. |
| 6 | Performance figures may reflect compensating balance arrangements, fees forgone and/or expense reimbursements. In the absence of compensating balance arrangements, fees forgone and/or expense reimbursements, the total return would have been lower. Total returns do not reflect expenses associated with separate accounts such as administrative fees, account charges and surrender charges which, if reflected, would reduce the total return for all periods shown. Past performance is no guarantee of future results. Total returns for periods of less than one year are not annualized. |
| 7 | The total return includes gains from settlement of investment litigations. Without these gains, the total return would have been 14.25% and 35.54% for the year ended December 31, 2010 and the period ended December 31, 2009, respectively. |
| 8 | Does not include expenses of the Underlying Funds in which the Portfolio invests. |
| 10 | Included in the expense ratios are certain non-recurring restructuring (and reorganization, if applicable) fees that were incurred by the Portfolio during the period. Without these fees, the gross and net expense ratios would have both been 0.35%. |
| 11 | The impact of compensating balance arrangements, if any, was less than 0.01%. |
| 12 | As a result of expense limitation arrangement, effective December 1, 2007, the ratio of expenses, other than brokerage, interest, taxes, extraordinary expenses and acquired fund fees and expenses, to average net assets of shares did not exceed 0.20%. This expense limitation arrangement cannot be terminated prior to December 31, 2012 without the Board of Trustees’ consent. |
| 13 | Reflects fees forgone and/or expense reimbursements. |
See Notes to Financial Statements.
| | |
| 16 | | Legg Mason Variable Lifestyle Series 2011 Semi-Annual Report |
Notes to financial statements (unaudited)
1. Organization and significant accounting policies
Legg Mason Variable Lifestyle Allocation 85% (“Lifestyle Allocation 85%”), Legg Mason Variable Lifestyle Allocation 70% (“Lifestyle Allocation 70%”) and Legg Mason Variable Lifestyle Allocation 50% (“Lifestyle Allocation 50%”) (the “Portfolios”) are separate non-diversified investment series of Legg Mason Partners Variable Equity Trust (the “Trust”). The Trust, a Maryland statutory trust, is registered under the Investment Company Act of 1940, as amended (the “1940 Act”), as an open-end management investment company. The Portfolios invest in other mutual funds (“Underlying Funds”) which are affiliated with Legg Mason, Inc. (“Legg Mason”). Shares of the Portfolios are offered to separate accounts sponsored by certain life insurance companies and qualified pension and retirement plans, including affiliates of the investment manager.
The following are significant accounting policies consistently followed by the Portfolios and are in conformity with U.S. generally accepted accounting principles (“GAAP”). Estimates and assumptions are required to be made regarding assets, liabilities and changes in net assets resulting from operations when financial statements are prepared. Changes in the economic environment, financial markets and any other parameters used in determining these estimates could cause actual results to differ. Subsequent events have been evaluated through the date the financial statements were issued.
(a) Investment valuation. Investments in the Underlying Funds are valued at the closing net asset value per share of each Underlying Fund on the day of valuation. Equity securities for which market quotations are available are valued at the last reported sales price or official closing price on the primary market or exchange on which they trade. Debt securities are valued at the mean between the last quoted bid and asked prices provided by an independent pricing service that are based on transactions in debt obligations, quotations from bond dealers, market transactions in comparable securities and various other relationships between securities. When reliable prices are not readily available, such as when the value of a security has been significantly affected by events after the close of the exchange or market on which the security is principally traded, but before the Portfolios calculate their net asset value, the Portfolios value these securities as determined in accordance with the procedures approved by the Portfolios’ Board of Trustees. Short-term obligations with maturities of 60 days or less are valued at amortized cost, which approximates fair value.
The Portfolios have adopted Financial Accounting Standards Board Codification Topic 820 (“ASC Topic 820”). ASC Topic 820 establishes a single definition of fair value, creates a three-tier hierarchy as a framework for measuring fair value based on inputs used to value the Portfolios’ investments, and requires additional disclosure about fair value. The hierarchy of inputs is summarized below.
| Ÿ | | Level 1 — quoted prices in active markets for identical investments |
| Ÿ | | Level 2 — other significant observable inputs (including quoted prices for similar investments, interest rates, prepayment speeds, credit risk, etc.) |
| Ÿ | | Level 3 — significant unobservable inputs (including the Portfolios’ own assumptions in determining the fair value of investments) |
The inputs or methodology used for valuing securities are not necessarily an indication of the risk associated with investing in those securities.
The Portfolios use valuation techniques to measure fair value that are consistent with the market approach and/or income approach, depending on the type of security and the particular circumstance. The market approach uses prices and other relevant information generated by market transactions involving identical or comparable securities. The income approach uses valuation techniques to discount estimated future cash flows to present value.
| | | | |
| Legg Mason Variable Lifestyle Series 2011 Semi-Annual Report | | | 17 | |
The following is a summary of the inputs used in valuing the Portfolios’ assets carried at fair value:
Lifestyle Allocation 85%
| | | | | | | | | | | | | | | | |
| ASSETS | |
| Description | | Quoted Prices
(Level 1) | | | Other Significant
Observable Inputs
(Level 2) | | | Significant
Unobservable
Inputs
(Level 3) | | | Total | |
| Investments in underlying funds† | | $ | 108,013,536 | | | | — | | | | — | | | $ | 108,013,536 | |
| Short-term investments† | | | — | | | $ | 49,000 | | | | — | | | | 49,000 | |
| Total investments | | $ | 108,013,536 | | | $ | 49,000 | | | | — | | | $ | 108,062,536 | |
| † | See Schedule of Investments for additional detailed categorizations. |
Lifestyle Allocation 70%
| | | | | | | | | | | | | | | | |
| ASSETS | |
| Description | | Quoted Prices
(Level 1) | | | Other Significant
Observable Inputs
(Level 2) | | | Significant
Unobservable
Inputs
(Level 3) | | | Total | |
| Investments in underlying funds† | | $ | 65,131,534 | | | | — | | | | — | | | $ | 65,131,534 | |
| Short-term investments† | | | — | | | $ | 165,000 | | | | — | | | | 165,000 | |
| Total investments | | $ | 65,131,534 | | | $ | 165,000 | | | | — | | | $ | 65,296,534 | |
| † | See Schedule of Investments for additional detailed categorizations. |
Lifestyle Allocation 50%
| | | | | | | | | | | | | | | | |
| Description | | Quoted Prices
(Level 1) | | | Other Significant
Observable Inputs
(Level 2) | | | Significant
Unobservable
Inputs
(Level 3) | | | Total | |
| Investments in underlying funds† | | $ | 124,895,438 | | | | — | | | | — | | | $ | 124,895,438 | |
| Short-term investments† | | | — | | | $ | 129,000 | | | | — | | | | 129,000 | |
| Total investments | | $ | 124,895,438 | | | $ | 129,000 | | | | — | | | $ | 125,024,438 | |
| † | See Schedule of Investments for additional detailed categorizations. |
(b) Repurchase agreements. The Portfolios may enter into repurchase agreements with institutions that their investment adviser has determined are creditworthy. Each repurchase agreement is recorded at cost. Under the terms of a typical repurchase agreement, the Portfolios acquire a debt security subject to an obligation of the seller to repurchase, and of the Portfolios to resell, the security at an agreed-upon price and time, thereby determining the yield during the Portfolios’ holding period. When entering into repurchase agreements, it is the Portfolios’ policy that their custodian or a third party custodian, acting on the Portfolios’ behalf, take possession of the underlying collateral securities, the market value of which, at all times, at least equals the principal amount of the repurchase transaction, including accrued interest. To the extent that any repurchase transaction maturity exceeds one business day, the value of the collateral is marked-to-market and measured against the value of the agreement in an effort to ensure the adequacy of the collateral. If the counterparty defaults, the Portfolios generally have the right to use the collateral to satisfy the terms of the repurchase transaction. However, if the market value of the collateral declines during the period in which the Portfolios seek to assert their rights or if bankruptcy proceedings are commenced with respect to the seller of the security, realization of the collateral by the Portfolios may be delayed or limited.
(c) Foreign currency translation. Investment securities and other assets and liabilities denominated in foreign currencies are translated into U.S. dollar amounts based upon prevailing exchange rates on the date of valuation. Purchases and sales of investment securities and income and expense items denominated in foreign currencies are translated into U.S. dollar amounts based upon prevailing exchange rates on the respective dates of such transactions.
The Portfolios do not isolate that portion of the results of operations resulting from fluctuations in foreign exchange rates on investments from the fluctuations arising from changes in market prices of securities held. Such fluctuations are included with the net realized and unrealized gain or loss on investments.
| | |
| 18 | | Legg Mason Variable Lifestyle Series 2011 Semi-Annual Report |
Notes to financial statements (unaudited) (cont’d)
Net realized foreign exchange gains or losses arise from sales of foreign currencies, including gains and losses on forward foreign currency contracts, currency gains or losses realized between the trade and settlement dates on securities transactions, and the difference between the amounts of dividends, interest, and foreign withholding taxes recorded on the Portfolios’ books and the U.S. dollar equivalent of the amounts actually received or paid. Net unrealized foreign exchange gains and losses arise from changes in the values of assets and liabilities, other than investments in securities, on the date of valuation, resulting from changes in exchange rates.
Foreign security and currency transactions may involve certain considerations and risks not typically associated with those of U.S. dollar denominated transactions as a result of, among other factors, the possibility of lower levels of governmental supervision and regulation of foreign securities markets and the possibility of political or economic instability.
(d) Security transactions and investment income. Security transactions are accounted for on a trade date basis. Net investment income distributions and short-term capital gain distributions, if any, from the Underlying Funds are recorded on the ex-dividend as investment income. Interest income is recorded on an accrual basis. Long-term capital gain distributions, if any, from the Underlying Funds are recorded on the ex-dividend date as realized gains. The cost of investments sold is determined by use of the specific identification method.
(e) Distributions to shareholders. Distributions from net investment income and distributions of net realized gains, if any, are declared at least annually. Distributions to shareholders of the Portfolios are recorded on the ex-dividend date and are determined in accordance with income tax regulations, which may differ from GAAP.
(f) Compensating balance arrangements. The Portfolios have an arrangement with their custodian bank whereby a portion of the custodian’s fees is paid indirectly by credits earned on the Portfolios’ cash on deposit with the bank.
(g) Federal and other taxes. It is the Portfolios’ policy to comply with the federal income and excise tax requirements of the Internal Revenue Code of 1986 (the “Code”), as amended, applicable to regulated investment companies. Accordingly, the Portfolios intend to distribute their taxable income and net realized gains, if any, to shareholders in accordance with timing requirements imposed by the Code. Therefore, no federal or state income tax provision is required in the Portfolios’ financial statements.
Management has analyzed the Portfolios’ tax positions taken on income tax returns for all open tax years and has concluded that as of June 30, 2011, no provision for income tax would be required in the Portfolios’ financial statements. The Portfolios’ federal and state income and federal excise tax returns for tax years for which the applicable statutes of limitations have not expired are subject to examination by Internal Revenue Service and state departments of revenue.
(h) Reclassification. GAAP requires that certain components of net assets be reclassified to reflect permanent differences between financial and tax reporting. These reclassifications have no effect on net assets or net asset value per share.
2. Investment management agreement and other transactions with affiliates
Legg Mason Partners Fund Advisor, LLC (“LMPFA”) is each Portfolio’s investment manager and Legg Mason Global Asset Allocation, LLC (“LMGAA”) is each Portfolio’s subadviser. Western Asset Management Company (“Western Asset”) manages each Portfolio’s cash and short-term instruments. LMPFA, LMGAA and Western Asset are wholly-owned subsidiaries of Legg Mason. The Portfolios do not pay a management fee or subadviser fee.
The Portfolios bear all expenses incurred in their operations, subject to LMPFA’s agreement to forgo fees and/or reimburse expenses incurred directly by the Portfolios, such that each Portfolio’s total annual operating expenses (other than brokerage, taxes, extraordinary expenses and Underlying Funds’ fees and expenses), are not expected to exceed 0.20% of each Portfolios’ average daily net assets. The manager is
| | | | |
| Legg Mason Variable Lifestyle Series 2011 Semi-Annual Report | | | 19 | |
also permitted to recapture amounts forgone or reimbursed to the Portfolio during the same fiscal year if the Portfolio’s total annual operating expenses have fallen to a level below the limit described above. In no case will the manager recapture any amount that would result, on any particular business day of the Portfolio, in the Portfolio’s total annual operating expenses exceeding this limit or any other lower limit then in effect. These expense limitation agreements cannot be terminated prior to December 31, 2012 without the Board of Trustees’ consent.
LMPFA provides administrative and certain oversight services to the Portfolios. LMPFA delegates to the subadviser the day-to-day portfolio management of the Portfolios, except, in certain cases, for the management of cash and short-term instruments, which is provided by Western Asset.
In addition, the Portfolios indirectly pay management and/or administration fees to LMPFA and other wholly-owned subsidiaries of Legg Mason as a shareholder in the Underlying Funds. These management and administration fees ranged from 0.20% to 1.00% of the average daily net assets of the Underlying Funds.
Legg Mason Investor Services, LLC, a wholly-owned broker-dealer subsidiary of Legg Mason, serves as the Portfolios’ sole and exclusive distributor.
All officers and one Trustee of the Trust are employees of Legg Mason or its affiliates and do not receive compensation from the Trust.
3. Investments
For the six months ended June 30, 2011, the aggregate cost of purchases and proceeds from sales of investments (excluding short-term investments) were as follows:
| | | | | | | | |
| | | Purchases | | | Sales | |
| Lifestyle Allocation 85% | | $ | 28,121,293 | | | $ | 29,351,822 | |
| Lifestyle Allocation 70% | | | 14,069,136 | | | | 21,990,891 | |
| Lifestyle Allocation 50% | | | 29,843,608 | | | | 34,731,241 | |
At June 30, 2011, the aggregate gross unrealized appreciation and depreciation of investments for federal income tax purposes were substantially as follows:
| | | | | | | | | | | | |
| | | Gross
Unrealized
Appreciation | | | Gross
Unrealized
Depreciation | | | Net
Unrealized
Appreciation | |
| Lifestyle Allocation 85% | | $ | 14,730,446 | | | $ | (950,882) | | | $ | 13,779,564 | |
| Lifestyle Allocation 70% | | | 8,217,276 | | | | (50,141) | | | | 8,167,135 | |
| Lifestyle Allocation 50% | | | 14,810,982 | | | | (190,356) | | | | 14,620,626 | |
4. Derivative instruments and hedging activities
Financial Accounting Standards Board Codification Topic 815 requires enhanced disclosure about an entity’s derivative and hedging activities.
During the six months ended June 30, 2011, the Portfolios did not invest in any derivative instruments.
5. Shares of beneficial interest
At June 30, 2011, the Trust had an unlimited number of shares of beneficial interest authorized with a par value of $0.00001 per share.
| | |
| 20 | | Legg Mason Variable Lifestyle Series 2011 Semi-Annual Report |
Notes to financial statements (unaudited) (cont’d)
Transactions in shares of the Portfolios were as follows:
| | | | | | | | |
| | | Six Months Ended
June 30, 2011 | | | Year Ended
December 31, 2010 | |
| | |
| Lifestyle Allocation 85% | | | | | | | | |
| Shares sold | | | 353,600 | | | | 852,068 | |
| Shares issued on reinvestment | | | 28,226 | | | | 131,956 | |
| Shares repurchased | | | (485,735) | | | | (826,168) | |
| Net increase (decrease) | | | (103,909) | | | | 157,856 | |
| | |
| Lifestyle Allocation 70% | | | | | | | | |
| Shares sold | | | 19,545 | | | | 45,561 | |
| Shares issued on reinvestment | | | 36,463 | | | | 134,735 | |
| Shares repurchased | | | (746,646) | | | | (1,221,922) | |
| Net decrease | | | (690,638) | | | | (1,041,626) | |
| | |
| Lifestyle Allocation 50% | | | | | | | | |
| Shares sold | | | 572,623 | | | | 598,092 | |
| Shares issued on reinvestment | | | 46,180 | | | | 319,816 | |
| Shares repurchased | | | (1,082,900) | | | | (2,195,384) | |
| Net decrease | | | (464,097) | | | | (1,277,476) | |
6. Paid-in-kind redemptions
During the six months ended June 30, 2011, the Portfolios received securities in lieu of cash proceeds from one of their Underlying Funds, the Legg Mason ClearBridge Fundamental All Cap Value Fund, to satisfy redemptions. Subsequently, the securities were sold. The realized gains and losses and currency gains and losses from these securities sold are noted in the statements of operations.
7. Capital loss carryforward
As of December 31, 2010, Lifestyle Allocation 85% had a net capital loss carryforward of approximately $18,309,421, of which $12,312,804 expires in 2011, $3,119,343 expires in 2012, $1,280,698 expires in 2013, $1,217,675 expires in 2017 and $378,901, expires in 2018. Lifestyle Allocation 70% had a net capital loss carryforward of approximately $34,340,014, of which $12,404,012 expires in 2011, $10,439,486 expires in 2012, $3,049,716 expires in 2013, $1,548,306, expires in 2016, $4,794,598 expires in 2017, and $2,103,896 expires in 2018. Lifestyle Allocation 50% had a net capital loss carryforward of approximately $21,944,141, of which $6,640,552 expires in 2016, $12,981,017 expires in 2017, and $2,322,572 expires in 2018. These amounts will be available to offset any future taxable capital gains.
Under the recently enacted Regulated Investment Company Modernization Act of 2010, the Fund will be permitted to carry forward capital losses incurred in taxable years beginning after December 22, 2010 for an unlimited period. However, any losses incurred during those future years will be required to be utilized prior to the losses incurred in pre-enactment taxable years. As a result of this ordering rule, pre-enactment capital loss carryforwards may be more likely to expire unused. Additionally, post-enactment capital losses that are carried forward will retain their character as either short-term or long-term capital losses rather than being considered all short-term as under previous law.
8. Legal matters
Beginning in May 2004, class action lawsuits alleging violations of the federal securities laws were filed against Citigroup Global Markets Inc. (“CGM”), a former distributor of the Portfolios, and other affiliated funds (collectively, the “Funds”) and a number of its then affiliates, including Smith Barney Fund Management LLC (“SBFM”), and Salomon Brothers Asset Management Inc. (“SBAM”), which were then investment adviser or manager to certain of the Funds (the “Managers”), substantially all of the mutual funds then managed by the Managers (the “Defendant Funds”), and Board members of the Defendant Funds (collectively, the “Defendants”). The complaints alleged, among other things, that CGM created various undisclosed incentives for its brokers to sell Smith Barney and Salomon Brothers funds. In addition, according to the complaints, the Managers caused the Defendant Funds to pay excessive brokerage
| | | | |
| Legg Mason Variable Lifestyle Series 2011 Semi-Annual Report | | | 21 | |
commissions to CGM for steering clients towards proprietary funds. The complaints also alleged that the Defendants breached their fiduciary duty to the Defendant Funds by improperly charging Rule 12b-1 fees and by drawing on fund assets to make undisclosed payments of soft dollars and excessive brokerage commissions. The complaints also alleged that the Defendant Funds failed to adequately disclose certain of the allegedly wrongful conduct. The complaints sought injunctive relief and compensatory and punitive damages, rescission of the Defendant Funds’ contracts with the Managers, recovery of all fees paid to the Managers pursuant to such contracts and an award of attorneys’ fees and litigation expenses.
On December 15, 2004, a consolidated amended complaint (the “Complaint”) was filed alleging substantially similar causes of action. On May 27, 2005, all of the Defendants filed motions to dismiss the Complaint. On July 26, 2006, the court issued a decision and order (1) finding that plaintiffs lacked standing to sue on behalf of the shareholders of the Funds in which none of the plaintiffs had invested and dismissing those Funds from the case (although stating that they could be brought back into the case if standing as to them could be established), and (2) other than one stayed claim, dismissing all of the causes of action against the remaining Defendants, with prejudice, except for the cause of action under Section 36(b) of the 1940 Act, which the court granted plaintiffs leave to replead as a derivative claim.
On October 16, 2006, plaintiffs filed their Second Consolidated Amended Complaint (“Second Amended Complaint”) which alleges derivative claims on behalf of nine funds identified in the Second Amended Complaint, under Section 36(b) of the 1940 Act, against Citigroup Asset Management, SBAM and SBFM as investment advisers to the identified funds, as well as CGM as a distributor for the identified funds (collectively, the “Second Amended Complaint Defendants”). The Portfolios were not identified in the Second Amended Complaint. The Second Amended Complaint alleges no claims against any of the funds or any of their Board Members. Under Section 36(b), the Second Amended Complaint alleges similar facts and seeks similar relief against the Second Amended Complaint Defendants as the Complaint.
On December 3, 2007, the court granted the Defendants’ motion to dismiss, with prejudice. On January 2, 2008, the plaintiffs filed a notice of appeal to the Second Circuit Court of Appeals. The appeal was fully briefed and oral argument before the U.S. Court of Appeals for the Second Circuit took place on March 5, 2009. On June 9, 2011, the Court of Appeals issued a Summary Order affirming the District Court’s dismissal of all claims with the exception of Plaintiffs’ Section 36(b) claim as it relates to Transfer Agent fees paid to an affiliate of the Managers. The case has been remanded to the District Court for further proceedings in accordance with the Summary Order.
Additional lawsuits arising out of these circumstances and presenting similar allegations and requests for relief may be filed in the future.
9. Other tax information
On December 22, 2010, President Obama signed into law the Regulated Investment Company Modernization Act of 2010 (the “Act”). The Act updates certain tax rules applicable to regulated investment companies (“RICs”). The various provisions of the Act will generally be effective for RICs with taxable years beginning after December 22, 2010. Additional information regarding the impact of the Act on the Portfolios, if any, will be contained within the relevant sections of the notes to the financial statements for the fiscal year ending December 31, 2011.
| | |
| 22 | | Legg Mason Variable Lifestyle Series |
Board approval of management and sub-advisory agreements (unaudited)
Legg Mason Variable Lifestyle Allocation 85%
At a meeting of the Trust’s Board of Trustees, the Board considered the re-approval for an annual period of the management agreement of Legg Mason Variable Lifestyle Allocation 85% (the “Fund”), pursuant to which Legg Mason Partners Fund Advisor, LLC (the “Manager”) provides the Fund with investment advisory and administrative services, and the sub-advisory agreement, pursuant to which Legg Mason Global Asset Allocation, LLC (“LMGAA”) provides day-to-day management of the Fund’s portfolio. At a subsequent meeting of the Trust’s Board of Trustees, the Board also considered the approval for an annual period of a sub-advisory agreement pursuant to which Western Asset Management Company (“Western Asset” and, together with LMGAA, the “Sub-Advisers”) provides day-to-day management of the Fund’s cash and short-term instruments. (The management agreement and sub-advisory agreements are collectively referred to as the “Agreements.”) The Manager and the Sub-Advisers are wholly-owned subsidiaries of Legg Mason, Inc. The Trustees who are not “interested persons” (as defined in the Investment Company Act of 1940, as amended (the “Independent Trustees”)) of the Fund were assisted in their review by Fund counsel and independent legal counsel and met with independent legal counsel in executive sessions separate from representatives of the Manager and the Sub-Advisers. The Independent Trustees requested and received information from the Manager and the Sub-Advisers they deemed reasonably necessary for their review of the Agreements and the performance of the Manager and the Sub-Advisers. Included was information about the Manager, the Sub-Advisers and the Fund’s distributor, as well as the management, sub-advisory and distribution arrangements for the Fund and other funds overseen by the Board. This information was initially reviewed by a special committee of the Independent Trustees and then by the full Board.
In voting to approve the Agreements, the Independent Trustees considered whether the approval of the Agreements would be in the best interests of the Fund and its shareholders, an evaluation based on several factors including those discussed below.
Nature, extent and quality of the services provided to the fund under the management agreement and sub-advisory agreements
The Board received and considered information regarding the nature, extent and quality of services provided to the Fund by the Manager and the Sub-Advisers under the Management Agreement and Sub-Advisory Agreements, respectively. The Trustees also considered the Manager’s supervisory activities over the Sub-Advisers. In addition, the Independent Trustees received and considered other information regarding the administrative and other services rendered to the Fund and its shareholders by the Manager. The Board noted information received at regular meetings throughout the year related to the services rendered by the Manager in its management of the Fund’s affairs, and the Manager’s role in coordinating the activities of the Sub-Advisers and the Fund’s other service providers. The Board noted that the same portfolio management team that previously provided management of the Fund’s cash and short-term instruments as dual employees of the Manager now provided such management services as employees of Western Asset. The Board’s evaluation of the services provided by the Manager and the Sub-Advisers took into account the Board’s knowledge and familiarity gained as Trustees of funds in the Legg Mason fund complex, including the scope and quality of the investment management and other capabilities of the Manager and the Sub-Advisers and the quality of the Manager’s administrative and other services. The Board observed that the scope of services provided by the Manager had expanded over time as a result of regulatory and other developments, including maintaining and monitoring its own and the Fund’s compliance programs. The Board reviewed information received from the Manager and the Fund’s Chief Compliance Officer regarding the Fund’s compliance policies and procedures established pursuant to Rule 38a-1 under the Investment Company Act of 1940, as amended.
The Board reviewed the qualifications, backgrounds and responsibilities of the Fund’s senior personnel and the portfolio management team primarily responsible for the day-to-day portfolio management of the Fund. The Board considered the degree to which the Manager implemented organizational changes to improve investment results and the services provided to the Legg Mason fund complex. The Board also considered, based on its knowledge of the Manager and the Manager’s affiliates, the financial resources available to the Manager’s parent organization, Legg Mason, Inc.
| | | | |
| Legg Mason Variable Lifestyle Series | | | 23 | |
The Board also considered the division of responsibilities among the Manager and the Sub-Advisers and the oversight provided by the Manager. The Board also considered the Manager’s brokerage policies and practices, the standards applied in seeking best execution, the Manager’s policies and practices regarding soft dollars, and the existence of quality controls applicable to brokerage allocation procedures. In addition, management also reported to the Board on, among other things, its business plans, recent organizational changes, portfolio manager compensation plan and policy regarding portfolio managers’ ownership of fund shares.
The Board concluded that, overall, it was satisfied with the nature, extent and quality of services provided (and expected to be provided) under the respective Agreement by the Manager and the Sub-Advisers.
Fund performance
The Board received and reviewed performance information for the Fund and for all mixed-asset target allocation growth funds underlying variable insurance products (the “Performance Universe”) selected by Lipper, Inc. (“Lipper”), an independent provider of investment company data. The Board was provided with a description of the methodology Lipper used to determine the similarity of the Fund with the funds included in the Performance Universe. The Trustees noted that they also had received and discussed with management information at periodic intervals comparing the Fund’s performance to that of its benchmark index. The information comparing the Fund’s performance to that of the Performance Universe was for the one-, three-, five- and ten-year periods ended June 30, 2010. The Fund performed better than the median for the one-year period, but below the median for the three-, five- and ten-year periods. The Board also reviewed performance information provided by the Manager for periods ended September 30, 2010, which showed that the Fund’s performance was better than the Lipper category average during the third quarter. The Trustees then discussed with representatives of management the portfolio management strategy of the Fund’s portfolio managers. The Trustees noted that the Manager and LMGAA were committed to providing the resources necessary to assist the Fund’s portfolio managers and improve Fund performance. Based on its review, the Board generally was satisfied with the Fund’s recent performance and management’s efforts to continue to improve performance going forward. The Board determined to continue to evaluate the Fund’s performance and directed the Independent Trustees’ performance committee to continue to periodically review Fund performance with the Manager and report to the full Board during periods between Board meetings.
Expense ratios
The Board noted that the Fund bears indirectly its pro rata share of the expenses of the underlying funds in which it invests, including management fees payable by such underlying funds to the Manager or its affiliates. The Board noted that there is no management fee payable by the Fund to the Manager.
The Board received an analysis of complex-wide management fees provided by the Manager, which, among other things, set out a framework of fees based on asset classes. Management also discussed with the Board the Fund’s distribution arrangements, including how amounts received by the Fund’s distributor are expended, and the fees received and expenses incurred in connection with such arrangements by affiliates of the Manager.
Additionally, the Board received and considered information comparing the Fund’s overall expense ratio with those of a group of actively managed affiliated funds of funds underlying variable insurance products consisting of four mixed-asset target allocation growth funds and one mixed-asset target allocation moderate fund selected by Lipper as comparable to the Fund (the “Expense Group”), and a broader group of funds selected by Lipper consisting of all actively managed affiliated mixed-asset target allocation growth and mixed-asset target allocation moderate funds of funds underlying variable insurance products (the “Expense Universe”). This information showed that the Fund’s actual total expense ratio was higher than the median of the total expense ratios of the funds in the Expense Group and higher than the average total expense ratio of the funds in the Expense Universe.
| | |
| 24 | | Legg Mason Variable Lifestyle Series |
Board approval of management and sub-advisory agreements (unaudited) (cont’d)
Manager profitability
The Board received and considered a profitability analysis of the Manager and its affiliates in providing services to the Fund. The Board also received profitability information with respect to the Legg Mason fund complex as a whole. In addition, the Board received information with respect to the Manager’s allocation methodologies used in preparing this profitability data as well as a report from an outside consultant that had reviewed the Manager’s methodology. The Board also noted the profitability percentage ranges determined by appropriate court cases to be reasonable given the services rendered to investment companies. The Board determined that the Manager’s profitability was not excessive in light of the nature, extent and quality of the services provided to the Fund.
Economies of scale
The Board received and considered information regarding whether there have been economies of scale with respect to the management of the Fund as the Fund’s assets grow, whether the Fund has appropriately benefited from any economies of scale, and whether there is potential for realization of any further economies of scale. The Board considered whether economies of scale in the provision of services to the Fund were being passed along to the shareholders.
The Board noted that to the extent the Fund’s assets increase over time, the Fund and its shareholders should realize economies of scale as certain expenses, such as fixed fund fees, become a smaller percentage of overall assets. The Board noted that it appeared that the benefits of any economies of scale also would be appropriately shared with shareholders through increased investment in fund management and administration resources.
Taking all of the above into consideration, the Board determined that the Fund’s expense ratio was reasonable in light of the comparative performance and expense information and the nature, extent and quality of the services provided to the Fund under the Agreements.
Other benefits to the manager
The Board considered other benefits received by the Manager and its affiliates, including the Sub-Advisers, as a result of the Manager’s relationship with the Fund, including the opportunity to offer additional products and services to Fund shareholders.
In light of the costs of providing investment management and other services to the Fund and the Manager’s ongoing commitment to the Fund, the profits and other ancillary benefits that the Manager and its affiliates received were considered reasonable.
Based on their discussions and considerations, including those described above, the Trustees approved the Management Agreement and the Sub-Advisory Agreements to continue for another year.
No single factor reviewed by the Board was identified by the Board as the principal factor in determining whether to approve the Management Agreement and the Sub-Advisory Agreements.
| | | | |
| Legg Mason Variable Lifestyle Series | | | 25 | |
Legg Mason Variable Lifestyle Allocation 70%
At a meeting of the Trust’s Board of Trustees, the Board considered the re-approval for an annual period of the management agreement of Legg Mason Variable Lifestyle Allocation 70% (the “Fund”), pursuant to which Legg Mason Partners Fund Advisor, LLC (the “Manager”) provides the Fund with investment advisory and administrative services, and the sub-advisory agreement, pursuant to which Legg Mason Global Asset Allocation, LLC (“LMGAA”) provides day-to-day management of the Fund’s portfolio. At a subsequent meeting of the Trust’s Board of Trustees, the Board also considered the approval for an annual period of a sub-advisory agreement pursuant to which Western Asset Management Company (“Western Asset” and, together with LMGAA, the “Sub-Advisers”) provides day-to-day management of the Fund’s cash and short-term instruments. (The management agreement and sub-advisory agreements are collectively referred to as the “Agreements.”) The Manager and the Sub-Advisers are wholly-owned subsidiaries of Legg Mason, Inc. The Trustees who are not “interested persons” (as defined in the Investment Company Act of 1940, as amended (the “Independent Trustees”)) of the Fund were assisted in their review by Fund counsel and independent legal counsel and met with independent legal counsel in executive sessions separate from representatives of the Manager and the Sub-Advisers. The Independent Trustees requested and received information from the Manager and the Sub-Advisers they deemed reasonably necessary for their review of the Agreements and the performance of the Manager and the Sub-Advisers. Included was information about the Manager, the Sub-Advisers and the Fund’s distributor, as well as the management, sub-advisory and distribution arrangements for the Fund and other funds overseen by the Board. This information was initially reviewed by a special committee of the Independent Trustees and then by the full Board.
In voting to approve the Agreements, the Independent Trustees considered whether the approval of the Agreements would be in the best interests of the Fund and its shareholders, an evaluation based on several factors including those discussed below.
Nature, extent and quality of the services provided to the fund under the management agreement and sub-advisory agreements
The Board received and considered information regarding the nature, extent and quality of services provided to the Fund by the Manager and the Sub-Advisers under the Management Agreement and Sub-Advisory Agreements, respectively. The Trustees also considered the Manager’s supervisory activities over the Sub-Advisers. In addition, the Independent Trustees received and considered other information regarding the administrative and other services rendered to the Fund and its shareholders by the Manager. The Board noted information received at regular meetings throughout the year related to the services rendered by the Manager in its management of the Fund’s affairs, and the Manager’s role in coordinating the activities of the Sub-Advisers and the Fund’s other service providers. The Board noted that the same portfolio management team that previously provided management of the Fund’s cash and short-term instruments as dual employees of the Manager now provided such management services as employees of Western Asset. The Board’s evaluation of the services provided by the Manager and the Sub-Advisers took into account the Board’s knowledge and familiarity gained as Trustees of funds in the Legg Mason fund complex, including the scope and quality of the investment management and other capabilities of the Manager and the Sub-Advisers and the quality of the Manager’s administrative and other services. The Board observed that the scope of services provided by the Manager had expanded over time as a result of regulatory and other developments, including maintaining and monitoring its own and the Fund’s compliance programs. The Board reviewed information received from the Manager and the Fund’s Chief Compliance Officer regarding the Fund’s compliance policies and procedures established pursuant to Rule 38a-1 under the Investment Company Act of 1940, as amended.
The Board reviewed the qualifications, backgrounds and responsibilities of the Fund’s senior personnel and the portfolio management team primarily responsible for the day-to-day portfolio management of the Fund. The Board considered the degree to which the Manager implemented organizational changes to improve investment results and the services provided to the Legg Mason fund complex. The Board also considered, based on its knowledge of the Manager and the Manager’s affiliates, the financial resources available to the Manager’s parent organization, Legg Mason, Inc.
| | |
| 26 | | Legg Mason Variable Lifestyle Series |
Board approval of management and sub-advisory agreements (unaudited) (cont’d)
The Board also considered the division of responsibilities among the Manager and the Sub-Advisers and the oversight provided by the Manager. The Board also considered the Manager’s brokerage policies and practices, the standards applied in seeking best execution, the Manager’s policies and practices regarding soft dollars, and the existence of quality controls applicable to brokerage allocation procedures. In addition, management also reported to the Board on, among other things, its business plans, recent organizational changes, portfolio manager compensation plan and policy regarding portfolio managers’ ownership of fund shares.
The Board concluded that, overall, it was satisfied with the nature, extent and quality of services provided (and expected to be provided) under the respective Agreement by the Manager and the Sub-Advisers.
Fund performance
The Board received and reviewed performance information for the Fund and for all mixed-asset target allocation growth funds underlying variable insurance products (the “Performance Universe”) selected by Lipper, Inc. (“Lipper”), an independent provider of investment company data. The Board was provided with a description of the methodology Lipper used to determine the similarity of the Fund with the funds included in the Performance Universe. The Trustees noted that they also had received and discussed with management information at periodic intervals comparing the Fund’s performance to that of its benchmark index. The information comparing the Fund’s performance to that of the Performance Universe was for the one-, three-, five- and ten-year periods ended June 30, 2010. The Fund performed better than the median for the one- and three-year periods, but below the median for the five- and ten-year periods. The Board also reviewed performance information provided by the Manager for periods ended September 30, 2010, which showed that the Fund’s performance was better than the Lipper category average during the third quarter. The Trustees then discussed with representatives of management the portfolio management strategy of the Fund’s portfolio managers. The Trustees noted that the Manager and LMGAA were committed to providing the resources necessary to assist the Fund’s portfolio managers and continue to improve Fund performance. Based on its review, the Board generally was satisfied with the Fund’s performance and management’s efforts to continue to improve performance going forward. The Board determined to continue to evaluate the Fund’s performance and directed the Independent Trustees’ performance committee to continue to periodically review Fund performance with the Manager and report to the full Board during periods between Board meetings.
Expense ratios
The Board noted that the Fund bears indirectly its pro rata share of the expenses of the underlying funds in which it invests, including management fees payable by such underlying funds to the Manager or its affiliates. The Board noted that there is no management fee payable by the Fund to the Manager.
The Board received an analysis of complex-wide management fees provided by the Manager, which, among other things, set out a framework of fees based on asset classes. Management also discussed with the Board the Fund’s distribution arrangements, including how amounts received by the Fund’s distributor are expended, and the fees received and expenses incurred in connection with such arrangements by affiliates of the Manager.
Additionally, the Board received and considered information comparing the Fund’s overall expense ratio with those of a group of actively managed affiliated funds of funds underlying variable insurance products consisting of four mixed-asset target allocation growth funds and one mixed-asset target allocation moderate fund selected by Lipper as comparable to the Fund (the “Expense Group”), and a broader group of funds selected by Lipper consisting of all actively managed affiliated mixed-asset target allocation growth and mixed-asset target allocation moderate funds of funds underlying variable insurance products (the “Expense Universe”). This information showed that the Fund’s actual total expense ratio was slightly higher than the total expense ratios of the funds in the Expense Group and slightly higher than the average total expense ratio of the funds in the Expense Universe.
| | | | |
| Legg Mason Variable Lifestyle Series | | | 27 | |
Manager profitability
The Board received and considered a profitability analysis of the Manager and its affiliates in providing services to the Fund. The Board also received profitability information with respect to the Legg Mason fund complex as a whole. In addition, the Board received information with respect to the Manager’s allocation methodologies used in preparing this profitability data as well as a report from an outside consultant that had reviewed the Manager’s methodology. The Board also noted the profitability percentage ranges determined by appropriate court cases to be reasonable given the services rendered to investment companies. The Board determined that the Manager’s profitability was not excessive in light of the nature, extent and quality of the services provided to the Fund.
Economies of scale
The Board received and considered information regarding whether there have been economies of scale with respect to the management of the Fund as the Fund’s assets grow, whether the Fund has appropriately benefited from any economies of scale, and whether there is potential for realization of any further economies of scale. The Board considered whether economies of scale in the provision of services to the Fund were being passed along to the shareholders.
The Board noted that to the extent the Fund’s assets increase over time, the Fund and its shareholders should realize economies of scale as certain expenses, such as fixed fund fees, become a smaller percentage of overall assets. The Board noted that it appeared that the benefits of any economies of scale also would be appropriately shared with shareholders through increased investment in fund management and administration resources.
Taking all of the above into consideration, the Board determined that the Fund’s expense ratio was reasonable in light of the comparative performance and expense information and the nature, extent and quality of the services provided to the Fund under the Agreements.
Other benefits to the manager
The Board considered other benefits received by the Manager and its affiliates, including the Sub-Advisers, as a result of the Manager’s relationship with the Fund, including the opportunity to offer additional products and services to Fund shareholders.
In light of the costs of providing investment management and other services to the Fund and the Manager’s ongoing commitment to the Fund, the profits and other ancillary benefits that the Manager and its affiliates received were considered reasonable.
Based on their discussions and considerations, including those described above, the Trustees approved the Management Agreement and the Sub-Advisory Agreements to continue for another year.
No single factor reviewed by the Board was identified by the Board as the principal factor in determining whether to approve the Management Agreement and the Sub-Advisory Agreements.
| | |
| 28 | | Legg Mason Variable Lifestyle Series |
Board approval of management and sub-advisory agreements (unaudited) (cont’d)
Legg Mason Variable Lifestyle Allocation 50%
At a meeting of the Trust’s Board of Trustees, the Board considered the re-approval for an annual period of the management agreement of Legg Mason Variable Lifestyle Allocation 50% (the “Fund”), pursuant to which Legg Mason Partners Fund Advisor, LLC (the “Manager”) provides the Fund with investment advisory and administrative services, and the sub-advisory agreement, pursuant to which Legg Mason Global Asset Allocation, LLC (“LMGAA”) provides day-to-day management of the Fund’s portfolio. At a subsequent meeting of the Trust’s Board of Trustees, the Board also considered the approval for an annual period of a sub-advisory agreement pursuant to which Western Asset Management Company (“Western Asset” and, together with LMGAA, the “Sub-Advisers”) provides day-to-day management of the Fund’s cash and short-term instruments. (The management agreement and sub-advisory agreements are collectively referred to as the “Agreements.”) The Manager and the Sub-Advisers are wholly-owned subsidiaries of Legg Mason, Inc. The Trustees who are not “interested persons” (as defined in the Investment Company Act of 1940, as amended (the “Independent Trustees”)) of the Fund were assisted in their review by Fund counsel and independent legal counsel and met with independent legal counsel in executive sessions separate from representatives of the Manager and the Sub-Advisers. The Independent Trustees requested and received information from the Manager and the Sub-Advisers they deemed reasonably necessary for their review of the Agreements and the performance of the Manager and the Sub-Advisers. Included was information about the Manager, the Sub-Advisers and the Fund’s distributor, as well as the management, sub-advisory and distribution arrangements for the Fund and other funds overseen by the Board. This information was initially reviewed by a special committee of the Independent Trustees and then by the full Board.
In voting to approve the Agreements, the Independent Trustees considered whether the approval of the Agreements would be in the best interests of the Fund and its shareholders, an evaluation based on several factors including those discussed below.
Nature, extent and quality of the services provided to the fund under the management agreement and sub-advisory agreements
The Board received and considered information regarding the nature, extent and quality of services provided to the Fund by the Manager and the Sub-Advisers under the Management Agreement and Sub-Advisory Agreements, respectively. The Trustees also considered the Manager’s supervisory activities over the Sub-Advisers. In addition, the Independent Trustees received and considered other information regarding the administrative and other services rendered to the Fund and its shareholders by the Manager. The Board noted information received at regular meetings throughout the year related to the services rendered by the Manager in its management of the Fund’s affairs, and the Manager’s role in coordinating the activities of the Sub-Advisers and the Fund’s other service providers. The Board noted that the same portfolio management team that previously provided management of the Fund’s cash and short-term instruments as dual employees of the Manager now provided such management services as employees of Western Asset. The Board’s evaluation of the services provided by the Manager and the Sub-Advisers took into account the Board’s knowledge and familiarity gained as Trustees of funds in the Legg Mason fund complex, including the scope and quality of the investment management and other capabilities of the Manager and the Sub-Advisers and the quality of the Manager’s administrative and other services. The Board observed that the scope of services provided by the Manager had expanded over time as a result of regulatory and other developments, including maintaining and monitoring its own and the Fund’s compliance programs. The Board reviewed information received from the Manager and the Fund’s Chief Compliance Officer regarding the Fund’s compliance policies and procedures established pursuant to Rule 38a-1 under the Investment Company Act of 1940, as amended.
The Board reviewed the qualifications, backgrounds and responsibilities of the Fund’s senior personnel and the portfolio management team primarily responsible for the day-to-day portfolio management of the Fund. The Board considered the degree to which the Manager implemented organizational changes to improve investment results and the services provided to the Legg Mason fund complex. The Board also considered, based on its knowledge of the Manager and the Manager’s affiliates, the financial resources available to the Manager’s parent organization, Legg Mason, Inc.
| | | | |
| Legg Mason Variable Lifestyle Series | | | 29 | |
The Board also considered the division of responsibilities among the Manager and the Sub-Advisers and the oversight provided by the Manager. The Board also considered the Manager’s brokerage policies and practices, the standards applied in seeking best execution, the Manager’s policies and practices regarding soft dollars, and the existence of quality controls applicable to brokerage allocation procedures. In addition, management also reported to the Board on, among other things, its business plans, recent organizational changes, portfolio manager compensation plan and policy regarding portfolio managers’ ownership of fund shares.
The Board concluded that, overall, it was satisfied with the nature, extent and quality of services provided (and expected to be provided) under the respective Agreement by the Manager and the Sub-Advisers.
Fund performance
The Board received and reviewed performance information for the Fund and for all mixed-asset target allocation moderate funds underlying variable insurance products (the “Performance Universe”) selected by Lipper, Inc. (“Lipper”), an independent provider of investment company data. The Board was provided with a description of the methodology Lipper used to determine the similarity of the Fund with the funds included in the Performance Universe. The Trustees noted that they also had received and discussed with management information at periodic intervals comparing the Fund’s performance to that of its benchmark index. The information comparing the Fund’s performance to that of the Performance Universe was for the one-, three-, five- and ten-year periods ended June 30, 2010. The Fund performed better than the median for the one-, three- and ten-year periods, but below the median for the five-year period. The Board also reviewed performance information provided by the Manager for periods ended September 30, 2010, which showed that the Fund’s performance was better than the Lipper category average during the third quarter. The Trustees then discussed with representatives of management the portfolio management strategy of the Fund’s portfolio managers. The Trustees noted that the Manager and LMGAA were committed to providing the resources necessary to assist the Fund’s portfolio managers and continue to improve Fund performance. Based on its review, the Board generally was satisfied with the Fund’s performance and management’s efforts to continue to improve performance going forward. The Board determined to continue to evaluate the Fund’s performance and directed the Independent Trustees’ performance committee to continue to periodically review Fund performance with the Manager and report to the full Board during periods between Board meetings.
Expense ratios
The Board noted that the Fund bears indirectly its pro rata share of the expenses of the underlying funds in which it invests, including management fees payable by such underlying funds to the Manager or its affiliates. The Board noted that there is no management fee payable by the Fund to the Manager.
The Board received an analysis of complex-wide management fees provided by the Manager, which, among other things, set out a framework of fees based on asset classes. Management also discussed with the Board the Fund’s distribution arrangements, including how amounts received by the Fund’s distributor are expended, and the fees received and expenses incurred in connection with such arrangements by affiliates of the Manager.
Additionally, the Board received and considered information comparing the Fund’s overall expense ratio with those of a group of actively managed affiliated funds of funds underlying variable insurance products consisting of three mixed-asset target allocation moderate funds and two mixed-asset target allocation growth funds selected by Lipper as comparable to the Fund (the “Expense Group”), and a broader group of funds selected by Lipper consisting of all actively managed affiliated mixed-asset target allocation moderate and mixed-asset target allocation growth funds of funds underlying variable insurance products (the “Expense Universe”). This information showed that the Fund’s actual total expense ratio was lower than the median of the total expense ratios of the funds in the Expense Group and lower than the average total expense ratio of the funds in the Expense Universe.
| | |
| 30 | | Legg Mason Variable Lifestyle Series |
Board approval of management and sub-advisory agreements (unaudited) (cont’d)
Manager profitability
The Board received and considered a profitability analysis of the Manager and its affiliates in providing services to the Fund. The Board also received profitability information with respect to the Legg Mason fund complex as a whole. In addition, the Board received information with respect to the Manager’s allocation methodologies used in preparing this profitability data as well as a report from an outside consultant that had reviewed the Manager’s methodology. The Board also noted the profitability percentage ranges determined by appropriate court cases to be reasonable given the services rendered to investment companies. The Board determined that the Manager’s profitability was not excessive in light of the nature, extent and quality of the services provided to the Fund.
Economies of scale
The Board received and considered information regarding whether there have been economies of scale with respect to the management of the Fund as the Fund’s assets grow, whether the Fund has appropriately benefited from any economies of scale, and whether there is potential for realization of any further economies of scale. The Board considered whether economies of scale in the provision of services to the Fund were being passed along to the shareholders.
The Board noted that to the extent the Fund’s assets increase over time, the Fund and its shareholders should realize economies of scale as certain expenses, such as fixed fund fees, become a smaller percentage of overall assets. The Board noted that it appeared that the benefits of any economies of scale also would be appropriately shared with shareholders through increased investment in fund management and administration resources.
Taking all of the above into consideration, the Board determined that the Fund’s expense ratio was reasonable in light of the comparative performance and expense information and the nature, extent and quality of the services provided to the Fund under the Agreements.
Other benefits to the manager
The Board considered other benefits received by the Manager and its affiliates, including the Sub-Advisers, as a result of the Manager’s relationship with the Fund, including the opportunity to offer additional products and services to Fund shareholders.
In light of the costs of providing investment management and other services to the Fund and the Manager’s ongoing commitment to the Fund, the profits and other ancillary benefits that the Manager and its affiliates received were considered reasonable.
Based on their discussions and considerations, including those described above, the Trustees approved the Management Agreement and the Sub-Advisory Agreements to continue for another year.
No single factor reviewed by the Board was identified by the Board as the principal factor in determining whether to approve the Management Agreement and the Sub-Advisory Agreements.
Legg Mason
Variable Lifestyle Series
Trustees
Paul R. Ades
Andrew L. Breech
Dwight B. Crane
R. Jay Gerken, CFA
Chairman
Frank G. Hubbard
Howard J. Johnson
David E. Maryatt
Jerome H. Miller
Ken Miller
John J. Murphy
Thomas F. Schlafly
Jerry A. Viscione
Investment manager
Legg Mason Partners Fund Advisor, LLC
Subadviser
Legg Mason Global Asset Allocation, LLC
Distributor
Legg Mason Investor Services, LLC
Custodian
State Street Bank and Trust Company
Transfer agent
Boston Financial Data Services, Inc. 2000 Crown Colony Drive
Quincy, MA 02169
Independent registered public accounting firm
KPMG LLP
345 Park Avenue
New York, NY 10154
Legg Mason Variable Lifestyle Series
Legg Mason Variable Lifestyle Allocation 85%
Legg Mason Variable Lifestyle Allocation 70%
Legg Mason Variable Lifestyle Allocation 50%
The Portfolios are separate investment series of Legg Mason Partners Variable Equity Trust, a Maryland statutory trust.
Legg Mason Variable Lifestyle Series
Legg Mason Funds
55 Water Street
New York, NY 10041
The Portfolios file their complete schedule of portfolio holdings with the Securities and Exchange Commission (“SEC”) for the first and third quarters of each fiscal year on Form N-Q. The Portfolios Forms N-Q are available on the SEC’s website at www.sec.gov. The Portfolios Forms N-Q may be reviewed and copied at the SEC’s Public Reference Room in Washington, D.C., and information on the operation of the Public Reference Room may be obtained by calling
1-800-SEC-0330. To obtain information on Form N-Q, shareholders can call the Portfolios at 1-877-721-1926.
Information on how the Portfolios voted proxies relating to portfolio securities during the prior 12-month period ended June 30th of each year and a description of the policies and procedures that the Portfolios use to determine how to vote proxies relating to portfolio transactions are available (1) without charge, upon request, by calling the Portfolios at 1-877-721-1926, (2) on the Portfolios’ website at www.leggmason.com/individualinvestors and (3) on the SEC’s website at www.sec.gov.
This report is submitted for the general information of the shareholders of Legg Mason Variable Lifestyle Allocation 85%, Legg Mason Variable Lifestyle Allocation 70% and Legg Mason Variable Lifestyle Allocation 50%. This report is not authorized for distribution to prospective investors in the Portfolios unless preceded or accompanied by a current prospectus.
Investors should consider each Portfolio’s investment objectives, risks, charges and expenses carefully before investing. Each prospectus contains this and other important information about the Portfolios. Please read the prospectus carefully before investing.
www.leggmason.com/individualinvestors
©2011 Legg Mason Investor Services, LLC
Member FINRA, SIPC
Legg Mason Funds Privacy and Security Notice
Your Privacy and the Security of Your Personal Information is Very Important to the Legg Mason Funds
This Privacy and Security Notice (the “Privacy Notice”) addresses the Legg Mason Funds’ privacy and data protection practices with respect to nonpublic personal information the Funds receive. The Legg Mason Funds include any funds sold by the Funds’ distributor, Legg Mason Investor Services, LLC, as well as Legg Mason-sponsored closed-end funds. The provisions of this Privacy Notice apply to your information both while you are a shareholder and after you are no longer invested with the Funds.
The Type of Nonpublic Personal Information the Funds Collect About You
The Funds collect and maintain nonpublic personal information about you in connection with your shareholder account. Such information may include, but is not limited to:
| Ÿ | | Personal information included on applications or other forms; |
| Ÿ | | Account balances, transactions, and mutual fund holdings and positions; |
| Ÿ | | Online account access user IDs, passwords, security challenge question responses; and |
| Ÿ | | Information received from consumer reporting agencies regarding credit history and creditworthiness (such as the amount of an individual’s total debt, payment history, etc.). |
How the Funds Use Nonpublic Personal Information About You
The Funds do not sell or share your nonpublic personal information with third parties or with affiliates for their marketing purposes, or with other financial institutions or affiliates for joint marketing purposes, unless you have authorized the Funds to do so. The Funds do not disclose any nonpublic personal information about you except as may be required to perform transactions or services you have authorized or as permitted or required by law. The Funds may disclose information about you to:
| Ÿ | | Employees, agents, and affiliates on a “need to know” basis to enable the Funds to conduct ordinary business or comply with obligations to government regulators; |
| Ÿ | | Service providers, including the Funds’ affiliates, who assist the Funds as part of the ordinary course of business (such as printing, mailing services, or processing or servicing your account with us) or otherwise perform services on the Funds’ behalf, including companies that may perform marketing services solely for the Funds; |
| Ÿ | | The Funds’ representatives such as legal counsel, accountants and auditors; and |
| Ÿ | | Fiduciaries or representatives acting on your behalf, such as an IRA custodian or trustee of a grantor trust. |
Except as otherwise permitted by applicable law, companies acting on the Funds’ behalf are contractually obligated to keep nonpublic personal information the Funds provide to them confidential and to use the information the Funds share only to provide the services the Funds ask them to perform.
The Funds may disclose nonpublic personal information about you when necessary to enforce their rights or protect against fraud, or as permitted or required by applicable law, such as in connection with a law enforcement or regulatory request, subpoena, or similar legal process. In the event of a corporate action or in the event a Fund service provider changes, the Funds may be required to disclose your nonpublic personal information to third parties. While it is the Funds’ practice to obtain protections for disclosed information in these types of transactions, the Funds cannot guarantee their privacy policy will remain unchanged.
|
| NOT PART OF THE SEMI-ANNUAL REPORT |
Legg Mason Funds Privacy and Security Notice (cont’d)
Keeping You Informed of the Funds’ Privacy and Security Practices
The Funds will notify you annually of their privacy policy as required by federal law. While the Funds reserve the right to modify this policy at any time they will notify you promptly if this privacy policy changes.
The Funds’ Security Practices
The Funds maintain appropriate physical, electronic and procedural safeguards designed to guard your nonpublic personal information. The Funds’ internal data security policies restrict access to your nonpublic personal information to authorized employees, who may use your nonpublic personal information for Fund business purposes only.
Although the Funds strive to protect your nonpublic personal information, they cannot ensure or warrant the security of any information you provide or transmit to them, and you do so at your own risk. In the event of a breach of the confidentiality or security of your nonpublic personal information, the Funds will attempt to notify you as necessary so you can take appropriate protective steps. If you have consented to the Funds using electronic communications or electronic delivery of statements, they may notify you under such circumstances using the most current email address you have on record with them.
In order for the Funds to provide effective service to you, keeping your account information accurate is very important. If you believe that your account information is incomplete, not accurate or not current, or if you have questions about the Funds’ privacy practices, write the Funds using the contact information on your account statements, email the Funds by clicking on the Contact Us section of the Funds’ website at www.leggmason.com, or contact the Fund at 1-877-721-1926.
Revised April 2011
|
| NOT PART OF THE SEMI-ANNUAL REPORT |
www.leggmason.com/individualinvestors
©2011 Legg Mason Investor Services, LLC Member FINRA, SIPC
FD01325 8/11 SR11-1462
Not applicable.
| ITEM 3. | AUDIT COMMITTEE FINANCIAL EXPERT. |
Not applicable.
| ITEM 4. | PRINCIPAL ACCOUNTANT FEES AND SERVICES. |
Not applicable.
| ITEM 5. | AUDIT COMMITTEE OF LISTED REGISTRANTS. |
Not applicable.
| ITEM 6. | SCHEDULE OF INVESTMENTS. |
Included herein under Item 1.
| ITEM 7. | DISCLOSURE OF PROXY VOTING POLICIES AND PROCEDURES FOR CLOSED-END MANAGEMENT INVESTMENT COMPANIES. |
Not applicable.
| ITEM 8. | PORTFOLIO MANAGERS OF CLOSED-END MANAGEMENT INVESTMENT COMPANIES. |
Not applicable.
| ITEM 9. | PURCHASES OF EQUITY SECURITIES BY CLOSED-END MANAGEMENT INVESTMENT COMPANY AND AFFILIATED PURCHASERS. |
Not applicable.
| ITEM 10. | SUBMISSION OF MATTERS TO A VOTE OF SECURITY HOLDERS. |
Not applicable.
| ITEM 11. | CONTROLS AND PROCEDURES. |
(a) The registrant’s principal executive officer and principal financial officer have concluded that the registrant’s disclosure controls and procedures (as defined in Rule 30a- 3(c) under the Investment Company Act of 1940, as amended (the “1940 Act”)) are effective as of a date within 90 days of the filing date of this report that includes the disclosure required by this paragraph, based on their evaluation of the disclosure controls and procedures required by Rule 30a-3(b) under the 1940 Act and 15d-15(b) under the Securities Exchange Act of 1934.
(b) There were no changes in the registrant’s internal control over financial reporting (as defined in Rule 30a-3(d) under the 1940 Act) that occurred during the registrant’s last fiscal half-year (the registrant’s second fiscal half-year in the case of an annual report) that have materially affected, or are likely to materially affect the registrant’s internal control over financial reporting.
(a) (1) Not applicable.
Exhibit 99.CODE ETH
(a) (2) Certifications pursuant to section 302 of the Sarbanes-Oxley Act of 2002 attached hereto.
Exhibit 99.CERT
(b) Certifications pursuant to Section 906 of the Sarbanes-Oxley Act of 2002 attached hereto.
Exhibit 99.906CERT
SIGNATURES
Pursuant to the requirements of the Securities Exchange Act of 1934 and the Investment Company Act of 1940, the registrant has duly caused this Report to be signed on its behalf by the undersigned, there unto duly authorized.
| | |
| Legg Mason Partners Variable Equity Trust |
| |
| By: | | /s/ R. Jay Gerken |
| | (R. Jay Gerken) Chief Executive Officer of Legg Mason Partners Variable Equity Trust |
Date: August 26, 2011
Pursuant to the requirements of the Securities Exchange Act of 1934 and the Investment Company Act of 1940, this report has been signed below by the following persons on behalf of the registrant and in the capacities and on the dates indicated.
| | |
| By: | | /s/ R. Jay Gerken |
| | (R. Jay Gerken) Chief Executive Officer of Legg Mason Partners Variable Equity Trust |
Date: August 26, 2011
| | |
| By: | | /s/ Kaprel Ozsolak |
| | (Kaprel Ozsolak) Chief Financial Officer of Legg Mason Partners Variable Equity Trust |
Date: August 26, 2011