UNITED STATES
SECURITIES AND EXCHANGE COMMISSION
Washington, D.C. 20549
FORM N-CSR
CERTIFIED SHAREHOLDER REPORT OF REGISTERED
MANAGEMENT INVESTMENT COMPANIES
Investment Company Act file number 811-21128
Legg Mason Partners Variable Equity Trust
(Exact name of registrant as specified in charter)
620 Eighth Avenue,
49th Floor, New York, NY 10018
(Address of principal executive offices) (Zip code)
Robert I. Frenkel, Esq.
Legg Mason & Co., LLC
100 First Stamford Place
Stamford, CT 06902
(Name and address of agent for service)
Registrant’s telephone number, including area code: 1-877-721-1926
Date of fiscal year end: December 31
Date of reporting period: December 31, 2012
| ITEM 1. | REPORT TO STOCKHOLDERS. |
The Annual Report to Stockholders is filed herewith.
December 31, 2012

Annual
Repor t
Legg Mason
Variable Lifestyle Series
Legg Mason Variable Lifestyle Allocation 85%
Legg Mason Variable Lifestyle Allocation 70%
Legg Mason Variable Lifestyle Allocation 50%
INVESTMENT PRODUCTS: NOT FDIC INSURED • NO BANK GUARANTEE • MAY LOSE VALUE
| | |
| II | | Legg Mason Variable Lifestyle Series |
Legg Mason Variable Lifestyle Series
Legg Mason Variable Lifestyle Series (“Variable Lifestyle Series”) consists of separate investment Portfolios, each with its own investment objective and policies. Each Portfolio offers different levels of potential return and involves different levels of risk.
The Portfolios are separate investment series of the Legg Mason Partners Variable Equity Trust, a Maryland statutory trust.
| | | | |
| Letter from the chairman | | |  | |
Dear Shareholder,
We are pleased to provide the annual report of Legg Mason Variable Lifestyle Series for the twelve-month reporting period ended December 31, 2012. Please read on for a detailed look at prevailing economic and market conditions during the Portfolios’ reporting period and to learn how those conditions have affected each Portfolio’s performance.
As always, we remain committed to providing you with excellent service and a full spectrum of investment choices. We also remain committed to supplementing the support you receive from your financial advisor. One way we accomplish this is through our website, www.leggmason.com/individualinvestors. Here you can gain immediate access to market and investment information, including:
| Ÿ | | Market insights and commentaries from our portfolio managers and |
| Ÿ | | A host of educational resources. |
We look forward to helping you meet your financial goals.
Sincerely,

R. Jay Gerken, CFA
Chairman, President and Chief Executive Officer
January 31, 2013
| | | | |
| Legg Mason Variable Lifestyle Series | | | III | |
Investment commentary
Economic review
The U.S. economy continued to grow over the twelve months ended December 31, 2012, but it did so at an uneven pace. U.S. gross domestic product (“GDP”)i growth, as reported by the U.S. Department of Commerce, was 2.0% in the first quarter of 2012. The economy then slowed in the second quarter, as GDP growth was a tepid 1.3%. Economic growth accelerated to 3.1% in the third quarter, partially due to increased private inventory investment, higher federal government spending and moderating imports. However, this was a temporary uptick, as the Commerce Department’s initial estimate showed that fourth quarter GDP contracted 0.1%. This was the first negative reading since the second quarter of 2009, and was driven by a reversal of the above factors, as private inventory investment and federal government spending weakened.
While there was some improvement in the U.S. job market, unemployment remained elevated throughout the reporting period. When the period began, unemployment, as reported by the U.S. Department of Labor, was 8.3%. Unemployment then generally declined and was 7.8% in September 2012, the lowest rate since January 2009, but still high by historical standards. The unemployment rate then rose to 7.9% in October, before falling to 7.8% in November, where it remained in December. The number of longer-term unemployed continued to be a headwind for the economy, as roughly 39% of the 12.2 million people without a job have been out of work for more than six months.
Meanwhile, the housing market brightened, as sales generally improved and home prices continued to rebound. According to the National Association of Realtors (“NAR”), while existing-home sales dipped 1.0% on a seasonally adjusted basis in December 2012 versus the previous month, they were still 12.8% higher than in December 2011. In addition, the NAR reported that the median existing-home price for all housing types was $180,800 in December 2012, up 11.5% from December 2011. This marked the tenth consecutive month that home prices rose compared to the same period a year earlier. Furthermore, the inventory of homes available for sale fell 8.5% in December, which represents a 4.4 month supply at the current sales pace. This represents the lowest inventory since May 2005.
The manufacturing sector expanded during much of the reporting period, although it experienced several soft patches. Based on the Institute for Supply Management’s PMI (“PMI”)ii, after expanding 34 consecutive months, the PMI fell to 49.7 in June
2012, which represented the first contraction in the manufacturing sector since July 2009 (a reading below 50 indicates a contraction, whereas a reading above 50 indicates an expansion). Manufacturing continued to contract in July and August before ticking up to 51.5 in September and 51.7 in October. The PMI fell back to contraction territory with a reading of 49.5 in November, its lowest level since July 2009. However, manufacturing again expanded in December, with the PMI increasing to 50.7.
Growth generally moderated overseas and, in some cases, fell back into a recession. But in its January 2013 World Economic Outlook Update, after the reporting period ended, the International Monetary Fund (“IMF”) stated that “Global growth is projected to increase during 2013, as the factors underlying soft global activity are expected to subside. However, this upturn is projected to be more gradual than in the October 2012 World Economic Outlook projections.” The IMF projects that global growth will increase from 3.2% in 2012 to 3.5% in 2013. From a regional perspective, the IMF anticipates 2013 growth will be -0.2% in the Eurozone. Growth in emerging market countries is expected to remain higher than in their developed country counterparts, and the IMF projects that emerging market growth will increase from 5.1% in 2012 to 5.5% in 2013. In particular, China’s economy is expected to grow 8.2% in 2013, versus 7.8% in 2012. Elsewhere, the IMF projects that growth in India will increase from 4.5% in 2012 to 5.9% in 2013.
The Federal Reserve Board (“Fed”)iii took a number of actions as it sought to meet its dual mandate of fostering maximum employment and price stability. As has been the case since December 2008, the Fed kept the federal funds rateiv at a historically low range between zero and 0.25%. In January 2012, the Fed extended the period it expects to keep rates on hold until at least through late 2014. At its June 2012 meeting, the Fed announced that it would continue its program of purchasing longer-term Treasury securities and selling an equal amount of shorter-term Treasury securities (often referred to as “Operation Twist”) until the end of 2012. In September, the Fed announced a third round of quantitative easing (“QE3”), which involves purchasing $40 billion each month of agency mortgage-backed securities on an open-end basis. In addition, the Fed further extended the duration that it expects to keep the federal funds rate on hold, until at least mid-2015. Finally, at its meeting in December, the Fed announced that it would continue purchasing $40 billion per month of agency mortgage-backed securities, as well as initially
| | |
| IV | | Legg Mason Variable Lifestyle Series |
Investment commentary (cont’d)
purchasing $45 billion a month of longer-term Treasuries. The Fed also said that it would keep the federal funds rate on hold “…as long as the unemployment rate remains above 6.5%, inflation between one and two years ahead is projected to be no more than a half percentage point above the Committee’s 2.0% longer-run goal, and longer-term inflation expectations continue to be well anchored.”
Given the economic challenges in the Eurozone, the European Central Bank (“ECB”)v lowered interest rates from 1.50% to 1.25% in November 2011 and to 1.00% the following month. In July 2012, the ECB cut rates from 1.00% to 0.75%, a record low. In September the ECB introduced its Outright Monetary Transactions program (“OMT”). With the OMT, the ECB can purchase an unlimited amount of bonds that are issued by troubled Eurozone countries, provided the countries formally ask to participate in the program and agree to certain conditions. In other developed countries, the Bank of England kept rates on hold at 0.50% during the reporting period, as did Japan at a range of zero to 0.10%, its lowest level
since 2006. In September, the Bank of Japan announced that it would increase its asset-purchase program and extend its duration by six months until the end of 2013. Elsewhere, with growth rates declining, both China and India lowered their cash reserve ratio for banks. China also cut its key interest rate in early June and again in July.
As always, thank you for your confidence in our stewardship of your assets.
Sincerely,
R. Jay Gerken, CFA
Chairman, President and Chief Executive Officer
January 31, 2013
All investments are subject to risk including the possible loss of principal. Past performance is no guarantee of future results. Forecasts and predictions are inherently limited and should not be relied upon as an indication of actual or future performance.
| i | Gross domestic product (“GDP”) is the market value of all final goods and services produced within a country in a given period of time. |
| ii | The Institute for Supply Management’s PMI is based on a survey of purchasing executives who buy the raw materials for manufacturing at more than 350 companies. It offers an early reading on the health of the manufacturing sector. |
| iii | The Federal Reserve Board (“Fed”) is responsible for the formulation of policies designed to promote economic growth, full employment, stable prices and a sustainable pattern of international trade and payments. |
| iv | The federal funds rate is the rate charged by one depository institution on an overnight sale of immediately available funds (balances at the Federal Reserve) to another depository institution; the rate may vary from depository institution to depository institution and from day to day. |
| v | The European Central Bank (“ECB”) is responsible for the monetary system of the European Union and the euro currency. |
| | | | |
| Legg Mason Variable Lifestyle Series 2012 Annual Report | | | 1 | |
Portfolios overview
Legg Mason Variable Lifestyle Series (the “Variable Lifestyle Series”) consists of three portfolio investment options (the “Portfolios”), each of which is a “fund of funds” that invests in a combination of equity and fixed-income mutual funds. The Variable Lifestyle Series offers a mix of equity funds categorized according to average market capitalization (size), investing style (e.g., value, core or growth) and global exposure (e.g., U.S. and/or international stocks). The various options within the Variable Lifestyle Series also offer a mix of bond asset classes such as U.S. and foreign government debt, corporate bonds, high-yield debt and emerging market debt — each of which carries a varying degree of risk/reward potential.
Q. What were the overall market conditions during the Portfolios’ reporting period?
A. Global equity markets produced strong results, though with some volatility along the way. For the twelve months ending December 31, 2012, the overall domestic stock market, as measured by the S&P 500 Indexi, returned 16.00%. Over the same time frame, the Russell 1000 Indexii of large-cap U.S. stocks produced a total return of 16.42%. Small-cap U.S. stocks produced very similar results. The Russell 2000 Indexiii was up 16.35% over the same period. International stock markets did even better; for the twelve months ending December 31, 2012, the MSCI EAFE Indexiv produced a total return of 17.90%. It wasn’t all smooth sailing in the equity markets, though. Worries about the potential for slower growth sparked two stock market “corrections” during the course of the year, one in April and May (which saw the S&P 500 fall almost 10% from peak to trough) and another in October and November (which saw the S&P 500 fall over 7% from peak to trough). Strong performance in the first and the third quarters of the year enabled the markets to show good results for the full year.
Investment grade fixed income markets produced more modest returns, but with much less volatility during the course of the year. The Barclays U.S. Aggregate Indexv was only up 4.22% for the year ending December 31, 2012, but it actually had a positive return in each quarter of the year. The ten-year U.S. Treasury bond yield started the period at 1.88%. It hit its high for the year in mid-March, reaching 2.38%, before falling as low as 1.39% in July. It ended the year at 1.76%. The yield on the two-year Treasury note remained extremely low all year long. It ended the year at 0.25%, almost unchanged from its level of 0.24% at the start of the year, and it only moved within a narrow range all year, from a low of 0.20% to a high of 0.39%. High yield fixed-income markets, which consist of bonds that are below investment grade, enjoyed higher returns that were more in line with the returns in the equity markets. The Barclays U.S. Corporate High Yield — 2% Issuer Cap Indexvi returned 15.78% for the year.
Q. How did we respond to these changing market conditions?
A. During the first quarter of the year, we maintained a small overweight position in equity funds (relative to the benchmark weights) and an underweight position in fixed-income funds. We believed that stocks were more attractive than bonds on a relative valuation basis, based on their price-to-earnings (“P/E”) ratiovii and their dividend yields. We expected earnings growth to remain positive, and felt that this further supported the case for overweighting equities. After stocks outperformed bonds by a wide margin in the first quarter, we felt that stocks were no longer as attractively valued relative to bonds as they had been before. In addition, we felt that the outlook for earnings growth was deteriorating. As a result, we decided to move from our overweight position in equities to a neutral position in both equities and bonds. We maintained that stance for the rest of the year.
| | |
| 2 | | Legg Mason Variable Lifestyle Series 2012 Annual Report |
Portfolios overview (cont’d)
Legg Mason Variable Lifestyle Allocation 85%
Target Asset Allocation1
| | |
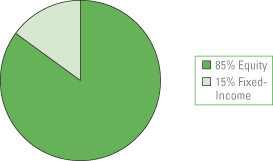 | | Legg Mason Variable Lifestyle Allocation 85% seeks capital appreciation by investing 85% of its assets in underlying funds that invest principally in equity securities and 15% in underlying funds that invest principally in fixed-income securities. |
Performance review
For the twelve months ended December 31, 2012, Legg Mason Variable Lifestyle Allocation 85%2 returned 15.89%. The Portfolio’s unmanaged benchmarks, the Barclays U.S. Aggregate Index, the Russell 3000 Indexviii and the Lifestyle Allocation 85% Composite Benchmarkix, returned 4.22%, 16.42% and 15.45%, respectively, over the same time frame. The Lipper Variable Mixed-Asset Target Allocation Growth Funds Category Average3 returned 13.50% for the same period.
| | | | | | | | |
| Performance Snapshot as of December 31, 2012 (unaudited) | |
| | | 6 months | | | 12 months | |
| Variable Lifestyle Allocation 85%2 | | | 8.40 | % | | | 15.89 | % |
| Barclays U.S. Aggregate Index | | | 1.80 | % | | | 4.22 | % |
| Russell 3000 Index | | | 6.49 | % | | | 16.42 | % |
| Lifestyle Allocation 85% Composite Benchmark | | | 7.68 | % | | | 15.45 | % |
| Lipper Variable Mixed-Asset Target Allocation Growth Funds Category Average3 | | | 6.85 | % | | | 13.50 | % |
The performance shown represents past performance. Past performance is no guarantee of future results and current performance may be higher or lower than the performance shown above. Principal value and investment returns will fluctuate and investors’ shares, when redeemed, may be worth more or less than their original cost.
Portfolio returns assume the reinvestment of all distributions at net asset value and the deduction of all Portfolio expenses. Performance figures for periods shorter than one year represent cumulative figures and are not annualized.
The portfolio managers periodically adjust the allocation of the Portfolio’s assets among different Legg Mason-affiliated funds depending upon the portfolio managers’ outlook for the equity and fixed-income markets in general, particular sectors of such markets and the performance outlook for the underlying funds. The Portfolio is not expected to be invested in all of the underlying funds at any time. The Portfolio may change its allocations among the underlying funds and may vary the allocation between equity and fixed-income funds within the Target Range4 without prior notice to shareholders.
Total Annual Operating Expenses† (unaudited)
As of the Portfolio’s current prospectus dated May 1, 2012, the gross total annual operating expense ratio for the Portfolio was 0.92%.
Actual expenses may be higher. For example, expenses may be higher than those shown if average net assets decrease. Net assets are more likely to decrease and Portfolio expense ratios are more likely to increase when markets are volatile.
As a result of an expense limitation arrangement, the ratio of expenses, other than brokerage, interest, taxes, extraordinary expenses and acquired fund fees and expenses, to average net assets is not expected to exceed 0.20%. This expense limitation arrangement cannot be terminated prior to December 31, 2014 without the Board of Trustees’ consent.
The manager is permitted to recapture amounts waived and/or reimbursed to the Portfolio during the same fiscal year if the Portfolio’s total annual operating expenses have fallen to a level below the expense limitation (“expense cap”) in effect at the time the fees were earned or the expenses incurred. In no case will the manager recapture any amount that would result, on any particular business day of the Portfolio, in the Portfolio’s total annual operating expenses exceeding the expense cap or any other lower limit then in effect.
| 1 | The Target Asset Allocation set forth above represents an approximate mix of investments for Legg Mason Variable Lifestyle Allocation 85%. The allocation and investment mix of the Portfolio may vary depending upon market conditions, cash flows in and out of the Portfolio and other factors. In addition, the allocation and investment range of the Portfolio may be changed, from time to time, without prior notice to shareholders. |
| 2 | The Portfolio is an underlying investment option of various variable annuity and variable life insurance products. The Portfolio’s performance returns do not reflect the deduction of expenses imposed in connection with investing in variable annuity or variable life insurance contracts, such as administrative fees, account charges and surrender charges, which, if reflected, would reduce the performance of the Portfolio. Past performance is no guarantee of future results. |
| 3 | Lipper, Inc., a wholly-owned subsidiary of Reuters, provides independent insight on global collective investments. Returns are based on the period ended December 31, 2012, including the reinvestment of all distributions, including returns of capital, if any, calculated among the 328 funds for the six-month period and among the 318 funds for the twelve-month period in the Portfolio’s Lipper category. |
| 4 | The Target Range is the percentage range, as stated by the prospectus, within which the Portfolio may make tactical changes to its equity funds/fixed-income funds allocation. |
| † | Includes expenses of the underlying funds in which the Portfolio invests. |
| | | | |
| Legg Mason Variable Lifestyle Series 2012 Annual Report | | | 3 | |
Legg Mason Variable Lifestyle Allocation 70%
Target Asset Allocation1
| | |
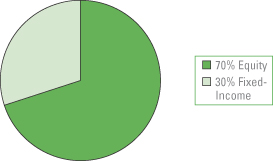 | | Legg Mason Variable Lifestyle Allocation 70% seeks long-term growth of capital by investing 70% of its assets in underlying funds that invest principally in equity securities and 30% in underlying funds that invest principally in fixed-income securities. |
Performance review
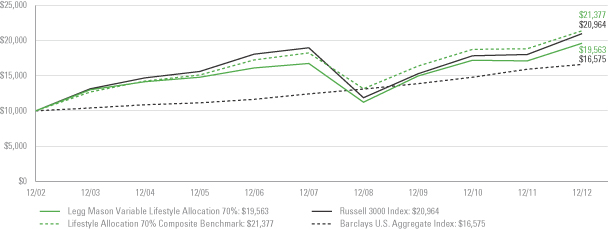
For the twelve months ended December 31, 2012, Legg Mason Variable Lifestyle Allocation 70%2 returned 14.60%. The Portfolio’s unmanaged benchmarks, the Barclays U.S. Aggregate Index, the Russell 3000 Index and the Lifestyle Allocation 70% Composite Benchmarkx, returned 4.22%, 16.42% and 13.58%, respectively, over the same time frame. The Lipper Variable Mixed-Asset Target Allocation Growth Funds Category Average3 returned 13.50% for the same period.
| | | | | | | | |
| Performance Snapshot as of December 31, 2012 (unaudited) | |
| | | 6 months | | | 12 months | |
| Variable Lifestyle Allocation 70%2 | | | 7.37 | % | | | 14.60 | % |
| Barclays U.S. Aggregate Index | | | 1.80 | % | | | 4.22 | % |
| Russell 3000 Index | | | 6.49 | % | | | 16.42 | % |
| Lifestyle Allocation 70% Composite Benchmark | | | 6.57 | % | | | 13.58 | % |
| Lipper Variable Mixed-Asset Target Allocation Growth Funds Category Average3 | | | 6.85 | % | | | 13.50 | % |
The performance shown represents past performance. Past performance is no guarantee of future results and current performance may be higher or lower than the performance shown above. Principal value and investment returns will fluctuate and investors’ shares, when redeemed, may be worth more or less than their original cost.
Portfolio returns assume the reinvestment of all distributions at net asset value and the deduction of all Portfolio expenses. Performance figures for periods shorter than one year represent cumulative figures and are not annualized.
The portfolio managers periodically adjust the allocation of the Portfolio’s assets among different Legg Mason-affiliated funds depending upon the portfolio managers’ outlook for the equity and fixed-income markets in general, particular sectors of such markets and the performance outlook for the underlying funds. The Portfolio is not expected to be invested in all of the underlying funds at any time. The Portfolio may change its allocations among the underlying funds and may vary the allocation between equity and fixed-income funds within the Target Range4 without prior notice to shareholders.
Total Annual Operating Expenses† (unaudited)
As of the Portfolio’s current prospectus dated May 1, 2012, the gross total annual operating expense ratio for the Portfolio was 0.90%.
Actual expenses may be higher. For example, expenses may be higher than those shown if average net assets decrease. Net assets are more likely to decrease and Portfolio expense ratios are more likely to increase when markets are volatile.
As a result of an expense limitation arrangement, the ratio of expenses, other than brokerage, interest, taxes, extraordinary expenses and acquired fund fees and expenses, to average net assets is not expected to exceed 0.20%. This expense limitation arrangement cannot be terminated prior to December 31, 2014 without the Board of Trustees’ consent.
The manager is permitted to recapture amounts waived and/or reimbursed to the Portfolio during the same fiscal year if the Portfolio’s total annual operating expenses have fallen to a level below the expense limitation (“expense cap”) in effect at the time the fees were earned or the expenses incurred. In no case will the manager recapture any amount that would result, on any particular business day of the Portfolio, in the Portfolio’s total annual operating expenses exceeding the expense cap or any other lower limit then in effect.
| 1 | The Target Asset Allocation set forth above represents an approximate mix of investments for Legg Mason Variable Lifestyle Allocation 70%. The allocation and investment mix of the Portfolio may vary depending upon market conditions, cash flows in and out of the Portfolio and other factors. In addition, the allocation and investment range of the Portfolio may be changed, from time to time, without prior notice to shareholders. |
| 2 | The Portfolio is an underlying investment option of various variable annuity and variable life insurance products. The Portfolio’s performance returns do not reflect the deduction of expenses imposed in connection with investing in variable annuity or variable life insurance contracts, such as administrative fees, account charges and surrender charges, which, if reflected, would reduce the performance of the Portfolio. Past performance is no guarantee of future results. |
| 3 | Lipper, Inc., a wholly-owned subsidiary of Reuters, provides independent insight on global collective investments. Returns are based on the period ended December 31, 2012, including the reinvestment of all distributions, including returns of capital, if any, calculated among the 328 funds for the six-month period and among the 318 funds for the twelve-month period in the Portfolio’s Lipper category. |
| 4 | The Target Range is the percentage range, as stated by the prospectus, within which the Portfolio may make tactical changes to its equity funds/fixed-income funds allocation. |
| † | Includes expenses of the underlying funds in which the Portfolio invests. |
| | |
| 4 | | Legg Mason Variable Lifestyle Series 2012 Annual Report |
Portfolios overview (cont’d)
Legg Mason Variable Lifestyle Allocation 50%
Target Asset Allocation1
| | |
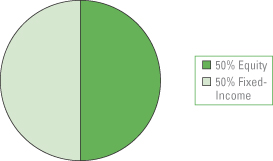 | | Legg Mason Variable Lifestyle Allocation 50% seeks a balance of growth of capital and income by investing 50% of its assets in underlying funds that invest principally in equity securities and 50% in underlying funds that invest principally in fixed-income securities. |
Performance review
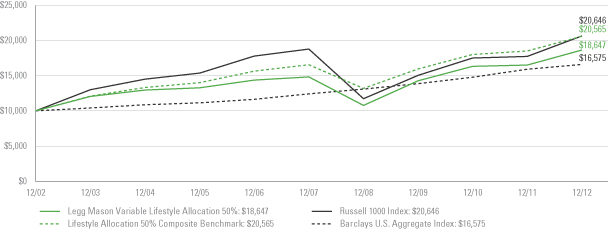
For the twelve months ended December 31, 2012, Legg Mason Variable Lifestyle Allocation 50%2 returned 13.10%. The Portfolio’s unmanaged benchmarks, the Barclays U.S. Aggregate Index, the Russell 1000 Index and the Lifestyle Allocation 50% Composite Benchmarkxi, returned 4.22%, 16.42% and 11.30%, respectively, over the same time frame. The Lipper Variable Mixed-Asset Target Allocation Moderate Funds Category Average3 returned 11.21% for the same period.
| | | | | | | | |
| Performance Snapshot as of December 31, 2012 (unaudited) | |
| | | 6 months | | | 12 months | |
| Variable Lifestyle Allocation 50%2 | | | 6.36 | % | | | 13.10 | % |
| Barclays U.S. Aggregate Index | | | 1.80 | % | | | 4.22 | % |
| Russell 1000 Index | | | 6.44 | % | | | 16.42 | % |
| Lifestyle Allocation 50% Composite Benchmark | | | 5.37 | % | | | 11.30 | % |
| Lipper Variable Mixed-Asset Target Allocation Moderate Funds Category Average3 | | | 5.51 | % | | | 11.21 | % |
The performance shown represents past performance. Past performance is no guarantee of future results and current performance may be higher or lower than the performance shown above. Principal value and investment returns will fluctuate and investors’ shares, when redeemed, may be worth more or less than their original cost.
Portfolio returns assume the reinvestment of all distributions at net asset value and the deduction of all Portfolio expenses. Performance figures for periods shorter than one year represent cumulative figures and are not annualized.
The portfolio managers periodically adjust the allocation of the Portfolio’s assets among different Legg Mason-affiliated funds depending upon the portfolio managers’ outlook for the equity and fixed-income markets in general, particular sectors of such markets and the performance outlook for the underlying funds. The Portfolio is not expected to be invested in all of the underlying funds at any time. The Portfolio may change its allocations among the underlying funds and may vary the allocation between equity and fixed-income funds within the Target Range4 without prior notice to shareholders.
Total Annual Operating Expenses† (unaudited)
As of the Portfolio’s current prospectus dated May 1, 2012, the gross total annual operating expense ratio for the Portfolio was 0.79%.
Actual expenses may be higher. For example, expenses may be higher than those shown if average net assets decrease. Net assets are more likely to decrease and Portfolio expense ratios are more likely to increase when markets are volatile.
As a result of an expense limitation arrangement, the ratio of expenses, other than brokerage, interest, taxes, extraordinary expenses and acquired fund fees and expenses, to average net assets is not expected to exceed 0.20%. This expense limitation arrangement cannot be terminated prior to December 31, 2014 without the Board of Trustees’ consent.
The manager is permitted to recapture amounts waived and/or reimbursed to the Portfolio during the same fiscal year if the Portfolio’s total annual operating expenses have fallen to a level below the expense limitation (“expense cap”) in effect at the time the fees were earned or the expenses incurred. In no case will the manager recapture any amount that would result, on any particular business day of the Portfolio, in the Portfolio’s total annual operating expenses exceeding the expense cap or any other lower limit then in effect.
| 1 | The Target Asset Allocation set forth above represents an approximate mix of investments for Legg Mason Variable Lifestyle Allocation 50%. The allocation and investment mix of the Portfolio may vary depending upon market conditions, cash flows in and out of the Portfolio and other factors. In addition, the allocation and investment range of the Portfolio may be changed, from time to time, without prior notice to shareholders. |
| 2 | The Portfolio is an underlying investment option of various variable annuity and variable life insurance products. The Portfolio’s performance returns do not reflect the deduction of expenses imposed in connection with investing in variable annuity or variable life insurance contracts, such as administrative fees, account charges and surrender charges, which, if reflected, would reduce the performance of the Portfolio. Past performance is no guarantee of future results. |
| 3 | Lipper, Inc., a wholly-owned subsidiary of Reuters, provides independent insight on global collective investments. Returns are based on the period ended December 31, 2012, including the reinvestment of all distributions, including returns of capital, if any, calculated among the 243 funds for the six-month period and among the 231 funds for the twelve-month period in the Portfolio’s Lipper category. |
| 4 | The Target Range is the percentage range, as stated by the prospectus, within which the Portfolio may make tactical changes to its equity funds/fixed-income funds allocation. |
| † | Includes expenses of the underlying funds in which the Portfolio invests. |
| | | | |
| Legg Mason Variable Lifestyle Series 2012 Annual Report | | | 5 | |
Q. What were the leading contributors to performance?
A. Taking into account both the underlying fund returns and their weightings within the portfolios, the leading contributors to absolute performance were the four large cap U.S. equity funds (the Legg Mason Batterymarch U.S. Large Cap Equity Fund, the Legg Mason BW Diversified Large Cap Value Fund, the ClearBridge Appreciation Fund, and the ClearBridge Aggressive Growth Fund) as well as the Western Asset Core Plus Bond Fund.
In relative terms (i.e., relative to the Portfolios’ blended benchmarks), the leading contributors to performance were the Western Asset Core Plus Bond Fund, the Western Asset Total Return Unconstrained Fund, and the ClearBridge International All Cap Opportunity Fund.
Q. What were the leading detractors from performance?
A. All of the underlying funds had positive returns for the reporting period, so no fund detracted from performance on an absolute basis. But taking into account both the underlying fund returns and their weightings within the portfolios, the funds that made the smallest positive contribution to performance were the Legg Mason Strategic Real Return Fund and the three U.S. small and mid cap equity funds (the Royce Value Fund, the ClearBridge Small Cap Growth Fund, and the ClearBridge Mid Cap Core Fund).
In relative terms (i.e., relative to the Portfolios’ blended benchmarks), the leading detractors from performance were the Legg Mason Strategic Real Return Fund, the Royce Value Fund, and the Legg Mason Batterymarch International Equity Trust.
Q. Were there any significant changes to the Portfolios during the reporting period?
A. There were no significant changes to the Portfolios during the reporting period.
Thank you for your investment in the Variable Lifestyle Series. As always, we appreciate that you have chosen us to manage your assets and we remain focused on achieving the Portfolios’ investment goals.
Sincerely,

Steven Bleiberg
Portfolio Manager
Legg Mason Global Asset Allocation, LLC

Y. Wayne Lin
Portfolio Manager
Legg Mason Global Asset Allocation, LLC

Patricia Duffy
Portfolio Manager
Legg Mason Global Asset Allocation, LLC
January 22, 2013
RISKS: Equity securities are subject to price fluctuation. Fixed-income securities are subject to interest rate and credit risks. Foreign securities are subject to certain risks of overseas investing including currency fluctuations and changes in political and economic conditions, which could result in significant market fluctuations. These risks are magnified in emerging markets. Investments in small- and mid-capitalization companies may involve a higher degree of risk and volatility than investments in larger, more established companies. As interest rates rise, bond prices fall, reducing the value of the Portfolios’ share prices. High-yield bonds involve greater credit and liquidity risks than investment grade bonds. There are additional risks and other expenses associated with investing in other mutual funds rather than directly in portfolio securities. Certain underlying funds may use derivatives, such as options and futures, which can be illiquid, may disproportionately increase losses, and have a potentially large impact on Portfolio performance. Additionally, the portfolio managers may invest in underlying funds that have a limited performance history. Please see the Portfolios’ prospectuses for a more complete discussion of these and other risks, and the Portfolios’ investment strategies.
All investments are subject to risk including the possible loss of principal. Past performance is no guarantee of future results. All index performance reflects no deduction for fees, expenses or taxes. Please note that an investor cannot invest directly in an index.
The information provided is not intended to be a forecast of future events, a guarantee of future results or investment advice. Views expressed may differ from those of the firm as a whole.
| | |
| 6 | | Legg Mason Variable Lifestyle Series 2012 Annual Report |
Portfolios overview (cont’d)
| i | The S&P 500 Index is an unmanaged index of 500 stocks and is generally representative of the performance of larger companies in the U.S. |
| ii | The Russell 1000 Index measures the performance of the 1,000 largest companies in the Russell 3000 Index, which represents approximately 92% of the total market capitalization of the Russell 3000 Index. |
| iii | The Russell 2000 Index measures the performance of the 2,000 smallest companies in the Russell 3000 Index, which represents approximately 8% of the total market capitalization of the Russell 3000 Index. |
| iv | The MSCI EAFE Index is a free float-adjusted market capitalization index designed to measure developed market equity performance, excluding the U.S. and Canada. |
| v | The Barclays U.S. Aggregate Index is a broad-based bond index comprised of government, corporate, mortgage- and asset-backed issues, rated investment grade or higher, and having at least one year to maturity. |
| vi | The Barclays U.S. Corporate High Yield — 2% Issuer Cap Index is an index of the 2% Issuer Cap component of the Barclays U.S. Corporate High Yield Index, which covers the U.S. dollar-denominated, non-investment grade, fixed-rate, taxable corporate bond market. |
| vii | The price-to-earnings (“P/E”) ratio is a stock’s price divided by its earnings per share. |
| viii | The Russell 3000 Index measures the performance of the 3,000 largest U.S. companies based on total market capitalization, which represents approximately 98% of the U.S. equity market. |
| ix | The Lifestyle Allocation 85% Composite Benchmark is a hypothetical representation of the performance of the Portfolio’s major asset classes. It consists of 45% Russell 1000 Index, 20% Russell 2000 Index, 20% MSCI EAFE Index, 10% Barclays U.S. Aggregate Index and 5% Barclays U.S. Corporate High Yield — 2% Issuer Cap Index. |
| x | The Lifestyle Allocation 70% Composite Benchmark is a hypothetical representation of the performance of the Portfolio’s major asset classes. It consists of 40% Russell 1000 Index, 15% Russell 2000 Index, 15% MSCI EAFE Index, 25% Barclays U.S. Aggregate Index and 5% Barclays U.S. Corporate High Yield — 2% Issuer Cap Index. |
| xi | The Lifestyle Allocation 50% Composite Benchmark is a hypothetical representation of the performance of the Portfolio’s major asset classes. It consists of 28% Russell 1000 Index, 12% Russell 2000 Index, 10% MSCI EAFE Index, 43% Barclays U.S. Aggregate Index and 7% Barclays U.S. Corporate High Yield — 2% Issuer Cap Index. |
| | | | |
| Legg Mason Variable Lifestyle Series 2012 Annual Report | | | 7 | |
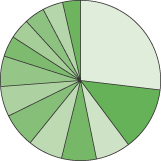
Portfolios at a glance (unaudited)
Legg Mason Variable Lifestyle Allocation 85% Breakdown† as of — December 31, 2012
As a Percent of Total Long-Term Investments

| | | | |
% of Total Long-Term
Investments | | Top 5 Sectors |
 | | 10.9 Legg Mason Partners Equity Trust — Legg Mason Batterymarch U.S. Large Cap Equity Fund, Class IS Shares | | Information Technology Consumer Discretionary Financials Health Care Energy |
 | | 10.9 Legg Mason Global Asset Management Trust — Legg Mason BW Diversified Large Cap Value Fund, Class IS Shares | | Financials Health Care Industrials Energy Information Technology |
 | | 10.8 Legg Mason Partners Equity Trust — ClearBridge Appreciation Fund, Class IS Shares | | Information Technology Financials Consumer Discretionary Health Care Consumer Staples |
 | | 10.4 Legg Mason Partners Equity Trust — ClearBridge International All Cap Opportunity Fund, Class IS Shares | | Financials Industrials Consumer Discretionary Materials Consumer Staples |
 | | 10.0 Legg Mason Partners Equity Trust — ClearBridge Aggressive Growth Fund, Class IS Shares | | Health Care Consumer Discretionary Information Technology Energy Industrials |
 | | 9.7 Legg Mason Global Asset Management Trust — Legg Mason Batterymarch International Equity Trust, Class IS Shares | | Financials Health Care Industrials Consumer Discretionary Consumer Staples |
 | | 7.1 The Royce Fund — Royce Value Fund, Institutional Class Shares | | Consumer Discretionary Materials Information Technology Financials Energy |
| † | Subject to change at any time. |
| | | | |
% of Total Long-Term
Investments | | Top 5 Sectors |
 | | 7.0 Legg Mason Partners Equity Trust—ClearBridge Small Cap Growth Fund, Class IS Shares | | Information Technology Health Care Industrials Consumer Discretionary Financials |
 | | 6.8 Legg Mason Global Asset Management Trust — Legg Mason Strategic Real Return Fund, Class IS Shares | | U.S. Treasury Inflation Protected Securities Investments In Underlying Funds Financials Health Care Consumer Staples |
 | | 5.1 Legg Mason Partners Equity Trust — ClearBridge Mid Cap Core Fund, Class IS Shares | | Financials Industrials Information Technology Consumer Discretionary Health Care |
 | | 4.4 Western Asset Funds, Inc. — Western Asset Core Plus Bond Fund, Class IS Shares | | Corporate Bonds & Notes Mortgage-Backed Securities U.S. Government & Agency Obligations Collateralized Mortgage Obligations Asset-Backed Securities |
 | | 3.9 Western Asset Funds, Inc. — Western Asset Total Return Unconstrained Fund, Class IS Shares | | U.S. Government & Agency Obligations Financials Collateralized Mortgage Obligations Consumer Discretionary Asset-Backed Securities |
 | | 3.0 Western Asset Funds, Inc. — Western Asset High Yield Fund, Class IS Shares | | Energy Consumer Discretionary Industrials Materials Financials |
| | |
| 8 | | Legg Mason Variable Lifestyle Series 2012 Annual Report |
Portfolios at a glance (unaudited) (cont’d)
Legg Mason Variable Lifestyle Allocation 70% Breakdown† as of — December 31, 2012
As a Percent of Total Long-Term Investments

| | | | |
% of Total Long-Term
Investments | | Top 5 Sectors |
| | | 12.1 Western Asset Funds, Inc. — Western Asset Core Plus Bond Fund, Class IS Shares | | Corporate Bonds & Notes Mortgage-Backed Securities U.S. Government & Agency Obligations Collateralized Mortgage Obligations Asset-Backed Securities |
| | | 10.0 Legg Mason Partners Equity Trust — Legg Mason Batterymarch U.S. Large Cap Equity Fund, Class IS Shares | | Information Technology Consumer Discretionary Financials Health Care Energy |
| | | 9.9 Legg Mason Global Asset Management Trust — Legg Mason BW Diversified Large Cap Value Fund, Class IS Shares | | Financials Health Care Industrials Energy Information Technology |
| | | 9.9 Western Asset Funds, Inc. — Western Asset Total Return Unconstrained Fund, Class IS Shares | | U.S. Government & Agency Obligations Financials Collateralized Mortgage Obligations Consumer Discretionary Asset-Backed Securities |
| | | 9.9 Legg Mason Partners Equity Trust — ClearBridge Appreciation Fund, Class IS Shares | | Information Technology Financials Consumer Discretionary Health Care Consumer Staples |
| | | 9.0 Legg Mason Partners Equity Trust — ClearBridge Aggressive Growth Fund, Class IS Shares | | Health Care Consumer Discretionary Information Technology Energy Industrials |
| † | Subject to change at any time. |
| | | | |
% of Total Long-Term
Investments | | Top 5 Sectors |
| | | 7.3 Legg Mason Partners Equity Trust — ClearBridge International All Cap Opportunity Fund, Class IS Shares | | Financials Industrials Consumer Discretionary Materials Consumer Staples |
| | | 7.0 Legg Mason Global Asset Management Trust — Legg Mason Strategic Real Return Fund, Class IS Shares | | U.S. Treasury Inflation Protected Securities Investments In Underlying Funds Financials Health Care Consumer Staples |
| | | 6.2 Legg Mason Global Asset Management Trust — Legg Mason Batterymarch International Equity Trust, Class IS Shares | | Financials Health Care Industrials Consumer Discretionary Consumer Staples |
| | | 5.1 The Royce Fund — Royce Value Fund, Institutional Class Shares | | Consumer Discretionary Materials Information Technology Financials Energy |
| | | 5.0 Legg Mason Partners Equity Trust — ClearBridge Small Cap Growth Fund, Class IS Shares | | Information Technology Health Care Industrials Consumer Discretionary Financials |
| | | 4.6 Legg Mason Partners Equity Trust — ClearBridge Mid Cap Core Fund, Class IS Shares | | Financials Industrials Information Technology Consumer Discretionary Health Care |
| | | 4.0 Western Asset Funds, Inc. — Western Asset High Yield Fund, Class IS Shares | | Energy Consumer Discretionary Industrials Materials Financials |
| | | | |
| Legg Mason Variable Lifestyle Series 2012 Annual Report | | | 9 | |
Legg Mason Variable Lifestyle Allocation 50% Breakdown† as of — December 31, 2012
As a Percent of Total Long-Term Investments
| | | | |
% of Total Long-Term
Investments | | Top 5 Sectors |
| | | 26.9 Western Asset Funds, Inc. — Western Asset Core Plus Bond Fund, Class IS Shares | | Corporate Bonds & Notes Mortgage-Backed Securities U.S. Government & Agency Obligations Collateralized Mortgage Obligations Asset-Backed Securities |
| | | 12.9 Western Asset Funds, Inc. — Western Asset Total Return Unconstrained Fund, Class IS Shares | | U.S. Government & Agency Obligations Financials Collateralized Mortgage Obligations Consumer Discretionary Asset-Backed Securities |
| | | 7.0 Legg Mason Partners Equity Trust — Legg Mason Batterymarch U.S. Large Cap Equity Fund, Class IS Shares | | Information Technology Consumer Discretionary Financials Health Care Energy |
| | | 7.0 Legg Mason Global Asset Management Trust — Legg Mason Strategic Real Return Fund, Class IS Shares | | U.S. Treasury Inflation Protected Securities Investments In Underlying Funds Financials Health Care Consumer Staples |
| | | 7.0 Legg Mason Global Asset Management Trust — Legg Mason BW Diversified Large Cap Value Fund, Class IS Shares | | Financials Health Care Industrials Energy Information Technology |
| | | 6.9 Legg Mason Partners Equity Trust — ClearBridge Appreciation Fund, Class IS Shares | | Information Technology Financials Consumer Discretionary Health Care Consumer Staples |
| † | Subject to change at any time. |
| | | | |
% of Total Long-Term
Investments | | Top 5 Sectors |
| | | 6.1 Legg Mason Partners Equity Trust — ClearBridge Aggressive Growth Fund, Class IS Shares | | Health Care Consumer Discretionary Information Technology Energy Industrials |
| | | 6.1 Western Asset Funds, Inc. — Western Asset High Yield Fund, Class IS Shares | | Energy Consumer Discretionary Industrials Materials Financials |
| | | 4.2 Legg Mason Partners Equity Trust — ClearBridge International All Cap Opportunity Fund, Class IS Shares | | Financials Industrials Consumer Discretionary Materials Consumer Staples |
| | | 4.1 The Royce Fund — Royce Value Fund, Institutional Class Shares | | Consumer Discretionary Materials Information Technology Financials Energy |
| | | 4.1 Legg Mason Global Asset Management Trust — Legg Mason Batterymarch International Equity Trust, Class IS Shares | | Financials Health Care Industrials Consumer Discretionary Consumer Staples |
| | | 4.1 Legg Mason Partners Equity Trust — ClearBridge Small Cap Growth Fund, Class IS Shares | | Information Technology Health Care Industrials Consumer Discretionary Financials |
| | | 3.6 Legg Mason Partners Equity Trust — ClearBridge Mid Cap Core Fund, Class IS Shares | | Financials Industrials Information Technology Consumer Discretionary Health Care |
| | |
| 10 | | Legg Mason Variable Lifestyle Series 2012 Annual Report |
Portfolios expenses (unaudited)
Example
As a shareholder of the Portfolios, you may incur two types of costs: (1) transaction costs and (2) ongoing costs, including management fees; and other Portfolio expenses. This example is intended to help you understand your ongoing costs (in dollars) of investing in the Portfolios and to compare these costs with the ongoing costs of investing in other mutual funds.
This example is based on an investment of $1,000 invested on July 1, 2012 and held for the six months ended December 31, 2012.
Actual expenses
The table below titled “Based on Actual Total Return” provides information about actual account values and actual expenses. You may use the information provided in this table, together with the amount you invested, to estimate the expenses that you paid over the period. To estimate the expenses you paid on your account, divide your ending account value by $1,000 (for example, an $8,600 ending account value divided by $1,000 = 8.6), then multiply the result by the number under the heading entitled “Expenses Paid During the Period”.
Hypothetical example for comparison purposes
The table below titled “Based on Hypothetical Total Return” provides information about hypothetical account values and hypothetical expenses based on the actual expense ratio and an assumed rate of return of 5.00% per year before expenses, which is not each Portfolio’s actual return. The hypothetical account values and expenses may not be used to estimate the actual ending account balance or expenses you paid for the period. You may use the information provided in this table to compare the ongoing costs of investing in the Portfolios and other portfolios. To do so, compare the 5.00% hypothetical example relating to the Portfolios with the 5.00% hypothetical examples that appear in the shareholder reports of the other funds.
Please note that the expenses shown in the table below are meant to highlight your ongoing costs only and do not reflect any transactional costs. Therefore, the table is useful in comparing ongoing costs only, and will not help you determine the relative total costs of owning different funds. In addition, if these transaction costs were included, your costs would have been higher.
| | | | | | | | | | | | | | | | | | | | | | | | | | | | | | | | | | | | | | | | | | | | |
| Based on actual total return1 | | | | | Based on hypothetical total return1 | |
| | | Actual
Total
Return2 | | | Beginning
Account
Value | | | Ending
Account
Value | | | Annualized
Expense
Ratio3 | | | Expenses
Paid
During
the
Period4 | | | | | | | Hypothetical
Annualized
Total
Return | | | Beginning
Account
Value | | | Ending
Account
Value | | | Annualized
Expense
Ratio3 | | | Expenses
Paid
During
the
Period4 | |
| Legg Mason Variable Lifestyle Allocation 85% | | | 8.40 | % | | $ | 1,000.00 | | | $ | 1,084.00 | | | | 0.11 | % | | $ | 0.58 | | | | | Legg Mason Variable Lifestyle Allocation 85% | | | 5.00 | % | | $ | 1,000.00 | | | $ | 1,024.58 | | | | 0.11 | % | | $ | 0.56 | |
| Legg Mason Variable Lifestyle Allocation 70% | | | 7.37 | % | | $ | 1,000.00 | | | $ | 1,073.70 | | | | 0.17 | % | | $ | 0.89 | | | | | Legg Mason Variable Lifestyle Allocation 70% | | | 5.00 | % | | $ | 1,000.00 | | | $ | 1,024.28 | | | | 0.17 | % | | $ | 0.87 | |
| Legg Mason Variable Lifestyle Allocation 50% | | | 6.36 | % | | $ | 1,000.00 | | | $ | 1,063.60 | | | | 0.10 | % | | $ | 0.52 | | | | | Legg Mason Variable Lifestyle Allocation 50% | | | 5.00 | % | | $ | 1,000.00 | | | $ | 1,024.63 | | | | 0.10 | % | | $ | 0.51 | |
| 1 | For the six months ended December 31, 2012. |
| 2 | Assumes the reinvestment of all distributions, including returns of capital, if any, at net asset value. Total return is not annualized, as it may not be representative of the total return for the year. Total returns do not reflect expenses associated with separate accounts such as administrative fees, account charges and surrender charges, which, if reflected, would reduce the total returns. Performance figures may reflect compensating balance arrangements, fee waivers and/or expense reimbursements. In the absence of compensating balance arrangements, fee waivers and/or expense reimbursements, the total return would have been lower. Past performance is no guarantee of future results. |
| 3 | The expense ratios do not include expenses of the Underlying Funds in which each Portfolio invests. |
| 4 | Expenses (net of compensating balance arrangements, fee waivers and/or expense reimbursements) are equal to each Portfolio’s respective annualized expense ratio multiplied by the average account value over the period, multiplied by the number of days in the most recent fiscal half-year (184), then divided by 366. |
| | | | |
| Legg Mason Variable Lifestyle Series 2012 Annual Report | | | 11 | |
Portfolios performance (unaudited)
Legg Mason Variable Lifestyle Allocation 85%
| | | | |
| Average annual total returns1 | | | |
| | | | |
| Twelve Months Ended 12/31/12 | | | 15.89 | % |
| Five Years Ended 12/31/12 | | | 1.66 | |
| Ten Years Ended 12/31/12 | | | 7.03 | |
| | | | |
Cumulative total returns1 | | | |
| 12/31/02 through 12/31/12 | | | 97.27 | % |
Legg Mason Variable Lifestyle Allocation 70%
| | | | |
| Average annual total returns1 | | | |
| | | | |
| Twelve Months Ended 12/31/12 | | | 14.60 | % |
| Five Years Ended 12/31/12 | | | 3.20 | |
| Ten Years Ended 12/31/12 | | | 6.94 | |
| | | | |
| Cumulative total returns1 | | | |
| 12/31/02 through 12/31/12 | | | 95.63 | % |
Legg Mason Variable Lifestyle Allocation 50%
| | | | |
| Average annual total returns1 | | | |
| | | | |
| Twelve Months Ended 12/31/12 | | | 13.10 | % |
| Five Years Ended 12/31/12 | | | 4.70 | |
| Ten Years Ended 12/31/12 | | | 6.43 | |
| | | | |
| Cumulative total returns1 | | | |
| 12/31/02 through 12/31/12 | | | 86.47 | % |
All figures represent past performance and are not a guarantee of future results. Investment return and principal value of an investment will fluctuate so that an investor’s shares, when redeemed, may be worth more or less than their original cost. The returns shown do not reflect expenses associated with separate accounts such as administrative fees, account charges and surrender charges, which, if reflected, would reduce the total returns. Performance figures may reflect compensating balance arrangements, fee waivers and/or expense reimbursements. In the absence of compensating balance arrangements, fee waivers and/or expense reimbursements, the total return would have been lower.
| 1 | Assumes the reinvestment of all distributions, including returns of capital, if any, at net asset value. |
| | |
| 12 | | Legg Mason Variable Lifestyle Series 2012 Annual Report |
Portfolios performance (unaudited) (cont’d)
Historical performance
Value of $10,000 invested in
Legg Mason Variable Lifestyle Allocation 85% vs. Benchmark Indices† — December 2002 - December 2012
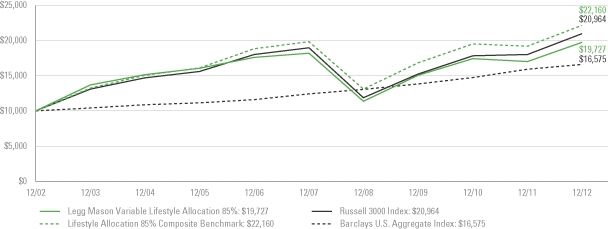
All figures represent past performance and are not a guarantee of future results. Investment return and principal value of an investment will fluctuate so that an investor’s shares, when redeemed, may be worth more or less than their original cost. The returns shown do not reflect expenses associated with separate accounts such as administrative fees, account charges and surrender charges, which, if reflected, would reduce the total returns. Performance figures may reflect compensating balance arrangements, fee waivers and/or expense reimbursements. In the absence of compensating balance arrangements, fee waivers and/or expense reimbursements, the total return would have been lower.
| † | Hypothetical illustration of $10,000 invested in Legg Mason Variable Lifestyle Allocation 85% on December 31, 2002, assuming the reinvestment of all distributions, including returns of capital, if any, at net asset value through December 31, 2012. The hypothetical illustration also assumes a $10,000 investment in the Barclays U.S. Aggregate Index, Russell 3000 Index and Lifestyle Allocation 85% Composite Benchmark. The Barclays U.S. Aggregate Index is a broad-based bond index comprised of government, corporate, mortgage- and asset-backed issues, rated investment grade or higher, and having at least one year to maturity. The Russell 3000 Index measures the performance of the 3,000 largest U.S. companies based on total market capitalization, which represents approximately 98% of the U.S. equity market. The Lifestyle Allocation 85% Composite Benchmark is a hypothetical representation of the performance of the Portfolio’s major asset classes. It consists of 45% Russell 1000 Index, 20% Russell 2000 Index, 20% MSCI EAFE Index, 10% Barclays U.S. Aggregate Index and 5% Barclays U.S. Corporate High Yield — 2% Issuer Cap Index. The Russell 1000 Index measures the performance of the 1,000 largest companies in the Russell 3000 Index, which represents approximately 92% of the total market capitalization of the Russell 3000 Index. The Russell 2000 Index measures the performance of the 2,000 smallest companies in the Russell 3000 Index, which represents approximately 8% of the total market capitalization of the Russell 3000 Index. The MSCI EAFE Index is a free float-adjusted market capitalization index designed to measure developed market equity performance, excluding the U.S. and Canada. The Barclays U.S. Corporate High Yield — 2% Issuer Cap Index is an index of the 2% Issuer Cap component of the Barclays U.S. Corporate High Yield Index, which covers the U.S. dollar-denominated, non-investment grade, fixed-rate, taxable corporate bond market. The Indices are unmanaged and are not subject to the same management and trading expenses of a mutual fund. Please note that an investor cannot invest directly in an index. |
| | | | |
| Legg Mason Variable Lifestyle Series 2012 Annual Report | | | 13 | |
Historical performance
Value of $10,000 invested in
Legg Mason Variable Lifestyle Allocation 70% vs. Benchmark Indices† — December 2002 - December 2012
All figures represent past performance and are not a guarantee of future results. Investment return and principal value of an investment will fluctuate so that an investor’s shares, when redeemed, may be worth more or less than their original cost. The returns shown do not reflect expenses associated with separate accounts such as administrative fees, account charges and surrender charges, which, if reflected, would reduce the total returns. Performance figures may reflect compensating balance arrangements, fee waivers and/or expense reimbursements. In the absence of compensating balance arrangements, fee waivers and/or expense reimbursements, the total return would have been lower.
| † | Hypothetical illustration of $10,000 invested in Legg Mason Variable Lifestyle Allocation 70% on December 31, 2002, assuming the reinvestment of all distributions, including returns of capital, if any, at net asset value through December 31, 2012. The hypothetical illustration also assumes a $10,000 investment in the Barclays U.S. Aggregate Index, Russell 3000 Index and Lifestyle Allocation 70% Composite Benchmark. The Barclays U.S. Aggregate Index is a broad-based bond index comprised of government, corporate, mortgage- and asset-backed issues, rated investment grade or higher, and having at least one year to maturity. The Russell 3000 Index measures the performance of the 3,000 largest U.S. companies based on total market capitalization, which represents approximately 98% of the U.S. equity market. The Lifestyle Allocation 70% Composite Benchmark is a hypothetical representation of the performance of the Portfolio’s major asset classes. It consists of 40% Russell 1000 Index, 15% Russell 2000 Index, 15% MSCI EAFE Index, 25% Barclays U.S. Aggregate Index and 5% Barclays U.S. Corporate High Yield — 2% Issuer Cap Index. The Russell 1000 Index measures the performance of the 1,000 largest companies in the Russell 3000 Index, which represents approximately 92% of the total market capitalization of the Russell 3000 Index. The Russell 2000 Index measures the performance of the 2,000 smallest companies in the Russell 3000 Index, which represents approximately 8% of the total market capitalization of the Russell 3000 Index. The MSCI EAFE Index is a free float-adjusted market capitalization index designed to measure developed market equity performance, excluding the U.S. and Canada. The Barclays U.S. Corporate High Yield — 2% Issuer Cap Index is an index of the 2% Issuer Cap component of the Barclays U.S. Corporate High Yield Index, which covers the U.S. dollar-denominated, non-investment grade, fixed-rate, taxable corporate bond market. The Indices are unmanaged and are not subject to the same management and trading expenses of a mutual fund. Please note that an investor cannot invest directly in an index. |
| | |
| 14 | | Legg Mason Variable Lifestyle Series 2012 Annual Report |
Portfolios performance (unaudited) (cont’d)
Historical performance
Value of $10,000 invested in
Legg Mason Variable Lifestyle Allocation 50% vs. Benchmark Indices† — December 2002 - December 2012
All figures represent past performance and are not a guarantee of future results. Investment return and principal value of an investment will fluctuate so that an investor’s shares, when redeemed, may be worth more or less than their original cost. The returns shown do not reflect expenses associated with separate accounts such as administrative fees, account charges and surrender charges, which, if reflected, would reduce the total returns. Performance figures may reflect compensating balance arrangements, fee waivers and/or expense reimbursements. In the absence of compensating balance arrangements, fee waivers and/or expense reimbursements, the total return would have been lower.
| † | Hypothetical illustration of $10,000 invested in Legg Mason Variable Lifestyle Allocation 50% on December 31, 2002, assuming the reinvestment of all distributions, including returns of capital, if any, at net asset value through December 31, 2012. The hypothetical illustration also assumes a $10,000 investment in the Barclays U.S. Aggregate Index, Russell 1000 Index and Lifestyle Allocation 50% Composite Benchmark. The Barclays U.S. Aggregate Index is a broad-based bond index comprised of government, corporate, mortgage- and asset-backed issues, rated investment grade or higher, and having at least one year to maturity. The Russell 1000 Index measures the performance of the 1,000 largest companies in the Russell 3000 Index, which represents approximately 92% of the total market capitalization of the Russell 3000 Index. The Lifestyle Allocation 50% Composite Benchmark is a hypothetical representation of the performance of the Portfolio’s major asset classes. It consists of 28% Russell 1000 Index, 12% Russell 2000 Index, 10% MSCI EAFE Index, 43% Barclays U.S. Aggregate Index and 7% Barclays U.S. Corporate High Yield — 2% Issuer Cap Index. The Russell 2000 Index measures the performance of the 2,000 smallest companies in the Russell 3000 Index, which represents approximately 8% of the total market capitalization of the Russell 3000 Index. The MSCI EAFE Index is a free float-adjusted market capitalization index designed to measure developed market equity performance, excluding the U.S. and Canada. The Barclays U.S. Corporate High Yield — 2% Issuer Cap Index is an index of the 2% Issuer Cap component of the Barclays U.S. Corporate High Yield Index, which covers the U.S. dollar-denominated, non-investment grade, fixed-rate, taxable corporate bond market. The Indices are unmanaged and are not subject to the same management and trading expenses of a mutual fund. Please note that an investor cannot invest directly in an index. |
| | | | |
| Legg Mason Variable Lifestyle Series 2012 Annual Report | | | 15 | |
Schedules of investments
December 31, 2012
Legg Mason Variable Lifestyle Allocation 85%
| | | | | | | | | | | | | | |
| Description | | | | | | | Shares | | | Value | |
| Investments in Underlying Funds — 100.0% | | | | | | | | | | | | | | |
Legg Mason Global Asset Management Trust: | | | | | | | | | | | | | | |
Legg Mason Batterymarch International Equity Trust, Class IS Shares | | | | | | | | | 875,544 | | | $ | 10,909,278 | |
Legg Mason BW Diversified Large Cap Value Fund, Class IS Shares | | | | | | | | | 801,930 | | | | 12,213,387 | |
Legg Mason Strategic Real Return Fund, Class IS Shares | | | | | | | | | 540,672 | | | | 7,574,815 | |
Legg Mason Partners Equity Trust: | | | | | | | | | | | | | | |
ClearBridge Aggressive Growth Fund, Class IS Shares | | | | | | | | | 81,522 | | | | 11,137,501 | * |
ClearBridge Appreciation Fund, Class IS Shares | | | | | | | | | 773,862 | | | | 12,095,458 | |
ClearBridge International All Cap Opportunity Fund, Class IS Shares | | | | | | | | | 1,262,685 | | | | 11,654,579 | |
ClearBridge Mid Cap Core Fund, Class IS Shares | | | | | | | | | 227,158 | | | | 5,656,235 | |
ClearBridge Small Cap Growth Fund, Class IS Shares | | | | | | | | | 375,296 | | | | 7,858,697 | * |
Legg Mason Batterymarch U.S. Large Cap Equity Fund, Class IS Shares | | | | | | | | | 1,019,252 | | | | 12,220,829 | |
The Royce Fund — Royce Value Fund, Institutional Class Shares | | | | | | | | | 701,526 | | | | 7,983,364 | |
Western Asset Funds, Inc.: | | | | | | | | | | | | | | |
Western Asset Core Plus Bond Fund, Class IS Shares | | | | | | | | | 422,151 | | | | 4,926,497 | |
Western Asset High Yield Fund, Class IS Shares | | | | | | | | | 371,317 | | | | 3,345,565 | |
Western Asset Total Return Unconstrained Fund, Class IS Shares | | | | | | | | | 411,615 | | | | 4,375,466 | |
Total Investments in Underlying Funds before Short-Term Investments (Cost — $92,737,700) | | | | 111,951,671 | |
| | | | |
| | | Rate | | | Maturity
Date | | Face
Amount | | | | |
| Short-Term Investments — 0.0% | | | | | | | | | | | | | | |
Repurchase Agreements — 0.0% | | | | | | | | | | | | | | |
Interest in $159,821,000 joint tri-party repurchase agreement dated 12/31/12 with Deutsche Bank Securities Inc.; Proceeds at maturity — $31,000; (Fully collateralized by various U.S. government agency obligations, 0.000% to 5.125% due 10/18/13 to 11/2/40; Market value — $31,620) (Cost — $31,000) | | | 0.200 | % | | 1/2/13 | | $ | 31,000 | | | | 31,000 | |
Total Investments — 100.0% (Cost — $92,768,700#) | | | | | | | | | | | | | 111,982,671 | |
Liabilities in Excess of Other Assets — (0.0)% | | | | | | | | | | | | | (54,026 | ) |
Total Net Assets — 100.0% | | | | | | | | | | | | $ | 111,928,645 | |
| * | Non-income producing security. |
| # | Aggregate cost for federal income tax purposes is $100,618,664. |
See Notes to Financial Statements.
| | |
| 16 | | Legg Mason Variable Lifestyle Series 2012 Annual Report |
Schedules of investments (cont’d)
December 31, 2012
Legg Mason Variable Lifestyle Allocation 70%
| | | | | | | | | | | | | | |
| Description | | | | | | | Shares | | | Value | |
| Investments in Underlying Funds — 100.0% | | | | | | | | | | | | | | |
Legg Mason Global Asset Management Trust: | | | | | | | | | | | | | | |
Legg Mason Batterymarch International Equity Trust, Class IS Shares | | | | | | | | | 257,806 | | | $ | 3,212,266 | |
Legg Mason BW Diversified Large Cap Value Fund, Class IS Shares | | | | | | | | | 337,781 | | | | 5,144,404 | |
Legg Mason Strategic Real Return Fund, Class IS Shares | | | | | | | | | 260,551 | | | | 3,650,314 | |
Legg Mason Partners Equity Trust: | | | | | | | | | | | | | | |
ClearBridge Aggressive Growth Fund, Class IS Shares | | | | | | | | | 34,531 | | | | 4,717,634 | * |
ClearBridge Appreciation Fund, Class IS Shares | | | | | | | | | 328,621 | | | | 5,136,349 | |
ClearBridge International All Cap Opportunity Fund, Class IS Shares | | | | | | | | | 414,402 | | | | 3,824,929 | |
ClearBridge Mid Cap Core Fund, Class IS Shares | | | | | | | | | 96,979 | | | | 2,414,775 | |
ClearBridge Small Cap Growth Fund, Class IS Shares | | | | | | | | | 125,500 | | | | 2,627,973 | * |
Legg Mason Batterymarch U.S. Large Cap Equity Fund, Class IS Shares | | | | | | | | | 432,661 | | | | 5,187,600 | |
The Royce Fund — Royce Value Fund, Institutional Class Shares | | | | | | | | | 233,395 | | | | 2,656,034 | |
Western Asset Funds, Inc.: | | | | | | | | | | | | | | |
Western Asset Core Plus Bond Fund, Class IS Shares | | | | | | | | | 541,288 | | | | 6,316,834 | |
Western Asset High Yield Fund, Class IS Shares | | | | | | | | | 232,095 | | | | 2,091,175 | |
Western Asset Total Return Unconstrained Fund, Class IS Shares | | | | | | | | | 483,673 | | | | 5,141,447 | |
Total Investments in Underlying Funds before Short-Term Investments (Cost — $41,657,763) | | | | | | | | | | 52,121,734 | |
| | | | |
| | | Rate | | | Maturity
Date | | Face
Amount | | | | |
| Short-Term Investments — 0.1% | | | | | | | | | | | | | | |
Repurchase Agreements — 0.1% | | | | | | | | | | | | | | |
Interest in $159,821,000 joint tri-party repurchase agreement dated 12/31/12 with Deutsche Bank Securities Inc.; Proceeds at maturity — $58,001; (Fully collateralized by various U.S. government agency obligations, 0.000% to 5.125% due 10/18/13 to 11/2/40; Market value — $59,160) (Cost — $58,000) | | | 0.200 | % | | 1/2/13 | | $ | 58,000 | | | | 58,000 | |
Total Investments — 100.1% (Cost — $41,715,763#) | | | | | | | | | | | | | 52,179,734 | |
Liabilities in Excess of Other Assets — (0.1)% | | | | | | | | | | | | | (66,495 | ) |
Total Net Assets — 100.0% | | | | | | | | | | | | $ | 52,113,239 | |
| * | Non-income producing security. |
| # | Aggregate cost for federal income tax purposes is $45,846,616. |
See Notes to Financial Statements.
| | | | |
| Legg Mason Variable Lifestyle Series 2012 Annual Report | | | 17 | |
Legg Mason Variable Lifestyle Allocation 50%
| | | | | | | | | | | | | | |
| Description | | | | | | | Shares | | | Value | |
| Investments in Underlying Funds — 99.8% | | | | | | | | | | | | | | |
Legg Mason Global Asset Management Trust: | | | | | | | | | | | | | | |
Legg Mason Batterymarch International Equity Trust, Class IS Shares | | | | | | | | | 387,247 | | | $ | 4,825,099 | |
Legg Mason BW Diversified Large Cap Value Fund, Class IS Shares | | | | | | | | | 531,187 | | | | 8,089,982 | |
Legg Mason Strategic Real Return Fund, Class IS Shares | | | | | | | | | 581,580 | | | | 8,147,936 | |
Legg Mason Partners Equity Trust: | | | | | | | | | | | | | | |
ClearBridge Aggressive Growth Fund, Class IS Shares | | | | | | | | | 51,918 | | | | 7,092,994 | * |
ClearBridge Appreciation Fund, Class IS Shares | | | | | | | | | 517,448 | | | | 8,087,716 | |
ClearBridge International All Cap Opportunity Fund, Class IS Shares | | | | | | | | | 529,116 | | | | 4,883,739 | |
ClearBridge Mid Cap Core Fund, Class IS Shares | | | | | | | | | 167,259 | | | | 4,164,751 | |
ClearBridge Small Cap Growth Fund, Class IS Shares | | | | | | | | | 225,975 | | | | 4,731,919 | * |
Legg Mason Batterymarch U.S. Large Cap Equity Fund, Class IS Shares | | | | | | | | | 680,449 | | | | 8,158,580 | |
The Royce Fund — Royce Value Fund, Institutional Class Shares | | | | | | | | | 424,283 | | | | 4,828,342 | |
Western Asset Funds, Inc.: | | | | | | | | | | | | | | |
Western Asset Core Plus Bond Fund, Class IS Shares | | | | | | | | | 2,685,078 | | | | 31,334,855 | |
Western Asset High Yield Fund, Class IS Shares | | | | | | | | | 782,830 | | | | 7,053,300 | |
Western Asset Total Return Unconstrained Fund, Class IS Shares | | | | | | | | | 1,407,747 | | | | 14,964,347 | |
Total Investments in Underlying Funds before Short-Term Investments (Cost — $96,962,618) | | | | | | | 116,363,560 | |
| | | | |
| | | Rate | | | Maturity
Date | | Face
Amount | | | | |
| Short-Term Investments — 0.2% | | | | | | | | | | | | | | |
Repurchase Agreements — 0.2% | | | | | | | | | | | | | | |
Interest in $159,821,000 joint tri-party repurchase agreement dated 12/31/12 with Deutsche Bank Securities Inc.; Proceeds at maturity $197,002 (Fully collateralized by various U.S. government agency obligations, 0.000% to 5.125% due 10/18/13 to 11/2/40; Market value $200,940) (Cost — $197,000) | | | 0.200 | % | | 1/2/13 | | $ | 197,000 | | | | 197,000 | |
Total Investments — 100.0% (Cost — $97,159,618#) | | | | | | | | | | | | | 116,560,560 | |
Liabilities in Excess of Other Assets — (0.0)% | | | | | | | | | | | | | (91 | ) |
Total Net Assets — 100.0% | | | | | | | | | | | | $ | 116,560,469 | |
| * | Non-income producing security. |
| # | Aggregate cost for federal income tax purposes is $105,800,535. |
See Notes to Financial Statements.
| | |
| 18 | | Legg Mason Variable Lifestyle Series 2012 Annual Report |
Statements of assets and liabilities
December 31, 2012
| | | | | | | | | | | | |
| | | Legg Mason
Variable
Lifestyle
Allocation 85% | | | Legg Mason
Variable
Lifestyle
Allocation 70% | | | Legg Mason
Variable
Lifestyle
Allocation 50% | |
| | | |
| Assets: | | | | | | | | | | | | |
Investments, at cost | | $ | 92,768,700 | | | $ | 41,715,763 | | | $ | 97,159,618 | |
Investments, at value | | | 111,982,671 | | | | 52,179,734 | | | | 116,560,560 | |
Cash | | | 391 | | | | 29 | | | | 163 | |
Receivable for Underlying Funds sold | | | 79,476 | | | | 23,289 | | | | 110,060 | |
Receivable for Portfolio shares sold | | | — | | | | — | | | | 2,806 | |
Prepaid expenses | | | 2,230 | | | | 1,340 | | | | 2,336 | |
Total Assets | | | 112,064,768 | | | | 52,204,392 | | | | 116,675,925 | |
| | | |
| Liabilities: | | | | | | | | | | | | |
Payable for Portfolio shares repurchased | | | 88,373 | | | | 49,694 | | | | 66,265 | |
Accrued expenses | | | 47,750 | | | | 41,459 | | | | 49,191 | |
Total Liabilities | | | 136,123 | | | | 91,153 | | | | 115,456 | |
| Total Net Assets | | $ | 111,928,645 | | | $ | 52,113,239 | | | $ | 116,560,469 | |
| | | |
| Net Assets: | | | | | | | | | | | | |
Par value (Note 5) | | $ | 84 | | | $ | 44 | | | $ | 93 | |
Paid-in capital in excess of par value | | | 103,216,457 | | | | 58,942,474 | | | | 125,577,052 | |
Undistributed net investment income | | | 476,790 | | | | 106,274 | | | | 65,112 | |
Accumulated net realized loss on Underlying Funds and capital gain distributions from Underlying Funds | | | (10,978,657) | | | | (17,399,524) | | | | (28,482,730) | |
Net unrealized appreciation on investments | | | 19,213,971 | | | | 10,463,971 | | | | 19,400,942 | |
| Total Net Assets | | $ | 111,928,645 | | | $ | 52,113,239 | | | $ | 116,560,469 | |
| | | |
| Shares Outstanding | | | 8,442,956 | | | | 4,449,059 | | | | 9,262,499 | |
| | | |
| Net Asset Value | | | $13.26 | | | | $11.71 | | | | $12.58 | |
See Notes to Financial Statements.
| | | | |
| Legg Mason Variable Lifestyle Series 2012 Annual Report | | | 19 | |
Statements of operations
For the Year Ended December 31, 2012
| | | | | | | | | | | | |
| | | Legg Mason
Variable
Lifestyle
Allocation 85% | | | Legg Mason
Variable
Lifestyle
Allocation 70% | | | Legg Mason
Variable
Lifestyle
Allocation 50% | |
| | | |
| Investment Income: | | | | | | | | | | | | |
Income distributions from Underlying Funds | | $ | 1,898,623 | | | $ | 1,034,880 | | | $ | 2,758,933 | |
Short-term capital gains distributions from Underlying Funds | | | 238,161 | | | | 101,331 | | | | 167,004 | |
Interest | | | 194 | | | | 91 | | | | 469 | |
Total Investment Income | | | 2,136,978 | | | | 1,136,302 | | | | 2,926,406 | |
| | | |
| Expenses: | | | | | | | | | | | | |
Shareholder reports | | | 35,371 | | | | 22,222 | | | | 33,377 | |
Audit and tax | | | 27,941 | | | | 27,421 | | | | 28,013 | |
Legal fees | | | 23,715 | | | | 23,285 | | | | 24,488 | |
Fund accounting fees | | | 10,955 | | | | 5,455 | | | | 11,230 | |
Trustees’ fees | | | 9,042 | | | | 4,639 | | | | 9,774 | |
Transfer agent fees | | | 6,460 | | | | 6,402 | | | | 6,447 | |
Insurance | | | 3,435 | | | | 2,236 | | | | 3,692 | |
Custody fees | | | 102 | | | | 84 | | | | 224 | |
Miscellaneous expenses | | | 1,266 | | | | 1,119 | | | | 1,294 | |
Total Expenses | | | 118,287 | | | | 92,863 | | | | 118,539 | |
Less: Fee waivers and/or expense reimbursements | | | — | | | | (7) | | | | — | |
Net Expenses | | | 118,287 | | | | 92,856 | | | | 118,539 | |
| Net Investment Income | | | 2,018,691 | | | | 1,043,446 | | | | 2,807,867 | |
| | | |
| Realized and Unrealized Gain (Loss) on Underlying Funds and Capital Gain Distributions from Underlying Funds (Notes 1 and 3): | | | | | | | | | | | | |
Net Realized Gain (Loss) From: | | | | | | | | | | | | |
Sale of Underlying Funds | | | (1,168,821) | | | | 27,723 | | | | 898,160 | |
Capital gain distributions from Underlying Funds | | | 1,270,709 | | | | 494,139 | | | | 825,148 | |
Net Realized Gain | | | 101,888 | | | | 521,862 | | | | 1,723,308 | |
Change in Net Unrealized Appreciation (Depreciation) on Underlying Funds | | | 13,746,979 | | | | 5,991,594 | | | | 9,886,036 | |
| Net Gain on Underlying Funds and Capital Gain Distributions from Underlying Funds | | | 13,848,867 | | | | 6,513,456 | | | | 11,609,344 | |
| Increase in Net Assets from Operations | | $ | 15,867,558 | | | $ | 7,556,902 | | | $ | 14,417,211 | |
See Notes to Financial Statements.
| | |
| 20 | | Legg Mason Variable Lifestyle Series 2012 Annual Report |
Statements of changes in net assets
Legg Mason Variable Lifestyle Allocation 85%
| | | | | | | | |
| For the Years Ended December 31, | | 2012 | | | 2011 | |
| | |
| Operations: | | | | | | | | |
Net investment income | | $ | 2,018,691 | | | $ | 1,702,079 | |
Net realized gain (loss) | | | 101,888 | | | | (1,173,625) | |
Change in net unrealized appreciation (depreciation) | | | 13,746,979 | | | | (2,627,779) | |
Increase (Decrease) in Net Assets From Operations | | | 15,867,558 | | | | (2,099,325) | |
| | |
| Distributions to Shareholders From (Note 1): | | | | | | | | |
Net investment income | | | (1,968,126) | | | | (1,550,012) | |
Decrease in Net Assets From Distributions to Shareholders | | | (1,968,126) | | | | (1,550,012) | |
| | |
| Portfolio Share Transactions (Note 5): | | | | | | | | |
Net proceeds from sale of shares | | | 8,229,948 | | | | 12,351,791 | |
Reinvestment of distributions | | | 1,968,126 | | | | 1,550,012 | |
Cost of shares repurchased | | | (12,205,466) | | | | (14,053,403) | |
Decrease in Net Assets From Portfolio Share Transactions | | | (2,007,392) | | | | (151,600) | |
Increase (Decrease) in Net Assets | | | 11,892,040 | | | | (3,800,937) | |
| | |
| Net Assets: | | | | | | | | |
Beginning of year | | | 100,036,605 | | | | 103,837,542 | |
End of year* | | $ | 111,928,645 | | | $ | 100,036,605 | |
* Includes undistributed net investment income of: | | | $476,790 | | | | $426,225 | |
See Notes to Financial Statements.
| | | | |
| Legg Mason Variable Lifestyle Series 2012 Annual Report | | | 21 | |
Statements of changes in net assets
Legg Mason Variable Lifestyle Allocation 70%
| | | | | | | | |
| For the Years Ended December 31, | | 2012 | | | 2011 | |
| | |
| Operations: | | | | | | | | |
Net investment income | | $ | 1,043,446 | | | $ | 1,159,836 | |
Net realized gain (loss) | | | 521,862 | | | | (1,333,536) | |
Change in net unrealized appreciation (depreciation) | | | 5,991,594 | | | | 101,469 | |
Increase (Decrease) in Net Assets From Operations | | | 7,556,902 | | | | (72,231) | |
| | |
| Distributions to Shareholders From (Note 1): | | | | | | | | |
Net investment income | | | (1,263,631) | | | | (1,150,006) | |
Decrease in Net Assets From Distributions to Shareholders | | | (1,263,631) | | | | (1,150,006) | |
| | |
| Portfolio Share Transactions (Note 5): | | | | | | | | |
Net proceeds from sale of shares | | | 401,500 | | | | 657,951 | |
Reinvestment of distributions | | | 1,263,631 | | | | 1,150,006 | |
Cost of shares repurchased | | | (12,145,672) | | | | (14,231,224) | |
Decrease in Net Assets From Portfolio Share Transactions | | | (10,480,541) | | | | (12,423,267) | |
Decrease in Net Assets | | | (4,187,270) | | | | (13,645,504) | |
| | |
| Net Assets: | | | | | | | | |
Beginning of year | | | 56,300,509 | | | | 69,946,013 | |
End of year* | | $ | 52,113,239 | | | $ | 56,300,509 | |
* Includes undistributed net investment income of: | | | $106,274 | | | | $326,459 | |
See Notes to Financial Statements.
| | |
| 22 | | Legg Mason Variable Lifestyle Series 2012 Annual Report |
Statements of changes in net assets
Legg Mason Variable Lifestyle Allocation 50%
| | | | | | | | |
| For the Years Ended December 31, | | 2012 | | | 2011 | |
| | |
| Operations: | | | | | | | | |
Net investment income | | $ | 2,807,867 | | | $ | 2,961,408 | |
Net realized gain | | | 1,723,308 | | | | 2,381,478 | |
Change in net unrealized appreciation (depreciation) | | | 9,886,036 | | | | (3,759,572) | |
Increase in Net Assets From Operations | | | 14,417,211 | | | | 1,583,314 | |
| | |
| Distributions to Shareholders From (Note 1): | | | | | | | | |
Net investment income | | | (3,118,397) | | | | (3,050,003) | |
Decrease in Net Assets From Distributions to Shareholders | | | (3,118,397) | | | | (3,050,003) | |
| | |
| Portfolio Share Transactions (Note 5): | | | | | | | | |
Net proceeds from sale of shares | | | 8,552,039 | | | | 14,543,632 | |
Reinvestment of distributions | | | 3,118,397 | | | | 3,050,003 | |
Cost of shares repurchased | | | (21,383,729) | | | | (26,466,498) | |
Decrease in Net Assets From Portfolio Share Transactions | | | (9,713,293) | | | | (8,872,863) | |
Increase (Decrease) in Net Assets | | | 1,585,521 | | | | (10,339,552) | |
| | |
| Net Assets: | | | | | | | | |
Beginning of year | | | 114,974,948 | | | | 125,314,500 | |
End of year* | | $ | 116,560,469 | | | $ | 114,974,948 | |
* Includes undistributed net investment income of: | | | $65,112 | | | | $375,642 | |
See Notes to Financial Statements.
| | | | |
| Legg Mason Variable Lifestyle Series 2012 Annual Report | | | 23 | |
Financial highlights
Legg Mason Variable Lifestyle Allocation 85%
| | | | | | | | | | | | | | | | | | | | | | | | |
| For a share of beneficial interest outstanding throughout each year ended December 31, unless otherwise noted: | |
| | | 20121 | | | 2011 | | | 2010 | | | 20092 | | | 20093 | | | 20083 | |
| | | | | | |
| Net asset value, beginning of year | | | $11.65 | | | | $12.11 | | | | $10.63 | | | | $7.73 | | | | $12.75 | | | | $14.39 | |
| | | | | | |
| Income (loss) from operations: | | | | | | | | | | | | | | | | | | | | | | | | |
Net investment income | | | 0.23 | 4 | | | 0.20 | 4 | | | 0.18 | | | | 0.20 | 4 | | | 0.23 | 4 | | | 0.24 | 4 |
Net realized and unrealized gain (loss) | | | 1.61 | | | | (0.48) | | | | 1.48 | | | | 2.92 | | | | (4.97) | | | | (0.71) | |
Total income (loss) from operations | | | 1.84 | | | | (0.28) | | | | 1.66 | | | | 3.12 | | | | (4.74) | | | | (0.47) | |
| | | | | | |
| Less distributions from: | | | | | | | | | | | | | | | | | | | | | | | | |
Net investment income | | | (0.23) | | | | (0.18) | | | | (0.18) | | | | (0.22) | | | | (0.20) | | | | (0.22) | |
Net realized gains | | | — | | | | — | | | | — | | | | — | | | | (0.08) | | | | (0.95) | |
Total distributions | | | (0.23) | | | | (0.18) | | | | (0.18) | | | | (0.22) | | | | (0.28) | | | | (1.17) | |
| | | | | | |
| Net asset value, end of year | | | $13.26 | | | | $11.65 | | | | $12.11 | | | | $10.63 | | | | $7.73 | | | | $12.75 | |
Total return5 | | | 15.89 | % | | | (2.31) | % | | | 15.70 | %6 | | | 40.53 | %6 | | | (37.53) | % | | | (3.87) | % |
| | | | | | |
| Net assets, end of year (000s) | | | $111,929 | | | | $100,037 | | | | $103,838 | | | | $89,463 | | | | $59,371 | | | | $83,678 | |
| | | | | | |
| Ratios to average net assets: | | | | | | | | | | | | | | | | | | | | | | | | |
Gross expenses7 | | | 0.11 | % | | | 0.11 | % | | | 0.15 | % | | | 0.21 | %8 | | | 0.15 | % | | | 0.32 | %9 |
Net expenses7,10,11 | | | 0.11 | | | | 0.11 | | | | 0.15 | | | | 0.19 | 8,12 | | | 0.12 | 12 | | | 0.32 | 9 |
Net investment income | | | 1.85 | | | | 1.64 | | | | 1.65 | | | | 2.52 | 8 | | | 2.30 | | | | 1.87 | |
| | | | | | |
| Portfolio turnover rate | | | 14 | % | | | 40 | % | | | 17 | % | | | 10 | % | | | 34 | % | | | 19 | % |
| 1 | Per share amounts have been calculated using the average shares method. |
| 2 | For the period February 1, 2009 through December 31, 2009. |
| 3 | For the year ended January 31. |
| 4 | Net investment income per share includes short-term capital gain distributions from Underlying Funds. |
| 5 | Performance figures may reflect compensating balance arrangements, fee waivers and/or expense reimbursements. In the absence of compensating balance arrangements, fee waivers and/or expense reimbursements, the total return would have been lower. Total returns do not reflect expenses associated with separate accounts such as administrative fees, account charges and surrender charges which, if reflected, would reduce the total return for all periods shown. Past performance is no guarantee of future results. Total returns for periods of less than one year are not annualized. |
| 6 | The total return includes gains from settlement of investment litigations. Without these gains, the total return would have been 15.60% and 39.87% for the year ended December 31, 2010 and the period ended December 31, 2009, respectively. |
| 7 | Does not include expenses of the Underlying Funds in which the Portfolio invests. |
| 9 | The gross and net expense ratios include interest expense. Excluding interest expense, the gross and net expense ratios would have been the same. |
| 10 | The impact of compensating balance arrangements, if any, was less than 0.01%. |
| 11 | As a result of an expense limitation arrangement, effective December 1, 2007, the ratio of expenses, other than brokerage, interest, taxes, extraordinary expenses and acquired fund fees and expenses, to average net assets of shares did not exceed 0.20%. This expense limitation arrangement cannot be terminated prior to December 31, 2014 without the Board of Trustees’ consent. |
| 12 | Reflects fee waivers and/or expense reimbursements. |
See Notes to Financial Statements.
| | |
| 24 | | Legg Mason Variable Lifestyle Series 2012 Annual Report |
Financial highlights (cont’d)
Legg Mason Variable Lifestyle Allocation 70%
| | | | | | | | | | | | | | | | | | | | | | | | |
| For a share of beneficial interest outstanding throughout each year ended December 31, unless otherwise noted: | |
| | | 20121 | | | 2011 | | | 2010 | | | 20092 | | | 20093 | | | 20083 | |
| | | | | | |
| Net asset value, beginning of year | | | $10.47 | | | | $10.74 | | | | $9.53 | | | | $7.09 | | | | $10.94 | | | | $11.62 | |
| | | | | | |
| Income (loss) from operations: | | | | | | | | | | | | | | | | | | | | | | | | |
Net investment income | | | 0.21 | 4 | | | 0.22 | 4 | | | 0.22 | | | | 0.27 | 4 | | | 0.30 | 4 | | | 0.33 | 4 |
Net realized and unrealized gain (loss) | | | 1.31 | | | | (0.28) | | | | 1.20 | | | | 2.47 | | | | (3.89) | | | | (0.50) | |
Total income (loss) from operations | | | 1.52 | | | | (0.06) | | | | 1.42 | | | | 2.74 | | | | (3.59) | | | | (0.17) | |
| | | | | | |
| Less distributions from: | | | | | | | | | | | | | | | | | | | | | | | | |
Net investment income | | | (0.28) | | | | (0.21) | | | | (0.21) | | | | (0.30) | | | | (0.25) | | | | (0.32) | |
Net realized gains | | | — | | | | — | | | | — | | | | — | | | | (0.01) | | | | (0.19) | |
Total distributions | | | (0.28) | | | | (0.21) | | | | (0.21) | | | | (0.30) | | | | (0.26) | | | | (0.51) | |
| | | | | | |
| Net asset value, end of year | | | $11.71 | | | | $10.47 | | | | $10.74 | | | | $9.53 | | | | $7.09 | | | | $10.94 | |
Total return5 | | | 14.60 | % | | | (0.58) | % | | | 15.01 | %6 | | | 38.90 | %6 | | | (33.03) | % | | | (1.64) | % |
| | | | | | |
| Net assets, end of year (000s) | | | $52,113 | | | | $56,301 | | | | $69,946 | | | | $71,982 | | | | $59,526 | | | | $108,500 | |
| | | | | | |
| Ratios to average net assets: | | | | | | | | | | | | | | | | | | | | | | | | |
Gross expenses7 | | | 0.17 | % | | | 0.14 | % | | | 0.20 | % | | | 0.23 | %8 | | | 0.14 | % | | | 0.32 | % |
Net expenses7,9,10 | | | 0.17 | 11 | | | 0.14 | | | | 0.18 | 11 | | | 0.20 | 8,11 | | | 0.10 | 11 | | | 0.32 | |
Net investment income | | | 1.90 | | | | 1.83 | | | | 2.02 | | | | 3.32 | 8 | | | 2.89 | | | | 2.67 | |
| | | | | | |
| Portfolio turnover rate | | | 11 | % | | | 30 | % | | | 14 | % | | | 11 | % | | | 26 | % | | | 15 | % |
| 1 | Per share amounts have been calculated using the average shares method. |
| 2 | For the period February 1, 2009 through December 31, 2009. |
| 3 | For the year ended January 31. |
| 4 | Net investment income per share includes short-term capital gain distributions from Underlying Funds. |
| 5 | Performance figures may reflect compensating balance arrangements, fee waivers and/or expense reimbursements. In the absence of compensating balance arrangements, fee waivers and/or expense reimbursements, the total return would have been lower. Total returns do not reflect expenses associated with separate accounts such as administrative fees, account charges and surrender charges which, if reflected, would reduce the total return for all periods shown. Past performance is no guarantee of future results. Total returns for periods of less than one year are not annualized. |
| 6 | The total return includes gains from settlement of investment litigations. Without these gains, the total return would have been 14.79% and 37.59% for the year ended December 31, 2010 and the period ended December 31, 2009, respectively. |
| 7 | Does not include expenses of the Underlying Funds in which the Portfolio invests. |
| 9 | The impact of compensating balance arrangements, if any, was less than 0.01%. |
| 10 | As a result of an expense limitation arrangement, effective December 1, 2007, the ratio of expenses, other than brokerage, interest, taxes, extraordinary expenses and acquired fund fees and expenses, to average net assets of shares did not exceed 0.20%. This expense limitation arrangement cannot be terminated prior to December 31, 2014 without the Board of Trustees’ consent. |
| 11 | Reflects fee waivers and/or expense reimbursements. |
See Notes to Financial Statements.
| | | | |
| Legg Mason Variable Lifestyle Series 2012 Annual Report | | | 25 | |
Legg Mason Variable Lifestyle Allocation 50%
| | | | | | | | | | | | | | | | | | | | | | | | |
| For a share of beneficial interest outstanding throughout each year ended December 31, unless otherwise noted: | |
| | | 20121 | | | 2011 | | | 2010 | | | 20092 | | | 20093 | | | 20083 | |
| | | | | | |
| Net asset value, beginning of year | | | $11.43 | | | | $11.60 | | | | $10.45 | | | | $8.06 | | | | $12.04 | | | | $12.61 | |
| | | | | | |
| Income (loss) from operations: | | | | | | | | | | | | | | | | | | | | | | | | |
Net investment income | | | 0.29 | 4 | | | 0.30 | 4 | | | 0.34 | | | | 0.43 | 4 | | | 0.46 | 4 | | | 0.47 | 4 |
Net realized and unrealized gain (loss) | | | 1.20 | | | | (0.16) | | | | 1.15 | | | | 2.44 | | | | (3.65) | | | | (0.45) | |
Total income (loss) from operations | | | 1.49 | | | | 0.14 | | | | 1.49 | | | | 2.87 | | | | (3.19) | | | | 0.02 | |
| | | | | | |
| Less distributions from: | | | | | | | | | | | | | | | | | | | | | | | | |
Net investment income | | | (0.34) | | | | (0.31) | | | | (0.34) | | | | (0.48) | | | | (0.40) | | | | (0.47) | |
Net realized gains | | | — | | | | — | | | | — | | | | — | | | | (0.39) | | | | (0.12) | |
Total distributions | | | (0.34) | | | | (0.31) | | | | (0.34) | | | | (0.48) | | | | (0.79) | | | | (0.59) | |
| | | | | | |
| Net asset value, end of year | | | $12.58 | | | | $11.43 | | | | $11.60 | | | | $10.45 | | | | $8.06 | | | | $12.04 | |
Total return5 | | | 13.10 | % | | | 1.17 | % | | | 14.35 | %6 | | | 35.93 | %6 | | | (27.51) | % | | | (0.01) | % |
| | | | | | |
| Net assets, end of year (000s) | | | $116,560 | | | | $114,975 | | | | $125,315 | | | | $126,294 | | | | $112,415 | | | | $198,862 | |
| | | | | | |
| Ratios to average net assets: | | | | | | | | | | | | | | | | | | | | | | | | |
Gross expenses7 | | | 0.10 | % | | | 0.09 | % | | | 0.13 | % | | | 0.14 | %8 | | | 0.09 | % | | | 0.31 | % |
Net expenses7,9,10 | | | 0.10 | | | | 0.09 | | | | 0.13 | | | | 0.14 | 8 | | | 0.07 | 11 | | | 0.31 | |
Net investment income | | | 2.39 | | | | 2.44 | | | | 2.89 | | | | 4.66 | 8 | | | 3.96 | | | | 3.53 | |
| | | | | | |
| Portfolio turnover rate | | | 14 | % | | | 37 | % | | | 20 | % | | | 11 | % | | | 24 | % | | | 15 | % |
| 1 | Per share amounts have been calculated using the average shares method. |
| 2 | For the period February 1, 2009 through December 31, 2009. |
| 3 | For the year ended January 31. |
| 4 | Net investment income per share includes short-term capital gain distributions from Underlying Funds. |
| 5 | Performance figures may reflect compensating balance arrangements, fee waivers and/or expense reimbursements. In the absence of compensating balance arrangements, fee waivers and/or expense reimbursements, the total return would have been lower. Total returns do not reflect expenses associated with separate accounts such as administrative fees, account charges and surrender charges which, if reflected, would reduce the total return for all periods shown. Past performance is no guarantee of future results. Total returns for periods of less than one year are not annualized. |
| 6 | The total return includes gains from settlement of investment litigations. Without these gains, the total return would have been 14.25% and 35.54% for the year ended December 31, 2010 and the period ended December 31, 2009, respectively. |
| 7 | Does not include expenses of the Underlying Funds in which the Portfolio invests. |
| 9 | The impact of compensating balance arrangements, if any, was less than 0.01%. |
| 10 | As a result of an expense limitation arrangement, effective December 1, 2007, the ratio of expenses, other than brokerage, interest, taxes, extraordinary expenses and acquired fund fees and expenses, to average net assets of shares did not exceed 0.20%. This expense limitation arrangement cannot be terminated prior to December 31, 2014 without the Board of Trustees’ consent. |
| 11 | Reflects fee waivers and/or expense reimbursements. |
See Notes to Financial Statements.
| | |
| 26 | | Legg Mason Variable Lifestyle Series 2012 Annual Report |
Notes to financial statements
1. Organization and significant accounting policies
Legg Mason Variable Lifestyle Allocation 85% (“Lifestyle Allocation 85%”), Legg Mason Variable Lifestyle Allocation 70% (“Lifestyle Allocation 70%”) and Legg Mason Variable Lifestyle Allocation 50% (“Lifestyle Allocation 50%”) (the “Portfolios”) are separate non-diversified investment series of Legg Mason Partners Variable Equity Trust (the “Trust”). The Trust, a Maryland statutory trust, is registered under the Investment Company Act of 1940, as amended (the “1940 Act”), as an open-end management investment company. The Portfolios invest in other mutual funds (“Underlying Funds”) which are affiliated with Legg Mason, Inc. (“Legg Mason”). Shares of the Portfolios are offered to separate accounts sponsored by certain life insurance companies and qualified pension and retirement plans, including affiliates of the investment manager.
The following are significant accounting policies consistently followed by the Portfolios and are in conformity with U.S. generally accepted accounting principles (“GAAP”). Estimates and assumptions are required to be made regarding assets, liabilities and changes in net assets resulting from operations when financial statements are prepared. Changes in the economic environment, financial markets and any other parameters used in determining these estimates could cause actual results to differ. Subsequent events have been evaluated through the date the financial statements were issued.
(a) Investment valuation. Investments in the Underlying Funds, excluding ETF’s, are valued at the closing net asset value per share of each Underlying Fund on the day of valuation. Equity securities for which market quotations are available are valued at the last reported sales price or official closing price on the primary market or exchange on which they trade. The valuations for fixed income securities (which may include, but are not limited to, corporate, government, municipal, mortgage-backed, collateralized mortgage obligations and asset-backed securities) and certain derivative instruments are typically the prices supplied by independent third party pricing services, which may use market prices or broker/dealer quotations or a variety of fair valuation techniques and methodologies. The independent third party pricing services use inputs that are observable such as issuer details, interest rates, yield curves, prepayment speeds, credit risks/spreads, default rates and quoted prices for similar securities. Short-term fixed income securities that will mature in 60 days or less are valued at amortized cost, unless it is determined that using this method would not reflect an investment’s fair value. When the Portfolios hold securities or other assets that are denominated in a foreign currency, the Portfolios will normally use the currency exchange rates as of 4:00 p.m. (Eastern Time). If independent third party pricing services are unable to supply prices for a portfolio investment, or if the prices supplied are deemed by the manager to be unreliable, the market price may be determined by the manager using quotations from one or more broker/dealers or at the transaction price if the security has recently been purchased and no value has yet been obtained from a pricing service or pricing broker. When reliable prices are not readily available, such as when the value of a security has been significantly affected by events after the close of the exchange or market on which the security is principally traded, but before the Portfolios calculate their net asset value, the Portfolios value these securities as determined in accordance with procedures approved by the Portfolios’ Board of Trustees.
The Board of Trustees is responsible for the valuation process and has delegated the supervision of the daily valuation process to the Legg Mason North American Fund Valuation Committee (the “Valuation Committee”). The Valuation Committee, pursuant to the policies adopted by the Board of Trustees, is responsible for making fair value determinations, evaluating the effectiveness of the Portfolios’ pricing policies, and reporting to the Board of Trustees. When determining the reliability of third party pricing information for investments owned by the Portfolios, the Valuation Committee, among other things, conducts due diligence reviews of pricing vendors, monitors the daily change in prices and reviews transactions among market participants.
The Valuation Committee will consider pricing methodologies it deems relevant and appropriate when making fair value determinations. Examples of possible methodologies include, but are not limited to, multiple of earnings; discount from market of a similar freely traded security; discounted cash-flow analysis; book value or a multiple thereof; risk premium/yield analysis; yield to maturity; and/or fundamental investment analysis. The Valuation Committee will also consider factors it deems relevant and appropriate in light of the facts and circumstances. Examples of possible factors include, but are not limited to, the type of security; the issuer’s financial statements; the purchase price of the security; the discount from market
| | | | |
| Legg Mason Variable Lifestyle Series 2012 Annual Report | | | 27 | |
value of unrestricted securities of the same class at the time of purchase; analysts’ research and observations from financial institutions; information regarding any transactions or offers with respect to the security; the existence of merger proposals or tender offers affecting the security; the price and extent of public trading in similar securities of the issuer or comparable companies; and the existence of a shelf registration for restricted securities.
For each portfolio security that has been fair valued pursuant to the policies adopted by the Board of Trustees, the fair value price is compared against the last available and next available market quotations. The Valuation Committee reviews the results of such back testing monthly and fair valuation occurrences are reported to the Board of Trustees quarterly.
The Portfolios use valuation techniques to measure fair value that are consistent with the market approach and/or income approach, depending on the type of security and the particular circumstance. The market approach uses prices and other relevant information generated by market transactions involving identical or comparable securities. The income approach uses valuation techniques to discount estimated future cash flows to present value.
GAAP establishes a disclosure hierarchy that categorizes the inputs to valuation techniques used to value assets and liabilities at measurement date. These inputs are summarized in the three broad levels listed below:
| Ÿ | | Level 1 — quoted prices in active markets for identical investments |
| Ÿ | | Level 2 — other significant observable inputs (including quoted prices for similar investments, interest rates, prepayment speeds, credit risk, etc.) |
| Ÿ | | Level 3 — significant unobservable inputs (including the Portfolios’ own assumptions in determining the fair value of investments) |
The inputs or methodologies used to value securities are not necessarily an indication of the risk associated with investing in those securities.
The following is a summary of the inputs used in valuing the Portfolios’ assets carried at fair value:
Lifestyle Allocation 85%
| | | | | | | | | | | | | | | | |
| ASSETS | |
| Description | | Quoted Prices
(Level 1) | | | Other Significant
Observable Inputs
(Level 2) | | | Significant
Unobservable
Inputs
(Level 3) | | | Total | |
| Investments in underlying funds† | | $ | 111,951,671 | | | | — | | | | — | | | $ | 111,951,671 | |
| Short-term investments† | | | — | | | $ | 31,000 | | | | — | | | | 31,000 | |
| Total investments | | $ | 111,951,671 | | | $ | 31,000 | | | | — | | | $ | 111,982,671 | |
| † | See Schedules of Investments for additional detailed categorizations. |
Lifestyle Allocation 70%
| | | | | | | | | | | | | | | | |
| ASSETS | |
| Description | | Quoted Prices
(Level 1) | | | Other Significant
Observable Inputs
(Level 2) | | | Significant
Unobservable
Inputs
(Level 3) | | | Total | |
| Investments in underlying funds† | | $ | 52,121,734 | | | | — | | | | — | | | $ | 52,121,734 | |
| Short-term investments† | | | — | | | $ | 58,000 | | | | — | | | | 58,000 | |
| Total investments | | $ | 52,121,734 | | | $ | 58,000 | | | | — | | | $ | 52,179,734 | |
| † | See Schedules of Investments for additional detailed categorizations. |
| | |
| 28 | | Legg Mason Variable Lifestyle Series 2012 Annual Report |
Notes to financial statements (cont’d)
Lifestyle Allocation 50%
| | | | | | | | | | | | | | | | |
| ASSETS | |
| Description | | Quoted Prices
(Level 1) | | | Other Significant
Observable Inputs
(Level 2) | | | Significant
Unobservable
Inputs
(Level 3) | | | Total | |
| Investments in underlying funds† | | $ | 116,363,560 | | | | — | | | | — | | | $ | 116,363,560 | |
| Short-term investments† | | | — | | | $ | 197,000 | | | | — | | | | 197,000 | |
| Total investments | | $ | 116,363,560 | | | $ | 197,000 | | | | — | | | $ | 116,560,560 | |
| † | See Schedules of Investments for additional detailed categorizations. |
(b) Repurchase Agreements. The Portfolios may enter into repurchase agreements with institutions that their investment adviser has determined are creditworthy. Each repurchase agreement is recorded at cost. Under the terms of a typical repurchase agreement, the Portfolios acquire a debt security subject to an obligation of the seller to repurchase, and of the Portfolios to resell, the security at an agreed-upon price and time, thereby determining the yield during the Portfolios’ holding period. When entering into repurchase agreements, it is the Portfolios’ policy that their custodian or a third party custodian, acting on the Portfolios’ behalf, take possession of the underlying collateral securities, the market value of which, at all times, at least equals the principal amount of the repurchase transaction, including accrued interest. To the extent that any repurchase transaction maturity exceeds one business day, the value of the collateral is marked-to-market and measured against the value of the agreement in an effort to ensure the adequacy of the collateral. If the counterparty defaults, the Portfolios generally have the right to use the collateral to satisfy the terms of the repurchase transaction. However, if the market value of the collateral declines during the period in which the Portfolios seek to assert their rights or if bankruptcy proceedings are commenced with respect to the seller of the security, realization of the collateral by the Portfolios may be delayed or limited.
(c) Fund of funds risk. Your cost of investing in the Portfolios, as funds of funds, may be higher than the cost of investing in a mutual fund that only invests directly in individual securities. An underlying fund may change its investment objective or policies without the Portfolios’ approval, which could force the Portfolios to withdraw their investments from such underlying fund at a time that is unfavorable to the Portfolios. In addition, one underlying fund may buy the same securities that another underlying fund sells. Therefore, the Portfolios would indirectly bear the costs of these trades without accomplishing any investment purpose.
(d) Security transactions and investment income. Security transactions are accounted for on a trade date basis. Net investment income distributions and short-term capital gain distributions, if any, from the Underlying Funds are recorded on the ex-dividend date as investment income. Interest income is recorded on an accrual basis. Long-term capital gain distributions, if any, from the Underlying Funds are recorded on the ex-dividend date as realized gains. The cost of investments sold is determined by use of the specific identification method.
(e) Distributions to shareholders. Distributions from net investment income and distributions of net realized gains, if any, are declared at least annually. Distributions to shareholders of the Portfolios are recorded on the ex-dividend date and are determined in accordance with income tax regulations, which may differ from GAAP.
(f) Compensating balance arrangements. The Portfolios have an arrangement with their custodian bank whereby a portion of the custodian’s fees is paid indirectly by credits earned on the Portfolios’ cash on deposit with the bank.
(g) Federal and other taxes. It is the Portfolios’ policy to comply with the federal income and excise tax requirements of the Internal Revenue Code of 1986 (the “Code”), as amended, applicable to regulated investment companies. Accordingly, the Portfolios intend to distribute their taxable income and net realized gains, if any, to shareholders in accordance with timing requirements imposed by the Code. Therefore, no federal or state income tax provision is required in the Portfolios’ financial statements.
Management has analyzed the Portfolios’ tax positions taken on income tax returns for all open tax years and has concluded that as of December 31, 2012, no provision for income tax would be required in the
| | | | |
| Legg Mason Variable Lifestyle Series 2012 Annual Report | | | 29 | |
Portfolios’ financial statements. The Portfolios’ federal and state income and federal excise tax returns for tax years for which the applicable statutes of limitations have not expired are subject to examination by the Internal Revenue Service and state departments of revenue.
(h) Reclassification. GAAP requires that certain components of net assets be adjusted to reflect permanent differences between financial and tax reporting. These reclassifications have no effect on net assets or net asset values per share. There were no reclassifications for Lifestyle 50% during the current year. During the current year, the other Portfolios had the following reclassifications:
| | | | | | | | | | |
| Fund | | | | Accumulated Net
Realized (Loss) | | | Paid-in
Capital | |
| Lifestyle Allocation 85% | | (a) | | $ | 3,119,343 | | | $ | (3,119,343) | |
| Lifestyle Allocation 70% | | (a) | | | 10,439,486 | | | | (10,439,486) | |
| (a) | Reclassifications are primarily due to the expiration of a capital loss carryover. |
2. Investment management agreement and other transactions with affiliates
Legg Mason Partners Fund Advisor, LLC (“LMPFA”) is each Portfolio’s investment manager and Legg Mason Global Asset Allocation, LLC (“LMGAA”) is each Portfolio’s subadviser. Western Asset Management Company (“Western Asset”) manages each Portfolio’s cash and short-term instruments. LMPFA, LMGAA and Western Asset are wholly-owned subsidiaries of Legg Mason. The Portfolios do not pay a management fee or subadviser fee.
LMPFA provides administrative and certain oversight services to the Portfolios. LMPFA delegates to the subadviser the day-to-day portfolio management of the Portfolios, except, for the management of cash and short-term instruments, which is provided by Western Asset.
The Portfolios bear all expenses incurred in their operations, subject to LMPFA’s agreement to waive fees and/or reimburse expenses incurred directly by the Portfolios, such that each Portfolio’s total annual operating expenses (other than brokerage, interest, taxes, extraordinary expenses and Underlying Funds’ fees and expenses), are not expected to exceed 0.20% of each Portfolios’ average daily net assets. The investment manager is also permitted to recapture amounts waived and/or reimbursed to the Portfolios during the same fiscal year if the Portfolios’ total annual operating expenses have fallen to a level below the limit described above. In no case will the investment manager recapture any amount that would result, on any particular business day of the Portfolios, in the Portfolios’ total annual operating expenses exceeding this limit or any other lower limit then in effect. These expense limitation agreements cannot be terminated prior to December 31, 2014 without the Board of Trustees’ consent.
In addition, the Portfolios indirectly pay management and/or administration fees to LMPFA and other wholly-owned subsidiaries of Legg Mason as a shareholder in the Underlying Funds. These management and administration fees ranged from 0.20% to 1.00% of the average daily net assets of the Underlying Funds.
For the year ended December 31, 2012, fees waived and/or expenses reimbursed amounted to $7 for Lifestyle allocation 70%.
Legg Mason Investor Services, LLC, a wholly-owned broker-dealer subsidiary of Legg Mason, serves as the Portfolios’ sole and exclusive distributor.
All officers and one Trustee of the Trust are employees of Legg Mason or its affiliates and do not receive compensation from the Trust.
3. Investments
During the year ended December 31, 2012, the aggregate cost of purchases and proceeds from sales of investments (excluding short-term investments) were as follows:
| | | | | | | | |
| | | Purchases | | | Sales | |
| Lifestyle Allocation 85% | | $ | 15,017,864 | | | $ | 15,770,432 | |
| Lifestyle Allocation 70% | | | 5,786,609 | | | | 15,926,274 | |
| Lifestyle Allocation 50% | | | 16,052,662 | | | | 25,100,474 | |
| | |
| 30 | | Legg Mason Variable Lifestyle Series 2012 Annual Report |
Notes to financial statements (cont’d)
At December 31, 2012, the aggregate gross unrealized appreciation and depreciation of investments for federal income tax purposes were as follows:
| | | | | | | | | | | | |
| | | Gross unrealized
appreciation | | | Gross unrealized
depreciation | | | Net unrealized
appreciation | |
| Lifestyle Allocation 85% | | $ | 11,364,007 | | | | — | | | $ | 11,364,007 | |
| Lifestyle Allocation 70% | | | 6,333,118 | | | | — | | | | 6,333,118 | |
| Lifestyle Allocation 50% | | | 10,760,025 | | | | — | | | | 10,760,025 | |
4. Derivative instruments and hedging activities
GAAP requires enhanced disclosure about an entity’s derivative and hedging activities.
During the year ended December 31, 2012, the Portfolios did not invest in any derivative instruments.
5. Shares of beneficial interest
At December 31, 2012, the Trust had an unlimited number of shares of beneficial interest authorized with a par value of $0.00001 per share.
Transactions in shares of the Portfolios were as follows:
| | | | | | | | |
| | | Year Ended
December 31, 2012 | | | Year Ended
December 31, 2011 | |
| | |
| Lifestyle Allocation 85% | | | | | | | | |
| Shares sold | | | 658,044 | | | | 1,034,345 | |
| Shares issued on reinvestment | | | 152,558 | | | | 131,143 | |
| Shares repurchased | | | (956,215) | | | | (1,149,483) | |
| Net increase (decrease) | | | (145,613) | | | | 16,005 | |
| | |
| Lifestyle Allocation 70% | | | | | | | | |
| Shares sold | | | 34,301 | | | | 60,420 | |
| Shares issued on reinvestment | | | 110,591 | | | | 108,028 | |
| Shares repurchased | | | (1,072,359) | | | | (1,306,424) | |
| Net decrease | | | (927,467) | | | | (1,137,976) | |
| | |
| Lifestyle Allocation 50% | | | | | | | | |
| Shares sold | | | 693,104 | | | | 1,234,583 | |
| Shares issued on reinvestment | | | 250,894 | | | | 264,712 | |
| Shares repurchased | | | (1,737,615) | | | | (2,250,685) | |
| Net decrease | | | (793,617) | | | | (751,390) | |
6. Income tax information and distributions to shareholders
The tax character of distributions paid during the fiscal year ended December 31, 2012 were as follows:
| | | | | | | | | | | | |
| | | Lifestyle
Allocation 85% | | | Lifestyle
Allocation 70% | | | Lifestyle
Allocation 50% | |
| | | |
| Distributions Paid From: | | | | | | | | | | | | |
| Ordinary income | | $ | 1,968,126 | | | $ | 1,263,631 | | | $ | 3,118,397 | |
The tax character of distributions paid during the fiscal year ended December 31, 2011 were as follows:
| | | | | | | | | | | | |
| | | Lifestyle
Allocation 85% | | | Lifestyle
Allocation 70% | | | Lifestyle
Allocation 50% | |
| | | |
| Distributions Paid From: | | | | | | | | | | | | |
| Ordinary income | | $ | 1,550,012 | | | $ | 1,150,006 | | | $ | 3,050,003 | |
| | | | |
| Legg Mason Variable Lifestyle Series 2012 Annual Report | | | 31 | |
As of December 31, 2012, the components of accumulated earnings on a tax basis were as follows:
| | | | | | | | | | | | |
| | | Lifestyle
Allocation 85% | | | Lifestyle
Allocation 70% | | | Lifestyle
Allocation 50% | |
| Undistributed ordinary income — net | | $ | 519,670 | | | $ | 144,296 | | | $ | 109,285 | |
| Capital loss carryforward* | | | (3,128,693) | | | | (13,268,671) | | | | (19,841,813) | |
| Other book/tax temporary differences | | | (42,880) | (a) | | | (38,022) | (a) | | | (44,173) | (a) |
| Unrealized appreciation (depreciation) | | | 11,364,007 | (b) | | | 6,333,118 | (b) | | | 10,760,025 | (b) |
| Total accumulated earnings (losses) — net | | $ | 8,712,104 | | | $ | (6,829,279) | | | $ | (9,016,676) | |
| * | During the taxable year ended December 31, 2012, Lifestyle Allocation 85% utilized $1,032,850, Lifestyle Allocation 70% utilized $430,510 and Lifestyle Allocation 50% utilized $762,887 of their respective capital loss carryforwards available from prior years. As of December 31, 2012, the Portfolios had the following net capital loss carryforwards remaining: |
| | | | | | | | | | | | |
| Year of Expiration | | Lifestyle
Allocation 85% | | | Lifestyle
Allocation 70% | | | Lifestyle
Allocation 50% | |
| No Expiration | | $ | (251,419) | ** | | $ | (1,772,155) | ** | | | — | |
| 12/31/2013 | | | (1,280,698) | | | | (3,049,716) | | | | — | |
| 12/31/2016 | | | — | | | | (1,548,306) | | | $ | (4,538,224) | |
| 12/31/2017 | | | (1,217,675) | | | | (4,794,598) | | | | (12,981,017) | |
| 12/31/2018 | | | (378,901) | | | | (2,103,896) | | | | (2,322,572) | |
| | | $ | (3,128,693) | | | $ | (13,268,671) | | | $ | (19,841,813) | |
These amounts will be available to offset any future taxable capital gains.
| ** | Under the Regulated Investment Company Modernization Act of 2010, the Portfolios are permitted to carry forward these capital losses for an unlimited period. However, these losses will be required to be utilized prior to the Portfolios’ other capital losses with the expiration dates listed above. Additionally, these capital losses retain their character as either short-term or long-term capital losses rather than being considered all short-term as under previous law. |
| (a) | Other book/tax temporary differences are attributable primarily to the book/tax differences in the timing of the deductibility of various expenses. |
| (b) | The difference between book-basis and tax-basis unrealized appreciation (depreciation) is attributable primarily to the tax deferral of losses on wash sales. |
| | |
| 32 | | Legg Mason Variable Lifestyle Series 2012 Annual Report |
Report of independent registered public accounting firm
The Board of Trustees and Shareholders
Legg Mason Partners Variable Equity Trust:
We have audited the accompanying statement of assets and liabilities of Legg Mason Variable Lifestyle Allocation 85%, Legg Mason Variable Lifestyle Allocation 70%, and Legg Mason Variable Lifestyle Allocation 50% (the “Portfolios”), each a series of Legg Mason Partners Variable Equity Trust, including the schedules of investments, as of December 31, 2012, and the related statements of operations for the year then ended, the statements of changes in net assets for each of the years in the two-year period then ended, and the financial highlights for each of the years in the three-year period then ended, the period from February 1, 2009 to December 31, 2009, and each of the years in the two-year period ended January 31, 2009. These financial statements and financial highlights are the responsibility of the Portfolios’ management. Our responsibility is to express an opinion on these financial statements and financial highlights based on our audits.
We conducted our audits in accordance with the standards of the Public Company Accounting Oversight Board (United States). Those standards require that we plan and perform the audit to obtain reasonable assurance about whether the financial statements and financial highlights are free of material misstatement. An audit includes examining, on a test basis, evidence supporting the amounts and disclosures in the financial statements. Our procedures included confirmation of securities owned as of December 31, 2012, by correspondence with the investee funds’ transfer agent and brokers. An audit also includes assessing the accounting principles used and significant estimates made by management, as well as evaluating the overall financial statement presentation. We believe that our audits provide a reasonable basis for our opinion.
In our opinion, the financial statements and financial highlights referred to above present fairly, in all material respects, the financial position of Legg Mason Variable Lifestyle Allocation 85%, Legg Mason Variable Lifestyle Allocation 70%, and Legg Mason Variable Lifestyle Allocation 50%, as of December 31, 2012, the results of their operations, the changes in their net assets, and the financial highlights for the periods described above, in conformity with U.S. generally accepted accounting principles.

New York, New York
February 15, 2013
| | | | |
| Legg Mason Variable Lifestyle Series | | | 33 | |
Board approval of management and subadvisory agreements (unaudited)
Legg Mason Partners Variable Equity Trust —Legg Mason Variable Lifestyle Allocation 85%
At a meeting of the Trust’s Board of Trustees, the Board considered the re-approval for an annual period of the management agreement of Legg Mason Variable Lifestyle Allocation 85% (the “Fund”), pursuant to which Legg Mason Partners Fund Advisor, LLC (the “Manager”) provides the Fund with investment advisory and administrative services, the sub-advisory agreement pursuant to which Legg Mason Global Asset Allocation, LLC (“LMGAA”) provides day-to-day management of the Fund’s portfolio, and the sub-advisory agreement pursuant to which Western Asset Management Company (“Western Asset” and, together with LMGAA, the “Sub-Advisers”) provides day-to-day management of the Fund’s cash and short-term instruments. (The management agreement and sub-advisory agreements are collectively referred to as the “Agreements.”) The Manager and the Sub-Advisers are wholly-owned subsidiaries of Legg Mason, Inc. The Trustees who are not “interested persons” (as defined in the Investment Company Act of 1940, as amended (the “Independent Trustees”)) of the Fund were assisted in their review by Fund counsel and independent legal counsel and met with independent legal counsel in executive sessions separate from representatives of the Manager and the Sub-Advisers. The Independent Trustees requested and received information from the Manager and the Sub-Advisers they deemed reasonably necessary for their review of the Agreements and the performance of the Manager and the Sub-Advisers. Included was information about the Manager, the Sub-Advisers and the Fund’s distributor, as well as the management, sub-advisory and distribution arrangements for the Fund and other funds overseen by the Board. This information was initially reviewed by a special committee of the Independent Trustees and then by the full Board.
In voting to approve the Agreements, the Independent Trustees considered whether the approval of the Agreements would be in the best interests of the Fund and its shareholders, an evaluation based on several factors including those discussed below.
Nature, extent and quality of the services provided to the fund under the management agreement and sub-advisory agreements
The Board received and considered information regarding the nature, extent and quality of services provided to the Fund by the Manager and the Sub-Advisers under the Management Agreement and Sub-Advisory Agreements, respectively, during the past year. The Trustees also considered the Manager’s supervisory activities over the Sub-Advisers. In addition, the Independent Trustees received and considered other information regarding the administrative and other services rendered to the Fund and its shareholders by the Manager. The Board noted information received at regular meetings throughout the year related to the services rendered by the Manager in its management of the Fund’s affairs and the Manager’s role in coordinating the activities of the Sub-Advisers and the Fund’s other service providers. The Board’s evaluation of the services provided by the Manager and the Sub-Advisers took into account the Board’s knowledge and familiarity gained as Trustees of funds in the Legg Mason fund complex, including the scope and quality of the investment management and other capabilities of the Manager and the Sub-Advisers and the quality of the Manager’s administrative and other services. The Board observed that the scope of services provided by the Manager had expanded over time as a result of regulatory and other developments, including maintaining and monitoring its own and the Fund’s compliance programs. The Board reviewed information received from the Manager and the Fund’s Chief Compliance Officer regarding the Fund’s compliance policies and procedures established pursuant to Rule 38a-1 under the Investment Company Act of 1940, as amended.
The Board reviewed the qualifications, backgrounds and responsibilities of the Fund’s senior personnel and the portfolio management team primarily responsible for the day-to-day portfolio management of the Fund. The Board considered the degree to which the Manager implemented organizational changes to improve investment results and the services provided to the Legg Mason fund complex. The Board also considered, based on its knowledge of the Manager and the Manager’s affiliates, the financial resources available to the Manager’s parent organization, Legg Mason, Inc.
| | |
| 34 | | Legg Mason Variable Lifestyle Series |
Board approval of management and subadvisory agreements (unaudited) (cont’d)
The Board also considered the division of responsibilities among the Manager and the Sub-Advisers and the oversight provided by the Manager. The Board also considered the Manager’s and LMGAA’s brokerage policies and practices, the standards applied in seeking best execution, their policies and practices regarding soft dollars, and the existence of quality controls applicable to brokerage allocation procedures. In addition, management also reported to the Board on, among other things, its business plans, recent organizational changes, portfolio manager compensation plan and policy regarding portfolio managers’ ownership of fund shares.
The Board concluded that, overall, it was satisfied with the nature, extent and quality of services provided (and expected to be provided) under the respective Agreement by the Manager and the Sub-Advisers.
Fund performance
The Board received and reviewed performance information for the Fund and for all mixed-asset target allocation growth funds underlying variable insurance products (the “Performance Universe”) selected by Lipper, Inc. (“Lipper”), an independent provider of investment company data. The Board was provided with a description of the methodology Lipper used to determine the similarity of the Fund with the funds included in the Performance Universe. The Trustees noted that they also had received and discussed with management information at periodic intervals comparing the Fund’s performance to that of its benchmark index. The information comparing the Fund’s performance to that of the Performance Universe was for the one-, three-, five- and ten-year periods ended June 30, 2012. The Fund performed better than the median performance of the funds in the Performance Universe for the three-year period, but performed below the median performance of the funds in the Performance Universe for the one-, five- and ten-year periods. The Board also reviewed performance information provided by the Manager for periods ended September 30, 2012, which showed that the Fund’s performance was better than the Lipper category average during the third quarter. The Trustees then discussed with representatives of management the portfolio management strategy of the Fund’s portfolio managers. The Trustees noted that the Manager and LMGAA were committed to providing the resources necessary to assist the Fund’s portfolio managers and continue to improve Fund performance. Based on its review, the Board generally was satisfied with the Fund’s performance and management’s efforts to continue to improve performance going forward. The Board determined to continue to evaluate the Fund’s performance and directed the Independent Trustees’ performance committee to continue to periodically review Fund performance with the Manager and report to the full Board during periods between Board meetings.
Expense ratios
The Board noted that the Fund bears indirectly its pro rata share of the expenses of the underlying funds in which it invests, including management fees payable by such underlying funds to the Manager or its affiliates. The Board noted that there is no management fee payable by the Fund to the Manager or sub-investment advisory fees payable by the Fund to the Sub-Advisers.
The Board received an analysis of complex-wide management fees provided by the Manager, which, among other things, set out a framework of fees based on asset classes. Management also discussed with the Board the Fund’s distribution arrangements, including how amounts received by the Fund’s distributor are expended, and the fees received and expenses incurred in connection with such arrangements by affiliates of the Manager.
Additionally, the Board received and considered information comparing the Fund’s overall expense ratio with those of a group of actively and passively managed affiliated funds of funds underlying variable insurance products consisting of ten mixed-asset target allocation growth funds selected by Lipper as comparable to the Fund (the “Expense Group”), and a broader group of funds selected by Lipper consisting of all actively and passively managed affiliated mixed-asset target allocation growth funds of funds underlying variable insurance products (the “Expense Universe”). This information showed that the Fund’s actual total expense ratio was at the median of the total expense ratios of the funds in the Expense Group, but was
| | | | |
| Legg Mason Variable Lifestyle Series | | | 35 | |
higher than the average total expense ratio of the funds in the Expense Universe. The Trustees also reviewed and considered the Manager’s fee waiver and/or expense reimbursement arrangements, if any.
Manager profitability
The Board received and considered a profitability analysis of the Manager and its affiliates in providing services to the Fund. The Board also received profitability information with respect to the Legg Mason fund complex as a whole. In addition, the Board received information with respect to the Manager’s allocation methodologies used in preparing this profitability data as well as a report from an outside consultant that had reviewed the Manager’s methodology. The Board also noted the profitability percentage ranges determined by appropriate court cases to be reasonable given the services rendered to investment companies. The Board determined that the Manager’s profitability was not excessive in light of the nature, extent and quality of the services provided to the Fund.
Economies of scale
The Board received and considered information regarding whether there have been economies of scale with respect to the management of the Fund as the Fund’s assets grow, whether the Fund has appropriately benefited from any economies of scale, and whether there is potential for realization of any further economies of scale. The Board considered whether economies of scale in the provision of services to the Fund were being passed along to the shareholders.
The Board noted that to the extent the Fund’s assets increase over time, the Fund and its shareholders should realize economies of scale as certain expenses, such as fixed fund fees, become a smaller percentage of overall assets. The Board also noted that it appeared that the benefits of any economies of scale also would be appropriately shared with shareholders through increased investment in fund management and administration resources.
Taking all of the above into consideration, the Board determined that the Fund’s expense ratio was reasonable in light of the comparative performance and expense information and the nature, extent and quality of the services provided to the Fund under the Agreements.
Other benefits to the manager
The Board considered other benefits received by the Manager and its affiliates, including the Sub-Advisers, as a result of the Manager’s relationship with the Fund, including the opportunity to offer additional products and services to Fund shareholders.
In light of the costs of providing investment management and other services to the Fund and the Manager’s ongoing commitment to the Fund, the profits and other ancillary benefits that the Manager and its affiliates received were considered reasonable.
Based on their discussions and considerations, including those described above, the Trustees approved the Management Agreement and the Sub-Advisory Agreements to continue for another year.
No single factor reviewed by the Board was identified by the Board as the principal factor in determining whether to approve the Management Agreement and the Sub-Advisory Agreements.
| | |
| 36 | | Legg Mason Variable Lifestyle Series |
Board approval of management and subadvisory agreements (unaudited) (cont’d)
Legg Mason Partners Variable Equity Trust —Legg Mason Variable Lifestyle Allocation 70%
At a meeting of the Trust’s Board of Trustees, the Board considered the re-approval for an annual period of the management agreement of Legg Mason Variable Lifestyle Allocation 70% (the “Fund”), pursuant to which Legg Mason Partners Fund Advisor, LLC (the “Manager”) provides the Fund with investment advisory and administrative services, the sub-advisory agreement pursuant to which Legg Mason Global Asset Allocation, LLC (“LMGAA”) provides day-to-day management of the Fund’s portfolio, and the sub-advisory agreement pursuant to which Western Asset Management Company (“Western Asset” and, together with LMGAA, the “Sub-Advisers”) provides day-to-day management of the Fund’s cash and short-term instruments. (The management agreement and sub-advisory agreements are collectively referred to as the “Agreements.”) The Manager and the Sub-Advisers are wholly-owned subsidiaries of Legg Mason, Inc. The Trustees who are not “interested persons” (as defined in the Investment Company Act of 1940, as amended (the “Independent Trustees”)) of the Fund were assisted in their review by Fund counsel and independent legal counsel and met with independent legal counsel in executive sessions separate from representatives of the Manager and the Sub-Advisers. The Independent Trustees requested and received information from the Manager and the Sub-Advisers they deemed reasonably necessary for their review of the Agreements and the performance of the Manager and the Sub-Advisers. Included was information about the Manager, the Sub-Advisers and the Fund’s distributor, as well as the management, sub-advisory and distribution arrangements for the Fund and other funds overseen by the Board. This information was initially reviewed by a special committee of the Independent Trustees and then by the full Board.
In voting to approve the Agreements, the Independent Trustees considered whether the approval of the Agreements would be in the best interests of the Fund and its shareholders, an evaluation based on several factors including those discussed below.
Nature, extent and quality of the services provided to the fund under the management agreement and sub-advisory agreements
The Board received and considered information regarding the nature, extent and quality of services provided to the Fund by the Manager and the Sub-Advisers under the Management Agreement and Sub-Advisory Agreements, respectively, during the past year. The Trustees also considered the Manager’s supervisory activities over the Sub-Advisers. In addition, the Independent Trustees received and considered other information regarding the administrative and other services rendered to the Fund and its shareholders by the Manager. The Board noted information received at regular meetings throughout the year related to the services rendered by the Manager in its management of the Fund’s affairs and the Manager’s role in coordinating the activities of the Sub-Advisers and the Fund’s other service providers. The Board’s evaluation of the services provided by the Manager and the Sub-Advisers took into account the Board’s knowledge and familiarity gained as Trustees of funds in the Legg Mason fund complex, including the scope and quality of the investment management and other capabilities of the Manager and the Sub-Advisers and the quality of the Manager’s administrative and other services. The Board observed that the scope of services provided by the Manager had expanded over time as a result of regulatory and other developments, including maintaining and monitoring its own and the Fund’s compliance programs. The Board reviewed information received from the Manager and the Fund’s Chief Compliance Officer regarding the Fund’s compliance policies and procedures established pursuant to Rule 38a-1 under the Investment Company Act of 1940, as amended.
The Board reviewed the qualifications, backgrounds and responsibilities of the Fund’s senior personnel and the portfolio management team primarily responsible for the day-to-day portfolio management of the Fund. The Board considered the degree to which the Manager implemented organizational changes to improve investment results and the services provided to the Legg Mason fund complex. The Board also considered, based on its knowledge of the Manager and the Manager’s affiliates, the financial resources available to the Manager’s parent organization, Legg Mason, Inc.
| | | | |
| Legg Mason Variable Lifestyle Series | | | 37 | |
The Board also considered the division of responsibilities among the Manager and the Sub-Advisers and the oversight provided by the Manager. The Board also considered the Manager’s and LMGAA’s brokerage policies and practices, the standards applied in seeking best execution, their policies and practices regarding soft dollars, and the existence of quality controls applicable to brokerage allocation procedures. In addition, management also reported to the Board on, among other things, its business plans, recent organizational changes, portfolio manager compensation plan and policy regarding portfolio managers’ ownership of fund shares.
The Board concluded that, overall, it was satisfied with the nature, extent and quality of services provided (and expected to be provided) under the respective Agreement by the Manager and the Sub-Advisers.
Fund performance
The Board received and reviewed performance information for the Fund and for all mixed-asset target allocation growth funds underlying variable insurance products (the “Performance Universe”) selected by Lipper, Inc. (“Lipper”), an independent provider of investment company data. The Board was provided with a description of the methodology Lipper used to determine the similarity of the Fund with the funds included in the Performance Universe. The Trustees noted that they also had received and discussed with management information at periodic intervals comparing the Fund’s performance to that of its benchmark index. The information comparing the Fund’s performance to that of the Performance Universe was for the one-, three-, five- and ten-year periods ended June 30, 2012. The Fund performed better than the median performance of the funds in the Performance Universe for each period. The Board also reviewed performance information provided by the Manager for periods ended September 30, 2012, which showed that the Fund’s performance was better than the Lipper category average during the third quarter. The Trustees then discussed with representatives of management the portfolio management strategy of the Fund’s portfolio managers. The Trustees noted that the Manager and LMGAA were committed to providing the resources necessary to assist the Fund’s portfolio managers and continue to improve Fund performance. Based on its review, the Board was satisfied with the Fund’s performance and management’s efforts to continue to improve performance going forward. The Board determined to continue to evaluate the Fund’s performance and directed the Independent Trustees’ performance committee to continue to periodically review Fund performance with the Manager and report to the full Board during periods between Board meetings.
Expense ratios
The Board noted that the Fund bears indirectly its pro rata share of the expenses of the underlying funds in which it invests, including management fees payable by such underlying funds to the Manager or its affiliates. The Board noted that there is no management fee payable by the Fund to the Manager or sub-investment advisory fees payable by the Fund to the Sub-Advisers.
The Board received an analysis of complex-wide management fees provided by the Manager, which, among other things, set out a framework of fees based on asset classes. Management also discussed with the Board the Fund’s distribution arrangements, including how amounts received by the Fund’s distributor are expended, and the fees received and expenses incurred in connection with such arrangements by affiliates of the Manager.
Additionally, the Board received and considered information comparing the Fund’s overall expense ratio with those of a group of actively and passively managed affiliated funds of funds underlying variable insurance products consisting of 12 mixed-asset target allocation growth funds selected by Lipper as comparable to the Fund (the “Expense Group”), and a broader group of funds selected by Lipper consisting of all actively and passively managed affiliated mixed-asset target allocation growth funds of funds underlying variable insurance products (the “Expense Universe”). This information showed that the Fund’s actual total expense ratio was lower than the median of the total expense ratios of the funds in the Expense Group, but was higher than the average total expense ratio of the funds in the Expense Universe. The Trustees also reviewed and considered the Manager’s fee waiver and/or expense reimbursement arrangements, if any.
| | |
| 38 | | Legg Mason Variable Lifestyle Series |
Board approval of management and subadvisory agreements (unaudited) (cont’d)
Manager profitability
The Board received and considered a profitability analysis of the Manager and its affiliates in providing services to the Fund. The Board also received profitability information with respect to the Legg Mason fund complex as a whole. In addition, the Board received information with respect to the Manager’s allocation methodologies used in preparing this profitability data as well as a report from an outside consultant that had reviewed the Manager’s methodology. The Board also noted the profitability percentage ranges determined by appropriate court cases to be reasonable given the services rendered to investment companies. The Board determined that the Manager’s profitability was not excessive in light of the nature, extent and quality of the services provided to the Fund.
Economies of scale
The Board received and considered information regarding whether there have been economies of scale with respect to the management of the Fund as the Fund’s assets grow, whether the Fund has appropriately benefited from any economies of scale, and whether there is potential for realization of any further economies of scale. The Board considered whether economies of scale in the provision of services to the Fund were being passed along to the shareholders.
The Board noted that to the extent the Fund’s assets increase over time, the Fund and its shareholders should realize economies of scale as certain expenses, such as fixed fund fees, become a smaller percentage of overall assets. The Board also noted that it appeared that the benefits of any economies of scale also would be appropriately shared with shareholders through increased investment in fund management and administration resources.
Taking all of the above into consideration, the Board determined that the Fund’s expense ratio was reasonable in light of the comparative performance and expense information and the nature, extent and quality of the services provided to the Fund under the Agreements.
Other benefits to the manager
The Board considered other benefits received by the Manager and its affiliates, including the Sub-Advisers, as a result of the Manager’s relationship with the Fund, including the opportunity to offer additional products and services to Fund shareholders.
In light of the costs of providing investment management and other services to the Fund and the Manager’s ongoing commitment to the Fund, the profits and other ancillary benefits that the Manager and its affiliates received were considered reasonable.
Based on their discussions and considerations, including those described above, the Trustees approved the Management Agreement and the Sub-Advisory Agreements to continue for another year.
No single factor reviewed by the Board was identified by the Board as the principal factor in determining whether to approve the Management Agreement and the Sub-Advisory Agreements.
| | | | |
| Legg Mason Variable Lifestyle Series | | | 39 | |
Legg Mason Partners Variable Equity Trust —Legg Mason Variable Lifestyle Allocation 50%
At a meeting of the Trust’s Board of Trustees, the Board considered the re-approval for an annual period of the management agreement of Legg Mason Variable Lifestyle Allocation 50% (the “Fund”), pursuant to which Legg Mason Partners Fund Advisor, LLC (the “Manager”) provides the Fund with investment advisory and administrative services, the sub-advisory agreement pursuant to which Legg Mason Global Asset Allocation, LLC (“LMGAA”) provides day-to-day management of the Fund’s portfolio, and the sub-advisory agreement pursuant to which Western Asset Management Company (“Western Asset” and, together with LMGAA, the “Sub-Advisers”) provides day-to-day management of the Fund’s cash and short-term instruments. (The management agreement and sub-advisory agreements are collectively referred to as the “Agreements.”) The Manager and the Sub-Advisers are wholly-owned subsidiaries of Legg Mason, Inc. The Trustees who are not “interested persons” (as defined in the Investment Company Act of 1940, as amended (the “Independent Trustees”)) of the Fund were assisted in their review by Fund counsel and independent legal counsel and met with independent legal counsel in executive sessions separate from representatives of the Manager and the Sub-Advisers. The Independent Trustees requested and received information from the Manager and the Sub-Advisers they deemed reasonably necessary for their review of the Agreements and the performance of the Manager and the Sub-Advisers. Included was information about the Manager, the Sub-Advisers and the Fund’s distributor, as well as the management, sub-advisory and distribution arrangements for the Fund and other funds overseen by the Board. This information was initially reviewed by a special committee of the Independent Trustees and then by the full Board.
In voting to approve the Agreements, the Independent Trustees considered whether the approval of the Agreements would be in the best interests of the Fund and its shareholders, an evaluation based on several factors including those discussed below.
Nature, extent and quality of the services provided to the fund under the management agreement and sub-advisory agreements
The Board received and considered information regarding the nature, extent and quality of services provided to the Fund by the Manager and the Sub-Advisers under the Management Agreement and Sub-Advisory Agreements, respectively, during the past year. The Trustees also considered the Manager’s supervisory activities over the Sub-Advisers. In addition, the Independent Trustees received and considered other information regarding the administrative and other services rendered to the Fund and its shareholders by the Manager. The Board noted information received at regular meetings throughout the year related to the services rendered by the Manager in its management of the Fund’s affairs and the Manager’s role in coordinating the activities of the Sub-Advisers and the Fund’s other service providers. The Board’s evaluation of the services provided by the Manager and the Sub-Advisers took into account the Board’s knowledge and familiarity gained as Trustees of funds in the Legg Mason fund complex, including the scope and quality of the investment management and other capabilities of the Manager and the Sub-Advisers and the quality of the Manager’s administrative and other services. The Board observed that the scope of services provided by the Manager had expanded over time as a result of regulatory and other developments, including maintaining and monitoring its own and the Fund’s compliance programs. The Board reviewed information received from the Manager and the Fund’s Chief Compliance Officer regarding the Fund’s compliance policies and procedures established pursuant to Rule 38a-1 under the Investment Company Act of 1940, as amended.
The Board reviewed the qualifications, backgrounds and responsibilities of the Fund’s senior personnel and the portfolio management team primarily responsible for the day-to-day portfolio management of the Fund. The Board considered the degree to which the Manager implemented organizational changes to improve investment results and the services provided to the Legg Mason fund complex. The Board also considered, based on its knowledge of the Manager and the Manager’s affiliates, the financial resources available to the Manager’s parent organization, Legg Mason, Inc.
| | |
| 40 | | Legg Mason Variable Lifestyle Series |
Board approval of management and subadvisory agreements (unaudited) (cont’d)
The Board also considered the division of responsibilities among the Manager and the Sub-Advisers and the oversight provided by the Manager. The Board also considered the Manager’s and LMGAA’s brokerage policies and practices, the standards applied in seeking best execution, their policies and practices regarding soft dollars, and the existence of quality controls applicable to brokerage allocation procedures. In addition, management also reported to the Board on, among other things, its business plans, recent organizational changes, portfolio manager compensation plan and policy regarding portfolio managers’ ownership of fund shares.
The Board concluded that, overall, it was satisfied with the nature, extent and quality of services provided (and expected to be provided) under the respective Agreement by the Manager and the Sub-Advisers.
Fund performance
The Board received and reviewed performance information for the Fund and for all mixed-asset target allocation moderate funds underlying variable insurance products (the “Performance Universe”) selected by Lipper, Inc. (“Lipper”), an independent provider of investment company data. The Board was provided with a description of the methodology Lipper used to determine the similarity of the Fund with the funds included in the Performance Universe. The Trustees noted that they also had received and discussed with management at periodic intervals information on the investment performance of the Fund in comparison to similar mutual funds and benchmark performance indices. The information comparing the Fund’s performance to that of the Performance Universe was for the one-, three-, five- and ten-year periods ended June 30, 2012. The Fund performed better than the median performance of the funds in the Performance Universe for each period and was ranked in the first quintile of the Performance Universe for the one-, three- and five-year periods. The Board also reviewed performance information provided by the Manager for periods ended September 30, 2012, which showed that the Fund’s performance was better than the Lipper category average during the third quarter. The Trustees then discussed with representatives of management the portfolio management strategy of the Fund’s portfolio managers. The Trustees noted that the Manager and LMGAA were committed to providing the resources necessary to assist the Fund’s portfolio managers and continue to improve Fund performance. Based on its review, the Board was satisfied with the Fund’s performance and management’s efforts to continue to improve performance going forward. The Board determined to continue to evaluate the Fund’s performance and directed the Independent Trustees’ performance committee to continue to periodically review Fund performance with the Manager and report to the full Board during periods between Board meetings.
Expense ratios
The Board noted that the Fund bears indirectly its pro rata share of the expenses of the underlying funds in which it invests, including management fees payable by such underlying funds to the Manager or its affiliates. The Board noted that there is no management fee payable by the Fund to the Manager or sub-investment advisory fees payable by the Fund to the Sub-Advisers.
The Board received an analysis of complex-wide management fees provided by the Manager, which, among other things, set out a framework of fees based on asset classes. Management also discussed with the Board the Fund’s distribution arrangements, including how amounts received by the Fund’s distributor are expended, and the fees received and expenses incurred in connection with such arrangements by affiliates of the Manager.
Additionally, the Board received and considered information comparing the Fund’s overall expense ratio with those of a group of actively and passively managed affiliated funds of funds underlying variable insurance products consisting of 11 mixed-asset target allocation moderate funds selected by Lipper as comparable to the Fund (the “Expense Group”), and a broader group of funds selected by Lipper consisting of all actively and passively managed affiliated mixed-asset target allocation moderate funds of funds underlying variable insurance products (the “Expense Universe”). This information showed that the Fund’s actual total expense ratio was lower than the median of the total expense ratios of the funds in the Expense Group and lower than the average total expense ratio of the funds in the Expense Universe. The Trustees
| | | | |
| Legg Mason Variable Lifestyle Series | | | 41 | |
also reviewed and considered the Manager’s fee waiver and/or expense reimbursement arrangements, if any.
Manager profitability
The Board received and considered a profitability analysis of the Manager and its affiliates in providing services to the Fund. The Board also received profitability information with respect to the Legg Mason fund complex as a whole. In addition, the Board received information with respect to the Manager’s allocation methodologies used in preparing this profitability data as well as a report from an outside consultant that had reviewed the Manager’s methodology. The Board also noted the profitability percentage ranges determined by appropriate court cases to be reasonable given the services rendered to investment companies. The Board determined that the Manager’s profitability was not excessive in light of the nature, extent and quality of the services provided to the Fund.
Economies of scale
The Board received and considered information regarding whether there have been economies of scale with respect to the management of the Fund as the Fund’s assets grow, whether the Fund has appropriately benefited from any economies of scale, and whether there is potential for realization of any further economies of scale. The Board considered whether economies of scale in the provision of services to the Fund were being passed along to the shareholders.
The Board noted that to the extent the Fund’s assets increase over time, the Fund and its shareholders should realize economies of scale as certain expenses, such as fixed fund fees, become a smaller percentage of overall assets. The Board also noted that it appeared that the benefits of any economies of scale also would be appropriately shared with shareholders through increased investment in fund management and administration resources.
Taking all of the above into consideration, the Board determined that the Fund’s expense ratio was reasonable in light of the comparative performance and expense information and the nature, extent and quality of the services provided to the Fund under the Agreements.
Other benefits to the manager
The Board considered other benefits received by the Manager and its affiliates, including the Sub-Advisers, as a result of the Manager’s relationship with the Fund, including the opportunity to offer additional products and services to Fund shareholders.
In light of the costs of providing investment management and other services to the Fund and the Manager’s ongoing commitment to the Fund, the profits and other ancillary benefits that the Manager and its affiliates received were considered reasonable.
Based on their discussions and considerations, including those described above, the Trustees approved the Management Agreement and the Sub-Advisory Agreements to continue for another year.
No single factor reviewed by the Board was identified by the Board as the principal factor in determining whether to approve the Management Agreement and the Sub-Advisory Agreements.
| | |
| 42 | | Legg Mason Variable Lifestyle Series |
Additional information (unaudited)
Information about Trustees and Officers
The business and affairs of Legg Mason Variable Lifestyle Series (the “Portfolios”) are conducted by management under the supervision and subject to the direction of its Board of Trustees. The business address of each Trustee is c/o R. Jay Gerken, 620 Eighth Avenue, 49th Floor, New York, New York 10018. Information pertaining to the Trustees and officers of the Portfolio is set forth below.
The Statement of Additional Information includes additional information about Trustees and is available, without charge, upon request by calling the Portfolio at 1-877-721-1926.
| | |
| Independent Trustees†: |
|
| Paul R. Ades |
| |
| Year of birth | | 1940 |
| Position(s) with Trust | | Trustee |
| Term of office1 and length of time served2 | | Since 1983 |
| Principal occupation(s) during past five years | | Paul R. Ades, PLLC (law firm) (since 2000) |
| Number of funds in fund complex overseen by Trustee | | 52 |
| Other board memberships held by Trustee during past five years | | None |
|
| Andrew L. Breech |
| |
| Year of birth | | 1952 |
| Position(s) with Trust | | Trustee |
| Term of office1 and length of time served2 | | Since 1991 |
| Principal occupation(s) during past five years | | President, Dealer Operating Control Service, Inc. (automotive retail management) (since 1985) |
| Number of funds in fund complex overseen by Trustee | | 52 |
| Other board memberships held by Trustee during past five years | | None |
|
| Dwight B. Crane |
| |
| Year of birth | | 1937 |
| Position(s) with Trust | | Trustee |
| Term of office1 and length of time served2 | | Since 1981 |
| Principal occupation(s) during past five years | | Professor Emeritus, Harvard Business School (since 2007); formerly, Professor, Harvard Business School (1969 to 2007); Independent Consultant (since 1969) |
| Number of funds in fund complex overseen by Trustee | | 52 |
| Other board memberships held by Trustee during past five years | | None |
|
| Frank G. Hubbard |
| |
| Year of birth | | 1937 |
| Position(s) with Trust | | Trustee |
| Term of office1 and length of time served2 | | Since 1993 |
| Principal occupation(s) during past five years | | President, Avatar International Inc. (business development) (since 1998) |
| Number of funds in fund complex overseen by Trustee | | 52 |
| Other board memberships held by Trustee during past five years | | None |
| | | | |
| Legg Mason Variable Lifestyle Series | | | 43 | |
| | |
| Independent Trustees cont’d |
|
| Howard J. Johnson |
| |
| Year of birth | | 1938 |
| Position(s) with Trust | | Trustee |
| Term of office1 and length of time served2 | | From 1981 to 1998 and since 2000 |
| Principal occupation(s) during past five years | | Chief Executive Officer, Genesis Imaging LLC (technology company) (since 2003) |
| Number of funds in fund complex overseen by Trustee | | 52 |
| Other board memberships held by Trustee during past five years | | None |
|
| Jerome H. Miller |
| |
| Year of birth | | 1938 |
| Position(s) with Trust | | Trustee |
| Term of office1 and length of time served2 | | Since 1995 |
| Principal occupation(s) during past five years | | Retired |
| Number of funds in fund complex overseen by Trustee | | 52 |
| Other board memberships held by Trustee during past five years | | None |
|
| Ken Miller |
| |
| Year of birth | | 1942 |
| Position(s) with Trust | | Trustee |
| Term of office1 and length of time served2 | | Since 1983 |
| Principal occupation(s) during past five years | | Retired; formerly, President, Young Stuff Apparel Group, Inc. (apparel manufacturer), division of Li & Fung (1963 to 2012) |
| Number of funds in fund complex overseen by Trustee | | 52 |
| Other board memberships held by Trustee during past five years | | None |
|
| John J. Murphy |
| |
| Year of birth | | 1944 |
| Position(s) with Trust | | Trustee |
| Term of office1 and length of time served2 | | Since 2002 |
| Principal occupation(s) during past five years | | Founder and Senior Principal, Murphy Capital Management (investment management) (since 1983) |
| Number of funds in fund complex overseen by Trustee | | 52 |
| Other board memberships held by Trustee during past five years | | Trustee, UBS Funds (52 funds) (since 2008); Trustee, Consulting Group Capital Markets Funds (11 funds) (since 2002); formerly, Director, Nicholas Applegate Institutional Funds (12 funds) (2005 to 2010); formerly, Director, Atlantic Stewardship Bank (2004 to 2005); formerly, Director, Barclays International Funds Group Ltd. and affiliated companies (1983 to 2003) |
| | |
| 44 | | Legg Mason Variable Lifestyle Series |
Additional information (unaudited) (cont’d)
Information about Trustees and Officers
| | |
| Independent Trustees cont’d |
|
| Thomas F. Schlafly |
| |
| Year of birth | | 1948 |
| Position(s) with Trust | | Trustee |
| Term of office1 and length of time served2 | | Since 1983 |
| Principal occupation(s) during past five years | | President, The Saint Louis Brewery, Inc. (brewery) (since 1989); Partner, Thompson Coburn LLP (law firm) (since 2009); formerly, Of Counsel, Husch Blackwell Sanders LLP (law firm) and its predecessor firms (1984 to 2009) |
| Number of funds in fund complex overseen by Trustee | | 52 |
| Other board memberships held by Trustee during past five years | | Director, Citizens National Bank of Greater St. Louis (since 2006) |
|
| Jerry A. Viscione |
| |
| Year of birth | | 1944 |
| Position(s) with Trust | | Trustee |
| Term of office1 and length of time served2 | | Since 1993 |
| Principal occupation(s) during past five years | | Retired |
| Number of funds in fund complex overseen by Trustee | | 52 |
| Other board memberships held by Trustee during past five years | | None |
| Interested Trustee and Officer: | | |
| |
| R. Jay Gerken3 | | |
| |
| Year of birth | | 1951 |
| Position(s) with Trust | | Trustee, President, Chairman and Chief Executive Officer |
| Term of office1 and length of time served2 | | Since 2002 |
| Principal occupation(s) during past five years | | Managing Director of Legg Mason & Co., LLC (“Legg Mason & Co.”) (since 2005); Officer and Trustee/Director of 161 funds associated with Legg Mason Partners Fund Advisor, LLC (“LMPFA”) or its affiliates (since 2006) and Legg Mason & Co. predecessors (prior to 2006); President and Chief Executive Officer (“CEO”) of LMPFA (since 2006); President and CEO of Smith Barney Fund Management LLC (“SBFM”) (formerly a registered investment adviser) (since 2002) |
| Number of funds in fund complex overseen by Trustee | | 161 |
| Other board memberships held by Trustee during past five years | | None |
| Additional Officers | | |
| |
Ted P. Becker Legg Mason 620 Eighth Avenue, New York, NY 10018 | | |
| |
| Year of birth | | 1951 |
| Position(s) with Trust | | Chief Compliance Officer |
| Term of office1 and length of time served2 | | Since 2007 |
| Principal occupation(s) during past five years | | Director of Global Compliance at Legg Mason (since 2006); Chief Compliance Officer of LMPFA (since 2006); Managing Director of Compliance of Legg Mason & Co. (since 2005); Chief Compliance Officer of certain mutual funds associated with Legg Mason & Co. or its affiliates (since 2006) |
| | | | |
| Legg Mason Variable Lifestyle Series | | | 45 | |
| | |
| Additional Officers cont’d | | |
| |
Vanessa A. Williams
Legg Mason 100 First Stamford Place, Stamford, CT 06902 | | |
| |
| Year of birth | | 1979 |
| Position(s) with Trust | | Chief Anti-Money Laundering Compliance Officer and Identity Theft Prevention Officer |
| Term of office1 and length of time served2 | | Since 2011 |
| Principal occupation(s) during past five years | | Vice President of Legg Mason & Co. (since 2012); Identity Theft Prevention Officer of certain mutual funds associated with Legg Mason & Co. or its affiliates (since 2011); Chief Anti-Money Laundering Compliance Officer of certain mutual funds associated with Legg Mason & Co. or its affiliates (since 2011); formerly, Senior Compliance Officer of Legg Mason & Co. (2008 to 2011); formerly, Compliance Analyst of Legg Mason & Co. (2006 to 2008) and Legg Mason & Co. predecessors (prior to 2006) |
| |
Robert I. Frenkel Legg Mason 100 First Stamford Place, Stamford, CT 06902 | | |
| |
| Year of birth | | 1954 |
| Position(s) with Trust | | Secretary and Chief Legal Officer |
| Term of office1 and length of time served2 | | Since 2007 |
| Principal occupation(s) during past five years | | Vice President and Deputy General Counsel of Legg Mason (since 2006); Managing Director and General Counsel of Global Mutual Funds for Legg Mason & Co. (since 2006) and Legg Mason & Co. predecessors (since 1994); Secretary and Chief Legal Officer of certain mutual funds associated with Legg Mason & Co. or its affiliates (since 2006) and Legg Mason & Co. predecessors (prior to 2006) |
| |
Thomas C. Mandia Legg Mason 100 First Stamford Place, Stamford, CT 06902 | | |
| |
| Year of birth | | 1962 |
| Position(s) with Trust | | Assistant Secretary |
| Term of office1 and length of time served2 | | Since 2007 |
| Principal occupation(s) during past five years | | Managing Director and Deputy General Counsel of Legg Mason & Co. (since 2005) and Legg Mason & Co. predecessors (prior to 2005); Secretary of LMPFA (since 2006); Assistant Secretary of certain mutual funds associated with Legg Mason & Co. or its affiliates (since 2006) and Legg Mason & Co. predecessors (prior to 2006); Secretary to SBFM (since 2002) |
| |
Richard F. Sennett Legg Mason 100 International Drive, Baltimore, MD 21202 | | |
| |
| Year of birth | | 1970 |
| Position(s) with Trust | | Principal Financial Officer |
| Term of office1 and length of time served2 | | Since 2011 |
| Principal occupation(s) during past five years | | Principal Financial Officer of certain mutual funds associated with Legg Mason & Co. or its affiliates (since 2011); Managing Director of Legg Mason & Co. and Senior Manager of the Treasury Policy group for Legg Mason & Co.’s Global Fiduciary Platform (since 2011); formerly, Chief Accountant within the SEC’s Division of Investment Management (2007 to 2011); formerly, Assistant Chief Accountant within the SEC’s Division of Investment Management (2002 to 2007) |
| | |
| 46 | | Legg Mason Variable Lifestyle Series |
Additional information (unaudited) (cont’d)
Information about Trustees and Officers
| | |
| Additional Officers cont’d | | |
| |
Albert Laskaj Legg Mason 100 First Stamford Place, Stamford, CT 06902 | | |
| |
| Year of birth | | 1977 |
| Position(s) with Trust | | Treasurer |
| Term of office1 and length of time served2 | | Since 2010 |
| Principal occupation(s) during past five years | | Vice President of Legg Mason & Co. (since 2008); Treasurer of certain mutual funds associated with Legg Mason & Co. or its affiliates (since 2010); formerly, Controller of certain mutual funds associated with Legg Mason & Co. or its affiliates (prior to 2010) |
| |
Jeanne M. Kelly Legg Mason 620 Eighth Avenue, New York, NY 10018 | | |
| |
| Year of birth | | 1951 |
| Position(s) with Trust | | Senior Vice President |
| Term of office1 and length of time served2 | | Since 2007 |
| Principal occupation(s) during past five years | | Senior Vice President of certain mutual funds associated with Legg Mason & Co. or its affiliates (since 2007); Senior Vice President of LMPFA (since 2006); Managing Director of Legg Mason & Co. (since 2005) and Legg Mason & Co. predecessors (prior to 2005) |
| † | Trustees who are not “interested persons” of the Portfolios within the meaning of Section 2(a)(19) of the 1940 Act. |
| 1 | Each Trustee and officer serves until his or her respective successor has been duly elected and qualified or until his or her earlier death, resignation, retirement or removal. |
| 2 | Indicates the earliest year in which the Trustee became a board member for a fund in the Legg Mason fund complex or the officer took such office. |
| 3 | Mr. Gerken is an “interested person” of the Portfolios, as defined in the 1940 Act, because of his position with LMPFA and/or certain of its affiliates. |
| | | | |
| Legg Mason Variable Lifestyle Series | | | 47 | |
Important tax information (unaudited)
The following information is provided with respect to the distributions paid during the taxable year ended December 31, 2012:
| | | | | | | | |
| | | Lifestyle Allocation 85% | |
| Record date: | | | 6/19/2012 | | | | 12/27/2012 | |
| Payable date: | | | 6/20/2012 | | | | 12/28/2012 | |
| Dividends qualifying for the dividends | | | | | | | | |
received deduction for corporations | | | 33.02 | % | | �� | 41.76 | % |
| Foreign source income | | | 27.46 | %* | | | 24.98 | %* |
| Foreign taxes paid per share | | $ | 0.001964 | | | $ | 0.005056 | |
| | | | | | | | |
| | | Lifestyle Allocation 70% | |
| Record date: | | | 6/19/2012 | | | | 12/27/2012 | |
| Payable date: | | | 6/20/2012 | | | | 12/28/2012 | |
| Dividends qualifying for the dividends | | | | | | | | |
received deduction for corporations | | | 24.72 | % | | | 33.75 | % |
| Foreign source income | | | 16.50 | %* | | | 14.76 | %* |
| Foreign taxes paid per share | | $ | 0.001638 | | | $ | 0.003481 | |
| | | | | | | | |
| | | Lifestyle Allocation 50% | |
| Record date: | | | 6/19/2012 | | | | 12/27/2012 | |
| Payable date: | | | 6/20/2012 | | | | 12/28/2012 | |
| Dividends qualifying for the dividends | | | | | | | | |
received deduction for corporations | | | 14.12 | % | | | 20.54 | % |
| Foreign source income | | | 8.73 | %* | | | 8.01 | %* |
| Foreign taxes paid per share | | $ | 0.000477 | | | $ | 0.002597 | |
| * | Expressed as a percentage of the cash distribution grossed-up for foreign taxes. |
The foreign taxes paid represent taxes incurred by the Portfolios on income received by the Portfolios from foreign sources. Foreign taxes paid may be included in taxable income with an offsetting deduction from gross income or may be taken as a credit for taxes paid to foreign governments. You should consult your tax adviser regarding the appropriate treatment of foreign taxes paid.
Please retain this information for your records.
Legg Mason
Variable Lifestyle Series
Trustees
Paul R. Ades
Andrew L. Breech
Dwight B. Crane
R. Jay Gerken
Chairman
Frank G. Hubbard
Howard J. Johnson
Jerome H. Miller
Ken Miller
John J. Murphy
Thomas F. Schlafly
Jerry A. Viscione
Investment manager
Legg Mason Partners Fund Advisor, LLC
Subadviser
Legg Mason Global Asset Allocation, LLC
Distributor
Legg Mason Investor Services, LLC
Custodian
State Street Bank and Trust Company
Transfer agent
Boston Financial Data Services, Inc. 2000 Crown Colony Drive
Quincy, MA 02169
Independent registered public accounting firm
KPMG LLP
345 Park Avenue
New York, NY 10154
Legg Mason Variable Lifestyle Series
Legg Mason Variable Lifestyle Allocation 85%
Legg Mason Variable Lifestyle Allocation 70%
Legg Mason Variable Lifestyle Allocation 50%
The Portfolios are separate investment series of Legg Mason Partners Variable Equity Trust, a Maryland statutory trust.
Legg Mason Variable Lifestyle Series
Legg Mason Funds
620 Eighth Avenue
New York, NY 10018
The Portfolios file their complete schedule of portfolio holdings with the Securities and Exchange Commission (“SEC”) for the first and third quarters of each fiscal year on Form N-Q. The Portfolios’ Forms N-Q are available on the SEC’s website at www.sec.gov. The Portfolios’ Forms N-Q may be reviewed and copied at the SEC’s Public Reference Room in Washington, D.C., and information on the operation of the Public Reference Room may be obtained by calling
1-800-SEC-0330. To obtain information on Form N-Q, shareholders can call the Portfolios at 1-877-721-1926.
Information on how the Portfolios voted proxies relating to portfolio securities during the prior 12-month period ended June 30th of each year and a description of the policies and procedures that the Portfolios use to determine how to vote proxies relating to portfolio transactions are available (1) without charge, upon request, by calling the Portfolios at 1-877-721-1926, (2) on the Portfolios’ website at www.leggmason.com/individualinvestors and (3) on the SEC’s website at www.sec.gov.
This report is submitted for the general information of the shareholders of Legg Mason Variable Lifestyle Allocation 85%, Legg Mason Variable Lifestyle Allocation 70% and Legg Mason Variable Lifestyle Allocation 50%. This report is not authorized for distribution to prospective investors in the Portfolios unless preceded or accompanied by a current prospectus.
Investors should consider each Portfolio’s investment objectives, risks, charges and expenses carefully before investing. Each prospectus contains this and other important information about the Portfolios. Please read the prospectus carefully before investing.
www.leggmason.com/individualinvestors
©2013 Legg Mason Investor Services, LLC
Member FINRA, SIPC
Legg Mason Funds Privacy and Security Notice
Your Privacy and the Security of Your Personal Information is Very Important to the Legg Mason Funds
This Privacy and Security Notice (the “Privacy Notice”) addresses the Legg Mason Funds’ privacy and data protection practices with respect to nonpublic personal information the Funds receive. The Legg Mason Funds include any funds sold by the Funds’ distributor, Legg Mason Investor Services, LLC, as well as Legg Mason-sponsored closed-end funds and certain closed-end funds managed or sub-advised by Legg Mason or its affiliates. The provisions of this Privacy Notice apply to your information both while you are a shareholder and after you are no longer invested with the Funds.
The Type of Nonpublic Personal Information the Funds Collect About You
The Funds collect and maintain nonpublic personal information about you in connection with your shareholder account. Such information may include, but is not limited to:
| Ÿ | | Personal information included on applications or other forms; |
| Ÿ | | Account balances, transactions, and mutual fund holdings and positions; |
| Ÿ | | Online account access user IDs, passwords, security challenge question responses; and |
| Ÿ | | Information received from consumer reporting agencies regarding credit history and creditworthiness (such as the amount of an individual’s total debt, payment history, etc.). |
How the Funds Use Nonpublic Personal Information About You
The Funds do not sell or share your nonpublic personal information with third parties or with affiliates for their marketing purposes, or with other financial institutions or affiliates for joint marketing purposes, unless you have authorized the Funds to do so. The Funds do not disclose any nonpublic personal information about you except as may be required to perform transactions or services you have authorized or as permitted or required by law. The Funds may disclose information about you to:
| Ÿ | | Employees, agents, and affiliates on a “need to know” basis to enable the Funds to conduct ordinary business or comply with obligations to government regulators; |
| Ÿ | | Service providers, including the Funds’ affiliates, who assist the Funds as part of the ordinary course of business (such as printing, mailing services, or processing or servicing your account with us) or otherwise perform services on the Funds’ behalf, including companies that may perform marketing services solely for the Funds; |
| Ÿ | | The Funds’ representatives such as legal counsel, accountants and auditors; and |
| Ÿ | | Fiduciaries or representatives acting on your behalf, such as an IRA custodian or trustee of a grantor trust. |
Except as otherwise permitted by applicable law, companies acting on the Funds’ behalf are contractually obligated to keep nonpublic personal information the Funds provide to them confidential and to use the information the Funds share only to provide the services the Funds ask them to perform.
The Funds may disclose nonpublic personal information about you when necessary to enforce their rights or protect against fraud, or as permitted or required by applicable law, such as in connection with a law enforcement or regulatory request, subpoena, or similar legal process. In the event of a corporate action or in the event a Fund service provider changes, the Funds may be required to disclose your nonpublic personal information to third parties. While it is the Funds’ practice to obtain protections for disclosed information in these types of transactions, the Funds cannot guarantee their privacy policy will remain unchanged.
|
| NOT PART OF THE ANNUAL REPORT |
Legg Mason Funds Privacy and Security Notice (cont’d)
Keeping You Informed of the Funds’ Privacy and Security Practices
The Funds will notify you annually of their privacy policy as required by federal law. While the Funds reserve the right to modify this policy at any time they will notify you promptly if this privacy policy changes.
The Funds’ Security Practices
The Funds maintain appropriate physical, electronic and procedural safeguards designed to guard your nonpublic personal information. The Funds’ internal data security policies restrict access to your nonpublic personal information to authorized employees, who may use your nonpublic personal information for Fund business purposes only.
Although the Funds strive to protect your nonpublic personal information, they cannot ensure or warrant the security of any information you provide or transmit to them, and you do so at your own risk. In the event of a breach of the confidentiality or security of your nonpublic personal information, the Funds will attempt to notify you as necessary so you can take appropriate protective steps. If you have consented to the Funds using electronic communications or electronic delivery of statements, they may notify you under such circumstances using the most current email address you have on record with them.
In order for the Funds to provide effective service to you, keeping your account information accurate is very important. If you believe that your account information is incomplete, not accurate or not current, or if you have questions about the Funds’ privacy practices, write the Funds using the contact information on your account statements, email the Funds by clicking on the Contact Us section of the Funds’ website at www.leggmason.com, or contact the Fund at 1-877-721-1926.
Revised April 2011
|
| NOT PART OF THE ANNUAL REPORT |
www.leggmason.com/individualinvestors
©2013 Legg Mason Investor Services, LLC Member FINRA, SIPC
FD01436 2/13 SR13-1845
The registrant has adopted a code of ethics that applies to the registrant’s principal executive officer, principal financial officer, principal accounting officer or controller.
| ITEM 3. | AUDIT COMMITTEE FINANCIAL EXPERT. |
The Board of Trustees of the registrant has determined that Jerry A. Viscione possesses the technical attributes identified in Instruction 2(b) of Item 3 to Form N-CSR to qualify as an “audit committee financial expert,” and has designated Mr. Viscione as the Audit Committee’s financial expert. Mr. Viscione is an “independent” Trustee pursuant to paragraph (a)(2) of Item 3 to Form N-CSR.
| ITEM 4. | PRINCIPAL ACCOUNTANT FEES AND SERVICES. |
a) Audit Fees. The aggregate fees billed in the previous fiscal years ending December 31, 2011 and December 31, 2012 (the “Reporting Periods”) for professional services rendered by the Registrant’s principal accountant (the “Auditor”) for the audit of the Registrant’s annual financial statements, or services that are normally provided by the Auditor in connection with the statutory and regulatory filings or engagements for the Reporting Periods, were $330,000 in December 31, 2011 and $317,700 in December 31, 2012.
b) Audit-Related Fees. The aggregate fees billed in the Reporting Period for assurance and related services by the Auditor that are reasonably related to the performance of the Registrant’s financial statements were $0 in December 31, 2011 and $0 in December 31, 2012.
In addition, there were no Audit-Related Fees billed in the Reporting Period for assurance and related services by the Auditor to the Registrant’s investment adviser (not including any sub-adviser whose role is primarily portfolio management and is subcontracted with or overseen by another investment adviser), and any entity controlling, controlled by or under common control with the investment adviser that provides ongoing services to the Legg Mason Partners Variable Equity Trust (“service affiliates”), that were reasonably related to the performance of the annual audit of the service affiliates. Accordingly, there were no such fees that required pre-approval by the Audit Committee for the Reporting Periods.
(c) Tax Fees. The aggregate fees billed in the Reporting Periods for professional services rendered by the Auditor for tax compliance, tax advice and tax planning (“Tax Services”) were $61,000 in December 31, 2011 and $48,100 in December 31, 2012. These services consisted of (i) review or preparation of U.S. federal, state, local and excise tax returns; (ii) U.S. federal, state and local tax planning, advice and assistance regarding statutory, regulatory or administrative developments, and (iii) tax advice regarding tax qualification matters and/or treatment of various financial instruments held or proposed to be acquired or held.
There were no fees billed for tax services by the Auditors to service affiliates during the Reporting Periods that required pre-approval by the Audit Committee.
d) All Other Fees. There were no other fees billed in the Reporting Periods for products and services provided by the Auditor, other than the services reported in paragraphs (a) through (c) of this Item for the Legg Mason Partners Variable Equity Trust.
All Other Fees. There were no other non-audit services rendered by the Auditor to Legg Mason Partners Fund Advisors, LLC (“LMPFA”), and any entity controlling, controlled by or under common control with LMPFA that provided ongoing services to Legg Mason Partners Variable Equity Trust requiring pre-approval by the Audit Committee in the Reporting Period.
(e) Audit Committee’s pre-approval policies and procedures described in paragraph (c) (7) of Rule 2-01 of Regulation
S-X.
(1) The Charter for the Audit Committee (the “Committee”) of the Board of each registered investment company (the “Fund”) advised by LMPFA or one of their affiliates (each, an “Adviser”) requires that the Committee shall approve (a) all audit and permissible non-audit services to be provided to the Fund and (b) all permissible non-audit services to be provided by the Fund’s independent auditors to the Adviser and any Covered Service Providers if the engagement relates directly to the operations and financial reporting of the Fund. The Committee may implement policies and procedures by which such services are approved other than by the full Committee.
The Committee shall not approve non-audit services that the Committee believes may impair the independence of the auditors. As of the date of the approval of this Audit Committee Charter, permissible non-audit services include any professional services (including tax services), that are not prohibited services as described below, provided to the Fund by the independent auditors, other than those provided to the Fund in connection with an audit or a review of the financial statements of the Fund. Permissible non-audit services may not include: (i) bookkeeping or other services related to the accounting records or financial statements of the Fund; (ii) financial information systems design and implementation; (iii) appraisal or valuation services, fairness opinions or contribution-in-kind reports; (iv) actuarial services; (v) internal audit outsourcing services; (vi) management functions or human resources; (vii) broker or dealer, investment adviser or investment banking services; (viii) legal services and expert services unrelated to the audit; and (ix) any other service the Public Company Accounting Oversight Board determines, by regulation, is impermissible.
Pre-approval by the Committee of any permissible non-audit services is not required so long as: (i) the aggregate amount of all such permissible non-audit services provided to the Fund, the Adviser and any service providers controlling, controlled by or under common control with the Adviser that provide ongoing services to the Fund (“Covered Service Providers”) constitutes not more than 5% of the total amount of revenues paid to the independent auditors during the fiscal year in which the permissible non-audit services are provided to (a) the Fund, (b) the Adviser and (c) any entity controlling, controlled by or under common control with the Adviser that provides ongoing services to the Fund during the fiscal year in which the services are provided that would have to be approved by the Committee; (ii) the permissible non-audit services were not recognized by the Fund at the time of the engagement to be non-audit services; and (iii) such services are promptly brought to the attention of the Committee and approved by the Committee (or its delegate(s)) prior to the completion of the audit.
(2) For the Legg Mason Partners Variable Equity Trust, the percentage of fees that were approved by the audit committee, with respect to: Audit-Related Fees were 100% and 100% for December 31, 2011 and December 31, 2012; Tax Fees were 100% and 100% for December 31, 2011 and December 31, 2012; and Other Fees were 100% and 100% for December 31, 2011 and December 31, 2012.
(f) N/A
(g) Non-audit fees billed by the Auditor for services rendered to Legg Mason Partners Variable Equity Trust, LMPFA and any entity controlling, controlled by, or under common control with LMPFA that provides ongoing services to Legg Mason Partners Variable Equity Trust during the reporting period were $0 in 2012.
(h) Yes. Legg Mason Partners Variable Equity Trust’s Audit Committee has considered whether the provision of non-audit services that were rendered to Service Affiliates, which were not pre-approved (not requiring pre-approval), is compatible with maintaining the Accountant’s independence. All services provided by the Auditor to the Legg Mason Partners Variable Equity Trust or to Service Affiliates, which were required to be pre-approved, were pre-approved as required.
| ITEM 5. | AUDIT COMMITTEE OF LISTED REGISTRANTS. |
| | a) | The independent board members are acting as the registrant’s audit committee as specified in Section 3(a)(58)(B) of the Exchange Act. The Audit Committee consists of the following Board members: |
Paul R. Ades
Andrew L. Breech
Dwight B. Crane
Frank G. Hubbard
Howard J. Johnson
Jerome H. Miller
Ken Miller
John J. Murphy
Thomas F. Schlafly
Jerry A. Viscione
| ITEM 6. | SCHEDULE OF INVESTMENTS. |
Included herein under Item 1.
| ITEM 7. | DISCLOSURE OF PROXY VOTING POLICIES AND PROCEDURES FOR CLOSED-END MANAGEMENT INVESTMENT COMPANIES. |
Not applicable.
| ITEM 8. | PORTFOLIO MANAGERS OF CLOSED-END MANAGEMENT INVESTMENT COMPANIES. |
Not applicable.
| ITEM 9. | PURCHASES OF EQUITY SECURITIES BY CLOSED-END MANAGEMENT INVESTMENT COMPANY AND AFFILIATED PURCHASERS. |
Not applicable.
| ITEM 10. | SUBMISSION OF MATTERS TO A VOTE OF SECURITY HOLDERS. |
Not applicable.
| ITEM 11. | CONTROLS AND PROCEDURES. |
| | (a) | The registrant’s principal executive officer and principal financial officer have concluded that the registrant’s disclosure controls and procedures (as defined in Rule 30a- 3(c) under the Investment Company Act of 1940, as amended (the “1940 Act”)) are effective as of a date within 90 days of the filing date of this report that includes the disclosure required by this paragraph, based on their evaluation of the disclosure controls and procedures required by Rule 30a-3(b) under the 1940 Act and 15d-15(b) under the Securities Exchange Act of 1934. |
| | (b) | There were no changes in the registrant’s internal control over financial reporting (as defined in Rule 30a-3(d) under the 1940 Act) that occurred during the second fiscal quarter of the period covered by this report that have materially affected, or are likely to materially affect the registrant’s internal control over financial reporting. |
(a) (1) Code of Ethics attached hereto.
Exhibit 99.CODE ETH
(a) (2) Certifications pursuant to section 302 of the Sarbanes-Oxley Act of 2002 attached hereto.
Exhibit 99.CERT
(b) Certifications pursuant to Section 906 of the Sarbanes-Oxley Act of 2002 attached hereto.
Exhibit 99.906CERT
SIGNATURES
Pursuant to the requirements of the Securities Exchange Act of 1934 and the Investment Company Act of 1940, the registrant has duly caused this Report to be signed on its behalf by the undersigned, there unto duly authorized.
| | |
| Legg Mason Partners Variable Equity Trust |
| |
| By: | | /s/ R. Jay Gerken |
| | (R. Jay Gerken) |
| | Chief Executive Officer |
| | Legg Mason Partners Variable Equity Trust |
| |
| Date: | | February 27, 2013 |
Pursuant to the requirements of the Securities Exchange Act of 1934 and the Investment Company Act of 1940, this report has been signed below by the following persons on behalf of the registrant and in the capacities and on the dates indicated.
| | |
| By: | | /s/ R. Jay Gerken |
| | (R. Jay Gerken) |
| | Chief Executive Officer |
| | Legg Mason Partners Variable Equity Trust |
| |
| Date: | | February 27, 2013 |
| |
| By: | | /s/ Richard F. Sennett |
| | (Richard F. Sennett) |
| | Principal Financial Officer |
| | Legg Mason Partners Variable Equity Trust |
| |
| Date: | | February 27, 2013 |