UNITED STATES
SECURITIES AND EXCHANGE COMMISSION
Washington, D.C. 20549
FORM N-CSR
CERTIFIED SHAREHOLDER REPORT OF REGISTERED
MANAGEMENT INVESTMENT COMPANIES
Investment Company Act file number 811-21128
Legg Mason Partners Variable Equity Trust
(Exact name of registrant as specified in charter)
620 Eighth Avenue, 49th Floor, New York, NY 10018
(Address of principal executive offices) (Zip code)
Robert I. Frenkel, Esq.
Legg Mason & Co., LLC
100 First Stamford Place
Stamford, CT 06902
(Name and address of agent for service)
Registrant’s telephone number, including area code: 1-877-721-1926
Date of fiscal year end: December 31
Date of reporting period: June 30, 2013
| ITEM 1. | REPORT TO STOCKHOLDERS. |
The Semi-Annual Report to Stockholders is filed herewith.
June 30, 2013

Semi-Annual
Repor t
Legg Mason
Variable Lifestyle Series
Legg Mason Variable Lifestyle Allocation 85%
Legg Mason Variable Lifestyle Allocation 70%
Legg Mason Variable Lifestyle Allocation 50%
INVESTMENT PRODUCTS: NOT FDIC INSURED • NO BANK GUARANTEE • MAY LOSE VALUE
Legg Mason Variable Lifestyle Series
Legg Mason Variable Lifestyle Series (“Variable Lifestyle Series”) consists of separate investment Portfolios, each with its own investment objective and policies. Each Portfolio offers different levels of potential return and involves different levels of risk.
The Portfolios are separate investment series of the Legg Mason Partners Variable Equity Trust, a Maryland statutory trust.
| | | | |
| Letter from the president | | |  | |
Dear Shareholder,
We are pleased to provide the semi-annual report of Legg Mason Variable Lifestyle Series for the six-month reporting period ended June 30, 2013. Please read on for performance information for each Portfolio and a detailed look at prevailing economic and market conditions during the Portfolios’ reporting period.
I am pleased to introduce myself as the new President and Chief Executive Officer of the Portfolios, succeeding R. Jay Gerken, as he embarks upon his retirement. Jay has most recently served as Chairman of the Board, President and Chief Executive Officer of the Portfolios and other funds in the Legg Mason complex. On behalf of all our shareholders and the Portfolios’ Board of Trustees, I would like to thank Jay for his vision and guidance, and wish him all the best.
I am honored to have been appointed to my new role with the Portfolios. During my 23 year career in the financial industry, I have seen it evolve and expand. Despite these changes, keeping an unwavering focus on our shareholders and their needs remains paramount. This was a consistent focus of Jay’s, and I look forward to following his lead in the years to come.
As always, we remain committed to providing you with excellent service and a full spectrum of investment choices. We also remain committed to supplementing the support you receive from your financial advisor. One way we accomplish this is through our website, www.leggmason.com/individualinvestors. Here you can gain immediate access to market and investment information, including:
| Ÿ | | Market insights and commentaries from our portfolio managers and |
| Ÿ | | A host of educational resources. |
We look forward to helping you meet your financial goals.
Sincerely,

Kenneth D. Fuller
President and Chief Executive Officer
July 26, 2013
| | |
| II | | Legg Mason Variable Lifestyle Series |
Investment commentary
Economic review
The U.S. economy continued to grow over the six months ended June 30, 2013 (the “reporting period”), but the pace was far from robust. Looking back, U.S. gross domestic product (“GDP”)i growth, as reported by the U.S. Department of Commerce, was an anemic 0.1% during the fourth quarter of 2012. This weakness was partially driven by moderating private inventory investment and federal government spending. Economic growth then improved, as first quarter 2013 GDP growth was 1.1%. Accelerating growth was due, in part, to strengthening consumer spending, which rose 2.3% during the first quarter, versus a 1.7% increase during the previous quarter. The U.S. Department of Commerce’s initial reading for second quarter 2013 GDP growth, released after the reporting period ended, was 1.7%. This increase was partially driven by increases in non-residential fixed investment and exports, along with a smaller decline in federal government spending versus the previous quarter.
While there was some improvement in the U.S. job market, unemployment remained elevated throughout the reporting period. When the period began, unemployment, as reported by the U.S. Department of Labor, was 7.9%. Unemployment then fell to 7.7% in February, 7.6% in March and 7.5% in April. It then edged up to 7.6% in May and was unchanged in June. In an encouraging sign, an average of almost 202,000 jobs were created per month during the first half of 2013. In contrast, the monthly average was roughly 183,000 in 2012. In addition, the percentage of longer-term unemployed has declined, as roughly 36.7% of the 11.8 million Americans looking for work in June 2013 have been out of work for more than six months, versus 38.1% in January 2013.
Meanwhile, the housing market brightened, as sales generally improved and home prices continued to rebound. According to the National Association of Realtors (“NAR”), existing-home sales dipped 1.2% on a seasonally adjusted basis in June 2013 versus the previous month and were 1.52% higher than in June 2012. In
addition, the NAR reported that the median existing-home price for all housing types was $214,200 in June 2013, up 13.5% from June 2012. This marked the sixteenth consecutive month that home prices rose compared to the same period a year earlier. While the inventory of homes available for sale rose 1.9% in June 2013 to a 5.2 month supply at the current sales pace, it was 7.6% lower than in June 2012.
While manufacturing activity was weak in many international developed countries, it was generally positive in the U.S. Based on the Institute for Supply Management’s Purchasing Managers’ Index (“PMI”)ii, the U.S. manufacturing sector expanded during the first four months of the reporting period. Manufacturing then experienced a setback, falling from 50.7 in April 2013 to 49.0 in May (a reading below 50 indicates a contraction, whereas a reading above 50 indicates an expansion). However, manufacturing then moved back into expansion territory in June, as the PMI increased to 50.9. During June, 12 of the 18 industries within the PMI expanded, versus 10 expanding the prior month.
Growth generally moderated overseas and, in some cases, fell back into a recession. In its July 2013 World Economic Outlook, which was released after the reporting period ended, the International Monetary Fund (“IMF”) stated that “Global growth is projected to remain subdued at slightly above three percent in 2013, the same as in 2012. This is less than forecast in the April 2013 World Economic Outlook.” From a regional perspective, the IMF anticipates 2013 growth will be -0.6% in the Eurozone. Growth in emerging market countries is expected to remain higher than in their developed country counterparts, and the IMF projects that emerging market growth will increase from 4.9% in 2012 to 5.0% in 2013. In particular, China’s economy is expected to grow 7.8% in 2013, the same as in 2012. Elsewhere, the IMF projects that growth in India will increase from 3.2% in 2012 to 5.6% in 2013.
| | |
| Legg Mason Variable Lifestyle Series | | III |
Investment commentary (cont’d)
Market review
Q. How did the Federal Reserve Board (“Fed”)iii respond to the economic environment?
A. The Fed took a number of actions as it sought to meet its dual mandate of fostering maximum employment and price stability. As has been the case since December 2008, the Fed kept the federal funds rateiv at a historically low range between zero and 0.25%. At its meeting in December 2012, prior to the beginning of the reporting period, the Fed announced that it would continue purchasing $40 billion per month of agency mortgage-backed securities (“MBS”), as well as initially purchasing $45 billion a month of longer-term Treasuries. The Fed also said that it would keep the federal funds rate on hold “…as long as the unemployment rate remains above 6.5%, inflation between one and two years ahead is projected to be no more than a half percentage point above the Committee’s 2.0% longer-run goal, and longer-term inflation expectations continue to be well anchored.” At its meeting that ended on June 19, 2013, the Fed did not make any material changes to its official policy statement. However, in a press conference following the meeting, Fed Chairman Bernanke said “…the Committee currently anticipates that it would be appropriate to moderate the monthly pace of purchases later this year; and if the subsequent data remain broadly aligned with our current expectations for the economy, we would continue to reduce the pace of purchases in measured steps through the first half of next year, ending purchases around midyear.” This initially triggered a sharp sell-off in both the stock and bond markets. While the stock market subsequently rallied and reached a new record high on July 12, the bond market did not rebound as sharply. As a result, Treasury yields remained sharply higher than they were prior to Chairman Bernanke’s press conference. At its meeting that ended on July 31, 2013, after the reporting period ended, the Fed did not institute any policy changes and left its $85 billion a month asset purchase program intact.
Q. What actions did international central banks take during the reporting period?
A. Given the economic challenges in the Eurozone, the European Central Bank (“ECB”)v lowered interest rates from 1.00% to 0.75% prior to the beginning of the period, at the time a record low. In September 2012, the ECB introduced its Outright Monetary Transactions (“OMT”) program. With the OMT, the ECB can purchase an unlimited amount of bonds that are issued by troubled Eurozone countries, provided the countries formally ask to participate in the program and agree to certain conditions. In May 2013, the ECB cut rates to a new record low of 0.50%. In other developed countries, the Bank of England kept rates on hold at 0.50% during the reporting period, as did Japan at a range of zero to 0.10%, its lowest level since 2006. In January 2013, the Bank of Japan announced that it would raise its target for annual inflation from 1% to 2%, and the Japanese government introduced a ¥10.3 trillion ($116 billion)
stimulus package to support its economy. Elsewhere, the Reserve Bank of India lowered interest rates three times during the reporting period to 7.25%, whereas the People’s Bank of China kept rates on hold at 6.0%.
Q. What factors impacted the U.S. stock market during the reporting period?
A. Despite periods of volatility and several “flights to quality,” the U.S. stock market generated strong results during the reporting period. As 2013 began, there were concerns about the “fiscal cliff” and its potential impact on the economy. While this and other macro issues, including the European sovereign debt crisis and uncertainties surrounding the impact of sequestration, weighed on investor sentiment at times, the market posted positive results during the first five months of the reporting period. The market then experienced a modest setback in June 2013, due to concerns related to the tapering of the Fed’s asset purchase program. However, for the six months ended June 30, 2013, the S&P 500 Indexvi gained 13.82%.
Looking at the U.S. stock market more closely, small-cap stocks generated the best returns during the six months ended June 30, 2013, with the Russell 2000 Indexvii gaining 15.86%. In contrast, large-cap stocks, as measured by the Russell 1000 Indexviii , returned 13.91% and the Russell Midcap Indexix returned 15.45%. From an investment style perspective, growth and value stocks, as measured by the Russell 3000 Growthx and Russell 3000 Valuexi Indices, returned 12.23% and 15.78%, respectively.
Q. How did the international stock markets perform during the reporting period?
A. The international developed stock market, as measured by the MSCI EAFE Indexxii posted a positive return but underperformed the S&P 500 Index during the six months ended June 30, 2013, gaining 4.10%. Emerging market equities, in contrast, produced very weak results, as the MSCI Emerging Markets Indexxiii fell 9.57%. Emerging market equities performed poorly given weakening global growth, concerns regarding China’s ability to orchestrate a “soft landing” for its economy, generally falling commodity prices and rising U.S. interest rates.
Q. Did Treasury yields trend higher or lower during the six months ended June 30, 2013?
A. Both short- and long-term Treasury yields moved sharply higher during the reporting period. When the period began, the yield on the two-year Treasury was 0.25%. It fell as low as 0.20% in late April/early May 2013 and was as high as 0.43% on June 25, 2013, before ending the period at 0.36%. The yield on the ten-year Treasury began the period at 1.78%. Ten-year Treasuries reached a low of 1.66% in early May 2013 and peaked at 2.60% on June 25, 2013, before edging down to 2.52% at the end of the period.
| | |
| IV | | Legg Mason Variable Lifestyle Series |
Q. What factors impacted the spread sectors (non-Treasuries) during the reporting period?
A. Most spread sectors performed poorly during the reporting period. Spread sector demand was often solid during the first four months of the period as investors looked to generate incremental yield in the low interest rate environment. Even so, there were several periods of volatility given a number of macro issues, including the European sovereign debt crisis, mixed economic data and concerns related to the U.S. “fiscal cliff” and sequestration. The spread sectors then weakened over the last two months of the period amid sharply rising interest rates given the Fed’s plan to begin tapering its asset purchase program sooner than previously anticipated. The majority of spread sectors generated negative absolute returns and performed largely in line with equal-durationxiv Treasuries during the reporting period as a whole. For the six months ended June 30, 2013, the Barclays U.S. Aggregate Indexxv fell 2.44%.
Q. How did the high-yield market perform over the six months ended June 30, 2013?
A. The U.S. high-yield bond market was one of the few spread sectors to generate a positive return during the reporting period. The
asset class, as measured by the Barclays U.S. Corporate High Yield — 2% Issuer Cap Indexxvi, posted positive returns during the first four months of the period. Risk appetite was often solid during that time as investors were drawn to higher yielding securities. However, the high-yield market gave back a large portion of previous gains in May and June. All told, the high-yield market gained 1.42% for the six months ended June 30, 2013.
Q. How did the emerging market debt asset class perform over the reporting period?
A. The asset class generated poor results during the six months ended June 30, 2013. Aside from a brief rally in April 2013, the asset class fell during the other five months of the reporting period. This weakness was triggered by a number of factors, including concerns over moderating global growth, fears of a “hard landing” for China’s economy, generally weaker commodity prices and sharply rising U.S. interest rates. Overall, the JPMorgan Emerging Markets Bond Index Global (“EMBI Global”)xvii fell 8.22% over the six months ended June 30, 2013.
| | |
| Legg Mason Variable Lifestyle Series | | V |
Investment commentary (cont’d)
Legg Mason Variable Lifestyle Allocation 85%
Target Asset Allocation1
| | |
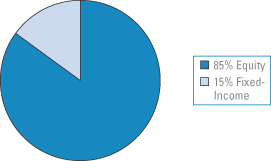 | | Legg Mason Variable Lifestyle Allocation 85% seeks capital appreciation by investing 85% of its assets in underlying funds that invest principally in equity securities and 15% in underlying funds that invest principally in fixed-income securities. |
Performance review
For the six months ended June 30, 2013, Legg Mason Variable Lifestyle Allocation 85%2 returned 9.52%. The Portfolio’s unmanaged benchmarks, the Barclays U.S. Aggregate Index, the Russell 3000 Indexxviii and the Lifestyle Allocation 85% Composite Benchmarkxix, returned -2.44%, 14.06% and 9.99%, respectively, over the same time frame. The Lipper Variable Mixed-Asset Target Allocation Growth Funds Category Average3 returned 6.60% for the same period.
| | | | |
| Performance Snapshot as of June 30, 2013 (unaudited) | | | |
| | | 6 months | |
| Variable Lifestyle Allocation 85%2 | | | 9.52 | % |
| Barclays U.S. Aggregate Index | | | -2.44 | % |
| Russell 3000 Index | | | 14.06 | % |
| Lifestyle Allocation 85% Composite Benchmark | | | 9.99 | % |
| Lipper Variable Mixed-Asset Target Allocation Growth Funds Category Average3 | | | 6.60 | % |
The performance shown represents past performance. Past performance is no guarantee of future results and current performance may be higher or lower than the performance shown above. Principal value and investment returns will fluctuate and investors’ shares, when redeemed, may be worth more or less than their original cost.
Portfolio return assumes the reinvestment of all distributions, including returns of capital, if any, at net asset value and the deduction of all Portfolio expenses. Performance figures for periods shorter than one year represent cumulative figures and are not annualized.
The portfolio managers periodically adjust the allocation of the Portfolio’s assets among different Legg Mason-affiliated funds depending upon the portfolio managers’ outlook for the equity and fixed-income markets in general, particular sectors of such markets and the performance outlook for the underlying funds. The Portfolio is not expected to be invested in all of the underlying funds at any time. The Portfolio may change its allocations among the underlying funds and may vary the allocation between equity and fixed-income funds within the Target Range4 without prior notice to shareholders.
Total Annual Operating Expenses† (unaudited)
As of the Portfolio’s current prospectus dated May 1, 2013, the gross total annual operating expense ratio for the Portfolio was 0.93%.
Actual expenses may be higher. For example, expenses may be higher than those shown if average net assets decrease. Net assets are more likely to decrease and Portfolio expense ratios are more likely to increase when markets are volatile.
| 1 | The Target Asset Allocation set forth above represents an approximate mix of investments for Legg Mason Variable Lifestyle Allocation 85%. The allocation and investment mix of the Portfolio may vary depending upon market conditions, cash flows in and out of the Portfolio and other factors. In addition, the allocation and investment range of the Portfolio may be changed, from time to time, without prior notice to shareholders. |
| 2 | The Portfolio is an underlying investment option of various variable annuity and variable life insurance products. The Portfolio’s performance returns do not reflect the deduction of expenses imposed in connection with investing in variable annuity or variable life insurance contracts, such as administrative fees, account charges and surrender charges, which, if reflected, would reduce the performance of the Portfolio. Past performance is no guarantee of future results. |
| 3 | Lipper, Inc., a wholly-owned subsidiary of Reuters, provides independent insight on global collective investments. Returns are based on the six-month period ended June 30, 2013, including the reinvestment of all distributions, including returns of capital, if any, calculated among the 300 funds in the Portfolio’s Lipper category. |
| 4 | The Target Range is the percentage range, as stated by the prospectus, within which the Portfolio may make tactical changes to its equity funds/fixed-income funds allocation. |
| † | Includes expenses of the underlying funds in which the Portfolio invests. |
| | |
| VI | | Legg Mason Variable Lifestyle Series |
Legg Mason Variable Lifestyle Allocation 70%
Target Asset Allocation1
| | |
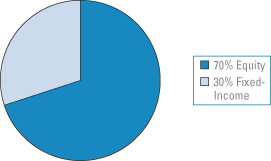 | | Legg Mason Variable Lifestyle Allocation 70% seeks long-term growth of capital by investing 70% of its assets in underlying funds that invest principally in equity securities and 30% in underlying funds that invest principally in fixed-income securities. |
Performance review
For the six months ended June 30, 2013, Legg Mason Variable Lifestyle Allocation 70%2 returned 7.92%. The Portfolio’s unmanaged benchmarks, the Barclays U.S. Aggregate Index, the Russell 3000 Index and the Lifestyle Allocation 70% Composite Benchmarkxx, returned -2.44%, 14.06% and 7.87%, respectively, for the same period. The Lipper Variable Mixed-Asset Target Allocation Growth Funds Category Average3 returned 6.60% over the same time frame.
| | | | |
| Performance Snapsot as of June 30, 2013 (unaudited) | |
| | | 6 months | |
| Variable Lifestyle Allocation 70%2 | | | 7.92 | % |
| Barclays U.S. Aggregate Index | | | -2.44 | % |
| Russell 3000 Index | | | 14.06 | % |
| Lifestyle Allocation 70% Composite Benchmark | | | 7.87 | % |
| Lipper Variable Mixed-Asset Target Allocation Growth Funds Category Average3 | | | 6.60 | % |
The performance shown represents past performance. Past performance is no guarantee of future results and current performance may be higher or lower than the performance shown above. Principal value and investment returns will fluctuate and investors’ shares, when redeemed, may be worth more or less than their original cost.
Portfolio return assumes the reinvestment of all distributions, including returns of capital, if any, at net asset value and the deduction of all Portfolio expenses. Performance figures for periods shorter than one year represent cumulative figures and are not annualized.
Fund performance figures reflect fee waivers and/or expense reimbursements, without which the performance would have been lower.
The portfolio managers periodically adjust the allocation of the Portfolio’s assets among different Legg Mason-affiliated funds depending upon the portfolio managers’ outlook for the equity and fixed-income markets in general, particular sectors of such markets and the performance outlook for the underlying funds. The Portfolio is not expected to be invested in all of the underlying funds at any time. The Portfolio may change its allocations among the underlying funds and may vary the allocation between equity and fixed-income funds within the Target Range4 without prior notice to shareholders.
Total Annual Operating Expenses† (unaudited)
As of the Portfolio’s current prospectus dated May 1, 2013, the gross total annual operating expense ratio for the Portfolio was 0.94%.
Actual expenses may be higher. For example, expenses may be higher than those shown if average net assets decrease. Net assets are more likely to decrease and Portfolio expense ratios are more likely to increase when markets are volatile.
| 1 | The Target Asset Allocation set forth above represents an approximate mix of investments for Legg Mason Variable Lifestyle Allocation 70%. The allocation and investment mix of the Portfolio may vary depending upon market conditions, cash flows in and out of the Portfolio and other factors. In addition, the allocation and investment ranges of the Portfolio may be changed, from time to time, without prior notice to shareholders. |
| 2 | The Portfolio is an underlying investment option of various variable annuity and variable life insurance products. The Portfolio’s performance returns do not reflect the deduction of expenses imposed in connection with investing in variable annuity or variable life insurance contracts, such as administrative fees, account charges and surrender charges, which, if reflected, would reduce the performance of the Portfolio. Past performance is no guarantee of future results. |
| 3 | Lipper, Inc., a wholly-owned subsidiary of Reuters, provides independent insight on global collective investments. Returns are based on the six-month period ended June 30, 2013, including the reinvestment of all distributions, including returns of capital, if any, calculated among the 300 funds in the Portfolio’s Lipper category. |
| 4 | The Target Range is the percentage range, as stated by the prospectus, within which the Portfolio may make tactical changes to its equity funds/fixed-income funds allocation. |
| † | Includes expenses of the underlying funds in which the Portfolio invests. |
| | |
| Legg Mason Variable Lifestyle Series | | VII |
Investment commentary (cont’d)
Legg Mason Variable Lifestyle Allocation 50%
Target Asset Allocation1
| | |
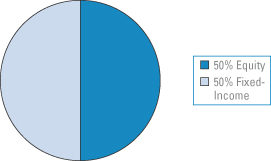 | | Legg Mason Variable Lifestyle Allocation 50% seeks a balance of growth of capital and income by investing 50% of its assets in underlying funds that invest principally in equity securities and 50% in underlying funds that invest principally in fixed-income securities. |
Performance review
For the six months ended June 30, 2013, Legg Mason Variable Lifestyle Allocation 50%2 returned 5.26%. The Portfolio’s unmanaged benchmarks, the Barclays U.S. Aggregate Index, the Russell 1000 Index and the Lifestyle Allocation 50% Composite Benchmarkxxi, returned -2.44%, 13.91% and 5.08%, respectively, for the same period. The Lipper Variable Mixed-Asset Target Allocation Moderate Funds Category Average3 returned 4.54% over the same time frame.
| | | | |
| Performance Snapshot as of June 30, 2013 (unaudited) | | | |
| | | 6 months | |
| Variable Lifestyle Allocation 50%2 | | | 5.26 | % |
| Barclays U.S. Aggregate Index | | | -2.44 | % |
| Russell 1000 Index | | | 13.91 | % |
| Lifestyle Allocation 50% Composite Benchmark | | | 5.08 | % |
| Lipper Variable Mixed-Asset Target Allocation Moderate Funds Category Average3 | | | 4.54 | % |
The performance shown represents past performance. Past performance is no guarantee of future results and current performance may be higher or lower than the performance shown
above. Principal value and investment returns will fluctuate and investors’ shares, when redeemed, may be worth more or less than their original cost.
Portfolio return assumes the reinvestment of all distributions, including returns of capital, if any, at net asset value and the deduction of all Portfolio expenses. Performance figures for periods shorter than one year represent cumulative figures and are not annualized.
The portfolio managers periodically adjust the allocation of the Portfolio’s assets among different Legg Mason-affiliated funds depending upon the portfolio managers’ outlook for the equity and fixed-income markets in general, particular sectors of such markets and the performance outlook for the underlying funds. The Portfolio is not expected to be invested in all of the underlying funds at any time. The Portfolio may change its allocations among the underlying funds and may vary the allocation between equity and fixed-income funds within the Target Range4 without prior notice to shareholders.
Total Annual Operating Expenses† (unaudited)
As of the Portfolio’s current prospectus dated May 1, 2013, the gross total annual operating expense ratio for the Portfolio was 0.81%.
Actual expenses may be higher. For example, expenses may be higher than those shown if average net assets decrease. Net assets are more likely to decrease and Portfolio expense ratios are more likely to increase when markets are volatile.
| 1 | The Target Asset Allocation set forth above represents an approximate mix of investments for Legg Mason Variable Lifestyle Allocation 50%. The allocation and investment mix of the Portfolio may vary depending upon market conditions, cash flows in and out of the Portfolio and other factors. In addition, the allocation and investment range of the Portfolio may be changed, from time to time, without prior notice to shareholders. |
| 2 | The Portfolio is an underlying investment option of various variable annuity and variable life insurance products. The Portfolio’s performance returns do not reflect the deduction of expenses imposed in connection with investing in variable annuity or variable life insurance contracts, such as administrative fees, account charges and surrender charges, which, if reflected, would reduce the performance of the Portfolio. Past performance is no guarantee of future results. |
| 3 | Lipper, Inc., a wholly-owned subsidiary of Reuters, provides independent insight on global collective investments. Returns are based on the six-month period ended June 30, 2013, including the reinvestment of all distributions, including returns of capital, if any, calculated among the 240 funds in the Portfolio’s Lipper category. |
| 4 | The Target Range is the percentage range, as stated by the prospectus, within which the Portfolio may make tactical changes to its equity funds/fixed-income funds allocation. |
| † | Includes expenses of the underlying funds in which the Portfolio invests. |
| | |
| VIII | | Legg Mason Variable Lifestyle Series |
As always, thank you for your confidence in our stewardship of your assets.
Sincerely,
Kenneth D. Fuller
President and Chief Executive Officer
August 1, 2013
RISKS: Equity securities are subject to price fluctuation. Fixed-income securities are subject to interest rate and credit risks. Foreign securities are subject to certain risks of overseas investing including currency fluctuations and changes in political and economic conditions, which could result in significant market fluctuations. These risks are magnified in emerging markets. Investments in small- and mid-capitalization companies may involve a higher degree of risk and volatility than investments in larger, more established companies. As interest rates rise, bond prices fall, reducing the
value of the Portfolios’ share prices. High-yield bonds involve greater credit and liquidity risks than investment grade bonds. There are additional risks and other expenses associated with investing in other mutual funds rather than directly in portfolio securities. Certain underlying funds may use derivatives, such as options and futures, which can be illiquid, may disproportionately increase losses, and have a potentially large impact on Portfolio performance. Additionally, the portfolio managers may invest in underlying funds that have a limited performance history. Please see the Portfolios’ prospectuses for a more complete discussion of these and other risks, and the Portfolios’ investment strategies.
All investments are subject to risk including the possible loss of principal. Past performance is no guarantee of future results. All index performance reflects no deduction for fees, expenses or taxes. Please note that an investor cannot invest directly in an index.
The information provided is not intended to be a forecast of future events, a guarantee of future results or investment advice. Views expressed may differ from those of the firm as a whole. Forecasts and predictions are inherently limited and should not be relied upon as an indication of actual or future performance.
| i | Gross domestic product (“GDP”) is the market value of all final goods and services produced within a country in a given period of time. |
| ii | The Institute for Supply Management’s PMI is based on a survey of purchasing executives who buy the raw materials for manufacturing at more than 350 companies. It offers an early reading on the health of the manufacturing sector. |
| iii | The Federal Reserve Board (“Fed”) is responsible for the formulation of policies designed to promote economic growth, full employment, stable prices and a sustainable pattern of international trade and payments. |
| iv | The federal funds rate is the rate charged by one depository institution on an overnight sale of immediately available funds (balances at the Federal Reserve) to another depository institution; the rate may vary from depository institution to depository institution and from day to day. |
| v | The European Central Bank (“ECB”) is responsible for the monetary system of the European Union and the euro currency. |
| vi | The S&P 500 Index is an unmanaged index of 500 stocks and is generally representative of the performance of larger companies in the U.S. |
| vii | The Russell 2000 Index measures the performance of the small-cap segment of the U.S. equity universe. The Russell 2000 is a subset of the Russell 3000 Index representing approximately 10% of the total market capitalization of that index. It includes approximately 2,000 of the smallest securities based on a combination of their market cap and current index membership. |
| viii | The Russell 1000 Index measures the performance of the large-cap segment of the U.S. equity universe. It is a subset of the Russell 3000 Index and includes approximately 1,000 of the largest securities based on a combination of their market cap and current index membership. The Russell 1000 represents approximately 92% of the U.S. market. |
| ix | The Russell Midcap Index measures the performance of the mid-cap segment of the U.S. equity universe. The Russell Midcap is a subset of the Russell 1000 Index. It includes approximately 800 of the smallest securities based on a combination of their market cap and current index membership. The Russell Midcap represents approximately 31% of the total market capitalization of the Russell 1000 companies. |
| x | The Russell 3000 Growth Index measures the performance of the broad growth segment of the U.S. equity universe. It includes those Russell 3000 Index companies with higher price-to-book ratios and higher forecasted growth values. (A price-to-book ratio is the price of a stock compared to the difference between a company’s assets and liabilities.) |
| xi | The Russell 3000 Value Index measures the performance of the broad value segment of the U.S. equity universe. It includes those Russell 3000 Index companies with lower price-to-book ratios and lower forecasted growth values. |
| xii | The MSCI EAFE Index is a free float-adjusted market capitalization index designed to measure developed market equity performance, excluding the U.S. and Canada. |
| xiii | The MSCI Emerging Markets Index is a free float-adjusted market capitalization index that is designed to measure equity market performance in the global emerging markets. |
| xiv | Duration is the measure of the price sensitivity of a fixed-income security to an interest rate change of 100 basis points. Calculation is based on the weighted average of the present values for all cash flows. |
| xv | The Barclays U.S. Aggregate Index is a broad-based bond index comprised of government, corporate, mortgage- and asset-backed issues, rated investment grade or higher, and having at least one year to maturity. |
| xvi | The Barclays U.S. Corporate High Yield — 2% Issuer Cap Index is an index of the 2% Issuer Cap component of the Barclays U.S. Corporate High Yield Index, which covers the U.S. dollar-denominated, non-investment grade, fixed-rate, taxable corporate bond market. |
| xvii | The JPMorgan Emerging Markets Bond Index Global (“EMBI Global”) tracks total returns for U.S. dollar-denominated debt instruments issued by emerging market sovereign and quasi-sovereign entities: Brady bonds, loans, Eurobonds and local market instruments. |
| xviii | The Russell 3000 Index measures the performance of the 3,000 largest U.S. companies based on total market capitalization, which represents approximately 98% of the U.S. equity market. |
| xix | The Lifestyle Allocation 85% Composite Benchmark is a hypothetical representation of the performance of the Portfolio’s major asset classes. It consists of 45% Russell 1000 Index, 20% Russell 2000 Index, 20% MSCI EAFE Index, 10% Barclays U.S. Aggregate Index and 5% Barclays U.S. Corporate High Yield — 2% Issuer Cap Index. |
| xx | The Lifestyle Allocation 70% Composite Benchmark is a hypothetical representation of the performance of the Portfolio’s major asset classes. It consists of 40% Russell 1000 Index, 15% Russell 2000 Index, 15% MSCI EAFE Index, 25% Barclays U.S. Aggregate Index and 5% Barclays U.S. Corporate High Yield — 2% Issuer Cap Index. |
| xxi | The Lifestyle Allocation 50% Composite Benchmark is a hypothetical representation of the performance of the Portfolio’s major asset classes. It consists of 28% Russell 1000 Index, 12% Russell 2000 Index, 10% MSCI EAFE Index, 43% Barclays U.S. Aggregate Index and 7% Barclays U.S. Corporate High Yield — 2% Issuer Cap Index. |
| | |
| Legg Mason Variable Lifestyle Series | | IX |
(This page intentionally left blank.)
Portfolios at a glance (unaudited)
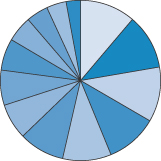
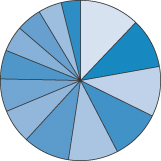
Legg Mason Variable Lifestyle Allocation 85% Breakdown† as of — June 30, 2013
As a Percent of Total Long-Term Investments
| | | | |
% of Total Long-Term
Investments | | Top 5 Sectors |
 | | 11.2 Legg Mason Global Asset Management Trust — Legg Mason BW Diversified Large Cap Value Fund, Class IS Shares | | Financials Industrials Health Care Energy Information Technology |
 | | 11.1 Legg Mason Partners Equity Trust — Legg Mason Batterymarch U.S. Large Cap Equity Fund, Class IS Shares | | Information Technology Consumer Discretionary Financials Health Care Industrials |
 | | 11.1 Legg Mason Partners Equity Trust — ClearBridge Appreciation Fund, Class IS Shares | | Information Technology Financials Consumer Discretionary Health Care Consumer Staples |
 | | 10.4 Legg Mason Partners Equity Trust — ClearBridge Aggressive Growth Fund, Class IS Shares | | Health Care Consumer Discretionary Information Technology Energy Industrials |
 | | 9.8 Legg Mason Partners Equity Trust — ClearBridge International All Cap Opportunity Fund, Class IS Shares | | Financials Industrials Consumer Discretionary Information Technology Consumer Staples |
 | | 9.2 Legg Mason Global Asset Management Trust — Legg Mason Batterymarch International Equity Trust, Class IS Shares | | Financials Consumer Discretionary Industrials Health Care Consumer Staples |
 | | 7.2 Legg Mason Partners Equity Trust — ClearBridge Small Cap Growth Fund, Class IS Shares | | Information Technology Health Care Consumer Discretionary Industrials Financials |
| † | Subject to change at any time. |
| | | | |
% of Total Long-Term
Investments | | Top 5 Sectors |
 | | 7.1 The Royce Fund — Royce Value Fund, Institutional Class Shares | | Consumer Discretionary Information Technology Financials Energy Industrials |
 | | 6.4 Legg Mason Global Asset Management Trust — Legg Mason Strategic Real Return Fund, Class IS Shares | | U.S. Treasury Inflation Protected Securities Investments In Underlying Funds Financials Consumer Discretionary Information Technology |
 | | 5.2 Legg Mason Partners Equity Trust — ClearBridge Mid Cap Core Fund, Class IS Shares | | Financials Consumer Discretionary Information Technology Health Care Industrials |
 | | 4.4 Western Asset Funds, Inc. — Western Asset Core Plus Bond Fund, Class IS Shares | | Corporate Bonds & Notes Mortgage-Backed Securities U.S. Government & Agency Obligations Collateralized Mortgage Obligations Asset-Backed Securities |
 | | 4.0 Western Asset Funds, Inc. — Western Asset Total Return Unconstrained Fund, Class IS Shares | | U.S. Government & Agency Obligations Financials Mortgage-Backed Securities Collateralized Mortgage Obligations Consumer Discretionary |
 | | 2.9 Western Asset Funds, Inc. — Western Asset High Yield Fund, Class IS Shares | | Consumer Discretionary Industrials Energy Materials Financials |
| | |
| Legg Mason Variable Lifestyle Series 2013 Semi-Annual Report | | 1 |
Portfolios at a glance (unaudited) (cont’d)
Legg Mason Variable Lifestyle Allocation 70% Breakdown† as of — June 30, 2013
As a Percent of Total Long-Term Investments
| | | | |
% of Total Long-Term
Investments | | Top 5 Sectors |
| | | 12.1 Western Asset Funds, Inc. — Western Asset Core Plus Bond Fund, Class IS Shares | | Corporate Bonds & Notes Mortgage-Backed Securities U.S. Government & Agency Obligations Collateralized Mortgage Obligations Asset-Backed Securities |
| | | 10.1 Legg Mason Partners Equity Trust — ClearBridge Appreciation Fund, Class IS Shares | | Information Technology Financials Consumer Discretionary Health Care Consumer Staples |
| | | 10.1 Legg Mason Global Asset Management Trust — Legg Mason BW Diversified Large Cap Value Fund, Class IS Shares | | Financials Industrials Health Care Energy Information Technology |
| | | 10.1 Legg Mason Partners Equity Trust — Legg Mason Batterymarch U.S. Large Cap Equity Fund, Class IS Shares | | Information Technology Consumer Discretionary Financials Health Care Industrials |
| | | 10.0 Western Asset Funds, Inc. — Western Asset Total Return Unconstrained Fund, Class IS Shares | | U.S. Government & Agency Obligations Financials Mortgage-Backed Securities Collateralized Mortgage Obligations Consumer Discretionary |
| | | 9.4 Legg Mason Partners Equity Trust — ClearBridge Aggressive Growth Fund, Class IS Shares | | Health Care Consumer Discretionary Information Technology Energy Industrials |
| † | Subject to change at any time. |
| | | | |
% of Total Long-Term
Investments | | Top 5 Sectors |
| | | 6.9 Legg Mason Partners Equity Trust — ClearBridge International All Cap Opportunity Fund, Class IS Shares | | Financials Industrials Consumer Discretionary Information Technology Consumer Staples |
| | | 6.6 Legg Mason Global Asset Management Trust — Legg Mason Strategic Real Return Fund, Class IS Shares | | U.S. Treasury Inflation Protected Securities Investments In Underlying Funds Financials Consumer Discretionary Information Technology |
| | | 5.8 Legg Mason Global Asset Management Trust — Legg Mason Batterymarch International Equity Trust, Class IS Shares | | Financials Consumer Discretionary Industrials Health Care Consumer Staples |
| | | 5.2 Legg Mason Partners Equity Trust — ClearBridge Small Cap Growth Fund, Class IS Shares | | Information Technology Health Care Consumer Discretionary Industrials Financials |
| | | 5.1 The Royce Fund — Royce Value Fund, Institutional Class Shares | | Consumer Discretionary Information Technology Financials Energy Industrials |
| | | 4.7 Legg Mason Partners Equity Trust — ClearBridge Mid Cap Core Fund, Class IS Shares | | Financials Consumer Discretionary Information Technology Health Care Industrials |
| | | 3.9 Western Asset Funds, Inc. — Western Asset High Yield Fund, Class IS Shares | | Consumer Discretionary Industrials Energy Materials Financials |
| | |
| 2 | | Legg Mason Variable Lifestyle Series 2013 Semi-Annual Report |
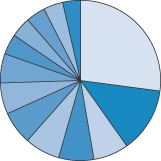
Legg Mason Variable Lifestyle Allocation 50% Breakdown† as of — June 30, 2013
As a Percent of Total Long-Term Investments
| | | | |
% of Total Long-Term
Investments | | Top 5 Sectors |
| | | 27.1 Western Asset Funds, Inc. — Western Asset Core Plus Bond Fund, Class IS Shares | | Corporate Bonds & Notes Mortgage-Backed Securities U.S. Government & Agency Obligations Collateralized Mortgage Obligations Asset-Backed Securities |
| | | 13.1 Western Asset Funds, Inc. — Western Asset Total Return Unconstrained Fund, Class IS Shares | | U.S. Government & Agency Obligations Financials Mortgage-Backed Securities Collateralized Mortgage Obligations Consumer Discretionary |
| | | 7.1 Legg Mason Global Asset Management Trust — Legg Mason BW Diversified Large Cap Value Fund, Class IS Shares | | Financials Industrials Health Care Energy Information Technology |
| | | 7.1 Legg Mason Partners Equity Trust — Legg Mason Batterymarch U.S. Large Cap Equity Fund, Class IS Shares | | Information Technology Consumer Discretionary Financials Health Care Industrials |
| | | 7.1 Legg Mason Partners Equity Trust — ClearBridge Appreciation Fund, Class IS Shares | | Information Technology Financials Consumer Discretionary Health Care Consumer Staples |
| | | 6.7 Legg Mason Global Asset Management Trust — Legg Mason Strategic Real Return Fund, Class IS Shares | | U.S. Treasury Inflation Protected Securities Investments In Underlying Funds Financials Consumer Discretionary Information Technology |
| † | Subject to change at any time. |
| | | | |
% of Total Long-Term
Investments | | Top 5 Sectors |
| | | 6.3 Legg Mason Partners Equity Trust — ClearBridge Aggressive Growth Fund, Class IS Shares | | Health Care Consumer Discretionary Information Technology Energy Industrials |
| | | 5.9 Western Asset Funds, Inc. — Western Asset High Yield Fund, Class IS Shares | | Consumer Discretionary Industrials Energy Materials Financials |
| | | 4.1 Legg Mason Partners Equity Trust — ClearBridge Small Cap Growth Fund, Class IS Shares | | Information Technology Health Care Consumer Discretionary Industrials Financials |
| | | 4.1 The Royce Fund — Royce Value Fund, Institutional Class Shares | | Consumer Discretionary Information Technology Financials Energy Industrials |
| | | 3.9 Legg Mason Partners Equity Trust — ClearBridge International All Cap Opportunity Fund, Class IS Shares | | Financials Industrials Consumer Discretionary Information Technology Consumer Staples |
| | | 3.9 Legg Mason Global Asset Management Trust — Legg Mason Batterymarch International Equity Trust, Class IS Shares | | Financials Consumer Discretionary Industrials Health Care Consumer Staples |
| | | 3.6 Legg Mason Partners Equity Trust — ClearBridge Mid Cap Core Fund, Class IS Shares | | Financials Consumer Discretionary Information Technology Health Care Industrials |
| | |
| Legg Mason Variable Lifestyle Series 2013 Semi-Annual Report | | 3 |
Portfolios expenses (unaudited)
Example
As a shareholder of the Portfolios, you may incur two types of costs: (1) transaction costs and (2) ongoing costs, including management fees; and other Portfolio expenses. This example is intended to help you understand your ongoing costs (in dollars) of investing in the Portfolios and to compare these costs with the ongoing costs of investing in other mutual funds.
This example is based on an investment of $1,000 invested on January 1, 2013 and held for the six months ended June 30, 2013.
Actual expenses
The table below titled “Based on Actual Total Return” provides information about actual account values and actual expenses. You may use the information provided in this table, together with the amount you invested, to estimate the expenses that you paid over the period. To estimate the expenses you paid on your account, divide your ending account value by $1,000 (for example, an $8,600 ending account value divided by $1,000 = 8.6), then multiply the result by the number under the heading entitled “Expenses Paid During the Period”.
Hypothetical example for comparison purposes
The table below titled “Based on Hypothetical Total Return” provides information about hypothetical account values and hypothetical expenses based on the actual expense ratio and an assumed rate of return of 5.00% per year before expenses, which is not each Portfolio’s actual return. The hypothetical account values and expenses may not be used to estimate the actual ending account balance or expenses you paid for the period. You may use the information provided in this table to compare the ongoing costs of investing in the Portfolios and other portfolios. To do so, compare the 5.00% hypothetical example relating to the Portfolios with the 5.00% hypothetical examples that appear in the shareholder reports of the other funds.
Please note that the expenses shown in the table below are meant to highlight your ongoing costs only and do not reflect any transactional costs. Therefore, the table is useful in comparing ongoing costs only, and will not help you determine the relative total costs of owning different funds. In addition, if these transaction costs were included, your costs would have been higher.
| | | | | | | | | | | | | | | | | | | | | | | | | | | | | | | | | | | | | | | | | | | | |
| Based on actual total return1 | | | | | Based on hypothetical total return1 | |
| | | Actual
Total
Return2 | | | Beginning
Account
Value | | | Ending
Account
Value | | | Annualized
Expense
Ratio3 | | | Expenses
Paid
During
the
Period4 | | | | | | | Hypothetical
Annualized
Total
Return | | | Beginning
Account
Value | | | Ending
Account
Value | | | Annualized
Expense
Ratio3 | | | Expenses
Paid
During
the
Period4 | |
Legg Mason Variable Lifestyle Allocation 85% | | | 9.52 | % | | $ | 1,000.00 | | | $ | 1,095.20 | | | | 0.11 | % | | $ | 0.57 | | | | | Legg Mason Variable Lifestyle Allocation 85% | | | 5.00 | % | | $ | 1,000.00 | | | $ | 1,024.25 | | | | 0.11 | % | | $ | 0.55 | |
Legg Mason Variable Lifestyle Allocation 70% | | | 7.92 | | | | 1,000.00 | | | | 1,079.20 | | | | 0.18 | | | | 0.93 | | | | | Legg Mason Variable Lifestyle Allocation 70% | | | 5.00 | | | | 1,000.00 | | | | 1,023.90 | | | | 0.18 | | | | 0.90 | |
Legg Mason Variable Lifestyle Allocation 50% | | | 5.26 | | | | 1,000.00 | | | | 1,052.60 | | | | 0.10 | | | | 0.51 | | | | | Legg Mason Variable Lifestyle Allocation 50 | | | 5.00 | | | | 1,000.00 | | | | 1,024.30 | | | | 0.10 | | | | 0.50 | |
| 1 | For the six months ended June 30, 2013. |
| 2 | Assumes the reinvestment of all distributions, including returns of capital, if any, at net asset value. Total return is not annualized, as it may not be representative of the total return for the year. Total returns do not reflect expenses associated with separate accounts such as administrative fees, account charges and surrender charges, which, if reflected, would reduce the total returns. Performance figures may reflect compensating balance arrangements, fee waivers and/or expense reimbursements. In the absence of compensating balance arrangements, fee waivers and/or expense reimbursements, the total return would have been lower. Past performance is no guarantee of future results. |
| 3 | The expense ratios do not include expenses of the Underlying Funds in which each Portfolio invests. |
| 4 | Expenses (net of compensating balance arrangements, fee waivers and/or expense reimbursements) are equal to each Portfolio’s respective annualized expense ratio multiplied by the average account value over the period, multiplied by the number of days in the most recent fiscal half-year (181), then divided by 365. |
| | |
| 4 | | Legg Mason Variable Lifestyle Series 2013 Semi-Annual Report |
Schedules of investments (unaudited)
June 30, 2013
Legg Mason Variable Lifestyle Allocation 85%
| | | | | | | | | | | | | | |
| Description | | | | | | | Shares | | | Value | |
| Investments in Underlying Funds(a) — 99.9% | | | | | | | | | | | | | | |
Legg Mason Global Asset Management Trust: | | | | | | | | | | | | | | |
Legg Mason Batterymarch International Equity Trust, Class IS Shares | | | | | | | | | 840,224 | | | $ | 10,838,895 | |
Legg Mason BW Diversified Large Cap Value Fund, Class IS Shares | | | | | | | | | 760,108 | | | | 13,180,269 | |
Legg Mason Strategic Real Return Fund, Class IS Shares | | | | | | | | | 556,530 | | | | 7,579,944 | |
Legg Mason Partners Equity Trust: | | | | | | | | | | | | | | |
ClearBridge Aggressive Growth Fund, Class IS Shares | | | | | | | | | 73,698 | | | | 12,334,836 | * |
ClearBridge Appreciation Fund, Class IS Shares | | | | | | | | | 740,985 | | | | 13,070,979 | |
ClearBridge International All Cap Opportunity Fund, Class IS Shares | | | | | | | | | 1,233,896 | | | | 11,623,302 | |
ClearBridge Mid Cap Core Fund, Class IS Shares | | | | | | | | | 213,265 | | | | 6,088,716 | |
ClearBridge Small Cap Growth Fund, Class IS Shares | | | | | | | | | 344,828 | | | | 8,517,248 | * |
Legg Mason Batterymarch U.S. Large Cap Equity Fund, Class IS Shares | | | | | | | | | 962,973 | | | | 13,125,320 | |
The Royce Fund — Royce Value Fund, Institutional Class Shares | | | | | | | | | 682,267 | | | | 8,439,643 | |
Western Asset Funds, Inc.: | | | | | | | | | | | | | | |
Western Asset Core Plus Bond Fund, Class IS Shares | | | | | | | | | 464,528 | | | | 5,230,581 | |
Western Asset High Yield Fund, Class IS Shares | | | | | | | | | 388,109 | | | | 3,454,169 | |
Western Asset Total Return Unconstrained Fund | | | | | | | | | 446,965 | | | | 4,715,480 | |
Total Investments in Underlying Funds before Short-Term Investments (Cost — $89,102,832) | | | | 118,199,382 | |
| | | | |
| | | Rate | | | Maturity
Date | | Face
Amount | | | | |
| Short-Term Investments — 0.1% | | | | | | | | | | | | | | |
Repurchase Agreements — 0.1% | | | | | | | | | | | | | | |
Interest in $1,050,000,000 joint tri-party repurchase agreement dated 6/28/13 with RBS Securities Inc.; Proceeds at maturity — $66,001; (Fully collateralized by various U.S. government obligations, 0.250% to 2.125% due 11/30/14 to 3/31/18; Market value — $67,320) (Cost — $66,000) | | | 0.100 | % | | 7/1/13 | | $ | 66,000 | | | | 66,000 | |
Total Investments — 100.0% (Cost — $89,168,832#) | | | | | | | | | | | | | 118,265,382 | |
Other Assets in Excess of Liabilities — 0.0% | | | | | | | | | | | | | 3,878 | |
Total Net Assets — 100.0% | | | | | | | | | | | | $ | 118,269,260 | |
| * | Non-income producing security. |
| # | Aggregate cost for federal income tax purposes is substantially the same. |
| (a) | Underlying Funds are affiliated with Legg Mason, Inc. and more information about the Underlying Funds is available at www.leggmason.com/individualinvestors. |
See Notes to Financial Statements.
| | |
| Legg Mason Variable Lifestyle Series 2013 Semi-Annual Report | | 5 |
Schedules of investments (unaudited) (cont’d)
June 30, 2013
Legg Mason Variable Lifestyle Allocation 70%
| | | | | | | | | | | | | | |
| Description | | | | | | | Shares | | | Value | |
| Investments in Underlying Funds(a) — 99.9% | | | | | | | | | | | | | | |
Legg Mason Global Asset Management Trust: | | | | | | | | | | | | | | |
Legg Mason Batterymarch International Equity Trust, Class IS Shares | | | | | | | | | 233,764 | | | $ | 3,015,551 | |
Legg Mason BW Diversified Large Cap Value Fund, Class IS Shares | | | | | | | | | 301,962 | | | | 5,236,015 | |
Legg Mason Strategic Real Return Fund, Class IS Shares | | | | | | | | | 252,345 | | | | 3,436,943 | |
Legg Mason Partners Equity Trust: | | | | | | | | | | | | | | |
ClearBridge Aggressive Growth Fund, Class IS Shares | | | | | | | | | 29,038 | | | | 4,860,106 | * |
ClearBridge Appreciation Fund, Class IS Shares | | | | | | | | | 296,936 | | | | 5,237,945 | |
ClearBridge International All Cap Opportunity Fund, Class IS Shares | | | | | | | | | 378,291 | | | | 3,563,499 | |
ClearBridge Mid Cap Core Fund, Class IS Shares | | | | | | | | | 84,454 | | | | 2,411,150 | |
ClearBridge Small Cap Growth Fund, Class IS Shares | | | | | | | | | 108,224 | | | | 2,673,144 | * |
Legg Mason Batterymarch U.S. Large Cap Equity Fund, Class IS Shares | | | | | | | | | 383,338 | | | | 5,224,891 | |
The Royce Fund — Royce Value Fund, Institutional Class Shares | | | | | | | | | 214,615 | | | | 2,654,783 | |
Western Asset Funds, Inc.: | | | | | | | | | | | | | | |
Western Asset Core Plus Bond Fund, Class IS Shares | | | | | | | | | 558,826 | | | | 6,292,379 | |
Western Asset High Yield Fund, Class IS Shares | | | | | | | | | 228,179 | | | | 2,030,796 | |
Western Asset Total Return Unconstrained Fund, Class IS Shares | | | | | | | | | 490,879 | | | | 5,178,769 | |
Total Investments in Underlying Funds before Short-Term Investments (Cost — $38,546,839) | | | | 51,815,971 | |
| | | | |
| | | Rate | | | Maturity
Date | | Face
Amount | | | | |
| Short-Term Investments — 0.1% | | | | | | | | | | | | | | |
Repurchase Agreements — 0.1% | | | | | | | | | | | | | | |
Interest in $1,050,000,000 joint tri-party repurchase agreement dated 6/28/13 with RBS Securities Inc.; Proceeds at maturity — $47,000; (Fully collateralized by various U.S. government obligations, 0.250% to 2.125% due 11/30/14 to 3/31/18; Market value — $47,940) (Cost — $47,000) | | | 0.100 | % | | 7/1/13 | | | $47,000 | | | | 47,000 | |
Total Investments — 100.0% (Cost — $38,593,839#) | | | | | | | | | | | | | 51,862,971 | |
Liabilities in Excess of Other Assets — (0.0)% | | | | | | | | | | | | | (8,197 | ) |
Total Net Assets — 100.0% | | | | | | | | | | | | $ | 51,854,774 | |
| * | Non-income producing security. |
| # | Aggregate cost for federal income tax purposes is substantially the same. |
| (a) | Underlying Funds are affiliated with Legg Mason, Inc. and more information about the Underlying Funds is available at www.leggmason.com/individualinvestors. |
See Notes to Financial Statements.
| | |
| 6 | | Legg Mason Variable Lifestyle Series 2013 Semi-Annual Report |
Legg Mason Variable Lifestyle Allocation 50%
| | | | | | | | | | | | | | |
| Description | | | | | | | Shares | | | Value | |
| Investments in Underlying Funds(a) — 99.7% | | | | | | | | | | | | | | |
Legg Mason Global Asset Management Trust: | | | | | | | | | | | | | | |
Legg Mason Batterymarch International Equity Trust, Class IS Shares | | | | | | | | | 361,619 | | | $ | 4,664,883 | |
Legg Mason BW Diversified Large Cap Value Fund, Class IS Shares | | | | | | | | | 490,423 | | | | 8,503,940 | |
Legg Mason Strategic Real Return Fund, Class IS Shares | | | | | | | | | 588,201 | | | | 8,011,300 | |
Legg Mason Partners Equity Trust: | | | | | | | | | | | | | | |
ClearBridge Aggressive Growth Fund, Class IS Shares | | | | | | | | | 44,659 | | | | 7,474,537 | * |
ClearBridge Appreciation Fund, Class IS Shares | | | | | | | | | 480,799 | | | | 8,481,299 | |
ClearBridge International All Cap Opportunity Fund, Class IS Shares | | | | | | | | | 500,575 | | | | 4,715,414 | |
ClearBridge Mid Cap Core Fund, Class IS Shares | | | | | | | | | 151,932 | | | | 4,337,659 | |
ClearBridge Small Cap Growth Fund, Class IS Shares | | | | | | | | | 200,508 | | | | 4,952,547 | * |
Legg Mason Batterymarch U.S. Large Cap Equity Fund, Class IS Shares | | | | | | | | | 622,494 | | | | 8,484,588 | |
The Royce Fund — Royce Value Fund, Institutional Class Shares | | | | | | | | | 398,908 | | | | 4,934,486 | |
Western Asset Funds, Inc.: | | | | | | | | | | | | | | |
Western Asset Core Plus Bond Fund, Class IS Shares | | | | | | | | | 2,876,506 | | | | 32,389,454 | |
Western Asset High Yield Fund, Class IS Shares | | | | | | | | | 799,341 | | | | 7,114,135 | |
Western Asset Total Return Unconstrained Fund, Class IS Shares | | | | | | | | | 1,481,058 | | | | 15,625,157 | |
Total Investments in Underlying Funds before Short-Term Investments (Cost — $96,087,691) | | | | | | | 119,689,399 | |
| | | | |
| | | Rate | | | Maturity
Date | | Face
Amount | | | | |
| Short-Term Investments — 0.3% | | | | | | | | | | | | | | |
Repurchase Agreements — 0.3% | | | | | | | | | | | | | | |
Interest in $100,000,000 joint tri-party repurchase agreement dated 6/28/13 with Deutsche Bank Securities Inc.; Proceeds at maturity $318,003; (Fully collateralized by U.S. government obligations, 1.625% due 8/15/22; Market value $324,360) (Cost — $318,000) | | | 0.120 | % | | 7/1/13 | | | $318,000 | | | | 318,000 | |
Total Investments — 100.0% (Cost — $96,405,691#) | | | | | | | | | | | | | 120,007,399 | |
Liabilities in Excess of Other Assets — (0.0)% | | | | | | | | | | | | | (32,673 | ) |
Total Net Assets — 100.0% | | | | | | | | | | | | $ | 119,974,726 | |
| * | Non-income producing security. |
| # | Aggregate cost for federal income tax purposes is substantially the same. |
| (a) | Underlying Funds are affiliated with Legg Mason, Inc. and more information about the Underlying Funds is available at www.leggmason.com/individualinvestors. |
See Notes to Financial Statements.
| | |
| Legg Mason Variable Lifestyle Series 2013 Semi-Annual Report | | 7 |
Statements of assets and liabilities (unaudited)
June 30, 2013
| | | | | | | | | | | | |
| | | Legg Mason
Variable
Lifestyle
Allocation 85% | | | Legg Mason
Variable
Lifestyle
Allocation 70% | | | Legg Mason
Variable
Lifestyle
Allocation 50% | |
| | | |
| Assets: | | | | | | | | | | | | |
Investments, at cost | | $ | 89,168,832 | | | $ | 38,593,839 | | | $ | 96,405,691 | |
Investments, at value | | | 118,265,382 | | | | 51,862,971 | | | | 120,007,399 | |
Cash | | | 897 | | | | 459 | | | | 575 | |
Receivable for Underlying Funds sold | | | 36,483 | | | | 25,568 | | | | 1,258 | |
Receivable for Portfolio shares sold | | | 8,735 | | | | — | | | | 30,229 | |
Receivable from investment manager | | | — | | | | 83 | | | | — | |
Prepaid expenses | | | 570 | | | | 341 | | | | 596 | |
Total Assets | | | 118,312,067 | | | | 51,889,422 | | | | 120,040,057 | |
| | | |
| Liabilities: | | | | | | | | | | | | |
Payable for Underlying Fund purchased | | | — | | | | — | | | | 16,855 | |
Payable for Portfolio shares repurchased | | | 762 | | | | 956 | | | | 6,787 | |
Accrued expenses | | | 42,045 | | | | 33,692 | | | | 41,689 | |
Total Liabilities | | | 42,807 | | | | 34,648 | | | | 65,331 | |
| Total Net Assets | | $ | 118,269,260 | | | $ | 51,854,774 | | | $ | 119,974,726 | |
| | | |
| Net Assets: | | | | | | | | | | | | |
Par value (Note 5) | | $ | 82 | | | $ | 41 | | | $ | 91 | |
Paid-in capital in excess of par value | | | 99,595,456 | | | | 54,813,150 | | | | 123,102,151 | |
Undistributed net investment income | | | 69,201 | | | | 76,068 | | | | 669,949 | |
Accumulated net realized loss on Underlying Funds and capital gain distributions from Underlying Funds | | | (10,492,029) | | | | (16,303,617) | | | | (27,399,173) | |
Net unrealized appreciation on investments | | | 29,096,550 | | | | 13,269,132 | | | | 23,601,708 | |
| Total Net Assets | | $ | 118,269,260 | | | $ | 51,854,774 | | | $ | 119,974,726 | |
| | | |
| Shares Outstanding | | | 8,187,101 | | | | 4,118,663 | | | | 9,076,055 | |
| | | |
| Net Asset Value | | | $14.45 | | | | $12.59 | | | | $13.22 | |
See Notes to Financial Statements.
| | |
| 8 | | Legg Mason Variable Lifestyle Series 2013 Semi-Annual Report |
Statements of operations (unaudited)
For the Six Months Ended June 30, 2013
| | | | | | | | | | | | |
| | | Legg Mason
Variable Lifestyle Allocation 85% | | | Legg Mason
Variable
Lifestyle
Allocation 70% | | | Legg Mason
Variable
Lifestyle
Allocation 50% | |
| | | |
| Investment Income: | | | | | | | | | | | | |
Income distributions from Underlying Funds | | $ | 255,608 | | | $ | 217,660 | | | $ | 866,672 | |
Interest | | | 41 | | | | 26 | | | | 147 | |
Total Investment Income | | | 255,649 | | | | 217,686 | | | | 866,819 | |
| | | |
| Expenses: | | | | | | | | | | | | |
Shareholder reports | | | 19,708 | | | | 10,709 | | | | 17,368 | |
Audit and tax | | | 13,807 | | | | 13,598 | | | | 13,841 | |
Legal fees | | | 13,050 | | | | 12,895 | | | | 13,353 | |
Fund accounting fees | | | 5,555 | | | | 2,655 | | | | 5,865 | |
Trustees’ fees | | | 4,269 | | | | 2,036 | | | | 4,557 | |
Transfer agent fees | | | 3,172 | | | | 3,180 | | | | 3,178 | |
Insurance | | | 1,660 | | | | 999 | | | | 1,739 | |
Custody fees | | | 67 | | | | 25 | | | | 96 | |
Miscellaneous expenses | | | 1,946 | | | | 1,874 | | | | 1,976 | |
Total Expenses | | | 63,234 | | | | 47,971 | | | | 61,973 | |
Less: Fee waivers and/or expense reimbursements | | | — | | | | (83) | | | | — | |
Net Expenses | | | 63,234 | | | | 47,888 | | | | 61,973 | |
| Net Investment Income | | | 192,415 | | | | 169,798 | | | | 804,846 | |
| | | |
| Realized and Unrealized Gain (Loss) on Underlying Funds and Capital Gain Distributions From Underlying Funds (Notes 1 and 3): | | | | | | | | | | | | |
Net Realized Gain From: | | | | | | | | | | | | |
Sale of Underlying Funds | | | 484,615 | | | | 1,095,107 | | | | 1,082,123 | |
Capital gain distributions from Underlying Funds | | | 2,013 | | | | 800 | | | | 1,434 | |
Net Realized Gain | | | 486,628 | | | | 1,095,907 | | | | 1,083,557 | |
Change in Net Unrealized Appreciation (Depreciation) on Underlying Funds | | | 9,882,579 | | | | 2,805,161 | | | | 4,200,766 | |
| Net Gain on Underlying Funds and Capital Gain Distributions from Underlying Funds | | | 10,369,207 | | | | 3,901,068 | | | | 5,284,323 | |
| Increase in Net Assets From Operations | | $ | 10,561,622 | | | $ | 4,070,866 | | | $ | 6,089,169 | |
See Notes to Financial Statements.
| | |
| Legg Mason Variable Lifestyle Series 2013 Semi-Annual Report | | 9 |
Statements of changes in net assets
Legg Mason Variable Lifestyle Allocation 85%
| | | | | | | | |
For the Six Months Ended June 30, 2013 (unaudited)
and the Year Ended December 31, 2012 | | 2013 | | | 2012 | |
| | |
| Operations: | | | | | | | | |
Net investment income | | $ | 192,415 | | | $ | 2,018,691 | |
Net realized gain | | | 486,628 | | | | 101,888 | |
Change in net unrealized appreciation (depreciation) | | | 9,882,579 | | | | 13,746,979 | |
Increase in Net Assets From Operations | | | 10,561,622 | | | | 15,867,558 | |
| | |
| Distributions to Shareholders From (Note 1): | | | | | | | | |
Net investment income | | | (600,004) | | | | (1,968,126) | |
Decrease in Net Assets From Distributions to Shareholders | | | (600,004) | | | | (1,968,126) | |
| | |
| Portfolio Share Transactions (Note 5): | | | | | | | | |
Net proceeds from sale of shares | | | 1,781,456 | | | | 8,229,948 | |
Reinvestment of distributions | | | 600,004 | | | | 1,968,126 | |
Cost of shares repurchased | | | (6,002,463) | | | | (12,205,466) | |
Decrease in Net Assets From Portfolio Share Transactions | | | (3,621,003) | | | | (2,007,392) | |
Increase in Net Assets | | | 6,340,615 | | | | 11,892,040 | |
| | |
| Net Assets: | | | | | | | | |
Beginning of period | | | 111,928,645 | | | | 100,036,605 | |
End of period* | | $ | 118,269,260 | | | $ | 111,928,645 | |
* Includes undistributed net investment income of: | | | $69,201 | | | | $476,790 | |
See Notes to Financial Statements.
| | |
| 10 | | Legg Mason Variable Lifestyle Series 2013 Semi-Annual Report |
Statements of changes in net assets
Legg Mason Variable Lifestyle Allocation 70%
| | | | | | | | |
For the Six Months Ended June 30, 2013 (unaudited)
and the Year Ended December 31, 2012 | | 2013 | | | 2012 | |
| | |
| Operations: | | | | | | | | |
Net investment income | | $ | 169,798 | | | $ | 1,043,446 | |
Net realized gain | | | 1,095,907 | | | | 521,862 | |
Change in net unrealized appreciation (depreciation) | | | 2,805,161 | | | | 5,991,594 | |
Increase in Net Assets From Operations | | | 4,070,866 | | | | 7,556,902 | |
| | |
| Distributions to Shareholders From (Note 1): | | | | | | | | |
Net investment income | | | (200,004) | | | | (1,263,631) | |
Decrease in Net Assets From Distributions to Shareholders | | | (200,004) | | | | (1,263,631) | |
| | |
| Portfolio Share Transactions (Note 5): | | | | | | | | |
Net proceeds from sale of shares | | | 266,001 | | | | 401,500 | |
Reinvestment of distributions | | | 200,004 | | | | 1,263,631 | |
Cost of shares repurchased | | | (4,595,332) | | | | (12,145,672) | |
Decrease in Net Assets From Portfolio Share Transactions | | | (4,129,327) | | | | (10,480,541) | |
Decrease in Net Assets | | | (258,465) | | | | (4,187,270) | |
| | |
| Net Assets: | | | | | | | | |
Beginning of period | | | 52,113,239 | | | | 56,300,509 | |
End of period* | | $ | 51,854,774 | | | $ | 52,113,239 | |
* Includes undistributed net investment income of: | | | $76,068 | | | | $106,274 | |
See Notes to Financial Statements.
| | |
| Legg Mason Variable Lifestyle Series 2013 Semi-Annual Report | | 11 |
Statements of changes in net assets
Legg Mason Variable Lifestyle Allocation 50%
| | | | | | | | |
For the Six Months Ended June 30, 2013 (unaudited)
and the Year Ended December 31, 2012 | | 2013 | | | 2012 | |
| | |
| Operations: | | | | | | | | |
Net investment income | | $ | 804,846 | | | $ | 2,807,867 | |
Net realized gain | | | 1,083,557 | | | | 1,723,308 | |
Change in net unrealized appreciation (depreciation) | | | 4,200,766 | | | | 9,886,036 | |
Increase in Net Assets From Operations | | | 6,089,169 | | | | 14,417,211 | |
| | |
| Distributions to Shareholders From (Note 1): | | | | | | | | |
Net investment income | | | (200,009) | | | | (3,118,397) | |
Decrease in Net Assets From Distributions to Shareholders | | | (200,009) | | | | (3,118,397) | |
| | |
| Portfolio Share Transactions (Note 5): | | | | | | | | |
Net proceeds from sale of shares | | | 6,831,859 | | | | 8,552,039 | |
Reinvestment of distributions | | | 200,009 | | | | 3,118,397 | |
Cost of shares repurchased | | | (9,506,771) | | | | (21,383,729) | |
Decrease in Net Assets From Portfolio Share Transactions | | | (2,474,903) | | | | (9,713,293) | |
Increase in Net Assets | | | 3,414,257 | | | | 1,585,521 | |
| | |
| Net Assets: | | | | | | | | |
Beginning of period | | | 116,560,469 | | | | 114,974,948 | |
End of period* | | $ | 119,974,726 | | | $ | 116,560,469 | |
* Includes undistributed net investment income of: | | | $669,949 | | | | $65,112 | |
See Notes to Financial Statements.
| | |
| 12 | | Legg Mason Variable Lifestyle Series 2013 Semi-Annual Report |
Financial highlights
Legg Mason Variable Lifestyle Allocation 85%
| | | | | | | | | | | | | | | | | | | | | | | | | | | | |
| For a share of beneficial interest outstanding throughout each year ended December 31, unless otherwise noted: | |
| | | 20131,2 | | | 20121 | | | 2011 | | | 2010 | | | 20093 | | | 20094 | | | 20084 | |
| | | | | | | |
| Net asset value, beginning of period | | | $13.26 | | | | $11.65 | | | | $12.11 | | | | $10.63 | | | | $7.73 | | | | $12.75 | | | | $14.39 | |
| | | | | | | |
| Income (loss) from operations: | | | | | | | | | | | | | | | | | | | | | | | | | | | | |
Net investment income | | | 0.02 | | | | 0.23 | 5 | | | 0.20 | 5 | | | 0.18 | | | | 0.20 | 5 | | | 0.23 | 5 | | | 0.24 | 5 |
Net realized and unrealized gain (loss) | | | 1.24 | | | | 1.61 | | | | (0.48) | | | | 1.48 | | | | 2.92 | | | | (4.97) | | | | (0.71) | |
Total income (loss) from operations | | | 1.26 | | | | 1.84 | | | | (0.28) | | | | 1.66 | | | | 3.12 | | | | (4.74) | | | | (0.47) | |
| | | | | | | |
| Less distributions from: | | | | | | | | | | | | | | | | | | | | | | | | | | | | |
Net investment income | | | (0.07) | | | | (0.23) | | | | (0.18) | | | | (0.18) | | | | (0.22) | | | | (0.20) | | | | (0.22) | |
Net realized gains | | | — | | | | — | | | | — | | | | — | | | | — | | | | (0.08) | | | | (0.95) | |
Total distributions | | | (0.07) | | | | (0.23) | | | | (0.18) | | | | (0.18) | | | | (0.22) | | | | (0.28) | | | | (1.17) | |
| | | | | | | |
| Net asset value, end of period | | | $14.45 | | | | $13.26 | | | | $11.65 | | | | $12.11 | | | | $10.63 | | | | $7.73 | | | | $12.75 | |
Total return6 | | | 9.52 | % | | | 15.89 | % | | | (2.31) | % | | | 15.70 | %7 | | | 40.53 | %7 | | | (37.53) | % | | | (3.87) | % |
| | | | | | | |
| Net assets, end of period (000s) | | | $118,269 | | | | $111,929 | | | | $100,037 | | | | $103,838 | | | | $89,463 | | | | $59,371 | | | | $83,678 | |
| | | | | | | |
| Ratios to average net assets: | | | | | | | | | | | | | | | | | | | | | | | | | | | | |
Gross expenses8 | | | 0.11 | %9 | | | 0.11 | % | | | 0.11 | % | | | 0.15 | % | | | 0.21 | %9 | | | 0.15 | % | | | 0.32 | %10 |
Net expenses8,11,12 | | | 0.11 | 9 | | | 0.11 | | | | 0.11 | | | | 0.15 | | | | 0.19 | 9,13 | | | 0.12 | 13 | | | 0.32 | 10 |
Net investment income | | | 0.33 | 9 | | | 1.85 | 5 | | | 1.64 | 5 | | | 1.65 | | | | 2.52 | 5,9 | | | 2.30 | 5 | | | 1.87 | 5 |
| | | | | | | |
| Portfolio turnover rate | | | 3 | % | | | 14 | % | | | 40 | % | | | 17 | % | | | 10 | % | | | 34 | % | | | 19 | % |
| 1 | Per share amounts have been calculated using the average shares method. |
| 2 | For the six months ended June 30, 2013 (unaudited). |
| 3 | For the period February 1, 2009 through December 31, 2009. |
| 4 | For the year ended January 31. |
| 5 | Net investment income includes short-term capital gain distributions from Underlying Funds. |
| 6 | Performance figures may reflect compensating balance arrangements, fee waivers and/or expense reimbursements. In the absence of compensating balance arrangements, fee waivers and/or expense reimbursements, the total return would have been lower. Total returns do not reflect expenses associated with separate accounts such as administrative fees, account charges and surrender charges which, if reflected, would reduce the total return for all periods shown. Past performance is no guarantee of future results. Total returns for periods of less than one year are not annualized. |
| 7 | The total return includes gains from settlement of investment litigations. Without these gains, the total return would have been 15.60% and 39.87% for the year ended December 31, 2010 and the period ended December 31, 2009, respectively. |
| 8 | Does not include expenses of the Underlying Funds in which the Portfolio invests. |
| 10 | The gross and net expense ratios include interest expense. Excluding interest expense, the gross and net expense ratios would have been the same. |
| 11 | The impact of compensating balance arrangements, if any, was less than 0.01%. |
| 12 | As a result of an expense limitation arrangement, effective December 1, 2007, the ratio of expenses, other than brokerage, interest, taxes, extraordinary expenses and acquired fund fees and expenses, to average net assets of shares did not exceed 0.20%. This expense limitation arrangement cannot be terminated prior to December 31, 2014 without the Board of Trustees’ consent. |
| 13 | Reflects fee waivers and/or expense reimbursements. |
See Notes to Financial Statements.
| | |
| Legg Mason Variable Lifestyle Series 2013 Semi-Annual Report | | 13 |
Financial highlights (cont’d)
Legg Mason Variable Lifestyle Allocation 70%
| | | | | | | | | | | | | | | | | | | | | | | | | | | | |
| For a share of beneficial interest outstanding throughout each year ended December 31, unless otherwise noted: | |
| | | 20131,2 | | | 20121 | | | 2011 | | | 2010 | | | 20093 | | | 20094 | | | 20084 | |
| | | | | | | |
| Net asset value, beginning of year | | | $11.71 | | | | $10.47 | | | | $10.74 | | | | $9.53 | | | | $7.09 | | | | $10.94 | | | | $11.62 | |
| | | | | | | |
| Income (loss) from operations: | | | | | | | | | | | | | | | | | | | | | | | | | | | | |
Net investment income | | | 0.04 | | | | 0.21 | 5 | | | 0.22 | 5 | | | 0.22 | | | | 0.27 | 5 | | | 0.30 | 5 | | | 0.33 | 5 |
Net realized and unrealized gain (loss) | | | 0.89 | | | | 1.31 | | | | (0.28) | | | | 1.20 | | | | 2.47 | | | | (3.89) | | | | (0.50) | |
Total income (loss) from operations | | | 0.93 | | | | 1.52 | | | | (0.06) | | | | 1.42 | | | | 2.74 | | | | (3.59) | | | | (0.17) | |
| | | | | | | |
| Less distributions from: | | | | | | | | | | | | | | | | | | | | | | | | | | | | |
Net investment income | | | (0.05) | | | | (0.28) | | | | (0.21) | | | | (0.21) | | | | (0.30) | | | | (0.25) | | | | (0.32) | |
Net realized gains | | | — | | | | — | | | | — | | | | — | | | | — | | | | (0.01) | | | | (0.19) | |
Total distributions | | | (0.05) | | | | (0.28) | | | | (0.21) | | | | (0.21) | | | | (0.30) | | | | (0.26) | | | | (0.51) | |
| | | | | | | |
| Net asset value, end of year | | | $12.59 | | | | $11.71 | | | | $10.47 | | | | $10.74 | | | | $9.53 | | | | $7.09 | | | | $10.94 | |
Total return6 | | | 7.92 | % | | | 14.60 | % | | | (0.58) | % | | | 15.01 | %7 | | | 38.90 | %7 | | | (33.03) | % | | | (1.64) | % |
| | | | | | | |
| Net assets, end of year (000s) | | | $51,855 | | | | $52,113 | | | | $56,301 | | | | $69,946 | | | | $71,982 | | | | $59,526 | | | | $108,500 | |
| | | | | | | |
| Ratios to average net assets: | | | | | | | | | | | | | | | | | | | | | | | | | | | | |
Gross expenses8 | | | 0.18 | %9 | | | 0.17 | % | | | 0.14 | % | | | 0.20 | % | | | 0.23 | %9 | | | 0.14 | % | | | 0.32 | % |
Net expenses8,10,11 | | | 0.18 | 9,12 | | | 0.17 | 12 | | | 0.14 | | | | 0.18 | 12 | | | 0.20 | 9,12 | | | 0.10 | 12 | | | 0.32 | |
Net investment income | | | 0.64 | 9 | | | 1.90 | 5 | | | 1.83 | 5 | | | 2.02 | | | | 3.32 | 5,9 | | | 2.89 | 5 | | | 2.67 | 5 |
| | | | | | | |
| Portfolio turnover rate | | | 3 | % | | | 11 | % | | | 30 | % | | | 14 | % | | | 11 | % | | | 26 | % | | | 15 | % |
| 1 | Per share amounts have been calculated using the average shares method. |
| 2 | For the six months ended June 30, 2013 (unaudited). |
| 3 | For the period February 1, 2009 through December 31, 2009. |
| 4 | For the year ended January 31. |
| 5 | Net investment income includes short-term capital gain distributions from Underlying Funds. |
| 6 | Performance figures may reflect compensating balance arrangements, fee waivers and/or expense reimbursements. In the absence of compensating balance arrangements, fee waivers and/or expense reimbursements, the total return would have been lower. Total returns do not reflect expenses associated with separate accounts such as administrative fees, account charges and surrender charges which, if reflected, would reduce the total return for all periods shown. Past performance is no guarantee of future results. Total returns for periods of less than one year are not annualized. |
| 7 | The total return includes gains from settlement of investment litigations. Without these gains, the total return would have been 14.79% and 37.59% for the year ended December 31, 2010 and the period ended December 31, 2009, respectively. |
| 8 | Does not include expenses of the Underlying Funds in which the Portfolio invests. |
| 10 | The impact of compensating balance arrangements, if any, was less than 0.01%. |
| 11 | As a result of an expense limitation arrangement, effective December 1, 2007, the ratio of expenses, other than brokerage, interest, taxes, extraordinary expenses and acquired fund fees and expenses, to average net assets of shares did not exceed 0.20%. This expense limitation arrangement cannot be terminated prior to December 31, 2014 without the Board of Trustees’ consent. |
| 12 | Reflects fee waivers and/or expense reimbursements. |
See Notes to Financial Statements.
| | |
| 14 | | Legg Mason Variable Lifestyle Series 2013 Semi-Annual Report |
Legg Mason Variable Lifestyle Allocation 50%
| | | | | | | | | | | | | | | | | | | | | | | | | | | | |
| For a share of beneficial interest outstanding throughout each year ended December 31, unless otherwise noted: | |
| | | 20131,2 | | | 20121 | | | 2011 | | | 2010 | | | 20093 | | | 20094 | | | 20084 | |
| | | | | | | |
| Net asset value, beginning of year | | | $12.58 | | | | $11.43 | | | | $11.60 | | | | $10.45 | | | | $8.06 | | | | $12.04 | | | | $12.61 | |
| | | | | | | |
| Income (loss) from operations: | | | | | | | | | | | | | | | | | | | | | | | | | | | | |
Net investment income | | | 0.09 | | | | 0.29 | 5 | | | 0.30 | 5 | | | 0.34 | | | | 0.43 | 5 | | | 0.46 | 5 | | | 0.47 | 5 |
Net realized and unrealized gain (loss) | | | 0.57 | | | | 1.20 | | | | (0.16) | | | | 1.15 | | | | 2.44 | | | | (3.65) | | | | (0.45) | |
Total income (loss) from operations | | | 0.66 | | | | 1.49 | | | | 0.14 | | | | 1.49 | | | | 2.87 | | | | (3.19) | | | | 0.02 | |
| | | | | | | |
| Less distributions from: | | | | | | | | | | | | | | | | | | | | | | | | | | | | |
Net investment income | | | (0.02) | | | | (0.34) | | | | (0.31) | | | | (0.34) | | | | (0.48) | | | | (0.40) | | | | (0.47) | |
Net realized gains | | | — | | | | — | | | | — | | | | — | | | | — | | | | (0.39) | | | | (0.12) | |
Total distributions | | | (0.02) | | | | (0.34) | | | | (0.31) | | | | (0.34) | | | | (0.48) | | | | (0.79) | | | | (0.59) | |
| | | | | | | |
| Net asset value, end of year | | | $13.22 | | | | $12.58 | | | | $11.43 | | | | $11.60 | | | | $10.45 | | | | $8.06 | | | | $12.04 | |
Total return6 | | | 5.26 | % | | | 13.10 | % | | | 1.17 | % | | | 14.35 | %7 | | | 35.93 | %7 | | | (27.51) | % | | | (0.01) | % |
| | | | | | | |
| Net assets, end of period (000s) | | | $119,975 | | | | $116,560 | | | | $114,975 | | | | $125,315 | | | | $126,294 | | | | $112,415 | | | | $198,862 | |
| | | | | | | |
| Ratios to average net assets: | | | | | | | | | | | | | | | | | | | | | | | | | | | | |
Gross expenses8 | | | 0.10 | %9 | | | 0.10 | % | | | 0.09 | % | | | 0.13 | % | | | 0.14 | %9 | | | 0.09 | % | | | 0.31 | % |
Net expenses8,10,11 | | | 0.10 | 9 | | | 0.10 | | | | 0.09 | | | | 0.13 | | | | 0.14 | 9 | | | 0.07 | 12 | | | 0.31 | |
Net investment income | | | 1.34 | 9 | | | 2.39 | 5 | | | 2.44 | 5 | | | 2.89 | | | | 4.66 | 5,9 | | | 3.96 | 5 | | | 3.53 | 5 |
| | | | | | | |
| Portfolio turnover rate | | | 7 | % | | | 14 | % | | | 37 | % | | | 20 | % | | | 11 | % | | | 24 | % | | | 15 | % |
| 1 | Per share amounts have been calculated using the average shares method. |
| 2 | For the six months ended June 30, 2013 (unaudited). |
| 3 | For the period February 1, 2009 through December 31, 2009. |
| 4 | For the year ended January 31. |
| 5 | Net investment income includes short-term capital gain distributions from Underlying Funds. |
| 6 | Performance figures may reflect compensating balance arrangements, fee waivers and/or expense reimbursements. In the absence of compensating balance arrangements, fee waivers and/or expense reimbursements, the total return would have been lower. Total returns do not reflect expenses associated with separate accounts such as administrative fees, account charges and surrender charges which, if reflected, would reduce the total return for all periods shown. Past performance is no guarantee of future results. Total returns for periods of less than one year are not annualized. |
| 7 | The total return includes gains from settlement of investment litigations. Without these gains, the total return would have been 14.25% and 35.54% for the year ended December 31, 2010 and the period ended December 31, 2009, respectively. |
| 8 | Does not include expenses of the Underlying Funds in which the Portfolio invests. |
| 10 | The impact of compensating balance arrangements, if any, was less than 0.01%. |
| 11 | As a result of an expense limitation arrangement, effective December 1, 2007, the ratio of expenses, other than brokerage, interest, taxes, extraordinary expenses and acquired fund fees and expenses, to average net assets of shares did not exceed 0.20%. This expense limitation arrangement cannot be terminated prior to December 31, 2014 without the Board of Trustees’ consent. |
| 12 | Reflects fee waivers and/or expense reimbursements. |
See Notes to Financial Statements.
| | |
| Legg Mason Variable Lifestyle Series 2013 Semi-Annual Report | | 15 |
Notes to financial statements (unaudited)
1. Organization and significant accounting policies
Legg Mason Variable Lifestyle Allocation 85% (“Lifestyle Allocation 85%”), Legg Mason Variable Lifestyle Allocation 70% (“Lifestyle Allocation 70%”) and Legg Mason Variable Lifestyle Allocation 50% (“Lifestyle Allocation 50%”) (the “Portfolios”) are separate non-diversified investment series of Legg Mason Partners Variable Equity Trust (the “Trust”). The Trust, a Maryland statutory trust, is registered under the Investment Company Act of 1940, as amended (the “1940 Act”), as an open-end management investment company. The Portfolios invest in other mutual funds (“Underlying Funds”) which are affiliated with Legg Mason, Inc. (“Legg Mason”). Shares of the Portfolios are offered to separate accounts sponsored by certain life insurance companies and qualified pension and retirement plans, including affiliates of the investment manager.
The following are significant accounting policies consistently followed by the Portfolios and are in conformity with U.S. generally accepted accounting principles (“GAAP”). Estimates and assumptions are required to be made regarding assets, liabilities and changes in net assets resulting from operations when financial statements are prepared. Changes in the economic environment, financial markets and any other parameters used in determining these estimates could cause actual results to differ. Subsequent events have been evaluated through the date the financial statements were issued.
(a) Investment valuation. Investments in the Underlying Funds, excluding ETF’s, are valued at the closing net asset value per share of each Underlying Fund on the day of valuation. Equity securities for which market quotations are available are valued at the last reported sales price or official closing price on the primary market or exchange on which they trade. The valuations for fixed income securities (which may include, but are not limited to, corporate, government, municipal, mortgage-backed, collateralized mortgage obligations and asset-backed securities) and certain derivative instruments are typically the prices supplied by independent third party pricing services, which may use market prices or broker/dealer quotations or a variety of fair valuation techniques and methodologies. The independent third party pricing services use inputs that are observable such as issuer details, interest rates, yield curves, prepayment speeds, credit risks/spreads, default rates and quoted prices for similar securities. Short-term fixed income securities that will mature in 60 days or less are valued at amortized cost, unless it is determined that using this method would not reflect an investment’s fair value. When the Portfolios hold securities or other assets that are denominated in a foreign currency, the Portfolios will normally use the currency exchange rates as of 4:00 p.m. (Eastern Time). If independent third party pricing services are unable to supply prices for a portfolio investment, or if the prices supplied are deemed by the manager to be unreliable, the market price may be determined by the manager using quotations from one or more broker/dealers or at the transaction price if the security has recently been purchased and no value has yet been obtained from a pricing service or pricing broker. When reliable prices are not readily available, such as when the value of a security has been significantly affected by events after the close of the exchange or market on which the security is principally traded, but before the Portfolios calculate their net asset value, the Portfolios value these securities as determined in accordance with procedures approved by the Portfolios’ Board of Trustees.
The Board of Trustees is responsible for the valuation process and has delegated the supervision of the daily valuation process to the Legg Mason North American Fund Valuation Committee (the “Valuation Committee”). The Valuation Committee, pursuant to the policies adopted by the Board of Trustees, is responsible for making fair value determinations, evaluating the effectiveness of the Portfolios’ pricing policies, and reporting to the Board of Trustees. When determining the reliability of third party pricing information for investments owned by the Portfolios, the Valuation Committee, among other things, conducts due diligence reviews of pricing vendors, monitors the daily change in prices and reviews transactions among market participants.
The Valuation Committee will consider pricing methodologies it deems relevant and appropriate when making fair value determinations. Examples of possible methodologies include, but are not limited to, multiple of earnings; discount from market of a similar freely traded security; discounted cash-flow analysis; book value or a multiple thereof; risk premium/yield analysis; yield to maturity; and/or fundamental investment analysis. The Valuation Committee will also consider factors it deems relevant and appropriate in light of the facts and circumstances. Examples of possible factors include, but are not limited to, the type of security; the issuer’s financial statements; the purchase price of the security; the discount from market value of unrestricted securities of the same class at the time of purchase; analysts’ research and observations from financial institutions; information regarding any transactions or offers with respect to the security; the existence of merger proposals or tender offers affecting the security; the price and extent of public trading in similar securities of the issuer or comparable companies; and the existence of a shelf registration for restricted securities. Additionally, if the closing net asset value per share for an Underlying Fund is not available on the day of valuation, the Valuation Committee may adjust the Underlying Fund’s last available net asset value per share to account for significant events that have occurred subsequent to the Underlying Fund’s last net asset value per share calculation but prior to the day of valuation.
For each portfolio security that has been fair valued pursuant to the policies adopted by the Board of Trustees, the fair value price is compared against the last available and next available market quotations. The Valuation Committee reviews the results of such back testing monthly and fair valuation occurrences are reported to the Board of Trustees quarterly.
| | |
| 16 | | Legg Mason Variable Lifestyle Series 2013 Semi-Annual Report |
The Portfolios use valuation techniques to measure fair value that are consistent with the market approach and/or income approach, depending on the type of security and the particular circumstance. The market approach uses prices and other relevant information generated by market transactions involving identical or comparable securities. The income approach uses valuation techniques to discount estimated future cash flows to present value.
GAAP establishes a disclosure hierarchy that categorizes the inputs to valuation techniques used to value assets and liabilities at measurement date. These inputs are summarized in the three broad levels listed below:
| Ÿ | | Level 1 — quoted prices in active markets for identical investments |
| Ÿ | | Level 2 — other significant observable inputs (including quoted prices for similar investments, interest rates, prepayment speeds, credit risk, etc.) |
| Ÿ | | Level 3 — significant unobservable inputs (including the Portfolios’ own assumptions in determining the fair value of investments) |
The inputs or methodologies used to value securities are not necessarily an indication of the risk associated with investing in those securities.
The following is a summary of the inputs used in valuing the Portfolios’ assets carried at fair value:
Lifestyle Allocation 85%
| | | | | | | | | | | | | | | | |
| ASSETS | |
| Description | | Quoted Prices
(Level 1) | | | Other Significant
Observable Inputs
(Level 2) | | | Significant
Unobservable
Inputs (Level 3) | | | Total | |
| Investments in underlying funds† | | $ | 118,199,382 | | | | — | | | | — | | | $ | 118,199,382 | |
| Short-term investments† | | | — | | | $ | 66,000 | | | | — | | | | 66,000 | |
| Total investments | | $ | 118,199,382 | | | $ | 66,000 | | | | — | | | $ | 118,265,382 | |
| † | See Schedules of Investments for additional detailed categorizations. |
Lifestyle Allocation 70%
| | | | | | | | | | | | | | | | |
| ASSETS | |
| Description | | Quoted Prices
(Level 1) | | | Other Significant
Observable Inputs
(Level 2) | | | Significant
Unobservable
Inputs (Level 3) | | | Total | |
| Investments in underlying funds† | | $ | 51,815,971 | | | | — | | | | — | | | $ | 51,815,971 | |
| Short-term investments† | | | — | | | $ | 47,000 | | | | — | | | | 47,000 | |
| Total investments | | $ | 51,815,971 | | | $ | 47,000 | | | | — | | | $ | 51,862,971 | |
| † | See Schedules of Investments for additional detailed categorizations. |
Lifestyle Allocation 50%
| | | | | | | | | | | | | | | | |
| ASSETS | |
| Description | | Quoted Prices
(Level 1) | | | Other Significant
Observable Inputs
(Level 2) | | | Significant
Unobservable
Inputs (level 3) | | | Total | |
| Investments in underlying funds† | | $ | 119,689,399 | | | | — | | | | — | | | $ | 119,689,399 | |
| Short-term investments† | | | — | | | $ | 318,000 | | | | — | | | | 318,000 | |
| Total investments | | $ | 119,689,399 | | | $ | 318,000 | | | | — | | | $ | 120,007,399 | |
| † | See Schedules of Investments for additional detailed categorizations. |
(b) Repurchase agreements. The Portfolios may enter into repurchase agreements with institutions that their investment adviser has determined are creditworthy. Each repurchase agreement is recorded at cost. Under the terms of a typical repurchase agreement, the Portfolios acquire a debt security subject to an obligation of the seller to repurchase, and of the Portfolios to resell, the security at an agreed-upon price and time, thereby determining the yield during the Portfolios’ holding period. When entering into repurchase agreements, it is the Portfolios’ policy that their custodian or a third party custodian, acting on the Portfolios’ behalf, take possession of the underlying collateral securities, the market value of which, at all times, at least equals the principal amount of the repurchase transaction, including accrued interest. To the extent that any repurchase transaction maturity exceeds one business day, the value of the collateral is marked-to-market and measured against the value of the agreement in an effort to ensure the adequacy of the collateral. If the
| | |
| Legg Mason Variable Lifestyle Series 2013 Semi-Annual Report | | 17 |
Notes to financial statements (unaudited) (cont’d)
counterparty defaults, the Portfolios generally have the right to use the collateral to satisfy the terms of the repurchase transaction. However, if the market value of the collateral declines during the period in which the Portfolios seek to assert their rights or if bankruptcy proceedings are commenced with respect to the seller of the security, realization of the collateral by the Portfolios may be delayed or limited.
(c) Fund of funds risk. Your cost of investing in the Portfolios, as funds of funds, may be higher than the cost of investing in a mutual fund that only invests directly in individual securities. An underlying fund may change its investment objective or policies without the Portfolios’ approval, which could force the Portfolios to withdraw their investments from such underlying fund at a time that is unfavorable to the Portfolios. In addition, one underlying fund may buy the same securities that another underlying fund sells. Therefore, the Portfolios would indirectly bear the costs of these trades without accomplishing any investment purpose.
(d) Security transactions and investment income. Security transactions are accounted for on a trade date basis. Net investment income distributions, if any, from the Underlying Funds are recorded on the ex-dividend date as investment income. Interest income is recorded on an accrual basis. Short-term and long-term capital gain distributions, if any, from the Underlying Funds are recorded on the ex-dividend date as realized gains. The cost of investments sold is determined by use of the specific identification method.
(e) Distributions to shareholders. Distributions from net investment income and distributions of net realized gains, if any, are declared at least annually. Distributions to shareholders of the Portfolios are recorded on the ex-dividend date and are determined in accordance with income tax regulations, which may differ from GAAP.
(f) Compensating balance arrangements. The Portfolios have an arrangement with their custodian bank whereby a portion of the custodian’s fees is paid indirectly by credits earned on the Portfolios’ cash on deposit with the bank.
(g) Federal and other taxes. It is the Portfolios’ policy to comply with the federal income and excise tax requirements of the Internal Revenue Code of 1986 (the “Code”), as amended, applicable to regulated investment companies. Accordingly, the Portfolios intend to distribute their taxable income and net realized gains, if any, to shareholders in accordance with timing requirements imposed by the Code. Therefore, no federal or state income tax provision is required in the Portfolios’ financial statements.
Management has analyzed the Portfolios’ tax positions taken on income tax returns for all open tax years and has concluded that as of June 30, 2013, no provision for income tax would be required in the Portfolios’ financial statements. The Portfolios’ federal and state income and federal excise tax returns for tax years for which the applicable statutes of limitations have not expired are subject to examination by the Internal Revenue Service and state departments of revenue.
(h) Reclassification. GAAP requires that certain components of net assets be reclassified to reflect permanent differences between financial and tax reporting. These reclassifications have no effect on net assets or net asset value per share.
2. Investment management agreement and other transactions with affiliates
Legg Mason Partners Fund Advisor, LLC (“LMPFA”) is each Portfolio’s investment manager and Legg Mason Global Asset Allocation, LLC (“LMGAA”) is each Portfolio’s subadviser. Western Asset Management Company (“Western Asset”) manages each Portfolio’s cash and short-term instruments. LMPFA, LMGAA and Western Asset are wholly-owned subsidiaries of Legg Mason. The Portfolios do not pay a management fee or subadviser fee.
LMPFA provides administrative and certain oversight services to the Portfolios. LMPFA delegates to the subadviser the day-to-day portfolio management of the Portfolios, except, for the management of cash and short-term instruments, which is provided by Western Asset.
The Portfolios bear all expenses incurred in their operations, subject to LMPFA’s agreement to waive fees and/or reimburse expenses incurred directly by the Portfolios, such that each Portfolio’s total annual operating expenses (other than brokerage, interest, taxes, extraordinary expenses and Underlying Funds’ fees and expenses), are not expected to exceed 0.20% of each Portfolios’ average daily net assets. The investment manager is also permitted to recapture amounts waived and/or reimbursed to the Portfolios during the same fiscal year if the Portfolios’ total annual operating expenses have fallen to a level below the limit described above. In no case will the investment manager recapture any amount that would result, on any particular business day of the Portfolios, in the Portfolios’ total annual operating expenses exceeding this limit or any other lower limit then in effect. These expense limitation agreements cannot be terminated prior to December 31, 2014 without the Board of Trustees’ consent.
In addition, the Portfolios indirectly pay management and/or administration fees to LMPFA and other wholly-owned subsidiaries of Legg Mason as a shareholder in the Underlying Funds. These management and administration fees ranged from 0.20% to 1.00% of the average daily net assets of the Underlying Funds.
For the six months ended June 30, 2013, fees waived and/or expenses reimbursed amounted to $83 for Lifestyle Allocation 70%.
| | |
| 18 | | Legg Mason Variable Lifestyle Series 2013 Semi-Annual Report |
Legg Mason Investor Services, LLC, a wholly-owned broker-dealer subsidiary of Legg Mason, serves as the Portfolios’ sole and exclusive distributor.
All officers and one Trustee of the Trust are employees of Legg Mason or its affiliates and do not receive compensation from the Trust.
3. Investments
During the six months ended June 30, 2013, the aggregate cost of purchases and proceeds from sales of investments (excluding short-term investments) were as follows:
| | | | | | | | |
| | | Purchases | | | Sales | |
| Lifestyle Allocation 85% | | $ | 3,657,463 | | | $ | 7,776,945 | |
| Lifestyle Allocation 70% | | | 1,811,344 | | | | 6,017,376 | |
| Lifestyle Allocation 50% | | | 8,807,876 | | | | 10,764,928 | |
At June 30, 2013, the aggregate gross unrealized appreciation and depreciation of investments for federal income tax purposes were substantially as follows:
| | | | | | | | | | | | |
| | | Gross unrealized
appreciation | | | Gross unrealized
depreciation | | | Net unrealized
appreciation | |
| Lifestyle Allocation 85% | | $ | 29,096,550 | | | | — | | | $ | 29,096,550 | |
| Lifestyle Allocation 70% | | | 13,269,132 | | | | — | | | | 13,269,132 | |
| Lifestyle Allocation 50% | | | 23,601,707 | | | | — | | | | 23,601,707 | |
4. Derivative instruments and hedging activities
GAAP requires enhanced disclosure about an entity’s derivative and hedging activities.
During the six months ended June 30, 2013, the Portfolios did not invest in any derivative instruments.
5. Shares of beneficial interest
At June 30, 2013, the Trust had an unlimited number of shares of beneficial interest authorized with a par value of $0.00001 per share.
Transactions in shares of the Fund were as follows:
| | | | | | | | |
| | | Six Months Ended
June 30, 2013 | | | Year Ended
December 31, 2012 | |
| | |
| Lifestyle Allocation 85% | | | | | | | | |
| Shares sold | | $ | 125,019 | | | $ | 658,044 | |
| Shares issued on reinvestment | | | 40,514 | | | | 152,558 | |
| Shares repurchased | | | (421,388) | | | | (956,215) | |
| Net decrease | | $ | (255,855) | | | $ | (145,613) | |
| | |
| Lifestyle Allocation 70% | | | | | | | | |
| Shares sold | | $ | 21,433 | | | $ | 34,301 | |
| Shares issued on reinvestment | | | 15,540 | | | | 110,591 | |
| Shares repurchased | | | (367,369) | | | | (1,072,359) | |
| Net decrease | | $ | (330,396) | | | $ | (927,467) | |
| | |
| Lifestyle Allocation 50% | | | | | | | | |
| Shares sold | | $ | 516,742 | | | $ | 693,104 | |
| Shares issued on reinvestment | | | 14,848 | | | | 250,894 | |
| Shares repurchased | | | (718,034) | | | | (1,737,615) | |
| Net decrease | | $ | (186,444) | | | $ | (793,617) | |
| | |
| Legg Mason Variable Lifestyle Series 2013 Semi-Annual Report | | 19 |
Notes to financial statements (unaudited) (cont’d)
6. Capital loss carryforward
As of December 31, 2012, the Portfolios had the following net capital loss carryforward remaining:
| | | | | | | | | | | | |
| Year of Expiration | | Lifestyle
Allocation 85% | | | Lifestyle
Allocation 70% | | | Lifestyle
Allocation 50% | |
| No Expiration | | $ | (251,419) | * | | $ | (1,772,155) | * | | | — | |
| 12/31/2013 | | | (1,280,698) | | | | (3,049,716) | | | | — | |
| 12/31/2016 | | | — | | | | (1,548,306) | | | $ | (4,538,224) | |
| 12/31/2017 | | | (1,217,675) | | | | (4,794,598) | | | | (12,981,017) | |
| 12/31/2018 | | | (378,901) | | | | (2,103,896) | | | | (2,322,572) | |
| | | $ | (3,128,693) | | | $ | (13,268,671) | | | $ | (19,841,813) | |
These amounts will be available to offset any future taxable capital gains.
| * | Under the Regulated Investment Company Modernization Act of 2010, the Portfolios are permitted to carry forward these capital losses for an unlimited period. However, these losses will be required to be utilized prior to the Portfolios’ other capital losses with the expiration dates listed above. Additionally, these capital losses retain their character as either short-term or long-term capital losses rather than being considered all short-term as under previous law. |
7. Recent accounting pronouncement
The Portfolios have adopted the disclosure provisions of Financial Accounting Standards Board (“FASB”) Accounting Standards Update 2011-11 (“ASU 2011-11”), Balance Sheet (Topic 210) – Disclosures about Offsetting Assets and Liabilities along with the related scope clarification provisions of FASB Accounting Standards Update 2013-01 (“ASU 2013-01”) entitled Balance Sheet (Topic 210) – Clarifying the Scope of Disclosures about Offsetting Assets and Liabilities. ASU 2011-11 is intended to enhance disclosures on the offsetting of financial assets and liabilities by requiring entities to disclose both gross and net information about financial instruments and transactions that are either offset in the statement of assets and liabilities or subject to a master netting agreement or similar arrangement. ASU 2013-01 limits the scope of ASU 2011-11’s disclosure requirements on offsetting to financial assets and financial liabilities related to derivatives, repurchase and reverse repurchase agreements, and securities lending and securities borrowing transactions.
| | |
| 20 | | Legg Mason Variable Lifestyle Series 2013 Semi-Annual Report |
Legg Mason
Variable Lifestyle Series
Trustees
Paul R. Ades
Andrew L. Breech
Dwight B. Crane
Kenneth D. Fuller*
President
Frank G. Hubbard
Howard J. Johnson*
Chairman
Jerome H. Miller
Ken Miller
John J. Murphy
Thomas F. Schlafly
Jerry A. Viscione
Investment manager
Legg Mason Partners Fund Advisor, LLC
Subadviser
Legg Mason Global Asset Allocation, LLC
Distributor
Legg Mason Investor Services, LLC
Custodian
State Street Bank and Trust Company
Transfer agent
Boston Financial Data Services, Inc. 2000 Crown Colony Drive
Quincy, MA 02169
Independent registered public accounting firm
KPMG LLP
345 Park Avenue
New York, NY 10154
| * | Effective June 1, 2013, Mr. Johnson became Chairman and Mr. Fuller became a Trustee, President, and Chief Executive Officer. |
Legg Mason Variable Lifestyle Series
Legg Mason Variable Lifestyle Allocation 85%
Legg Mason Variable Lifestyle Allocation 70%
Legg Mason Variable Lifestyle Allocation 50%
The Portfolios are separate investment series of Legg Mason Partners Variable Equity Trust, a Maryland statutory trust.
Legg Mason Variable Lifestyle Series
Legg Mason Funds
620 Eighth Avenue, 49th Floor
New York, NY 10018
The Portfolios file their complete schedule of portfolio holdings with the Securities and Exchange Commission (“SEC”) for the first and third quarters of each fiscal year on Form N-Q. The Portfolios’ Forms N-Q are available on the SEC’s website at www.sec.gov. The Portfolios’ Forms N-Q may be reviewed and copied at the SEC’s Public Reference Room in Washington, D.C., and information on the operation of the Public Reference Room may be obtained by calling
1-800-SEC-0330. To obtain information on Form N-Q, shareholders can call the Portfolios at 1-877-721-1926.
Information on how the Portfolios voted proxies relating to portfolio securities during the prior 12-month period ended June 30th of each year and a description of the policies and procedures that the Portfolios use to determine how to vote proxies relating to portfolio transactions are available (1) without charge, upon request, by calling the Portfolios at 1-877-721-1926, (2) on the Portfolios’ website at www.leggmason.com/individualinvestors and (3) on the SEC’s website at www.sec.gov.
This report is submitted for the general information of the shareholders of Legg Mason Variable Lifestyle Allocation 85%, Legg Mason Variable Lifestyle Allocation 70% and Legg Mason Variable Lifestyle Allocation 50%. This report is not authorized for distribution to prospective investors in the Portfolios unless preceded or accompanied by a current prospectus.
Investors should consider each Portfolio’s investment objectives, risks, charges and expenses carefully before investing. Each prospectus contains this and other important information about the Portfolios. Please read the prospectus carefully before investing.
www.leggmason.com/individualinvestors
©2013 Legg Mason Investor Services, LLC
Member FINRA, SIPC
Legg Mason Funds Privacy and Security Notice
Your Privacy and the Security of Your Personal Information is Very Important to the Legg Mason Funds
This Privacy and Security Notice (the “Privacy Notice”) addresses the Legg Mason Funds’ privacy and data protection practices with respect to nonpublic personal information the Funds receive. The Legg Mason Funds include any funds sold by the Funds’ distributor, Legg Mason Investor Services, LLC, as well as Legg Mason-sponsored closed-end funds and certain closed-end funds managed or sub-advised by Legg Mason or its affiliates. The provisions of this Privacy Notice apply to your information both while you are a shareholder and after you are no longer invested with the Funds.
The Type of Nonpublic Personal Information the Funds Collect About You
The Funds collect and maintain nonpublic personal information about you in connection with your shareholder account. Such information may include, but is not limited to:
| Ÿ | | Personal information included on applications or other forms; |
| Ÿ | | Account balances, transactions, and mutual fund holdings and positions; |
| Ÿ | | Online account access user IDs, passwords, security challenge question responses; and |
| Ÿ | | Information received from consumer reporting agencies regarding credit history and creditworthiness (such as the amount of an individual’s total debt, payment history, etc.). |
How the Funds Use Nonpublic Personal Information About You
The Funds do not sell or share your nonpublic personal information with third parties or with affiliates for their marketing purposes, or with other financial institutions or affiliates for joint marketing purposes, unless you have authorized the Funds to do so. The Funds do not disclose any nonpublic personal information about you except as may be required to perform transactions or services you have authorized or as permitted or required by law. The Funds may disclose information about you to:
| Ÿ | | Employees, agents, and affiliates on a “need to know” basis to enable the Funds to conduct ordinary business or comply with obligations to government regulators; |
| Ÿ | | Service providers, including the Funds’ affiliates, who assist the Funds as part of the ordinary course of business (such as printing, mailing services, or processing or servicing your account with us) or otherwise perform services on the Funds’ behalf, including companies that may perform marketing services solely for the Funds; |
| Ÿ | | The Funds’ representatives such as legal counsel, accountants and auditors; and |
| Ÿ | | Fiduciaries or representatives acting on your behalf, such as an IRA custodian or trustee of a grantor trust. |
Except as otherwise permitted by applicable law, companies acting on the Funds’ behalf are contractually obligated to keep nonpublic personal information the Funds provide to them confidential and to use the information the Funds share only to provide the services the Funds ask them to perform.
The Funds may disclose nonpublic personal information about you when necessary to enforce their rights or protect against fraud, or as permitted or required by applicable law, such as in connection with a law enforcement or regulatory request, subpoena, or similar legal process. In the event of a corporate action or in the event a Fund service provider changes, the Funds may be required to disclose your nonpublic personal information to third parties. While it is the Funds’ practice to obtain protections for disclosed information in these types of transactions, the Funds cannot guarantee their privacy policy will remain unchanged.
|
| NOT PART OF THE SEMI-ANNUAL REPORT |
Legg Mason Funds Privacy and Security Notice (cont’d)
Keeping You Informed of the Funds’ Privacy and Security Practices
The Funds will notify you annually of their privacy policy as required by federal law. While the Funds reserve the right to modify this policy at any time they will notify you promptly if this privacy policy changes.
The Funds’ Security Practices
The Funds maintain appropriate physical, electronic and procedural safeguards designed to guard your nonpublic personal information. The Funds’ internal data security policies restrict access to your nonpublic personal information to authorized employees, who may use your nonpublic personal information for Fund business purposes only.
Although the Funds strive to protect your nonpublic personal information, they cannot ensure or warrant the security of any information you provide or transmit to them, and you do so at your own risk. In the event of a breach of the confidentiality or security of your nonpublic personal information, the Funds will attempt to notify you as necessary so you can take appropriate protective steps. If you have consented to the Funds using electronic communications or electronic delivery of statements, they may notify you under such circumstances using the most current email address you have on record with them.
In order for the Funds to provide effective service to you, keeping your account information accurate is very important. If you believe that your account information is incomplete, not accurate or not current, or if you have questions about the Funds’ privacy practices, write the Funds using the contact information on your account statements, email the Funds by clicking on the Contact Us section of the Funds’ website at www.leggmason.com, or contact the Fund at 1-877-721-1926.
Revised April 2011
|
| NOT PART OF THE SEMI-ANNUAL REPORT |
www.leggmason.com/individualinvestors
©2013 Legg Mason Investor Services, LLC Member FINRA, SIPC
FD01325 8/13 SR13-1980
| | |
| ITEM 2. | | CODE OF ETHICS. |
| |
| | Not applicable. |
| |
| ITEM 3. | | AUDIT COMMITTEE FINANCIAL EXPERT. |
| |
| | Not applicable. |
| |
| ITEM 4. | | PRINCIPAL ACCOUNTANT FEES AND SERVICES. |
| |
| | Not applicable. |
| |
| ITEM 5. | | AUDIT COMMITTEE OF LISTED REGISTRANTS. |
| |
| | Not applicable. |
| |
| ITEM 6. | | SCHEDULE OF INVESTMENTS. |
| |
| | Included herein under Item 1. |
| |
| ITEM 7. | | DISCLOSURE OF PROXY VOTING POLICIES AND PROCEDURES FOR CLOSED-END MANAGEMENT INVESTMENT COMPANIES. |
| |
| | Not applicable. |
| |
| ITEM 8. | | PORTFOLIO MANAGERS OF CLOSED-END MANAGEMENT INVESTMENT COMPANIES. |
| |
| | Not applicable. |
| |
| ITEM 9. | | PURCHASES OF EQUITY SECURITIES BY CLOSED-END MANAGEMENT INVESTMENT COMPANY AND AFFILIATED PURCHASERS. |
| |
| | Not applicable. |
| |
| ITEM 10. | | SUBMISSION OF MATTERS TO A VOTE OF SECURITY HOLDERS. |
| |
| | Not applicable. |
| |
| ITEM 11. | | CONTROLS AND PROCEDURES. |
| |
| | (a) The registrant’s principal executive officer and principal financial officer have concluded that the registrant’s disclosure controls and procedures (as defined in Rule 30a- 3(c) under the Investment Company Act of 1940, as amended (the “1940 Act”)) are effective as of a date within 90 days of the filing date of this report that includes the disclosure required by this paragraph, based on their evaluation of the disclosure controls and procedures required by Rule 30a-3(b) under the 1940 Act and 15d-15(b) under the Securities Exchange Act of 1934. |
| |
| | (b) There were no changes in the registrant’s internal control over financial reporting (as defined in Rule 30a-3(d) under the 1940 Act) that occurred during the second fiscal quarter of the period covered by this report that have materially affected, or are likely to materially affect the registrant’s internal control over financial reporting |
| | |
| ITEM 12. | | EXHIBITS. |
| |
| | (a) (1) Not applicable. |
| | Exhibit 99.CODE ETH |
| |
| | (a) (2) Certifications pursuant to section 302 of the Sarbanes-Oxley Act of 2002 attached hereto. |
| | Exhibit 99.CERT |
| |
| | (b) Certifications pursuant to Section 906 of the Sarbanes-Oxley Act of 2002 attached hereto. |
| | Exhibit 99.906CERT |
SIGNATURES
Pursuant to the requirements of the Securities Exchange Act of 1934 and the Investment Company Act of 1940, the registrant has duly caused this Report to be signed on its behalf by the undersigned, there unto duly authorized.
Legg Mason Partners Variable Equity Trust
| | |
| |
| By: | | /s/ Kenneth D. Fuller |
| | Kenneth D. Fuller |
| | Chief Executive Officer |
| | Legg Mason Partners Variable Equity Trust |
| |
| Date: | | August 23, 2013 |
Pursuant to the requirements of the Securities Exchange Act of 1934 and the Investment Company Act of 1940, this report has been signed below by the following persons on behalf of the registrant and in the capacities and on the dates indicated.
| | |
| By: | | /s/ Kenneth D. Fuller |
| | Kenneth D. Fuller |
| | Chief Executive Officer |
| | Legg Mason Partners Variable Equity Trust |
| |
| Date: | | August 23, 2013 |
| |
| By: | | /s/ Richard F. Sennett |
| | Richard F. Sennett |
| | Principal Financial Officer |
| | Legg Mason Partners Variable Equity Trust |
| |
| Date: | | August 23, 2013 |