UNITED STATES
SECURITIES AND EXCHANGE COMMISSION
Washington, D.C. 20549
FORMN-CSR
CERTIFIED SHAREHOLDER REPORT OF REGISTERED
MANAGEMENT INVESTMENT COMPANIES
Investment Company Act file number811-21128
Legg Mason Partners Variable Equity Trust
(Exact name of registrant as specified in charter)
620 Eighth Avenue, 49th Floor, New York, NY 10018
(Address of principal executive offices) (Zip code)
Robert I. Frenkel, Esq.
Legg Mason & Co., LLC
100 First Stamford Place
Stamford, CT 06902
(Name and address of agent for service)
Registrant’s telephone number, including area code:1-877-721-1926
Date of fiscal year end: December 31
Date of reporting period: December 31, 2019
| ITEM 1. | REPORT TO STOCKHOLDERS. |
TheAnnual Report to Stockholders is filed herewith.

| | |
| Annual Report | | December 31, 2019 |
CLEARBRIDGE
VARIABLE SMALL CAP GROWTH PORTFOLIO
Beginning in January 2021, as permitted by regulations adopted by the Securities and Exchange Commission, your insurance company may no longer send you paper copies of the Fund’s shareholder reports like this one by mail, unless you specifically request paper copies of the reports from the insurance company or your financial intermediary. Instead, the shareholder reports will be made available on a website, and you will be notified by mail each time a report is posted and provided with a website link to access the report. Instructions for requesting paper copies will be provided by your insurance company.
If you already elected to receive shareholder reports electronically, you will not be affected by this change and you need not take any action. If your insurance company offers electronic delivery, you may elect to receive shareholder reports and other communications from them electronically by following the instructions provided by the insurance company.
You may elect to receive all future reports in paper free of charge. You can inform the insurance company that you wish to continue receiving paper copies of shareholder reports by following the instructions provided by them. Your election will apply to all Funds available under your contract with the insurance company.

|
| INVESTMENT PRODUCTS: NOT FDIC INSURED • NO BANK GUARANTEE • MAY LOSE VALUE |
Portfolio objective
The Portfolio seeks long-term growth of capital.
Letter from the president

Dear Shareholder,
We are pleased to provide the annual report of ClearBridge Variable Small Cap Growth Portfolio for the twelve-month reporting period ended December 31, 2019. Please read on for a detailed look at prevailing economic and market conditions during the Portfolio’s reporting period and to learn how those conditions have affected Portfolio performance.
As always, we remain committed to providing you with excellent service and a full spectrum of investment choices. We also remain committed to supplementing the support you receive from your financial advisor. One way we accomplish this is through our website, www.leggmason.com. Here you can gain immediate access to market and investment information, including:
| • | | Market insights and commentaries from our portfolio managers and |
| • | | A host of educational resources. |
We look forward to helping you meet your financial goals.
Sincerely,

Jane Trust, CFA
President and Chief Executive Officer
January 31, 2020
| | |
| | |
| II | | ClearBridge Variable Small Cap Growth Portfolio |
Portfolio overview
Q. What is the Portfolio’s investment strategy?
A. The Portfolio seeks long-term growth of capital. We use a growth-oriented investment style that emphasizes small capitalization U.S. companies. In selecting individual companies for investment, some of the sought after characteristics include:
| • | | Superior management teams, evidenced by experience, capital discipline and definable strategy |
| • | | Good prospects for growth |
| • | | Dominant position in a niche market or customers that are very large companies |
| • | | Strong or improving financial conditions |
In addition, the Portfolio may invest in companies that we believe to be emerging in new or existing markets. The Portfolio may also invest in companies we believe to be undervalued relative to their peers.
We generally use a concentrated “bottom-up” approach when selecting securities for the Portfolio. We focus on individual security selection rather than allow macro-economic considerations to strongly influence sector weights or individual security selection.
We utilize ClearBridge’s fundamental research analysts who, using their industry expertise, determine the material ESG (environmental, social and governance) factors facing both individual companies and industry sectors and engage with company management regarding the extent to which they promote best practices of such factors. ESG factors may include, but are not necessarily limited to, environmentally-friendly product initiatives, labor audits of overseas supply chains and strong corporate governance. The choice of ESG factors for any particular company reflects the specific industry.
Under normal circumstances, the Portfolio invests at least 80% of its assets in equity securities of companies with small market capitalizations and related investments. The Portfolio may invest up to 20% of its assets in equity securities of companies that are not considered to be small capitalization companies. The Portfolio may also invest up to 20% of its assets in non-convertible bonds, notes and debt, when we believe that their total return potential equals or exceeds the potential return of equity securities.
Q. What were the overall market conditions during the Portfolio’s reporting period?
A.In the latter half of 2018, a hornet’s nest of negative trends worried investors: tariff and trade conflicts, cost pressures, Washington budget dysfunction, decelerating macro statistics and rising short-term interest rates. Late 2019 brought a tidy quasi-resolution of a multitude of those nettlesome issues:
| • | | A phase-one deal with China (almost signed) and lessening of tariff worries |
| • | | An agreement between the White House and House Democrats on USMCA terms |
| | |
| | |
| ClearBridge Variable Small Cap Growth Portfolio 2019 Annual Report | | 1 |
Portfolio overview (cont’d)
| • | | A Federal spending authorization package |
| • | | Quiescence at the Federal Reserve Board (the “Fed”)i |
| • | | Boris Johnson getting the necessary mandate for an orderly Brexit process |
| • | | A modest uptick in U.S. industrial activity after 12-18 months of deceleration |
Markets ripped into the year-end mark as a result, with the Russell 2000 Growth Indexii up more than 11% during the fourth quarter of 2019, to finish the year 28.48% higher.
In our view, there are fewer macro overhangs than a year ago, with the caveat that the upcoming U.S election is a new uncertainty. Last year, we alluded to fears of the “glissade into recession.” This year an accommodating Fed reversed its path of higher short-term interest rates and trimmed rates several times. The inverted yield curveiii has once again sent a false positive regarding near-term recession risk. The macro threats from the various trade and tariff actions appear to be abating, a definitive positive.
Our economic recovery is lengthy in duration off the June 2009 base but the level of economic activity has been moderate compared to past recoveries. The trough to present level recovery is in line with historic trough to peak norms in real gross domestic product (“GDP”)iv and nowhere near as vibrant as the 1960s expansion or the 1990s. Consumer balance sheets are in ruddy good shape. While corporate financial leverage is comparable, by some measures, to the last peak, U.S. banks are now in much better shape than during the Great Recession. Unemployment is at multi-decade lows and labor absorption is picking up.
What could upset financial markets? Apart from exacerbated trade tensions, it is always the unknowable surprise that’s understandably most worrisome. A palpable pickup of inflation given tight labor markets. A deterioration of corporate or personal credit, especially a credit market “spark” that creates a wildfire and disturbs the normal functioning of financial markets. Rediscovery of the yawning deficits that plague the Federal budget and the budgets of many states. Social unrest or military actions. Some combination of these and other factors could touch off a market sell-off.
Q. How did we respond to these changing market conditions?
A. After keeping pace during the first three quarters of the year, the Portfolio underperformed the Russell 2000 Growth Index benchmark during the fourth quarter of 2019. The portfolio struggled during the fourth quarter market updraft, largely due to a major move in the small biotech industry in which the Portfolio has virtually no investments as well as strong quarterly flows into small cap ETFs, which benefit disproportionately lower capitalization and lower quality small cap stocks. The Portfolio typically lags strong “up markets,” so we’re not surprised at recent performance.
During 2019 we remained squarely attentive to identifying great up-and-coming businesses. We made eighteen new investments with a disproportionate focus on the Health Care
| | |
| | |
| 2 | | ClearBridge Variable Small Cap Growth Portfolio 2019 Annual Report |
sector as three health care holdings were acquired during the reporting period (Medidata Solutions, Genomic Health, Cambrex).
The initial public offering (“IPO”) market continues to be a fertile source of new investments, and we participated in eight IPOs this year of which seven remain in the Portfolio. Many of the positions are modestly sized and we expect to increase them over time assuming continued strong execution by management of the businesses. As always, we look for i) businesses with growing and large opportunities, ii) self-financing capital structures and iii) managements with well-defined strategies to expand the business and benefit shareholders.
We bade farewell to several holdings during 2019 due to growth of capitalization including internet security vendor Fortinet and financial services firm SVB Financial. We also trimmed a number of holdings due to capitalization, including car auction and salvage provider Copart and diabetes care device maker Insulet.
As a reminder, the Portfolio does not hold “the market.” Our practice is to invest with a concentrated number of progressive managements, developing and commercializing innovative products and services. The Portfolio’s investments generally have the financial resources to invest through a more guarded macro and capital markets environment. We structure the Portfolio with resilient businesses which we believe, over time, can result in substantially higher firm values.
Performance review
For the twelve months ended December 31, 2019, Class I shares of ClearBridge Variable Small Cap Growth Portfolio1 returned 26.87%. The Portfolio’s unmanaged benchmark, the Russell 2000 Growth Index, returned 28.48% for the same period. The Lipper Variable Small-Cap Growth Funds Category Averagev returned 29.85% over the same time frame.
| | | | | | | | |
Performance Snapshotas of December 31, 2019
(unaudited) | |
| | | 6 months | | | 12 months | |
| ClearBridge Variable Small Cap Growth Portfolio1: | | | | | | | | |
Class I | | | 4.17 | % | | | 26.87 | % |
Class II | | | 4.04 | % | | | 26.55 | % |
| Russell 2000 Growth Index | | | 6.75 | % | | | 28.48 | % |
| Lipper Variable Small-Cap Growth Funds Category Average | | | 4.73 | % | | | 29.85 | % |
The performance shown represents past performance. Past performance is no guarantee of future results and current performance may be higher or lower than the performance shown above. Principal value and investment returns will fluctuate and investors’ shares, when redeemed, may be worth more or less than their original cost.
| 1 | The Portfolio is an underlying investment option of various variable annuity and variable life insurance products. The Portfolio’s performance returns do not reflect the deduction of expenses imposed in connection with investing in variable annuity or variable life insurance contracts, such as fees, account charges and surrender charges, which, if reflected, would reduce the performance of the Portfolio.Past performance is no guarantee of future results. |
| | |
| | |
| ClearBridge Variable Small Cap Growth Portfolio 2019 Annual Report | | 3 |
Portfolio overview (cont’d)
All share class returns assume the reinvestment of all distributions at net asset value and the deduction of all Portfolio expenses. Performance figures for periods shorter than one year represent cumulative figures are not annualized.
|
| Total Annual Operating Expenses(unaudited) |
As of the Portfolio’s current prospectus dated April 29, 2019, the gross total annual fund operating expense ratios for Class I and Class II shares were 0.83% and 1.08%, respectively.
Actual expenses may be higher. For example, expenses may be higher than those shown if average net assets decrease. Net assets are more likely to decrease and Portfolio expense ratios are more likely to increase when markets are volatile.
Q. What were the leading contributors to performance?
A. On an absolute basis, the Portfolio had positive performance in nine of the ten economic sectors in which it was invested for the reporting period (out of eleven economic sectors in total). The leading contributors came from the Information Technology (“IT”), Industrials and Health Care sectors.
Relative to the benchmark, overall sector allocation contributed to performance for the reporting period. In particular, an overweight to the IT sector as well as stock selection in the Industrials, Health Care and Financials sectors had positive impacts on relative performance.
In terms of individual holdings, leading contributors to performance for the reporting period included positions in Insulet and Syneos Health in the Health Care sector, Copart and Trex in the Industrials sector and Inphi in the IT sector.
Q. What were the leading detractors from performance?
A. Relative to the benchmark, overall stock selection detracted from performance for the reporting period. In particular, stock selection in the Consumer Discretionary, Communication Services and IT sectors was the primary detractor from returns.
In terms of individual holdings, the leading detractors from performance for the reporting period included Portfolio positions in Vocera Communications and Glaukos in the Health Care sector, Grubhub in the Consumer Discretionary sector as well as Lions Gate Entertainment and Comscore in the Communication Services sector.
Q. Were there any significant changes to the Portfolio during the reporting period?
A. There were a number of positions bought and sold over the course of the reporting period. Among the largest, we initiated positions in Aerojet Rocketdyne in the Industrials sector, Glaukos and Invitae in the Health Care sector, Bandwidth in the Communication Services sector and PagerDuty in the IT sector. The Portfolio also closed several positions during the year with the largest sales in Medidata Solutions and Cambrex in the Health Care sector, Fortinet and MINDBODY, both in the IT sector and Grubhub in the Consumer Discretionary sector.
| | |
| | |
| 4 | | ClearBridge Variable Small Cap Growth Portfolio 2019 Annual Report |
Thank you for your investment in ClearBridge Variable Small Cap Growth Portfolio. As always, we appreciate that you have chosen us to manage your assets and we remain focused on achieving the Portfolio’s investment goals.
Sincerely,

Jeffrey J. Russell, CFA
Portfolio Manager
ClearBridge Investments, LLC

Aram E. Green
Portfolio Manager
ClearBridge Investments, LLC
January 27, 2020
RISKS: Equity securities are subject to price and market fluctuations. Investments in small-capitalization companies may involve a higher degree of risk and volatility than investments in larger, more established companies. Investments in foreign securities are subject to certain risks of overseas investing, including currency fluctuations and changes in social, political and economic conditions, which could result in significant market fluctuations. These risks are magnified in emerging markets. The Portfolio may use derivatives, such as options and futures, which can be illiquid, may disproportionately increase losses, and have a potentially large impact on Portfolio performance. Please see the Portfolio’s prospectus for a more complete discussion of these and other risks and the Portfolio’s investment strategies.
Portfolio holdings and breakdowns are as of December 31, 2019 and are subject to change and may not be representative of the portfolio managers’ current or future investments. The Portfolio’s top ten holdings (as a percentage of net assets) as of December 31, 2019 were: Trex Co. Inc. (3.8%), Insulet Corp. (3.5%), ICON PLC (3.2%), Penumbra Inc. (2.4%), Cornerstone OnDemand Inc. (2.4%), Syneos Health Inc. (2.4%), Wix.com Ltd. (2.3%), Monolithic Power Systems Inc. (2.3%), Integra LifeSciences Holdings Corp. (2.2%), and National Vision Holdings Inc. (2.2%). Please refer to pages 12 through 16 for a list and percentage breakdown of the Portfolio’s holdings.
The mention of sector breakdowns is for informational purposes only and should not be construed as a recommendation to purchase or sell any securities. The information provided regarding such sectors is not a sufficient basis upon which to make an investment decision. Investors seeking financial advice regarding the appropriateness of investing in any securities or investment strategies discussed should consult their financial professional. The Portfolio’s top five sector holdings (as a percentage of net assets) as of December 31, 2019 were: Information Technology (27.9%), Health Care (22.1%),
| | |
| | |
| ClearBridge Variable Small Cap Growth Portfolio 2019 Annual Report | | 5 |
Portfolio overview (cont’d)
Industrials (20.4%), Consumer Discretionary (12.3%), and Financials (5.6%). The Portfolio’s composition is subject to change at any time.
All investments are subject to risk including the possible loss of principal. Past performance is no guarantee of future results. All index performance reflects no deduction for fees, expenses or taxes. Please note that an investor cannot invest directly in an index.
The information provided is not intended to be a forecast of future events, a guarantee of future results or investment advice. Views expressed may differ from those of the firm as a whole.
| i | The Federal Reserve Board (the “Fed”) is responsible for the formulation of U.S. policies designed to promote economic growth, full employment, stable prices and a sustainable pattern of international trade and payments. |
| ii | The Russell 2000 Growth Index measures the performance of the small-cap growth segment of the U.S. equity universe. It includes those Russell 2000 Index companies with higher price-to-value ratios and higher forecasted growth values. (A price-to-book ratio is the price of a stock compared to the difference between a company’s assets and liabilities.) The Russell 2000 Index measures the performance of the small-cap segment of the U.S. equity universe. The Russell 2000 is a subset of the Russell 3000 Index representing approximately 10% of the total market capitalization of that index. It includes approximately 2,000 of the smallest securities based on a combination of their market cap and current index membership. The Russell 3000 Index measures the performance of the 3,000 largest U.S. companies based on total market capitalization, which represents approximately 98% of the U.S. equity market. |
| iii | The yield curve is the graphical depiction of the relationship between the yield on bonds of the same credit quality but different maturities. |
| iv | Gross domestic product (“GDP”) is the market value of all final goods and services produced within a country in a given period of time. |
| v | Lipper, Inc., a wholly-owned subsidiary of Reuters, provides independent insight on global collective investments. Returns are based on the period ended December 31, 2019, including the reinvestment of all distributions, including returns of capital, if any, calculated among the 102 funds for the six-month period and among the 102 funds for the twelve-month period in the Portfolio’s Lipper category. |
| | |
| | |
| 6 | | ClearBridge Variable Small Cap Growth Portfolio 2019 Annual Report |
Fund at a glance†(unaudited)
Investment breakdown(%) as a percent of total investments
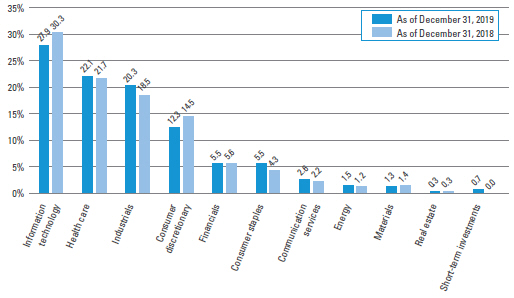
| † | The bar graph above represents the composition of the Portfolio’s investments as of December 31, 2019 and December 31, 2018. The Portfolio is actively managed. As a result, the composition of the Portfolio’s investments is subject to change at any time. |
| | |
| | |
| ClearBridge Variable Small Cap Growth Portfolio 2019 Annual Report | | 7 |
Portfolio expenses(unaudited)
Example
As a shareholder of the Portfolio, you may incur two types of costs: (1) transaction costs and (2) ongoing costs, including management fees; service and/or distribution (12b-1) fees; and other Portfolio expenses. This example is intended to help you understand your ongoing costs (in dollars) of investing in the Portfolio and to compare these costs with the ongoing costs of investing in other funds.
This example is based on an investment of $1,000 invested on July 1, 2019 and held for the six months ended December 31, 2019.
Actual expenses
The table below titled “Based on Actual Total Return” provides information about actual account values and actual expenses. You may use the information provided in this table, together with the amount you invested, to estimate the expenses that you paid over the period. To estimate the expenses you paid on your account, divide your ending account value by $1,000 (for example, an $8,600 ending account value divided by $1,000 = 8.6), then multiply the result by the number under the heading entitled “Expenses Paid During the Period”.
Hypothetical example for comparison purposes
The table below titled “Based on Hypothetical Total Return” provides information about hypothetical account values and hypothetical expenses based on the actual expense ratio and an assumed rate of return of 5.00% per year before expenses, which is not the Portfolio’s actual return. The hypothetical account values and expenses may not be used to estimate the actual ending account balance or expenses you paid for the period. You may use the information provided in this table to compare the ongoing costs of investing in the Portfolio and other funds. To do so, compare the 5.00% hypothetical example relating to the Portfolio with the 5.00% hypothetical examples that appear in the shareholder reports of the other funds.
Please note that the expenses shown in the table below are meant to highlight your ongoing costs only and do not reflect any transactional costs. Therefore, the table is useful in comparing ongoing costs only, and will not help you determine the relative total costs of owning different funds. In addition, if these transaction costs were included, your costs would have been higher.
| | | | | | | | | | | | | | | | | | | | | | | | | | | | | | | | | | | | | | | | | | | | | | |
| | |
| Based on actual total return1 | | | | | | Based on hypothetical total return1 | |
| | | Actual
Total Return2 | | | Beginning
Account
Value | | | Ending
Account
Value | | | Annualized
Expense
Ratio | | | Expenses
Paid During
the Period3 | | | | | | | | Hypothetical
Annualized
Total Return | | | Beginning
Account
Value | | | Ending
Account
Value | | | Annualized
Expense
Ratio | | | Expenses
Paid During
the Period3 | |
| Class I | | | 4.17 | % | | $ | 1,000.00 | | | $ | 1,041.70 | | | | 0.81 | % | | $ | 4.17 | | | | | | | Class I | | | 5.00 | % | | $ | 1,000.00 | | | $ | 1,021.12 | | | | 0.81 | % | | $ | 4.13 | |
| Class II | | | 4.04 | | | | 1,000.00 | | | | 1,040.40 | | | | 1.06 | | | | 5.45 | | | | | | | Class II | | | 5.00 | | | | 1,000.00 | | | | 1,019.86 | | | | 1.06 | | | | 5.40 | |
| | |
| | |
| 8 | | ClearBridge Variable Small Cap Growth Portfolio 2019 Annual Report |
| 1 | For the six months ended December 31, 2019. |
| 2 | Assumes the reinvestment of all distributions, including returns of capital, if any, at net asset value. Total return is not annualized, as it may not be representative of the total return for the year. Total returns do not reflect expenses associated with separate accounts such as administrative fees, account charges and surrender charges, which, if reflected, would reduce the total returns. Performance figures may reflect compensating balance arrangements, fee waivers and/or expense reimbursements. In the absence of compensating balance arrangements, fee waivers and/or expense reimbursements, the total return would have been lower. Past performance is no guarantee of future results. |
| 3 | Expenses (net of compensating balance arrangements, fee waivers and/or expense reimbursements) are equal to each class’ respective annualized expense ratio multiplied by the average account value over the period, multiplied by the number of days in the most recent fiscal half-year (184), then divided by 365. |
| | |
| | |
| ClearBridge Variable Small Cap Growth Portfolio 2019 Annual Report | | 9 |
Portfolio performance(unaudited)
| | | | | | | | |
| Average annual total returns1 | | | | | | |
| | | Class I | | | Class II | |
| Twelve Months Ended 12/31/19 | | | 26.87 | % | | | 26.55 | % |
| Five Years Ended 12/31/19 | | | 10.53 | | | | 10.26 | |
| Ten Years Ended 12/31/19 | | | 14.36 | | | | 14.03 | |
| | | | |
| Cumulative total returns1 | |
| Class I (12/31/09 through 12/31/19) | | | 282.74 | % |
| Class II (12/31/09 through 12/31/19) | | | 271.69 | |
All figures represent past performance and are not a guarantee of future results. Investment return and principal value of an investment will fluctuate so that an investor’s shares, when redeemed, may be worth more or less than their original cost. The returns shown do not reflect expenses associated with separate accounts such as administrative fees, account charges and surrender charges, which, if reflected, would reduce the total returns. Performance figures may reflect compensating balance arrangements, fee waivers and/or expense reimbursements. In the absence of compensating balance arrangements, fee waivers and/or expense reimbursements, the total return would have been lower.
| 1 | Assumes the reinvestment of all distributions, including returns of capital, if any, at net asset value. |
| | |
| | |
| 10 | | ClearBridge Variable Small Cap Growth Portfolio 2019 Annual Report |
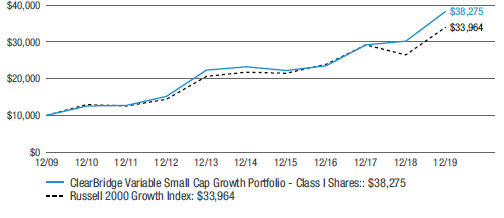
Historical performance
Value of $10,000 invested in
Class I Shares of ClearBridge Variable Small Cap Growth Portfolio vs Russell 2000 Growth Index† — December 2009 - December 2019
All figures represent past performance and are not a guarantee of future results. Investment return and principal value of an investment will fluctuate so that an investor’s shares, when redeemed, may be worth more or less than their original cost. The returns shown do not reflect expenses associated with separate accounts such as administrative fees, account charges and surrender charges, which, if reflected, would reduce the total returns. Performance figures may reflect compensating balance arrangements, fee waivers and/or expense reimbursements. In the absence of compensating balance arrangements, fee waivers and/or expense reimbursements, the total return would have been lower.
| † | Hypothetical illustration of $10,000 invested in Class I shares of ClearBridge Variable Small Cap Growth Portfolio on December 31, 2009, assuming the reinvestment of all distributions, including returns of capital, if any, at net asset value through December 31, 2019. The hypothetical illustration also assumes a $10,000 investment in the Russell 2000 Growth Index. The Russell 2000 Growth Index measures the performance of the small-cap growth segment of the U.S. equity universe. It includes those Russell 2000 Index companies with higher price-to-value ratios and higher forecasted growth values. The index is unmanaged and is not subject to the same management and trading expenses as a fund. Please note that an investor cannot invest directly in an index. The performance of the Portfolio’s other class may be greater or less than the Class I shares’ performance indicated on this chart, depending on whether greater or lesser fees were incurred by shareholders investing in the other class. |
| | |
| | |
| ClearBridge Variable Small Cap Growth Portfolio 2019 Annual Report | | 11 |
Schedule of investments
December 31, 2019
ClearBridge Variable Small Cap Growth Portfolio
| | | | | | | | | | | | | | | | |
| Security | | | | | | | | Shares | | | Value | |
| Common Stocks — 99.4% | | | | | | | | | | | | | | | | |
| Communication Services — 2.6% | | | | | | | | | | | | | | | | |
Diversified Telecommunication Services — 1.4% | | | | | | | | | | | | | | | | |
Bandwidth Inc., Class A Shares | | | | | | | | | | | 43,620 | | | | $ 2,793,861 | * |
Iridium Communications Inc. | | | | | | | | | | | 93,510 | | | | 2,304,087 | * |
Total Diversified Telecommunication Services | | | | | | | | | | | | | | | 5,097,948 | |
Interactive Media & Services — 1.2% | | | | | | | | | | | | | | | | |
Cargurus Inc. | | | | | | | | | | | 131,466 | | | | 4,624,974 | * |
Media — 0.0% | | | | | | | | | | | | | | | | |
Turn Inc. (Escrow) | | | | | | | | | | | 73,522 | | | | 25,551 | *(a)(b)(c) |
Total Communication Services | | | | | | | | | | | | | | | 9,748,473 | |
| Consumer Discretionary — 12.3% | | | | | | | | | | | | | | | | |
Auto Components — 2.1% | | | | | | | | | | | | | | | | |
Fox Factory Holding Corp. | | | | | | | | | | | 115,769 | | | | 8,054,049 | * |
Distributors — 1.1% | | | | | | | | | | | | | | | | |
Core-Mark Holding Co. Inc. | | | | | | | | | | | 156,374 | | | | 4,251,809 | |
Diversified Consumer Services — 2.1% | | | | | | | | | | | | | | | | |
Chegg Inc. | | | | | | | | | | | 203,743 | | | | 7,723,897 | * |
Internet & Direct Marketing Retail — 1.7% | | | | | | | | | | | | | | | | |
Revolve Group Inc. | | | | | | | | | | | 120,832 | | | | 2,218,475 | * |
Shutterstock Inc. | | | | | | | | | | | 93,136 | | | | 3,993,672 | * |
Total Internet & Direct Marketing Retail | | | | | | | | | | | | | | | 6,212,147 | |
Specialty Retail — 5.3% | | | | | | | | | | | | | | | | |
Hudson Ltd., Class A Shares | | | | | | | | | | | 240,100 | | | | 3,683,134 | * |
Monro Inc. | | | | | | | | | | | 96,619 | | | | 7,555,606 | |
National Vision Holdings Inc. | | | | | | | | | | | 257,992 | | | | 8,366,681 | * |
Total Specialty Retail | | | | | | | | | | | | | | | 19,605,421 | |
Total Consumer Discretionary | | | | | | | | | | | | | | | 45,847,323 | |
| Consumer Staples — 5.5% | | | | | | | | | | | | | | | | |
Food & Staples Retailing — 4.1% | | | | | | | | | | | | | | | | |
BJ’s Wholesale Club Holdings Inc. | | | | | | | | | | | 305,883 | | | | 6,955,779 | * |
Casey’s General Stores Inc. | | | | | | | | | | | 46,153 | | | | 7,337,865 | |
Grocery Outlet Holding Corp. | | | | | | | | | | | 24,910 | | | | 808,330 | * |
Total Food & Staples Retailing | | | | | | | | | | | | | | | 15,101,974 | |
Food Products — 1.4% | | | | | | | | | | | | | | | | |
Calavo Growers Inc. | | | | | | | | | | | 50,580 | | | | 4,582,042 | |
Hain Celestial Group Inc. | | | | | | | | | | | 30,480 | | | | 791,109 | * |
Total Food Products | | | | | | | | | | | | | | | 5,373,151 | |
Total Consumer Staples | | | | | | | | | | | | | | | 20,475,125 | |
See Notes to Financial Statements.
| | |
| | |
| 12 | | ClearBridge Variable Small Cap Growth Portfolio 2019 Annual Report |
ClearBridge Variable Small Cap Growth Portfolio
| | | | | | | | | | | | | | | | |
| Security | | | | | | | | Shares | | | Value | |
| Energy — 1.4% | | | | | | | | | | | | | | | | |
Energy Equipment & Services — 1.4% | | | | | | | | | | | | | | | | |
Cactus Inc., Class A Shares | | | | | | | | | | | 96,066 | | | $ | 3,296,985 | |
Newpark Resources Inc. | | | | | | | | | | | 331,100 | | | | 2,075,997 | * |
Total Energy | | | | | | | | | | | | | | | 5,372,982 | |
| Financials — 5.6% | | | | | | | | | | | | | | | | |
Banks — 1.9% | | | | | | | | | | | | | | | | |
Western Alliance Bancorp | | | | | | | | | | | 120,324 | | | | 6,858,468 | |
Capital Markets — 1.5% | | | | | | | | | | | | | | | | |
Assetmark Financial Holdings Inc. | | | | | | | | | | | 60,340 | | | | 1,751,067 | * |
PJT Partners Inc., Class A Shares | | | | | | | | | | | 46,170 | | | | 2,083,652 | |
WisdomTree Investments Inc. | | | | | | | | | | | 336,903 | | | | 1,630,611 | |
Total Capital Markets | | | | | | | | | | | | | | | 5,465,330 | |
Insurance — 2.2% | | | | | | | | | | | | | | | | |
American Equity Investment Life Holding Co. | | | | | | | | | | | 147,392 | | | | 4,411,442 | |
Trupanion Inc. | | | | | | | | | | | 104,854 | | | | 3,927,831 | * |
Total Insurance | | | | | | | | | | | | | | | 8,339,273 | |
Total Financials | | | | | | | | | | | | | | | 20,663,071 | |
| Health Care — 22.1% | | | | | | | | | | | | | | | | |
Biotechnology — 2.5% | | | | | | | | | | | | | | | | |
Heron Therapeutics Inc. | | | | | | | | | | | 279,278 | | | | 6,563,033 | * |
Invitae Corp. | | | | | | | | | | | 164,860 | | | | 2,659,192 | * |
Total Biotechnology | | | | | | | | | | | | | | | 9,222,225 | |
Health Care Equipment & Supplies — 9.5% | | | | | | | | | | | | | | | | |
Glaukos Corp. | | | | | | | | | | | 65,851 | | | | 3,586,904 | * |
Insulet Corp. | | | | | | | | | | | 76,735 | | | | 13,137,032 | * |
Integra LifeSciences Holdings Corp. | | | | | | | | | | | 143,677 | | | | 8,373,495 | * |
Penumbra Inc. | | | | | | | | | | | 55,458 | | | | 9,110,086 | * |
Silk Road Medical Inc. | | | | | | | | | | | 33,800 | | | | 1,364,844 | * |
Total Health Care Equipment & Supplies | | | | | | | | | | | | | | | 35,572,361 | |
Health Care Providers & Services — 1.9% | | | | | | | | | | | | | | | | |
Progyny Inc. | | | | | | | | | | | 115,050 | | | | 3,158,122 | * |
Surgery Partners Inc. | | | | | | | | | | | 250,136 | | | | 3,915,879 | * |
Total Health Care Providers & Services | | | | | | | | | | | | | | | 7,074,001 | |
Health Care Technology — 1.4% | | | | | | | | | | | | | | | | |
Health Catalyst Inc. | | | | | | | | | | | 37,050 | | | | 1,285,635 | * |
Phreesia Inc. | | | | | | | | | | | 40,606 | | | | 1,081,744 | * |
Vocera Communications Inc. | | | | | | | | | | | 136,880 | | | | 2,841,629 | * |
Total Health Care Technology | | | | | | | | | | | | | | | 5,209,008 | |
See Notes to Financial Statements.
| | |
| | |
| ClearBridge Variable Small Cap Growth Portfolio 2019 Annual Report | | 13 |
Schedule of investments(cont’d)
December 31, 2019
ClearBridge Variable Small Cap Growth Portfolio
| | | | | | | | | | | | | | | | |
| Security | | | | | | | | Shares | | | Value | |
Life Sciences Tools & Services — 5.6% | | | | | | | | | | | | | | | | |
ICON PLC | | | | | | | | | | | 68,652 | | | $ | 11,823,934 | * |
Syneos Health Inc. | | | | | | | | | | | 149,299 | | | | 8,879,558 | * |
Total Life Sciences Tools & Services | | | | | | | | | | | | | | | 20,703,492 | |
Pharmaceuticals — 1.2% | | | | | | | | | | | | | | | | |
Pacira BioSciences Inc. | | | | | | | | | | | 100,392 | | | | 4,547,758 | * |
Total Health Care | | | | | | | | | | | | | | | 82,328,845 | |
| Industrials — 20.4% | | | | | | | | | | | | | | | | |
Aerospace & Defense — 1.4% | | | | | | | | | | | | | | | | |
Aerojet Rocketdyne Holdings Inc. | | | | | | | | | | | 114,089 | | | | 5,209,304 | * |
Air Freight & Logistics — 3.2% | | | | | | | | | | | | | | | | |
Forward Air Corp. | | | | | | | | | | | 81,390 | | | | 5,693,230 | |
XPO Logistics Inc. | | | | | | | | | | | 78,820 | | | | 6,281,954 | * |
Total Air Freight & Logistics | | | | | | | | | | | | | | | 11,975,184 | |
Building Products — 5.2% | | | | | | | | | | | | | | | | |
Masonite International Corp. | | | | | | | | | | | 69,550 | | | | 5,022,205 | * |
Trex Co. Inc. | | | | | | | | | | | 158,092 | | | | 14,209,309 | * |
Total Building Products | | | | | | | | | | | | | | | 19,231,514 | |
Commercial Services & Supplies — 3.4% | | | | | | | | | | | | | | | | |
Copart Inc. | | | | | | | | | | | 86,469 | | | | 7,863,491 | * |
US Ecology Inc. | | | | | | | | | | | 84,119 | | | | 4,871,331 | |
Total Commercial Services & Supplies | | | | | | | | | | | | | | | 12,734,822 | |
Electrical Equipment — 0.3% | | | | | | | | | | | | | | | | |
Bloom Energy Corp., Class A Shares | | | | | | | | | | | 126,480 | | | | 944,806 | * |
Machinery — 4.4% | | | | | | | | | | | | | | | | |
Albany International Corp., Class A Shares | | | | | | | | | | | 44,070 | | | | 3,345,794 | |
IDEX Corp. | | | | | | | | | | | 46,110 | | | | 7,930,920 | |
Tennant Co. | | | | | | | | | | | 67,007 | | | | 5,221,186 | |
Total Machinery | | | | | | | | | | | | | | | 16,497,900 | |
Professional Services — 0.4% | | | | | | | | | | | | | | | | |
Insperity Inc. | | | | | | | | | | | 17,500 | | | | 1,505,700 | |
Trading Companies & Distributors — 2.1% | | | | | | | | | | | | | | | | |
H&E Equipment Services Inc. | | | | | | | | | | | 167,752 | | | | 5,607,949 | |
MRC Global Inc. | | | | | | | | | | | 153,431 | | | | 2,092,799 | * |
Total Trading Companies & Distributors | | | | | | | | | | | | | | | 7,700,748 | |
Total Industrials | | | | | | | | | | | | | | | 75,799,978 | |
| Information Technology — 27.9% | | | | | | | | | | | | | | | | |
Communications Equipment — 1.2% | | | | | | | | | | | | | | | | |
Viavi Solutions Inc. | | | | | | | | | | | 295,198 | | | | 4,427,970 | * |
Electronic Equipment, Instruments & Components — 1.9% | | | | | | | | | | | | | | | | |
MTS Systems Corp. | | | | | | | | | | | 35,933 | | | | 1,725,862 | |
See Notes to Financial Statements.
| | |
| | |
| 14 | | ClearBridge Variable Small Cap Growth Portfolio 2019 Annual Report |
ClearBridge Variable Small Cap Growth Portfolio
| | | | | | | | | | | | |
| Security | | | | | Shares | | | Value | |
Electronic Equipment, Instruments & Components — continued | | | | | | | | | | | | |
nLight Inc. | | | | | | | 95,360 | | | $ | 1,933,901 | * |
OSI Systems Inc. | | | | | | | 34,913 | | | | 3,517,135 | * |
Total Electronic Equipment, Instruments & Components | | | | | | | | | | | 7,176,898 | |
IT Services — 3.3% | | | | | | | | | | | | |
Cardtronics PLC, Class A Shares | | | | | | | 81,945 | | | | 3,658,844 | * |
Wix.com Ltd. | | | | | | | 70,536 | | | | 8,632,196 | * |
Total IT Services | | | | | | | | | | | 12,291,040 | |
Semiconductors & Semiconductor Equipment — 4.6% | | | | | | | | | | | | |
Inphi Corp. | | | | | | | 86,157 | | | | 6,377,341 | * |
Lattice Semiconductor Corp. | | | | | | | 113,380 | | | | 2,170,094 | * |
Monolithic Power Systems Inc. | | | | | | | 48,054 | | | | 8,554,573 | |
Total Semiconductors & Semiconductor Equipment | | | | | | | | | | | 17,102,008 | |
Software — 16.9% | | | | | | | | | | | | |
Aspen Technology Inc. | | | | | | | 64,763 | | | | 7,831,789 | * |
Cornerstone OnDemand Inc. | | | | | | | 153,836 | | | | 9,007,098 | * |
DocuSign Inc. | | | | | | | 53,907 | | | | 3,995,048 | * |
Envestnet Inc. | | | | | | | 78,462 | | | | 5,463,309 | * |
ForeScout Technologies Inc. | | | | | | | 113,126 | | | | 3,710,533 | * |
HubSpot Inc. | | | | | | | 42,350 | | | | 6,712,475 | * |
New Relic Inc. | | | | | | | 69,858 | | | | 4,590,369 | * |
PagerDuty Inc. | | | | | | | 111,740 | | | | 2,613,599 | * |
Pluralsight Inc., Class A Shares | | | | | | | 61,200 | | | | 1,053,252 | * |
Qualys Inc. | | | | | | | 83,876 | | | | 6,992,742 | * |
Smartsheet Inc., Class A Shares | | | | | | | 37,050 | | | | 1,664,286 | * |
Varonis Systems Inc. | | | | | | | 69,659 | | | | 5,413,201 | * |
Yext Inc. | | | | | | | 265,694 | | | | 3,831,307 | * |
Total Software | | | | | | | | | | | 62,879,008 | |
Total Information Technology | | | | | | | | | | | 103,876,924 | |
| Materials — 1.3% | | | | | | | | | | | | |
Chemicals — 1.3% | | | | | | | | | | | | |
Balchem Corp. | | | | | | | 46,146 | | | | 4,689,818 | |
| Real Estate — 0.3% | | | | | | | | | | | | |
Real Estate Management & Development — 0.3% | | | | | | | | | | | | |
Redfin Corp. | | | | | | | 58,324 | | | | 1,232,969 | * |
Total Investments before Short-Term Investments (Cost — $223,718,859) | | | | 370,035,508 | |
See Notes to Financial Statements.
| | |
| | |
| ClearBridge Variable Small Cap Growth Portfolio 2019 Annual Report | | 15 |
Schedule of investments(cont’d)
December 31, 2019
ClearBridge Variable Small Cap Growth Portfolio
| | | | | | | | | | | | |
| Security | | Rate | | | Shares | | | Value | |
| Short-Term Investments — 0.8% | | | | | | | | | | | | |
JPMorgan 100% U.S. Treasury Securities Money Market Fund, Institutional Class | | | 1.403 | % | | | 2,189,769 | | | | $ 2,189,769 | |
Western Asset Premier Institutional U.S. Treasury Reserves, Premium Shares | | | 1.485 | % | | | 547,442 | | | | 547,442 | (d) |
Total Short-Term Investments (Cost — $2,737,211) | | | | | | | | | | | 2,737,211 | |
Total Investments — 100.2% (Cost — $226,456,070) | | | | | | | | | | | 372,772,719 | |
Liabilities in Excess of Other Assets — (0.2)% | | | | | | | | | | | (596,628 | ) |
Total Net Assets — 100.0% | | | | | | | | | | | $372,176,091 | |
| * | Non-income producing security. |
| (a) | Security is valued in good faith in accordance with procedures approved by the Board of Trustees (Note 1). |
| (b) | Security is valued using significant unobservable inputs (Note 1). |
| (c) | Restricted security (Note 9). |
| (d) | In this instance, as defined in the Investment Company Act of 1940, an “Affiliated Company” represents Portfolio ownership of at least 5% of the outstanding voting securities of an issuer, or a company which is under common ownership or control. At December 31, 2019, the total market value of investments in Affiliated Companies was $547,442 and the cost was $547,442 (Note 8). |
See Notes to Financial Statements.
| | |
| | |
| 16 | | ClearBridge Variable Small Cap Growth Portfolio 2019 Annual Report |
Statement of assets and liabilities
December 31, 2019
| | | | |
| |
| Assets: | | | | |
Investments in unaffiliated securities, at value (Cost — $225,908,628) | | $ | 372,225,277 | |
Investments in affiliated securities, at value (Cost — $547,442) | | | 547,442 | |
Receivable for Portfolio shares sold | | | 170,048 | |
Dividends and interest receivable | | | 56,144 | |
Prepaid expenses | | | 3,515 | |
Total Assets | | | 373,002,426 | |
| |
| Liabilities: | | | | |
Payable for Portfolio shares repurchased | | | 364,007 | |
Investment management fee payable | | | 234,909 | |
Payable for securities purchased | | | 137,628 | |
Service and/or distribution fees payable | | | 21,932 | |
Trustees’ fees payable | | | 4,006 | |
Accrued expenses | | | 63,853 | |
Total Liabilities | | | 826,335 | |
| Total Net Assets | | $ | 372,176,091 | |
| |
| Net Assets: | | | | |
Par value (Note 7) | | $ | 137 | |
Paid-in capital in excess of par value | | | 221,720,528 | |
Total distributable earnings (loss) | | | 150,455,426 | |
| Total Net Assets | | $ | 372,176,091 | |
| |
| Net Assets: | | | | |
Class I | | | $267,324,394 | |
Class II | | | $104,851,697 | |
| |
| Shares Outstanding: | | | | |
Class I | | | 9,707,657 | |
Class II | | | 4,016,463 | |
| |
| Net Asset Value: | | | | |
Class I | | | $27.54 | |
Class II | | | $26.11 | |
See Notes to Financial Statements.
| | |
| | |
| ClearBridge Variable Small Cap Growth Portfolio 2019 Annual Report | | 17 |
Statement of operations
For the Year Ended December 31, 2019
| | | | |
| |
| Investment Income: | | | | |
Dividends | | $ | 1,091,090 | |
Interest from unaffiliated investments | | | 47,018 | |
Interest from affiliated investments | | | 760 | |
Total Investment Income | | | 1,138,868 | |
| |
| Expenses: | | | | |
Investment management fee (Note 2) | | | 2,643,884 | |
Service and/or distribution fees (Notes 2 and 5) | | | 232,421 | |
Fund accounting fees | | | 70,999 | |
Shareholder reports | | | 46,733 | |
Audit and tax fees | | | 34,918 | |
Trustees’ fees | | | 24,810 | |
Legal fees | | | 19,374 | |
Insurance | | | 5,479 | |
Custody fees | | | 4,915 | |
Interest expense | | | 4,283 | |
Transfer agent fees (Note 5) | | | 4,058 | |
Miscellaneous expenses | | | 2,617 | |
Total Expenses | | | 3,094,491 | |
Less: Fee waivers and/or expense reimbursements (Notes 2 and 5) | | | (6) | |
Net Expenses | | | 3,094,485 | |
| Net Investment Loss | | | (1,955,617) | |
| |
| Realized and Unrealized Gain on Investments and Written Options (Notes 1, 3 and 4): | | | | |
Net Realized Gain From: | | | | |
Investment transactions in unaffiliated securities | | | 29,869,437 | |
Written options | | | 367,277 | |
Net Realized Gain | | | 30,236,714 | |
Change in Net Unrealized Appreciation (Depreciation) From Unaffiliated Investments | | | 50,680,063 | |
| Net Gain on Investments and Written Options | | | 80,916,777 | |
| Increase in Net Assets From Operations | | $ | 78,961,160 | |
See Notes to Financial Statements.
| | |
| | |
| 18 | | ClearBridge Variable Small Cap Growth Portfolio 2019 Annual Report |
Statements of changes in net assets
| | | | | | | | |
| For the Years Ended December 31, | | 2019 | | | 2018 | |
| | |
| Operations: | | | | | | | | |
Net investment loss | | $ | (1,955,617) | | | $ | (1,784,807) | |
Net realized gain | | | 30,236,714 | | | | 41,113,711 | |
Change in net unrealized appreciation (depreciation) | | | 50,680,063 | | | | (30,665,652) | |
Increase in Net Assets From Operations | | | 78,961,160 | | | | 8,663,252 | |
| | |
| Distributions to Shareholders From (Notes 1 and 6): | | | | | | | | |
Total distributable earnings | | | (34,303,056) | | | | (35,996,223) | |
Decrease in Net Assets From Distributions to Shareholders | | | (34,303,056) | | | | (35,996,223) | |
| | |
| Portfolio Share Transactions (Note 7): | | | | | | | | |
Net proceeds from sale of shares | | | 83,034,209 | | | | 111,930,470 | |
Reinvestment of distributions | | | 34,303,056 | | | | 35,996,223 | |
Cost of shares repurchased | | | (90,479,872) | | | | (119,505,082) | |
Increase in Net Assets From Portfolio Share Transactions | | | 26,857,393 | | | | 28,421,611 | |
Increase in Net Assets | | | 71,515,497 | | | | 1,088,640 | |
| | |
| Net Assets: | | | | | | | | |
Beginning of year | | | 300,660,594 | | | | 299,571,954 | |
End of year | | $ | 372,176,091 | | | $ | 300,660,594 | |
See Notes to Financial Statements.
| | |
| | |
| ClearBridge Variable Small Cap Growth Portfolio 2019 Annual Report | | 19 |
Financial highlights
| | | | | | | | | | | | | | | | | | | | |
| For a share of each class of beneficial interest outstanding throughout each year ended December 31: | |
| Class I Shares1 | | 2019 | | | 2018 | | | 2017 | | | 2016 | | | 2015 | |
| | | | | |
| Net asset value, beginning of year | | | $23.88 | | | | $25.94 | | | | $21.31 | | | | $20.95 | | | | $22.40 | |
| | | | | |
| Income (loss) from operations: | | | | | | | | | | | | | | | | | | | | |
Net investment loss | | | (0.14) | | | | (0.13) | | | | (0.11) | | | | (0.08) | | | | (0.09) | |
Net realized and unrealized gain (loss) | | | 6.50 | | | | 1.16 | | | | 5.28 | | | | 1.27 | | | | (0.86) | |
Total income (loss) from operations | | | 6.36 | | | | 1.03 | | | | 5.17 | | | | 1.19 | | | | (0.95) | |
| | | | | |
| Less distributions from: | | | | | | | | | | | | | | | | | | | | |
Net realized gains | | | (2.70) | | | | (3.09) | | | | (0.54) | | | | (0.83) | | | | (0.50) | |
Total distributions | | | (2.70) | | | | (3.09) | | | | (0.54) | | | | (0.83) | | | | (0.50) | |
| | | | | |
| Net asset value, end of year | | | $27.54 | | | | $23.88 | | | | $25.94 | | | | $21.31 | | | | $20.95 | |
Total return2 | | | 26.87 | % | | | 3.44 | % | | | 24.26 | % | | | 5.80 | % | | | (4.37) | % |
| | | | | |
| Net assets, end of year (millions) | | | $267 | | | | $229 | | | | $238 | | | | $213 | | | | $220 | |
| | | | | |
| Ratios to average net assets: | | | | | | | | | | | | | | | | | | | | |
Gross expenses | | | 0.81 | % | | | 0.82 | % | | | 0.82 | % | | | 0.83 | % | | | 0.82 | % |
Net expenses3 | | | 0.81 | 4 | | | 0.82 | | | | 0.82 | | | | 0.83 | | | | 0.82 | |
Net investment loss | | | (0.49) | | | | (0.46) | | | | (0.47) | | | | (0.41) | | | | (0.40) | |
| | | | | |
| Portfolio turnover rate | | | 21 | % | | | 25 | % | | | 20 | % | | | 13 | % | | | 18 | % |
| 1 | Per share amounts have been calculated using the average shares method. |
| 2 | Performance figures may reflect compensating balance arrangements, fee waivers and/or expense reimbursements. In the absence of compensating balance arrangements, fee waivers and/or expense reimbursements, the total return would have been lower. Total returns do not reflect expenses associated with separate accounts such as administrative fees, account charges and surrender charges which, if reflected, would reduce the total return for all periods shown. Past performance is no guarantee of future results. |
| 3 | As a result of an expense limitation arrangement, the ratio of total annual fund operating expenses, other than interest, brokerage, taxes, extraordinary expenses and acquired fund fees and expenses, to average net assets of Class I shares did not exceed 1.00%. This expense limitation arrangement cannot be terminated prior to December 31, 2021 without the Board of Trustees’ consent. In addition, the manager has agreed to waive the Portfolio’s management fee to an extent sufficient to offset the net management fee payable in connection with any investment in an affiliated money market fund. |
| 4 | Reflects fee waivers and/or expense reimbursements. |
See Notes to Financial Statements.
| | |
| | |
| 20 | | ClearBridge Variable Small Cap Growth Portfolio 2019 Annual Report |
| | | | | | | | | | | | | | | | | | | | |
| For a share of each class of beneficial interest outstanding throughout each year ended December 31: | |
| Class II Shares1 | | 2019 | | | 2018 | | | 2017 | | | 2016 | | | 2015 | |
| | | | | |
| Net asset value, beginning of year | | | $22.81 | | | | $24.96 | | | | $20.58 | | | | $20.31 | | | | $21.78 | |
| | | | | |
| Income (loss) from operations: | | | | | | | | | | | | | | | | | | | | |
Net investment loss | | | (0.20) | | | | (0.20) | | | | (0.16) | | | | (0.13) | | | | (0.14) | |
Net realized and unrealized gain (loss) | | | 6.20 | | | | 1.14 | | | | 5.08 | | | | 1.23 | | | | (0.83) | |
Total income (loss) from operations | | | 6.00 | | | | 0.94 | | | | 4.92 | | | | 1.10 | | | | (0.97) | |
| | | | | |
| Less distributions from: | | | | | | | | | | | | | | | | | | | | |
Net realized gains | | | (2.70) | | | | (3.09) | | | | (0.54) | | | | (0.83) | | | | (0.50) | |
Total distributions | | | (2.70) | | | | (3.09) | | | | (0.54) | | | | (0.83) | | | | (0.50) | |
| | | | | |
| Net asset value, end of year | | | $26.11 | | | | $22.81 | | | | $24.96 | | | | $20.58 | | | | $20.31 | |
Total return2 | | | 26.55 | % | | | 3.21 | % | | | 23.91 | % | | | 5.54 | % | | | (4.59) | % |
| | | | | |
| Net assets, end of year (000s) | | | $104,852 | | | | $72,147 | | | | $61,094 | | | | $30,610 | | | | $17,546 | |
| | | | | |
| Ratios to average net assets: | | | | | | | | | | | | | | | | | | | | |
Gross expenses | | | 1.06 | % | | | 1.07 | % | | | 1.07 | % | | | 1.08 | % | | | 1.07 | % |
Net expenses3 | | | 1.06 | 4 | | | 1.07 | | | | 1.07 | | | | 1.08 | | | | 1.07 | |
Net investment loss | | | (0.74) | | | | (0.70) | | | | (0.71) | | | | (0.66) | | | | (0.65) | |
| | | | | |
| Portfolio turnover rate | | | 21 | % | | | 25 | % | | | 20 | % | | | 13 | % | | | 18 | % |
| 1 | Per share amounts have been calculated using the average shares method. |
| 2 | Performance figures may reflect compensating balance arrangements, fee waivers and/or expense reimbursements. In the absence of compensating balance arrangements, fee waivers and/or expense reimbursements, the total return would have been lower. Total returns do not reflect expenses associated with separate accounts such as administrative fees, account charges and surrender charges which, if reflected, would reduce the total return for all periods shown. Past performance is no guarantee of future results. |
| 3 | As a result of an expense limitation arrangement, the ratio of total annual fund operating expenses, other than interest, brokerage, taxes, extraordinary expenses and acquired fund fees and expenses, to average net assets of Class II shares did not exceed 1.25%. This expense limitation arrangement cannot be terminated prior to December 31, 2021 without the Board of Trustees’ consent. In addition, the manager has agreed to waive the Portfolio’s management fee to an extent sufficient to offset the net management fee payable in connection with any investment in an affiliated money market fund. |
| 4 | Reflects fee waivers and/or expense reimbursements. |
See Notes to Financial Statements.
| | |
| | |
| ClearBridge Variable Small Cap Growth Portfolio 2019 Annual Report | | 21 |
Notes to financial statements
1. Organization and significant accounting policies
ClearBridge Variable Small Cap Growth Portfolio (the “Portfolio”) is a separate diversified investment series of Legg Mason Partners Variable Equity Trust (the “Trust”). The Trust, a Maryland statutory trust, is registered under the Investment Company Act of 1940, as amended (the “1940 Act”), as anopen-end management investment company.
Shares of the Portfolio may only be purchased or redeemed through variable annuity contracts and variable life insurance policies offered by the separate accounts of participating insurance companies or through eligible pension or other qualified plans.
The following are significant accounting policies consistently followed by the Portfolio and are in conformity with U.S. generally accepted accounting principles (“GAAP”). Estimates and assumptions are required to be made regarding assets, liabilities and changes in net assets resulting from operations when financial statements are prepared. Changes in the economic environment, financial markets and any other parameters used in determining these estimates could cause actual results to differ. Subsequent events have been evaluated through the date the financial statements were issued.
(a) Investment valuation. Equity securities for which market quotations are available are valued at the last reported sales price or official closing price on the primary market or exchange on which they trade. The valuations for fixed income securities (which may include, but are not limited to, corporate, government, municipal, mortgage-backed, collateralized mortgage obligations and asset-backed securities) and certain derivative instruments are typically the prices supplied by independent third party pricing services, which may use market prices or broker/dealer quotations or a variety of valuation techniques and methodologies. The independent third party pricing services use inputs that are observable such as issuer details, interest rates, yield curves, prepayment speeds, credit risks/spreads, default rates and quoted prices for similar securities. Investments inopen-end funds are valued at the closing net asset value per share of each fund on the day of valuation. When the Portfolio holds securities or other assets that are denominated in a foreign currency, the Portfolio will normally use the currency exchange rates as of 4:00 p.m. (Eastern Time). If independent third party pricing services are unable to supply prices for a portfolio investment, or if the prices supplied are deemed by the manager to be unreliable, the market price may be determined by the manager using quotations from one or more broker/dealers or at the transaction price if the security has recently been purchased and no value has yet been obtained from a pricing service or pricing broker. When reliable prices are not readily available, such as when the value of a security has been significantly affected by events after the close of the exchange or market on which the security is principally traded, but before the Portfolio calculates its net asset value, the Portfolio values these securities as determined in accordance with procedures approved by the Portfolio’s Board of Trustees.
The Board of Trustees is responsible for the valuation process and has delegated the supervision of the daily valuation process to the Legg Mason North Atlantic Fund Valuation Committee (the “Valuation Committee”). The Valuation Committee, pursuant to the policies
| | |
| | |
| 22 | | ClearBridge Variable Small Cap Growth Portfolio 2019 Annual Report |
adopted by the Board of Trustees, is responsible for making fair value determinations, evaluating the effectiveness of the Portfolio’s pricing policies, and reporting to the Board of Trustees. When determining the reliability of third party pricing information for investments owned by the Portfolio, the Valuation Committee, among other things, conducts due diligence reviews of pricing vendors, monitors the daily change in prices and reviews transactions among market participants.
The Valuation Committee will consider pricing methodologies it deems relevant and appropriate when making fair value determinations. Examples of possible methodologies include, but are not limited to, multiple of earnings; discount from market of a similar freely traded security; discounted cash-flow analysis; book value or a multiple thereof; risk premium/yield analysis; yield to maturity; and/or fundamental investment analysis. The Valuation Committee will also consider factors it deems relevant and appropriate in light of the facts and circumstances. Examples of possible factors include, but are not limited to, the type of security; the issuer’s financial statements; the purchase price of the security; the discount from market value of unrestricted securities of the same class at the time of purchase; analysts’ research and observations from financial institutions; information regarding any transactions or offers with respect to the security; the existence of merger proposals or tender offers affecting the security; the price and extent of public trading in similar securities of the issuer or comparable companies; and the existence of a shelf registration for restricted securities.
For each portfolio security that has been fair valued pursuant to the policies adopted by the Board of Trustees, the fair value price is compared against the last available and next available market quotations. The Valuation Committee reviews the results of such back testing monthly and fair valuation occurrences are reported to the Board of Trustees quarterly.
The Portfolio uses valuation techniques to measure fair value that are consistent with the market approach and/or income approach, depending on the type of security and the particular circumstance. The market approach uses prices and other relevant information generated by market transactions involving identical or comparable securities. The income approach uses valuation techniques to discount estimated future cash flows to present value.
GAAP establishes a disclosure hierarchy that categorizes the inputs to valuation techniques used to value assets and liabilities at measurement date. These inputs are summarized in the three broad levels listed below:
| • | | Level 1 — quoted prices in active markets for identical investments |
| • | | Level 2 — other significant observable inputs (including quoted prices for similar investments, interest rates, prepayment speeds, credit risk, etc.) |
| • | | Level 3 — significant unobservable inputs (including the Portfolio’s own assumptions in determining the fair value of investments) |
| | |
| | |
| ClearBridge Variable Small Cap Growth Portfolio 2019 Annual Report | | 23 |
Notes to financial statements (cont’d)
The inputs or methodologies used to value securities are not necessarily an indication of the risk associated with investing in those securities.
The following is a summary of the inputs used in valuing the Portfolio’s assets carried at fair value:
| | | | | | | | | | | | | | | | |
| ASSETS | |
| Description | | Quoted Prices
(Level 1) | | | Other Significant
Observable Inputs
(Level 2) | | | Significant
Unobservable
Inputs
(Level 3) | | | Total | |
| Long-term investments†: | | | | | | | | | | | | | | | | |
Common stocks: | | | | | | | | | | | | | | | | |
Communication services | | $ | 9,722,922 | | | | — | | | $ | 25,551 | | | $ | 9,748,473 | |
Other common stocks | | | 360,287,035 | | | | — | | | | — | | | | 360,287,035 | |
| Total long-term investments | | | 370,009,957 | | | | — | | | | 25,551 | | | | 370,035,508 | |
| Short-term investments† | | | 2,737,211 | | | | — | | | | — | | | | 2,737,211 | |
| Total investments | | $ | 372,747,168 | | | | — | | | $ | 25,551 | | | $ | 372,772,719 | |
| † | See Schedule of Investments for additional detailed categorizations. |
(b) Purchased options. When the Portfolio purchases an option, an amount equal to the premium paid by the Portfolio is recorded as an investment on the Statement of Assets and Liabilities, the value of which ismarked-to-market to reflect the current market value of the option purchased. If the purchased option expires, the Portfolio realizes a loss equal to the amount of premium paid. When an instrument is purchased or sold through the exercise of an option, the related premium paid is added to the basis of the instrument acquired or deducted from the proceeds of the instrument sold. The risk associated with purchasing put and call options is limited to the premium paid.
(c) Written options. When the Portfolio writes an option, an amount equal to the premium received by the Portfolio is recorded as a liability, the value of which ismarked-to-market daily to reflect the current market value of the option written. If the option expires, the premium received is recorded as a realized gain. When a written call option is exercised, the difference between the premium received plus the option exercise price and the Portfolio’s basis in the underlying security (in the case of a covered written call option), or the cost to purchase the underlying security (in the case of an uncovered written call option), including brokerage commission, is recognized as a realized gain or loss. When a written put option is exercised, the amount of the premium received is subtracted from the cost of the security purchased by the Portfolio from the exercise of the written put option to form the Portfolio’s basis in the underlying security purchased. The writer or buyer of an option traded on an exchange can liquidate the position before the exercise of the option by entering into a closing transaction. The cost of a closing transaction is deducted from the original premium received resulting in a realized gain or loss to the Portfolio.
The risk in writing a covered call option is that the Portfolio may forego the opportunity of profit if the market price of the underlying security increases and the option is exercised.
| | |
| | |
| 24 | | ClearBridge Variable Small Cap Growth Portfolio 2019 Annual Report |
The risk in writing a put option is that the Portfolio may incur a loss if the market price of the underlying security decreases and the option is exercised. The risk in writing an uncovered call option is that the Portfolio is exposed to the risk of loss if the market price of the underlying security increases. In addition, there is the risk that the Portfolio may not be able to enter into a closing transaction because of an illiquid secondary market.
(d) Foreign investment risks. The Portfolio’s investments in foreign securities may involve risks not present in domestic investments. Since securities may be denominated in foreign currencies, may require settlement in foreign currencies or pay interest or dividends in foreign currencies, changes in the relationship of these foreign currencies to the U.S. dollar can significantly affect the value of the investments and earnings of the Portfolio. Foreign investments may also subject the Portfolio to foreign government exchange restrictions, expropriation, taxation or other political, social or economic developments, all of which affect the market and/or credit risk of the investments.
(e) Counterparty risk and credit-risk-related contingent features of derivative instruments. The Portfolio may invest in certain securities or engage in other transactions, where the Portfolio is exposed to counterparty credit risk in addition to broader market risks. The Portfolio may invest in securities of issuers, which may also be considered counterparties as trading partners in other transactions. This may increase the risk of loss in the event of default or bankruptcy by the counterparty or if the counterparty otherwise fails to meet its contractual obligations. The Portfolio’s subadviser attempts to mitigate counterparty risk by (i) periodically assessing the creditworthiness of its trading partners, (ii) monitoring and/or limiting the amount of its net exposure to each individual counterparty based on its assessment and (iii) requiring collateral from the counterparty for certain transactions. Market events and changes in overall economic conditions may impact the assessment of such counterparty risk by the subadviser. In addition, declines in the values of underlying collateral received may expose the Portfolio to increased risk of loss.
With exchange traded and centrally cleared derivatives, there is less counterparty risk to the Portfolio since the exchange or clearinghouse, as counterparty to such instruments, guarantees against a possible default. The clearinghouse stands between the buyer and the seller of the contract; therefore, the credit risk is limited to failure of the clearinghouse. While offset rights may exist under applicable law, the Portfolio does not have a contractual right of offset against a clearing broker or clearinghouse in the event of a default of the clearing broker or clearinghouse.
The Portfolio has entered into master agreements, such as an International Swaps and Derivatives Association, Inc. Master Agreement (“ISDA Master Agreement”) or similar agreement, with certain of its derivative counterparties that governover-the-counter derivatives and provide for general obligations, representations, agreements, collateral posting terms, netting provisions in the event of default or termination and credit related contingent features. The credit related contingent features include, but are not limited to, a percentage decrease in the Portfolio’s net assets or NAV over a specified period of time. If these credit
| | |
| | |
| ClearBridge Variable Small Cap Growth Portfolio 2019 Annual Report | | 25 |
Notes to financial statements (cont’d)
related contingent features were triggered, the derivatives counterparty could terminate the positions and demand payment or require additional collateral.
Under an ISDA Master Agreement, the Portfolio may, under certain circumstances, offset with the counterparty certain derivative financial instruments’ payables and/or receivables with collateral held and/or posted and create one single net payment. However, absent an event of default by the counterparty or a termination of the agreement, the terms of the ISDA Master Agreements do not result in an offset of reported amounts of financial assets and financial liabilities in the Statement of Assets and Liabilities across transactions between the Portfolio and the applicable counterparty. The enforceability of the right to offset may vary by jurisdiction.
Collateral requirements differ by type of derivative. Collateral or margin requirements are set by the broker or exchange clearinghouse for exchange traded derivatives while collateral terms are contract specific forover-the-counter traded derivatives. Cash collateral that has been pledged to cover obligations of the Portfolio under derivative contracts, if any, will be reported separately in the Statement of Assets and Liabilities. Securities pledged as collateral, if any, for the same purpose are noted in the Schedule of Investments.
As of December 31, 2019, the Portfolio did not have any open OTC derivative transactions with credit related contingent features in a net liability position.
(f) Security transactions and investment income. Security transactions are accounted for on a trade date basis. Interest income (including interest income frompayment-in-kind securities), adjusted for amortization of premium and accretion of discount, is recorded on the accrual basis. Dividend income is recorded on theex-dividend date for dividends received in cash and/or securities. Foreign dividend income is recorded on theex-dividend date or as soon as practicable after the Portfolio determines the existence of a dividend declaration after exercising reasonable due diligence. The cost of investments sold is determined by use of the specific identification method. To the extent any issuer defaults or a credit event occurs that impacts the issuer, the Portfolio may halt any additional interest income accruals and consider the realizability of interest accrued up to the date of default or credit event.
(g) Distributions to shareholders. Distributions from net investment income and distributions of net realized gains, if any, are declared at least annually. Distributions to shareholders of the Portfolio are recorded on theex-dividend date and are determined in accordance with income tax regulations, which may differ from GAAP.
(h) Share class accounting. Investment income, common expenses and realized/ unrealized gains (losses) on investments are allocated to the various classes of the Portfolio on the basis of daily net assets of each class. Fees relating to a specific class are charged directly to that share class.
| | |
| | |
| 26 | | ClearBridge Variable Small Cap Growth Portfolio 2019 Annual Report |
(i) Compensating balance arrangements. The Portfolio has an arrangement with its custodian bank whereby a portion of the custodian’s fees is paid indirectly by credits earned on the Portfolio’s cash on deposit with the bank.
(j) Federal and other taxes. It is the Portfolio’s policy to comply with the federal income and excise tax requirements of the Internal Revenue Code of 1986 (the “Code”), as amended, applicable to regulated investment companies. Accordingly, the Portfolio intends to distribute its taxable income and net realized gains, if any, to shareholders in accordance with timing requirements imposed by the Code. Therefore, no federal or state income tax provision is required in the Portfolio’s financial statements.
Management has analyzed the Portfolio’s tax positions taken on income tax returns for all open tax years and has concluded that as of December 31, 2019, no provision for income tax is required in the Portfolio’s financial statements. The Portfolio’s federal and state income and federal excise tax returns for tax years for which the applicable statutes of limitations have not expired are subject to examination by the Internal Revenue Service and state departments of revenue.
Under the applicable foreign tax laws, a withholding tax may be imposed on interest, dividends and capital gains at various rates.
(k) Reclassification. GAAP requires that certain components of net assets be reclassified to reflect permanent differences between financial and tax reporting. These reclassifications have no effect on net assets or net asset value per share. During the current year, the following reclassifications have been made:
| | | | | | | | |
| | | Total Distributable
Earnings (Loss) | | | Paid-in
Capital | |
| (a) | | $ | 1,959,537 | | | $ | (1,959,537) | |
| (a) Reclassifications are due to a tax net operating loss. | | | | | |
2. Investment management agreement and other transactions with affiliates
Legg Mason Partners Fund Advisor, LLC (“LMPFA”) is the Portfolio’s investment manager and ClearBridge Investments, LLC (“ClearBridge”) is the Portfolio’s subadviser. Western Asset Management Company, LLC (“Western Asset”) manages the portion of the Portfolio’s cash and short-term instruments allocated to it. LMPFA, ClearBridge and Western Asset are wholly-owned subsidiaries of Legg Mason, Inc. (“Legg Mason”).
Under the investment management agreement, the Portfolio pays an investment management fee, calculated daily and paid monthly, at an annual rate of 0.75% of the Portfolio’s average daily net assets.
LMPFA provides administrative and certain oversight services to the Portfolio. LMPFA delegates to the subadviser theday-to-day portfolio management of the Portfolio, except for the management of the portion of the cash and short-term instruments allocated to Western
| | |
| | |
| ClearBridge Variable Small Cap Growth Portfolio 2019 Annual Report | | 27 |
Notes to financial statements (cont’d)
Asset. For their services, LMPFA pays ClearBridge and Western Asset monthly an aggregate fee equal to 70% of the net management fee it receives from the Portfolio.
As a result of expense limitation arrangements between the Portfolio and LMPFA, the ratio of total annual fund operating expenses, other than interest, brokerage, taxes, extraordinary expenses and acquired fund fees and expenses, to average net assets of Class I and Class II shares did not exceed 1.00% and 1.25%, respectively. These expense limitation arrangements cannot be terminated prior to December 31, 2021 without the Board of Trustees’ consent. In addition, the manager has agreed to waive the Portfolio’s management fee to an extent sufficient to offset the net management fee payable in connection with any investment in an affiliated money market fund (the “affiliated money market fund waiver”). The affiliated money market fund waiver is not subject to the recapture provision discussed below.
During the year ended December 31, 2019, fees waived and/or expenses reimbursed amounted to $6, all of which was an affiliated money market fund waiver.
LMPFA is permitted to recapture amounts waived and/or reimbursed to a class during the same fiscal year if the class’ total annual operating expenses have fallen to a level below the expense limitation (“expense cap”) in effect at the time the fees were earned or the expenses incurred. In no case will LMPFA recapture any amount that would result, on any particular business day of the Portfolio, in the class’ total annual operating expenses exceeding the expense cap or any other lower limit then in effect.
Legg Mason Investor Services, LLC, a wholly-owned broker-dealer subsidiary of Legg Mason, serves as the Portfolio’s sole and exclusive distributor.
All officers and one Trustee of the Trust are employees of Legg Mason or its affiliates and do not receive compensation from the Trust.
3. Investments
During the year ended December 31, 2019, the aggregate cost of purchases and proceeds from sales of investments (excluding short-term investments) were as follows:
| | | | |
| Purchases | | $ | 73,582,248 | |
| Sales | | | 85,788,575 | |
At December 31, 2019, the aggregate cost of investments and the aggregate gross unrealized appreciation and depreciation of investments for federal income tax purposes were as follows:
| | | | | | | | | | | | | | | | |
| | | Cost | | | Gross
Unrealized
Appreciation | | | Gross
Unrealized
Depreciation | | | Net
Unrealized
Appreciation | |
| Securities | | $ | 226,688,406 | | | $ | 156,494,966 | | | $ | (10,410,653) | | | $ | 146,084,313 | |
4. Derivative instruments and hedging activities
At December 31, 2019, the Portfolio did not have any derivative instruments outstanding.
| | |
| | |
| 28 | | ClearBridge Variable Small Cap Growth Portfolio 2019 Annual Report |
The following table provides information about the effect of derivatives and hedging activities on the Portfolio’s Statement of Operations for the year ended December 31, 2019. The table provides additional detail about the amounts and sources of gains (losses) realized on derivatives during the period.
| | | | |
| AMOUNT OF REALIZED GAIN (LOSS) ON DERIVATIVES RECOGNIZED | |
| | | Equity
Risk | |
| Purchased options1 | | $ | (15,405) | |
| Written options | | | 367,277 | |
| Total | | $ | 351,872 | |
| 1 | Net realized gain (loss) from purchased options is reported in net realized gain (loss) from investment transactions in the Statement of Operations. |
During the year ended December 31, 2019, the volume of derivative activity for the Portfolio was as follows:
| | | | |
| | | Average Market
Value | |
| Purchased options† | | $ | 396 | |
| Written options† | | | 43,164 | |
| † | At December 31, 2019, there were no open positions held in this derivative. |
5. Class specific expenses, waivers and/or expense reimbursements
The Portfolio has adopted a Rule12b-1 shareholder services and distribution plan and under that plan the Portfolio pays service and/or distribution fees with respect to its Class II shares calculated at the annual rate of 0.25% of the average daily net assets of the class. Service and/or distribution fees are accrued daily and paid monthly.
For the year ended December 31, 2019, class specific expenses were as follows:
| | | | | | | | |
| | | Service and/or
Distribution Fees | | | Transfer Agent
Fees | |
| Class I | | | — | | | $ | 2,459 | |
| Class II | | $ | 232,421 | | | | 1,599 | |
| Total | | $ | 232,421 | | | $ | 4,058 | |
For the year ended December 31, 2019, waivers and/or expense reimbursements by class were as follows:
| | | | |
| | | Waivers/Expense
Reimbursements | |
| Class I | | $ | 4 | |
| Class II | | | 2 | |
| Total | | $ | 6 | |
| | |
| | |
| ClearBridge Variable Small Cap Growth Portfolio 2019 Annual Report | | 29 |
Notes to financial statements (cont’d)
6. Distributions to shareholders by class
| | | | | | | | |
| | | Year Ended
December 31, 2019 | | | Year Ended
December 31, 2018 | |
| Net realized gains: | | | | | | | | |
| Class I | | $ | 24,582,028 | | | $ | 26,832,765 | |
| Class II | | | 9,721,028 | | | | 9,163,458 | |
| Total | | $ | 34,303,056 | | | $ | 35,996,223 | |
7. Shares of beneficial interest
At December 31, 2019, the Trust had an unlimited number of shares of beneficial interest authorized with a par value of $0.00001 per share. The Portfolio has the ability to issue multiple classes of shares. Each class of shares represents an identical interest and has the same rights, except that each class bears certain direct expenses, including those specifically related to the distribution of its shares.
Transactions in shares of each class were as follows:
| | | | | | | | | | | | | | | | |
| | | Year Ended
December 31, 2019 | | | Year Ended
December 31, 2018 | |
| | | Shares | | | Amount | | | Shares | | | Amount | |
| Class I | | | | | | | | | | | | | | | | |
| Shares sold | | | 1,110,587 | | | $ | 30,721,367 | | | | 1,556,916 | | | $ | 46,807,158 | |
| Shares issued on reinvestment | | | 895,671 | | | | 24,582,028 | | | | 1,060,116 | | | | 26,832,765 | |
| Shares repurchased | | | (1,868,675) | | | | (51,689,634) | | | | (2,240,966) | | | | (65,756,694) | |
| Net increase | | | 137,583 | | | $ | 3,613,761 | | | | 376,066 | | | $ | 7,883,229 | |
| | | | |
| Class II | | | | | | | | | | | | | | | | |
| Shares sold | | | 1,966,451 | | | $ | 52,312,842 | | | | 2,264,139 | | | $ | 65,123,312 | |
| Shares issued on reinvestment | | | 373,647 | | | | 9,721,028 | | | | 377,957 | | | | 9,163,458 | |
| Shares repurchased | | | (1,487,230) | | | | (38,790,238) | | | | (1,925,888) | | | | (53,748,388) | |
| Net increase | | | 852,868 | | | $ | 23,243,632 | | | | 716,208 | | | $ | 20,538,382 | |
8. Transactions with affiliated companies
As defined by the 1940 Act, an affiliated company is one in which the Portfolio owns 5% or more of the outstanding voting securities, or a company which is under common ownership or control. Based on the Portfolio’s relative ownership, the following company was considered an affiliated company for all or some portion of the year ended December 31, 2019.
| | |
| | |
| 30 | | ClearBridge Variable Small Cap Growth Portfolio 2019 Annual Report |
The following transactions were effected in shares of such company for the year ended December 31, 2019.
| | | | | | | | | | | | | | | | |
| | | Affiliate Value at
December 31, 2018 | | | Purchased | | Sold | |
| | | Cost | | Shares | | Cost | | | Shares | |
| Western Asset Premier Institutional U.S. Treasury Reserves, Premium Shares | | | — | | | $1,398,534 | | 1,398,534 | | $ | 851,092 | | | | 851,092 | |
| | | | | | | | | | | | | | | | |
| (cont’d) | | Realized
Gain (Loss) | | | Interest
Income | | | Net Increase
(Decrease) in
Unrealized
Appreciation
(Depreciation) | | | Affiliate Value at
December 31, 2019 | |
| Western Asset Premier Institutional U.S. Treasury Reserves, Premium Shares | | | — | | | $ | 760 | | | | — | | | $ | 547,442 | |
9. Restricted securities
The following Portfolio investment is restricted as to resale and, in the absence of a readily ascertainable market value, is valued in good faith in accordance with procedures approved by the Board of Trustees.
| | | | | | | | | | | | | | | | | | | | | | | | |
| Security | | Number of
Shares | | | Acquisition
Date | | | Cost | | | Fair Value
at 12/31/2019 | | | Value Per
Share | | | Percent of
Net Assets | |
| Turn Inc. (Escrow) | | | 73,522 | | | | 12/13 | | | $ | 108,102 | | | $ | 25,551 | | | $ | 0.35 | | | | 0.01 | % |
10. Income tax information and distributions to shareholders
The tax character of distributions paid during the fiscal years ended December 31, was as follows:
| | | | | | | | |
| | | 2019 | | | 2018 | |
| Distributions paid from: | | | | | | | | |
| Ordinary income | | $ | 145,928 | | | $ | 2,008,269 | |
| Net long-term capital gains | | | 34,157,128 | | | | 33,987,954 | |
| Total distributions paid | | $ | 34,303,056 | | | $ | 35,996,223 | |
As of December 31, 2019, the components of distributable earnings (loss) on a tax basis were as follows:
| | | | |
| Undistributed long-term capital gains — net | | $ | 4,420,732 | |
| Other book/tax temporary differences(a) | | | (49,619) | |
| Unrealized appreciation (depreciation)(b) | | | 146,084,313 | |
| Total distributable earnings (loss) — net | | $ | 150,455,426 | |
| | |
| | |
| ClearBridge Variable Small Cap Growth Portfolio 2019 Annual Report | | 31 |
Notes to financial statements (cont’d)
| (a) | Other book/tax temporary differences are attributable to the tax deferral of losses on straddles, and book/tax differences in the timing of the deductibility of various expenses. |
| (b) | The difference between book-basis andtax-basis unrealized appreciation (depreciation) is attributable to the tax deferral of losses on wash sales. |
11. Recent accounting pronouncement
The Portfolio has adopted the disclosure provisions of the Financial Accounting Standards Board Accounting Standards UpdateNo. 2018-13,Fair Value Measurement (Topic 820)—Disclosure Framework—Changes to the Disclosure Requirements for Fair Value Measurement(“ASU2018-13”) which introduces new fair value disclosure requirements as well as eliminates and modifies certain existing fair value disclosure requirements. ASU2018-13 would be effective for fiscal years beginning after December 15, 2019, and interim periods within those fiscal years; however, management has elected to early adopt ASU2018-13. The impact of the Portfolio’s adoption was limited to changes in the Portfolio’s financial statement disclosures regarding fair value, primarily those disclosures related to transfers between levels of the fair value hierarchy.
| | |
| | |
| 32 | | ClearBridge Variable Small Cap Growth Portfolio 2019 Annual Report |
Report of independent registered public accounting firm
To the Board of Trustees of Legg Mason Partners Variable Equity Trust and Shareholders of ClearBridge Variable Small Cap Growth Portfolio
Opinion on the financial statements
We have audited the accompanying statement of assets and liabilities, including the schedule of investments, of ClearBridge Variable Small Cap Growth Portfolio (one of the funds constituting Legg Mason Partners Variable Equity Trust, referred to hereafter as the “Fund”) as of December 31, 2019, the related statement of operations for the year ended December 31, 2019, the statement of changes in net assets for each of the two years in the period ended December 31, 2019, including the related notes, and the financial highlights for each of the three years in the period ended December 31, 2019 (collectively referred to as the “financial statements”). In our opinion, the financial statements present fairly, in all material respects, the financial position of the Fund as of December 31, 2019, the results of its operations for the year then ended, the changes in its net assets for each of the two years in the period ended December 31, 2019 and the financial highlights for each of the three years in the period ended December 31, 2019 in conformity with accounting principles generally accepted in the United States of America.
The financial statements of the Fund as of and for the year ended December 31, 2016 and the financial highlights for each of the periods ended on or prior to December 31, 2016 (not presented herein, other than the financial highlights) were audited by other auditors whose report dated February 16, 2017 expressed an unqualified opinion on those financial statements and financial highlights.
Basis for opinion
These financial statements are the responsibility of the Fund’s management. Our responsibility is to express an opinion on the Fund’s financial statements based on our audits. We are a public accounting firm registered with the Public Company Accounting Oversight Board (United States) (PCAOB) and are required to be independent with respect to the Fund in accordance with the U.S. federal securities laws and the applicable rules and regulations of the Securities and Exchange Commission and the PCAOB.
We conducted our audits of these financial statements in accordance with the standards of the PCAOB. Those standards require that we plan and perform the audit to obtain reasonable assurance about whether the financial statements are free of material misstatement, whether due to error or fraud.
Our audits included performing procedures to assess the risks of material misstatement of the financial statements, whether due to error or fraud, and performing procedures that respond to those risks. Such procedures included examining, on a test basis, evidence regarding the amounts and disclosures in the financial statements. Our audits also included evaluating the accounting principles used and significant estimates made by management, as well as evaluating the overall presentation of the financial statements. Our procedures included confirmation of securities owned as of December 31, 2019 by correspondence with the custodian and brokers; when replies were not received from brokers, we performed other auditing procedures. We believe that our audits provide a reasonable basis for our opinion.
/s/PricewaterhouseCoopers LLP
Baltimore, Maryland
February 14, 2020
We have served as the auditor of one or more investment companies in Legg Mason investment company group since at least 1973. We have not been able to determine the specific year we began serving as auditor.
| | |
| | |
| ClearBridge Variable Small Cap Growth Portfolio 2019 Annual Report | | 33 |
Board approval of management and subadvisory agreements(unaudited)
At a meeting of the Trust’s Board of Trustees, the Board considered there-approval for an annual period of the management agreement of ClearBridge Variable Small Cap Growth Portfolio (the “Fund”), pursuant to which Legg Mason Partners Fund Advisor, LLC (the “Manager”) provides the Fund with investment advisory and administrative services, thesub-advisory agreement pursuant to which ClearBridge Investments, LLC (“ClearBridge”) providesday-to-day management of the Fund’s portfolio, and thesub-advisory agreement pursuant to which Western Asset Management Company, LLC (“Western Asset” and, together with ClearBridge, the“Sub-Advisers”) providesday-to-day management of the Fund’s cash and short-term instruments allocated to it by the Manager. (The management agreement andsub-advisory agreements are collectively referred to as the “Agreements.”) The Manager and theSub-Advisers are wholly-owned subsidiaries of Legg Mason, Inc. The Trustees who are not “interested persons” (as defined in the Investment Company Act of 1940, as amended (the “Independent Trustees”)) of the Fund were assisted in their review by Fund counsel and independent legal counsel and met with independent legal counsel in executive sessions separate from representatives of the Manager and theSub-Advisers. The Independent Trustees requested and received information from the Manager and theSub-Advisers they deemed reasonably necessary for their review of the Agreements and the performance of the Manager and theSub-Advisers. Included was information about the Manager, theSub-Advisers and the Fund’s distributor, as well as the management,sub-advisory and distribution arrangements and services provided to the Fund and other funds overseen by the Board. This information was initially reviewed by a special committee of the Independent Trustees and then by the full Board.
In voting to approve the Agreements, the Independent Trustees considered whether the approval of the Agreements would be in the best interests of the Fund and its shareholders, an evaluation based on several factors including those discussed below.
Nature, extent and quality of the services provided to the fund under the management agreement andsub-advisory agreements
The Board received and considered information regarding the nature, extent and quality of services provided to the Fund by the Manager and theSub-Advisers under the Management Agreement and Sub-Advisory Agreements, respectively, during the past year. The Trustees also considered the Manager’s supervisory activities over theSub-Advisers. In addition, the Independent Trustees received and considered other information regarding the administrative and other services rendered to the Fund and its shareholders by the Manager. The Board noted information received at regular meetings throughout the year related to the services rendered by the Manager in its management of the Fund’s affairs and the Manager’s role in coordinating the activities of theSub-Advisers and the Fund’s other service providers. The Board’s evaluation of the services provided by the Manager and theSub-Advisers took into account the Board’s knowledge and familiarity gained as Trustees of funds in the Legg Mason fund complex, including the scope and quality of the investment
| | |
| | |
| 34 | | ClearBridge Variable Small Cap Growth Portfolio |
management and other capabilities of the Manager and theSub-Advisers and the quality of the Manager’s administrative and other services. The Board observed that the scope of services provided by the Manager had expanded over time as a result of regulatory and other developments, including maintaining and monitoring its own and the Fund’s compliance programs. The Board reviewed information received from the Manager and the Fund’s Chief Compliance Officer regarding the Fund’s compliance policies and procedures established pursuant to Rule38a-1 under the Investment Company Act of 1940, as amended.
The Board reviewed the qualifications, backgrounds and responsibilities of the Fund’s senior personnel and the portfolio management team primarily responsible for theday-to-day portfolio management of the Fund. The Board considered the services provided to the Legg Mason fund complex and the Manager’s commitment to continue to provide effective and efficient investment management and shareholder services. The Board also considered, based on its knowledge of the Manager and the Manager’s affiliates, the financial resources available to the Manager’s parent organization, Legg Mason, Inc.
The Board considered the division of responsibilities among the Manager and theSub-Advisers and the oversight provided by the Manager. The Board also considered the Manager’s and ClearBridge’s brokerage policies and practices, the standards applied in seeking best execution, their policies and practices regarding soft dollars, and the existence of quality controls applicable to brokerage allocation procedures. In addition, management also reported to the Board on, among other things, its business plans, recent organizational changes, portfolio manager compensation plan and policy regarding portfolio managers’ ownership of fund shares.
The Board concluded that, overall, it was satisfied with the nature, extent and quality of services provided (and expected to be provided) under the respective Agreement by the Manager and theSub-Advisers.
Fund performance
The Board received and reviewed performance information for the Fund and for allsmall-cap growth funds underlying variable insurance products (the “Performance Universe”) selected by Broadridge Financial Solutions Inc. (“Broadridge”), an independent provider of investment company data. The Board was provided with a description of the methodology Broadridge used to determine the similarity of the Fund with the funds included in the Performance Universe. The Trustees noted that they also had received and discussed with management at periodic intervals information on the investment performance of the Fund in comparison to similar mutual funds and benchmark performance indices. The information comparing the Fund’s performance to that of the Performance Universe was for theone-, three-, five- andten-year periods ended June 30, 2019. The Fund performed slightly below the median performance of the funds in the Performance Universe for theone-year period,
| | |
| | |
| ClearBridge Variable Small Cap Growth Portfolio | | 35 |
Board approval of management and subadvisory agreements(unaudited) (cont’d)
but performed better than the median performance of the funds in the Performance Universe for the three-, five- andten-year periods and was ranked in the first quintile of the funds in the Performance Universe for the three-year period. The Board reviewed performance information provided by the Manager for periods ended September 30, 2019, which showed that the Fund’s performance was better than the Broadridge category average during the third quarter. The Board also reviewed information prepared by Broadridge comparing the Fund’s annualized total return for the three-year period ended June 30, 2019 in relation to the Fund’s standard deviation to that of the funds in the Performance Universe. The Trustees noted that the Manager and ClearBridge were committed to providing the resources necessary to assist the Fund’s portfolio managers. Based on its review, the Board was satisfied with the Fund’s performance. The Board determined to continue to evaluate the Fund’s performance and directed the Independent Trustees’ performance committee to continue to periodically review Fund performance with the Manager and report to the full Board during periods between Board meetings.
Management fees and expense ratios
The Board reviewed and considered the contractual management fee rate (the “Contractual Management Fee”) payable by the Fund to the Manager in light of the nature, extent and quality of the management andsub-advisory services provided by the Manager and theSub-Advisers, respectively. The Board noted that the Manager, and not the Fund, pays thesub-advisory fees to theSub-Advisers and, accordingly, that the retention of theSub-Advisers does not increase the fees and expenses incurred by the Fund. In addition, the Board also reviewed and considered the actual management fee rate (the “Actual Management Fee”) paid by the Fund over the Fund’s last fiscal year.
The Board also reviewed information regarding the fees the Manager and ClearBridge charged any of their U.S. clients investing primarily in an asset class similar to that of the Fund including, where applicable, institutional separate and commingled accounts and retail managed accounts. The Manager reviewed with the Board the significant differences in the scope of services provided to the Fund and to such other clients, noting that the Fund is provided with regulatory compliance and administrative services, office facilities and Fund officers (including the Fund’s chief financial, chief legal and chief compliance officers), and that the Manager coordinates and oversees the provision of services to the Fund by other fund service providers, including theSub-Advisers. The Board considered the fee comparisons in light of the scope of services required to manage these different types of accounts.
The Board received an analysis of complex-wide management fees provided by the Manager, which, among other things, set out a framework of fees based on asset classes. Management also discussed with the Board the Fund’s distribution arrangements, including how
| | |
| | |
| 36 | | ClearBridge Variable Small Cap Growth Portfolio |
amounts received by the Fund’s distributor are expended, and the fees received and expenses incurred in connection with such arrangements by affiliates of the Manager.
Additionally, the Board received and considered information comparing the Fund’s Contractual Management Fee and Actual Management Fee and the Fund’s overall expense ratio with those of a group of 15small-cap growth funds underlying variable insurance products selected by Broadridge as comparable to the Fund (the “Expense Group”), and a broader group of funds selected by Broadridge consisting of allsmall-cap growth funds underlying variable insurance products (the “Expense Universe”). This information showed that the Fund’s Contractual Management Fee and Actual Management Fee were lower than the median of management fees paid by the funds in the Expense Group and the funds in the Expense Universe, and that the Fund’s total expense ratio was lower than the median of the total expense ratios of the funds in the Expense Group and the funds in the Expense Universe.
Manager profitability
The Board received and considered a profitability analysis of the Manager and its affiliates in providing services to the Fund. The Board also received profitability information with respect to the Legg Mason fund complex as a whole. In addition, the Board received information with respect to the Manager’s allocation methodologies used in preparing this profitability data as well as a report from an outside consultant that had reviewed the Manager’s methodology. The Board noted the profitability percentage ranges determined by appropriate court cases to be reasonable given the services rendered to investment companies. The Board determined that the Manager’s profitability was not excessive in light of the nature, extent and quality of the services provided to the Fund.
Economies of scale
The Board received and considered information regarding whether there have been economies of scale with respect to the management of the Fund as the Fund’s assets grow, whether the Fund has appropriately benefited from any economies of scale, and whether there is potential for realization of any further economies of scale. The Board considered whether economies of scale in the provision of services to the Fund were being passed along to the shareholders.
The Board noted that to the extent the Fund’s assets increase over time, the Fund and its shareholders should realize economies of scale as certain expenses, such as fixed fund fees, become a smaller percentage of overall assets. The Board noted that it appeared that the benefits of any economies of scale also would be appropriately shared with shareholders through increased investment in fund management and administration resources.
| | |
| | |
| ClearBridge Variable Small Cap Growth Portfolio | | 37 |
Board approval of management and subadvisory agreements(unaudited) (cont’d)
Taking all of the above into consideration, the Board determined that the management fee was reasonable in light of the comparative performance and expense information and the nature, extent and quality of the services provided to the Fund under the Agreements.
Other benefits to the manager
The Board considered other benefits received by the Manager and its affiliates, including theSub-Advisers, as a result of the Manager’s relationship with the Fund, including the opportunity to offer additional products and services such as 529 College Savings Plans and retail managed accounts.
In light of the costs of providing investment management and other services to the Fund and the Manager’s ongoing commitment to the Fund, the profits and other ancillary benefits that the Manager and its affiliates received were considered reasonable.
Based on their discussions and considerations, including those described above, the Trustees approved the Management Agreement and theSub-Advisory Agreements to continue for another year.
No single factor reviewed by the Board was identified by the Board as the principal factor in determining whether to approve the Management Agreement and theSub-Advisory Agreements.
| | |
| | |
| 38 | | ClearBridge Variable Small Cap Growth Portfolio |
Additional information(unaudited)
Information about Trustees and Officers
The business and affairs of ClearBridge Variable Small Cap Growth Portfolio (the “Portfolio”) are conducted by management under the supervision and subject to the direction of its Board of Trustees. The business address of each Trustee is c/o Jane Trust, Legg Mason, 100 International Drive, 11th Floor, Baltimore, Maryland 21202. Information pertaining to the Trustees and officers of the Portfolio is set forth below.
The Statement of Additional Information includes additional information about Trustees and is available, without charge, upon request by calling the Portfolio at1-877-721-1926.
| | |
| Independent Trustees† |
|
| Paul R. Ades |
| |
| Year of birth | | 1940 |
| Position(s) with Trust | | Trustee |
| Term of office1and length of time served2 | | Since 1983 |
| Principal occupation(s) during the past five years | | Paul R. Ades, PLLC (law firm) (since 2000) |
| Number of funds in fund complex overseen by Trustee | | 44 |
| Other board memberships held by Trustee during the past five years | | None |
| |
| Andrew L. Breech | | |
| |
| Year of birth | | 1952 |
| Position(s) with Trust | | Trustee |
| Term of office1and length of time served2 | | Since 1991 |
| Principal occupation(s) during the past five years | | President, Dealer Operating Control Service, Inc. (automotive retail management) (since 1985) |
| Number of funds in fund complex overseen by Trustee | | 44 |
| Other board memberships held by Trustee during the past five years | | None |
| |
| Dwight B. Crane | | |
| |
| Year of birth | | 1937 |
| Position(s) with Trust | | Trustee |
| Term of office1and length of time served2 | | Since 1981 |
| Principal occupation(s) during the past five years | | Professor Emeritus, Harvard Business School (since 2007); formerly, Professor, Harvard Business School (1969 to 2007); Independent Consultant (since 1969) |
| Number of funds in fund complex overseen by Trustee | | 44 |
| Other board memberships held by Trustee during the past five years | | None |
| | |
| | |
| ClearBridge Variable Small Cap Growth Portfolio | | 39 |
Additional information(unaudited) (cont’d)
Information about Trustees and Officers
| | |
| Independent Trustees†(cont’d) |
|
| Althea L. Duersten |
| |
| Year of birth | | 1951 |
| Position(s) with Trust | | Trustee |
| Term of office1and length of time served2 | | Since 2014 |
| Principal occupation(s) during the past five years | | Retired (since 2011); formerly, Chief Investment Officer, North America, JPMorgan Chase (investment bank) and member of JPMorgan Executive Committee (2007 to 2011) |
| Number of funds in fund complex overseen by Trustee | | 44 |
| Other board memberships held by Trustee during the past five years | | Non-Executive Director, Rokos Capital Management LLP (since 2019) |
| |
| Stephen R. Gross* | | |
| Year of birth | | 1947 |
| Position(s) with Trust | | Trustee |
| Term of office1and length of time served2 | | Since 1986 |
| Principal occupation(s) during the past five years | | Chairman Emeritus (since 2011) and formerly, Chairman, HLB Gross Collins, P.C. (accounting and consulting firm) (1979 to 2011); Executive Director of Business Builders Team, LLC (since 2005); Principal, Gross Consulting Group, LLC (since 2011); CEO, Gross Capital Partners, LLC (since 2014); CEO, Trusted CFO Solutions, LLC (since 2011) |
| Number of funds in fund complex overseen by Trustee | | 44 |
| Other board memberships held by Trustee during the past five years | | None |
| |
| Susan M. Heilbron* | | |
| Year of birth | | 1945 |
| Position(s) with Trust | | Trustee |
| Term of office1and length of time served2 | | Since 1991 |
| Principal occupation(s) during the past five years | | Retired; formerly, President, Lacey & Heilbron (communications consulting) (1990 to 2002); General Counsel and Executive Vice President, The Trump Organization (1986 to 1990); Senior Vice President, New York State Urban Development Corporation (1984 to 1986); Associate, Cravath, Swaine & Moore LLP (1980 to 1984) and (1977 to 1979) |
| Number of funds in fund complex overseen by Trustee | | 44 |
| Other board memberships held by Trustee during the past five years | | Formerly, Director, Lincoln Savings Bank, FSB (1991 to 1994); Director, Trump Shuttle, Inc. (air transportation) (1989 to 1990); Director, Alexander’s Inc. (department store) (1987 to 1990) |
| | |
| | |
| 40 | | ClearBridge Variable Small Cap Growth Portfolio |
| | |
| Independent Trustees†(cont’d) |
|
| Frank G. Hubbard |
| Year of birth | | 1937 |
| Position(s) with Trust | | Trustee |
| Term of office1and length of time served2 | | Since 1993 |
| Principal occupation(s) during the past five years | | President, Fealds, Inc. (business development) (since 2016); formerly, President, Avatar International Inc. (business development) (1998 to 2015) |
| Number of funds in fund complex overseen by Trustee | | 44 |
| Other board memberships held by Trustee during the past five years | | None |
| |
| Howard J. Johnson | | |
| Year of birth | | 1938 |
| Position(s) with Trust | | Trustee and Chairman |
| Term of office1and length of time served2 | | From 1981 to 1998 and since 2000 (Chairman since 2013) |
| Principal occupation(s) during the past five years | | Retired; formerly, Chief Executive Officer, Genesis Imaging LLC (technology company) (2003 to 2012) |
| Number of funds in fund complex overseen by Trustee | | 44 |
| Other board memberships held by Trustee during the past five years | | None |
| |
| Jerome H. Miller | | |
| Year of birth | | 1938 |
| Position(s) with Trust | | Trustee |
| Term of office1and length of time served2 | | Since 1995 |
| Principal occupation(s) during the past five years | | Retired; formerly, Vice Chairman, Shearson Lehman Hutton Inc. (1989 to 1992) and Senior Executive Vice President, E.F. Hutton Group Inc. (1986 to 1989) |
| Number of funds in fund complex overseen by Trustee | | 44 |
| Other board memberships held by Trustee during the past five years | | None |
| |
| Ken Miller | | |
| Year of birth | | 1942 |
| Position(s) with Trust | | Trustee |
| Term of office1and length of time served2 | | Since 1983 |
| Principal occupation(s) during the past five years | | Retired; formerly, President, Young Stuff Apparel Group, Inc. (apparel manufacturer), division of Li & Fung (1963 to 2012) |
| Number of funds in fund complex overseen by Trustee | | 44 |
| Other board memberships held by Trustee during the past five years | | None |
| | |
| | |
| ClearBridge Variable Small Cap Growth Portfolio | | 41 |
Additional information(unaudited) (cont’d)
Information about Trustees and Officers
| | |
| Independent Trustees†(cont’d) |
|
| Thomas F. Schlafly |
| |
| Year of birth | | 1948 |
| Position(s) with Trust | | Trustee |
| Term of office1and length of time served2 | | Since 1983 |
| Principal occupation(s) during the past five years | | Chairman, The Saint Louis Brewery, LLC (brewery) (since 2012); formerly, President, The Saint Louis Brewery, Inc. (1989 to 2012); Senior Counsel (since 2017) and formerly, Partner (2009 to 2016), Thompson Coburn LLP (law firm) |
| Number of funds in fund complex overseen by Trustee | | 44 |
| Other board memberships held by Trustee during the past five years | | Director, Citizens National Bank of Greater St. Louis (since 2006) |
| | |
| Interested Trustee and Officer |
| |
| Jane Trust, CFA3 | | |
| Year of birth | | 1962 |
| Position(s) with Trust | | Trustee, President and Chief Executive Officer |
| Term of office1and length of time served2 | | Since 2015 |
| Principal occupation(s) during the past five years | | Senior Managing Director of Legg Mason & Co., LLC (“Legg Mason & Co.”) (since 2018); Managing Director of Legg Mason & Co. (2016 to 2018); Officer and/or Trustee/Director of 145 funds associated with Legg Mason Partners Fund Advisor, LLC (“LMPFA”) or its affiliates (since 2015); President and Chief Executive Officer of LMPFA (since 2015); formerly, Senior Vice President of LMPFA (2015); Director of ClearBridge, LLC (formerly, Legg Mason Capital Management, LLC) (2007 to 2014); Managing Director of Legg Mason Investment Counsel & Trust Co. (2000 to 2007) |
| Number of funds in fund complex overseen by Trustee | | 142 |
| Other board memberships held by Trustee during the past five years | | None |
| | |
| Additional Officers | | |
|
Ted P. Becker
Legg Mason 620 Eighth Avenue, 49th Floor, New York, NY 10018 |
| Year of birth | | 1951 |
| Position(s) with Trust | | Chief Compliance Officer |
| Term of office1and length of time served2 | | Since 2007 |
| Principal occupation(s) during the past five years | | Director of Global Compliance at Legg Mason, Inc. (since 2006); Chief Compliance Officer of LMPFA (since 2006); Managing Director of Compliance of Legg Mason & Co. (since 2005); Chief Compliance Officer of certain mutual funds associated with Legg Mason & Co. or its affiliates (since 2006) |
| | |
| | |
| 42 | | ClearBridge Variable Small Cap Growth Portfolio |
| | |
| Additional Officers (cont’d) | | |
| |
Susan Kerr
Legg Mason 620 Eighth Avenue, 49th Floor, New York, NY 10018 | | |
| Year of birth | | 1949 |
| Position(s) with Trust | | Chief Anti-Money Laundering Compliance Officer |
| Term of office1and length of time served2 | | Since 2013 |
| Principal occupation(s) during the past five years | | Assistant Vice President of Legg Mason & Co. and Legg Mason Investor Services, LLC (“LMIS”) (since 2010); Chief Anti-Money Laundering Compliance Officer of certain mutual funds associated with Legg Mason & Co. or its affiliates (since 2013) and Anti-Money Laundering Compliance Officer of LMIS (since 2012); Senior Compliance Officer of LMIS (since 2011); formerly, AML Consultant, DTCC (2010); AML Consultant, Rabobank Netherlands, (2009); First Vice President, Director of Marketing & Advertising Compliance and Manager of Communications Review Group at Citigroup Inc. (1996 to 2008) |
| |
Jenna Bailey Legg Mason 100 First Stamford Place, 5th Floor, Stamford, CT 06902 | | |
| Year of birth | | 1978 |
| Position(s) with Trust | | Identity Theft Prevention Officer |
| Term of office1and length of time served2 | | Since 2015 |
| Principal occupation(s) during the past five years | | Identity Theft Prevention Officer of certain mutual funds associated with Legg Mason & Co. or its affiliates (since 2015); Compliance Officer of Legg Mason & Co. (since 2013); Assistant Vice President of Legg Mason & Co. (since 2011); formerly, Associate Compliance Officer of Legg Mason & Co. (2011 to 2013) |
| |
Robert I. Frenkel
Legg Mason 100 First Stamford Place, 6th Floor, Stamford, CT 06902 | | |
| Year of birth | | 1954 |
| Position(s) with Trust | | Secretary and Chief Legal Officer |
| Term of office1and length of time served2 | | Since 2007 |
| Principal occupation(s) during the past five years | | Vice President and Deputy General Counsel of Legg Mason, Inc. (since 2006); Managing Director and General Counsel — U.S. Mutual Funds for Legg Mason & Co. (since 2006) and Legg Mason & Co. predecessors (since 1994); Secretary and Chief Legal Officer of certain mutual funds associated with Legg Mason & Co. or its affiliates (since 2006) and Legg Mason & Co. predecessors (prior to 2006) |
| | |
| | |
| ClearBridge Variable Small Cap Growth Portfolio | | 43 |
Additional information(unaudited) (cont’d)
Information about Trustees and Officers
| | |
| Additional Officers (cont’d) | | |
| |
Thomas C. Mandia
Legg Mason 100 First Stamford Place, 6th Floor, Stamford, CT 06902 | | |
| Year of birth | | 1962 |
| Position(s) with Trust | | Assistant Secretary |
| Term of office1and length of time served2 | | Since 2007 |
| Principal occupation(s) during the past five years | | Managing Director and Deputy General Counsel of Legg Mason & Co. (since 2005) and Legg Mason & Co. predecessors (prior to 2005); Secretary of LMPFA (since 2006); Assistant Secretary of certain mutual funds associated with Legg Mason & Co. or its affiliates (since 2006) and Legg Mason & Co. predecessors (prior to 2006); Secretary of LM Asset Services, LLC (“LMAS”) (since 2002) and Legg Mason Fund Asset Management, Inc. (“LMFAM”) (since 2013) (formerly registered investment advisers) |
| |
Christopher Berarducci**
Legg Mason 620 Eighth Avenue, 49th Floor, New York, NY 10018 | | |
| Year of birth | | 1974 |
| Position(s) with Trust | | Treasurer and Principal Financial Officer |
| Term of office1and length of time served2 | | Since 2014 and 2019 |
| Principal occupation(s) during the past five years | | Treasurer (since 2010) and Principal Financial Officer (since 2019) of certain mutual funds associated with Legg Mason & Co. or its affiliates; Director of Legg Mason & Co. (since 2015); formerly, Vice President of Legg Mason & Co. (2011 to 2015); Assistant Controller of certain mutual funds associated with Legg Mason & Co. or its affiliates (prior to 2010) |
| |
Jeanne M. Kelly
Legg Mason 620 Eighth Avenue, 49th Floor, New York, NY 10018 | | |
| Year of birth | | 1951 |
| Position(s) with Trust | | Senior Vice President |
| Term of office1and length of time served2 | | Since 2007 |
| Principal occupation(s) during the past five years | | Senior Vice President of certain mutual funds associated with Legg Mason & Co. or its affiliates (since 2007); Senior Vice President of LMPFA (since 2006); President and Chief Executive Officer of LMAS and LMFAM (since 2015); Managing Director of Legg Mason & Co. (since 2005) and Legg Mason & Co. predecessors (prior to 2005); formerly, Senior Vice President of LMFAM (2013 to 2015) |
| † | Trustees who are not “interested persons” of the Portfolio within the meaning of Section 2(a)(19) of the Investment Company Act of 1940, as amended (the “1940 Act”). |
| * | Effective February 6, 2019, Mr. Gross and Ms. Heilbron became Trustees. |
| ** | Effective September 27, 2019, Mr. Berarducci became Treasurer and Principal Financial Officer. |
| | |
| | |
| 44 | | ClearBridge Variable Small Cap Growth Portfolio |
| 1 | Each Trustee and officer serves until his or her respective successor has been duly elected and qualified or until his or her earlier death, resignation, retirement or removal. |
| 2 | Indicates the earliest year in which the Trustee became a board member for a fund in the Legg Mason fund complex or the officer took such office. |
| 3 | Ms. Trust is an “interested person” of the Portfolio, as defined in the 1940 Act, because of her position with LMPFA and/or certain of its affiliates. |
| | |
| | |
| ClearBridge Variable Small Cap Growth Portfolio | | 45 |
Important tax information(unaudited)
The following information is provided with respect to the distributions paid during the taxable year ended December 31, 2019:
| | | | | | | | |
| Record date: | | | 6/19/2019 | | | | 12/12/2019 | |
| Payable date: | | | 6/20/2019 | | | | 12/13/2019 | |
| Ordinary income: | | | | | | | | |
Dividends qualifying for the dividends | | | | | | | | |
received deduction for corporations | | | 61.41 | % | | | — | |
| Long-term capital gain dividend | | | $0.664830 | | | | $2.022140 | |
| | |
| | |
| 46 | | ClearBridge Variable Small Cap Growth Portfolio |
ClearBridge
Variable Small Cap Growth Portfolio
Trustees
Paul R. Ades
Andrew L. Breech
Dwight B. Crane
Althea L. Duersten
Stephen R. Gross*
Susan M. Heilbron*
Frank G. Hubbard
Howard J. Johnson
Chairman
Jerome H. Miller
Ken Miller
Thomas F. Schlafly
Jane Trust
| * | Effective February 6, 2019, Mr. Gross and Ms. Heilbron became Trustees. |
Investment manager
Legg Mason Partners Fund Advisor, LLC
Subadviser
ClearBridge Investments, LLC
Distributor
Legg Mason Investor Services, LLC
Custodian
The Bank of New York Mellon
Transfer agent
BNY Mellon Investment Servicing (US) Inc.
4400 Computer Drive
Westborough, MA 01581
Independent registered public accounting firm
PricewaterhouseCoopers LLP
Baltimore, MD
ClearBridge Variable Small Cap Growth Portfolio
The Portfolio is a separate investment series of Legg Mason Partners Variable Equity Trust, a Maryland statutory trust.
ClearBridge Variable Small Cap Growth Portfolio
Legg Mason Funds
620 Eighth Avenue, 49th Floor
New York, NY 10018
The Portfolio files its complete schedule of portfolio holdings with the Securities and Exchange Commission (“SEC”) for the first and third quarters of each fiscal year as an exhibit to its reports on FormN-PORT. The Portfolio’s FormsN-PORT are available on the SEC’s website at www.sec.gov. To obtain information on FormN-PORT, shareholders can call the Portfolio at1-877-721-1926.
Information on how the Portfolio voted proxies relating to portfolio securities during the prior12-month period ended June 30th of each year and a description of the policies and procedures that the Portfolio uses to determine how to vote proxies related to portfolio transactions are available (1) without charge, upon request, by calling the Portfolio at1-877-721-1926, (2) at www.leggmason.com/variablefunds and (3) on the SEC’s website at www.sec.gov.
This report is submitted for the general information of the shareholders of ClearBridge Variable Small Cap Growth Portfolio. This report is not authorized for distribution to prospective investors in the Portfolio unless preceded or accompanied by a current prospectus.
Investors should consider the Portfolio’s investment objectives, risks, charges and expenses carefully before investing. The prospectus contains this and other important information about the Portfolio. Please read the prospectus carefully before investing.
www.leggmason.com
© 2020 Legg Mason Investor Services, LLC
Member FINRA, SIPC
Legg Mason Funds Privacy and Security Notice
Your Privacy and the Security of Your Personal Information is Very Important to the Legg Mason Funds
This Privacy and Security Notice (the “Privacy Notice”) addresses the Legg Mason Funds’ privacy and data protection practices with respect to nonpublic personal information the Funds receive. The Legg Mason Funds include any funds sold by the Funds’ distributor, Legg Mason Investor Services, LLC, as well as Legg Mason-sponsoredclosed-end funds. The provisions of this Privacy Notice apply to your information both while you are a shareholder and after you are no longer invested with the Funds.
The Type of Nonpublic Personal Information the Funds Collect About You
The Funds collect and maintain nonpublic personal information about you in connection with your shareholder account. Such information may include, but is not limited to:
| • | | Personal information included on applications or other forms; |
| • | | Account balances, transactions, and mutual fund holdings and positions; |
| • | | Bank account information, legal documents, and identity verification documentation; |
| • | | Online account access user IDs, passwords, security challenge question responses; and |
| • | | Information received from consumer reporting agencies regarding credit history and creditworthiness (such as the amount of an individual’s total debt, payment history, etc.). |
How the Funds Use Nonpublic Personal Information About You
The Funds do not sell or share your nonpublic personal information with third parties or with affiliates for their marketing purposes, or with other financial institutions or affiliates for joint marketing purposes, unless you have authorized the Funds to do so. The Funds do not disclose any nonpublic personal information about you except as may be required to perform transactions or services you have authorized or as permitted or required by law. The Funds may disclose information about you to:
| • | | Employees, agents, and affiliates on a “need to know” basis to enable the Funds to conduct ordinary business or to comply with obligations to government regulators; |
| • | | Service providers, including the Funds’ affiliates, who assist the Funds as part of the ordinary course of business (such as printing, mailing services, or processing or servicing your account with us) or otherwise perform services on the Funds’ behalf, including companies that may perform statistical analysis, market research and marketing services solely for the Funds; |
| • | | Permit access to transfer, whether in the United States or countries outside of the United States to such Funds’ employees, agents and affiliates and service providers as required to enable the Funds to conduct ordinary business, or to comply with obligations to government regulators; |
| • | | The Funds’ representatives such as legal counsel, accountants and auditors to enable the Funds to conduct ordinary business, or to comply with obligations to government regulators; |
| • | | Fiduciaries or representatives acting on your behalf, such as an IRA custodian or trustee of a grantor trust. |
|
| NOT PART OF THE ANNUAL REPORT |
Legg Mason Funds Privacy and Security Notice (cont’d)
Except as otherwise permitted by applicable law, companies acting on the Funds’ behalf, including those outside the United States, are contractually obligated to keep nonpublic personal information the Funds provide to them confidential and to use the information the Funds share only to provide the services the Funds ask them to perform.
The Funds may disclose nonpublic personal information about you when necessary to enforce their rights or protect against fraud, or as permitted or required by applicable law, such as in connection with a law enforcement or regulatory request, subpoena, or similar legal process. In the event of a corporate action or in the event a Fund service provider changes, the Funds may be required to disclose your nonpublic personal information to third parties. While it is the Funds’ practice to obtain protections for disclosed information in these types of transactions, the Funds cannot guarantee their privacy policy will remain unchanged.
Keeping You Informed of the Funds’ Privacy and Security Practices
The Funds will notify you annually of their privacy policy as required by federal law. While the Funds reserve the right to modify this policy at any time they will notify you promptly if this privacy policy changes.
The Funds’ Security Practices
The Funds maintain appropriate physical, electronic and procedural safeguards designed to guard your nonpublic personal information. The Funds’ internal data security policies restrict access to your nonpublic personal information to authorized employees, who may use your nonpublic personal information for Fund business purposes only.
Although the Funds strive to protect your nonpublic personal information, they cannot ensure or warrant the security of any information you provide or transmit to them, and you do so at your own risk. In the event of a breach of the confidentiality or security of your nonpublic personal information, the Funds will attempt to notify you as necessary so you can take appropriate protective steps. If you have consented to the Funds using electronic communications or electronic delivery of statements, they may notify you under such circumstances using the most current email address you have on record with them.
In order for the Funds to provide effective service to you, keeping your account information accurate is very important. If you believe that your account information is incomplete, not accurate or not current, if you have questions about the Funds’ privacy practices, or our use of your nonpublic personal information, write the Funds using the contact information on your account statements, email the Funds by clicking on the Contact Us section of the Funds’ website at www.leggmason.com, or contact the Funds at1-877-721-1926.
Revised April 2018
|
| NOT PART OF THE ANNUAL REPORT |
www.leggmason.com
© 2020 Legg Mason Investor Services, LLC Member FINRA, SIPC
FD04119 2/20 SR20-3805
The registrant has adopted a code of ethics that applies to the registrant’s principal executive officer, principal financial officer, principal accounting officer or controller.
| ITEM 3. | AUDIT COMMITTEE FINANCIAL EXPERT. |
The Board of Trustees of the registrant has determined that Dwight B. Crane, possess the technical attributes identified in Instruction 2(b) of Item 3 to FormN-CSR to qualify as “audit committee financial experts,” and have designated Dwight B. Crane as the Audit Committee’s financial experts. Dwight B. Crane is an “independent” Trustees pursuant to paragraph (a) (2) of Item 3 to FormN-CSR.
| ITEM 4. | PRINCIPAL ACCOUNTANT FEES AND SERVICES. |
a)Audit Fees. The aggregate fees billed in the last two fiscal years ending December 31, 2018 and December 31, 2019 (the “Reporting Periods”) for professional services rendered by the Registrant’s principal accountant (the “Auditor”) for the audit of the Registrant’s annual financial statements, or services that are normally provided by the Auditor in connection with the statutory and regulatory filings or engagements for the Reporting Periods, were $537,805 in December 31, 2018 and $296,402 in December 31, 2019.
b)Audit-Related Fees. The aggregate fees billed in the Reporting Period for assurance and related services by the Auditor that are reasonably related to the performance of the Registrant’s financial statements were $0 in December 31, 2018 and $0 in December 31, 2019.
(c)Tax Fees. The aggregate fees billed in the Reporting Periods for professional services rendered by the Auditor for tax compliance, tax advice and tax planning (“Tax Services”) were $0 in December 31, 2018 and $0 in December 31, 2019. These services consisted of (i) review or preparation of U.S. federal, state, local and excise tax returns; (ii) U.S. federal, state and local tax planning, advice and assistance regarding statutory, regulatory or administrative developments, and (iii) tax advice regarding tax qualification matters and/or treatment of various financial instruments held or proposed to be acquired or held.
There were no fees billed for tax services by the Auditors to service affiliates during the Reporting Periods that requiredpre-approval by the Audit Committee.
d)All Other Fees. The aggregate fees billed in the Reporting Periods for products and services provided by the Auditor, other than the services reported in paragraphs (a) through (c) for the Item 4 for the Legg Mason Partners Variable Equity Trust., were $33,000 in December 31, 2018 and $0 in December 31, 2019
All Other Fees. There were no othernon-audit services rendered by the Auditor to Legg Mason Partners Fund Advisors, LLC (“LMPFA”), and any entity controlling, controlled by or under common control with LMPFA that provided ongoing services to Legg Mason Partners Variable Equity Trust requiringpre-approval by the Audit Committee in the Reporting Period.
(e) Audit Committee’s pre–approval policies and procedures described in paragraph (c) (7) of Rule2-01 of RegulationS-X.
(1) The Charter for the Audit Committee (the “Committee”) of the Board of each registered investment company (the “Fund”) advised by LMPFA or one of their affiliates (each, an “Adviser”) requires that the Committee shall approve (a) all audit and permissiblenon-audit services to be provided to the Fund and (b) all permissiblenon-audit services to be provided by the Fund’s independent auditors to the Adviser and any Covered Service Providers if the engagement relates directly to the operations and financial reporting of the Fund. The Committee may implement policies and procedures by which such services are approved other than by the full Committee.
The Committee shall not approvenon-audit services that the Committee believes may impair the independence of the auditors. As of the date of the approval of this Audit Committee Charter, permissiblenon-audit services include any professional services (including tax services), that are not prohibited services as described below, provided to the Fund by the independent auditors, other than those provided to the Fund in connection with an audit or a review of the financial statements of the Fund. Permissiblenon-audit services may not include: (i) bookkeeping or other services related to the accounting records or financial statements of the Fund; (ii) financial information systems design and implementation; (iii) appraisal or valuation services, fairness opinions orcontribution-in-kind reports; (iv) actuarial services; (v) internal audit outsourcing services; (vi) management functions or human resources; (vii) broker or dealer, investment adviser or investment banking services; (viii) legal services and expert services unrelated to the audit; and (ix) any other service the Public Company Accounting Oversight Board determines, by regulation, is impermissible.
Pre-approval by the Committee of any permissiblenon-audit services is not required so long as: (i) the aggregate amount of all such permissiblenon-audit services provided to the Fund, the Adviser and any service providers controlling, controlled by or under common control with the Adviser that provide ongoing services to the Fund (“Covered Service Providers”) constitutes not more than 5% of the total amount of revenues paid to the independent auditors during the fiscal year in which the permissiblenon-audit services are provided to (a) the Fund, (b) the Adviser and (c) any entity controlling, controlled by or under common control with the Adviser that provides ongoing services to the Fund during the fiscal year in which the services are provided that would have to be approved by the Committee; (ii) the permissiblenon-audit services were not recognized by the Fund at the time of the engagement to benon-audit services; and (iii) such services are promptly brought to the attention of the Committee and approved by the Committee (or its delegate(s)) prior to the completion of the audit.
(2) For the Legg Mason Partners Variable Equity Trust, the percentage of fees that were approved by the audit committee, with respect to: Audit-Related Fees were 100% and 100% for December 31, 2018 and December 31, 2019; Tax Fees were 100% and 100% for December 31, 2018 and December 31, 2019; and Other Fees were 100% and 100% for December 31, 2018 and December 31, 2019.
(f) N/A
(g)Non-audit fees billed by the Auditor for services rendered to Legg Mason Partners Variable Equity Trust, LMPFA and any entity controlling, controlled by, or under common control with LMPFA that provides ongoing services to Legg Mason Partners Variable Equity Trust during the reporting period were $678,000 in December 31, 2018 and $544,232 in December 31, 2019.
(h) Yes. Legg Mason Partners Variable Equity Trust’s Audit Committee has considered whether the provision ofnon-audit services that were rendered to Service Affiliates, which were notpre-approved (not requiringpre-approval), is compatible with maintaining the Accountant’s independence. All services provided by the Auditor to the Legg Mason Partners Variable Equity Trust or to Service Affiliates, which were required to bepre-approved, werepre-approved as required.
| ITEM 5. | AUDIT COMMITTEE OF LISTED REGISTRANTS. |
| | a) | The independent board members are acting as the registrant’s audit committee as specified in Section 3(a)(58)(B) of the Exchange Act. The Audit Committee consists of the following Board members: |
Paul R. Ades
Andrew L. Breech
Dwight B. Crane
Althea L. Duersten
Stephen R. Gross*
Susan M. Heilbron*
Frank G. Hubbard
Howard J. Johnson
Jerome H. Miller
Ken Miller
Thomas F. Schlafly
* Effective February 6, 2019, Mr. Gross and Ms. Heilbron became Trustees.
| ITEM 6. | SCHEDULE OF INVESTMENTS. |
Included herein under Item 1.
| ITEM 7. | DISCLOSURE OF PROXY VOTING POLICIES AND PROCEDURES FORCLOSED-END MANAGEMENT INVESTMENT COMPANIES. |
Not applicable.
| ITEM 8. | PORTFOLIO MANAGERS OFCLOSED-END MANAGEMENT INVESTMENT COMPANIES. |
Not applicable.
| ITEM 9. | PURCHASES OF EQUITY SECURITIES BYCLOSED-END MANAGEMENT INVESTMENT COMPANY AND AFFILIATED PURCHASERS. |
Not applicable.
| ITEM 10. | SUBMISSION OF MATTERS TO A VOTE OF SECURITY HOLDERS. |
Not applicable.
| ITEM 11. | CONTROLS AND PROCEDURES. |
| | (a) | The registrant’s principal executive officer and principal financial officer have concluded that the registrant’s disclosure controls and procedures (as defined in Rule30a- 3(c) under the Investment Company Act of 1940, as amended (the “1940 Act”)) are effective as of a date within 90 days of the filing date of this report that includes the disclosure required by this paragraph, based on their evaluation of the disclosure controls and procedures required by Rule30a-3(b) under the 1940 Act and15d-15(b) under the Securities Exchange Act of 1934. |
| | (b) | There were no changes in the registrant’s internal control over financial reporting (as defined in Rule30a-3(d) under the 1940 Act) that occurred during the second fiscal quarter of the period covered by this report that have materially affected, or are likely to materially affect the registrant’s internal control over financial reporting. |
| ITEM 12. | DISCLOSURE OF SECURITIES LENDING ACTIVITIES FORCLOSED-END MANAGEMENT INVESTMENT COMPANIES. |
Not applicable.
(a) (1) Code of Ethics attached hereto.
Exhibit 99.CODE ETH
(a) (2) Certifications pursuant to section 302 of the Sarbanes-Oxley Act of 2002 attached hereto.
Exhibit 99.CERT
(b) Certifications pursuant to Section 906 of the Sarbanes-Oxley Act of 2002 attached hereto.
Exhibit 99.906CERT
SIGNATURES
Pursuant to the requirements of the Securities Exchange Act of 1934 and the Investment Company Act of 1940, the registrant has duly caused this Report to be signed on its behalf by the undersigned, there unto duly authorized.
| | |
| Legg Mason Partners Variable Equity Trust |
| |
| By: | | /s/ Jane Trust |
| | Jane Trust |
| | Chief Executive Officer |
| |
| Date: | | February 26, 2020 |
Pursuant to the requirements of the Securities Exchange Act of 1934 and the Investment Company Act of 1940, this report has been signed below by the following persons on behalf of the registrant and in the capacities and on the dates indicated.
| | |
| By: | | /s/ Jane Trust |
| | Jane Trust |
| | Chief Executive Officer |
| |
| Date: | | February 26, 2020 |
| |
| By: | | /s/ Christopher Berarducci |
| | Christopher Berarducci |
| | Principal Financial Officer |
| |
| Date: | | February 26, 2020 |