UNITED STATES
SECURITIES AND EXCHANGE COMMISSION
Washington, D.C. 20549
FORM N-CSR
CERTIFIED SHAREHOLDER REPORT OF REGISTERED
MANAGEMENT INVESTMENT COMPANIES
Investment Company Act file number 811-21128
Legg Mason Partners Variable Equity Trust
(Exact name of registrant as specified in charter)
620 Eighth Avenue, 47th Floor, New York, NY 10018
(Address of principal executive offices) (Zip code)
Marc A. De Oliveira.
Franklin Templeton
100 First Stamford Place
Stamford, CT 06902
(Name and address of agent for service)
Registrant’s telephone number, including area code: 1-877-721-1926
Date of fiscal year end: December 31
Date of reporting period: December 31, 2020
| ITEM 1. | REPORT TO STOCKHOLDERS. |
The Annual Report to Stockholders is filed herewith.

| | |
| Annual Report | | December 31, 2020 |
Legg Mason/QS
Model Portfolio Funds
Legg Mason/QS Aggressive Model Portfolio
Legg Mason/QS Moderately Aggressive Model Portfolio
Legg Mason/QS Moderate Model Portfolio
Legg Mason/QS Moderately Conservative Model Portfolio
Legg Mason/QS Conservative Model Portfolio
Beginning in or after January 2021, as permitted by regulations adopted by the Securities and Exchange Commission, your insurance company may no longer send you paper copies of the Fund’s shareholder reports like this one by mail, unless you specifically request paper copies of the reports from the insurance company or your financial intermediary. Instead, the shareholder reports will be made available on a website, and you will be notified by mail each time a report is posted and provided with a website link to access the report. Instructions for requesting paper copies will be provided by your insurance company.
If you already elected to receive shareholder reports electronically, you will not be affected by this change and you need not take any action. If your insurance company offers electronic delivery, you may elect to receive shareholder reports and other communications from them electronically by following the instructions provided by the insurance company.
You may elect to receive all future reports in paper free of charge. You can inform the insurance company that you wish to continue receiving paper copies of shareholder reports by following the instructions provided by them. Your election will apply to all Funds available under your contract with the insurance company.

|
| INVESTMENT PRODUCTS: NOT FDIC INSURED • NO BANK GUARANTEE • MAY LOSE VALUE |
Legg Mason/QS Model Portfolio Funds
Legg Mason/QS Model Portfolio Funds (“Model Portfolio Funds”) consists of separate investment Portfolios, each with its own investment objective and policies. Each Portfolio is a “fund of funds,” investing in insurance-dedicated mutual funds, and is managed as an asset allocation program.
The Portfolios are separate investment series of Legg Mason Partners Variable Equity Trust, a Maryland statutory trust.
Letter from the president

Dear Shareholder,
We are pleased to provide the annual report of Legg Mason/QS Model Portfolio Funds for the period since the Portfolios’ inception on April 15, 2020 through December 31, 2020. Please read on for a detailed look at prevailing economic and market conditions during the Portfolios’ reporting period and to learn how those conditions have affected each Portfolio’s performance.
As always, we remain committed to providing you with excellent service and a full spectrum of investment choices. We also remain committed to supplementing the support you receive from your financial advisor. One way we accomplish this is through our website, www.leggmason.com. Here you can gain immediate access to market and investment information, including:
| • | | Market insights and commentaries from our portfolio managers, and |
| • | | A host of educational resources. |
We look forward to helping you meet your financial goals.
Sincerely,

Jane Trust, CFA
President and Chief Executive Officer
January 29, 2021
| | |
| | |
| II | | Legg Mason/QS Model Portfolio Funds |
Portfolios overview
Each of the five Legg Mason/QS Model Portfolio Funds is managed as asset allocation program and allocates its assets among insurance-dedicated mutual funds that have been selected by New York Life Insurance and Annuity Corporation (“NYLIAC”) as investment options for use with their variable annuity and variable universal life insurance policies (the “underlying funds”). The underlying funds include funds managed by investment advisers that are not affiliated with Legg Mason and funds managed by Legg Mason affiliated investment advisers. When selecting investments to fulfill a desired asset class exposure, the portfolio managers expect to allocate primarily to underlying funds managed by unaffiliated investment advisers, but may also allocate to Legg Mason-affiliated underlying funds. The underlying funds may change from time to time without prior notice to shareholders.
Q. What were the overall market conditions during the Portfolios’ reporting period?
A. The Portfolios were funded in April 2020. During the second calendar quarter of 2020, global equity markets surged, recovering some of the first quarter’s selloff in the face of COVID-19 and the resulting economic shutdowns. April 2020 was the best month for U.S. stocks since 1987. Many investors cheered plans for the reopening of economies, and government officials continued pledging extraordinary measures to lessen the pandemic’s economic impact. Gold maintained its perceived safe-haven profile despite renewed risk appetite and rose to nearly an eight-year high. Intermediate U.S. Treasury yields fell modestly over the second quarter as shorter- and longer-term yields rose.
Global equity markets continued to rise during the third quarter of 2020. Many investors were encouraged by economic data and accommodative central bank policies. Later in the quarter, sentiment was dampened by concerns about the pace and unevenness of economic recovery, US-China tensions, increasing coronavirus infections, and delays in further U.S. stimulus measures. September 2020 brought a selloff of U.S. technology stocks on worries they were overvalued. To boost economic recovery and job creation, the Federal Reserve Board (the “Fed”)i announced a new policy framework in August 2020, allowing for higher inflation in the short term to achieve its target over a longer-term horizon. The U.S. Treasury yield curveii steepened, with short-term yields moving lower while their longer-term counterparts rose.
Global equity markets advanced nearly across the board for the fourth quarter of 2020. The bulk of gains occurred in November 2020 following positive coronavirus vaccine trials and Joe Biden’s win in the U.S. presidential election. Positive news appeared to outweigh concerns that economic recoveries would stall amid renewed lockdowns resulting from rising coronavirus infection rates and the identification of a new, more infectious COVID-19 strain. Sentiment was buoyed toward the end of the reporting period by the start of vaccinations for essential medical workers in parts of the United States and Europe. The U.S. Treasury yield curve steepened over the quarter with short-term yields moving lower while their longer-term counterparts rose.
Q. How did we respond to these changing market conditions?
A. For all five Portfolios, we employ a quantitative tactical strategy that over- and underweights certain allocations in the Portfolios in response to various market, economic and valuation conditions. These tactical views are updated on a monthly basis. Throughout the reporting period, we were generally overweight equities versus fixed income, as valuation measures and our in-house index of leading economic indicators favored equities. In addition, we were largely overweight U.S. equities versus international equities.
| | |
| | |
| Legg Mason/QS Model Portfolio Funds 2020 Annual Report | | 1 |
Portfolios overview (cont’d)
Legg Mason/QS Aggressive Model Portfolio1
Legg Mason/QS Aggressive Model Portfolio seeks capital appreciation. The Portfolio organizes its investments in underlying funds into two main asset classes: the equity class (equity securities of all types) and the fixed income class (fixed income securities of all types). The portfolio managers may invest across all asset classes and strategies. Under ordinary circumstances, the portfolio managers expect to allocate between 80% to 100% of the Portfolio’s assets among underlying funds that invest in equity and equity-like strategies and between 0% to 20% of the Portfolio’s assets among underlying funds that invest in fixed income strategies. The Portfolio’s allocation to each class will be measured at the time of purchase and may vary thereafter as a result of market movement. The Portfolio compares its performance to a composite benchmark, consisting of 75% Russell 3000 Indexiii, 15% MSCI World Ex-U.S.A. Indexiv, and 10% Bloomberg Barclays U.S. Aggregate Indexv. The portfolio managers will seek to maintain a level of risk in the Portfolio similar to that of this composite benchmark.
Performance review
For the period since inception on April 15, 2020 through December 31, 2020, Class I shares of Legg Mason/QS Aggressive Model Portfolio returned 31.90%. The Portfolio’s unmanaged benchmarks, the Bloomberg Barclays U.S. Aggregate Index and the Russell 3000 Index, and the Aggressive Model Portfolio Composite Benchmarkvi returned 2.58%, 42.21% and 37.10% respectively over the same time frame. The Lipper Variable Mixed-Asset Target Allocation Aggressive Growth Funds Category Averagevii returned 35.69% over the same period.
| | | | | | | | |
Performance Snapshot as of December 31, 2020 (unaudited) | |
| | | 6 months | | | Since Portfolio
Inception* | |
| Legg Mason/QS Aggressive Model Portfolio: | | | | | | | | |
Class I | | | 21.01 | % | | | 31.90 | % |
Class II | | | 20.93 | % | | | 31.70 | % |
| Bloomberg Barclays U.S. Aggregate Index | | | 1.29 | % | | | 2.58 | % |
| Russell 3000 Index | | | 25.24 | % | | | 42.21 | % |
| Aggressive Model Portfolio Composite Benchmark | | | 22.20 | % | | | 37.10 | % |
| Lipper Variable Mixed-Asset Target Allocation Aggressive Growth Funds Category Average | | | 21.54 | % | | | 35.69 | % |
The performance shown represents past performance. Past performance is no guarantee of future results and current performance may be higher or lower than the performance shown above. Principal value and investment returns will fluctuate and investors’ shares, when redeemed, may be worth more or less than their original cost.
All share class returns assume the reinvestment of all distributions at net asset value and the deduction of all Portfolio expenses. Performance figures for periods shorter than one year represent cumulative figures and are not annualized.
Portfolio performance figures reflect fee waivers and/or expense reimbursements, without which the performance would have been lower.
The portfolio managers periodically adjust the allocation of the Portfolio’s assets among funds managed by investment advisers that are not affiliated with Legg Mason and funds managed by Legg Mason affiliated investment advisers, depending upon the portfolio managers’ outlook for the equity and bond markets in general, particular sectors of such markets and the performance outlook for the underlying funds. In assessing the equity and bond markets, the portfolio managers consider a broad range of market and economic trends and quantitative factors.
|
| Total Annual Operating Expenses† (unaudited) |
As of the Portfolio’s current prospectus dated April 14, 2020, the gross total annual fund operating expense ratios for Class I and Class II were 0.94% and 1.19%, respectively.
Actual expenses may be higher. For example, expenses may be higher than those shown if average net assets decrease. Net assets are more likely to decrease and Fund expense ratios are more likely to increase when markets are volatile.
| 1 | The Portfolio is an underlying investment option of various variable annuity and variable life insurance products. The Portfolio’s performance returns do not reflect the deduction of expenses imposed in connection with investing in variable annuity or variable life insurance contracts, such as administrative fees, account charges and surrender charges, which, if reflected, would reduce the performance of the Portfolio. Past performance is no guarantee of future results. |
| * | The Portfolio’s inception date is April 15, 2020. |
| † | Includes expenses of the underlying funds in which the Portfolio invests. |
| | |
| | |
| 2 | | Legg Mason/QS Model Portfolio Funds 2020 Annual Report |
As a result of expense limitation arrangements, the ratio of total annual fund operating expenses, other than interest, brokerage, taxes, extraordinary expenses and acquired fund fees and expenses (fees and expenses of underlying funds), to average net asset will not exceed 0.23% for Class I shares and 0.48% for Class II shares, subject to recapture as described below. These arrangements cannot be terminated prior to December 31, 2022 without the Board of Trustees’ consent.
The manager is permitted to recapture amounts waived and/or reimbursed to a class during the same fiscal year in which the manager earned the fee or incurred the expense if the class’ total annual fund operating expenses have fallen to a level below the limits described above. In no case will the manager recapture any amount that would result, after taking the recapture into account, in the class’ total annual fund operating expenses exceeding the applicable limits described above or any other lower limit then in effect, on any particular business day of the Portfolio.
Q. What were the leading contributors to performance?
A. Taking into account the underlying fund returns and their weightings within the Portfolio, the top contributors to absolute performance came from U.S. equities followed by international equities.
From an asset allocation perspective, an underweight to international equity contributed. Sub-asset class selection contributed within U.S. small-cap and U.S. large-cap growth equities as they outpaced the broader U.S. market. Manager selection effects contributed overall.
Q. What were the leading detractors from performance?
A. Asset allocation effects were effectively neutral during the reporting period, though detracted slightly. Sub-asset class selection overall detracted during the reporting period, as U.S. utilities, U.S. large-cap, and U.S. value-oriented equities underperformed the broader Russell 3000 Index.
Q. Were there any significant changes to the Portfolio during the period?
A. During the fourth quarter of 2020, MainStay VP CBRE Global Infrastructure Portfolio was sold out from the Portfolio. Since this was a small holding, this change did not have a large impact on the other Portfolio holdings or overall Portfolio exposure. In addition, we replaced the MainStay VP Indexed Bond with the Fidelity® VIP Bond Index Portfolio. This did not affect any of the other holdings or allocations of the Portfolio.
| | |
| | |
| Legg Mason/QS Model Portfolio Funds 2020 Annual Report | | 3 |
Portfolios overview (cont’d)
Legg Mason/QS Moderately Aggressive Model Portfolio1
Legg Mason/QS Moderately Aggressive Model Portfolio seeks capital appreciation. The Portfolio organizes its investments in underlying funds into two main asset classes: the equity class (equity securities of all types) and the fixed income class (fixed income securities of all types). The portfolio managers may invest across all asset classes and strategies. Under ordinary circumstances, the portfolio managers expect to allocate between 60% to 70% of the Portfolio’s assets among underlying funds that invest in equity and equity-like strategies and between 30% to 40% of the Portfolio’s assets among underlying funds that invest in fixed income strategies. The Portfolio’s allocation to each class will be measured at the time of purchase and may vary thereafter as a result of market movement. The Portfolio compares its performance to a composite benchmark, consisting of 60% Russell 3000 Index, 10% MSCI World Ex-U.S.A. Index, and 30% Bloomberg Barclays U.S. Aggregate Index. The portfolio managers will seek to maintain a level of risk in the Portfolio similar to that of this composite benchmark.
Performance review
For the period since inception on April 15, 2020 through December 31, 2020, Class I shares of Legg Mason/QS Moderately Aggressive Model Portfolio returned 25.99%. The Portfolio’s unmanaged benchmarks, the Bloomberg Barclays U.S. Aggregate Index and the Russell 3000 Index, and the Moderately Aggressive Model Portfolio Composite Benchmarkviii returned 2.58%, 42.21% and 28.86% respectively over the same time frame. The Lipper Variable Mixed-Asset Target Allocation Growth Funds Category Average ix returned 26.53% over the same period.
| | | | | | | | |
Performance Snapshot as of December 31, 2020 (unaudited) | |
| | | 6 months | | | Since Portfolio
Inception* | |
| Legg Mason/QS Moderately Aggressive Model Portfolio: | | | | | | | | |
Class I | | | 16.55 | % | | | 25.99 | % |
Class II | | | 16.38 | % | | | 25.69 | % |
| Bloomberg Barclays U.S. Aggregate Index | | | 1.29 | % | | | 2.58 | % |
| Russell 3000 Index | | | 25.24 | % | | | 42.21 | % |
| Moderately Aggressive Model Portfolio Composite Benchmark | | | 17.45 | % | | | 28.86 | % |
| Lipper Variable Mixed-Asset Target Allocation Growth Funds Category Average | | | 16.20 | % | | | 26.53 | % |
The performance shown represents past performance. Past performance is no guarantee of future results and current performance may be higher or lower than the performance shown above. Principal value and investment returns will fluctuate and investors’ shares, when redeemed, may be worth more or less than their original cost.
All share class returns assume the reinvestment of all distributions at net asset value and the deduction of all Portfolio expenses. Performance figures for periods shorter than one year represent cumulative figures and are not annualized.
Portfolio performance figures reflect fee waivers and/or expense reimbursements, without which the performance would have been lower.
The portfolio managers periodically adjust the allocation of the Portfolio’s assets among funds managed by investment advisers that are not affiliated with Legg Mason and funds managed by Legg Mason affiliated investment advisers, depending upon the portfolio managers’ outlook for the equity and bond markets in general, particular sectors of such markets and the performance outlook for the underlying funds. In assessing the equity and bond markets, the portfolio managers consider a broad range of market and economic trends and quantitative factors.
|
| Total Annual Operating Expenses† (unaudited) |
As of the Portfolio’s current prospectus dated April 14, 2020, the gross total annual fund operating expense ratios for Class I and Class II were 0.74% and 0.99%, respectively.
| 1 | The Portfolio is an underlying investment option of various variable annuity and variable life insurance products. The Portfolio’s performance returns do not reflect the deduction of expenses imposed in connection with investing in variable annuity or variable life insurance contracts, such as administrative fees, account charges and surrender charges, which, if reflected, would reduce the performance of the Portfolio. Past performance is no guarantee of future results. |
| * | The Portfolio’s inception date is April 15, 2020. |
| † | Includes expenses of the underlying funds in which the Portfolio invests. |
| | |
| | |
| 4 | | Legg Mason/QS Model Portfolio Funds 2020 Annual Report |
Actual expenses may be higher. For example, expenses may be higher than those shown if average net assets decrease. Net assets are more likely to decrease and Portfolio expense ratios are more likely to increase when markets are volatile.
Q. What were the leading contributors to performance?
A. Taking into account the underlying fund returns and their weightings within the Portfolio, the top contributors to absolute performance came from U.S. equities followed by international equities.
Asset allocation effects were positive overall, with an underweight to U.S. fixed income being the top contributor. Sub-asset class selection contributed within U.S. small-cap and U.S. large-cap growth equities as they outpaced the broader U.S. market. Manager selection effects contributed overall.
Q. What were the leading detractors from performance?
A. From an asset allocation perspective, an underweight allocation to U.S. equity detracted from returns, as U.S. equity markets saw strong returns during the reporting period. Sub-asset class selection overall detracted during the reporting period, as international fixed income underperformed the composite benchmark, and U.S. utilities, U.S. large-cap, and U.S. value-oriented equities underperformed the broader Russell 3000 Index.
Q. Were there any significant changes to the Portfolio during the period?
A. During the 4th quarter of 2020, MainStay VP CBRE Global Infrastructure Portfolio was sold out from the Portfolio. Since this was a small holding, this change did not have a large impact on the other Portfolio holdings or overall Portfolio exposure. In addition, we replaced the MainStay VP Indexed Bond Portfolio with the Fidelity® VIP Bond Index Portfolio. This did not affect any of the other holdings or allocations of the Portfolio.
| | |
| | |
| Legg Mason/QS Model Portfolio Funds 2020 Annual Report | | 5 |
Portfolios overview (cont’d)
Legg Mason/QS Moderate Model Portfolio1
Legg Mason/QS Moderate Model Portfolio seeks capital appreciation. The Portfolio organizes its investments in underlying funds into two main asset classes: the equity class (equity securities of all types) and the fixed income class (fixed income securities of all types). The portfolio managers may invest across all asset classes and strategies. Under ordinary circumstances, the portfolio managers expect to allocate between 45% to 65% of the Portfolio’s assets among underlying funds that invest in equity and equity-like strategies and between 35% to 55% of the Portfolio’s assets among underlying funds that invest in fixed income strategies. The Portfolio’s allocation to each class will be measured at the time of purchase and may vary thereafter as a result of market movement. The Portfolio compares its performance to a composite benchmark, consisting of 45% Russell 3000 Index, 10% MSCI World Ex-U.S.A. Index, and 45% Bloomberg Barclays U.S. Aggregate Index. The portfolio managers will seek to maintain a level of risk in the Portfolio similar to that of this composite benchmark.
Performance review
For the period since inception on April 15, 2020 through December 31, 2020, Class I shares of Legg Mason/QS Moderate Model Portfolio returned 19.95%. The Portfolio’s unmanaged benchmarks, the Bloomberg Barclays U.S. Aggregate Index and the Russell 3000 Index, and the Moderate Model Portfolio Composite Benchmarkx returned 2.58%, 42.21% and 22.76% respectively over the same time frame. The Lipper Variable Mixed-Asset Target Allocation Moderate Funds Category Averagexi returned 21.41% over the same period.
| | | | | | | | |
Performance Snapshot as of December 31, 2020 (unaudited) | |
| | | 6 months | | | Since Portfolio
Inception* | |
| Legg Mason/QS Moderate Model Portfolio: | | | | | | | | |
Class I | | | 13.05 | % | | | 19.95 | % |
Class II | | | 12.88 | % | | | 19.65 | % |
| Bloomberg Barclays U.S. Aggregate Index | | | 1.29 | % | | | 2.58 | % |
| Russell 3000 Index | | | 25.24 | % | | | 42.21 | % |
| Moderate Model Portfolio Composite Benchmark | | | 13.82 | % | | | 22.76 | % |
| Lipper Variable Mixed-Asset Target Allocation Moderate Funds Category Average | | | 13.17 | % | | | 21.41 | % |
The performance shown represents past performance. Past performance is no guarantee of future results and current performance may be higher or lower than the performance shown above. Principal value and investment returns will fluctuate and investors’ shares, when redeemed, may be worth more or less than their original cost.
All share class returns assume the reinvestment of all distributions at net asset value and the deduction of all Portfolio expenses. Performance figures for periods shorter than one year represent cumulative figures and are not annualized.
Portfolio performance figures reflect fee waivers and/or expense reimbursements, without which the performance would have been lower.
The portfolio managers periodically adjust the allocation of the Portfolio’s assets among funds managed by investment advisers that are not affiliated with Legg Mason and funds managed by Legg Mason affiliated investment advisers, depending upon the portfolio managers’ outlook for the equity and bond markets in general, particular sectors of such markets and the performance outlook for the underlying funds. In assessing the equity and bond markets, the portfolio managers consider a broad range of market and economic trends and quantitative factors.
|
| Total Annual Operating Expenses† (unaudited) |
As of the Portfolio’s current prospectus dated April 14, 2020, the gross total annual fund operating expense ratios for Class I and Class II were 0.75% and 1.00%, respectively.
| 1 | The Portfolio is an underlying investment option of various variable annuity and variable life insurance products. The Portfolio’s performance returns do not reflect the deduction of expenses imposed in connection with investing in variable annuity or variable life insurance contracts, such as administrative fees, account charges and surrender charges, which, if reflected, would reduce the performance of the Portfolio. Past performance is no guarantee of future results. |
| * | The Portfolio’s inception date is April 15, 2020. |
| † | Includes expenses of the underlying funds in which the Portfolio invests. |
| | |
| | |
| 6 | | Legg Mason/QS Model Portfolio Funds 2020 Annual Report |
Actual expenses may be higher. For example, expenses may be higher than those shown if average net assets decrease. Net assets are more likely to decrease and Portfolio expense ratios are more likely to increase when markets are volatile.
Q. What were the leading contributors to performance?
A. Taking into account the underlying fund returns and their weightings within the Portfolio, the top contributors to absolute performance came from U.S. equities followed by international equities.
Asset allocation effects were positive overall, with an underweight to U.S. fixed income being the top contributor. Sub-asset class selection contributed within U.S. small-cap and U.S. large-cap growth equities as they outpaced the broader U.S. market. Manager selection effects contributed overall.
Q. What were the leading detractors from performance?
A. From an asset allocation perspective, an underweight allocation to international equity detracted from returns, as global equity markets saw strong returns during the reporting period. Sub-asset class selection overall detracted during the reporting period, as international fixed income underperformed the composite benchmark, and U.S. utilities and U.S. large-cap equities underperformed the broader Russell 3000 Index.
Q. Were there any significant changes to the Portfolio during the period?
A. During the 4th quarter of 2020, MainStay VP CBRE Global Infrastructure Portfolio was sold out from the Portfolio. Since this was a small holding, this change did not have a large impact on the other Portfolio holdings or overall Portfolio exposure. In addition, we replaced the MainStay VP Indexed Bond Portfolio with the Fidelity® VIP Bond Index Portfolio. This did not affect any of the other holdings or allocations of the Portfolio.
| | |
| | |
| Legg Mason/QS Model Portfolio Funds 2020 Annual Report | | 7 |
Portfolios overview (cont’d)
Legg Mason/QS Moderately Conservative Model Portfolio1
Leg Mason/QS Moderately Conservative Model Portfolio seeks a balance of capital appreciation and income. The Portfolio organizes its investments in underlying funds into two main asset classes: the equity class (equity securities of all types) and the fixed income class (fixed income securities of all types). The portfolio managers may invest across all asset classes and strategies. Under ordinary circumstances, the portfolio managers expect to allocate between 30% to 50% of the Portfolio’s assets among underlying funds that invest in equity and equity-like strategies and between 50% to 70% of the Portfolio’s assets among underlying funds that invest in fixed income strategies. The Portfolio’s allocation to each class will be measured at the time of purchase and may vary thereafter as a result of market movement. The Portfolio compares its performance to a composite benchmark, consisting of 35% Russell 3000 Index, 5% MSCI World Ex-U.S.A. Index, and 60% Bloomberg Barclays U.S. Aggregate Index. The portfolio managers will seek to maintain a level of risk in the Portfolio similar to that of this composite benchmark.
Performance review
For the period since inception on April 15, 2020 through December 31, 2020, Class I shares of Legg Mason/QS Moderately Conservative Model Portfolio returned 16.43%. The Portfolio’s unmanaged benchmarks, the Bloomberg Barclays U.S. Aggregate Index and the Russell 3000 Index, and the Moderately Conservative Model Portfolio Composite Benchmarkxii returned 2.58%, 42.21% and 17.08% respectively over the same time frame. The Lipper Variable Mixed-Asset Target Allocation Conservative Funds Category Average xiii returned 14.82% over the same period.
| | | | | | | | |
Performance Snapshot as of December 31, 2020 (unaudited) | |
| | | 6 months | | | Since Portfolio
Inception* | |
| Legg Mason/QS Moderately Conservative Model Portfolio: | | | | | | | | |
Class I | | | 10.46 | % | | | 16.43 | % |
Class II | | | 10.46 | % | | | 16.32 | % |
| Bloomberg Barclays U.S. Aggregate Index | | | 1.29 | % | | | 2.58 | % |
| Russell 3000 Index | | | 25.24 | % | | | 42.21 | % |
| Moderately Conservative Model Portfolio Composite Benchmark | | | 10.40 | % | | | 17.08 | % |
| Lipper Variable Mixed-Asset Target Allocation Conservative Funds Category Average | | | 9.06 | % | | | 14.82 | % |
The performance shown represents past performance. Past performance is no guarantee of future results and current performance may be higher or lower than the performance shown above. Principal value and investment returns will fluctuate and investors’ shares, when redeemed, may be worth more or less than their original cost.
All share class returns assume the reinvestment of all distributions at net asset value and the deduction of all Portfolio expenses. Performance figures for periods shorter than one year represent cumulative figures and are not annualized.
Portfolio performance figures reflect fee waivers and/or expense reimbursements, without which the performance would have been lower.
The portfolio managers periodically adjust the allocation of the Portfolio’s assets among funds managed by investment advisers that are not affiliated with Legg Mason and funds managed by Legg Mason affiliated investment advisers, depending upon the portfolio managers’ outlook for the equity and bond markets in general, particular sectors of such markets and the performance outlook for the underlying funds. In assessing the equity and bond markets, the portfolio managers consider a broad range of market and economic trends and quantitative factors.
|
| Total Annual Operating Expenses† (unaudited) |
As of the Portfolio’s current prospectus dated April 14, 2020, the gross total annual fund operating expense ratios for Class I and Class II were 0.82% and 1.07%, respectively.
Actual expenses may be higher. For example, expenses may be higher than those shown if average net assets decrease. Net assets are more likely to decrease and Fund expense ratios are more likely to increase when markets are volatile.
| 1 | The Portfolio is an underlying investment option of various variable annuity and variable life insurance products. The Portfolio’s performance returns do not reflect the deduction of expenses imposed in connection with investing in variable annuity or variable life insurance contracts, such as administrative fees, account charges and surrender charges, which, if reflected, would reduce the performance of the Portfolio. Past performance is no guarantee of future results. |
| * | The Portfolio’s inception date is April 15, 2020. |
| † | Includes expenses of the underlying funds in which the Portfolio invests. |
| | |
| | |
| 8 | | Legg Mason/QS Model Portfolio Funds 2020 Annual Report |
As a result of expense limitation arrangements, the ratio of total annual fund operating expenses, other than interest, brokerage, taxes, extraordinary expenses and acquired fund fees and expenses (fees and expenses of underlying funds), to average net asset will not exceed 0.23% for Class I shares and 0.48% for Class II shares, subject to recapture as described below. These arrangements cannot be terminated prior to December 31, 2022 without the Board of Trustees’ consent.
The manager is permitted to recapture amounts waived and/or reimbursed to a class during the same fiscal year in which the manager earned the fee or incurred the expense if the class’ total annual fund operating expenses have fallen to a level below the limits described above. In no case will the manager recapture any amount that would result, after taking the recapture into account, in the class’ total annual fund operating expenses exceeding the applicable limits described above or any other lower limit then in effect, on any particular business day of the Portfolio.
Q. What were the leading contributors to performance?
A. Taking into account the underlying fund returns and their weightings within the Portfolio, the top contributors to absolute performance came from U.S. equities followed by international equities.
Asset allocation effects were positive overall, with an underweight to U.S. fixed income being the top contributor. Sub-asset class selection contributed within U.S. fixed income, as high yield bonds outperformed the broader fixed income benchmark and within U.S. small-cap as it outpaced the broader U.S. market. Manager selection effects contributed overall.
Q. What were the leading detractors from performance?
A. From an asset allocation perspective, an underweight allocation to U.S. equity detracted from returns, as equity markets saw strong returns during the reporting period. Sub-asset class selection overall detracted during the reporting period, as international fixed income underperformed the composite benchmark, U.S. utilities and U.S. large-cap equities underperformed the broader Russell 3000 Index, and U.S. government bonds underperformed the broader Bloomberg Barclays U.S. Aggregate Index.
Q. Were there any significant changes to the Portfolio during the period?
A. During the fourth quarter of 2020, MainStay VP CBRE Global Infrastructure Portfolio was sold out from the Portfolio. Since this was a small holding, this change did not have a large impact on the other Portfolio holdings or overall Portfolio exposure. In addition, we replaced the MainStay VP Indexed Bond Portfolio with the Fidelity® VIP Bond Index Portfolio. This did not affect any of the other holdings or allocations of the Portfolio.
| | |
| | |
| Legg Mason/QS Model Portfolio Funds 2020 Annual Report | | 9 |
Portfolios overview (cont’d)
Legg Mason/QS Conservative Model Portfolio1
Legg Mason/QS Conservative Model Portfolio seeks a balance between capital appreciation and income. The Portfolio organizes its investments in underlying funds into two main asset classes: the equity class (equity securities of all types) and the fixed income class (fixed income securities of all types). The portfolio managers may invest across all asset classes and strategies. Under ordinary circumstances, the portfolio managers expect to allocate between 10% to 30% of the Portfolio’s assets among underlying funds that invest in equity and equity-like strategies and between 70% to 90% of the Portfolio’s assets among underlying funds that invest in fixed income strategies. The Portfolio’s allocation to each class will be measured at the time of purchase and may vary thereafter as a result of market movement. The Portfolio compares its performance to a composite benchmark, consisting of 20% Russell 3000 Index and 80% Bloomberg Barclays U.S. Aggregate Index. The portfolio managers will seek to maintain a level of risk in the Portfolio similar to that of this composite benchmark.
Performance review
For the period since inception on April 15, 2020 through December 31, 2020, Class I shares of Legg Mason/QS Conservative Model Portfolio returned 10.99%. The Portfolio’s unmanaged benchmarks, the Bloomberg Barclays U.S. Aggregate Index and the Russell 3000 Index, and the Conservative Model Portfolio Composite Benchmarkxiv returned 2.58%, 42.21% and 9.75% respectively over the same time frame. The Lipper Variable Mixed-Asset Target Allocation Conservative Funds Category Averagexv returned 14.82% over the same period.
| | | | | | | | |
Performance Snapshot as of December 31, 2020 (unaudited) | |
| | | 6 months | | | Since Portfolio
Inception* | |
| Legg Mason/QS Conservative Model Portfolio: | | | | | | | | |
Class I | | | 6.92 | % | | | 10.99 | % |
Class II | | | 6.83 | % | | | 10.78 | % |
| Bloomberg Barclays U.S. Aggregate Index | | | 1.29 | % | | | 2.58 | % |
| Russell 3000 Index | | | 25.24 | % | | | 42.21 | % |
| Conservative Model Portfolio Composite Benchmark | | | 5.88 | % | | | 9.75 | % |
| Lipper Variable Mixed-Asset Target Allocation Conservative Funds Category Average | | | 9.06 | % | | | 14.82 | % |
The performance shown represents past performance. Past performance is no guarantee of future results and current performance may be higher or lower than the performance shown above. Principal value and investment returns will fluctuate and investors’ shares, when redeemed, may be worth more or less than their original cost.
All share class returns assume the reinvestment of all distributions at net asset value and the deduction of all Portfolio expenses. Performance figures for periods shorter than one year represent cumulative figures and are not annualized.
Portfolio performance figures reflect fee waivers and/or expense reimbursements, without which the performance would have been lower.
The portfolio managers periodically adjust the allocation of the Portfolio’s assets among funds managed by investment advisers that are not affiliated with Legg Mason and funds managed by Legg Mason affiliated investment advisers, depending upon the portfolio managers’ outlook for the equity and bond markets in general, particular sectors of such markets and the performance outlook for the underlying funds. In assessing the equity and bond markets, the portfolio managers consider a broad range of market and economic trends and quantitative factors.
|
| Total Annual Operating Expenses† (unaudited) |
As of the Portfolio’s current prospectus dated April 14, 2020, the gross total annual fund operating expense ratios for Class I and Class II were 1.40% and 1.65%, respectively.
Actual expenses may be higher. For example, expenses may be higher than those shown if average net assets decrease. Net assets are more likely to decrease and Fund expense ratios are more likely to increase when markets are volatile.
| 1 | The Portfolio is an underlying investment option of various variable annuity and variable life insurance products. The Portfolio’s performance returns do not reflect the deduction of expenses imposed in connection with investing in variable annuity or variable life insurance contracts, such as administrative fees, account charges and surrender charges, which, if reflected, would reduce the performance of the Portfolio. Past performance is no guarantee of future results. |
| * | The Portfolio’s inception date is April 15, 2020. |
| † | Includes expenses of the underlying funds in which the Portfolio invests. |
| | |
| | |
| 10 | | Legg Mason/QS Model Portfolio Funds 2020 Annual Report |
As a result of expense limitation arrangements, the ratio of total annual fund operating expenses, other than interest, brokerage, taxes, extraordinary expenses and acquired fund fees and expenses (fees and expenses of underlying funds), to average net asset will not exceed 0.23% for Class I shares and 0.48% for Class II shares, subject to recapture as described below. These arrangements cannot be terminated prior to December 31, 2022 without the Board of Trustees’ consent.
The manager is permitted to recapture amounts waived and/or reimbursed to a class during the same fiscal year in which the manager earned the fee or incurred the expense if the class’ total annual fund operating expenses have fallen to a level below the limits described above. In no case will the manager recapture any amount that would result, after taking the recapture into account, in the class’ total annual fund operating expenses exceeding the applicable limits described above or any other lower limit then in effect, on any particular business day of the fund.
Q. What were the leading contributors to performance?
A. Taking into account the underlying fund returns and their weightings within the Portfolio, the top contributors to absolute performance came from U.S. equities followed by U.S. fixed income.
Asset allocation effects were positive overall, with an underweight to U.S. fixed income being the top contributor. Sub-asset class selection contributed within U.S. fixed income, as high yield bonds outperformed the broader fixed income benchmark. Manager selection effects contributed overall.
Q. What were the leading detractors from performance?
A. From an asset allocation perspective, an underweight allocation to U.S. equity detracted from returns, as equity markets saw strong returns during the reporting period. Sub-asset class selection overall detracted during the reporting period, as international fixed income underperformed the composite benchmark, U.S. large-cap equities underperformed the broader Russell 3000 Index, and U.S. government bonds underperformed the broader Bloomberg Barclays U.S. Aggregate Index.
Q. Were there any significant changes to the Portfolio during the period?
A. During the 4th quarter of 2020, MSVP CBRE Global Infrastructure was sold out from the Portfolio. Since this was a small holding this change did not have a large impact on the other portfolio holdings or overall portfolio exposure. In addition, we replaced the MSVP Indexed Bond VIT with the Fidelity® VIP Bond Index Strategy. This did not affect any of the other holdings or allocations of the Portfolio.
| | |
| | |
| Legg Mason/QS Model Portfolio Funds 2020 Annual Report | | 11 |
Portfolios overview (cont’d)
Thank you for your investment in Legg Mason/QS Model Portfolio Funds. As always, we appreciate that you have chosen us to manage your assets and we remain focused on achieving the Portfolios’ investment goals.
Sincerely,
QS Investors, LLC
January 14, 2021
RISKS: Each Portfolio is newly organized, with a limited history of operations. Equity securities are subject to price fluctuation and possible loss of principal. Small- and mid-cap stocks involve greater risks and volatility than large-cap stocks. International investments are subject to special risks, including currency fluctuations and social, economic, and political uncertainties, which could increase volatility. These risks are magnified in emerging markets. Emerging market countries tend to have economic, political, and legal systems that are less developed and are less stable than those of more developed countries. Fixed income securities involve interest rate, credit, inflation, and reinvestment risks, and possible loss of principal. As interest rates rise, the value of fixed income securities falls. High yield bonds are subject to greater price volatility, illiquidity, and possibility of default.
Each Portfolio is a fund of funds and is subject to the risks of the underlying funds in which it invests. In addition to the Portfolios’ operating expenses, you will indirectly bear the operating expenses of the underlying funds. The investment strategies employed by the underlying funds and the securities in which they invest may change without the knowledge of the Portfolios’ portfolio managers. The portfolio managers may invest each Portfolio’s assets in underlying funds that have a limited performance history. Each underlying fund may engage in active and frequent trading, resulting in higher portfolio turnover and transaction costs. As a non-diversified Portfolio, each Portfolio may invest a larger percentage of its assets in a smaller number of underlying funds than a diversified Portfolio, which may magnify the Portfolio’s losses from events affecting an underlying fund. The underlying funds in which each Portfolio invests may be either diversified or non-diversified. Certain of the underlying funds may engage in short selling, which is a speculative strategy that involves special risks. Unlike the possible loss on a security that is purchased, there is no limit on the amount of loss on an appreciating security that is sold short.
The model used to manage each Portfolio’s assets provides no assurance that the recommended allocation will either maximize returns or minimize risks. There is no assurance that a recommended allocation will prove the ideal allocation in all circumstances. Derivatives, such as options and futures, can be illiquid, may disproportionately increase losses, and have a potentially large impact on each Portfolio’s performance. Please see the Portfolios’ prospectus for a more complete discussion of these and other risks and each Portfolio’s investment strategies.
All investments are subject to risk including the possible loss of principal. Past performance is no guarantee of future results. All index performance reflects no deduction for fees, expenses, or taxes. Please note that an investor cannot invest directly in an index.
IMPORTANT INFORMATION: These Portfolios are available as investment options under a variable annuity or variable life contract. Shares of the Portfolios are offered only to insurance company separate accounts established by New York Life Insurance and Annuity Corporation that fund certain variable annuity or life contracts. These Portfolios may not be available in all states and may only be offered in certain variable products. Please refer to the prospectuses. Variable annuities are long-term, tax-deferred investment vehicles designed for retirement purposes. Gains from tax-deferred investments are taxable as ordinary income upon withdrawal. Withdrawals made prior to age 59 1/2 are subject to a 10% IRS penalty charge and/or surrender charges. Investments in a variable annuity are subject to market risks, including loss of principal. Guarantees are based on the claims-paying ability of the insurer.
| | |
| | |
| 12 | | Legg Mason/QS Model Portfolio Funds 2020 Annual Report |
| i | The Federal Reserve Board (the “Fed”) is responsible for the formulation of U.S. policies designed to promote economic growth, full employment, stable prices and a sustainable pattern of international trade and payments. |
| ii | The yield curve is the graphical depiction of the relationship between the yield on bonds of the same credit quality but different maturities. |
| iii | The Russell 3000 Index measures the performance of the 3,000 largest U.S. companies based on total market capitalization, which represents approximately 98% of the U.S. equity market. |
| iv | MSCI World Ex-U.S.A. Index captures large-, mid-and small-cap representation across 22 of 23 Developed Markets (DM) countries — excluding the United States. The MSCI World Ex-U.S.A. Index calculates performance utilizing local currencies taking out the effect of converting to the U.S. dollar. |
| v | The Bloomberg Barclays U.S. Aggregate Index is a broad-based bond index comprised of government, corporate, mortgage- and asset-backed issues, rated investment grade or higher, and having at least one year to maturity. |
| vi | The Aggressive Model Portfolio Composite Benchmark is a hypothetical representation of the performance of the Portfolio’s major asset classes. It consists of consists of 75% Russell 3000 Index, 15% MSCI World Ex U.S.A. Index, and 10% Bloomberg Barclays U.S. Aggregate Index. |
| vii | Lipper, Inc., a wholly-owned subsidiary of Reuters, provides independent insight on global collective investments. Returns are based on the period ended December 31, 2020, including the reinvestment of all distributions, including returns of capital, if any, calculated among the 77 funds for the six-month period and among the 77 funds for the nine-month period in the Portfolio’s Lipper category. |
| viii | The Moderately Aggressive Model Portfolio Composite Benchmark is a hypothetical representation of the performance of the Portfolio’s major asset classes. It consists of consists of 60% Russell 3000 Index, 10% MSCI World Ex U.S.A. Index, and 30% Bloomberg Barclays U.S. Aggregate Index. |
| ix | Lipper, Inc., a wholly-owned subsidiary of Reuters, provides independent insight on global collective investments. Returns are based on the period ended December 31, 2020, including the reinvestment of all distributions, including returns of capital, if any, calculated among the 248 funds for the six-month period and among the 247 funds for the nine-month period in the Portfolio’s Lipper category. |
| x | The Moderate Model Portfolio Composite Benchmark is a hypothetical representation of the performance of the Portfolio’s major asset classes. It consists of 45% Russell 3000 Index, 10% MSCI World Ex U.S.A. Index, and 45% Bloomberg Barclays U.S. Aggregate Index. |
| xi | Lipper, Inc., a wholly-owned subsidiary of Reuters, provides independent insight on global collective investments. Returns are based on the period ended December 31, 2020, including the reinvestment of all distributions, including returns of capital, if any, calculated among the 291 funds for the six-month period and among the 291 funds for the nine-month period in the Portfolio’s Lipper category. |
| xii | The Moderately Conservative Model Portfolio Composite Benchmark is a hypothetical representation of the performance of the Portfolio’s major asset classes. It consists of consists of 35% Russell 3000 Index, 5% MSCI World Ex U.S.A. Index, and 60% Bloomberg Barclays U.S. Aggregate Index. |
| xiii | Lipper, Inc., a wholly-owned subsidiary of Reuters, provides independent insight on global collective investments. Returns are based on the period ended December 31, 2020, including the reinvestment of all distributions, including returns of capital, if any, calculated among the 146 funds for the six-month period and among the 146 funds for the nine-month period in the Portfolio’s Lipper category. |
| xiv | The Conservative Model Portfolio Composite Benchmark is a hypothetical representation of the performance of the Portfolio’s major asset classes. It consists of 20% Russell 3000 Index and 80% Bloomberg Barclays U.S. Aggregate Index. |
| xv | Lipper, Inc., a wholly-owned subsidiary of Reuters, provides independent insight on global collective investments. Returns are based on the period ended December 31, 2020, including the reinvestment of all distributions, including returns of capital, if any, calculated among the 146 funds for the six-month period and among the 142 funds for the nine-month period in the Portfolio’s Lipper category. |
| | |
| | |
| Legg Mason/QS Model Portfolio Funds 2020 Annual Report | | 13 |
Portfolios at a glance (unaudited)
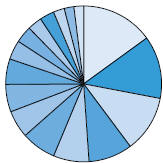
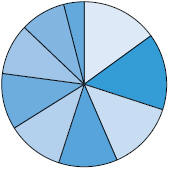
Legg Mason/QS Aggressive Model Portfolio Breakdown† as of — December 31, 2020
As a Percent of Total Long-Term Investments
| | | | |
| % of Total Long-Term Investments | | Top 5 Sectors/Industries‡ |
 | | 15.0 MainStay VP Funds Trust — MainStay VP MacKay S&P 500 Index Portfolio, Initial Class | | Software Technology Hardware, Storage & Peripherals IT Services Interactive Media & Services Internet & Direct Marketing Retail |
 | | 13.0 Variable Insurance Products Fund — VIP Equity-Income Portfolio, Initial Class | | Health Care Financials Information Technology Industrials Consumer Discretionary |
| | 11.8 MainStay VP Funds Trust — MainStay VP MacKay Common Stock Portfolio, Initial Class | | Software Technology Hardware, Storage & Peripherals Internet & Direct Marketing Retail Interactive Media & Services IT Services |
| | 9.1 MainStay VP Funds Trust — MainStay VP Fidelity Institutional AM Utilities Portfolio, Initial Class | | Electric Utilities Multi-Utilities Independent Power & Renewable Electricity Producers Short-Term Investment Gas Utilities |
| | 7.4 Variable Insurance Products Fund II — VIP Bond Index Portfolio, Initial Class | | Corporate Bonds U.S. Government and U.S. Government Agency Obligations CMOs and Other Mortgage Related Securities Municipal Bonds Other Investments |
| | 7.2 American Funds Insurance Series — Growth Fund, Class 1A | | Information technology Communication services Consumer discretionary Health care Industrials |
| | 5.7 American Funds Insurance Series — New World Fund, Class 1A | | Information technology Consumer discretionary Health care Financials Communication services |
| | 5.7 MainStay VP Funds Trust — MainStay VP Winslow Large Cap Growth Portfolio, Initial Class | | Software IT Services Interactive Media & Services Internet & Direct Marketing Retail Technology Hardware, Storage & Peripherals |
| | 5.3 MainStay VP Funds Trust — MainStay VP Epoch U.S. Equity Yield Portfolio, Initial Class | | Electric Utilities Pharmaceuticals Semiconductors & Semiconductor Equipment Insurance Banks |
| | 4.0 Variable Insurance Products Fund II — VIP Contrafund® Portfolio, Initial Class(a) | | Information Technology Health Care Communication Services Consumer Discretionary Financials |
| | 3.5 BNY Mellon Investment Portfolios — Technology Growth Portfolio, Initial Shares | | Semiconductors & Semiconductor Equipment Software Internet & Direct Marketing Retail Interactive Media & Services It Services |
| | 3.0 Delaware VIP Trust — Delaware VIP Small Cap Value Series, Standard Class | | Financial services Technology Consumer services Capital spending REITs |
| | 3.0 Janus Aspen Series — Janus Henderson VIT Global Research Portfolio, Institutional Shares | | Technology Financials Industrials & Materials Consumer Health Care |
| | 2.3 Variable Insurance Products Fund II — VIP International Index Portfolio, Initial Class | | Financials Industrials Consumer Discretionary Information Technology Health Care |
| | 2.0 American Funds Insurance Series — Blue Chip Income and Growth Fund, Class 1A | | Health care Information technology Industrials Consumer staples Communication services |
| | |
| | |
| 14 | | Legg Mason/QS Model Portfolio Funds 2020 Annual Report |
| | | | |
| % of Total Long-Term Investments | | Top 5 Sectors/Industries‡ |
| | 2.0 Variable Insurance Products Fund III — VIP Growth Opportunities Portfolio, Initial Class | | Information Technology
Consumer Discretionary
Communication Services
Health Care
Industrials
|
| † | Subject to change at any time. |
| ‡ | Top 5 sector/industry information for unaffiliated underlying funds is as of the date of the most recent publicly available information. |
| (a) | Contrafund is a registered service mark of FMR LLC. |
| | |
| | |
| Legg Mason/QS Model Portfolio Funds 2020 Annual Report | | 15 |
Portfolios at a glance (unaudited) (cont’d)
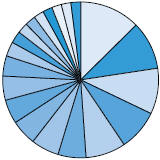
Legg Mason/QS Moderately Aggressive Model Portfolio Breakdown† as of — December 31, 2020
As a Percent of Total Long-Term Investments
| | | | |
| % of Total Long-Term Investments | | Top 5 Sectors/Industries‡ |
| | 12.6 MainStay VP Funds Trust — MainStay VP MacKay S&P 500 Index Portfolio, Initial Class | | Software Technology Hardware, Storage & Peripherals IT Services Interactive Media & Services Internet & Direct Marketing Retail |
| | 10.0 Variable Insurance Products Fund II — VIP Bond Index Portfolio, Initial Class | | Corporate Bonds U.S. Government and U.S. Government Agency Obligations CMOs and Other Mortgage Related Securities Municipal Bonds Other Investments |
| | 9.5 MainStay VP Funds Trust — MainStay VP MacKay Common Stock Portfolio, Initial Class | | Software Technology Hardware, Storage & Peripherals Internet & Direct Marketing Retail Interactive Media & Services IT Services |
| | 8.5 Variable Insurance Products Fund — VIP Equity-Income Portfolio, Initial Class | | Health Care Financials Information Technology Industrials Consumer Discretionary |
| | 8.3 MainStay VP Funds Trust — MainStay VP Bond Portfolio, Initial Class | | U.S. Government & Federal Agencies Corporate Bonds Asset-Backed Securities Mortgage-Backed Securities Short-Term Investments |
| | 5.8 MainStay VP Funds Trust — MainStay VP Fidelity Institutional AM Utilities Portfolio, Initial Class | | Electric Utilities Multi-Utilities Independent Power & Renewable Electricity Producers Short-Term Investment Gas Utilities |
| | 5.8 MainStay VP Funds Trust — MainStay VP Epoch U.S. Equity Yield Portfolio, Initial Class | | Electric Utilities Pharmaceuticals Semiconductors & Semiconductor Equipment Insurance Banks |
| | 5.3 American Funds Insurance Series — Growth Fund, Class 1A | | Information technology Communication services Consumer discretionary Health care Industrials |
| | 5.0 Columbia Funds Variable Series Trust II — Columbia Variable Portfolio — Emerging Markets Bond Fund, Class I | | Foreign Government Obligations Corporate Bonds & Notes Money Market Funds |
| | 5.0 PIMCO Variable Insurance Trust — PIMCO International Bond Portfolio (U.S. Dollar-Hedged), Institutional Class | | Government Related Securitized EM Local Investment Grade Credit EM External |
| | 4.2 MainStay VP Funds Trust — MainStay VP Winslow Large Cap Growth Portfolio, Initial Class | | Software IT Services Interactive Media & Services Internet & Direct Marketing Retail Technology Hardware, Storage & Peripherals |
| | 3.0 Variable Insurance Products Fund II — VIP Contrafund® Portfolio, Initial Class(a) | | Information Technology Health Care Communication Services Consumer Discretionary Financials |
| | 2.5 American Funds Insurance Series — New World Fund, Class 1A | | Information technology Consumer discretionary Health care Financials Communication services |
| | 2.2 BNY Mellon Investment Portfolios — Technology Growth Portfolio, Initial Shares | | Semiconductors & Semiconductor Equipment Software Internet & Direct Marketing Retail Interactive Media & Services It Services |
| | 2.2 Delaware VIP Trust — Delaware VIP Small Cap Value Series, Standard Class | | Financial services Technology Consumer services Capital spending REITs |
| | 2.1 Variable Insurance Products Fund II — VIP International Index Portfolio, Initial Class | | Financials Industrials Consumer Discretionary Information Technology Health Care |
| | |
| | |
| 16 | | Legg Mason/QS Model Portfolio Funds 2020 Annual Report |
| | | | |
| % of Total Long-Term Investments | | Top 5 Sectors/Industries‡ |
| | 2.0 American Funds Insurance Series — Blue Chip Income and Growth Fund, Class 1A | | Health care Information technology Industrials Consumer staples Communication services |
| | 2.0 MainStay VP Funds Trust — MainStay VP MacKay Government Portfolio, Initial Class | | U.S. Government & Federal Agencies Mortgage-Backed Securities Short-Term Investments Corporate Bonds Asset-Backed Securities |
| | 2.0 Janus Aspen Series — Janus Henderson VIT Global Research Portfolio, Institutional Shares | | Technology Financials Industrials & Materials Consumer Health Care |
| | 2.0 Variable Insurance Products Fund III — VIP Growth Opportunities Portfolio, Initial Class | | Information Technology Consumer Discretionary Communication Services Health Care Industrials |
| † | Subject to change at any time. |
| ‡ | Top 5 sector/industry information for unaffiliated underlying funds is as of the date of the most recent publicly available information. |
| (a) | Contrafund is a registered service mark of FMR LLC. |
| | |
| | |
| Legg Mason/QS Model Portfolio Funds 2020 Annual Report | | 17 |
Portfolios at a glance (unaudited) (cont’d)
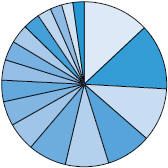
Legg Mason/QS Moderate Model Portfolio Breakdown† as of — December 31, 2020
As a Percent of Total Long-Term Investments
| | | | |
| % of Total Long-Term Investments | | Top 5 Sectors/Industries‡ |
| | 13.0 MainStay VP Funds Trust — MainStay VP Bond Portfolio, Initial Class | | U.S. Government & Federal Agencies Corporate Bonds Asset-Backed Securities Mortgage-Backed Securities Short-Term Investments |
| | 12.9 MainStay VP Funds Trust — MainStay VP MacKay S&P 500 Index Portfolio, Initial Class | | Software Technology Hardware, Storage & Peripherals IT Services Interactive Media & Services Internet & Direct Marketing Retail |
| | 10.5 PIMCO Variable Insurance Trust — PIMCO International Bond Portfolio (U.S. Dollar-Hedged), Institutional Class | | Government Related Securitized EM Local Investment Grade Credit EM External |
| | 8.8 MainStay VP Funds Trust — MainStay VP MacKay Common Stock Portfolio, Initial Class | | Software Technology Hardware, Storage & Peripherals Internet & Direct Marketing Retail Interactive Media & Services IT Services |
| | 8.5 Variable Insurance Products Fund II — VIP Bond Index Portfolio, Initial Class | | Corporate Bonds U.S. Government and U.S. Government Agency Obligations CMOs and Other Mortgage Related Securities Municipal Bonds Other Investments |
| | 7.5 MainStay VP Funds Trust — MainStay VP MacKay Government Portfolio, Initial Class | | U.S. Government & Federal Agencies Mortgage-Backed Securities Short-Term Investments Corporate Bonds Asset-Backed Securities |
| | 5.6 MainStay VP Funds Trust — MainStay VP Fidelity Institutional AM Utilities Portfolio, Initial Class | | Electric Utilities Multi-Utilities Independent Power & Renewable Electricity Producers Short-Term Investment Gas Utilities |
| | 4.8 MainStay VP Funds Trust — MainStay VP Epoch U.S. Equity Yield Portfolio, Initial Class | | Electric Utilities Pharmaceuticals Semiconductors & Semiconductor Equipment Insurance Banks |
| | 4.2 MainStay VP Funds Trust — MainStay VP Winslow Large Cap Growth Portfolio, Initial Class | | Software IT Services Interactive Media & Services Internet & Direct Marketing Retail Technology Hardware, Storage & Peripherals |
| | 4.0 Columbia Funds Variable Series Trust II — Columbia Variable Portfolio — Emerging Markets Bond Fund, Class I | | Foreign Government Obligations Corporate Bonds & Notes Money Market Funds |
| | 3.8 Variable Insurance Products Fund — VIP Equity-Income Portfolio, Initial Class | | Health Care Financials Information Technology Industrials Consumer Discretionary |
| | 3.7 American Funds Insurance Series — Growth Fund, Class 1A | | Information technology Communication services Consumer discretionary Health care Industrials |
| | 3.3 Variable Insurance Products Fund II — VIP International Index Portfolio, Initial Class | | Financials Industrials Consumer Discretionary Information Technology Health Care |
| | 2.7 Variable Insurance Products Fund II — VIP Contrafund® Portfolio, Initial Class(a) | | Information Technology Health Care Communication Services Consumer Discretionary Financials |
| | 2.3 American Funds Insurance Series — Blue Chip Income and Growth Fund, Class 1A | | Health care Information technology Industrials Consumer staples Communication services |
| | 2.2 Delaware VIP Trust — Delaware VIP Small Cap Value Series, Standard Class | | Financial services Technology Consumer services Capital spending REITs |
| | |
| | |
| 18 | | Legg Mason/QS Model Portfolio Funds 2020 Annual Report |
| | | | |
| % of Total Long-Term Investments | | Top 5 Sectors/Industries‡ |
| | 2.2 BNY Mellon Investment Portfolios — Technology Growth Portfolio, Initial Shares | | Semiconductors & Semiconductor Equipment Software Internet & Direct Marketing Retail Interactive Media & Services It Services |
| † | Subject to change at any time. |
| ‡ | Top 5 sector/industry information for unaffiliated underlying funds is as of the date of the most recent publicly available information. |
| (a) | Contrafund is a registered service mark of FMR LLC. |
| | |
| | |
| Legg Mason/QS Model Portfolio Funds 2020 Annual Report | | 19 |
Portfolios at a glance (unaudited) (cont’d)
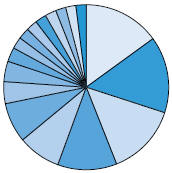
Legg Mason/QS Moderately Conservative Model Portfolio Breakdown† as of — December 31, 2020
As a Percent of Total Long-Term Investments
| | | | |
| % of Total Long-Term Investments | | Top 5 Sectors/Industries‡ |
| | 15.0 MainStay VP Funds Trust — MainStay VP Bond Portfolio, Initial Class | | U.S. Government & Federal Agencies Corporate Bonds Asset-Backed Securities Mortgage-Backed Securities Short-Term Investments |
| | 15.0 PIMCO Variable Insurance Trust — PIMCO International Bond Portfolio (U.S. Dollar-Hedged), Institutional Class | | Government Related Securitized EM Local Investment Grade Credit EM External |
| | 14.0 MainStay VP Funds Trust — MainStay VP MacKay Government Portfolio, Initial Class | | U.S. Government & Federal Agencies Mortgage-Backed Securities Short-Term Investments Corporate Bonds Asset-Backed Securities |
| | 11.6 MainStay VP Funds Trust — MainStay VP MacKay S&P 500 Index Portfolio, Initial Class | | Software Technology Hardware, Storage & Peripherals IT Services Interactive Media & Services Internet & Direct Marketing Retail |
| | 8.4 Variable Insurance Products Fund II — VIP Bond Index Portfolio, Initial Class | | Corporate Bonds U.S. Government and U.S. Government Agency Obligations CMOs and Other Mortgage Related Securities Municipal Bonds Other Investments |
| | 7.8 MainStay VP Funds Trust — MainStay VP MacKay Common Stock Portfolio, Initial Class | | Software Technology Hardware, Storage & Peripherals Internet & Direct Marketing Retail Interactive Media & Services IT Services |
| | 4.3 MainStay VP Funds Trust — MainStay VP Fidelity Institutional AM Utilities Portfolio, Initial Class | | Electric Utilities Multi-Utilities Independent Power & Renewable Electricity Producers Short-Term Investment Gas Utilities |
| | 4.0 Variable Insurance Products Fund II — VIP International Index Portfolio, Initial Class | | Financials Industrials Consumer Discretionary Information Technology Health Care |
| | 2.8 Variable Insurance Products Fund — VIP Equity-Income Portfolio, Initial Class | | Health Care Financials Information Technology Industrials Consumer Discretionary |
| | 2.3 American Funds Insurance Series — Growth Fund, Class 1A | | Information technology Communication services Consumer discretionary Health care Industrials |
| | 2.2 Delaware VIP Trust — Delaware VIP Small Cap Value Series, Standard Class | | Financial services Technology Consumer services Capital spending REITs |
| | 2.2 Variable Insurance Products Fund II — VIP Contrafund® Portfolio, Initial Class(a) | | Information Technology Health Care Communication Services Consumer Discretionary Financials |
| | 2.2 MainStay VP Funds Trust — MainStay VP Winslow Large Cap Growth Portfolio, Initial Class | | Software IT Services Interactive Media & Services Internet & Direct Marketing Retail Technology Hardware, Storage & Peripherals |
| | 2.2 BNY Mellon Investment Portfolios — Technology Growth Portfolio, Initial Shares | | Semiconductors & Semiconductor Equipment Software Internet & Direct Marketing Retail Interactive Media & Services It Services |
| | 2.0 Columbia Funds Variable Series Trust II — Columbia Variable Portfolio — Emerging Markets Bond Fund, Class I | | Foreign Government Obligations Corporate Bonds & Notes Money Market Funds |
| | |
| | |
| 20 | | Legg Mason/QS Model Portfolio Funds 2020 Annual Report |
| | | | |
| % of Total Long-Term Investments | | Top 5 Sectors/Industries‡ |
| | 2.0 BlackRock Variable Series Funds II, Inc. — BlackRock High Yield V.I. Fund, Class I | | Corporate Bonds Floating Rate Loan Interests Capital Trusts Common Stocks Short-Term Securities |
| | 2.0 MainStay VP Funds Trust — MainStay VP MacKay High Yield Corporate Bond Portfolio, Initial Class | | Corporate Bonds Short-Term Investments Loan Assignments Common Stocks Convertible Bonds |
| † | Subject to change at any time. |
| ‡ | Top 5 sector/industry information for unaffiliated underlying funds is as of the date of the most recent publicly available information. |
| (a) | Contrafund is a registered service mark of FMR LLC. |
| | |
| | |
| Legg Mason/QS Model Portfolio Funds 2020 Annual Report | | 21 |
Portfolios at a glance (unaudited) (cont’d)
Legg Mason/QS Conservative Model Portfolio Breakdown† as of — December 31, 2020
As a Percent of Total Long-Term Investments
| | | | |
| % of Total Long-Term Investments | | Top 5 Sectors/Industries‡ |
| | 15.0 MainStay VP Funds Trust — MainStay VP Bond Portfolio, Initial Class | | U.S. Government & Federal Agencies Corporate Bonds Asset-Backed Securities Mortgage-Backed Securities Short-Term Investments |
| | 15.0 MainStay VP Funds Trust — MainStay VP MacKay Government Portfolio, Initial Class | | U.S. Government & Federal Agencies Mortgage-Backed Securities Short-Term Investments Corporate Bonds Asset-Backed Securities |
| | 13.5 PIMCO Variable Insurance Trust — PIMCO International Bond Portfolio (U.S. Dollar-Hedged), Institutional Class | | Government Related Securitized EM Local Investment Grade Credit EM External |
| | 11.5 PIMCO Variable Insurance Trust — PIMCO Total Return Portfolio, Institutional Class | | Invest. Grade Credit Securitized US Government - Treasury Emerging Markets Other |
| | 11.1 MainStay VP Funds Trust — MainStay VP MacKay S&P 500 Index Portfolio, Initial Class | | Software Technology Hardware, Storage & Peripherals IT Services Interactive Media & Services Internet & Direct Marketing Retail |
| | 11.0 MainStay VP Funds Trust — MainStay VP MacKay High Yield Corporate Bond Portfolio, Initial Class | | Corporate Bonds Short-Term Investments Loan Assignments Common Stocks Convertible Bonds |
| | 10.0 MainStay VP Funds Trust — MainStay VP MacKay Common Stock Portfolio, Initial Class | | Software Technology Hardware, Storage & Peripherals Internet & Direct Marketing Retail Interactive Media & Services IT Services |
| | 8.9 Variable Insurance Products Fund II — VIP Bond Index Portfolio, Initial Class | | Corporate Bonds U.S. Government and U.S. Government Agency Obligations CMOs and Other Mortgage Related Securities Municipal Bonds Other Investments |
| | 4.0 BlackRock Variable Series Funds II, Inc. — BlackRock High Yield V.I. Fund, Class I | | Corporate Bonds Floating Rate Loan Interests Capital Trusts Common Stocks Short-Term Securities |
| † | Subject to change at any time. |
| ‡ | Top 5 sector/industry information for unaffiliated underlying funds is as of the date of the most recent publicly available information. |
| | |
| | |
| 22 | | Legg Mason/QS Model Portfolio Funds 2020 Annual Report |
Portfolios expenses (unaudited)
Example
As a shareholder of the Portfolio, you may incur two types of costs: (1) transaction costs and (2) ongoing costs, including management fees; service and/or distribution (12b-1) fees; and other Portfolio expenses. This example is intended to help you understand your ongoing costs (in dollars) of investing in the Portfolio and to compare these costs with the ongoing costs of investing in other funds.
This example is based on an investment of $1,000 invested on July 1, 2020 and held for the six months ended December 31, 2020.
Actual expenses
The table below titled “Based on Actual Total Return” provides information about actual account values and actual expenses. You may use the information provided in this table, together with the amount you invested, to estimate the expenses that you paid over the period. To estimate the expenses you paid on your account, divide your ending account value by $1,000 (for example, an $8,600 ending account value divided by $1,000 = 8.6), then multiply the result by the number under the heading entitled “Expenses Paid During the Period”.
Hypothetical example for comparison purposes
The table below titled “Based on Hypothetical Total Return” provides information about hypothetical account values and hypothetical expenses based on the actual expense ratio and an assumed rate of return of 5.00% per year before expenses, which is not the Portfolio’s actual return. The hypothetical account values and expenses may not be used to estimate the actual ending account balance or expenses you paid for the period. You may use the information provided in this table to compare the ongoing costs of investing in the Portfolio and other portfolios. To do so, compare the 5.00% hypothetical example relating to the Portfolio with the 5.00% hypothetical examples that appear in the shareholder reports of the other funds.
Please note that the expenses shown in the table below are meant to highlight your ongoing costs only and do not reflect any transactional costs. Therefore, the table is useful in comparing ongoing costs only, and will not help you determine the relative total costs of owning different funds. In addition, if these transaction costs were included, your costs would have been higher.
| | | | | | | | | | | | | | | | | | | | | | | | | | | | | | | | | | | | | | | | | | | | | | |
| | | |
| Based on actual total return1 | | | | | | | | | Based on hypothetical total return1 | |
Legg Mason/QS
Aggressive
Model Portfolio | | Actual
Total
Return2 | | | Beginning
Account
Value | | | Ending
Account
Value | | | Annualized
Expense
Ratio3 | | | Expenses
Paid
During
the
Period4 | | | | | | Legg Mason/QS
Aggressive
Model Portfolio | | Hypothetical
Annualized
Total Return | | | Beginning
Account
Value | | | Ending
Account
Value | | | Annualized
Expense
Ratio3 | | | Expenses
Paid
During
the
Period4 | |
| Class I | | | 21.01 | % | | $ | 1,000.00 | | | $ | 1,210.10 | | | | 0.23 | % | | $ | 1.28 | | | | | | | Class I | | | 5.00 | % | | $ | 1,000.00 | | | $ | 1,023.98 | | | | 0.23 | % | | $ | 1.17 | |
| Class II | | | 20.93 | | | | 1,000.00 | | | | 1,209.30 | | | | 0.48 | | | | 2.67 | | | | | | | Class II | | | 5.00 | | | | 1,000.00 | | | | 1,022.72 | | | | 0.48 | | | | 2.44 | |
| 1 | For the six months ended December 31, 2020. |
| 2 | Assumes the reinvestment of all distributions, including returns of capital, if any, at net asset value. Total return is not annualized, as it may not be representative of the total return for the year. Total returns do not reflect expenses associated with separate accounts such as administrative fees, account charges and surrender charges, which, if reflected, would reduce the total returns. Performance figures may reflect compensating balance arrangements, fee waivers and/or expense reimbursements. In the absence of compensating balance arrangements, fee waivers and/or expense reimbursements, the total return would have been lower. Past performance is no guarantee of future results. |
| 3 | Does not include fees and expenses of the Underlying Funds in which the Portfolio invests. |
| 4 | Expenses (net of compensating balance arrangements, fee waivers and/or expense reimbursements) are equal to each class’ respective annualized expense ratio multiplied by the average account value over the period, multiplied by the number of days in the most recent fiscal half-year (184), then divided by 366. |
| | |
| | |
| Legg Mason/QS Model Portfolio Funds 2020 Annual Report | | 23 |
Portfolios expenses (unaudited) (cont’d)
Example
As a shareholder of the Portfolio, you may incur two types of costs: (1) transaction costs and (2) ongoing costs, including management fees; service and/or distribution (12b-1) fees; and other Portfolio expenses. This example is intended to help you understand your ongoing costs (in dollars) of investing in the Portfolio and to compare these costs with the ongoing costs of investing in other funds.
This example is based on an investment of $1,000 invested on July 1, 2020 and held for the six months ended December 31, 2020.
Actual expenses
The table below titled “Based on Actual Total Return” provides information about actual account values and actual expenses. You may use the information provided in this table, together with the amount you invested, to estimate the expenses that you paid over the period. To estimate the expenses you paid on your account, divide your ending account value by $1,000 (for example, an $8,600 ending account value divided by $1,000 = 8.6), then multiply the result by the number under the heading entitled “Expenses Paid During the Period”.
Hypothetical example for comparison purposes
The table below titled “Based on Hypothetical Total Return” provides information about hypothetical account values and hypothetical expenses based on the actual expense ratio and an assumed rate of return of 5.00% per year before expenses, which is not the Portfolio’s actual return. The hypothetical account values and expenses may not be used to estimate the actual ending account balance or expenses you paid for the period. You may use the information provided in this table to compare the ongoing costs of investing in the Portfolio and other portfolios. To do so, compare the 5.00% hypothetical example relating to the Portfolio with the 5.00% hypothetical examples that appear in the shareholder reports of the other funds.
Please note that the expenses shown in the table below are meant to highlight your ongoing costs only and do not reflect any transactional costs. Therefore, the table is useful in comparing ongoing costs only, and will not help you determine the relative total costs of owning different funds. In addition, if these transaction costs were included, your costs would have been higher.
| | | | | | | | | | | | | | | | | | | | | | | | | | | | | | | | | | | | | | | | | | | | | | |
| | | |
| Based on actual total return1 | | | | | | | | | Based on hypothetical total return1 | |
Legg Mason/QS
Moderately Aggressive Model Portfolio | | Actual
Total
Return2 | | | Beginning
Account
Value | | | Ending
Account
Value | | | Annualized
Expense
Ratio3 | | | Expenses
Paid
During
the
Period4 | | | | | | Legg Mason/QS
Moderately
Aggressive
Model Portfolio | | Hypothetical
Annualized
Total Return | | | Beginning
Account
Value | | | Ending
Account
Value | | | Annualized
Expense
Ratio3 | | | Expenses
Paid
During
the
Period4 | |
| Class I | | | 16.55 | % | | $ | 1,000.00 | | | $ | 1,165.50 | | | | 0.21 | % | | $ | 1.14 | | | | | | | Class I | | | 5.00 | % | | $ | 1,000.00 | | | $ | 1,024.08 | | | | 0.21 | % | | $ | 1.07 | |
| Class II | | | 16.38 | | | | 1,000.00 | | | | 1,163.80 | | | | 0.46 | | | | 2.50 | | | | | | | Class II | | | 5.00 | | | | 1,000.00 | | | | 1,022.82 | | | | 0.46 | | | | 2.34 | |
| 1 | For the six months ended December 31, 2020. |
| 2 | Assumes the reinvestment of all distributions, including returns of capital, if any, at net asset value. Total return is not annualized, as it may not be representative of the total return for the year. Total returns do not reflect expenses associated with separate accounts such as administrative fees, account charges and surrender charges, which, if reflected, would reduce the total returns. Performance figures may reflect compensating balance arrangements, fee waivers and/or expense reimbursements. In the absence of compensating balance arrangements, fee waivers and/or expense reimbursements, the total return would have been lower. Past performance is no guarantee of future results. |
| 3 | Does not include fees and expenses of the Underlying Funds in which the Portfolio invests. |
| 4 | Expenses (net of compensating balance arrangements, fee waivers and/or expense reimbursements) are equal to each class’ respective annualized expense ratio multiplied by the average account value over the period, multiplied by the number of days in the most recent fiscal half-year (184), then divided by 366. |
| | |
| | |
| 24 | | Legg Mason/QS Model Portfolio Funds 2020 Annual Report |
Example
As a shareholder of the Portfolio, you may incur two types of costs: (1) transaction costs and (2) ongoing costs, including management fees; service and/or distribution (12b-1) fees; and other Portfolio expenses. This example is intended to help you understand your ongoing costs (in dollars) of investing in the Portfolio and to compare these costs with the ongoing costs of investing in other funds.
This example is based on an investment of $1,000 invested on July 1, 2020 and held for the six months ended December 31, 2020.
Actual expenses
The table below titled “Based on Actual Total Return” provides information about actual account values and actual expenses. You may use the information provided in this table, together with the amount you invested, to estimate the expenses that you paid over the period. To estimate the expenses you paid on your account, divide your ending account value by $1,000 (for example, an $8,600 ending account value divided by $1,000 = 8.6), then multiply the result by the number under the heading entitled “Expenses Paid During the Period”.
Hypothetical example for comparison purposes
The table below titled “Based on Hypothetical Total Return” provides information about hypothetical account values and hypothetical expenses based on the actual expense ratio and an assumed rate of return of 5.00% per year before expenses, which is not the Portfolio’s actual return. The hypothetical account values and expenses may not be used to estimate the actual ending account balance or expenses you paid for the period. You may use the information provided in this table to compare the ongoing costs of investing in the Portfolio and other portfolios. To do so, compare the 5.00% hypothetical example relating to the Portfolio with the 5.00% hypothetical examples that appear in the shareholder reports of the other funds.
Please note that the expenses shown in the table below are meant to highlight your ongoing costs only and do not reflect any transactional costs. Therefore, the table is useful in comparing ongoing costs only, and will not help you determine the relative total costs of owning different funds. In addition, if these transaction costs were included, your costs would have been higher.
| | | | | | | | | | | | | | | | | | | | | | | | | | | | | | | | | | | | | | | | | | | | | | |
| | | |
| Based on actual total return1 | | | | | | | | | Based on hypothetical total return1 | |
Legg Mason/QS
Moderate
Model Portfolio | | Actual
Total
Return2 | | | Beginning
Account
Value | | | Ending
Account
Value | | | Annualized
Expense
Ratio3 | | | Expenses
Paid
During
the
Period4 | | | | | | Legg Mason/QS
Moderate Model Portfolio | | Hypothetical
Annualized
Total Return | | | Beginning
Account
Value | | | Ending
Account
Value | | | Annualized
Expense
Ratio3 | | | Expenses
Paid
During
the
Period4 | |
| Class I | | | 13.05 | % | | $ | 1,000.00 | | | $ | 1,130.50 | | | | 0.21 | % | | $ | 1.12 | | | | | | | Class I | | | 5.00 | % | | $ | 1,000.00 | | | $ | 1,024.08 | | | | 0.21 | % | | $ | 1.07 | |
| Class II | | | 12.88 | | | | 1,000.00 | | | | 1,128.80 | | | | 0.46 | | | | 2.46 | | | | | | | Class II | | | 5.00 | | | | 1,000.00 | | | | 1,022.82 | | | | 0.46 | | | | 2.34 | |
| 1 | For the six months ended December 31, 2020. |
| 2 | Assumes the reinvestment of all distributions, including returns of capital, if any, at net asset value. Total return is not annualized, as it may not be representative of the total return for the year. Total returns do not reflect expenses associated with separate accounts such as administrative fees, account charges and surrender charges, which, if reflected, would reduce the total returns. Performance figures may reflect compensating balance arrangements, fee waivers and/or expense reimbursements. In the absence of compensating balance arrangements, fee waivers and/or expense reimbursements, the total return would have been lower. Past performance is no guarantee of future results. |
| 3 | Does not include fees and expenses of the Underlying Funds in which the Portfolio invests. |
| 4 | Expenses (net of compensating balance arrangements, fee waivers and/or expense reimbursements) are equal to each class’ respective annualized expense ratio multiplied by the average account value over the period, multiplied by the number of days in the most recent fiscal half-year (184), then divided by 366. |
| | |
| | |
| Legg Mason/QS Model Portfolio Funds 2020 Annual Report | | 25 |
Portfolios expenses (unaudited) (cont’d)
Example
As a shareholder of the Portfolio, you may incur two types of costs: (1) transaction costs and (2) ongoing costs, including management fees; service and/or distribution (12b-1) fees; and other Portfolio expenses. This example is intended to help you understand your ongoing costs (in dollars) of investing in the Portfolio and to compare these costs with the ongoing costs of investing in other funds.
This example is based on an investment of $1,000 invested on July 1, 2020 and held for the six months ended December 31, 2020.
Actual expenses
The table below titled “Based on Actual Total Return” provides information about actual account values and actual expenses. You may use the information provided in this table, together with the amount you invested, to estimate the expenses that you paid over the period. To estimate the expenses you paid on your account, divide your ending account value by $1,000 (for example, an $8,600 ending account value divided by $1,000 = 8.6), then multiply the result by the number under the heading entitled “Expenses Paid During the Period”.
Hypothetical example for comparison purposes
The table below titled “Based on Hypothetical Total Return” provides information about hypothetical account values and hypothetical expenses based on the actual expense ratio and an assumed rate of return of 5.00% per year before expenses, which is not the Portfolio’s actual return. The hypothetical account values and expenses may not be used to estimate the actual ending account balance or expenses you paid for the period. You may use the information provided in this table to compare the ongoing costs of investing in the Portfolio and other portfolios. To do so, compare the 5.00% hypothetical example relating to the Portfolio with the 5.00% hypothetical examples that appear in the shareholder reports of the other funds.
Please note that the expenses shown in the table below are meant to highlight your ongoing costs only and do not reflect any transactional costs. Therefore, the table is useful in comparing ongoing costs only, and will not help you determine the relative total costs of owning different funds. In addition, if these transaction costs were included, your costs would have been higher.
| | | | | | | | | | | | | | | | | | | | | | | | | | | | | | | | | | | | | | | | | | | | | | |
| | | |
| Based on actual total return1 | | | | | | | | | Based on hypothetical total return1 | |
Legg Mason/QS
Moderately
Conservative
Model Portfolio | | Actual
Total
Return2 | | | Beginning
Account
Value | | | Ending
Account
Value | | | Annualized
Expense
Ratio3 | | | Expenses
Paid
During
the
Period4 | | | | | | Legg Mason/QS
Moderately
Conservative
Model Portfolio | | Hypothetical
Annualized
Total Return | | | Beginning
Account
Value | | | Ending
Account
Value | | | Annualized
Expense
Ratio3 | | | Expenses
Paid
During
the
Period4 | |
| Class I | | | 10.46 | % | | $ | 1,000.00 | | | $ | 1,104.60 | | | | 0.23 | % | | $ | 1.22 | | | | | | | Class I | | | 5.00 | % | | $ | 1,000.00 | | | $ | 1,023.98 | | | | 0.23 | % | | $ | 1.17 | |
| Class II | | | 10.46 | | | | 1,000.00 | | | | 1,104.60 | | | | 0.48 | | | | 2.54 | | | | | | | Class II | | | 5.00 | | | | 1,000.00 | | | | 1,022.72 | | | | 0.48 | | | | 2.44 | |
| 1 | For the six months ended December 31, 2020. |
| 2 | Assumes the reinvestment of all distributions, including returns of capital, if any, at net asset value. Total return is not annualized, as it may not be representative of the total return for the year. Total returns do not reflect expenses associated with separate accounts such as administrative fees, account charges and surrender charges, which, if reflected, would reduce the total returns. Performance figures may reflect compensating balance arrangements, fee waivers and/or expense reimbursements. In the absence of compensating balance arrangements, fee waivers and/or expense reimbursements, the total return would have been lower. Past performance is no guarantee of future results. |
| 3 | Does not include fees and expenses of the Underlying Funds in which the Portfolio invests. |
| 4 | Expenses (net of compensating balance arrangements, fee waivers and/or expense reimbursements) are equal to each class’ respective annualized expense ratio multiplied by the average account value over the period, multiplied by the number of days in the most recent fiscal half-year (184), then divided by 366. |
| | |
| | |
| 26 | | Legg Mason/QS Model Portfolio Funds 2020 Annual Report |
Example
As a shareholder of the Portfolio, you may incur two types of costs: (1) transaction costs and (2) ongoing costs, including management fees; service and/or distribution (12b-1) fees; and other Portfolio expenses. This example is intended to help you understand your ongoing costs (in dollars) of investing in the Portfolio and to compare these costs with the ongoing costs of investing in other funds.
This example is based on an investment of $1,000 invested on July 1, 2020 and held for the six months ended December 31, 2020.
Actual expenses
The table below titled “Based on Actual Total Return” provides information about actual account values and actual expenses. You may use the information provided in this table, together with the amount you invested, to estimate the expenses that you paid over the period. To estimate the expenses you paid on your account, divide your ending account value by $1,000 (for example, an $8,600 ending account value divided by $1,000 = 8.6), then multiply the result by the number under the heading entitled “Expenses Paid During the Period”.
Hypothetical example for comparison purposes
The table below titled “Based on Hypothetical Total Return” provides information about hypothetical account values and hypothetical expenses based on the actual expense ratio and an assumed rate of return of 5.00% per year before expenses, which is not the Portfolio’s actual return. The hypothetical account values and expenses may not be used to estimate the actual ending account balance or expenses you paid for the period. You may use the information provided in this table to compare the ongoing costs of investing in the Portfolio and other portfolios. To do so, compare the 5.00% hypothetical example relating to the Portfolio with the 5.00% hypothetical examples that appear in the shareholder reports of the other funds.
Please note that the expenses shown in the table below are meant to highlight your ongoing costs only and do not reflect any transactional costs. Therefore, the table is useful in comparing ongoing costs only, and will not help you determine the relative total costs of owning different funds. In addition, if these transaction costs were included, your costs would have been higher.
| | | | | | | | | | | | | | | | | | | | | | | | | | | | | | | | | | | | | | | | | | | | | | |
| | | |
| Based on actual total return1 | | | | | | | | | Based on hypothetical total return1 | |
Legg Mason/QS
Conservative
Model Portfolio | | Actual
Total
Return2 | | | Beginning
Account
Value | | | Ending
Account
Value | | | Annualized
Expense
Ratio3 | | | Expenses
Paid
During
the
Period4 | | | | | | Legg Mason/QS
Conservative
Model Portfolio | | Hypothetical
Annualized
Total Return | | | Beginning
Account
Value | | | Ending
Account
Value | | | Annualized
Expense
Ratio3 | | | Expenses
Paid
During
the
Period4 | |
| Class I | | | 6.92 | % | | $ | 1,000.00 | | | $ | 1,069.20 | | | | 0.23 | % | | $ | 1.20 | | | | | | | Class I | | | 5.00 | % | | $ | 1,000.00 | | | $ | 1,023.98 | | | | 0.23 | % | | $ | 1.17 | |
| Class II | | | 6.83 | | | | 1,000.00 | | | | 1,068.30 | | | | 0.48 | | | | 2.50 | | | | | | | Class II | | | 5.00 | | | | 1,000.00 | | | | 1,022.72 | | | | 0.48 | | | | 2.44 | |
| 1 | For the six months ended December 31, 2020. |
| 2 | Assumes the reinvestment of all distributions, including returns of capital, if any, at net asset value. Total return is not annualized, as it may not be representative of the total return for the year. Total returns do not reflect expenses associated with separate accounts such as administrative fees, account charges and surrender charges, which, if reflected, would reduce the total returns. Performance figures may reflect compensating balance arrangements, fee waivers and/or expense reimbursements. In the absence of compensating balance arrangements, fee waivers and/or expense reimbursements, the total return would have been lower. Past performance is no guarantee of future results. |
| 3 | Does not include fees and expenses of the Underlying Funds in which the Portfolio invests. |
| 4 | Expenses (net of compensating balance arrangements, fee waivers and/or expense reimbursements) are equal to each class’ respective annualized expense ratio multiplied by the average account value over the period, multiplied by the number of days in the most recent fiscal half-year (184), then divided by 366. |
| | |
| | |
| Legg Mason/QS Model Portfolio Funds 2020 Annual Report | | 27 |
Portfolios performance (unaudited)
Legg Mason/QS Aggressive Model Portfolio
| | | | | | | | |
| Average annual total returns1 | |
| | | Class I† | | | Class II† | |
| Inception* through 12/31/20 | | | 31.90 | % | | | 31.70 | % |
| | | | |
| Cumulative total returns1 | | | |
| Class I (Inception date of 4/15/20 through 12/31/20) | | | 31.90 | % |
| Class II (Inception date of 4/15/20 through 12/31/20) | | | 31.70 | |
All figures represent past performance and are not a guarantee of future results. Investment return and principal value of an investment will fluctuate so that an investor’s shares, when redeemed, may be worth more or less than their original cost. The returns shown do not reflect expenses associated with separate accounts such as administrative fees, account charges and surrender charges, which, if reflected, would reduce the total returns. Performance figures may reflect compensating balance arrangements, fee waivers and/or expense reimbursements. In the absence of compensating balance arrangements, fee waivers and/or expense reimbursements, the total return would have been lower.
| 1 | Assumes the reinvestment of all distributions, including returns of capital, if any, at net asset value. |
| * | Inception date for Class I and Class II shares is April 15, 2020. |
| | |
| | |
| 28 | | Legg Mason/QS Model Portfolio Funds 2020 Annual Report |
Legg Mason/QS Aggressive Model Portfolio
Historical performance
Value of $10,000 invested in
Class I and Class II Shares of Legg Mason/QS Aggressive Model Portfolio vs. Benchmark Indices† — April 15, 2020 - December 31, 2020
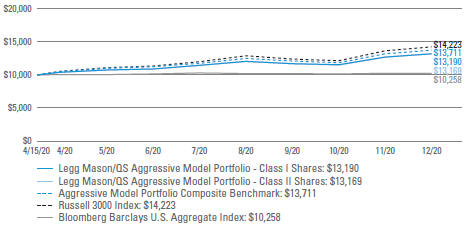
All figures represent past performance and are not a guarantee of future results. Investment return and principal value of an investment will fluctuate so that an investor’s shares, when redeemed, may be worth more or less than their original cost. The returns shown do not reflect expenses associated with separate accounts such as administrative fees, account charges and surrender charges, which, if reflected, would reduce the total returns. Performance figures may reflect compensating balance arrangements, fee waivers and/or expense reimbursements. In the absence of compensating balance arrangements, fee waivers and/or expense reimbursements, the total return would have been lower.
| † | Hypothetical illustration of $10,000 invested in Class I and Class II shares of Legg Mason/QS Aggressive Model Portfolio on April 15, 2020 (inception date), assuming the reinvestment of all distributions, including returns of capital, if any, at net asset value through December 31, 2020. The hypothetical illustration also assumes a $10,000 investment in the Bloomberg Barclays U.S. Aggregate Index, the Russell 3000 Index and the Aggressive Model Portfolio Composite Benchmark. The Bloomberg Barclays U.S. Aggregate Index is a broad-based bond index comprised of government, corporate, mortgage-and asset-backed issues, rated investment grade or higher, and having at least one year to maturity. The Russell 3000 Index measures the performance of the 3,000 largest U.S companies based on total market capitalization, which represents approximately 98% of the U.S. equity market. The Aggressive Model Portfolio Composite Benchmark is a hypothetical representation of the performance of the Portfolio’s major asset classes. It consists of 75% Russell 3000 Index, 15% MSCI World Ex U.S.A. Index and 10% Bloomberg Barclays U.S. Aggregate Index. The MSCI World Ex U.S.A. Index captures large-, mid-and small-cap representation across 22 of 23 developed markets countries – excluding the United States. The MSCI World Ex U.S.A. Index calculates performance utilizing local currencies taking out the effect of converting to the U.S. dollar. The Indices are unmanaged and are not subject to the same management and trading expenses as a mutual fund. Please note that an investor cannot invest directly in an index. |
| | |
| | |
| Legg Mason/QS Model Portfolio Funds 2020 Annual Report | | 29 |
Portfolios performance (unaudited)
Legg Mason/QS Moderately Aggressive Model Portfolio
| | | | | | | | |
| Average annual total returns1 | |
| | | Class I† | | | Class II† | |
| Inception* through 12/31/20 | | | 25.99 | % | | | 25.69 | % |
| | | | |
| Cumulative total returns1 | | | |
| Class I (Inception date of 4/15/20 through 12/31/20) | | | 25.99 | % |
| Class II (Inception date of 4/15/20 through 12/31/20) | | | 25.69 | |
All figures represent past performance and are not a guarantee of future results. Investment return and principal value of an investment will fluctuate so that an investor’s shares, when redeemed, may be worth more or less than their original cost. The returns shown do not reflect expenses associated with separate accounts such as administrative fees, account charges and surrender charges, which, if reflected, would reduce the total returns. Performance figures may reflect compensating balance arrangements, fee waivers and/or expense reimbursements. In the absence of compensating balance arrangements, fee waivers and/or expense reimbursements, the total return would have been lower.
| 1 | Assumes the reinvestment of all distributions, including returns of capital, if any, at net asset value. |
| * | Inception date for Class I and Class II shares is April 15, 2020. |
| | |
| | |
| 30 | | Legg Mason/QS Model Portfolio Funds 2020 Annual Report |
Legg Mason/QS Moderately Aggressive Model Portfolio
Historical performance
Value of $10,000 invested in
Class I and Class II Shares of Legg Mason/QS Moderately Aggressive Model Portfolio vs. Benchmark Indices† — April 15, 2020 - December 31, 2020
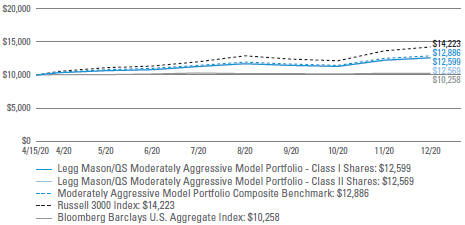
All figures represent past performance and are not a guarantee of future results. Investment return and principal value of an investment will fluctuate so that an investor’s shares, when redeemed, may be worth more or less than their original cost. The returns shown do not reflect expenses associated with separate accounts such as administrative fees, account charges and surrender charges, which, if reflected, would reduce the total returns. Performance figures may reflect compensating balance arrangements, fee waivers and/or expense reimbursements. In the absence of compensating balance arrangements, fee waivers and/or expense reimbursements, the total return would have been lower.
| † | Hypothetical illustration of $10,000 invested in Class I and Class II shares of Legg Mason/QS Moderately Aggressive Model Portfolio on April 15, 2020 (inception date), assuming the reinvestment of all distributions, including returns of capital, if any, at net asset value through December 31, 2020. The hypothetical illustration also assumes a $10,000 investment in the Bloomberg Barclays U.S. Aggregate Index, the Russell 3000 Index and the Moderately Aggressive Model Portfolio Composite Benchmark. The Bloomberg Barclays U.S. Aggregate Index is a broad-based bond index comprised of government, corporate, mortgage- and asset-backed issues, rated investment grade or higher, and having at least one year to maturity. The Russell 3000 Index measures the performance of the 3,000 largest U.S companies based on total market capitalization, which represents approximately 98% of the U.S. equity market. The Moderately Aggressive Model Portfolio Composite Benchmark is a hypothetical representation of the performance of the Portfolio’s major asset classes. It consists of 60% Russell 3000 Index, 10% MSCI World Ex U.S.A. Index and 30% Bloomberg Barclays U.S. Aggregate Index. The MSCI World Ex U.S.A. Index captures large-, mid-and small-cap representation across 22 of 23 developed markets countries – excluding the United States. The MSCI World Ex U.S.A. Index calculates performance utilizing local currencies taking out the effect of converting to the U.S. dollar. The Indices are unmanaged and are not subject to the same management and trading expenses as a mutual fund. Please note that an investor cannot invest directly in an index. |
| | |
| | |
| Legg Mason/QS Model Portfolio Funds 2020 Annual Report | | 31 |
Portfolios performance (unaudited)
Legg Mason/QS Moderate Model Portfolio
| | | | | | | | |
| Average annual total returns1 | | | | | | |
| | | Class I† | | | Class II† | |
| Inception* through 12/31/20 | | | 19.95 | % | | | 19.65 | % |
| | | | | | | | |
| Cumulative total returns1 | | | | | | |
| Class I (Inception date of 4/15/20 through 12/31/20) | | | | | | | 19.95 | % |
| Class II (Inception date of 4/15/20 through 12/31/20) | | | | | | | 19.65 | |
All figures represent past performance and are not a guarantee of future results. Investment return and principal value of an investment will fluctuate so that an investor’s shares, when redeemed, may be worth more or less than their original cost. The returns shown do not reflect expenses associated with separate accounts such as administrative fees, account charges and surrender charges, which, if reflected, would reduce the total returns. Performance figures may reflect compensating balance arrangements, fee waivers and/or expense reimbursements. In the absence of compensating balance arrangements, fee waivers and/or expense reimbursements, the total return would have been lower.
| 1 | Assumes the reinvestment of all distributions, including returns of capital, if any, at net asset value. |
| * | Inception date for Class I and Class II shares is April 15, 2020. |
| | |
| | |
| 32 | | Legg Mason/QS Model Portfolio Funds 2020 Annual Report |
Legg Mason/QS Moderate Model Portfolio
Historical performance
Value of $10,000 invested in
Class I and Class II Shares of Legg Mason/QS Moderate Model Portfolio vs. Benchmark Indices† — April 15, 2020 - December 31, 2020
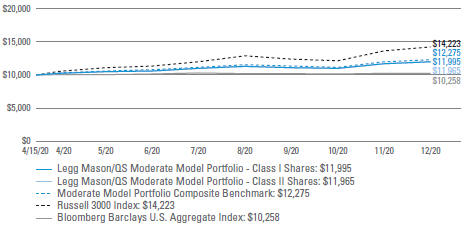
All figures represent past performance and are not a guarantee of future results. Investment return and principal value of an investment will fluctuate so that an investor’s shares, when redeemed, may be worth more or less than their original cost. The returns shown do not reflect expenses associated with separate accounts such as administrative fees, account charges and surrender charges, which, if reflected, would reduce the total returns. Performance figures may reflect compensating balance arrangements, fee waivers and/or expense reimbursements. In the absence of compensating balance arrangements, fee waivers and/or expense reimbursements, the total return would have been lower.
| † | Hypothetical illustration of $10,000 invested in Class I and Class II shares of Legg Mason/QS Moderate Model Portfolio on April 15, 2020 (inception date), assuming the reinvestment of all distributions, including returns of capital, if any, at net asset value through December 31, 2020. The hypothetical illustration also assumes a $10,000 investment in the Bloomberg Barclays U.S. Aggregate Index, the Russell 3000 Index and the Moderate Model Portfolio Composite Benchmark. The Bloomberg Barclays U.S. Aggregate Index is a broad-based bond index comprised of government, corporate, mortgage-and asset-backed issues, rated investment grade or higher, and having at least one year to maturity. The Russell 3000 Index measures the performance of the 3,000 largest U.S companies based on total market capitalization, which represents approximately 98% of the U.S. equity market. The Moderate Model Portfolio Composite Benchmark is a hypothetical representation of the performance of the Portfolio’s major asset classes. It consists of 45% Russell 3000 Index, 10% MSCI World Ex U.S.A. Index and 45% Bloomberg Barclays U.S. Aggregate Index. The MSCI World Ex U.S.A. Index captures large-, mid-and small-cap representation across 22 of 23 developed markets countries – excluding the United States. The MSCI World Ex U.S.A. Index calculates performance utilizing local currencies taking out the effect of converting to the U.S. dollar. The Indices are unmanaged and are not subject to the same management and trading expenses as a mutual fund. Please note that an investor cannot invest directly in an index. |
| | |
| | |
| Legg Mason/QS Model Portfolio Funds 2020 Annual Report | | 33 |
Portfolios performance (unaudited)
Legg Mason/QS Moderately Conservative Model Portfolio
| | | | | | | | |
| Average annual total returns1 | | | | | | |
| | | Class I† | | | Class II† | |
| Inception* through 12/31/20 | | | 16.43 | % | | | 16.32 | % |
| | | | | | | | |
| Cumulative total returns1 | | | | | | |
| Class I (Inception date of 4/15/20 through 12/31/20) | | | | | | | 16.43 | % |
| Class II (Inception date of 4/15/20 through 12/31/20) | | | | | | | 16.32 | |
All figures represent past performance and are not a guarantee of future results. Investment return and principal value of an investment will fluctuate so that an investor’s shares, when redeemed, may be worth more or less than their original cost. The returns shown do not reflect expenses associated with separate accounts such as administrative fees, account charges and surrender charges, which, if reflected, would reduce the total returns. Performance figures may reflect compensating balance arrangements, fee waivers and/or expense reimbursements. In the absence of compensating balance arrangements, fee waivers and/or expense reimbursements, the total return would have been lower.
| 1 | Assumes the reinvestment of all distributions, including returns of capital, if any, at net asset value. |
| * | Inception date for Class I and Class II shares is April 15, 2020. |
| | |
| | |
| 34 | | Legg Mason/QS Model Portfolio Funds 2020 Annual Report |
Legg Mason/QS Moderately Conservative Model Portfolio
Historical performance
Value of $10,000 invested in
Class I and Class II Shares of Legg Mason/QS Moderately Conservative Model Portfolio vs. Benchmark Indices† — April 15, 2020 - December 31, 2020
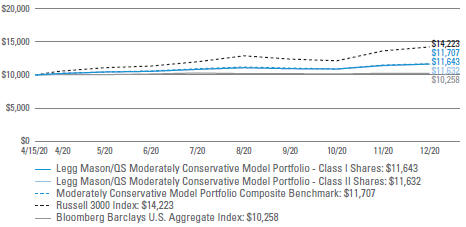
All figures represent past performance and are not a guarantee of future results. Investment return and principal value of an investment will fluctuate so that an investor’s shares, when redeemed, may be worth more or less than their original cost. The returns shown do not reflect expenses associated with separate accounts such as administrative fees, account charges and surrender charges, which, if reflected, would reduce the total returns. Performance figures may reflect compensating balance arrangements, fee waivers and/or expense reimbursements. In the absence of compensating balance arrangements, fee waivers and/or expense reimbursements, the total return would have been lower.
| † | Hypothetical illustration of $10,000 invested in Class I and Class II shares of Legg Mason/QS Moderately Conservative Model Portfolio on April 15, 2020 (inception date), assuming the reinvestment of all distributions, including returns of capital, if any, at net asset value through December 31, 2020. The hypothetical illustration also assumes a $10,000 investment in the Bloomberg Barclays U.S. Aggregate Index, the Russell 3000 Index and Moderately Conservative Model Portfolio Composite Benchmark. The Bloomberg Barclays U.S. Aggregate Index is a broad-based bond index comprised of government, corporate, mortgage- and asset-backed issues, rated investment grade or higher, and having at least one year to maturity. The Russell 3000 Index measures the performance of the 3,000 largest U.S companies based on total market capitalization, which represents approximately 98% of the U.S. equity market. The Moderately Conservative Model Portfolio Composite Benchmark is a hypothetical representation of the performance of the Portfolio’s major asset classes. It consists of 35% Russell 3000 Index, 5% MSCI World Ex U.S.A. Index and 60% Bloomberg Barclays U.S. Aggregate Index. The MSCI World Ex U.S.A. Index captures large-, mid-and small-cap representation across 22 of 23 developed markets countries – excluding the United States. The MSCI World Ex U.S.A. Index calculates performance utilizing local currencies taking out the effect of converting to the U.S. dollar. The Indices are unmanaged and are not subject to the same management and trading expenses as a mutual fund. Please note that an investor cannot invest directly in an index. |
| | |
| | |
| Legg Mason/QS Model Portfolio Funds 2020 Annual Report | | 35 |
Portfolios performance (unaudited)
Legg Mason/QS Conservative Model Portfolio
| | | | | | | | |
| Average annual total returns1 | | | | | | |
| | | Class I† | | | Class II† | |
| Inception* through 12/31/20 | | | 10.99 | % | | | 10.78 | % |
| | | | | | | | |
| Cumulative total returns1 | | | | | | |
| Class I (Inception date of 4/15/20 through 12/31/20) | | | | | | | 10.99 | % |
| Class II (Inception date of 4/15/20 through 12/31/20) | | | | | | | 10.78 | |
All figures represent past performance and are not a guarantee of future results. Investment return and principal value of an investment will fluctuate so that an investor’s shares, when redeemed, may be worth more or less than their original cost. The returns shown do not reflect expenses associated with separate accounts such as administrative fees, account charges and surrender charges, which, if reflected, would reduce the total returns. Performance figures may reflect compensating balance arrangements, fee waivers and/or expense reimbursements. In the absence of compensating balance arrangements, fee waivers and/or expense reimbursements, the total return would have been lower.
| 1 | Assumes the reinvestment of all distributions, including returns of capital, if any, at net asset value. |
| * | Inception date for Class I and Class II shares is April 15, 2020. |
| | |
| | |
| 36 | | Legg Mason/QS Model Portfolio Funds 2020 Annual Report |
Legg Mason/QS Conservative Model Portfolio
Historical performance
Value of $10,000 invested in
Class I and Class II Shares of Legg Mason/QS Conservative Model Portfolio vs. Benchmark Indices† — April 15, 2020 - December 31, 2020
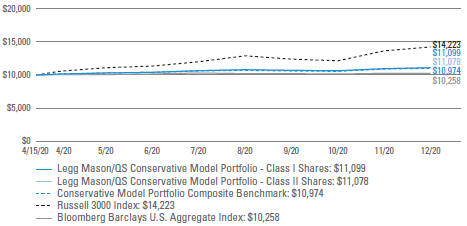
All figures represent past performance and are not a guarantee of future results. Investment return and principal value of an investment will fluctuate so that an investor’s shares, when redeemed, may be worth more or less than their original cost. The returns shown do not reflect expenses associated with separate accounts such as administrative fees, account charges and surrender charges, which, if reflected, would reduce the total returns. Performance figures may reflect compensating balance arrangements, fee waivers and/or expense reimbursements. In the absence of compensating balance arrangements, fee waivers and/or expense reimbursements, the total return would have been lower.
| † | Hypothetical illustration of $10,000 invested in Class I and Class II shares of Legg Mason/QS Conservative Model Portfolio on April 15, 2020 (inception date), assuming the reinvestment of all distributions, including returns of capital, if any, at net asset value through December 31, 2020. The hypothetical illustration also assumes a $10,000 investment in the Bloomberg Barclays U.S. Aggregate Index, the Russell 3000 Index and the Conservative Model Portfolio Composite Benchmark. The Bloomberg Barclays U.S. Aggregate Index is a broad-based bond index comprised of government, corporate, mortgage-and asset-backed issues, rated investment grade or higher, and having at least one year to maturity. The Russell 3000 Index measures the performance of the 3,000 largest U.S companies based on total market capitalization, which represents approximately 98% of the U.S. equity market. The Conservative Model Portfolio Composite Benchmark is a hypothetical representation of the performance of the Portfolio’s major asset classes. It consists of 20% Russell 3000 Index and 80% Bloomberg Barclays U.S. Aggregate Index. The Indices are unmanaged and are not subject to the same management and trading expenses as a mutual fund. Please note that an investor cannot invest directly in an index. |
| | |
| | |
| Legg Mason/QS Model Portfolio Funds 2020 Annual Report | | 37 |
Schedules of investments
December 31, 2020
Legg Mason/QS Aggressive Model Portfolio
| | | | | | | | | | | | |
| Description | | | | | Shares | | | Value | |
| Investments in Underlying Funds — 97.6% | | | | | | | | | | | | |
American Funds Insurance Series: | | | | | | | | | | | | |
Blue Chip Income and Growth Fund, Class 1A | | | | | | | 101,006 | | | $ | 1,442,362 | |
Growth Fund, Class 1A | | | | | | | 43,650 | | | | 5,220,101 | |
New World Fund, Class 1A | | | | | | | 131,256 | | | | 4,125,387 | |
BNY Mellon Investment Portfolios — Technology Growth Portfolio, Initial Shares | | | | | | | 68,105 | | | | 2,498,072 | |
Delaware VIP Trust — Delaware VIP Small Cap Value Series, Standard Class | | | | | | | 63,100 | | | | 2,155,482 | |
Janus Aspen Series — Janus Henderson VIT Global Research Portfolio, Institutional Shares | | | | | | | 33,831 | | | | 2,152,303 | |
MainStay VP Funds Trust: | | | | | | | | | | | | |
MainStay VP Epoch U.S. Equity Yield Portfolio, Initial Class | | | | | | | 251,196 | | | | 3,799,723 | |
MainStay VP Fidelity Institutional AM Utilities Portfolio, Initial Class | | | | | | | 530,676 | | | | 6,552,360 | |
MainStay VP MacKay Common Stock Portfolio, Initial Class | | | | | | | 299,425 | | | | 8,467,522 | |
MainStay VP MacKay S&P 500 Index Portfolio, Initial Class | | | | | | | 151,511 | | | | 10,818,880 | |
MainStay VP Winslow Large Cap Growth Portfolio, Initial Class | | | | | | | 125,906 | | | | 4,125,039 | |
Variable Insurance Products Fund — VIP Equity-Income Portfolio, Initial Class | | | | | | | 392,398 | | | | 9,378,316 | |
Variable Insurance Products Fund II: | | | | | | | | | | | | |
VIP Bond Index Portfolio, Initial Class | | | | | | | 472,584 | | | | 5,363,832 | |
VIP Contrafund® Portfolio, Initial Class | | | | | | | 59,768 | | | | 2,879,009 | (a) |
VIP International Index Portfolio, Initial Class | | | | | | | 147,848 | | | | 1,618,936 | |
Variable Insurance Products Fund III — VIP Growth Opportunities Portfolio, Initial Class | | | | | | | 18,481 | | | | 1,433,034 | |
Total Investments in Underlying Funds before Short-Term Investments (Cost — $65,554,892) | | | | | | | | 72,030,358 | |
| | | |
| | | Rate | | | | | | | |
| Short-Term Investments — 1.9% | | | | | | | | | | | | |
Blackrock Liquidity Funds — Treasury Trust Fund, Institutional Shares
(Cost — $1,374,832) | | | 0.015 | % | | | 1,374,832 | | | | 1,374,832 | |
Total Investments — 99.5% (Cost — $66,929,724) | | | | | | | | | | | 73,405,190 | |
Other Assets in Excess of Liabilities — 0.5% | | | | | | | | | | | 365,220 | |
Total Net Assets — 100.0% | | | | | | | | | | $ | 73,770,410 | |
| (a) | Contrafund is a registered service mark of FMR LLC. |
See Notes to Financial Statements.
| | |
| | |
| 38 | | Legg Mason/QS Model Portfolio Funds 2020 Annual Report |
Legg Mason/QS Moderately Aggressive Model Portfolio
| | | | | | | | | | | | |
| Description | | | | | Shares | | | Value | |
| Investments in Underlying Funds — 98.6% | | | | | | | | | | | | |
American Funds Insurance Series: | | | | | | | | | | | | |
Blue Chip Income and Growth Fund, Class 1A | | | | | | | 372,632 | | | $ | 5,321,185 | |
Growth Fund, Class 1A | | | | | | | 116,843 | | | | 13,973,311 | |
New World Fund, Class 1A | | | | | | | 213,254 | | | | 6,702,586 | |
BNY Mellon Investment Portfolios — Technology Growth Portfolio, Initial Shares | | | | | | | 162,720 | | | | 5,968,587 | |
Columbia Funds Variable Series Trust II — Columbia Variable Portfolio — Emerging Markets Bond Fund, Class I | | | | | | | 1,336,260 | | | | 13,322,509 | |
Delaware VIP Trust — Delaware VIP Small Cap Value Series, Standard Class | | | | | | | 173,201 | | | | 5,916,531 | |
Janus Aspen Series — Janus Henderson VIT Global Research Portfolio, Institutional Shares | | | | | | | 83,435 | | | | 5,308,140 | |
MainStay VP Funds Trust: | | | | | | | | | | | | |
MainStay VP Bond Portfolio, Initial Class | | | | | | | 1,427,848 | | | | 21,944,317 | |
MainStay VP Epoch U.S. Equity Yield Portfolio, Initial Class | | | | | | | 1,011,792 | | | | 15,304,867 | |
MainStay VP Fidelity Institutional AM Utilities Portfolio, Initial Class | | | | | | | 1,250,494 | | | | 15,440,093 | |
MainStay VP MacKay Common Stock Portfolio, Initial Class | | | | | | | 888,138 | | | | 25,115,933 | |
MainStay VP MacKay Government Portfolio, Initial Class | | | | | | | 474,067 | | | | 5,315,383 | |
MainStay VP MacKay S&P 500 Index Portfolio, Initial Class | | | | | | | 468,201 | | | | 33,432,524 | |
MainStay VP Winslow Large Cap Growth Portfolio, Initial Class | | | | | | | 341,804 | | | | 11,198,458 | |
PIMCO Variable Insurance Trust — PIMCO International Bond Portfolio (U.S. Dollar-Hedged), Institutional Class | | | | | | | 1,183,590 | | | | 13,303,557 | |
Variable Insurance Products Fund — VIP Equity-Income Portfolio, Initial Class | | | | | | | 945,039 | | | | 22,586,424 | |
Variable Insurance Products Fund II: | | | | | | | | | | | | |
VIP Bond Index Portfolio, Initial Class | | | | | | | 2,342,534 | | | | 26,587,760 | |
VIP Contrafund® Portfolio, Initial Class | | | | | | | 164,244 | | | | 7,911,629 | (a) |
VIP International Index Portfolio, Initial Class | | | | | | | 519,353 | | | | 5,686,916 | |
Variable Insurance Products Fund III — VIP Growth Opportunities Portfolio, Initial Class | | | | | | | 68,240 | | | | 5,291,307 | |
Total Investments in Underlying Funds before Short-Term Investments (Cost — $246,893,804) | | | | | | | | | | | 265,632,017 | |
| | | |
| | | Rate | | | | | | | |
| Short-Term Investments — 0.9% | | | | | | | | | | | | |
Blackrock Liquidity Funds — Treasury Trust Fund, Institutional Shares
(Cost — $2,325,305) | | | 0.015 | % | | | 2,325,305 | | | | 2,325,305 | |
Total Investments — 99.5% (Cost — $249,219,109) | | | | | | | | | | | 267,957,322 | |
Other Assets in Excess of Liabilities — 0.5% | | | | | | | | | | | 1,419,736 | |
Total Net Assets — 100.0% | | | | | | | | | | $ | 269,377,058 | |
| (a) | Contrafund is a registered service mark of FMR LLC. |
See Notes to Financial Statements.
| | |
| | |
| Legg Mason/QS Model Portfolio Funds 2020 Annual Report | | 39 |
Schedules of investments (cont’d)
December 31, 2020
Legg Mason/QS Moderate Model Portfolio
| | | | | | | | | | | | |
| Description | | | | | Shares | | | Value | |
| Investments in Underlying Funds — 99.3% | | | | | | | | | | | | |
American Funds Insurance Series: | | | | | | | | | | | | |
Blue Chip Income and Growth Fund, Class 1A | | | | | | | 423,078 | | | $ | 6,041,557 | |
Growth Fund, Class 1A | | | | | | | 83,963 | | | | 10,041,081 | |
BNY Mellon Investment Portfolios — Technology Growth Portfolio, Initial Shares | | | | | | | 162,903 | | | | 5,975,274 | |
Columbia Funds Variable Series Trust II — Columbia Variable Portfolio — Emerging Markets Bond Fund, Class I | | | | | | | 1,079,068 | | | | 10,758,306 | |
Delaware VIP Trust — Delaware VIP Small Cap Value Series, Standard Class | | | | | | | 176,087 | | | | 6,015,139 | |
MainStay VP Funds Trust: | | | | | | | | | | | | |
MainStay VP Bond Portfolio, Initial Class | | | | | | | 2,258,052 | | | | 34,703,545 | |
MainStay VP Epoch U.S. Equity Yield Portfolio, Initial Class | | | | | | | 845,059 | | | | 12,782,785 | |
MainStay VP Fidelity Institutional AM Utilities Portfolio, Initial Class | | | | | | | 1,206,431 | | | | 14,896,039 | |
MainStay VP MacKay Common Stock Portfolio, Initial Class | | | | | | | 829,425 | | | | 23,455,561 | |
MainStay VP MacKay Government Portfolio, Initial Class | | | | | | | 1,784,971 | | | | 20,013,626 | |
MainStay VP MacKay S&P 500 Index Portfolio, Initial Class | | | | | | | 484,786 | | | | 34,616,839 | |
MainStay VP Winslow Large Cap Growth Portfolio, Initial Class | | | | | | | 346,239 | | | | 11,343,766 | |
PIMCO Variable Insurance Trust — PIMCO International Bond Portfolio (U.S. Dollar-Hedged), Institutional Class | | | | | | | 2,493,502 | | | | 28,026,968 | |
Variable Insurance Products Fund — VIP Equity-Income Portfolio, Initial Class | | | | | | | 421,315 | | | | 10,069,438 | |
Variable Insurance Products Fund II: | | | | | | | | | | | | |
VIP Bond Index Portfolio, Initial Class | | | | | | | 1,994,820 | | | | 22,641,203 | |
VIP Contrafund® Portfolio, Initial Class | | | | | | | 152,702 | | | | 7,355,679 | (a) |
VIP International Index Portfolio, Initial Class | | | | | | | 815,716 | | | | 8,932,091 | |
Total Investments in Underlying Funds before Short-Term Investments (Cost — $253,848,971) | | | | | | | | | | | 267,668,897 | |
| | | |
| | | Rate | | | | | | | |
| Short-Term Investments — 1.7% | | | | | | | | | | | | |
Blackrock Liquidity Funds — Treasury Trust Fund, Institutional Shares
(Cost — $4,658,997) | | | 0.015 | % | | | 4,658,997 | | | | 4,658,997 | |
Total Investments — 101.0% (Cost — $258,507,968) | | | | | | | | | | | 272,327,894 | |
Liabilities in Excess of Other Assets — (1.0)% | | | | | | | | | | | (2,695,241 | ) |
Total Net Assets — 100.0% | | | | | | | | | | $ | 269,632,653 | |
| (a) | Contrafund is a registered service mark of FMR LLC. |
See Notes to Financial Statements.
| | |
| | |
| 40 | | Legg Mason/QS Model Portfolio Funds 2020 Annual Report |
Legg Mason/QS Moderately Conservative Model Portfolio
| | | | | | | | | | | | |
| Description | | | | | Shares | | | Value | |
| Investments in Underlying Funds — 99.8% | | | | | | | | | | | | |
American Funds Insurance Series, Growth Fund, Class 1A | | | | | | | 24,520 | | | $ | 2,932,373 | |
BlackRock Variable Series Funds II, Inc. — BlackRock High Yield V.I. Fund, Class I | | | | | | | 344,190 | | | | 2,602,074 | |
BNY Mellon Investment Portfolios — Technology Growth Portfolio, Initial Shares | | | | | | | 79,416 | | | | 2,912,963 | |
Columbia Funds Variable Series Trust II — Columbia Variable Portfolio — Emerging Markets Bond Fund, Class I | | | | | | | 262,984 | | | | 2,621,953 | |
Delaware VIP Trust — Delaware VIP Small Cap Value Series, Standard Class | | | | | | | 85,822 | | | | 2,931,681 | |
MainStay VP Funds Trust: | | | | | | | | | | | | |
MainStay VP Bond Portfolio, Initial Class | | | | | | | 1,269,047 | | | | 19,503,725 | |
MainStay VP Fidelity Institutional AM Utilities Portfolio, Initial Class | | | | | | | 453,945 | | | | 5,604,947 | |
MainStay VP MacKay Common Stock Portfolio, Initial Class | | | | | | | 357,879 | | | | 10,120,565 | |
MainStay VP MacKay Government Portfolio, Initial Class | | | | | | | 1,623,055 | | | | 18,198,177 | |
MainStay VP MacKay High Yield Corporate Bond Portfolio, Initial Class | | | | | | | 262,685 | | | | 2,599,090 | |
MainStay VP MacKay S&P 500 Index Portfolio, Initial Class | | | | | | | 212,281 | | | | 15,158,231 | |
MainStay VP Winslow Large Cap Growth Portfolio, Initial Class | | | | | | | 89,322 | | | | 2,926,451 | |
PIMCO Variable Insurance Trust — PIMCO International Bond Portfolio (U.S. Dollar-Hedged), Institutional Class | | | | | | | 1,734,922 | | | | 19,500,522 | |
Variable Insurance Products Fund — VIP Equity-Income Portfolio, Initial Class | | | | | | | 150,378 | | | | 3,594,024 | |
Variable Insurance Products Fund II: | | | | | | | | | | | | |
VIP Bond Index Portfolio, Initial Class | | | | | | | 961,414 | | | | 10,912,048 | |
VIP Contrafund® Portfolio, Initial Class | | | | | | | 60,830 | | | | 2,930,162 | (a) |
VIP International Index Portfolio, Initial Class | | | | | | | 472,641 | | | | 5,175,424 | |
Total Investments in Underlying Funds before Short-Term Investments (Cost — $124,509,936) | | | | | | | | 130,224,410 | |
| | | |
| | | Rate | | | | | | | |
| Short-Term Investments — 1.8% | | | | | | | | | | | | |
Blackrock Liquidity Funds — Treasury Trust Fund, Institutional Shares
(Cost — $2,424,493) | | | 0.015 | % | | | 2,424,493 | | | | 2,424,493 | |
Total Investments — 101.6% (Cost — $126,934,429) | | | | | | | | | | | 132,648,903 | |
Liabilities in Excess of Other Assets — (1.6)% | | | | | | | | | | | (2,113,292 | ) |
Total Net Assets — 100.0% | | | | | | | | | | $ | 130,535,611 | |
| (a) | Contrafund is a registered service mark of FMR LLC. |
See Notes to Financial Statements.
| | |
| | |
| Legg Mason/QS Model Portfolio Funds 2020 Annual Report | | 41 |
Schedules of investments (cont’d)
December 31, 2020
Legg Mason/QS Conservative Model Portfolio
| | | | | | | | | | | | |
| Description | | | | | Shares | | | Value | |
| Investments in Underlying Funds — 99.7% | | | | | | | | | | | | |
BlackRock Variable Series Funds II, Inc. — BlackRock High Yield V.I. Fund, Class I | | | | | | | 438,975 | | | $ | 3,318,647 | |
MainStay VP Funds Trust: | | | | | | | | | | | | |
MainStay VP Bond Portfolio, Initial Class | | | | | | | 809,214 | | | | 12,436,645 | |
MainStay VP MacKay Common Stock Portfolio, Initial Class | | | | | | | 293,518 | | | | 8,300,478 | |
MainStay VP MacKay Government Portfolio, Initial Class | | | | | | | 1,107,715 | | | | 12,420,033 | |
MainStay VP MacKay High Yield Corporate Bond Portfolio, Initial Class | | | | | | | 922,165 | | | | 9,124,179 | |
MainStay VP MacKay S&P 500 Index Portfolio, Initial Class | | | | | | | 128,908 | | | | 9,204,881 | |
PIMCO Variable Insurance Trust: | | | | | | | | | | | | |
PIMCO International Bond Portfolio (U.S. Dollar-Hedged), Institutional Class | | | | | | | 996,265 | | | | 11,198,023 | |
PIMCO Total Return Portfolio, Institutional Class | | | | | | | 823,171 | | | | 9,540,548 | |
Variable Insurance Products Fund II, VIP Bond Index Portfolio, Initial Class | | | | | | | 652,378 | | | | 7,404,491 | |
Total Investments in Underlying Funds before Short-Term Investments (Cost — $81,140,585) | | | | | | | | | | | 82,947,925 | |
| | | |
| | | Rate | | | | | | | |
| Short-Term Investments — 0.3% | | | | | | | | | | | | |
Blackrock Liquidity Funds — Treasury Trust Fund, Institutional Shares
(Cost — $230,241) | | | 0.015 | % | | | 230,241 | | | | 230,241 | |
Total Investments — 100.0% (Cost — $81,370,826) | | | | | | | | | | | 83,178,166 | |
Other Assets in Excess of Liabilities — 0.0%†† | | | | | | | | | | | 17,581 | |
Total Net Assets — 100.0% | | | | | | | | | | $ | 83,195,747 | |
| †† | Represents less than 0.1%. |
See Notes to Financial Statements.
| | |
| | |
| 42 | | Legg Mason/QS Model Portfolio Funds 2020 Annual Report |
Statements of assets and liabilities
December 31, 2020
| | | | | | | | | | | | |
| | | Legg Mason/QS Aggressive
Model Portfolio | | | Legg Mason/QS Moderately
Aggressive
Model Portfolio | | | Legg Mason/QS
Moderate Model Portfolio | |
| | | |
| Assets: | | | | | | | | | | | | |
Investments in Underlying Funds, at cost | | $ | 66,929,724 | | | $ | 249,219,109 | | | $ | 258,507,968 | |
Investments in Underlying Funds, at value | | | 73,405,190 | | | | 267,957,322 | | | | 272,327,894 | |
Receivable for Portfolio shares sold | | | 1,429,026 | | | | 1,536,935 | | | | 737,518 | |
Interest receivable | | | 14 | | | | 49 | | | | 50 | |
Distributions receivable from Underlying Funds | | | — | | | | 114,042 | | | | 102,872 | |
Prepaid expenses | | | 446 | | | | 857 | | | | 828 | |
Total Assets | | | 74,834,676 | | | | 269,609,205 | | | | 273,169,162 | |
| | | |
| Liabilities: | | | | | | | | | | | | |
Payable for investments in Underlying Funds | | | 1,015,000 | | | | 115,299 | | | | 3,420,483 | |
Service and/or distribution fees payable | | | 13,077 | | | | 50,556 | | | | 49,710 | |
Audit and tax fees payable | | | 11,886 | | | | 11,885 | | | | 11,886 | |
Legal fees payable | | | 9,168 | | | | 7,805 | | | | 7,937 | |
Shareholder reports payable | | | 6,323 | | | | 5,117 | | | | 5,900 | |
Fund accounting fees payable | | | 5,023 | | | | 5,078 | | | | 5,056 | |
Investment management fee payable | | | 3,089 | | | | 35,749 | | | | 34,859 | |
Trustees’ fees payable | | | 179 | | | | 129 | | | | 173 | |
Accrued expenses | | | 521 | | | | 529 | | | | 505 | |
Total Liabilities | | | 1,064,266 | | | | 232,147 | | | | 3,536,509 | |
| Total Net Assets | | $ | 73,770,410 | | | $ | 269,377,058 | | | $ | 269,632,653 | |
| | | |
| Net Assets: | | | | | | | | | | | | |
Par value (Note 7) | | $ | 57 | | | $ | 218 | | | $ | 229 | |
Paid-in capital in excess of par value | | | 67,282,477 | | | | 250,583,338 | | | | 255,942,677 | |
Total distributable earnings (loss) | | | 6,487,876 | | | | 18,793,502 | | | | 13,689,747 | |
| Total Net Assets | | $ | 73,770,410 | | | $ | 269,377,058 | | | $ | 269,632,653 | |
| | | |
| Net Assets: | | | | | | | | | | | | |
Class I | | | $2,154,597 | | | | $3,117,839 | | | | $2,187,663 | |
Class II | | | $71,615,813 | | | | $266,259,219 | | | | $267,444,990 | |
| | | |
| Shares Outstanding: | | | | | | | | | | | | |
Class I | | | 166,473 | | | | 251,657 | | | | 185,444 | |
Class II | | | 5,537,088 | | | | 21,519,611 | | | | 22,704,115 | |
| | | |
| Net Asset Value: | | | | | | | | | | | | |
Class I | | | $12.94 | | | | $12.39 | | | | $11.80 | |
Class II | | | $12.93 | | | | $12.37 | | | | $11.78 | |
See Notes to Financial Statements.
| | |
| | |
| Legg Mason/QS Model Portfolio Funds 2020 Annual Report | | 43 |
Statements of assets and liabilities (cont’d)
December 31, 2020
| | | | | | | | |
| | | Legg Mason/QS
Moderately
Conservative
Model Portfolio | | | Legg Mason/QS
Conservative
Model Portfolio | |
| | |
| Assets: | | | | | | | | |
Investments in Underlying Funds, at cost | | $ | 126,934,429 | | | $ | 81,370,826 | |
Investments in Underlying Funds, at value | | | 132,648,903 | | | | 83,178,166 | |
Distributions receivable from Underlying Funds | | | 45,035 | | | | 36,868 | |
Interest receivable | | | 22 | | | | 11 | |
Receivable for Portfolio shares sold | | | — | | | | 62,701 | |
Prepaid expenses | | | 529 | | | | 375 | |
Total Assets | | | 132,694,489 | | | | 83,278,121 | |
| | |
| Liabilities: | | | | | | | | |
Payable for investments in Underlying Funds | | | 1,812,284 | | | | 26,782 | |
Payable for Portfolio shares repurchased | | | 275,468 | | | | 3 | |
Service and/or distribution fees payable | | | 24,950 | | | | 16,440 | |
Investment management fee payable | | | 13,517 | | | | 5,935 | |
Audit and tax fees payable | | | 11,886 | | | | 11,886 | |
Legal fees payable | | | 8,811 | | | | 9,229 | |
Shareholder reports payable | | | 6,236 | | | | 6,428 | |
Fund accounting fees payable | | | 5,042 | | | | 5,002 | |
Trustees’ fees payable | | | 164 | | | | 184 | |
Accrued expenses | | | 520 | | | | 485 | |
Total Liabilities | | | 2,158,878 | | | | 82,374 | |
| Total Net Assets | | $ | 130,535,611 | | | $ | 83,195,747 | |
| | |
| Net Assets: | | | | | | | | |
Par value (Note 7) | | $ | 114 | | | $ | 76 | |
Paid-in capital in excess of par value | | | 124,917,910 | | | | 81,439,995 | |
Total distributable earnings (loss) | | | 5,617,587 | | | | 1,755,676 | |
| Total Net Assets | | $ | 130,535,611 | | | $ | 83,195,747 | |
| | |
| Net Assets: | | | | | | | | |
Class I | | | $1,050,327 | | | | $1,052,580 | |
Class II | | | $129,485,284 | | | | $82,143,167 | |
| | |
| Shares Outstanding: | | | | | | | | |
Class I | | | 91,546 | | | | 96,485 | |
Class II | | | 11,289,359 | | | | 7,538,219 | |
| | |
| Net Asset Value: | | | | | | | | |
Class I | | | $11.47 | | | | $10.91 | |
Class II | | | $11.47 | | | | $10.90 | |
See Notes to Financial Statements.
| | |
| | |
| 44 | | Legg Mason/QS Model Portfolio Funds 2020 Annual Report |
Statements of operations
For the Period Ended December 31, 2020†
| | | | | | | | | | | | |
| | | Legg Mason/QS
Aggressive
Model Portfolio | | | Legg Mason/QS Moderately
Aggressive
Model Portfolio | | | Legg Mason/QS Moderate
Model Portfolio | |
| | | |
| Investment Income: | | | | | | | | | | | | |
Income distributions from Underlying Funds | | $ | 554,268 | | | $ | 2,346,686 | | | $ | 2,443,976 | |
Interest | | | 137 | | | | 394 | | | | 324 | |
Total Investment Income | | | 554,405 | | | | 2,347,080 | | | | 2,444,300 | |
| | | |
| Expenses: | | | | | | | | | | | | |
Service and/or distribution fees (Notes 2 and 5) | | | 49,388 | | | | 182,945 | | | | 178,793 | |
Audit and tax fees | | | 32,886 | | | | 32,886 | | | | 32,886 | |
Investment management fee (Note 2) | | | 26,507 | | | | 96,367 | | | | 93,824 | |
Fund accounting fees | | | 21,629 | | | | 21,947 | | | | 21,912 | |
Legal fees | | | 14,240 | | | | 14,240 | | | | 14,240 | |
Offering costs (Note 1) | | | 12,415 | | | | 12,415 | | | | 12,377 | |
Shareholder reports | | | 6,596 | | | | 6,596 | | | | 6,596 | |
Organization costs (Note 1) | | | 1,433 | | | | 1,433 | | | | 1,433 | |
Trustees’ fees | | | 1,210 | | | | 2,741 | | | | 2,681 | |
Custody fees | | | 362 | | | | 648 | | | | 586 | |
Insurance | | | 224 | | | | 430 | | | | 415 | |
Transfer agent fees (Note 5) | | | 208 | | | | 210 | | | | 208 | |
Interest expense | | | 15 | | | | 65 | | | | 88 | |
Miscellaneous expenses | | | 1,435 | | | | 1,436 | | | | 1,435 | |
Total Expenses | | | 168,548 | | | | 374,359 | | | | 367,474 | |
Less: Fee waivers and/or expense reimbursements (Notes 2 and 5) | | | (72,249) | | | | (35,679) | | | | (37,031) | |
Net Expenses | | | 96,299 | | | | 338,680 | | | | 330,443 | |
| Net Investment Income | | | 458,106 | | | | 2,008,400 | | | | 2,113,857 | |
| | | |
| Realized and Unrealized Gain (Loss) on Underlying Funds and Capital Gain Distributions from Underlying Funds (Notes 1 and 3): | | | | | | | | | | | | |
Net Realized Gain (Loss) From: | | | | | | | | | | | | |
Sale of Underlying Funds | | | 14,275 | | | | (61,452) | | | | (247,661) | |
Capital gain distributions from Underlying Funds | | | 833,133 | | | | 2,343,844 | | | | 2,092,145 | |
Net Realized Gain | | | 847,408 | | | | 2,282,392 | | | | 1,844,484 | |
Change in Net Unrealized Appreciation (Depreciation) From Investments | | | 6,475,466 | | | | 18,738,213 | | | | 13,819,926 | |
| Net Gain on Underlying Funds and Capital Gain Distributions from Underlying Funds | | | 7,322,874 | | | | 21,020,605 | | | | 15,664,410 | |
| Increase in Net Assets From Operations | | $ | 7,780,980 | | | $ | 23,029,005 | | | $ | 17,778,267 | |
| † | For the period April 15, 2020 (inception date) to December 31, 2020. |
See Notes to Financial Statements.
| | |
| | |
| Legg Mason/QS Model Portfolio Funds 2020 Annual Report | | 45 |
Statements of operations (cont’d)
For the Period Ended December 31, 2020†
| | | | | | | | |
| | | Legg Mason/QS Moderately
Conservative
Model Portfolio | | | Legg Mason/QS
Conservative
Model Portfolio | |
| | |
| Investment Income: | | | | | | | | |
Income distributions from Underlying Funds | | $ | 1,281,061 | | | $ | 989,931 | |
Interest | | | 160 | | | | 138 | |
Total Investment Income | | | 1,281,221 | | | | 990,069 | |
| | |
| Expenses: | | | | | | | | |
Service and/or distribution fees (Notes 2 and 5) | | | 91,424 | | | | 57,944 | |
Investment management fee (Note 2) | | | 47,987 | | | | 30,551 | |
Audit and tax fees | | | 32,886 | | | | 32,886 | |
Fund accounting fees | | | 21,724 | | | | 21,611 | |
Legal fees | | | 14,240 | | | | 14,240 | |
Offering costs (Note 1) | | | 12,365 | | | | 12,415 | |
Shareholder reports | | | 6,596 | | | | 6,596 | |
Trustees’ fees | | | 1,652 | | | | 1,227 | |
Organization costs (Note 1) | | | 1,433 | | | | 1,433 | |
Custody fees | | | 436 | | | | 318 | |
Insurance | | | 266 | | | | 188 | |
Transfer agent fees (Note 5) | | | 208 | | | | 202 | |
Interest expense | | | 27 | | | | 2 | |
Miscellaneous expenses | | | 1,435 | | | | 1,436 | |
Total Expenses | | | 232,679 | | | | 181,049 | |
Less: Fee waivers and/or expense reimbursements (Notes 2 and 5) | | | (56,328) | | | | (69,053) | |
Net Expenses | | | 176,351 | | | | 111,996 | |
| Net Investment Income | | | 1,104,870 | | | | 878,073 | |
| | |
| Realized and Unrealized Gain (Loss) on Underlying Funds and Capital Gain Distributions from Underlying Funds (Notes 1 and 3): | | | | | | | | |
Net Realized Gain (Loss) From: | | | | | | | | |
Sale of Underlying Funds | | | (143,363) | | | | (42,971) | |
Capital gain distributions from Underlying Funds | | | 735,728 | | | | 445,018 | |
Net Realized Gain | | | 592,365 | | | | 402,047 | |
Change in Net Unrealized Appreciation (Depreciation) From Investments | | | 5,714,474 | | | | 1,807,340 | |
| Net Gain on Underlying Funds and Capital Gain Distributions from Underlying Funds | | | 6,306,839 | | | | 2,209,387 | |
| Increase in Net Assets From Operations | | $ | 7,411,709 | | | $ | 3,087,460 | |
| † | For the period April 15, 2020 (inception date) to December 31, 2020. |
See Notes to Financial Statements.
| | |
| | |
| 46 | | Legg Mason/QS Model Portfolio Funds 2020 Annual Report |
Statements of changes in net assets
Legg Mason/QS Aggressive Model Portfolio
| | | | |
| For the Period Ended December 31, 2020† | | 2020 | |
| |
| Operations: | | | | |
Net investment income | | $ | 458,106 | |
Net realized gain | | | 847,408 | |
Change in net unrealized appreciation (depreciation) | | | 6,475,466 | |
Increase in Net Assets From Operations | | | 7,780,980 | |
| |
| Distributions to Shareholders From (Notes 1 and 6): | | | | |
Total distributable earnings | | | (1,301,016) | |
Decrease in Net Assets From Distributions to Shareholders | | | (1,301,016) | |
| |
| Portfolio Share Transactions (Note 7): | | | | |
Net proceeds from sale of shares | | | 68,361,856 | |
Reinvestment of distributions | | | 1,300,406 | |
Cost of shares repurchased | | | (2,371,816) | |
Increase in Net Assets From Portfolio Share Transactions | | | 67,290,446 | |
Increase in Net Assets | | | 73,770,410 | |
| |
| Net Assets: | | | | |
Beginning of period | | | — | |
End of period | | $ | 73,770,410 | |
| † | For the period April 15, 2020 (inception date) to December 31, 2020. |
See Notes to Financial Statements.
| | |
| | |
| Legg Mason/QS Model Portfolio Funds 2020 Annual Report | | 47 |
Statements of changes in net assets (cont’d)
Legg Mason/QS Moderately Aggressive Model Portfolio
| | | | |
| For the Period Ended December 31, 2020† | | 2020 | |
| |
| Operations: | | | | |
Net investment income | | $ | 2,008,400 | |
Net realized gain | | | 2,282,392 | |
Change in net unrealized appreciation (depreciation) | | | 18,738,213 | |
Increase in Net Assets From Operations | | | 23,029,005 | |
| |
| Distributions to Shareholders From (Notes 1 and 6): | | | | |
Total distributable earnings | | | (4,248,032) | |
Decrease in Net Assets From Distributions to Shareholders | | | (4,248,032) | |
| |
| Portfolio Share Transactions (Note 7): | | | | |
Net proceeds from sale of shares | | | 247,676,894 | |
Reinvestment of distributions | | | 4,247,422 | |
Cost of shares repurchased | | | (1,328,231) | |
Increase in Net Assets From Portfolio Share Transactions | | | 250,596,085 | |
Increase in Net Assets | | | 269,377,058 | |
| |
| Net Assets: | | | | |
Beginning of period | | | — | |
End of period | | $ | 269,377,058 | |
| † | For the period April 15, 2020 (inception date) to December 31, 2020. |
See Notes to Financial Statements.
| | |
| | |
| 48 | | Legg Mason/QS Model Portfolio Funds 2020 Annual Report |
Legg Mason/QS Moderate Model Portfolio
| | | | |
| For the Period Ended December 31, 2020† | | 2020 | |
| |
| Operations: | | | | |
Net investment income | | $ | 2,113,857 | |
Net realized gain | | | 1,844,484 | |
Change in net unrealized appreciation (depreciation) | | | 13,819,926 | |
Increase in Net Assets From Operations | | | 17,778,267 | |
| |
| Distributions to Shareholders From (Notes 1 and 6): | | | | |
Total distributable earnings | | | (4,100,782) | |
Decrease in Net Assets From Distributions to Shareholders | | | (4,100,782) | |
| |
| Portfolio Share Transactions (Note 7): | | | | |
Net proceeds from sale of shares | | | 254,626,557 | |
Reinvestment of distributions | | | 4,100,184 | |
Cost of shares repurchased | | | (2,771,573) | |
Increase in Net Assets From Portfolio Share Transactions | | | 255,955,168 | |
Increase in Net Assets | | | 269,632,653 | |
| |
| Net Assets: | | | | |
Beginning of period | | | — | |
End of period | | $ | 269,632,653 | |
| † | For the period April 15, 2020 (inception date) to December 31, 2020. |
See Notes to Financial Statements.
| | |
| | |
| Legg Mason/QS Model Portfolio Funds 2020 Annual Report | | 49 |
Statements of changes in net assets (cont’d)
Legg Mason/QS Moderately Conservative Model Portfolio
| | | | |
| For the Period Ended December 31, 2020† | | 2020 | |
| |
| Operations: | | | | |
Net investment income | | $ | 1,104,870 | |
Net realized gain | | | 592,365 | |
Change in net unrealized appreciation (depreciation) | | | 5,714,474 | |
Increase in Net Assets From Operations | | | 7,411,709 | |
| |
| Distributions to Shareholders From (Notes 1 and 6): | | | | |
Total distributable earnings | | | (1,803,513) | |
Decrease in Net Assets From Distributions to Shareholders | | | (1,803,513) | |
| |
| Portfolio Share Transactions (Note 7): | | | | |
Net proceeds from sale of shares | | | 126,955,560 | |
Reinvestment of distributions | | | 1,802,885 | |
Cost of shares repurchased | | | (3,831,030) | |
Increase in Net Assets From Portfolio Share Transactions | | | 124,927,415 | |
Increase in Net Assets | | | 130,535,611 | |
| |
| Net Assets: | | | | |
Beginning of period | | | — | |
End of period | | $ | 130,535,611 | |
| † | For the period April 15, 2020 (inception date) to December 31, 2020. |
See Notes to Financial Statements.
| | |
| | |
| 50 | | Legg Mason/QS Model Portfolio Funds 2020 Annual Report |
Legg Mason/QS Conservative Model Portfolio
| | | | |
| For the Period Ended December 31, 2020† | | 2020 | |
| |
| Operations: | | | | |
Net investment income | | $ | 878,073 | |
Net realized gain | | | 402,047 | |
Change in net unrealized appreciation (depreciation) | | | 1,807,340 | |
Increase in Net Assets From Operations | | | 3,087,460 | |
| |
| Distributions to Shareholders From (Notes 1 and 6): | | | | |
Total distributable earnings | | | (1,340,351) | |
Decrease in Net Assets From Distributions to Shareholders | | | (1,340,351) | |
| |
| Portfolio Share Transactions (Note 7): | | | | |
Net proceeds from sale of shares | | | 81,896,105 | |
Reinvestment of distributions | | | 1,339,618 | |
Cost of shares repurchased | | | (1,787,085) | |
Increase in Net Assets From Portfolio Share Transactions | | | 81,448,638 | |
Increase in Net Assets | | | 83,195,747 | |
| |
| Net Assets: | | | | |
Beginning of period | | | — | |
End of period | | $ | 83,195,747 | |
| † | For the period April 15, 2020 (inception date) to December 31, 2020. |
See Notes to Financial Statements.
| | |
| | |
| Legg Mason/QS Model Portfolio Funds 2020 Annual Report | | 51 |
Financial highlights
Legg Mason/QS Aggressive Model Portfolio
| | | | |
For a share of each class of beneficial interest outstanding throughout each year ended December 31,
unless otherwise noted: | |
| Class I Shares1 | | 20202 | |
| |
| Net asset value, beginning of period | | | $10.00 | |
| |
| Income from operations: | | | | |
Net investment income | | | 0.22 | |
Net realized and unrealized gain | | | 2.97 | |
Total income from operations | | | 3.19 | |
| |
| Less distributions from: | | | | |
Net investment income | | | (0.12) | |
Net realized gains | | | (0.13) | |
Total distributions | | | (0.25) | |
| |
| Net asset value, end of period | | | $12.94 | |
Total return3 | | | 31.90 | % |
| |
| Net assets, end of period (000s) | | | $2,155 | |
| |
| Ratios to average net assets: | | | | |
Gross expenses4,5 | | | 0.61 | % |
Net expenses4,5,6,7 | | | 0.23 | |
Net investment income4 | | | 2.62 | |
| |
| Portfolio turnover rate | | | 31 | % |
| 1 | Per share amounts have been calculated using the average shares method. |
| 2 | For the period April 15, 2020 (inception date) to December 31, 2020. |
| 3 | Performance figures may reflect compensating balance arrangements, fee waivers and/or expense reimbursements. In the absence of compensating balance arrangements, fee waivers and/or expense reimbursements, the total return would have been lower. Total returns do not reflect expenses associated with separate accounts such as administrative fees, account charges and surrender charges which, if reflected, would reduce the total return for the period shown. Past performance is no guarantee of future results. Total returns for periods of less than one year are not annualized. |
| 5 | Does not include fees and expenses of the Underlying Funds in which the Portfolio invests. |
| 6 | Reflects fee waivers and/or expense reimbursements. |
| 7 | As a result of an expense limitation arrangement, the ratio of total annual fund operating expenses, other than interest, brokerage, taxes, extraordinary expenses and acquired fund fees and expenses (fees and expenses of Underlying Funds), to average net assets of Class I shares did not exceed 0.23%. This expense limitation arrangement cannot be terminated prior to December 31, 2022 without the Board of Trustees’ consent. |
See Notes to Financial Statements.
| | |
| | |
| 52 | | Legg Mason/QS Model Portfolio Funds 2020 Annual Report |
Legg Mason/QS Aggressive Model Portfolio
| | | | |
For a share of each class of beneficial interest outstanding throughout each year ended December 31,
unless otherwise noted: | |
| Class II Shares1 | | 20202 | |
| |
| Net asset value, beginning of period | | | $10.00 | |
| |
| Income from operations: | | | | |
Net investment income | | | 0.19 | |
Net realized and unrealized gain | | | 2.98 | |
Total income from operations | | | 3.17 | |
| |
| Less distributions from: | | | | |
Net investment income | | | (0.11) | |
Net realized gains | | | (0.13) | |
Total distributions | | | (0.24) | |
| |
| Net asset value, end of period | | | $12.93 | |
Total return3 | | | 31.70 | % |
| |
| Net assets, end of period (000s) | | | $71,616 | |
| |
| Ratios to average net assets: | | | | |
Gross expenses4,5 | | | 0.83 | % |
Net expenses4,5,6,7 | | | 0.48 | |
Net investment income4 | | | 2.23 | |
| |
| Portfolio turnover rate | | | 31 | % |
| 1 | Per share amounts have been calculated using the average shares method. |
| 2 | For the period April 15, 2020 (inception date) to December 31, 2020. |
| 3 | Performance figures may reflect compensating balance arrangements, fee waivers and/or expense reimbursements. In the absence of compensating balance arrangements, fee waivers and/or expense reimbursements, the total return would have been lower. Total returns do not reflect expenses associated with separate accounts such as administrative fees, account charges and surrender charges which, if reflected, would reduce the total return for the period shown. Past performance is no guarantee of future results. Total returns for periods of less than one year are not annualized. |
| 5 | Does not include fees and expenses of the Underlying Funds in which the Portfolio invests. |
| 6 | Reflects fee waivers and/or expense reimbursements. |
| 7 | As a result of an expense limitation arrangement, the ratio of total annual fund operating expenses, other than interest, brokerage, taxes, extraordinary expenses and acquired fund fees and expenses (fees and expenses of Underlying Funds), to average net assets of Class II shares did not exceed 0.48%. This expense limitation arrangement cannot be terminated prior to December 31, 2022 without the Board of Trustees’ consent. |
See Notes to Financial Statements.
| | |
| | |
| Legg Mason/QS Model Portfolio Funds 2020 Annual Report | | 53 |
Financial highlights (cont’d)
Legg Mason/QS Moderately Aggressive Model Portfolio
| | | | |
For a share of each class of beneficial interest outstanding throughout each year ended December 31,
unless otherwise noted: | |
| Class I Shares1 | | 20202 | |
| |
| Net asset value, beginning of period | | | $10.00 | |
| |
| Income from operations: | | | | |
Net investment income | | | 0.24 | |
Net realized and unrealized gain | | | 2.36 | |
Total income from operations | | | 2.60 | |
| |
| Less distributions from: | | | | |
Net investment income | | | (0.12) | |
Net realized gains | | | (0.09) | |
Total distributions | | | (0.21) | |
| |
| Net asset value, end of period | | | $12.39 | |
Total return3 | | | 25.99 | % |
| |
| Net assets, end of period (000s) | | | $3,118 | |
| |
| Ratios to average net assets: | | | | |
Gross expenses4,5 | | | 0.28 | % |
Net expenses4,5,6,7 | | | 0.21 | |
Net investment income4 | | | 2.92 | |
| |
| Portfolio turnover rate | | | 28 | % |
| 1 | Per share amounts have been calculated using the average shares method. |
| 2 | For the period April 15, 2020 (inception date) to December 31, 2020. |
| 3 | Performance figures may reflect compensating balance arrangements, fee waivers and/or expense reimbursements. In the absence of compensating balance arrangements, fee waivers and/or expense reimbursements, the total return would have been lower. Total returns do not reflect expenses associated with separate accounts such as administrative fees, account charges and surrender charges which, if reflected, would reduce the total return for the period shown. Past performance is no guarantee of future results. Total returns for periods of less than one year are not annualized. |
| 5 | Does not include fees and expenses of the Underlying Funds in which the Portfolio invests. |
| 6 | Reflects fee waivers and/or expense reimbursements. |
| 7 | As a result of an expense limitation arrangement, the ratio of total annual fund operating expenses, other than interest, brokerage, taxes, extraordinary expenses and acquired fund fees and expenses (fees and expenses of Underlying Funds), to average net assets of Class I shares did not exceed 0.21%. This expense limitation arrangement cannot be terminated prior to December 31, 2022 without the Board of Trustees’ consent. |
See Notes to Financial Statements.
| | |
| | |
| 54 | | Legg Mason/QS Model Portfolio Funds 2020 Annual Report |
Legg Mason/QS Moderately Aggressive Model Portfolio
| | | | |
For a share of each class of beneficial interest outstanding throughout each year ended December 31,
unless otherwise noted: | |
| Class II Shares1 | | 20202 | |
| |
| Net asset value, beginning of period | | | $10.00 | |
| |
| Income from operations: | | | | |
Net investment income | | | 0.22 | |
Net realized and unrealized gain | | | 2.35 | |
Total income from operations | | | 2.57 | |
| |
| Less distributions from: | | | | |
Net investment income | | | (0.11) | |
Net realized gains | | | (0.09) | |
Total distributions | | | (0.20) | |
| |
| Net asset value, end of period | | | $12.37 | |
Total return3 | | | 25.69 | % |
| |
| Net assets, end of period (millions) | | | $266 | |
| |
| Ratios to average net assets: | | | | |
Gross expenses4,5 | | | 0.51 | % |
Net expenses4,5,6,7 | | | 0.46 | |
Net investment income4 | | | 2.71 | |
| |
| Portfolio turnover rate | | | 28 | % |
| 1 | Per share amounts have been calculated using the average shares method. |
| 2 | For the period April 15, 2020 (inception date) to December 31, 2020. |
| 3 | Performance figures may reflect compensating balance arrangements, fee waivers and/or expense reimbursements. In the absence of compensating balance arrangements, fee waivers and/or expense reimbursements, the total return would have been lower. Total returns do not reflect expenses associated with separate accounts such as administrative fees, account charges and surrender charges which, if reflected, would reduce the total return for the period shown. Past performance is no guarantee of future results. Total returns for periods of less than one year are not annualized. |
| 5 | Does not include fees and expenses of the Underlying Funds in which the Portfolio invests. |
| 6 | Reflects fee waivers and/or expense reimbursements. |
| 7 | As a result of an expense limitation arrangement, the ratio of total annual fund operating expenses, other than interest, brokerage, taxes, extraordinary expenses and acquired fund fees and expenses (fees and expenses of Underlying Funds), to average net assets of Class II shares did not exceed 0.46%. This expense limitation arrangement cannot be terminated prior to December 31, 2022 without the Board of Trustees’ consent. |
See Notes to Financial Statements.
| | |
| | |
| Legg Mason/QS Model Portfolio Funds 2020 Annual Report | | 55 |
Financial highlights (cont’d)
Legg Mason/QS Moderate Model Portfolio
| | | | |
For a share of each class of beneficial interest outstanding throughout each year ended December 31,
unless otherwise noted: | |
| Class I Shares1 | | 20202 | |
| |
| Net asset value, beginning of period | | | $10.00 | |
| |
| Income from operations: | | | | |
Net investment income | | | 0.28 | |
Net realized and unrealized gain | | | 1.71 | |
Total income from operations | | | 1.99 | |
| |
| Less distributions from: | | | | |
Net investment income | | | (0.12) | |
Net realized gains | | | (0.07) | |
Total distributions | | | (0.19) | |
| |
| Net asset value, end of period | | | $11.80 | |
Total return3 | | | 19.95 | % |
| |
| Net assets, end of period (000s) | | | $2,188 | |
| |
| Ratios to average net assets: | | | | |
Gross expenses4,5 | | | 0.29 | % |
Net expenses4,5,6,7 | | | 0.21 | |
Net investment income4 | | | 3.45 | |
| |
| Portfolio turnover rate | | | 27 | % |
| 1 | Per share amounts have been calculated using the average shares method. |
| 2 | For the period April 15, 2020 (inception date) to December 31, 2020. |
| 3 | Performance figures may reflect compensating balance arrangements, fee waivers and/or expense reimbursements. In the absence of compensating balance arrangements, fee waivers and/or expense reimbursements, the total return would have been lower. Total returns do not reflect expenses associated with separate accounts such as administrative fees, account charges and surrender charges which, if reflected, would reduce the total return for the period shown. Past performance is no guarantee of future results. Total returns for periods of less than one year are not annualized. |
| 5 | Does not include fees and expenses of the Underlying Funds in which the Portfolio invests. |
| 6 | Reflects fee waivers and/or expense reimbursements. |
| 7 | As a result of an expense limitation arrangement, the ratio of total annual fund operating expenses, other than interest, brokerage, taxes, extraordinary expenses and acquired fund fees and expenses (fees and expenses of Underlying Funds), to average net assets of Class I shares did not exceed 0.21%. This expense limitation arrangement cannot be terminated prior to December 31, 2022 without the Board of Trustees’ consent. |
See Notes to Financial Statements.
| | |
| | |
| 56 | | Legg Mason/QS Model Portfolio Funds 2020 Annual Report |
Legg Mason/QS Moderate Model Portfolio
| | | | |
For a share of each class of beneficial interest outstanding throughout each year ended December 31,
unless otherwise noted: | |
| Class II Shares1 | | 20202 | |
| |
| Net asset value, beginning of period | | | $10.00 | |
| |
| Income from operations: | | | | |
Net investment income | | | 0.23 | |
Net realized and unrealized gain | | | 1.73 | |
Total income from operations | | | 1.96 | |
| |
| Less distributions from: | | | | |
Net investment income | | | (0.11) | |
Net realized gains | | | (0.07) | |
Total distributions | | | (0.18) | |
| |
| Net asset value, end of period | | | $11.78 | |
Total return3 | | | 19.65 | % |
| |
| Net assets, end of period (millions) | | | $267 | |
| |
| Ratios to average net assets: | | | | |
Gross expenses4,5 | | | 0.51 | % |
Net expenses4,5,6,7 | | | 0.46 | |
Net investment income4 | | | 2.92 | |
| |
| Portfolio turnover rate | | | 27 | % |
| 1 | Per share amounts have been calculated using the average shares method. |
| 2 | For the period April 15, 2020 (inception date) to December 31, 2020. |
| 3 | Performance figures may reflect compensating balance arrangements, fee waivers and/or expense reimbursements. In the absence of compensating balance arrangements, fee waivers and/or expense reimbursements, the total return would have been lower. Total returns do not reflect expenses associated with separate accounts such as administrative fees, account charges and surrender charges which, if reflected, would reduce the total return for the period shown. Past performance is no guarantee of future results. Total returns for periods of less than one year are not annualized. |
| 5 | Does not include fees and expenses of the Underlying Funds in which the Portfolio invests. |
| 6 | Reflects fee waivers and/or expense reimbursements. |
| 7 | As a result of an expense limitation arrangement, the ratio of total annual fund operating expenses, other than interest, brokerage, taxes, extraordinary expenses and acquired fund fees and expenses (fees and expenses of Underlying Funds), to average net assets of Class II shares did not exceed 0.46%. This expense limitation arrangement cannot be terminated prior to December 31, 2022 without the Board of Trustees’ consent. |
See Notes to Financial Statements.
| | |
| | |
| Legg Mason/QS Model Portfolio Funds 2020 Annual Report | | 57 |
Financial highlights (cont’d)
Legg Mason/QS Moderately Conservative Model Portfolio
| | | | |
For a share of each class of beneficial interest outstanding throughout each year ended December 31,
unless otherwise noted: | |
| Class I Shares1 | | 20202 | |
| |
| Net asset value, beginning of period | | | $10.00 | |
| |
| Income from operations: | | | | |
Net investment income | | | 0.25 | |
Net realized and unrealized gain | | | 1.40 | |
Total income from operations | | | 1.65 | |
| |
| Less distributions from: | | | | |
Net investment income | | | (0.13) | |
Net realized gains | | | (0.05) | |
Total distributions | | | (0.18) | |
| |
| Net asset value, end of period | | | $11.47 | |
Total return3 | | | 16.43 | % |
| |
| Net assets, end of period (000s) | | | $1,050 | |
| |
| Ratios to average net assets: | | | | |
Gross expenses4,5 | | | 0.43 | % |
Net expenses4,5,6,7 | | | 0.23 | |
Net investment income4 | | | 3.14 | |
| |
| Portfolio turnover rate | | | 27 | % |
| 1 | Per share amounts have been calculated using the average shares method. |
| 2 | For the period April 15, 2020 (inception date) to December 31, 2020. |
| 3 | Performance figures may reflect compensating balance arrangements, fee waivers and/or expense reimbursements. In the absence of compensating balance arrangements, fee waivers and/or expense reimbursements, the total return would have been lower. Total returns do not reflect expenses associated with separate accounts such as administrative fees, account charges and surrender charges which, if reflected, would reduce the total return for the period shown. Past performance is no guarantee of future results. Total returns for periods of less than one year are not annualized. |
| 5 | Does not include fees and expenses of the Underlying Funds in which the Portfolio invests. |
| 6 | Reflects fee waivers and/or expense reimbursements. |
| 7 | As a result of an expense limitation arrangement, the ratio of total annual fund operating expenses, other than interest, brokerage, taxes, extraordinary expenses and acquired fund fees and expenses (fees and expenses of Underlying Funds), to average net assets of Class I shares did not exceed 0.23%. This expense limitation arrangement cannot be terminated prior to December 31, 2022 without the Board of Trustees’ consent. |
See Notes to Financial Statements.
| | |
| | |
| 58 | | Legg Mason/QS Model Portfolio Funds 2020 Annual Report |
Legg Mason/QS Moderately Conservative Model Portfolio
| | | | |
For a share of each class of beneficial interest outstanding throughout each year ended December 31,
unless otherwise noted: | |
| Class II Shares1 | | 20202 | |
| |
| Net asset value, beginning of period | | | $10.00 | |
| |
| Income from operations: | | | | |
Net investment income | | | 0.23 | |
Net realized and unrealized gain | | | 1.40 | |
Total income from operations | | | 1.63 | |
| |
| Less distributions from: | | | | |
Net investment income | | | (0.11) | |
Net realized gains | | | (0.05) | |
Total distributions | | | (0.16) | |
| |
| Net asset value, end of period | | | $11.47 | |
Total return3 | | | 16.32 | % |
| |
| Net assets, end of period (millions) | | | $129 | |
| |
| Ratios to average net assets: | | | | |
Gross expenses4,5 | | | 0.63 | % |
Net expenses4,5,6,7 | | | 0.48 | |
Net investment income4 | | | 2.99 | |
| |
| Portfolio turnover rate | | | 27 | % |
| 1 | Per share amounts have been calculated using the average shares method. |
| 2 | For the period April 15, 2020 (inception date) to December 31, 2020. |
| 3 | Performance figures may reflect compensating balance arrangements, fee waivers and/or expense reimbursements. In the absence of compensating balance arrangements, fee waivers and/or expense reimbursements, the total return would have been lower. Total returns do not reflect expenses associated with separate accounts such as administrative fees, account charges and surrender charges which, if reflected, would reduce the total return for the period shown. Past performance is no guarantee of future results. Total returns for periods of less than one year are not annualized. |
| 5 | Does not include fees and expenses of the Underlying Funds in which the Portfolio invests. |
| 6 | Reflects fee waivers and/or expense reimbursements. |
| 7 | As a result of an expense limitation arrangement, the ratio of total annual fund operating expenses, other than interest, brokerage, taxes, extraordinary expenses and acquired fund fees and expenses (fees and expenses of Underlying Funds), to average net assets of Class II shares did not exceed 0.48%. This expense limitation arrangement cannot be terminated prior to December 31, 2022 without the Board of Trustees’ consent. |
See Notes to Financial Statements.
| | |
| | |
| Legg Mason/QS Model Portfolio Funds 2020 Annual Report | | 59 |
Financial highlights (cont’d)
Legg Mason/QS Conservative Model Portfolio
| | | | |
For a share of each class of beneficial interest outstanding throughout each year ended December 31
unless otherwise noted: | |
| Class I Shares1 | | 20202 | |
| |
| Net asset value, beginning of period | | | $10.00 | |
| |
| Income from operations: | | | | |
Net investment income | | | 0.33 | |
Net realized and unrealized gain | | | 0.77 | |
Total income from operations | | | 1.10 | |
| |
| Less distributions from: | | | | |
Net investment income | | | (0.15) | |
Net realized gains | | | (0.04) | |
Total distributions | | | (0.19) | |
| |
| Net asset value, end of period | | | $10.91 | |
Total return3 | | | 10.99 | % |
| |
| Net assets, end of period (000s) | | | $1,053 | |
| |
| Ratios to average net assets: | | | | |
Gross expenses4,5 | | | 0.57 | % |
Net expenses4,5,6,7 | | | 0.23 | |
Net investment income4 | | | 4.33 | |
| |
| Portfolio turnover rate | | | 22 | % |
| 1 | Per share amounts have been calculated using the average shares method. |
| 2 | For the period April 15, 2020 (inception date) to December 31, 2020. |
| 3 | Performance figures may reflect compensating balance arrangements, fee waivers and/or expense reimbursements. In the absence of compensating balance arrangements, fee waivers and/or expense reimbursements, the total return would have been lower. Total returns do not reflect expenses associated with separate accounts such as administrative fees, account charges and surrender charges which, if reflected, would reduce the total return for the period shown. Past performance is no guarantee of future results. Total returns for periods of less than one year are not annualized. |
| 5 | Does not include fees and expenses of the Underlying Funds in which the Portfolio invests. |
| 6 | Reflects fee waivers and/or expense reimbursements. |
| 7 | As a result of an expense limitation arrangement, the ratio of total annual fund operating expenses, other than interest, brokerage, taxes, extraordinary expenses and acquired fund fees and expenses (fees and expenses of Underlying Funds), to average net assets of Class I shares did not exceed 0.23%. This expense limitation arrangement cannot be terminated prior to December 31, 2022 without the Board of Trustees’ consent. |
See Notes to Financial Statements.
| | |
| | |
| 60 | | Legg Mason/QS Model Portfolio Funds 2020 Annual Report |
Legg Mason/QS Conservative Model Portfolio
| | | | |
For a share of each class of beneficial interest outstanding throughout each year ended December 31
unless otherwise noted: | |
| Class II Shares1 | | 20202 | |
| |
| Net asset value, beginning of period | | | $10.00 | |
| |
| Income from operations: | | | | |
Net investment income | | | 0.28 | |
Net realized and unrealized gain | | | 0.80 | |
Total income from operations | | | 1.08 | |
| |
| Less distributions from: | | | | |
Net investment income | | | (0.14) | |
Net realized gains | | | (0.04) | |
Total distributions | | | (0.18) | |
| |
| Net asset value, end of period | | | $10.90 | |
Total return3 | | | 10.78 | % |
| |
| Net assets, end of period (000s) | | | $82,143 | |
| |
| Ratios to average net assets: | | | | |
Gross expenses4,5 | | | 0.77 | % |
Net expenses4,5,6,7 | | | 0.48 | |
Net investment income4 | | | 3.73 | |
| |
| Portfolio turnover rate | | | 22 | % |
| 1 | Per share amounts have been calculated using the average shares method. |
| 2 | For the period April 15, 2020 (inception date) to December 31, 2020. |
| 3 | Performance figures may reflect compensating balance arrangements, fee waivers and/or expense reimbursements. In the absence of compensating balance arrangements, fee waivers and/or expense reimbursements, the total return would have been lower. Total returns do not reflect expenses associated with separate accounts such as administrative fees, account charges and surrender charges which, if reflected, would reduce the total return for the period shown. Past performance is no guarantee of future results. Total returns for periods of less than one year are not annualized. |
| 5 | Does not include fees and expenses of the Underlying Funds in which the Portfolio invests. |
| 6 | Reflects fee waivers and/or expense reimbursements. |
| 7 | As a result of an expense limitation arrangement, the ratio of total annual fund operating expenses, other than interest, brokerage, taxes, extraordinary expenses and acquired fund fees and expenses (fees and expenses of Underlying Funds), to average net assets of Class II shares did not exceed 0.48%. This expense limitation arrangement cannot be terminated prior to December 31, 2022 without the Board of Trustees’ consent. |
See Notes to Financial Statements.
| | |
| | |
| Legg Mason/QS Model Portfolio Funds 2020 Annual Report | | 61 |
Notes to financial statements
1. Organization and significant accounting policies
Legg Mason/QS Aggressive Model Portfolio (“Aggressive Model Portfolio”), Legg Mason/QS Moderately Aggressive Model Portfolio (“Moderately Aggressive Model Portfolio”), Legg Mason/QS Moderate Model Portfolio (“Moderate Model Portfolio”), Legg Mason/QS Moderately Conservative Model Portfolio (“Moderately Conservative Model Portfolio”) and Legg Mason/QS Conservative Model Portfolio (“Conservative Model Portfolio”), (the “Portfolios”) are separate non-diversified investment series of Legg Mason Partners Variable Equity Trust (the “Trust”). The Trust, a Maryland statutory trust, is registered under the Investment Company Act of 1940, as amended (the “1940 Act”), as an open-end management investment company. The Portfolios invest in insurance-dedicated mutual funds that have been selected by New York Life Insurance and Annuity Corporation (“NYLIAC”) as investment options for use with their variable annuity and variable universal life insurance policies (“Underlying Funds”). The Underlying Funds include funds managed by investment advisers that are not affiliated with Legg Mason, Inc. (“Legg Mason”) and funds managed by Legg Mason affiliated investment advisers. Shares of the Portfolios are offered to variable annuity and variable life insurance separate accounts established by NYLIAC.
Shares of the Portfolios may only be purchased or redeemed through variable annuity contracts and variable life insurance policies issued by NYLIAC through their separate accounts.
The following are significant accounting policies consistently followed by the Portfolios and are in conformity with U.S. generally accepted accounting principles (“GAAP”). Estimates and assumptions are required to be made regarding assets, liabilities and changes in net assets resulting from operations when financial statements are prepared. Changes in the economic environment, financial markets and any other parameters used in determining these estimates could cause actual results to differ. Subsequent events have been evaluated through the date the financial statements were issued.
(a) Investment valuation. Investments in the Underlying Funds are valued at the closing net asset value per share of each Underlying Fund on the day of valuation. Equity securities for which market quotations are available are valued at the last reported sales price or official closing price on the primary market or exchange on which they trade. The valuations for fixed income securities (which may include, but are not limited to, corporate, government, municipal, mortgage-backed, collateralized mortgage obligations and asset-backed securities) and certain derivative instruments are typically the prices supplied by independent third party pricing services, which may use market prices or broker/dealer quotations or a variety of valuation techniques and methodologies. The independent third party pricing services use inputs that are observable such as issuer details, interest rates, yield curves, prepayment speeds, credit risks/spreads, default rates and quoted prices for similar securities. Investments in open-end funds are valued at the closing net asset value per share of each fund on the day of valuation. When the Portfolios hold securities or other assets that are denominated in a foreign currency, the Portfolios will normally use the currency exchange rates as of 4:00 p.m. (Eastern Time). If independent third party pricing services are unable to supply prices for a portfolio investment, or if the prices supplied are deemed by the manager to be unreliable, the market price may be determined by the manager using quotations from one or more broker/dealers or at the transaction price if the security has recently been purchased and no value has yet been obtained from a pricing service or pricing broker. When reliable prices are not readily available, such as when the value of a security has been significantly affected by events after the close of the exchange or market on which the security is principally traded, but before each Portfolio calculates its net asset value, the Portfolios value these securities as determined in accordance with procedures approved by the Portfolios’ Board of Trustees.
The Board of Trustees is responsible for the valuation process and has delegated the supervision of the daily valuation process to the Legg Mason North Atlantic Fund Valuation Committee (the “Valuation Committee”). The Valuation Committee, pursuant to the policies adopted by the Board of Trustees, is responsible for making fair value determinations, evaluating the effectiveness of the Portfolios’ pricing policies, and reporting to the Board of Trustees. When determining the reliability of third party pricing information for investments owned by the Portfolios, the Valuation Committee, among other things, conducts due diligence reviews of pricing vendors, monitors the daily change in prices and reviews transactions among market participants.
The Valuation Committee will consider pricing methodologies it deems relevant and appropriate when making fair value determinations. Examples of possible methodologies include, but are not limited to, multiple of earnings; discount from market of a similar freely traded security; discounted cash-flow analysis; book value or a multiple thereof; risk premium/yield analysis; yield to maturity; and/or fundamental investment analysis. The Valuation Committee will also consider factors it deems relevant and appropriate in light of the facts and circumstances. Examples of possible factors include, but are not limited to, the type of security; the issuer’s financial statements; the purchase price of the security; the discount from market value of unrestricted securities of the same class at the time of purchase; analysts’ research and observations from financial institutions; information regarding any transactions or offers with respect to the security; the existence of merger
| | |
| | |
| 62 | | Legg Mason/QS Model Portfolio Funds 2020 Annual Report |
proposals or tender offers affecting the security; the price and extent of public trading in similar securities of the issuer or comparable companies; and the existence of a shelf registration for restricted securities. Additionally, if the closing net asset value per share for an Underlying Fund is not available on the day of valuation, the Valuation Committee may adjust the Underlying Fund’s last available net asset value per share to account for significant events that have occurred subsequent to the Underlying Fund’s last net asset value per share calculation but prior to the day of valuation.
For each portfolio security that has been fair valued pursuant to the policies adopted by the Board of Trustees, the fair value price is compared against the last available and next available market quotations. The Valuation Committee reviews the results of such back testing monthly and fair valuation occurrences are reported to the Board of Trustees quarterly.
The Portfolios use valuation techniques to measure fair value that are consistent with the market approach and/or income approach, depending on the type of security and the particular circumstance. The market approach uses prices and other relevant information generated by market transactions involving identical or comparable securities. The income approach uses valuation techniques to discount estimated future cash flows to present value.
GAAP establishes a disclosure hierarchy that categorizes the inputs to valuation techniques used to value assets and liabilities at measurement date. These inputs are summarized in the three broad levels listed below:
| • | | Level 1 — quoted prices in active markets for identical investments |
| • | | Level 2 — other significant observable inputs (including quoted prices for similar investments, interest rates, prepayment speeds, credit risk, etc.) |
| • | | Level 3 — significant unobservable inputs (including the Portfolios’ own assumptions in determining the fair value of investments) |
The inputs or methodologies used to value securities are not necessarily an indication of the risk associated with investing in those securities.
The following is a summary of the inputs used in valuing the Portfolios’ assets carried at fair value:
| | | | | | | | | | | | | | | | |
| Aggressive Model Portfolio | |
| | | ASSETS | | | | | | | | | | |
| Description | | Quoted Prices (Level 1) | | | Other Significant
Observable Inputs
(Level 2) | | | Significant
Unobservable
Inputs (Level 3) | | | Total | |
| Investments in Underlying Funds† | | $ | 24,980,912 | | | $ | 47,049,446 | | | | — | | | $ | 72,030,358 | |
| Short-Term Investments† | | | 1,374,832 | | | | — | | | | — | | | | 1,374,832 | |
| Total Investments | | $ | 26,355,744 | | | $ | 47,049,446 | | | | — | | | $ | 73,405,190 | |
| † | See Schedule of Investments for additional detailed categorizations. |
| | | | | | | | | | | | | | | | |
| Moderately Aggressive Model Portfolio | |
| | | ASSETS | | | | | | | | | | |
| Description | | Quoted Prices
(Level 1) | | | Other Significant
Observable Inputs (Level 2) | | | Significant
Unobservable
Inputs (Level 3) | | | Total | |
| Investments in Underlying Funds† | | $ | 105,914,773 | | | $ | 159,717,244 | | | | — | | | $ | 265,632,017 | |
| Short-Term Investments† | | | 2,325,305 | | | | — | | | | — | | | | 2,325,305 | |
| Total Investments | | $ | 108,240,078 | | | $ | 159,717,244 | | | | — | | | $ | 267,957,322 | |
| † | See Schedule of Investments for additional detailed categorizations. |
| | |
| | |
| Legg Mason/QS Model Portfolio Funds 2020 Annual Report | | 63 |
Notes to financial statements (cont’d)
| | | | | | | | | | | | | | | | |
| Moderate Model Portfolio | |
| | | ASSETS | | | | | | | | | | |
| Description | | Quoted Prices
(Level 1) | | | Other Significant
Observable Inputs
(Level 2) | | | Significant
Unobservable
Inputs (Level 3) | | | Total | |
| Investments in Underlying Funds† | | $ | 93,798,824 | | | $ | 173,870,073 | | | | — | | | $ | 267,668,897 | |
| Short-Term Investments† | | | 4,658,997 | | | | — | | | | — | | | | 4,658,997 | |
| Total Investments | | $ | 98,457,821 | | | $ | 173,870,073 | | | | — | | | $ | 272,327,894 | |
| † | See Schedule of Investments for additional detailed categorizations. |
| | | | | | | | | | | | | | | | |
| Moderately Conservative Model Portfolio | |
| | | ASSETS | | | | | | | | | | |
| Description | | Quoted Prices
(Level 1) | | | Other Significant
Observable Inputs (Level 2) | | | Significant
Unobservable
Inputs (Level 3) | | | Total | |
| Investments in Underlying Funds† | | $ | 50,267,888 | | | $ | 79,956,522 | | | | — | | | $ | 130,224,410 | |
| Short-Term Investments† | | | 2,424,493 | | | | — | | | | — | | | | 2,424,493 | |
| Total Investments | | $ | 52,692,381 | | | $ | 79,956,522 | | | | — | | | $ | 132,648,903 | |
| † | See Schedule of Investments for additional detailed categorizations. |
| | | | | | | | | | | | | | | | |
| Conservative Model Portfolio | |
| | | ASSETS | | | | | | | | | | |
| Description | | Quoted Prices
(Level 1) | | | Other Significant
Observable Inputs
(Level 2) | | | Significant
Unobservable
Inputs (Level 3) | | | Total | |
| Investments in Underlying Funds† | | $ | 31,461,709 | | | $ | 51,486,216 | | | | — | | | $ | 82,947,925 | |
| Short-Term Investments† | | | 230,241 | | | | — | | | | — | | | | 230,241 | |
| Total Investments | | $ | 31,691,950 | | | $ | 51,486,216 | | | | — | | | $ | 83,178,166 | |
| † | See Schedule of Investments for additional detailed categorizations. |
(b) Fund of funds risk. The cost of investing in the Portfolios, as funds of funds, may be higher than the cost of investing in a mutual fund that only invests directly in individual securities. An Underlying Fund may change its investment objective or policies without the Portfolios’ approval, which could force the Portfolios to withdraw their investments from such Underlying Fund at a time that is unfavorable to the Portfolios. In addition, one Underlying Fund may buy the same securities that another Underlying Fund sells. Therefore, the Portfolios would indirectly bear the costs of these trades without accomplishing any investment purpose.
(c) Security transactions and investment income. Security transactions are accounted for on a trade date basis. Net investment income distributions, if any, from the Underlying Funds are recorded on the ex-dividend date as investment income. Interest income is recorded on an accrual basis. Short-term and long-term capital gain distributions, if any, from the Underlying Funds are recorded on the ex-dividend date as realized gains. The character of certain distributions received from the Underlying Funds may represent a return of capital. The Portfolios determine the components of these distributions subsequent to the ex-dividend date, based on the actual tax character reported by the Underlying Funds. These distributions are recorded by adjusting the cost basis of the related Underlying Fund. The cost of investments sold is determined by use of the specific identification method.
(d) Distributions to shareholders. Distributions from net investment income and distributions of net realized gains, if any, are declared at least annually. Distributions to shareholders of the Portfolios are recorded on the ex-dividend date and are determined in accordance with income tax regulations, which may differ from GAAP.
(e) Share class accounting. Investment income, common expenses and realized/unrealized gains (losses) on investments are allocated to the various classes of the Portfolios on the basis of daily net assets of each class. Fees relating to a specific class are charged directly to that share class.
| | |
| | |
| 64 | | Legg Mason/QS Model Portfolio Funds 2020 Annual Report |
(f) Compensating balance arrangements. The Portfolios have an arrangement with their custodian bank whereby a portion of the custodian’s fees is paid indirectly by credits earned on the Portfolios’ cash on deposit with the bank.
(g) Organization costs. Organization costs associated with the establishment of the Portfolios are charged to expense as they are incurred.
(h) Offering costs. Costs incurred by the Portfolios in connection with the commencement of the Portfolios’ operations are being amortized on a straight line basis was amortized in less than twelve months.
(i) Federal and other taxes. It is the Portfolios’ policy to comply with the federal income and excise tax requirements of the Internal Revenue Code of 1986 (the “Code”), as amended, applicable to regulated investment companies. Accordingly, the Portfolios intend to distribute their taxable income and net realized gains, if any, to shareholders in accordance with timing requirements imposed by the Code. Therefore, no federal or state income tax provision is required in the Portfolios’ financial statements.
(j) Reclassification. GAAP requires that certain components of net assets be reclassified to reflect permanent differences between financial and tax reporting. These reclassifications have no effect on net assets or net asset value per share. During the current year, the following reclassifications have been made:
| | | | | | | | |
| | | Total Distributable
Earnings (Loss) | | | Paid-in
Capital | |
| Aggressive Model Portfolio(a) | | $ | 7,912 | | | $ | (7,912) | |
| Moderately Aggressive Model Portfolio(a) | | | 12,529 | | | | (12,529) | |
| Moderate Model Portfolio(a) | | | 12,262 | | | | (12,262) | |
| Moderately Conservative Model Portfolio(a) | | | 9,391 | | | | (9,391) | |
| Conservative Model Portfolio(a) | | | 8,567 | | | | (8,567) | |
| (a) | Reclassifications are due to non-deductible offering costs. |
2. Investment management agreement and other transactions with affiliates
Legg Mason Partners Fund Advisor, LLC (“LMPFA”) is each Portfolio’s investment manager and QS Investors, LLC (“QS Investors”) is each Portfolio’s subadviser. Western Asset Management Company, LLC (“Western Asset”) manages the portion of each Portfolio’s cash and short-term instruments allocated to it. As of July 31, 2020, LMPFA, QS Investors and Western Asset are indirect, wholly-owned subsidiaries of Franklin Resources, Inc. (“Franklin Resources”). Prior to July 31, 2020, LMPFA, QS Investors and Western Asset were wholly-owned subsidiaries of Legg Mason, Inc. (“Legg Mason”). As of July 31, 2020, Legg Mason is a subsidiary of Franklin Resources.
Under the investment management agreement, each Portfolio pays an investment management fee, calculated daily and paid monthly, at an annual rate that decreases as assets increase, as follows: 0.13% of assets up to and including $1 billion, 0.11% of assets over $1 billion and up to and including $1.5 billion, 0.09% of assets over $1.5 billion and up to and including $2 billion, 0.08% of assets over $2 billion and up to and including $3.5 billion, 0.07% of assets over $3.5 billion and up to and including $5 billion and 0.06% of assets over $5 billion. For purposes of determining the effective management fee rate, the net assets of each Portfolio will be aggregated.
LMPFA provides administrative and certain oversight services to the Portfolios. LMPFA delegates to the subadviser the day-to-day portfolio management of the Portfolios, except for the management of the portion of each Portfolio’s cash and short-term instruments allocated to Western Asset. For its services, LMPFA pays QS Investors a fee monthly, at an annual rate equal to 70% of the net management fee it receives from each Portfolio. For Western Asset’s services to the Portfolios, LMPFA pays Western Asset monthly 0.02% of the portion of each Portfolio’s average daily net assets that are allocated to Western Asset by LMPFA.
As a result of expense limitation arrangements between the Portfolios and LMPFA, the ratio of total annual fund operating expenses, other than interest, brokerage, taxes, extraordinary expenses and acquired fund fees and expenses (fees and expenses of Underlying Funds), to average net assets of Class I and Class II shares of Aggressive Model Portfolio, Moderately Conservative Model Portfolio and Conservative Model Portfolio did not exceed 0.23% and 0.48%, respectively. Additionally, the ratio of total annual fund operating expenses, other than interest, brokerage, taxes, extraordinary expenses and acquired fund fees and expenses (fees and expenses of Underlying Funds), to average net assets of Class I and Class II shares
| | |
| | |
| Legg Mason/QS Model Portfolio Funds 2020 Annual Report | | 65 |
Notes to financial statements (cont’d)
of Moderately Aggressive Model Portfolio and Moderate Model Portfolio did not exceed 0.21% and 0.46%, respectively. These expense limitation arrangements cannot be terminated prior to December 31, 2022 without the Board of Trustees’ consent.
During the period ended December 31, 2020, fees waived and/or reimbursed were as follows:
| | | | |
| Aggressive Model Portfolio | | $ | 72,249 | |
| Moderately Aggressive Model Portfolio | | | 35,679 | |
| Moderate Model Portfolio | | | 37,031 | |
| Moderately Conservative Model Portfolio | | | 56,328 | |
| Conservative Model Portfolio | | | 69,053 | |
LMPFA is permitted to recapture amounts waived and/or expenses reimbursed to a class during the same fiscal year if the class’ total annual fund operating expenses have fallen to a level below the expense limitation (“expense cap”) in effect at the time the fees were earned or the expenses incurred. In no case will LMPFA recapture any amount that would result, on any particular business day of the Portfolios, in the class’ total annual fund operating expenses exceeding the expense cap or any other lower limit then in effect.
Legg Mason Investor Services, LLC (“LMIS”) serves as the Portfolios’ sole and exclusive distributor. As of July 31, 2020, LMIS is an indirect, wholly-owned broker-dealer subsidiary of Franklin Resources. Prior to July 31, 2020, LMIS was a wholly-owned broker-dealer subsidiary of Legg Mason.
As of July 31, 2020, all officers and one Trustee of the Trust are employees of Franklin Resources or its affiliates and do not receive compensation from the Trust. Prior to July 31, 2020, all officers and one Trustee of the Trust were employees of Legg Mason and did not receive compensation from the Trust.
3. Investments
During the period ended December 31, 2020, the aggregate cost of purchases and proceeds from sales of investments (excluding short-term investments) were as follows:
| | | | | | | | |
| | | Purchases | | | Sales | |
| Aggressive Model Portfolio | | $ | 75,092,400 | | | $ | 9,551,784 | |
| Moderately Aggressive Model Portfolio | | | 278,766,751 | | | | 31,811,493 | |
| Moderate Model Portfolio | | | 284,403,649 | | | | 30,307,018 | |
| Moderately Conservative Model Portfolio | | | 139,998,986 | | | | 15,345,689 | |
| Conservative Model Portfolio | | | 89,193,875 | | | | 8,010,319 | |
At December 31, 2020, the aggregate cost of investments and the aggregate gross unrealized appreciation and depreciation of investments for federal income tax purposes were as follows:
| | | | | | | | | | | | | | | | |
| | | Aggressive Model Portfolio | |
| | | Cost | | | Gross
Unrealized
Appreciation | | | Gross
Unrealized
Depreciation | | | Net
Unrealized
Appreciation | |
| Securities | | | $66,963,353 | | | | $6,527,417 | | | | $(85,580) | | | | $6,441,837 | |
| |
| | | Moderately Aggressive Model Portfolio | |
| | | Cost | | | Gross
Unrealized
Appreciation | | | Gross
Unrealized
Depreciation | | | Net
Unrealized
Appreciation | |
| Securities | | | $249,385,438 | | | | $19,022,504 | | | | $(450,620) | | | | $18,571,884 | |
| |
| | | Moderate Model Portfolio | |
| | | Cost | | | Gross
Unrealized
Appreciation | | | Gross
Unrealized
Depreciation | | | Net
Unrealized
Appreciation | |
| Securities | | | $258,724,139 | | | | $14,113,276 | | | | $(509,521) | | | | $13,603,755 | |
| | |
| | |
| 66 | | Legg Mason/QS Model Portfolio Funds 2020 Annual Report |
| | | | | | | | | | | | | | | | |
| | | Moderately Conservative Model Portfolio | |
| | | Cost | | | Gross
Unrealized
Appreciation | | | Gross
Unrealized
Depreciation | | | Net
Unrealized
Appreciation | |
| Securities | | | $127,009,420 | | | | $5,812,633 | | | | $(173,150) | | | | $5,639,483 | |
| |
| | | Conservative Model Portfolio | |
| | | Cost | | | Gross
Unrealized
Appreciation | | | Gross
Unrealized
Depreciation | | | Net
Unrealized
Appreciation | |
| Securities | | | $81,386,970 | | | | $1,947,335 | | | | $(156,139) | | | | $1,791,196 | |
4. Derivative instruments and hedging activities
During the period ended December 31, 2020, the Portfolios did not invest in derivative instruments.
5. Class specific expenses, waivers and/or expense reimbursements
The Portfolios have adopted a Rule 12b-1 shareholder services and distribution plan and under that plan Aggressive Model Portfolio, Moderately Aggressive Model Portfolio, Moderate Model Portfolio, Moderately Conservative Model Portfolio and Conservative Model Portfolio pay service and/or distribution fees with respect to their Class II shares calculated at the annual rate of 0.25% of the average daily net assets of the class. Service and/or distribution fees are accrued daily and paid monthly.
For the period ended December 31, 2020, class specific expenses were as follows:
| | | | | | | | |
| | | Service and/or
Distribution Fees† | | | Transfer Agent
Fees† | |
| Aggressive Model Portfolio | | | | | | | | |
| Class I | | | — | | | $ | 166 | |
| Class II | | $ | 49,388 | | | | 42 | |
| Total | | $ | 49,388 | | | $ | 208 | |
| † | For the period April 15, 2020 (inception date) to December 31, 2020. |
| | | | | | | | |
| | | Service and/or
Distribution Fees† | | | Transfer Agent
Fees† | |
| Moderately Aggressive Model Portfolio | | | | | |
| Class I | | | — | | | $ | 166 | |
| Class II | | $ | 182,945 | | | | 44 | |
| Total | | $ | 182,945 | | | $ | 210 | |
| † | For the period April 15, 2020 (inception date) to December 31, 2020. |
| | | | | | | | |
| | | Service and/or
Distribution Fees† | | | Transfer Agent
Fees† | |
| Moderate Model Portfolio | | | | | | | | |
| Class I | | | — | | | $ | 164 | |
| Class II | | $ | 178,793 | | | | 44 | |
| Total | | $ | 178,793 | | | $ | 208 | |
| † | For the period April 15, 2020 (inception date) to December 31, 2020. |
| | | | | | | | |
| | | Service and/or
Distribution Fees† | | | Transfer Agent
Fees† | |
| Moderately Conservative Model Portfolio | | | | | |
| Class I | | | — | | | $ | 164 | |
| Class II | | $ | 91,424 | | | | 44 | |
| Total | | $ | 91,424 | | | $ | 208 | |
| † | For the period April 15, 2020 (inception date) to December 31, 2020. |
| | |
| | |
| Legg Mason/QS Model Portfolio Funds 2020 Annual Report | | 67 |
Notes to financial statements (cont’d)
| | | | | | | | |
| | | Service and/or Distribution Fees† | | | Transfer Agent
Fees† | |
| Conservative Model Portfolio | | | | | | | | |
| Class I | | | — | | | $ | 158 | |
| Class II | | $ | 57,944 | | | | 44 | |
| Total | | $ | 57,944 | | | $ | 202 | |
| † | For the period April 15, 2020 (inception date) to December 31, 2020. |
For the period ended December 31, 2020, waivers and/or expense reimbursements by class were as follows:
| | | | |
| | | Waivers/Expense
Reimbursements† | |
| Aggressive Model Portfolio | | | | |
| Class I | | $ | 2,410 | |
| Class II | | | 69,839 | |
| Total | | $ | 72,249 | |
† For the period April 15, 2020 (inception date) to December 31, 2020. | |
| |
| | | Waivers/Expense
Reimbursements† | |
| Moderately Aggressive Model Portfolio | | | | |
| Class I | | $ | 621 | |
| Class II | | | 35,058 | |
| Total | | $ | 35,679 | |
† For the period April 15, 2020 (inception date) to December 31, 2020. | |
| |
| | | Waivers/Expense
Reimbursements† | |
| Moderate Model Portfolio | | | | |
| Class I | | $ | 498 | |
| Class II | | | 36,533 | |
| Total | | $ | 37,031 | |
† For the period April 15, 2020 (inception date) to December 31, 2020. | |
| |
| | | Waivers/Expense
Reimbursements† | |
| Moderately Conservative Model Portfolio | | | | |
| Class I | | $ | 686 | |
| Class II | | | 55,642 | |
| Total | | $ | 56,328 | |
† For the period April 15, 2020 (inception date) to December 31, 2020. | |
| |
| | | Waivers/Expense
Reimbursements† | |
| Conservative Model Portfolio | | | | |
| Class I | | $ | 1,105 | |
| Class II | | | 67,948 | |
| Total | | $ | 69,053 | |
† For the period April 15, 2020 (inception date) to December 31, 2020. | | | | |
| | |
| | |
| 68 | | Legg Mason/QS Model Portfolio Funds 2020 Annual Report |
6. Distributions to shareholders by class
| | | | |
| | | Period Ended
December 31, 2020† | |
| Aggressive Model Portfolio | | | | |
| Net Investment Income: | | | | |
| Class I | | $ | 19,526 | |
| Class II | | | 590,478 | |
| Total | | $ | 610,004 | |
| |
| Net Realized Gains: | | | | |
| Class I | | $ | 20,257 | |
| Class II | | | 670,755 | |
| Total | | $ | 691,012 | |
† For the period April 15, 2020 (inception date) to December 31, 2020. | |
| |
| | | Period Ended
December 31, 2020† | |
| Moderately Aggressive Model Portfolio | | | | |
| Net Investment Income: | | | | |
| Class I | | $ | 30,004 | |
| Class II | | | 2,374,999 | |
| Total | | $ | 2,405,003 | |
| |
| Net Realized Gains: | | | | |
| Class I | | $ | 21,241 | |
| Class II | | | 1,821,788 | |
| Total | | $ | 1,843,029 | |
† For the period April 15, 2020 (inception date) to December 31, 2020. | |
| |
| | | Period Ended
December 31, 2020† | |
| Moderate Model Portfolio | | | | |
| Net Investment Income: | | | | |
| Class I | | $ | 21,762 | |
| Class II | | | 2,428,257 | |
| Total | | $ | 2,450,019 | |
| |
| Net Realized Gains: | | | | |
| Class I | | $ | 13,538 | |
| Class II | | | 1,637,225 | |
| Total | | $ | 1,650,763 | |
† For the period April 15, 2020 (inception date) to December 31, 2020. | |
| |
| | | Period Ended
December 31, 2020† | |
| Moderately Conservative Model Portfolio | | | | |
| Net Investment Income: | | | | |
| Class I | | $ | 11,695 | |
| Class II | | | 1,268,308 | |
| Total | | $ | 1,280,003 | |
| | |
| | |
| Legg Mason/QS Model Portfolio Funds 2020 Annual Report | | 69 |
Notes to financial statements (cont’d)
| | | | |
| | | Period Ended
December 31, 2020† | |
| Moderately Conservative Model Portfolio (cont’d) | | | | |
| Net Realized Gains: | | | | |
| Class I | | $ | 4,363 | |
| Class II | | | 519,147 | |
| Total | | $ | 523,510 | |
† For the period April 15, 2020 (inception date) to December 31, 2020. | |
| |
| | | Period Ended
December 31, 2020† | |
| Conservative Model Portfolio | | | | |
| Net Investment Income: | | | | |
| Class I | | $ | 13,901 | |
| Class II | | | 1,011,106 | |
| Total | | $ | 1,025,007 | |
| |
| Net Realized Gains: | | | | |
| Class I | | $ | 3,970 | |
| Class II | | | 311,374 | |
| Total | | $ | 315,344 | |
† For the period April 15, 2020 (inception date) to December 31, 2020. | |
7. Shares of beneficial interest
At December 31, 2020, the Trust had an unlimited number of shares of beneficial interest authorized with a par value of $0.00001 per share. The Portfolios have the ability to issue multiple classes of shares. Each class of shares represents an identical interest and has the same rights, except that each class bears certain direct expenses, including those specifically related to the distribution of its shares.
Transactions in shares of each class were as follows:
| | | | | | | | |
| | | Period Ended
December 31, 2020† | |
| | | Shares | | | Amount | |
| Aggressive Model Portfolio | | | | | | | | |
| Class I | | | | | | | | |
| Shares sold | | | 183,465 | | | $ | 2,145,044 | |
| Shares issued on reinvestment | | | 3,041 | | | | 39,173 | |
| Shares repurchased | | | (20,033) | | | | (240,385) | |
| Net increase | | | 166,473 | | | $ | 1,943,832 | |
| | |
| Class II | | | | | | | | |
| Shares sold | | | 5,623,576 | | | $ | 66,216,812 | |
| Shares issued on reinvestment | | | 97,998 | | | | 1,261,233 | |
| Shares repurchased | | | (184,486) | | | | (2,131,431) | |
| Net increase | | | 5,537,088 | | | $ | 65,346,614 | |
† For the period April 15, 2020 (inception date) to December 31, 2020. | | | | | |
| | |
| | |
| 70 | | Legg Mason/QS Model Portfolio Funds 2020 Annual Report |
| | | | | | | | |
| | | Period Ended
December 31, 2020† | |
| | | Shares | | | Amount | |
| Moderately Aggressive Model Portfolio | | | | | | | | |
| Class I | | | | | | | | |
| Shares sold | | | 249,790 | | | $ | 2,852,160 | |
| Shares issued on reinvestment | | | 4,103 | | | | 50,635 | |
| Shares repurchased | | | (2,236) | | | | (25,375) | |
| Net increase | | | 251,657 | | | $ | 2,877,420 | |
| | |
| Class II | | | | | | | | |
| Shares sold | | | 21,290,002 | | | $ | 244,824,734 | |
| Shares issued on reinvestment | | | 340,372 | | | | 4,196,787 | |
| Shares repurchased | | | (110,763) | | | | (1,302,856) | |
| Net increase | | | 21,519,611 | | | $ | 247,718,665 | |
† For the period April 15, 2020 (inception date) to December 31, 2020. | | | | | | | | |
| | | | | | | | |
| | | Period Ended
December 31, 2020† | |
| | | Shares | | | Amount | |
| Moderate Model Portfolio | | | | | | | | |
| Class I | | | | | | | | |
| Shares sold | | | 185,739 | | | $ | 2,065,384 | |
| Shares issued on reinvestment | | | 2,951 | | | | 34,702 | |
| Shares repurchased | | | (3,246) | | | | (36,239) | |
| Net increase | | | 185,444 | | | $ | 2,063,847 | |
| | |
| Class II | | | | | | | | |
| Shares sold | | | 22,602,688 | | | $ | 252,561,173 | |
| Shares issued on reinvestment | | | 346,293 | | | | 4,065,482 | |
| Shares repurchased | | | (244,866) | | | | (2,735,334) | |
| Net increase | | | 22,704,115 | | | $ | 253,891,321 | |
† For the period April 15, 2020 (inception date) to December 31, 2020. | | | | | | | | |
| | | | | | | | |
| | | Period Ended
December 31, 2020† | |
| | | Shares | | | Amount | |
| Moderately Conservative Model Portfolio | | | | | | | | |
| Class I | | | | | | | | |
| Shares sold | | | 97,447 | | | $ | 1,061,286 | |
| Shares issued on reinvestment | | | 1,348 | | | | 15,430 | |
| Shares repurchased | | | (7,249) | | | | (81,866) | |
| Net increase | | | 91,546 | | | $ | 994,850 | |
| | |
| Class II | | | | | | | | |
| Shares sold | | | 11,475,474 | | | $ | 125,894,274 | |
| Shares issued on reinvestment | | | 156,246 | | | | 1,787,455 | |
| Shares repurchased | | | (342,361) | | | | (3,749,164) | |
| Net increase | | | 11,289,359 | | | $ | 123,932,565 | |
† For the period April 15, 2020 (inception date) to December 31, 2020. | | | | | | | | |
| | |
| | |
| Legg Mason/QS Model Portfolio Funds 2020 Annual Report | | 71 |
Notes to financial statements (cont’d)
| | | | | | | | |
| | | Period Ended
December 31, 2020† | |
| | | Shares | | | Amount | |
| Conservative Model Portfolio | | | | | | | | |
| Class I | | | | | | | | |
| Shares sold | | | 119,343 | | | $ | 1,271,799 | |
| Shares issued on reinvestment | | | 1,574 | | | | 17,138 | |
| Shares repurchased | | | (24,432) | | | | (258,532) | |
| Net increase | | | 96,485 | | | $ | 1,030,405 | |
| | |
| Class II | | | | | | | | |
| Shares sold | | | 7,560,270 | | | $ | 80,624,306 | |
| Shares issued on reinvestment | | | 121,551 | | | | 1,322,480 | |
| Shares repurchased | | | (143,602) | | | | (1,528,553) | |
| Net increase | | | 7,538,219 | | | $ | 80,418,233 | |
† For the period April 15, 2020 (inception date) to December 31, 2020. | |
8. Income tax information and distributions to shareholders
The tax character of distributions paid during the fiscal year ended December 31, 2020 was as follows:
| | | | | | | | | | | | | | | | | | | | |
| | | Aggressive
Model
Portfolio | | | Moderately
Aggressive
Model
Portfolio | | | Moderate
Model
Portfolio | | | Moderately
Conservative
Model
Portfolio | | | Conservative
Model
Portfolio | |
| Distributions paid from: | | | | | | | | | | | | | | | | | | | | |
| Ordinary income | | $ | 610,004 | | | $ | 2,405,003 | | | $ | 2,450,019 | | | $ | 1,280,080 | | | $ | 1,025,016 | |
| Net long-term capital gains | | | 691,012 | | | | 1,843,029 | | | | 1,650,763 | | | | 523,433 | | | | 315,335 | |
| Total distributions paid | | $ | 1,301,016 | | | | $4,248,032 | | | $ | 4,100,782 | | | $ | 1,803,513 | | | $ | 1,340,351 | |
| As of December 31, 2020, the components of distributable earnings (loss) on a tax basis were as follows: | |
| | | | | | | | | | | | | | | | | | | | |
| | | Aggressive
Model
Portfolio | | | Moderately
Aggressive
Model
Portfolio | | | Moderate
Model
Portfolio | | | Moderately
Conservative
Model
Portfolio | | | Conservative
Model
Portfolio | |
| Undistributed ordinary income — net | | $ | 54,425 | | | $ | 154,868 | | | $ | 70,576 | | | $ | 13,264 | | | $ | 3,423 | |
| Undistributed long-term capital gains — net | | | 9,823 | | | | 83,753 | | | | 33,202 | | | | — | | | | — | |
| Total undistributed earnings | | $ | 64,248 | | | $ | 238,621 | | | $ | 103,778 | | | $ | 13,264 | | | $ | 3,423 | |
| Deferred capital losses* | | | — | | | | — | | | | — | | | | (17,038) | | | | (20,629) | |
| Other book/tax temporary differences(a) | | | (18,209) | | | | (17,003) | | | | (17,786) | | | | (18,122) | | | | (18,314) | |
| Unrealized appreciation | | | | | | | | | | | | | | | | | | | | |
| (depreciation)(b) | | | 6,441,837 | | | | 18,571,884 | | | | 13,603,755 | | | | 5,639,483 | | | | 1,791,196 | |
| Total distributable earnings (loss) — net | | $ | 6,487,876 | | | | $18,793,502 | | | $ | 13,689,747 | | | $ | 5,617,587 | | | $ | 1,755,676 | |
| * | These capital losses have been deferred in the current year as either short-term or long-term losses. The losses will be deemed to occur on the first day of the next taxable year in the same character as they were originally deferred and will be available to offset future taxable capital gains. |
| (a) | Other book/tax temporary differences are attributable to book/tax differences in the timing of the deductibility of various expenses. |
| (b) | The difference between book-basis and tax-basis unrealized appreciation (depreciation) is attributable to the tax deferral of losses on wash sales. |
9. Other matter
The outbreak of the respiratory illness COVID-19 (commonly referred to as “coronavirus”) has continued to rapidly spread around the world, causing considerable uncertainty for the global economy and financial markets. The ultimate economic fallout from the pandemic, and the long-term impact on economies, markets, industries and individual issuers, are not known. The COVID-19 pandemic could adversely affect the value and liquidity of the Portfolios’ investments, impair the Portfolios’ ability to satisfy redemption requests, and negatively impact the Portfolios’ performance. In addition, the outbreak
| | |
| | |
| 72 | | Legg Mason/QS Model Portfolio Funds 2020 Annual Report |
of COVID-19, and measures taken to mitigate its effects, could result in disruptions to the services provided to the Portfolio by its service providers.
| | |
| | |
| Legg Mason/QS Model Portfolio Funds 2020 Annual Report | | 73 |
Report of independent registered public accounting firm
To the Board of Trustees of Legg Mason Partners Variable Equity Trust and Shareholders of Legg Mason/QS Aggressive Model Portfolio, Legg Mason/QS Moderately Aggressive Model Portfolio, Legg Mason/QS Moderate Model Portfolio, Legg Mason/QS Moderately Conservative Model Portfolio and Legg Mason/QS Conservative Model Portfolio
Opinions on the Financial Statements
We have audited the accompanying statements of assets and liabilities, including the schedules of investments, of Legg Mason/QS Aggressive Model Portfolio, Legg Mason/QS Moderately Aggressive Model Portfolio, Legg Mason/QS Moderate Model Portfolio, Legg Mason/QS Moderately Conservative Model Portfolio and Legg Mason/QS Conservative Model Portfolio (five of the funds constituting Legg Mason Partners Variable Equity Trust, hereafter collectively referred to as the “Funds”) as of December 31, 2020, the related statements of operations and changes in net assets, including the related notes, and the financial highlights for the period April 15, 2020 (inception date) through December 31, 2020 (collectively referred to as the “financial statements”). In our opinion, the financial statements present fairly, in all material respects, the financial position of each of the Funds as of December 31, 2020, and the results of each of their operations, changes in each of their net assets, and each of the financial highlights for the period April 15, 2020 (inception date) through December 31, 2020 in conformity with accounting principles generally accepted in the United States of America.
Basis for Opinions
These financial statements are the responsibility of the Funds’ management. Our responsibility is to express an opinion on the Funds’ financial statements based on our audits. We are a public accounting firm registered with the Public Company Accounting Oversight Board (United States) (PCAOB) and are required to be independent with respect to the Funds in accordance with the U.S. federal securities laws and the applicable rules and regulations of the Securities and Exchange Commission and the PCAOB.
We conducted our audits of these financial statements in accordance with the standards of the PCAOB. Those standards require that we plan and perform the audit to obtain reasonable assurance about whether the financial statements are free of material misstatement, whether due to error or fraud.
Our audits included performing procedures to assess the risks of material misstatement of the financial statements, whether due to error or fraud, and performing procedures that respond to those risks. Such procedures included examining, on a test basis, evidence regarding the amounts and disclosures in the financial statements. Our audits also included evaluating the accounting principles used and significant estimates made by management, as well as evaluating the overall presentation of the financial statements. Our procedures included confirmation of securities owned as of December 31, 2020 by correspondence with the custodian. We believe that our audits provide a reasonable basis for our opinions.
/s/PricewaterhouseCoopers LLP
Baltimore, Maryland
February 12, 2021
We have served as the auditor of one or more investment companies in the Franklin Templeton Group of Funds since 1948.
| | |
| | |
| 74 | | Legg Mason/QS Model Portfolio Funds 2020 Annual Report |
Statement regarding liquidity risk management program (unaudited)
As required by law, each fund has adopted and implemented a liquidity risk management program (the “Program”) that is designed to assess and manage liquidity risk. Liquidity risk is the risk that the funds could not meet requests to redeem their shares without significant dilution of remaining investors’ interests in the funds. Legg Mason Partners Fund Advisor, LLC (the “Manager”), the funds’ manager, is the administrator of the Program. The Manager has established a liquidity risk management committee (the “Committee”) to administer the Program on a day-to-day basis.
The Committee, on behalf of the Manager, provided the funds’ Board of Trustees with a report that addressed the operation of the Program, assessed its adequacy and effectiveness of implementation, including, if applicable, the operation of any highly liquid investment minimum (“HLIM”), and described any material changes that had been made to the Program or were recommended (the “Report”). The Report covered the period from December 1, 2018 through December 31, 2019 (the “Reporting Period”).
The Report confirmed that there were no material changes to the Program during the Reporting Period and that no changes were recommended.
The Report also confirmed that, throughout the Reporting Period, the Committee had monitored each fund’s portfolio liquidity and liquidity risk on an ongoing basis, as described in the Program and in Board reporting throughout the Reporting Period.
The Report discussed the Committee’s annual review of the Program, which addressed, among other things, the following elements of the Program:
Assessment, Management, and Periodic Review of Liquidity Risk. The Committee reviewed each fund’s investment strategy and liquidity of portfolio investments during both normal and reasonably foreseeable stressed conditions. The Committee noted that the funds’ investment strategy continues to be appropriate for an open-end fund, taking into account, among other things, whether and to what extent the funds held less liquid and illiquid assets and the extent to which any such investments affected the funds’ ability to meet redemption requests. In managing and reviewing the funds’ liquidity risk, the Committee also considered the extent to which the funds’ investment strategy involves a relatively concentrated portfolio or large positions in particular issuers, the extent to which the fund uses borrowing for investment purposes, and the extent to which the funds use derivatives (including for hedging purposes). The Committee also reviewed the funds’ short-term and long-term cash flow projections during both normal and reasonably foreseeable stressed conditions. In assessing the funds’ cash flow projections, the Committee considered, among other factors, historical net redemption activity, redemption policies, ownership concentration, distribution channels, and the degree of certainty associated with the funds’ short-term and long-term cash flow projections. The Committee also considered the funds’ holdings of cash and cash equivalents, as well as borrowing arrangements and other funding sources, including, if applicable, the funds’ participation in a credit facility, as components of the funds’ ability to meet redemption requests.
Liquidity Classification. The Committee reviewed the Program’s liquidity classification methodology for categorizing each fund’s investments into one of four liquidity buckets. In reviewing the funds’ investments, the Committee considered, among other factors, whether trading varying portions of a position in a particular portfolio investment or asset class in sizes the fund would reasonably anticipate trading, would be reasonably expected to significantly affect liquidity.
Highly Liquid Investment Minimum. The Committee performed an analysis to determine whether the funds are required to maintain a Highly Liquid Investment Minimum, and determined that no such minimum is required because the funds primarily hold highly liquid investments.
Compliance with Limitation on Illiquid Investments. The Committee confirmed that during the Reporting Period, the funds did not acquire any illiquid investment such that, after the acquisition, the funds would have invested more than 15% of their assets in illiquid investments that are assets, in accordance with the Program and applicable SEC rules.
Redemptions in Kind. The Committee confirmed that no redemptions in-kind were effected by each fund during the Reporting Period.
The Report stated that the Committee concluded that the Program is reasonably designed and operated effectively to assess and manage the funds’ liquidity risk throughout the Reporting Period.
| | |
| | |
| Legg Mason/QS Model Portfolio Funds | | 75 |
Additional information (unaudited)
Information about Trustees and Officers
The business and affairs of Legg Mason/QS Model Portfolio (the “Portfolios”) are conducted by management under the supervision and subject to the direction of its Board of Trustees. The business address of each Trustee is c/o Jane Trust, Legg Mason, 100 International Drive, 11th Floor, Baltimore, Maryland 21202. Information pertaining to the Trustees and officers of the Portfolios is set forth below.
The Statement of Additional Information includes additional information about Trustees and is available, without charge, upon request by calling the Fund at 1-877-721-1926.
| | |
| Independent Trustees† |
|
| Paul R. Ades |
| |
| Year of birth | | 1940 |
| Position(s) with Trust | | Trustee |
| Term of office1 and length of time served2 | | Since 1983 |
| Principal occupation(s) during the past five years | | Paul R. Ades, PLLC (law firm) (since 2000) |
| Number of funds in fund complex overseen by Trustee | | 49 |
| Other board memberships held by Trustee during the past five years | | None |
| |
| Andrew L. Breech | | |
| |
| Year of birth | | 1952 |
| Position(s) with Trust | | Trustee |
| Term of office1 and length of time served2 | | Since 1991 |
| Principal occupation(s) during the past five years | | President, Dealer Operating Control Service, Inc. (automotive retail management) (since 1985) |
| Number of funds in fund complex overseen by Trustee | | 49 |
| Other board memberships held by Trustee during the past five years | | None |
| |
| Althea L. Duersten | | |
| |
| Year of birth | | 1951 |
| Position(s) with Trust | | Trustee and Chair |
| Term of office1 and length of time served2 | | Since 2014 |
| Principal occupation(s) during the past five years | | Retired (since 2011); formerly, Chief Investment Officer, North America, JPMorgan Chase (investment bank) and member of JPMorgan Executive Committee (2007 to 2011) |
| Number of funds in fund complex overseen by Trustee | | 49 |
| Other board memberships held by Trustee during the past five years | | Non-Executive Director, Rokos Capital Management LLP (since 2019) |
| |
| Stephen R. Gross | | |
| |
| Year of birth | | 1947 |
| Position(s) with Trust | | Trustee |
| Term of office1 and length of time served2 | | Since 1986 |
| Principal occupation(s) during the past five years | | Chairman Emeritus (since 2011) and formerly, Chairman, HLB Gross Collins, P.C. (accounting and consulting firm) (1979 to 2011); Executive Director of Business Builders Team, LLC (since 2005); Principal, Gross Consulting Group, LLC (since 2011); CEO, Gross Capital Partners, LLC (since 2014); CEO, Trusted CFO Solutions, LLC (since 2011) |
| Number of funds in fund complex overseen by Trustee | | 49 |
| Other board memberships held by Trustee during the past five years | | None |
| | |
| | |
| 76 | | Legg Mason/QS Model Portfolio Funds |
| | |
| Independent Trustees† (cont’d) |
|
| Susan M. Heilbron |
| |
| Year of birth | | 1945 |
| Position(s) with Trust | | Trustee |
| Term of office1 and length of time served2 | | Since 1991 |
| Principal occupation(s) during the past five years | | Retired; formerly, President, Lacey & Heilbron (communications consulting) (1990 to 2002); General Counsel and Executive Vice President, The Trump Organization (1986 to 1990); Senior Vice President, New York State Urban Development Corporation (1984 to 1986); Associate, Cravath, Swaine & Moore LLP (1980 to 1984) and (1977 to 1979) |
| Number of funds in fund complex overseen by Trustee | | 49 |
| Other board memberships held by Trustee during the past five years | | Formerly, Director, Lincoln Savings Bank, FSB (1991 to 1994); Director, Trump Shuttle, Inc. (air transportation) (1989 to 1990); Director, Alexander’s Inc. (department store) (1987 to 1990) |
| |
| Howard J. Johnson | | |
| Year of birth | | 1938 |
| Position(s) with Trust | | Trustee |
| Term of office1 and length of time served2 | | From 1981 to 1998 and since 2000 (Chairman since 2013) |
| Principal occupation(s) during the past five years | | Retired; formerly, Chief Executive Officer, Genesis Imaging LLC (technology company) (2003 to 2012) |
| Number of funds in fund complex overseen by Trustee | | 49 |
| Other board memberships held by Trustee during the past five years | | None |
| |
| Jerome H. Miller | | |
| Year of birth | | 1938 |
| Position(s) with Trust | | Trustee |
| Term of office1 and length of time served2 | | Since 1995 |
| Principal occupation(s) during the past five years | | Retired; formerly, President, Shearson Lehman Asset Management (1991 to 1993), Vice Chairman, Shearson Lehman Hutton Inc. (1989 to 1992) and Senior Executive Vice President, E.F. Hutton Group Inc. (1986 to 1989) |
| Number of funds in fund complex overseen by Trustee | | 49 |
| Other board memberships held by Trustee during the past five years | | None |
| |
| Ken Miller | | |
| Year of birth | | 1942 |
| Position(s) with Trust | | Trustee |
| Term of office1 and length of time served2 | | Since 1983 |
| Principal occupation(s) during the past five years | | Retired; formerly, President, Young Stuff Apparel Group, Inc. (apparel manufacturer), division of Li & Fung (1963 to 2012) |
| Number of funds in fund complex overseen by Trustee | | 49 |
| Other board memberships held by Trustee during the past five years | | None |
| | |
| | |
| Legg Mason/QS Model Portfolio Funds | | 77 |
Additional information (unaudited) (cont’d)
Information about Trustees and Officers
| | |
| Independent Trustees† (cont’d) |
|
| Thomas F. Schlafly |
| Year of birth | | 1948 |
| Position(s) with Trust | | Trustee |
| Term of office1 and length of time served2 | | Since 1983 |
| Principal occupation(s) during the past five years | | Chairman, The Saint Louis Brewery, LLC (brewery) (since 2012); formerly, President, The Saint Louis Brewery, Inc. (1989 to 2012); Senior Counsel (since 2017) and formerly, Partner (2009 to 2016), Thompson Coburn LLP (law firm) |
| Number of funds in fund complex overseen by Trustee | | 49 |
| Other board memberships held by Trustee during the past five years | | Director, CNB St. Louis Bank (since 2006) |
| | |
| Interested Trustee and Officer |
| |
| Jane Trust, CFA3 | | |
| Year of birth | | 1962 |
| Position(s) with Trust | | Trustee, President and Chief Executive Officer |
| Term of office1 and length of time served2 | | Since 2015 |
| Principal occupation(s) during the past five years | | Senior Vice President, Fund Board Management, Franklin Templeton (since 2020); Officer and/or Trustee/Director of 147 funds associated with Legg Mason Partners Fund Advisor, LLC (“LMPFA”) or its affiliates (since 2015); President and Chief Executive Officer of LMPFA (since 2015); formerly, Senior Managing Director (2018 to 2020) and Managing Director (2016 to 2018) of Legg Mason & Co., LLC (“Legg Mason & Co.”); Senior Vice President of LMPFA (2015) |
| Number of funds in fund complex overseen by Trustee | | 145 |
| Other board memberships held by Trustee during the past five years | | None |
| | |
| Additional Officers | | |
|
Ted P. Becker Franklin Templeton 620 Eighth Avenue, 47th Floor, New York, NY 10018 |
| Year of birth | | 1951 |
| Position(s) with Trust | | Chief Compliance Officer |
| Term of office1 and length of time served2 | | Since 2007 |
| Principal occupation(s) during the past five years | | Vice President, Global Compliance of Franklin Templeton (since 2020); Chief Compliance Officer of LMPFA (since 2006); Chief Compliance Officer of certain funds associated with Legg Mason & Co. or its affiliates (since 2006); formerly, Director of Global Compliance at Legg Mason, Inc. (2006 to 2020); Managing Director of Compliance of Legg Mason & Co. (2005 to 2020) |
| |
Susan Kerr Franklin Templeton 620 Eighth Avenue, 47th Floor, New York, NY 10018 | | |
| Year of birth | | 1949 |
| Position(s) with Trust | | Chief Anti-Money Laundering Compliance Officer |
| Term of office1 and length of time served2 | | Since 2013 |
| Principal occupation(s) during the past five years | | Senior Compliance Analyst, Franklin Templeton (since 2020); Chief Anti-Money Laundering Compliance Officer of certain funds associated with Legg Mason & Co. or its affiliates (since 2013) and Anti-Money Laundering Compliance Officer (since 2012), Senior Compliance Officer (since 2011) and Assistant Vice President (since 2010) of Legg Mason Investor Services, LLC (“LMIS”); formerly, Assistant Vice President of Legg Mason & Co. (2010 to 2020) |
| | |
| | |
| 78 | | Legg Mason/QS Model Portfolio Funds |
| | |
| Additional Officers (cont’d) | | |
| |
Jenna Bailey Franklin Templeton 100 First Stamford Place, 5th Floor, Stamford, CT 06902 | | |
| Year of birth | | 1978 |
| Position(s) with Trust | | Identity Theft Prevention Officer |
| Term of office1 and length of time served2 | | Since 2015 |
| Principal occupation(s) during the past five years | | Senior Compliance Analyst of Franklin Templeton (since 2020); Identity Theft Prevention Officer of certain funds associated with Legg Mason & Co. or its affiliates (since 2015); formerly, Compliance Officer of Legg Mason & Co. (2013 to 2020); Assistant Vice President of Legg Mason & Co. (2011 to 2020) |
| |
Marc A. De Oliveira* Franklin Templeton 100 First Stamford Place, 6th Floor, Stamford, CT 06902 | | |
| Year of birth | | 1971 |
| Position(s) with Trust | | Secretary and Chief Legal Officer |
| Term of office1 and length of time served2 | | Since 2020 |
| Principal occupation(s) during the past five years | | Associate General Counsel of Franklin Templeton (since 2020); Assistant Secretary of certain funds associated with Legg Mason & Co. or its affiliates (since 2006); formerly, Managing Director (2016 to 2020) and Associate General Counsel of Legg Mason & Co. (2005 to 2020) |
| |
Thomas C. Mandia Franklin Templeton 100 First Stamford Place, 6th Floor, Stamford, CT 06902 | | |
| Year of birth | | 1962 |
| Position(s) with Trust | | Senior Vice President |
| Term of office1 and length of time served2 | | Since 2020 |
| Principal occupation(s) during the past five years | | Senior Associate General Counsel of Franklin Templeton (since 2020); Secretary of LMPFA (since 2006); Assistant Secretary of certain funds associated with Legg Mason & Co. or its affiliates (since 2006); Secretary of LM Asset Services, LLC (“LMAS”) (since 2002) and Legg Mason Fund Asset Management, Inc. (“LMFAM”) (since 2013) (formerly registered investment advisers); formerly, Managing Director and Deputy General Counsel of Legg Mason & Co. (2005 to 2020) |
| |
Christopher Berarducci Franklin Templeton 620 Eighth Avenue, 47th Floor, New York, NY 10018 | | |
| Year of birth | | 1974 |
| Position(s) with Trust | | Treasurer and Principal Financial Officer |
| Term of office1 and length of time served2 | | Since 2014 and 2019 |
| Principal occupation(s) during the past five years | | Vice President, Fund Administration and Reporting, Franklin Templeton (since 2020); Treasurer (since 2010) and Principal Financial Officer (since 2019) of certain funds associated with Legg Mason & Co. or its affiliates; formerly, Managing Director (2020), Director (2015 to 2020), and Vice President (2011 to 2015) of Legg Mason & Co. |
| |
Jeanne M. Kelly Franklin Templeton 620 Eighth Avenue, 47th Floor, New York, NY 10018 | | |
| Year of birth | | 1951 |
| Position(s) with Trust | | Senior Vice President |
| Term of office1 and length of time served2 | | Since 2007 |
| Principal occupation(s) during the past five years | | U.S. Fund Board Team Manager, Franklin Templeton (since 2020); Senior Vice President of certain funds associated with Legg Mason & Co. or its affiliates (since 2007); Senior Vice President of LMPFA (since 2006); President and Chief Executive Officer of LMAS and LMFAM (since 2015); formerly, Managing Director of Legg Mason & Co. (2005 to 2020); Senior Vice President of LMFAM (2013 to 2015) |
| | |
| | |
| Legg Mason/QS Model Portfolio Funds | | 79 |
Additional information (unaudited) (cont’d)
Information about Trustees and Officers
| † | Trustees who are not “interested persons” of the Portfolios within the meaning of Section 2(a)(19) of the Investment Company Act of 1940, as amended (the “1940 Act”). |
| * | Effective August 6, 2020, Mr. De Oliveira became Secretary and Chief Legal Officer. |
| 1 | Each Trustee and officer serves until his or her respective successor has been duly elected and qualified or until his or her earlier death, resignation, retirement or removal. |
| 2 | Indicates the earliest year in which the Trustee became a board member for a fund in the Legg Mason fund complex or the officer took such office. |
| 3 | Ms. Trust is an “interested person” of the Portfolios, as defined in the 1940 Act, because of her position with LMPFA and/or certain of its affiliates. |
| | |
| | |
| 80 | | Legg Mason/QS Model Portfolio Funds |
Important tax information (unaudited)
The following information is provided with respect to the distributions paid during the taxable year ended December 31, 2020:
| | | | | | | | | | | | | | | | | | | | |
| | | Aggressive
Model
Portfolio | | | Moderately
Aggressive
Model
Portfolio | | | Moderate Model
Portfolio | | | Moderately
Conservative
Model Portfolio | | | Conservative
Model
Portfolio | |
| Record date: | | | 12/29/2020 | | | | 12/29/2020 | | | | 12/29/2020 | | | | 12/29/2020 | | | | 12/29/2020 | |
| Payable date: | | | 12/30/2020 | | | | 12/30/2020 | | | | 12/30/2020 | | | | 12/30/2020 | | | | 12/30/2020 | |
| Long-Term Capital Gain Dividend | | | $0.126770 | | | | $0.086260 | | | | $0.074380 | | | | $0.046840 | | | | $0.041830 | |
| | |
| | |
| Legg Mason/QS Model Portfolio Funds | | 81 |
Legg Mason/QS
Model Portfolio Funds
Trustees
Paul R. Ades
Andrew L. Breech
Althea L. Duersten
Chair
Stephen R. Gross
Susan M. Heilbron
Howard J. Johnson
Jerome H. Miller
Ken Miller
Thomas F. Schlafly
Jane Trust
Investment manager
Legg Mason Partners Fund Advisor, LLC
Subadviser
QS Investors, LLC
Distributor
Legg Mason Investor Services, LLC
Custodian
The Bank of New York Mellon
Transfer agent
BNY Mellon Investment Servicing (US) Inc.
4400 Computer Drive
Westborough, MA 01581
Independent registered public accounting firm
PricewaterhouseCoopers LLP
Baltimore, MD
Legg Mason/QS Model Portfolio Funds
Legg Mason/QS Aggressive Model Portfolio
Legg Mason/QS Moderately Aggressive Model Portfolio
Legg Mason/QS Moderate Model Portfolio
Legg Mason/QS Moderately Conservative Model Portfolio
Legg Mason/QS Conservative Model Portfolio
The Portfolios are separate investment series of Legg Mason Partners Variable Equity Trust, a Maryland statutory trust.
Legg Mason/QS Model Portfolio Funds
Legg Mason Funds
620 Eighth Avenue, 47th Floor
New York, NY 10018
The Portfolios file their complete schedule of portfolio holdings with the Securities and Exchange Commission (“SEC”) for the first and third quarters of each fiscal year as an exhibit to their reports on Form N-PORT. The Portfolios’ Forms N-PORT are available on the SEC’s website at www.sec.gov. To obtain information on Form N-PORT, shareholders can call the Portfolios at 1-877-721-1926.
Information on how the Portfolios voted proxies relating to portfolio securities during the prior 12-month period ended June 30th of each year and a description of the policies and procedures that the Portfolios use to determine how to vote proxies related to portfolio transactions are available (1) without charge, upon request, by calling the Portfolios at 1-877-721-1926, (2) at www.leggmason.com/variablefunds and (3) on the SEC’s website at www.sec.gov.
This report is submitted for the general information of the shareholders of Legg Mason/QS Aggressive Model Portfolio, Legg Mason/QS Moderately Aggressive Model Portfolio, Legg Mason/QS Moderate Model Portfolio, Legg Mason/QS Moderately Conservative Model Portfolio and Legg Mason/QS Conservative Model Portfolio. This report is not authorized for distribution to prospective investors in the Portfolios unless preceded or accompanied by a current prospectus.
Investors should consider each Portfolio’s investment objectives, risks, charges and expenses carefully before investing. Each prospectus contains this and other important information about the Portfolios. Please read the prospectuses carefully before investing.
www.leggmason.com
© 2021 Legg Mason Investor Services, LLC
Member FINRA, SIPC
Legg Mason Funds Privacy and Security Notice
Your Privacy and the Security of Your Personal Information is Very Important to the Legg Mason Funds
This Privacy and Security Notice (the “Privacy Notice”) addresses the Legg Mason Funds’ privacy and data protection practices with respect to nonpublic personal information the Funds receive. The Legg Mason Funds include any funds sold by the Funds’ distributor, Legg Mason Investor Services, LLC, as well as Legg Mason-sponsored closed-end funds. The provisions of this Privacy Notice apply to your information both while you are a shareholder and after you are no longer invested with the Funds.
The Type of Nonpublic Personal Information the Funds Collect About You
The Funds collect and maintain nonpublic personal information about you in connection with your shareholder account. Such information may include, but is not limited to:
| • | | Personal information included on applications or other forms; |
| • | | Account balances, transactions, and mutual fund holdings and positions; |
| • | | Bank account information, legal documents, and identity verification documentation; |
| • | | Online account access user IDs, passwords, security challenge question responses; and |
| • | | Information received from consumer reporting agencies regarding credit history and creditworthiness (such as the amount of an individual’s total debt, payment history, etc.). |
How the Funds Use Nonpublic Personal Information About You
The Funds do not sell or share your nonpublic personal information with third parties or with affiliates for their marketing purposes, or with other financial institutions or affiliates for joint marketing purposes, unless you have authorized the Funds to do so. The Funds do not disclose any nonpublic personal information about you except as may be required to perform transactions or services you have authorized or as permitted or required by law.
The Funds may disclose information about you to:
| • | | Employees, agents, and affiliates on a “need to know” basis to enable the Funds to conduct ordinary business, or to comply with obligations to government regulators; |
| • | | Service providers, including the Funds’ affiliates, who assist the Funds as part of the ordinary course of business (such as printing, mailing services, or processing or servicing your account with us) or otherwise perform services on the Funds’ behalf, including companies that may perform statistical analysis, market research and marketing services solely for the Funds; |
| • | | Permit access to transfer, whether in the United States or countries outside of the United States to such Funds’ employees, agents and affiliates and service providers as required to enable the Funds to conduct ordinary business, or to comply with obligations to government regulators; |
| • | | The Funds’ representatives such as legal counsel, accountants and auditors to enable the Funds to conduct ordinary business, or to comply with obligations to government regulators; |
| • | | Fiduciaries or representatives acting on your behalf, such as an IRA custodian or trustee of a grantor trust. |
Except as otherwise permitted by applicable law, companies acting on the Funds’ behalf, including those outside the United States, are contractually obligated to keep nonpublic personal information the Funds provide to them confidential and to use the information the Funds share only to provide the services the Funds ask them to perform. The Funds may disclose nonpublic personal information about you when necessary to enforce their rights or protect against fraud, or as permitted or required by applicable law, such as in connection with a law enforcement or regulatory request, subpoena, or similar legal process. In the event of a corporate action or in the event a Fund service provider changes, the Funds may be required to disclose your nonpublic personal information to third parties. While it is the Funds’ practice to obtain protections for disclosed information in these types of transactions, the Funds cannot guarantee their privacy policy will remain unchanged.
|
| NOT PART OF THE ANNUAL REPORT |
Legg Mason Funds Privacy and Security Notice (cont’d)
Keeping You Informed of the Funds’ Privacy and Security Practices
The Funds will notify you annually of their privacy policy as required by federal law. While the Funds reserve the right to modify this policy at any time they will notify you promptly if this privacy policy changes.
The Funds’ Security Practices
The Funds maintain appropriate physical, electronic and procedural safeguards designed to guard your nonpublic personal information. The Funds’ internal data security policies restrict access to your nonpublic personal information to authorized employees, who may use your nonpublic personal information for Fund business purposes only.
Although the Funds strive to protect your nonpublic personal information, they cannot ensure or warrant the security of any information you provide or transmit to them, and you do so at your own risk. In the event of a breach of the confidentiality or security of your nonpublic personal information, the Funds will attempt to notify you as necessary, so you can take appropriate protective steps. If you have consented to the Funds using electronic communications or electronic delivery of statements, they may notify you under such circumstances using the most current email address you have on record with them.
In order for the Funds to provide effective service to you, keeping your account information accurate is very important. If you believe that your account information is incomplete, not accurate or not current, if you have questions about the Funds’ privacy practices, or our use of your nonpublic personal information, write the Funds using the contact information on your account statements, email the Funds by clicking on the Contact Us section of the Funds’ website at www.leggmason.com, or contact the Fund at 1-877-721-1926.
Revised April 2018
Legg Mason California Consumer Privacy Act Policy
Although much of the personal information we collect is “nonpublic personal information” subject to federal law, residents of California may, in certain circumstances, have additional rights under the California Consumer Privacy Act (“CCPA”). For example, if you are a broker, dealer, agent, fiduciary, or representative acting by or on behalf of, or for, the account of any other person(s) or household, or a financial advisor, or if you have otherwise provided personal information to us separate from the relationship we have with personal investors, the provisions of this Privacy Policy apply to your personal information (as defined by the CCPA).
| • | | In addition to the provisions of the Legg Mason Funds Security and Privacy Notice, you may have the right to know the categories and specific pieces of personal information we have collected about you. |
| • | | You also have the right to request the deletion of the personal information collected or maintained by the Funds. |
If you wish to exercise any of the rights you have in respect of your personal information, you should advise the Funds by contacting them as set forth below. The rights noted above are subject to our other legal and regulatory obligations and any exemptions under the CCPA. You may designate an authorized agent to make a rights request on your behalf, subject to the identification process described below. We do not discriminate based on requests for information related to our use of your personal information, and you have the right not to receive discriminatory treatment related to the exercise of your privacy rights.
We may request information from you in order to verify your identity or authority in making such a request. If you have appointed an authorized agent to make a request on your behalf, or you are an authorized agent making such a request (such as a power of attorney or other written permission), this process may include providing a password/passcode, a copy of government issued identification, affidavit or other applicable documentation, i.e. written permission. We may require you to verify your identity directly even when using an authorized agent, unless a power of attorney has been provided. We reserve the right to deny a request submitted by an agent if suitable and appropriate proof is not provided.
For the 12-month period prior to the date of this Privacy Policy, the Legg Mason Funds have not sold any of your personal information; nor do we have any plans to do so in the future.
|
| NOT PART OF THE ANNUAL REPORT |
Legg Mason Funds Privacy and Security Notice (cont’d)
Contact Information
Address: Data Privacy Officer, 100 International Dr., Baltimore, MD 21202
Email: DataProtectionOfficer@franklintempleton.com
Phone: 1-800-396-4748
Revised October 2020
|
| NOT PART OF THE ANNUAL REPORT |
www.leggmason.com
© 2021 Legg Mason Investor Services, LLC Member FINRA, SIPC
QSIN632443 2/21 SR21-4076
The registrant has adopted a code of ethics that applies to the registrant’s principal executive officer, principal financial officer, principal accounting officer or controller.
| ITEM 3. | AUDIT COMMITTEE FINANCIAL EXPERT. |
The Board of Trustees of the registrant has determined that Stephen R. Gross possesses the technical attributes identified in Instruction 2(b) of Item 3 to Form N-CSR to qualify as an “audit committee financial expert,” and has designated Stephen R. Gross as the Audit Committee’s financial expert Stephen R. Gross is an “independent” Trustees pursuant to paragraph (a)(2) of Item 3 to Form N-CSR.
| ITEM 4. | PRINCIPAL ACCOUNTANT FEES AND SERVICES. |
a) Audit Fees. The aggregate fees billed in the last two fiscal years ending December 31, 2019 and December 31, 2020 (the “Reporting Periods”) for professional services rendered by the Registrant’s principal accountant (the “Auditor”) for the audit of the Registrant’s annual financial statements, or services that are normally provided by the Auditor in connection with the statutory and regulatory filings or engagements for the Reporting Periods, were $296,402 in December 31, 2019 and $379,280 in December 31, 2020.
b) Audit-Related Fees. The aggregate fees billed in the Reporting Period for assurance and related services by the Auditor that are reasonably related to the performance of the Registrant’s financial statements were $0 in December 31, 2019 and $0 in December 31, 2020.
(c) Tax Fees. The aggregate fees billed in the Reporting Periods for professional services rendered by the Auditor for tax compliance, tax advice and tax planning (“Tax Services”) were $0 in December 31, 2019 and $0 in December 31, 2020. These services consisted of (i) review or preparation of U.S. federal, state, local and excise tax returns; (ii) U.S. federal, state and local tax planning, advice and assistance regarding statutory, regulatory or administrative developments, and (iii) tax advice regarding tax qualification matters and/or treatment of various financial instruments held or proposed to be acquired or held.
There were no fees billed for tax services by the Auditors to service affiliates during the Reporting Periods that required pre-approval by the Audit Committee.
d) All Other Fees. The aggregate fees billed in the Reporting Periods for products and services provided by the Auditor, other than the services reported in paragraphs (a) through (c) for the Item 4 for the Legg Mason Partners Variable Equity Trust., were $0 in December 31, 2019 and $0 in December 31, 2020
All Other Fees. There were no other non-audit services rendered by the Auditor to Legg Mason Partners Fund Advisors, LLC (“LMPFA”), and any entity controlling, controlled by or under common control with LMPFA that provided ongoing services to Legg Mason Partners Variable Equity Trust requiring pre-approval by the Audit Committee in the Reporting Period.
(e) Audit Committee’s pre–approval policies and procedures described in paragraph (c) (7) of Rule 2-01 of Regulation S-X.
(1) The Charter for the Audit Committee (the “Committee”) of the Board of each registered investment company (the “Fund”) advised by LMPFA or one of their affiliates (each, an “Adviser”) requires that the Committee shall approve (a) all audit and permissible non-audit services to be provided to the Fund and (b) all permissible non-audit services to be provided by the Fund’s independent auditors to the Adviser and any Covered Service Providers if the engagement relates directly to the operations and financial reporting of the Fund. The Committee may implement policies and procedures by which such services are approved other than by the full Committee.
The Committee shall not approve non-audit services that the Committee believes may impair the independence of the auditors. As of the date of the approval of this Audit Committee Charter, permissible non-audit services include any professional services (including tax services), that are not prohibited services as described below, provided to the Fund by the independent auditors, other than those provided to the Fund in connection with an audit or a review of the financial statements of the Fund. Permissible non-audit services may not include: (i) bookkeeping or other services related to the accounting records or financial statements of the Fund; (ii) financial information systems design and implementation; (iii) appraisal or valuation services, fairness opinions or contribution-in-kind reports; (iv) actuarial services; (v) internal audit outsourcing services; (vi) management functions or human resources; (vii) broker or dealer, investment adviser or investment banking services; (viii) legal services and expert services unrelated to the audit; and (ix) any other service the Public Company Accounting Oversight Board determines, by regulation, is impermissible.
Pre-approval by the Committee of any permissible non-audit services is not required so long as: (i) the aggregate amount of all such permissible non-audit services provided to the Fund, the Adviser and any service providers controlling, controlled by or under common control with the Adviser that provide ongoing services to the Fund (“Covered Service Providers”) constitutes not more than 5% of the total amount of revenues paid to the independent auditors during the fiscal year in which the permissible non-audit services are provided to (a) the Fund, (b) the Adviser and (c) any entity controlling, controlled by or under common control with the Adviser that provides ongoing services to the Fund during the fiscal year in which the services are provided that would have to be approved by the Committee; (ii) the permissible non-audit services were not recognized by the Fund at the time of the engagement to be non-audit services; and (iii) such services are promptly brought to the attention of the Committee and approved by the Committee (or its delegate(s)) prior to the completion of the audit.
(2) For the Legg Mason Partners Variable Equity Trust, the percentage of fees that were approved by the audit committee, with respect to: Audit-Related Fees were 100% and 100% for December 31, 2019 and December 31, 2020; Tax Fees were 100% and 100% for December 31, 2019 and December 31, 2020; and Other Fees were 100% and 100% for December 31, 2019 and December 31, 2020.
(f) N/A
(g) Non-audit fees billed by the Auditor for services rendered to Legg Mason Partners Variable Equity Trust, LMPFA and any entity controlling, controlled by, or under common control with LMPFA that provides ongoing services to Legg Mason Partners Variable Equity Trust during the reporting period were $544,232 in December 31, 2019 and $674,925 in December 31, 2020.
(h) Yes. Legg Mason Partners Variable Equity Trust’s Audit Committee has considered whether the provision of non-audit services that were rendered to Service Affiliates, which were not pre-approved (not requiring pre-approval), is compatible with maintaining the Accountant’s independence. All services provided by the Auditor to the Legg Mason Partners Variable Equity Trust or to Service Affiliates, which were required to be pre-approved, were pre-approved as required.
| ITEM 5. | AUDIT COMMITTEE OF LISTED REGISTRANTS. |
| | a) | The independent board members are acting as the registrant’s audit committee as specified in Section 3(a)(58)(B) of the Exchange Act .The Audit Committee consists of the following Board members: |
Paul R. Ades
Andrew L. Breech
Althea L. Duersten
Stephen R. Gross
Susan M. Heilbron
Howard J. Johnson
Jerome H. Miller
Ken Miller
Thomas F. Schlafly
b) Not applicable
| ITEM 6. | SCHEDULE OF INVESTMENTS. |
Included herein under Item 1.
| ITEM 7. | DISCLOSURE OF PROXY VOTING POLICIES AND PROCEDURES FOR CLOSED-END MANAGEMENT INVESTMENT COMPANIES. |
Not applicable.
| ITEM 8. | PORTFOLIO MANAGERS OF CLOSED-END MANAGEMENT INVESTMENT COMPANIES. |
Not applicable.
| ITEM 9. | PURCHASES OF EQUITY SECURITIES BY CLOSED-END MANAGEMENT INVESTMENT COMPANY AND AFFILIATED PURCHASERS. |
Not applicable.
| ITEM 10. | SUBMISSION OF MATTERS TO A VOTE OF SECURITY HOLDERS. |
Not applicable.
| ITEM 11. | CONTROLS AND PROCEDURES. |
| | (a) | The registrant’s principal executive officer and principal financial officer have concluded that the registrant’s disclosure controls and procedures (as defined in Rule 30a- 3(c) under the Investment Company Act of 1940, as amended (the “1940 Act”)) are effective as of a date within 90 days of the filing date of this report that includes the disclosure required by this paragraph, based on their evaluation of the disclosure controls and procedures required by Rule 30a-3(b) under the 1940 Act and 15d-15(b) under the Securities Exchange Act of 1934. |
| | (b) | There were no changes in the registrant’s internal control over financial reporting (as defined in Rule 30a-3(d) under the 1940 Act) that occurred during the second fiscal quarter of the period covered by this report that have materially affected, or are likely to materially affect the registrant’s internal control over financial reporting. |
| ITEM 12. | DISCLOSURE OF SECURITIES LENDING ACTIVITIES FOR CLOSED-END MANAGEMENT INVESTMENT COMPANIES. |
Not applicable.
(a) (1) Code of Ethics attached hereto.
Exhibit 99.CODE ETH
(a) (2) Certifications pursuant to section 302 of the Sarbanes-Oxley Act of 2002 attached hereto.
Exhibit 99.CERT
(b) Certifications pursuant to Section 906 of the Sarbanes-Oxley Act of 2002 attached hereto.
Exhibit 99.906CERT
SIGNATURES
Pursuant to the requirements of the Securities Exchange Act of 1934 and the Investment Company Act of 1940, the registrant has duly caused this Report to be signed on its behalf by the undersigned, there unto duly authorized.
Legg Mason Partners Variable Equity Trust
| | |
| By: | | /s/ Jane Trust |
| | Jane Trust |
| | Chief Executive Officer |
Date: February 22, 2021
Pursuant to the requirements of the Securities Exchange Act of 1934 and the Investment Company Act of 1940, this report has been signed below by the following persons on behalf of the registrant and in the capacities and on the dates indicated.
| | |
| By: | | /s/ Jane Trust |
| | Jane Trust |
| | Chief Executive Officer |
| |
| Date: | | February 22, 2021 |
| |
| By: | | /s/ Christopher Berarducci |
| | Christopher Berarducci |
| | Principal Financial Officer |
| |
| Date: | | February 22, 2021 |