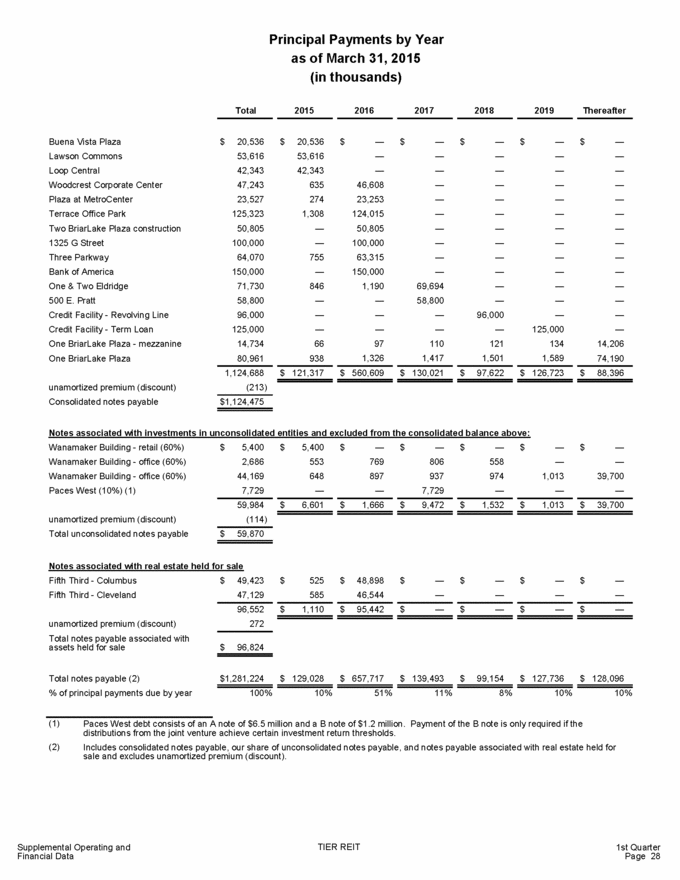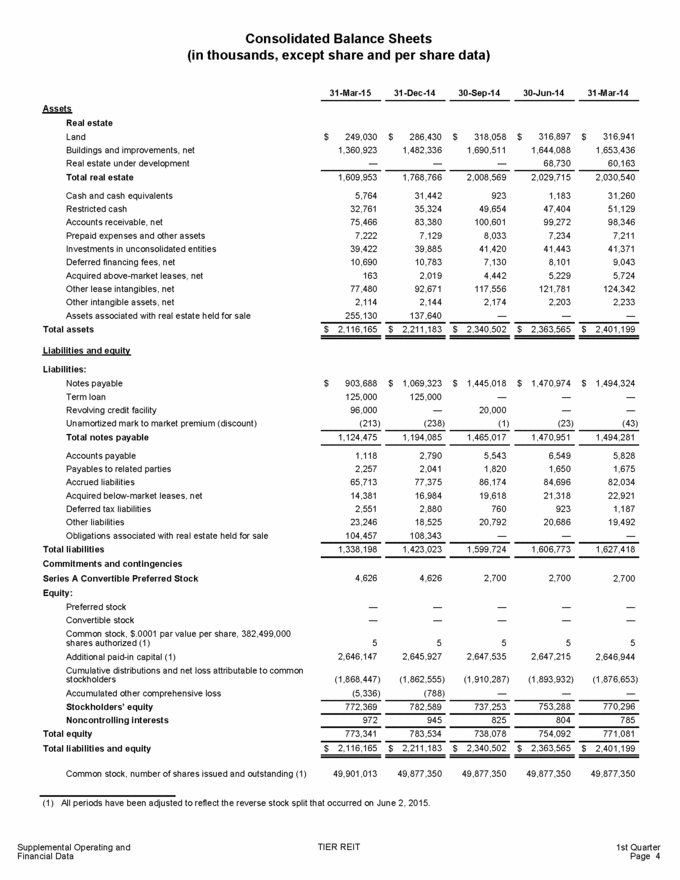
| Consolidated Balance Sheets (in thousands, except share and per share data) 31-Mar-15 31-Dec-14 30-Sep-14 30-Jun-14 31-Mar-14 Assets Real estate Land Buildings and improvements, net Real estate under development Total real estate Cash and cash equivalents Restricted cash Accounts receivable, net Prepaid expenses and other assets Investments in unconsolidated entities Deferred financing fees, net Acquired above-market leases, net Other lease intangibles, net Other intangible assets, net Assets associated with real estate held for sale Total assets $ 249,030 1,360,923 — $ 286,430 1,482,336 — $ 318,058 1,690,511 — $ 316,897 1,644,088 68,730 $ 316,941 1,653,436 60,163 1,609,953 5,764 32,761 75,466 7,222 39,422 10,690 163 77,480 2,114 255,130 1,768,766 31,442 35,324 83,380 7,129 39,885 10,783 2,019 92,671 2,144 137,640 2,008,569 923 49,654 100,601 8,033 41,420 7,130 4,442 117,556 2,174 — 2,029,715 1,183 47,404 99,272 7,234 41,443 8,101 5,229 121,781 2,203 — 2,030,540 31,260 51,129 98,346 7,211 41,371 9,043 5,724 124,342 2,233 — $ 2,116,165 $ 2,211,183 $ 2,340,502 $ 2,363,565 $ 2,401,199 Liabilities and equity Liabilities: Notes payable Term loan Revolving credit facility Unamortized mark to market premium (discount) Total notes payable Accounts payable Payables to related parties Accrued liabilities Acquired below-market leases, net Deferred tax liabilities Other liabilities Obligations associated with real estate held for sale Total liabilities Commitments and contingencies Series A Convertible Preferred Stock Equity: Preferred stock Convertible stock Common stock, $.0001 par value per share, 382,499,000 shares authorized (1) Additional paid-in capital (1) Cumulative distributions and net loss attributable to common stockholders Accumulated other comprehensive loss Stockholders’ equity Noncontrolling interests Total equity Total liabilities and equity $ 903,688 125,000 96,000 (213) $ 1,069,323 125,000 — (238) $ 1,445,018 — 20,000 (1) $ 1,470,974 — — (23) $ 1,494,324 — — (43) 1,124,475 1,194,085 1,465,017 1,470,951 1,494,281 1,118 2,257 65,713 14,381 2,551 23,246 104,457 2,790 2,041 77,375 16,984 2,880 18,525 108,343 5,543 1,820 86,174 19,618 760 20,792 — 6,549 1,650 84,696 21,318 923 20,686 — 5,828 1,675 82,034 22,921 1,187 19,492 — 1,338,198 1,423,023 1,599,724 1,606,773 1,627,418 4,626 4,626 2,700 2,700 2,700 — — — — — — — — — — 5 2,646,147 5 2,645,927 5 2,647,535 5 2,647,215 5 2,646,944 (1,868,447) (5,336) (1,862,555) (788) (1,910,287) — (1,893,932) — (1,876,653) — 772,369 782,589 737,253 753,288 770,296 972 945 825 804 785 773,341 783,534 738,078 754,092 771,081 $ 2,116,165 $ 2,211,183 $ 2,340,502 $ 2,363,565 $ 2,401,199 Common stock, number of shares issued and outstanding (1) 49,901,013 49,877,350 49,877,350 49,877,350 49,877,350 (1) All periods have been adjusted to reflect the reverse stock split that occurred on June 2, 2015. TIER REIT Supplemental Operating and Financial Data 1st Quarter Page 4 |