Supplemental Operating and Financial Data
For the Quarter Ended June 30, 2015
About the Company
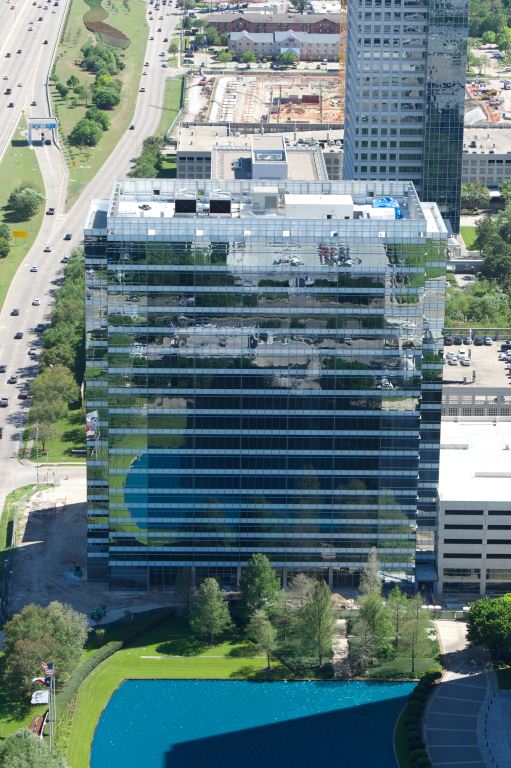
TIER REIT, Inc. is a self-managed, Dallas, Texas-based real estate investment trust whose goal is to maximize total return to stockholders through the combination of stock appreciation and income derived from a sustainable distribution. TIER’s investment strategy is to acquire, develop, and operate a portfolio of best-in-class office properties in select markets across the U.S. that consistently lead the nation in population and office-using employment growth. As of June 30, 2015, we owned interests in 31 operating office properties, one recently developed non-operating office property and one retail property, located in 16 markets throughout the United States with a total of 12.4 million rentable square feet.
Senior Management
|
| | |
| Scott W. Fordham | | Chief Executive Officer and President |
| Dallas E. Lucas | | Chief Financial Officer and Treasurer |
| William J. Reister | | Chief Investment Officer and Executive Vice President |
| Telisa Webb Schelin | | Chief Legal Officer, Executive Vice President and Secretary |
| James E. Sharp | | Chief Accounting Officer and Executive Vice President |
| R. Heath Johnson | | Managing Director - Asset Management |
| Dean R. Hook | | Senior Vice President - Information Systems |
Where to Get More Information: |
| | |
| Kelly Sargent | | Vice President - Investor Relations |
By Phone:
(972) 483-2400
By Email:
ir@tierreit.com
By Mail:
17300 Dallas Parkway, Suite 1010
Dallas, Texas 75248
as of September 14, 2015, please contact us at our new address:
5950 Sherry Lane, Suite 700
Dallas, Texas 75225
Website:
www.tierreit.com
Supplemental Operating and Financial Data
For the Quarter Ended June 30, 2015
Table of Contents:
|
| | |
| Overview and Highlights | |
| Overview | 1 |
|
| Financial Highlights | 2-3 |
|
| Consolidated Balance Sheets | 4 |
|
| Consolidated Statements of Operations | 5 |
|
| Consolidated Statements of Discontinued Operations | 6 |
|
| Calculation of FFO and FAD | 7 |
|
| Calculation of EBITDA | 8 |
|
| Joint Venture Financial Summary | 9 |
|
| Same Store Analysis | 10 |
|
| Schedule of Properties Owned | 11 |
|
| Net Operating Income by Market | 12 |
|
| Components of Net Asset Value | 13 |
|
| Selected Non-Stabilized Properties | 14 |
|
| Significant Tenants | 15 |
|
| Industry Diversification | 16 |
|
| | |
| Leasing | |
| Leasing Activity | 17-18 |
|
| Lease Expirations | 19-20 |
|
| Occupancy Trends | 21 |
|
| | |
| Capital Expenditures | |
| Leasing Cost Analysis | 22 |
|
| Leasing Cost Trend Analysis | 23 |
|
| Development, Leasing, and Capital Expenditures Summary | 24 |
|
| | |
| Other Information | |
| Potential Future Development Sites | 25 |
|
| Acquisition and Disposition Activities | 26 |
|
| Summary of Financing | 27 |
|
| Principal Payments by Year | 28 |
|
| Definitions of Non-GAAP Financial Measures | 29-30 |
|
Forward Looking Statements
This supplemental operating and financial data report contains forward-looking statements relating to the business and financial outlook of TIER REIT, Inc. that are based on current expectations, estimates, forecasts, and projections and are not guarantees of future performance. Statements contained herein may be impacted by a number of risks and uncertainties, including the company’s ability to rent space on favorable terms, its ability to address debt maturities and fund its capital requirements, the value of its assets, its anticipated capital expenditures, and other matters. Actual results may differ materially from those expressed in these forward-looking statements, and you should not place undue reliance on any such statements. A number of important factors could cause actual results to differ materially from the forward-looking statements contained in this document, as well as other factors described in the Risk Factors section of TIER REIT, Inc.’s Annual Report on Form 10-K for the year ended December 31, 2014, and subsequent Quarterly Report on Form 10-Q for the quarter ended June 30, 2015. Forward-looking statements in this document speak only as of the date on which such statements were made, and we undertake no obligation to update any such statements that may become untrue because of subsequent events.
Overview
For the Quarter Ended June 30, 2015
Quarterly Highlights and Financial Results
| |
| • | FFO attributable to common stockholders, excluding certain items for the second quarter of 2015 was $17.2 million, as compared to $17.4 million for the first quarter of 2015, a decrease of $0.2 million, or 1.1% |
| |
| • | Same Store GAAP NOI for the second quarter of 2015 was $31.5 million, as compared to $29.4 million for the second quarter of 2014, an increase of $2.1 million, or 7.1% |
| |
| • | Same Store Cash NOI for the second quarter of 2015 and 2014 were each $27.6 million. |
Property Results
| |
| • | Occupancy at June 30, 2015, was 89.0%, an increase of 60 basis points from March 31, 2015 |
| |
| • | Leased 857,000 square feet - 622,000 square feet of renewals, 91,000 square feet of expansion space, and 144,000 square feet of new leasing |
Real Estate Activities
| |
| • | Sold Fifth Third Center (Cleveland, Ohio) for $52.8 million, resulting in a $6.1 million gain |
| |
| • | Sold 1650 Arch Street and United Plaza (Philadelphia, Pennsylvania) for $190.8 million, resulting in a combined gain on sale of $27.5 million |
| |
| • | Sold Colorado Building and 1325 G Street (Washington, D.C.) for $202.0 million, to two separate entities in which we maintain a 10% ownership interest resulting in a combined gain on sale of $17.1 million |
| |
| • | Acquired a 95% interest in a land development project in the central business district of Austin,Texas, for $7.5 million |
| |
| • | Acquired a 95% interest in a land development project in the Legacy Town Center submarket of Plano (Dallas),Texas, for $6.2 million |
Capital Market Activities
| |
| • | Paid off $496.0 million of CMBS debt secured by six properties |
| |
| • | Amended credit facility adding a seven-year $275.0 million term loan that matures in June 2022, with an initial swapped-to-fixed interest rate of 3.67% |
| |
| • | Reduced our 2015 and 2016 debt maturities to $47.5 million and $237.4 million, respectively |
| |
| • | On July 23, 2015, we listed our common stock on the NYSE under the ticker symbol “TIER” |
|
| | |
Supplemental Operating and Financial Data | TIER REIT | 2nd Quarter Page 1 |
|
| | | | | | | | | | | | | | | | | | | | | | | | | | | | |
| Financial Highlights |
| (in thousands, except per share data, effective rent data, and number of properties) |
| | | | | | | | | | | | | | | |
| | 30-Jun-15 | | 30-Jun-14 | | | 30-Jun-15 | | 31-Mar-15 | | 31-Dec-14 | | 30-Sep-14 | | 30-Jun-14 |
| Portfolio Summary: | | | | | | | | | | | | | | |
| (at our ownership %, unless otherwise noted) | | | | | | | | | | | | | | |
| Total operating office properties | 31 |
| | 38 |
| | | 31 |
| | 34 |
| | 37 |
| | 37 |
| | 38 |
|
| Rentable square feet (100%) (operating properties) | 11,946 |
| | 15,501 |
| | | 11,946 |
| | 13,624 |
| | 14,304 |
| | 15,291 |
| | 15,501 |
|
| Rentable square feet (own %) (operating properties) | 10,418 |
| | 14,364 |
| | | 10,418 |
| | 12,487 |
| | 13,167 |
| | 14,154 |
| | 14,364 |
|
| Occupancy % | 89 | % | | 86 | % | | | 89 | % | | 88 | % | | 88 | % | | 87 | % | | 86 | % |
| Executed % SF leased | 89 | % | | 87 | % | | | 89 | % | | 90 | % | | 89 | % | | 89 | % | | 87 | % |
| Economic % SF leased | 82 | % | | 81 | % | | | 82 | % | | 82 | % | | 82 | % | | 82 | % | | 81 | % |
| Average effective rent/square feet | $ | 24.94 |
| | $ | 25.79 |
| | | $ | 24.94 |
| | $ | 25.95 |
| | $ | 26.02 |
| | $ | 26.13 |
| | $ | 25.79 |
|
| | | | | | | | | | | | | | | |
| | Six Months Ended | | | Three Months Ended |
| | 30-Jun-15 | | 30-Jun-14 | | | 30-Jun-15 | | 31-Mar-15 | | 31-Dec-14 | | 30-Sep-14 | | 30-Jun-14 |
| Financial Results: | | | | | | | | | | | | | | |
| Revenue | $ | 145,857 |
| | $ | 141,294 |
| | | $ | 70,038 |
| | $ | 75,819 |
| | $ | 74,616 |
| | $ | 72,157 |
| | $ | 71,234 |
|
| Base rent | $ | 108,259 |
| | $ | 104,343 |
| | | $ | 51,336 |
| | $ | 56,923 |
| | $ | 54,771 |
| | $ | 53,141 |
| | $ | 52,305 |
|
| Free rent | $ | (10,538 | ) | | $ | (5,085 | ) | | | $ | (5,365 | ) | | $ | (5,173 | ) | | $ | (3,717 | ) | | $ | (2,284 | ) | | $ | (2,518 | ) |
| NOI | $ | 73,522 |
| | $ | 68,153 |
| | | $ | 36,858 |
| | $ | 36,664 |
| | $ | 38,116 |
| | $ | 36,192 |
| | $ | 35,547 |
|
| Net income (loss) attributable to common stockholders (2) | $ | (7,043 | ) | | $ | (46,893 | ) | | | $ | (1,151 | ) | | $ | (5,892 | ) | | $ | 45,806 |
| | $ | (16,355 | ) | | $ | (17,279 | ) |
| Diluted earnings (loss) per common share (1) (2) | $ | (0.14 | ) | | $ | (0.94 | ) | | | $ | (0.02 | ) | | $ | (0.12 | ) | | $ | 0.92 |
| | $ | (0.33 | ) | | $ | (0.35 | ) |
| FFO attributable to common stockholders | $ | (1,147 | ) | | $ | 33,536 |
| | | $ | (18,051 | ) | | $ | 16,904 |
| | $ | 3,107 |
| | $ | 17,071 |
| | $ | 19,066 |
|
| Diluted FFO per common share (2) | $ | (0.02 | ) | | $ | 0.67 |
| | | $ | (0.36 | ) | | $ | 0.34 |
| | $ | 0.06 |
| | $ | 0.34 |
| | $ | 0.38 |
|
| FFO attributable to common stockholders, excluding certain items | $ | 34,625 |
| | $ | 33,536 |
| | | $ | 17,181 |
| | $ | 17,444 |
| | $ | 17,889 |
| | $ | 18,020 |
| | $ | 19,066 |
|
| Diluted FFO, excluding certain items per common share (2) | $ | 0.69 |
| | $ | 0.67 |
| | | $ | 0.34 |
| | $ | 0.35 |
| | $ | 0.36 |
| | $ | 0.36 |
| | $ | 0.38 |
|
| FAD attributable to common stockholders | $ | 380 |
| | $ | (3,992 | ) | | | $ | (1,176 | ) | | $ | 1,556 |
| | $ | (2,656 | ) | | $ | 1,958 |
| | $ | 1,505 |
|
| FAD per common share (2) | $ | 0.01 |
| | $ | (0.08 | ) | | | $ | (0.02 | ) | | $ | 0.03 |
| | $ | (0.05 | ) | | $ | 0.04 |
| | $ | 0.03 |
|
| Normalized EBITDA | $ | 70,511 |
| | $ | 77,449 |
| | | $ | 33,439 |
| | $ | 37,072 |
| | $ | 41,294 |
| | $ | 40,094 |
| | $ | 41,090 |
|
| Weighted average common shares outstanding - basic (2) | 49,892 |
| | 49,874 |
| | | 49,893 |
| | 49,891 |
| | 49,877 |
| | 49,877 |
| | 49,877 |
|
| Weighted average common shares outstanding - diluted (2) | 50,076 |
| | 50,001 |
| | | 50,085 |
| | 50,066 |
| | 49,996 |
| | 49,996 |
| | 49,937 |
|
| | | | | | | | | | | | | | | |
| Selected Additional Trend Information: | | | | | | | | | | | | | | |
| Renewal % based on square feet | 81 | % | | 58 | % | | | 83 | % | | 74 | % | | 89 | % | | 75 | % | | 49 | % |
| Distributions declared on common shares | $ | 9,011 |
| | $ | — |
| | | $ | 9,011 |
| | $ | — |
| | $ | — |
| | $ | — |
| | $ | — |
|
| Annualized distribution yield (3) | 1.3 | % | | 0.0 | % | | | 2.7 | % | | 0.0 | % | | 0.0 | % | | 0.0 | % | | 0.0 | % |
(1) In periods of net loss from continuing operations or negative FFO attributable to common stockholders there are no dilutive securities and diluted earnings (loss) per common share or diluted FFO per common share is calculated using weighted average common shares outstanding - basic as the denominator.
(2) All periods presented have been adjusted to reflect the one-for-six reverse stock split that occurred on June 2, 2015.
(3) Based on the October 30, 2014, estimated per share value of our common stock.
Occupancy % represents the total square footage subject to commenced leases as of the reporting date as a percentage of the total rentable square feet (at our ownership interest).
Executed % SF leased represents the total square footage subject to commenced leases plus the square footage for currently vacant space that is subject to executed leases that have not commenced as of the reporting date as a percentage of the total rentable square feet (at our ownership interest).
Economic % SF leased represents the total square footage subject to commenced leases as of the reporting date adjusted to exclude the square footage associated with leases receiving rental abatements as a percentage of the total rentable square feet (at our ownership interest).
Average effective rent represents 12 times the sum of the monthly contractual amounts for base rent and the pro rata budgeted operating expense reimbursements, as of period end, related to leases in place as of period end, as reduced for free rent and excluding any scheduled future rent increases, as adjusted for our ownership interest.
This section includes non-GAAP financial measures, which are accompanied by what we consider the most directly comparable financial measures calculated and presented in accordance with GAAP. Quantitative reconciliations of the differences between the non-GAAP financial measures presented and the most directly comparable GAAP financial measures are shown on pages 7-8. A description of the non-GAAP financial measures we present and a statement of the reasons why management believes the non-GAAP measures provide useful information to investors about the Company’s financial condition and results of operations can be found on pages 29-30.
|
| | |
Supplemental Operating and Financial Data | TIER REIT | 2nd Quarter Page 2 |
|
| | | | | | | | | | | | | | | | | | | | | | | | | | | | |
| Financial Highlights (continued) |
| (in thousands) |
| | | | | | | |
| | 30-Jun-15 | | 30-Jun-14 | | | 30-Jun-15 | | 31-Mar-15 | | 31-Dec-14 | | 30-Sep-14 | | 30-Jun-14 |
| Selected Balance Sheet Items: | | | | | | | | | | | | | | |
| | | | | | | | | | | | | | | |
| Total book value of real estate (1) | $ | 1,488,373 |
| | $ | 2,029,715 |
| | | $ | 1,488,373 |
| | $ | 1,609,953 |
| | $ | 1,768,766 |
| | $ | 2,008,569 |
| | $ | 2,029,715 |
|
| | | | | | | | | | | | | | | |
| Cash and cash equivalents | $ | 153,158 |
| | $ | 1,183 |
| | | $ | 153,158 |
| | $ | 5,764 |
| | $ | 31,442 |
| | $ | 923 |
| | $ | 1,183 |
|
| | | | | | | | | | | | | | | |
| Unconsolidated cash and cash equivalents (at ownership %) | $ | 3,368 |
| | $ | 3,127 |
| | | $ | 3,368 |
| | $ | 2,480 |
| | $ | 3,355 |
| | $ | 3,621 |
| | $ | 3,127 |
|
| | | | | | | | | | | | | | | |
| Restricted cash | $ | 29,620 |
| | $ | 47,404 |
| | | $ | 29,620 |
| | $ | 32,761 |
| | $ | 35,324 |
| | $ | 49,654 |
| | $ | 47,404 |
|
| | | | | | | | | | | | | | | |
| Total assets | $ | 1,919,743 |
| | $ | 2,363,565 |
| | | $ | 1,919,743 |
| | $ | 2,116,165 |
| | $ | 2,211,183 |
| | $ | 2,340,502 |
| | $ | 2,363,565 |
|
| | | | | | | | | | | | | | | |
| Mortgage notes payable (1) | $ | 505,224 |
| | $ | 1,470,951 |
| | | $ | 505,224 |
| | $ | 903,475 |
| | $ | 1,069,085 |
| | $ | 1,445,017 |
| | $ | 1,470,951 |
|
| | | | | | | | | | | | | | | |
| Revolving credit facility and term loan | $ | 525,000 |
| | $ | — |
| | | $ | 525,000 |
| | $ | 221,000 |
| | $ | 125,000 |
| | $ | 20,000 |
| | $ | — |
|
| | | | | | | | | | | | | | | |
| Notes payable classified as held for sale | $ | — |
| | $ | — |
| | | $ | — |
| | $ | 96,824 |
| | $ | 97,257 |
| | $ | — |
| | $ | — |
|
| | | | | | | | | | | | | | | |
| Unconsolidated debt (at ownership %) | $ | 72,392 |
| | $ | 60,988 |
| | | $ | 72,392 |
| | $ | 59,870 |
| | $ | 60,253 |
| | $ | 60,625 |
| | $ | 60,988 |
|
| | | | | | | | | | | | | | | |
| Total liabilities | $ | 1,144,786 |
| | $ | 1,606,773 |
| | | $ | 1,144,786 |
| | $ | 1,338,198 |
| | $ | 1,423,023 |
| | $ | 1,599,724 |
| | $ | 1,606,773 |
|
| | | | | | | | | | | | | | | |
| Common stock outstanding (5) | 49,872 |
| | 49,877 |
| | | 49,872 |
| | 49,901 |
| | 49,877 |
| | 49,877 |
| | 49,877 |
|
| | | | | | | | | | | | | | | |
| OP units and vested restricted stock units outstanding (5) | 76 |
| | 72 |
| | | 76 |
| | 78 |
| | 78 |
| | 78 |
| | 72 |
|
| | | | | | | | | | | | | | | |
| Restricted stock outstanding (5) | 192 |
| | 119 |
| | | 192 |
| | 192 |
| | 119 |
| | 119 |
| | 119 |
|
| | | | | | | | | | | | | | | |
| Capitalization: |
| |
| | | | | | | | | | | |
| | | | | | | | | | | | | | | |
| Market capitalization (2) | $ | 1,342,602 |
| | $ | 1,258,726 |
| | | $ | 1,342,602 |
| | $ | 1,343,444 |
| | $ | 1,342,808 |
| | $ | 1,258,883 |
| | $ | 1,258,726 |
|
| | | | | | | | | | | | | | | |
| Total debt (3) | $ | 1,102,616 |
| | $ | 1,531,939 |
| | | $ | 1,102,616 |
| | $ | 1,281,169 |
| | $ | 1,351,595 |
| | $ | 1,525,642 |
| | $ | 1,531,939 |
|
| | | | | | | | | | | | | | | |
| Net debt (4) | $ | 946,090 |
| | $ | 1,527,629 |
| | | $ | 946,090 |
| | $ | 1,272,925 |
| | $ | 1,316,798 |
| | $ | 1,521,098 |
| | $ | 1,527,629 |
|
| | | | | | | | | | | | | | | |
| Total capitalization | $ | 2,445,218 |
| | $ | 2,790,665 |
| | | $ | 2,445,218 |
| | $ | 2,624,613 |
| | $ | 2,694,403 |
| | $ | 2,784,525 |
| | $ | 2,790,665 |
|
| | | | | | | | | | | | | | | |
| Net debt/total capitalization | 39 | % | | 55 | % | | | 39 | % | | 48 | % | | 49 | % | | 55 | % | | 55 | % |
| | | | | | | | | | | | | | | |
| | Six Months Ended | | | Three Months Ended |
| | 30-Jun-15 | | 30-Jun-14 | | | 30-Jun-15 | | 31-Mar-15 | | 31-Dec-14 | | 30-Sep-14 | | 30-Jun-14 |
| Ratios: | | | | | | | | | | | | | | |
| | | | | | | | | | | | | | | |
| NOI margin % | 50.4 | % | | 48.2 | % | | | 52.6 | % | | 48.4 | % | | 51.1 | % | | 50.2 | % | | 49.9 | % |
| | | | | | | | | | | | | | | |
| Normalized fixed charge coverage | 1.77 |
| | 1.42 |
| | | 1.78 |
| | 1.76 |
| | 1.54 |
| | 1.46 |
| | 1.51 |
|
| | | | | | | | | | | | | | | |
| Normalized interest coverage | 2.06 |
| | 1.74 |
| | | 2.05 |
| | 2.06 |
| | 1.90 |
| | 1.79 |
| | 1.83 |
|
| | | | | | | | | | | | | | | |
| Net debt/normalized annualized estimated full period EBITDA from properties owned at period end | N/A |
| | N/A |
| | | 7.75x |
| | 8.94x |
| | 8.43x |
| | 9.56x |
| | 9.30x |
|
| | | | | | | | | | | | | | | |
| (1) Excludes book value of real estate and notes payable classified as held for sale. | | | |
| (2) Market capitalization is equal to outstanding shares (common stock, OP units, and vested restricted stock units, as if converted) times our estimated stock value of $25.20 per share through October 2014 or $26.88 per share beginning in November 2014, as reported in Quarterly Reports on Form 10-Q filed on November 5, 2013, and November 3, 2014, respectively and reflect the one-for-six reverse stock split that occurred on June 2, 2015. |
| (3) Includes book value of mortgage notes payable, the revolving credit facility and term loan, notes payable classified as held for sale, and TIER REIT’s ownership share of unconsolidated debt. |
| (4) Total debt less cash and cash equivalents. |
| (5) All periods presented have been adjusted to reflect the one-for-six reverse stock split that occurred on June 2, 2015. |
|
| | |
Supplemental Operating and Financial Data | TIER REIT | 2nd Quarter Page 3 |
|
| | | | | | | | | | | | | | | | | | | | | | | |
| Consolidated Balance Sheets |
| (in thousands, except share and per share data) |
| | | | | | | | | | | | | | |
| | | | | | | | | | | | | | |
| | | | | | 30-Jun-15 | | 31-Mar-15 | | 31-Dec-14 | | 30-Sep-14 | | 30-Jun-14 |
| Assets | | | | | | | | | | | |
| | Real estate | | | | | | | | | | |
| | Land | | | $ | 167,231 |
| | $ | 249,030 |
| | $ | 286,430 |
| | $ | 318,058 |
| | $ | 316,897 |
|
| | Land held for development | | 6,377 |
| | — |
| | — |
| | — |
| | — |
|
| | Buildings and improvements, net | | 1,314,765 |
| | 1,360,923 |
| | 1,482,336 |
| | 1,690,511 |
| | 1,644,088 |
|
| | Real estate under development | | — |
| | — |
| | — |
| | — |
| | 68,730 |
|
| | Total real estate | | 1,488,373 |
| | 1,609,953 |
| | 1,768,766 |
| | 2,008,569 |
| | 2,029,715 |
|
| | | | | | | | | | | | | | |
| | Cash and cash equivalents | | 153,158 |
| | 5,764 |
| | 31,442 |
| | 923 |
| | 1,183 |
|
| | Restricted cash | | 29,620 |
| | 32,761 |
| | 35,324 |
| | 49,654 |
| | 47,404 |
|
| | Accounts receivable, net | | 71,877 |
| | 75,466 |
| | 83,380 |
| | 100,601 |
| | 99,272 |
|
| | Prepaid expenses and other assets | | 31,890 |
| | 7,222 |
| | 7,129 |
| | 8,033 |
| | 7,234 |
|
| | Investments in unconsolidated entities | | 44,780 |
| | 39,422 |
| | 39,885 |
| | 41,420 |
| | 41,443 |
|
| | Deferred financing fees, net | | 13,292 |
| | 10,690 |
| | 10,783 |
| | 7,130 |
| | 8,101 |
|
| | Acquired above-market leases, net | | 1,619 |
| | 163 |
| | 2,019 |
| | 4,442 |
| | 5,229 |
|
| | Other lease intangibles, net | | 74,850 |
| | 77,480 |
| | 92,671 |
| | 117,556 |
| | 121,781 |
|
| | Other intangible assets, net | | 10,284 |
| | 2,114 |
| | 2,144 |
| | 2,174 |
| | 2,203 |
|
| | Assets associated with real estate held for sale | | — |
| | 255,130 |
| | 137,640 |
| | — |
| | — |
|
| Total assets | | $ | 1,919,743 |
| | $ | 2,116,165 |
| | $ | 2,211,183 |
| | $ | 2,340,502 |
| | $ | 2,363,565 |
|
| | | | | | | | | | | | | | |
| Liabilities and equity | | | | | | | | | | |
| | | | | | | | | | | | | | |
| Liabilities: | | | | | | | | | | | |
| | Notes payable | | $ | 505,196 |
| | $ | 903,688 |
| | $ | 1,069,323 |
| | $ | 1,445,018 |
| | $ | 1,470,974 |
|
| | Term loan | | | 525,000 |
| | 125,000 |
| | 125,000 |
| | — |
| | — |
|
| | Revolving credit facility | | — |
| | 96,000 |
| | — |
| | 20,000 |
| | — |
|
| | Unamortized mark to market premium (discount) | | 28 |
| | (213 | ) | | (238 | ) | | (1 | ) | | (23 | ) |
| | Total notes payable | | 1,030,224 |
| | 1,124,475 |
| | 1,194,085 |
| | 1,465,017 |
| | 1,470,951 |
|
| | | | | | | | | | | | | | |
| | Accounts payable | | 2,192 |
| | 1,118 |
| | 2,790 |
| | 5,543 |
| | 6,549 |
|
| | Payables to related parties | | 794 |
| | 2,257 |
| | 2,041 |
| | 1,820 |
| | 1,650 |
|
| | Accrued liabilities | | 64,794 |
| | 65,713 |
| | 77,375 |
| | 86,174 |
| | 84,696 |
|
| | Acquired below-market leases, net | | 12,773 |
| | 14,381 |
| | 16,984 |
| | 19,618 |
| | 21,318 |
|
| | Deferred tax liabilities | | 2,507 |
| | 2,551 |
| | 2,880 |
| | 760 |
| | 923 |
|
| | Other liabilities | | 22,474 |
| | 23,246 |
| | 18,525 |
| | 20,792 |
| | 20,686 |
|
| | Distributions payable | | 9,028 |
| | — |
| | — |
| | — |
| | — |
|
| | Obligations associated with real estate held for sale | | — |
| | 104,457 |
| | 108,343 |
| | — |
| | — |
|
| Total liabilities | | 1,144,786 |
| | 1,338,198 |
| | 1,423,023 |
| | 1,599,724 |
| | 1,606,773 |
|
| Commitments and contingencies | | | | | | | | | | |
| Series A Convertible Preferred Stock | | 4,626 |
| | 4,626 |
| | 4,626 |
| | 2,700 |
| | 2,700 |
|
| Equity: | | | | | | | | | | | |
| | Preferred stock | | — |
| | — |
| | — |
| | — |
| | — |
|
| | Convertible stock | | — |
| | — |
| | — |
| | — |
| | — |
|
| | Common stock, $.0001 par value per share, 382,499,000 shares authorized (1) | 5 |
| | 5 |
| | 5 |
| | 5 |
| | 5 |
|
| | Additional paid-in capital (1) | | 2,645,825 |
| | 2,646,147 |
| | 2,645,927 |
| | 2,647,535 |
| | 2,647,215 |
|
| | Cumulative distributions and net loss attributable to common stockholders | (1,878,611 | ) | | (1,868,447 | ) | | (1,862,555 | ) | | (1,910,287 | ) | | (1,893,932 | ) |
| | Accumulated other comprehensive income (loss) | | 799 |
| | (5,336 | ) | | (788 | ) | | — |
| | — |
|
| | Stockholders’ equity | | 768,018 |
| | 772,369 |
| | 782,589 |
| | 737,253 |
| | 753,288 |
|
| | Noncontrolling interests | | 2,313 |
| | 972 |
| | 945 |
| | 825 |
| | 804 |
|
| Total equity | | 770,331 |
| | 773,341 |
| | 783,534 |
| | 738,078 |
| | 754,092 |
|
| Total liabilities and equity | | $ | 1,919,743 |
| | $ | 2,116,165 |
| | $ | 2,211,183 |
| | $ | 2,340,502 |
| | $ | 2,363,565 |
|
| | | | | | | | | | | | |
| Common stock, number of shares issued and outstanding (1) | | 49,871,776 |
| | 49,901,013 |
| | 49,877,350 |
| | 49,877,350 |
| | 49,877,350 |
|
| | | | | | | | | | | | | | |
| (1) All periods have been adjusted to reflect the one-for-six reverse stock split that occurred on June 2, 2015. |
|
| | |
Supplemental Operating and Financial Data | TIER REIT | 2nd Quarter Page 4 |
|
| | | | | | | | | | | | | | | | | | | | | | | | | | | | | |
| | Consolidated Statements of Operations |
| | (in thousands, except share and per share amounts) |
| | | | | | | | |
| | | | | | | | |
| | | Six Months Ended | | | Three Months Ended |
| | | 30-Jun-15 | | 30-Jun-14 | | | 30-Jun-15 | | 31-Mar-15 | | 31-Dec-14 | | 30-Sep-14 | | 30-Jun-14 |
| Revenue | | | | | | | | | | | | | | |
| | Rental income | $ | 135,557 |
| | $ | 135,653 |
| | | $ | 63,953 |
| | $ | 71,604 |
| | $ | 69,973 |
| | $ | 69,857 |
| | $ | 68,308 |
|
| | Straight-line rent revenue adjustment | 6,630 |
| | 2,940 |
| | | 4,339 |
| | 2,291 |
| | 2,618 |
| | 772 |
| | 1,312 |
|
| | Lease incentives | 478 |
| | 189 |
| | | 286 |
| | 192 |
| | 528 |
| | 77 |
| | 151 |
|
| | Above- and below-market rent amortization | 2,522 |
| | 1,816 |
| | | 1,335 |
| | 1,187 |
| | 955 |
| | 532 |
| | 887 |
|
| | Lease termination fees | 670 |
| | 696 |
| | | 125 |
| | 545 |
| | 542 |
| | 919 |
| | 576 |
|
| | Total revenue | 145,857 |
| | 141,294 |
| | | 70,038 |
| | 75,819 |
| | 74,616 |
| | 72,157 |
| | 71,234 |
|
| Expenses | | | | | | | | | | | | | | |
| | Property related expenses | 46,056 |
| | 48,634 |
| | | 20,877 |
| | 25,179 |
| | 24,358 |
| | 22,464 |
| | 23,283 |
|
| | Real estate taxes | 21,842 |
| | 20,256 |
| | | 10,198 |
| | 11,644 |
| | 9,944 |
| | 11,272 |
| | 10,276 |
|
| | Property management fees | 4,437 |
| | 4,251 |
| | | 2,105 |
| | 2,332 |
| | 2,198 |
| | 2,229 |
| | 2,128 |
|
| | Total property operating expenses | 72,335 |
| | 73,141 |
| | | 33,180 |
| | 39,155 |
| | 36,500 |
| | 35,965 |
| | 35,687 |
|
| | Interest expense | 30,232 |
| | 32,240 |
| | | 14,591 |
| | 15,641 |
| | 16,390 |
| | 16,033 |
| | 16,133 |
|
| | Amortization of deferred financing costs | 1,807 |
| | 1,136 |
| | | 899 |
| | 908 |
| | 782 |
| | 654 |
| | 666 |
|
| | Amortization of mark to market | (57 | ) | | 38 |
| | | (30 | ) | | (27 | ) | | 82 |
| | 19 |
| | 19 |
|
| | Total interest expense | 31,982 |
| | 33,414 |
| | | 15,460 |
| | 16,522 |
| | 17,254 |
| | 16,706 |
| | 16,818 |
|
| | General and administrative | 10,793 |
| | 8,646 |
| | | 5,412 |
| | 5,381 |
| | 4,695 |
| | 4,147 |
| | 4,300 |
|
| | BHT Advisors termination fee and HPT Management buyout fee | 10,200 |
| | — |
| | | 10,200 |
| | — |
| | — |
| | — |
| | — |
|
| | Listing costs | 2,991 |
| | — |
| | | 2,488 |
| | 503 |
| | 104 |
| | — |
| | — |
|
| | Amortization of restricted shares and units | 1,099 |
| | 665 |
| | | 564 |
| | 535 |
| | 363 |
| | 369 |
| | 311 |
|
| | Straight-line rent expense adjustment | (14 | ) | | (10 | ) | | | (7 | ) | | (7 | ) | | (6 | ) | | (5 | ) | | (5 | ) |
| | Acquisition expense | 815 |
| | — |
| | | 813 |
| | 2 |
| | 86 |
| | 4 |
| | — |
|
| | Asset impairment losses | 132 |
| | 8,225 |
| | | — |
| | 132 |
| | 4,940 |
| | — |
| | — |
|
| | Real estate depreciation and amortization | 61,103 |
| | 58,103 |
| | | 31,081 |
| | 30,022 |
| | 31,682 |
| | 29,885 |
| | 29,182 |
|
| | Total expenses | 191,436 |
| | 182,184 |
| | | 99,191 |
| | 92,245 |
| | 95,618 |
| | 87,071 |
| | 86,293 |
|
| | Interest and other income | 286 |
| | 344 |
| | | 141 |
| | 145 |
| | 81 |
| | 88 |
| | 96 |
|
| | Loss on early extinguishment of debt | (21,448 | ) | | — |
| | | (21,412 | ) | | (36 | ) | | (426 | ) | | — |
| | — |
|
| Loss from continuing operations before income taxes, equity | | | | | | | | | | | | | | |
| | in operations of investments, and gain on sale of assets | (66,741 | ) | | (40,546 | ) | | | (50,424 | ) | | (16,317 | ) | | (21,347 | ) | | (14,826 | ) | | (14,963 | ) |
| | Benefit (provision) for income taxes | (1,262 | ) | | (9 | ) | | | (1,338 | ) | | 76 |
| | 73 |
| | (36 | ) | | 59 |
|
| | Equity in operations of investments | 312 |
| | 883 |
| | | 69 |
| | 243 |
| | 522 |
| | 431 |
| | 795 |
|
| Loss from continuing operations before gain on sale of assets | (67,691 | ) | | (39,672 | ) | | | (51,693 | ) | | (15,998 | ) | | (20,752 | ) | | (14,431 | ) | | (14,109 | ) |
| Discontinued operations: | | | | | | | | | | | | | | |
| | Income (loss) from discontinued operations | 1,369 |
| | (7,285 | ) | | | (121 | ) | | 1,490 |
| | (17,634 | ) | | (5,975 | ) | | (3,191 | ) |
| | Gain on sale of discontinued operations | 14,683 |
| | — |
| | | 6,077 |
| | 8,606 |
| | 86,195 |
| | 4,026 |
| | — |
|
| Income (loss) from discontinued operations | 16,052 |
| | (7,285 | ) | | | 5,956 |
| | 10,096 |
| | 68,561 |
| | (1,949 | ) | | (3,191 | ) |
| Gain on sale of assets | 44,564 |
| | — |
| | | 44,564 |
| | — |
| | — |
| | — |
| | — |
|
| Net income (loss) | (7,075 | ) | | (46,957 | ) | | | (1,173 | ) | | (5,902 | ) | | 47,809 |
| | (16,380 | ) | | (17,300 | ) |
| | Noncontrolling interests - continuing operations | 60 |
| | 57 |
| | | 33 |
| | 27 |
| | 41 |
| | 34 |
| | 20 |
|
| | Noncontrolling interests - discontinued operations | (28 | ) | | 7 |
| | | (11 | ) | | (17 | ) | | (118 | ) | | (9 | ) | | 1 |
|
| | Accretion of Series A Convertible Preferred Stock | — |
| | — |
| | | — |
| | — |
| | (1,926 | ) | | — |
| | — |
|
| Net income (loss) attributable to common stockholders | $ | (7,043 | ) | | $ | (46,893 | ) | | | $ | (1,151 | ) | | $ | (5,892 | ) | | $ | 45,806 |
| | $ | (16,355 | ) | | $ | (17,279 | ) |
| | | | | | | | | | | | | | | |
| Basic and diluted weighted average common shares outstanding (1) | 49,892,390 |
| | 49,874,423 |
| | | 49,893,330 |
| | 49,891,436 |
| | 49,877,350 |
| | 49,877,350 |
| | 49,877,350 |
|
| Basic and diluted earnings (loss) per common share: | | | | | | | | | | | | | | |
| | Continuing operations (1) | $ | (0.46 | ) | | $ | (0.79 | ) | | | $ | (0.14 | ) | | $ | (0.32 | ) | | $ | (0.45 | ) | | $ | (0.29 | ) | | $ | (0.28 | ) |
| | Discontinued operations (1) | 0.32 |
| | (0.15 | ) | | | 0.12 |
| | 0.20 |
| | 1.37 |
| | (0.04 | ) | | (0.07 | ) |
| Basic and diluted earnings (loss) per common share (1) | $ | (0.14 | ) | | $ | (0.94 | ) | | | $ | (0.02 | ) | | $ | (0.12 | ) | | $ | 0.92 |
| | $ | (0.33 | ) | | $ | (0.35 | ) |
| Net income (loss) attributable to common stockholders: | | | | | | |
| | Continuing operations | $ | (23,067 | ) | | $ | (39,615 | ) | | | $ | (7,096 | ) | | $ | (15,971 | ) | | $ | (22,637 | ) | | $ | (14,397 | ) | | $ | (14,089 | ) |
| | Discontinued operations | 16,024 |
| | (7,278 | ) | | | 5,945 |
| | 10,079 |
| | 68,443 |
| | (1,958 | ) | | (3,190 | ) |
| Net income (loss) attributable to common stockholders | $ | (7,043 | ) | | $ | (46,893 | ) | | | $ | (1,151 | ) | | $ | (5,892 | ) | | $ | 45,806 |
| | $ | (16,355 | ) | | $ | (17,279 | ) |
| | | | | | | | | | | | | | | | |
| | | | | | | | | | | | | | | | |
| (1) All periods presented have been adjusted to reflect the one-for-six reverse stock split that occurred on June 2, 2015. |
|
| | |
Supplemental Operating and Financial Data | TIER REIT | 2nd Quarter Page 5 |
|
| | | | | | | | | | | | | | | | | | | | | | | | | | | | | |
| Consolidated Statements of Discontinued Operations |
| (in thousands) |
| | | | | | | | | | | | | | | | |
| | | | | | | | | | | | | | | | |
| | | Six Months Ended | | | Three Months Ended |
| | | 30-Jun-15 | | 30-Jun-14 | | | 30-Jun-15 | | 31-Mar-15 | | 31-Dec-14 | | 30-Sep-14 | | 30-Jun-14 |
| | | | | | | | | | | | | | | | |
| Revenue | | | | | | | | | | | | | | |
| | Rental income | $ | 4,111 |
| | $ | 26,936 |
| | | $ | (92 | ) | | $ | 4,203 |
| | $ | 11,358 |
| | $ | 12,946 |
| | $ | 13,451 |
|
| | Straight-line rent revenue adjustment | 455 |
| | (11 | ) | | | (32 | ) | | 487 |
| | 454 |
| | (406 | ) | | 55 |
|
| | Lease incentives | — |
| | (207 | ) | | | — |
| | — |
| | (102 | ) | | (109 | ) | | (102 | ) |
| | Above- and below-market rent amortization | — |
| | 447 |
| | | — |
| | — |
| | 188 |
| | 195 |
| | 222 |
|
| | Lease termination fees | — |
| | 239 |
| | | — |
| | — |
| | 149 |
| | 116 |
| | 164 |
|
| | Total revenue | 4,566 |
| | 27,404 |
| | | (124 | ) | | 4,690 |
| | 12,047 |
| | 12,742 |
| | 13,790 |
|
| | | | | | | | | | | | | | | | |
| Expenses | | | | | | | | | | | | | | |
| | Property related expenses | 1,723 |
| | 8,359 |
| | | 22 |
| | 1,701 |
| | 3,909 |
| | 4,295 |
| | 3,833 |
|
| | Real estate taxes | 633 |
| | 4,869 |
| | | (83 | ) | | 716 |
| | 2,334 |
| | 2,171 |
| | 2,293 |
|
| | Property management fees | 121 |
| | 816 |
| | | 14 |
| | 107 |
| | 309 |
| | 374 |
| | 398 |
|
| | Total property operating expenses | 2,477 |
| | 14,044 |
| | | (47 | ) | | 2,524 |
| | 6,552 |
| | 6,840 |
| | 6,524 |
|
| | | | | | | | | | | | | | | | |
| | Interest expense | 707 |
| | 8,814 |
| | | 44 |
| | 663 |
| | 3,362 |
| | 4,455 |
| | 4,423 |
|
| | Amortization of deferred financing costs | 14 |
| | 187 |
| | | — |
| | 14 |
| | 75 |
| | 113 |
| | 93 |
|
| | Amortization of mark to market | (1 | ) | | 1 |
| | | — |
| | (1 | ) | | — |
| | 1 |
| | 1 |
|
| | Total interest expense | 720 |
| | 9,002 |
| | | 44 |
| | 676 |
| | 3,437 |
| | 4,569 |
| | 4,517 |
|
| | | | | | | | | | | | | | | | |
| | Real estate depreciation and amortization | — |
| | 11,639 |
| | | — |
| | — |
| | 5,499 |
| | 6,360 |
| | 5,938 |
|
| Total expenses | 3,197 |
| | 34,685 |
| | | (3 | ) | | 3,200 |
| | 15,488 |
| | 17,769 |
| | 16,979 |
|
| | | | | | | | | | | | | | | | |
| | Interest and other income (expense) | — |
| | (4 | ) | | | — |
| | — |
| | (3 | ) | | (2 | ) | | (2 | ) |
| | Loss on early extinguishment of debt | — |
| | — |
| | | — |
| | — |
| | (14,190 | ) | | (946 | ) | | — |
|
| Income (loss) before gain on sale | | | | | | | | | | | | | | |
| | of discontinued operations | 1,369 |
| | (7,285 | ) | | | (121 | ) | | 1,490 |
| | (17,634 | ) | | (5,975 | ) | | (3,191 | ) |
| | Gain on sale of discontinued operations | 14,683 |
| | — |
| | | 6,077 |
| | 8,606 |
| | 86,195 |
| | 4,026 |
| | — |
|
| Income (loss) from discontinued operations | $ | 16,052 |
| | $ | (7,285 | ) | | | $ | 5,956 |
| | $ | 10,096 |
| | $ | 68,561 |
| | $ | (1,949 | ) | | $ | (3,191 | ) |
|
| | |
Supplemental Operating and Financial Data | TIER REIT | 2nd Quarter Page 6 |
|
| | | | | | | | | | | | | | | | | | | | | | | | | | | | | |
| Calculation of FFO and FAD |
| (in thousands, except per share data) |
| | | | | | | | |
| | | | | | | | |
| | | Six Months Ended | | | Three Months Ended |
| Funds from operations (FFO) | 30-Jun-15 | | 30-Jun-14 | | | 30-Jun-15 | | 31-Mar-15 | | 31-Dec-14 | | 30-Sep-14 | | 30-Jun-14 |
| | | | | | | | | | | | | | | | |
| Net income (loss) | $ | (7,075 | ) | | $ | (46,957 | ) | | | $ | (1,173 | ) | | $ | (5,902 | ) | | $ | 47,809 |
| | $ | (16,380 | ) | | $ | (17,300 | ) |
| Net (income) loss attributable to noncontrolling interests | 32 |
| | 64 |
| | | 22 |
| | 10 |
| | (77 | ) | | 25 |
| | 21 |
|
| Accretion of Series A Convertible Preferred Stock | — |
| | — |
| | | — |
| | — |
| | (1,926 | ) | | — |
| | — |
|
| Adjustments (1): | | | | | | | | | | | | | | |
| | Real estate depreciation and amortization - consolidated | 61,103 |
| | 69,742 |
| | | 31,081 |
| | 30,022 |
| | 37,181 |
| | 36,245 |
| | 35,120 |
|
| | Real estate depreciation and amortization - unconsolidated joint ventures | 2,654 |
| | 2,579 |
| | | 1,367 |
| | 1,287 |
| | 1,307 |
| | 1,275 |
| | 1,278 |
|
| | Impairment of depreciable real estate assets | 132 |
| | 8,225 |
| | | — |
| | 132 |
| | 4,940 |
| | — |
| | — |
|
| | Gain on sale of depreciable real estate | (59,247 | ) | | — |
| | | (50,641 | ) | | (8,606 | ) | | (86,195 | ) | | (4,026 | ) | | — |
|
| | Taxes associated with sale of depreciable assets | 1,264 |
| | — |
| | | 1,264 |
| | — |
| | — |
| | — |
| | — |
|
| | Noncontrolling interests (OP units & vested restricted stock units) share of above adjustments | (10 | ) | | (117 | ) | | | 29 |
| | (39 | ) | | 68 |
| | (68 | ) | | (53 | ) |
| FFO attributable to common stockholders | $ | (1,147 | ) | | $ | 33,536 |
| | | $ | (18,051 | ) | | $ | 16,904 |
| | $ | 3,107 |
| | $ | 17,071 |
| | $ | 19,066 |
|
| | | | | | | | | | | | | | | |
| FFO, excluding certain items | | | | | | | | | | | | | | |
| FFO attributable to common stockholders | $ | (1,147 | ) | | $ | 33,536 |
| | | $ | (18,051 | ) | | $ | 16,904 |
| | $ | 3,107 |
| | $ | 17,071 |
| | $ | 19,066 |
|
| Adjustments (1): | | | | | | | | | | | | | | |
| | Acquisition expenses | 1,195 |
| | — |
| | | 1,193 |
| | 2 |
| | 86 |
| | 4 |
| | — |
|
| | Listing costs | 2,991 |
| | — |
| | | 2,488 |
| | 503 |
| | 104 |
| | — |
| | — |
|
| | Loss on early extinguishment of debt | 21,448 |
| | — |
| | | 21,412 |
| | 36 |
| | 14,616 |
| | 946 |
| | — |
|
| | BHT Advisors termination fee and HPT Management buyout fee | 10,200 |
| | — |
| | | 10,200 |
| | — |
| | — |
| | — |
| | — |
|
| | Noncontrolling interests (OP units & vested restricted stock units) share of above adjustments | (62 | ) | | — |
| | | (61 | ) | | (1 | ) | | (24 | ) | | (1 | ) | | — |
|
| FFO attributable to common stock holders, excluding certain items | $ | 34,625 |
| | $ | 33,536 |
| | | $ | 17,181 |
| | $ | 17,444 |
| | $ | 17,889 |
| | $ | 18,020 |
| | $ | 19,066 |
|
| | | | | | | | | | | | | | | |
| Funds available for distribution (FAD) | | | | | | | | | | | | | | |
| FFO attributable to common stock holders | $ | (1,147 | ) | | $ | 33,536 |
| | | $ | (18,051 | ) | | $ | 16,904 |
| | $ | 3,107 |
| | $ | 17,071 |
| | $ | 19,066 |
|
| Adjustments (1): | | | | | | | | | | | | | | |
| | Recurring capital expenditures | (27,314 | ) | | (33,827 | ) | | | (14,067 | ) | | (13,247 | ) | | (19,468 | ) | | (16,056 | ) | | (15,864 | ) |
| | Straight-line rent adjustments | (7,219 | ) | | (3,411 | ) | | | (4,369 | ) | | (2,850 | ) | | (3,141 | ) | | (411 | ) | | (1,646 | ) |
| | Above- and below-market rent amortization | (2,722 | ) | | (2,460 | ) | | | (1,433 | ) | | (1,289 | ) | | (1,244 | ) | | (827 | ) | | (1,210 | ) |
| | Amortization of deferred financing fees and mark to market | 1,834 |
| | 1,451 |
| | | 898 |
| | 936 |
| | 982 |
| | 831 |
| | 823 |
|
| | Amortization of restricted shares and units | 1,099 |
| | 665 |
| | | 564 |
| | 535 |
| | 363 |
| | 369 |
| | 311 |
|
| | Acquisition expenses | 1,195 |
| | — |
| | | 1,193 |
| | 2 |
| | 86 |
| | 4 |
| | — |
|
| | Listing costs | 2,991 |
| | — |
| | | 2,488 |
| | 503 |
| | 104 |
| | — |
| | — |
|
| | Loss on early extinguishment of debt | 21,448 |
| | — |
| | | 21,412 |
| | 36 |
| | 14,616 |
| | 946 |
| | — |
|
| | BHT Advisors termination fee and HPT Management buyout fee | 10,200 |
| | — |
| | | 10,200 |
| | — |
| | — |
| | — |
| | — |
|
| | Noncontrolling interests (OP units & vested restricted stock units) share of above adjustments | 15 |
| | 54 |
| | | (11 | ) | | 26 |
| | 13 |
| | 31 |
| | 25 |
|
| | Accretion of Series A Convertible Preferred Stock | — |
| | — |
| | | — |
| | — |
| | 1,926 |
| | — |
| | — |
|
| FAD attributable to common stockholders | $ | 380 |
| | $ | (3,992 | ) | | | $ | (1,176 | ) | | $ | 1,556 |
| | $ | (2,656 | ) | | $ | 1,958 |
| | $ | 1,505 |
|
| | | | | | | | | | | | | | | |
| Weighted average common shares outstanding - basic (2) | 49,892 |
| | 49,874 |
| | | 49,893 |
| | 49,891 |
| | 49,877 |
| | 49,877 |
| | 49,877 |
|
| Weighted average common shares outstanding - diluted (2) | 50,076 |
| | 50,001 |
| | | 50,085 |
| | 50,066 |
| | 49,996 |
| | 49,996 |
| | 49,937 |
|
| | | | | | | | | | | | | | | |
| Diluted FFO per common share (2) (3) | $ | (0.02 | ) | | $ | 0.67 |
| | | $ | (0.36 | ) | | $ | 0.34 |
| | $ | 0.06 |
| | $ | 0.34 |
| | $ | 0.38 |
|
| Diluted FFO, excluding certain items per common share (2) (3) | $ | 0.69 |
| | $ | 0.67 |
| | | $ | 0.34 |
| | $ | 0.35 |
| | $ | 0.36 |
| | $ | 0.36 |
| | $ | 0.38 |
|
| Diluted FAD per common share (2) (3) | $ | 0.01 |
| | $ | (0.08 | ) | | | $ | (0.02 | ) | | $ | 0.03 |
| | $ | (0.05 | ) | | $ | 0.04 |
| | $ | 0.03 |
|
| | | | | | | | | | | | | | | | |
|
| | | | | | | | | | | | | |
| (1) Adjustments represent our pro rata share of consolidated and unconsolidated amounts, including discontinued operations. |
| (2) All periods presented have been adjusted to reflect the one-for-six reverse stock split that occurred on June 2, 2015. |
| (3) There are no dilutive securities for purposes of calculating diluted FFO per common share and diluted FAD per common share when FFO attributable to common stockholders or FAD attributable to common stockholders are negative. |
|
| | |
Supplemental Operating and Financial Data | TIER REIT | 2nd Quarter Page 7 |
|
| | | | | | | | | | | | | | | | | | | | |
| Calculation of EBITDA |
| (in thousands, except fixed charge coverage) |
| | | |
| | | Three Months Ended |
| | | 30-Jun-15 | | 31-Mar-15 | | 31-Dec-14 | | 30-Sep-14 | | 30-Jun-14 |
| | | | | | | | | | | |
| Net income (loss) attributable to common stockholders | $ | (1,151 | ) | | $ | (5,892 | ) | | $ | 45,806 |
| | $ | (16,355 | ) | | $ | (17,279 | ) |
| | | | | | | | | | | |
| Adjustments: | | | | | | | | | |
| | | | | | | | | | | |
| | Noncontrolling interests (OP units & vested restricted stock units) | (1 | ) | | (10 | ) | | 77 |
| | (36 | ) | | (25 | ) |
| | Accretion of Series A Convertible Preferred Stock | — |
| | — |
| | 1,926 |
| | — |
| | — |
|
| | | | | | | | | | | |
| | Interest expense - consolidated (including discontinued operations) | 14,635 |
| | 16,304 |
| | 19,752 |
| | 20,488 |
| | 20,933 |
|
| | Interest expense - unconsolidated joint ventures | 617 |
| | 615 |
| | 631 |
| | 635 |
| | 633 |
|
| | Amortization of deferred financing costs - consolidated (including discontinued operations) | 899 |
| | 922 |
| | 857 |
| | 767 |
| | 382 |
|
| | Amortization of deferred financing costs - unconsolidated joint ventures | 13 |
| | 13 |
| | 13 |
| | 13 |
| | 12 |
|
| | Mark to market - consolidated (including discontinued operations) | (30 | ) | | (28 | ) | | 82 |
| | 20 |
| | 20 |
|
| | Mark to market - unconsolidated joint ventures | 16 |
| | 17 |
| | 18 |
| | 19 |
| | 20 |
|
| | Total interest expense | 16,150 |
| | 17,843 |
| | 21,353 |
| | 21,942 |
| | 22,000 |
|
| | | | | | | | | | | |
| | Tax (benefit) provision - consolidated (including discontinued operations) | 1,338 |
| | (76 | ) | | (73 | ) | | 36 |
| | (59 | ) |
| | Tax (benefit) provision - unconsolidated joint ventures | 1 |
| | 2 |
| | 3 |
| | (1 | ) | | 1 |
|
| | | | | | | | | | | |
| | Depreciation and amortization - consolidated (including discontinued operations) | 31,081 |
| | 30,022 |
| | 37,181 |
| | 36,245 |
| | 35,120 |
|
| | Depreciation and amortization - unconsolidated joint ventures | 1,367 |
| | 1,287 |
| | 1,307 |
| | 1,275 |
| | 1,278 |
|
| | | | | | | | | | | |
| | Impairment losses | — |
| | 132 |
| | 4,940 |
| | — |
| | — |
|
| | Gain on sale of real estate | (50,641 | ) | | (8,606 | ) | | (86,195 | ) | | (4,026 | ) | | — |
|
| | Loss on early extinguishment of debt | 21,412 |
| | 36 |
| | 14,616 |
| | 946 |
| | — |
|
| EBITDA | 19,556 |
| | 34,738 |
| | 40,941 |
| | 40,026 |
| | 41,036 |
|
| | | | | | | | | | | |
| Adjustments: | | | | | | | | | |
| | Costs incurred in connection with listing activities | 2,488 |
| | 503 |
| | 104 |
| | — |
| | — |
|
| | Acquisition expenses | 1,193 |
| | 2 |
| | 86 |
| | 4 |
| | — |
|
| | Non-cash write-off of tenant receivables | 2 |
| | 1,829 |
| | 163 |
| | 64 |
| | 54 |
|
| | BHT Advisors termination fee and HPT Management buyout fee | 10,200 |
| | — |
| | — |
| | — |
| | — |
|
| Normalized EBITDA | 33,439 |
| | 37,072 |
| | 41,294 |
| | 40,094 |
| | 41,090 |
|
| | | | | | | | | | | |
| Adjustments: | | | | | | | | | |
| | EBITDA from properties disposed before period end | (2,933 | ) | | (1,488 | ) | | (2,974 | ) | | (336 | ) | | (16 | ) |
| | Full quarter adjustment for acquired properties | — |
| | — |
| | 723 |
| | — |
| | — |
|
| Normalized estimated full period EBITDA from properties owned at period end | $ | 30,506 |
| | $ | 35,584 |
| | $ | 39,043 |
| | $ | 39,758 |
| | $ | 41,074 |
|
| | | | | | | | | | | |
| Fixed charges | | | | | | | | | |
| | Interest expense | $ | 16,150 |
| | $ | 17,843 |
| | $ | 21,353 |
| | $ | 21,942 |
| | $ | 22,000 |
|
| | Capitalized interest incurred (1) | 132 |
| | 176 |
| | 338 |
| | 428 |
| | 427 |
|
| | Interest expense | 16,282 |
| | 18,019 |
| | 21,691 |
| | 22,370 |
| | 22,427 |
|
| | Principal payments (excludes debt payoff) | 2,498 |
| | 3,059 |
| | 5,038 |
| | 5,026 |
| | 4,867 |
|
| Fixed charges | $ | 18,780 |
| | $ | 21,078 |
| | $ | 26,729 |
| | $ | 27,396 |
| | $ | 27,294 |
|
| | | | | | | | | | | |
| Normalized Interest coverage | 2.05 |
| | 2.06 |
| | 1.9 |
| | 1.79 |
| | 1.83 |
|
| Normalized Fixed charge coverage | 1.78 |
| | 1.76 |
| | 1.54 |
| | 1.46 |
| | 1.51 |
|
______________________
(1) Excludes capitalized interest funded from Two BriarLake Plaza construction loan.
|
| | |
Supplemental Operating and Financial Data | TIER REIT | 2nd Quarter Page 8 |
|
| | | | | | | | | | | | | | | | | | | | | | | | | | | | | | | | |
| Joint Venture Financial Summary |
| As of and for the Quarter Ended June 30, 2015 |
| (dollars in thousands) |
| | | | | | | | | |
| | | Unconsolidated Joint Ventures at | | Consolidated Joint Ventures at |
| | | TIER REIT Ownership Share | | TIER REIT Ownership Share |
| | | Paces West | | Wanamaker Building | | 1325 G Street | | Colorado Building | | | | Legacy Land | | 208 Nueces Street | | |
| Ownership % during the period | 10.00% | | 60.00% | | 10.00% | | 10.00% | | | | 95% | | 95% | | |
| Ownership % at period end | 10.00% | | 60.00% | | 10.00% | | 10.00% | | Total | | 95% | | 95% | | Total |
| Results of Operations | | | | | | | | | | | | | | | |
| Rental income | $ | 296 |
| | $ | 3,821 |
| | $ | 2 |
| | $ | 1 |
| | $ | 4,120 |
| | — |
| | — |
| | — |
|
| Straight-line rent revenue adjustment | 21 |
| | 34 |
| | — |
| | — |
| | 55 |
| | — |
| | — |
| | — |
|
| Above- and below-market rent amortization | (3 | ) | | 101 |
| | — |
| | — |
| | 98 |
| | — |
| | — |
| | — |
|
| Lease termination fees | — |
| | — |
| | 36 |
| | — |
| | 36 |
| | — |
| | — |
| | — |
|
| Other income | 1 |
| | 41 |
| | — |
| | — |
| | 42 |
| | — |
| | — |
| | — |
|
| | Total revenue | 315 |
| | 3,997 |
| | 38 |
| | 1 |
| | 4,351 |
| | — |
| | — |
| | — |
|
| | | | | | | | | | | | | | | | | |
| Property related expenses | 100 |
| | 1,351 |
| | 1 |
| | 1 |
| | 1,453 |
| | — |
| | 13 |
| | 13 |
|
| Real estate taxes | 25 |
| | 377 |
| | — |
| | — |
| | 402 |
| | 1 |
| | 5 |
| | 6 |
|
| Property management fees | 9 |
| | 114 |
| | — |
| | — |
| | 123 |
| | — |
| | 5 |
| | 5 |
|
| | NOI | 181 |
| | 2,155 |
| | 37 |
| | — |
| | 2,373 |
| | (1 | ) | | (23 | ) | | (24 | ) |
| | | | | | | | | — |
| | | | | | | | |
| Interest expense | 89 |
| | 527 |
| | 1 |
| | — |
| | 617 |
| | — |
| | — |
| | — |
|
| Amortization of deferred financing costs | 3 |
| | 21 |
| | — |
| | — |
| | 24 |
| | — |
| | — |
| | — |
|
| Amortization of mark to market | — |
| | 16 |
| | — |
| | — |
| | 16 |
| | — |
| | — |
| | — |
|
| Real estate depreciation and amortization | 168 |
| | 1,199 |
| | — |
| | — |
| | 1,367 |
| | — |
| | — |
| | — |
|
| Interest income and other expense | — |
| | 7 |
| | — |
| | — |
| | 7 |
| | — |
| | — |
| | — |
|
| Acquisition expenses | — |
| | — |
| | 297 |
| | 102 |
| | 399 |
| | — |
| | 361 |
| | 361 |
|
| Provision for income taxes | — |
| | 1 |
| | — |
| | — |
| | 1 |
| | — |
| | — |
| | — |
|
| | Net income (loss) | (79 | ) | | 384 |
| | (261 | ) | | (102 | ) | | (58 | ) | | (1 | ) | | (384 | ) | | (385 | ) |
| | | | | | | — |
| | — |
| | | | | | | | |
| Intercompany eliminations | | | | | | | | | | | | | | | |
| Eliminate amortization of deferred financing costs | — |
| | 11 |
| | — |
| | — |
| | 11 |
| | — |
| | — |
| | — |
|
| Eliminate property management fees | 1 |
| | 114 |
| | — |
| | — |
| | 115 |
| | — |
| | — |
| | — |
|
| | Adjusted net income (loss) | (78 | ) | | 509 |
| | (261 | ) | | (102 | ) | | 68 |
| | (1 | ) | | (384 | ) | | (385 | ) |
| Adjustments: | | | | | — |
| | — |
| | | | | | | | |
| | Real estate depreciation and amortization | 168 |
| | 1,199 |
| | — |
| | — |
| | 1,367 |
| | — |
| | — |
| | — |
|
| Funds from operations | 90 |
| | 1,708 |
| | (261 | ) | | (102 | ) | | 1,435 |
| | (1 | ) | | (384 | ) | | (385 | ) |
| | | | | | | | | | | | | | | | |
| Balance Sheet Information | | | | | | | | | | | | | | | |
| Real estate book value | $ | 6,641 |
| | $ | 100,914 |
| | $ | 15,004 |
| | $ | 4,763 |
| | $ | 127,322 |
| | 6,058 |
| | 8,232 |
| | 14,290 |
|
| Accumulated depreciation | (670 | ) | | (22,637 | ) | | — |
| | — |
| | (23,307 | ) | | — |
| | — |
| | — |
|
| Real estate book value after depreciation | $ | 5,971 |
| | $ | 78,277 |
| | $ | 15,004 |
| | $ | 4,763 |
| | $ | 104,015 |
| | $ | 6,058 |
| | $ | 8,232 |
| | $ | 14,290 |
|
| | | | | | | | | | | | | | | | |
| Cash and cash equivalents | $ | 48 |
| | $ | 2,290 |
| | $ | 463 |
| | $ | 567 |
| | $ | 3,368 |
| | $ | 178 |
| | $ | 1,078 |
| | $ | 1,256 |
|
| Assets | $ | 8,085 |
| | $ | 99,284 |
| | $ | 15,599 |
| | $ | 5,373 |
| | $ | 128,341 |
| | $ | 6,237 |
| | $ | 10,289 |
| | $ | 16,526 |
|
| Debt (1) | $ | 6,500 |
| | $ | 51,763 |
| | $ | 9,500 |
| | $ | 3,400 |
| | $ | 71,163 |
| | $ | — |
| | $ | — |
| | $ | — |
|
| Equity (2) | $ | 1,161 |
| | $ | 37,978 |
| | $ | 4,612 |
| | $ | 1,029 |
| | $ | 44,780 |
| | $ | 6,174 |
| | $ | 10,065 |
| | $ | 16,239 |
|
| ______________________________ | | | | | | |
| (1) | All joint venture debt is non-recourse. Debt is shown net of mark to market adjustments. | | | | | | |
| (2) | Equity for 1325 G Street and Colorado Building have been reduced by $1.2 million and $0.6 million of deferred gain, respectively. |
|
| | |
Supplemental Operating and Financial Data | TIER REIT | 2nd Quarter Page 9 |
|
| | | | | | | | | | | | | | | | | | | | | | | | | | | |
| Same Store Analysis |
| (in thousands, except property count) |
| | | | | | | | | | |
| | | Three Months Ended | | Six Months Ended | |
| Same Store GAAP NOI: | 30-Jun-15 | | 30-Jun-14 | | Favorable/ (Unfavorable) | | 30-Jun-15 | | 30-Jun-14 | | Favorable/ (Unfavorable) | |
| Revenues: | | | | | | | | | | | | |
| Total revenue | $ | 60,706 |
| | $ | 59,102 |
| | $ | 1,604 |
| | $ | 120,968 |
| | $ | 117,189 |
| | $ | 3,779 |
| |
| Less: Lease termination fees | 125 |
| | 576 |
| | (451 | ) | | 670 |
| | 696 |
| | (26 | ) | |
| | | 60,581 |
| | 58,526 |
| | 2,055 |
| 3.5 | % | 120,298 |
| | 116,493 |
| | 3,805 |
| 3.3 | % |
| Expenses: | | | | | | | | | | | | |
| Property operating expenses (less tenant improvement demolition costs) | 18,063 |
| | 18,731 |
| | 668 |
| 3.6 | % | 37,503 |
| | 37,608 |
| | 105 |
| 0.3 | % |
| Real estate taxes | 9,164 |
| | 8,634 |
| | (530 | ) | -6.1 | % | 18,382 |
| | 17,351 |
| | (1,031 | ) | -5.9 | % |
| Property management fees | 1,891 |
| | 1,788 |
| | (103 | ) | -5.8 | % | 3,825 |
| | 3,578 |
| | (247 | ) | -6.9 | % |
| Property expenses | 29,118 |
| | 29,153 |
| | 35 |
| 0.1 | % | 59,710 |
| | 58,537 |
| | (1,173 | ) | -2.0 | % |
| Same Store GAAP NOI | $ | 31,463 |
| | $ | 29,373 |
| | $ | 2,090 |
| 7.1 | % | $ | 60,588 |
| | $ | 57,956 |
| | $ | 2,632 |
| 4.5 | % |
| Same Store Cash NOI: | | | | | | | | | | | | |
| Less: | | | | | | | | | | | | |
| Straight-line rent adjustments | 2,673 |
| | 875 |
| | 1,798 |
| | 2,969 |
| | 2,067 |
| | 902 |
| |
| Above- and below-market rent amortization | 1,192 |
| | 926 |
| | 266 |
| | 2,275 |
| | 1,895 |
| | 380 |
| |
| Same Store Cash NOI | $ | 27,598 |
| | $ | 27,572 |
| | $ | 26 |
| 0.1 | % | $ | 55,344 |
| | $ | 53,994 |
| | $ | 1,350 |
| 2.5 | % |
| | | | | | | | | | | | | | |
| Occupancy % at period end (% owned) | 88.7 | % | | 85.8 | % | | | | 88.7 | % | | 85.8 | % | | | |
| | | | | | | | | | | | | | |
| Consolidated operating properties | 26 |
| | | | | | 26 |
| | | | | |
| Rentable square feet (% owned) | 9,278 |
| | | | | | 9,278 |
| | | | | |
| | | | | | | | | | | | | | |
| Same Store GAAP NOI and Same Store Cash NOI reconciliation: | | | | | | | | | | | | |
| Net loss | $ | (1,173 | ) | | $ | (17,300 | ) | | | | $ | (7,075 | ) | | $ | (46,957 | ) | | | |
| Adjustments: | | | | | | | | | | | | |
| Interest expense | 15,460 |
| | 16,818 |
| | | | 31,982 |
| | 33,414 |
| | | |
| Asset impairment losses | — |
| | — |
| | | | 132 |
| | 8,225 |
| | | |
| Tenant improvement demolition costs | — |
| | 245 |
| | | | 52 |
| | 989 |
| | | |
| General and administrative | 15,612 |
| | 4,300 |
| | | | 20,993 |
| | 8,646 |
| | | |
| Listing costs | 2,488 |
| | — |
| | | | 2,991 |
| | — |
| | | |
| Amortization of restricted shares and units | 564 |
| | 311 |
| | | | 1,099 |
| | 665 |
| | | |
| Straight-line rent expense adjustment | (7 | ) | | (5 | ) | | | | (14 | ) | | (10 | ) | | | |
| Acquisition expense | 813 |
| | — |
| | | | 815 |
| | — |
| | | |
| Real estate depreciation and amortization | 31,081 |
| | 29,182 |
| | | | 61,103 |
| | 58,103 |
| | | |
| Interest and other income | (141 | ) | | (96 | ) | | | | (286 | ) | | (344 | ) | | | |
| Loss on early extinguishment of debt | 21,412 |
| | — |
| | | | 21,448 |
| | — |
| | | |
| Provision (benefit) for income taxes | 1,338 |
| | (59 | ) | | | | 1,262 |
| | 9 |
| | | |
| Equity in operations of investments | (69 | ) | | (795 | ) | | | | (312 | ) | | (883 | ) | | | |
| (Income) loss from discontinued operations | 121 |
| | 3,191 |
| | | | (1,369 | ) | | 7,285 |
| | | |
| Gain on sale of discontinued operations | (6,077 | ) | | — |
| | | | (14,683 | ) | | — |
| | | |
| Gain on sale of assets | (44,564 | ) | | — |
| | | | (44,564 | ) | | — |
| | | |
| Net operating income of non-same store properties | (5,270 | ) | | (5,843 | ) | | | | (12,316 | ) | | (10,490 | ) | | | |
| Lease termination fees | (125 | ) | | (576 | ) | | | | (670 | ) | | (696 | ) | | | |
| Same Store GAAP NOI | 31,463 |
| | 29,373 |
| | | | 60,588 |
| | 57,956 |
| | | |
| Straight-line rent revenue adjustment | (2,673 | ) | | (875 | ) | | | | (2,969 | ) | | (2,067 | ) | | | |
| Above- and below-market rent amortization | (1,192 | ) | | (926 | ) | | | | (2,275 | ) | | (1,895 | ) | | | |
| Same Store Cash NOI | $ | 27,598 |
| | $ | 27,572 |
| | | | $ | 55,344 |
| | $ | 53,994 |
| | | |
|
| | |
Supplemental Operating and Financial Data | TIER REIT | 2nd Quarter Page 10 |
|
| | | | | | | | | | | | | | | | | | | | | | | | | |
| Schedule of Properties Owned |
| as of June 30, 2015 |
| (in thousands, except average effective rent $/RSF) |
| | | | | | | | | | | | | | | |
| | | | | Rentable SF (100%) | | Rentable SF (own %) | | | | Average Effective Rent | | Average Effective Rent $/RSF | | | | % Average Effective Rent (own %) |
| | | | | | | Occupancy % | | | | % of NRA (own %) | |
| Property (% owned, if not 100%) | | Location | | | | | | | |
| Terrace Office Park | | Austin, TX | | 619 |
| | 619 |
| | 93.2 | % | | $ | 20,886 |
| | $ | 36.18 |
| | 5.9 | % | | 9.0 | % |
| Austin | | | | 619 |
| | 619 |
| | 93.2 | % | | 20,886 |
| | $ | 36.18 |
| | 5.9 | % | | 9.0 | % |
| | | | | | | | | | | | | | | | | |
| 5950 Sherry Lane | | Dallas, TX | | 197 |
| | 197 |
| | 72.6 | % | | 4,903 |
| | $ | 34.32 |
| | 1.9 | % | | 2.1 | % |
| Burnett Plaza | | Fort Worth, TX | | 1,025 |
| | 1,025 |
| | 85.4 | % | | 17,460 |
| | $ | 19.95 |
| | 9.8 | % | | 7.6 | % |
| Centreport Office Center | | Fort Worth, TX | | 133 |
| | 133 |
| | 100.0 | % | | 2,503 |
| | $ | 18.78 |
| | 1.3 | % | | 1.1 | % |
| Dallas/Fort Worth | | | | 1,355 |
| | 1,355 |
| | 84.9 | % | | 24,866 |
| | $ | 21.60 |
| | 13.0 | % | | 10.8 | % |
| | | | | | | | | | | | | | | | | |
| Loop Central | | Houston, TX | | 575 |
| | 575 |
| | 94.3 | % | | 9,392 |
| | $ | 17.32 |
| | 5.5 | % | | 4.1 | % |
| One & Two Eldridge Place | | Houston, TX | | 519 |
| | 519 |
| | 99.2 | % | | 17,082 |
| | $ | 33.14 |
| | 5.0 | % | | 7.4 | % |
| One BriarLake Plaza | | Houston, TX | | 502 |
| | 502 |
| | 97.2 | % | | 20,760 |
| | $ | 42.58 |
| | 4.8 | % | | 9.0 | % |
| Three Eldridge Place | | Houston, TX | | 305 |
| | 305 |
| | 80.3 | % | | 9,985 |
| | $ | 40.72 |
| | 2.9 | % | | 4.3 | % |
| Houston | | | | 1,901 |
| | 1,901 |
| | 94.2 | % | | 57,219 |
| | $ | 31.96 |
| | 18.2 | % | | 24.8 | % |
| | | | | | | | | | | | | | | | | |
| Paces West (10%) | | Atlanta, GA | | 646 |
| | 65 |
| | 83.1 | % | | 1,142 |
| | $ | 21.21 |
| | 0.6 | % | | 0.5 | % |
| Atlanta | | | | 646 |
| | 65 |
| | 83.1 | % | | 1,142 |
| | $ | 21.21 |
| | 0.6 | % | | 0.5 | % |
| | | | | | | | | | | | | | | | | |
| Bank of America Plaza | | Charlotte, NC | | 891 |
| | 891 |
| | 89.2 | % | | 18,002 |
| | $ | 22.66 |
| | 8.6 | % | | 7.8 | % |
| Charlotte | | | | 891 |
| | 891 |
| | 89.2 | % | | 18,002 |
| | $ | 22.66 |
| | 8.6 | % | | 7.8 | % |
| | | | | | | | | | | | | | | | | |
| Buena Vista Plaza | | Burbank, CA | | 115 |
| | 115 |
| | 100.0 | % | | 211 |
| | $ | 1.83 |
| | 1.1 | % | | 0.1 | % |
| Los Angeles | | | | 115 |
| | 115 |
| | 100.0 | % | | 211 |
| | $ | 1.83 |
| | 1.1 | % | | 0.1 | % |
| | | | | | | | | | | | | | | | | |
| Forum Office Park | | Louisville, KY | | 328 |
| | 328 |
| | 98.2 | % | | 5,813 |
| | $ | 18.06 |
| | 3.1 | % | | 2.5 | % |
| Hurstbourne Place | | Louisville, KY | | 235 |
| | 235 |
| | 81.7 | % | | 3,626 |
| | $ | 18.90 |
| | 2.3 | % | | 1.6 | % |
| One Oxmoor Place | | Louisville, KY | | 135 |
| | 135 |
| | 97.0 | % | | 2,904 |
| | $ | 22.09 |
| | 1.3 | % | | 1.3 | % |
| Hurstbourne Park | | Louisville, KY | | 104 |
| | 104 |
| | 99.0 | % | | 2,181 |
| | $ | 21.21 |
| | 1.00 | % | | 0.9 | % |
| Steeplechase Place | | Louisville, KY | | 77 |
| | 77 |
| | 90.9 | % | | 1,173 |
| | $ | 16.77 |
| | 0.7 | % | | 0.5 | % |
| Lakeview | | Louisville, KY | | 76 |
| | 76 |
| | 93.4 | % | | 1,399 |
| | $ | 19.71 |
| | 0.7 | % | | 0.6 | % |
| Hunnington | | Louisville, KY | | 62 |
| | 62 |
| | 85.5 | % | | 604 |
| | $ | 11.40 |
| | 0.6 | % | | 0.3 | % |
| Louisville | | | | 1,017 |
| | 1,017 |
| | 92.6 | % | | 17,700 |
| | $ | 18.79 |
| | 9.8 | % | | 7.7 | % |
| | | | | | | | | | | | | | | | | |
| Plaza at MetroCenter | | Nashville, TN | | 361 |
| | 361 |
| | 92.8 | % | | 5,567 |
| | $ | 16.62 |
| | 3.5 | % | | 2.4 | % |
| Nashville | | | | 361 |
| | 361 |
| | 92.8 | % | | 5,567 |
| | $ | 16.62 |
| | 3.5 | % | | 2.4 | % |
| | | | | | | | | | | | | | | | | |
| 5104 Eisenhower Blvd. | | Tampa, FL | | 130 |
| | 130 |
| | 100.0 | % | | 2,776 |
| | $ | 21.34 |
| | 1.2 | % | | 1.2 | % |
| Tampa | | | | 130 |
| | 130 |
| | 100.0 | % | | 2,776 |
| | $ | 21.34 |
| | 1.2 | % | | 1.2 | % |
| | | | | | | | | | | | | | | | | |
| 801 Thompson | | Rockville, MD | | 51 |
| | 51 |
| | 100.0 | % | | 1,656 |
| | $ | 32.52 |
| | 0.5 | % | | 0.7 | % |
| 1325 G Street (10%) | | Washington, D.C. | | 307 |
| | 31 |
| | 83.9 | % | | 1,022 |
| | $ | 39.30 |
| | 0.3 | % | | 0.4 | % |
| Colorado Building (10%) | | Washington, D.C. | | 128 |
| | 13 |
| | 92.3 | % | | 437 |
| | $ | 38.03 |
| | 0.1 | % | | 0.2 | % |
| Washington, D.C. | | | | 486 |
| | 95 |
| | 93.7 | % | | 3,115 |
| | $ | 35.24 |
| | 0.9 | % | | 1.3 | % |
| | | | | | | | | | | | | | | | | |
| Operating office properties in strategic markets | | | | 7,521 |
| | 6,549 |
| | 91.3 | % | | 151,484 |
| | $ | 25.76 |
| | 62.9 | % | | 65.5 | % |
| | | | | | | | | | | | | | | | | |
| 500 East Pratt | | Baltimore, MD | | 280 |
| | 280 |
| | 98.2 | % | | 9,165 |
| | $ | 33.32 |
| | 2.7 | % | | 4.0 | % |
| Woodcrest Corporate Center | | Cherry Hill, NJ | | 333 |
| | 333 |
| | 90.4 | % | | 6,933 |
| | $ | 23.07 |
| | 3.2 | % | | 3.0 | % |
| 111 Woodcrest | | Cherry Hill, NJ | | 53 |
| | 53 |
| | 84.9 | % | | 937 |
| | $ | 20.82 |
| | 0.5 | % | | 0.4 | % |
| FOUR40 | | Chicago, IL | | 1,041 |
| | 1,041 |
| | 69.2 | % | | 21,088 |
| | $ | 29.27 |
| | 10.0 | % | | 9.1 | % |
| Fifth Third Center | | Columbus, OH | | 331 |
| | 331 |
| | 69.2 | % | | 6,962 |
| | $ | 30.37 |
| | 3.2 | % | | 3.0 | % |
| Wanamaker Building (60%) | | Philadelphia, PA | | 1,390 |
| | 834 |
| | 96.4 | % | | 13,657 |
| | $ | 16.98 |
| | 8.0 | % | | 5.9 | % |
| Three Parkway | | Philadelphia, PA | | 561 |
| | 561 |
| | 93.8 | % | | 10,892 |
| | $ | 20.71 |
| | 5.4 | % | | 4.7 | % |
| Lawson Commons | | St. Paul, MN | | 436 |
| | 436 |
| | 89.2 | % | | 10,001 |
| | $ | 25.70 |
| | 4.2 | % | | 4.3 | % |
| Other operating office properties | | | | 4,425 |
| | 3,869 |
| | 85.0 | % | | 79,635 |
| | $ | 24.21 |
| | 37.1 | % | | 34.5 | % |
| Total operating office properties | | 11,946 |
| | 10,418 |
| | 89.0 | % | | $ | 231,119 |
| | $ | 24.94 |
| | 100.0 | % | | 100.0 | % |
| Non-operating retail property | | | | | | | | | | | | | | |
| Hurstbourne Plaza (1) | | Louisville, KY | | 79 |
| | 79 |
| | 52.0 | % | | | | | | | | |
| Office development property (2) | | | | | | | | | | | | | | |
| Two BriarLake Plaza | | Houston, TX | | 334 |
| | 334 |
| | 60.0 | % | | | | | | | | |
| Total Properties | | | | 12,359 |
| | 10,831 |
| | | | | | | | | | |
| | | | | | | | | | | | | | | | | |
| (1) Hurstbourne Plaza is a retail property planned for redevelopment within the Hurstbourne Business Park. |
| (2) Development properties are classified as operating upon the sooner to occur of 90% commenced leasing or one year after major construction is completed. |
| | | | | | | | | | | | | | | | | |
Average effective rent represents 12 times the sum of the monthly contractual amounts for base rent and the pro rata budgeted operating expense reimbursements, as of period end, related to leases in place as of period end, as reduced for free rent and excluding any scheduled future rent increases, as adjusted for our ownership interest. |
|
| | |
Supplemental Operating and Financial Data | TIER REIT | 2nd Quarter Page 11 |
Net Operating Income by Market
|
| | | | | | | | | | | | | | | | |
| Represents TIER REIT’s % ownership of NOI during the current quarter from operating properties owned at period end by market as a % of TIER REIT’s % ownership of total NOI during the current quarter from operating properties owned at period end. |
|
| | |
Supplemental Operating and Financial Data | TIER REIT | 2nd Quarter Page 12 |
|
| | | | | | | |
| Components of Net Asset Value |
| (in thousands) |
| | | | | |
| | | | | Annualized Three Months Ended |
| | | | | 30-Jun-15 |
| Revenue (1) | | | $ | 279,656 |
|
| | Less: | | | |
| | GAAP rent adjustments | | (23,712 | ) |
| | Lease termination fees | | (500 | ) |
| | | | | 255,444 |
|
| Property operating expenses (1) | | (132,532 | ) |
| | Add: | | | |
| | Costs attributable to tenant improvement demolition | | 319 |
|
| | Property management fees (2) | | 6,926 |
|
| Adjusted cash NOI | | 130,157 |
|
| | Less: | | | |
| | Adjusted cash NOI from properties sold during the period | | (13,329 | ) |
| | Adjusted cash NOI from non-stabilized properties (3) | | (23,743 | ) |
| | Add: Adjusted cash NOI from unconsolidated real estate at ownership share | 8,763 |
|
| Total adjusted cash NOI at ownership share (4) | | $ | 101,848 |
|
| | | | | |
| | | | | 30-Jun-15 |
| Non-stabilized real estate properties and land development sites acquired (3) | | |
| | Value of non-stabilized properties as determined by third-party on 10/30/14 | | 567,400 |
|
| | Purchase price of 5950 Sherry Lane and land development sites acquired | | 76,676 |
|
| Total other real estate properties | | $ | 644,076 |
|
| Other tangible assets | | |
| | Cash and cash equivalents | | $ | 153,158 |
|
| | Restricted cash | | 29,620 |
|
| | Accounts receivable (excluding $65.1 million of straight-line rent receivable and deferred lease incentives) | 6,723 |
|
| | Prepaid expenses | | 31,890 |
|
| | Ownership share of other tangible assets in unconsolidated joint ventures | 9,603 |
|
| Total other tangible assets | | $ | 230,994 |
|
| Liabilities | | | |
| | Notes payable | | $ | 505,196 |
|
| | Credit facility | | 525,000 |
|
| | Other liabilities | | 101,789 |
|
| | Ownership share of other liabilities in unconsolidated joint ventures | | 3,371 |
|
| | Ownership share of unconsolidated debt | | 71,163 |
|
| Total liabilities | | $ | 1,206,519 |
|
| | | |
| Total common shares, OP units, and vested restricted stock units outstanding (5) | | 49,948 |
|
| (1 | ) | Includes consolidated operations | | |
| (2 | ) | Represents adjustment made for third-party property management services which was internalized 7/1/2015. | |
| (3 | ) | Non-stabilized properties include: | Economic % SF Leased | | |
| | | |
| | | 30-Jun-15 | | |
| | 1325 G Street | 68% | | |
| | Colorado Building | 46% | | |
| | Hurstbourne Plaza | 43% | | |
| | 5104 Eisenhower Blvd (a) | 83% | | |
| | 5950 Sherry Lane | 71% | | |
| | Two Briarlake Plaza | 42% | | |
| | FOUR40 | 59% | | |
| | Burnett Plaza | 76% | | |
| | Buena Vista Plaza | 3% | | |
| | _______________________ | | | |
| | (a) Free rent period on 17% of space at 5104 Eisenhower Blvd. expires in August 2015 | | |
| | | | | |
| (4 | ) | Includes adjusted cash NOI of Plaza at MetroCenter, which is currently stabilized but will become economically non-stabilized in 2015 due to large lease renewals with associated rent abatements. | |
| (5 | ) | Reflects the one-for-six reverse stock split that occurred on June 2, 2015 | |
|
| | |
Supplemental Operating and Financial Data | TIER REIT | 2nd Quarter Page 13 |
|
| | | | | | | | | | | | | | |
| Selected Non-Stabilized Properties |
| | | | | | | | | | | | | | |
| | Property Name Market Sub-Market | | Property Type | | Rentable Square feet | | Occupancy % | | Estimated Cash NOI at Stabilization (in thousands) | | Estimated Stabilization date | | Description |
| | | | | | | | | | | | | | |
| 5950 Sherry Lane | | Office | | 197,000 | | 73% | | $4,106 | | 2016 | | Acquired in December 2014, following the move out of an approximate 40,000 square foot tenant. Budgeted $1.6 million in capital improvements and repair and maintenance projects. |
| Dallas | | | | | | | | | | | |
| Preston Center | | | | | | | | | | | |
| | | | | | | | | | | | |
| | | | | | | | | | | | |
| | | | | | | | | | | | |
| | | | | | | | | | | | | | |
| Two BriarLake Plaza | Office Development | | 334,000 | | 60% | | $8,246 | | 2016 | | Property operates as a multi-campus facility with our One BriarLake Plaza property. Major construction was completed in the third quarter of 2014. |
| Houston | | | | | | | | | | | |
| Westchase | | | | | | | | | | | |
| | | | | | | | | | | | | |
| | | | | | | | | | | | | |
| | | | | | | | | | | | | |
| | | | | | | | | | | | | |
| | | | | | | | | | | | | | |
| FOUR40 | | Office | | 1,041,000 | | 69% | | $16,271 | | 2017 | | Completed $5.8 million lobby renovation in the third quarter of 2014. Construction of a $10.6 million tenant amenity floor including wi-fi lounge, conference center, and café was completed in June 2015. |
| Chicago | | | | | | | | | | | |
| Central Loop | | | | | | | | | | | |
| | | | | | | | | | | | |
| | | | | | | | | | | | |
| | | | | | | | | | | | |
| | | | | | | | | | | | |
| | | | | | | | | | | | | | |
| Burnett Plaza | | Office | | 1,025,000 |
| | 85% | | $13,506 | | 2017 | | Two tenants moved out due to relocation to an owned facility (approximately 80,000 square feet in Q3 2013) and downsizing (approximately 80,000 square feet in Q2 2014). The property received BOMA’s 2014 International Building of the Year (TOBY) for properties in excess of one million square feet. Budgeted $2.2 million in strategic capital improvements. |
| Dallas/Fort Worth | | | | | | | | | | | |
| Fort Worth CBD | | | | | | | | | | | |
| | | | | | | | | | | | |
| | | | | | | | | | | | |
| | | | | | | | | | | | |
| | | | | | | | | | | | |
| | | | | | | | | | | | | | |
| Plaza at MetroCenter | Office | | 361,000 |
| | 93% | | $3,032 | | 2017 | | 15 year renewal of 100,000 square feet (43,000 square feet downsizing to occur) by the major tenant was completed in second quarter 2015. Upon completion of tenant renovations in late 2016, tenant will receive six months of free rent. |
| Nashville | | | | | | | | | | | |
| MetroCenter | | | | | | | | | | | |
| | | | | | | | | | | | |
| | | | | | | | | | | | |
| | | | | | | | | | | | | |
| | | | | | | | | | | | | | |
| Buena Vista Plaza | | Office | | 115,000 |
| | 100% | | $3,056 | | 2016 | | Completed ten year renewal of 113,000 square feet by the major tenant in the second quarter of 2015 with free rent for eleven months, beginning in April 2015, before returning to stabilized economic occupancy. |
| Burbank | | | | | | | | | | | |
| Burbank media district | | | | | | | | | | | |
| | | | | | | | | | | | |
| | | | | | | | | | | | |
| | | | | | | | | | | | | |
|
| | |
Supplemental Operating and Financial Data | TIER REIT | 2nd Quarter Page 14 |
|
| | | | | | | | | | | | | | | | |
| Significant Tenants |
| June 30, 2015 |
| (In thousands) |
| |
| Properties in Strategic Markets |
| | Annualized Gross Rental Revenues | | Percentage of Annualized Gross Rental Revenues | | | | Percentage of Square Feet Leased | | Weighted Average Remaining Term (Years) | | |
| | | | Square Feet Leased | | | | Moody’s / S&P Credit Rating |
| Tenant | | | | | |
| Oil & Gas | $ | 12,979 |
| | 8 | % | | 329 |
| | 6 | % | | 3.1 | | A2 / A |
| Financial Services | 10,229 |
| | 6 | % | | 455 |
| | 8 | % | | 3.6 | | Baa1 / A- |
| Oil & Gas | 8,347 |
| | 5 | % | | 210 |
| | 4 | % | | 9.3 | | Baa1 / BBB+ |
| GSA | 7,645 |
| | 5 | % | | 295 |
| | 5 | % | | 3.0 | | U.S. Government |
| McDermott, Inc. | 6,051 |
| | 4 | % | | 190 |
| | 3 | % | | 5.6 | | Ba3 / B+ |
| Oil & Gas | 5,334 |
| | 3 | % | | 218 |
| | 4 | % | | 4.8 | | NR |
| Disney Enterprises Inc | 3,899 |
| | 2 | % | | 113 |
| | 2 | % | | 10.7 | | A2 / A |
| Law Firm | 3,636 |
| | 2 | % | | 93 |
| | 2 | % | | 6.5 | | NR |
| Financial Services | 3,432 |
| | 2 | % | | 204 |
| | 3 | % | | 9.9 | | NR |
| E. R. Squibb and Sons, LLC | 3,350 |
| | 2 | % | | 130 |
| | 2 | % | | 9.0 | | A2 / A+ |
| Insurance | 3,273 |
| | 2 | % | | 140 |
| | 2 | % | | 13.1 | | NR / A+ |
| Law Firm | 3,194 |
| | 2 | % | | 111 |
| | 2 | % | | 7.3 | | NR |
| Oil & Gas | 2,872 |
| | 2 | % | | 117 |
| | 2 | % | | 7.1 | | NR |
| Oil & Gas | 2,760 |
| | 2 | % | | 63 |
| | 1 | % | | 1.9 | | NR |
| Healthcare | 2,759 |
| | 2 | % | | 148 |
| | 2 | % | | 9.8 | | Baa3 / BBB+ |
| Total of largest 15 tenants at properties in strategic markets | $ | 79,760 |
| | 49 | % | | 2,816 |
| | 47 | % | | 6.3 | | |
| Total all tenants at properties in strategic markets | $ | 163,087 |
| | | | 5,978 |
| | | | 5.1 | | |
| | | | | | | | | | | | |
| |
| Total Portfolio |
| | Annualized
Gross Rental
Revenues | | Percentage of Annualized
Gross Rental
Revenues | | | | Percentage of Square Feet Leased | | Weighted Average Remaining Term (Years) | | |
| | | | Square Feet Leased | | | | Moody’s / S&P Credit Rating |
| Tenant | | | | | |
| Oil & Gas | $ | 12,979 |
| | 5 | % | | 329 |
| | 4 | % | | 3.1 | | A2 / A |
| GSA | 12,490 |
| | 5 | % | | 510 |
| | 6 | % | | 4.1 | | U.S. Government |
| Financial Services | 10,229 |
| | 4 | % | | 455 |
| | 5 | % | | 3.6 | | Baa1 / A- |
| Oil & Gas | 8,347 |
| | 3 | % | | 210 |
| | 2 | % | | 9.3 | | Baa1 / BBB+ |
| Software | 6,347 |
| | 3 | % | | 240 |
| | 3 | % | | 4.5 | | B3 / B |
| McDermott, Inc. | 6,051 |
| | 2 | % | | 190 |
| | 2 | % | | 5.6 | | Ba3 / B+ |
| Oil & Gas | 5,334 |
| | 2 | % | | 218 |
| | 2 | % | | 4.8 | | NR |
| Education | 4,519 |
| | 2 | % | | 184 |
| | 2 | % | | 7.6 | | NR |
| Financial Services | 4,167 |
| | 2 | % | | 118 |
| | 1 | % | | 3.4 | | Aa3 / A- |
| Disney Enterprises Inc | 3,899 |
| | 2 | % | | 113 |
| | 1 | % | | 10.7 | | A2 / A |
| Law Firm | 3,636 |
| | 1 | % | | 93 |
| | 1 | % | | 6.5 | | NR |
| Technology | 3,626 |
| | 1 | % | | 151 |
| | 2 | % | | 5.2 | | Baa2 / BBB |
| Financial Services | 3,432 |
| | 1 | % | | 204 |
| | 2 | % | | 9.9 | | NR |
| Financial Services | 3,376 |
| | 1 | % | | 87 |
| | 1 | % | | 6.7 | | NR |
| E. R. Squibb and Sons, LLC | 3,350 |
| | 1 | % | | 130 |
| | 1 | % | | 9.0 | | A2 / A+ |
| Total of largest 15 tenants | $ | 91,782 |
| | 37 | % | | 3,232 |
| | 35 | % | | 5.6 | | |
| Total all tenants | $ | 247,400 |
| | | | 9,267 |
| | | | 5.4 | | |
| | | | | | | | | | | | |
|
| | | | | | | | | | | | | | | | | | | | | | |
| | | | | | | | | | | | | | | | | | | | | | | |
| Notes: | | | | | | | | | | | | | | | | | | | | | | |
| The above tables set forth the company’s 15 largest tenants including subsidiaries for the operating properties as of the date noted above, based upon annualized gross rents plus estimated operating cost recoveries in place at the end of the above noted period. |
| As annualized rental revenue is not derived from the historical GAAP results, historical results may differ from those set forth above. |
| Amounts reflect TIER REIT’s ownership %. | | | | | |
|
| | |
Supplemental Operating and Financial Data | TIER REIT | 2nd Quarter Page 15 |
Industry Diversification (by square foot)
As of June 30, 2015
|
| |
| Notes: |
| | |
| The Company’s tenants are classified according to the U.S. Government’s North American Industrial Classification System (NAICS). | |
| Amounts reflect TIER REIT’s ownership %. | |
|
| | |
Supplemental Operating and Financial Data | TIER REIT | 2nd Quarter Page 16 |
|
| | | | | | | | | | | | | | | | | | | | | | | | | | | | | | | | | | | | | | | | | | | | | | | | | |
| Leasing Activity Summary |
| For the Three Months Ended |
| June 30, 2015 |
| | | | | | | | | | | | | | | | | | | | | | | | | | | | | | | |
| | | | | Occupancy | | | | | | | �� | | | Occupancy | | Cash | | | | Straight-lined | | |
| | | Rentable SF (000’s) | | % | | SF | | Activity for the Quarter (SF 000’s) | | SF | | % | | Net Rent /SF | | % Increase of Cash Net Rent | | Net Rent /SF | | % Increase of SL Net Rent |
| Market | | | 3/31/2015 | | 3/31/2015 | | Expirations | | Renewals | | Expansions | | New | | 6/30/2015 | | 6/30/2015 | | Expiring | | Activity | | | Expiring | | Activity | |
| Austin | | 619 |
| | 92.9 | % | | 575 |
| | (13 | ) | | 11 |
| | 4 |
| | — |
| | 577 |
| | 93.2 | % | | $ | 21.95 |
| | $ | 24.09 |
| | 10 | % | | $ | 19.63 |
| | $ | 24.59 |
| | 25 | % |
| Dallas/Fort Worth | | 1,355 |
| | 83.3 | % | | 1,129 |
| | (174 | ) | | 148 |
| | 48 |
| | — |
| | 1,151 |
| | 84.9 | % | | $ | 15.17 |
| | $ | 12.40 |
| | -18 | % | | $ | 14.61 |
| | $ | 12.94 |
| | -11 | % |
| Houston | | 1,901 |
| | 97.2 | % | | 1,847 |
| | (88 | ) | | 27 |
| | — |
| | 4 |
| | 1,790 |
| | 94.2 | % | | $ | 23.86 |
| | $ | 23.90 |
| | — | % | | $ | 21.88 |
| | $ | 26.77 |
| | 22 | % |
| Atlanta | | 65 |
| | 83.1 | % | | 54 |
| | (2 | ) | | 2 |
| | — |
| | — |
| | 54 |
| | 83.1 | % | | $ | 15.85 |
| | $ | 17.01 |
| | 7 | % | | $ | 15.37 |
| | $ | 17.01 |
| | 11 | % |
| Charlotte | | 891 |
| | 88.6 | % | | 789 |
| | (36 | ) | | 8 |
| | 2 |
| | 32 |
| | 795 |
| | 89.2 | % | | $ | 15.36 |
| | $ | 19.27 |
| | 25 | % | | $ | 15.25 |
| | $ | 21.69 |
| | 42 | % |
| Los Angeles | | 115 |
| | 100.0 | % | | 115 |
| | (113 | ) | | 113 |
| | — |
| | — |
| | 115 |
| | 100.0 | % | | $ | 27.95 |
| | $ | 23.16 |
| | -17 | % | | $ | 28.64 |
| | $ | 25.89 |
| | -10 | % |
| Louisville | | 1,017 |
| | 90.6 | % | | 921 |
| | (55 | ) | | 36 |
| | 3 |
| | 37 |
| | 942 |
| | 92.6 | % | | $ | 11.27 |
| | $ | 10.82 |
| | -4 | % | | $ | 10.02 |
| | $ | 11.15 |
| | 11 | % |
| Nashville | | 361 |
| | 91.4 | % | | 330 |
| | — |
| | — |
| | 2 |
| | 3 |
| | 335 |
| | 92.8 | % | | $ | 10.13 |
| | $ | 8.36 |
| | -17 | % | | $ | 9.54 |
| | $ | 7.81 |
| | -18 | % |
| Tampa | | 130 |
| | 100.0 | % | | 130 |
| | — |
| | — |
| | — |
| | — |
| | 130 |
| | 100.0 | % | | $ | — |
| | $ | — |
| | — |
| | $ | — |
| | $ | — |
| | — |
|
| Washington, D.C. | | 95 |
| | 90.5 | % | | 86 |
| | — |
| | — |
| | — |
| | 3 |
| | 89 |
| | 93.7 | % | | $ | 38.68 |
| | $ | 29.09 |
| | -25 | % | | $ | 34.18 |
| | $ | 29.71 |
| | -13 | % |
| Operating office properties in strategic markets | | 6,549 |
| | 91.3 | % | | 5,976 |
| | (481 | ) | | 345 |
| | 59 |
| | 79 |
| | 5,978 |
| | 91.3 | % | | $ | 18.43 |
| | $ | 16.45 |
| | -11 | % | | $ | 17.92 |
| | $ | 17.77 |
| | -1 | % |
| Other operating office properties | | 3,869 |
| | 85.2 | % | | 3,296 |
| | (381 | ) | | 277 |
| | 32 |
| | 65 |
| | 3,289 |
| | 85.0 | % | | $ | 17.96 |
| | $ | 15.34 |
| | -15 | % | | $ | 16.95 |
| | $ | 15.78 |
| | -7 | % |
| Total | | 10,418 |
| | 89.0 | % | | 9,272 |
| | (862 | ) | | 622 |
| | 91 |
| | 144 |
| | 9,267 |
| | 89.0 | % | | $ | 18.22 |
| | $ | 15.97 |
| | -12 | % | | $ | 17.50 |
| | $ | 16.90 |
| | -3 | % |
| | | | | | | | | | | | | | | | | | | | | | | | | | | | | | | |
| | | End of Period | | | | | | | | | | | | | | | | | | Cash | | | | Straight-lined | | |
| | | | | | | | | | | | | | | | | | | | Net Rent /SF | | % Increase
of Cash
Net Rent | | Net Rent /SF | | % Increase
of SL
Net Rent |
| Year-To-Date Summary | | NRA (000's) | | % Leased | | Leased SF (000's) | | Expirations | | Renewals | | Expansions | | New | | Leased SF (000's) | | % Leased | | Expiring | | Activity | | | Expiring | | Activity | |
| Operating office properties in strategic markets | | | | | | | | | | | | | | | | | | | | | | | | | | | | | | |
| Q1 Activity | | 6,940 |
| | 89.2 | % | | 6,189 |
| | (109 | ) | | 55 |
| | 44 |
| | 106 |
| | 6,285 |
| | 90.6 | % | | $ | 22.00 |
| | $ | 21.14 |
| | -4 | % | | $ | 20.91 |
| | $ | 21.95 |
| | 5 | % |
| Q2 Activity | | 6,549 |
| | 91.3 | % | | 5,976 |
| | (481 | ) | | 345 |
| | 59 |
| | 79 |
| | 5,978 |
| | 91.3 | % | | $ | 18.43 |
| | $ | 16.45 |
| | -11 | % | | $ | 17.92 |
| | $ | 17.77 |
| | -1 | % |
| | | | | | | | | (590 | ) | | 400 |
| | 103 |
| | 185 |
| | | | | | $ | 19.49 |
| | $ | 17.85 |
| | -8 | % | | $ | 18.81 |
| | $ | 19.01 |
| | 1 | % |
| Total Portfolio | | | | | | | | | | | | | | | | | | | | | | | | | | | | | | |
| Q1 Activity | | 12,487 |
| | 88.1 | % | | 10,996 |
| | (278 | ) | | 137 |
| | 68 |
| | 111 |
| | 11,034 |
| | 88.4 | % | | $ | 20.86 |
| | $ | 19.19 |
| | -8 | % | | $ | 19.72 |
| | $ | 19.74 |
| | — |
|
| Q2 Activity | | 10,418 |
| | 89.0 | % | | 9,272 |
| | (862 | ) | | 622 |
| | 91 |
| | 144 |
| | 9,267 |
| | 89.0 | % | | $ | 18.22 |
| | $ | 15.97 |
| | -12 | % | | $ | 17.50 |
| | $ | 16.90 |
| | -3 | % |
| | | | | | | | | (1,140 | ) | | 759 |
| | 159 |
| | 255 |
| | | | | | $ | 18.93 |
| | $ | 16.83 |
| | -11 | % | | $ | 18.10 |
| | $ | 17.66 |
| | -2 | % |
|
| | | | | | | | | | | |
| Notes: | |
| Analysis relates to operating properties owned at the end of the period and reflects TIER REIT’s ownership %. |
| Occupancy includes all leases for tenants under legal lease contracts that have commenced during the period. |
| Rates for expiring leases relate to the lease previously occupying the specific space for which positive absorption was shown or the current lease rate if it is a first generation lease. |
| Net Rent is equal to the fixed base rental amount paid under the terms of the lease less any portion used to offset real estate taxes, utility charges, and other operating expenses incurred in connection with the leased space. |
| Cash Net Rent disregards any free rent periods. Therefore, the rate shown is first full monthly cash rent paid. |
| The impact of short term temporary leasing activity is excluded from the analysis of % increase of cash net rent and % increase of SL net rent. |
|
| | |
Supplemental Operating and Financial Data | TIER REIT | 2nd Quarter Page 17 |
|
| | | | | | | | | | | | | | | | | | | | | | | | | | | | | | | | | | | | | | | | | | | | | | | | | | | | | | | | |
| Leasing Rate Activity Summary |
| For the Three Months Ended |
| June 30, 2015 |
| | | | | | | | | | | | | | | | | | | | | | | | | | | | | | |
| | Renewals | | Expansions | | New |
| | | | Cash | | Straight-lined | | | | Cash | | Straight-lined | | | | Cash | | Straight-lined |
| | | | Net Rent /SF | | Net Rent /SF | | | | Net Rent /SF | | Net Rent /SF | | | | Net Rent /SF | | Net Rent /SF |
| Markets | SF | | Expiring | | Activity | | Expiring | | Activity | | SF | | Expiring | | Activity | | Expiring | | Activity | | SF | | Expiring | | Activity | | Expiring | | Activity |
| Austin | 11 |
| | $ | 21.29 |
| | $ | 23.30 |
| | $ | 18.00 |
| | $ | 23.22 |
| | 4 |
| | $ | 23.55 |
| | $ | 26.00 |
| | $ | 23.55 |
| | $ | 27.89 |
| | — |
| | $ | — |
| | $ | — |
| | $ | — |
| | $ | — |
|
| Dallas/Fort Worth | 148 |
| | $ | 15.84 |
| | $ | 12.31 |
| | $ | 15.49 |
| | $ | 13.32 |
| | 48 |
| | $ | 13.10 |
| | $ | 12.68 |
| | $ | 11.91 |
| | $ | 11.76 |
| | — |
| | $ | — |
| | $ | — |
| | $ | — |
| | $ | — |
|
| Houston | 27 |
| | $ | 25.65 |
| | $ | 25.68 |
| | $ | 23.39 |
| | $ | 28.63 |
| | — |
| | $ | — |
| | $ | — |
| | $ | — |
| | $ | — |
| | 4 |
| | $ | 12.08 |
| | $ | 12.05 |
| | $ | 12.08 |
| | $ | 14.55 |
|
| Atlanta | 2 |
| | $ | 15.85 |
| | $ | 17.01 |
| | $ | 15.37 |
| | $ | 17.01 |
| | — |
| | $ | — |
| | $ | — |
| | $ | — |
| | $ | — |
| | — |
| | $ | — |
| | $ | — |
| | $ | — |
| | $ | — |
|
| Charlotte | 8 |
| | $ | 21.73 |
| | $ | 20.70 |
| | $ | 21.73 |
| | $ | 21.24 |
| | 2 |
| | $ | 19.12 |
| | $ | 19.37 |
| | $ | 18.24 |
| | $ | 19.37 |
| | 32 |
| | $ | 13.56 |
| | $ | 18.92 |
| | $ | 13.48 |
| | $ | 21.95 |
|
| Los Angeles | 113 |
| | $ | 27.95 |
| | $ | 23.16 |
| | $ | 28.64 |
| | $ | 25.89 |
| | — |
| | $ | — |
| | $ | — |
| | $ | — |
| | $ | — |
| | — |
| | $ | — |
| | $ | — |
| | $ | — |
| | $ | — |
|
| Louisville | 36 |
| | $ | 12.02 |
| | $ | 11.88 |
| | $ | 9.70 |
| | $ | 12.50 |
| | 3 |
| | $ | 9.64 |
| | $ | 10.64 |
| | $ | 9.64 |
| | $ | 10.94 |
| | 37 |
| | $ | 10.65 |
| | $ | 9.77 |
| | $ | 10.38 |
| | $ | 9.84 |
|
| Nashville | — |
| | $ | — |
| | $ | — |
| | $ | — |
| | $ | — |
| | 2 |
| | $ | 11.08 |
| | $ | 8.21 |
| | $ | 11.08 |
| | $ | 8.32 |
| | 3 |
| | $ | 9.48 |
| | $ | 8.46 |
| | $ | 8.48 |
| | $ | 7.46 |
|
| Tampa | — |
| | $ | — |
| | $ | — |
| | $ | — |
| | $ | — |
| | — |
| | $ | — |
| | $ | — |
| | $ | — |
| | $ | — |
| | — |
| | $ | — |
| | $ | — |
| | $ | — |
| | $ | — |
|
| Washington, D.C. | — |
| | $ | — |
| | $ | — |
| | $ | — |
| | $ | — |
| | — |
| | $ | — |
| | $ | — |
| | $ | — |
| | $ | — |
| | 3 |
| | $ | 38.68 |
| | $ | 29.09 |
| | $ | 34.18 |
| | $ | 29.71 |
|
| Operating office properties in strategic markets | 345 |
| | $ | 20.49 |
| | $ | 17.44 |
| | $ | 20.03 |
| | $ | 19.07 |
| | 59 |
| | $ | 13.77 |
| | $ | 13.55 |
| | $ | 12.77 |
| | $ | 12.95 |
| | 79 |
| | $ | 12.92 |
| | $ | 14.28 |
| | $ | 12.55 |
| | $ | 15.65 |
|
| Percentage increase (decrease) | | | | (15 | )% | | | | (5 | )% | | | | | | (2 | )% | | | | 1 | % | | | | | | 11 | % | | | | 25 | % |
| | | | | | | | | | | | | | | | | | | | | | | | | | | | | | |
| Other operating office properties | 277 |
| | $ | 17.94 |
| | $ | 15.55 |
| | $ | 17.09 |
| | $ | 16.24 |
| | 32 |
| | $ | 16.75 |
| | $ | 13.19 |
| | $ | 16.19 |
| | $ | 12.43 |
| | 65 |
| | $ | 18.60 |
| | $ | 15.47 |
| | $ | 16.68 |
| | $ | 15.43 |
|
| Total | 622 |
| | $ | 19.35 |
| | $ | 16.6 |
| | $ | 18.72 |
| | $ | 17.81 |
| | 91 |
| | $ | 14.81 |
| | $ | 13.43 |
| | $ | 13.97 |
| | $ | 12.77 |
| | 144 |
| | $ | 15.48 |
| | $ | 14.82 |
| | $ | 14.42 |
| | $ | 15.55 |
|
| Percentage increase (decrease) | | | | (14 | )% | | | | (5 | )% | | | | | | (9 | )% | | | | (9 | )% | | | | | | (4 | )% | | | | 8 | % |
| | | | | | | | | | | | | | | | | | | | | | | | | | | | | | |
| Year-To-Date Summary: | | | | | | | | | | | | | | | | | | | | | | | | | | | | |
| Operating office properties in strategic markets | | | | | | | | | | | | | | | | | | | | | | | | | | | | | |
| Q1 2015 | 55 |
| | $ | 18.06 |
| | $ | 18.88 |
| | $ | 16.61 |
| | $ | 19.80 |
| | 44 |
| | $ | 18.96 |
| | $ | 23.46 |
| | $ | 18.53 |
| | $ | 24.51 |
| | 106 |
| | $ | 25.28 |
| | $ | 21.37 |
| | $ | 24.10 |
| | $ | 22.01 |
|
| Q2 2015 | 345 |
| | $ | 20.49 |
| | $ | 17.44 |
| | $ | 20.03 |
| | $ | 19.07 |
| | 59 |
| | $ | 13.77 |
| | $ | 13.55 |
| | $ | 12.77 |
| | $ | 12.95 |
| | 79 |
| | $ | 12.92 |
| | $ | 14.28 |
| | $ | 12.55 |
| | $ | 15.65 |
|
| | 400 |
| | $ | 20.15 |
| | $ | 17.63 |
| | $ | 19.56 |
| | $ | 19.17 |
| | 103 |
| | $ | 15.99 |
| | $ | 17.79 |
| | $ | 15.23 |
| | $ | 17.89 |
| | 185 |
| | $ | 20.00 |
| | $ | 18.34 |
| | $ | 19.17 |
| | $ | 19.29 |
|
| Percentage increase (decrease) | | | | (12 | )% | | | | (2 | )% | | | | | | 11 | % | | | | 17 | % | | | | | | (8 | )% | | | | 1 | % |
| Total Portfolio | | | | | | | | | | | | | | | | | | | | | | | | | | | | | |
| Q1 2015 | 137 |
| | $ | 19.41 |
| | $ | 17.36 |
| | $ | 17.91 |
| | $ | 17.58 |
| | 68 |
| | $ | 16.99 |
| | $ | 19.82 |
| | $ | 16.70 |
| | $ | 20.99 |
| | 111 |
| | $ | 25.00 |
| | $ | 21.07 |
| | $ | 23.77 |
| | $ | 21.66 |
|
| Q2 2015 | 622 |
| | $ | 19.35 |
| | $ | 16.60 |
| | $ | 18.72 |
| | $ | 17.81 |
| | 91 |
| | $ | 14.81 |
| | $ | 13.43 |
| | $ | 13.97 |
| | $ | 12.77 |
| | 144 |
| | $ | 15.48 |
| | $ | 14.82 |
| | $ | 14.42 |
| | $ | 15.55 |
|
| | 759 |
| | $ | 19.36 |
| | $ | 16.73 |
| | $ | 18.58 |
| | $ | 17.77 |
| | 159 |
| | $ | 15.75 |
| | $ | 16.16 |
| | $ | 15.14 |
| | $ | 16.28 |
| | 255 |
| | $ | 19.63 |
| | $ | 17.54 |
| | $ | 18.49 |
| | $ | 18.21 |
|
| Percentage increase (decrease) | | | | (14 | )% | | | | (4 | )% | | | | | | 3 | % | | | | 8% |
| | | | | | (11 | )% | | | | (2 | )% |
| | |
| Analysis relates to operating properties owned at the end of the period and reflects TIER REIT’s ownership %. | |
| SF includes all leases for tenants under legal lease contracts that have commenced during the period. | |
| Rates for expiring leases relate to the lease previously occupying the specific space for which positive absorption was shown or the current lease rate if it is a first generation lease. | |
| Net Rent is equal to the fixed base rental amount paid under the terms of the lease less any portion used to offset real estate taxes, utility charges, and other operating expenses incurred in connection with the leased space. |
| Cash Net Rent disregards any free rent periods. Therefore, the rate shown is first full monthly cash rent paid. | |
| The impact of short term temporary leasing activity is excluded from the analysis of % increase of cash net rent and % increase of SL net rent. | |
|
| | |
Supplemental Operating and Financial Data | TIER REIT | 2nd Quarter Page 18 |
|
| | | | | | | | | | | | | | | | | | | | |
| Lease Expirations |
| For Four Quarters From July 1, 2015 |
| (In thousands) |
| | | | | | | | | | | |
| | Market | Q3 2015 | | Q4 2015 | | Q1 2016 | | Q2 2016 | | Grand Total |
| | | | | | | | | | | |
| | By Square Foot | | | | | | | | | |
| | Austin | 5 |
| | 6 |
| | 29 |
| | 7 |
| | 47 |
|
| | Dallas/Fort Worth | 29 |
| | 3 |
| | 3 |
| | 41 |
| | 76 |
|
| | Houston | 37 |
| | 35 |
| | 6 |
| | 4 |
| | 82 |
|
| | Atlanta | 1 |
| | 2 |
| | 1 |
| | 1 |
| | 5 |
|
| | Charlotte | 3 |
| | 3 |
| | 9 |
| | — |
| | 15 |
|
| | Los Angeles | — |
| | — |
| | 1 |
| | — |
| | 1 |
|
| | Louisville | 6 |
| | 11 |
| | 106 |
| | 9 |
| | 132 |
|
| | Nashville | 160 |
| | — |
| | 18 |
| | 2 |
| | 180 |
|
| | Tampa | — |
| | — |
| | — |
| | — |
| | — |
|
| | Washington, D.C. | — |
| | — |
| | 6 |
| | 2 |
| | 8 |
|
| | Operating office properties in strategic markets | 241 |
| | 60 |
| | 179 |
| | 66 |
| | 546 |
|
| | Other operating office properties | 70 |
| | 34 |
| | 17 |
| | 46 |
| | 167 |
|
| | Total | 311 |
| | 94 |
| | 196 |
| | 112 |
| | 713 |
|
| | | | | | | | | | | |
| | By Annualized Expiring Rentals | | | | | | | | |
| | Austin | $ | 155 |
| | $ | 202 |
| | $ | 1,026 |
| | $ | 262 |
| | $ | 1,645 |
|
| | Dallas/Fort Worth | 781 |
| | 80 |
| | 109 |
| | 1,141 |
| | 2,111 |
|
| | Houston | 1,293 |
| | 984 |
| | 108 |
| | 142 |
| | 2,527 |
|
| | Atlanta | 11 |
| | 46 |
| | 13 |
| | 18 |
| | 88 |
|
| | Charlotte | — |
| | 91 |
| | 284 |
| | — |
| | 375 |
|
| | Los Angeles | 13 |
| | — |
| | 25 |
| | — |
| | 38 |
|
| | Louisville | 105 |
| | 201 |
| | 2,291 |
| | 176 |
| | 2,773 |
|
| | Nashville | 2,611 |
| | — |
| | 373 |
| | 41 |
| | 3,025 |
|
| | Tampa | — |
| | — |
| | — |
| | — |
| | — |
|
| | Washington, D.C. | — |
| | — |
| | 285 |
| | 118 |
| | 403 |
|
| | Operating office properties in strategic markets | 4,969 |
| | 1,604 |
| | 4,514 |
| | 1,898 |
| | 12,985 |
|
| | Other operating office properties | 1,470 |
| | 209 |
| | 475 |
| | 1,390 |
| | 3,544 |
|
| | Total | $ | 6,439 |
| | $ | 1,813 |
| | $ | 4,989 |
| | $ | 3,288 |
| | $ | 16,529 |
|
| | | | | | | | | | | |
| | By Expiring Rent Per SF | | | | | | | | | |
| | Austin | $ | 31.00 |
| | $ | 33.67 |
| | $ | 35.38 |
| | $ | 37.43 |
| | $ | 35.00 |
|
| | Dallas/Fort Worth | $ | 26.93 |
| | $ | 26.67 |
| | $ | 36.33 |
| | $ | 27.83 |
| | $ | 27.78 |
|
| | Houston | $ | 34.95 |
| | $ | 28.11 |
| | $ | — |
| | $ | 35.50 |
| | $ | 30.82 |
|
| | Atlanta | $ | — |
| | $ | — |
| | $ | 13.00 |
| | $ | 18.00 |
| | $ | 17.60 |
|
| | Charlotte | $ | — |
| | $ | — |
| | $ | 31.56 |
| | $ | — |
| | $ | 25.00 |
|
| | Los Angeles | $ | — |
| | $ | — |
| | $ | — |
| | $ | — |
| | $ | 38.00 |
|
| | Louisville | $ | 17.50 |
| | $ | 18.27 |
| | $ | 21.61 |
| | $ | 19.56 |
| | $ | 21.01 |
|
| | Nashville | $ | 16.32 |
| | $ | — |
| | $ | — |
| | $ | 20.50 |
| | $ | 16.81 |
|
| | Tampa | $ | — |
| | $ | — |
| | $ | — |
| | $ | — |
| | $ | — |
|
| | Washington, D.C. | $ | — |
| | $ | — |
| | $ | — |
| | $ | 59.00 |
| | $ | 50.38 |
|
| | Operating office properties in strategic markets | $ | 20.62 |
| | $ | 26.73 |
| | $ | 25.22 |
| | $ | 28.76 |
| | $ | 23.78 |
|
| | Other operating office properties | $ | 21.00 |
| | $ | 6.15 |
| | $ | 27.94 |
| | $ | 30.22 |
| | $ | 21.22 |
|
| | Total | $ | 20.70 |
| | $ | 19.29 |
| | $ | 25.45 |
| | $ | 29.36 |
| | $ | 23.18 |
|
| | | | | | | | | | | |
| Notes: | |
| Leases with an expiration on the last day of the period are considered leased at the last day of the period (i.e., expiring on the fist day of the following period). |
| Reflects TIER REIT’s ownership %. |
| Rentals shown above are the contractually obligated annualized base rent charged in the final month prior to lease termination grossed up to include current operating cost recoveries. |
|
| | |
Supplemental Operating and Financial Data | TIER REIT | 2nd Quarter Page 19 |
|
| | | | | | | | | | | | | | | | | | | | | | | | | | | | | | | | | | | | | | | | | | | | | | | | |
| Lease Expirations |
| Annually From July 1, 2015 |
| (In thousands) |
| | | | | | | | | | | | | | | | | | | | | | | | | |
| | Market | 2015 |
| | 2016 |
| | 2017 |
| | 2018 |
| | 2019 |
| | 2020 |
| | 2021 |
| | 2022 |
| | 2023 |
| | 2024 |
| | 2025+ |
| | Grand Total |
|
| | By Square Foot | | | | | | | | | | | | | | | | | | | | | | | |
| | Austin | 11 |
| | 80 |
| | 46 |
| | 61 |
| | 101 |
| | 103 |
| | 42 |
| | 96 |
| | 36 |
| | — |
| | — |
| | 576 |
|
| | Dallas/Fort Worth | 32 |
| | 64 |
| | 186 |
| | 197 |
| | 100 |
| | 38 |
| | 42 |
| | 117 |
| | 144 |
| | — |
| | 231 |
| | 1,151 |
|
| | Houston | 72 |
| | 51 |
| | 358 |
| | 57 |
| | 341 |
| | 304 |
| | 215 |
| | 13 |
| | 25 |
| | 272 |
| | 85 |
| | 1,793 |
|
| | Atlanta | 2 |
| | 2 |
| | 1 |
| | 2 |
| | 7 |
| | 5 |
| | 3 |
| | 4 |
| | — |
| | 3 |
| | 25 |
| | 54 |
|
| | Charlotte | 6 |
| | 13 |
| | 8 |
| | 12 |
| | 439 |
| | 10 |
| | 7 |
| | — |
| | 81 |
| | 32 |
| | 189 |
| | 797 |
|
| | Los Angeles | — |
| | 1 |
| | — |
| | — |
| | 4 |
| | — |
| | — |
| | — |
| | — |
| | — |
| | 110 |
| | 115 |
|
| | Louisville | 17 |
| | 157 |
| | 257 |
| | 28 |
| | 150 |
| | 72 |
| | 3 |
| | 15 |
| | 35 |
| | 14 |
| | 194 |
| | 942 |
|
| | Nashville | 160 |
| | 36 |
| | 7 |
| | 3 |
| | — |
| | 2 |
| | 21 |
| | 14 |
| | — |
| | 4 |
| | 87 |
| | 334 |
|
| | Tampa | — |
| | — |
| | — |
| | — |
| | — |
| | — |
| | — |
| | — |
| | — |
| | 130 |
| | — |
| | 130 |
|
| | Washington, D.C. | — |
| | 60 |
| | 3 |
| | 2 |
| | 1 |
| | 3 |
| | 1 |
| | 2 |
| | 2 |
| | — |
| | 12 |
| | 86 |
|
| | Operating office properties in strategic markets | 300 |
| | 464 |
| | 866 |
| | 362 |
| | 1,143 |
| | 537 |
| | 334 |
| | 261 |
| | 323 |
| | 455 |
| | 933 |
| | 5,978 |
|
| | As a % of Occupied SF | 5 | % | | 8 | % | | 14 | % | | 6 | % | | 19 | % | | 9 | % | | 6 | % | | 4 | % | | 5 | % | | 8 | % | | 16 | % | | 100 | % |
| | As a % of Total NRA | 5 | % | | 7 | % | | 13 | % | | 6 | % | | 17 | % | | 8 | % | | 5 | % | | 4 | % | | 5 | % | | 7 | % | | 14 | % | | 91 | % |
| | Other operating office properties | 105 |
| | 116 |
| | 316 |
| | 355 |
| | 184 |
| | 512 |
| | 333 |
| | 464 |
| | 298 |
| | 39 |
| | 567 |
| | 3,289 |
|
| | Total | 405 |
| | 580 |
| | 1,182 |
| | 717 |
| | 1,327 |
| | 1,049 |
| | 667 |
| | 725 |
| | 621 |
| | 494 |
| | 1,500 |
| | 9,267 |
|
| | As a % of Occupied SF | 4 | % | | 6 | % | | 13 | % | | 8 | % | | 14 | % | | 11 | % | | 7 | % | | 8 | % | | 8 | % | | 5 | % | | 16 | % | | 100 | % |
| | As a % of Total NRA | 4 | % | | 6 | % | | 11 | % | | 7 | % | | 13 | % | | 10 | % | | 6 | % | | 7 | % | | 6 | % | | 5 | % | | 14 | % | | 89 | % |
| | | | | | | | | | | | | | | | | | | | | | | | | |
| | By Annualized Expiring Rentals | | | | | | | | | | | | | | | | | | | | | | | |
| | Austin | $ | 357 |
| | $ | 2,899 |
| | $ | 1,663 |
| | $ | 2,132 |
| | $ | 3,955 |
| | $ | 4,077 |
| | $ | 1,801 |
| | $ | 3,794 |
| | $ | 1,511 |
| | $ | — |
| | $ | — |
| | $ | 22,189 |
|
| | Dallas/Fort Worth | 861 |
| | 1,950 |
| | 4,345 |
| | 4,929 |
| | 2,451 |
| | 1,344 |
| | 1,356 |
| | 2,975 |
| | 4,044 |
| | — |
| | 6,115 |
| | 30,370 |
|
| | Houston | 2,277 |
| | 1,258 |
| | 11,760 |
| | 2,387 |
| | 13,959 |
| | 9,716 |
| | 7,256 |
| | 643 |
| | 1,203 |
| | 12,079 |
| | 2,280 |
| | 64,818 |
|
| | Atlanta | 57 |
| | 51 |
| | 16 |
| | 39 |
| | 177 |
| | 126 |
| | 49 |
| | 115 |
| | — |
| | 91 |
| | 669 |
| | 1,390 |
|
| | Charlotte | 91 |
| | 398 |
| | 277 |
| | 465 |
| | 10,155 |
| | 317 |
| | 250 |
| | — |
| | 2,903 |
| | 360 |
| | 6,064 |
| | 21,280 |
|
| | Los Angeles | 13 |
| | 25 |
| | — |
| | — |
| | 197 |
| | — |
| | — |
| | — |
| | — |
| | — |
| | 5,223 |
| | 5,458 |
|
| | Louisville | 307 |
| | 3,231 |
| | 4,858 |
| | 524 |
| | 3,116 |
| | 1,345 |
| | 69 |
| | 289 |
| | 840 |
| | 307 |
| | 4,035 |
| | 18,921 |
|
| | Nashville | 2,611 |
| | 701 |
| | 142 |
| | 54 |
| | — |
| | 38 |
| | 483 |
| | 283 |
| | — |
| | 114 |
| | 2,002 |
| | 6,428 |
|
| | Tampa | — |
| | — |
| | — |
| | — |
| | — |
| | — |
| | — |
| | — |
| | — |
| | 4,371 |
| | — |
| | 4,371 |
|
| | Washington, D.C. | — |
| | 2,087 |
| | 175 |
| | 123 |
| | 78 |
| | 211 |
| | 54 |
| | 291 |
| | 120 |
| | 30 |
| | 768 |
| | 3,937 |
|
| | Operating office properties in strategic markets | 6,574 |
| | 12,600 |
| | 23,236 |
| | 10,653 |
| | 34,088 |
| | 17,174 |
| | 11,318 |
| | 8,390 |
| | 10,621 |
| | 17,352 |
| | 27,156 |
| | 179,162 |
|
| | As a % of Total Annualized Expiring Rentals | 4 | % | | 7 | % | | 13 | % | | 6 | % | | 19 | % | | 10 | % | | 6 | % | | 5 | % | | 6 | % | | 10 | % | | 15 | % | | 100 | % |
| | Other operating office properties | 1,678 |
| | 3,311 |
| | 10,549 |
| | 12,050 |
| | 5,106 |
| | 13,137 |
| | 8,692 |
| | 14,872 |
| | 9,858 |
| | 770 |
| | 10,753 |
| | 90,776 |
|
| | Total | $ | 8,252 |
| | $ | 15,911 |
| | $ | 33,785 |
| | $ | 22,703 |
| | $ | 39,194 |
| | $ | 30,311 |
| | $ | 20,010 |
| | $ | 23,262 |
| | $ | 20,479 |
| | $ | 18,122 |
| | $ | 37,909 |
| | $ | 269,938 |
|
| | As a % of Total Annualized Expiring Rentals | 3 | % | | 6 | % | | 13 | % | | 8 | % | | 15 | % | | 11 | % | | 7 | % | | 9 | % | | 8 | % | | 7 | % | | 14 | % | | 100 | % |
| | | | | | | | | | | | | | | | | | | | | | | | | |
| | By Expiring Rent Per SF | | | | | | | | | | | | | | | | | | | | | | | |
| | Austin | $ | 32.45 |
| | $ | 36.24 |
| | $ | 36.15 |
| | $ | 34.95 |
| | $ | 39.16 |
| | $ | 39.58 |
| | $ | 42.88 |
| | $ | 39.52 |
| | $ | 41.97 |
| | $ | — |
| | $ | — |
| | $ | 38.52 |
|
| | Dallas/Fort Worth | $ | 26.91 |
| | $ | 30.47 |
| | $ | 23.36 |
| | $ | 25.02 |
| | $ | 24.51 |
| | $ | 35.37 |
| | $ | 32.29 |
| | $ | 25.43 |
| | $ | 28.08 |
| | $ | — |
| | $ | 26.47 |
| | $ | 26.39 |
|
| | Houston | $ | 31.63 |
| | $ | 24.67 |
| | $ | 32.85 |
| | $ | 41.88 |
| | $ | 40.94 |
| | $ | 31.96 |
| | $ | 33.75 |
| | $ | 49.46 |
| | $ | 48.12 |
| | $ | 44.41 |
| | $ | 26.95 |
| | $ | 36.16 |
|
| | Atlanta | $ | 28.50 |
| | $ | 25.50 |
| | $ | 16.00 |
| | $ | 19.50 |
| | $ | 25.29 |
| | $ | 25.20 |
| | $ | 16.33 |
| | $ | 28.75 |
| | $ | — |
| | $ | 30.33 |
| | $ | 26.76 |
| | $ | 25.74 |
|
| | Charlotte | $ | 15.17 |
| | $ | 30.62 |
| | $ | 34.63 |
| | $ | 38.75 |
| | $ | 23.13 |
| | $ | 31.70 |
| | $ | 35.71 |
| | $ | — |
| | $ | 35.84 |
| | $ | 11.25 |
| | $ | 32.08 |
| | $ | 26.70 |
|
| | Los Angeles | $ | — |
| | $ | 25.00 |
| | $ | — |
| | $ | — |
| | $ | — |
| | $ | — |
| | $ | — |
| | $ | — |
| | $ | — |
| | $ | — |
| | $ | — |
| | $ | 47.46 |
|
| | Louisville | $ | 18.06 |
| | $ | 20.58 |
| | $ | 18.90 |
| | $ | 18.71 |
| | $ | 20.77 |
| | $ | 18.68 |
| | $ | 23.00 |
| | $ | 19.27 |
| | $ | 24.00 |
| | $ | 21.93 |
| | $ | 20.80 |
| | $ | 20.09 |
|
| | Nashville | $ | 16.32 |
| | $ | 19.47 |
| | $ | 20.29 |
| | $ | — |
| | $ | — |
| | $ | — |
| | $ | 23.00 |
| | $ | — |
| | $ | — |
| | $ | 28.50 |
| | $ | 23.01 |
| | $ | 19.25 |
|
| | Tampa | $ | — |
| | $ | — |
| | $ | — |
| | $ | — |
| | $ | — |
| | $ | — |
| | $ | — |
| | $ | — |
| | $ | — |
| | $ | 33.62 |
| | $ | — |
| | $ | — |
|
| | Washington, D.C. | $ | — |
| | $ | 34.78 |
| | $ | 58.33 |
| | $ | 61.50 |
| | $ | 78.00 |
| | $ | 70.33 |
| | $ | 54.00 |
| | $ | 119.26 |
| | $ | 60.00 |
| | $ | — |
| | $ | 64.00 |
| | $ | 45.55 |
|
| | Operating office properties in strategic markets | $ | 21.91 |
| | $ | 27.16 |
| | $ | 26.83 |
| | $ | 29.43 |
| | $ | 29.82 |
| | $ | 31.98 |
| | $ | 33.89 |
| | $ | 32.09 |
| | $ | 32.88 |
| | $ | 38.14 |
| | $ | 29.12 |
| | $ | 29.97 |
|
| | Other operating office properties | $ | 15.98 |
| | $ | 28.54 |
| | $ | 33.38 |
| | $ | 33.94 |
| | $ | 27.75 |
| | $ | 25.66 |
| | $ | 26.10 |
| | $ | 32.05 |
| | $ | 33.08 |
| | $ | 19.74 |
| | $ | 18.96 |
| | $ | 27.60 |
|
| | Total | $ | 20.38 |
| | $ | 27.43 |
| | $ | 28.58 |
| | $ | 31.66 |
| | $ | 29.54 |
| | $ | 28.90 |
| | $ | 30.00 |
| | $ | 32.07 |
| | $ | 32.98 |
| | $ | 36.68 |
| | $ | 25.28 |
| | $ | 29.13 |
|
| | | | | | | | | | | | | | | | | | | | | | | | | |
| | Notes: | | | | | | | | | | | | | | | | | | | | | | | |
| | Leases with an expiration on the last day of the period are considered leased at the last day of the period (i.e., expiring on the first day of the following period). | | | | |
| | Reflects TIER REIT’s ownership %. | | | | | | | | | | | | | | |
| | Rentals shown above are the contractually obligated annualized base rent charged in the final month prior to lease termination grossed up to include current operating cost recoveries. |
|
| | |
Supplemental Operating and Financial Data | TIER REIT | 2nd Quarter Page 20 |
|
| | | | | | | | | | | | | | | | | | |
| Occupancy Trends |
| |
| | | | | | | | | | | | | |
| | | | | | | | | | | | | |
| | | Rentable SF (in thousands) | | | | | | | | | | |
| | | | Occupancy % |
| Market | | 30-Jun-15 | | 30-Jun-15 | | 31-Mar-15 | | 31-Dec-14 | | 30-Sep-14 | | 30-Jun-14 |
| | | | | | | | | | | | | |
| Austin | | 619 |
| | 93 | % | | 93 | % | | 92 | % | | 92 | % | | 89 | % |
| Dallas/Fort Worth | | 1,355 |
| | 85 | % | | 83 | % | | 82 | % | | 81 | % | | 81 | % |
| Houston | | 1,901 |
| | 94 | % | | 97 | % | | 96 | % | | 98 | % | | 94 | % |
| Atlanta | | 65 |
| | 83 | % | | 83 | % | | 80 | % | | 77 | % | | 78 | % |
| Charlotte | | 891 |
| | 89 | % | | 89 | % | | 88 | % | | 88 | % | | 88 | % |
| Los Angeles | | 115 |
| | 100 | % | | 100 | % | | 100 | % | | 100 | % | | 100 | % |
| Louisville | | 1,017 |
| | 93 | % | | 91 | % | | 89 | % | | 89 | % | | 86 | % |
| Nashville | | 361 |
| | 93 | % | | 91 | % | | 88 | % | | 83 | % | | 83 | % |
| Tampa | | 130 |
| | 100 | % | | 100 | % | | 100 | % | | 57 | % | | 57 | % |
| Washington, D.C. | | 95 |
| | 94 | % | | 90 | % | | 88 | % | | 87 | % | | 86 | % |
| Operating office properties in strategic markets | | 6,549 |
| | 91 | % | | 91 | % | | 90 | % | | 89 | % | | 87 | % |
| Other operating office properties | | 3,869 |
| | 85 | % | | 85 | % | | 86 | % | | 85 | % | | 86 | % |
| Total | | 10,418 |
| | 89 | % | | 89 | % | | 89 | % | | 88 | % | | 87 | % |
| | | | | | | | | | | | | |
| Notes: | | | | | | | | | | | | |
| Analysis relates to operating properties owned at the end of the most recent period and reflects TIER REIT’s ownership %. |
| Occupancy % is as of the last day of the indicated period. | | | | |
| |
|
| | |
Supplemental Operating and Financial Data | TIER REIT | 2nd Quarter Page 21 |
|
| | | | | | | | | | | | | | | | | | | | | | | | | | | | | | |
| Leasing Cost Summary |
| For the Three Months Ended |
| June 30, 2015 |
| | | | | | | | | | | | | | | | | |
| | | | | | | | | | | | | | | | | |
| | | | | | | Weighted Average Leasing Costs |
| | | SF (000’s) | | Wtd Avg Term (Yrs) | | Per Square Foot | | Per Square Foot / Year |
| Renewal | | | | Comms | | TI & Other | | Total | | Comms | | TI & Other | | Total |
| Market | | | | | | | | | | | | | | | | |
| Austin | | 11 |
| | 2.2 |
| | $ | 4.87 |
| | $ | 4.12 |
| | $ | 8.99 |
| | $ | 2.21 |
| | $ | 1.87 |
| | $ | 4.08 |
|
| Dallas/Fort Worth | | 148 |
| | 11.0 |
| | $ | 12.45 |
| | $ | 32.47 |
| | $ | 44.92 |
| | $ | 1.14 |
| | $ | 2.96 |
| | $ | 4.10 |
|
| Houston | | 27 |
| | 2.6 |
| | $ | 6.74 |
| | $ | 4.63 |
| | $ | 11.37 |
| | $ | 2.58 |
| | $ | 1.78 |
| | $ | 4.36 |
|
| Atlanta | | 2 |
| | 0.5 |
| | $ | 0.69 |
| | $ | — |
| | $ | 0.69 |
| | $ | 1.38 |
| | $ | — |
| | $ | 1.38 |
|
| Charlotte | | 8 |
| | 3.4 |
| | $ | 5.78 |
| | $ | 12.50 |
| | $ | 18.28 |
| | $ | 1.70 |
| | $ | 3.68 |
| | $ | 5.38 |
|
| Los Angeles | | 113 |
| | 10.9 |
| | $ | 5.95 |
| | $ | 40.55 |
| | $ | 46.50 |
| | $ | 0.55 |
| | $ | 3.71 |
| | $ | 4.26 |
|
| Louisville | | 36 |
| | 5.8 |
| | $ | 4.64 |
| | $ | 1.03 |
| | $ | 5.67 |
| | $ | 0.81 |
| | $ | 0.18 |
| | $ | 0.99 |
|
| Nashville | | — |
| | — |
| | $ | — |
| | $ | — |
| | $ | — |
| | $ | — |
| | $ | — |
| | $ | — |
|
| Tampa | | — |
| | — |
| | $ | — |
| | $ | — |
| | $ | — |
| | $ | — |
| | $ | — |
| | $ | — |
|
| Washington, D.C. | | — |
| | — |
| | $ | — |
| | $ | — |
| | $ | — |
| | $ | — |
| | $ | — |
| | $ | — |
|
| Operating office properties in strategic markets | | 345 |
| | 9.2 |
| | $ | 8.60 |
| | $ | 28.10 |
| | $ | 36.70 |
| | $ | 0.93 |
| | $ | 3.05 |
| | $ | 3.98 |
|
| Other operating office properties | | 277 |
| | 4.8 |
| | $ | 5.45 |
| | $ | 13.11 |
| | $ | 18.56 |
| | $ | 1.13 |
| | $ | 2.72 |
| | $ | 3.85 |
|
| Total | | 622 |
| | 7.3 |
| | $ | 7.20 |
| | $ | 21.41 |
| | $ | 28.61 |
| | $ | 0.99 |
| | $ | 2.95 |
| | $ | 3.94 |
|
| | | | | | | | | | | | | | | | | |
| Expansion | | | | | | | | | | | | | | | | |
| Market | | | | | | | | | | | | | | | | |
| Austin | | 4 |
| | 6.4 |
| | $ | 16.03 |
| | $ | 35.18 |
| | $ | 51.21 |
| | $ | 2.50 |
| | $ | 5.48 |
| | $ | 7.98 |
|
| Dallas/Fort Worth | | 48 |
| | 11.0 |
| | $ | 12.49 |
| | $ | 32.64 |
| | $ | 45.13 |
| | $ | 1.14 |
| | $ | 2.97 |
| | $ | 4.11 |
|
| Houston | | — |
| | — |
| | $ | — |
| | $ | — |
| | $ | — |
| | $ | — |
| | $ | — |
| | $ | — |
|
| Atlanta | | — |
| | — |
| | $ | — |
| | $ | — |
| | $ | — |
| | $ | — |
| | $ | — |
| | $ | — |
|
| Charlotte | | 2 |
| | 5.0 |
| | $ | — |
| | $ | 66.61 |
| | $ | 66.61 |
| | $ | — |
| | $ | 13.32 |
| | $ | 13.32 |
|
| Los Angeles | | — |
| | — |
| | $ | — |
| | $ | — |
| | $ | — |
| | $ | — |
| | $ | — |
| | $ | — |
|
| Louisville | | 3 |
| | 3.4 |
| | $ | 1.38 |
| | $ | 4.15 |
| | $ | 5.53 |
| | $ | 0.40 |
| | $ | 1.20 |
| | $ | 1.60 |
|
| Nashville | | 2 |
| | 5.3 |
| | $ | 5.29 |
| | $ | 7.99 |
| | $ | 13.28 |
| | $ | 1.00 |
| | $ | 1.51 |
| | $ | 2.51 |
|
| Tampa | | — |
| | — |
| | $ | — |
| | $ | — |
| | $ | — |
| | $ | — |
| | $ | — |
| | $ | — |
|
| Washington, D.C. | | — |
| | — |
| | $ | — |
| | $ | — |
| | $ | — |
| | $ | — |
| | $ | — |
| | $ | — |
|
| Operating office properties in strategic markets | | 59 |
| | 9.9 |
| | $ | 11.50 |
| | $ | 31.68 |
| | $ | 43.18 |
| | $ | 1.16 |
| | $ | 3.20 |
| | $ | 4.36 |
|
| Other operating office properties | | 32 |
| | 4.3 |
| | $ | 5.36 |
| | $ | 7.50 |
| | $ | 12.86 |
| | $ | 1.24 |
| | $ | 1.73 |
| | $ | 2.97 |
|
| Total | | 91 |
| | 7.9 |
| | $ | 9.34 |
| | $ | 23.18 |
| | $ | 32.52 |
| | $ | 1.17 |
| | $ | 2.92 |
| | $ | 4.09 |
|
| | | | | | | | | | | | | | | | | |
| New | | | | | | | | | | | | | | | | |
| Market | | | | | | | | | | | | | | | | |
| Austin | | — |
| | — |
| | $ | — |
| | $ | — |
| | $ | — |
| | $ | — |
| | $ | — |
| | $ | — |
|
| Dallas/Fort Worth | | — |
| | — |
| | $ | — |
| | $ | — |
| | $ | — |
| | $ | — |
| | $ | — |
| | $ | — |
|
| Houston | | 4 |
| | 12.0 |
| | $ | 17.08 |
| | $ | 42.84 |
| | $ | 59.92 |
| | $ | 1.42 |
| | $ | 3.57 |
| | $ | 4.99 |
|
| Atlanta | | — |
| | — |
| | $ | — |
| | $ | — |
| | $ | — |
| | $ | — |
| | $ | — |
| | $ | — |
|
| Charlotte | | 32 |
| | 11.7 |
| | $ | 20.24 |
| | $ | 70.34 |
| | $ | 90.58 |
| | $ | 1.73 |
| | $ | 6.01 |
| | $ | 7.74 |
|
| Los Angeles | | — |
| | — |
| | — |
| | — |
| | — |
| | $ | — |
| | $ | — |
| | $ | — |
|
| Louisville | | 37 |
| | 6.2 |
| | $ | 6.50 |
| | $ | 20.70 |
| | $ | 27.20 |
| | $ | 1.05 |
| | $ | 3.33 |
| | $ | 4.38 |
|
| Nashville | | 3 |
| | 3.3 |
| | $ | 3.29 |
| | $ | 3.00 |
| | $ | 6.29 |
| | $ | 1.01 |
| | $ | 0.92 |
| | $ | 1.93 |
|
| Tampa | | — |
| | — |
| | — |
| | — |
| | — |
| | $ | — |
| | $ | — |
| | $ | — |
|
| Washington, D.C. | | 3 |
| | 10.5 |
| | $ | 15.83 |
| | $ | 75.12 |
| | $ | 90.95 |
| | $ | 1.51 |
| | $ | 7.15 |
| | $ | 8.66 |
|
| Operating office properties in strategic markets | | 79 |
| | 8.8 |
| | $ | 12.83 |
| | $ | 43.32 |
| | $ | 56.15 |
| | $ | 1.46 |
| | $ | 4.94 |
| | $ | 6.40 |
|
| Other operating office properties | | 65 |
| | 7.0 |
| | $ | 9.00 |
| | $ | 41.37 |
| | $ | 50.37 |
| | $ | 1.29 |
| | $ | 5.93 |
| | $ | 7.22 |
|
| Total | | 144 |
| | 8.0 |
| | $ | 11.11 |
| | $ | 42.44 |
| | $ | 53.55 |
| | $ | 1.39 |
| | $ | 5.33 |
| | $ | 6.72 |
|
| Notes: | | | | | | | | | | | | | | | | |
| Analysis relates to operating properties owned at the end of the period and reflects TIER REIT’s ownership %. |
| |
|
| | |
Supplemental Operating and Financial Data | TIER REIT | 2nd Quarter Page 22 |
|
| | | | | | | | | | | | | | | | | | | | |
| Leasing Cost Trend Analysis |
| |
| | | | | | | | | | | |
| | | Three Months Ended | | Three Months Ended | | Year to Date | | Year Ended | | Year Ended |
| | | 30-Jun-15 | | 31-Mar-15 | | 30-Jun-15 | | 31-Dec-14 | | 31-Dec-13 |
| Renewal Leasing | | | | | | | | | | |
| Square Feet (in thousands) | | 622 |
| | 137 |
| | 759 |
| | 1,298 |
| | 1,504 |
|
| Weighted Average Term (in years) | | 7.3 |
| | 4.4 |
| | 6.7 |
| | 5.7 |
| | 4.3 |
|
| Commissions per SF | | $ | 7.20 |
| | $ | 6.63 |
| | $ | 7.09 |
| | $ | 4.68 |
| | $ | 4.55 |
|
| TI and Other Leasing Cost per SF | | 21.41 |
| | 7.43 |
| | 18.89 |
| | 4.62 |
| | 7.68 |
|
| Total Leasing Cost per SF | | $ | 28.61 |
| | $ | 14.06 |
| | $ | 25.98 |
| | $ | 9.30 |
| | $ | 12.23 |
|
| | | | | | | | | | | |
| Commissions per SF per Year | | $ | 0.99 |
| | $ | 1.52 |
| | $ | 1.09 |
| | $ | 0.93 |
| | $ | 1.06 |
|
| TI and Other Leasing Cost per SF per Year | | 2.95 |
| | 1.70 |
| | 2.72 |
| | 0.74 |
| | 1.68 |
|
| Total Leasing Cost per SF per Year | | $ | 3.94 |
| | $ | 3.22 |
| | $ | 3.81 |
| | $ | 1.67 |
| | $ | 2.74 |
|
| | | | | | | | | | | |
| Expansion Leasing | | | | | | | | | | |
| Square Feet (in thousands) | | 91 |
| | 68 |
| | 159 |
| | 264 |
| | 389 |
|
| Weighted Average Term (in years) | | 7.9 |
| | 6.5 |
| | 7.3 |
| | 6.6 |
| | 6.1 |
|
| Commissions per SF | | $ | 9.34 |
| | $ | 11.35 |
| | $ | 10.2 |
| | $ | 9.41 |
| | $ | 8.10 |
|
| TI and Other Leasing Cost per SF | | 23.18 |
| | 29.53 |
| | 25.89 |
| | 21.39 |
| | 19.17 |
|
| Total Leasing Cost per SF | | $ | 32.52 |
| | $ | 40.88 |
| | $ | 36.09 |
| | $ | 30.80 |
| | $ | 27.27 |
|
| | | | | | | | | | | |
| Commissions per SF per Year | | $ | 1.17 |
| | $ | 1.73 |
| | $ | 1.41 |
| | $ | 1.41 |
| | $ | 1.37 |
|
| TI and Other Leasing Cost per SF per Year | | 2.92 |
| | 4.51 |
| | 3.6 |
| | 3.11 |
| | 3.14 |
|
| Total Leasing Cost per SF per Year | | $ | 4.09 |
| | $ | 6.24 |
| | $ | 5.01 |
| | $ | 4.52 |
| | $ | 4.51 |
|
| | | | | | | | | | | |
| New Leasing | | | | | | | | | | |
| Square Feet (in thousands) | | 144 |
| | 111 |
| | 255 |
| | 927 |
| | 754 |
|
| Weighted Average Term (in years) | | 8.0 |
| | 8.0 |
| | 8 |
| | 8.4 |
| | 7.4 |
|
| Commissions per SF | | $ | 11.11 |
| | $ | 16.31 |
| | $ | 13.37 |
| | $ | 12.15 |
| | $ | 10.51 |
|
| TI and Other Leasing Cost per SF | | 42.44 |
| | 43.27 |
| | 42.8 |
| | 36.28 |
| | 28.27 |
|
| Total Leasing Cost per SF | | $ | 53.55 |
| | $ | 59.58 |
| | $ | 56.17 |
| | $ | 48.43 |
| | $ | 38.78 |
|
| | | | | | | | | | | |
| Commissions per SF per Year | | $ | 1.39 |
| | $ | 2.04 |
| | $ | 1.68 |
| | $ | 1.45 |
| | $ | 1.42 |
|
| TI and Other Leasing Cost per SF per Year | | 5.33 |
| | 5.41 |
| | 5.36 |
| | 4.34 |
| | 3.82 |
|
| Total Leasing Cost per SF per Year | | $ | 6.72 |
| | $ | 7.45 |
| | $ | 7.04 |
| | $ | 5.79 |
| | $ | 5.24 |
|
| | | | | | | | | | | |
| Total Leasing | | | | | | | | | | |
| Square Feet (in thousands) | | 857 |
| | 316 |
| | 1,173 |
| | 2,489 |
| | 2,647 |
|
| Weighted Average Term (in years) | | 7.5 |
| | 6.1 |
| | 7.1 |
| | 6.8 |
| | 5.4 |
|
| Commissions per SF | | $ | 8.08 |
| | $ | 11.05 |
| | $ | 8.88 |
| | $ | 7.96 |
| | $ | 6.77 |
|
| TI and Other Leasing Cost per SF | | 25.13 |
| | 24.78 |
| | 25.04 |
| | 18.19 |
| | 15.23 |
|
| Total Leasing Cost per SF | | $ | 33.21 |
| | $ | 35.83 |
| | $ | 33.92 |
| | $ | 26.15 |
| | $ | 22.00 |
|
| | | | | | | | | | | |
| Commissions per SF per Year | | $ | 1.08 |
| | $ | 1.81 |
| | $ | 1.26 |
| | $ | 1.18 |
| | $ | 1.24 |
|
| TI and Other Leasing Cost per SF per Year | | 3.37 |
| | 4.05 |
| | 3.42 |
| | 2.33 |
| | 2.80 |
|
| Total Leasing Cost per SF per Year | | $ | 4.45 |
| | $ | 5.86 |
| | $ | 4.68 |
| | $ | 3.51 |
| | $ | 4.04 |
|
| | | | | | | | | | | |
| Notes: | | | | | | | | | | |
| Analysis relates to operating properties owned at the end of the indicated period and reflects TIER REIT’s ownership %. |
| | |
|
| | |
Supplemental Operating and Financial Data | TIER REIT | 2nd Quarter Page 23 |
|
| | | | | | | | | | | | | | | | | | | | | |
| | Development, Leasing, and |
| | Capital Expenditures Summary |
| | (in thousands) |
| | | | | | | | | | | | |
| | | | | | | | | | | | |
| | | | For the Three Months Ended |
| | | | 30-Jun-15 | | 31-Mar-15 | | 31-Dec-14 | | 30-Sep-14 | | 30-Jun-14 |
| | | | | | | | | | | | |
| | Recurring Capital Expenditures | | | | | | | | | | |
| | Leasing costs | | $ | 10,105 |
| | $ | 10,253 |
| | $ | 16,513 |
| | $ | 10,148 |
| | $ | 11,443 |
|
| | Building improvements | | 3,962 |
| | 2,994 |
| | 2,955 |
| | 5,908 |
| | 4,421 |
|
| | Subtotal recurring capital expenditures | | 14,067 |
| | 13,247 |
| | 19,468 |
| | 16,056 |
| | 15,864 |
|
| | | | | | | | | | | | |
| | Non-recurring capital expenditures | | | | | | | | | | |
| | Building improvements (1) | | — |
| | 125 |
| | — |
| | — |
| | — |
|
| | Leasing costs (2) | | 4,093 |
| | 5,454 |
| | 9,868 |
| | 6,621 |
| | 6,488 |
|
| | Development (3) | | 3,307 |
| | 2,286 |
| | 8,962 |
| | 3,310 |
| | 8,378 |
|
| | Redevelopment (4) | | 4,375 |
| | 4,506 |
| | 1,532 |
| | 391 |
| | 1,591 |
|
| | Subtotal non-recurring capital expenditures | | 11,775 |
| | 12,371 |
| | 20,362 |
| | 10,322 |
| | 16,457 |
|
| | | | | | | | | | | | |
| | Total capital expenditures | | $ | 25,842 |
| | $ | 25,618 |
| | $ | 39,830 |
| | $ | 26,378 |
| | $ | 32,321 |
|
| | | | | | | | | | | | |
| Notes: | | | | | | | | | | |
| All amounts represent TIER REIT’s ownership %. | | | | | | | | | | |
| | | | | | | | | | | |
| (1) | Non-recurring building improvements include costs identified as deferred capital needs at the acquisition of a property. |
| (2) | Non-recurring leasing costs include costs incurred within 12 months of acquisition to lease space that was vacant at acquisition and costs incurred to lease space that has been vacant for at least 12 months. Cost incurred within 12 months of acquisition to lease space that was vacant at acquisition were as follows: |
| | | | $ | 662 |
| | $ | 674 |
| | $ | 203 |
| | $ | — |
| | $ | — |
|
| (3) | Development includes all new construction costs related to base building and all costs associated with leasing development projects. |
| (4) | Redevelopment costs are for capital projects where substantial improvements are made to the property that change the character of the asset and are expected to result in development type returns on capital. |
|
| | |
Supplemental Operating and Financial Data | TIER REIT | 2nd Quarter Page 24 |
|
| | | | | | | | | | | | | | |
| Potential Future Development Sites |
| June 30, 2015 |
| | | | | | | | | | | | | |
| | | | | | | Approximate Rentable Square Feet | | | | | | |
| | | | | | | | Month of Acquisition | | Cost Basis (in millions) | | |
| Project | | Market | | Acres | | | | | Comments |
| | | | | | | | | | | | | |
| | | | | | | | | | | | | |
| Hurstbourne Plaza | | Louisville | 6.1 | | 350,000 | | Dec-07 | | n/a |
| | Planned mixed-use redevelopment of the Hurstbourne Business Center |
| | | | | | | | | | | | | |
| Burnett Plaza | | Fort Worth - CBD | 1.4 | | N/A | | Jan-07 | | $ | 2.9 |
| | Planned mixed-use development and garage for use at Burnett Plaza |
| | | | | | | | | | | | | |
| 5104 Eisenhower Blvd. | | Tampa | | 5.2 | | 130,000 | | Dec-07 | | $ | 1.5 |
| | Office building |
| | | | | | | | | | | | | |
| 208 Nueces (95%) (1) | | Austin - CBD | | 0.8 | | 325,000 | | Jun-15 | | $ | 7.5 |
| | Office building |
| | | | | | | | | | | | | |
| Legacy Land (95%) (1) | | Dallas (Plano - Legacy) | | 4.0 | | 570,000 | | Jun-15 | | $ | 6.2 |
| | Office building(s) |
| | | | | | | | | | | | | |
| (1) Cost basis represents our investment in this project. |
| | | | | | | | | | | | | |
|
| | |
Supplemental Operating and Financial Data | TIER REIT | 2nd Quarter Page 25 |
|
| | | | | | | | | | | | | | |
| Acquisition and Disposition Activities |
| For the Twelve Months Ended June 30, 2015 |
| |
| | | | | | | | | | | |
| | | | | | | | | | | |
| | | | | | | | | | | |
| | | | | Number of Properties | | Square Feet (in thousands) | | Transaction Date | | Price (in thousands) |
| Acquisitions (1) | | Location | | | | |
| | | | | | | | | | | |
| 5950 Sherry Lane | | Dallas, TX | | 1 |
| | 197 |
| | 12/19/2014 | | $ | 62,578 |
|
| | | | | | | | | | | |
| | | | | | | | | | | |
| Dispositions (2) | | | | | | | | | | |
| | | | | | | | | | | |
| City Hall Plaza | | Manchester, NH | | 1 |
| | 210 |
| | 9/16/2014 | | $ | 19,750 |
|
| 222 South Riverside Plaza | | Chicago, IL | | 1 |
| | 1,184 |
| | 12/19/2014 | | (Note 3) |
|
| One & Two Chestnut Place | | Worcester, MA | | 1 |
| | 218 |
| | 3/6/2015 | | $ | 14,000 |
|
| 250 West Pratt | | Baltimore, MD | | 1 |
| | 368 |
| | 3/19/2015 | | $ | 63,500 |
|
| Fifth Third Center | | Cleveland, OH | | 1 |
| | 508 |
| | 4/7/2015 | | $ | 52,750 |
|
| United Plaza | | Philadelphia, PA | | 1 |
| | 617 |
| | 4/23/2015 | | $ | 114,554 |
|
| 1650 Arch Street | | Philadelphia, PA | | 1 |
| | 553 |
| | 4/23/2015 | | $ | 76,290 |
|
| | | | | 7 |
| | 3,658 |
| | | | |
| | | | | | | | | | | |
| | | | | | | | | | | |
| (1) In June 2015 we acquired 95% interests in two separate land development projects, one located in Austin, Texas, and the other in Plano, Texas. |
| (2) In June 2015 we sold our 1325 G Street and Colorado Building properties (each located in Washington, D.C.) to two separate joint ventures in which we own a 10% noncontrolling interest. |
| (3) The contract sales price for the 222 South Riverside Plaza property was approximately $247.0 million in cash, excluding transaction costs, credits, prorations, and adjustments plus the conveyance of the 5950 Sherry Lane property. |
|
| | |
Supplemental Operating and Financial Data | TIER REIT | 2nd Quarter Page 26 |
|
| | | | | | | | | | | | | | | | | | |
| Summary of Financing | |
| June 30, 2015 | |
| (in thousands) | |
| | | | | | | | | | | | | |
| | | | | | Principal | | Weighted Average Stated Interest Rate | | % of Total | | | |
| Fixed Rate Debt | | | | | | | | | | | | |
| Secured mortgage debt (1) | | | | | $ | 451,338 |
| | 5.68% | | 44% | | | |
| Total fixed rate debt | | | | | 451,338 |
| | 5.68% | | 44% | | | |
| | | | | | | | | | | | | |
| Variable Rate Debt | | | | | | | | | | | | |
| Revolving credit facility (2) | | | | | — |
| | — | | — | | | |
| Term loans (3) | | | | | 525,000 |
| | 3.46% | | 51% | | | |
| Construction loan | | | | | 53,886 |
| | 3.04% | | 5% | | | |
| Total variable rate debt | | | | | 578,886 |
| | 3.42% | | 56% | | | |
| Total debt | | | | | $ | 1,030,224 |
| | 4.47% | | 100% | | | |
| | | | | | | | | | | | | |
| (1) Includes unamortized premium. | | | | | |
| (2) Additional borrowings of $66.0 million were available under the total credit facility. | |
| (3) The borrowing rate under the term loans has been effectively fixed through the use of interest rate hedges. | |
| | | |
| | Maturities |
| | Secured Mortgage Debt | | Revolving Credit Facility and Term Loans | | Total | Annual % Maturing |
| | Principal | | Rate (1) | | Principal | | Rate (1) | | Principal | | Rate (1) |
| July - December 2015 | $ | 42,148 |
| | 5.20% | | $ | — |
| | — | | $ | 42,148 |
| | 5.20% | 4% |
| 2016 | 237,423 |
| | 5.03% | | — |
| | — | | 237,423 |
| | 5.03% | 23% |
| 2017 | 130,255 |
| | 5.47% | | — |
| | — | | 130,255 |
| | 5.47% | 13% |
| 2018 | — |
| | — | | — |
| | — | | — |
| | — | — |
| 2019 | — |
| | — | | 250,000 |
| | 3.24% | | 250,000 |
| | 3.24% | 24% |
| Thereafter | 95,370 |
| | 6.29% | | 275,000 |
| | 3.67% | | 370,370 |
| | 4.34% | 36% |
| unamortized premium | 28 |
| | | | — |
| | | | 28 |
| | | |
| Total debt | $ | 505,224 |
| | | | $ | 525,000 |
| | | | $ | 1,030,224 |
| | | |
| Weighted average maturity in years | 2.1 |
| | | | 5.8 |
| | | | 4.0 |
| | | |
| | | | | | | | | | | | | |
| (1) Represents weighted average stated interest rate for debt maturing in this period. | | | | | |
| | | | | | | | | | | | | |
| | Maturities |
| | Consolidated Debt | | Our share of unconsolidated debt | | Total | Annual % Maturing |
| | Principal | | Rate (1) | | Principal | | Rate (1) | | Principal | | Rate (1) |
| July - December 2015 | $ | 42,148 |
| | 5.20% | | $ | 5,400 |
| | 5.16% | | $ | 47,548 |
| | 5.19% | 4% |
| 2016 | 237,423 |
| | 5.03% | | — |
| | — | | 237,423 |
| | 5.03% | 22% |
| 2017 | 130,255 |
| | 5.47% | | 7,729 |
| | 5.44% | | 137,984 |
| | 5.47% | 13% |
| 2018 | — |
| | — | | 2,504 |
| | 4.75% | | 2,504 |
| | 4.75% | — |
| 2019 | 250,000 |
| | 3.24% | | — |
| | — | | 250,000 |
| | 3.24% | 23% |
| Thereafter | 370,370 |
| | 4.34% | | 56,857 |
| | 3.40% | | 427,227 |
| | 4.22% | 38% |
| unamortized premium (discount) | 28 |
| | | | (98 | ) | | | | (70 | ) | | | |
| Total debt | $ | 1,030,224 |
| | | | $ | 72,392 |
| | | | $ | 1,102,616 |
| | | |
| Weighted average maturity in years | 4.0 |
| | | | 5.9 |
| | | | 4.1 |
| | | |
| | | | | | | | | | | | | |
| (1) Represents weighted average stated interest rate for debt maturing in this period. | | | | | |
| | | | | | | | | | | | | |
| Hedging Details: | | | | | | | | | | | | |
| Type/Description | 100% Notional Value | | Index | Strike Rate | | Effective Date | | Maturity Date | | Loan Designation |
| Interest rate swap - cash flow hedge | $ | 125,000 |
| | one-month LIBOR | 1.6775% | | 31-Dec-14 | | 31-Oct-19 | | Credit Facility |
| Interest rate swap - cash flow hedge | $ | 125,000 |
| | one-month LIBOR | 1.6935% | | 30-Apr-15 | | 31-Oct-19 | | Credit Facility |
| Interest rate swap - cash flow hedge | $ | 125,000 |
| | one-month LIBOR | 1.7615% | | 30-Jun-15 | | 31-May-22 | | Credit Facility |
| Interest rate swap - cash flow hedge | $ | 150,000 |
| | one-month LIBOR | 1.7695% | | 30-Jun-15 | | 31-May-22 | | Credit Facility |
|
| | |
Supplemental Operating and Financial Data | TIER REIT | 2nd Quarter Page 27 |
|
| | | | | | | | | | | | | | | | | | | | | | | | | | | | | |
| | Principal Payments by Year |
| | as of June 30, 2015 |
| | (in thousands) |
| | | | | | | | | | | | | | | | |
| | | | Total | | 2015 | | 2016 | | 2017 | | 2018 | | 2019 | | Thereafter |
| | | | | | | | | | | | | | | | |
| Loop Central | | $ | 42,148 |
| | $ | 42,148 |
| | $ | — |
| | $ | — |
| | $ | — |
| | $ | — |
| | $ | — |
|
| Woodcrest Corporate Center | | 47,036 |
| | 428 |
| | 46,608 |
| | — |
| | — |
| | — |
| | — |
|
| Fifth Third Plaza | | 49,238 |
| | 388 |
| | 48,850 |
| | — |
| | — |
| | — |
| | — |
|
| Plaza at MetroCenter | | 23,438 |
| | 185 |
| | 23,253 |
| | — |
| | — |
| | — |
| | — |
|
| Two BriarLake Plaza construction | | 53,886 |
| | — |
| | 53,886 |
| | — |
| | — |
| | — |
| | — |
|
| Three Parkway | | 63,825 |
| | 510 |
| | 63,315 |
| | — |
| | — |
| | — |
| | — |
|
| One & Two Eldridge | | 71,455 |
| | 571 |
| | 1,190 |
| | 69,694 |
| | — |
| | — |
| | — |
|
| 500 E. Pratt | | 58,800 |
| | — |
| | — |
| | 58,800 |
| | — |
| | — |
| | — |
|
| Credit Facility - Revolving Line | | — |
| | — |
| | — |
| | — |
| | — |
| | — |
| | — |
|
| Credit Facility - Term Loan | | 250,000 |
| | — |
| | — |
| | — |
| | — |
| | 250,000 |
| | — |
|
| One BriarLake Plaza - mezzanine | | 14,714 |
| | 44 |
| | 97 |
| | 110 |
| | 121 |
| | 134 |
| | 14,208 |
|
| One BriarLake Plaza | | 80,656 |
| | 635 |
| | 1,326 |
| | 1,417 |
| | 1,501 |
| | 1,589 |
| | 74,188 |
|
| Credit Facility - Term Loan | | 275,000 |
| | — |
| | — |
| | — |
| | — |
| | — |
| | 275,000 |
|
| | | | 1,030,196 |
| | $ | 44,909 |
| | $ | 238,525 |
| | $ | 130,021 |
| | $ | 1,622 |
| | $ | 251,723 |
| | $ | 363,396 |
|
| unamortized premium (discount) | | 28 |
| | | | | | | | | | | | |
| Consolidated notes payable | | $ | 1,030,224 |
| | | | | | | | | | | | |
| |
| Notes associated with investments in unconsolidated entities and excluded from the consolidated balance above: |
| Wanamaker Building - retail (60%) | | $ | 5,400 |
| | $ | 5,400 |
| | $ | — |
| | $ | — |
| | $ | — |
| | $ | — |
| | $ | — |
|
| Wanamaker Building - office (60%) | | 2,504 |
| | 371 |
| | 769 |
| | 806 |
| | 558 |
| | — |
| | — |
|
| Wanamaker Building - office (60%) | | 43,957 |
| | 436 |
| | 897 |
| | 937 |
| | 974 |
| | 1,013 |
| | 39,700 |
|
| Paces West (10%) (1) | | 7,729 |
| | — |
| | — |
| | 7,729 |
| | — |
| | — |
| | — |
|
| 1325 G Street (10%) | | 9,500 |
| | — |
| | — |
| | — |
| | — |
| | — |
| | 9,500 |
|
| Colorado Building (10%) | | 3,400 |
| | — |
| | — |
| | — |
| | — |
| | — |
| | 3,400 |
|
| | | | 72,490 |
| | $ | 6,207 |
| | $ | 1,666 |
| | $ | 9,472 |
| | $ | 1,532 |
| | $ | 1,013 |
| | $ | 52,600 |
|
| unamortized premium (discount) | | (98 | ) | | | | | | | | | | | | |
| Total unconsolidated notes payable | | $ | 72,392 |
| | | | | | | | | | | | |
| | | | | | | | | | | | | | | | |
| | | | | | | | | | | | | | | | |
| Total notes payable (2) | | $ | 1,102,686 |
| | $ | 51,116 |
| | $ | 240,191 |
| | $ | 139,493 |
| | $ | 3,154 |
| | $ | 252,736 |
| | $ | 415,996 |
|
| % of principal payments due by year | | 100 | % | | 4 | % | | 22 | % | | 13 | % | | — |
| | 23 | % | | 38 | % |
| | | | | | | | | | | | | | | | |
| (1) | Paces West debt consists of an A note of $6.5 million and a B note of $1.2 million. Payment of the B note is only required if the distributions from the joint venture achieve certain investment return thresholds. |
| (2) | Includes consolidated notes payable, our share of unconsolidated notes payable, and excludes unamortized premium (discount). |
|
| | |
Supplemental Operating and Financial Data | TIER REIT | 2nd Quarter Page 28 |
Definitions of Non-GAAP Financial Measures
We use non-GAAP financial measures in our public filings and other public disclosures. These non-GAAP financial measures are defined below.
Funds from Operations (“FFO”)
Historical cost accounting for real estate assets in accordance with GAAP implicitly assumes that the value of real estate diminishes predictably over time. Since real estate values have historically risen or fallen with market conditions, many industry investors and analysts have considered the presentation of operating results for real estate companies that use historical cost accounting alone to be insufficient for evaluating operating performance. FFO is a non-GAAP financial measure that is widely recognized as a measure of a REIT’s operating performance. We use FFO as defined by the National Association of Real Estate Investment Trusts (NAREIT) in the April 2002 “White Paper on Funds From Operations” which is net income (loss), computed in accordance with GAAP, excluding extraordinary items, as defined by GAAP, gains (or losses) from sales of property and impairments of depreciable real estate (including impairments of investments in unconsolidated entities which resulted from measurable decreases in the fair value of the depreciable real estate held by the unconsolidated entity), plus depreciation and amortization of real estate assets, and after related adjustments for unconsolidated entities and noncontrolling interests. The determination of whether impairment charges have been incurred is based partly on anticipated operating performance and hold periods. Estimated undiscounted cash flows from a property, derived from estimated future net rental and lease revenues, net proceeds on the sale of the property, and certain other ancillary cash flows are taken into account in determining whether an impairment charge has been incurred. While impairment charges for depreciable real estate are excluded from net income (loss) in the calculation of FFO as described above, impairments reflect a decline in the value of the applicable property which we may not recover.
We believe that the use of FFO, together with the required GAAP presentations, is helpful in understanding our operating performance because it excludes real estate-related depreciation and amortization, gains and losses from property dispositions, impairments of depreciable real estate assets, and extraordinary items, and as a result, when compared period to period, reflects the impact on operations from trends in occupancy rates, rental rates, operating costs, development activities, general and administrative expenses, and interest costs, which are not immediately apparent from net income. Factors that impact FFO include fixed costs, yields on cash held in accounts, income from portfolio properties and other portfolio assets, interest rates on debt financing, and operating expenses.
We also evaluate FFO attributable to common stockholders, excluding certain items. The items excluded relate to certain non-operating activities or certain non-recurring activities that create significant FFO volatility. We believe it is useful to evaluate FFO excluding these items because it provides useful information in analyzing comparability between reporting periods and in assessing the sustainability of our operating performance.
FFO and FFO, excluding certain items, should not be considered as alternatives to net income (loss), or indications of our liquidity, nor are they indicative of funds available to fund our cash needs, including our ability to make distributions. Additionally, the exclusion of impairments limits the usefulness of FFO and FFO, excluding certain items, as historical operating performance measures since an impairment charge indicates that operating performance has been permanently affected. FFO and FFO, excluding certain items, are not useful measures in evaluating net asset value because impairments are taken into account in determining net asset value but not in determining FFO and FFO, excluding certain items. FFO and FFO, excluding certain items, are non-GAAP measurements and should be reviewed in connection with other GAAP measurements. Our FFO and FFO, excluding certain items, attributable to common stockholders as presented may not be comparable to amounts calculated by other REITs that do not define FFO in accordance with the current NAREIT definition or that interpret it differently.
Funds Available for Distribution (“FAD”)
FAD is a non-GAAP financial measure that we define as FFO, excluding fair value mark to market adjustments, non-real estate depreciation and amortization, non-cash stock-based compensation expense, accretion of Series A preferred stock, the amortization of financing costs, and realized gains (losses) from the early extinguishment of derivatives, acquisition fees and expenses, straight-line rent amounts, amortization of above- or below-market intangible assets and liabilities, and gains or losses on early extinguishment of debt, costs associated with our NYSE listing, other non-recurring charges, less recurring capital expenditures, each as adjusted for our pro rata share of consolidated and unconsolidated amounts. Recurring capital expenditures are those capital expenditures, tenant improvements, leasing commissions and deferred lease incentives that are incurred to maintain current in-place rents including the leasing costs incurred to replace tenants upon lease expiration. Recurring capital expenditures exclude non-recurring capital expenditures. Non-recurring capital expenditures are those capital expenditures (1) incurred to change the class or characterization of an asset, (2) identified as deferred capital needs at the acquisition of a property and were incurred within a reasonable period of time subsequent to the property’s acquisition, or (3) incurred for tenant improvements, leasing commissions, or deferred lease incentives within twelve months of acquisition to lease space that was vacant at acquisition and costs incurred to lease space that has been vacant for at least twelve months. Although our FAD may not be comparable to that of other REITs and real estate companies, we believe it provides a meaningful indicator of our ability to fund our cash needs and to make cash distributions to equity owners.
We believe that net income (loss) is the most directly comparable GAAP financial measure to FAD. FAD does not represent cash generated from operating activities in accordance with GAAP and should not be considered as an alternative to net income (loss) as an indication of our performance or to cash flows as a measure of liquidity or our ability to make distributions.
Net Operating Income (“NOI”)
NOI is a non-GAAP financial measure equal to rental revenue, less property operating expenses (excluding tenant improvement demolition costs), real estate taxes, and property management expenses. Our management uses NOI internally as a performance measure and believes NOI is useful to investors as a performance measure because NOI reflects only those income and expense items that are incurred at the property level and is therefore a useful measure for evaluating a property’s performance. Using NOI on a comparative basis allows investors to evaluate property level performance to: (a) hold management accountable for maintaining or increasing property level NOI from period to period and (b) compare the operating performance of our properties in a given market with the operating performance of other real estate companies in the same market, and consequently allocate their own investment capital accordingly.
Further, we use NOI internally as a performance measure and believe NOI is useful to investors as a performance measure because, when compared year over year, NOI reflects the impact on operations from trends in occupancy rates, rental rates, operating costs, acquisition and development activities, and general and administrative expenses on an un-leveraged basis, providing perspective not immediately apparent from net income. NOI excludes certain components from net income in order to provide results that are more closely related to a property’s results of operations.
|
| | |
Supplemental Operating and Financial Data | TIER REIT | 2nd Quarter Page 29 |
Certain items such as interest expense, while included in net income, do not affect the operating performance of a real estate asset and are often incurred at the corporate level as opposed to the property level. In addition, it is useful to our management and investors that depreciation and amortization are excluded from NOI because historical cost accounting for real estate assets implicitly assumes that the value of real estate assets diminishes predictably over time, and, instead, real estate values have historically risen or fallen with market conditions.
NOI presented by us may not be comparable to NOI reported by other REITs that do not define NOI exactly as we do. We believe that in order to facilitate a clear understanding of our operating results, NOI should be examined in conjunction with net income as presented in our consolidated financial statements and notes thereto. NOI should not be considered as an alternative to net income as an indication of our performance or to cash flows as a measure of liquidity or our ability to make distributions.
Same Store GAAP NOI and Same Store Cash NOI
Same Store GAAP NOI is equal to rental revenue, less lease termination fee income, property operating expenses (excluding tenant improvement demolition costs), real estate taxes, and property management expenses for our same store properties and is considered a non-GAAP financial measure. Same Store Cash NOI is equal to Same Store GAAP NOI less non-cash revenue items including straight-line rent adjustments and the amortization of above- and below-market rent. The same store properties include our consolidated operating properties owned and operated for the entirety of the current and comparable periods. We view Same Store GAAP NOI and Same Store Cash NOI as important measures of the operating performance of our properties because they allow us to compare operating results of consolidated properties owned and operated for the entirety of the current and comparable periods and therefore eliminate variations caused by acquisitions or dispositions during the periods under review.
Same Store GAAP NOI and Same Store Cash NOI presented by us may not be comparable to Same Store GAAP NOI or Same Store Cash NOI reported by other REITs that do not define Same Store GAAP NOI or Same Store Cash NOI exactly as we do. We believe that in order to facilitate a clear understanding of our operating results, Same Store GAAP NOI and Same Store Cash NOI should be examined in conjunction with net income (loss) as presented in our consolidated financial statements and notes thereto. Same Store GAAP NOI and Same Store Cash NOI should not be considered as alternatives to net income (loss) as an indication of our performance or to cash flows as a measure of liquidity or our ability to make distributions.
Earnings before Interest, Taxes, Depreciation and Amortization (“EBITDA”)
EBITDA, a non-GAAP financial measure, is defined as net income (loss), plus interest expense, income tax expense, and depreciation and amortization expense, and after related adjustments for unconsolidated partnerships, joint ventures and subsidiaries, and noncontrolling interests. EBITDA is not intended to represent cash flow for the period, is not presented as an alternative to operating income as an indicator of operating performance, should not be considered in isolation or as a substitute for measures of performance prepared in accordance with GAAP, and is not indicative of operating income or cash provided by operating activities as determined under GAAP. EBITDA is presented solely as a supplemental disclosure with respect to liquidity because we believe it provides useful information regarding our ability to service or incur debt.
|
| | |
Supplemental Operating and Financial Data | TIER REIT | 2nd Quarter Page 30 |