Supplemental Operating and Financial Data
For the Quarter Ended September 30, 2018
About the Company
TIER REIT, Inc. is a publicly traded (NYSE: TIER), self-managed, Dallas-based real estate investment trust focused on owning quality, well-managed commercial office properties in dynamic markets throughout the U.S. TIER REIT’s vision is to be the premier owner and operator of best-in-class office properties in TIER1 submarkets, which are primarily higher density and amenity-rich locations within select, high-growth metropolitan areas that offer a walkable experience to various amenities. Our mission is to provide unparalleled, TIER ONE Property Services to our tenants and outsized total return through stock price appreciation and dividend growth to our stockholders.
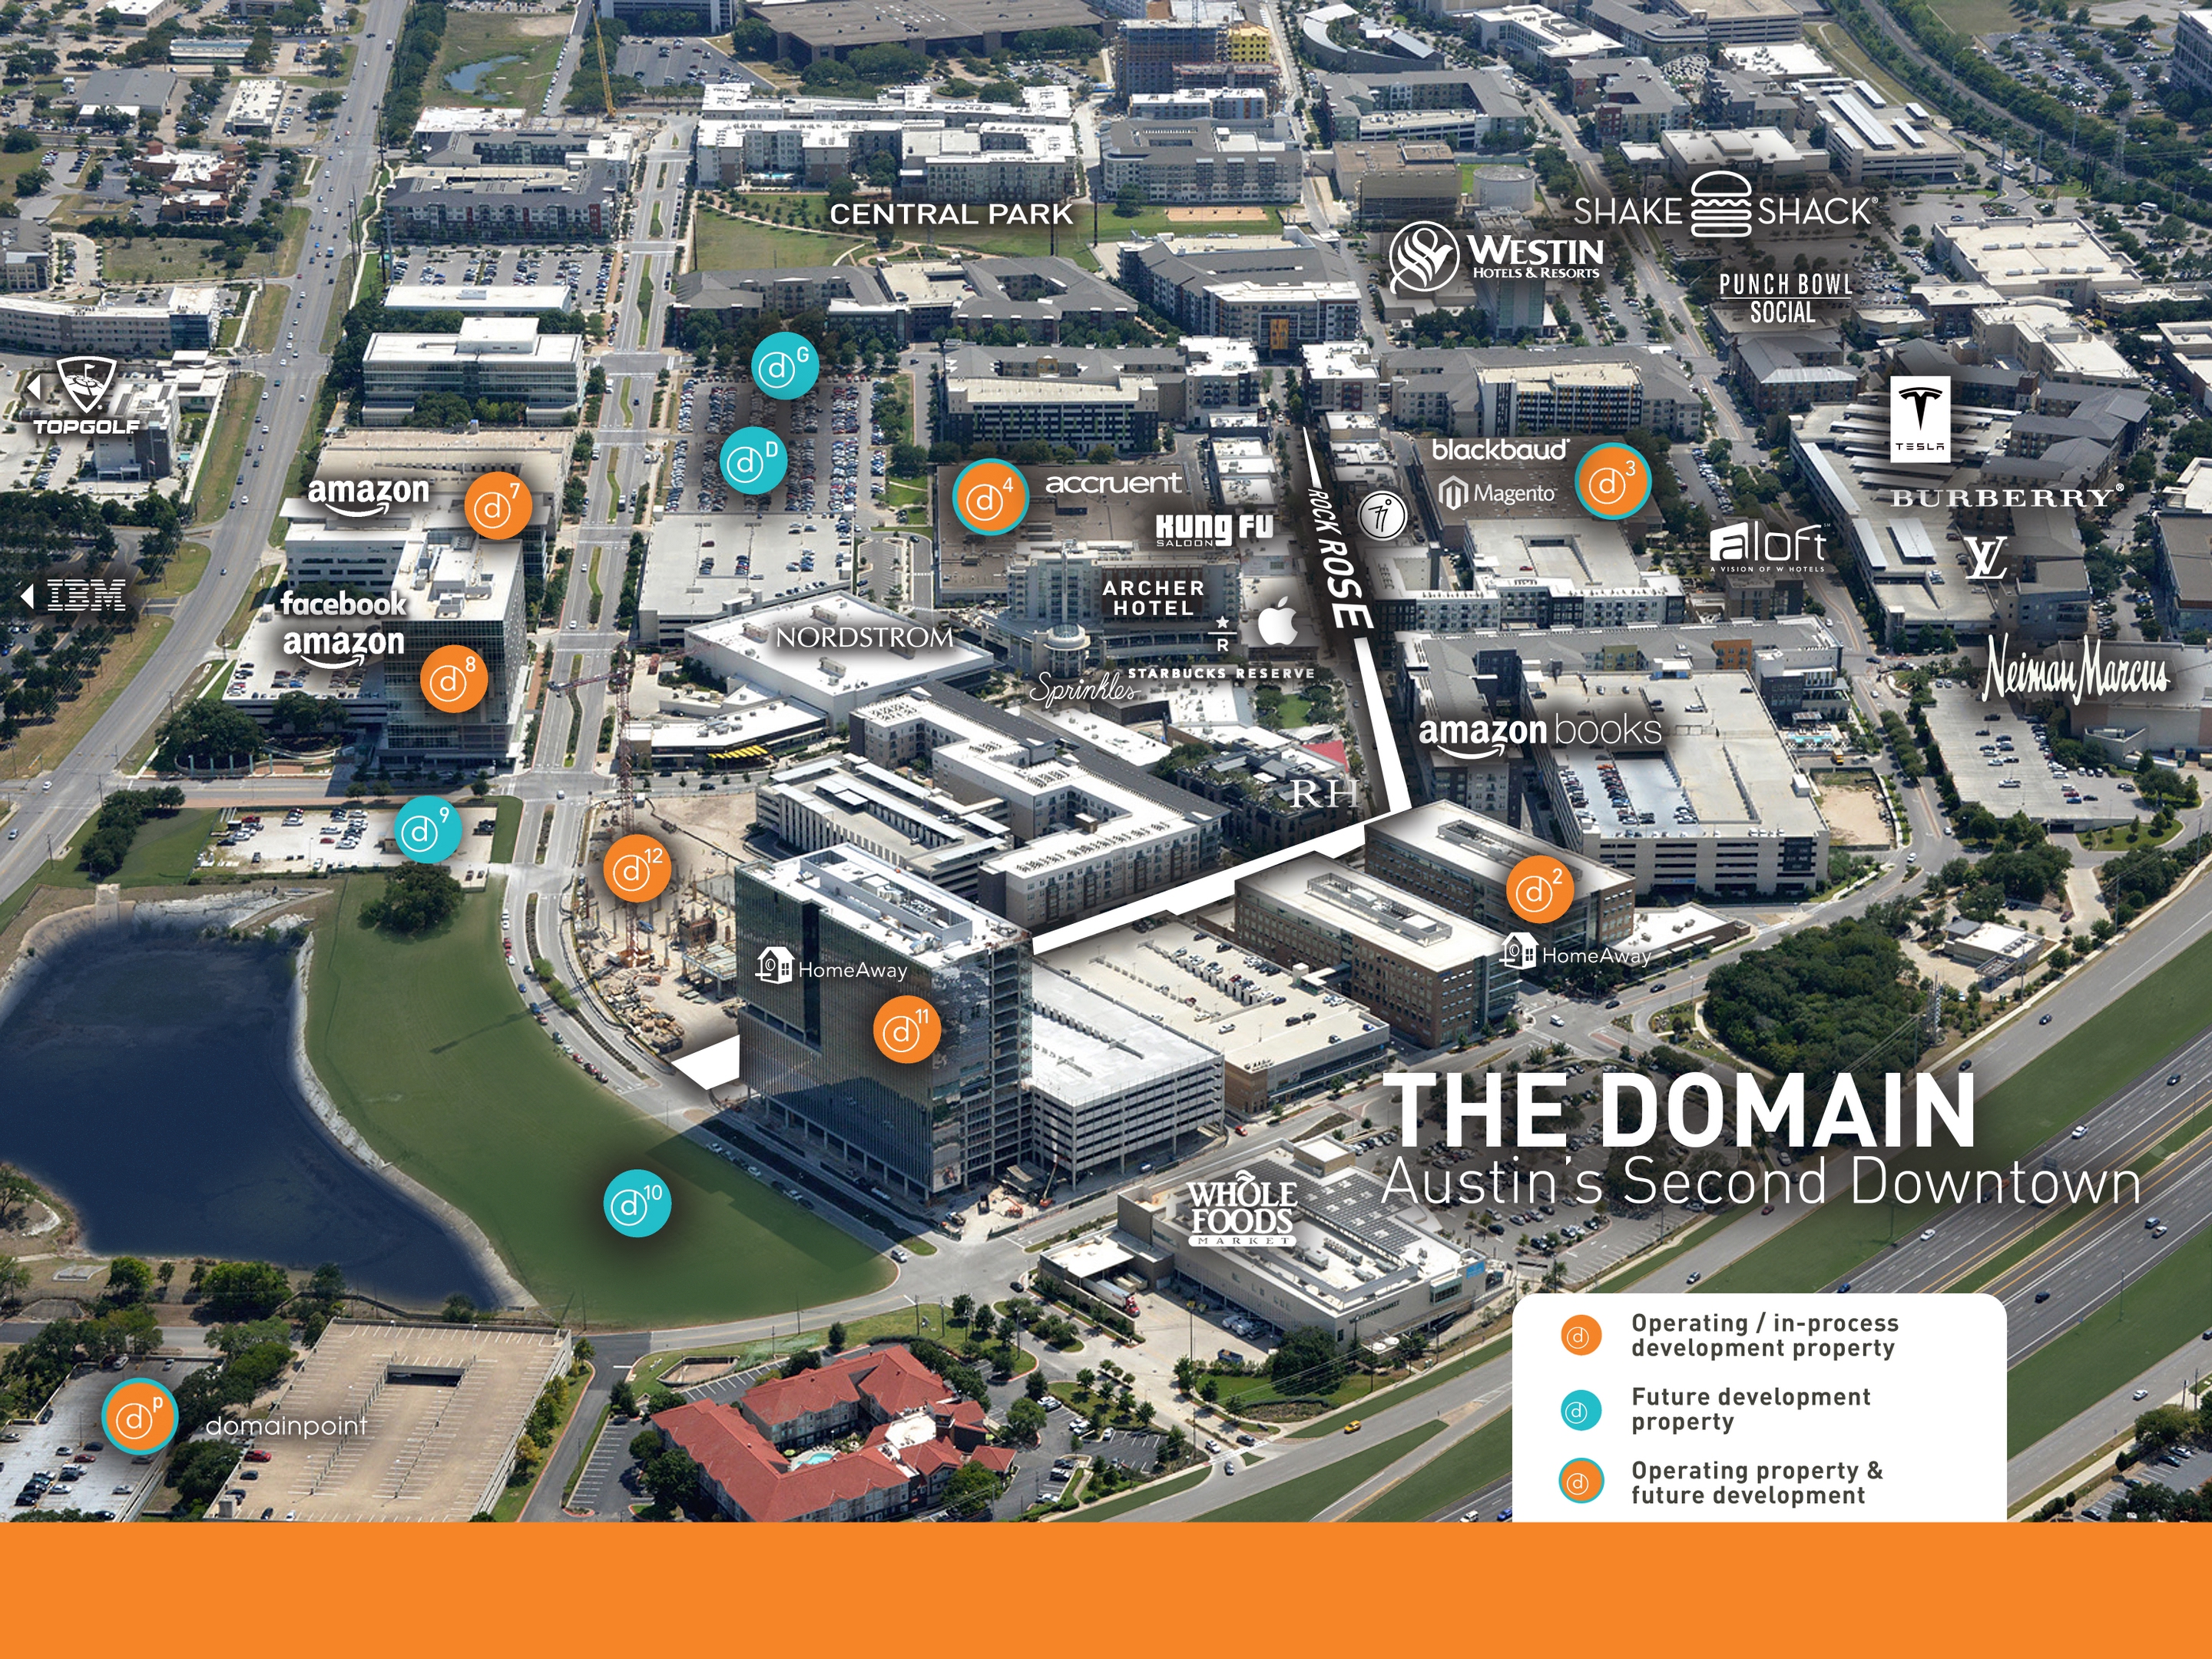
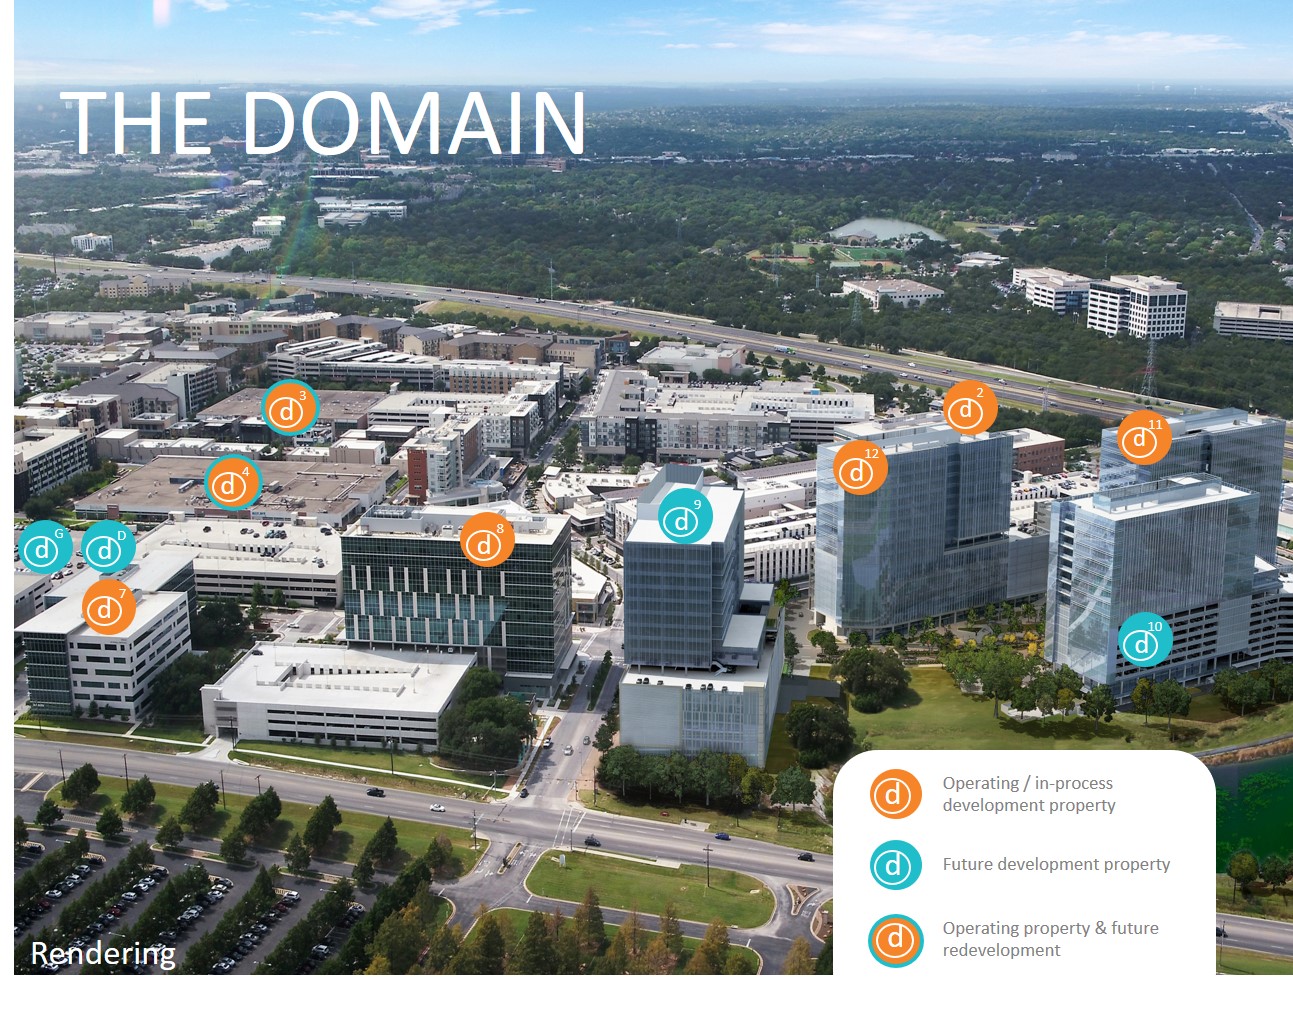
As of September 30, 2018, we owned interests in 18 operating office properties with approximately 6.7 million rentable square feet and three development properties that will consist of approximately 989,000 rentable square feet. As of September 30, 2018, our operating properties are located in six markets throughout the United States.
|
| | |
| Board of Directors | | Executive Officers and Senior Management |
| Richard I. Gilchrist | | Scott W. Fordham |
| Chairman of the Board and Independent Director | | Chief Executive Officer and Director |
| | | |
| Scott W. Fordham | | Dallas E. Lucas |
| Chief Executive Officer and Director | | President and Chief Operating Officer |
| | | |
| R. Kent Griffin, Jr. | | James E. Sharp |
| Independent Director | | Chief Financial Officer and Treasurer |
| | | |
| Thomas M. Herzog | | William J. Reister |
| Independent Director | | Chief Investment Officer and Executive Vice President |
| | | |
| Dennis J. Martin | | Telisa Webb Schelin |
| Independent Director | | Chief Legal Officer, Executive Vice President, and Secretary |
| | | |
| Gregory J. Whyte | | Hannah Q. Wrenn |
| Independent Director | | Chief Accounting Officer |
| | | |
| | | R. Heath Johnson |
| | | Managing Director - Asset Management |
| | | |
| | | Dean R. Hook |
| | | Senior Vice President - Information Technology and Property Management |
| | |
| | | |
|
| | | | | | |
| Company Information | | |
| Corporate Headquarters | | Website | | Trading Information | | Investor inquiries should be directed to: |
| 5950 Sherry Lane, Suite 700 | | www.tierreit.com | | Trading Symbol: TIER | | Scott A. McLaughlin |
| Dallas, Texas 75225 | | | | New York Stock Exchange | | Senior Vice President - Investor Relations |
| | | | | | | at 972.483.2400 or ir@tierreit.com |
| | | | | | | |
| | | | | | | |
|
| | | | | | | | |
| Research Coverage | | | | | | |
| BMO Capital | | Janney Montgomery Scott | | JMP Securities | | J.P. Morgan Securities | | Robert W. Baird & Co. |
| John Kim | | Robert Stevenson | | Mitch Germain | | Anthony Paolone | | David Rodgers |
| 212.885.4115 | | 646.840.3217 | | 212.906.3546 | | 212.622.6682 | | 216.737.7341 |
Supplemental Operating and Financial Data
For the Quarter Ended September 30, 2018
Table of Contents
|
| | |
| Overview and Highlights | |
| Overview | 1 |
|
| Financial Highlights | 2-3 |
|
| Consolidated Balance Sheets | 4 |
|
| Consolidated Statements of Operations | 5 |
|
| Calculations of FFO and Additional Information | 6 |
|
| Calculations of EBITDAre | 7 |
|
| Unconsolidated Entities Financial Summary | 8 |
|
| Same Store Analysis | 9 |
|
| Schedule of Properties Owned | 10 |
|
| Portfolio Analysis | 11 |
|
| Components of Net Asset Value | 12 |
|
| Significant Tenants | 13 |
|
| Industry Diversification | 14 |
|
| | |
| Leasing | |
| Leasing Activity | 15-16 |
|
| Lease Expirations | 17-18 |
|
| Occupancy Trends | 19 |
|
| | |
| Capital Expenditures | |
| Leasing Cost Summary | 20 |
|
| Development, Leasing, and Capital Expenditures Summary | 21 |
|
| | |
| Other Information | |
| Potential Future Development and Redevelopment Sites | 22 |
|
| Summary of Development Activity | 23 |
|
| Properties Under Development | 24-27 |
|
| Acquisition and Disposition Activities | 28 |
|
| Summary of Financing | 29 |
|
| Principal Payments by Year | 30 |
|
| Definitions of Non-GAAP Financial Measures | 31-32 |
|
Forward-Looking Statements
This supplemental operating and financial data report contains forward-looking statements within the meaning of the federal securities laws relating to the business and financial outlook of TIER REIT, Inc. that are based on current expectations, estimates, forecasts, and projections and are not guarantees of future performance. Statements contained herein may be impacted by a number of risks and uncertainties, including the company’s ability to rent space on favorable terms, its ability to address debt maturities and fund its capital requirements, its intentions to acquire, develop, or sell certain properties, the value of its assets, its anticipated capital expenditures, and other matters. Words such as “may,” "will," “anticipates,” “expects,” “intends,” “plans,” “believes,” “seeks,” “estimates,” “outlook,” “would,” “could,” “should,” “objectives,” “strategies,” “opportunities,” “goals,” “position,” “future,” “vision,” “mission,” “strive,” “project” and variations of these words and similar expressions are intended to identify forward-looking statements. Actual results may differ materially from those expressed in these forward-looking statements, and you should not place undue reliance on any such statements. A number of important factors could cause actual results to differ materially from the forward-looking statements contained in this document, as well as other factors described in the Risk Factors section of TIER REIT, Inc.’s Annual Report on Form 10-K for the year ended December 31, 2017. Forward-looking statements in this document speak only as of the date on which such statements were made, and we undertake no obligation to update any such statements that may become untrue because of subsequent events.
Overview
For the Quarter Ended September 30, 2018
| |
| • | Occupancy at September 30, 2018, was 90.1%, reflecting an increase of 70 basis points from June 30, 2018. |
| |
| • | 120,000 square feet leased - 26,000 square feet of renewals, 19,000 square feet of expansions, and 75,000 square feet of new leasing. |
| |
| • | During the third quarter of 2018, we received $0.7 million in business interruption insurance proceeds related to rent abatements provided in previous periods as a result of Hurricane Harvey. We anticipate we will receive additional business interruption insurance proceeds in subsequent quarters. |
| |
| • | Plaza at MetroCenter was held for sale as of September 30, 2018, and was sold on October 31, 2018, for a contract purchase price of $51.3 million. |
| |
| • | During the third quarter of 2018, we pre-leased 100% of Domain 12. Domain 12 is a development property containing 320,000 rentable square feet located in Austin, Texas. |
| |
| • | On August 3, 2018, our board of directors authorized a distribution of $0.18 per share of common stock for the third quarter of 2018, that was paid on September 28, 2018. |
| |
| • | On August 15, 2018, we entered into three forward interest rate swaps for a combined notional value of $250.0 million with a maturity date of December 31, 2024. These become effective on October 31, 2019, upon the maturity of two of our outstanding interest rate swaps with a combined notional value of $250.0 million. |
| |
| • | On August 21, 2018, we paid off the $89.7 million loan secured by Domain 8 without penalty. The loan was scheduled to mature in June 2020. |
| |
| • | On August 27, 2018, ownership of Fifth Third Center, located in Columbus, Ohio, was conveyed to the associated lender pursuant to a foreclosure. The transaction was accounted for as a full settlement of the outstanding debt and related interest. As a result, we recognized a gain on troubled debt restructuring of $31.0 million. We recorded an asset impairment loss of $3.4 million related to the disposition of the property. |
| |
| • | In August 2018, we established an additional $125.0 million ATM program for a total of $250.0 million when combined with our May 2017 ATM Program. During the three months ended September 30, 2018, we issued 4,916,095 shares of common stock under our ATM Programs, for proceeds of $114.1 million, net of commissions and issuance costs. Subsequent to September 30, 2018, we issued 130,172 additional shares for net proceeds of $3.1 million, resulting in total net proceeds for the year of $138.0 million. |
| |
| • | Development on Domain 10 commenced in October 2018. Domain 10 will contain 300,000 rentable square feet and is located in Austin, Texas, adjacent to our other Domain properties. |
| |
| • | On November 2, 2018, our board of directors authorized a distribution of $0.18 per share of common stock for the fourth quarter of 2018, that will be paid on December 27, 2018. |
|
| | |
Supplemental Operating and Financial Data | | 3Q’18 Page 1 |
|
| | | | | | | | | | | | | | | | | | | | | | | | | | | | |
| Financial Highlights |
| (in thousands, except per share data, effective rent data, percentages, and number of properties) |
| | | | | | | | | | | | | | | |
| | 30-Sep-18 | | 30-Sep-17 | | | 30-Sep-18 | | 30-Jun-18 | | 31-Mar-18 | | 31-Dec-17 | | 30-Sep-17 |
| Portfolio Summary: | | | | | | | | | | | | | | |
| Total operating office properties | 18 |
| | 20 |
| | | 18 |
| | 18 |
| | 18 |
| | 20 |
| | 20 |
|
| Rentable square feet (100%) (operating properties) | 6,657 |
| | 7,405 |
| | | 6,657 |
| | 6,657 |
| | 6,657 |
| | 7,405 |
| | 7,405 |
|
| Rentable square feet (own %) (operating properties) | 6,633 |
| | 7,260 |
| | | 6,633 |
| | 6,633 |
| | 6,633 |
| | 7,260 |
| | 7,260 |
|
| Occupancy % | 90.1 | % | | 88.3 | % | | | 90.1 | % | | 89.4 | % | | 89.4 | % | | 89.1 | % | | 88.3 | % |
| Executed % SF leased | 90.4 | % | | 89.0 | % | | | 90.4 | % | | 89.8 | % | | 89.6 | % | | 89.7 | % | | 89.0 | % |
| Economic % SF leased | 86.2 | % | | 82.4 | % | | | 86.2 | % | | 85.3 | % | | 86.1 | % | | 84.4 | % | | 82.4 | % |
| Average effective rent/square foot | $ | 32.89 |
| | $ | 29.58 |
| | | $ | 32.89 |
| | $ | 32.60 |
| | $ | 32.55 |
| | $ | 30.33 |
| | $ | 29.58 |
|
| | | | | | | | | | | | | | | |
| | Nine Months Ended | | | Three Months Ended |
| | 30-Sep-18 | | 30-Sep-17 | | | 30-Sep-18 | | 30-Jun-18 | | 31-Mar-18 | | 31-Dec-17 | | 30-Sep-17 |
| Financial Results: | | | | | | | | | | | | | | |
| Revenue | $ | 162,965 |
| | $ | 161,835 |
| | | $ | 54,832 |
| | $ | 53,990 |
| | $ | 54,143 |
| | $ | 54,626 |
| | $ | 50,920 |
|
| Property related expenses | (38,812 | ) | | (41,790 | ) | | | (13,262 | ) | | (12,395 | ) | | (13,155 | ) | | (14,131 | ) | | (13,170 | ) |
| Real estate taxes | (27,057 | ) | | (25,752 | ) | | | (9,229 | ) | | (9,074 | ) | | (8,754 | ) | | (8,512 | ) | | (8,439 | ) |
| Property management fees | (262 | ) | | (181 | ) | | | (80 | ) | | (97 | ) | | (85 | ) | | (51 | ) | | (49 | ) |
| NOI | $ | 96,834 |
| | $ | 94,112 |
| | | $ | 32,261 |
| | $ | 32,424 |
| | $ | 32,149 |
| | $ | 31,932 |
| | $ | 29,262 |
|
| Base rent | $ | 106,433 |
| | $ | 116,002 |
| | | $ | 35,759 |
| | $ | 35,556 |
| | $ | 35,118 |
| | $ | 34,122 |
| | $ | 36,002 |
|
| Free rent | $ | (4,298 | ) | | $ | (8,040 | ) | | | $ | (1,218 | ) | | $ | (1,776 | ) | | $ | (1,304 | ) | | $ | (1,570 | ) | | $ | (2,288 | ) |
| Net income (loss) attributable to common stockholders | $ | 22,758 |
| | $ | 94,161 |
| | | $ | 22,645 |
| | $ | (8,277 | ) | | $ | 8,390 |
| | $ | (9,875 | ) | | $ | (8,041 | ) |
| Diluted income (loss) per common share (1) | $ | 0.46 |
| | $ | 1.95 |
| | | $ | 0.43 |
| | $ | (0.17 | ) | | $ | 0.17 |
| | $ | (0.21 | ) | | $ | (0.17 | ) |
| FFO attributable to common stockholders | $ | 79,371 |
| | $ | 52,918 |
| | | $ | 50,678 |
| | $ | 18,804 |
| | $ | 9,889 |
| | $ | 19,020 |
| | $ | 15,885 |
|
| Diluted FFO per common share | $ | 1.59 |
| | $ | 1.10 |
| | | $ | 0.96 |
| | $ | 0.39 |
| | $ | 0.20 |
| | $ | 0.39 |
| | $ | 0.33 |
|
| FFO attributable to common stockholders, excluding certain items | $ | 59,085 |
| | $ | 55,748 |
| | | $ | 20,070 |
| | $ | 19,521 |
| | $ | 19,494 |
| | $ | 19,374 |
| | $ | 16,508 |
|
| Diluted FFO, excluding certain items, per common share | $ | 1.18 |
| | $ | 1.16 |
| | | $ | 0.38 |
| | $ | 0.40 |
| | $ | 0.40 |
| | $ | 0.40 |
| | $ | 0.34 |
|
| Adjusted EBITDAre | $ | 82,969 |
| | $ | 81,865 |
| | | $ | 26,407 |
| | $ | 28,359 |
| | $ | 28,203 |
| | $ | 26,321 |
| | $ | 26,181 |
|
| | | | | | | | | | | | | | | |
| Weighted average common shares outstanding - basic | 49,092 |
| | 47,532 |
| | | 51,900 |
| | 47,684 |
| | 47,645 |
| | 47,554 |
| | 47,550 |
|
| Weighted average common shares outstanding - diluted | 49,950 |
| | 47,956 |
| | | 52,617 |
| | 48,534 |
| | 48,300 |
| | 48,207 |
| | 48,160 |
|
| | | | | | | | | | | | | | | |
| Selected Additional Trend Information: | | | | | | | | | | | | | | |
| Renewal % based on square feet | 67 | % | | 73 | % | | | 61 | % | | 74 | % | | 64 | % | | 30 | % | | 83 | % |
| Distributions declared on common shares | $ | 26,925 |
| | $ | 25,829 |
| | | $ | 9,671 |
| | $ | 8,628 |
| | $ | 8,626 |
| | $ | 8,612 |
| | $ | 8,612 |
|
| Annualized distribution yield (2) | 3.0 | % | | 3.7 | % | | | 3.0 | % | | 3.0 | % | | 3.9 | % | | 3.5 | % | | 3.7 | % |
_______________________________
(1) In periods of net loss from continuing operations there are no dilutive securities and diluted loss per common share is calculated using weighted average common shares outstanding - basic as the denominator.
(2) Based on the closing price of our common stock as of the last day of the associated period.
Notes:
Occupancy % represents the total square footage subject to commenced leases as of the reporting date as a percentage of the total rentable square feet (at our ownership interest).
Executed % SF leased represents the total square footage subject to commenced leases plus the square footage for currently vacant space that is subject to executed leases that have not commenced as of the reporting date as a percentage of the total rentable square feet (at our ownership interest).
Economic % SF leased represents the total square footage subject to commenced leases as of the reporting date adjusted to exclude the square footage associated with leases receiving rental abatements as a percentage of the total rentable square feet (at our ownership interest).
Average effective rent represents 12 times the sum of the monthly contractual amounts for base rent and the pro rata budgeted operating expense reimbursements, as of period end, related to leases in place as of period end, as reduced for free rent and excluding any scheduled future rent increases, as adjusted for our ownership interest, divided by the total square footage under commenced leases at period end.
This section includes non-GAAP financial measures, which are accompanied by what we consider the most directly comparable financial measures calculated and presented in accordance with accounting principles generally accepted in the United States (“GAAP”). Quantitative reconciliations of the differences between the non-GAAP financial measures presented and the most directly comparable GAAP financial measures are shown on pages 6-7. A description of the non-GAAP financial measures we present and a statement of the reasons why management believes the non-GAAP measures provide useful information to investors about the Company’s financial condition and results of operations can be found on pages 31-32.
|
| | |
Supplemental Operating and Financial Data | | 3Q’18 Page 2 |
|
| | | | | | | | | | | | | | | | | | | | | | | | | | | | |
| Financial Highlights (continued) |
| (in thousands, except stock prices, percentages, and ratios) |
| | | | | | | |
| | 30-Sep-18 | | 30-Sep-17 | | | 30-Sep-18 | | 30-Jun-18 | | 31-Mar-18 | | 31-Dec-17 | | 30-Sep-17 |
| Selected Balance Sheet Items: | | | | | | | | | | | | | | |
| | | | | | | | | | | | | | | |
| Total book value of real estate | $ | 1,386,255 |
| | $ | 1,325,536 |
| | | $ | 1,386,255 |
| | $ | 1,434,814 |
| | $ | 1,430,355 |
| | $ | 1,275,953 |
| | $ | 1,325,536 |
|
| | | | | | | | | | | | | | | |
| Cash and cash equivalents | $ | 5,192 |
| | $ | 10,959 |
| | | $ | 5,192 |
| | $ | 8,359 |
| | $ | 10,183 |
| | $ | 13,800 |
| | $ | 10,959 |
|
| | | | | | | | | | | | | | | |
Unconsolidated cash and cash equivalents (at ownership %) | $ | 550 |
| | $ | 2,495 |
| | | $ | 550 |
| | $ | 327 |
| | $ | 282 |
| | $ | 1,435 |
| | $ | 2,495 |
|
| | | | | | | | | | | | | | | |
| Restricted cash | $ | 10,232 |
| | $ | 13,323 |
| | | $ | 10,232 |
| | $ | 14,086 |
| | $ | 12,565 |
| | $ | 8,510 |
| | $ | 13,323 |
|
| | | | | | | | | | | | | | | |
| Total assets | $ | 1,662,342 |
| | $ | 1,581,288 |
| | | $ | 1,662,342 |
| | $ | 1,696,121 |
| | $ | 1,688,999 |
| | $ | 1,581,138 |
| | $ | 1,581,288 |
|
| | | | | | | | | | | | | | | |
| Mortgage debt | $ | 142,162 |
| | $ | 191,694 |
| | | $ | 142,162 |
| | $ | 280,311 |
| | $ | 280,689 |
| | $ | 191,339 |
| | $ | 191,694 |
|
| | | | | | | | | | | | | | | |
| Revolving credit facility and term loans | $ | 591,000 |
| | $ | 598,000 |
| | | $ | 591,000 |
| | $ | 608,000 |
| | $ | 612,000 |
| | $ | 610,000 |
| | $ | 598,000 |
|
| | | | | | | | | | | | | | | |
| Unconsolidated debt (at ownership %) | $ | 26,137 |
| | $ | 43,572 |
| | | $ | 26,137 |
| | $ | 21,248 |
| | $ | 16,239 |
| | $ | 52,377 |
| | $ | 43,572 |
|
| | | | | | | | | | | | | | | |
| Total liabilities | $ | 836,797 |
| | $ | 889,465 |
| | | $ | 836,797 |
| | $ | 1,001,531 |
| | $ | 1,001,439 |
| | $ | 903,567 |
| | $ | 889,465 |
|
| | | | | | | | | | | | | | | |
| Capitalization: | | | | | | | | | | | | | | |
| | | | | | | | | | | | | | | |
| Shares of common stock outstanding | 53,491 |
| | 47,552 |
| | | 53,491 |
| | 48,575 |
| | 47,656 |
| | 47,623 |
| | 47,552 |
|
| | | | | | | | | | | | | | | |
| Restricted stock units outstanding | 351 |
| | 228 |
| | | 351 |
| | 351 |
| | 356 |
| | 228 |
| | 228 |
|
| | | | | | | | | | | | | | | |
| Shares of restricted stock outstanding | 260 |
| | 291 |
| | | 260 |
| | 260 |
| | 265 |
| | 181 |
| | 291 |
|
| | | | | | | | | | | | | | | |
| | 54,102 |
| | 48,071 |
| | | 54,102 |
| | 49,186 |
| | 48,277 |
| | 48,032 |
| | 48,071 |
|
| | | | | | | | | | | | | | | |
| High stock price | $ | 24.98 |
| | $ | 19.50 |
| | | $ | 24.98 |
| | $ | 24.22 |
| | $ | 20.51 |
| | $ | 20.72 |
| | $ | 19.50 |
|
| | | | | | | | | | | | | | | |
| Low stock price | $ | 17.04 |
| | $ | 15.96 |
| | | $ | 22.66 |
| | $ | 18.06 |
| | $ | 17.04 |
| | $ | 18.83 |
| | $ | 16.67 |
|
| | | | | | | | | | | | | | | |
| Average closing stock price | $ | 21.18 |
| | $ | 17.81 |
| | | $ | 23.67 |
| | $ | 20.81 |
| | $ | 19.01 |
| | $ | 19.71 |
| | $ | 18.39 |
|
| | | | | | | | | | | | | | | |
| Closing stock price | $ | 24.10 |
| | $ | 19.30 |
| | | $ | 24.10 |
| | $ | 23.78 |
| | $ | 18.48 |
| | $ | 20.39 |
| | $ | 19.30 |
|
| | | | | | | | | | | | | | | |
| Market capitalization (1) | $ | 1,303,858 |
| | $ | 927,770 |
| | | $ | 1,303,858 |
| | $ | 1,169,643 |
| | $ | 892,159 |
| | $ | 979,372 |
| | $ | 927,770 |
|
| | | | | | | | | | | | | | | |
| Total debt (2) | $ | 759,299 |
| | $ | 833,266 |
| | | $ | 759,299 |
| | $ | 909,559 |
| | $ | 908,928 |
| | $ | 853,716 |
| | $ | 833,266 |
|
| | | | | | | | | | | | | | | |
| Net debt (3) | $ | 753,557 |
| | $ | 819,812 |
| | | $ | 753,557 |
| | $ | 900,873 |
| | $ | 898,463 |
| | $ | 838,481 |
| | $ | 819,812 |
|
| | | | | | | | | | | | | | | |
| Total capitalization | $ | 2,063,157 |
| | $ | 1,761,036 |
| | | $ | 2,063,157 |
| | $ | 2,079,202 |
| | $ | 1,801,087 |
| | $ | 1,833,088 |
| | $ | 1,761,036 |
|
| | | | | | | | | | | | | | | |
| | | | | | | | | | | | | | | |
| | Nine Months Ended | | | Three Months Ended |
| | 30-Sep-18 | | 30-Sep-17 | | | 30-Sep-18 | | 30-Jun-18 | | 31-Mar-18 | | 31-Dec-17 | | 30-Sep-17 |
| Ratios: | | | | | | | | | | | | | | |
| | | | | | | | | | | | | | | |
| NOI margin % (4) | 59.4 | % | | 58.2 | % | | | 58.8 | % | | 60.1 | % | | 59.4 | % | | 58.5 | % | | 57.5 | % |
| | | | | | | | | | | | | | | |
| Normalized fixed charge coverage (5) | 3.02 |
| | 2.99 |
| | | 3.06 |
| | 3.00 |
| | 3.00 |
| | 2.83 |
| | 2.86 |
|
| | | | | | | | | | | | | | | |
| Normalized interest coverage (5) | 3.13 |
| | 3.12 |
| | | 3.14 |
| | 3.12 |
| | 3.13 |
| | 2.94 |
| | 2.97 |
|
| | | | | | | | | | | | | | | |
| Net debt/adjusted annualized estimated full period EBITDAre from properties owned at period end (5) | N/A |
| | N/A |
| | | 7.15x |
| | 7.94x |
| | 8.34x |
| | 7.96x |
| | 7.83x |
|
| | | | | | | | | | | | | | | |
| Net debt/adjusted annualized estimated full period EBITDAre from properties owned at period end, including development properties (5) (6) | N/A |
| | N/A |
| | | 6.22x |
| | 7.13x |
| | 7.67x |
| | 7.47x |
| | 7.45x |
|
| | | | | | | | | | | | | | | |
| |
| (1) Market capitalization is equal to outstanding shares (common stock, restricted stock, and restricted stock units, as if converted) times the closing price of our common stock as of the last day of the associated period. |
| (2) Includes book value of mortgage debt, the revolving credit facility and term loans, and unconsolidated debt (at ownership %). |
| (3) Total debt less cash and cash equivalents and unconsolidated cash and cash equivalents (at ownership %). |
| (4) NOI margin % is equal to NOI divided by revenue. |
| (5) See page 7 for more detailed information. |
| (6) Includes estimated stabilized NOI for development properties, to the extent of percentage of completion of the respective developments based on spend to date. |
|
| | |
Supplemental Operating and Financial Data | | 3Q’18 Page 3 |
|
| | | | | | | | | | | | | | | | | | | | | | | |
| Consolidated Balance Sheets |
| (in thousands, except share and per share data) |
| | | | | | | | | | | | | | |
| | | | | | | | | | | | | | |
| | | | | | 30-Sep-18 | | 30-Jun-18 | | 31-Mar-18 | | 31-Dec-17 | | 30-Sep-17 |
| Assets | | | | | | | | | | | |
| | Real estate | | | | | | | | | | |
| | Land | | $ | 150,473 |
| | $ | 156,517 |
| | $ | 156,577 |
| | $ | 139,951 |
| | $ | 140,959 |
|
| | Land held for development | | 45,059 |
| | 45,059 |
| | 45,059 |
| | 45,059 |
| | 45,059 |
|
| | Buildings and improvements, net | | 1,097,613 |
| | 1,160,273 |
| | 1,177,433 |
| | 1,061,418 |
| | 1,122,072 |
|
| | Real estate under development | | 93,110 |
| | 72,965 |
| | 51,286 |
| | 29,525 |
| | 17,446 |
|
| | Total real estate | | 1,386,255 |
| | 1,434,814 |
| | 1,430,355 |
| | 1,275,953 |
| | 1,325,536 |
|
| | | | | | | | | | | | |
| | Cash and cash equivalents | | 5,192 |
| | 8,359 |
| | 10,183 |
| | 13,800 |
| | 10,959 |
|
| | Restricted cash | | 10,232 |
| | 14,086 |
| | 12,565 |
| | 8,510 |
| | 13,323 |
|
| | Accounts receivable, net | | 69,592 |
| | 80,755 |
| | 76,385 |
| | 81,129 |
| | 82,737 |
|
| | Prepaid expenses and other assets | | 19,357 |
| | 17,124 |
| | 14,238 |
| | 28,112 |
| | 20,115 |
|
| | Investments in unconsolidated entities | | 32,112 |
| | 31,714 |
| | 31,314 |
| | 31,852 |
| | 33,977 |
|
| | Deferred financing fees, net | | 2,985 |
| | 3,211 |
| | 3,426 |
| | 1,387 |
| | 1,735 |
|
| | Acquired above-market leases, net | | 20 |
| | 180 |
| | 288 |
| | 419 |
| | 543 |
|
| | Other lease intangibles, net | | 103,511 |
| | 105,878 |
| | 110,245 |
| | 86,628 |
| | 90,547 |
|
| | Other intangible assets, net | | — |
| | — |
| | — |
| | — |
| | 1,816 |
|
| | Assets associated with real estate held for sale | | 33,086 |
| | — |
| | — |
| | 53,348 |
| | — |
|
| Total assets | | $ | 1,662,342 |
| | $ | 1,696,121 |
| | $ | 1,688,999 |
| | $ | 1,581,138 |
| | $ | 1,581,288 |
|
| | | | | | | | | | | | | | |
| Liabilities and equity | | | | | | | | | | |
| | | | | | | | | | | | | | |
| Liabilities | | | | | | | | | | | |
| | Mortgage debt | | $ | 142,162 |
| | $ | 280,311 |
| | $ | 280,689 |
| | $ | 191,339 |
| | $ | 191,694 |
|
| | Unsecured term loans | | 575,000 |
| | 575,000 |
| | 575,000 |
| | 575,000 |
| | 575,000 |
|
| | Unsecured revolving credit facility | | 16,000 |
| | 33,000 |
| | 37,000 |
| | 35,000 |
| | 23,000 |
|
| | Unamortized debt issuance costs | | (2,029 | ) | | (2,051 | ) | | (2,156 | ) | | (6,801 | ) | | (7,308 | ) |
| | Total notes payable, net | | 731,133 |
| | 886,260 |
| | 890,533 |
| | 794,538 |
| | 782,386 |
|
| | | | | | | | | | | | | | |
| | Accounts payable and accrued liabilities | | 74,560 |
| | 82,816 |
| | 76,144 |
| | 81,166 |
| | 78,174 |
|
| | Acquired below-market leases, net | | 24,312 |
| | 25,910 |
| | 27,684 |
| | 17,942 |
| | 19,462 |
|
| | Other liabilities | | 6,471 |
| | 6,545 |
| | 7,078 |
| | 7,567 |
| | 9,443 |
|
| | Obligations associated with real estate held for sale | | 321 |
| | — |
| | — |
| | 2,354 |
| | — |
|
| Total liabilities | | 836,797 |
| | 1,001,531 |
| | 1,001,439 |
| | 903,567 |
| | 889,465 |
|
| Commitments and contingencies | | | | | | | | | | |
| | | | | | | | | | | |
| Equity | | | | | | | | | | |
| | Preferred stock | | — |
| | — |
| | — |
| | — |
| | — |
|
| | Convertible stock | | — |
| | — |
| | — |
| | — |
| | — |
|
| | Common stock | | 5 |
| | 5 |
| | 5 |
| | 5 |
| | 5 |
|
| | Additional paid-in capital | | 2,747,825 |
| | 2,632,635 |
| | 2,610,288 |
| | 2,609,540 |
| | 2,609,361 |
|
| | Cumulative distributions and net loss attributable to common stockholders | | (1,940,492 | ) | | (1,953,466 | ) | | (1,936,561 | ) | | (1,936,960 | ) | | (1,918,473 | ) |
| | Accumulated other comprehensive income | | 15,262 |
| | 12,462 |
| | 10,479 |
| | 4,218 |
| | 257 |
|
| | Stockholders’ equity | | 822,600 |
| | 691,636 |
| | 684,211 |
| | 676,803 |
| | 691,150 |
|
| | Noncontrolling interests | | 2,945 |
| | 2,954 |
| | 3,349 |
| | 768 |
| | 673 |
|
| Total equity | | 825,545 |
| | 694,590 |
| | 687,560 |
| | 677,571 |
| | 691,823 |
|
| Total liabilities and equity | | $ | 1,662,342 |
| | $ | 1,696,121 |
| | $ | 1,688,999 |
| | $ | 1,581,138 |
| | $ | 1,581,288 |
|
| | | | | | | | | | | | |
| Common stock, number of shares issued and outstanding | | 53,490,819 |
| | 48,574,724 |
| | 47,655,669 |
| | 47,623,324 |
| | 47,552,014 |
|
| | | | | | | | | | | | | | |
| |
| |
|
| | |
Supplemental Operating and Financial Data | | 3Q’18 Page 4 |
|
| | | | | | | | | | | | | | | | | | | | | | | | | | | | | |
| | Consolidated Statements of Operations |
| | (in thousands, except share and per share amounts) |
| | | | | | | | |
| | | | | | | | |
| | | Nine Months Ended | | | Three Months Ended |
| | | 30-Sep-18 | | 30-Sep-17 | | | 30-Sep-18 | | 30-Jun-18 | | 31-Mar-18 | | 31-Dec-17 | | 30-Sep-17 |
| Revenue | | | | | | | | | | | | | | |
| | Rental income | $ | 155,599 |
| | $ | 152,186 |
| | | $ | 52,570 |
| | $ | 51,088 |
| | $ | 51,941 |
| | $ | 52,362 |
| | $ | 47,333 |
|
| | Straight-line rent and lease incentive revenue | 1,906 |
| | 6,334 |
| | | 453 |
| | 862 |
| | 591 |
| | 978 |
| | 2,280 |
|
| | Above- and below-market rent amortization | 4,474 |
| | 2,863 |
| | | 1,533 |
| | 1,665 |
| | 1,276 |
| | 1,032 |
| | 1,075 |
|
| | Lease termination fees | 986 |
| | 452 |
| | | 276 |
| | 375 |
| | 335 |
| | 254 |
| | 232 |
|
| | Total revenue | 162,965 |
| | 161,835 |
| | | 54,832 |
| | 53,990 |
| | 54,143 |
| | 54,626 |
| | 50,920 |
|
| Expenses | | | | | | | | | | | | | | |
| | Property related expenses | 38,812 |
| | 41,790 |
| | | 13,262 |
| | 12,395 |
| | 13,155 |
| | 14,131 |
| | 13,170 |
|
| | Real estate taxes | 27,057 |
| | 25,752 |
| | | 9,229 |
| | 9,074 |
| | 8,754 |
| | 8,512 |
| | 8,439 |
|
| | Property management fees | 262 |
| | 181 |
| | | 80 |
| | 97 |
| | 85 |
| | 51 |
| | 49 |
|
| | Total property operating expenses | 66,131 |
| | 67,723 |
| | | 22,571 |
| | 21,566 |
| | 21,994 |
| | 22,694 |
| | 21,658 |
|
| | Interest expense | 22,498 |
| | 22,851 |
| | | 6,782 |
| | 8,011 |
| | 7,705 |
| | 7,534 |
| | 7,516 |
|
| | Interest rate hedge ineffectiveness expense (income) | — |
| | 9 |
| | | — |
| | — |
| | — |
| | (262 | ) | | 8 |
|
| | Amortization of deferred financing costs | 1,121 |
| | 2,561 |
| | | 359 |
| | 358 |
| | 404 |
| | 883 |
| | 882 |
|
| | Total interest expense | 23,619 |
| | 25,421 |
| | | 7,141 |
| | 8,369 |
| | 8,109 |
| | 8,155 |
| | 8,406 |
|
| | Asset impairment losses | 3,418 |
| | — |
| | | 3,418 |
| | — |
| | — |
| | 5,250 |
| | — |
|
| | General and administrative | 16,008 |
| | 16,490 |
| | | 5,128 |
| | 5,377 |
| | 5,503 |
| | 4,956 |
| | 5,157 |
|
| | Real estate depreciation and amortization | 76,281 |
| | 70,641 |
| | | 24,770 |
| | 27,011 |
| | 24,500 |
| | 23,655 |
| | 23,653 |
|
| | Depreciation and amortization - non-real estate assets | 303 |
| | 325 |
| | | 64 |
| | 123 |
| | 116 |
| | 133 |
| | 132 |
|
| | Total expenses | 185,760 |
| | 180,600 |
| | | 63,092 |
| | 62,446 |
| | 60,222 |
| | 64,843 |
| | 59,006 |
|
| | Interest and other income | 644 |
| | 1,271 |
| | | 49 |
| | 550 |
| | 45 |
| | 88 |
| | 170 |
|
| | Loss on early extinguishment of debt | (8,988 | ) | | (545 | ) | | | — |
| | — |
| | (8,988 | ) | | — |
| | — |
|
| | Gain on troubled debt restructuring | 31,006 |
| | — |
| | | 31,006 |
| | — |
| | — |
| | — |
| | — |
|
| Income (loss) before income taxes, equity in operations | | | | | | | | | | | | | | |
| | of investments, and gains (losses) | (133 | ) | | (18,039 | ) | | | 22,795 |
| | (7,906 | ) | | (15,022 | ) | | (10,129 | ) | | (7,916 | ) |
| | Provision for income taxes | (637 | ) | | (297 | ) | | | (228 | ) | | (214 | ) | | (195 | ) | | (171 | ) | | (202 | ) |
| | Equity in operations of investments | 287 |
| | 6,367 |
| | | — |
| | — |
| | 287 |
| | 32 |
| | 67 |
|
| Income (loss) before gains (losses) | (483 | ) | | (11,969 | ) | | | 22,567 |
| | (8,120 | ) | | (14,930 | ) | | (10,268 | ) | | (8,051 | ) |
| Gain (loss) on sale of assets | 11,924 |
| | 92,012 |
| | | — |
| | (90 | ) | | 12,014 |
| | 384 |
| | — |
|
| Gain (loss) on remeasurement of investment in unconsolidated entities | 11,090 |
| | 14,168 |
| | | — |
| | (152 | ) | | 11,242 |
| | — |
| | — |
|
| Net income (loss) | 22,531 |
| | 94,211 |
| | | 22,567 |
| | (8,362 | ) | | 8,326 |
| | (9,884 | ) | | (8,051 | ) |
| | Noncontrolling interests | 227 |
| | (50 | ) | | | 78 |
| | 85 |
| | 64 |
| | 9 |
| | 10 |
|
| Net income (loss) attributable to common stockholders | $ | 22,758 |
| | $ | 94,161 |
| | | $ | 22,645 |
| | $ | (8,277 | ) | | $ | 8,390 |
| | $ | (9,875 | ) | | $ | (8,041 | ) |
| | | | | | | | | | | | | | | |
| Weighted average common shares outstanding - basic | 49,091,962 |
| | 47,532,432 |
| | | 51,899,779 |
| | 47,684,152 |
| | 47,645,050 |
| | 47,553,564 |
| | 47,549,635 |
|
| Weighted average common shares outstanding - diluted (1) | 49,950,441 |
| | 47,956,167 |
| | | 52,616,570 |
| | 47,684,152 |
| | 48,299,882 |
| | 47,553,564 |
| | 47,549,635 |
|
| | | | | | | | | | | | | | | | |
| Basic income (loss) per common share | $ | 0.46 |
| | $ | 1.97 |
| | | $ | 0.43 |
| | $ | (0.17 | ) | | $ | 0.18 |
| | $ | (0.21 | ) | | $ | (0.17 | ) |
| Diluted income (loss) per common share (1) | $ | 0.46 |
| | $ | 1.95 |
| | | $ | 0.43 |
| | $ | (0.17 | ) | | $ | 0.17 |
| | $ | (0.21 | ) | | $ | (0.17 | ) |
| | | | | | | | | | | | | | | | |
| Distributions declared per common share | $ | 0.54 |
| | $ | 0.54 |
| | | $ | 0.18 |
| | $ | 0.18 |
| | $ | 0.18 |
| | $ | 0.18 |
| | $ | 0.18 |
|
| | | | | | | | | | | | | | | | |
| | | | | | | | | | | | | | | | |
| (1) | In periods of net loss there are no dilutive securities and diluted loss per common share is calculated using weighted average common shares outstanding - basic as the denominator. |
|
| | |
Supplemental Operating and Financial Data | | 3Q’18 Page 5 |
|
| | | | | | | | | | | | | | | | | | | | | | | | | | | | | |
| Calculations of FFO and Additional Information |
| (in thousands, except per share data) |
| | | | | | | | |
| | | | | | | | |
| | | Nine Months Ended | | | Three Months Ended |
| | 30-Sep-18 | | 30-Sep-17 | | | 30-Sep-18 | | 30-Jun-18 | | 31-Mar-18 | | 31-Dec-17 | | 30-Sep-17 |
| | | | | | | | | | | | | | | | |
| Net income (loss) | $ | 22,531 |
| | $ | 94,211 |
| | | $ | 22,567 |
| | $ | (8,362 | ) | | $ | 8,326 |
| | $ | (9,884 | ) | | $ | (8,051 | ) |
| Noncontrolling interests | 227 |
| | (50 | ) | | | 78 |
| | 85 |
| | 64 |
| | 9 |
| | 10 |
|
| Net income (loss) attributable to common stockholders | 22,758 |
| | 94,161 |
| | | 22,645 |
| | (8,277 | ) | | 8,390 |
| | (9,875 | ) | | (8,041 | ) |
| Adjustments (1): | | | | | | | | | | | | | | |
| | Real estate depreciation and amortization from consolidated properties | 76,281 |
| | 70,641 |
| | | 24,770 |
| | 27,011 |
| | 24,500 |
| | 23,655 |
| | 23,653 |
|
| | Real estate depreciation and amortization from unconsolidated properties | 391 |
| | 986 |
| | | — |
| | — |
| | 391 |
| | 391 |
| | 289 |
|
| | Real estate depreciation and amortization - noncontrolling interest | (1,759 | ) | | — |
| | | (544 | ) | | (782 | ) | | (433 | ) | | — |
| | — |
|
| | Impairment of depreciable real estate assets | 3,418 |
| | — |
| | | 3,418 |
| | — |
| | — |
| | 5,250 |
| | — |
|
| | Loss (gain) on sale of depreciable real estate | (11,924 | ) | | (98,725 | ) | | | — |
| | 90 |
| | (12,014 | ) | | (384 | ) | | — |
|
| | Loss (gain) on remeasurement of investment in unconsolidated entities | (11,090 | ) | | (14,168 | ) | | | — |
| | 152 |
| | (11,242 | ) | | — |
| | — |
|
| | Noncontrolling interests | 1,296 |
| | 23 |
| | | 389 |
| | 610 |
| | 297 |
| | (17 | ) | | (16 | ) |
| FFO attributable to common stockholders | 79,371 |
| | 52,918 |
| | | 50,678 |
| | 18,804 |
| | 9,889 |
| | 19,020 |
| | 15,885 |
|
| | | | | | | | | | | | | | | |
| Adjustments (1): | | | | | | | | | | | | | | |
| | Severance charges | 127 |
| | 451 |
| | | — |
| | 108 |
| | 19 |
| | — |
| | — |
|
| | Interest rate hedge ineffectiveness expense (income) (2) | — |
| | 9 |
| | | — |
| | — |
| | — |
| | (262 | ) | | 8 |
|
| | Loss on early extinguishment of debt | 8,988 |
| | 545 |
| | | — |
| | — |
| | 8,988 |
| | — |
| | — |
|
| | Gain on troubled debt restructuring | (31,006 | ) | | — |
| | | (31,006 | ) | | — |
| | — |
| | — |
| | — |
|
| | Default interest (3) | 1,599 |
| | 1,827 |
| | | 388 |
| | 609 |
| | 602 |
| | 616 |
| | 616 |
|
| | Noncontrolling interests | 6 |
| | (2 | ) | | | 10 |
| | — |
| | (4 | ) | | — |
| | (1 | ) |
| FFO attributable to common stockholders, excluding certain items | $ | 59,085 |
| | $ | 55,748 |
| | | $ | 20,070 |
| | $ | 19,521 |
| | $ | 19,494 |
| | $ | 19,374 |
| | $ | 16,508 |
|
| | | | | | | | | | | | | | | |
| Recurring capital expenditures (1) | $ | (11,781 | ) | | $ | (22,022 | ) | | | $ | (3,252 | ) | | $ | (2,337 | ) | | $ | (6,192 | ) | | $ | (6,109 | ) | | $ | (10,271 | ) |
| Straight-line rent adjustments (1) | $ | (3,283 | ) | | $ | (8,655 | ) | | | $ | (769 | ) | | $ | (1,165 | ) | | $ | (1,349 | ) | | $ | (2,088 | ) | | $ | (3,757 | ) |
| Above- and below-market rent amortization (1) | $ | (4,382 | ) | | $ | (2,865 | ) | | | $ | (1,503 | ) | | $ | (1,634 | ) | | $ | (1,245 | ) | | $ | (1,032 | ) | | $ | (1,075 | ) |
| Amortization of deferred financing costs (1) | $ | 1,153 |
| | $ | 2,724 |
| | | $ | 359 |
| | $ | 358 |
| | $ | 436 |
| | $ | 915 |
| | $ | 918 |
|
| Amortization of restricted shares and units | $ | 3,370 |
| | $ | 3,010 |
| | | $ | 1,206 |
| | $ | 1,164 |
| | $ | 1,000 |
| | $ | 1,071 |
| | $ | 1,077 |
|
| Depreciation and amortization - non-real estate assets | $ | 303 |
| | $ | 325 |
| | | $ | 64 |
| | $ | 123 |
| | $ | 116 |
| | $ | 133 |
| | $ | 132 |
|
| | | | | | | | | | | | | | | |
| Weighted average common shares outstanding - basic | 49,092 |
| | 47,532 |
| | | 51,900 |
| | 47,684 |
| | 47,645 |
| | 47,554 |
| | 47,550 |
|
| Weighted average common shares outstanding - diluted | 49,950 |
| | 47,956 |
| | | 52,617 |
| | 48,534 |
| | 48,300 |
| | 48,207 |
| | 48,160 |
|
| | | | | | | | | | | | | | | |
| Diluted FFO per common share | $ | 1.59 |
| | $ | 1.10 |
| | | $ | 0.96 |
| | $ | 0.39 |
| | $ | 0.20 |
| | $ | 0.39 |
| | $ | 0.33 |
|
| Diluted FFO, excluding certain items, per common share | $ | 1.18 |
| | $ | 1.16 |
| | | $ | 0.38 |
| | $ | 0.40 |
| | $ | 0.40 |
| | $ | 0.40 |
| | $ | 0.34 |
|
| | | | | | | | | | | | | | | | |
| We provided rent abatements to tenants at the Eldridge Properties as a result of Hurricane Harvey through the second quarter of 2018. These rent abatements were offset by business interruption insurance proceeds, net of a deductible and estimated saved expenses as detailed below: |
| Rent abatements | $ | (4,683 | ) | | $ | (1,921 | ) | | | $ | — |
| | $ | (775 | ) | | $ | (3,908 | ) | | $ | (5,116 | ) | | $ | (1,921 | ) |
| Business interruption insurance proceeds, net | $ | 4,414 |
| | $ | — |
| | | $ | 719 |
| | $ | 358 |
| | $ | 3,337 |
| | $ | 6,221 |
| | $ | — |
|
| | | | | | | | | | | | | | | | |
|
| | | | | | | | | | | | | | | |
| (1) Includes our pro rata share of consolidated and unconsolidated amounts, including for our period of ownership of properties sold. |
| (2) Interest rate swaps are adjusted to fair value through other comprehensive income (loss). However, because our interest rate swaps do not have a LIBOR floor while the hedged debt is subject to a LIBOR floor, the portion of the change in fair value of our interest rate swaps attributable to this mismatch is reclassified to interest rate hedge ineffectiveness expense (income) within “interest expense” on our consolidated statements of operations. We adopted new accounting guidance on January 1, 2018, that eliminates the requirement to separately measure and report hedge ineffectiveness expense (income). |
| (3) We had a non-recourse loan in default that subjected us to incur default interest at a rate that was 500 basis points higher than the stated interest rate. The ownership of this property was conveyed to the lender in August 2018. |
| | | | | | | | | | | | | | | | |
| For additional information regarding the non-GAAP measures, see pages 31-32. |
|
| | |
Supplemental Operating and Financial Data | | 3Q’18 Page 6 |
|
| | | | | | | | | | | | | | | | | | | | |
| Calculations of EBITDAre |
| (in thousands, except ratios) |
| | | |
| | | Three Months Ended |
| | | 30-Sep-18 | | 30-Jun-18 | | 31-Mar-18 | | 31-Dec-17 | | 30-Sep-17 |
| | | | | | | | | | | |
| Net income (loss) | $ | 22,567 |
| | $ | (8,362 | ) | | $ | 8,326 |
| | $ | (9,884 | ) | | $ | (8,051 | ) |
| | | | | | | | | | | |
| Adjustments: | | | | | | | | | |
| | | | | | | | | | | |
| | Interest expense: | | | | | | | | | |
| | Interest expense - consolidated | 6,782 |
| | 8,011 |
| | 7,705 |
| | 7,534 |
| | 7,516 |
|
| | Interest expense - unconsolidated entities | — |
| | — |
| | 360 |
| | 338 |
| | 335 |
|
| | Interest rate hedge ineffectiveness expense (income) (1) | — |
| | — |
| | — |
| | (262 | ) | | 8 |
|
| | Amortization of deferred financing costs - consolidated | 359 |
| | 358 |
| | 404 |
| | 883 |
| | 882 |
|
| | Amortization of deferred financing costs - unconsolidated entities | — |
| | — |
| | 32 |
| | 32 |
| | 36 |
|
| | Total interest expense | 7,141 |
| | 8,369 |
| | 8,501 |
| | 8,525 |
| | 8,777 |
|
| | | | | | | | | | | |
| | Tax provision - consolidated | 228 |
| | 214 |
| | 195 |
| | 171 |
| | 202 |
|
| | Tax provision - unconsolidated entities | — |
| | — |
| | 14 |
| | 1 |
| | — |
|
| | Depreciation and amortization - consolidated | 24,834 |
| | 27,134 |
| | 24,616 |
| | 23,788 |
| | 23,785 |
|
| | Depreciation and amortization - unconsolidated entities | — |
| | — |
| | 391 |
| | 391 |
| | 289 |
|
| | Asset impairment losses | 3,418 |
| | — |
| | — |
| | 5,250 |
| | — |
|
| | Loss (gain) on sale of real estate | — |
| | 90 |
| | (12,014 | ) | | (384 | ) | | — |
|
| | Loss (gain) on remeasurement of investment in unconsolidated entities | — |
| | 152 |
| | (11,242 | ) | | — |
| | — |
|
| EBITDAre | 58,188 |
| | 27,597 |
| | 18,787 |
| | 27,858 |
| | 25,002 |
|
| | | | | | | | | | | |
| Adjustments: | | | | | | | | | |
| | Loss on early extinguishment of debt | — |
| | — |
| | 8,988 |
| | — |
| | — |
|
| | Gain on troubled debt restructuring | (31,006 | ) | | — |
| | — |
| | — |
| | — |
|
| | Non-cash write-off (recoveries), net of tenant receivables | (56 | ) | | 237 |
| | — |
| | 19 |
| | (742 | ) |
| | Rent abatements (recoveries), net, due to Hurricane Harvey (2) | (719 | ) | | 417 |
| | 409 |
| | (1,556 | ) | | 1,921 |
|
| | Severance charges | — |
| | 108 |
| | 19 |
| | — |
| | — |
|
| Adjusted EBITDAre | 26,407 |
| | 28,359 |
| | 28,203 |
| | 26,321 |
| | 26,181 |
|
| | | | | | | | | | | |
| Adjustments: | | | | | | | | | |
| | EBITDAre from properties disposed before period end | (61 | ) | | (4 | ) | | (2,504 | ) | | 5 |
| | 11 |
|
| | Full quarter EBITDAre adjustment for acquired properties | — |
| | — |
| | 1,223 |
| | — |
| | — |
|
Adjusted estimated full period EBITDAre from properties owned at period end | $ | 26,346 |
| | $ | 28,355 |
| | $ | 26,922 |
| | $ | 26,326 |
| | $ | 26,192 |
|
| | | | | | | | | | | |
| Fixed charges | | | | | | | | | |
| | Interest expense | $ | 7,141 |
| | $ | 8,369 |
| | $ | 8,501 |
| | $ | 8,525 |
| | $ | 8,777 |
|
| | Interest rate hedge ineffectiveness (expense) income (1) | — |
| | — |
| | — |
| | 262 |
| | (8 | ) |
| | Default interest expense (3) | (388 | ) | | (609 | ) | | (602 | ) | | (616 | ) | | (616 | ) |
| | Capitalized interest incurred (4) | 1,644 |
| | 1,318 |
| | 1,103 |
| | 782 |
| | 653 |
|
| | Normalized interest expense | 8,397 |
| | 9,078 |
| | 9,002 |
| | 8,953 |
| | 8,806 |
|
| | Principal payments (excludes debt payoff) | 239 |
| | 378 |
| | 384 |
| | 355 |
| | 349 |
|
| Normalized fixed charges | $ | 8,636 |
| | $ | 9,456 |
| | $ | 9,386 |
| | $ | 9,308 |
| | $ | 9,155 |
|
| | | | | | | | | | | |
| Normalized interest coverage (5) | 3.14 |
| | 3.12 |
| | 3.13 |
| | 2.94 |
| | 2.97 |
|
| Normalized fixed charge coverage (5) | 3.06 |
| | 3.00 |
| | 3.00 |
| | 2.83 |
| | 2.86 |
|
| | | | | | | | | | | |
| |
| (1) | Interest rate swaps are adjusted to fair value through other comprehensive income (loss). However, because our interest rate swaps do not have a LIBOR floor while the hedged debt is subject to a LIBOR floor, the portion of the change in fair value of our interest rate swaps attributable to this mismatch is reclassified to interest rate hedge ineffectiveness expense (income). We adopted new accounting guidance on January 1, 2018, that eliminates the requirement to separately measure and report hedge ineffectiveness expense (income). |
| |
| (2) | Reflects rent abatements, net of business interruption insurance recoveries and an insurance deductible, following Hurricane Harvey. |
| |
| (3) | We had a non-recourse loan in default that subjected us to incur default interest at a rate that was 500 basis points higher than the stated interest rate. The ownership of this property was conveyed to the lender in August 2018. |
(4) Excludes capitalized interest funded from construction loans.
(5) Normalized interest coverage is equal to adjusted EBITDAre divided by normalized interest expense. Normalized fixed charge coverage is equal to adjusted EBITDAre divided by normalized fixed charges.
For additional information regarding the non-GAAP measures, see pages 31-32.
|
| | |
Supplemental Operating and Financial Data | | 3Q’18 Page 7 |
|
| | | | |
| Unconsolidated Entities Financial Summary |
| at TIER REIT Ownership Share |
| As of and for the Quarter Ended September 30, 2018 |
| (dollars in thousands) |
| | | |
| | | |
| | | Third + Shoal |
| Ownership % during the period | 47.50% |
| Ownership % at period end | 47.50% |
| | |
| Balance Sheet Information | |
| Real estate book value | $ | 53,683 |
|
| Accumulated depreciation and amortization | (433 | ) |
| Real estate book value after depreciation and amortization | $ | 53,250 |
|
| | |
| Cash and cash equivalents | $ | 550 |
|
| Assets | $ | 56,846 |
|
| Mortgage debt | $ | 26,137 |
|
| Company’s equity interest in investment | $ | 25,919 |
|
| Basis differences | 6,193 |
|
| Carrying value of the Company’s investment | $ | 32,112 |
|
| ________________________________ | |
| Notes: |
| Investments in unconsolidated entities consist of our noncontrolling interest in properties accounted for using the equity method. Multiplying each financial statement line item by the associated ownership percentage and adding those amounts to consolidated totals may not accurately depict the legal and economic implications of holding a noncontrolling interest in an investee entity. |
| | |
| Third + Shoal is a development property. |
| |

(Third + Shoal interior rendering)
|
| | |
Supplemental Operating and Financial Data | | 3Q’18 Page 8 |
|
| | | | | | | | | | | | | | | | | | | | | | | | | | | |
| Same Store Analysis |
| (in thousands, except property count and percentages) |
| | | | | | | | | | |
| | | Three Months Ended | | Nine Months Ended | |
| Same Store NOI: | 30-Sep-18 | | 30-Sep-17 | | Favorable/ (Unfavorable) | | 30-Sep-18 | | 30-Sep-17 | | Favorable/ (Unfavorable) | |
| Same Store Revenue: | | | | | | | | | | | | |
| Rental revenue (1) | $ | 46,592 |
| | $ | 42,113 |
| | $ | 4,479 |
| | $ | 128,281 |
| | $ | 122,945 |
| | $ | 5,336 |
| |
| Less: Lease termination fees | (276 | ) | | (177 | ) | | (99 | ) | | (986 | ) | | (207 | ) | | (779 | ) | |
| | 46,316 |
| | 41,936 |
| | 4,380 |
| 10.4 | % | 127,295 |
| | 122,738 |
| | 4,557 |
| 3.7 | % |
| Same Store Expenses: | | | | | | | | | | | | |
Property operating expenses
(less tenant improvement demolition costs) | 11,103 |
| | 9,568 |
| | (1,535 | ) | (16.0 | )% | 31,320 |
| | 29,046 |
| | (2,274 | ) | (7.8 | )% |
| Real estate taxes | 7,856 |
| | 7,684 |
| | (172 | ) | (2.2 | )% | 21,680 |
| | 21,697 |
| | 17 |
| 0.1 | % |
| Property management fees | 25 |
| | 25 |
| | — |
| — | % | 76 |
| | 66 |
| | (10 | ) | (15.2 | )% |
| Property expenses | 18,984 |
| | 17,277 |
| | (1,707 | ) | (9.9 | )% | 53,076 |
| | 50,809 |
| | (2,267 | ) | (4.5 | )% |
| Same Store NOI - consolidated properties | 27,332 |
| | 24,659 |
| | 2,673 |
| 10.8 | % | 74,219 |
| | 71,929 |
| | 2,290 |
| 3.2 | % |
Same Store NOI - unconsolidated properties
(at ownership %) | 1,272 |
| | 728 |
| | 544 |
| 74.7 | % | — |
| | — |
| | — |
| — | % |
| Same Store NOI | $ | 28,604 |
| | $ | 25,387 |
| | $ | 3,217 |
| 12.7 | % | $ | 74,219 |
| | $ | 71,929 |
| | $ | 2,290 |
| 3.2 | % |
| | | | | | | | | | | | | |
| Same Store Cash NOI: | | | | | | | | | | | | |
| Same Store NOI | $ | 27,332 |
| | $ | 24,659 |
| | $ | 2,673 |
| | $ | 74,219 |
| | $ | 71,929 |
| | $ | 2,290 |
| |
| Less: | | | | | | | | | | | | |
| Straight-line rent revenue adjustment | 288 |
| | (2,085 | ) | | 2,373 |
| | 222 |
| | (4,528 | ) | | 4,750 |
| |
| Above- and below-market rent amortization | (1,052 | ) | | (1,156 | ) | | 104 |
| | (2,859 | ) | | (2,922 | ) | | 63 |
| |
| Same Store Cash NOI - consolidated properties | 26,568 |
| | 21,418 |
| | 5,150 |
| 24.0 | % | 71,582 |
| | 64,479 |
| | 7,103 |
| 11.0 | % |
| Same Store Cash NOI - unconsolidated properties (at ownership %) | 840 |
| | (283 | ) | | 1,123 |
| (396.8 | )% | — |
| | — |
| | — |
| — | % |
| Same Store Cash NOI | $ | 27,408 |
| | $ | 21,135 |
| | $ | 6,273 |
| 29.7 | % | $ | 71,582 |
| | $ | 64,479 |
| | $ | 7,103 |
| 11.0 | % |
| | | | | | | | | | | | | |
Same Store occupancy % at period end
(% owned) | 89.7 | % | | 88.6 | % | | | | 88.9 | % | | 87.7 | % | | | |
| | | | | | | | | | | | | |
| Same Store operating properties | 16 |
| | | | | | 14 |
| | | | | |
| Same Store rentable square feet (% owned) | 5,911 |
| | | | | | 5,446 |
| | | | | |
| | | | | | | | | | | | | |
| Reconciliation of net income (loss) to Same Store NOI and Same Store Cash NOI: | | | | | | | |
| Net income (loss) | $ | 22,567 |
| | $ | (8,051 | ) | | | | $ | 22,531 |
| | $ | 94,211 |
| | | |
| Adjustments: | | | | | | | | | | | | |
| Interest expense | 7,141 |
| | 8,406 |
| | | | 23,619 |
| | 25,421 |
| | | |
| Asset impairment losses | 3,418 |
| | — |
| | | | 3,418 |
| | — |
| | | |
| Tenant improvement demolition costs | 36 |
| | 127 |
| | | | 170 |
| | 242 |
| | | |
| General and administrative | 5,128 |
| | 5,157 |
| | | | 16,008 |
| | 16,490 |
| | | |
| Real estate depreciation and amortization | 24,834 |
| | 23,785 |
| | | | 76,584 |
| | 70,966 |
| | | |
| Interest and other income | (49 | ) | | (170 | ) | | | | (644 | ) | | (1,271 | ) | | | |
| Loss on early extinguishment of debt | — |
| | — |
| | | | 8,988 |
| | 545 |
| | | |
| Gain on troubled debt restructuring | (31,006 | ) | | — |
| | | | (31,006 | ) | | — |
| | | |
| Provision for income taxes | 228 |
| | 202 |
| | | | 637 |
| | 297 |
| | | |
| Equity in operations of investments | — |
| | (67 | ) | | | | (287 | ) | | (6,367 | ) | | | |
| Gain on sale of assets | — |
| | — |
| | | | (11,924 | ) | | (92,012 | ) | | | |
| Gain on remeasurement of investment in unconsolidated entities | — |
| | — |
| | | | (11,090 | ) | | (14,168 | ) | | | |
| Net operating income of non-same store properties | (4,689 | ) | | (4,553 | ) | | | | (21,799 | ) | | (22,218 | ) | | | |
| Lease termination fees | (276 | ) | | (177 | ) | | | | (986 | ) | | (207 | ) | | | |
Same Store NOI of unconsolidated properties
(at ownership %) | 1,272 |
| | 728 |
| | | | — |
| | — |
| | | |
| Same Store NOI | 28,604 |
| | 25,387 |
| | | | 74,219 |
| | 71,929 |
| | | |
| Straight-line rent revenue adjustment | 288 |
| | (2,085 | ) | | | | 222 |
| | (4,528 | ) | | | |
| Above- and below-market rent amortization | (1,052 | ) | | (1,156 | ) | | | | (2,859 | ) | | (2,922 | ) | | | |
| Cash NOI adjustments for unconsolidated properties (at ownership %) | (432 | ) | | (1,011 | ) | | | | — |
| | — |
| | | |
| Same Store Cash NOI | $ | 27,408 |
| | $ | 21,135 |
| | | | $ | 71,582 |
| | $ | 64,479 |
| | | |
| | | | | | | | | | | | | | |
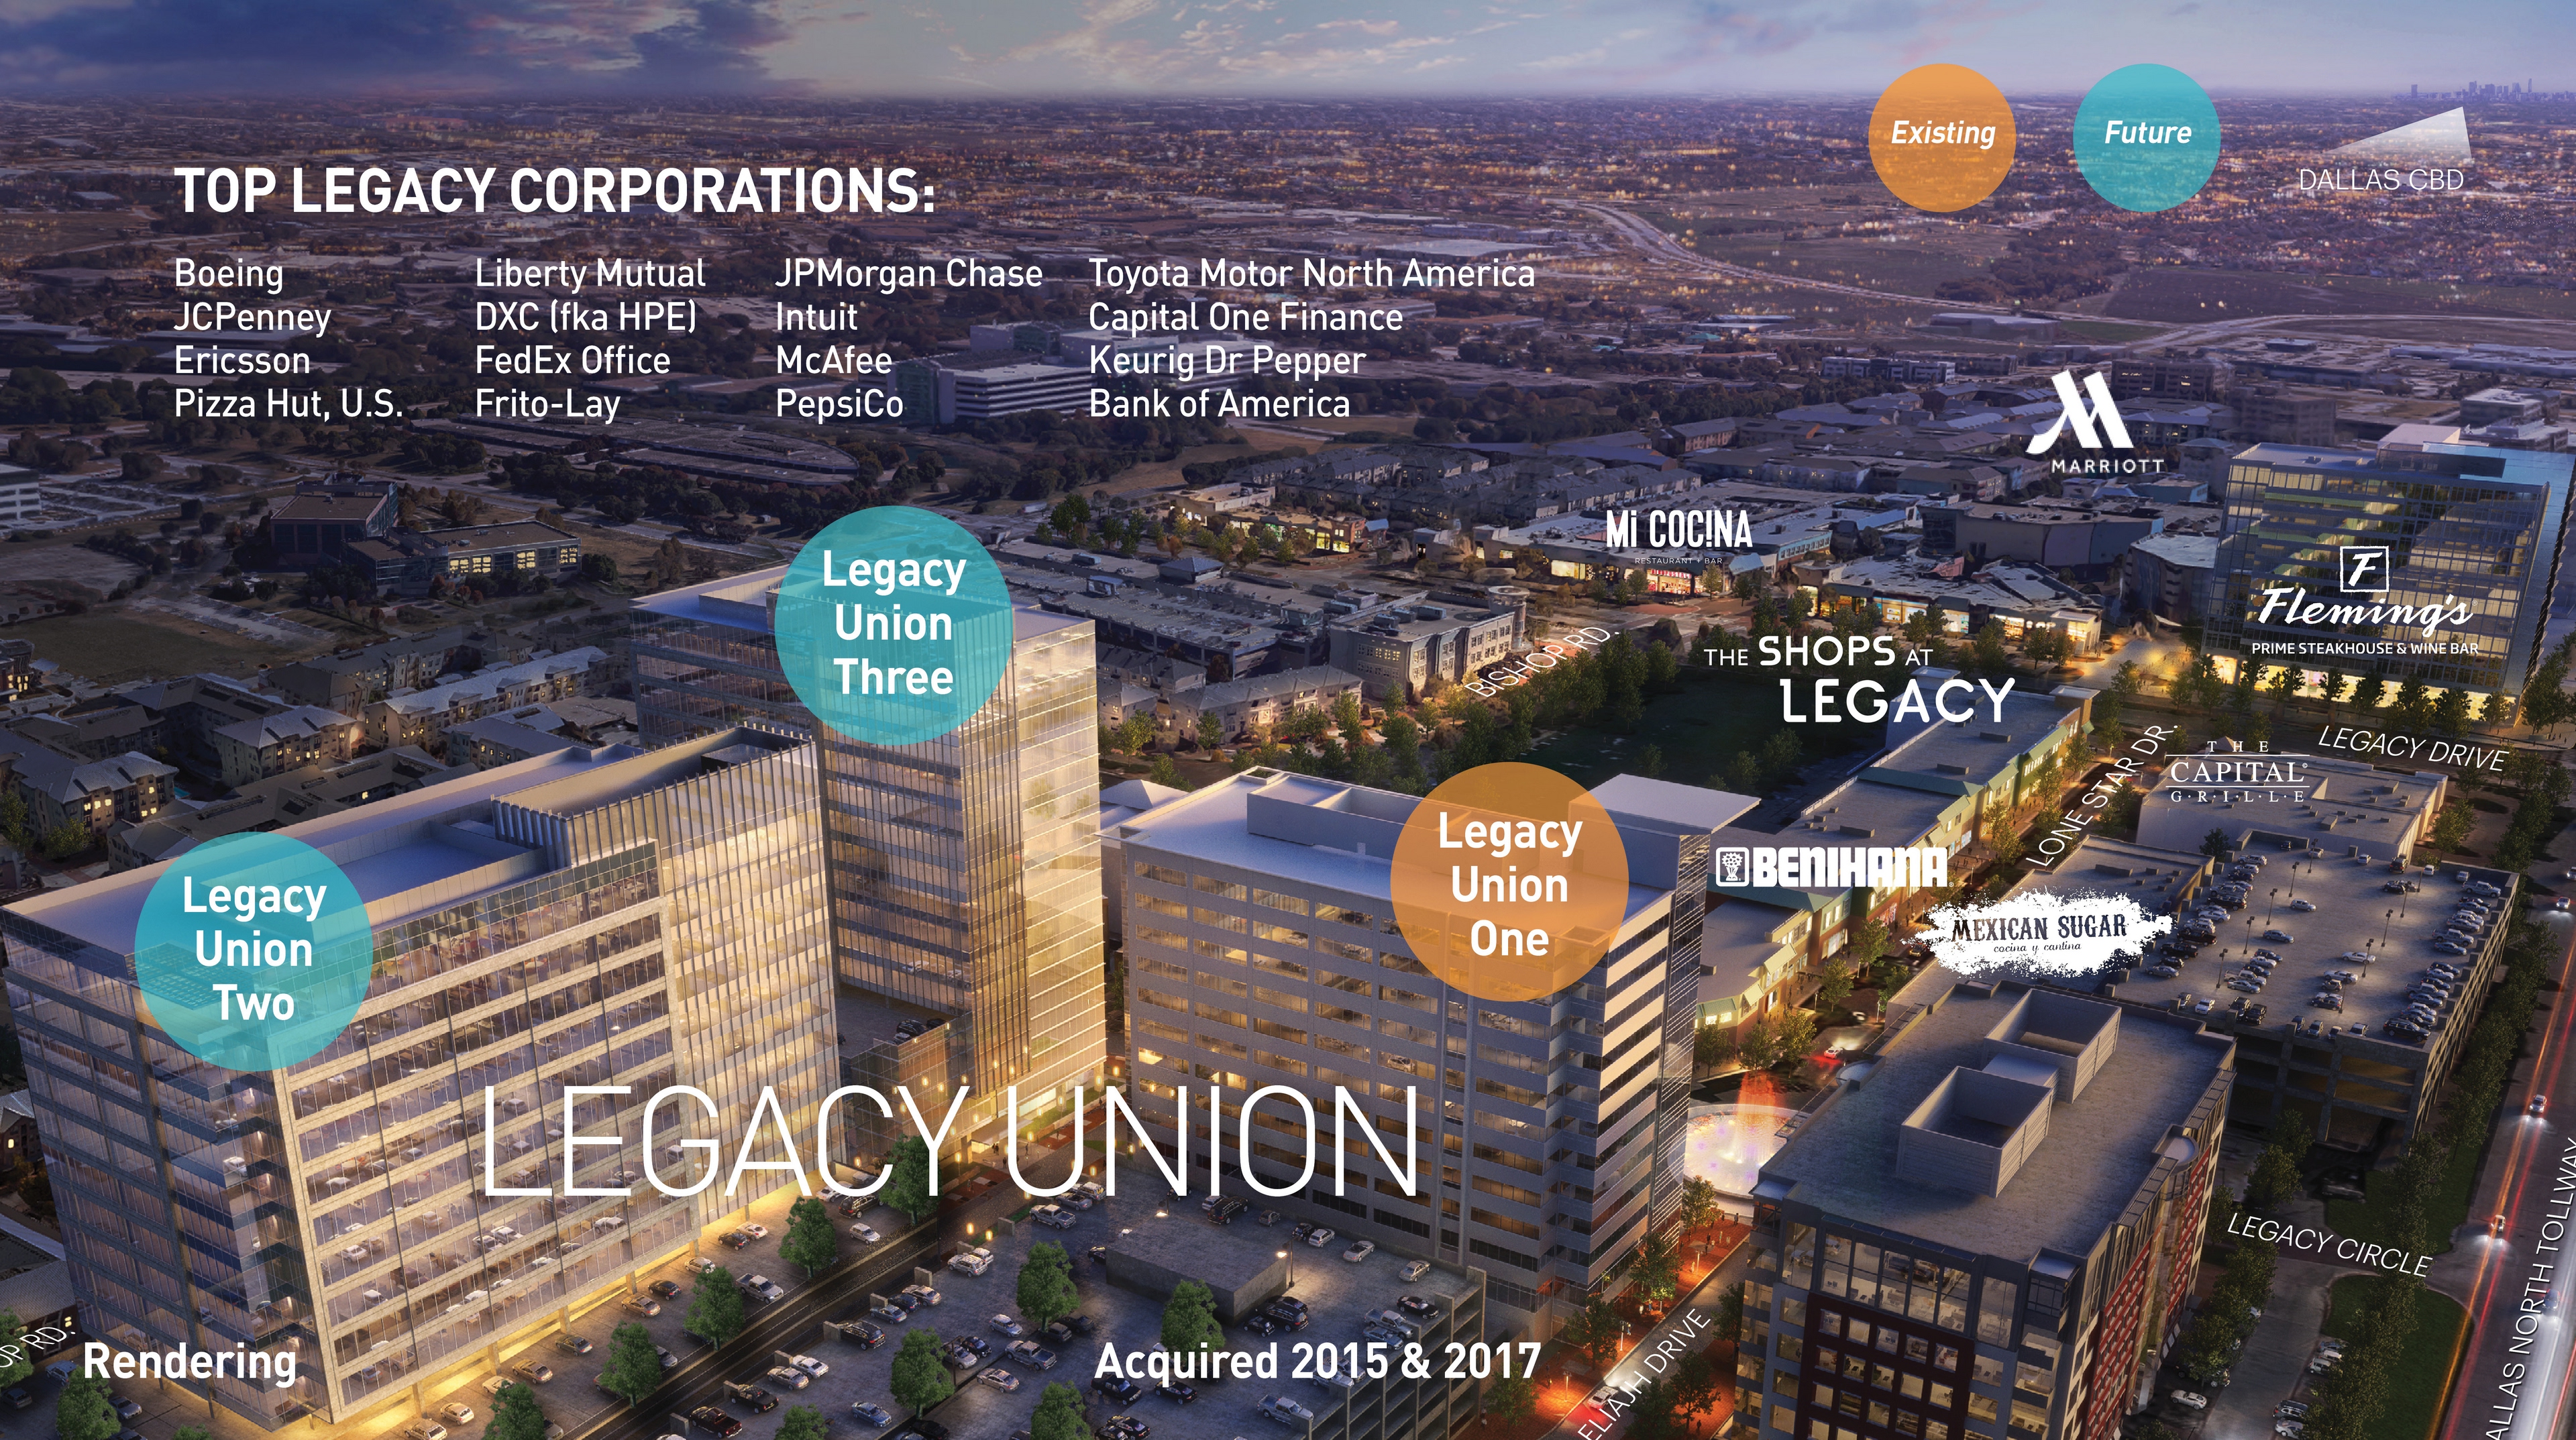
| Our Domain 2 and Domain 7 properties (two properties in which we acquired full ownership in January 2017) are reflected above as consolidated and at 100% ownership in all periods presented. Our Domain 8 property is reflected as unconsolidated and at the prior year ownership percentage of 50% for the three-month comparison periods presented above. Domain 8 became operational in the third quarter of 2017 and we acquired full ownership on March 30, 2018. Legacy Union One was acquired in June 2017, and is included in the three-month comparison periods presented above. For additional information regarding the non-GAAP measures, see pages 30-31. |
| (1) We provided rent abatements to tenants at the Eldridge Properties as a result of Hurricane Harvey through the second quarter of 2018. These rent abatements were offset by business interruption insurance proceeds, net of a deductible and estimated saved expenses. See page 6 for details. The timing difference of rent abatements provided and business interruption insurance proceeds received for the Eldridge Properties was a significant driver to the increase in Same Store NOI and Same Store Cash NOI. Excluding the Eldridge Properties, Same Store NOI and Same Store Cash NOI increase over prior year same periods would be as follows: |
| Increase in Same Store NOI (excluding Eldridge Properties) | |
|
| 3.0 | % | | | | |
|
| 2.4 | % |
| Increase in Same Store Cash NOI (excluding Eldridge Properties) | |
|
| 18.1 | % | | | | |
|
| 11.7 | % |
|
| | |
Supplemental Operating and Financial Data | | 3Q’18 Page 9 |
|
| | | | | | | | | | | | | | | | | | | | | | | | | | | | | | | | | |
| Schedule of Properties Owned |
| as of September 30, 2018 |
| (in thousands, except $/RSF and percentages) |
| | | | | | | | | | | | | | | | | | | |
| | | | | Rentable SF (100%) | | Rentable SF (own %) | | | | Average Effective Rent (own %) | | Average Effective Rent $/RSF (own %) | | Average
Adjusted
Effective Rent
$/RSF
(own %) | | Estimated Market Rent $/RSF (own %) | | | | % Average Effective Rent (own %) |
| | | | | | | Occupancy % (own %) | | | | | | % of NRA (own %) | |
| Property (% owned, if not 100%) | | Location | | | | | | | | | |
| Terrace Office Park | | Austin, TX | | 619 |
| | 619 |
| | 91.4 | % | | $ | 23,100 |
| | $ | 40.81 |
| | $ | 41.83 |
| | $ | 45.76 |
| | 9.3 | % | | 11.8 | % |
| Domain 2 | | Austin, TX | | 115 |
| | 115 |
| | 100.0 | % | | 5,124 |
| | $ | 44.56 |
| | $ | 44.56 |
| | $ | 49.50 |
| | 1.7 | % | | 2.6 | % |
| Domain 3 | | Austin, TX | | 179 |
| | 179 |
| | 100.0 | % | | 6,180 |
| | $ | 34.53 |
| | $ | 37.21 |
| | $ | 43.65 |
| | 2.7 | % | | 3.1 | % |
| Domain 4 | | Austin, TX | | 153 |
| | 153 |
| | 100.0 | % | | 5,124 |
| | $ | 33.49 |
| | $ | 37.10 |
| | $ | 41.03 |
| | 2.3 | % | | 2.6 | % |
| Domain 7 | | Austin, TX | | 222 |
| | 222 |
| | 100.0 | % | | 10,092 |
| | $ | 45.46 |
| | $ | 45.46 |
| | $ | 49.28 |
| | 3.3 | % | | 5.1 | % |
| Domain 8 | | Austin, TX | | 291 |
| | 291 |
| | 100.0 | % | | 11,040 |
| | $ | 37.94 |
| | $ | 47.05 |
| | $ | 48.60 |
| | 4.4 | % | | 5.6 | % |
| Domain Point (90%) | | Austin, TX | | 240 |
| | 216 |
| | 90.5 | % | | 6,714 |
| | $ | 34.34 |
| | $ | 34.34 |
| | $ | 43.60 |
| | 3.3 | % | | 3.4 | % |
| Austin | | | | 1,819 |
| | 1,795 |
| | 95.9 | % | | 67,374 |
| | $ | 39.14 |
| | $ | 41.61 |
| | $ | 46.06 |
| | 27.1 | % | | 34.3 | % |
| | | | | | | | | | | | | | | | | | | | | |
| 5950 Sherry Lane | | Dallas, TX | | 197 |
| | 197 |
| | 92.9 | % | | 7,440 |
| | $ | 40.66 |
| | $ | 41.38 |
| | $ | 42.28 |
| | 3.0 | % | | 3.8 | % |
| Burnett Plaza | | Fort Worth, TX | | 1,025 |
| | 1,025 |
| | 85.3 | % | | 20,832 |
| | $ | 23.84 |
| | $ | 24.25 |
| | $ | 25.00 |
| | 15.5 | % | | 10.6 | % |
| Legacy Union One | | Plano, TX | | 319 |
| | 319 |
| | 100.0 | % | | 12,262 |
| | $ | 38.44 |
| | $ | 38.44 |
| | $ | 41.25 |
| | 4.8 | % | | 6.2 | % |
| Dallas/Fort Worth | | | | 1,541 |
| | 1,541 |
| | 89.3 | % | | 40,534 |
| | $ | 29.46 |
| | $ | 29.82 |
| | $ | 31.07 |
| | 23.2 | % | | 20.6 | % |
| | | | | | | | | | | | | | | | | | | | | |
| One BriarLake Plaza | | Houston, TX | | 502 |
| | 502 |
| | 89.2 | % | | 18,732 |
| | $ | 41.81 |
| | $ | 43.47 |
| | $ | 43.41 |
| | 7.6 | % | | 9.5 | % |
| Two BriarLake Plaza | | Houston, TX | | 333 |
| | 333 |
| | 85.6 | % | | 9,732 |
| | $ | 34.15 |
| | $ | 42.40 |
| | $ | 42.86 |
| | 5.0 | % | | 5.0 | % |
| One & Two Eldridge Place | | Houston, TX | | 519 |
| | 519 |
| | 70.7 | % | | 12,012 |
| | $ | 32.73 |
| | $ | 33.42 |
| | $ | 35.20 |
| | 7.8 | % | | 6.1 | % |
| Three Eldridge Place | | Houston, TX | | 305 |
| | 305 |
| | 71.1 | % | | 9,372 |
| | $ | 43.19 |
| | $ | 43.74 |
| | $ | 38.05 |
| | 4.6 | % | | 4.8 | % |
| Houston | | | | 1,659 |
| | 1,659 |
| | 79.4 | % | | 49,848 |
| | $ | 37.85 |
| | $ | 40.48 |
| | $ | 40.12 |
| | 25.0 | % | | 25.4 | % |
| | | | | | | | | | | | | | | | | | | | | |
| Bank of America Plaza | | Charlotte, NC | | 891 |
| | 891 |
| | 96.0 | % | | 22,824 |
| | $ | 26.69 |
| | $ | 26.96 |
| | $ | 32.50 |
| | 13.4 | % | | 11.6 | % |
| Charlotte | | | | 891 |
| | 891 |
| | 96.0 | % | | 22,824 |
| | $ | 26.69 |
| | $ | 26.96 |
| | $ | 32.50 |
| | 13.4 | % | | 11.6 | % |
| | | | | | | | | | | | | | | | | | | | | |
| Plaza at MetroCenter (1) | | Nashville, TN | | 361 |
| | 361 |
| | 92.0 | % | | 6,168 |
| | $ | 18.58 |
| | $ | 18.83 |
| | $ | 20.00 |
| | 5.5 | % | | 3.1 | % |
| Nashville | | | | 361 |
| | 361 |
| | 92.0 | % | | 6,168 |
| | $ | 18.58 |
| | $ | 18.83 |
| | $ | 20.00 |
| | 5.5 | % | | 3.1 | % |
| | | | | | | | | | | | | | | | | | | | | |
| Woodcrest (2) | | Cherry Hill, NJ | | 386 |
| | 386 |
| | 97.2 | % | | 9,816 |
| | $ | 26.18 |
| | $ | 26.18 |
| | $ | 20.74 |
| | 5.8 | % | | 5.0 | % |
| Other | | 386 |
| | 386 |
| | 97.2 | % | | 9,816 |
| | $ | 26.18 |
| | $ | 26.18 |
| | $ | 20.74 |
| | 5.8 | % | | 5.0 | % |
| Total operating office properties | | 6,657 |
| | 6,633 |
| | 90.1 | % | | $ | 196,564 |
| | $ | 32.89 |
| | $ | 34.32 |
| | $ | 36.32 |
| | 100.0 | % | | 100.0 | % |
| | | | | | | | | | | | | | | | | | | |
| | | | | | | | | | | | | | | | | | | | | |
| Development Properties | | | | | | Leased % | | | | | | | | | | | | |
| Domain 11 | | Austin, TX | | 324 |
| | 324 |
| | 98.0 | % | | | | | | | | | | | | |
| Domain 12 | | Austin, TX | | 320 |
| | 320 |
| | 100.0 | % | | | | | | | | | | | | |
| Third + Shoal (47.5%) | | Austin, TX | | 345 |
| | 164 |
| | 99.7 | % | | | | | | | | | | | | |
| | | | | | | | | | | | | | | | | | | | | |
| | | | | | | | | | | | | | | | | | | | | |
| (1) This property is classified as held for sale as of September 30, 2018. |
| (2) Includes two properties. |
| |
| |
Average effective rent represents 12 times the sum of the monthly contractual amounts for base rent and the pro rata budgeted operating expense reimbursements, as of period end, related to leases in place as of period end, as reduced for free rent and excluding any scheduled future rent increases, as adjusted for our ownership interest, divided by the total square footage under commenced leases at period end. |
Average adjusted effective rent represents 12 times the sum of the monthly contractual amounts for base rent and the pro rata budgeted operating expense reimbursements, as of period end, related to leases in place as of period end, excluding any scheduled future rent increases, as adjusted for our ownership interest, divided by the total square footage under commenced leases at period end. |
|
| | |
Supplemental Operating and Financial Data | | 3Q’18 Page 10 |
|
| | | | | | | | | | | | | | | | | | | | | | | |
| Portfolio Analysis |
| For the Three Months Ended and |
| as of September 30, 2018 |
| | | | | | | | | | | | | | | | |
| | | | | | | | | | | | | | | | |
| | | Number of Properties | | Number of Buildings | | Net Rentable Area (000’s) | | Commenced % SF Leased | | % of NRA | | NOI ($000’s) (1) | | % of NOI | |
| Market | | | | | | | | |
| | | | | | | | | | | | | | | | |
| Austin | | 7 |
| | 11 |
| | 1,795 |
| | 95.9 | % | | 27.1 | % | | $ | 11,489 |
| | 35.7 | % | |
| Dallas/Fort Worth | | 3 |
| | 3 |
| | 1,541 |
| | 89.3 | % | | 23.2 | % | | 6,450 |
| | 20.0 | % | |
| Houston | | 4 |
| | 5 |
| | 1,659 |
| | 79.4 | % | | 25.0 | % | | 7,487 |
| | 23.3 | % | |
| Charlotte | | 1 |
| | 1 |
| | 891 |
| | 96.0 | % | | 13.4 | % | | 4,805 |
| | 14.9 | % | |
| Nashville | | 1 |
| | 2 |
| | 361 |
| | 92.0 | % | | 5.5 | % | | 937 |
| | 2.9 | % | |
| Other | | 2 |
| | 2 |
| | 386 |
| | 97.2 | % | | 5.8 | % | | 1,030 |
| | 3.2 | % | |
| | | | | | | | | | | | | | | | |
| Total | | 18 |
| | 24 |
| | 6,633 |
| | 90.1 | % | | 100.0 | % | | 32,198 |
| | 100.0 | % | |
| | | | | | | | | | | | | | | | |
| Reconciliation to NOI (Consolidated): | | | | | | |
| Plus NOI from noncontrolling interest | | 126 |
| | | |
| Plus NOI from disposed properties | | (63 | ) | | | |
| NOI (Consolidated) | | | | | | | | | | | | $ | 32,261 |
| | | |
| | | | | | | | | | | | | | | | |
| Notes: | | | | | | | | | | | | | | | |
| Analysis relates to operating properties owned at the end of the most recent period only. | |
| Amounts reflect TIER REIT’s ownership %. | | | |
| NOI is a non-GAAP performance measure. A calculation of NOI is presented on page 2. | |
| | |
| (1) NOI in Houston reflects approximately $0.7 million of business interruption insurance proceeds received in the third quarter of 2018 related to rent abatements provided to tenants at the Eldridge Properties in previous periods as a result of Hurricane Harvey. We anticipate we will receive additional business interruption insurance proceeds in subsequent quarters. | |
| | |
|
| | |
Supplemental Operating and Financial Data | | 3Q’18 Page 11 |
|
| | | | | | |
| Components of Net Asset Value |
| (in thousands, except percentages) |
| |
| | | | | Annualized Three Months Ended |
| | | | | 30-Sep-18 |
| Consolidated total revenue | | | $ | 219,328 |
|
| | Less: | | | |
| | GAAP rent adjustments | | (7,944 | ) |
| | Lease termination fees | | (1,104 | ) |
| | | | | 210,280 |
|
| Consolidated total property operating expenses | | (90,284 | ) |
| Adjusted cash NOI | | 119,996 |
|
| | Adjustments: | | | |
| | Adjusted cash NOI from sold properties, at ownership share | | 20 |
|
| | Adjusted cash NOI from noncontrolling interest in consolidated assets | (375 | ) |
| | Adjusted cash NOI attributed to business interruption insurance proceeds in excess of abatements during the period at the Eldridge Properties (2) | (2,585 | ) |
| | Incremental pro forma stabilized adjusted cash NOI from executed leases at Domain 8, Domain 11, Domain 12, and Third + Shoal at ownership share | 31,343 |
|
| Total adjusted cash NOI at ownership share (3) | | | $ | 148,399 |
|
| | | | | |
| | | | | 30-Sep-18 |
| Cost basis of land and development properties, at ownership share (4) | | $ | 36,426 |
|
| | | |
| Other tangible assets | | |
| | Cash and cash equivalents | | $ | 5,192 |
|
| | Restricted cash | | 10,232 |
|
| | Accounts receivable, net (excluding $50,878 of straight-line rent receivable and $12,132 of insurance receivable) (5) | 6,582 |
|
| | Prepaid expenses and other assets | | 19,357 |
|
| Total other tangible assets | | $ | 41,363 |
|
| | | | |
| Liabilities | | | |
| | Mortgage debt | | $ | 142,162 |
|
| | Unsecured term loans and revolving credit facility | | 591,000 |
|
| | Accrued and other liabilities | | 81,031 |
|
| | Ownership share of unconsolidated mortgage debt | | 26,137 |
|
| | Remaining estimated cost to complete Domain 11, Domain 12, and Third + Shoal, at ownership share | 142,370 |
|
| Total liabilities | | $ | 982,700 |
|
| | | |
| Total common shares, restricted stock, and restricted stock units outstanding | | 54,102 |
|
| | | | | |
| | | | |
| (1) | Includes Domain 9, Domain 10, Domain 11, Legacy Union Two, Legacy Union Three, and Domain Blocks D & G at ownership share. |
| (2) | We received approximately $0.7 million of business interruption insurance proceeds during the quarter. |
| (3) | Comprised of adjusted cash NOI as detailed in the table below. |
|
| | | | | |
| Market | Adjusted Cash NOI | % |
| Austin | $ | 69,768 |
| 47 | % |
| Dallas | 24,356 |
| 17 | % |
| Houston | 28,447 |
| 19 | % |
| Charlotte | 17,240 |
| 12 | % |
| Nashville | 3,396 |
| 2 | % |
| Other | 5,192 |
| 3 | % |
| | | |
| Total | $ | 148,399 |
| 100 | % |
|
| | | | | |
| (4) | Includes Domain 9, Domain 10, Legacy Union Two, Legacy Union Three, and Domain Blocks D & G at ownership share. |
| (5) | Excludes insurance receivable expected to be recovered for the write-off of net book value of hurricane-damaged assets. |
|
| | |
Supplemental Operating and Financial Data | | 3Q’18 Page 12 |
|
| | | | | | | | | | | | | | | | |
| Significant Tenants |
| September 30, 2018 |
| (in thousands, except percentages and years) |
| |
| |
| | Annualized
Gross Rental
Revenues | | Percentage of Annualized
Gross Rental
Revenues | | | | Percentage of Square Feet Leased | | Weighted Average Remaining Term (Years) | | |
| | | | Square Feet Leased | | | | Moody’s / S&P Credit Rating |
| Tenant | | | | | |
| Encana Oil & Gas (USA) Inc. | $ | 12,265 |
| | 6 | % | | 319 |
| | 5 | % | | 8.8 | | Ba1 / BBB- |
| Amazon | 11,297 |
| | 6 | % | | 246 |
| | 4 | % | | 7.2 | | Baa1 / AA- |
| Amoco | 9,498 |
| | 5 | % | | 217 |
| | 4 | % | | 0.5 | | A1 / A- |
| Bank of America | 8,931 |
| | 4 | % | | 388 |
| | 6 | % | | 1.9 | | A3 / A- |
| Apache Corporation | 8,671 |
| | 4 | % | | 210 |
| | 4 | % | | 6.1 | | Baa3 / BBB |
| GM Financial | 8,306 |
| | 4 | % | | 326 |
| | 5 | % | | 7.4 | | Baa3 / BBB |
| Samsung Engineering America Inc. | 7,206 |
| | 4 | % | | 161 |
| | 3 | % | | 6.8 | | NR |
| McDermott, Inc. | 5,504 |
| | 3 | % | | 169 |
| | 3 | % | | 1.8 | | NR / B+ |
| GSA | 5,284 |
| | 3 | % | | 226 |
| | 4 | % | | 5.1 | | U.S. Government |
| HomeAway | 5,128 |
| | 3 | % | | 115 |
| | 2 | % | | 7.4 | | Ba1 / BBB |
| Facebook, Inc. | 4,847 |
| | 2 | % | | 102 |
| | 2 | % | | 7.1 | | NR |
| Blackbaud, Inc. | 4,753 |
| | 2 | % | | 133 |
| | 2 | % | | 5.0 | | NR |
| Time Warner Cable Inc. | 4,072 |
| | 2 | % | | 112 |
| | 2 | % | | 2.3 | | NR |
| Conduent Incorporated | 4,020 |
| | 2 | % | | 151 |
| | 3 | % | | 1.9 | | Ba3 / BB |
| SCOR Global Life | 3,696 |
| | 2 | % | | 140 |
| | 2 | % | | 9.8 | | NR / AA- |
| Total of largest 15 tenants | $ | 103,478 |
| | 50 | % | | 3,015 |
| | 50 | % | | 5.2 | | |
| Total all tenants | $ | 205,095 |
| | | | 5,977 |
| | | | 5.3 | | |
| | | | | | | | | | | | |
|
| | | | | | | | | | | | | | | | | | | | | | |
| | | | | | | | | | | | | | | | | | | | | | | |
| Notes: | | | | | | | | | | | | | | | | | | | | | | |
| The above tables set forth the Company’s 15 largest tenants including subsidiaries for the operating properties as of the date noted above, based upon annualized gross rents plus estimated operating cost recoveries in place at the end of the above noted period. |
| As annualized rental revenue is not derived from the historical GAAP results, historical results may differ from those set forth above. |
| Amounts reflect TIER REIT’s ownership %. | | | | | |
|
| | |
Supplemental Operating and Financial Data | | 3Q’18 Page 13 |
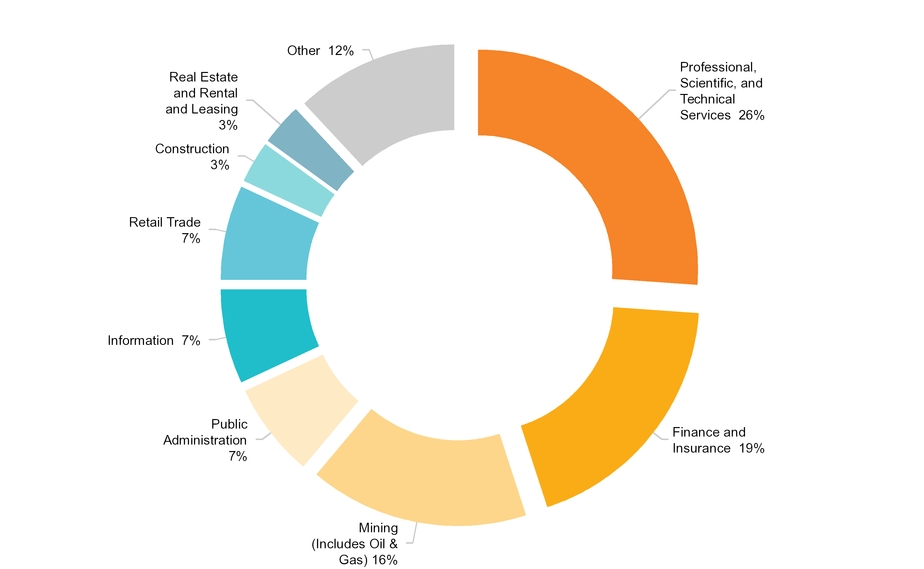
Industry Diversification (by square feet)
As of September 30, 2018
|
| |
| Notes: |
| | |
| The Company’s tenants are classified according to the U.S. Government’s North American Industrial Classification System (NAICS). | |
| Amounts reflect TIER REIT’s ownership %. | |
| “Other” includes 12 industry classifications. | |
|
| | |
Supplemental Operating and Financial Data | | 3Q’18 Page 14 |
|
| | | | | | | | | | | | | | | | | | | | | | | | | | | | | | | | | | | | | | | | | | | | | | | | | |
| Leasing Activity Summary |
| For the Three Months Ended |
| September 30, 2018 |
| | | | | | | | | | | | | | | | | | | | | | | | | | | | | | | |
| | | | | Occupancy | | | | | | | | | | Occupancy | | | | |
| | | | | % | | SF (000’s) | | Activity for the Quarter (SF 000’s) | | SF (000’s) | | % | | Cash Net Rent /SF | | Straight-lined Net Rent /SF |
| Market | | Rentable SF (000’s) | | 30-Jun-18 | | 30-Jun-18 | | Expiring | | Renewals | | Expansions | | New | | 30-Sep-18 | | 30-Sep-18 | | Expiring | | Activity | | % Increase | | Expiring | | Activity | | % Increase |
| Austin | | 1,795 |
| | 95.8 | % | | 1,720 |
| | (25 | ) | | 5 |
| | 14 |
| | 8 |
| | 1,722 |
| | 95.9 | % | | $ | 25.14 |
| | $ | 29.05 |
| | 16 | % | | $ | 24.28 |
| | $ | 30.30 |
| | 25 | % |
| Dallas/Fort Worth | | 1,541 |
| | 90.5 | % | | 1,395 |
| | (29 | ) | | 1 |
| | 5 |
| | 4 |
| | 1,376 |
| | 89.3 | % | | $ | 20.06 |
| | $ | 24.54 |
| | 22 | % | | $ | 19.76 |
| | $ | 25.18 |
| | 27 | % |
| Houston | | 1,659 |
| | 75.8 | % | | 1,258 |
| | (17 | ) | | 17 |
| | — |
| | 59 |
| | 1,317 |
| | 79.4 | % | | $ | 25.57 |
| | $ | 23.73 |
| | (7 | )% | | $ | 23.24 |
| | $ | 22.18 |
| | (5 | )% |
| Charlotte | | 891 |
| | 96.0 | % | | 855 |
| | (3 | ) | | 3 |
| | — |
| | — |
| | 855 |
| | 96.0 | % | | $ | 30.56 |
| | $ | 32.00 |
| | 5 | % | | $ | 24.43 |
| | $ | 33.62 |
| | 38 | % |
| Nashville | | 361 |
| | 90.9 | % | | 328 |
| | — |
| | — |
| | — |
| | 4 |
| | 332 |
| | 92.0 | % | | $ | 8.19 |
| | $ | 12.19 |
| | 49 | % | | $ | 8.19 |
| | $ | 12.19 |
| | 49 | % |
| Other | | 386 |
| | 97.2 | % | | 375 |
| | — |
| | — |
| | — |
| | — |
| | 375 |
| | 97.2 | % | | $ | — |
| | $ | — |
| | — | % | | $ | — |
| | $ | — |
| | — | % |
| Total | | 6,633 |
| | 89.4 | % | | 5,931 |
| | (74 | ) | | 26 |
| | 19 |
| | 75 |
| | 5,977 |
| | 90.1 | % | | $ | 24.56 |
| | $ | 24.82 |
| | 1 | % | | $ | 22.71 |
| | $ | 24.21 |
| | 7 | % |
| | | | | | | | | | | | | | | | | | | | | | | | | | | | | | | |
| | | | | | | | | | | | | | | | | | | | | | | | | | | |
| | | | | | | | | | | | | | | | | | | | | | | | | | |
| Year-To-Date Summary | | | Beginning of Period | | | | | | | | | | End of Period | | | | | | | | | | | | |
| Q1 Activity | | 6,633 |
| | 89.8 | % | | 5,954 |
| | (89 | ) | | 56 |
| | 1 |
| | 11 |
| | 5,933 |
| | 89.4 | % | | $ | 21.50 |
| | $ | 22.78 |
| | 6 | % | | $ | 20.24 |
| | $ | 25.61 |
| | 27 | % |
| Q2 Activity | | 6,633 |
| | 89.4 | % | | 5,933 |
| | (96 | ) | | 48 |
| | 23 |
| | 23 |
| | 5,931 |
| | 89.4 | % | | $ | 20.36 |
| | $ | 22.48 |
| | 10 | % | | $ | 20.03 |
| | $ | 23.22 |
| | 16 | % |
| Q3 Activity | | 6,633 |
| | 89.4 | % | | 5,931 |
| | (74 | ) | | 26 |
| | 19 |
| | 75 |
| | 5,977 |
| | 90.1 | % | | $ | 24.56 |
| | $ | 24.82 |
| | 1 | % | | $ | 22.71 |
| | $ | 24.21 |
| | 7 | % |
| | | | | | | | | (259 | ) | | 130 |
| | 43 |
| | 109 |
| | | | | | $ | 22.42 |
| | $ | 23.55 |
| | 5 | % | | $ | 21.22 |
| | $ | 24.22 |
| | 14 | % |
|
| | | | | | | | | | | |
| | | | | | | | | | | | |
| Notes: | |
| Analysis relates to operating properties owned at the end of the period and reflects TIER REIT’s ownership %. |
| Occupancy includes all leases for tenants under lease contracts that have commenced during the period. |
| Rates for expiring leases relate to the lease previously occupying the specific space for which positive absorption was shown or the current lease rate if it is a first generation lease. |
| Net Rent is equal to the fixed base rental amount paid under the terms of the lease less any portion used to offset real estate taxes, utility charges, and other operating expenses incurred in connection with the leased space. |
| Cash Net Rent disregards any free rent periods. Therefore, the rate shown is first full monthly cash rent paid. |
| The impact of short term temporary leasing activity is excluded from the analysis of % increase of Cash Net Rent and % increase of Straight-lined Net Rent. |
|
| | |
Supplemental Operating and Financial Data | | 3Q’18 Page 15 |
|
| | | | | | | | | | | | | | | | | | | | | | | | | | | | | | | | | | | | | | | | | | | | | | | | | | | | | | | | | |
| Leasing Rate Activity Summary |
| For the Three Months Ended |
| September 30, 2018 |
| | | | | | | | | | | | | | | | | | | | | | | | | | | | | | | |
| | | Renewals | | Expansions | | New |
| | | SF (000’s) | | Cash Net Rent /SF | | Straight-lined Net Rent /SF | | SF (000’s) | | Cash Net Rent /SF | | Straight-lined Net Rent /SF | | SF (000’s) | | Cash Net Rent /SF | | Straight-lined Net Rent /SF |
| Markets | | | Expiring | | Activity | | Expiring | | Activity | | | Expiring | | Activity | | Expiring | | Activity | | | Expiring | | Activity | | Expiring | | Activity |
| Austin | | 5 |
| | $ | 23.07 |
| | $ | 29.00 |
| | $ | 20.74 |
| | $ | 30.79 |
| | 14 |
| | $ | 27.18 |
| | $ | 28.82 |
| | $ | 27.18 |
| | $ | 30.24 |
| | 8 |
| | $ | 22.81 |
| | $ | 29.44 |
| | $ | 21.26 |
| | $ | 30.01 |
|
| Dallas/Fort Worth | | 1 |
| | $ | 15.72 |
| | $ | 14.95 |
| | $ | 13.22 |
| | $ | 14.95 |
| | 5 |
| | $ | 18.46 |
| | $ | 25.00 |
| | $ | 18.46 |
| | $ | 26.00 |
| | 4 |
| | $ | 23.42 |
| | $ | 26.45 |
| | $ | 23.29 |
| | $ | 26.71 |
|
| Houston | | 17 |
| | $ | 34.20 |
| | $ | 26.00 |
| | $ | 30.44 |
| | $ | 25.69 |
| | — |
| | $ | — |
| | $ | — |
| | $ | — |
| | $ | — |
| | 59 |
| | $ | 23.08 |
| | $ | 23.08 |
| | $ | 21.17 |
| | $ | 21.17 |
|
| Charlotte | | 3 |
| | $ | 30.56 |
| | $ | 32.00 |
| | $ | 24.43 |
| | $ | 33.62 |
| | — |
| | $ | — |
| | $ | — |
| | $ | — |
| | $ | — |
| | — |
| | $ | — |
| | $ | — |
| | $ | — |
| | $ | — |
|
| Nashville | | — |
| | $ | — |
| | $ | — |
| | $ | — |
| | $ | — |
| | — |
| | $ | — |
| | $ | — |
| | $ | — |
| | $ | — |
| | 4 |
| | $ | 8.19 |
| | $ | 12.19 |
| | $ | 8.19 |
| | $ | 12.19 |
|
| Other | | — |
| | $ | — |
| | $ | — |
| | $ | — |
| | $ | — |
| | — |
| | $ | — |
| | $ | — |
| | $ | — |
| | $ | — |
| | — |
| | $ | — |
| | $ | — |
| | $ | — |
| | $ | — |
|
| Total | | 26 |
| | $ | 30.93 |
| | $ | 26.84 |
| | $ | 27.22 |
| | $ | 27.17 |
| | 19 |
| | $ | 24.88 |
| | $ | 27.82 |
| | $ | 24.88 |
| | $ | 29.12 |
| | 75 |
| | $ | 22.28 |
| | $ | 23.36 |
| | $ | 20.60 |
| | $ | 21.93 |
|
| Percentage increase (decrease) | | | | (13 | )% | | | | — | % | | | | | | 12 | % | | | | 17 | % | | | | | | 5 | % | | | | 6 | % |
| | | | | | | | | | | | | | | | | | | | | | | | | | | | | | | |
| | | | | | | | | | | | | | | | | | | | | | | | | | | | | |
| Year-To-Date Summary: | | | | | | | | | | | | | | | | | | | | | | | | | | | | | | |
| Q1 Activity | | 56 |
| | $ | 22.63 |
| | $ | 23.39 |
| | $ | 21.46 |
| | $ | 26.41 |
| | 1 |
| | $ | 27.50 |
| | $ | 26.00 |
| | $ | 27.40 |
| | $ | 26.50 |
| | 11 |
| | $ | 15.12 |
| | $ | 19.00 |
| | $ | 13.34 |
| | $ | 21.07 |
|
| Q2 Activity | | 48 |
| | $ | 19.35 |
| | $ | 19.80 |
| | $ | 18.57 |
| | $ | 20.96 |
| | 23 |
| | $ | 20.66 |
| | $ | 25.22 |
| | $ | 20.61 |
| | $ | 26.10 |
| | 23 |
| | $ | 22.36 |
| | $ | 25.20 |
| | $ | 22.63 |
| | $ | 25.04 |
|
| Q3 Activity | | 26 |
| | $ | 30.93 |
| | $ | 26.84 |
| | $ | 27.22 |
| | $ | 27.17 |
| | 19 |
| | $ | 24.88 |
| | $ | 27.82 |
| | $ | 24.88 |
| | $ | 29.12 |
| | 75 |
| | $ | 22.28 |
| | $ | 23.36 |
| | $ | 20.60 |
| | $ | 21.93 |
|
| | | 130 |
| | $ | 23.08 |
| | $ | 22.76 |
| | $ | 21.54 |
| | $ | 24.55 |
| | 43 |
| | $ | 22.69 |
| | $ | 26.39 |
| | $ | 22.66 |
| | $ | 27.45 |
| | 109 |
| | $ | 21.57 |
| | $ | 23.31 |
| | $ | 20.30 |
| | $ | 22.50 |
|
| Percentage increase (decrease) | | | | (1 | )% | | | | 14 | % | | | | | | 16 | % | | | | 21 | % | | | | | | 8 | % | | | | 11 | % |
| | | | | | | | | | | | | | | | | | | | | | | | | | | |
| | | | | | | | | | | | | | | | | | | | | | | | | | | | | | | |
| Notes: | |
| Analysis relates to operating properties owned at the end of the period and reflects TIER REIT’s ownership %. | |
| SF includes all leases for tenants under lease contracts that have commenced during the period. | |
| Rates for expiring leases relate to the lease previously occupying the specific space for which positive absorption was shown or the current lease rate if it is a first generation lease. | |
| Net Rent is equal to the fixed base rental amount paid under the terms of the lease less any portion used to offset real estate taxes, utility charges, and other operating expenses incurred in connection with the leased space. |
| Cash Net Rent disregards any free rent periods. Therefore, the rate shown is first full monthly cash rent paid. | |
| The impact of short term temporary leasing activity is excluded from the analysis of % increase of Cash Net Rent and % increase of Straight-lined Net Rent. | |
|
| | |
Supplemental Operating and Financial Data | | 3Q’18 Page 16 |
|
| | | | | | | | | | | | | | | | | | | | | | | | | |
| Lease Expirations |
| For Four Quarters From October 1, 2018 |
| (in thousands, except per SF data) |
| | | | | | | | | | | | | | |
| | Market | | Month to Month | | 4Q'18 | | 1Q'19 | | 2Q'19 | | 3Q'19 | | Grand Total |
| | | | | | | | | | | | | | |
| | By Square Foot | | | | | | | | | | | | |
| | Austin | | 15 |
| | 4 |
| | 8 |
| | 54 |
| | 5 |
| | 86 |
|
| | Dallas/Fort Worth | | 12 |
| | 4 |
| | 12 |
| | 1 |
| | — |
| | 29 |
|
| | Houston | | — |
| | 30 |
| | 21 |
| | 223 |
| | 30 |
| | 304 |
|
| | Charlotte | | — |
| | 3 |
| | 42 |
| | 1 |
| | 43 |
| | 89 |
|
| | Nashville | | 1 |
| | 2 |
| | — |
| | — |
| | — |
| | 3 |
|
| | Other | | — |
| | — |
| | — |
| | — |
| | — |
| | — |
|
| | Total | | 28 |
| | 43 |
| | 83 |
| | 279 |
| | 78 |
| | 511 |
|
| | | | | | | | | | | | | | |
| | By Annualized Expiring Rentals | | | | | | | | |
| | Austin | | $ | 559 |
| | $ | 146 |
| | $ | 336 |
| | $ | 2,146 |
| | $ | 174 |
| | $ | 3,361 |
|
| | Dallas/Fort Worth | | 264 |
| | 58 |
| | 393 |
| | 53 |
| | — |
| | 768 |
|
| | Houston | | — |
| | 1,342 |
| | 690 |
| | 9,706 |
| | 1,199 |
| | 12,937 |
|
| | Charlotte | | — |
| | 135 |
| | 963 |
| | 60 |
| | 986 |
| | 2,144 |
|
| | Nashville | | 10 |
| | 40 |
| | — |
| | — |
| | — |
| | 50 |
|
| | Other | | — |
| | — |
| | — |
| | — |
| | — |
| | — |
|
| | Total | | $ | 833 |
| | $ | 1,721 |
| | $ | 2,382 |
| | $ | 11,965 |
| | $ | 2,359 |
| | $ | 19,260 |
|
| | | | | | | | | | | | | | |
| | By Expiring Rent Per SF | | | | | | | | | | | | |
| | Austin | | $ | 37.52 |
| | $ | 38.42 |
| | $ | 40.00 |
| | $ | 39.81 |
| | $ | 36.25 |
| | $ | 39.17 |
|
| | Dallas/Fort Worth | | $ | 22.56 |
| | $ | 14.50 |
| | $ | 32.21 |
| | $ | 40.77 |
| | $ | — |
| | $ | 26.30 |
|
| | Houston | | $ | — |
| | $ | 45.80 |
| | $ | 33.01 |
| | $ | 43.56 |
| | $ | 39.83 |
| | $ | 42.68 |
|
| | Charlotte | | $ | — |
| | $ | 46.55 |
| | $ | 22.77 |
| | $ | 42.86 |
| | $ | 22.77 |
| | $ | 23.85 |
|
| | Nashville | | $ | 16.67 |
| | $ | 19.05 |
| | $ | — |
| | $ | — |
| | $ | — |
| | $ | 18.52 |
|
| | Other | | $ | — |
| | $ | — |
| | $ | — |
| | $ | — |
| | $ | — |
| | $ | — |
|
| | Total | | $ | 29.75 |
| | $ | 40.02 |
| | $ | 28.70 |
| | $ | 42.89 |
| | $ | 30.24 |
| | $ | 37.69 |
|
| | | | | | | | | | | | | | |
| | | | | | | | | | | | | | |
| Notes: | |
| Leases with an expiration on the last day of the period are considered leased at the last day of the period (i.e., expiring on the first day of the following period). |
| Reflects TIER REIT’s ownership %. |
| Rentals shown above are the contractually obligated annualized base rent charged in the final month prior to lease termination grossed up to include current operating cost recoveries. |
| Annualized expiring rentals may include rent related to parking management agreements where square footage is zero. |
| |
|
| | |
Supplemental Operating and Financial Data | | 3Q’18 Page 17 |
|
| | | | | | | | | | | | | | | | | | | | | | | | | | | | | | | | | | | | | | | | | | | | | | | | |
| Lease Expirations |
| Annually From October 1, 2018 |
| (in thousands, except percentage and per SF data) |
| | | | | | | | | | | | | | | | | | | | | | | | | |
| | | | | | | | | | | | | | | | | | | | | | | | | |
| | Market | 2018 | | 2019 |
| 2020 |
| 2021 |
| 2022 |
| 2023 | | 2024 | | 2025 |
| 2026 |
| 2027 |
| 2028+ | | Grand Total |
| | By Square Foot | | | | | | | | | | | | | | | | | | | | | | | |
| | Austin | 19 |
| | 146 |
| | 216 |
| | 82 |
| | 250 |
| | 275 |
| | 141 |
| | 165 |
| | 207 |
| | 180 |
| | 44 |
| | 1,722 |
|
| | Dallas/Fort Worth | 16 |
| | 31 |
| | 169 |
| | 72 |
| | 44 |
| | 164 |
| | 30 |
| | 27 |
| | 390 |
| | 319 |
| | 114 |
| | 1,376 |
|
| | Houston | 30 |
| | 274 |
| | 247 |
| | 90 |
| | 45 |
| | 63 |
| | 277 |
| | 20 |
| | 176 |
| | — |
| | 97 |
| | 1,317 |
|
| | Charlotte | 3 |
| | 87 |
| | 29 |
| | 333 |
| | 17 |
| | 86 |
| | 37 |
| | 5 |
| | 25 |
| | 3 |
| | 231 |
| | 855 |
|
| | Nashville | 3 |
| | 3 |
| | 2 |
| | 60 |
| | 20 |
| | 17 |
| | 4 |
| | 22 |
| | — |
| | — |
| | 200 |
| | 332 |
|
| | Other | — |
| | 39 |
| | 244 |
| | 93 |
| | — |
| | — |
| | — |
| | — |
| | — |
| | — |
| | — |
| | 375 |
|
| | Total | 71 |
| | 580 |
| | 907 |
| | 730 |
| | 376 |
| | 605 |
| | 489 |
| | 239 |
| | 798 |
| | 502 |
| | 686 |
| | 5,977 |
|
| | As a % of Occupied SF | 1 | % | | 10 | % | | 15 | % | | 12 | % | | 6 | % | | 10 | % | | 8 | % | | 4 | % | | 14 | % | | 9 | % | | 11 | % | | 100 | % |
| | As a % of Total NRA | 1 | % | | 9 | % | | 14 | % | | 11 | % | | 6 | % | | 9 | % | | 7 | % | | 4 | % | | 12 | % | | 7 | % | | 10 | % | | 90 | % |
| | | | | | | | | | | | | | | | | | | | | | | | | |
| | By Annualized Expiring Rentals | | | | | | | | | | | | | | | | | | | | | | | |
| | Austin | $ | 705 |
| | $ | 5,552 |
| | $ | 8,954 |
| | $ | 3,823 |
| | $ | 11,423 |
| | $ | 12,004 |
| | $ | 6,053 |
| | $ | 8,472 |
| | $ | 9,916 |
| | $ | 9,634 |
| | $ | 1,809 |
| | $ | 78,345 |
|
| | Dallas/Fort Worth | 322 |
| | 918 |
| | 5,102 |
| | 2,684 |
| | 1,238 |
| | 4,957 |
| | 1,023 |
| | 821 |
| | 11,281 |
| | 13,242 |
| | 3,045 |
| | 44,633 |
|
| | Houston | 1,342 |
| | 11,595 |
| | 9,532 |
| | 3,777 |
| | 2,096 |
| | 2,756 |
| | 12,295 |
| | 791 |
| | 8,230 |
| | — |
| | 3,781 |
| | 56,195 |
|
| | Charlotte | 135 |
| | 2,009 |
| | 997 |
| | 8,981 |
| | 635 |
| | 3,222 |
| | 535 |
| | 295 |
| | 1,058 |
| | 147 |
| | 8,383 |
| | 26,397 |
|
| | Nashville | 50 |
| | 68 |
| | 45 |
| | 1,201 |
| | 438 |
| | 398 |
| | 88 |
| | 544 |
| | — |
| | — |
| | 4,532 |
| | 7,364 |
|
| | Other | — |
| | 938 |
| | 6,634 |
| | 2,510 |
| | — |
| | — |
| | — |
| | — |
| | — |
| | — |
| | 4 |
| | 10,086 |
|
| | Total | $ | 2,554 |
| | $ | 21,080 |
| | $ | 31,264 |
| | $ | 22,976 |
| | $ | 15,830 |
| | $ | 23,337 |
| | $ | 19,994 |
| | $ | 10,923 |
| | $ | 30,485 |
| | $ | 23,023 |
| | $ | 21,554 |
| | $ | 223,020 |
|
| | As a % of Total Annualized Expiring Rentals | 1 | % | | 9 | % | | 14 | % | | 10 | % | | 7 | % | | 11 | % | | 9 | % | | 5 | % | | 14 | % | | 10 | % | | 10 | % | | 100 | % |
| | | | | | | | | | | | | | | | | | | | | | | | | |
| | By Expiring Rent Per SF | | | | | | | | | | | | | | | | | | | | | | | |
| | Austin | $ | 37.70 |
| | $ | 38.16 |
| | $ | 41.40 |
| | $ | 46.45 |
| | $ | 45.89 |
| | $ | 43.65 |
| | $ | 42.93 |
| | $ | 51.63 |
| | $ | 47.97 |
| | $ | 53.52 |
| | $ | 41.59 |
| | $ | 45.50 |
|
| | Dallas/Fort Worth | $ | 20.51 |
| | $ | 29.61 |
| | $ | 30.05 |
| | $ | 37.49 |
| | $ | 27.82 |
| | $ | 30.15 |
| | $ | 34.10 |
| | $ | 30.52 |
| | $ | 28.93 |
| | $ | 41.59 |
| | $ | 26.64 |
| | $ | 32.42 |
|
| | Houston | $ | 45.80 |
| | $ | 42.35 |
| | $ | 38.42 |
| | $ | 41.83 |
| | $ | 45.76 |
| | $ | 44.03 |
| | $ | 44.43 |
| | $ | 40.15 |
| | $ | 46.76 |
| | $ | — |
| | $ | 39.47 |
| | $ | 42.63 |
|
| | Charlotte | $ | 46.55 |
| | $ | 23.09 |
| | $ | 34.38 |
| | $ | 26.97 |
| | $ | 38.25 |
| | $ | 37.29 |
| | $ | 14.62 |
| | $ | 54.63 |
| | $ | 42.15 |
| | $ | 47.42 |
| | $ | 36.32 |
| | $ | 30.84 |
|
| | Nashville | $ | 18.52 |
| | $ | 20.61 |
| | $ | 21.43 |
| | $ | 20.22 |
| | $ | 21.79 |
| | $ | 23.01 |
| | $ | 21.46 |
| | $ | 23.86 |
| | $ | — |
| | $ | — |
| | $ | 22.64 |
| | $ | 22.18 |
|
| | Other | $ | — |
| | $ | 24.30 |
| | $ | 27.24 |
| | $ | 26.99 |
| | $ | — |
| | $ | — |
| | $ | — |
| | $ | — |
| | $ | — |
| | $ | — |
| | $ | 20.00 |
| | $ | 26.87 |
|
| | Total | $ | 35.97 |
| | $ | 36.34 |
| | $ | 34.47 |
| | $ | 31.47 |
| | $ | 42.10 |
| | $ | 38.57 |
| | $ | 40.89 |
| | $ | 45.70 |
| | $ | 38.20 |
| | $ | 45.86 |
| | $ | 31.42 |
| | $ | 37.31 |
|
| | | | | | | | | | | | | | | | | | | | | | | | | |
| | | | | | | | | | | | | | | | | | | | | | | | | |
| | | | | | | | | | | | | | | | | | | | | | | | | |
| | | | | | | | | | | | | | | | | | | | | | | | | |
| | | | | | | | | | | | | | | | | | | | | | | | | |
| | | | | | | | | | | | | | | | | | | | | | | | | |
| | | | | | | | | | | | | | | | | | | | | | | | | |
| | | | | | | | | | | | | | | | | | | | | | | | | |
| | | | | | | | | | | | | | | | | | | | | | | | | |
| | | | | | | | | | | | | | | | | | | | | | | | | |
| | Notes: | | | | | | | | | | | | | | | | | | | | | | | |
| | Leases with an expiration on the last day of the period are considered leased at the last day of the period (i.e., expiring on the first day of the following period). | | | | |
| | Reflects TIER REIT’s ownership %. | | | | | | | | | | | | | | |
| | Rentals shown above are the contractually obligated annualized base rent charged in the final month prior to lease termination grossed up to include current operating cost recoveries. |
| | Annualized expiring rentals may include rent related to parking management agreements where square footage is zero. |
| | |
|
| | |
Supplemental Operating and Financial Data | | 3Q’18 Page 18 |
|
| | | | | | | | | | | | | | | | | | |
| Occupancy Trends |
| |
| | | | | | | | | | | | | |
| | | | | | | | | | | | | |
| | | Rentable SF (000’s) | | Occupancy % |
| Market | | 30-Sep-18 | | 30-Sep-18 | | 30-Jun-18 | | 31-Mar-18 | | 31-Dec-17 | | 30-Sep-17 |
| | | | | | | | | | | | | |
| Austin | | 1,795 |
| | 95.9 | % | | 95.8 | % | | 95.4 | % | | 95.8 | % | | 95.0 | % |
| Dallas/Fort Worth | | 1,541 |
| | 89.3 | % | | 90.5 | % | | 91.0 | % | | 92.1 | % | | 90.3 | % |
| Houston | | 1,659 |
| | 79.4 | % | | 75.8 | % | | 76.3 | % | | 76.4 | % | | 75.8 | % |
| Charlotte | | 891 |
| | 96.0 | % | | 96.0 | % | | 95.6 | % | | 95.8 | % | | 95.8 | % |
| Nashville | | 361 |
| | 92.0 | % | | 90.9 | % | | 90.3 | % | | 90.3 | % | | 87.5 | % |
| Other | | 386 |
| | 97.2 | % | | 97.2 | % | | 97.2 | % | | 97.2 | % | | 97.2 | % |
| Total | | 6,633 |
| | 90.1 | % | | 89.4 | % | | 89.4 | % | | 89.5 | % | | 88.6 | % |
| | | | | | | | | | | | | |
| Notes: | | | | | | | | | | | | |
| Analysis relates to operating properties owned at the end of the most recent period and reflects TIER REIT’s ownership %. |
| Occupancy % is as of the last day of the indicated period. |
| |
|
| | |
Supplemental Operating and Financial Data | | 3Q’18 Page 19 |
|
| | | | | | | | | | | | | | | | | | | | | | | | | | | | | | |
| Leasing Cost Summary |
| For the Three Months Ended |
| September 30, 2018 |
| | | | | | | | | | | | | | | | | |
| | | | | | | Weighted Average Leasing Costs |
| | | SF (000’s) | | Wtd Avg Term (Yrs) | | Per Square Foot | | Per Square Foot / Year |
| Renewal | | | | Comms | | TI & Other | | Total | | Comms | | TI & Other | | Total |
| Market | | | | | | | | | | | | | | | | |
| Austin | | 5 |
| | 5.0 |
| | $ | 9.36 |
| | $ | 4.48 |
| | $ | 13.84 |
| | $ | 1.87 |
| | $ | 0.90 |
| | $ | 2.77 |
|
| Dallas/Fort Worth | | 1 |
| | 1.3 |
| | $ | 1.41 |
| | $ | — |
| | $ | 1.41 |
| | $ | 1.08 |
| | $ | — |
| | $ | 1.08 |
|
| Houston | | 17 |
| | 8.8 |
| | $ | 5.07 |
| | $ | 21.44 |
| | $ | 26.51 |
| | $ | 0.58 |
| | $ | 2.44 |
| | $ | 3.01 |
|
| Charlotte | | 3 |
| | 5.0 |
| | $ | 3.36 |
| | $ | 3.98 |
| | $ | 7.34 |
| | $ | 0.67 |
| | $ | 0.80 |
| | $ | 1.47 |
|
| Nashville | | — |
| | — |
| | $ | — |
| | $ | — |
| | $ | — |
| | $ | — |
| | $ | — |
| | $ | — |
|
| Other | | — |
| | — |
| | $ | — |
| | $ | — |
| | $ | — |
| | $ | — |
| | $ | — |
| | $ | — |
|
| Total Current Quarter | | 26 |
| | 7.3 |
| | $ | 5.56 |
| | $ | 15.34 |
| | $ | 20.90 |
| | $ | 0.76 |
| | $ | 2.09 |
| | $ | 2.85 |
|
| Q2 2018 | | 48 |
| | 6.7 |
| | $ | 6.73 |
| | $ | 2.02 |
| | $ | 8.75 |
| | $ | 1.01 |
| | $ | 0.30 |
| | $ | 1.31 |
|
| Q1 2018 | | 56 |
| | 6.1 |
| | $ | 13.02 |
| | $ | 11.20 |
| | $ | 24.22 |
| | $ | 2.13 |
| | $ | 1.84 |
| | $ | 3.97 |
|
| Year to Date 2018 | | 130 |
| | 6.6 |
| | $ | 9.2 |
| | $ | 8.64 |
| | $ | 17.84 |
| | $ | 1.44 |
| | $ | 1.32 |
| | $ | 2.76 |
|
| Year Ended 2017 | | 918 |
| | 5.5 |
| | $ | 6.18 |
| | $ | 11.53 |
| | $ | 17.71 |
| | $ | 1.07 |
| | $ | 1.83 |
| | $ | 2.90 |
|
| | | | | | | | | | | | | | | | | |
| Expansion | | | | | | | | | | | | | | | | |
| Market | | | | | | | | | | | | | | | | |
| Austin | | 14 |
| | 6.7 |
| | $ | 18.07 |
| | $ | 37.36 |
| | $ | 55.43 |
| | $ | 2.70 |
| | $ | 5.54 |
| | $ | 8.24 |
|
| Dallas/Fort Worth | | 5 |
| | 3.1 |
| | $ | 8.58 |
| | $ | 25.83 |
| | $ | 34.41 |
| | $ | 2.77 |
| | $ | 8.33 |
| | $ | 11.10 |
|
| Houston | | — |
| | — |
| | $ | — |
| | $ | — |
| | $ | — |
| | $ | — |
| | $ | — |
| | $ | — |
|
| Charlotte | | — |
| | — |
| | $ | — |
| | $ | — |
| | $ | — |
| | $ | — |
| | $ | — |
| | $ | — |
|
| Nashville | | — |
| | — |
| | $ | — |
| | $ | — |
| | $ | — |
| | $ | — |
| | $ | — |
| | $ | — |
|
| Other | | — |
| | — |
| | $ | — |
| | $ | — |
| | $ | — |
| | $ | — |
| | $ | — |
| | $ | — |
|
| Total Current Quarter | | 19 |
| | 5.7 |
| | $ | 15.57 |
| | $ | 34.33 |
| | $ | 49.90 |
| | $ | 2.71 |
| | $ | 5.98 |
| | $ | 8.69 |
|
| Q2 2018 | | 23 |
| | 5.5 |
| | $ | 3.13 |
| | $ | 5.08 |
| | $ | 8.21 |
| | $ | 0.57 |
| | $ | 0.93 |
| | $ | 1.50 |
|
| Q1 2018 | | 1 |
| | 2.9 |
| | $ | 8.22 |
| | $ | 7.32 |
| | $ | 15.54 |
| | $ | 2.84 |
| | $ | 2.52 |
| | $ | 5.36 |
|
| Year to Date 2018 | | 43 |
| | 5.5 |
| | $ | 8.75 |
| | $ | 18.05 |
| | $ | 26.8 |
| | $ | 1.57 |
| | $ | 3.2 |
| | $ | 4.77 |
|
| Year Ended 2017 | | 62 |
| | 5.8 |
| | $ | 13.24 |
| | $ | 21.35 |
| | $ | 34.59 |
| | $ | 2.33 |
| | $ | 3.69 |
| | $ | 6.02 |
|
| | | | | | | | | | | | | | | | | |
| New | | | | | | | | | | | | | | | | |
| Market | | | | | | | | | | | | | | | | |
| Austin | | 8 |
| | 5.2 |
| | $ | 14.65 |
| | $ | 20.56 |
| | $ | 35.21 |
| | $ | 2.82 |
| | $ | 3.95 |
| | $ | 6.77 |
|
| Dallas/Fort Worth | | 4 |
| | 7.3 |
| | $ | 20.56 |
| | $ | 13.22 |
| | $ | 33.78 |
| | $ | 2.82 |
| | $ | 1.81 |
| | $ | 4.63 |
|
| Houston | | 59 |
| | 11.1 |
| | $ | 23.90 |
| | $ | 116.13 |
| | $ | 140.03 |
| | $ | 2.15 |
| | $ | 10.46 |
| | $ | 12.62 |
|
| Charlotte | | — |
| | — |
| | $ | — |
| | $ | — |
| | $ | — |
| | $ | — |
| | $ | — |
| | $ | — |
|
| Nashville | | 4 |
| | 5.1 |
| | $ | 6.95 |
| | $ | 12.16 |
| | $ | 19.11 |
| | $ | 1.36 |
| | $ | 2.38 |
| | $ | 3.75 |
|
| Other | | — |
| | — |
| | $ | — |
| | $ | — |
| | $ | — |
| | $ | — |
| | $ | — |
| | $ | — |
|
| Total Current Quarter | | 75 |
| | 9.9 |
| | $ | 21.83 |
| | $ | 94.90 |
| | $ | 116.73 |
| | $ | 2.19 |
| | $ | 9.54 |
| | $ | 11.73 |
|
| Q2 2018 | | 23 |
| | 8.1 |
| | $ | 9.89 |
| | $ | 24.04 |
| | $ | 33.93 |
| | $ | 1.22 |
| | $ | 2.98 |
| | $ | 4.20 |
|
| Q1 2018 | | 11 |
| | 6.4 |
| | $ | 12.55 |
| | $ | 34.36 |
| | $ | 46.91 |
| | $ | 1.96 |
| | $ | 5.38 |
| | $ | 7.34 |
|
| Year to Date 2018 | | 109 |
| | 9.2 |
| | $ | 18.37 |
| | $ | 73.84 |
| | $ | 92.21 |
| | $ | 1.96 |
| | $ | 7.74 |
| | $ | 9.70 |
|
| Year Ended 2017 | | 312 |
| | 7.6 |
| | $ | 15.55 |
| | $ | 43.29 |
| | $ | 58.84 |
| | $ | 2.05 |
| | $ | 5.73 |
| | $ | 7.78 |
|
| | | | | | | | | | | | | | | | | |
| Total | | | | | | | | | | | | | | | | |
| Current Quarter | | 120 |
| | 8.7 |
| | $ | 17.32 |
| | $ | 68.07 |
| | $ | 85.39 |
| | $ | 1.98 |
| | $ | 7.81 |
| | $ | 9.79 |
|
| Q2 2018 | | 94 |
| | 6.7 |
| | $ | 6.62 |
| | $ | 8.16 |
| | $ | 14.78 |
| | $ | 0.99 |
| | $ | 1.21 |
| | $ | 2.20 |
|
| Q1 2018 | | 68 |
| | 6.1 |
| | $ | 12.87 |
| | $ | 14.90 |
| | $ | 27.77 |
| | $ | 2.11 |
| | $ | 2.44 |
| | $ | 4.55 |
|
| Year to Date 2018 | | 282 |
| | 7.4 |
| | $ | 12.68 |
| | $ | 35.28 |
| | $ | 47.96 |
| | $ | 1.70 |
| | $ | 4.75 |
| | $ | 6.45 |
|
| Year Ended 2017 | | 1,292 |
| | 6.0 |
| | $ | 8.78 |
| | $ | 19.67 |
| | $ | 28.45 |
| | $ | 1.45 |
| | $ | 3.26 |
| | $ | 4.71 |
|
| | | | | | | | | | | | | | | | | |
| Notes: | | | | | | | | | | | | | | | | |
| Analysis relates to operating properties owned at the end of the indicated period and reflects TIER REIT’s ownership %. |
|
| | |
Supplemental Operating and Financial Data | | 3Q’18 Page 20 |
|
| | | | | | | | | | | | | | | | | | | | | |
| | Development, Leasing, and |
| | Capital Expenditures Summary |
| | (in thousands) |
| | | | | | | | | | | | |
| | | | | | | | | | | | |
| | | | For the Three Months Ended |
| | | | 30-Sep-18 | | 30-Jun-18 | | 31-Mar-18 | | 31-Dec-17 | | 30-Sep-17 |
| | | | | | | | | | | | |
| | Recurring capital expenditures | | | | | | | | | | |
| | Leasing costs | | $ | 2,011 |
| | $ | 1,905 |
| | $ | 5,345 |
| | $ | 5,199 |
| | $ | 9,065 |
|
| | Building improvements | | 1,241 |
| | 432 |
| | 847 |
| | 910 |
| | 1,206 |
|
| | Subtotal recurring capital expenditures | | 3,252 |
| | 2,337 |
| | 6,192 |
| | 6,109 |
| | 10,271 |
|
| | | | | | | | | | | | |
| | Non-recurring capital expenditures | | | | | | | | |
| | Building improvements (1) | | 2,591 |
| | 772 |
| | 4,461 |
| | 2,751 |
| | 150 |
|
| | Leasing costs (2) | | 4,025 |
| | 1,295 |
| | 1,351 |
| | 1,039 |
| | 3,218 |
|
| | Development (3) | | 30,518 |
| | 26,826 |
| | 29,512 |
| | 24,361 |
| | 18,389 |
|
| | Redevelopment (4) | | 187 |
| | 906 |
| | 967 |
| | 1,444 |
| | 603 |
|
| | Subtotal non-recurring capital expenditures | | 37,321 |
| | 29,799 |
| | 36,291 |
| | 29,595 |
| | 22,360 |
|
| | | | | | | | | | | | |
| | Total capital expenditures | | $ | 40,573 |
| | $ | 32,136 |
| | $ | 42,483 |
| | $ | 35,704 |
| | $ | 32,631 |
|
| | | | | | | | | | | | |
| | | | | | | | | | | |
| (1) | Non-recurring building improvements include costs identified as deferred capital needs at the acquisition of a property and costs incurred to improve the Eldridge Properties as a result of Hurricane Harvey, which has been identified as an unusual event. Costs incurred to improve the Eldridge Properties for such damages should be recoverable under our insurance policies and were as follows: |
| | | | $ | 2,034 |
| | $ | 417 |
| | $ | 4,461 |
| | $ | 2,751 |
| | $ | 150 |
|
| (2) | Non-recurring leasing costs include costs incurred within 12 months of acquisition to lease space and costs incurred to lease space that has been vacant for at least 12 months. Cost incurred within 12 months of acquisition to lease space were as follows: |
| | | | $ | 371 |
| | $ | — |
| | $ | — |
| | $ | — |
| | $ | — |
|
| (3) | Development includes all new construction costs related to base building and all costs associated with leasing development projects. |
| (4) | Redevelopment costs are for capital projects where substantial improvements are made to the property that change the character of the asset and are expected to result in development-type returns on capital. |
| | | | | | | | | | | | |
| Notes: | | | | | | | | | | |
| All amounts represent TIER REIT’s ownership %. |
| Leasing costs reimbursed to us by tenants when tenant improvement allowances have been exceeded are excluded from the above amounts. |
| | | | | | | | | | | | |
|
| | |
Supplemental Operating and Financial Data | | 3Q’18 Page 21 |
|
| | | | | | | | | | | | |
| Potential Future Development and Redevelopment Sites |
| September 30, 2018 |
| | | | | | | | | | | |
| | | | | | | | | | | |
| | | | | Approximate Rentable Square Feet | | Month of Acquisition | | Cost Basis (in millions) | | |
| Project | | Acres | | | | | Comments |
| | | | | | | | | | | |
| Development | | | | | | | | | | |
| Austin | | | | | | | | | | |
| Domain 9 and Domain 10 | | 6.2 | | 630,000 | | Jul-15 | | $ | 17.0 |
| | Office building (Domain 10 commenced development in October 2018) |
| Domain D & G | | 5.6 | | 600,000 | | Jul-15 | | $ | 9.9 |
| | Office building(s) |
| | | | | | | | | | | |
| Dallas/Fort Worth | | | | | | | | | | |
| Legacy Union Two and Legacy Union Three (95%) (1) | | 4.0 | | 600,000 | | Jun-15 | | $ | 10.0 |
| | Office building(s) |
| Burnett Plaza | | 1.4 | | N/A | | Jan-07 | | $ | 3.4 |
| | Planned mixed-use development and parking garage for use at Burnett Plaza |
| | | | | | | | | | | |
| Redevelopment (2) | | | | | | | | | | |
| Austin | | | | | | | | | | |
| Domain 3 and Domain 4 | | 8.8 | | 2,000,000 | | Jul-15 | | N/A |
| | Potential mixed-use redevelopment opportunity |
| Domain Point (90%) | | 9.5 | | 1,000,000 | | Jan-18 | | N/A |
| | Potential mixed-use redevelopment opportunity |
| | | | | | | | | | | |
| (1) The cost basis for this less than wholly-owned project represents 100%. |
| (2) Excludes 0.6 million of existing rentable square feet. |
|
| | |
Supplemental Operating and Financial Data | | 3Q’18 Page 22 |
|
| | | | | | | | | | | | | | | | | | | | |
| Summary Development Activity |
| September 30, 2018 |
| | | | | | | | | | | | | | | | | | | | | |
| | | | | | | | | | | | | | | | | | | | | |
| | | | | | | | | | | Estimated Shell Delivery Date | | | | Estimated Total Cost (in millions) (1) | | Cost to Date (in millions) (1) | | Estimated Stabilized NOI (in millions) | | Estimated Stabilized Cash NOI (in millions) |
| Project | | Market | | Square feet (in thousands) | | % Leased | | Start Date | | | Estimated Cost per SF | | | | |
| | | | | | | | | | | | | | | | | | | | | |
| In Process: | | | | | | | | | | | |
| | | | | | | | |
| Domain 12 | | Austin | | 320 | | 100% | | 2Q’18 | | 4Q’19 | | $379 | | $121.4 | | $29.2 | | $11.4 | | $11.4 |
| Domain 11 | | Austin | | 324 | | 98% | | 2Q’17 | | 4Q’18 | | $352 | | $114.2 | | $81.7 | | $10.7 | | $10.9 |
| Third + Shoal | | Austin | | 345 | | 100% | | 1Q’17 | | 3Q’18 | | $451 | | $155.7 | | $118.5 | | $14.6 | | $14.4 |
| | | | | | | | | | | | | | | | | | | | | |
| Completed in the Past 18 Months: | | | | | | | | | | | | | | | | |
| Domain 8 (2) | | Austin | | 291 | | 100% | | 3Q’15 | | 2Q’17 | | $290 | | $84.4 | | $84.4 | | $11.0 | | $9.5 |
| | | | | |
| (1) Reflects development cost at the asset level. Excludes basis adjustment of $6.2 million to date and $6.3 million estimated in total for Third + Shoal. Excludes basis adjustment of $4.3 million in total for Domain 8. On March 30, 2018, we acquired the remaining 50% interest in Domain 8, increasing our ownership interest in the property to 100%. |
| (2) Estimated stabilized NOI for Domain 8 includes amortization income/(expense) as a result of stepping up our basis to fair value related to our acquisition of the remaining interest. |
| |
| All amounts above are reflected at 100%. |
|
| | | | | | | | | | | | | | | | |
| Percent of Expected Stabilized NOI by quarter |
| Project | | 4Q'18 | | 1Q'19 | | 2Q'19 | | 3Q’19 | | 4Q’19 | | 2020 | | 2021 | | 2022 |
| Domain 12 | | — | | — | | — | | — | | 46% | | 73% | | 93% | | 100% |
| Domain 11 | | 23% | | 60% | | 59% | | 79% | | 79% | | 86% | | 95% | | 100% |
| Third + Shoal | | 48% | | 61% | | 66% | | 86% | | 93% | | 100% | | 100% | | 100% |
| Domain 8 | | 95% | | 100% | | 100% | | 100% | | 100% | | 100% | | 100% | | 100% |
| | | | | | | | | | | | | | | | | |
Represents expected NOI as a percentage of estimated stabilized NOI based on current executed leases and other forecasted leasing.
|
| | | | | | | | | | | | | | | | |
| Percent of Expected Stabilized Cash NOI by quarter |
| Project | | 4Q'18 | | 1Q'19 | | 2Q'19 | | 3Q’19 | | 4Q’19 | | 2020 | | 2021 | | 2022 |
| Domain 12 | | — | | — | | — | | — | | (21)% | | (3)% | | 74% | | 100% |
| Domain 11 | | (9)% | | (37)% | | (40)% | | 33% | | 32% | | 53% | | 84% | | 100% |
| Third + Shoal | | (16)% | | (32)% | | (27)% | | 58% | | 79% | | 96% | | 100% | | 100% |
| Domain 8 | | 84% | | 98% | | 98% | | 100% | | 100% | | 100% | | 100% | | 100% |
| | | | | | | | | | | | | | | | | |
Represents expected adjusted cash NOI as a percentage of estimated stabilized NOI based on current executed leases and other forecasted leasing. Adjusted cash NOI excludes non-cash revenue items including straight-line rent adjustments and the amortization of above- and below-market rent.
Negative percentages occur when expenses are incurred for tenants during a free rent period.
|
| | |
Supplemental Operating and Financial Data | | 3Q’18 Page 23 |
Property Under Development
Third + Shoal
Austin, Texas
Property Description
Third + Shoal is a 29-story, Class A office building in the center of Austin’s “New Downtown” district. The building is constructed of poured in place concrete along with a glass curtain wall system. The building is 100% leased in total with 74% leased to Facebook, Inc.
Property Highlights
Located in Austin’s “New Downtown” district surrounded by restaurants, entertainment, and residences, just steps away from outdoor amenities such as The Lance Armstrong Bikeway, Shoal Creek Trail, and Lady Bird Lake Hike and Bike Trail. The building features floor-to-ceiling glass windows, direct access balconies, and a 4,000 square foot common roof terrace overlooking Lady Bird Lake and the Austin Hill Country.
Property Facts
|
| | | |
| Submarket | | Austin CBD |
|
| Floors | | 17 Floors Rentable Space/12 Floors Parking |
|
| Approximate Rentable SF | | 345,000 |
|
| Estimated Operating Expenses per SF | | $22.13 |
| Shell Delivery Date to Tenants | | 3Q’18 |
|
| Estimated Project Cost at Completion (1) | | $155,700,000 |
| Percentage Owned | | 47.5 | % |
| Percentage Leased | | 99.7 | % |
| | | |
| (1) Excludes $6.3 million basis adjustment. |
|
| | |
Supplemental Operating and Financial Data | | 3Q’18 Page 24 |
Property Under Development
Domain 10
Austin, Texas
(rendering)
Property Description
Domain 10 is a 15-story, Class A office building currently under development located within The Domain in Austin, Texas. It offers 300,000 square feet of office space, along with dramatic views of the surrounding Domain community and Texas Hill Country. Domain 10 was designed to achieve a minimum LEED Silver and Energy Star designations. Development on Domain 10 commenced in October 2018.
Property Highlights
The Domain is the epitome of upscale “live, work, play,” spread across 300 acres in Northwest Austin. The community currently includes 1.7 million square feet of office space that commands the highest Class A office rents in Austin outside the city’s CBD. In addition to office space, The Domain offers 1.8 million square feet of retail, 775 hotel rooms, and up to 5,000 apartment units.
Property Facts
|
| | | |
| Submarket | | The Domain |
|
| Floors | | 8 Floors Rentable Space/7 Floors Parking |
|
| Approximate Rentable SF | | 300,000 |
|
| Estimated Operating Expenses per SF | | $16.58 |
| Estimated Shell Delivery Date to Tenants | | 2Q’20 |
|
| Estimated Project Cost at Completion | | $116,200,000 |
| Percentage Owned | | 100 | % |
| Percentage Leased | | — | % |
| | | |
|
| | |
Supplemental Operating and Financial Data | | 3Q’18 Page 25 |
Property Under Development
Domain 11
Austin, Texas
Property Description
Domain 11 is a 16-story, Class A office building currently under development located within The Domain in Austin, Texas. It offers 316,000 square feet of office space and 8,000 square feet of ground floor retail, along with dramatic views of the surrounding Domain community and Texas Hill Country. Domain 11 was designed to achieve a minimum LEED Silver and Energy Star designations. The available office space is 100% pre-leased to HomeAway (a subsidiary of Expedia Group, Inc.), which represents 98% of the total rentable space.
Property Highlights
The Domain is the epitome of upscale “live, work, play,” spread across 300 acres in Northwest Austin. The community currently includes 1.7 million square feet of office space that commands the highest Class A office rents in Austin outside the city’s CBD. In addition to office space, The Domain offers 1.8 million square feet of retail, 775 hotel rooms, and up to 5,000 apartment units.
Property Facts
|
| | | |
| Submarket | | The Domain |
|
| Floors | | 9 Floors Rentable Space/7 Floors Parking |
|
| Approximate Rentable SF | | 324,000 |
|
| Estimated Operating Expenses per SF | | $17.60 |
| Estimated Shell Delivery Date to Tenants | | 4Q’18 |
|
| Estimated Project Cost at Completion | | $114,200,000 |
| Percentage Owned | | 100 | % |
| Percentage Leased | | 98.0 | % |
| | | |
|
| | |
Supplemental Operating and Financial Data | | 3Q’18 Page 26 |
Property Under Development
Domain 12
Austin, Texas
(rendering)
Property Description
Domain 12 is a 17-story, Class A office building currently under development located within The Domain in Austin, Texas. It will offer 320,000 square feet of office space, along with dramatic views of the surrounding Domain community and Texas Hill Country. Domain 12 was designed to achieve a minimum LEED Silver and Energy Star designations. The building is 100% pre-leased.
Property Highlights
The Domain is the epitome of upscale “live, work, play,” spread across 300 acres in Northwest Austin. The community currently includes 1.7 million square feet of office space that commands the highest Class A office rents in Austin outside the city’s CBD. In addition to office space, The Domain offers 1.8 million square feet of retail, 775 hotel rooms, and up to 5,000 apartment units.
Property Facts |
| | | |
| Submarket | | The Domain |
|
| Floors | | 9 Floors Rentable Space/8 Floors Parking |
|
| Approximate Rentable SF | | 320,000 |
|
| Estimated Operating Expenses per SF | | $16.20 |
| Estimated Shell Delivery Date to Tenants | | 4Q’19 |
|
| Estimated Project Cost at Completion | | $121,400,000 |
| Percentage Owned | | 100 | % |
| Percentage Leased | | 100 | % |
|
| | |
Supplemental Operating and Financial Data | | 3Q’18 Page 27 |
|
| | | | | | | | | | | | | | |
| Acquisition and Disposition Activities |
| For the Twelve Months Ended September 30, 2018 |
| |
| | | | | | | | | | | |
| | | | | | | | | | | |
| | | | | | | | | | | |
| | | | | Number of Properties | | Square Feet (in thousands) (at 100%) | | Transaction Date | | Price (in thousands) |
| | | Location | | | | |
| Acquisitions | | | | | | | | | | |
| Domain Point (1) | | Austin, TX | | 1 |
| | 240 |
| | 1/4/2018 | | $ | 73,800 |
|
| Domain 8 (2) | | Austin, TX | | 1 |
| | 291 |
| | 3/30/2018 | | $ | 92,787 |
|
| | | | | 2 |
| | 531 |
| | | | |
| | | | | | | | | | | |
| Dispositions | | | | | | | | | | |
| 500 East Pratt | | Baltimore, MD | | 1 |
| | 280 |
| | 2/13/2018 | | $ | 60,000 |
|
| Centreport Office Center | | Fort Worth, TX | | 1 |
| | 133 |
| | 2/22/2018 | | $ | 12,696 |
|
| Loop Central | | Houston, TX | | 1 |
| | 575 |
| | 3/27/2018 | | $ | 72,982 |
|
| Fifth Third Center (3) | | Columbus, OH | | 1 |
| | 331 |
| | 8/27/2018 | | N/A |
|
| | | | | 4 |
| | 1,319 |
| | | | |
| | | | | | | | | | | |
| | | | | | | | | | | |
| (1) We acquired a 96.5% initial economic interest in Domain Point. We own a 90% interest in the joint venture entity that owns Domain Point. |
| (2) We acquired the remaining 50% interest in Domain 8, increasing our ownership interest to 100%. |
| (3) Ownership of Fifth Third Center was conveyed to the associated lender pursuant to a foreclosure and was accounted for as a full settlement of the outstanding $48.2 million loan and related interest. |
| |
| |
|
| | |
Supplemental Operating and Financial Data | | 3Q’18 Page 28 |
|
| | | | | | | | | | | | | | | | | | |
| Summary of Financing |
| September 30, 2018 |
| (in thousands, except percentages and number of years) |
| | | | | | | | | | | | | |
| | | | | | Principal | | Weighted Average Effective Interest Rate | | % of Total | | | |
| Fixed Rate Debt | | | | | | | | | | | | |
| Secured mortgage debt | | | | | $ | 142,162 |
| | 5.06% | | 19% | | | |
| Unsecured term loans (1) | | | | | 525,000 |
| | 3.41% | | 72% | | | |
| Total fixed rate debt | | | | | 667,162 |
| | 3.76% | | 91% | | | |
| | | | | | | | | | | | | |
| Variable Rate Debt | | | | | | | | | | | | |
| Unsecured term loan (1) | | | | | 50,000 |
| | 4.20% | | 7% | | | |
| Unsecured revolving credit facility (2) | | | | | 16,000 |
| | 3.50% | | 2% | | | |
| Total variable rate debt | | | | | 66,000 |
| | 4.03% | | 9% | | | |
| Total debt (3) | | | | | 733,162 |
| | 3.79% | | 100% | | | |
| Unamortized debt issuance costs (3) | | | | | (2,029 | ) | | | | | | | |
| Total notes payable, net | | | | | $ | 731,133 |
| | | | | | | |
| | | | | | | | | | | | | |
| (1) The borrowing rate under $525.0 million of the unsecured term loans has been effectively fixed through the use of interest rate hedges. The remaining portion is variable rate. |
| (2) Additional borrowings of $304.6 million were available under the credit facility. |
| (3) Excludes $3.0 million of unamortized debt issuance costs associated with the revolving line of credit because those costs are presented as an asset on our consolidated balance sheet. |
| |
| | Maturities |
| | Secured Mortgage Debt | | Unsecured Revolving Credit Facility and Term Loans | | Total | Annual % Maturing |
| | Principal | | Rate (1) | | Principal | | Rate (1) | | Principal | | Rate (1) |
| 2018 | $ | — |
| | — | | $ | — |
| | — | | $ | — |
| | — | — |
| 2019 | — |
| | — | | — |
| | — | | — |
| | — | — |
| 2020 | — |
| | — | | — |
| | — | | — |
| | — | — |
| 2021 | 76,162 |
| | 5.72% | | — |
| | — | | 76,162 |
| | 5.72% | 10% |
| 2022 | — |
| | — | | 291,000 |
| | 3.23% | | 291,000 |
| | 3.23% | 40% |
| Thereafter | 66,000 |
| | 4.30% | | 300,000 |
| | 3.73% | | 366,000 |
| | 3.83% | 50% |
| Total debt | $ | 142,162 |
| | | | $ | 591,000 |
| | | | 733,162 |
| | 3.79% | 100% |
| Unamortized debt issuance costs | | | | | | | | | (2,029 | ) | | | |
| Total notes payable, net | | | | | | | | | $ | 731,133 |
| | | |
| Weighted average maturity in years | 3.5 |
| | | | 5.0 |
| | | | 4.7 |
| | | |
| | | | | | | | | | | | | |
| (1) Represents weighted average effective interest rate for debt maturing in this period. |
| | |
| | Maturities |
| | Consolidated Debt | | Our share of unconsolidated debt | | Total | Annual % Maturing |
| | Principal | | Rate (1) | | Principal | | Rate (1) | | Principal | | Rate (1) |
| 2018 | $ | — |
| | — | | $ | — |
| | — | | $ | — |
| | — | — |
| 2019 | — |
| | — | | — |
| | — | | — |
| | — | — |
| 2020 | — |
| | — | | — |
| | — | | — |
| | — | — |
| 2021 | 76,162 |
| | 5.72% | | 26,137 |
| | 5.33% | | 102,299 |
| | 5.62% | 13% |
| 2022 | 291,000 |
| | 3.23% | | — |
| | — | | 291,000 |
| | 3.23% | 38% |
| Thereafter | 366,000 |
| | 3.83% | | — |
| | — | | 366,000 |
| | 3.83% | 49% |
| Total debt | 733,162 |
| | | | 26,137 |
| | | | 759,299 |
| | 3.84% | 100% |
| Unamortized debt issuance costs | (2,029 | ) | | | | (590 | ) | | | | (2,619 | ) | | | |
| Total notes payable, net | $ | 731,133 |
| | | | $ | 25,547 |
| | | | $ | 756,680 |
| | | |
| Weighted average maturity in years | 4.7 |
| | | | 3.1 |
| | | | 4.7 |
| | | |
| | | | | | | | | | | | | |
| (1) Represents weighted average effective interest rate for debt maturing in this period. | | | | | |
| |
| Hedging Details: | | | | | | | | | | | | |
| Type/Description | Notional Value | | Index | Strike Rate | | Effective Date | | Maturity Date | | Loan Designation |
| Interest rate swap - cash flow hedge | $ | 125,000 |
| | one-month LIBOR | 1.6775% | | 31-Dec-14 | | 31-Oct-19 | | Credit Facility |
| Interest rate swap - cash flow hedge | $ | 125,000 |
| | one-month LIBOR | 1.6935% | | 30-Apr-15 | | 31-Oct-19 | | Credit Facility |
| Interest rate swap - cash flow hedge | $ | 125,000 |
| | one-month LIBOR | 1.7615% | | 30-Jun-15 | | 31-May-22 | | Credit Facility |
| Interest rate swap - cash flow hedge | $ | 150,000 |
| | one-month LIBOR | 1.7695% | | 30-Jun-15 | | 31-May-22 | | Credit Facility |
| Interest rate swap - cash flow hedge | $ | 62,500 |
| | one-month LIBOR | | 2.8220% | | 31-Oct-19 | | 31-Dec-24 | | Credit Facility |
| Interest rate swap - cash flow hedge | $ | 62,500 |
| | one-month LIBOR | | 2.8230% | | 31-Oct-19 | | 31-Dec-24 | | Credit Facility |
| Interest rate swap - cash flow hedge | $ | 125,000 |
| | one-month LIBOR | | 2.8220% | | 31-Oct-19 | | 31-Dec-24 | | Credit Facility |
|
| | |
Supplemental Operating and Financial Data | | 3Q’18 Page 29 |
|
| | | | | | | | | | | | | | | | | | | | | | | | | | | | | | | | | | | | | |
| | Principal Payments by Year |
| | as of September 30, 2018 |
| | (in thousands, except percentages) |
| | | | | | | | | | | | | | | | | | | | | | |
| | | | | | Stated Interest Rate | | Effective Interest Rate | | | | | | | | | | | | | | |
| | | | Maturity | | | | Total | | 2018 | | 2019 | | 2020 | | 2021 | | 2022 | | Thereafter |
| | | | | | | | | | | | | | | | | | | | | | |
| One BriarLake Plaza | | 01-Aug-21 | | 5.65 | % | | 5.72 | % | | $ | 76,162 |
| | $ | 501 |
| | $ | 1,589 |
| | $ | 1,670 |
| | $ | 72,402 |
| | $ | — |
| | $ | — |
|
| Credit Facility - Revolving Line | | 18-Jan-22 | | 3.45 | % | | 3.50 | % | | 16,000 |
| | — |
| | — |
| | — |
| | — |
| | 16,000 |
| | — |
|
| Credit Facility - Term Loan | | 30-Jun-22 | | 3.17 | % | | 3.21 | % | | 275,000 |
| | — |
| | — |
| | — |
| | — |
| | 275,000 |
| | — |
|
| Legacy Union One | | 01-Jan-23 | | 4.24 | % | | 4.30 | % | | 66,000 |
| | — |
| | — |
| | — |
| | — |
| | — |
| | 66,000 |
|
| Credit Facility - Term Loan | | 17-Jan-25 | | 3.68 | % | | 3.73 | % | | 300,000 |
| | — |
| | — |
| | — |
| | — |
| | — |
| | 300,000 |
|
| Total | | | | 3.74 | % | | 3.79 | % | | 733,162 |
| | 501 |
| | 1,589 |
| | 1,670 |
| | 72,402 |
| | 291,000 |
| | 366,000 |
|
| Unamortized debt issuance costs (1) | | | | | | | | (2,029 | ) | | | | | | | | | | | | |
| Consolidated notes payable, net | | | | | | | | 731,133 |
| | | | | | | | | | | | |
| | | | | | | | | | | | | | | | | | | | | | |
| Notes associated with investments in unconsolidated entities and excluded from the consolidated balance above (at ownership share): |
| Third + Shoal (47.5%) | | 27-Oct-21 | | 5.26 | % | | 5.33 | % | | 26,137 |
| | — |
| | — |
| | — |
| | 26,137 |
| | — |
| | — |
|
| Unamortized debt issuance costs | | | | | | | | (590 | ) | | | | | | | | | | | | |
| Total unconsolidated notes payable, net | | | | | | $ | 25,547 |
| | | | | | | | | | | | |
| | | | | | | | | | | | | | | | | | | | | | |
| Total notes payable | | | | 3.79 | % | | 3.84 | % | | 759,299 |
| | $ | 501 |
| | $ | 1,589 |
| | $ | 1,670 |
| | $ | 98,539 |
| | $ | 291,000 |
| | $ | 366,000 |
|
| Unamortized debt issuance costs | | | | | | | | (2,619 | ) | | | | | | | | | | | | |
| | | | | | | | | | | | | | | | | | | | | |
| Total notes payable, net | | | | | | | | $ | 756,680 |
| | | | | | | | | | | | |
| | | | | | | | | | | | | | | | | | | | | |
| % of principal payments due by year | | | | | | | | 100 | % | | — | % | | — | % | | — | % | | 13 | % | | 38 | % | | 49 | % |
| | | | | | | | | | | | | | | | | | | | | | |
| | | | | | | | | | | | | | | | | | | | | | |
| | |
| | |
| (1) | Excludes $3.0 million of unamortized debt issuance costs associated with the revolving line of credit because those costs are presented as an asset on our consolidated balance sheet. |
| | |
| | |
|
| | |
Supplemental Operating and Financial Data | | 3Q’18 Page 30 |
Definitions of Non-GAAP Financial Measures
We use non-GAAP financial measures in our public filings and other public disclosures. These non-GAAP financial measures are defined below.
Funds from Operations (FFO)
Historical cost accounting for real estate assets in accordance with GAAP implicitly assumes that the value of real estate diminishes predictably over time. Since real estate values have historically risen or fallen with market conditions, many industry investors and analysts have considered the presentation of operating results for real estate companies that use historical cost accounting alone to be insufficient for evaluating operating performance. FFO is a non-GAAP financial measure that is widely recognized as a measure of a REIT’s operating performance. We use FFO as defined by the National Association of Real Estate Investment Trusts (“Nareit”), which is net income (loss), computed in accordance with GAAP, excluding gains (or losses) from sales of property and impairments of depreciable real estate (including impairments of investments in unconsolidated entities that resulted from measurable decreases in the fair value of the depreciable real estate held by the unconsolidated entity), plus depreciation and amortization of real estate assets, and after related adjustments for unconsolidated entities and noncontrolling interests. The determination of whether impairment charges have been incurred is based partly on anticipated operating performance and hold periods. Estimated undiscounted cash flows from a property, derived from estimated future net rental and lease revenues, net proceeds on the sale of the property, and certain other ancillary cash flows, are taken into account in determining whether an impairment charge has been incurred. While impairment charges for depreciable real estate are excluded from net income (loss) in the calculation of FFO as described above, impairments reflect a decline in the value of the applicable property that we may not recover.
We believe that the use of FFO, together with the required GAAP presentations, is helpful in understanding our operating performance because it excludes real estate-related depreciation and amortization, gains and losses from property dispositions, and impairments of depreciable real estate assets, and as a result, when compared period to period, reflects the impact on operations from trends in occupancy rates, rental rates, operating costs, development activities, general and administrative expenses, and interest costs, which are not immediately apparent from net income. Factors that impact FFO include fixed costs, yields on cash held in accounts, income from portfolio properties and other portfolio assets, interest rates on debt financing, and operating expenses.
We also evaluate FFO, excluding certain items. The items excluded relate to certain non-operating activities or certain non-recurring activities that may create significant FFO volatility and affect the comparability of FFO across periods. We believe it is useful to evaluate FFO excluding these items because it provides useful information in analyzing comparability between reporting periods and in assessing the sustainability of our operating performance.
FFO and FFO, excluding certain items, should not be considered as alternatives to net income (loss), or as indicators of our liquidity, nor are they indicative of funds available to fund our cash needs, including our ability to make distributions. Additionally, the exclusion of impairments limits the usefulness of FFO and FFO, excluding certain items, as historical operating performance measures since an impairment charge indicates that operating performance has been permanently affected. FFO and FFO, excluding certain items, are non-GAAP measurements and should be reviewed in connection with other GAAP measurements. Our FFO and FFO, excluding certain items, as presented may not be comparable to amounts calculated by other REITs that do not define FFO in accordance with the current Nareit definition, or interpret it differently, or that identify and exclude different items related to non-operating activities or certain non-recurring activities.
Net Operating Income (NOI)
NOI is a non-GAAP financial measure equal to rental revenue, less property operating expenses, real estate taxes, and property management expenses. Our management uses NOI internally as a performance measure and believes NOI is useful to investors as a performance measure because NOI reflects only those income and expense items that are incurred at the property level and is therefore a useful measure for evaluating a property’s performance. Using NOI on a comparative basis allows investors to evaluate property level performance to compare the operating performance of our properties in a given market with the operating performance of other real estate companies in the same market, and consequently allocate their own investment capital accordingly.
Further, we use NOI internally as a performance measure and believe NOI is useful to investors as a performance measure because, when compared year over year, NOI reflects the impact on operations from trends in occupancy rates, rental rates, operating costs, acquisition and development activities, and general and administrative expenses on an un-leveraged basis, providing perspective not immediately apparent from net income. NOI excludes certain components from net income in order to provide results that are more closely related to a property’s results of operations. Certain items such as interest expense, while included in net income, do not affect the operating performance of a real estate asset and are often incurred at the corporate level as opposed to the property level. In addition, it is useful to our management and investors that depreciation and amortization are excluded from NOI because historical cost accounting for real estate assets implicitly assumes that the value of real estate assets diminishes predictably over time, and, instead, real estate values have historically risen or fallen with market conditions.
NOI presented by us may not be comparable to NOI reported by other REITs that do not define NOI exactly as we do. We believe that in order to facilitate a clear understanding of our operating results, NOI should be examined in conjunction with net income as presented in our consolidated financial statements and notes thereto. NOI should not be considered as an alternative to net income as an indication of our performance, or to cash flows as a measure of liquidity or our ability to make distributions.
Same Store NOI and Same Store Cash NOI
Same Store NOI is equal to rental revenue, less lease termination fee income, property operating expenses (excluding tenant improvement demolition costs), real estate taxes, and property management expenses for our same store properties and is considered a non-GAAP financial measure. Same Store Cash NOI is equal to Same Store NOI less non-cash revenue items including straight-line rent adjustments and the amortization of above- and below-market rent. The same store properties include our operating office properties not held for sale and owned and operated for the entirety of both periods being compared and include our comparable ownership percentage in each period for properties in which we own an unconsolidated interest that is accounted for using the equity method. We view Same Store NOI and Same Store Cash NOI as important measures of the operating performance of our properties because they allow us to compare operating results of properties owned and operated for the entirety of both periods being compared and therefore eliminate variations caused by acquisitions or dispositions during such periods.
|
| | |
Supplemental Operating and Financial Data | | 3Q’18 Page 31 |
Same Store NOI and Same Store Cash NOI presented by us may not be comparable to Same Store NOI or Same Store Cash NOI reported by other REITs that do not define Same Store NOI or Same Store Cash NOI exactly as we do. We believe that in order to facilitate a clear understanding of our operating results, Same Store NOI and Same Store Cash NOI should be examined in conjunction with net income (loss) as presented in our consolidated financial statements and notes thereto. Same Store NOI and Same Store Cash NOI should not be considered as an indicator of our ability to make distributions, as alternatives to net income (loss) as an indication of our performance, or as a measure of cash flows or liquidity.
Earnings before Interest, Taxes, Depreciation and Amortization for Real Estate (EBITDAre)
EBITDAre is a non-GAAP financial measure. We use EBITDAre as defined by Nareit which is net income (loss), computed in accordance with GAAP, plus interest expense, plus income tax expense, plus depreciation and amortization expense, plus (minus) losses and gains on the disposition of depreciated property, including losses and gains on change of control, plus impairment write-downs of depreciated property, and after related adjustments for unconsolidated entities. Our EBITDAre as presented may not be comparable to amounts calculated by other REITs that do not define EBITDAre in accordance with the current Nareit definition, or interpret it differently than we do.
EBITDAre is not intended to represent cash flow for the period, is not presented as an alternative to operating income as an indicator of operating performance, should not be considered in isolation or as a substitute for measures of performance prepared in accordance with GAAP, and is not indicative of operating income or cash provided by operating activities as determined under GAAP. EBITDAre is presented solely as a supplemental disclosure with respect to liquidity because we believe it provides useful information regarding our ability to service or incur debt.
We also evaluate Adjusted EBITDAre, which is EBITDAre excluding certain revenues and operating expenses. The items excluded relate to certain non-operating activities or certain non-recurring activities that create significant EBITDAre volatility. Further, we evaluate Adjusted Estimated Full Period EBITDAre, which is EBITDAre excluding certain revenues and operating expenses and adjusted to show the pro forma impact of properties that were either acquired or disposed during the period. We believe it is useful to evaluate EBITDAre excluding these items and as adjusted for property acquisitions and dispositions because it provides useful information in analyzing comparability between reporting periods and in assessing the sustainability of our operating performance.
|
| | |
Supplemental Operating and Financial Data | | 3Q’18 Page 32 |