UNITED STATES
SECURITIES AND EXCHANGE COMMISSION
Washington, D.C. 20549
FORM N-CSR
CERTIFIED SHAREHOLDER REPORT OF REGISTERED
MANAGEMENT INVESTMENT COMPANIES
| | |
| Investment Company Act file number | | |
Nuveen Preferred & Income Securities Fund
(Exact name of registrant as specified in charter)
333 West Wacker Drive
Chicago, IL 60606
(Address of principal executive offices) (Zip code)
Mark L. Winget
Nuveen Investments
333 West Wacker Drive
Chicago, IL 60606
(Name and address of agent for service)
Registrant’s telephone number, including area code:
(312) 917-7700
Date of fiscal year end:
July 31
Date of reporting period:
July 31, 2022
Form N-CSR is to be used by management investment companies to file reports with the Commission not later than 10 days after the transmission to stockholders of any report that is required to be transmitted to stockholders under Rule 30e-1 under the Investment Company Act of 1940 (17 CFR 270.30e-1). The Commission may use the information provided on Form N-CSR in its regulatory, disclosure review, inspection, and policymaking roles.
A registrant is required to disclose the information specified by Form N-CSR, and the Commission will make this information public. A registrant is not required to respond to the collection of information contained in Form N-CSR unless the Form displays a currently valid Office of Management and Budget (“OMB”) control number. Please direct comments concerning the accuracy of the information collection burden estimate and any suggestions for reducing the burden to Secretary, Securities and Exchange Commission, 450 Fifth Street, NW, Washington, DC 20549-0609. The OMB has reviewed this collection of information under the clearance requirements of 44 U.S.C. ss. 3507.
ITEM 1. REPORTS TO STOCKHOLDERS.
Closed-End Funds
31 July 2022
Nuveen Closed-End Funds
| | |
| JPC | | Nuveen Preferred & Income Opportunities Fund |
| JPI | | Nuveen Preferred and Income Term Fund |
| JPS | | Nuveen Preferred & Income Securities Fund |
| JPT | | Nuveen Preferred and Income Fund (formerly Nuveen Preferred and Income 2022 Term Fund) |
| NPFD | | Nuveen Variable Rate Preferred & Income Fund |
Nuveen makes things e-simple.
It only takes a minute to sign up for
e-Reports.
Once enrolled, you’ll receive an
e-mail
as soon as your Nuveen Fund information is ready—no more waiting for delivery by regular mail. Just click on the link within the
e-mail
to see the report and save it on your computer if you wish.
Free e-Reports right to your email!
If you receive your Nuveen Fund dividends and statements from your financial professional or brokerage account.
or
www.nuveen.com/client-access
If you receive your Nuveen Fund dividends and statements directly from Nuveen.
NOT FDIC INSURED MAY LOSE VALUE NO BANK GUARANTEE
| | | | |
| | | 4 | |
| |
| | | 5 | |
| |
| | | 7 | |
| |
| | | 14 | |
| |
| | | 16 | |
| |
| | | 20 | |
| |
| | | 30 | |
| |
| | | 31 | |
| |
| | | 33 | |
| |
| | | 66 | |
| |
| | | 67 | |
| |
| | | 68 | |
| |
| | | 71 | |
| |
| | | 72 | |
| |
| | | 79 | |
| |
| | | 97 | |
| |
| | | 139 | |
| |
| | | 141 | |
| |
| | | 142 | |
| |
| | | 144 | |
| |
| | | 155 | |
3
Chair’s Letter to Shareholders
Dear Shareholders,
The question of whether economies are moving toward normalization or recession has dominated financial markets in 2022. Persistently high inflation has made the outcome more unpredictable, as it has dampened consumer sentiment, pushed central banks into raising interest rates more aggressively and contributed to considerable turbulence in the markets this year.
Inflation has surged partially due to COVID supply chain bottlenecks and exacerbated by Russia’s war in Ukraine and recent lockdowns across China to contain a large-scale COVID-19 outbreak. This has necessitated increasingly forceful responses from the U.S. Federal Reserve (Fed) and other central banks, who have signaled their intentions to slow inflation while tolerating slower economic growth. As anticipated, the Fed began the rate hiking cycle in March 2022, raising its short-term rate by 0.25% from near zero for the first time since the pandemic was declared two years ago. Larger increases of 0.50% in May and 0.75% in June, July and September 2022 followed, bringing the target fed funds rate to a range of 3.00% to 3.25%. Additional rate hikes are expected in the remainder of this year, although Fed officials will closely monitor inflation data along with other economic measures and modify their rate setting policy based upon these factors. U.S. gross domestic product growth has now contracted for two consecutive quarters, according to government estimates, as consumer and business activity has slowed in part due to higher prices and borrowing costs. However, the still strong labor market suggests not all areas of the economy are weakening in unison.
While markets will likely continue fluctuating with the daily headlines, we encourage investors to keep a long-term perspective. To learn more about how well your portfolio is aligned to your time horizon, risk tolerance and investment goals, consider reviewing it with your financial professional.
On behalf of the other members of the Nuveen Fund Board, we look forward to continuing to earn your trust in the months and years ahead.
Terence J. Toth
Chair of the Board
September 23, 2022
4
For Shareholders of
Nuveen Preferred & Income Opportunities Fund (JPC)
Nuveen Preferred and Income Term Fund (JPI)
Nuveen Preferred & Income Securities Fund (JPS)
Nuveen Preferred and Income Fund (JPT)
Nuveen Variable Rate Preferred & Income Fund (NPFD)
Fund Restructuring for Nuveen Preferred and Income Fund (JPT)
On January 19, 2022, shareholders of Nuveen Preferred and Income Fund (JPT) approved a proposal to restructure the fund (the “restructuring”). The restructuring allowed shareholders the opportunity to maintain their investment in JPT and its exposure to a leveraged strategy focused on preferred and other income producing securities in lieu of the scheduled termination of the fund. The effectiveness of the restructuring was contingent on the success of the fund’s tender offer.
On January 20, 2022, JPT conducted a tender offer, which allowed shareholders to offer up to 100% of their shares for repurchase for cash at a price per share equal to 100% of the net asset value (“NAV”) per share determined on the date the tender offer expired.
JPT’s tender offer expired on February 17, 2022. In the tender offer 2,454,617 shares were tendered, representing approximately 36% of JPT’s common shares outstanding. Properly tendered shares were repurchased at $23.2613 per share, which was the NAV of the fund as of the close of ordinary trading on the New York Stock Exchange on February 17, 2022.
As a result of the successful completion of the tender offer, the restructuring of the JPT was completed and on February 28, 2022 the following changes became effective.
| | • | | JPT’s declaration of trust was amended to eliminate the term of the fund. |
| | • | | JPT’s investment policies were amended to permit investment in contingent capital securities (CoCos). |
| | • | | JPT’s name changed to Nuveen Preferred and Income Fund. |
| | • | | Nuveen Fund Advisors, LLC, the investment adviser to the fund, will waive 50% of the fund’s net management fees beginning February 8, 2022 and continuing over the first year following the elimination of the term. |
More details about JPT’s restructuring is available on www.nuveen.com/cef.
Additional Market Disruption Risk
In late February 2022, Russia launched a large scale military attack on Ukraine. The invasion significantly amplified already existing geopolitical tensions among Russia, Ukraine, Europe, NATO and other western nations, including the U.S. In response to the military action by Russia, various countries, including the U.S., the United Kingdom, and European Union issued broad-ranging economic sanctions against Russia. Such sanctions included, among other things, a prohibition on doing business with certain Russian companies, large financial institutions, officials and oligarchs; a commitment by certain countries and the European Union to remove selected Russian banks from the Society for Worldwide Interbank Financial Telecommunications (“SWIFT”), the electronic banking network that connects banks globally; and restrictive measures to prevent the Russian Central Bank from undermining the impact of the sanctions.
Additional sanctions may be imposed in the future. Such sanctions may adversely impact, among other things, the Russian economy and various sectors of the global economy, including but not limited to, the financials, energy, metals and mining, engineering and defense sectors. The sanctions and any related boycotts, tariffs, and financial restrictions
5
imposed on Russia’s government, companies and certain individuals may cause a decline in the value and liquidity of Russian securities; weaken the value of the ruble; downgrade the country’s credit rating; freeze Russian securities and/or funds invested in prohibited assets and impair the ability to trade in Russian securities and/or other assets; and have other adverse consequences on the Russian government, economy, companies and region. Further, several large corporations and U.S. states have announced plans to divest interests or otherwise curtail business dealings with certain Russian businesses.
The ramifications of the hostilities and sanctions, however, may not be limited to Russia and Russian companies but may spill over to and negatively impact other regional and global economic markets (including Europe and the United States), companies in other countries (particularly those that have done business with Russia) and on various sectors, industries and markets for securities and commodities globally, such as oil and natural gas. Accordingly, the actions discussed above and the potential for a wider conflict could increase financial market volatility, cause severe negative effects on regional and global economic markets, industries, and companies and have a negative effect on your Fund’s investments and performance beyond any direct exposure to Russian issuers or those of adjoining geographic regions. In addition, Russia may take retaliatory actions and other countermeasures, including cyberattacks and espionage against other countries and companies around the world, which may negatively impact such countries and the companies in which your Fund invests.
The extent and duration of the military action or future escalation of such hostilities, the extent and impact of existing and future sanctions, market disruptions and volatility, and the result of any diplomatic negotiations cannot be predicted. These and any related events could have a significant impact on Fund performance and the value of an investment in the Fund.
6
Portfolio Managers’ Comments
Nuveen Preferred & Income Opportunities Fund (JPC)
Nuveen Preferred and Income Term Fund (JPI)
Nuveen Preferred & Income Securities Fund (JPS)
Nuveen Preferred and Income Fund (JPT)
(formerly Nuveen Preferred and Income 2022 Term Fund
)
Nuveen Variable Rate Preferred & Income Fund (NPFD)
Nuveen Asset Management, LLC (NAM), an affiliate of Nuveen Fund Advisors, LLC, the Funds’ investment adviser, is the
sub-adviser
for the Nuveen Preferred & Income Opportunities Fund (JPC), Nuveen Preferred and Income Term Fund (JPI), Nuveen Preferred and Income Fund (JPT) and Nuveen Variable Rate Preferred & Income Fund (NPFD). The Funds’ portfolio managers are Douglas M. Baker, CFA and Brenda A. Langenfeld, CFA. The Nuveen Preferred & Income Securities Fund (JPS) is
sub-advised
by a team of specialists at Spectrum Asset Management, Inc. (Spectrum), a wholly owned subsidiary of Principal Global Investors Holding Company (U.S.), LLC. The portfolio managers for JPS are Mark Lieb and Phil Jacoby.
Here the Funds’ portfolio management teams review economic and market conditions, key investment strategies and the Funds’ performance for the twelve-month reporting period July 31, 2022. For more information on the Funds’ investment objectives and policies, please refer to the Shareholder Update section of the report.
What factors affected the economy and the markets during the twelve-month annual reporting period ended July 31, 2022?
After recovering from the pandemic in 2021, the U.S. economy weakened in the first half of 2022. Overall, 2021 gross domestic product (GDP) grew by 5.7% as the economy reopened with the help of $5.3 trillion in crisis-related aid from the federal government, low borrowing rates for businesses and individuals, an increase in
COVID-19
vaccinations and improved treatments for
COVID-19.
However, in early 2022, China’s
COVID-19
lockdown and the Russia-Ukraine war worsened existing pandemic-related supply chain disruptions. Inflation increased more than expected during the first half of 2022, putting pressure on global central banks to respond with more aggressive measures.
The U.S. Federal Reserve (Fed) began an interest rate hiking cycle in March 2022 with a 0.25% hike to the target federal funds rate, followed by larger increases of 0.50% in May 2022, 0.75% in June 2022 and another 0.75% in July 2022. Overall, the Fed raised the target federal funds rate from near zero at the start of 2022 to a range of 2.25% to 2.50% by July 2022. Subsequent to the end of the reporting period, the Fed raised the policy interest rate another 0.75% in September 2022 to a range of 3.00% to 3.25%. Interest rate, stock and bond price volatility increased as markets considered whether the Fed could cool inflation without putting the economy into a recession. Additionally, the U.S. dollar appreciated significantly relative to major world currencies beginning in March of 2022, serving as a headwind to the profits of international companies and U.S. domestic companies with overseas earnings. The dollar’s appreciation was driven in part by the Fed’s increasingly forceful response to inflation compared with other central banks, the relatively better prospects of the U.S. economy and “safe-haven” flows from investors uncertain about geopolitical and global economic conditions.
By
mid-year,
inflation and higher borrowing costs appeared to be dampening consumer confidence and consumer spending. Also, two consecutive quarters of negative U.S. GDP growth added to recession risks. U.S. GDP fell by an annual rate of 0.6% in the second quarter of 2022, according to the second estimate from the U.S. Bureau of Economic
7
Portfolio Managers’ Comments
(continued)
Analysis. This followed a 1.6% annualized GDP decrease in the first quarter of 2022. However, the labor market, another key gauge of the economy’s health, has remained resilient. As of July 2022, the U.S. unemployment rate fell to 3.5%, its
pre-pandemic
low, and the economy has now recovered the 22 million jobs lost since the beginning of the pandemic.
The preferred market struggled during the reporting period, with all segments of the market posting negative returns that were driven by a combination of wider credit spreads and higher U.S. Treasury rates. $1,000 par preferred securities were top performers, followed by $25 par securities and contingent capital securities (“CoCos”). Securities that have coupons with reset features also fared better than fixed-rate coupons during the same period. Those structures are predominately found in the $1,000 par and CoCo segments.
Nuveen Preferred & Income Opportunities Fund (JPC)
What key strategies were used to manage the Fund during the twelve-month reporting period ended July 31, 2022?
The Fund seeks to provide high current income and secondarily, total return, by investing at least 80% of its managed assets in preferred and other income producing securities, including hybrid securities such as contingent capital securities (CoCos). The Fund invests up to 20% opportunistically in other securities, primarily income-oriented securities such as corporate and taxable municipal debt and common equity. Additionally, at least 50% is invested in securities that are rated investment grade at the time of purchase or, if unrated, judged to be of comparable quality by the Fund’s investment management team. The Fund uses leverage.
The investment management team incorporated several active themes within the Fund relative to the JPC Blended Benchmark, including an overweight to $1,000 par preferred securities and securities that have coupons with reset features (floating rate,
rate,
an underweight to CoCos and a corresponding overweight to U.S.-domiciled issuers. The investment management team increased the Fund’s exposure to CoCos beginning in the second quarter of 2022. However, given the anticipated impact of the Russia-Ukraine war on the European economy, the Fund shifted its allocation to core Western European countries and reduced exposure to periphery European countries. The Fund was strategically overweight in the more highly regulated bank and insurance sectors, so investors could benefit from the added scrutiny of regulatory oversight resulting in higher required capital levels.
How did the Fund perform during the twelve-month reporting period ended July 31, 2022?
For the twelve-month reporting period ended July 31, 2022, JPC outperformed the JPC Blended Benchmark. For the purposes of this Performance Commentary, references to relative performance are in comparison to the JPC Blended Benchmark. Effective April 1, 2022, the JPC Blended Benchmark was updated to consist of: 1) 60% ICE BofA U.S. All Capital Securities Index and 2) 40% ICE USD Contingent Capital Index (CDLR). Benchmark performance prior to April 1, 2022 reflects the JPC Blended Benchmark’s previous composition of: 1) 50% ICE BofA Fixed Rate Preferred Securities Index, 2) 30% ICE BofA U.S. All Capital Securities Index, and 3) 20% ICE USD Contingent Capital Index (CDLR).
The Fund’s outperformance was driven by an overweight to $1,000 par preferred securities, which gave the Fund greater exposure to securities that have coupons with reset features. These investments generally demonstrate lower sensitivity to interest rates. During the reporting period, these structures outperformed securities with fixed-rate coupons. The Fund’s relatively shorter leverage-adjusted duration was also accretive to performance. Historically, the investment management team has limited emerging markets exposure in the portfolio and the Fund held no securities from Russian, Ukrainian or Belarusian-domiciled issuers during the reporting period. Conversely, the JPC Blended Benchmark began 2022 with approximately a 1.4% weighting in US dollar denominated CoCos issued by Russian banks, whose prices dropped to zero by the end of the first quarter of 2022. While the absolute exposure to these securities was modest in the JPC Blended Benchmark, their price performance had a meaningful impact on the benchmark performance during the first quarter of 2022. The Fund’s lack of exposure was accretive to relative performance. The
8
Fund’s overweight exposure to Land O’ Lakes Inc. and CHS Inc. contributed to performance. Both of these consumer
non-cyclical
sector holdings outperformed the broader market that encountered headwinds due to uncertainty surrounding the global economy. The Fund continues to hold both positions.
Partially offsetting the outperformance was the Fund’s use of leverage through bank borrowings and reverse repurchase agreements, which significantly detracted from relative performance during the reporting period. However, the Fund’s use of leverage was accretive to overall common share income. Leverage is discussed in more detail in the Fund Leverage section of this report.
In addition to the use of leverage, the Fund’s modest overweight to consumer cyclicals detracted from performance as the market began to price in an economic slowdown and the sector underperformed the JPC Blended Benchmark during the second quarter of 2022. An underweight to the utilities sector also detracted from performance as that sector outperformed the JPC Blended Benchmark. Finally, the Fund’s overweight exposure to Deutsche Bank AG and General Motors Financial Co Inc. both detracted from performance. Deutsche Bank underperformed due to concerns about Russian exposure. Capital levels remain strong and the Fund continues to hold the position. An overweight to General Motors hindered performance due to increased economic uncertainty. The Fund continues to maintain an overweight given the company’s solid long-term fundamentals.
The Fund sold interest rate futures during the reporting period to manage its exposure to various points along the yield curve, with a net effect of decreasing the Fund’s overall interest rate sensitivity. During the reporting period, the interest rate futures had a negligible impact on relative performance.
Nuveen Preferred and Income Term Fund (JPI)
What key strategies were used to manage the Fund during the twelve-month reporting period ended July 31, 2022?
The Fund seeks to provide a high level of current income and total return by investing at least 80% of its managed assets in preferred and other income-producing securities, including hybrid securities such as contingent capital securities, with a focus on securities issued by financial and insurance firms. At least 50% of its managed assets are rated investment grade at the time of purchase or, if unrated, judged to be of comparable quality by the Fund’s investment management team.
The investment management team incorporated several active themes within the Fund relative to the JPI Blended Benchmark that included an overweight to $1,000 par preferred securities and securities that have coupons with reset features (floating rate,
rate,
an underweight to CoCos and a corresponding overweight to U.S.-domiciled issuers. Given the anticipated impact of the Russian-Ukrainian war on the European economy, the investment management team modestly reduced the Fund’s CoCos exposure and correspondingly added to its preferred securities allocation. Within the CoCos allocation, the investment management team was more defensive given its relatively greater concern for the European economy. As a result, the team rotated some of the Fund’s exposure out of periphery European countries and added exposure to core Western European countries. The Fund was strategically overweight the more highly regulated bank and insurance sectors, so investors could benefit from the added scrutiny of regulatory oversight resulting in higher required capital levels.
How did the Fund perform during the twelve-month reporting period ended July 31, 2022?
For the twelve-month reporting period ended July 31, 2022, JPI underperformed the JPI Blended Benchmark. The JPI Blended Benchmark consists of: 1) 60% ICE BofA U.S. All Capital Securities Index and 2) 40% ICE USD Contingent Capital Index (CDLR). For the purposes of this Performance Commentary, references to relative performance are in comparison to the JPI Blended Benchmark.
9
Portfolio Managers’ Comments
(continued)
The Fund’s use of leverage through bank borrowings and reverse repurchase agreements significantly detracted from relative performance during the reporting period. However, the Fund’s use of leverage was accretive to overall common share income. Leverage is discussed in more detail in the Fund Leverage section of this report.
In addition to the use of leverage, the Fund’s longer leverage-adjusted duration for most of the reporting period and an underweight to the utilities sector detracted from relative performance. Also, the Fund’s overweight to Deutsche Bank AG and SBL Holdings both detracted from relative results. Deutsche Bank underperformed due to concerns about Russian exposure. Capital levels remain strong and the Fund continues to hold the position. SBL Holdings underperformance was related to selling pressure during the reporting period. The Fund continues to hold the position based on its solid credit metrics.
Partially offsetting the Fund’s relative detractors were overweight exposures to the consumer
non-cyclical
sector, $1,000 par preferred securities, and securities that have coupons with reset features, as well as selection within the CoCos allocation that contributed favorably to the Fund’s relative results. The Fund’s overweight exposure to Land O’ Lakes Inc. and CHS Inc. also contributed to performance. Both of these consumer
non-cyclical
sector holdings outperformed the broader market that encountered headwinds given uncertainty surrounding the global economy. The Fund continues to hold both positions.
The Fund sold interest rate futures during the reporting period to manage its exposure to various points along the yield curve, with a net effect of decreasing the Fund’s overall interest rate sensitivity. During the reporting period, the interest rate futures contributed to relative performance.
Nuveen Preferred & Income Securities Fund (JPS)
What key strategies were used to manage the Fund during the twelve-month reporting period ended July 31, 2022?
The Fund primarily seeks to offer high current income consistent with capital preservation. The Fund invests at least 80% of its managed assets in preferred and other income-producing securities, including hybrid securities such as contingent capital securities. At least 50% is invested in securities that are rated investment grade. The Fund uses leverage.
The investment management team incorporated several strategies relative to the JPS Blended Benchmark, including an overweight to $1,000 par preferred securities and CoCos. The Fund was also underweight securities with a duration of at least 10 years and overweight securities with a duration of one to three years. As interest rates are expected to be elevated for some time, the Fund maintained an overall shorter-duration profile relative to the JPS Blended Benchmark.
How did the Fund perform during this twelve-month reporting period ended July 31, 2022?
For the twelve-month reporting period ended July 31, 2022, JPS underperformed the JPS Blended Benchmark. The JPS Blended Benchmark consists of: 1) 60% ICE BofA U.S. All Capital Securities Index, and 2) 40% ICE USD Contingent Capital Index (CDLR). For the purposes of this Performance Commentary, references to relative performance are in comparison to the JPS Blended Benchmark.
The Fund’s use of leverage through bank borrowings and reverse repurchase agreements significantly detracted from relative performance during the reporting period. However, the Fund’s use of leverage was accretive to overall common share income. Leverage is discussed in more detail in the Fund Leverage section of this report.
In addition to the use of leverage, the Fund’s overweight to securities with a duration of one to three years detracted from relative performance. Although these securities had short-duration profiles, they underperformed because of the significant flattening on the front end of the yield curve. The longer-duration junior subordinated debt of MetLife and Nationwide Financial also detracted from performance. Longer-duration securities underperformed driven by rising interest rates during the reporting period. The Fund continues to hold these issues because the credits are stable and the current income has remained above market levels.
10
Partially offsetting some of the Fund’s underperformance was an underweight to securities with a duration of at least 10 years. As previously mentioned, longer-duration securities underperformed driven by rising interest rates during the reporting period. The Fund’s allocation to Bank of America Corp. perpetual preferred and PNC Financial Services Group Inc. PRP $25 par preferred also contributed to performance. The floating rate features of both holdings contributed to their outperformance. The Fund continues to maintain its allocation to Bank of America Corp. and PNC Financial Services Group.
Nuveen Preferred and Income Fund (JPT)
(formerly Nuveen Preferred and Income 2022 Term Fund
)
What key strategies were used to manage the Fund during the twelve-month reporting period ended July 31, 2022?
The Fund seeks to provide a high level of current income and total return. The Fund provides access to both the exchange-traded and
preferred securities markets, seeking to capitalize on price discrepancies that may occur between these two markets. The Fund also has the flexibility to opportunistically invest in preferred securities with various coupon structures, including
structures, which may help reduce interest rate risk and enhance performance in a rising rate environment. The Fund invests at least 80% of its managed assets in preferred and other income-producing securities, including hybrid securities such as contingent capital securities (CoCos). The Fund may invest without limit in below investment grade securities but no more than 10% in securities rated below
B-/B3
at the time of investment. Up to 40% of its managed assets may be in securities issued by companies located anywhere in the world, but no more than 10% in securities of issuers in emerging markets countries, and 100% in U.S. dollar-denominated securities. The Fund uses leverage.
During the reporting period, the investment management team incorporated several active themes within the Fund relative to the JPT Blended Benchmark, including: an overweight to $1,000 par preferred securities; an overweight to securities that have coupons with reset features (floating rate,
rate,
and an underweight to CoCos with a corresponding overweight to U.S.-domiciled issuers. On February 28, 2022, JPT’s investment policies were amended to permit investment in CoCos. Following the policy change, the investment management team increased exposure to CoCo securities. However, given the anticipated impact of the Russian-Ukrainian war on the European economy, the Fund shifted its allocation to core Western European countries and reduced exposure to periphery European countries. In terms of sector exposure, the Fund was strategically overweight in the highly regulated bank and insurance sectors, so investors could benefit from the added scrutiny of regulatory oversight resulting in higher required capital levels.
How did the Fund perform during the twelve-month reporting period ended July 31, 2022?
For the twelve-month reporting period ended July 31, 2022, JPT performed in line with the JPT Blended Benchmark. For the purposes of this Performance Commentary, references to relative performance are in comparison to the JPT Blended Benchmark. Effective February 28, 2022, the JPT Blended Benchmark was updated to consist of: 1) 60% ICE BofA U.S. All Capital Securities Index, and 2) 40% ICE USD Contingent Capital Index (CDLR). Benchmark performance prior to February 28, 2022 consisted of the ICE BofA U.S. All Capital Securities Index.
Contributors to the Fund’s relative performance included overweight exposure to the consumer
non-cyclical
sector, $1,000 par preferred securities and securities that have coupons with reset features, as well as selection within the CoCo allocation. The Fund’s overweight to $1,000 par preferred securities gave the Fund greater exposure to securities that have coupons with reset features. These structures generally demonstrate lower sensitivity to interest rates and during the reporting period, they outperformed securities with fixed-rate coupons. Historically, the investment management team has limited emerging markets exposure in the portfolio and the Fund held no securities from Russian, Ukrainian or Belarusian domiciled issuers during the reporting period. Conversely, the JPT Blended Benchmark began 2022 with approximately a 1.4% weighting in USD CoCos issued by Russian banks, whose prices dropped to zero by the end of
11
Portfolio Managers’ Comments
(continued)
the first quarter of 2022. While the absolute exposure was modest in the JPT Blended Benchmark, the price performance had a meaningful impact during the first quarter of 2022. The Fund’s lack of exposure was accretive to relative performance. The Fund’s overweight exposure to Land O’ Lakes Inc. and CHS Inc. also contributed to performance. Both of these consumer
non-cyclical
sector holdings outperformed the broader market that encountered headwinds due to uncertainty surrounding the global economy. The Fund continues to hold both positions.
The Fund sold interest rate futures during the reporting period to manage its exposure to various points along the yield curve, with a net effect of decreasing the Fund’s overall interest rate sensitivity. During the reporting period, the interest rate futures contributed to relative performance.
Serving to partially offset the contributors was the Fund’s use of leverage through bank borrowings, which significantly detracted from relative performance during the reporting period. However, the Fund’s use of leverage was accretive to overall common share income. Leverage is discussed in more detail in the Fund Leverage section of this report.
In addition to the use of leverage, the Fund’s relatively longer leverage-adjusted duration for most of the reporting period detracted from relative performance. The Fund’s modest overweight to consumer cyclicals detracted from performance as the market began to price in an economic slowdown and the sector underperformed the JPT Blended Benchmark during the second quarter of 2022. An underweight to the utilities sector also detracted from performance as that sector outperformed the JPT Blended Benchmark. Finally, the Fund’s overweight exposure to Deutsche Bank and SBL Holdings both detracted from performance. Deutsche Bank underperformed due to concerns about Russian exposure. Capital levels remain strong and the Fund continues to hold the position. SBL Holdings underperformance was related to selling pressure during the reporting period. The Fund continues to hold the position based on its solid credit metrics.
Nuveen Variable Rate Preferred & Income Fund (NPFD)
What key strategies were used to manage the Fund during the abbreviated reporting period since the Fund’s commencement on December 15, 2021 through July 31, 2022?
The Fund seeks to provide a high level of current income and total return by investing in primarily investment grade, variable rate preferred securities and other variable rate income-producing securities from high quality, highly regulated companies such as banks, utilities and insurance companies. All, or almost all, of the Fund’s distributions of net investment income are expected to be treated as qualified dividend income (QDI) which is generally taxed at a lower rate than interest and ordinary dividend income, assuming holding period and certain other requirements are met.
The Fund may invest up to 20% of managed assets in contingent capital securities or contingent convertible securities (CoCos) and up to 15% in companies located in emerging market countries but may only invest in U.S. dollar denominated securities. More than 25% of managed assets are invested in securities of companies in the financial services sector. The Fund uses leverage and has a
12-year
term with the potential to convert to perpetual.
The overwhelming majority of the
invest-up
period was via the secondary market in attractive opportunities in both U.S.-domiciled and
non-U.S.-domiciled
issuers, including CoCos. Positioning favored highly regulated sectors such as banks and insurance. Given the anticipated impact of the Russian/Ukrainian war on the European economy, the investment management team slightly reduced the Fund’s CoCos exposure beginning in February 2022 and correspondingly added to its preferred securities allocation. Within the CoCos allocation, the team rotated some exposure out of periphery European countries and added exposure to core Western European countries.
How did the Fund perform during the abbreviated reporting period since the Fund’s commencement on December 15, 2021 through July 31, 2022?
For the abbreviated reporting period since the Fund’s commencement on December 15, 2021 through July 31, 2022, NPFD underperformed the NPFD Blended Benchmark. The NPFD Blended Benchmark consists of: 1) 80% ICE Variable
12
Rate Preferred & Hybrid Securities Index, and 2) 20% ICE USD Contingent Capital Index (CDLR). For the purposes of this Performance Commentary, references to relative performance are in comparison to the NPFD Blended Benchmark.
The Fund’s use of leverage through bank borrowings and reverse repurchase agreements significantly detracted from relative performance during the reporting period. However, the Fund’s use of leverage was accretive to overall common share income. Leverage is discussed in more detail in the Fund Leverage section of this report.
In addition to the use of leverage, the Fund’s longer leverage-adjusted effective duration and modest steepening bias detracted from relative performance. The Fund’s overweight to consumer cyclicals detracted from performance as the market began to price in an economic slowdown during the second quarter of 2022 and the sector underperformed the benchmark. The Fund’s overweight exposure to SBL Holdings and General Motors also detracted from performance. SBL Holdings underperformance was related to selling pressure during the reporting period. The Fund continues to hold based on its solid credit metrics. An overweight to General Motors hindered performance due to increased economic uncertainty. The Fund continues to maintain an overweight given the company’s solid long-term fundamentals.
Partially offsetting the Fund’s relative detractors was the Fund’s lack of exposure to Russian-domiciled issuers. The investment management team has limited emerging markets exposure in the Fund and held no securities from Russian, Ukrainian or Belarusian-domiciled issuers during the reporting period. Conversely, the NPFD Blended Benchmark began 2022 with an estimated 0.7% weighting in USD CoCos issued by Russian banks, whose prices dropped to zero by the end of the first quarter of 2022 and resulted in removal from the index. While the absolute exposure was modest in the NPFD Blended Benchmark, the price performance had a meaningful impact. Overweight positions in the insurance and consumer
non-cyclical
sectors contributed favorably to the Fund’s relative performance versus the NPFD Blended Benchmark. These sectors outperformed the NPFD Blended Benchmark since the Fund’s inception. The Fund’s overweight exposure to CHS Inc. and NuStar Energy LP contributed to performance. Within the consumer
non-cyclical
sector, CHS Inc. outperformed the broader market, which encountered headwinds due to uncertainty surrounding the global economy. Nustar Energy was a strong performer tracking higher oil prices during the reporting period. The Fund continues to hold both positions.
The Fund sold interest rate futures during the reporting period to manage its exposure to various points along the yield curve, with a net effect of decreasing the Fund’s overall interest rate sensitivity. During the reporting period, the interest rate futures had a negligible impact on relative performance.
13
IMPACT OF THE FUNDS’ LEVERAGE STRATEGIES ON PERFORMANCE
One important factor impacting the returns of the Funds’ common shares relative to their comparative benchmarks was the Funds’ use of leverage through bank borrowings, Taxable Fund Preferred Shares (TFP) for JPS and reverse repurchase agreements for JPC, JPI, JPS and NPFD. The Funds use leverage because our research has shown that, over time, leveraging provides opportunities for additional income. The opportunity arises when short-term rates that a Fund pays on its leveraging instruments are lower than the interest the Fund earns on its portfolio securities that it has bought with the proceeds of that leverage. This has been particularly true in the recent market environment where short-term rates have been low by historical standards.
However, use of leverage can expose Fund common shares to additional price volatility. When a Fund uses leverage, the Fund’s common shares will experience a greater increase in their net asset value if the securities acquired through the use of leverage increase in value, but will also experience a correspondingly larger decline in their net asset value if the securities acquired through leverage decline in value. All this will make the shares’ total return performance more variable, over time.
In addition, common share income in levered funds will typically decrease in comparison to unlevered funds when short-term interest rates increase and increase when short-term interest rates decrease. In recent quarters, fund leverage expenses have generally tracked the overall movement of short-term tax-exempt interest rates. While fund leverage expenses are somewhat higher than their all-time lows, leverage nevertheless continues to provide the opportunity for incremental common share income, particularly over longer-term periods.
The Funds’ use of leverage significantly detracted from relative performance during the reporting period. However, the Funds’ use of leverage was accretive to overall common share income.
JPC, JPI and JPS continued to use interest rate swap contracts to partially hedge the interest cost of leverage. During the period, these interest rate swaps contributed to the relative performance of JPC, JPI and JPS.
As of July 31, 2022, the Funds’ percentages of leverage are as shown in the accompanying table.
| | | | | | | | | | | | | | | | | | | | |
| | | JPC | | | JPI | | | JPS | | | JPT | | | NPFD | |
| Effective Leverage* | | | 37.28 | % | | | 36.72 | % | | | 38.09 | % | | | 33.59 | % | | | 36.46 | % |
| Regulatory Leverage* | | | 32.38 | % | | | 30.85 | % | | | 31.18 | % | | | 33.59 | % | | | 27.04 | % |
| * | Effective leverage is a Fund’s effective economic leverage, and includes both regulatory leverage and the leverage effects of reverse repurchase agreements, certain derivative and other investments in a Fund’s portfolio that increase the Fund’s investment exposure. Regulatory leverage consists of preferred shares issued or borrowings of a Fund. Both of these are part of a Fund’s capital structure. A Fund, however, may from time to time borrow on a typically transient basis in connection with its day-to-day operations, primarily in connection with the need to settle portfolio trades. Such incidental borrowings are excluded from the calculation of a Fund’s effective leverage ratio. Regulatory leverage is subject to asset coverage limits set forth in the Investment Company Act of 1940. |
14
THE FUNDS’ LEVERAGE
As noted previously, the Funds employ leverage through the use of bank borrowings. The Funds’ bank borrowing activities are as shown in the accompanying table.
| | | | | | | | | | | | | | | | | | | | | | | | | | | | | | | | | | | | |
| | | Current Reporting Period | | | | | | Subsequent to the Close of the Reporting Period | |
| Fund | | Outstanding
Balance as of
August 1, 2021 | | | Draws | | | Paydowns | | | Outstanding
Balance as of
July 31, 2022 | | | Average Balance
Outstanding | | | | | | Draws | | | Paydowns | | | Outstanding
Balance as of
September 23, 2022 | |
| JPC | | $ | 462,700,000 | | | $ | 10,700,000 | | | $ | (50,000,000 | ) | | $ | 423,400,000 | | | $ | 455,111,644 | | | | | | | $ | — | | | $ | (150,000,000 | ) | | $ | 273,400,000 | |
| JPI | | $ | 234,800,000 | | | $ | 1,200,000 | | | $ | (20,000,000 | ) | | $ | 216,000,000 | | | $ | 231,129,315 | | | | | | | $ | 9,400,000 | | | $ | — | | | $ | 225,400,000 | |
| JPS | | $ | 873,300,000 | | | $
| —
|
| | $ | (374,000,000 | ) | | $ | 499,300,000 | | | $ | 829,047,945 | | | | | | | $ | — | | | $ | — | | | $ | 499,300,000 | |
| JPT | | $ | 47,000,000 | | | $
| —
|
| | $
| —
|
| | $ | 47,000,000 | | | $ | 47,000,000 | | | | | | | $ | — | | | $ | — | | | $ | 47,000,000 | |
| NPFD | | $
| —
|
| | $ | 210,200,000 | | | $ | (21,600,000 | ) | | $ | 188,600,000 | | | $ | 197,116,832 | * | | | | | | $ | — | | | $ | (33,800,000 | ) | | $ | 154,800,000 | |
| * | For the period January 11, 2022 (initial draw) through July 31, 2022. |
Refer to Notes to Financial Statements, Note 9 – Borrowing Arrangements and Reverse Repurchase Agreements for further details.
Reverse Repurchase Agreements
As noted previously, JPC, JPI, JPS and NPFD used reverse repurchase agreements, in which the Funds sell to a counterparty a security that it holds with a contemporaneous agreement to repurchase the same security at an agreed-upon price and date. The Funds’ transactions in reverse repurchase agreements are as shown in the accompanying table.
| | | | | | | | | | | | | | | | | | | | | | | | | | | | | | | | | | | | |
| | | Current Reporting Period | | | | | | Subsequent to the Close of the Reporting Period | |
| Fund | | Outstanding
Balance as of
August 1, 2021 | | | Sales | | | Purchases | | | Outstanding
Balance as of
July 31, 2022 | | | Average Balance
Outstanding | | | | | | Sales | | | Purchases | | | Outstanding
Balance as of
September 23, 2022 | |
| JPC | | $ | 121,000,000 | | | $ | 3,500,000 | | | $ | (22,400,000 | ) | | $ | 102,100,000 | | | $ | 115,558,630 | | | | | | | $ | — | | | $ | — | | | $ | 102,100,000 | |
| JPI | | $ | 56,500,000 | | | $ | 8,500,000 | | | $ | — | | | $ | 65,000,000 | | | $ | 64,426,301 | | | | | | | $ | — | | | $ | — | | | $ | 65,000,000 | |
| JPS | | $ | 275,000,000 | | | $ | — | | | $
| —
|
| | $ | 275,000,000 | | | $ | 275,000,000 | | | | | | | $ | — | | | $ | — | | | $ | 275,000,000 | |
| NPFD | | $
| —
|
| | $ | 120,000,000 | | | $ | (16,598,000 | ) | | $ | 103,402,000 | | | $ | 107,266,712 | ** | | | | | | $ | 52,197,000 | | | $ | (103,402,000 | ) | | $ | 52,197,000 | |
| ** | For the period January 5, 2022 (initial purchase of reverse repurchase agreements) through July 31, 2022. |
Refer to Notes to Financial Statements, Note 9 – Borrowing Arrangements and Reverse Repurchase Agreements for further details.
Taxable Fund Preferred Shares
As noted previously, in addition to bank borrowings, JPS also issued TFP. The Fund’s transactions in TFP are as shown in the accompanying table.
| | | | | | | | | | | | | | | | | | | | | | | | | | | | | | | | | | |
| Current Reporting Period | | | | | | Subsequent to the Close of the Reporting Period | |
Outstanding
Balance as of
August 1, 2021 | | | Issuance | | | Redemptions | | | Outstanding
Balance as of
July 31, 2022 | | | Average Balance
Outstanding | | | | | | Issuance | | | Redemptions | | | Outstanding
Balance as of
September 23, 2022 | |
| | $ — | | | | $270,000,000 | | | | $ — | | | | $270,000,000 | | | | $270,000,000 | * | | | | | | | $ — | | | | $ — | | | | $270,000,000 | |
| * | For the period July 14, 2022 (first issuance date of shares) through July 31, 2022. |
Refer to Notes to Financial Statements, Note 5 – Fund Shares and Note 11 - Subsequent Events for further details on TFP.
15
COMMON SHARE DISTRIBUTION INFORMATION
The following information regarding the Funds’ distributions is current as of July 31, 2022. Each Fund’s distribution levels may vary over time based on each Fund’s investment activity and portfolio investment value changes.
During the current reporting period, each Fund’s distributions to common shareholders were as shown in the accompanying table.
| | | | | | | | | | | | | | | | | | | | |
| | | Per Common Share Amounts | |
| Monthly Distributions (Ex-Dividend Date) | | JPC | | | JPI | | | JPS | | | JPT | | | NPFD | |
| August 2021 | | $ | 0.0530 | | | $ | 0.1305 | | | $ | 0.0505 | | | $ | 0.1185 | | | $ | — | |
| September | | | 0.0530 | | | | 0.1305 | | | | 0.0505 | | | | 0.1185 | | | | — | |
| October | | | 0.0530 | | | | 0.1305 | | | | 0.0505 | | | | 0.1185 | | | | — | |
| November | | | 0.0530 | | | | 0.1305 | | | | 0.0505 | | | | 0.1185 | | | | — | |
| December | | | 0.0530 | | | | 0.1305 | | | | 0.0505 | | | | 0.1185 | | | | — | |
| January | | | 0.0530 | | | | 0.1305 | | | | 0.0505 | | | | 0.1185 | | | | — | |
| February | | | 0.0530 | | | | 0.1305 | | | | 0.0505 | | | | 0.1185 | | | | 0.1380 | |
| March | | | 0.0530 | | | | 0.1305 | | | | 0.0505 | | | | 0.1350 | | | | 0.1380 | |
| April | | | 0.0530 | | | | 0.1305 | | | | 0.0475 | | | | 0.1350 | | | | 0.1380 | |
| May | | | 0.0530 | | | | 0.1305 | | | | 0.0475 | | | | 0.1350 | | | | 0.1380 | |
| June | | | 0.0530 | | | | 0.1305 | | | | 0.0475 | | | | 0.1350 | | | | 0.1380 | |
| July 2022 | | | 0.0530 | | | | 0.1305 | | | | 0.0435 | | | | 0.1255 | | | | 0.1380 | |
| Total Distributions | | $ | 0.6360 | | | $ | 1.5660 | | | $ | 0.5900 | | | $ | 1.4950 | | | $ | 0.8280 | |
| | | | | |
| Current Distribution Rate* | | | 7.76 | % | | | 7.64 | % | | | 6.72 | % | | | 7.43 | % | | | 8.29 | % |
| * | Current distribution rate is based on the Fund’s current annualized monthly distribution divided by the Fund’s current market price. The Fund’s monthly distributions to its shareholders may be comprised of ordinary income, net realized capital gains and, if at the end of the fiscal year the Fund’s cumulative net ordinary income and net realized gains are less than the amount of the Fund’s distributions, a return of capital for tax purposes. |
NPFD declared its first distribution of $0.1380 during January 2022, for shareholders of record on February 15, 2022 and payable on March 1, 2022. Each Fund seeks to pay regular monthly dividends out of its net investment income at a rate that reflects its past and projected net income performance. To permit each Fund to maintain a more stable monthly dividend, the Fund may pay dividends at a rate that may be more or less than the amount of net income actually earned by the Fund during the period. Distributions to common shareholders are determined on a tax basis, which may differ from amounts recorded in the accounting records. In instances where the monthly dividend exceeds the earned net investment income, the Fund would report a negative undistributed net ordinary income. Refer to Note 6 – Income Tax Information for additional information regarding the amounts of undistributed net ordinary income and undistributed net long-term capital gains and the character of the actual distributions paid by the Fund during the period.
All monthly dividends paid by each Fund during the current reporting period were paid from net investment income. If a portion of the Fund’s monthly distributions is sourced or comprised of elements other than net investment income, including capital gains and/or a return of capital, shareholders will be notified of those sources. For financial reporting purposes, the per share amounts of each Fund’s distributions for the reporting period are presented in this report’s Financial Highlights. For income tax purposes, distribution information for each Fund as of its most recent tax year end is presented in Note 6 – Income Tax Information within the Notes to Financial Statements of this report.
16
NUVEEN CLOSED-END FUND DISTRIBUTION AMOUNTS
The Nuveen Closed-End Funds’ monthly and quarterly periodic distributions to shareholders are posted on www.nuveen.com and can be found on Nuveen’s enhanced closed-end fund resource page, which is at https://www.nuveen.com/resource-center-closed-end-funds, along with other Nuveen closed-end fund product updates. To ensure timely access to the latest information, shareholders may use a subscribe function, which can be activated at this web page (https://www.nuveen.com/subscriptions).
COMMON SHARE EQUITY SHELF PROGRAMS
During the current reporting period, JPC and JPS were authorized by the Securities and Exchange Commission to issue additional common shares through an equity shelf program (Shelf Offering). Under these programs, JPC and JPS, subject to market conditions, may raise additional capital from time to time in varying amounts and offering methods at a net price at or above each Fund’s NAV per common share. The maximum aggregate offering under these Shelf Offerings, are as shown in the accompanying table.
| | | | | | | | |
| | | JPC | | | JPS | |
| Maximum aggregate offering | | | Unlimited | | | | Unlimited | |
During the current reporting period, JPS and JPC sold common shares through their Shelf Offerings at a weighted average premium to its NAV per common share as shown in the accompanying table.
| | | | | | | | |
| | | JPC | | | JPS | |
| Common shares sold through shelf offering | | | 1,185,860 | | | | 921,252 | |
| Weighted average premium to NAV per common share sold | | | 1.18 | % | | | 1.16 | % |
Refer to Notes to Financial Statements, Note 5 – Fund Shares for further details of Shelf Offerings and each Fund’s transactions.
COMMON SHARE REPURCHASES
During August 2022 (subsequent to the close of the reporting period), the Funds’ Board of Trustees reauthorized an open-market common share repurchase program for JPC, JPI, JPS and JPT and authorized an open-market common share repurchase for NPFD, allowing each Fund to repurchase an aggregate of up to approximately 10% of its outstanding common shares.
During the current reporting period, the Funds did not repurchase any of their outstanding common shares. As of July 31, 2022 (and since the inception of the Funds’ repurchase programs), each Fund has cumulatively repurchased and retired its outstanding common shares as shown in the accompanying table.
| | | | | | | | | | | | | | | | |
| | | JPC | | | JPI | | | JPS | | | JPT | |
| Common shares cumulatively repurchased and retired | | | 2,826,100 | | | | 0 | | | | 38,000 | | | | 0 | |
| Common shares authorized for repurchase | | | 10,380,000 | | | | 2,275,000 | | | | 20,475,000 | | | | 680,000 | |
TENDER OFFER
The Fund’s Board of Trustees authorized JPT to conduct a tender offer pursuant to which the Fund offered to purchase up to 100% of JPT’s outstanding shares for cash on a pro rata basis at a price per share equal to 100% of the NAV per share, as determined on the date the tender offer expires.
On January 19, 2022, Nuveen announced the Fund’s tender offer, which commenced on January 20, 2022 and expired on February 17, 2022. In the tender offer, 2,454,617 common shares were tendered, representing approximately 36% of the Fund’s common shares outstanding, and therefore the Fund repurchased these outstanding shares from participating shareholders.
17
During the current reporting period, JPT repurchased and retired their common shares, through the tender offer, at a price per share and a discount per share as shown in the accompanying table.
| | | | |
| Common shares repurchased and retired through tender offer | | | 2,454,617 | |
| Tender offer price per common share | | $ | 23.2613 | |
| Tender offer discount per common share | | | 0.00 | % |
Refer to Notes to Financial Statements, Note 5 – Fund Shares, Tender Offer for further details on the tender offer.
OTHER COMMON SHARE INFORMATION
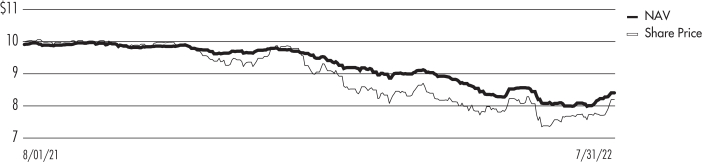
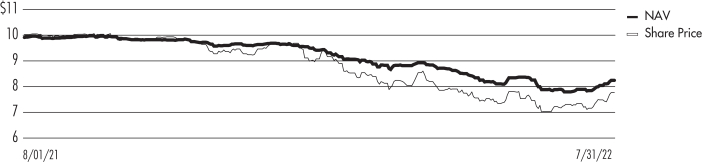
As of July 31, 2022, the Funds’ common share prices were trading at a premium/(discount) to their common share NAV and trading at an average premium/(discount) to NAV during the current reporting period, as follows.
| | | | | | | | | | | | | | | | | | | | |
| | | JPC | | | JPI | | | JPS | | | JPT | | | NPFD | |
| Common share NAV | | $ | 8.41 | | | $ | 21.26 | | | $ | 8.25 | | | $ | 21.16 | | | $ | 21.06 | |
| Common share price | | $ | 8.20 | | | $ | 20.51 | | | $ | 7.77 | | | $ | 20.26 | | | $ | 19.98 | |
| Premium/(Discount) to NAV | | | (2.50 | )% | | | (3.53 | )% | | | (5.82 | )% | | | (4.25 | )% | | | (5.13 | )% |
| Average premium/(discount) to NAV | | | (3.26 | )% | | | (1.46 | )% | | | (3.90 | )% | | | (2.46 | )% | | | (3.52 | )% |
18
THIS PAGE INTENTIONALLY LEFT BLANK
19
| | |
| | Nuveen Preferred & Income Opportunities Fund Performance Overview and Holding Summaries as of July 31, 2022 |
Refer to the Glossary of Terms Used in this Report for further definition of the terms used within this section.
Average Annual Total Returns as of July 31, 2022*
| | | | | | | | | | | | |
| | | Average Annual | |
| | | | | | | | | | |
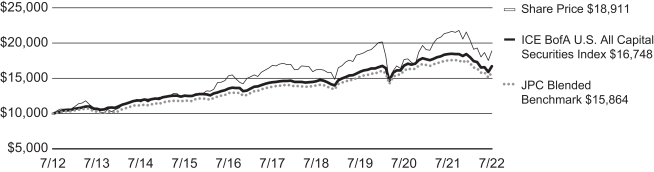
| JPC at Common Share NAV | | | (9.05)% | | | | 2.04% | | | | 6.02% | |
| JPC at Common Share Price | | | (11.91)% | | | | 2.32% | | | | 6.58% | |
| ICE BofA U.S. All Capital Securities Index | | | (9.18)% | | | | 2.96% | | | | 5.29% | |
| JPC Blended Benchmark | | | (9.64)% | | | | 2.77% | | | | 4.62% | |
| * | For purposes of Fund performance, relative results are measured against the JPC Blended Benchmark. Effective April 1, 2022, the Fund’s Blended Benchmark was updated to consist of: 1) 60% ICE BofA U.S. All Capital Securities Index and 2) 40% ICE USD Contingent Capital Index (CDLR). From December 31, 2013 through March 31, 2022, the Fund’s Blended Benchmark consists of: 1) 50% ICE BofA Fixed Rate Preferred Securities Index, 2) 30% ICE BofA U.S. All Capital Securities Index and 3) 20% ICE USD Contingent Capital Index (CDLR). Through December 30, 2013, the JPC Blended Benchmark’s consists of: 1) 82.5% ICE BofA Fixed Rate Preferred Securities Index and 2) 17.5% Bloomberg Capital Securities Index. Refer to the Glossary of Terms Used in this report for further details on the Fund’s Blended Benchmark compositions. |
Performance data shown represents past performance and does not predict or guarantee future results. Current performance may be higher or lower than the data shown. Returns do not reflect the deduction of taxes that shareholders may have to pay on Fund distributions or upon the sale of Fund shares. Returns at NAV are net of Fund expenses, and assume reinvestment of distributions. Comparative index return information is provided for the Fund’s shares at NAV only. Indexes are not available for direct investment. Performance for indexes that were created after the Fund’s inception are linked to the Fund’s previous benchmark.
Daily Common Share NAV and Share Price
Growth of an Assumed $10,000 Investment as of July 31, 2022 - Common Share Price
20
This data relates to the securities held in the Fund’s portfolio of investments as of the end of the reporting period. It should not be construed as a measure of performance for the Fund itself. Holdings are subject to change.
For financial reporting purposes, the ratings disclosed are the highest rating given by one of the following national rating agencies: Standard & Poor’s Group, Moody’s Investors Service, Inc. or Fitch, Inc. This treatment of split-rated securities may differ from that used for other purposes, such as for Fund investment policies. Credit ratings are subject to change. AAA, AA, A and BBB are investment grade ratings; BB, B, CCC, CC, C and D are below investment grade ratings. Holdings designated N/R are not rated by these national rating agencies.
Fund Allocation
(% of net assets)
| | | | |
| $1,000 Par (or similar) Institutional Preferred | | | 78.3% | |
| Contingent Capital Securities | | | 50.7% | |
| $25 Par (or similar) Retail Preferred | | | 28.2% | |
| Corporate Bonds | | | 0.7% | |
| Repurchase Agreements | | | 0.6% | |
| Other Assets Less Liabilities | | | 1.0% | |
| Net Assets Plus Borrowings and Reverse Repurchase Agreements, including accrued interest | | | 159.5% | |
| Borrowings | | | (47.9)% | |
| Reverse Repurchase Agreements, including accrued interest | | | (11.6)% | |
| Net Assets | | | 100% | |
(% of total investments)
| | | | |
| Banks | | | 47.4% | |
| Insurance | | | 14.4% | |
| Capital Markets | | | 13.5% | |
| Food Products | | | 4.7% | |
| Diversified Financial Services | | | 3.7% | |
| Trading Companies & Distributors | | | 2.7% | |
| Oil, Gas & Consumable Fuels | | | 2.5% | |
| Other | | | 10.8% | |
| Repurchase Agreements | | | 0.3% | |
| Total | | | 100% | |
(% of total investments)
| | | | |
| United States | | | 60.5% | |
| United Kingdom | | | 12.2% | |
| Switzerland | | | 7.6% | |
| France | | | 5.3% | |
| Spain | | | 2.4% | |
| Netherlands | | | 2.2% | |
| Canada | | | 2.0% | |
| Australia | | | 1.7% | |
| Germany | | | 1.5% | |
| Ireland | | | 1.4% | |
| Bermuda | | | 1.1% | |
| Other | | | 2.1% | |
| Total | | | 100% | |
Top Five Issuers
(% of total long-term
investments)
| | | | |
| UBS Group AG | | | 4.4% | |
| HSBC Holdings PLC | | | 3.6% | |
| Citigroup Inc | | | 3.3% | |
| Credit Suisse Group AG | | | 3.2% | |
| Barclays PLC | | | 2.9% | |
Portfolio Credit Quality
(% of total long-term fixed-income investments)
| | | | |
| A | | | 0.1% | |
| BBB | | | 65.6% | |
| BB or Lower | | | 32.3% | |
| N/R (not rated) | | | 2.0% | |
| Total | | | 100% | |
| 1 | See the Portfolio of Investments for the remaining industries/sectors comprising “Other” and not listed in the Portfolio Composition above. |
| 2 | Includes 2.0% (as a percentage of total investments) in emerging market countries. |
21
| | |
| | Nuveen Preferred and Income Term Fund Performance Overview and Holding Summaries as of July 31, 2022 |
Refer to the Glossary of Terms Used in this Report for further definition of the terms used within this section.
Average Annual Total Returns as of July 31, 2022*
| | | | | | | | | | | | |
| | | Average Annual | |
| | | 1-Year | | | 5-Year | | | 10-Year | |
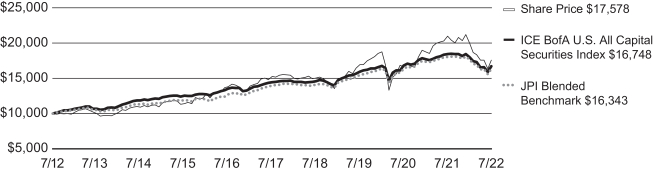
| JPI at Common Share NAV | | | (10.41)% | | | | 2.74% | | | | 6.56% | |
| JPI at Common Share Price | | | (16.35)% | | | | 2.86% | | | | 5.80% | |
| ICE BofA U.S. All Capital Securities Index | | | (9.18)% | | | | 2.96% | | | | 5.29% | |
| JPI Blended Benchmark | | | (9.48)% | | | | 3.16% | | | | 4.82% | |
| * | For purposes of Fund performance, relative results are measured against the JPI Blended Benchmark. The Fund’s Blended Benchmark consists of: 1) 60% ICE BofA U.S. All Capital Securities Index and 2) 40% ICE USD Contingent Capital Index (CDLR). Through December 30, 2013, the Fund’s Blended Benchmark consists of: 1) 65% ICE BofA Fixed Rate Preferred Securities Index and 2) 35% Bloomberg Capital Securities Index. Refer to the Glossary of Terms Used in this report for further details on the Fund’s Blended Benchmark compositions. |
Performance data shown represents past performance and does not predict or guarantee future results. Current performance may be higher or lower than the data shown. Returns do not reflect the deduction of taxes that shareholders may have to pay on Fund distributions or upon the sale of Fund shares. Returns at NAV are net of Fund expenses, and assume reinvestment of distributions. Comparative index return information is provided for the Fund’s shares at NAV only. Indexes are not available for direct investment.
Daily Common Share NAV and Share Price
Growth of an Assumed $10,000 Investment as of July 31, 2022 - Common Share Price
22
This data relates to the securities held in the Fund’s portfolio of investments as of the end of the reporting period. It should not be construed as a measure of performance for the Fund itself. Holdings are subject to change.
For financial reporting purposes, the ratings disclosed are the highest rating given by one of the following national rating agencies: Standard & Poor’s Group, Moody’s Investors Service, Inc. or Fitch, Inc. This treatment of split-rated securities may differ from that used for other purposes, such as for Fund investment policies. Credit ratings are subject to change. AAA, AA, A and BBB are investment grade ratings; BB, B, CCC, CC, C and D are below investment grade ratings. Holdings designated N/R are not rated by these national rating agencies.
Fund Allocation
(% of net assets)
| | | | |
| $1,000 Par (or similar) Institutional Preferred | | | 74.7% | |
| Contingent Capital Securities | | | 51.1% | |
| $25 Par (or similar) Retail Preferred | | | 29.8% | |
| Corporate Bonds | | | 0.7% | |
| Repurchase Agreements | | | 1.0% | |
| Other Assets Less Liabilities | | | 0.8% | |
| Net Assets Plus Borrowings and Reverse Repurchase Agreements, including accrued interest | | | 158.1% | |
| Borrowings | | | (44.6)% | |
| Reverse Repurchase Agreements, including accrued interest | | | (13.5)% | |
| Net Assets | | | 100% | |
(% of total investments)
| | | | |
| Banks | | | 45.6% | |
| Insurance | | | 14.4% | |
| Capital Markets | | | 13.2% | |
| Diversified Financial Services | | | 4.9% | |
| Food Products | | | 4.9% | |
| Other | | | 16.4% | |
| Repurchase Agreements | | | 0.6% | |
| Total | | | 100% | |
(% of total investments)
| | | | |
| United States | | | 59.2% | |
| United Kingdom | | | 12.4% | |
| Switzerland | | | 7.6% | |
| France | | | 5.4% | |
| Spain | | | 2.3% | |
| Netherlands | | | 2.3% | |
| Canada | | | 2.2% | |
| Australia | | | 2.2% | |
| Germany | | | 1.6% | |
| Bermuda | | | 1.2% | |
| Ireland | | | 1.2% | |
| Other | | | 2.4% | |
| Total | | | 100% | |
Top Five Issuers
(% of total long-term
investments)
| | | | |
| UBS Group AG | | | 4.5% | |
| HSBC Holdings PLC | | | 3.6% | |
| Citigroup Inc | | | 3.2% | |
| Credit Suisse Group AG | | | 3.1% | |
| Barclays PLC | | | 2.9% | |
Portfolio Credit Quality
(% of total long-term fixed-income
investments)
| | | | |
| A | | | 0.2% | |
| BBB | | | 64.9% | |
| BB or Lower | | | 32.7% | |
| N/R (not rated) | | | 2.2% | |
| Total | | | 100% | |
| 1 | See the Portfolio of Investments for the remaining industries/sectors comprising “Other” and not listed in the Portfolio Composition above. |
| 2 | Includes 2.1% (as a percentage of total investments) in emerging market countries. |
23
| | |
| | Nuveen Preferred & Income Securities Fund Performance Overview and Holding Summaries as of July 31, 2022 |
Refer to the Glossary of Terms Used in this Report for further definition of the terms used within this section.
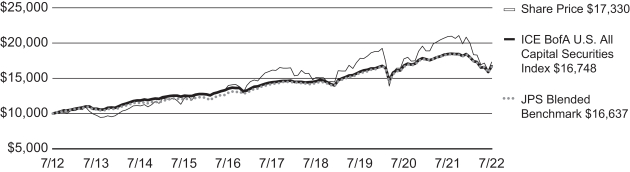
Average Annual Total Returns as of July 31, 2022*
| | | | | | | | | | | | |
| | | Average Annual | |
| | | 1-Year | | | 5-Year | | | 10-Year | |
| JPS at Common Share NAV | | | (11.16)% | | | | 2.21% | | | | 6.18% | |
| JPS at Common Share Price | | | (17.04)% | | | | 1.41% | | | | 5.65% | |
| ICE BofA U.S. All Capital Securities Index | | | (9.18)% | | | | 2.96% | | | | 5.29% | |
| JPS Blended Benchmark | | | (9.48)% | | | | 3.16% | | | | 5.23% | |
| * | For purposes of Fund performance, relative results are measured against the JPS Blended Benchmark. The Fund’s Blended Benchmark consists of: 1) 60% ICE BofA U.S. All Capital Securities Index and 2) 40% ICE USD Contingent Capital Index (CDLR). Through to December 30, 2013, the Fund’s Blended Benchmark consists of: 1) 55% ICE BofA Fixed Rate Preferred Securities Index and 2) 45% Bloomberg Capital Securities Tier-1 Index. Refer to the Glossary of Terms Used in this report for further details on the Fund’s Blended Benchmark compositions. |
Performance data shown represents past performance and does not predict or guarantee future results. Current performance may be higher or lower than the data shown. Returns do not reflect the deduction of taxes that shareholders may have to pay on Fund distributions or upon the sale of Fund shares. Returns at NAV are net of Fund expenses, and assume reinvestment of distributions. Comparative index return information is provided for the Fund’s shares at NAV only. Indexes are not available for direct investment. Performance for indexes that were created after the Fund’s inception are linked to the Fund’s previous benchmark.
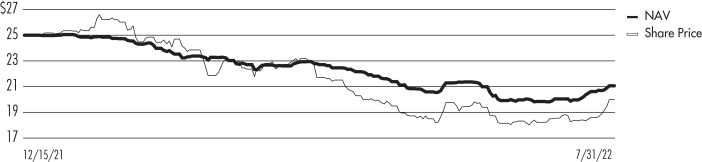
Daily Common Share NAV and Share Price
Growth of an Assumed $10,000 Investment as of July 31, 2022 - Common Share Price
24
This data relates to the securities held in the Fund’s portfolio of investments as of the end of the reporting period. It should not be construed as a measure of performance for the Fund itself. Holdings are subject to change.
For financial reporting purposes, the ratings disclosed are the highest rating given by one of the following national rating agencies: Standard & Poor’s Group, Moody’s Investors Service, Inc. or Fitch, Inc. This treatment of split-rated securities may differ from that used for other purposes, such as for Fund investment policies. Credit ratings are subject to change. AAA, AA, A and BBB are investment grade ratings; BB, B, CCC, CC, C and D are below investment grade ratings. Holdings designated N/R are not rated by these national rating agencies.
Fund Allocation
(% of net assets)
| | | | |
| $1,000 Par (or similar) Institutional Preferred | | | 79.0% | |
| Contingent Capital Securities | | | 54.3% | |
| $25 Par (or similar) Retail Preferred | | | 17.3% | |
| Corporate Bonds | | | 4.7% | |
| Convertible Preferred Securities | | | 1.8% | |
| Investment Companies | | | 1.1% | |
| Repurchase Agreements | | | 1.8% | |
| Other Assets Less Liabilities | | | 1.4% | |
| Net Assets Plus Borrowings, Reverse Repurchase Agreements, including accrued interest and Taxable Fund Preferred Shares, net of deferred offering costs | | | 161.4% | |
| Borrowings | | | (29.4)% | |
| Reverse Repurchase Agreements, including accrued interest | | | (16.2)% | |
| Taxable Fund Preferred, net of deferred offering costs | | | (15.8)% | |
| Net Assets | | | 100% | |
(% of total investments)
| | | | |
| Banks | | | 53.2% | |
| Capital Markets | | | 14.9% | |
| Insurance | | | 14.7% | |
| Electric Utilities | | | 3.0% | |
| Other | | | 12.3% | |
| Repurchase Agreements | | | 1.2% | |
| Investment Companies | | | 0.7% | |
| Total | | | 100% | |
(% of total investments)
| | | | |
| United States | | | 54.6% | |
| United Kingdom | | | 11.4% | |
| France | | | 10.3% | |
| Switzerland | | | 9.0% | |
| Finland | | | 3.0% | |
| Spain | | | 2.1% | |
| Canada | | | 1.6% | |
| Netherlands | | | 1.3% | |
| Norway | | | 1.3% | |
| Australia | | | 1.2% | |
| Japan | | | 1.1% | |
| Other | | | 3.1% | |
| Total | | | 100% | |
Top Five Issuers
(% of total long-term
investments)
| | | | |
| Bank of America Corp | | | 4.3% | |
| UBS Group AG | | | 3.9% | |
| Credit Suisse Group AG | | | 3.5% | |
| BNP Paribas SA | | | 3.4% | |
| Barclays PLC | | | 3.4% | |
Portfolio Credit Quality
(% of total long-term fixed-income investments)
| | | | |
| A | | | 7.5% | |
| BBB | | | 79.1% | |
| BB or Lower | | | 13.4% | |
| Total | | | 100% | |
| 1 | See the Portfolio of Investments for the remaining industries/sectors comprising “Other” and not listed in the Portfolio Composition above. |
| 2 | Includes 0.0% (as a percentage of total investments) in emerging market countries. |
25
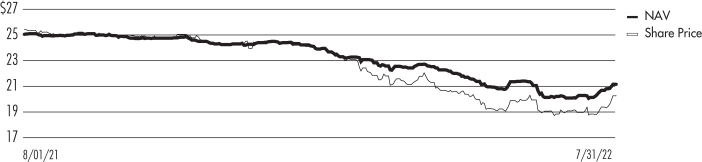
| | |
| | Nuveen Preferred and Income Fund Performance Overview and Holding Summaries as of July 31, 2022 |
Refer to the Glossary of Terms Used in this Report for further definition of the terms used within this section.
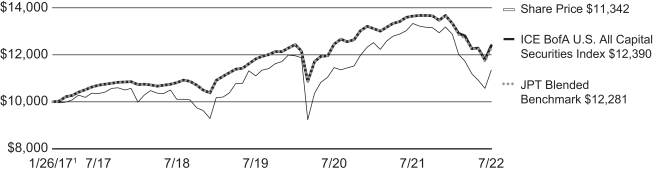
Average Annual Total Returns as of July 31, 2022*
| | | | | | | | | | | | |
| | | Average Annual | |
| | | 1-Year | | | 5-Year | | | Since
Inception | |
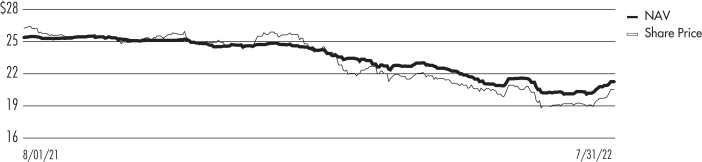
| JPT at Common Share NAV | | | (9.81)% | | | | 2.33% | | | | 3.32% | |
| JPT at Common Share Price | | | (14.88)% | | | | 1.84% | | | | 2.31% | |
| ICE BofA U.S. All Capital Securities Index | | | (9.18)% | | | | 2.96% | | | | 3.97% | |
| JPT Blended Benchmark | | | (9.98)% | | | | 2.78% | | | | 3.80% | |
| * | For purposes of Fund performance, relative results are measured against the JPT Blended Benchmark. Effective February 28, 2022, the Fund’s Blended Benchmark consists of: 1) 60% ICE BofA U.S. All Capital Securities Index and 2) 40% ICE USD Contingent Capital Index (CDLR). Prior to February 28, 2022, the Fund’s performance was measured against the ICE BofA U.S. All Capital Securities Index. Refer to the Glossary of Terms Used in this report for further details. |
Since inception returns are from 1/26/17. Performance data shown represents past performance and does not predict or guarantee future results. Current performance may be higher or lower than the data shown. Returns do not reflect the deduction of taxes that shareholders may have to pay on Fund distributions or upon the sale of Fund shares. Returns at NAV are net of Fund expenses, and assume reinvestment of distributions. Comparative index return information is provided for the Fund’s shares at NAV only. Indexes are not available for direct investment.
Daily Common Share NAV and Share Price
Growth of an Assumed $10,000 Investment as of July 31, 2022 - Common Share Price
| 1 | Value on 1/26/17 is $24.63, which represents the Fund’s public offering price less sales load. |
26
This data relates to the securities held in the Fund’s portfolio of investments as of the end of the reporting period. It should not be construed as a measure of performance for the Fund itself. Holdings are subject to change.
For financial reporting purposes, the ratings disclosed are the highest rating given by one of the following national rating agencies: Standard & Poor’s Group, Moody’s Investors Service, Inc. or Fitch, Inc. This treatment of split-rated securities may differ from that used for other purposes, such as for Fund investment policies. Credit ratings are subject to change. AAA, AA, A and BBB are investment grade ratings; BB, B, CCC, CC, C and D are below investment grade ratings. Holdings designated N/R are not rated by these national rating agencies.
Fund Allocation
(% of net assets)
| | | | |
| $1,000 Par (or similar) Institutional Preferred | | | 75.1% | |
| Contigent Capital Securities | | | 44.9% | |
| $25 Par (or similar) Retail Preferred | | | 25.5% | |
| Corporate Bonds | | | 3.9% | |
| Repurchase Agreements | | | 0.2% | |
| Other Assets Less Liabilities | | | 1.0% | |
| Net Assets Plus Borrowings | | | 150.6% | |
| Borrowings | | | (50.6)% | |
| Net Assets | | | 100% | |
Top Five Issuers
(% of total long-term investments)
| | | | |
| UBS Group AG | | | 4.5% | |
| HSBC Holdings PLC | | | 4.0% | |
| Citigroup Inc | | | 3.3% | |
| Barclays PLC | | | 3.0% | |
| Credit Suisse Group AG | | | 3.0% | |
(% of total investments)
| | | | |
| Banks | | | 44.6% | |
| Insurance | | | 15.0% | |
| Capital Markets | | | 13.5% | |
| Food Products | | | 5.2% | |
| Diversified Financial Services | | | 4.8% | |
| Trading Companies & Distributors | | | 3.1% | |
| Other | | | 13.7% | |
| Repurchase Agreements | | | 0.1% | |
| Total | | | 100% | |
Portfolio Credit Quality
(% of total long-term
fixed-income investments)
| | | | |
| A | | | 0.2% | |
| BBB | | | 65.3% | |
| BB or Lower | | | 33.1% | |
| N/R (not rated) | | | 1.4% | |
| Total | | | 100% | |
(% of total investments)
| | | | |
| United States | | | 58.5% | |
| United Kingdom | | | 11.8% | |
| Switzerland | | | 7.5% | |
| France | | | 5.8% | |
| Spain | | | 2.2% | |
| Ireland | | | 2.2% | |
| Germany | | | 2.2% | |
| Netherlands | | | 2.2% | |
| Canada | | | 2.2% | |
| Australia | | | 1.9% | |
| Bermuda | | | 1.6% | |
| Other | | | 1.9% | |
| Total | | | 100% | |
| 1 | See the Portfolio of Investments for the remaining industries/sectors comprising “Other” and not listed in the Portfolio Composition above. |
| 2 | Includes 2.6% (as a percentage of total investments) in emerging market countries. |
27
| | |
| | Nuveen Variable Rate Preferred & Income Fund Performance Overview and Holding Summaries as of July 31, 2022 |
Refer to Glossary of Terms Used in this Report for further definition of terms used in this section.
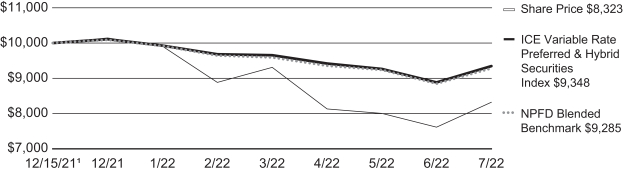
Cumulative Total Returns as of July 31, 2022*
| | | | |
| | | Since
Inception | |
| NPFD at Common Share NAV | | | (12.48)% | |
| NPFD at Common Share Price | | | (16.77)% | |
| ICE Variable Rate Preferred & Hybrid Securities Index | | | (6.52)% | |
| NPFD Blended Benchmark | | | (7.15)% | |
| * | For purposes of Fund performance, relative results are measured against the NPFD Blended Benchmark. The Fund’s Blended Benchmark consists of: 1) 80% ICE Variable Rate Preferred & Hybrid Securities Index and 2) 20% ICE USD Contingent Capital Index (CDLR). |
Since inception returns are from 12/15/2021. Performance data shown represents past performance and does not predict or guarantee future results. Current performance may be higher or lower than the data shown. Returns do not reflect the deduction of taxes that shareholders may have to pay on Fund distributions or upon the sale of Fund shares. Returns at NAV are net of Fund expenses, and assume reinvestment of distributions. Comparative index return information is provided for the Fund’s shares at NAV only. Indexes are not available for direct investment.
Daily Common Share NAV and Share Price
Growth of an Assumed $10,000 Investment as of July 31, 2022 - Common Share Price
| 1 | Value on 12/15/21 is $25.00, which represents the Fund’s public offering price. |
28
This data relates to the securities held in the Fund’s portfolio of investments as of the end of the reporting period. It should not be construed as a measure of performance for the Fund itself. Holdings are subject to change.
For financial reporting purposes, the ratings disclosed are the highest rating given by one of the following national rating agencies: Standard & Poor’s Group, Moody’s Investors Service, Inc. or Fitch, Inc. This treatment of split-rated securities may differ from that used for other purposes, such as for Fund investment policies. Credit ratings are subject to change. AAA, AA, A and BBB are investment grade ratings; BB, B, CCC, CC, C and D are below investment grade ratings. Holdings designated N/R are not rated by these national rating agencies.
Fund Allocation
(% of net assets)
| | | | |
| $1,000 Par (or similar) Institutional Preferred | | | 97.0% | |
| Contingent Capital Securities | | | 29.4% | |
| $25 Par (or similar) Retail Preferred | | | 29.2% | |
| Repurchase Agreements | | | 0.9% | |
| Other Assets Less Liabilities | | | 1.0% | |
| Net Assets Plus Borrowings and Reverse Repurchase Agreements, including accrued interest | | | 157.5% | |
| Borrowings | | | (37.1)% | |
| Reverse Repurchase Agreements, including accrued interest | | | (20.4)% | |
| Net Assets | | | 100% | |
(% of total investments)
| | | | |
| Banks | | | 43.0% | |
| Insurance | | | 13.9% | |
| Capital Markets | | | 13.3% | |
| Oil, Gas & Consumable Fuels | | | 5.3% | |
| Trading Companies & Distributors | | | 3.8% | |
| Electric Utilities | | | 3.1% | |
| Other | | | 17.0% | |
| Repurchase Agreements | | | 0.6% | |
| Total | | | 100% | |
(% of total investments)
| | | | |
| United States | | | 68.1% | |
| United Kingdom | | | 8.5% | |
| Canada | | | 4.8% | |
| Switzerland | | | 4.8% | |
| France | | | 3.3% | |
| Ireland | | | 2.3% | |
| Australia | | | 2.0% | |
| Spain | | | 1.5% | |
| Netherlands | | | 1.4% | |
| Bermuda | | | 1.0% | |
| Other | | | 2.3% | |
| Total | | | 100% | |
Top Five Issuers
(% of total long- term investments)
| | | | |
| Citigroup Inc | | | 4.4% | |
| JPMorgan Chase & Co | | | 3.8% | |
| Wells Fargo & Co | | | 3.8% | |
| Bank of America Corp | | | 3.2% | |
| Morgan Stanley | | | 3.0% | |
Portfolio Credit Quality
(% of total long-term
fixed-income investments)
| | | | |
| A | | | 0.2% | |
| BBB | | | 67.4% | |
| BB or Lower | | | 30.4% | |
| N/R (not rated) | | | 2.0% | |
| Total | | | 100% | |
| 1 | See the Portfolio of Investments for the remaining industries/sectors comprising “Other” and not listed in the Portfolio Composition above. |
| 2 | Includes 1.8% (as a percentage of total investments) in emerging market countries. |
29
Shareholder Meeting Report
The annual meeting of shareholders was held on April 8, 2022 for JPC, JPI, JPS and JPT. The meeting was held virtually due to public health concerns regarding the ongoing COVID-19 pandemic; at this meeting the shareholders were asked to elect Board members.
| | | | | | | | | | | | | | | | |
| | | JPC | | | JPI | | | JPS | | | JPT | |
| | | Common
Shares | | | Common
Shares | | | Common
Shares | | | Common
Shares | |
| Approval of the Board Members was reached as follows: | | | | | | | | | | | | | | | | |
| William C. Hunter | | | | | | | | | | | | | | | | |
| For | | | 77,777,914 | | | | 16,624,330 | | | | 149,954,832 | | | | 4,897,170 | |
| Withhold | | | 2,497,315 | | | | 564,757 | | | | 4,122,817 | | | | 242,767 | |
| Total | | | 80,275,229 | | | | 17,189,087 | | | | 154,077,649 | | | | 5,139,937 | |
| Judith M. Stockdale | | | | | | | | | | | | | | | | |
| For | | | 77,485,636 | | | | 16,666,637 | | | | 149,105,147 | | | | 4,877,367 | |
| Withhold | | | 2,789,593 | | | | 522,450 | | | | 4,972,502 | | | | 262,570 | |
| Total | | | 80,275,229 | | | | 17,189,087 | | | | 154,077,649 | | | | 5,139,937 | |
| Carole E. Stone | | | | | | | | | | | | | | | | |
| For | | | 77,531,909 | | | | 16,680,802 | | | | 149,134,541 | | | | 4,893,628 | |
| Withhold | | | 2,743,320 | | | | 508,285 | | | | 4,943,108 | | | | 246,309 | |
| Total | | | 80,275,229 | | | | 17,189,087 | | | | 154,077,649 | | | | 5,139,937 | |
| Margaret L. Wolff | | | | | | | | | | | | | | | | |
| For | | | 78,035,707 | | | | 16,681,772 | | | | 149,828,600 | | | | 4,907,526 | |
| Withhold | | | 2,239,522 | | | | 507,315 | | | | 4,249,049 | | | | 232,411 | |
| Total | | | 80,275,229 | | | | 17,189,087 | | | | 154,077,649 | | | | 5,139,937 | |
30
Report of Independent Registered Public Accounting Firm
To the Shareholders and Board of Trustees
Nuveen Preferred & Income Opportunities Fund, Nuveen Preferred and Income Term Fund, Nuveen Preferred & Income Securities Fund, Nuveen Preferred and Income Fund (formerly Nuveen Preferred and Income 2022 Term Fund), and Nuveen Variable Rate Preferred & Income Fund:
Opinion on the Financial Statements
We have audited the accompanying statements of assets and liabilities of the Funds listed in Appendix A (the Funds), including the portfolios of investments, as of July 31, 2022, the related statements of operations, cash flows, and changes in net assets for the Funds and periods listed in Appendix A, and the related notes (collectively, the financial statements) and the financial highlights for the Funds and periods listed in Appendix A. In our opinion, the financial statements and financial highlights present fairly, in all material respects, the financial position of the Funds as of July 31, 2022, the results of their operations and their cash flows, and the changes in their net assets for the Funds and periods listed in Appendix A, and the financial highlights for the Funds and periods listed in Appendix A, in conformity with U.S. generally accepted accounting principles.
These financial statements and financial highlights are the responsibility of the Funds’ management. Our responsibility is to express an opinion on these financial statements and financial highlights based on our audits. We are a public accounting firm registered with the Public Company Accounting Oversight Board (United States) (PCAOB) and are required to be independent with respect to the Funds in accordance with the U.S. federal securities laws and the applicable rules and regulations of the Securities and Exchange Commission and the PCAOB.
We conducted our audits in accordance with the standards of the PCAOB. Those standards require that we plan and perform the audit to obtain reasonable assurance about whether the financial statements and financial highlights are free of material misstatement, whether due to error or fraud. Our audits included performing procedures to assess the risks of material misstatement of the financial statements and financial highlights, whether due to error or fraud, and performing procedures that respond to those risks. Such procedures included examining, on a test basis, evidence regarding the amounts and disclosures in the financial statements and financial highlights. Such procedures also included confirmation of securities owned as of July 31, 2022, by correspondence with custodians and brokers; when replies were not received from brokers, we performed other auditing procedures. Our audits also included evaluating the accounting principles used and significant estimates made by management, as well as evaluating the overall presentation of the financial statements and financial highlights. We believe that our audits provide a reasonable basis for our opinion.
/s/ KPMG LLP
We have served as the auditor of one or more Nuveen investment companies since 2014.
Chicago, Illinois
September 28, 2022
31
Appendix A
Funds and Periods
For the year ended July 31, 2022 (statements of operations and cash flows); each of the years in the two-year period ended July 31, 2022 (statements of changes in net assets); each of the years in the five-year period ended July 31, 2022 (financial highlights):
Nuveen Preferred & Income Opportunities Fund
Nuveen Preferred and Income Term Fund
Nuveen Preferred & Income Securities Fund
Nuveen Preferred and Income Fund (formerly Nuveen Preferred and Income 2022 Term Fund)
For the period December 15, 2021 (commencement of operations) through July 31, 2022 (statement of operations, statement of cash flows, statement of changes in net assets and financial highlights):
Nuveen Variable Rate Preferred & Income Fund
32
| | |
| | Nuveen Preferred & Income
Opportunities Fund Portfolio of Investments July 31, 2022 |
| | | | | | | | | | | | | | | | | | | | |
Principal
Amount (000)/
Shares | | | Description (1) | | Coupon | | | Maturity | | | Ratings (2) | | | Value | |
| |
| | | | LONG-TERM INVESTMENTS – 157.9% (99.7% of Total Investments) | |
| |
| | | | $1,000 PAR (OR SIMILAR) INSTITUTIONAL PREFERRED – 78.3% (49.5% of Total Investments) | |
| | | | | |
| | | | Automobiles – 2.3% | | | | | | | | | | | | |
| | | | | |
| $ | 7,485 | | | General Motors Financial Co Inc (3) | | | 5.700% | | | | N/A (4) | | | | BB+ | | | $ | 7,092,038 | |
| | 14,640 | | | General Motors Financial Co Inc (5) | | | 5.750% | | | | N/A (4) | | | | BB+ | | | | 13,119,060 | |
| | | | Total Automobiles | | | | | | | | | | | | | | | 20,211,098 | |
| | | | | |
| | | | Banks – 30.8% | | | | | | | | | | | | |
| | | | | |
| | 1,415 | | | Bank of America Corp | | | 6.100% | | | | N/A (4) | | | | BBB+ | | | | 1,430,746 | |
| | 3,540 | | | Bank of America Corp | | | 6.250% | | | | N/A (4) | | | | BBB+ | | | | 3,565,358 | |
| | 5,560 | | | Bank of America Corp (5) | | | 6.300% | | | | N/A (4) | | | | BBB+ | | | | 5,772,370 | |
| | 3,685 | | | Bank of America Corp | | | 4.375% | | | | N/A (4) | | | | BBB+ | | | | 3,344,137 | |
| | 21,125 | | | Bank of America Corp (3), (5) | | | 6.500% | | | | N/A (4) | | | | BBB+ | | | | 21,661,619 | |
| | 1,820 | | | Citigroup Inc | | | 4.150% | | | | N/A (4) | | | | BBB- | | | | 1,602,656 | |
| | 16,055 | | | Citigroup Inc (5) | | | 6.250% | | | | N/A (4) | | | | BBB- | | | | 16,457,659 | |
| | 6,290 | | | Citigroup Inc (5) | | | 5.000% | | | | N/A (4) | | | | BBB- | | | | 5,823,701 | |
| | 9,981 | | | Citigroup Inc (3) | | | 5.950% | | | | N/A (4) | | | | BBB- | | | | 9,821,404 | |
| | 13,145 | | | Citigroup Inc (3) | | | 6.300% | | | | N/A (4) | | | | BBB- | | | | 12,700,423 | |
| | 2,015 | | | Citizens Financial Group Inc (5) | | | 4.000% | | | | N/A (4) | | | | BB+ | | | | 1,698,548 | |
| | 1,685 | | | Citizens Financial Group Inc | | | 6.375% | | | | N/A (4) | | | | BB+ | | | | 1,514,503 | |
| | 3,150 | | | CoBank ACB (5) | | | 6.250% | | | | N/A (4) | | | | BBB+ | | | | 3,035,313 | |
| | 1,900 | | | Fifth Third Bancorp (5) | | | 4.500% | | | | N/A (4) | | | | Baa3 | | �� | | 1,843,361 | |
| | 14,985 | | | First Citizens BancShares Inc/NC (3-Month LIBOR reference rate + 3.972% spread) (3), (6) | | | 5.801% | | | | N/A (4) | | | | BB- | | | | 14,142,094 | |
| | 910 | | | Goldman Sachs Group Inc | | | 4.400% | | | | N/A (4) | | | | BB+ | | | | 822,276 | |
| | 925 | | | Goldman Sachs Group Inc | | | 3.800% | | | | N/A (4) | | | | BBB- | | | | 798,166 | |
| | 2,314 | | | HSBC Capital Funding Dollar 1 LP, 144A | | | 10.176% | | | | N/A (4) | | | | BBB | | | | 3,118,798 | |
| | 5,525 | | | Huntington Bancshares Inc/OH | | | 5.625% | | | | N/A (4) | | | | Baa3 | | | | 5,469,750 | |
| | 3,025 | | | Huntington Bancshares Inc/OH (5) | | | 5.700% | | | | N/A (4) | | | | Baa3 | | | | 2,742,979 | |
| | 4,280 | | | JPMorgan Chase & Co | | | 3.650% | | | | N/A (4) | | | | BBB+ | | | | 3,917,056 | |
| | 24,555 | | | JPMorgan Chase & Co (5) | | | 6.750% | | | | N/A (4) | | | | BBB+ | | | | 25,230,262 | |
| | 7,275 | | | JPMorgan Chase & Co | | | 5.000% | | | | N/A (4) | | | | BBB+ | | | | 6,758,313 | |
| | 2,660 | | | JPMorgan Chase & Co (5) | | | 6.100% | | | | N/A (4) | | | | BBB+ | | | | 2,661,596 | |
| | 2,485 | | | KeyCorp | | | 5.000% | | | | N/A (4) | | | | Baa3 | | | | 2,305,648 | |
| | 6,970 | | | M&T Bank Corp (5) | | | 6.450% | | | | N/A (4) | | | | Baa2 | | | | 6,902,191 | |
| | 1,880 | | | M&T Bank Corp | | | 5.125% | | | | N/A (4) | | | | Baa2 | | | | 1,739,402 | |
| | 1,440 | | | M&T Bank Corp (5) | | | 3.500% | | | | N/A (4) | | | | Baa2 | | | | 1,174,277 | |
| | 1,922 | | | PNC Financial Services Group Inc | | | 5.000% | | | | N/A (4) | | | | Baa2 | | | | 1,779,846 | |
| | 2,835 | | | PNC Financial Services Group Inc | | | 3.400% | | | | N/A (4) | | | | Baa2 | | | | 2,324,700 | |
| | 16,977 | | | PNC Financial Services Group Inc (3-Month LIBOR reference rate + 3.678% spread) (5), (6) | | | 3.804% | | | | N/A (4) | | | | Baa2 | | | | 16,831,554 | |
| | 4,245 | | | PNC Financial Services Group Inc | | | 6.000% | | | | N/A (4) | | | | Baa2 | | | | 4,271,531 | |
| | 8,290 | | | Regions Financial Corp (3) | | | 5.750% | | | | N/A (4) | | | | Baa3 | | | | 8,430,455 | |
| | 3,290 | | | SVB Financial Group | | | 4.000% | | | | N/A (4) | | | | Baa2 | | | | 2,667,042 | |
| | 785 | | | SVB Financial Group | | | 4.700% | | | | N/A (4) | | | | Baa2 | | | | 626,336 | |
| | 875 | | | SVB Financial Group | | | 4.100% | | | | N/A (4) | | | | Baa2 | | | | 680,488 | |
| | 17,735 | | | Truist Financial Corp (3) | | | 4.800% | | | | N/A (4) | | | | Baa2 | | | | 16,822,498 | |
| | 1,930 | | | Truist Financial Corp (3-Month LIBOR reference rate + 3.102% spread) (6) | | | 4.931% | | | | N/A (4) | | | | Baa2 | | | | 1,785,733 | |
| | 4,690 | | | Truist Financial Corp | | | 5.100% | | | | N/A (4) | | | | Baa2 | | | | 4,485,996 | |
| | 11,747 | | | Wells Fargo & Co (5) | | | 3.900% | | | | N/A (4) | | | | Baa2 | | | | 10,880,659 | |
| | 6,490 | | | Wells Fargo & Co (3) | | | 5.900% | | | | N/A (4) | | | | Baa2 | | | | 6,160,860 | |
| | 13,950 | | | Wells Fargo & Co (3), (5) | | | 5.875% | | | | N/A (4) | | | | Baa2 | | | | 14,071,625 | |
| | 1,385 | | | Wells Fargo & Co (5) | | | 7.950% | | | | 11/15/29 | | | | Baa1 | | | | 1,664,707 | |
| | 9,666 | | | Zions Bancorp NA (3) | | | 7.200% | | | | N/A (4) | | | | BB+ | | | | 9,783,189 | |
| | 1,105 | | | Zions Bancorp NA | | | 5.800% | | | | N/A (4) | | | | BB+ | | | | 1,062,871 | |
| | | | Total Banks | | | | | | | | | | | | | | | 272,384,696 | |
33
| | |
| |
| | Nuveen Preferred & Income Opportunities Fund (continued) |
| | Portfolio of Investments July 31, 2022 |
| | | | | | | | | | | | | | | | | | | | |
Principal
Amount (000)/
Shares | | | Description (1) | | Coupon | | | Maturity | | | Ratings (2) | | | Value | |
| | | | | |
| | | | Capital Markets – 3.8% | | | | | | | | | | | | |
| | | | | |
| $ | 2,040 | | | Bank of New York Mellon Corp (3) | | | 4.700% | | | | N/A (4) | | | | Baa1 | | | $ | 2,031,840 | |
| | 7,425 | | | Charles Schwab Corp (3) | | | 5.375% | | | | N/A (4) | | | | BBB | | | | 7,539,345 | |
| | 1,825 | | | Charles Schwab Corp (5) | | | 4.000% | | | | N/A (4) | | | | BBB | | | | 1,659,600 | |
| | 4,325 | | | Charles Schwab Corp (3-Month LIBOR reference rate + 4.820% spread) (6) | | | 7.602% | | | | N/A (4) | | | | BBB | | | | 4,317,040 | |
| | 7,411 | | | Goldman Sachs Group Inc (3) | | | 5.300% | | | | N/A (4) | | | | BBB- | | | | 7,328,655 | |
| | 9,704 | | | Goldman Sachs Group Inc | | | 5.500% | | | | N/A (4) | | | | BBB- | | | | 9,650,603 | |
| | 1,555 | | | Goldman Sachs Group Inc | | | 4.125% | | | | N/A (4) | | | | BBB- | | | | 1,368,066 | |
| | | | Total Capital Markets | | | | | | | | | | | | | | | 33,895,149 | |
| | | | | |
| | | | Communications Equipment – 0.2% | | | | | | | | | | | | |
| | | | | |
| | 2,315 | | | Vodafone Group PLC (5) | | | 4.125% | | | | 6/04/81 | | | | BB+ | | | | 1,873,911 | |
| | | | | |
| | | | Consumer Finance – 2.3% | | | | | | | | | | | | |
| | | | | |
| | 6,365 | | | Ally Financial Inc | | | 4.700% | | | | N/A (4) | | | | Ba2 | | | | 5,021,612 | |
| | 6,609 | | | Ally Financial Inc (5) | | | 4.700% | | | | N/A (4) | | | | Ba2 | | | | 5,569,404 | |
| | 3,060 | | | American Express Co | | | 3.550% | | | | N/A (4) | | | | Baa2 | | | | 2,689,740 | |
| | 3,215 | | | Capital One Financial Corp | | | 3.950% | | | | N/A (4) | | | | Baa3 | | | | 2,797,006 | |
| | 3,175 | | | Discover Financial Services (5) | | | 6.125% | | | | N/A (4) | | | | Ba2 | | | | 3,241,749 | |
| | 1,465 | | | Discover Financial Services | | | 5.500% | | | | N/A (4) | | | | Ba2 | | | | 1,247,876 | |
| | | | Total Consumer Finance | | | | | | | | | | | | | | | 20,567,387 | |
| | | | | |
| | | | Diversified Financial Services – 4.2% | | | | | | | | | | | | |
| | | | | |
| | 4,570 | | | American AgCredit Corp, 144A (5) | | | 5.250% | | | | N/A (4) | | | | BB+ | | | | 4,181,550 | |
| | 2,590 | | | Capital Farm Credit ACA, 144A (5) | | | 5.000% | | | | N/A (4) | | | | BB | | | | 2,310,280 | |
| | 1,100 | | | Compeer Financial ACA, 144A | | | 4.875% | | | | N/A (4) | | | | BB+ | | | | 970,751 | |
| | 13 | | | Compeer Financial ACA, 144A (5) | | | 6.750% | | | | N/A (4) | | | | BB+ | | | | 12,726,000 | |
| | 7,470 | | | Equitable Holdings Inc (3) | | | 4.950% | | | | N/A (4) | | | | BBB- | | | | 7,328,395 | |
| | 9,696 | | | Voya Financial Inc (5) | | | 6.125% | | | | N/A (4) | | | | BBB- | | | | 9,289,770 | |
| | | | Total Diversified Financial Services | | | | | | | | | | | | | | | 36,806,746 | |
| | | | | |
| | | | Electric Utilities – 2.5% | | | | | | | | | | | | |
| | | | | |
| | 2,070 | | | American Electric Power Co Inc | | | 3.875% | | | | 2/15/62 | | | | BBB | | | | 1,750,738 | |
| | 995 | | | Edison International (5) | | | 5.375% | | | | N/A (4) | | | | BB+ | | | | 857,352 | |
| | 6,070 | | | Edison International (5) | | | 5.000% | | | | N/A (4) | | | | BB+ | | | | 5,120,551 | |
| | 1,565 | | | Electricite de France SA, 144A (5) | | | 5.250% | | | | N/A (4) | | | | BBB- | | | | 1,502,400 | |
| | 11,680 | | | Emera Inc (5) | | | 6.750% | | | | 6/15/76 | | | | BB+ | | | | 11,607,551 | |
| | 1,905 | | | Southern Co | | | 4.000% | | | | 1/15/51 | | | | BBB- | | | | 1,774,206 | |
| | | | Total Electric Utilities | | | | | | | | | | | | | | | 22,612,798 | |
| | | | | |
| | | | Food Products – 4.7% | | | | | | | | | | | | |
| | | | | |
| | 2,145 | | | Dairy Farmers of America Inc, 144A | | | 7.125% | | | | N/A (4) | | | | BB+ | | | | 1,994,850 | |
| | 7,435 | | | Land O’ Lakes Inc, 144A (5) | | | 7.000% | | | | N/A (4) | | | | BB | | | | 7,108,306 | |
| | 3,860 | | | Land O’ Lakes Inc, 144A (5) | | | 7.250% | | | | N/A (4) | | | | BB | | | | 3,763,500 | |
| | 28,560 | | | Land O’ Lakes Inc, 144A (3), (5) | | | 8.000% | | | | N/A (4) | | | | BB | | | | 28,845,600 | |
| | | | Total Food Products | | | | | | | | | | | | | | | 41,712,256 | |
| | | | | |
| | | | Independent Power Producers & Energy Traders – 1.8% | | | | | | | | | | | | |
| | | | | |
| | 2,200 | | | AES Andes SA, 144A (5) | | | 7.125% | | | | 3/26/79 | | | | BB | | | | 2,002,000 | |
| | 4,775 | | | AES Andes SA, 144A | | | 6.350% | | | | 10/07/79 | | | | BB | | | | 4,068,300 | |
| | 1,550 | | | Vistra Corp, 144A | | | 7.000% | | | | N/A (4) | | | | Ba3 | | | | 1,441,407 | |
| | 8,525 | | | Vistra Corp, 144A (3) | | | 8.000% | | | | N/A (4) | | | | Ba3 | | | | 8,258,594 | |
| | | | Total Independent Power Producers & Energy Traders | | | | | | | | | | | | | | | 15,770,301 | |
| | | | | |
| | | | Industrial Conglomerates – 1.5% | | | | | | | | | | | | | | | | |
| | | | | |
| | 14,026 | | | General Electric Co (3-Month LIBOR reference rate + 3.330% spread) (3), (5), (6) | | | 5.159% | | | | N/A (4) | | | | BBB- | | | | 13,079,245 | |
| | | | | |
| | | | Insurance – 14.3% | | | | | | | | | | | | |
| | | | | |
| | 1,615 | | | Aegon NV | | | 5.500% | | | | 4/11/48 | | | | Baa1 | | | | 1,558,785 | |
| | 1,550 | | | American International Group Inc (5) | | | 5.750% | | | | 4/01/48 | | | | BBB- | | | | 1,416,915 | |
34
| | | | | | | | | | | | | | | | | | | | |
Principal
Amount (000)/
Shares | | | Description (1) | | Coupon | | | Maturity | | | Ratings (2) | | | Value | |
| | | | | |
| | | | Insurance (continued) | | | | | | | | | | | | |
| | | | | |
| $ | 10,404 | | | Assurant Inc (3), (5) | | | 7.000% | | | | 3/27/48 | | | | Baa3 | | | $ | 10,424,153 | |
| | 11,519 | | | Assured Guaranty Municipal Holdings Inc, 144A (5) | | | 6.400% | | | | 12/15/66 | | | | BBB+ | | | | 11,113,075 | |
| | 2,465 | | | AXIS Specialty Finance LLC (5) | | | 4.900% | | | | 1/15/40 | | | | BBB | | | | 2,136,859 | |
| | 2,395 | | | Enstar Finance LLC | | | 5.750% | | | | 9/01/40 | | | | BBB- | | | | 2,237,646 | |
| | 5,720 | | | Enstar Finance LLC | | | 5.500% | | | | 1/15/42 | | | | BBB- | | | | 4,907,584 | |
| | 1,485 | | | Legal & General Group PLC Reg S | | | 5.250% | | | | 3/21/47 | | | | A3 | | | | 1,438,579 | |
| | 8,710 | | | Markel Corp | | | 6.000% | | | | N/A (4) | | | | BBB- | | | | 8,840,553 | |
| | 11,660 | | | MetLife Capital Trust IV, 144A (5) | | | 7.875% | | | | 12/15/37 | | | | BBB | | | | 12,838,699 | |
| | 1,430 | | | MetLife Inc | | | 5.875% | | | | N/A (4) | | | | BBB | | | | 1,394,427 | |
| | 1,790 | | | MetLife Inc | | | 3.850% | | | | N/A (4) | | | | BBB | | | | 1,690,197 | |
| | 8,088 | | | MetLife Inc, 144A | | | 9.250% | | | | 4/08/38 | | | | BBB | | | | 9,629,504 | |
| | 575 | | | Nationwide Financial Services Capital Trust (3) | | | 7.899% | | | | 3/01/37 | | | | Baa2 | | | | 649,750 | |
| | 9,550 | | | Nationwide Financial Services Inc (5) | | | 6.750% | | | | 5/15/37 | | | | Baa2 | | | | 9,542,306 | |
| | 2,485 | | | PartnerRe Finance B LLC (5) | | | 4.500% | | | | 10/01/50 | | | | Baa1 | | | | 2,193,012 | |
| | 7,281 | | | Provident Financing Trust I (5) | | | 7.405% | | | | 3/15/38 | | | | BB+ | | | | 8,009,100 | |
| | 745 | | | Prudential Financial Inc | | | 3.700% | | | | 10/01/50 | | | | BBB+ | | | | 651,677 | |
| | 1,190 | | | Prudential Financial Inc (3) | | | 5.125% | | | | 3/01/52 | | | | BBB+ | | | | 1,136,362 | |
| | 9,055 | | | QBE Insurance Group Ltd, 144A (5) | | | 7.500% | | | | 11/24/43 | | | | Baa1 | | | | 9,184,649 | |
| | 2,960 | | | QBE Insurance Group Ltd, 144A (5) | | | 5.875% | | | | N/A (4) | | | | Baa2 | | | | 2,881,560 | |
| | 6,715 | | | QBE Insurance Group Ltd Reg S | | | 6.750% | | | | 12/02/44 | | | | BBB | | | | 6,786,038 | |
| | 10,685 | | | SBL Holdings Inc, 144A (5) | | | 7.000% | | | | N/A (4) | | | | BB | | | | 8,759,938 | |
| | 9,700 | | | SBL Holdings Inc, 144A (3) | | | 6.500% | | | | N/A (4) | | | | BB | | | | 7,105,250 | |
| | | | Total Insurance | | | | | | | | | | | | | | | 126,526,618 | |
| | | | | |
| | | | Media – 0.3% | | | | | | | | | | | | |
| | | | | |
| | 3,110 | | | Paramount Global | | | 6.375% | | | | 3/30/62 | | | | Baa3 | | | | 2,937,505 | |
| | | | | |
| | | | Multi-Utilities – 2.1% | | | | | | | | | | | | |
| | | | | |
| | 2,125 | | | Algonquin Power & Utilities Corp (5) | | | 4.750% | | | | 1/18/82 | | | | BB+ | | | | 1,876,587 | |
| | 7,999 | | | CenterPoint Energy Inc | | | 6.125% | | | | N/A (4) | | | | BBB- | | | | 7,218,915 | |
| | 1,210 | | | CMS Energy Corp (5) | | | 4.750% | | | | 6/01/50 | | | | BBB- | | | | 1,132,996 | |
| | 1,320 | | | NiSource Inc | | | 5.650% | | | | N/A (4) | | | | BBB- | | | | 1,202,943 | |
| | 3,005 | | | Sempra Energy | | | 4.125% | | | | 4/01/52 | | | | BBB- | | | | 2,536,736 | |
| | 4,750 | | | Sempra Energy | | | 4.875% | | | | N/A (4) | | | | BBB- | | | | 4,604,742 | |
| | | | Total Multi-Utilities | | | | | | | | | | | | | | | 18,572,919 | |
| | | | | |
| | | | Oil, Gas & Consumable Fuels – 2.3% | | | | | | | | | | | | |
| | | | | |
| | 2,578 | | | Enbridge Inc | | | 5.500% | | | | 7/15/77 | | | | BBB- | | | | 2,341,606 | |
| | 1,540 | | | Enbridge Inc (5) | | | 6.000% | | | | 1/15/77 | | | | BBB- | | | | 1,464,518 | |
| | 5,765 | | | Enbridge Inc (5) | | | 5.750% | | | | 7/15/80 | | | | BBB- | | | | 5,430,053 | |
| | 3,320 | | | Energy Transfer LP (5) | | | 6.500% | | | | N/A (4) | | | | BB | | | | 3,012,900 | |
| | 630 | | | Energy Transfer LP | | | 7.125% | | | | N/A (4) | | | | BB | | | | 567,000 | |
| | 1,735 | | | MPLX LP (5) | | | 6.875% | | | | N/A (4) | | | | BB+ | | | | 1,663,847 | |
| | 3,015 | | | Transcanada Trust | | | 5.600% | | | | 3/07/82 | | | | BBB | | | | 2,814,943 | |
| | 3,010 | | | Transcanada Trust (5) | | | 5.500% | | | | 9/15/79 | | | | BBB | | | | 2,768,615 | |
| | | | Total Oil, Gas & Consumable Fuels | | | | | | | | | | | | | | | 20,063,482 | |
| | | | | |
| | | | Trading Companies & Distributors – 3.5% | | | | | | | | | | | | |
| | | | | |
| | 15,493 | | | AerCap Global Aviation Trust, 144A (5) | | | 6.500% | | | | 6/15/45 | | | | BB+ | | | | 14,691,234 | |
| | 5,385 | | | AerCap Holdings NV | | | 5.875% | | | | 10/10/79 | | | | BB+ | | | | 4,779,187 | |
| | 4,180 | | | Air Lease Corp (5) | | | 4.650% | | | | N/A (4) | | | | BB+ | | | | 3,658,132 | |
| | 8,474 | | | ILFC E-Capital Trust I, 144A (3) | | | 5.100% | | | | 12/21/65 | | | | BB+ | | | | 6,291,945 | |
| | 1,960 | | | ILFC E-Capital Trust I, 144A | | | 4.850% | | | | 12/21/65 | | | | B+ | | | | 1,471,787 | |
| | | | Total Trading Companies & Distributors | | | | | | | | | | | | | | | 30,892,285 | |
| | | | | |
| | | | U.S. Agency – 0.9% | | | | | | | | | | | | |
| | | | | |
| | 2,420 | | | Farm Credit Bank of Texas, 144A (5) | | | 5.700% | | | | N/A (4) | | | | Baa1 | | | | 2,285,750 | |
| | 5,835 | | | Farm Credit Bank of Texas, 144A (5) | | | 6.200% | | | | N/A (4) | | | | BBB+ | | | | 5,410,475 | |
| | | | Total U.S. Agency | | | | | | | | | | | | | | | 7,696,225 | |
| | | | | |
| | | | Wireless Telecommunication Services – 0.8% | | | | | | | | | | | | |
| | | | | |
| | 6,644 | | | Vodafone Group PLC (3) | | | 7.000% | | | | 4/04/79 | | | | BB+ | | | | 6,984,505 | |
| | | | Total $1,000 Par (or similar) Institutional Preferred (cost $719,728,761) | | | | | | | | | | | | 692,587,126 | |
35
| | |
| |
| | Nuveen Preferred & Income Opportunities Fund (continued) |
| | Portfolio of Investments July 31, 2022 |
| | | | | | | | | | | | | | | | | | | | |
Principal
Amount (000) | | | Description (1), (7) | | Coupon | | | Maturity | | | Ratings (2) | | | Value | |
| | | | |
| | | | CONTINGENT CAPITAL SECURITIES – 50.7% (32.0% of Total Investments) | | | | | | | | | | | | | |
| | | | | |
| | | | Banks – 36.4% | | | | | | | | | | | | |
| | | | | |
| $ | 2,025 | | | Australia & New Zealand Banking Group Ltd/United Kingdom, 144A (5) | | | 6.750% | | | | N/A (4) | | | | Baa2 | | | $ | 2,065,500 | |
| | 3,805 | | | Banco Bilbao Vizcaya Argentaria SA (5) | | | 6.125% | | | | N/A (4) | | | | Ba2 | | | | 3,332,148 | |
| | 12,820 | | | Banco Bilbao Vizcaya Argentaria SA | | | 6.500% | | | | N/A (4) | | | | Ba2 | | | | 12,289,003 | |
| | 3,120 | | | Banco Mercantil del Norte SA/Grand Cayman, 144A (5) | | | 7.625% | | | | N/A (4) | | | | Ba2 | | | | 2,930,585 | |
| | 4,700 | | | Banco Mercantil del Norte SA/Grand Cayman, 144A (5) | | | 7.500% | | | | N/A (4) | | | | Ba2 | | | | 4,218,250 | |
| | 7,905 | | | Banco Santander SA | | | 4.750% | | | | N/A (4) | | | | Ba1 | | | | 6,750,482 | |
| | 10,600 | | | Banco Santander SA Reg S (5) | | | 7.500% | | | | N/A (4) | | | | Ba1 | | | | 10,732,500 | |
| | 6,440 | | | Barclays PLC (3) | | | 6.125% | | | | N/A (4) | | | | BBB- | | | | 6,210,092 | |
| | 19,365 | | | Barclays PLC (3) | | | 7.750% | | | | N/A (4) | | | | BBB- | | | | 19,508,162 | |
| | 14,810 | | | Barclays PLC (3) | | | 8.000% | | | | N/A (4) | | | | BBB- | | | | 15,254,300 | |
| | 13,810 | | | BNP Paribas SA, 144A (3) | | | 7.375% | | | | N/A (4) | | | | BBB | | | | 14,359,280 | |
| | 1,000 | | | BNP Paribas SA, 144A | | | 7.000% | | | | N/A (4) | | | | BBB | | | | 1,005,500 | |
| | 13,145 | | | BNP Paribas SA, 144A (3) | | | 6.625% | | | | N/A (4) | | | | BBB | | | | 13,189,127 | |
| | 7,754 | | | Credit Agricole SA, 144A | | | 7.875% | | | | N/A (4) | | | | BBB | | | | 7,967,235 | |
| | 12,445 | | | Credit Agricole SA, 144A (3) | | | 8.125% | | | | N/A (4) | | | | BBB | | | | 13,238,369 | |
| | 1,840 | | | Danske Bank A/S Reg S | | | 4.375% | | | | N/A (4) | | | | BBB- | | | | 1,582,400 | |
| | 1,815 | | | Danske Bank A/S Reg S | | | 6.125% | | | | N/A (4) | | | | BBB- | | | | 1,756,012 | |
| | 1,600 | | | Danske Bank A/S Reg S (5) | | | 7.000% | | | | N/A (4) | | | | BBB- | | | | 1,545,440 | |
| | 21,850 | | | HSBC Holdings PLC (3), (5) | | | 6.000% | | | | N/A (4) | | | | BBB | | | | 20,961,396 | |
| | 3,415 | | | HSBC Holdings PLC (5) | | | 6.375% | | | | N/A (4) | | | | BBB | | | | 3,392,693 | |
| | 26,144 | | | HSBC Holdings PLC (3) | | | 6.375% | | | | N/A (4) | | | | BBB | | | | 26,387,712 | |
| | 9,280 | | | ING Groep NV (3) | | | 5.750% | | | | N/A (4) | | | | BBB | | | | 8,866,813 | |
| | 7,585 | | | ING Groep NV | | | 6.500% | | | | N/A (4) | | | | BBB | | | | 7,462,047 | |
| | 12,425 | | | ING Groep NV Reg S | | | 6.750% | | | | N/A (4) | | | | BBB | | | | 12,467,493 | |
| | 3,805 | | | Intesa Sanpaolo SpA, 144A (5) | | | 7.700% | | | | N/A (4) | | | | BB- | | | | 3,557,675 | |
| | 11,190 | | | Lloyds Banking Group PLC (3), (5) | | | 7.500% | | | | N/A (4) | | | | Baa3 | | | | 11,304,736 | |
| | 20,395 | | | Lloyds Banking Group PLC (3) | | | 7.500% | | | | N/A (4) | | | | Baa3 | | | | 20,649,938 | |
| | 3,350 | | | Macquarie Bank Ltd/London, 144A | | | 6.125% | | | | N/A (4) | | | | BB+ | | | | 3,100,157 | |
| | 9,649 | | | NatWest Group PLC (5) | | | 6.000% | | | | N/A (4) | | | | BBB- | | | | 9,413,854 | |
| | 12,440 | | | NatWest Group PLC (3) | | | 8.000% | | | | N/A (4) | | | | BBB- | | | | 12,844,300 | |
| | 3,985 | | | Nordea Bank Abp, 144A | | | 6.625% | | | | N/A (4) | | | | BBB+ | | | | 3,975,865 | |
| | 2,820 | | | Societe Generale SA, 144A | | | 4.750% | | | | N/A (4) | | | | BB+ | | | | 2,456,180 | |
| | 11,536 | | | Societe Generale SA, 144A (3) | | | 7.875% | | | | N/A (4) | | | | BB+ | | | | 11,681,863 | |
| | 6,268 | | | Societe Generale SA, 144A | | | 8.000% | | | | N/A (4) | | | | BB | | | | 6,440,555 | |
| | 2,066 | | | Societe Generale SA, 144A (5) | | | 6.750% | | | | N/A (4) | | | | BB | | | | 1,942,139 | |
| | 5,300 | | | Standard Chartered PLC, 144A | | | 4.300% | | | | N/A (4) | | | | BBB- | | | | 4,064,809 | |
| | 5,406 | | | Standard Chartered PLC, 144A (5) | | | 6.000% | | | | N/A (4) | | | | BBB- | | | | 5,363,446 | |
| | 2,010 | | | Standard Chartered PLC, 144A | | | 7.750% | | | | N/A (4) | | | | BBB- | | | | 2,060,602 | |
| | 5,500 | | | UniCredit SpA Reg S | | | 8.000% | | |
| N/A (4)
|
| | | BB- | | | | 5,330,325 | |
| | 325,418 | | | Total Banks | | | | | | | | | | | | | | | 321,658,983 | |
| | | | | |
| | | | Capital Markets – 14.3% | | | | | | | | | | | | |
| | | | | |
| | 18,750 | | | Credit Suisse Group AG, 144A | | | 7.500% | | | | N/A (4) | | | | BB | | | | 17,424,375 | |
| | 8,090 | | | Credit Suisse Group AG, 144A (3) | | | 6.375% | | | | N/A (4) | | | | Ba2 | | | | 6,836,050 | |
| | 7,420 | | | Credit Suisse Group AG, 144A (3) | | | 7.500% | | | | N/A (4) | | | | BB | | | | 7,284,763 | |
| | 10,229 | | | Credit Suisse Group AG, 144A (3), (5) | | | 7.250% | | | | N/A (4) | | | | BB | | | | 9,062,894 | |
| | 3,445 | | | Credit Suisse Group AG, 144A | | | 9.750% | | | | N/A (4) | | | | BB | | | | 3,658,590 | |
| | 23,420 | | | Deutsche Bank AG (3), (5) | | | 6.000% | | | | N/A (4) | | | | BB- | | | | 20,258,300 | |
| | 3,755 | | | UBS Group AG, 144A | | | 3.875% | | | | N/A (4) | | | | BBB | | | | 3,238,480 | |
| | 2,940 | | | UBS Group AG, 144A | | | 4.875% | | | | N/A (4) | | | | BBB | | | | 2,619,930 | |
| | 17,870 | | | UBS Group AG, 144A (5) | | | 7.000% | | | | N/A (4) | | | | BBB | | | | 18,193,983 | |
| | 15,645 | | | UBS Group AG Reg S (5) | | | 7.000% | | | | N/A (4) | | | | BBB | | | | 16,268,610 | |
| | 15,780 | | | UBS Group AG Reg S (5) | | | 6.875% | | | | N/A (4) | | | | BBB | | | | 16,115,325 | |
| | 5,900 | | | UBS Group AG Reg S | | | 5.125% | | | | N/A (4) | | | | BBB | | | | 5,626,700 | |
| | 133,244 | | | Total Capital Markets | | | | | | | | | | | | | | | 126,588,000 | |
| | | | Total Contingent Capital Securities (cost $463,586,185) | | | | | | | | | | | | | | | 448,246,983 | |
36
| | | | | | | | | | | | | | | | | | | | |
| Shares | | | Description (1) | | Coupon | | | | | | Ratings (2) | | | Value | |
| | | | |
| | | | $25 PAR (OR SIMILAR) RETAIL PREFERRED – 28.2% (17.8% of Total Investments) | | | | | | | | | | | | | |
| | | | | |
| | | | Banks – 8.0% | | | | | | | | | | | | |
| | | | | |
| | 93,724 | | | CoBank ACB (8) | | | 6.200% | | | | | | | | BBB+ | | | $ | 9,606,710 | |
| | 158,575 | | | CoBank ACB (8) | | | 6.250% | | | | | | | | BBB+ | | | | 15,897,144 | |
| | 165,500 | | | Farm Credit Bank of Texas, 144A (5), (8) | | | 6.750% | | | | | | | | Baa1 | | | | 16,839,625 | |
| | 221,181 | | | Fifth Third Bancorp (5) | | | 6.625% | | | | | | | | Baa3 | | | | 5,843,602 | |
| | 138,275 | | | KeyCorp | | | 6.125% | | | | | | | | Baa3 | | | | 3,686,411 | |
| | 219,461 | | | Regions Financial Corp | | | 6.375% | | | | | | | | Baa3 | | | | 5,842,052 | |
| | 61,900 | | | Regions Financial Corp | | | 5.700% | | | | | | | | Baa3 | | | | 1,556,166 | |
| | 91,115 | | | Synovus Financial Corp | | | 5.875% | | | | | | | | BB- | | | | 2,329,811 | |
| | 68,200 | | | Wells Fargo & Co | | | 4.750% | | | | | | | | Baa2 | | | | 1,426,744 | |
| | 141,500 | | | Western Alliance Bancorp | | | 4.250% | | | | | | | | Ba1 | | | | 3,404,490 | |
| | 160,747 | | | Wintrust Financial Corp | | | 6.875% | | | | | | | | BB | | | | 4,259,795 | |
| | | | Total Banks | | | | | | | | | | | | | | | 70,692,550 | |
| | | | | |
| | | | Capital Markets – 3.3% | | | | | | | | | | | | |
| | | | | |
| | 57,993 | | | Goldman Sachs Group Inc | | | 5.500% | | | | | | | | BB+ | | | | 1,454,464 | |
| | 203,611 | | | Morgan Stanley | | | 5.850% | | | | | | | | BBB- | | | | 5,228,731 | |
| | 115,800 | | | Morgan Stanley (8) | | | 6.500% | | | | | | | | BBB- | | | | 3,017,748 | |
| | 100,352 | | | Morgan Stanley | | | 6.375% | | | | | | | | BBB- | | | | 2,657,321 | |
| | 110,293 | | | Morgan Stanley | | | 6.875% | | | | | | | | BBB- | | | | 2,901,809 | |
| | 534,260 | | | Morgan Stanley (5) | | | 7.125% | | | | | | | | BBB- | | | | 14,024,325 | |
| | | | Total Capital Markets | | | | | | | | | | | | | | | 29,284,398 | |
| | | | | |
| | | | Consumer Finance – 0.5% | | | | | | | | | | | | |
| | | | | |
| | 84,573 | | | Capital One Financial Corp (5) | | | 5.000% | | | | | | | | Baa3 | | | | 1,886,824 | |
| | 132,414 | | | Synchrony Financial (5) | | | 5.625% | | | | | | | | BB- | | | | 2,735,673 | |
| | | | Total Consumer Finance | | | | | | | | | | | | | | | 4,622,497 | |
| | | | | |
| | | | Diversified Financial Services – 1.7% | | | | | | | | | | | | |
| | | | | |
| | 74,600 | | | AgriBank FCB (8) | | | 6.875% | | | | | | | | BBB+ | | | | 7,590,550 | |
| | 114,400 | | | Equitable Holdings Inc | | | 5.250% | | | | | | | | BBB- | | | | 2,720,432 | |
| | 204,839 | | | Voya Financial Inc | | | 5.350% | | | | | | | | BBB- | | | | 5,053,378 | |
| | | | Total Diversified Financial Services | | | | | | | | | | | | | | | 15,364,360 | |
| | | | | |
| | | | Diversified Telecommunication Services – 0.1% | | | | | | | | | | | | |
| | | | | |
| | 52,800 | | | AT&T Inc (5) | | | 4.750% | | | | | | | | BBB- | | | | 1,098,240 | |
| | | | | |
| | | | Food Products – 2.7% | | | | | | | | | | | | |
| | | | | |
| | 229,411 | | | CHS Inc (5) | | | 7.875% | | | | | | | | N/R | | | | 6,464,802 | |
| | 279,909 | | | CHS Inc | | | 6.750% | | | | | | | | N/R | | | | 7,470,771 | |
| | 295,991 | | | CHS Inc | | | 7.100% | | | | | | | | N/R | | | | 7,837,842 | |
| | 23,900 | | | Dairy Farmers of America Inc, 144A (8) | | | 7.875% | | | | | | | | BB+ | | | | 2,367,677 | |
| | | | Total Food Products | | | | | | | | | | | | | | | 24,141,092 | |
| | | | | |
| | | | Insurance – 8.0% | | | | | | | | | | | | |
| | | | | |
| | 226,000 | | | American Equity Investment Life Holding Co | | | 6.625% | | | | | | | | BB | | | | 5,805,940 | |
| | 460,300 | | | American Equity Investment Life Holding Co (3) | | | 5.950% | | | | | | | | BB | | | | 11,203,702 | |
| | 107,800 | | | Aspen Insurance Holdings Ltd | | | 5.625% | | | | | | | | BB+ | | | | 2,553,782 | |
| | 423,677 | | | Aspen Insurance Holdings Ltd | | | 5.950% | | | | | | | | BB+ | | | | 10,252,983 | |
| | 82,800 | | | Assurant Inc | | | 5.250% | | | | | | | | Baa3 | | | | 1,932,552 | |
| | 236,052 | | | Athene Holding Ltd | | | 6.375% | | | | | | | | BBB | | | | 6,217,610 | |
| | 411,533 | | | Athene Holding Ltd | | | 6.350% | | | | | | | | BBB | | | | 11,037,315 | |
| | 63,400 | | | Delphi Financial Group Inc (8) | | | 4.601% | | | | | | | | BBB | | | | 1,347,250 | |
| | 319,645 | | | Enstar Group Ltd | | | 7.000% | | | | | | | | BBB- | | | | 7,760,981 | |
| | 219,645 | | | Maiden Holdings North America Ltd | | | 7.750% | | | | | | | | N/R | | | | 4,164,469 | |
| | 157,800 | | | Reinsurance Group of America Inc | | | 5.750% | | | | | | | | BBB+ | | | | 4,142,250 | |
| | 113,445 | | | Reinsurance Group of America Inc (5) | | | 6.200% | | | | | | | | BBB+ | | | | 2,874,696 | |
| | 46,100 | | | Selective Insurance Group Inc | | | 4.600% | | | | | | | | BBB- | | | | 936,291 | |
| | | | Total Insurance | | | | | | | | | | | | | | | 70,229,821 | |
37
| | |
| |
| | Nuveen Preferred & Income Opportunities Fund (continued) |
| | Portfolio of Investments July 31, 2022 |
| | | | | | | | | | | | | | | | | | | | |
| Shares | | | Description (1) | | Coupon | | | | | | Ratings (2) | | | Value | |
| | | | | |
| | | | Oil, Gas & Consumable Fuels – 1.8% | | | | | | | | | | | | |
| | | | | |
| | 60,200 | | | Energy Transfer LP | | | 7.600% | | | | | | | | BB | | | $ | 1,426,740 | |
| | 221,982 | | | NuStar Energy LP | | | 8.769% | | | | | | | | B2 | | | | 5,316,469 | |
| | 242,497 | | | NuStar Energy LP | | | 7.673% | | | | | | | | B2 | | | | 5,080,312 | |
| | 163,651 | | | NuStar Logistics LP | | | 9.246% | | | | | | | | B | | | | 4,088,002 | |
| | | | Total Oil, Gas & Consumable Fuels | | | | | | | | | | | | | | | 15,911,523 | |
| | | | | |
| | | | Thrifts & Mortgage Finance – 1.3% | | | | | | | | | | | | |
| | | | | |
| | 74,541 | | | Federal Agricultural Mortgage Corp | | | 6.000% | | | | | | | | N/R | | | | 2,200,823 | |
| | 337,570 | | | New York Community Bancorp Inc | | | 6.375% | | | | | | | | Ba2 | | | | 8,837,583 | |
| | | | Total Thrifts & Mortgage Finance | | | | | | | | | | | | | | | 11,038,406 | |
| | | | | |
| | | | Trading Companies & Distributors – 0.8% | | | | | | | | | | | | |
| | | | | |
| | 207,815 | | | Air Lease Corp | | | 6.150% | | | | | | | | BB+ | | | | 5,072,764 | |
| | 76,500 | | | WESCO International Inc | | | 10.625% | | | | | | | | B | | | | 2,153,475 | |
| | | | Total Trading Companies & Distributors | | | | | | | | | | | | | | | 7,226,239 | |
| | | | Total $25 Par (or similar) Retail Preferred (cost $250,812,767) | | | | | | | | | | | | | | | 249,609,126 | |
| | | | | |
Principal
Amount (000) | | | Description (1) | | Coupon | | | Maturity | | | Ratings (2) | | | Value | |
| | | | | |
| | | | CORPORATE BONDS – 0.7% (0.4% of Total Investments) | | | | | | | | | | | | | | | | |
| | | | | |
| | | | Banks – 0.2% | | | | | | | | | | | | |
| | | | | |
| $ | 1,180 | | | Commerzbank AG, 144A | | | 8.125% | | | | 9/19/23 | | | | Baa3 | | | $ | 1,209,651 | |
| | | | | |
| | | | Insurance – 0.5% | | | | | | | | | | | | |
| | | | | |
| | 2,575 | | | Fidelis Insurance Holdings Ltd, 144A | | | 6.625% | | | | 4/01/41 | | | | BB+ | | | | 2,523,500 | |
| | 1,792 | | | Liberty Mutual Group Inc, 144A (5) | | | 7.800% | | | | 3/15/37 | | | | Baa3 | | | | 2,082,649 | |
| | 4,367 | | | Total Insurance | | | | | | | | | | | | | | | 4,606,149 | |
| $ | 5,547 | | | Total Corporate Bonds (cost $5,390,060) | | | | | | | | | | | | | | | 5,815,800 | |
| | | | Total Long-Term Investments (cost $1,439,517,773) | | | | | | | | | | | | | | | 1,396,259,035 | |
| | | | | |
Principal
Amount (000) | | | Description (1) | | Coupon | | | Maturity | | | | | | Value | |
| |
| | | | SHORT-TERM INVESTMENTS – 0.6% (0.3% of Total Investments) | |
| | | | | |
| | | | REPURCHASE AGREEMENTS – 0.6% (0.3% of Total Investments) | | | | | | | | | | | | |
| | | | | |
| $ | 4,813 | | | Repurchase Agreement with Fixed Income Clearing Corporation, dated 7/29/22, repurchase price $4,813,678, collateralized by $3,143,200, U.S. Treasury Inflation Index Government Bond, 2.500%, due 1/15/29, value 4,909,777 | | | 0.450% | | | | 8/01/22 | | | | | | | $ | 4,813,498 | |
| | | | Total Short-Term Investments (cost $4,813,498) | | | | | | | | | | | | | | | 4,813,498 | |
| | | | Total Investments (cost $1,444,331,271) – 158.5% | | | | | | | | | | | | | | | 1,401,072,533 | |
| | | | Borrowings – (47.9)% (9), (10) | | | | | | | | | | | | | | | (423,400,000 | ) |
| | | | Reverse Repurchase Agreements, including accrued interest – (11.6)% (11) | | | | | | | | (102,318,630 | ) |
| | | | Other Assets Less Liabilities – 1.0% (12) | | | | | | | | | | | | | | | 8,708,135 | |
| | | | Net Assets Applicable to Common Shares – 100% | | | | | | | | | | | | | | $ | 884,062,038 | |
38
Investment in Derivatives
Interest Rate Swaps – OTC Uncleared
| | | | | | | | | | | | | | | | | | | | | | | | | | | | | | | | | | | | | | | | |
| Counterparty | | Notional
Amount | | | Fund
Pay/Receive
Floating Rate | | | Floating Rate Index | | | Fixed Rate
(Annualized) | | | Fixed Rate
Payment
Frequency | | | Effective
Date (13) | | | Optional
Termination
Date | | | Maturity
Date | | | Value | | | Unrealized
Appreciation
(Depreciation) | |
| Morgan Stanley Capital Services, LLC | | $ | 277,500,000 | | | | Receive | | | | 1-Month LIBOR | | | | 1.994 | % | | | Monthly | | | | 6/01/18 | | | | 7/01/25 | | | | 7/01/27 | | | $ | 2,520,950 | | | $ | 2,520,950 | |
| Morgan Stanley Capital Services, LLC | | | 48,000,000 | | | | Receive | | | | 1-Month LIBOR | | | | 2.364 | | | | Monthly | | | | 7/01/19 | | | | 7/01/26 | | | | 7/01/28 | | | | (249,556 | ) | | | (249,556 | ) |
| Total | | $ | 325,500,000 | | | | | | | | | | | | | | | | | | | | | | | | | | | | | | | $ | 2,271,394 | | | $ | 2,271,394 | |
For Fund portfolio compliance purposes, the Fund’s industry classifications refer to any one or more of the industry
sub-classifications
used by one or more widely recognized market indexes or ratings group indexes, and/or as defined by Fund management. This definition may not apply for purposes of this report, which may combine industry
sub-classifications
into sectors for reporting ease.
| (1) | All percentages shown in the Portfolio of Investments are based on net assets applicable to common shares unless otherwise noted. |
| (2) | For financial reporting purposes, the ratings disclosed are the highest of Standard & Poor’s Group (“Standard & Poor’s”), Moody’s Investors Service, Inc. (“Moody’s”) or Fitch, Inc. (“Fitch”) rating. This treatment of split-rated securities may differ from that used for other purposes, such as for Fund investment policies. Ratings below BBB by Standard & Poor’s, Baa by Moody’s or BBB by Fitch are considered to be below investment grade. Holdings designated N/R are not rated by any of these national rating agencies. Ratings are not covered by the report of independent registered public accounting firm. |
| (3) | Investment, or portion of investment, is hypothecated. The total value of investments hypothecated as of the end of the reporting period was $378,989,172. |
| (4) | Perpetual security. Maturity date is not applicable. |
| (5) | Investment, or portion of investment, has been pledged to collateralize the net payment obligations for investments in reverse repurchase agreements. As of the end of the reporting period, investments with a value of $255,549,076 have been pledged as collateral for reverse repurchase agreements. |
| (6) | Variable rate security. The rate shown is the coupon as of the end of the reporting period. |
| (7) | Contingent Capital Securities (“CoCos”) are hybrid securities with loss absorption characteristics built into the terms of the security for the benefit of the issuer. For example, the terms may specify an automatic write-down of principal or a mandatory conversion into the issuer’s common stock under certain adverse circumstances, such as the issuer’s capital ratio falling below a specified level. |
| (8) | For fair value measurement disclosure purposes, investment classified as Level 2. |
| (9) | Borrowings as a percentage of Total Investments is 30.2%. |
| (10) | The Fund may pledge up to 100% of its eligible investments (excluding any investments separately pledged as collateral for specific investments in derivatives, when applicable) in the Portfolio of Investments as collateral for borrowings. As of the end of the reporting period, investments with a value of $985,779,981 have been pledged as collateral for borrowings. |
| (11) | Reverse Repurchase Agreements, including accrued interest as a percentage of Total investments is 7.3%. |
| (12) | Other assets less liabilities includes the unrealized appreciation (depreciation) of certain (“OTC”) derivatives as well as the OTC cleared and exchange-traded derivatives, when applicable. The unrealized appreciation (depreciation) of OTC cleared and exchange-traded derivatives is recognized as part of the cash collateral at brokers and/or the receivable or payable for variation margin as presented on the Statement of Assets and Liabilities, when applicable. |
| (13) | Effective date represents the date on which both the Fund and counterparty commence interest payment accruals on each contract. |
| 144A | Investment is exempt from registration under Rule 144A of the Securities Act of 1933, as amended. These investments may only be resold in transactions exempt from registration, which are normally those transactions with qualified institutional buyers. |
| LIBOR | London Inter-Bank Offered Rate |
| Reg S | Regulation S allows U.S. companies to sell securities to persons or entities located outside of the United States without registering those securities with the Securities and Exchange Commission. Specifically, Regulation S provides a safe harbor from the registration requirements of the Securities Act for the offers and sales of securities by both foreign and domestic issuers that are made outside the United States. |
See accompanying notes to financial statements.
39
| | |
| | Nuveen Preferred and Income
Term Fund Portfolio of Investments July 31, 2022 |
| | | | | | | | | | | | | | | | | | | | |
Principal
Amount (000)/
Shares | | | Description (1) | | Coupon | | | Maturity | | | Ratings (2) | | | Value | |
| |
| | | | LONG-TERM INVESTMENTS – 156.3% (99.4% of Total Investments) | |
| |
| | | | $1,000 PAR (OR SIMILAR) INSTITUTIONAL PREFERRED – 74.7% (47.5% of Total Investments) | |
| |
| | | | Automobiles – 2.3% | |
| | | | | |
| $ | 8,463 | | | General Motors Financial Co Inc (3) | | | 5.750% | | | | N/A (4) | | | | BB+ | | | $ | 7,583,784 | |
| | 3,610 | | | General Motors Financial Co Inc (3) | | | 5.700% | | | | N/A (4) | | | | BB+ | | | | 3,420,475 | |
| | | | Total Automobiles | | | | | | | | | | | | | | | 11,004,259 | |
| |
| | | | Banks – 25.8% | |
| | | | | |
| | 1,330 | | | Bank of America Corp | | | 6.100% | | | | N/A (4) | | | | BBB+ | | | | 1,344,800 | |
| | 3,290 | | | Bank of America Corp (3) | | | 6.250% | | | | N/A (4) | | | | BBB+ | | | | 3,313,567 | |
| | 2,430 | | | Bank of America Corp | | | 4.375% | | | | N/A (4) | | | | BBB+ | | | | 2,205,225 | |
| | 3,815 | | | Bank of America Corp (3) | | | 6.300% | | | | N/A (4) | | | | BBB+ | | | | 3,960,718 | |
| | 3,620 | | | Bank of America Corp (3) | | | 6.500% | | | | N/A (4) | | | | BBB+ | | | | 3,711,956 | |
| | 9,343 | | | Citigroup Inc (3) | | | 5.950% | | | | N/A (4) | | | | BBB- | | | | 9,193,605 | |
| | 6,565 | | | Citigroup Inc (3) | | | 6.300% | | | | N/A (4) | | | | BBB- | | | | 6,342,965 | |
| | 4,850 | | | Citigroup Inc (3) | | | 5.000% | | | | N/A (4) | | | | BBB- | | | | 4,490,453 | |
| | 1,695 | | | Citigroup Inc | | | 4.150% | | | | N/A (4) | | | | BBB- | | | | 1,492,583 | |
| | 2,870 | | | Citigroup Inc (5) | | | 6.250% | | | | N/A (4) | | | | BBB- | | | | 2,941,980 | |
| | 1,580 | | | Citizens Financial Group Inc | | | 6.375% | | | | N/A (4) | | | | BB+ | | | | 1,420,128 | |
| | 1,530 | | | Citizens Financial Group Inc | | | 4.000% | | | | N/A (4) | | | | BB+ | | | | 1,289,716 | |
| | 1,215 | | | Fifth Third Bancorp | | | 4.500% | | | | N/A (4) | | | | Baa3 | | | | 1,178,781 | |
| | 2,670 | | | First Citizens BancShares Inc/NC (3-Month LIBOR reference rate + 3.972% spread) (6) | | | 5.801% | | | | N/A (4) | | | | BB- | | | | 2,519,813 | |
| | 850 | | | Goldman Sachs Group Inc | | | 4.400% | | | | N/A (4) | | | | BB+ | | | | 768,060 | |
| | 860 | | | Goldman Sachs Group Inc | | | 3.800% | | | | N/A (4) | | | | BBB- | | | | 742,079 | |
| | 2,121 | | | HSBC Capital Funding Dollar 1 LP, 144A | | | 10.176% | | | | N/A (4) | | | | BBB | | | | 2,858,673 | |
| | 4,740 | | | Huntington Bancshares Inc/OH | | | 5.625% | | | | N/A (4) | | | | Baa3 | | | | 4,692,600 | |
| | 2,370 | | | JPMorgan Chase & Co | | | 6.100% | | | | N/A (4) | | | | BBB+ | | | | 2,371,422 | |
| | 6,800 | | | JPMorgan Chase & Co (5) | | | 5.000% | | | | N/A (4) | | | | BBB+ | | | | 6,317,049 | |
| | 2,305 | | | JPMorgan Chase & Co | | | 3.650% | | | | N/A (4) | | | | BBB+ | | | | 2,109,536 | |
| | 10,092 | | | JPMorgan Chase & Co | | | 6.750% | | | | N/A (4) | | | | BBB+ | | | | 10,369,530 | |
| | 2,430 | | | KeyCorp | | | 5.000% | | | | N/A (4) | | | | Baa3 | | | | 2,254,618 | |
| | 1,340 | | | M&T Bank Corp | | | 3.500% | | | | N/A (4) | | | | Baa2 | | | | 1,092,730 | |
| | 1,570 | | | M&T Bank Corp | | | 6.450% | | | | N/A (4) | | | | Baa2 | | | | 1,554,726 | |
| | 1,765 | | | M&T Bank Corp | | | 5.125% | | | | N/A (4) | | | | Baa2 | | | | 1,633,002 | |
| | 2,130 | | | PNC Financial Services Group Inc | | | 3.400% | | | | N/A (4) | | | | Baa2 | | | | 1,746,600 | |
| | 1,407 | | | PNC Financial Services Group Inc | | | 5.000% | | | | N/A (4) | | | | Baa2 | | | | 1,302,936 | |
| | 2,340 | | | PNC Financial Services Group Inc | | | 6.000% | | | | N/A (4) | | | | Baa2 | | | | 2,354,625 | |
| | 799 | | | PNC Financial Services Group Inc (3-Month LIBOR reference rate + 3.678% spread) (6) | | | 3.804% | | | | N/A (4) | | | | Baa2 | | | | 792,155 | |
| | 1,745 | | | Regions Financial Corp (3) | | | 5.750% | | | | N/A (4) | | | | Baa3 | | | | 1,774,565 | |
| | 1,320 | | | SVB Financial Group | | | 4.000% | | | | N/A (4) | | | | Baa2 | | | | 1,070,059 | |
| | 830 | | | SVB Financial Group | | | 4.100% | | | | N/A (4) | | | | Baa2 | | | | 645,491 | |
| | 730 | | | SVB Financial Group | | | 4.700% | | | | N/A (4) | | | | Baa2 | | | | 582,453 | |
| | 9,280 | | | Truist Financial Corp (3), (5) | | | 4.800% | | | | N/A (4) | | | | Baa2 | | | | 8,802,525 | |
| | 1,805 | | | Truist Financial Corp (3-Month LIBOR reference rate + 3.102% spread) (5), (6) | | | 4.931% | | | | N/A (4) | | | | Baa2 | | | | 1,670,076 | |
| | 2,520 | | | Truist Financial Corp | | | 5.100% | | | | N/A (4) | | | | Baa2 | | | | 2,410,386 | |
| | 5,803 | | | Wells Fargo & Co (3) | | | 5.875% | | | | N/A (4) | | | | Baa2 | | | | 5,853,594 | |
| | 1,230 | | | Wells Fargo & Co (5) | | | 7.950% | | | | 11/15/29 | | | | Baa1 | | | | 1,478,404 | |
| | 3,256 | | | Wells Fargo & Co | | | 5.900% | | | | N/A (4) | | | | Baa2 | | | | 3,090,872 | |
| | 7,240 | | | Wells Fargo & Co (3) | | | 3.900% | | | | N/A (4) | | | | Baa2 | | | | 6,706,050 | |
| | 1,415 | | | Zions Bancorp NA (5) | | | 7.200% | | | | N/A (4) | | | | BB+ | | | | 1,432,155 | |
| | 1,050 | | | Zions Bancorp NA | | | 5.800% | | | | N/A (4) | | | | BB+ | | | | 1,009,968 | |
| | | | Total Banks | | | | | | | | | | | | | | | 124,893,229 | |
40
| | | | | | | | | | | | | | | | | | | | |
Principal
Amount (000)/
Shares | | | Description (1) | | Coupon | | | Maturity | | | Ratings (2) | | | Value | |
| |
| | | | Capital Markets – 3.6% | |
| | | | | |
| $ | 1,395 | | | Bank of New York Mellon Corp | | | 4.700% | | | | N/A (4) | | | | Baa1 | | | $ | 1,389,420 | |
| | 1,950 | | | Charles Schwab Corp | | | 4.000% | | | | N/A (4) | | | | BBB | | | | 1,773,272 | |
| | 4,215 | | | Charles Schwab Corp (3) | | | 5.375% | | | | N/A (4) | | | | BBB | | | | 4,279,911 | |
| | 1,450 | | | Goldman Sachs Group Inc | | | 4.125% | | | | N/A (4) | | | | BBB- | | | | 1,275,689 | |
| | 4,595 | | | Goldman Sachs Group Inc | | | 5.500% | | | | N/A (4) | | | | BBB- | | | | 4,569,715 | |
| | 4,127 | | | Goldman Sachs Group Inc (5) | | | 5.300% | | | | N/A (4) | | | | BBB- | | | | 4,081,144 | |
| | | | Total Capital Markets | | | | | | | | | | | | | | | 17,369,151 | |
| |
| | | | Communications Equipment – 0.3% | |
| | | | | |
| | 1,920 | | | Vodafone Group PLC | | | 4.125% | | | | 6/04/81 | | | | BB+ | | | | 1,554,173 | |
| |
| | | | Consumer Finance – 2.5% | |
| | | | | |
| | 2,570 | | | Ally Financial Inc | | | 4.700% | | | | N/A (4) | | | | Ba2 | | | | 2,027,579 | |
| | 3,190 | | | Ally Financial Inc | | | 4.700% | | | | N/A (4) | | | | Ba2 | | | | 2,688,213 | |
| | 2,850 | | | American Express Co | | | 3.550% | | | | N/A (4) | | | | Baa2 | | | | 2,505,150 | |
| | 3,005 | | | Capital One Financial Corp | | | 3.950% | | | | N/A (4) | | | | Baa3 | | | | 2,614,309 | |
| | 1,820 | | | Discover Financial Services | | | 6.125% | | | | N/A (4) | | | | Ba2 | | | | 1,858,262 | |
| | 800 | | | Discover Financial Services | | | 5.500% | | | | N/A (4) | | | | Ba2 | | | | 681,434 | |
| | | | Total Consumer Finance | | | | | | | | | | | | | | | 12,374,947 | |
| | | | | |
| | | | Diversified Financial Services – 4.8% | | | | | | | | | | | | |
| | | | | |
| | 2,010 | | | American AgCredit Corp, 144A | | | 5.250% | | | | N/A (4) | | | | BB+ | | | | 1,839,150 | |
| | 2,425 | | | Capital Farm Credit ACA, 144A | | | 5.000% | | | | N/A (4) | | | | BB | | | | 2,163,100 | |
| | 12 | | | Compeer Financial ACA, 144A | | | 6.750% | | | | N/A (4) | | | | BB+ | | | | 11,918,000 | |
| | 1,050 | | | Compeer Financial ACA, 144A | | | 4.875% | | | | N/A (4) | | | | BB+ | | | | 926,626 | |
| | 3,430 | | | Equitable Holdings Inc (3) | | | 4.950% | | | | N/A (4) | | | | BBB- | | | | 3,364,979 | |
| | 3,171 | | | Voya Financial Inc (3), (5) | | | 6.125% | | | | N/A (4) | | | | BBB- | | | | 3,038,146 | |
| | | | Total Diversified Financial Services | | | | | | | | | | | | | | | 23,250,001 | |
| |
| | | | Electric Utilities – 2.7% | |
| | | | | |
| | 1,920 | | | American Electric Power Co Inc (5) | | | 3.875% | | | | 2/15/62 | | | | BBB | | | | 1,623,873 | |
| | 2,110 | | | Edison International | | | 5.000% | | | | N/A (4) | | | | BB+ | | | | 1,779,961 | |
| | 930 | | | Edison International | | | 5.375% | | | | N/A (4) | | | | BB+ | | | | 801,344 | |
| | 1,460 | | | Electricite de France SA, 144A | | | 5.250% | | | | N/A (4) | | | | BBB- | | | | 1,401,600 | |
| | 6,100 | | | Emera Inc (5) | | | 6.750% | | | | 6/15/76 | | | | BB+ | | | | 6,062,162 | |
| | 1,670 | | | Southern Co | | | 4.000% | | | | 1/15/51 | | | | BBB- | | | | 1,555,341 | |
| | | | Total Electric Utilities | | | | | | | | | | | | | | | 13,224,281 | |
| |
| | | | Food Products – 4.9% | |
| | | | | |
| | 2,250 | | | Dairy Farmers of America Inc, 144A | | | 7.125% | | | | N/A (4) | | | | BB+ | | | | 2,092,500 | |
| | 2,240 | | | Land O’ Lakes Inc, 144A | | | 7.250% | | | | N/A (4) | | | | BB | | | | 2,184,000 | |
| | 12,550 | | | Land O’ Lakes Inc, 144A (3) | | | 8.000% | | | | N/A (4) | | | | BB | | | | 12,675,500 | |
| | 7,223 | | | Land O’ Lakes Inc, 144A (3) | | | 7.000% | | | | N/A (4) | | | | BB | | | | 6,905,621 | |
| | | | Total Food Products | | | | | | | | | | | | | | | 23,857,621 | |
| |
| | | | Independent Power Producers & Energy Traders – 1.1% | |
| | | | | |
| | 1,240 | | | AES Andes SA, 144A | | | 7.125% | | | | 3/26/79 | | | | BB | | | | 1,128,400 | |
| | 2,550 | | | AES Andes SA, 144A (5) | | | 6.350% | | | | 10/07/79 | | | | BB | | | | 2,172,600 | |
| | 1,135 | | | Vistra Corp, 144A | | | 8.000% | | | | N/A (4) | | | | Ba3 | | | | 1,099,531 | |
| | 1,095 | | | Vistra Corp, 144A | | | 7.000% | | | | N/A (4) | | | | Ba3 | | | | 1,018,284 | |
| | | | Total Independent Power Producers & Energy Traders | | | | | | | | | | | | | | | 5,418,815 | |
| |
| | | | Industrial Conglomerates – 1.5% | |
| | | | | |
| | 7,852 | | | General Electric Co (3-Month LIBOR reference rate + 3.330% spread) (6) | | | 5.159% | | | | N/A (4) | | | | BBB- | | | | 7,321,990 | |
| |
| | | | Insurance – 14.5% | |
| | | | | |
| | 1,505 | | | Aegon NV | | | 5.500% | | | | 4/11/48 | | | | Baa1 | | | | 1,452,614 | |
| | 1,447 | | | American International Group Inc (5) | | | 5.750% | | | | 4/01/48 | | | | BBB- | | | | 1,322,758 | |
| | 8,580 | | | Assurant Inc (5) | | | 7.000% | | | | 3/27/48 | | | | Baa3 | | | | 8,596,620 | |
| | 10,595 | | | Assured Guaranty Municipal Holdings Inc, 144A (5) | | | 6.400% | | | | 12/15/66 | | | | BBB+ | | | | 10,221,637 | |
| | 2,320 | | | AXIS Specialty Finance LLC (5) | | | 4.900% | | | | 1/15/40 | | | | BBB | | | | 2,011,162 | |
41
| | |
| |
| | Nuveen Preferred and Income Term Fund (continued) |
| | Portfolio of Investments July 31, 2022 |
| | | | | | | | | | | | | | | | | | | | |
Principal
Amount (000)/
Shares | | | Description (1) | | Coupon | | | Maturity | | | Ratings (2) | | | Value | |
| |
| | | | Insurance (continued) | |
| | | | | |
| $ | 1,505 | | | Enstar Finance LLC (5) | | | 5.500% | | | | 1/15/42 | | | | BBB- | | | $ | 1,291,244 | |
| | 1,540 | | | Enstar Finance LLC (5) | | | 5.750% | | | | 9/01/40 | | | | BBB- | | | | 1,438,820 | |
| | 1,375 | | | Legal & General Group PLC Reg S | | | 5.250% | | | | 3/21/47 | | | | A3 | | | | 1,332,017 | |
| | 4,755 | | | Markel Corp (3) | | | 6.000% | | | | N/A (4) | | | | BBB- | | | | 4,826,272 | |
| | 1,850 | | | MetLife Inc | | | 3.850% | | | | N/A (4) | | | | BBB | | | | 1,746,852 | |
| | 3,440 | | | MetLife Inc, 144A | | | 9.250% | | | | 4/08/38 | | | | BBB | | | | 4,095,635 | |
| | 1,270 | | | MetLife Inc (5) | | | 5.875% | | | | N/A (4) | | | | BBB | | | | 1,238,407 | |
| | 2,335 | | | PartnerRe Finance B LLC (5) | | | 4.500% | | | | 10/01/50 | | | | Baa1 | | | | 2,060,637 | |
| | 4,734 | | | Provident Financing Trust I (3) | | | 7.405% | | | | 3/15/38 | | | | BB+ | | | | 5,207,400 | |
| | 700 | | | Prudential Financial Inc | | | 3.700% | | | | 10/01/50 | | | | BBB+ | | | | 612,314 | |
| | 1,105 | | | Prudential Financial Inc (5) | | | 5.125% | | | | 3/01/52 | | | | BBB+ | | | | 1,055,193 | |
| | 7,495 | | | QBE Insurance Group Ltd, 144A (3) | | | 7.500% | | | | 11/24/43 | | | | Baa1 | | | | 7,602,313 | |
| | 2,770 | | | QBE Insurance Group Ltd, 144A (5) | | | 5.875% | | | | N/A (4) | | | | Baa2 | | | | 2,696,595 | |
| | 1,135 | | | QBE Insurance Group Ltd Reg S | | | 6.750% | | | | 12/02/44 | | | | BBB | | | | 1,147,007 | |
| | 2,600 | | | SBL Holdings Inc, 144A | | | 6.500% | | | | N/A (4) | | | | BB | | | | 1,904,500 | |
| | 10,005 | | | SBL Holdings Inc, 144A (3) | | | 7.000% | | | | N/A (4) | | | | BB | | | | 8,202,450 | |
| | | | Total Insurance | | | | | | | | | | | | | | | 70,062,447 | |
| | | | | |
| | | | Media – 0.3% | | | | | | | | | | | | |
| | | | | |
| | 1,660 | | | Paramount Global | | | 6.375% | | | | 3/30/62 | | | | Baa3 | | | | 1,567,929 | |
| | | | | |
| | | | Multi-Utilities – 2.7% | | | | | | | | | | | | |
| | | | | |
| | 1,975 | | | Algonquin Power & Utilities Corp (5) | | | 4.750% | | | | 1/18/82 | | | | BB+ | | | | 1,744,123 | |
| | 5,505 | | | CenterPoint Energy Inc (3) | | | 6.125% | | | | N/A (4) | | | | BBB- | | | | 4,968,137 | |
| | 570 | | | CMS Energy Corp (5) | | | 4.750% | | | | 6/01/50 | | | | BBB- | | | | 533,725 | |
| | 1,215 | | | NiSource Inc | | | 5.650% | | | | N/A (4) | | | | BBB- | | | | 1,107,254 | |
| | 2,365 | | | Sempra Energy | | | 4.875% | | | | N/A (4) | | | | BBB- | | | | 2,292,677 | |
| | 2,785 | | | Sempra Energy | | | 4.125% | | | | 4/01/52 | | | | BBB- | | | | 2,351,018 | |
| | | | Total Multi-Utilities | | | | | | | | | | | | | | | 12,996,934 | |
| | | | | |
| | | | Oil, Gas & Consumable Fuels – 2.5% | | | | | | | | | | | | |
| | | | | |
| | 1,245 | | | Enbridge Inc | | | 5.500% | | | | 7/15/77 | | | | BBB- | | | | 1,130,837 | |
| | 1,440 | | | Enbridge Inc | | | 6.000% | | | | 1/15/77 | | | | BBB- | | | | 1,369,420 | |
| | 3,520 | | | Enbridge Inc (5) | | | 5.750% | | | | 7/15/80 | | | | BBB- | | | | 3,315,488 | |
| | 1,590 | | | Energy Transfer LP (5) | | | 6.500% | | | | N/A (4) | | | | BB | | | | 1,442,925 | |
| | 345 | | | Energy Transfer LP | | | 7.125% | | | | N/A (4) | | | | BB | | | | 310,500 | |
| | 1,620 | | | MPLX LP (5) | | | 6.875% | | | | N/A (4) | | | | BB+ | | | | 1,553,563 | |
| | 1,650 | | | Transcanada Trust | | | 5.600% | | | | 3/07/82 | | | | BBB | | | | 1,540,516 | |
| | 1,645 | | | Transcanada Trust (5) | | | 5.500% | | | | 9/15/79 | | | | BBB | | | | 1,513,080 | |
| | | | Total Oil, Gas & Consumable Fuels | | | | | | | | | | | | | | | 12,176,329 | |
| |
| | | | Trading Companies & Distributors – 3.8% | |
| | | | | |
| | 7,045 | | | AerCap Global Aviation Trust, 144A (5) | | | 6.500% | | | | 6/15/45 | | | | BB+ | | | | 6,680,420 | |
| | 2,915 | | | AerCap Holdings NV | | | 5.875% | | | | 10/10/79 | | | | BB+ | | | | 2,587,062 | |
| | 2,045 | | | Air Lease Corp | | | 4.650% | | | | N/A (4) | | | | BB+ | | | | 1,789,684 | |
| | 1,855 | | | ILFC E-Capital Trust I, 144A (5) | | | 4.850% | | | | 12/21/65 | | | | B+ | | | | 1,392,942 | |
| | 7,902 | | | ILFC E-Capital Trust I, 144A (5) | | | 5.100% | | | | 12/21/65 | | | | BB+ | | | | 5,867,235 | |
| | | | Total Trading Companies & Distributors | | | | | | | | | | | | | | | 18,317,343 | |
| |
| | | | U.S. Agency – 0.7% | |
| | | | | |
| | 2,270 | | | Farm Credit Bank of Texas, 144A | | | 5.700% | | | | N/A (4) | | | | Baa1 | | | | 2,144,072 | |
| | 1,180 | | | Farm Credit Bank of Texas, 144A | | | 6.200% | | | | N/A (4) | | | | BBB+ | | | | 1,094,149 | |
| | | | Total U.S. Agency | | | | | | | | | | | | | | | 3,238,221 | |
| |
| | | | Wireless Telecommunication Services – 0.7% | |
| | | | | |
| | 3,180 | | | Vodafone Group PLC | | | 7.000% | | | | 4/04/79 | | | | BB+ | | | | 3,342,975 | |
| | | | Total $1,000 Par (or similar) Institutional Preferred (cost $376,375,937) | | | | | | | | | | | | | | | 361,970,645 | |
42
| | | | | | | | | | | | | | | | | | | | |
Principal
Amount (000) | | | Description (1), (7) | | Coupon | | | Maturity | | | Ratings (2) | | | Value | |
| |
| | | | CONTINGENT CAPITAL SECURITIES – 51.1% (32.5% of Total Investments) | |
| |
| | | | Banks – 37.0% | |
| | | | | |
| $ | 1,970 | | | Australia & New Zealand Banking Group Ltd/United Kingdom, 144A | | | 6.750% | | | | N/A (4) | | | | Baa2 | | | $ | 2,009,400 | |
| | 3,570 | | | Banco Bilbao Vizcaya Argentaria SA (5) | | | 6.125% | | | | N/A (4) | | | | Ba2 | | | | 3,126,352 | |
| | 5,600 | | | Banco Bilbao Vizcaya Argentaria SA | | | 6.500% | | | | N/A (4) | | | | Ba2 | | | | 5,368,051 | |
| | 1,300 | | | Banco Mercantil del Norte SA/Grand Cayman, 144A (5) | | | 7.500% | | | | N/A (4) | | | | Ba2 | | | | 1,166,750 | |
| | 2,930 | | | Banco Mercantil del Norte SA/Grand Cayman, 144A (5) | | | 7.625% | | | | N/A (4) | | | | Ba2 | | | | 2,752,120 | |
| | 4,660 | | | Banco Santander SA | | | 4.750% | | | | N/A (4) | | | | Ba1 | | | | 3,979,411 | |
| | 5,200 | | | Banco Santander SA Reg S | | | 7.500% | | | | N/A (4) | | | | Ba1 | | | | 5,265,000 | |
| | 8,350 | | | Barclays PLC (3), (5) | | | 7.750% | | | | N/A (4) | | | | BBB- | | | | 8,411,730 | |
| | 7,750 | | | Barclays PLC (5) | | | 8.000% | | | | N/A (4) | | | | BBB- | | | | 7,982,500 | |
| | 6,095 | | | Barclays PLC (3) | | | 6.125% | | | | N/A (4) | | | | BBB- | | | | 5,877,408 | |
| | 950 | | | BNP Paribas SA, 144A | | | 7.000% | | | | N/A (4) | | | | BBB | | | | 955,225 | |
| | 7,615 | | | BNP Paribas SA, 144A (3) | | | 7.375% | | | | N/A (4) | | | | BBB | | | | 7,917,880 | |
| | 7,110 | | | BNP Paribas SA, 144A | | | 6.625% | | | | N/A (4) | | | | BBB | | | | 7,133,868 | |
| | 3,935 | | | Credit Agricole SA, 144A | | | 7.875% | | | | N/A (4) | | | | BBB | | | | 4,043,212 | |
| | 6,979 | | | Credit Agricole SA, 144A (3) | | | 8.125% | | | | N/A (4) | | | | BBB | | | | 7,423,911 | |
| | 870 | | | Danske Bank A/S Reg S | | | 7.000% | | | | N/A (4) | | | | BBB- | | | | 840,333 | |
| | 1,020 | | | Danske Bank A/S Reg S | | | 6.125% | | | | N/A (4) | | | | BBB- | | | | 986,850 | |
| | 970 | | | Danske Bank A/S Reg S | | | 4.375% | | | | N/A (4) | | | | BBB- | | | | 834,200 | |
| | 1,895 | | | HSBC Holdings PLC | | | 6.375% | | | | N/A (4) | | | | BBB | | | | 1,882,621 | |
| | 14,356 | | | HSBC Holdings PLC (3) | | | 6.375% | | | | N/A (4) | | | | BBB | | | | 14,489,825 | |
| | 11,100 | | | HSBC Holdings PLC (3) | | | 6.000% | | | | N/A (4) | | | | BBB | | | | 10,648,581 | |
| | 4,850 | | | ING Groep NV (3) | | | 5.750% | | | | N/A (4) | | | | BBB | | | | 4,634,056 | |
| | 4,270 | | | ING Groep NV | | | 6.500% | | | | N/A (4) | | | | BBB | | | | 4,200,783 | |
| | 6,740 | | | ING Groep NV Reg S | | | 6.750% | | | | N/A (4) | | | | BBB | | | | 6,763,051 | |
| | 2,139 | | | Intesa Sanpaolo SpA, 144A (5) | | | 7.700% | | | | N/A (4) | | | | BB- | | | | 1,999,965 | |
| | 10,645 | | | Lloyds Banking Group PLC (3) | | | 7.500% | | | | N/A (4) | | | | Baa3 | | | | 10,754,148 | |
| | 6,550 | | | Lloyds Banking Group PLC (3) | | | 7.500% | | | | N/A (4) | | | | Baa3 | | | | 6,631,875 | |
| | 3,050 | | | Macquarie Bank Ltd/London, 144A | | | 6.125% | | | | N/A (4) | | | | BB+ | | | | 2,822,531 | |
| | 5,255 | | | NatWest Group PLC | | | 6.000% | | | | N/A (4) | | | | BBB- | | | | 5,126,936 | |
| | 6,950 | | | NatWest Group PLC (5) | | | 8.000% | | | | N/A (4) | | | | BBB- | | | | 7,175,875 | |
| | 3,735 | | | Nordea Bank Abp, 144A (3) | | | 6.625% | | | | N/A (4) | | | | BBB+ | | | | 3,726,439 | |
| | 6,163 | | | Societe Generale SA, 144A | | | 7.875% | | | | N/A (4) | | | | BB+ | | | | 6,240,926 | |
| | 1,820 | | | Societe Generale SA, 144A (5) | | | 8.000% | | | | N/A (4) | | | | BB | | | | 1,870,104 | |
| | 2,635 | | | Societe Generale SA, 144A (5) | | | 4.750% | | | | N/A (4) | | | | BB+ | | | | 2,295,048 | |
| | 1,928 | | | Societe Generale SA, 144A (5) | | | 6.750% | | | | N/A (4) | | | | BB | | | | 1,812,412 | |
| | 2,890 | | | Standard Chartered PLC, 144A | | | 4.300% | | | | N/A (4) | | | | BBB- | | | | 2,216,471 | |
| | 1,875 | | | Standard Chartered PLC, 144A | | | 7.750% | | | | N/A (4) | | | | BBB- | | | | 1,922,203 | |
| | 2,480 | | | Standard Chartered PLC, 144A | | | 6.000% | | | | N/A (4) | | | | BBB- | | | | 2,460,478 | |
| | 2,990 | | | UniCredit SpA Reg S | | | 8.000% | | | | N/A (4) | | | | BB- | | | | 2,897,758 | |
| | 181,190 | | | Total Banks | | | | | | | | | | | | | | | 178,646,287 | |
| |
| | | | Capital Markets – 14.1% | |
| | | | | |
| | 8,175 | | | Credit Suisse Group AG, 144A (5) | | | 7.500% | | | | N/A (4) | | | | BB | | | | 7,597,028 | |
| | 4,037 | | | Credit Suisse Group AG, 144A | | | 7.500% | | | | N/A (4) | | | | BB | | | | 3,963,422 | |
| | 1,870 | | | Credit Suisse Group AG, 144A | | | 9.750% | | | | N/A (4) | | | | BB | | | | 1,985,940 | |
| | 9,496 | | | Credit Suisse Group AG, 144A (3), (5) | | | 7.250% | | | | N/A (4) | | | | BB | | | | 8,413,456 | |
| | 1,955 | | | Credit Suisse Group AG, 144A (5) | | | 6.375% | | | | N/A (4) | | | | Ba2 | | | | 1,651,975 | |
| | 12,995 | | | Deutsche Bank AG (3), (5) | | | 6.000% | | | | N/A (4) | | | | BB- | | | | 11,240,675 | |
| | 8,620 | | | UBS Group AG, 144A (5) | | | 7.000% | | | | N/A (4) | | | | BBB | | | | 8,776,281 | |
| | 3,585 | | | UBS Group AG, 144A | | | 3.875% | | | | N/A (4) | | | | BBB | | | | 3,091,865 | |
| | 1,595 | | | UBS Group AG, 144A | | | 4.875% | | | | N/A (4) | | | | BBB | | | | 1,421,357 | |
| | 2,035 | | | UBS Group AG Reg S | | | 5.125% | | | | N/A (4) | | | | BBB | | | | 1,940,735 | |
| | 8,637 | | | UBS Group AG Reg S | | | 7.000% | | | | N/A (4) | | | | BBB | | | | 8,981,271 | |
| | 9,405 | | | UBS Group AG Reg S (5) | | | 6.875% | | | | N/A (4) | | | | BBB | | | | 9,604,856 | |
| | 72,405 | | | Total Capital Markets | | | | | | | | | | | | | | | 68,668,861 | |
| | | | Total Contingent Capital Securities (cost $256,598,085) | | | | | | | | | | | | | | | 247,315,148 | |
| | | | | |
| Shares | | | Description (1) | | Coupon | | | | | | Ratings (2) | | | Value | |
| |
| | | | $25 PAR (OR SIMILAR) RETAIL PREFERRED – 29.8% (18.9% of Total Investments) | |
| |
| | | | Banks – 8.8% | |
| | | | | |
| | 99,200 | | | CoBank ACB (8) | | | 6.250% | | | | | | | | BBB+ | | | $ | 9,944,800 | |
| | 62,728 | | | CoBank ACB (8) | | | 6.200% | | | | | | | | BBB+ | | | | 6,429,620 | |
43
| | |
| |
| | Nuveen Preferred and Income Term Fund (continued) |
| | Portfolio of Investments July 31, 2022 |
| | | | | | | | | | | | | | | | | | | | |
| Shares | | | Description (1) | | Coupon | | | | | | Ratings (2) | | | Value | |
| |
| | | | Banks (continued) | |
| | | | | |
| | 111,200 | | | Farm Credit Bank of Texas, 144A (5), (8) | | | 6.750% | | | | | | | | Baa1 | | | $ | 11,314,600 | |
| | 98,863 | | | Fifth Third Bancorp | | | 6.625% | | | | | | | | Baa3 | | | | 2,611,961 | |
| | 25,900 | | | KeyCorp | | | 6.125% | | | | | | | | Baa3 | | | | 690,494 | |
| | 120,200 | | | Regions Financial Corp | | | 6.375% | | | | | | | | Baa3 | | | | 3,199,724 | |
| | 57,838 | | | Regions Financial Corp | | | 5.700% | | | | | | | | Baa3 | | | | 1,454,047 | |
| | 82,853 | | | Synovus Financial Corp | | | 5.875% | | | | | | | | BB- | | | | 2,118,551 | |
| | 64,600 | | | Wells Fargo & Co | | | 4.750% | | | | | | | | Baa2 | | | | 1,351,432 | |
| | 43,000 | | | Western Alliance Bancorp | | | 4.250% | | | | | | | | Ba1 | | | | 1,034,580 | |
| | 86,389 | | | Wintrust Financial Corp | | | 6.875% | | | | | | | | BB | | | | 2,289,309 | |
| | | | Total Banks | | | | | | | | | | | | | | | 42,439,118 | |
| |
| | | | Capital Markets – 3.1% | |
| | | | | |
| | 31,549 | | | Goldman Sachs Group Inc | | | 5.500% | | | | | | | | BB+ | | | | 791,249 | |
| | 101,372 | | | Morgan Stanley | | | 7.125% | | | | | | | | BBB- | | | | 2,661,015 | |
| | 93,300 | | | Morgan Stanley | | | 6.375% | | | | | | | | BBB- | | | | 2,470,584 | |
| | 83,476 | | | Morgan Stanley | | | 6.875% | | | | | | | | BBB- | | | | 2,196,253 | |
| | 63,000 | | | Morgan Stanley (8) | | | 6.500% | | | | | | | | BBB- | | | | 1,641,780 | |
| | 196,300 | | | Morgan Stanley | | | 5.850% | | | | | | | | BBB- | | | | 5,040,984 | |
| | | | Total Capital Markets | | | | | | | | | | | | | | | 14,801,865 | |
| |
| | | | Consumer Finance – 0.3% | |
| | | | | |
| | 66,500 | | | Synchrony Financial | | | 5.625% | | | | | | | | BB- | | | | 1,373,890 | |
| | | | | |
| | | | Diversified Financial Services – 3.0% | | | | | | | | | | | | |
| | | | | |
| | 69,700 | | | AgriBank FCB (8) | | | 6.875% | | | | | | | | BBB+ | | | | 7,091,975 | |
| | 105,500 | | | Equitable Holdings Inc (5) | | | 5.250% | | | | | | | | BBB- | | | | 2,508,790 | |
| | 190,535 | | | Voya Financial Inc | | | 5.350% | | | | | | | | BBB- | | | | 4,700,498 | |
| | | | Total Diversified Financial Services | | | | | | | | | | | | | | | 14,301,263 | |
| |
| | | | Diversified Telecommunication Services – 0.2% | |
| | | | | |
| | 49,500 | | | AT&T Inc (5) | | | 4.750% | | | | | | | | BBB- | | | | 1,029,600 | |
| |
| | | | Food Products – 2.7% | |
| | | | | |
| | 180,029 | | | CHS Inc | | | 7.100% | | | | | | | | N/R | | | | 4,767,168 | |
| | 177,210 | | | CHS Inc | | | 6.750% | | | | | | | | N/R | | | | 4,729,735 | |
| | 61,800 | | | CHS Inc | | | 7.875% | | | | | | | | N/R | | | | 1,741,524 | |
| | 20,500 | | | Dairy Farmers of America Inc, 144A (8) | | | 7.875% | | | | | | | | BB+ | | | | 2,030,853 | |
| | | | Total Food Products | | | | | | | | | | | | | | | 13,269,280 | |
| |
| | | | Insurance – 7.7% | |
| | | | | |
| | 122,300 | | | American Equity Investment Life Holding Co | | | 6.625% | | | | | | | | BB | | | | 3,141,887 | |
| | 241,300 | | | American Equity Investment Life Holding Co | | | 5.950% | | | | | | | | BB | | | | 5,873,242 | |
| | 62,000 | | | Aspen Insurance Holdings Ltd | | | 5.625% | | | | | | | | BB+ | | | | 1,468,780 | |
| | 231,598 | | | Aspen Insurance Holdings Ltd | | | 5.950% | | | | | | | | BB+ | | | | 5,604,671 | |
| | 45,000 | | | Assurant Inc | | | 5.250% | | | | | | | | Baa3 | | | | 1,050,300 | |
| | 159,300 | | | Athene Holding Ltd (5) | | | 6.350% | | | | | | | | BBB | | | | 4,272,426 | |
| | 120,000 | | | Athene Holding Ltd | | | 6.375% | | | | | | | | BBB | | | | 3,160,800 | |
| | 59,400 | | | Delphi Financial Group Inc (5), (8) | | | 4.601% | | | | | | | | BBB | | | | 1,262,250 | |
| | 123,400 | | | Enstar Group Ltd (5) | | | 7.000% | | | | | | | | BBB- | | | | 2,996,152 | |
| | 200,629 | | | Maiden Holdings North America Ltd (5) | | | 7.750% | | | | | | | | N/R | | | | 3,803,926 | |
| | 146,800 | | | Reinsurance Group of America Inc (5) | | | 5.750% | | | | | | | | BBB+ | | | | 3,853,500 | |
| | 43,200 | | | Selective Insurance Group Inc | | | 4.600% | | | | | | | | BBB- | | | | 877,392 | |
| | | | Total Insurance | | | | | | | | | | | | | | | 37,365,326 | |
| |
| | | | Oil, Gas & Consumable Fuels – 1.9% | |
| | | | | |
| | 33,200 | | | Energy Transfer LP | | | 7.600% | | | | | | | | BB | | | | 786,840 | |
| | 139,235 | | | NuStar Energy LP (5) | | | 7.673% | | | | | | | | B2 | | | | 2,916,973 | |
| | 157,103 | | | NuStar Energy LP | | | 8.769% | | | | | | | | B2 | | | | 3,762,617 | |
| | 71,018 | | | NuStar Logistics LP (5) | | | 9.246% | | | | | | | | B | | | | 1,774,030 | |
| | | | Total Oil, Gas & Consumable Fuels | | | | | | | | | | | | | | | 9,240,460 | |
44
| | | | | | | | | | | | | | | | | | | | |
| Shares | | | Description (1) | | Coupon | | | | | | Ratings (2) | | | Value | |
| |
| | | | Thrifts & Mortgage Finance – 1.3% | |
| | | | | |
| | 65,790 | | | Federal Agricultural Mortgage Corp | | | 6.000% | | | | | | | | N/R | | | $ | 1,942,450 | |
| | 169,115 | | | New York Community Bancorp Inc (5) | | | 6.375% | | | | | | | | Ba2 | | | | 4,427,430 | |
| | | | Total Thrifts & Mortgage Finance | | | | | | | | | | | | | | | 6,369,880 | |
| |
| | | | Trading Companies & Distributors – 0.8% | |
| | | | | |
| | 114,543 | | | Air Lease Corp (5) | | | 6.150% | | | | | | | | BB+ | | | | 2,795,995 | |
| | 41,600 | | | WESCO International Inc | | | 10.625% | | | | | | | | B | | | | 1,171,040 | |
| | | | Total Trading Companies & Distributors | | | | | | | | | | | | | | | 3,967,035 | |
| | | | Total $25 Par (or similar) Retail Preferred (cost $144,703,558) | | | | | | | | | | | | | | | 144,157,717 | |
| | | | | |
Principal
Amount (000) | | | Description (1) | | Coupon | | | Maturity | | | Ratings (2) | | | Value | |
| |
| | | | CORPORATE BONDS – 0.7% (0.5% of Total Investments) | |
| |
| | | | Banks – 0.2% | |
| | | | | |
| $ | 1,085 | | | Commerzbank AG, 144A (5) | | | 8.125% | | | | 9/19/23 | | | | Baa3 | | | $ | 1,112,264 | |
| |
| | | | Insurance – 0.5% | |
| | | | | |
| | 2,400 | | | Fidelis Insurance Holdings Ltd, 144A (5) | | | 6.625% | | | | 4/01/41 | | | | BB+ | | | | 2,352,000 | |
| $ | 3,485 | | | Total Corporate Bonds (cost $3,485,000) | | | | | | | | | | | | | | | 3,464,264 | |
| | | | Total Long-Term Investments (cost $781,162,580) | | | | | | | | | | | | | | | 756,907,774 | |
| | | | | |
Principal
Amount (000) | | | Description (1) | | Coupon | | | Maturity | | | | | | Value | |
| |
| | | | SHORT-TERM INVESTMENTS – 1.0% (0.6% of Total Investments) | |
| |
| | | | REPURCHASE AGREEMENTS – 1.0% (0.6% of Total Investments) | |
| | | | | |
| $ | 4,622 | | | Repurchase Agreement with Fixed Income Clearing Corporation, dated 7/29/22, repurchase price $4,622,459, collateralized by $3,018,400, U.S Treasury Inflation Index Government Bond, 2.500%, due 1/15/29, value $4,714,836 | | | 0.450% | | | | 8/01/22 | | | | | | | $ | 4,622,286 | |
| | | | Total Short-Term Investments (cost $4,622,286) | | | | | | | | | | | | | | | 4,622,286 | |
| | | | Total Investments (cost $785,784,866) – 157.3% | | | | | | | | | | | | | | | 761,530,060 | |
| | | | Borrowings – (44.6)% (9), (10) | | | | | | | | | | | | | | | (216,000,000 | ) |
| | | | Reverse Repurchase Agreements, including accrued interest – (13.5)% (11) | | | | | | | | (65,189,978 | ) |
| | | | Other Assets Less Liabilities – 0.8% (12) | | | | | | | | | | | | | | | 3,902,036 | |
| | | | Net Assets Applicable to Common Shares – 100% | | | | | | | | | | | | | | $ | 484,242,118 | |
Investment in Derivatives
Interest Rate Swaps – OTC Uncleared
| | | | | | | | | | | | | | | | | | | | | | | | | | | | | | | | | | | | | | | | |
| Counterparty | | Notional
Amount | | | Fund
Pay/Receive
Floating Rate | | | Floating Rate Index | | | Fixed Rate
(Annualized) | | | Fixed Rate
Payment
Frequency | | | Effective
Date (13) | | | Optional
Termination
Date | | | Maturity
Date | | | Value | | | Unrealized
Appreciation
(Depreciation) | |
| Morgan Stanley Capital Services, LLC | | $ | 112,000,000 | | | | Receive | | | | 1-Month LIBOR | | | | 1.928 | % | | | Monthly | | | | 6/01/18 | | | | 3/01/23 | | | | 3/01/24 | | | $ | 719,407 | | | $ | 719,407 | |
| Morgan Stanley Capital Services, LLC | | | 45,000,000 | | | | Receive | | | | 1-Month LIBOR | | | | 2.333 | | | | Monthly | | | | 7/01/19 | | | | 10/01/23 | | | | 7/01/24 | | | | 222,011 | | | | 222,011 | |
| Total | | $ | 157,000,000 | | | | | | | | | | | | | | | | | | | | | | | | | | | | | | | $ | 941,418 | | | $ | 941,418 | |
45
| | |
| |
| | Nuveen Preferred and Income Term Fund (continued) |
| | Portfolio of Investments July 31, 2022 |
For Fund portfolio compliance purposes, the Fund’s industry classifications refer to any one or more of the industry
sub-classifications
used by one or more widely recognized market indexes or ratings group indexes, and/or as defined by Fund management. This definition may not apply for purposes of this report, which may combine industry
sub-classifications
into sectors for reporting ease.
| (1) | All percentages shown in the Portfolio of Investments are based on net assets applicable to common shares unless otherwise noted. |
| (2) | For financial reporting purposes, the ratings disclosed are the highest of Standard & Poor’s Group (“Standard & Poor’s”), Moody’s Investors Service, Inc. (“Moody’s”) or Fitch, Inc. (“Fitch”) rating. This treatment of split-rated securities may differ from that used for other purposes, such as for Fund investment policies. Ratings below BBB by Standard & Poor’s, Baa by Moody’s or BBB by Fitch are considered to be below investment grade. Holdings designated N/R are not rated by any of these national rating agencies. Ratings are not covered by the report of independent registered public accounting firm. |
| (3) | Investment, or portion of investment, is hypothecated. The total value of investments hypothecated as of the end of the reporting period was $197,806,164. |
| (4) | Perpetual security. Maturity date is not applicable. |
| (5) | Investment, or portion of investment, has been pledged to collateralize the net payment obligations for investments in reverse repurchase agreements. As of the end of the reporting period, investments with a value of $157,389,618 have been pledged as collateral for reverse repurchase agreements. |
| (6) | Variable rate security. The rate shown is the coupon as of the end of the reporting period. |
| (7) | Contingent Capital Securities (“CoCos”) are hybrid securities with loss absorption characteristics built into the terms of the security for the benefit of the issuer. For example, the terms may specify an automatic write-down of principal or a mandatory conversion into the issuer’s common stock under certain adverse circumstances, such as the issuer’s capital ratio falling below a specified level. |
| (8) | For fair value measurement disclosure purposes, investment classified as Level 2. |
| (9) | Borrowings as a percentage of Total Investments is 28.4%. |
| (10) | The Fund may pledge up to 100% of its eligible investments (excluding any investments separately pledged as collateral for specific investments in derivatives, when applicable) in the Portfolio of Investments as collateral for borrowings. As of the end of the reporting period, investments with a value of $521,181,625 have been pledged as collateral for borrowings. |
| (11) | Reverse Repurchase Agreements, including accrued interest as a percentage of Total Investments is 8.6%. |
| (12) | Other assets less liabilities includes the unrealized appreciation (depreciation) of certain (“OTC”) derivatives as well as the OTC cleared and exchange-traded derivatives, when applicable. The unrealized appreciation (depreciation) of OTC cleared and exchange-traded derivatives is recognized as part of the cash collateral at brokers and/or the receivable or payable for variation margin as presented on the Statement of Assets and Liabilities, when applicable. |
| (13) | Effective date represents the date on which both the Fund and counterparty commence interest payment accruals on each contract. |
| 144A | Investment is exempt from registration under Rule 144A of the Securities Act of 1933, as amended. These investments may only be resold in transactions exempt from registration, which are normally those transactions with qualified institutional buyers. |
| LIBOR | London Inter-Bank Offered Rate |
| Reg S | Regulation S allows U.S. companies to sell securities to persons or entities located outside of the United States without registering those securities with the Securities and Exchange Commission. Specifically, Regulation S provides a safe harbor from the registration requirements of the Securities Act for the offers and sales of securities by both foreign and domestic issuers that are made outside the United States. |
See accompanying notes to financial statements.
46
| | |
| | Nuveen Preferred &
Income Securities Fund Portfolio of Investments July 31, 2022 |
| | | | | | | | | | | | | | | | | | | | |
Principal
Amount (000)/
Shares | | | Description (1) | | Coupon | | | Maturity | | | Ratings (2) | | | Value | |
| | | | |
| | | | LONG-TERM INVESTMENTS – 158.2% (98.8% of Total Investments) | | | | | | | | | | | | | |
| |
| | | | $1,000 PAR (OR SIMILAR) INSTITUTIONAL PREFERRED – 79.0% (49.4% of Total Investments) | |
| | | | | |
| | | | Banks – 32.6% | | | | | | | | | | | | |
| | | | | |
| $ | 19,300 | | | Bank of America Corp (3) | | | 6.500% | | | | N/A (4) | | | | BBB+ | | | $ | 19,790,260 | |
| | 12,300 | | | Bank of America Corp | | | 6.100% | | | | N/A (4) | | | | BBB+ | | | | 12,436,871 | |
| | 2,861 | | | Bank of America Corp (5) | | | 8.050% | | | | 6/15/27 | | | | Baa2 | | | | 3,251,208 | |
| | 2,800 | | | Bank of America Corp | | | 4.375% | | | | N/A (4) | | | | BBB+ | | | | 2,541,000 | |
| | 60,000 | | | Bank of America Corp (5) | | | 6.125% | | | | N/A (4) | | | | BBB+ | | | | 60,300,000 | |
| | 3,000 | | | Bank of Nova Scotia | | | 4.900% | | | | N/A (4) | | | | BBB- | | | | 2,921,250 | |
| | 19,799 | | | Citigroup Inc (5) | | | 4.000% | | | | N/A (4) | | | | BBB- | | | | 18,405,697 | |
| | 20,700 | | | Citigroup Inc | | | 3.875% | | | | N/A (4) | | | | BBB- | | | | 18,920,835 | |
| | 8,500 | | | Citigroup Inc (5) | | | 4.150% | | | | N/A (4) | | | | BBB- | | | | 7,484,930 | |
| | 3,400 | | | Citizens Financial Group Inc (5) | | | 6.375% | | | | N/A (4) | | | | BB+ | | | | 3,055,971 | |
| | 7,500 | | | Citizens Financial Group Inc | | | 4.000% | | | | N/A (4) | | | | BB+ | | | | 6,322,138 | |
| | 3,976 | | | Citizens Financial Group Inc (5) | | | 5.650% | | | | N/A (4) | | | | BB+ | | | | 4,086,135 | |
| | 14,000 | | | CoBank ACB (3), (5) | | | 6.250% | | | | N/A (4) | | | | BBB+ | | | | 13,490,280 | |
| | 12,130 | | | Comerica Inc (5) | | | 5.625% | | | | N/A (4) | | | | Baa2 | | | | 12,463,575 | |
| | 6,100 | | | Corestates Capital III (3-Month LIBOR reference rate + 0.570% spread), 144A (5), (6) | | | 1.981% | | | | 2/15/27 | | | | A1 | | | | 5,649,984 | |
| | 1,250 | | | DNB Bank ASA (6-Month LIBOR reference rate + 0.150% spread) (6) | | | 0.954% | | | | N/A (4) | | | | Baa2 | | | | 887,500 | |
| | 1,250 | | | DNB Bank ASA (3-Month LIBOR reference rate + 0.250% spread) (6) | | | 1.848% | | | | N/A (4) | | | | Baa2 | | | | 886,000 | |
| | 1,000 | | | Fifth Third Bancorp | | | 4.500% | | | | N/A (4) | | | | Baa3 | | | | 970,190 | |
| | 2,500 | | | Goldman Sachs Group Inc | | | 3.800% | | | | N/A (4) | | | | BBB- | | | | 2,157,205 | |
| | 30,000 | | | HSBC Capital Funding Dollar 1 LP, 144A (3), (5) | | | 10.176% | | | | N/A (4) | | | | BBB | | | | 40,433,853 | |
| | 8,000 | | | HSBC Capital Funding Dollar 1 LP, Reg S | | | 10.176% | | | | N/A (4) | | | | BBB | | | | 10,782,361 | |
| | 21,000 | | | Huntington Bancshares Inc/OH (5) | | | 4.450% | | | | N/A (4) | | | | Baa3 | | | | 19,603,051 | |
| | 11,000 | | | Huntington Bancshares Inc/OH (5) | | | 5.625% | | | | N/A (4) | | | | Baa3 | | | | 10,890,000 | |
| | 7,000 | | | JPMorgan Chase & Co (5) | | | 6.100% | | | | N/A (4) | | | | BBB+ | | | | 7,004,200 | |
| | 55,800 | | | JPMorgan Chase & Co | | | 6.750% | | | | N/A (4) | | | | BBB+ | | | | 57,334,500 | |
| | 2,000 | | | JPMorgan Chase & Co | | | 3.650% | | | | N/A (4) | | | | BBB+ | | | | 1,830,400 | |
| | 8,000 | | | KeyCorp Capital III (5) | | | 7.750% | | | | 7/15/29 | | | | Baa2 | | | | 9,210,188 | |
| | 6,200 | | | PNC Financial Services Group Inc (5) | | | 3.400% | | | | N/A (4) | | | | Baa2 | | | | 5,084,000 | |
| | 4,100 | | | PNC Financial Services Group Inc (3-Month LIBOR reference rate + 3.678% spread) (6) | | | 3.804% | | | | N/A (4) | | | | Baa2 | | | | 4,064,874 | |
| | 3,000 | | | PNC Financial Services Group Inc | | | 6.000% | | | | N/A (4) | | | | Baa2 | | | | 3,018,750 | |
| | 2,000 | | | Regions Financial Corp | | | 5.750% | | | | N/A (4) | | | | Baa3 | | | | 2,033,885 | |
| | 24,100 | | | Standard Chartered PLC, 144A | | | 7.014% | | | | N/A (4) | | | | BBB- | | | | 25,287,867 | |
| | 16,200 | | | SVB Financial Group (5) | | | 4.250% | | | | N/A (4) | | | | Baa2 | | | | 12,807,102 | |
| | 1,000 | | | SVB Financial Group | | | 4.100% | | | | N/A (4) | | | | Baa2 | | | | 777,700 | |
| | 46,867 | | | Truist Financial Corp (3) | | | 4.950% | | | | N/A (4) | | | | Baa2 | | | | 47,359,104 | |
| | 36,386 | | | Truist Financial Corp | | | 4.800% | | | | N/A (4) | | | | Baa2 | | | | 34,513,866 | |
| | 38,150 | | | Wells Fargo & Co (3), (5) | | | 3.900% | | | | N/A (4) | | | | Baa2 | | | | 35,336,438 | |
| | 25,580 | | | Wells Fargo & Co (5) | | | 7.950% | | | | 11/15/29 | | | | Baa1 | | | | 30,746,001 | |
| | | | Total Banks | | | | | | | | | | | | | | | 554,139,169 | |
| | | | | |
| | | | Capital Markets – 10.0% | | | | | | | | | | | | |
| | | | | |
| | 21,300 | | | Bank of New York Mellon Corp | | | 3.750% | | | | N/A (4) | | | | Baa1 | | | | 18,556,560 | |
| | 35,150 | | | Bank of New York Mellon Corp (3) | | | 4.700% | | | | N/A (4) | | | | Baa1 | | | | 35,009,400 | |
| | 10,000 | | | Bank of New York Mellon Corp | | | 3.700% | | | | N/A (4) | | | | Baa1 | | | | 9,200,137 | |
| | 18,700 | | | Charles Schwab Corp (3-Month LIBOR reference rate + 4.820% spread) (6) | | | 7.602% | | | | N/A (4) | | | | BBB | | | | 18,665,584 | |
| | 15,500 | | | Charles Schwab Corp | | | 4.000% | | | | N/A (4) | | | | BBB | | | | 14,095,235 | |
| | 39,505 | | | Charles Schwab Corp (3) | | | 5.375% | | | | N/A (4) | | | | BBB | | | | 40,113,377 | |
| | 7,500 | | | Depository Trust & Clearing Corp, 144A | | | 3.375% | | | | N/A (4) | | | | A | | | | 6,076,914 | |
| | 7,600 | | | Goldman Sachs Group Inc | | | 4.950% | | | | N/A (4) | | | | BBB- | | | | 7,265,600 | |
| | 6,000 | | | Goldman Sachs Group Inc | | | 5.500% | | | | N/A (4) | | | | BBB- | | | | 5,966,984 | |
| | 18,000 | | | Goldman Sachs Group Inc | | | 3.650% | | | | N/A (4) | | | | BBB- | | | | 15,211,393 | |
| | | | Total Capital Markets | | | | | | | | | | | | | | | 170,161,184 | |
47
| | |
| |
| | Nuveen Preferred & Income Securities Fund (continued) |
| | Portfolio of Investments July 31, 2022 |
| | | | | | | | | | | | | | | | | | | | |
Principal
Amount (000)/
Shares | | | Description (1) | | Coupon | | | Maturity | | | Ratings (2) | | | Value | |
| | | | | |
| | | | Consumer Finance – 2.4% | | | | | | | | | | | | |
| | | | | |
| $ | 8,500 | | | Ally Financial Inc | | | 4.700% | | | | N/A (4) | | | | Ba2 | | | $ | 7,162,950 | |
| | 7,400 | | | Ally Financial Inc | | | 4.700% | | | | N/A (4) | | | | Ba2 | | | | 5,838,166 | |
| | 14,500 | | | American Express Co | | | 3.550% | | | | N/A (4) | | | | Baa2 | | | | 12,745,500 | |
| | 5,000 | | | Capital One Financial Corp (5) | | | 3.950% | | | | N/A (4) | | | | Baa3 | | | | 4,349,932 | |
| | 10,000 | | | Discover Financial Services (5) | | | 6.125% | | | | N/A (4) | | | | Ba2 | | | | 10,210,232 | |
| | | | Total Consumer Finance | | | | | | | | | | | | | | | 40,306,780 | |
| | | | | |
| | | | Diversified Financial Services – 2.1% | | | | | | | | | | | | |
| | | | | |
| | 7,500 | | | Citigroup Inc | | | 5.950% | | | | N/A (4) | | | | BBB- | | | | 7,459,645 | |
| | 4,000 | | | JP Morgan Chase & Company | | | 6.000% | | | | N/A (4) | | | | BBB+ | | | | 3,887,115 | |
| | 12,800 | | | Scentre Group Trust 2, 144A (5) | | | 4.750% | | | | 9/24/80 | | | | BBB+ | | | | 11,773,620 | |
| | 12,700 | | | Voya Financial Inc | | | 6.125% | | | | N/A (4) | | | | BBB- | | | | 12,167,913 | |
| | | | Total Diversified Financial Services | | | | | | | | | | | | | | | 35,288,293 | |
| | | | | |
| | | | Electric Utilities – 3.4% | | | | | | | | | | | | |
| | | | | |
| | 8,500 | | | American Electric Power Co Inc (5) | | | 3.875% | | | | 2/15/62 | | | | BBB | | | | 7,189,021 | |
| | 24,075 | | | Duke Energy Corp (3) | | | 4.875% | | | | N/A (4) | | | | BBB- | | | | 22,750,092 | |
| | 91 | | | Emera Inc | | | 6.750% | | | | 6/15/76 | | | | BB+ | | | | 90,435 | |
| | 10,000 | | | NextEra Energy Capital Holdings Inc | | | 3.954% | | | | 6/15/67 | | | | BBB | | | | 7,901,858 | |
| | 17,400 | | | PPL Capital Funding Inc (5) | | | 4.915% | | | | 3/30/67 | | | | BBB | | | | 13,920,000 | |
| | 6,000 | | | Southern Co | | | 5.459% | | | | 3/15/57 | | | | BBB- | | | | 5,964,000 | |
| | | | Total Electric Utilities | | | | | | | | | | | | | | | 57,815,406 | |
| | | | | |
| | | | Food Products – 0.4% | | | | | | | | | | | | |
| | | | | |
| | 6,705 | | | Dairy Farmers of America Inc, 144A (5) | | | 7.125% | | | | N/A (4) | | | | BB+ | | | | 6,235,650 | |
| | | | | |
| | | | Insurance – 19.0% | | | | | | | | | | | | |
| | | | | |
| | 3,598 | | | ACE Capital Trust II | | | 9.700% | | | | 4/01/30 | | | | BBB+ | | | | 4,677,300 | |
| | 10,500 | | | Allianz SE, 144A (5) | | | 3.500% | | | | N/A (4) | | | | A | | | | 9,231,198 | |
| | 8,400 | | | Allianz SE Reg S | | | 3.500% | | | | N/A (4) | | | | A | | | | 7,384,959 | |
| | 4,400 | | | Allstate Corp | | | 5.750% | | | | 8/15/53 | | | | Baa1 | | | | 4,078,976 | |
| | 1,100 | | | Allstate Corp (3) | | | 6.500% | | | | 5/15/57 | | | | Baa1 | | | | 1,145,393 | |
| | 13,300 | | | American International Group Inc (5) | | | 5.750% | | | | 4/01/48 | | | | BBB- | | | | 12,158,042 | |
| | 2,299 | | | Aon Corp (5) | | | 8.205% | | | | 1/01/27 | | | | BBB | | | | 2,475,661 | |
| | 6,210 | | | Argentum Netherlands BV for Swiss Re Ltd Reg S (5) | | | 5.750% | | | | 8/15/50 | | | | BBB+ | | | | 6,078,038 | |
| | 2,100 | | | Argentum Netherlands BV for Swiss Re Ltd Reg S | | | 5.625% | | | | 8/15/52 | | | | BBB+ | | | | 1,999,158 | |
| | 16,550 | | | AXA SA (5) | | | 8.600% | | | | 12/15/30 | | | | A2 | | | | 20,165,471 | |
| | 17,819 | | | AXA SA, 144A | | | 6.379% | | | | N/A (4) | | | | A3 | | | | 20,154,038 | |
| | 1,550 | | | Cloverie PLC for Zurich Insurance Co Ltd Reg S | | | 5.625% | | | | 6/24/46 | | | | A+ | | | | 1,561,762 | |
| | 7,900 | | | Legal & General Group PLC Reg S | | | 5.250% | | | | 3/21/47 | | | | A3 | | | | 7,653,046 | |
| | 29,600 | | | MetLife Capital Trust IV, 144A (5) | | | 7.875% | | | | 12/15/37 | | | | BBB | | | | 32,592,238 | |
| | 3,000 | | | MetLife Inc | | | 10.750% | | | | 8/01/39 | | | | BBB | | | | 4,147,500 | |
| | 11,300 | | | MetLife Inc | | | 3.850% | | | | N/A (4) | | | | BBB | | | | 10,669,960 | |
| | 36,531 | | | MetLife Inc, 144A (3), (5) | | | 9.250% | | | | 4/08/38 | | | | BBB | | | | 43,493,497 | |
| | 41,904 | | | Nationwide Financial Services Inc (5) | | | 6.750% | | | | 5/15/37 | | | | Baa2 | | | | 41,870,241 | |
| | 20,600 | | | Nippon Life Insurance Co, 144A (5) | | | 2.750% | | | | 1/21/51 | | | | A- | | | | 16,998,451 | |
| | 6,500 | | | Prudential Financial Inc (3) | | | 3.700% | | | | 10/01/50 | | | | BBB+ | | | | 5,685,770 | |
| | 27,180 | | | Prudential Financial Inc (5) | | | 5.625% | | | | 6/15/43 | | | | BBB+ | | | | 27,115,583 | |
| | 14,900 | | | Sumitomo Life Insurance Co, 144A (5) | | | 3.375% | | | | 4/15/81 | | | | A- | | | | 13,030,033 | |
| | 8,700 | | | Willow No 2 Ireland PLC for Zurich Insurance Co Ltd Reg S | | | 4.250% | | | | 10/01/45 | | | | A+ | | | | 8,248,783 | |
| | 23,794 | | | Zurich Finance Ireland Designated Activity Co Reg S | | | 3.000% | | | | 4/19/51 | | | | A+ | | | | 19,464,444 | |
| | | | Total Insurance | | | | | | | | | | | | | | | 322,079,542 | |
| | | | | |
| | | | Machinery – 0.3% | | | | | | | | | | | | |
| | | | | |
| | 5,700 | | | Stanley Black & Decker Inc (5) | | | 4.000% | | | | 3/15/60 | | | | BBB+ | | | | 5,086,765 | |
| | | | | |
| | | | Multi-Utilities – 3.3% | | | | | | | | | | | | |
| | | | | |
| | 500 | | | Algonquin Power & Utilities Corp | | | 4.750% | | | | 1/18/82 | | | | BB+ | | | | 441,550 | |
| | 38,020 | | | Dominion Energy Inc | | | 4.650% | | | | N/A (4) | | | | BBB- | | | | 35,358,600 | |
48
| | | | | | | | | | | | | | | | | | | | |
Principal
Amount (000)/
Shares | | | Description (1) | | Coupon | | | Maturity | | | Ratings (2) | | | Value | |
| | | | | |
| | | | Multi-Utilities (continued) | | | | | | | | | | | | |
| | | | | |
| $ | 2,000 | | | Dominion Energy Inc | | | 4.350% | | | | N/A (4) | | | | BBB- | | | $ | 1,819,991 | |
| | 20,900 | | | NiSource Inc | | | 5.650% | | | | N/A (4) | | | | BBB- | | | | 19,046,595 | |
| | | | Total Multi-Utilities | | | | | | | | | | | | | | | 56,666,736 | |
| | | | | |
| | | | Oil, Gas & Consumable Fuels – 3.0% | | | | | | | | | | | | |
| | | | | |
| | 5,900 | | | BP Capital Markets PLC | | | 4.375% | | | | N/A (4) | | | | Baa1 | | | | 5,824,893 | |
| | 16,000 | | | Enbridge Inc (5) | | | 5.750% | | | | 7/15/80 | | | | BBB- | | | | 15,070,400 | |
| | 10,934 | | | Enterprise Products Operating LLC (5) | | | 5.250% | | | | 8/16/77 | | | | Baa2 | | | | 9,451,590 | |
| | 3,400 | | | Enterprise Products Operating LLC | | | 5.375% | | | | 2/15/78 | | | | Baa2 | | | | 2,724,608 | |
| | 14,885 | | | Transcanada Trust (5) | | | 5.500% | | | | 9/15/79 | | | | BBB | | | | 13,691,306 | |
| | 4,560 | | | Transcanada Trust (5) | | | 5.600% | | | | 3/07/82 | | | | BBB | | | | 4,257,426 | |
| | | | Total Oil, Gas & Consumable Fuels | | | | | | | | | | | | | | | 51,020,223 | |
| | | | | |
| | | | Road & Rail – 1.5% | | | | | | | | | | | | |
| | | | | |
| | 25,485 | | | BNSF Funding Trust I | | | 6.613% | | | | 12/15/55 | | | | A | | | | 24,968,929 | |
| | | | | |
| | | | Wireless Telecommunication Services – 1.0% | | | | | | | | | | | | |
| | | | | |
| | 16,516 | | | Vodafone Group PLC | | | 7.000% | | | | 4/04/79 | | | | BB+ | | | | 17,362,445 | |
| | | | Total $1,000 Par (or similar) Institutional Preferred (cost $1,382,337,816) | | | | | | | | | | | | 1,341,131,122 | |
| | | | | |
Principal
Amount (000) | | | Description (1), (7) | | Coupon | | | Maturity | | | Ratings (2) | | | Value | |
| |
| | | | CONTINGENT CAPITAL SECURITIES – 54.3% (33.9% of Total Investments) | |
| | | | | |
| | | | Banks – 42.6% | | | | | | | | | | | | |
| | | | | |
| $ | 2,800 | | | Australia & New Zealand Banking Group Ltd/United Kingdom, 144A | | | 6.750% | | | | N/A (4) | | | | Baa2 | | | $ | 2,856,000 | |
| | 17,800 | | | Banco Bilbao Vizcaya Argentaria SA (3) | | | 6.500% | | | | N/A (4) | | | | Ba2 | | | | 17,062,734 | |
| | 11,800 | | | Banco Bilbao Vizcaya Argentaria SA | | | 6.125% | | | | N/A (4) | | | | Ba2 | | | | 10,333,601 | |
| | 6,200 | | | Banco Santander SA | | | 4.750% | | | | N/A (4) | | | | Ba1 | | | | 5,294,496 | |
| | 24,200 | | | Banco Santander SA Reg S | | | 7.500% | | | | N/A (4) | | | | Ba1 | | | | 24,502,500 | |
| | 1,708 | | | Barclays Bank PLC (5) | | | 7.625% | | | | 11/21/22 | | | | BBB+ | | | | 1,719,476 | |
| | 26,000 | | | Barclays PLC (3) | | | 8.000% | | | | N/A (4) | | | | BBB- | | | | 26,780,000 | |
| | 63,300 | | | Barclays PLC | | | 7.750% | | | | N/A (4) | | | | BBB- | | | | 63,767,964 | |
| | 5,500 | | | BNP Paribas SA, 144A | | | 7.000% | | | | N/A (4) | | | | BBB | | | | 5,530,250 | |
| | 38,585 | | | BNP Paribas SA, 144A (3), (5) | | | 7.375% | | | | N/A (4) | | | | BBB | | | | 40,119,683 | |
| | 39,000 | | | BNP Paribas SA, 144A | | | 4.625% | | | | N/A (4) | | | | BBB | | | | 34,577,517 | |
| | 10,000 | | | BNP Paribas SA Reg S | | | 7.375% | | | | N/A (4) | | | | BBB | | | | 10,397,741 | |
| | 31,550 | | | Credit Agricole SA, 144A | | | 8.125% | | | | N/A (4) | | | | BBB | | | | 33,561,313 | |
| | 19,653 | | | Credit Agricole SA, 144A | | | 7.875% | | | | N/A (4) | | | | BBB | | | | 20,193,458 | |
| | 2,000 | | | Credit Agricole SA, 144A | | | 4.750% | | | | N/A (4) | | | | BBB | | | | 1,695,000 | |
| | 4,466 | | | Credit Agricole SA Reg S | | | 8.125% | | | | N/A (4) | | | | BBB | | | | 4,750,708 | |
| | 10,500 | | | Danske Bank A/S Reg S | | | 7.000% | | | | N/A (4) | | | | BBB- | | | | 10,141,950 | |
| | 5,000 | | | Danske Bank A/S Reg S | | | 4.375% | | | | N/A (4) | | | | BBB- | | | | 4,300,000 | |
| | 11,588 | | | Danske Bank A/S Reg S (5) | | | 6.125% | | | | N/A (4) | | | | BBB- | | | | 11,211,390 | |
| | 33,192 | | | DNB Bank ASA Reg S | | | 4.875% | | | | N/A (4) | | | | BBB | | | | 32,111,932 | |
| | 8,504 | | | HSBC Holdings PLC (5) | | | 6.250% | | | | N/A (4) | | | | BBB | | | | 8,533,764 | |
| | 1,600 | | | HSBC Holdings PLC (5) | | | 6.000% | | | | N/A (4) | | | | BBB | | | | 1,534,931 | |
| | 26,700 | | | ING Groep NV | | | 6.500% | | | | N/A (4) | | | | BBB | | | | 26,267,193 | |
| | 10,000 | | | ING Groep NV | | | 5.750% | | | | N/A (4) | | | | BBB | | | | 9,554,755 | |
| | 9,600 | | | Intesa Sanpaolo SpA, 144A | | | 7.700% | | | | N/A (4) | | | | BB- | | | | 8,976,000 | |
| | 4,500 | | | Lloyds Banking Group PLC | | | 6.750% | | | | N/A (4) | | | | Baa3 | | | | 4,421,811 | |
| | 3,000 | | | Lloyds Banking Group PLC | | | 7.500% | | | | N/A (4) | | | | Baa3 | | | | 3,037,500 | |
| | 48,428 | | | Lloyds Banking Group PLC | | | 7.500% | | | | N/A (4) | | | | Baa3 | | | | 48,924,552 | |
| | 5,075 | | | Macquarie Bank Ltd/London, 144A (5) | | | 6.125% | | | | N/A (4) | | | | BB+ | | | | 4,696,507 | |
| | 14,250 | | | NatWest Group PLC | | | 8.000% | | | | N/A (4) | | | | BBB- | | | | 14,713,125 | |
| | 17,000 | | | NatWest Group PLC | | | 6.000% | | | | N/A (4) | | | | BBB- | | | | 16,585,710 | |
| | 26,400 | | | Nordea Bank Abp, 144A (3) | | | 6.625% | | | | N/A (4) | | | | BBB+ | | | | 26,339,485 | |
| | 35,090 | | | Nordea Bank Abp, 144A (3) | | | 6.125% | | | | N/A (4) | | | | BBB | | | | 35,028,095 | |
| | 18,988 | | | Nordea Bank Abp Reg S (3) | | | 6.125% | | | | N/A (4) | | | | BBB+ | | | | 18,954,502 | |
| | 10,000 | | | Skandinaviska Enskilda Banken AB Reg S | | | 5.125% | | | | N/A (4) | | | | BBB+ | | | | 9,596,800 | |
| | 73,300 | | | Societe Generale SA, 144A (5) | | | 8.000% | | | | N/A (4) | | | | BB | | | | 75,317,909 | |
| | 4,550 | | | Societe Generale SA, 144A | | | 5.375% | | | | N/A (4) | | | | BB+ | | | | 3,817,967 | |
| | 1,700 | | | Societe Generale SA, 144A | | | 4.750% | | | | N/A (4) | | | | BB+ | | | | 1,480,676 | |
49
| | |
| |
| | Nuveen Preferred & Income Securities Fund (continued) |
| | Portfolio of Investments July 31, 2022 |
| | | | | | | | | | | | | | | | | | | | |
Principal
Amount (000) | | | Description (1), (7) | | Coupon | | | Maturity | | | Ratings (2) | | | Value | |
| | | | | |
| | | | Banks (continued) | | | | | | | | | | | | |
| | | | | |
| $ | 9,000 | | | Societe Generale SA Reg S | | | 7.875% | | | | N/A (4) | | | | BB+ | | | $ | 9,113,797 | |
| | 13,000 | | | Standard Chartered PLC, 144A (3) | | | 7.750% | | | | N/A (4) | | | | BBB- | | | | 13,327,274 | |
| | 7,200 | | | Svenska Handelsbanken AB Reg S | | | 4.375% | | | | N/A (4) | | | | A- | | | | 6,391,555 | |
| | 15,000 | | | UniCredit SpA Reg S | | | 8.000% | | | | N/A (4) | | | | BB- | | | | 14,537,250 | |
| | 727,727 | | | Total Banks | | | | | | | | | | | | | | | 722,058,871 | |
| | | | | |
| | | | Capital Markets – 11.7% | | | | | | | | | | | | |
| | | | | |
| | 11,000 | | | Credit Suisse Group AG, 144A | | | 7.500% | | | | N/A (4) | | | | BB | | | | 10,222,300 | |
| | 10,000 | | | Credit Suisse Group AG, 144A (3) | | | 9.750% | | | | N/A (4) | | | | BB | | | | 10,620,000 | |
| | 58,000 | | | Credit Suisse Group AG, 144A (5) | | | 7.500% | | | | N/A (4) | | | | BB | | | | 56,942,892 | |
| | 17,400 | | | Credit Suisse Group AG Reg S | | | 7.500% | | | | N/A (4) | | | | BB | | | | 17,095,500 | |
| | 7,400 | | | UBS Group AG, 144A (5) | | | 7.000% | | | | N/A (4) | | | | BBB | | | | 7,534,162 | |
| | 24,000 | | | UBS Group AG, 144A | | | 4.875% | | | | N/A (4) | | | | BBB | | | | 21,387,187 | |
| | 25,000 | | | UBS Group AG, 144A (5) | | | 3.875% | | | | N/A (4) | | | | BBB | | | | 21,561,120 | |
| | 35,300 | | | UBS Group AG Reg S (5) | | | 6.875% | | | | N/A (4) | | | | BBB | | | | 36,050,125 | |
| | 10,800 | | | UBS Group AG Reg S | | | 5.125% | | | | N/A (4) | | | | BBB | | | | 10,299,722 | |
| | 10,000 | | | UBS Group AG Reg S | | | 3.875% | | | | N/A (4) | | | | BBB | | | | 8,624,448 | |
| | 208,900 | | | Total Capital Markets | | | | | | | | | | | | | | | 200,337,456 | |
| | | | Total Contingent Capital Securities (cost $945,445,043) | | | | | | | | | | | | | | | 922,396,327 | |
| | | | | |
| Shares | | | Description (1) | | Coupon | | | | | | Ratings (2) | | | Value | |
| |
| | | | $25 PAR (OR SIMILAR) RETAIL PREFERRED – 17.3% (10.8% of Total Investments) | |
| | | | | |
| | | | Banks – 7.5% | | | | | | | | | | | | |
| | | | | |
| | 233,680 | | | Associated Banc-Corp | | | 5.625% | | | | | | | | Baa3 | | | $ | 5,874,715 | |
| | 301,095 | | | Bank of America Corp | | | 5.375% | | | | | | | | BBB+ | | | | 7,391,882 | |
| | 346,088 | | | Citigroup Inc | | | 6.875% | | | | | | | | BBB- | | | | 9,292,463 | |
| | 53,000 | | | CoBank ACB (8) | | | 6.200% | | | | | | | | BBB+ | | | | 5,432,500 | |
| | 47,500 | | | CoBank ACB (8) | | | 6.250% | | | | | | | | BBB+ | | | | 4,761,875 | |
| | 177,750 | | | Farm Credit Bank of Texas, 144A (5), (8) | | | 6.750% | | | | | | | | Baa1 | | | | 18,086,063 | |
| | 50,000 | | | Fifth Third Bancorp | | | 4.950% | | | | | | | | Baa3 | | | | 1,240,000 | |
| | 84,563 | | | Fifth Third Bancorp | | | 6.625% | | | | | | | | Baa3 | | | | 2,234,154 | |
| | 40,000 | | | First Republic Bank/CA | | | 4.000% | | | | | | | | BBB- | | | | 734,400 | |
| | 150,000 | | | Fulton Financial Corp | | | 5.125% | | | | | | | | Baa3 | | | | 3,427,500 | |
| | 11,474 | | | JPMorgan Chase & Co | | | 5.750% | | | | | | | | BBB+ | | | | 293,505 | |
| | 718,558 | | | KeyCorp | | | 6.125% | | | | | | | | Baa3 | | | | 19,156,756 | |
| | 1,413,440 | | | PNC Financial Services Group Inc (5) | | | 6.849% | | | | | | | | Baa2 | | | | 35,717,629 | |
| | 189,200 | | | Regions Financial Corp (5) | | | 5.700% | | | | | | | | Baa3 | | | | 4,756,488 | |
| | 21,637 | | | Synovus Financial Corp | | | 5.875% | | | | | | | | BB- | | | | 553,258 | |
| | 212,731 | | | Wells Fargo & Co | | | 5.850% | | | | | | | | Baa2 | | | | 5,205,528 | |
| | 152,000 | | | Western Alliance Bancorp | | | 4.250% | | | | | | | | Ba1 | | | | 3,657,120 | |
| | | | Total Banks | | | | | | | | | | | | | | | 127,815,836 | |
| | | | | |
| | | | Capital Markets – 2.1% | | | | | | | | | | | | |
| | | | | |
| | 103,000 | | | Affiliated Managers Group Inc | | | 4.200% | | | | | | | | Baa1 | | | | 1,946,700 | |
| | 136,229 | | | Affiliated Managers Group Inc | | | 5.875% | | | | | | | | Baa1 | | | | 3,446,594 | |
| | 160,000 | | | Affiliated Managers Group Inc | | | 4.750% | | | | | | | | Baa1 | | | | 3,353,600 | |
| | 356,501 | | | Goldman Sachs Group Inc | | | 5.500% | | | | | | | | BB+ | | | | 8,941,045 | |
| | 612,782 | | | Morgan Stanley | | | 5.850% | | | | | | | | BBB- | | | | 15,736,242 | |
| | 15,000 | | | Northern Trust Corp | | | 4.700% | | | | | | | | BBB+ | | | | 358,950 | |
| | 74,642 | | | State Street Corp | | | 5.900% | | | | | | | | Baa1 | | | | 1,922,031 | |
| | | | Total Capital Markets | | | | | | | | | | | | | | | 35,705,162 | |
| | | | | |
| | | | Consumer Finance – 0.2% | | | | | | | | | | | | |
| | | | | |
| | 130,000 | | | Capital One Financial Corp (5) | | | 4.800% | | | | | | | | Baa3 | | | | 2,706,600 | |
| | 50,338 | | | Capital One Financial Corp (5) | | | 5.000% | | | | | | | | Baa3 | | | | 1,123,041 | |
| | | | Total Consumer Finance | | | | | | | | | | | | | | | 3,829,641 | |
| | | | | |
| | | | Diversified Financial Services – 1.1% | | | | | | | | | | | | |
| | | | | |
| | 105,300 | | | AgriBank FCB (8) | | | 6.875% | | | | | | | | BBB+ | | | | 10,714,275 | |
| | 239,758 | | | Equitable Holdings Inc (5) | | | 5.250% | | | | | | | | BBB- | | | | 5,701,445 | |
| | 100,000 | | | Equitable Holdings Inc | | | 4.300% | | | | | | | | BBB- | | | | 2,003,000 | |
50
| | | | | | | | | | | | | | | | | | | | |
| Shares | | | Description (1) | | Coupon | | | | | | Ratings (2) | | | Value | |
| | | | | |
| | | | Diversified Financial Services (continued) | | | | | | | | | | | | |
| | | | | |
| | 39,705 | | | Voya Financial Inc (5) | | | 5.350% | | | | | | | | BBB- | | | $ | 979,523 | |
| | | | Total Diversified Financial Services | | | | | | | | | | | | | | | 19,398,243 | |
| | | | | |
| | | | Diversified Telecommunication Services – 0.7% | | | | | | | | | | | | |
| | | | | |
| | 578,314 | | | AT&T Inc | | | 4.750% | | | | | | | | BBB- | | | | 12,028,931 | |
| | 20,680 | | | AT&T Inc (5) | | | 5.000% | | | | | | | | BBB- | | | | 466,748 | |
| | | | Total Diversified Telecommunication Services | | | | | | | | | | | | | | | 12,495,679 | |
| | | | | |
| | | | Electric Utilities – 1.4% | | | | | | | | | | | | |
| | | | | |
| | 145,955 | | | Alabama Power Co | | | 5.000% | | | | | | | | A3 | | | | 3,662,011 | |
| | 5,786 | | | CMS Energy Corp | | | 5.875% | | | | | | | | BBB- | | | | 146,038 | |
| | 82,916 | | | DTE Energy Co | | | 4.375% | | | | | | | | BBB- | | | | 1,754,502 | |
| | 152,276 | | | Duke Energy Corp (5) | | | 5.750% | | | | | | | | BBB- | | | | 4,035,314 | |
| | 13,220 | | | Entergy Arkansas LLC | | | 4.875% | | | | | | | | A | | | | 332,483 | |
| | 1,047 | | | Entergy Louisiana LLC | | | 4.875% | | | | | | | | A | | | | 26,123 | |
| | 16,000 | | | Entergy Texas Inc (5) | | | 5.375% | | | | | | | | BBB- | | | | 405,760 | |
| | 197,288 | | | NextEra Energy Capital Holdings Inc | | | 5.650% | | | | | | | | BBB | | | | 5,050,573 | |
| | 188,947 | | | Southern Co | | | 4.950% | | | | | | | | BBB- | | | | 4,417,581 | |
| | 86,891 | | | Southern Co (3) | | | 5.250% | | | | | | | | BBB- | | | | 2,213,983 | |
| | 53,372 | | | Southern Co | | | 4.200% | | | | | | | | BBB- | | | | 1,072,777 | |
| | | | Total Electric Utilities | | | | | | | | | | | | | | | 23,117,145 | |
| | | | | |
| | | | Equity Real Estate Investment Trusts (Reits) – 1.7% | | | | | | | | | | | | |
| | | | | |
| | 125,000 | | | Hudson Pacific Properties Inc | | | 4.750% | | | | | | | | Baa3 | | | | 2,591,250 | |
| | 80,301 | | | Prologis Inc (8) | | | 8.540% | | | | | | | | BBB | | | | 4,858,210 | |
| | 300,000 | | | Public Storage | | | 4.000% | | | | | | | | A3 | | | | 5,991,000 | |
| | 185,296 | | | Public Storage | | | 5.600% | | | | | | | | A3 | | | | 4,923,315 | |
| | 131,589 | | | Public Storage | | | 4.625% | | | | | | | | A3 | | | | 3,189,717 | |
| | 121,528 | | | Public Storage | | | 4.000% | | | | | | | | A3 | | | | 2,414,761 | |
| | 83,200 | | | Public Storage | | | 4.125% | | | | | | | | A3 | | | | 1,790,464 | |
| | 111,690 | | | Public Storage (5) | | | 4.750% | | | | | | | | A3 | | | | 2,775,497 | |
| | 4,000 | | | Public Storage | | | 4.700% | | | | | | | | A3 | | | | 97,280 | |
| | | | Total Equity Real Estate Investment Trusts (Reits) | | | | | | | | | | | | | | | 28,631,494 | |
| | | | | |
| | | | Food Products – 0.2% | | | | | | | | | | | | |
| | | | | |
| | 32,500 | | | Dairy Farmers of America Inc, 144A (8) | | | 7.875% | | | | | | | | BB+ | | | | 3,219,645 | |
| | | | | |
| | | | Insurance – 1.4% | | | | | | | | | | | | |
| | | | | |
| | 591,623 | | | Allstate Corp | | | 5.100% | | | | | | | | Baa1 | | | | 14,672,250 | |
| | 60,000 | | | American Financial Group Inc/OH | | | 5.625% | | | | | | | | Baa2 | | | | 1,466,400 | |
| | 93,406 | | | American Financial Group Inc/OH | | | 5.875% | | | | | | | | Baa2 | | | | 2,406,138 | |
| | 19,825 | | | American International Group Inc | | | 5.850% | | | | | | | | BBB- | | | | 519,613 | |
| | 24,814 | | | Arch Capital Group Ltd | | | 5.450% | | | | | | | | BBB | | | | 603,973 | |
| | 3,839 | | | Hartford Financial Services Group Inc | | | 6.000% | | | | | | | | BBB- | | | | 100,659 | |
| | 28,129 | | | MetLife Inc | | | 4.750% | | | | | | | | BBB | | | | 672,002 | |
| | 49,847 | | | Prudential Financial Inc | | | 4.125% | | | | | | | | BBB+ | | | | 1,102,616 | |
| | 40,000 | | | RenaissanceRe Holdings Ltd | | | 4.200% | | | | | | | | BBB | | | | 763,600 | |
| | 5,646 | | | W R Berkley Corp | | | 5.700% | | | | | | | | Baa2 | | | | 140,472 | |
| | 38,000 | | | W R Berkley Corp | | | 4.250% | | | | | | | | BBB- | | | | 765,320 | |
| | | | Total Insurance | | | | | | | | | | | | | | | 23,213,043 | |
| | | | | |
| | | | Multi-Utilities – 0.8% | | | | | | | | | | | | |
| | | | | |
| | 179,646 | | | Algonquin Power & Utilities Corp | | | 6.200% | | | | | | | | BB+ | | | | 4,582,769 | |
| | 280,000 | | | DTE Energy Co | | | 5.250% | | | | | | | | BBB- | | | | 7,011,200 | |
| | 95,000 | | | DTE Energy Co | | | 4.375% | | | | | | | | BBB- | | | | 1,926,600 | |
| | | | Total Multi-Utilities | | | | | | | | | | | | | | | 13,520,569 | |
| | | | | |
| | | | Oil, Gas & Consumable Fuels – 0.2% | | | | | | | | | | | | |
| | | | | |
| | 125,563 | | | Enbridge Inc | | | 6.375% | | | | | | | | BBB- | | | | 3,204,368 | |
| | | | Total $25 Par (or similar) Retail Preferred (cost $301,205,670) | | | | | | | | | | | | | | | 294,150,825 | |
51
| | |
| |
| | Nuveen Preferred & Income Securities Fund (continued) |
| | Portfolio of Investments July 31, 2022 |
| | | | | | | | | | | | | | | | | | | | |
Principal
Amount (000) | | | Description (1) | | Coupon | | | Maturity | | | Ratings (2) | | | Value | |
| |
| | | | CORPORATE BONDS – 4.7% (2.9% of Total Investments) | |
| |
| | | | Banks – 0.6% | |
| | | | | |
| $ | 7,000 | | | Citizens Financial Group Inc | | | 6.000% | | | | 1/06/71 | | | | BB+ | | | $ | 6,110,380 | |
| | 3,600 | | | JPMorgan Chase & Co (5) | | | 8.750% | | | | 9/01/30 | | | | Baa1 | | | | 4,497,553 | |
| | 10,600 | | | Total Banks | | | | | | | | | | | | | | | 10,607,933 | |
| |
| | | | Equity Real Estate Investment Trusts (Reits) – 0.8% | |
| | | | | |
| | 16,100 | | | Scentre Group Trust 2, 144A (3) | | | 5.125% | | | | 9/24/80 | | | | BBB+ | | | | 13,699,018 | |
| |
| | | | Insurance – 3.3% | |
| | | | | |
| | 30,860 | | | Liberty Mutual Group Inc, 144A (5) | | | 7.800% | | | | 3/15/37 | | | | Baa3 | | | | 35,865,261 | |
| | 6,150 | | | Liberty Mutual Insurance Co, 144A (3), (5) | | | 7.697% | | | | 10/15/97 | | | | BBB+ | | | | 7,547,157 | |
| | 5,300 | | | Lincoln National Corp (3-Month LIBOR reference rate + 2.040% spread) (5), (6) | | | 4.750% | | | | 4/20/67 | | | | BBB | | | | 4,002,835 | |
| | 1,000 | | | Nippon Life Insurance Co, 144A | | | 2.900% | | | | 9/16/51 | | | | A- | | | | 819,201 | |
| | 8,000 | | | Zurich Finance Ireland Designated Activity Co Reg S | | | 3.500% | | | | 5/02/52 | | | | A+ | | | | 6,610,400 | |
| | 51,310 | | | Total Insurance | | | | | | | | | | | | | | | 54,844,854 | |
| $ | 78,010 | | | Total Corporate Bonds (cost $78,496,808) | | | | | | | | | | | | | | | 79,151,805 | |
| | | | | |
| Shares | | | Description (1) | | Coupon | | | | | | Ratings (2) | | | Value | |
| |
| | | | CONVERTIBLE PREFERRED SECURITIES – 1.8% (1.1% of Total Investments) | |
| |
| | | | Banks – 1.8% | |
| | | | | |
| | 7,493 | | | Bank of America Corp | | | 7.250% | | | | | | | | BBB+ | | | $ | 9,321,667 | |
| | 16,041 | | | Wells Fargo & Co | | | 7.500% | | | | | | | | Baa2 | | | | 20,356,029 | |
| | | | Total Banks | | | | | | | | | | | | | | | 29,677,696 | |
| | | | Total Convertible Preferred Securities (cost $32,961,574) | | | | | | | | | | | | | | | 29,677,696 | |
| | | | | |
| Shares | | | Description (1) | | | | | | | | | | | Value | |
| |
| | | | INVESTMENT COMPANIES – 1.1% (0.7% of Total Investments) | |
| | | | | |
| | 723,135 | | | BlackRock Credit Allocation Income Trust | | | | | | | | | | | | | | $ | 8,438,986 | |
| | 646,421 | | | John Hancock Preferred Income Fund III | | | | | | | | | | | | | | | 11,027,942 | |
| | | | Total Investment Companies (cost $27,993,530) | | | | | | | | | | | | | | | 19,466,928 | |
| | | | Total Long-Term Investments (cost $2,768,440,441) | | | | | | | | | | | | | | | 2,685,974,703 | |
| | | | | |
Principal
Amount (000) | | | Description (1) | | Coupon | | | Maturity | | | | | | Value | |
| | | | | |
| | | | SHORT-TERM INVESTMENTS – 1.8% (1.2% of Total Investments) | | | | | | | | | | | | | | | | |
| | | | | |
| | | | REPURCHASE AGREEMENTS – 1.8% (1.2% of Total Investments) | | | | | | | | | | | | | | | | |
| | | | | |
| $ | 31,360 | | | Repurchase Agreement with Fixed Income Clearing Corporation, dated 7/29/22, repurchase price $31,361,573, collateralized by $20,478,300, U.S. Treasury Inflation Index Government Bond, 2.500%, due 1/15/29, value $31,987,750 | | | 0.450% | | | | 8/01/22 | | | | | | | $ | 31,360,397 | |
| | | | Total Short-Term Investments (cost $31,360,397) | | | | | | | | | | | | | | | 31,360,397 | |
| | | | Total Investments (cost $2,799,800,838) – 160.0% | | | | | | | | | | | | | | | 2,717,335,100 | |
| | | | Borrowings – (29.4)% (9), (10) | | | | | | | | | | | | | | | (499,300,000 | ) |
| | | | Reverse Repurchase Agreements, including accrued interest – (16.2)% (11) | | | | | | | | | | | | (275,588,867 | ) |
| | | | Taxable Fund Preferred Shares, net of deferred offering costs – (15.8)% (12) | | | | | | | | (268,930,316 | ) |
| | | | Other Assets Less Liabilities – 1.4% (13) | | | | | | | | | | | | | | | 24,180,880 | |
| | | | Net Assets Applicable to Common Shares – 100% | | | | | | | | | | | | | | $ | 1,697,696,797 | |
52
Investment in Derivatives
Interest Rate Swaps – OTC Uncleared
| | | | | | | | | | | | | | | | | | | | | | | | | | | | | | | | | | | | | | | | |
| Counterparty | | Notional
Amount | | | Fund
Pay/Receive
Floating Rate | | | Floating Rate Index | | | Fixed Rate
(Annualized) | | | Fixed Rate
Payment
Frequency | | | Effective
Date (14) | | | Optional
Termination
Date | | | Maturity
Date | | | Value | | | Unrealized
Appreciation
(Depreciation) | |
| Morgan Stanley Capital Services, LLC | | $ | 521,000,000 | | | | Receive | | | | 1-Month LIBOR | | | | 1.994 | % | | | Monthly | | | | 6/01/18 | | | | 7/01/25 | | | | 7/01/27 | | | $ | 5,265,234 | | | $ | 5,265,234 | |
| Morgan Stanley Capital Services, LLC | | | 90,000,000 | | | | Receive | | | | 1-Month LIBOR | | | | 2.364 | | | | Monthly | | | | 7/01/19 | | | | 7/01/26 | | | | 7/01/28 | | | | (595,246 | ) | | | (595,246 | ) |
| Total | | $ | 611,000,000 | | | | | | | | | | | | | | | | | | | | | | | | | | | | | | | $ | 4,669,988 | | | $ | 4,669,988 | |
For Fund portfolio compliance purposes, the Fund’s industry classifications refer to any one or more of the industry
sub-classifications
used by one or more widely recognized market indexes or ratings group indexes, and/or as defined by Fund management. This definition may not apply for purposes of this report, which may combine industry
sub-classifications
into sectors for reporting ease.
| (1) | All percentages shown in the Portfolio of Investments are based on net assets applicable to common shares unless otherwise noted. |
| (2) | For financial reporting purposes, the ratings disclosed are the highest of Standard & Poor’s Group (“Standard & Poor’s”), Moody’s Investors Service, Inc. (“Moody’s”) or Fitch, Inc. (“Fitch”) rating. This treatment of split-rated securities may differ from that used for other purposes, such as for Fund investment policies. Ratings below BBB by Standard & Poor’s, Baa by Moody’s or BBB by Fitch are considered to be below investment grade. Holdings designated N/R are not rated by any of these national rating agencies. Ratings are not covered by the report of independent registered public accounting firm. |
| (3) | Investment, or portion of investment, is hypothecated. The total value of investments hypothecated as of the end of the reporting period was $389,505,910. |
| (4) | Perpetual security. Maturity date is not applicable. |
| (5) | Investment, or portion of investment, has been pledged to collateralize the net payment obligations for investments in reverse repurchase agreements. As of the end of the reporting period, investments with a value of $707,100,826 have been pledged as collateral for reverse repurchase agreements. |
| (6) | Variable rate security. The rate shown is the coupon as of the end of the reporting period. |
| (7) | Contingent Capital Securities (“CoCos”) are hybrid securities with loss absorption characteristics built into the terms of the security for the benefit of the issuer. For example, the terms may specify an automatic write-down of principal or a mandatory conversion into the issuer’s common stock under certain adverse circumstances, such as the issuer’s capital ratio falling below a specified level. |
| (8) | For fair value measurement disclosure purposes, investment classified as Level 2. |
| (9) | Borrowings as a percentage of Total Investments is 18.4%. |
| (10) | The Fund may pledge up to 100% of its eligible investments (excluding any investments separately pledged as collateral for specific investments in derivatives, when applicable) in the Portfolio of Investments as collateral for borrowings. As of the end of the reporting period, investments with a value of $1,568,812,837 have been pledged as collateral for borrowings. |
| (11) | Reverse Repurchase Agreements, including accrued interest as a percentage of Total investments is 10.1%. |
| (12) | Taxable Fund Preferred Shares, net of deferred offering costs as a percentage of Total Investments is 9.9%. |
| (13) | Other assets less liabilities includes the unrealized appreciation (depreciation) of certain (“OTC”) derivatives as well as the OTC cleared and exchange-traded derivatives, when applicable. The unrealized appreciation (depreciation) of OTC cleared and exchange-traded derivatives is recognized as part of the cash collateral at brokers and/or the receivable or payable for variation margin as presented on the Statement of Assets and Liabilities, when applicable. |
| (14) | Effective date represents the date on which both the Fund and counterparty commence interest payment accruals on each contract. |
| 144A | Investment is exempt from registration under Rule 144A of the Securities Act of 1933, as amended. These investments may only be resold in transactions exempt from registration, which are normally those transactions with qualified institutional buyers. |
| LIBOR | London Inter-Bank Offered Rate |
| Reg S | Regulation S allows U.S. companies to sell securities to persons or entities located outside of the United States without registering those securities with the Securities and Exchange Commission. Specifically, Regulation S provides a safe harbor from the registration requirements of the Securities Act for the offers and sales of securities by both foreign and domestic issuers that are made outside the United States. |
See accompanying notes to financial statements.
53
| | |
| | Nuveen Preferred and Income Fund Portfolio of Investments July 31, 2022 |
| | | | | | | | | | | | | | | | | | | | |
Principal
Amount (000)/
Shares | | | Description (1) | | Coupon | | | Maturity | | | Ratings (2) | | | Value | |
| |
| | | | LONG-TERM INVESTMENTS – 149.4% (99.9% of Total Investments) | |
| |
| | | | $1,000 PAR (OR SIMILAR) INSTITUTIONAL PREFERRED – 75.1% (50.2% of Total Investments) | |
| |
| | | | Automobiles – 2.1% | |
| | | | | |
| $ | 695 | | | General Motors Financial Co Inc | | | 5.700% | | | | N/A (3) | | | | BB+ | | | $ | 658,512 | |
| | 1,479 | | | General Motors Financial Co Inc | | | 5.750% | | | | N/A (3) | | | | BB+ | | | | 1,325,348 | |
| | | | Total Automobiles | | | | | | | | | | | | | | | 1,983,860 | |
| | | | | |
| | | | Banks – 25.3% | | | | | | | | | | | | |
| | | | | |
| | 730 | | | Bank of America Corp | | | 6.300% | | | | N/A (3) | | | | BBB+ | | | | 757,883 | |
| | 685 | | | Bank of America Corp | | | 6.500% | | | | N/A (3) | | | | BBB+ | | | | 702,400 | |
| | 540 | | | Bank of America Corp | | | 4.375% | | | | N/A (3) | | | | BBB+ | | | | 490,050 | |
| | 550 | | | Bank of America Corp | | | 6.250% | | | | N/A (3) | | | | BBB+ | | | | 553,940 | |
| | 240 | | | Bank of America Corp | | | 6.100% | | | | N/A (3) | | | | BBB+ | | | | 242,671 | |
| | 900 | | | Citigroup Inc | | | 6.250% | | | | N/A (3) | | | | BBB- | | | | 922,572 | |
| | 1,455 | | | Citigroup Inc | | | 6.300% | | | | N/A (3) | | | | BBB- | | | | 1,405,791 | |
| | 1,872 | | | Citigroup Inc | | | 5.950% | | | | N/A (3) | | | | BBB- | | | | 1,842,067 | |
| | 420 | | | Citigroup Inc | | | 4.150% | | | | N/A (3) | | | | BBB- | | | | 369,844 | |
| | 629 | | | Citizens Financial Group Inc | | | 6.375% | | | | N/A (3) | | | | BB+ | | | | 565,355 | |
| | 833 | | | CoBank ACB | | | 6.250% | | | | N/A (3) | | | | BBB+ | | | | 802,672 | |
| | 200 | | | Fifth Third Bancorp | | | 4.500% | | | | N/A (3) | | | | Baa3 | | | | 194,038 | |
| | 475 | | | First Citizens BancShares Inc/NC (3-Month LIBOR reference rate + 3.972% spread) (4) | | | 5.801% | | | | N/A (3) | | | | BB- | | | | 448,281 | |
| | 915 | | | Huntington Bancshares Inc/OH | | | 5.625% | | | | N/A (3) | | | | Baa3 | | | | 905,850 | |
| | 420 | | | JPMorgan Chase & Co | | | 6.100% | | | | N/A (3) | | | | BBB+ | | | | 420,252 | |
| | 1,990 | | | JPMorgan Chase & Co | | | 6.750% | | | | N/A (3) | | | | BBB+ | | | | 2,044,725 | |
| | 1,500 | | | JPMorgan Chase & Co | | | 5.000% | | | | N/A (3) | | | | BBB+ | | | | 1,393,467 | |
| | 315 | | | KeyCorp | | | 5.000% | | | | N/A (3) | | | | Baa3 | | | | 292,265 | |
| | 220 | | | M&T Bank Corp | | | 3.500% | | | | N/A (3) | | | | Baa2 | | | | 179,403 | |
| | 465 | | | M&T Bank Corp | | | 6.450% | | | | N/A (3) | | | | Baa2 | | | | 460,476 | |
| | 220 | | | M&T Bank Corp | | | 5.125% | | | | N/A (3) | | | | Baa2 | | | | 203,547 | |
| | 266 | | | PNC Financial Services Group Inc | | | 5.000% | | | | N/A (3) | | | | Baa2 | | | | 246,326 | |
| | 485 | | | PNC Financial Services Group Inc | | | 3.400% | | | | N/A (3) | | | | Baa2 | | | | 397,700 | |
| | 420 | | | PNC Financial Services Group Inc | | | 6.000% | | | | N/A (3) | | | | Baa2 | | | | 422,625 | |
| | 310 | | | Regions Financial Corp | | | 5.750% | | | | N/A (3) | | | | Baa3 | | | | 315,252 | |
| | 235 | | | SVB Financial Group | | | 4.000% | | | | N/A (3) | | | | Baa2 | | | | 190,503 | |
| | 120 | | | SVB Financial Group | | | 4.100% | | | | N/A (3) | | | | Baa2 | | | | 93,324 | |
| | 180 | | | SVB Financial Group | | | 4.700% | | | | N/A (3) | | | | Baa2 | | | | 143,618 | |
| | 375 | | | Truist Financial Corp | | | 5.100% | | | | N/A (3) | | | | Baa2 | | | | 358,688 | |
| | 525 | | | Truist Financial Corp (3-Month LIBOR reference rate + 3.102% spread) (4) | | | 4.931% | | | | N/A (3) | | | | Baa2 | | | | 485,756 | |
| | 1,580 | | | Truist Financial Corp | | | 4.800% | | | | N/A (3) | | | | Baa2 | | | | 1,498,706 | |
| | 550 | | | UniCredit SpA Reg S | | | 8.000% | | | | N/A (3) | | | | BB- | | | | 533,033 | |
| | 1,130 | | | Wells Fargo & Co | | | 5.875% | | | | N/A (3) | | | | Baa2 | | | | 1,139,852 | |
| | 885 | | | Wells Fargo & Co | | | 5.900% | | | | N/A (3) | | | | Baa2 | | | | 840,117 | |
| | 805 | | | Wells Fargo & Co | | | 7.950% | | | | 11/15/29 | | | | Baa1 | | | | 967,574 | |
| | 355 | | | Zions Bancorp NA | | | 7.200% | | | | N/A (3) | | | | BB+ | | | | 359,304 | |
| | 355 | | | Zions Bancorp NA | | | 5.800% | | | | N/A (3) | | | | BB+ | | | | 341,465 | |
| | | | Total Banks | | | | | | | | | | | | | | | 23,531,392 | |
| | | | | |
| | | | Capital Markets – 3.7% | | | | | | | | | | | | |
| | | | | |
| | 295 | | | Bank of New York Mellon Corp | | | 4.700% | | | | N/A (3) | | | | Baa1 | | | | 293,820 | |
| | 1,080 | | | Charles Schwab Corp | | | 5.375% | | | | N/A (3) | | | | BBB | | | | 1,096,632 | |
| | 360 | | | Goldman Sachs Group Inc | | | 4.125% | | | | N/A (3) | | | | BBB- | | | | 316,723 | |
| | 1,008 | | | Goldman Sachs Group Inc | | | 5.500% | | | | N/A (3) | | | | BBB- | | | | 1,002,453 | |
| | 709 | | | Goldman Sachs Group Inc | | | 5.300% | | | | N/A (3) | | | | BBB- | | | | 701,122 | |
| | | | Total Capital Markets | | | | | | | | | | | | | | | 3,410,750 | |
| | | | | |
| | | | Consumer Finance – 2.4% | | | | | | | | | | | | |
| | | | | |
| | 475 | | | Ally Financial Inc | | | 4.700% | | | | N/A (3) | | | | Ba2 | | | | 374,747 | |
| | 625 | | | Ally Financial Inc | | | 4.700% | | | | N/A (3) | | | | Ba2 | | | | 526,687 | |
| | 500 | | | American Express Co | | | 3.550% | | | | N/A (3) | | | | Baa2 | | | | 439,500 | |
54
| | | | | | | | | | | | | | | | | | | | |
Principal
Amount (000)/
Shares | | | Description (1) | | Coupon | | | Maturity | | | Ratings (2) | | | Value | |
| | | | | |
| | | | Consumer Finance (continued) | | | | | | | | | | | | |
| | | | | |
| $ | 535 | | | Capital One Financial Corp | | | 3.950% | | | | N/A (3) | | | | Baa3 | | | $ | 465,443 | |
| | 335 | | | Discover Financial Services | | | 6.125% | | | | N/A (3) | | | | Ba2 | | | | 342,043 | |
| | 145 | | | Discover Financial Services | | | 5.500% | | | | N/A (3) | | | | Ba2 | | | | 123,510 | |
| | | | Total Consumer Finance | | | | | | | | | | | | | | | 2,271,930 | |
| | | | | |
| | | | Diversified Financial Services – 4.4% | | | | | | | | | | | | |
| | | | | |
| | 305 | | | American AgCredit Corp, 144A | | | 5.250% | | | | N/A (3) | | | | BB+ | | | | 279,075 | |
| | 425 | | | Capital Farm Credit ACA, 144A | | | 5.000% | | | | N/A (3) | | | | BB | | | | 379,100 | |
| | 250 | | | Compeer Financial ACA, 144A | | | 4.875% | | | | N/A (3) | | | | BB+ | | | | 220,625 | |
| | 2 | | | Compeer Financial ACA, 144A | | | 6.750% | | | | N/A (3) | | | | BB+ | | | | 2,020,000 | |
| | 630 | | | Equitable Holdings Inc | | | 4.950% | | | | N/A (3) | | | | BBB- | | | | 618,058 | |
| | 560 | | | Voya Financial Inc | | | 6.125% | | | | N/A (3) | | | | BBB- | | | | 536,538 | |
| | | | Total Diversified Financial Services | | | | | | | | | | | | | | | 4,053,396 | |
| | | | | |
| | | | Electric Utilities – 2.6% | | | | | | | | | | | | |
| | | | | |
| | 345 | | | American Electric Power Co Inc | | | 3.875% | | | | 2/15/62 | | | | BBB | | | | 291,790 | |
| | 370 | | | Edison International | | | 5.000% | | | | N/A (3) | | | | BB+ | | | | 312,126 | |
| | 160 | | | Edison International | | | 5.375% | | | | N/A (3) | | | | BB+ | | | | 137,865 | |
| | 270 | | | Electricite de France SA, 144A | | | 5.250% | | | | N/A (3) | | | | BBB- | | | | 259,200 | |
| | 1,125 | | | Emera Inc | | | 6.750% | | | | 6/15/76 | | | | BB+ | | | | 1,118,022 | |
| | 305 | | | Southern Co | | | 4.000% | | | | 1/15/51 | | | | BBB- | | | | 284,059 | |
| | | | Total Electric Utilities | | | | | | | | | | | | | | | 2,403,062 | |
| | | | | |
| | | | Food Products – 5.6% | | | | | | | | | | | | |
| | | | | |
| | 2,005 | | | Dairy Farmers of America Inc, 144A | | | 7.125% | | | | N/A (3) | | | | BB+ | | | | 1,864,650 | |
| | 620 | | | Land O’ Lakes Inc, 144A | | | 7.250% | | | | N/A (3) | | | | BB | | | | 604,500 | |
| | 1,550 | | | Land O’ Lakes Inc, 144A | | | 8.000% | | | | N/A (3) | | | | BB | | | | 1,565,500 | |
| | 1,275 | | | Land O’ Lakes Inc, 144A | | | 7.000% | | | | N/A (3) | | | | BB | | | | 1,218,977 | |
| | | | Total Food Products | | | | | | | | | | | | | | | 5,253,627 | |
| | | | | |
| | | | Independent Power Producers & Energy Traders – 1.1% | | | | | | | | | | | | |
| | | | | |
| | 445 | | | AES Andes SA, 144A | | | 6.350% | | | | 10/07/79 | | | | BB | | | | 379,140 | |
| | 355 | | | AES Andes SA, 144A | | | 7.125% | | | | 3/26/79 | | | | BB | | | | 323,050 | |
| | 200 | | | Vistra Corp, 144A | | | 8.000% | | | | N/A (3) | | | | Ba3 | | | | 193,750 | |
| | 195 | | | Vistra Corp, 144A | | | 7.000% | | | | N/A (3) | | | | Ba3 | | | | 181,338 | |
| | | | Total Independent Power Producers & Energy Traders | | | | | | | | | | | | | | | 1,077,278 | |
| | | | | |
| | | | Industrial Conglomerates – 1.5% | | | | | | | | | | | | |
| | | | | |
| | 1,467 | | | General Electric Co (3-Month LIBOR reference rate + 3.330% spread) (4) | | | 5.159% | | | | N/A (3) | | | | BBB- | | | | 1,367,978 | |
| | | | | |
| | | | Insurance – 14.8% | | | | | | | | | | | | |
| | | | | |
| | 280 | | | Aegon NV | | | 5.500% | | | | 4/11/48 | | | | Baa1 | | | | 270,254 | |
| | 260 | | | American International Group Inc | | | 5.750% | | | | 4/01/48 | | | | BBB- | | | | 237,676 | |
| | 1,490 | | | Assurant Inc | | | 7.000% | | | | 3/27/48 | | | | Baa3 | | | | 1,492,886 | |
| | 3,390 | | | Assured Guaranty Municipal Holdings Inc, 144A | | | 6.400% | | | | 12/15/66 | | | | BBB+ | | | | 3,270,538 | |
| | 440 | | | AXIS Specialty Finance LLC | | | 4.900% | | | | 1/15/40 | | | | BBB | | | | 381,427 | |
| | 220 | | | Enstar Finance LLC | | | 5.750% | | | | 9/01/40 | | | | BBB- | | | | 205,546 | |
| | 375 | | | Enstar Finance LLC | | | 5.500% | | | | 1/15/42 | | | | BBB- | | | | 321,738 | |
| | 225 | | | Legal & General Group PLC Reg S | | | 5.250% | | | | 3/21/47 | | | | A3 | | | | 217,967 | |
| | 845 | | | Markel Corp | | | 6.000% | | | | N/A (3) | | | | BBB- | | | | 857,666 | |
| | 900 | | | MetLife Inc, 144A | | | 9.250% | | | | 4/08/38 | | | | BBB | | | | 1,071,532 | |
| | 205 | | | MetLife Inc | | | 5.875% | | | | N/A (3) | | | | BBB | | | | 199,900 | |
| | 450 | | | PartnerRe Finance B LLC | | | 4.500% | | | | 10/01/50 | | | | Baa1 | | | | 397,125 | |
| | 805 | | | Provident Financing Trust I | | | 7.405% | | | | 3/15/38 | | | | BB+ | | | | 885,500 | |
| | 125 | | | Prudential Financial Inc | | | 3.700% | | | | 10/01/50 | | | | BBB+ | | | | 109,342 | |
| | 200 | | | Prudential Financial Inc | | | 5.125% | | | | 3/01/52 | | | | BBB+ | | | | 190,985 | |
| | 940 | | | QBE Insurance Group Ltd, 144A | | | 5.875% | | | | N/A (3) | | | | Baa2 | | | | 915,090 | |
| | 840 | | | QBE Insurance Group Ltd, 144A | | | 7.500% | | | | 11/24/43 | | | | Baa1 | | | | 852,027 | |
| | 268 | | | QBE Insurance Group Ltd Reg S | | | 6.750% | | | | 12/02/44 | | | | BBB | | | | 270,835 | |
| | 1,290 | | | SBL Holdings Inc, 144A | | | 7.000% | | | | N/A (3) | | | | BB | | | | 1,057,587 | |
| | 740 | | | SBL Holdings Inc, 144A | | | 6.500% | | | | N/A (3) | | | | BB | | | | 542,050 | |
| | | | Total Insurance | | | | | | | | | | | | | | | 13,747,671 | |
55
| | |
| |
| | Nuveen Preferred and Income Fund (continued) |
| | Portfolio of Investments July 31, 2022 |
| | | | | | | | | | | | | | | | | | | | |
Principal
Amount (000)/
Shares | | | Description (1) | | Coupon | | | Maturity | | | Ratings (2) | | | Value | |
| | | | | |
| | | | Media – 0.3% | | | | | | | | | | | | |
| | | | | |
| $ | 295 | | | Paramount Global | | | 6.375% | | | | 3/30/62 | | | | Baa3 | | | $ | 278,638 | |
| | | | | |
| | | | Multi-Utilities – 2.7% | | | | | | | | | | | | |
| | | | | |
| | 355 | | | Algonquin Power & Utilities Corp | | | 4.750% | | | | 1/18/82 | | | | BB+ | | | | 313,501 | |
| | 1,040 | | | CenterPoint Energy Inc | | | 6.125% | | | | N/A (3) | | | | BBB- | | | | 938,576 | |
| | 145 | | | CMS Energy Corp | | | 4.750% | | | | 6/01/50 | | | | BBB- | | | | 135,772 | |
| | 304 | | | NiSource Inc | | | 5.650% | | | | N/A (3) | | | | BBB- | | | | 277,041 | |
| | 440 | | | Sempra Energy | | | 4.875% | | | | N/A (3) | | | | BBB- | | | | 426,544 | |
| | 475 | | | Sempra Energy | | | 4.125% | | | | 4/01/52 | | | | BBB- | | | | 400,982 | |
| | | | Total Multi-Utilities | | | | | | | | | | | | | | | 2,492,416 | |
| | | | | |
| | | | Oil, Gas & Consumable Fuels – 2.4% | | | | | | | | | | | | |
| | | | | |
| | 220 | | | Enbridge Inc | | | 5.500% | | | | 7/15/77 | | | | BBB- | | | | 199,827 | |
| | 255 | | | Enbridge Inc | | | 6.000% | | | | 1/15/77 | | | | BBB- | | | | 242,501 | |
| | 630 | | | Enbridge Inc | | | 5.750% | | | | 7/15/80 | | | | BBB- | | | | 593,397 | |
| | 295 | | | Energy Transfer LP | | | 6.500% | | | | N/A (3) | | | | BB | | | | 267,712 | |
| | 60 | | | Energy Transfer LP | | | 7.125% | | | | N/A (3) | | | | BB | | | | 54,000 | |
| | 300 | | | MPLX LP | | | 6.875% | | | | N/A (3) | | | | BB+ | | | | 287,697 | |
| | 300 | | | Transcanada Trust | | | 5.600% | | | | 3/07/82 | | | | BBB | | | | 280,094 | |
| | 298 | | | Transcanada Trust | | | 5.500% | | | | 9/15/79 | | | | BBB | | | | 274,102 | |
| | | | Total Oil, Gas & Consumable Fuels | | | | | | | | | | | | | | | 2,199,330 | |
| | | | | |
| | | | Trading Companies & Distributors – 3.9% | | | | | | | | | | | | |
| | | | | |
| | 2,850 | | | AerCap Global Aviation Trust, 144A | | | 6.500% | | | | 6/15/45 | | | | BB+ | | | | 2,702,512 | |
| | 455 | | | AerCap Holdings NV | | | 5.875% | | | | 10/10/79 | | | | BB+ | | | | 403,812 | |
| | 580 | | | Air Lease Corp | | | 4.650% | | | | N/A (3) | | | | BB+ | | | | 507,588 | |
| | | | Total Trading Companies & Distributors | | | | | | | | | | | | | | | 3,613,912 | |
| | | | | |
| | | | U.S. Agency – 1.3% | | | | | | | | | | | | |
| | | | | |
| | 615 | | | Farm Credit Bank of Texas, 144A | | | 6.200% | | | | N/A (3) | | | | BBB+ | | | | 570,256 | |
| | 640 | | | Farm Credit Bank of Texas, 144A | | | 5.700% | | | | N/A (3) | | | | Baa1 | | | | 604,496 | |
| | | | Total U.S. Agency | | | | | | | | | | | | | | | 1,174,752 | |
| | | | | |
| | | | Wireless Telecommunication Services – 1.0% | | | | | | | | | | | | |
| | | | | |
| | 860 | | | Vodafone Group PLC | | | 7.000% | | | | 4/04/79 | | | | BB+ | | | | 904,075 | |
| | | | Total $1,000 Par (or similar) Institutional Preferred (cost $72,978,027) | | | | | | | | | | | | | | | 69,764,067 | |
| | | | | |
Principal
Amount (000) | | | Description (1), (5) | | Coupon | | | Maturity | | | Ratings (2) | | | Value | |
| |
| | | | CONTINGENT CAPITAL SECURITIES – 44.9% (30.0% of Total Investments) | |
| | | | | |
| | | | Banks – 31.5% | | | | | | | | | | | | |
| | | | | |
| $ | 1,555 | | | Banco Bilbao Vizcaya Argentaria SA | | | 6.500% | | | | N/A (3) | | | | Ba2 | | | $ | 1,490,593 | |
| | 740 | | | Banco Mercantil del Norte SA/Grand Cayman, 144A | | | 7.500% | | | | N/A (3) | | | | Ba2 | | | | 664,150 | |
| | 1,900 | | | Barclays PLC | | | 7.750% | | | | N/A (3) | | | | BBB- | | | | 1,914,046 | |
| | 1,000 | | | Barclays PLC | | | 6.125% | | | | N/A (3) | | | | BBB- | | | | 964,300 | |
| | 1,250 | | | Barclays PLC | | | 8.000% | | | | N/A (3) | | | | BBB- | | | | 1,287,500 | |
| | 3,200 | | | BNP Paribas SA, 144A | | | 6.625% | | | | N/A (3) | | | | BBB | | | | 3,210,742 | |
| | 2,035 | | | Credit Agricole SA, 144A | | | 8.125% | | | | N/A (3) | | | | BBB | | | | 2,164,731 | |
| | 2,150 | | | HSBC Holdings PLC | | | 6.000% | | | | N/A (3) | | | | BBB | | | | 2,062,563 | |
| | 3,500 | | | HSBC Holdings PLC | | | 6.375% | | | | N/A (3) | | | | BBB | | | | 3,532,627 | |
| | 2,545 | | | ING Groep NV | | | 6.500% | | | | N/A (3) | | | | BBB | | | | 2,503,746 | |
| | 285 | | | ING Groep NV Reg S | | | 6.750% | | | | N/A (3) | | | | BBB | | | | 285,975 | |
| | 3,200 | | | Lloyds Banking Group PLC | | | 7.500% | | | | N/A (3) | | | | Baa3 | | | | 3,240,000 | |
| | 580 | | | Macquarie Bank Ltd/London, 144A | | | 6.125% | | | | N/A (3) | | | | BB+ | | | | 536,744 | |
| | 2,080 | | | NatWest Group PLC | | | 6.000% | | | | N/A (3) | | | | BBB- | | | | 2,029,310 | |
| | 200 | | | NatWest Group PLC | | | 8.000% | | | | N/A (3) | | | | BBB- | | | | 206,500 | |
| | 680 | | | Nordea Bank Abp, 144A | | | 6.625% | | | | N/A (3) | | | | BBB+ | | | | 678,441 | |
| | 2,400 | | | Societe Generale SA, 144A | | | 7.875% | | | | N/A (3) | | | | BB+ | | | | 2,430,346 | |
| | 29,300 | | | Total Banks | | | | | | | | | | | | | | | 29,202,314 | |
56
| | | | | | | | | | | | | | | | | | | | |
Principal
Amount (000) | | | Description (1), (5) | | Coupon | | | Maturity | | | Ratings (2) | | | Value | |
| | | | | |
| | | | Capital Markets – 13.4% | | | | | | | | | | | | |
| | | | | |
| $ | 3,000 | | | Credit Suisse Group AG, 144A | | | 7.500% | | | | N/A (3) | | | | BB | | | $ | 2,945,322 | |
| | 1,000 | | | Credit Suisse Group AG, 144A | | | 6.375% | | | | N/A (3) | | | | Ba2 | | | | 845,000 | |
| | 340 | | | Credit Suisse Group AG, 144A | | | 9.750% | | | | N/A (3) | | | | BB | | | | 361,080 | |
| | 2,400 | | | Deutsche Bank AG | | | 6.000% | | | | N/A (3) | | | | BB- | | | | 2,076,000 | |
| | 2,040 | | | UBS Group AG, 144A | | | 7.000% | | | | N/A (3) | | | | BBB | | | | 2,076,985 | |
| | 3,845 | | | UBS Group AG Reg S | | | 6.875% | | | | N/A (3) | | | | BBB | | | | 3,926,706 | |
| | 290 | | | UBS Group AG Reg S | | | 5.125% | | | | N/A (3) | | | | BBB | | | | 276,567 | |
| | 12,915 | | | Total Capital Markets | | | | | | | | | | | | | | | 12,507,660 | |
| | | | Total Contingent Capital Securities (cost $43,551,396) | | | | | | | | | | | | | | | 41,709,974 | |
| | | | | |
| Shares | | | Description (1) | | Coupon | | | | | | Ratings (2) | | | Value | |
| |
| | | | $25 PAR (OR SIMILAR) RETAIL PREFERRED – 25.5% (17.1% of Total Investments) | |
| | | | | |
| | | | Banks – 7.1% | | | | | | | | | | | | |
| | | | | |
| | 4,740 | | | CoBank ACB (6) | | | 6.200% | | | | | | | | BBB+ | | | $ | 485,850 | |
| | 16,050 | | | CoBank ACB (6) | | | 6.250% | | | | | | | | BBB+ | | | | 1,609,012 | |
| | 15,000 | | | Farm Credit Bank of Texas, 144A (6) | | | 6.750% | | | | | | | | Baa1 | | | | 1,526,250 | |
| | 19,366 | | | Fifth Third Bancorp | | | 6.625% | | | | | | | | Baa3 | | | | 511,650 | |
| | 8,100 | | | KeyCorp | | | 6.125% | | | | | | | | Baa3 | | | | 215,946 | |
| | 21,268 | | | Regions Financial Corp | | | 6.375% | | | | | | | | Baa3 | | | | 566,154 | |
| | 10,600 | | | Regions Financial Corp | | | 5.700% | | | | | | | | Baa3 | | | | 266,484 | |
| | 16,894 | | | Synovus Financial Corp | | | 5.875% | | | | | | | | BB- | | | | 431,980 | |
| | 16,400 | | | Wells Fargo & Co | | | 4.750% | | | | | | | | Baa2 | | | | 343,088 | |
| | 7,900 | | | Western Alliance Bancorp | | | 4.250% | | | | | | | | Ba1 | | | | 190,074 | |
| | 15,308 | | | Wintrust Financial Corp | | | 6.875% | | | | | | | | BB | | | | 405,662 | |
| | | | Total Banks | | | | | | | | | | | | | | | 6,552,150 | |
| | | | | |
| | | | Capital Markets – 3.0% | | | | | | | | | | | | |
| | | | | |
| | 7,777 | | | Goldman Sachs Group Inc | | | 5.500% | | | | | | | | BB+ | | | | 195,047 | |
| | 23,100 | | | Morgan Stanley | | | 6.375% | | | | | | | | BBB- | | | | 611,688 | |
| | 19,451 | | | Morgan Stanley | | | 6.875% | | | | | | | | BBB- | | | | 511,756 | |
| | 33,800 | | | Morgan Stanley | | | 5.850% | | | | | | | | BBB- | | | | 867,984 | |
| | 12,974 | | | Morgan Stanley | | | 7.125% | | | | | | | | BBB- | | | | 340,567 | |
| | 11,600 | | | Morgan Stanley (6) | | | 6.500% | | | | | | | | BBB- | | | | 302,296 | |
| | | | Total Capital Markets | | | | | | | | | | | | | | | 2,829,338 | |
| | | | | |
| | | | Consumer Finance – 0.3% | | | | | | | | | | | | |
| | | | | |
| | 11,900 | | | Synchrony Financial | | | 5.625% | | | | | | | | BB- | | | | 245,854 | |
| | | | | |
| | | | Diversified Financial Services – 2.8% | | | | | | | | | | | | |
| | | | | |
| | 12,213 | | | AgriBank FCB (6) | | | 6.875% | | | | | | | | BBB+ | | | | 1,242,673 | |
| | 18,500 | | | Equitable Holdings Inc | | | 5.250% | | | | | | | | BBB- | | | | 439,930 | |
| | 35,623 | | | Voya Financial Inc | | | 5.350% | | | | | | | | BBB- | | | | 878,819 | |
| | | | Total Diversified Financial Services | | | | | | | | | | | | | | | 2,561,422 | |
| | | | | |
| | | | Diversified Telecommunication Services – 0.2% | | | | | | | | | | | | |
| | | | | |
| | 8,700 | | | AT&T Inc | | | 4.750% | | | | | | | | BBB- | | | | 180,960 | |
| | | | | |
| | | | Food Products – 2.1% | | | | | | | | | | | | |
| | | | | |
| | 32,207 | | | CHS Inc | | | 7.100% | | | | | | | | N/R | | | | 852,841 | |
| | 31,132 | | | CHS Inc | | | 6.750% | | | | | | | | N/R | | | | 830,913 | |
| | 10,959 | | | CHS Inc | | | 7.875% | | | | | | | | N/R | | | | 308,825 | |
| | | | Total Food Products | | | | | | �� | | | | | | | | | 1,992,579 | |
| | | | | |
| | | | Insurance – 6.6% | | | | | | | | | | | | |
| | | | | |
| | 23,700 | | | American Equity Investment Life Holding Co | | | 6.625% | | | | | | | | BB | | | | 608,853 | |
| | 43,600 | | | American Equity Investment Life Holding Co | | | 5.950% | | | | | | | | BB | | | | 1,061,224 | |
| | 16,280 | | | Aspen Insurance Holdings Ltd | | | 5.625% | | | | | | | | BB+ | | | | 385,673 | |
| | 38,688 | | | Aspen Insurance Holdings Ltd | | | 5.950% | | | | | | | | BB+ | | | | 936,250 | |
| | 12,000 | | | Assurant Inc | | | 5.250% | | | | | | | | Baa3 | | | | 280,080 | |
| | 24,100 | | | Athene Holding Ltd | | | 6.375% | | | | | | | | BBB | | | | 634,794 | |
57
| | |
| |
| | Nuveen Preferred and Income Fund (continued) |
| | Portfolio of Investments July 31, 2022 |
| | | | | | | | | | | | | | | | | | | | |
| Shares | | | Description (1) | | Coupon | | | | | | Ratings (2) | | | Value | |
| | | | | |
| | | | Insurance (continued) | | | | | | | | | | | | |
| | | | | |
| | 27,700 | | | Athene Holding Ltd | | | 6.350% | | | | | | | | BBB | | | $ | 742,914 | |
| | 23,000 | | | Enstar Group Ltd | | | 7.000% | | | | | | | | BBB- | | | | 558,440 | |
| | 26,902 | | | Reinsurance Group of America Inc | | | 5.750% | | | | | | | | BBB+ | | | | 706,177 | |
| | 9,463 | | | Selective Insurance Group Inc | | | 4.600% | | | | | | | | BBB- | | | | 192,194 | |
| | | | Total Insurance | | | | | | | | | | | | | | | 6,106,599 | |
| | | | | |
| | | | Oil, Gas & Consumable Fuels – 1.8% | | | | | | | | | | | | |
| | | | | |
| | 8,300 | | | Energy Transfer LP | | | 7.600% | | | | | | | | BB | | | | 196,710 | |
| | 24,163 | | | NuStar Energy LP | | | 7.673% | | | | | | | | B2 | | | | 506,215 | |
| | 31,634 | | | NuStar Energy LP | | | 8.769% | | | | | | | | B2 | | | | 757,634 | |
| | 10,020 | | | NuStar Logistics LP | | | 9.246% | | | | | | | | B | | | | 250,300 | |
| | | | Total Oil, Gas & Consumable Fuels | | | | | | | | | | | | | | | 1,710,859 | |
| | | | | |
| | | | Thrifts & Mortgage Finance – 0.9% | | | | | | | | | | | | |
| | | | | |
| | 32,731 | | | New York Community Bancorp Inc | | | 6.375% | | | | | | | | Ba2 | | | | 856,898 | |
| | | | | |
| | | | Trading Companies & Distributors – 0.7% | | | | | | | | | | | | |
| | | | | |
| | 17,771 | �� | | Air Lease Corp | | | 6.150% | | | | | | | | BB+ | | | | 433,790 | |
| | 7,500 | | | WESCO International Inc | | | 10.625% | | | | | | | | B | | | | 211,125 | |
| | | | Total Trading Companies & Distributors | | | | | | | | | | | | | | | 644,915 | |
| | | | Total $25 Par (or similar) Retail Preferred (cost $24,375,793) | | | | | | | | | | | | | | | 23,681,574 | |
| | | | | |
Principal
Amount (000) | | | Description (1) | | Coupon | | | Maturity | | | Ratings (2) | | | Value | |
| |
| | | | CORPORATE BONDS – 3.9% (2.6% of Total Investments) | |
| | | | | |
| | | | Banks – 2.9% | | | | | | | | | | | | |
| | | | | |
| $ | 1,600 | | | Banco Santander SA Reg S | | | 7.500% | | | | 5/08/71 | | | | Ba1 | | | $ | 1,620,000 | |
| | 1,000 | | | Commerzbank AG, 144A | | | 8.125% | | | | 9/19/23 | | | | Baa3 | | | | 1,025,128 | |
| | 2,600 | | | Total Banks | | | | | | | | | | | | | | | 2,645,128 | |
| | | | | |
| | | | Insurance – 1.0% | | | | | | | | | | | | |
| | | | | |
| | 980 | | | Fidelis Insurance Holdings Ltd, 144A | | | 6.625% | | | | 4/01/41 | | | | BB+ | | | | 960,400 | |
| $ | 3,580 | | | Total Corporate Bonds (cost $3,628,850) | | | | | | | | | | | | | | | 3,605,528 | |
| | | | Total Long-Term Investments (cost $144,534,066) | | | | | | | | | | | | | | | 138,761,143 | |
| | | | | |
Principal
Amount (000) | | | Description (1) | | Coupon | | | Maturity | | | | | | Value | |
| | | | |
| | | | SHORT-TERM INVESTMENTS – 0.2% (0.1% of Total Investments) | | | | | | | | | | |
| | | | | |
| | | | REPURCHASE AGREEMENTS – 0.2% (0.1% of Total Investments) | | | | | | | | | | | | |
| | | | | |
| $ | 195 | | | Repurchase Agreement with Fixed Income Clearing Corporation, dated 7/29/22, repurchase price $194,681, collateralized by $127,200, U.S Treasury Inflation Index Government Bond, 2.500%,
due 1/15/29, value $198,690 | | | 0.450% | | | | 8/01/22 | | | | | | | $ | 194,673 | |
| | | | Total Short-Term Investments (cost $194,673) | | | | | | | | | | | | | | | 194,673 | |
| | | | Total Investments (cost $144,728,739) – 149.6% | | | | | | | | | | | | | | | 138,955,816 | |
| | | | Borrowings – (50.6)% (7), (8) | | | | | | | | | | | | | | | (47,000,000 | ) |
| | | | Other Assets Less Liabilities – 1.0% | | | | | | | | | | | | | | | 955,531 | |
| | | | Net Assets Applicable to Common Shares – 100% | | | | | | | | | | | | | | $ | 92,911,347 | |
58
For Fund portfolio compliance purposes, the Fund’s industry classifications refer to any one or more of the industry
sub-classifications
used by one or more widely recognized market indexes or ratings group indexes, and/or as defined by Fund management. This definition may not apply for purposes of this report, which may combine industry
sub-classifications
into sectors for reporting ease.
| (1) | All percentages shown in the Portfolio of Investments are based on net assets applicable to common shares unless otherwise noted. |
| (2) | For financial reporting purposes, the ratings disclosed are the highest of Standard & Poor’s Group (“Standard & Poor’s”), Moody’s Investors Service, Inc. (“Moody’s”) or Fitch, Inc. (“Fitch”) rating. This treatment of split-rated securities may differ from that used for other purposes, such as for Fund investment policies. Ratings below BBB by Standard & Poor’s, Baa by Moody’s or BBB by Fitch are considered to be below investment grade. Holdings designated N/R are not rated by any of these national rating agencies. Ratings are not covered by the report of independent registered public accounting firm. |
| (3) | Perpetual security. Maturity date is not applicable. |
| (4) | Variable rate security. The rate shown is the coupon as of the end of the reporting period. |
| (5) | Contingent Capital Securities (“CoCos”) are hybrid securities with loss absorption characteristics built into the terms of the security for the benefit of the issuer. For example, the terms may specify an automatic write-down of principal or a mandatory conversion into the issuer’s common stock under certain adverse circumstances, such as the issuer’s capital ratio falling below a specified level. |
| (6) | For fair value measurement disclosure purposes, investment classified as Level 2. |
| (7) | Borrowings as a percentage of Total Investments is 33.8%. |
| (8) | The Fund segregates 100% of its eligible investments (excluding any investments separately pledged as collateral for specific investments in derivatives, when applicable) in the Portfolio of Investments as collateral for borrowings. |
| 144A | Investment is exempt from registration under Rule 144A of the Securities Act of 1933, as amended. These investments may only be resold in transactions exempt from registration, which are normally those transactions with qualified institutional buyers. |
| LIBOR | London Inter-Bank Offered Rate |
| Reg S | Regulation S allows U.S. companies to sell securities to persons or entities located outside of the United States without registering those securities with the Securities and Exchange Commission. Specifically, Regulation S provides a safe harbor from the registration requirements of the Securities Act for the offers and sales of securities by both foreign and domestic issuers that are made outside the United States. |
See accompanying notes to financial statements.
59
| | |
| | Nuveen Variable Rate Preferred &
Income Fund Portfolio of Investments July 31, 2022 |
| | | | | | | | | | | | | | | | | | | | |
Principal
Amount (000)/
Shares | | | Description (1) | | Coupon | | | Maturity | | | Ratings (2) | | | Value | |
| |
| | | | LONG-TERM INVESTMENTS – 155.6% (99.4% of Total Investments) | |
| |
| | | | $1,000 PAR (OR SIMILAR) INSTITUTIONAL PREFERRED – 97.0% (62.0% of Total Investments) | |
| |
| | | | Automobiles – 4.0% | |
| | | | | |
| $ | 10,000 | | | General Motors Financial Co Inc | | | 5.700% | | | | N/A (3) | | | | BB+ | | | $ | 9,475,000 | |
| | | | | |
| | 12,331 | | | General Motors Financial Co Inc (4) | | | 5.750% | | | | N/A (3) | | | | BB+ | | | | 11,049,940 | |
| | | | Total Automobiles | | | | | | | | | | | | | | | 20,524,940 | |
| |
| | | | Banks – 40.7% | |
| | | | | |
| | 3,000 | | | Bank of America Corp | | | 6.300% | | | | N/A (3) | | | | BBB+ | | | | 3,114,588 | |
| | 5,000 | | | Bank of America Corp | | | 6.500% | | | | N/A (3) | | | | BBB+ | | | | 5,127,010 | |
| | 8,000 | | | Bank of America Corp | | | 4.375% | | | | N/A (3) | | | | BBB+ | | | | 7,260,000 | |
| | 2,219 | | | Bank of America Corp (4) | | | 6.100% | | | | N/A (3) | | | | BBB+ | | | | 2,243,692 | |
| | 7,810 | | | Bank of America Corp | | | 6.250% | | | | N/A (3) | | | | BBB+ | | | | 7,865,946 | |
| | 3,375 | | | Citigroup Inc | | | 5.950% | | | | N/A (3) | | | | BBB- | | | | 3,321,034 | |
| | 19,995 | | | Citigroup Inc (4) | | | 6.300% | | | | N/A (3) | | | | BBB- | | | | 19,318,749 | |
| | 2,875 | | | Citigroup Inc | | | 6.250% | | | | N/A (3) | | | | BBB- | | | | 2,947,105 | |
| | 1,877 | | | Citigroup Inc | | | 4.150% | | | | N/A (3) | | | | BBB- | | | | 1,652,849 | |
| | 8,000 | | | Citigroup Inc | | | 5.000% | | | | N/A (3) | | | | BBB- | | | | 7,406,932 | |
| | 4,290 | | | Citizens Financial Group Inc | | | 4.000% | | | | N/A (3) | | | | BB+ | | | | 3,616,263 | |
| | 2,500 | | | Citizens Financial Group Inc | | | 6.375% | | | | N/A (3) | | | | BB+ | | | | 2,247,038 | |
| | 4,095 | | | Fifth Third Bancorp | | | 4.500% | | | | N/A (3) | | | | Baa3 | | | | 3,972,928 | |
| | 5,600 | | | First Citizens BancShares Inc/NC (3-Month LIBOR reference rate + 3.972% spread) (5) | | | 5.801% | | | | N/A (3) | | | | BB- | | | | 5,285,000 | |
| | 2,700 | | | Goldman Sachs Group Inc | | | 3.800% | | | | N/A (3) | | | | BBB- | | | | 2,329,782 | |
| | 5,190 | | | HSBC Capital Funding Dollar 1 LP, 144A | | | 10.176% | | | | N/A (3) | | | | BBB | | | | 6,995,057 | |
| | 8,400 | | | Huntington Bancshares Inc/OH | | | 5.625% | | | | N/A (3) | | | | Baa3 | | | | 8,316,000 | |
| | 1,245 | | | JPMorgan Chase & Co | | | 3.650% | | | | N/A (3) | | | | BBB+ | | | | 1,139,424 | |
| | 5,000 | | | JPMorgan Chase & Co | | | 6.100% | | | | N/A (3) | | | | BBB+ | | | | 5,003,000 | |
| | 16,250 | | | JPMorgan Chase & Co | | | 6.750% | | | | N/A (3) | | | | BBB+ | | | | 16,696,875 | |
| | 8,130 | | | JPMorgan Chase & Co | | | 5.000% | | | | N/A (3) | | | | BBB+ | | | | 7,552,589 | |
| | 4,789 | | | KeyCorp | | | 5.000% | | | | N/A (3) | | | | Baa3 | | | | 4,443,360 | |
| | 2,020 | | | M&T Bank Corp | | | 3.500% | | | | N/A (3) | | | | Baa2 | | | | 1,647,250 | |
| | 6,000 | | | M&T Bank Corp (4) | | | 5.125% | | | | N/A (3) | | | | Baa2 | | | | 5,551,282 | |
| | 3,534 | | | PNC Financial Services Group Inc (4) | | | 5.000% | | | | N/A (3) | | | | Baa2 | | | | 3,272,620 | |
| | 2,800 | | | PNC Financial Services Group Inc | | | 3.400% | | | | N/A (3) | | | | Baa2 | | | | 2,296,000 | |
| | 2,825 | | | PNC Financial Services Group Inc | | | 6.000% | | | | N/A (3) | | | | Baa2 | | | | 2,842,656 | |
| | 2,820 | | | Regions Financial Corp | | | 5.750% | | | | N/A (3) | | | | Baa3 | | | | 2,867,779 | |
| | 4,000 | | | SVB Financial Group | | | 4.000% | | | | N/A (3) | | | | Baa2 | | | | 3,242,604 | |
| | 4,470 | | | SVB Financial Group | | | 4.700% | | | | N/A (3) | | | | Baa2 | | | | 3,566,524 | |
| | 1,970 | | | Truist Financial Corp (3-Month LIBOR reference rate + 3.102% spread) (5) | | | 4.931% | | | | N/A (3) | | | | Baa2 | | | | 1,822,742 | |
| | 13,368 | | | Truist Financial Corp (4) | | | 4.800% | | | | N/A (3) | | | | Baa2 | | | | 12,680,189 | |
| | 8,195 | | | Truist Financial Corp | | | 5.100% | | | | N/A (3) | | | | Baa2 | | | | 7,838,537 | |
| | 18,208 | | | Wells Fargo & Co | | | 3.900% | | | | N/A (3) | | | | Baa2 | | | | 16,865,160 | |
| | 9,429 | | | Wells Fargo & Co | | | 5.875% | | | | N/A (3) | | | | Baa2 | | | | 9,511,208 | |
| | 4,000 | | | Wells Fargo & Co | | | 5.900% | | | | N/A (3) | | | | Baa2 | | | | 3,797,140 | |
| | 1,200 | | | Zions Bancorp NA | | | 7.200% | | | | N/A (3) | | | | BB+ | | | | 1,214,549 | |
| | | | Total Banks | | | | | | | | | | | | | | | 206,871,461 | |
| |
| | | | Capital Markets – 7.2% | |
| | | | | |
| | 2,405 | | | Bank of New York Mellon Corp (4) | | | 4.700% | | | | N/A (3) | | | | Baa1 | | | | 2,395,380 | |
| | 3,000 | | | Charles Schwab Corp | | | 4.000% | | | | N/A (3) | | | | BBB | | | | 2,728,110 | |
| | 11,373 | | | Charles Schwab Corp | | | 5.375% | | | | N/A (3) | | | | BBB | | | | 11,548,144 | |
| | 8,200 | | | Goldman Sachs Group Inc | | | 4.125% | | | | N/A (3) | | | | BBB- | | | | 7,214,240 | |
| | 7,045 | | | Goldman Sachs Group Inc (4) | | | 5.500% | | | | N/A (3) | | | | BBB- | | | | 7,006,234 | |
| | 5,890 | | | Goldman Sachs Group Inc (4) | | | 5.300% | | | | N/A (3) | | | | BBB- | | | | 5,824,555 | |
| | | | Total Capital Markets | | | | | | | | | | | | | | | 36,716,663 | |
60
| | | | | | | | | | | | | | | | | | | | |
Principal
Amount (000)/
Shares | | | Description (1) | | Coupon | | | Maturity | | | Ratings (2) | | | Value | |
| |
| | | | Communications Equipment – 0.6% | |
| | | | | |
| $ | 3,520 | | | Vodafone Group PLC | | | 4.125% | | | | 6/04/81 | | | | BB+ | | | $ | 2,849,317 | |
| |
| | | | Consumer Finance – 3.9% | |
| | | | | |
| | 4,200 | | | Ally Financial Inc | | | 4.700% | | | | N/A (3) | | | | Ba2 | | | | 3,313,554 | |
| | 5,000 | | | Ally Financial Inc | | | 4.700% | | | | N/A (3) | | | | Ba2 | | | | 4,213,500 | |
| | 3,785 | | | American Express Co (4) | | | 3.550% | | | | N/A (3) | | | | Baa2 | | | | 3,327,015 | |
| | 4,705 | | | Capital One Financial Corp | | | 3.950% | | | | N/A (3) | | | | Baa3 | | | | 4,093,286 | |
| | 3,690 | | | Discover Financial Services | | | 5.500% | | | | N/A (3) | | | | Ba2 | | | | 3,143,113 | |
| | 1,745 | | | Discover Financial Services | | | 6.125% | | | | N/A (3) | | | | Ba2 | | | | 1,781,685 | |
| | | | Total Consumer Finance | | | | | | | | | | | | | | | 19,872,153 | |
| |
| | | | Diversified Financial Services – 2.7% | |
| | | | | |
| | 3,250 | | | Capital Farm Credit ACA, 144A | | | 5.000% | | | | N/A (3) | | | | BB | | | | 2,899,000 | |
| | 350 | | | Compeer Financial ACA, 144A | | | 4.875% | | | | N/A (3) | | | | BB+ | | | | 308,875 | |
| | 6,310 | | | Equitable Holdings Inc | | | 4.950% | | | | N/A (3) | | | | BBB- | | | | 6,190,385 | |
| | 4,352 | | | Voya Financial Inc | | | 6.125% | | | | N/A (3) | | | | BBB- | | | | 4,169,666 | |
| | | | Total Diversified Financial Services | | | | | | | | | | | | | | | 13,567,926 | |
| |
| | | | Electric Utilities – 4.9% | |
| | | | | |
| | 2,600 | | | American Electric Power Co Inc (4) | | | 3.875% | | | | 2/15/62 | | | | BBB | | | | 2,198,995 | |
| | 4,530 | | | Edison International | | | 5.000% | | | | N/A (3) | | | | BB+ | | | | 3,821,433 | |
| | 1,445 | | | Edison International | | | 5.375% | | | | N/A (3) | | | | BB+ | | | | 1,245,099 | |
| | 2,000 | | | Electricite de France SA, 144A | | | 5.250% | | | | N/A (3) | | | | BBB- | | | | 1,920,000 | |
| | 14,093 | | | Emera Inc (4) | | | 6.750% | | | | 6/15/76 | | | | BB+ | | | | 14,005,583 | |
| | 2,000 | | | Southern Co/The | | | 4.000% | | | | 1/15/51 | | | | BBB- | | | | 1,862,683 | |
| | | | Total Electric Utilities | | | | | | | | | | | | | | | 25,053,793 | |
| |
| | | | Independent Power Producers & Energy Traders – 1.5% | |
| | | | | |
| | 2,685 | | | AES Andes SA, 144A | | | 7.125% | | | | 3/26/79 | | | | BB | | | | 2,443,350 | |
| | 1,700 | | | AES Andes SA, 144A | | | 6.350% | | | | 10/07/79 | | | | BB | | | | 1,448,400 | |
| | 1,560 | | | Vistra Corp, 144A | | | 8.000% | | | | N/A (3) | | | | Ba3 | | | | 1,511,250 | |
| | 2,215 | | | Vistra Corp, 144A | | | 7.000% | | | | N/A (3) | | | | Ba3 | | | | 2,059,817 | |
| | | | Total Independent Power Producers & Energy Traders | | | | | | | | | | | | | | | 7,462,817 | |
| |
| | | | Industrial Conglomerates – 1.7% | |
| | | | | |
| | 9,440 | | | General Electric Co (3-Month LIBOR reference rate + 3.330% spread) (5) | | | 5.159% | | | | N/A (3) | | | | BBB- | | | | 8,802,800 | |
| |
| | | | Insurance – 13.8% | |
| | | | | |
| | 2,595 | | | Aegon NV (4) | | | 5.500% | | | | 4/11/48 | | | | Baa1 | | | | 2,504,673 | |
| | 2,250 | | | American International Group Inc (4) | | | 5.750% | | | | 4/01/48 | | | | BBB- | | | | 2,056,812 | |
| | 3,516 | | | Assurant Inc (4) | | | 7.000% | | | | 3/27/48 | | | | Baa3 | | | | 3,522,811 | |
| | 3,000 | | | Assured Guaranty Municipal Holdings Inc, 144A | | | 6.400% | | | | 12/15/66 | | | | BBB+ | | | | 2,894,281 | |
| | 3,050 | | | AXIS Specialty Finance LLC (4) | | | 4.900% | | | | 1/15/40 | | | | BBB | | | | 2,643,984 | |
| | 6,115 | | | Enstar Finance LLC | | | 5.500% | | | | 1/15/42 | | | | BBB- | | | | 5,246,482 | |
| | 1,000 | | | Enstar Finance LLC | | | 5.750% | | | | 9/01/40 | | | | BBB- | | | | 934,299 | |
| | 1,530 | | | Legal & General Group PLC Reg S | | | 5.250% | | | | 3/21/47 | | | | A3 | | | | 1,482,172 | |
| | 10,345 | | | Markel Corp | | | 6.000% | | | | N/A (3) | | | | BBB- | | | | 10,500,060 | |
| | 8,000 | | | MetLife Inc (4) | | | 5.875% | | | | N/A (3) | | | | BBB | | | | 7,800,988 | |
| | 945 | | | Prudential Financial Inc | | | 3.700% | | | | 10/01/50 | | | | BBB+ | | | | 826,623 | |
| | 1,395 | | | Prudential Financial Inc | | | 5.125% | | | | 3/01/52 | | | | BBB+ | | | | 1,332,121 | |
| | 8,205 | | | QBE Insurance Group Ltd, 144A (4) | | | 7.500% | | | | 11/24/43 | | | | Baa1 | | | | 8,322,479 | |
| | 1,600 | | | QBE Insurance Group Ltd, 144A | | | 5.875% | | | | N/A (3) | | | | Baa2 | | | | 1,557,600 | |
| | 3,875 | | | QBE Insurance Group Ltd Reg S | | | 6.750% | | | | 12/02/44 | | | | BBB | | | | 3,915,994 | |
| | 14,500 | | | SBL Holdings Inc, 144A | | | 7.000% | | | | N/A (3) | | | | BB | | | | 11,887,609 | |
| | 3,915 | | | SBL Holdings Inc, 144A | | | 6.500% | | | | N/A (3) | | | | BB | | | | 2,867,737 | |
| | | | Total Insurance | | | | | | | | | | | | | | | 70,296,725 | |
| |
| | | | Media – 0.4% | |
| | | | | |
| | 2,235 | | | Paramount Global | | | 6.375% | | | | 3/30/62 | | | | Baa3 | | | | 2,111,037 | |
61
| | |
| |
| | Nuveen Variable Rate Preferred & Income Fund (continued) |
| | Portfolio of Investments July 31, 2022 |
| | | | | | | | | | | | | | | | | | | | |
Principal
Amount (000)/
Shares | | | Description (1) | | Coupon | | | Maturity | | | Ratings (2) | | | Value | |
| |
| | | | Multi-Utilities – 4.1% | |
| | | | | |
| $ | 6,115 | | | Algonquin Power & Utilities Corp | | | 4.750% | | | | 1/18/82 | | | | BB+ | | | $ | 5,400,157 | |
| | 8,050 | | | CenterPoint Energy Inc | | | 6.125% | | | | N/A (3) | | | | BBB- | | | | 7,264,941 | |
| | 2,500 | | | CMS Energy Corp (4) | | | 4.750% | | | | 6/01/50 | | | | BBB- | | | | 2,340,900 | |
| | 3,210 | | | Sempra Energy (4) | | | 4.875% | | | | N/A (3) | | | | BBB- | | | | 3,111,836 | |
| | 3,400 | | | Sempra Energy | | | 4.125% | | | | 4/01/52 | | | | BBB- | | | | 2,870,184 | |
| | | | Total Multi-Utilities | | | | | | | | | | | | | | | 20,988,018 | |
| |
| | | | Oil, Gas & Consumable Fuels – 5.3% | |
| | | | | |
| | 3,000 | | | Enbridge Inc | | | 6.000% | | | | 1/15/77 | | | | BBB- | | | | 2,852,958 | |
| | 13,546 | | | Enbridge Inc | | | 5.500% | | | | 7/15/77 | | | | BBB- | | | | 12,303,878 | |
| | 5,345 | | | Energy Transfer LP (4) | | | 6.500% | | | | N/A (3) | | | | BB | | | | 4,850,588 | |
| | 545 | | | Energy Transfer LP | | | 7.125% | | | | N/A (3) | | | | BB | | | | 490,500 | |
| | 2,730 | | | MPLX LP | | | 6.875% | | | | N/A (3) | | | | BB+ | | | | 2,618,041 | |
| | 2,155 | | | Transcanada Trust | | | 5.600% | | | | 3/07/82 | | | | BBB | | | | 2,012,007 | |
| | 2,000 | | | Transcanada Trust (4) | | | 5.500% | | | | 9/15/79 | | | | BBB | | | | 1,839,611 | |
| | | | Total Oil, Gas & Consumable Fuels | | | | | | | | | | | | | | | 26,967,583 | |
| |
| | | | Trading Companies & Distributors – 4.9% | |
| | | | | |
| | 3,200 | | | AerCap Global Aviation Trust, 144A (4) | | | 6.500% | | | | 6/15/45 | | | | BB+ | | | | 3,034,399 | |
| | 16,900 | | | AerCap Holdings NV | | | 5.875% | | | | 10/10/79 | | | | BB+ | | | | 14,998,750 | |
| | 4,841 | | | Air Lease Corp | | | 4.650% | | | | N/A (3) | | | | BB+ | | | | 4,236,607 | |
| | 3,673 | | | ILFC E-Capital Trust I, 144A | | | 4.850% | | | | 12/21/65 | | | | B+ | | | | 2,758,099 | |
| | | | Total Trading Companies & Distributors | | | | | | | | | | | | | | | 25,027,855 | |
| |
| | | | U.S. Agency – 0.0% | |
| | | | | |
| | 50 | | | Farm Credit Bank of Texas, 144A | | | 6.200% | | | | N/A (3) | | | | BBB+ | | | | 46,362 | |
| | 50 | | | Farm Credit Bank of Texas, 144A | | | 5.700% | | | | N/A (3) | | | | Baa1 | | | | 47,226 | |
| | | | Total U.S. Agency | | | | | | | | | | | | | | | 93,588 | |
| |
| | | | Wireless Telecommunication Services – 1.3% | |
| | | | | |
| | 6,000 | | | Vodafone Group PLC | | | 7.000% | | | | 4/04/79 | | | | BB+ | | | | 6,307,500 | |
| | | | Total $1,000 Par (or similar) Institutional Preferred (cost $552,317,888) | | | | | | | | | | | | | | | 493,514,176 | |
| | | | | |
Principal
Amount (000) | | | Description (1), (6) | | Coupon | | | Maturity | | | Ratings (2) | | | Value | |
| | | |
| | | | CONTINGENT CAPITAL SECURITIES – 29.4% (18.8% of Total Investments) | | | | | | | | | |
| |
| | | | Banks – 20.7% | |
| | | | | |
| $ | 1,000 | | | Australia & New Zealand Banking Group Ltd/United Kingdom, 144A (4) | | | 6.750% | | | | N/A (3) | | | | Baa2 | | | $ | 1,020,000 | |
| | 3,200 | | | Banco Bilbao Vizcaya Argentaria SA | | | 6.500% | | | | N/A (3) | | | | Ba2 | | | | 3,067,458 | |
| | 2,200 | | | Banco Bilbao Vizcaya Argentaria SA | | | 6.125% | | | | N/A (3) | | | | Ba2 | | | | 1,926,604 | |
| | 715 | | | Banco Mercantil del Norte SA/Grand Cayman, 144A | | | 7.500% | | | | N/A (3) | | | | Ba2 | | | | 641,713 | |
| | 1,595 | | | Banco Mercantil del Norte SA/Grand Cayman, 144A | | | 7.625% | | | | N/A (3) | | | | Ba2 | | | | 1,498,168 | |
| | 3,000 | | | Banco Santander SA | | | 4.750% | | | | N/A (3) | | | | Ba1 | | | | 2,561,853 | |
| | 4,000 | | | Banco Santander SA Reg S | | | 7.500% | | | | N/A (3) | | | | Ba1 | | | | 4,050,000 | |
| | 3,800 | | | Barclays PLC | | | 6.125% | | | | N/A (3) | | | | BBB- | | | | 3,664,340 | |
| | 9,588 | | | Barclays PLC | | | 7.750% | | | | N/A (3) | | | | BBB- | | | | 9,658,882 | |
| | 7,265 | | | BNP Paribas SA, 144A | | | 6.625% | | | | N/A (3) | | | | BBB | | | | 7,289,388 | |
| | 2,089 | | | BNP Paribas SA, 144A | | | 7.000% | | | | N/A (3) | | | | BBB | | | | 2,100,490 | |
| | 2,465 | | | Credit Agricole SA, 144A | | | 7.875% | | | | N/A (3) | | | | BBB | | | | 2,532,788 | |
| | 5,800 | | | Credit Agricole SA, 144A | | | 8.125% | | | | N/A (3) | | | | BBB | | | | 6,169,750 | |
| | 925 | | | Danske Bank A/S Reg S | | | 4.375% | | | | N/A (3) | | | | BBB- | | | | 795,500 | |
| | 910 | | | Danske Bank A/S Reg S | | | 7.000% | | | | N/A (3) | | | | BBB- | | | | 878,969 | |
| | 8,000 | | | HSBC Holdings PLC | | | 6.375% | | | | N/A (3) | | | | BBB | | | | 8,074,575 | |
| | 1,220 | | | HSBC Holdings PLC | | | 6.375% | | | | N/A (3) | | | | BBB | | | | 1,212,031 | |
| | 6,650 | | | HSBC Holdings PLC (4) | | | 6.000% | | | | N/A (3) | | | | BBB | | | | 6,379,555 | |
| | 8,441 | | | ING Groep NV Reg S | | | 6.750% | | | | N/A (3) | | | | BBB | | | | 8,469,868 | |
| | 1,098 | | | Intesa Sanpaolo SpA, 144A | | | 7.700% | | | | N/A (3) | | | | BB- | | | | 1,026,630 | |
| | 2,000 | | | Lloyds Banking Group PLC | | | 7.500% | | | | N/A (3) | | | | Baa3 | | | | 2,020,507 | |
| | 9,185 | | | Lloyds Banking Group PLC | | | 6.750% | | | | N/A (3) | | | | Baa3 | | | | 9,025,407 | |
| | 1,500 | | | Macquarie Bank Ltd/London, 144A | | | 6.125% | | | | N/A (3) | | | | BB+ | | | | 1,388,130 | |
| | 7,000 | | | NatWest Group PLC | | | 8.000% | | | | N/A (3) | | | | BBB- | | | | 7,227,500 | |
62
| | | | | | | | | | | | | | | | | | | | |
Principal
Amount (000) | | | Description (1), (6) | | Coupon | | | Maturity | | | Ratings (2) | | | Value | |
| |
| | | | Banks (continued) | |
| | | | | |
| $ | 2,100 | | | Nordea Bank Abp, 144A (4) | | | 6.625% | | | | N/A (3) | | | | BBB+ | | | $ | 2,095,186 | |
| | 1,500 | | | Societe Generale SA, 144A (4) | | | 4.750% | | | | N/A (3) | | | | BB+ | | | | 1,306,479 | |
| | 5,000 | | | Societe Generale SA, 144A (4) | | | 8.000% | | | | N/A (3) | | | | BB | | | | 5,137,647 | |
| | 1,700 | | | Standard Chartered PLC, 144A (4) | | | 7.750% | | | | N/A (3) | | | | BBB- | | | | 1,742,797 | |
| | 1,080 | | | Standard Chartered PLC, 144A | | | 6.000% | | | | N/A (3) | | | | BBB- | | | | 1,071,499 | |
| | 1,660 | | | UniCredit SpA Reg S | | | 8.000% | | | | N/A (3) | | | | BB- | | | | 1,608,789 | |
| | 106,686 | | | Total Banks | | | | | | | | | | | | | | | 105,642,503 | |
| |
| | | | Capital Markets – 8.7% | |
| | | | | |
| | 2,100 | | | Credit Suisse Group AG, 144A | | | 7.500% | | | | N/A (3) | | | | BB | | | | 2,061,725 | |
| | 1,575 | | | Credit Suisse Group AG, 144A | | | 9.750% | | | | N/A (3) | | | | BB | | | | 1,672,650 | |
| | 10,904 | | | Credit Suisse Group AG, 144A | | | 7.500% | | | | N/A (3) | | | | BB | | | | 10,133,087 | |
| | 5,850 | | | Credit Suisse Group AG, 144A | | | 6.375% | | | | N/A (3) | | | | Ba2 | | | | 4,943,250 | |
| | 6,800 | | | Deutsche Bank AG (4) | | | 6.000% | | | | N/A (3) | | | | BB- | | | | 5,882,000 | |
| | 6,600 | | | UBS Group AG, 144A (4) | | | 4.875% | | | | N/A (3) | | | | BBB | | | | 5,881,476 | |
| | 420 | | | UBS Group AG, 144A | | | 7.000% | | | | N/A (3) | | | | BBB | | | | 427,615 | |
| | 12,305 | | | UBS Group AG Reg S | | | 6.875% | | | | N/A (3) | | | | BBB | | | | 12,566,481 | |
| | 400 | | | UBS Group AG Reg S | | | 5.125% | | | | N/A (3) | | | | BBB | | | | 381,471 | |
| | 46,954 | | | Total Capital Markets | | | | | | | | | | | | | | | 43,949,755 | |
| | | | Total Contingent Capital Securities (cost $164,388,041) | | | | | | | | | | | | | | | 149,592,258 | |
| | | | | |
| Shares | | | Description (1) | | Coupon | | | | | | Ratings (2) | | | Value | |
| | | |
| | | | $25 PAR (OR SIMILAR) RETAIL PREFERRED – 29.2% (18.6% of Total Investments) | | | | | | | | | |
| |
| | | | Banks – 6.0% | |
| | | | | |
| | 38,600 | | | CoBank ACB (7) | | | 6.200% | | | | | | | | BBB+ | | | $ | 3,956,500 | |
| | 14,431 | | | CoBank ACB (7) | | | 6.250% | | | | | | | | BBB+ | | | | 1,446,708 | |
| | 121,601 | | | Fifth Third Bancorp | | | 6.625% | | | | | | | | Baa3 | | | | 3,212,698 | |
| | 62,700 | | | KeyCorp | | | 6.125% | | | | | | | | Baa3 | | | | 1,671,582 | |
| | 208,766 | | | PNC Financial Services Group Inc | | | 6.849% | | | | | | | | Baa2 | | | | 5,275,517 | |
| | 163,723 | | | Regions Financial Corp | | | 5.700% | | | | | | | | Baa3 | | | | 4,115,996 | |
| | 168,058 | | | Regions Financial Corp | | | 6.375% | | | | | | | | Baa3 | | | | 4,473,704 | |
| | 136,600 | | | Synovus Financial Corp | | | 5.875% | | | | | | | | BB- | | | | 3,492,862 | |
| | 99,600 | | | Wintrust Financial Corp | | | 6.875% | | | | | | | | BB | | | | 2,639,400 | |
| | | | Total Banks | | | | | | | | | | | | | | | 30,284,967 | |
| |
| | | | Capital Markets – 4.9% | |
| | | | | |
| | 51,400 | | | Goldman Sachs Group Inc | | | 5.500% | | | | | | | | BB+ | | | | 1,289,112 | |
| | 166,500 | | | Morgan Stanley | | | 7.125% | | | | | | | | BBB- | | | | 4,370,625 | |
| | 122,800 | | | Morgan Stanley | | | 6.375% | | | | | | | | BBB- | | | | 3,251,744 | |
| | 122,400 | | | Morgan Stanley | | | 6.875% | | | | | | | | BBB- | | | | 3,220,344 | |
| | 66,000 | | | Morgan Stanley (7) | | | 6.500% | | | | | | | | BBB- | | | | 1,719,960 | |
| | 433,584 | | | Morgan Stanley | | | 5.850% | | | | | | | | BBB- | | | | 11,134,437 | |
| | | | Total Capital Markets | | | | | | | | | | | | | | | 24,986,222 | |
| |
| | | | Diversified Financial Services – 1.9% | |
| | | | | |
| | 31,750 | | | AgriBank FCB (7) | | | 6.875% | | | | | | | | BBB+ | | | | 3,230,562 | |
| | 261,000 | | | Voya Financial Inc | | | 5.350% | | | | | | | | BBB- | | | | 6,438,870 | |
| | | | Total Diversified Financial Services | | | | | | | | | | | | | | | 9,669,432 | |
| |
| | | | Food Products – 2.5% | |
| | | | | |
| | 157,200 | | | CHS Inc | | | 6.750% | | | | | | | | N/R | | | | 4,195,668 | |
| | 315,300 | | | CHS Inc | | | 7.100% | | | | | | | | N/R | | | | 8,349,144 | |
| | 300 | | | Dairy Farmers of America Inc, 144A (7) | | | 7.875% | | | | | | | | BB+ | | | | 29,720 | |
| | | | Total Food Products | | | | | | | | | | | | | | | 12,574,532 | |
| |
| | | | Insurance – 7.9% | |
| | | | | |
| | 180,150 | | | American Equity Investment Life Holding Co | | | 6.625% | | | | | | | | BB | | | | 4,628,053 | |
| | 310,550 | | | American Equity Investment Life Holding Co | | | 5.950% | | | | | | | | BB | | | | 7,558,787 | |
| | 340,200 | | | Aspen Insurance Holdings Ltd | | | 5.950% | | | | | | | | BB+ | | | | 8,232,840 | |
| | 166,250 | | | Athene Holding Ltd | | | 6.375% | | | | | | | | BBB | | | | 4,379,025 | |
| | 194,775 | | | Athene Holding Ltd | | | 6.350% | | | | | | | | BBB | | | | 5,223,866 | |
63
| | |
| |
| | Nuveen Variable Rate Preferred & Income Fund (continued) |
| | Portfolio of Investments July 31, 2022 |
| | | | | | | | | | | | | | | | | | | | |
| Shares | | | Description (1) | | Coupon | | | | | | Ratings (2) | | | Value | |
| |
| | | | Insurance (continued) | |
| | | | | |
| | 131,900 | | | Enstar Group Ltd | | | 7.000% | | | | | | | | BBB- | | | $ | 3,202,532 | |
| | 188,600 | | | Reinsurance Group of America Inc | | | 5.750% | | | | | | | | BBB+ | | | | 4,950,750 | |
| | 77,800 | | | Reinsurance Group of America Inc | | | 6.200% | | | | | | | | BBB+ | | | | 1,971,452 | |
| | | | Total Insurance | | | | | | | | | | | | | | | 40,147,305 | |
| |
| | | | Multi-Utilities – 0.2% | |
| | | | | |
| | 31,600 | | | NiSource Inc | | | 6.500% | | | | | | | | BBB- | | | | 843,088 | |
| |
| | | | Oil, Gas & Consumable Fuels – 2.9% | |
| | | | | |
| | 51,100 | | | Energy Transfer LP | | | 7.600% | | | | | | | | BB | | | | 1,211,070 | |
| | 176,668 | | | NuStar Energy LP | | | 8.769% | | | | | | | | B2 | | | | 4,231,199 | |
| | 271,200 | | | NuStar Energy LP | | | 7.673% | | | | | | | | B2 | | | | 5,681,640 | |
| | 154,289 | | | NuStar Logistics LP | | | 9.246% | | | | | | | | B | | | | 3,854,139 | |
| | | | Total Oil, Gas & Consumable Fuels | | | | | | | | | | | | | | | 14,978,048 | |
| |
| | | | Thrifts & Mortgage Finance – 1.9% | |
| | | | | |
| | 115,560 | | | Federal Agricultural Mortgage Corp | | | 6.000% | | | | | | | | N/R | | | | 3,411,909 | |
| | 243,300 | | | New York Community Bancorp Inc | | | 6.375% | | | | | | | | Ba2 | | | | 6,369,594 | |
| | | | Total Thrifts & Mortgage Finance | | | | | | | | | | | | | | | 9,781,503 | |
| |
| | | | Trading Companies & Distributors – 1.0% | |
| | | | | |
| | 164,687 | | | Air Lease Corp | | | 6.150% | | | | | | | | BB+ | | | | 4,020,010 | |
| | 43,800 | | | WESCO International Inc | | | 10.625% | | | | | | | | B | | | | 1,232,970 | |
| | | | Total Trading Companies & Distributors | | | | | | | | | | | | | | | 5,252,980 | |
| | | | Total $25 Par (or similar) Retail Preferred (cost $160,024,352) | | | | | | | | | | | | | | | 148,518,077 | |
| | | | Total Long-Term Investments (cost $876,730,281) | | | | | | | | | | | | | | | 791,624,511 | |
| | | | | |
Principal
Amount (000) | | | Description (1) | | Coupon | | | Maturity | | | | | | Value | |
| | | | | |
| | | | SHORT-TERM INVESTMENTS – 0.9% (0.6% of Total Investments) | | | | | | | | | | | | |
| | | | | |
| | | | REPURCHASE AGREEMENTS – 0.9% (0.6% of Total Investments) | | | | | | | | | | | | |
| | | | | |
| $ | 4,815 | | | Repurchase Agreement with Fixed Income Clearing Corporation, dated 7/29/22, repurchase price $4,815,151, collateralized by $3,144,200, U.S Treasury Inflation Index Government Bond, 2.500%, due 1/15/29, value $4,911,339 | | | 0.450% | | | | 8/01/22 | | | | | | | $ | 4,814,971 | |
| | | | Total Short-Term Investments (cost $4,814,971) | | | | | | | | | | | | | | | 4,814,971 | |
| | | | Total Investments (cost $881,545,252) – 156.5% | | | | | | | | | | | | | | | 796,439,482 | |
| | | | Borrowings – (37.1)% (8), (9) | | | | | | | | | | | | | | | (188,600,000 | ) |
| | | | Reverse Repurchase Agreements, including accrued interest – (20.4)% (10) | | | | | | | | (103,887,702 | ) |
| | | | Other Assets Less Liabilities – 1.0% (11) | | | | | | | | | | | | | | | 4,877,233 | |
| | | | Net Assets Applicable to Common Shares – 100% | | | | | | | | | | | | | | $ | 508,829,013 | |
Investments in Derivatives
Futures Contracts – Short
| | | | | | | | | | | | | | | | | | | | |
| Description | | Number of
Contracts | | | Expiration
Date | | | Notional
Amount | | | Value | | | Unrealized
Appreciation
(Depreciation) | |
| U.S. Treasury 5-Year Note | | | (493 | ) | | | 9/22 | | | $ | (55,890,599 | ) | | $ | (56,067,196 | ) | | $ | (176,597 | ) |
64
For Fund portfolio compliance purposes, the Fund’s industry classifications refer to any one or more of the industry sub-classifications used by one or more widely recognized market indexes or ratings group indexes, and/or as defined by Fund management. This definition may not apply for purposes of this report, which may combine industry sub-classifications into sectors for reporting ease.
| (1) | All percentages shown in the Portfolio of Investments are based on net assets applicable to common shares unless otherwise noted. |
| (2) | For financial reporting purposes, the ratings disclosed are the highest of Standard & Poor’s Group (“Standard & Poor’s”), Moody’s Investors Service, Inc. (“Moody’s”) or Fitch, Inc. (“Fitch”) rating. This treatment of split-rated securities may differ from that used for other purposes, such as for Fund investment policies. Ratings below BBB by Standard & Poor’s, Baa by Moody’s or BBB by Fitch are considered to be below investment grade. Holdings designated N/R are not rated by any of these national rating agencies. Ratings are not covered by the report of independent registered public accounting firm. |
| (3) | Perpetual security. Maturity date is not applicable. |
| (4) | Investment, or portion of investment, has been pledged to collateralize the net payment obligations for investments in reverse repurchase agreements. As of the end of the reporting period, investments with a value of $145,022,279 have been pledged as collateral for reverse repurchase agreements. |
| (5) | Variable rate security. The rate shown is the coupon as of the end of the reporting period. |
| (6) | Contingent Capital Securities (“CoCos”) are hybrid securities with loss absorption characteristics built into the terms of the security for the benefit of the issuer. For example, the terms may specify an automatic write-down of principal or a mandatory conversion into the issuer’s common stock under certain adverse circumstances, such as the issuer’s capital ratio falling below a specified level. |
| (7) | For fair value measurement disclosure purposes, investment classified as Level 2. |
| (8) | Borrowings as a percentage of Total Investments is 23.7%. |
| (9) | The Fund may pledge up to 100% of its eligible investments (excluding any investments separately pledged as collateral for specific investments in derivatives, when applicable) in the Portfolio of Investments as collateral for borrowings. As of the end of the reporting period, investments with a value of $395,783,244 have been pledged as collateral for borrowings. |
| (10) | Reverse Repurchase Agreements, including accrued interest as a percentage of Total investments is 13.0%. |
| (11) | Other assets less liabilities includes the unrealized appreciation (depreciation) of certain over-the-counter (“OTC”) derivatives as well as the OTC cleared and exchange-traded derivatives, when applicable. The unrealized appreciation (depreciation) of OTC cleared and exchange-traded derivatives is recognized as part of the cash collateral at brokers and/or the receivable or payable for variation margin as presented on the Statement of Assets and Liabilities, when applicable. |
| 144A | Investment is exempt from registration under Rule 144A of the Securities Act of 1933, as amended. These investments may only be resold in transactions exempt from registration, which are normally those transactions with qualified institutional buyers. |
| LIBOR | London Inter-Bank Offered Rate |
| RegS | Regulation S allows U.S. companies to sell securities to persons or entities located outside of the United States without registering those securities with the Securities and Exchange Commission. Specifically, Regulation S provides a safe harbor from the registration requirements of the Securities Act for the offers and sales of securities by both foreign and domestic issuers that are made outside the United States. |
See accompanying notes to financial statements.
65
Statement of Assets and Liabilities
| | | | | | | | | | | | | | | | | | | | |
| | | JPC | | | JPI | | | JPS | | | JPT | | | NPFD | |
| Assets | | | | | | | | | | | | | | | | | | | | |
| Long-term investments, at value (cost $1,439,517,773, $781,162,580, $2,768,440,441, $144,534,066 and $876,730,281, respectively) | | $ | 1,396,259,035 | | | $ | 756,907,774 | | | $ | 2,685,974,703 | | | $ | 138,761,143 | | | $ | 791,624,511 | |
| Short-term investments, at value (cost approximates value) | | | 4,813,498 | | | | 4,622,286 | | | | 31,360,397 | | | | 194,673 | | | | 4,814,971 | |
| Cash | | | 4,615,537 | | | | — | | | | 969,792 | | | | 25 | | | | — | |
Cash collateral at brokers for investments in futures (1) | | | — | | | | — | | | | — | | | | — | | | | 689,898 | |
| Cash denominated in foreign currencies (cost $—, $—, $163, $— and $—, respectively) | | | — | | | | — | | | | 163 | | | | — | | | | — | |
| Unrealized appreciation on interest rate swaps | | | 2,520,950 | | | | 941,418 | | | | 5,265,234 | | | | — | | | | — | |
| Receivable for: | | | | | | | | | | | | | | | | | | | | |
| Dividends | | | 132,809 | | | | 85,294 | | | | 1,047,244 | | | | 17,159 | | | | 171,672 | |
| Interest | | | 18,461,052 | | | | 9,704,790 | | | | 35,256,590 | | | | 1,917,246 | | | | 10,020,159 | |
| Investments sold | | | 391,121 | | | | — | | | | — | | | | — | | | | — | |
| Reclaims | | | 49,905 | | | | — | | | | — | | | | 1,843 | | | | 28,877 | |
| Deferred offering costs | | | 187,362 | | | | — | | | | 198,422 | | | | — | | | | — | |
| Other assets | | | 360,668 | | | | 82,734 | | | | 929,601 | | | | 6,370 | | | | 5,367 | |
| Total assets | | | 1,427,791,937 | | | | 772,344,296 | | | | 2,761,002,146 | | | | 140,898,459 | | | | 807,355,455 | |
| Liabilities | | | | | | | | | | | | | | | | | | | | |
| Cash overdraft | | | — | | | | 116,096 | | | | — | | | | — | | | | — | |
| Cash collateral due to broker | | | 2,825,673 | | | | 1,055,181 | | | | 5,305,638 | | | | — | | | | — | |
| Borrowings | | | 423,400,000 | | | | 216,000,000 | | | | 499,300,000 | | | | 47,000,000 | | | | 188,600,000 | |
| Reverse repurchase agreements, including accrued interest | | | 102,318,630 | | | | 65,189,978 | | | | 275,588,867 | | | | — | | | | 103,887,702 | |
| Unrealized depreciation on interest rate swaps | | | 249,556 | | | | — | | | | 595,246 | | | | — | | | | — | |
| Payable for: | | | | | | | | | | | | | | | | | | | | |
| Dividends | | | 5,467,089 | | | | 2,937,935 | | | | 8,857,764 | | | | 543,727 | | | | 3,334,099 | |
| Investments purchased – regular settlement | | | 6,969,222 | | | | 1,575,000 | | | | — | | | | 290,000 | | | | 1,650,000 | |
| Offering costs | | | — | | | | — | | | | 576,102 | | | | — | | | | — | |
| Variation margin on futures contracts | | | — | | | | — | | | | — | | | | — | | | | 3,852 | |
| Taxable Fund Preferred (“TFP”) Shares, net of deferred offering costs (liquidation preference $—, $—, $ 270,000,000, $— and $—, respectively) | | | — | | | | — | | | | 268,930,316 | | | | — | | | | — | |
| Accrued expenses: | | | | | | | | | | | | | | | | | | | | |
| Interest | | | 886,725 | | | | 453,254 | | | | 1,277,098 | | | | 9,561 | | | | 324,799 | |
| Management fees | | | 953,633 | | | | 537,538 | | | | 1,730,357 | | | | 68,216 | | | | 611,339 | |
| Trustees fees | | | 342,811 | | | | 67,357 | | | | 658,247 | | | | 6,328 | | | | 8,282 | |
| Shelf offering costs | | | 40,772 | | | | — | | | | 41,761 | | | | — | | | | — | |
| Other | | | 275,788 | | | | 169,839 | | | | 443,953 | | | | 69,280 | | | | 106,369 | |
| Total liabilities | | | 543,729,899 | | | | 288,102,178 | | | | 1,063,305,349 | | | | 47,987,112 | | | | 298,526,442 | |
| Commitments and contingencies (as disclosed in Note 8) | | | | | | | | | | | | | | | | | | | | |
| Net assets applicable to common shares | | $ | 884,062,038 | | | $ | 484,242,118 | | | $ | 1,697,696,797 | | | $ | 92,911,347 | | | $ | 508,829,013 | |
| Common shares outstanding | | | 105,069,232 | | | | 22,772,419 | | | | 205,710,932 | | | | 4,391,624 | | | | 24,164,141 | |
| Net asset value (“NAV”) per common share outstanding | | $ | 8.41 | | | $ | 21.26 | | | $ | 8.25 | | | $ | 21.16 | | | $ | 21.06 | |
| Net assets applicable to common shares consist of: | | | | | | | | | | | | | | | | | | | | |
| Common shares, $0.01 par value per share | | $ | 1,050,692 | | | $ | 227,724 | | | $ | 2,057,109 | | | $ | 43,916 | | | $ | 241,641 | |
| Paid-in-surplus | | | 1,049,253,894 | | | | 537,875,526 | | | | 1,877,845,371 | | | | 111,065,215 | | | | 603,829,711 | |
| Total distributable earnings (loss) | | | (166,242,548 | ) | | | (53,861,132 | ) | | | (182,205,683 | ) | | | (18,197,784 | ) | | | (95,242,339 | ) |
| Net assets applicable to common shares | | $ | 884,062,038 | | | $ | 484,242,118 | | | $ | 1,697,696,797 | | | $ | 92,911,347 | | | $ | 508,829,013 | |
| Authorized shares: | | | | | | | | | | | | | | | | | | | | |
| Common | | | Unlimited | | | | Unlimited | | | | Unlimited | | | | Unlimited | | | | Unlimited | |
| Preferred | | | Unlimited | | | | Unlimited | | | | Unlimited | | | | Unlimited | | | | Unlimited | |
| (1) | Cash pledged to collateralize the net payment obligations for investments in derivatives. |
See accompanying notes to financial statements.
66
| | | | | | | | | | | | | | | | | | | | |
| | | JPC | | | JPI | | | JPS | | | JPT | | | | |
| Investment Income | | | | | | | | | | | | | | | | | | | | |
| Dividends | | $ | 22,544,081 | | | $ | 10,352,481 | | | $ | 21,322,198 | | | $ | 2,606,099 | | | $ | 5,071,899 | |
| Interest | | | 66,182,397 | | | | 36,656,466 | | | | 136,024,336 | | | | 6,997,733 | | | | 16,451,030 | |
| Rehypothecation income | | | 74,994 | | | | 68,003 | | | | 255,820 | | | | — | | | | — | |
| Total investment income | | | 88,801,472 | | | | 47,076,950 | | | | 157,602,354 | | | | 9,603,832 | | | | 21,522,929 | |
| Expenses | | | | | | | | | | | | | | | | | | | | |
| Management fees | | | 12,434,968 | | | | 7,008,448 | | | | 23,760,225 | | | | 1,565,270 | | | | 4,441,428 | |
| Interest expense and amortization of offering costs | | | 6,937,616 | | | | 3,692,626 | | | | 13,603,119 | | | | 560,206 | | | | 2,456,257 | |
| Liquidity fees | | | — | | | | — | | | | 130,623 | | | | — | | | | — | |
| Remarketing fees | | | — | | | | — | | | | 13,500 | | | | — | | | | — | |
| Custodian fees | | | 181,605 | | | | 106,131 | | | | 339,879 | | | | 30,157 | | | | 72,529 | |
| Trustees fees | | | 46,100 | | | | 24,892 | | | | 89,440 | | | | 10,417 | | | | 22,004 | |
| Professional fees | | | 141,601 | | | | 78,050 | | | | 231,570 | | | | 124,905 | | | | 56,239 | |
| Shareholder reporting expenses | | | 149,909 | | | | 69,325 | | | | 296,493 | | | | 25,920 | | | | 19,687 | |
| Shareholder servicing agent fees | | | 2,241 | | | | 648 | | | | 4,802 | | | | 1,398 | | | | 108 | |
| Stock exchange listing fees | | | 30,670 | | | | 7,211 | | | | 60,279 | | | | 7,175 | | | | — | |
| Investor relations expenses | | | 49,508 | | | | 27,521 | | | | 101,871 | | | | 6,214 | | | | 22,860 | |
| Other | | | 27,380 | | | | 15,607 | | | | 34,331 | | | | 10,514 | | | | 3,085 | |
| Total expenses before expense reimbursement | | | 20,001,598 | | | | 11,030,459 | | | | 38,666,132 | | | | 2,342,176 | | | | 7,094,197 | |
| Expense reimbursement | | | — | | | | — | | | | — | | | | (254,914 | ) | | | — | |
| Net expenses | | | 20,001,598 | | | | 11,030,459 | | | | 38,666,132 | | | | 2,087,262 | | | | 7,094,197 | |
| Net investment income (loss) | | | 68,799,874 | | | | 36,046,491 | | | | 118,936,222 | | | | 7,516,570 | | | | 14,428,732 | |
| Realized and Unrealized Gain (Loss) | | | | | | | | | | | | | | | | | | | | |
| Net realized gain (loss) from: | | | | | | | | | | | | | | | | | | | | |
| Investments and foreign currency | | | (14,551,968 | ) | | | (2,694,347 | ) | | | 10,651,214 | | | | (1,075,211 | ) | | | (5,398,457 | ) |
| Futures contracts | | | 1,713,691 | | | | 1,612,854 | | | | — | | | | 265,502 | | | | 985,489 | |
| Swaps | | | (5,165,009 | ) | | | (2,649,333 | ) | | | (10,105,705 | ) | | | — | | | | — | |
| Change in net unrealized appreciation (depreciation) of: | | | | | | | | | | | | | | | | | | | | |
| Investments and foreign currency | | | (170,838,823 | ) | | | (99,769,575 | ) | | | (393,846,791 | ) | | | (19,958,013 | ) | | | (85,105,770 | ) |
| Futures contracts | | | 896,503 | | | | 844,887 | | | | — | | | | 138,551 | | | | (176,597 | ) |
| Swaps | | | 29,067,374 | | | | 8,472,981 | | | | 54,965,989 | | | | — | | | | — | |
| Net realized and unrealized gain (loss) | | | (158,878,232 | ) | | | (94,182,533 | ) | | | (338,335,293 | ) | | | (20,629,171 | ) | | | (89,695,335 | ) |
| Net increase (decrease) in net assets applicable to common shares from operations | | $ | (90,078,358 | ) | | $ | (58,136,042 | ) | | $ | (219,399,071 | ) | | $ | (13,112,601 | ) | | $ | (75,266,603 | ) |
| (1) | For the period December 15, 2021 (commencement of operations) through July 31, 2022. |
See accompanying notes to financial statements.
67
Statement of Changes in Net Assets
| | | | | | | | | | | | | | | | |
| | | JPC | | | JPI | |
| | | Year
Ended
7/31/22 | | | Year
Ended
7/31/21 | | | Year
Ended
7/31/22 | | | Year
Ended
7/31/21 | |
| Operations | | | | | | | | | | | | | | | | |
| Net investment income (loss) | | $
| 68,799,874
|
| | $ | 69,111,496 | | | $
| 36,046,491
|
| | $ | 37,498,387 | |
| Net realized gain (loss) from: | | | | | | | | | | | | | | | | |
| Investments and foreign currency | |
| (14,551,968
| )
| | | 8,606,310 | | |
| (2,694,347
| )
| | | 8,849,056 | |
| Futures contracts | |
| 1,713,691
|
| | | 1,062,326 | | |
| 1,612,854
|
| | | 976,904 | |
| Swaps | |
| (5,165,009
| )
| | | (6,217,126 | ) | |
| (2,649,333
| )
| | | (2,991,949 | ) |
| Change in net unrealized appreciation (depreciation) of: | | | | | | | | | | | | | | | | |
| Investments and foreign currency | |
| (170,838,823
| )
| | | 90,072,375 | | |
| (99,769,575
| )
| | | 54,551,734 | |
| Futures contracts | |
| 896,503
|
| | | (526,263 | ) | |
| 844,887
|
| | | (506,715 | ) |
| Swaps | |
| 29,067,374
|
| | | 15,312,751 | | |
| 8,472,981
|
| | | 3,970,105 | |
| Net increase (decrease) in net assets applicable to common shares from operations | |
| (90,078,358
| )
| | | 177,421,869 | | |
| (58,136,042
| )
| | | 102,347,522 | |
| Distributions to Common Shareholders | | | | | | | | | | | | | | | | |
| Dividends | |
| (66,660,132
| )
| | | (65,752,057 | ) | |
| (35,659,439
| )
| | | (35,645,968 | ) |
| Decrease in net assets applicable to common shares from distributions to common shareholders | |
| (66,660,132
| )
| | | (65,752,057 | ) | |
| (35,659,439
| )
| | | (35,645,968 | ) |
| Capital Share Transactions | | | | | | | | | | | | | | | | |
| Common shares: | | | | | | | | | | | | | | | | |
| Proceeds from shelf offering, net of offering costs | | | 11,703,948 | | | | 4,757,224 | | | | — | | | | — | |
| Proceeds from sale of shares | | | — | | | | — | | | | — | | | | — | |
| Net proceeds from shares issued to shareholders due to reinvestment of distributions | | | 382,390 | | | | 93,796 | | |
| 154,363
|
| | | 122,141 | |
| Cost of shares repurchased and retired through tender offer | | | — | | | | — | | | | — | | | | — | |
| Net increase (decrease) in net assets applicable to common shares from capital share transactions | | | 12,086,338 | | | | 4,851,020 | | |
| 154,363
|
| | | 122,141 | |
| Net increase (decrease) in net assets applicable to common shares | |
| (144,652,152
| )
| | | 116,520,832 | | |
| (93,641,118
| )
| | | 66,823,695 | |
| Net assets applicable to common shares at the beginning of period | | $
| 1,028,714,190
|
| | $ | 912,193,358 | | | $
| 577,883,236
|
| | $ | 511,059,541 | |
| Net assets applicable to common shares at the end of period | | $
| 884,062,038
|
| | $ | 1,028,714,190 | | | $
| 484,242,118
|
| | $ | 577,883,236 | |
See accompanying notes to financial statements.
68
| | | | | | | | | | | | | | | | |
| | | JPS | | | JPT | |
| | | Year
Ended
7/31/22 | | | Year
Ended
7/31/21 | | | Year
Ended
7/31/22 | | | Year
Ended
7/31/21 | |
| Operations | | | | | | | | | | | | | | | | |
| Net investment income (loss) | | $
| 118,936,222
|
| | $ | 127,664,148 | | | $
| 7,516,570
|
| | $ | 8,952,095 | |
| Net realized gain (loss) from: | | | | | | | | | | | | | | | | |
| Investments and foreign currency | |
| 10,651,214
|
| | | 19,722,013 | | |
| (1,075,211
| )
| | | 771,145 | |
| Futures contracts | | | — | | | | — | | |
| 265,502
|
| | | 232,378 | |
| Swaps | |
| (10,105,705
| )
| | | (11,669,868 | ) | | | — | | | | — | |
| Change in net unrealized appreciation (depreciation) of: | | | | | | | | | | | | | | | | |
| Investments and foreign currency | |
| (393,846,791
| )
| | | 131,150,023 | | |
| (19,958,013
| )
| | | 14,886,835 | |
| Futures contracts | | | — | | | | — | | |
| 138,551
|
| | | (54,008 | ) |
| Swaps | |
| 54,965,989
|
| | | 28,742,497 | | | | — | | | | — | |
| Net increase (decrease) in net assets applicable to common shares from operations | |
| (219,399,071
| )
| | | 295,608,813 | | |
| (13,112,601
| )
| | | 24,788,445 | |
| Distributions to Common Shareholders | | | | | | | | | | | | | | | | |
| Dividends | |
| (121,278,321
| )
| | | (123,552,214 | ) | |
| (8,310,452
| )
| | | (9,728,671 | ) |
| Decrease in net assets applicable to common shares from distributions to common shareholders | |
| (121,278,321
| )
| | | (123,552,214 | ) | |
| (8,310,452
| )
| | | (9,728,671 | ) |
| Capital Share Transactions | | | | | | | | | | | | | | | | |
| Common shares: | | | | | | | | | | | | | | | | |
| Proceeds from shelf offering, net of offering costs | | | 9,114,000 | | | | 9,215,446 | | | | — | | | | — | |
| Proceeds from sale of shares | | | — | | | | — | | | | — | | | | — | |
| Net proceeds from shares issued to shareholders due to reinvestment of distributions | | | 287,954 | | | | 466,698 | | | | 54,398 | | | | 118,396 | |
| Cost of shares repurchased and retired through tender offer | | | — | | | | — | | | | (57,097,582 | ) | | | — | |
| Net increase (decrease) in net assets applicable to common shares from capital share transactions | | | 9,401,954 | | | | 9,682,144 | | |
| (57,043,184
| )
| | | 118,396 | |
| Net increase (decrease) in net assets applicable to common shares | |
| (331,275,438
| )
| | | 181,738,743 | | |
| (78,466,237
| )
| | | 15,178,170 | |
| Net assets applicable to common shares at the beginning of period | | $
| 2,028,972,235
|
| | $ | 1,847,233,492 | | | $
| 171,377,584
|
| | $ | 156,199,414 | |
| Net assets applicable to common shares at the end of period | | $
| 1,697,696,797
|
| | $ | 2,028,972,235 | | | $
| 92,911,347
|
| | $ | 171,377,584 | |
See accompanying notes to financial statements.
69
Statement of Changes in Net Assets
(continued)
| | | | |
| | | NPFD | |
| | | For the period 12/15/2021
(commencement of operations)
through 7/31/2022 | |
| Operations | | | | |
| Net investment income (loss) | | $ | 14,428,732 | |
| Net realized gain (loss) from: | | | | |
| Investments and foreign currency | | | (5,398,457 | ) |
| Futures contracts | | | 985,489 | |
| Swaps | | | — | |
| Change in net unrealized appreciation (depreciation) of: | | | | |
| Investments and foreign currency | | | (85,105,770 | ) |
| Futures contracts | | | (176,597 | ) |
| Swaps | | | — | |
| Net increase (decrease) in net assets applicable to common shares from operations | | | (75,266,603 | ) |
| Distributions to Common Shareholders | | | | |
| Dividends | | | (20,007,909 | ) |
| Decrease in net assets applicable to common shares from distributions to common shareholders | | | (20,007,909 | ) |
| Capital Share Transactions | | | | |
| Common shares: | | | | |
| Proceeds from shelf offering, net of offering costs | | | — | |
| Proceeds from sale of shares | | | 604,003,525 | |
| Net proceeds from shares issued to shareholders due to reinvestment of distributions | | | — | |
| Cost of shares repurchased and retired through tender offer | | | — | |
| Net increase (decrease) in net assets applicable to common shares from capital share transactions | | | 604,003,525 | |
| Net increase (decrease) in net assets applicable to common shares | | | 508,729,013 | |
| Net assets applicable to common shares at the beginning of period | | $ | 100,000 | |
| Net assets applicable to common shares at the end of period | | $ | 508,829,013 | |
See accompanying notes to financial statements.
70
| | | | | | | | | | | | | | | | | | | | |
| | | JPC | | | JPI | | | JPS | | | JPT | | | | |
| Cash Flows from Operating Activities: | | | | | | | | | | | | | | | | | | | | |
| Net Increase (Decrease) in Net Assets Applicable to Common Shares from Operations | | $ | (90,078,358 | ) | | $ | (58,136,042 | ) | | $ | (219,399,071 | ) | | $ | (13,112,601 | ) | | $ | (75,266,603 | ) |
| Adjustments to reconcile the net increase (decrease) in net assets applicable to common shares from operations to net cash provided by (used in) operating activities: | | | | | | | | | | | | | | | | | | | | |
| Purchases of investments | | | (1,065,218,624 | ) | | | (76,350,812 | ) | | | (341,330,102 | ) | | | (60,041,463 | ) | | | (957,552,596 | ) |
| Proceeds from sales and maturities of investments | | | 1,088,424,268 | | | | 85,146,382 | | | | 440,401,303 | | | | 116,802,842 | | | | 68,477,715 | |
| Proceeds from (Purchase of) short-term investments, net | | | 19,933,857 | | | | (2,369,571 | ) | | | 3,298,646 | | | | 533,888 | | | | (4,814,971 | ) |
| Proceeds from litigation settlement | | | 223,196 | | | | — | | | | 237,302 | | | | — | | | | — | |
| Taxes paid | | | — | | | | — | | | | — | | | | (529 | ) | | | (32,173 | ) |
| Amortization (Accretion) of premiums and discounts, net | | | 3,668,317 | | | | 2,843,590 | | | | 11,330,148 | | | | 1,056,898 | | | | 6,978,316 | |
| Amortization of deferred offering costs | | | — | | | | — | | | | 20,316 | | | | — | | | | — | |
| (Increase) Decrease in: | | | | | | | | | | | | | | | | | | | | |
| Receivable for dividends | | | 94,200 | | | | 4,754 | | | | (25,219 | ) | | | 3,040 | | | | (171,672 | ) |
| Receivable for interest | | | (1,230,690 | ) | | | (16,190 | ) | | | 3,170,807 | | | | 172,853 | | | | (10,020,159 | ) |
| Receivable for investments sold | | | (391,121 | ) | | | — | | | | 196,740 | | | | — | | | | — | |
| Receivable for reclaims | | | 42 | | | | 39 | | | | — | | | | (1,843 | ) | | | (28,877 | ) |
| Receivable for shares sold | | | 563,167 | | | | — | | | | 1,541,350 | | | | — | | | | — | |
| Other assets | | | 43,553 | | | | (5,746 | ) | | | (149,856 | ) | | | (6,126 | ) | | | (5,367 | ) |
| Increase (Decrease) in: | | | | | | | | | | | | | | | | | | | | |
| Payable for Investments purchased – regular settlement | | | (464,661 | ) | | | (2,774,033 | ) | | | (24,683,125 | ) | | | (770,000 | ) | | | 1,650,000 | |
| Payable for offering costs | | | — | | | | — | | | | 576,102 | | | | — | | | | — | |
| Payable for variation margin on futures contracts | | | (77,344 | ) | | | (72,891 | ) | | | — | | | | (11,953 | ) | | | 3,852 | |
| Accrued management fees | | | (147,238 | ) | | | (84,286 | ) | | | (398,224 | ) | | | (89,818 | ) | | | 611,339 | |
| Accrued interest | | | 686,393 | | | | 427,965 | | | | 1,050,368 | | | | 7,417 | | | | 810,501 | |
| Accrued Trustees fees | | | (56,315 | ) | | | (7,693 | ) | | | (107,089 | ) | | | 4,639 | | | | 8,282 | |
| Accrued shelf offering costs | | | (24,244 | ) | | | — | | | | (5,826 | ) | | | — | | | | — | |
| Accrued other expenses | | | (56,733 | ) | | | (37,709 | ) | | | (94,184 | ) | | | (27,962 | ) | | | 106,369 | |
| Net realized (gain) loss from investments and foreign currency | | | 14,551,968 | | | | 2,694,347 | | | | (10,651,214 | ) | | | 1,075,211 | | | | 5,398,457 | |
| Change in net unrealized (appreciation) depreciation of: | | | | | | | | | | | | | | | | | | | | |
| Investments and foreign currency | | | 170,838,823 | | | | 99,769,575 | | | | 393,846,791 | | | | 19,958,013 | | | | 85,105,770 | |
| Swaps | | | (29,067,374 | ) | | | (8,472,981 | ) | | | (54,965,989 | ) | | | — | | | | — | |
| Net cash provided by (used in) operating activities | | | 112,215,082 | | | | 42,558,698 | | | | 203,859,974 | | | | 65,552,506 | | | | (878,741,817 | ) |
| Cash Flow from Financing Activities: | | | | | | | | | | | | | | | | | | | | |
| Proceeds from TFP shares issued, at liquidation preference | | | — | | | | — | | | | 270,000,000 | | | | — | | | | — | |
| Proceeds from borrowings | | | 10,700,000 | | | | 1,200,000 | | | | — | | | | — | | | | 210,200,000 | |
| (Repayments of) borrowings | | | (50,000,000 | ) | | | (20,000,000 | ) | | | (374,000,000 | ) | | | — | | | | (21,600,000 | ) |
| Proceeds from reverse repurchase agreements | | | 3,500,000 | | | | 8,500,000 | | | | — | | | | — | | | | 120,000,000 | |
| (Repayments of) reverse repurchase agreements | | | (22,400,000 | ) | | | — | | | | — | | | | — | | | | (16,598,000 | ) |
| Proceeds from shelf offering, net of offering costs | | | 11,705,923 | | | | — | | | | 9,114,930 | | | | — | | | | — | |
| Proceeds from sale of shares | | | | | | | | | | | | | | | | | | | 604,003,525 | |
| (Payments for) deferred offering costs | | | — | | | | — | | | | (1,090,000 | ) | | | — | | | | — | |
| Increase (Decrease) in cash overdraft | | | — | | | | 116,096 | | | | — | | | | (34,712 | ) | | | — | |
| Increase (Decrease) in cash collateral due to broker | | | 2,825,673 | | | | 1,055,181 | | | | 5,305,638 | | | | — | | | | — | |
| Cash distributions paid to common shareholders | | | (66,209,883 | ) | | | (35,509,936 | ) | | | (122,350,431 | ) | | | (8,505,212 | ) | | | (16,673,810 | ) |
| Cost of common shares repurchased and retired through tender offer | | | — | | | | — | | | | — | | | | (57,097,582 | ) | | | — | |
| Net cash provided by (used in) financing activities | | | (109,878,287 | ) | | | (44,638,659 | ) | | | (213,019,863 | ) | | | (65,637,506 | ) | | | 879,331,715 | |
| Net Increase (Decrease) in Cash, cash denominated in foreign currencies and Cash Collateral at Brokers | | | 2,336,795 | | | | (2,079,961 | ) | | | (9,159,889 | ) | | | (85,000 | ) | | | 589,898 | |
| Cash, cash denominated in foreign currencies and cash collateral at brokers at the beginning of period | | | 2,278,742 | | | | 2,079,961 | | | | 10,129,844 | | | | 85,025 | | | | 100,000 | |
| Cash, cash denominated in foreign currencies and cash collateral at brokers at the end of period | | $ | 4,615,537 | | | $ | — | | | $ | 969,955 | | | $ | 25 | | | $ | 689,898 | |
The following table provides a reconciliation of cash and cash collateral at brokers to the statement of assets and liabilities:
| | | | | | | | | | | | | | | | | | | | |
| | | JPC | | | JPI | | | JPS | | | JPT | | | | |
| Cash | | $ | 4,615,537 | | | $ | — | | | $ | 969,792 | | | $ | 25 | | | $ | — | |
| Cash denominated in foreign currencies | | | — | | | | — | | | | 163 | | | | — | | | | — | |
| Cash collateral at brokers for investments in futures | | | — | | | | — | | | | — | | | | — | | | | 689,898 | |
| Total cash, cash denominated in foreign currencies and cash collateral at brokers | | $ | 4,615,537 | | | $ | — | | | $ | 969,955 | | | $ | 25 | | | $ | 689,898 | |
| | | | | |
| Supplemental Disclosure of Cash Flow Information | | | | | | | | | | | | | | | |
| Cash paid for interest (excluding amortization of offering costs) | | $ | 6,247,880 | | | $ | 3,250,862 | | | $ | 12,541,706 | | | $ | 552,268 | | | $ | 1,645,756 | |
| Non-cash financing activities not included herein consists of reinvestments of common share distributions | | | 382,390 | | | | 154,363 | | | | 287,954 | | | | 54,398 | | | | — | |
| (1) | For the period December 15, 2021 (commencement of operations) through July 31, 2022. |
See accompanying notes to financial statements.
71
Selected data for a share outstanding throughout each period:
| | | | | | | | | | | | | | | | | | | | | | | | | | | | | | | | | | | | | | | | | | | | | | | | |
| | | | |
| | | | | |
Investment Operations | | | Less Distributions to
Common Shareholders | | | Common Share | |
| | | Beginning
Common
Share
NAV | | | Net
Investment
Income
(Loss)(a) | | | Net
Realized/
Unrealized
Gain (Loss) | | | Total | | | From
Net
Investment
Income | | | From
Accumulated
Net
Realized
Gains | | | Return
of
Capital | | | Total | | | Premium from
Shares Sold
through Shelf
Offering | | | Shelf Offering
Costs | | | Ending
NAV | | | Ending
Share
Price | |
| | | | | | | |
| JPC | | | | | | | | | | | | | | | | | | | | | | | | | | | | | |
| | | | | | | | | | |
| Year Ended 7/31: | | | | | | | | | | | | | | | | | | | | | | | | | | | | | | | | | | | | | | | | | |
| 2022 | | $ | 9.91 | | | $ | 0.66 | | | $ | (1.52 | ) | | $ | (0.86 | ) | | $ | (0.64 | ) | | $ | — | | | $ | — | | | $ | (0.64 | ) | | $ | — | * | | $ | — | * | | $ | 8.41 | | | $ | 8.20 | |
| 2021 | | | 8.83 | | | | 0.67 | | | | 1.05 | | | | 1.72 | | | | (0.64 | ) | | | — | | | | — | | | | (0.64 | ) | | | — | * | | | — | * | | | 9.91 | | | | 10.00 | |
| 2020 | | | 10.14 | | | | 0.65 | | | | (1.26 | ) | | | (0.61 | ) | | | (0.68 | ) | | | — | | | | (0.02 | ) | | | (0.70 | ) | | | — | | | | — | | | | 8.83 | | | | 8.81 | |
| 2019 | | | 10.16 | | | | 0.70 | | | | 0.01 | | | | 0.71 | | | | (0.70 | ) | | | — | | | | (0.03 | ) | | | (0.73 | ) | | | — | | | | — | | | | 10.14 | | | | 9.91 | |
| 2018 | | | 10.87 | | | | 0.76 | | | | (0.70 | ) | | | 0.06 | | | | (0.77 | ) | | | — | | | | — | * | | | (0.77 | ) | | | — | | | | — | | | | 10.16 | | | | 9.44 | |
|
| JPI | |
|
| Year Ended 7/31: | |
| 2022 | | | 25.38 | | | | 1.58 | | | | (4.13 | ) | | | (2.55 | ) | | | (1.57 | ) | | | — | | | | — | | | | (1.57 | ) | | | — | | | | — | | | | 21.26 | | | | 20.51 | |
| 2021 | | | 22.45 | | | | 1.65 | | | | 2.85 | | | | 4.50 | | | | (1.57 | ) | | | — | | | | — | | | | (1.57 | ) | | | — | | | | — | | | | 25.38 | | | | 26.26 | |
| 2020 | | | 24.67 | | | | 1.59 | | | | (2.20 | ) | | | (0.61 | ) | | | (1.57 | ) | | | — | | | | (0.04 | ) | | | (1.61 | ) | | | — | | | | — | | | | 22.45 | | | | 22.20 | |
| 2019 | | | 24.39 | | | | 1.64 | | | | 0.27 | | | | 1.91 | | | | (1.61 | ) | | | — | | | | (0.02 | ) | | | (1.63 | ) | | | — | | | | — | | | | 24.67 | | | | 24.27 | |
| 2018 | | | 25.97 | | | | 1.66 | | | | (1.55 | ) | | | 0.11 | | | | (1.62 | ) | | | — | | | | (0.07 | ) | | | (1.69 | ) | | | — | | | | — | | | | 24.39 | | | | 23.13 | |
| (a) | Per share Net Investment Income (Loss) is calculated using the average daily shares method. |
| (b) | Total Return Based on Common Share NAV is the combination of changes in common share NAV, reinvested dividend income at NAV and reinvested capital gains distributions at NAV, if any. The last dividend declared in the period, which is typically paid on the first business day of the following month, is assumed to be reinvested at the ending NAV. The actual reinvest price for the last dividend declared in the period may often be based on the Fund’s market price (and not its NAV), and therefore may be different from the price used in the calculation. Total returns are not annualized. |
| | Total Return Based on Common Share Price is the combination of changes in the market price per share and the effect of reinvested dividend income and reinvested capital gains distributions, if any, at the average price paid per share at the time of reinvestment. The last dividend declared in the period, which is typically paid on the first business day of the following month, is assumed to be reinvested at the ending market price. The actual reinvestment for the last dividend declared in the period may take place over several days, and in some instances may not be based on the market price, so the actual reinvestment price may be different from the price used in the calculation. Total returns are not annualized. |
72
| | | | | | | | | | | | | | | | | | | | | | |
| | | | | | | Common Share Supplemental Data/
Ratios Applicable to Common Shares | |
Common Share
Total Returns | | | | | | Ratios to Average Net Assets(c) | | | | |
Based
on
NAV(b) | | |
Based
on
Share
Price(b) | | | Ending
Net Assets
(000) | | | Expenses | | | Net
Investment
Income (Loss) | | | Portfolio
Turnover
Rate(d) | |
| | | | | |
| | | | | | | | | | | | | | | | | | | | | | | |
| | | | | |
| | | | | | | | | | | | | | | | | | | | | | |
| | (9.05 | )% | | | (11.91 | )% | | $ | 884,062 | | | | 2.06 | % | | | 7.10 | % | | | 71 | % |
| | 19.93 | | | | 21.55 | | | | 1,028,714 | | | | 1.81 | | | | 7.02 | | | | 23 | |
| | (6.16 | ) | | | (4.12 | ) | | | 912,193 | | | | 2.50 | | | | 6.87 | | | | 32 | |
| | 7.48 | | | | 13.52 | | | | 1,047,925 | | | | 3.04 | | | | 7.10 | | | | 23 | |
| | 0.57 | | | | (3.76 | ) | | | 1,049,894 | | | | 2.59 | | | | 7.19 | | | | 29 | |
| | | | | |
| | | | | | | | | | | | | | | | | | | | | | | |
| | | | | |
| | | | | | | | | | | | | | | | | | | | | | |
| | (10.41 | ) | | | (16.35 | ) | | | 484,242 | | | | 2.06 | | | | 6.75 | | | | 9 | |
| | 20.54 | | | | 26.22 | | | | 577,883 | | | | 1.76 | | | | 6.79 | | | | 23 | |
| | (2.50 | ) | | | (1.93 | ) | | | 511,060 | | | | 2.34 | | | | 6.75 | | | | 34 | |
| | 8.29 | | | | 12.79 | | | | 561,523 | | | | 2.72 | | | | 6.90 | | | | 27 | |
| | 0.37 | | | | (1.40 | ) | | | 555,058 | | | | 2.22 | | | | 6.56 | | | | 26 | |
| (c) • | Net Investment Income (Loss) ratios reflect income earned and expenses incurred on assets attributable to borrowings and/or reverse repurchase agreements (as described in Note 9 – Borrowing Arrangements and Reverse Repurchase Agreements, where applicable. |
| | • | Each ratio includes the effect of all interest expenses paid and other costs related to borrowings and/or reverse repurchase agreements, where applicable, as follows: |
| | | | |
| | | Ratios of Interest Expense
to Average Net Assets Applicable
to Common Shares | |
| JPC | | | | |
| Year Ended 7/31: | |
| 2022 | | | 0.72 | % |
| 2021 | | | 0.49 | |
| 2020 | | | 1.17 | |
| 2019 | | | 1.73 | |
| 2018 | | | 1.29 | |
| | | | |
| | | Ratios of Interest Expense
to Average Net Assets Applicable
to Common Shares | |
| JPI | | | | |
| Year Ended 7/31: | |
| 2022 | | | 0.69 | % |
| 2021 | | | 0.44 | |
| 2020 | | | 1.01 | |
| 2019 | | | 1.43 | |
| 2018 | | | 0.97 | |
| (d) | Portfolio Turnover Rate is calculated based on the lesser of long-term purchases or sales (as disclosed in Note 4 – Portfolio Securities and Investments in Derivatives) divided by the average long-term market value during the period. |
See accompanying notes to financial statements.
73
Selected data for a share outstanding throughout each period:
| | | | | | | | | | | | | | | | | | | | | | | | | | | | | | | | | | | | | | | | | | | | | | | | | | | | |
| | | |
| | | | Investment Operations | | | Less Distributions to
Common Shareholders | | | Common Share | |
| | | Beginning
Common
Share
NAV | | | Net
Investment
Income
(Loss)(a) | | | Net
Realized/
Unrealized
Gain (Loss) | | | Total | | | From
Net
Investment
Income | | | From
Accumulated
Net Realized
Gains | | | Return
of
Capital | | | Total | | | Discount
Per Share
Repurchased
and Retired | | | Shelf Offering
Costs | | | Premium from
Shares
Sold
through
Shelf
Offering | | | Ending
NAV | | | Ending Share Price | |
|
| JPS | |
|
| Year Ended 7/31: | |
| 2022 | | $ | 9.91 | | | $ | 0.58 | | | $ | (1.65 | ) | | $ | (1.07 | ) | | $ | (0.59 | ) | | $
| —
|
| | $ | — | | | $ | (0.59 | ) | | $ | — | | | $ | — | * | | $ | — | * | | $ | 8.25 | | | $ | 7.77 | |
| 2021 | | | 9.06 | | | | 0.63 | | | | 0.83 | | | | 1.46 | | | | (0.61 | ) | | | — | | | | — | | | | (0.61 | ) | | | — | | | | — | * | | | — | * | | | 9.91 | | | | 10.02 | |
| 2020 | | | 9.84 | | | | 0.63 | | | | (0.76 | ) | | | (0.13 | ) | | | (0.60 | ) | | | — | | | | (0.05 | ) | | | (0.65 | ) | | | — | | | | — | | | | — | | | | 9.06 | | | | 9.07 | |
| 2019 | | | 9.73 | | | | 0.66 | | | | 0.12 | | | | 0.78 | | | | (0.66 | ) | | | — | | | | (0.01 | ) | | | (0.67 | ) | | | — | * | | | — | | | | — | | | | 9.84 | | | | 9.79 | |
| 2018 | | | 10.39 | | | | 0.69 | | | | (0.62 | ) | | | 0.07 | | | | (0.73 | ) | | | — | | | | — | | | | (0.73 | ) | | | — | | | | — | | | | — | | | | 9.73 | | | | 8.94 | |
| | | | | | | | | | | | | |
| JPT | | | | | | | | | | | | | | | | | | | | | | | | | | | | | | | | | | | | | | | | | | | | | | | | | | | | |
|
| Year Ended 7/31: | |
| 2022 | | | 25.04 | | | | 1.30 | | | | (3.68 | ) | | | (2.38 | ) | |
| (1.50
| )
| | | — | | | | — | | |
| (1.50
| )
| | | — | | | | — | | | | — | | | | 21.16 | | | | 20.26 | |
| 2021 | | | 22.84 | | | | 1.31 | | | | 2.31 | | | | 3.62 | | | | (1.42 | ) | | | — | | | | — | | | | (1.42 | ) | | | — | | | | — | | | | — | | | | 25.04 | | | | 25.45 | |
| 2020 | | | 24.24 | | | | 1.29 | | | | (1.27 | ) | | | 0.02 | | | | (1.42 | ) | | | — | | | | — | | | | (1.42 | ) | | | — | | | | — | | | | — | | | | 22.84 | | | | 23.20 | |
| 2019 | | | 23.89 | | | | 1.36 | | | | 0.41 | | | | 1.77 | | | | (1.42 | ) | | | — | | | | — | | | | (1.42 | ) | | | — | | | | — | | | | — | | | | 24.24 | | | | 23.90 | |
| 2018 | | | 25.62 | | | | 1.44 | | | | (1.66 | ) | | | (0.22 | ) | | | (1.51 | ) | | | — | | | | — | | | | (1.51 | ) | | | — | | | | — | | | | — | | | | 23.89 | | | | 23.17 | |
| (a) | Per share Net Investment Income (Loss) is calculated using the average daily shares method. |
| (b) | Total Return Based on Common Share NAV is the combination of changes in common share NAV, reinvested dividend income at NAV and reinvested capital gains distributions at NAV, if any. The last dividend declared in the period, which is typically paid on the first business day of the following month, is assumed to be reinvested at the ending NAV. The actual reinvest price for the last dividend declared in the period may often be based on the Fund’s market price (and not its NAV), and therefore may be different from the price used in the calculation. Total returns are not annualized. |
| | Total Return Based on Common Share Price is the combination of changes in the market price per share and the effect of reinvested dividend income and reinvested capital gains distributions, if any, at the average price paid per share at the time of reinvestment. The last dividend declared in the period, which is typically paid on the first business day of the following month, is assumed to be reinvested at the ending market price. The actual reinvestment for the last dividend declared in the period may take place over several days, and in some instances may not be based on the market price, so the actual reinvestment price may be different from the price used in the calculation. Total returns are not annualized. |
74
| | | | | | | | | | | | | | | | | | | | | | | | | | |
| | | | | | | Common Share Supplemental Data/
Ratios Applicable to Common Shares | |
Common Share
Total Returns | | | | | | Ratios to Average Net Assets(c) | | | | |
Based
on
NAV(b) | | |
Based
on
Share
Price(b) | | | Ending
Net Assets
(000) | | | Expenses
Before
Reimbursement | | | Expenses After
Reimbursement(d) | | | Net
Investment
Income (Loss)(d) | | | Portfolio
Turnover
Rate(e) | |
| | | | | | |
| | | | | | | | | | | | | | | | | | | | | | | | | | | |
| | | | | | |
| | | | | | | | | | | | | | | | | | | | | | | | | | |
| | (11.16 | )% | | | (17.04 | )% | | $ | 1,697,697 | | | | 2.06 | % | | | N/A | % | | | 6.33 | % | | | 12 | % |
| | 16.45 | | | | 17.75 | | | | 2,028,972 | | | | 1.78 | | | | N/A | | | | 6.51 | | | | 14 | |
| | (1.29 | ) | | | (0.59 | ) | | | 1,847,233 | | | | 2.44 | | | | N/A | | | | 6.73 | | | | 24 | |
| | 8.53 | | | | 18.01 | | | | 2,004,447 | | | | 3.02 | | | | N/A | | | | 6.91 | | | | 16 | |
| | 0.66 | | | | (6.43 | ) | | | 1,982,910 | | | | 2.48 | | | | N/A | | | | 6.77 | | | | 13 | |
| | | | | | |
| | | | | | | | | | | | | | | | | | | | | | | | | | | |
| | | | | | |
| | | | | | | | | | | | | | | | | | | | | | | | | | |
| | (9.81 | ) | | | (14.88 | ) | | | 92,911 | | | | 1.72 | | | | 1.53 | | | | 5.33 | | | | 34 | |
| | 16.25 | | | | 16.33 | | | | 171,378 | | | | 1.37 | | | | N/A | | | | 5.42 | | | | 28 | |
| | 0.15 | | | | 3.18 | | | | 156,199 | | | | 1.71 | | | | N/A | | | | 5.52 | | | | 22 | |
| | 7.76 | | | | 9.78 | | | | 165,623 | | | | 2.00 | | | | N/A | | | | 5.83 | | | | 26 | |
| | (0.84 | ) | | | (2.36 | ) | | | 163,238 | | | | 1.77 | | | | N/A | | | | 5.82 | | | | 28 | |
| (c) • | Net Investment Income (Loss) ratios reflect income earned and expenses incurred on assets attributable to preferred shares (as described in Note 5 – Fund Shares) and/or borrowings and/or reverse repurchase agreements (as described in Note 9 – Borrowing Arrangements and Reverse Repurchase Agreements, where applicable. |
| | • | Each ratio includes the effect of all interest expenses paid and other costs related to preferred shares and/or borrowings and/or reverse repurchase agreements, where applicable, as follows: |
| | | | |
| | | Ratios of Interest Expense
to Average Net Assets Applicable
to Common Shares | |
| JPS | | | | |
| Year Ended 7/31: | |
| 2022 | | | 0.73 | % |
| 2021 | | | 0.49 | |
| 2020 | | | 1.14 | |
| 2019 | | | 1.73 | |
| 2018 | | | 1.22 | |
| | | | |
| | | Ratios of Interest Expense
to Average Net Assets Applicable
to Common Shares | |
| JPT | | | | |
| Year Ended 7/31: | |
| 2022 | | | 0.41 | % |
| 2021 | | | 0.22 | |
| 2020 | | | 0.55 | |
| 2019 | | | 0.83 | |
| 2018 | | | 0.60 | |
| (d) | During the fiscal year ended July 31, 2022, the Adviser voluntarily reimbursed JPT for certain expenses incurred in connection with its restructuring. See Note 7-Management Fees for more information. |
| (e) | Portfolio Turnover Rate is calculated based on the lesser of long-term purchases or sales (as disclosed in Note 4 – Portfolio Securities and Investments in Derivatives) divided by the average long-term market value during the period. |
| N/A | Fund does not/did not have a contractual reimbursement with the Adviser. |
See accompanying notes to financial statements.
75
Selected data for a share outstanding throughout each period:
| | | | | | | | | | | | | | | | | | | | | | | | | | | | | | | | | | | | |
| | | | |
| | | | | | Investment Operations | | |
Less Distributions to
Common Shareholders | | | Common Share | |
| | | Beginning
Common
Share
NAV | | | Net
Investment
Income
(Loss)(a) | | | Net
Realized/
Unrealized
Gain (Loss) | | | Total | | | From
Net
Investment
Income | | | From
Accumulated
Net
Realized
Gains | | | Total | | | Ending
NAV | | | Ending
Share
Price | |
| | | | | | | | | |
| NPFD | | | | | | | | | | | | | | | | | | | | | | | | | | | | | | | | | | | | |
| | | | | | | | |
| Year Ended 7/31: | | | | | | | | | | | | | | | | | | | | | | | | | | | | | | | | | |
| 2022(e) | | $ | 25.00 | | | $ | 0.61 | | | $ | (3.72 | ) | | $ | (3.11 | ) | | $ | (0.83 | ) | | $ | — | | | $
| (0.83
| )
| | $ | 21.06 | | | $ | 19.98 | |
| (a) | Per share Net Investment Income (Loss) is calculated using the average daily shares method. |
| (b) | Total Return Based on Common Share NAV is the combination of changes in common share NAV, reinvested dividend income at NAV and reinvested capital gains distributions at NAV, if any. The last dividend declared in the period, which is typically paid on the first business day of the following month, is assumed to be reinvested at the ending NAV. The actual reinvest price for the last dividend declared in the period may often be based on the Fund’s market price (and not its NAV), and therefore may be different from the price used in the calculation. Total returns are not annualized. |
| | Total Return Based on Common Share Price is the combination of changes in the market price per share and the effect of reinvested dividend income and reinvested capital gains distributions, if any, at the average price paid per share at the time of reinvestment. The last dividend declared in the period, which is typically paid on the first business day of the following month, is assumed to be reinvested at the ending market price. The actual reinvestment for the last dividend declared in the period may take place over several days, and in some instances may not be based on the market price, so the actual reinvestment price may be different from the price used in the calculation. Total returns are not annualized. |
76
| | | | | | | | | | | | | | | | | | | | | | |
| | | | | | | Common Share Supplemental Data/
Ratios Applicable to Common Shares | |
Common Share
Total Returns | | | | | | Ratios to Average Net Assets(c) | | | | |
Based
on
NAV(b) | | |
Based
on
Share
Price(b) | | | Ending
Net Assets
(000) | | | Expenses | | | Net
Investment
Income (Loss) | | | Portfolio
Turnover
Rate(d) | |
| | | | | |
| | | | | | | | | | | | | | | | | | | | | | | |
| | | | | |
| | | | | | | | | | | | | | | | | | | | | | |
| | (12.48 | )% | | | (16.77 | )% | | $ | 508,829 | | | | 2.13 | %* | | | 4.33 | %* | | | 14 | % |
| (c) • | Net Investment Income (Loss) ratios reflect income earned and expenses incurred on assets attributable to borrowings and/or reverse repurchase agreements (as described in Note 9 – Borrowing Arrangements and Reverse Repurchase Agreements, where applicable. |
| | • | Each ratio includes the effect of all interest expenses paid and other costs related to borrowings and/or reverse repurchase agreements, where applicable, as follows: |
| | | | |
| NPFD | | Ratios of Interest Expense
to Average Net Assets
Applicable to Common Shares | |
| |
| Year Ended 7/31: | | | | |
| 2022(e) | | | 0.74 | %* |
| (d) | Portfolio Turnover Rate is calculated based on the lesser of long-term purchases or sales (as disclosed in Note 4 – Portfolio Securities and Investments in Derivatives) divided by the average long-term market value during the period. |
| (e) | For the period December 15, 2021 (commencement of operations) through July 31, 2022. |
See accompanying notes to financial statements.
77
The following table sets forth information regarding each Fund’s outstanding senior securities as of the end of each of the Fund’s last five fiscal periods, as applicable.
| | | | | | | | | | | | | | | | | | | | |
| | | Borrowings | | | TFP Shares | | | Borrowings,
and/or
TFP Shares | |
| | | Aggregate Amount Outstanding (000)(a) | | | Asset Coverage Per $1,000 Share(b) | | | Aggregate Amount Outstanding (000)(a) | | | Asset Coverage Per $1,000 Share(b) | | | Asset Coverage Per $1 Liquidation Preference | |
| JPC | | | | | | | | | | | | | | | | | | | | |
| Year Ended 7/31: | | | | | | | | | | | | | | | | | | | | |
| 2022 | | $ | 423,400 | | | $ | 3,088 | | | $ | — | | | $ | — | | | $ | — | |
| 2021 | | | 462,700 | | | | 3,223 | | | | — | | | | — | | | | — | |
| 2020 | | | 400,000 | | | | 3,280 | | | | — | | | | — | | | | — | |
| 2019 | | | 455,000 | | | | 3,303 | | | | — | | | | — | | | | — | |
| 2018 | | | 437,000 | | | | 3,403 | | | | — | | | | — | | | | — | |
| JPI | | | | | | | | | | | | | | | | | | | | |
| Year Ended 7/31: | | | | | | | | | | | | | | | | | | | | |
| 2022 | | | 216,000 | | | | 3,242 | | | | — | | | | — | | | | — | |
| 2021 | | | 234,800 | | | | 3,461 | | | | — | | | | — | | | | — | |
| 2020 | | | 200,000 | | | | 3,555 | | | | — | | | | — | | | | — | |
| 2019 | | | 210,000 | | | | 3,674 | | | | — | | | | — | | | | — | |
| 2018 | | | 225,000 | | | | 3,467 | | | | — | | | | — | | | | — | |
| JPS | | | | | | | | | | | | | | | | | | | | |
| Year Ended 7/31: | | | | | | | | | | | | | | | | | | | | |
| 2022 | | | 499,300 | | | | 4,402 | | | | 270,000 | | | | 3,208 | | | | 3.21 | |
| 2021 | | | 873,300 | | | | 3,323 | | | | — | | | | — | | | | — | |
| 2020 | | | 740,300 | | | | 3,495 | | | | — | | | | — | | | | — | |
| 2019 | | | 853,300 | | | | 3,349 | | | | — | | | | — | | | | — | |
| 2018 | | | 845,300 | | | | 3,346 | | | | — | | | | — | | | | — | |
| JPT | | | | | | | | | | | | | | | | | | | | |
| Year Ended 7/31: | | | | | | | | | | | | | | | | | | | | |
| 2022 | | | 47,000 | | | | 2,977 | | | | — | | | | — | | | | — | |
| 2021 | | | 47,000 | | | | 4,646 | | | | — | | | | — | | | | — | |
| 2020 | | | 37,300 | | | | 5,188 | | | | — | | | | — | | | | — | |
| 2019 | | | 42,500 | | | | 4,897 | | | | — | | | | — | | | | — | |
| 2018 | | | 42,500 | | | | 4,841 | | | | — | | | | — | | | | — | |
| NPFD | | | | | | | | | | | | | | | | | | | | |
| Year Ended 7/31: | | | | | | | | | | | | | | | | | | | | |
| 2022(c) | | | 188,600 | | | | 3,698 | | | | — | | | | — | | | | — | |
| (a) | Aggregate Amount Outstanding: Aggregate amount outstanding represents the principal amount outstanding or liquidation preference as of the end of the relevant fiscal year. |
| (b) | Asset Coverage Per $1,000: Asset coverage per $1,000 is calculated by subtracting the Fund’s liabilities and indebtedness not represented by senior securities from the Fund’s total assets, dividing the result by the aggregate amount of the Fund’s senior securities representing indebtedness then outstanding (if applicable,) plus the aggregate of the involuntary liquidation preference of the outstanding preferred shares, if applicable, and multiplying the result by 1,000. |
| (c) | For the period December 15, 2021 (commencement of operations) through July 31, 2022. |
78
Notes to Financial Statements
1. General Information
The funds covered in this report and their corresponding New York Stock Exchange (“NYSE”) symbols are as follows (each a “Fund” and collectively, the “Funds”):
| | • | | Nuveen Preferred & Income Opportunities Fund (JPC) |
| | • | | Nuveen Preferred and Income Term Fund (JPI) |
| | • | | Nuveen Preferred & Income Securities Fund (JPS) |
| | • | | Nuveen Preferred and Income Fund (JPT) (formerly, Nuveen Preferred and Income 2022 Term Fund) |
| | • | | Nuveen Variable Rate Preferred & Income Fund (NPFD) |
The Funds are registered under the Investment Company Act of 1940 (the “1940 Act”), as amended, as diversified, closed-end management investment companies. JPC, JPI, JPS, JPT and NPFD were each organized as Massachusetts business trusts on January 27, 2003, April 18, 2012, June 24, 2002, July 6, 2016 and June 1, 2021, respectively.
The end of the reporting period for the Funds is July 31, 2022, and the period covered by these Notes to Financial Statements for JPC, JPI, JPS and JPT is for the fiscal year ended July 31, 2022, while the reporting period for NPFD is the period December 15, 2021 (commencement of operations) through July 31, 2022 (collectively the “current fiscal period”).
Investment Adviser and Sub-Advisers
The Funds’ investment adviser is Nuveen Fund Advisors, LLC (the “Adviser”), a subsidiary of Nuveen, LLC (“Nuveen”). Nuveen is the investment management arm of Teachers Insurance and Annuity Association of America (TIAA). The Adviser has overall responsibility for management of the Funds, oversees the management of the Funds’ portfolios, manages the Funds’ business affairs and provides certain clerical, bookkeeping and other administrative services, an, if necessary, asset allocation decisions. For JPC, JPI, JPT and NPFD, the Adviser has entered into sub-advisory agreements with Nuveen Asset Management LLC (“NAM”), a subsidiary of the Adviser. For JPS, the Adviser has entered into a sub-advisory agreement with Spectrum Asset Management, Inc. (“Spectrum”). Spectrum and NAM are each a “Sub-Adviser” and collectively, the “Sub-Advisers” for their respective Funds. The Sub-Advisers manage the investment portfolio of each Fund. The Adviser is responsible for managing JPC’s, JPI’s and JPS’s investments in swap contracts.
For JPC, prior to December 31, 2021, the Adviser had entered into a sub-advisory agreement with NWQ Investment Management Company, LLC (“NWQ”), also an affiliate of the Adviser. NWQ, along with NAM, was responsible for approximately half of JPC’s investment portfolio. Effective December 31, 2021, the sub-advisory agreement with NWQ was terminated in connection with the transfer of investment management personnel from NWQ into NAM. On that date, any assets of the Fund that were managed by NWQ were reallocated to NAM along with the NWQ personnel who served as portfolio managers continuing to do so as NAM personnel. Effective April 1, 2022, the former NWQ portfolio managers Thomas J. Ray and Susi Budiman will no longer co-manage JPC with Douglas Baker and Brenda A. Langenfeld. Mr. Baker and Ms. Langenfeld will assume sole responsibility for the portfolio management of JPC.
Fund Restructuring for JPT
On January 19, 2022, JPT shareholders approved a proposal to restructure the Fund (the “Restructuring”). The Restructuring allowed shareholders the opportunity to maintain their investment in JPT and its exposure to a leveraged strategy focused on preferred and other income producing securities in lieu of the scheduled termination of the Fund. The effectiveness of the Restructuring was contingent on the success of the Fund’s tender offer.
On January 20, 2022, JPT conducted a tender offer, which allowed shareholders to offer up to 100% of their shares for repurchase for cash at a price per share equal to 100% of the net asset value (“NAV”) per share determined on the date the tender offer expired. The tender offer expired on February 17, 2022. In the tender offer 2,454,617 shares were tendered, representing approximately 36% of JPT’s common shares outstanding. Properly tendered shares were repurchased at $23.2613 per share, which was the NAV of the Fund as of the close of ordinary trading on the NYSE on February 17, 2022.
As a result of the successful completion of the tender offer, the Restructuring of the JPT was completed and on February 28, 2022 the following changes became effective.
| | • | | JPT’s declaration of trust was amended to eliminate the term of the Fund. |
| | • | | JPT’s investment policies were amended to permit investment in contingent capital securities (CoCos). |
79
Notes to Financial Statements
(continued)
| | • | | JPT’s name changed to Nuveen Preferred and Income Fund. |
| | • | | Beginning February 8, 2022 the Adviser is waiving 50% of the Fund’s net management fees, which will continue over the first year following the elimination of the term. |
Developments Regarding the Funds’ Control Share
By-Law
On October 5, 2020, the Funds and certain other
closed-end
funds in the Nuveen fund complex amended their
by-laws.
Among other things, the amended
by-laws
included provisions pursuant to which, in summary, a shareholder who obtains beneficial ownership of common shares in a Control Share Acquisition (as defined in the
by-laws)
shall have the same voting rights as other common shareholders only to the extent authorized by the other disinterested shareholders (the “Control Share
By-Law”).
On January 14, 2021, a shareholder of certain Nuveen
closed-end
funds filed a civil complaint in the U.S. District Court for the Southern District of New York (the “District Court”) against certain Nuveen funds and their trustees, seeking a declaration that such funds’ Control Share
By-Laws
violate the 1940 Act, rescission of such fund’s Control Share
By-Laws
and a permanent injunction against such funds applying the Control Share
By-Laws.
On February 18, 2022, the District Court granted judgment in favor of the plaintiff’s claim for rescission of such funds’ Control Share
By-Laws
and the plaintiff’s declaratory judgment claim, and declared that such funds’ Control Share
By-Laws
violate Section 18(i) of the 1940 Act. Following review of the judgment of the District Court, on February 22, 2022, the Funds’ Board of Trustees (the “Board”) amended the Funds’
by-laws
to provide that the Funds’ Control Share
By-Law
shall be of no force and effect for so long as the judgment of the District Court is effective and that if the judgment of the District Court is reversed, overturned, vacated, stayed, or otherwise nullified, the Funds’ Control Share
By-Law
will be automatically reinstated and apply to any beneficial owner of common shares acquired in a Control Share Acquisition, regardless of whether such Control Share Acquisition occurs before or after such reinstatement, for the duration of the stay or upon issuance of the mandate reversing, overturning, vacating or otherwise nullifying the judgment of the District Court. On February 25, 2022, the Board and the Funds appealed the District Court’s decision to the U.S. Court of Appeals for the Second Circuit.
The outbreak of the novel coronavirus (“COVID-19”) and subsequent global pandemic began significantly impacting the U.S. and global financial markets and economies during the calendar quarter ended March 31, 2020. The worldwide spread of COVID-19 has created significant uncertainty in the global economy. The duration and extent of COVID-19 over the long term cannot be reasonably estimated at this time. The ultimate impact of COVID-19 and the extent to which COVID-19 impacts the Funds’ normal course of business, results of operations, investments, and cash flows will depend on future developments, which are highly uncertain and difficult to predict. Management continues to monitor and evaluate this situation.
2. Significant Accounting Policies
The accompanying financial statements were prepared in accordance with accounting principles generally accepted in the United States of America (“U.S. GAAP”), which may require the use of estimates made by management and the evaluation of subsequent events. Actual results may differ from those estimates. Each Fund is an investment company and follows the accounting guidance in the Financial Accounting Standards Board (“FASB”) Accounting Standards Codification 946, Financial Services – Investment Companies. The NAV for financial reporting purposes may differ from the NAV for processing security and common share transactions. The NAV for financial reporting purposes includes security and common share transactions through the date of the report. Total return is computed based on the NAV used for processing security and common share transactions. The following is a summary of the significant accounting policies consistently followed by the Funds.
The Funds pay no compensation directly to those of its trustees or to its officers, all of whom receive remuneration for their services to the Funds from the Adviser or its affiliates. The Board has adopted a deferred compensation plan for independent trustees that enables trustees to elect to defer receipt of all or a portion of the annual compensation they are entitled to receive from certain Nuveen-advised funds. Under the plan, deferred amounts are treated as though equal dollar amounts had been invested in shares of select Nuveen advised funds.
Distributions to Common Shareholders
Distributions to common shareholders are recorded on the
ex-dividend
date. The amount, character and timing of distributions are determined in accordance with federal income tax regulations, which may differ from U.S. GAAP.
Foreign Currency Transactions and Translation
To the extent that the Funds invest in securities and/or contracts that are denominated in a currency other than U.S. dollars, the Funds will be subject to currency risk, which is the risk that an increase in the U.S. dollar relative to the foreign currency will reduce returns or portfolio value. Generally, when the U.S. dollar rises in value against a foreign currency, the Funds’ investments denominated in that currency will lose value because their currency is worth fewer U.S. dollars; the opposite effect occurs if the U.S. dollar falls in relative value. Investments and other assets and liabilities denominated in foreign currencies are converted into U.S. dollars on a spot (i.e. cash) basis at the spot rate prevailing in the foreign currency exchange market at the time of valuation. Purchases and sales of investments and income denominated in foreign currencies are translated into U.S. dollars on the respective dates of such transactions.
80
The Funds may be subject to foreign taxes on income, gains on investments or currency repatriation, a portion of which may be recoverable. The Funds will accrue such taxes and recoveries as applicable, based upon the current interpretation of tax rules and regulations that exist in the markets in which the Funds invest.
The books and records of the Funds are maintained in U.S. dollars. Assets, including investments, and liabilities denominated in foreign currencies are translated into U.S. dollars at the end of each day. Purchases and sales of securities, income and expenses are translated into U.S. dollars at the prevailing exchange rate on the respective dates of the transactions.
Net realized foreign currency gains and losses resulting from changes in exchange rates associated with (i) foreign currency, (ii) investments and (iii) derivatives include foreign currency gains and losses between trade date and settlement date of the transactions, foreign currency transactions, and the difference between the amounts of interest and dividends recorded on the books of the Funds and the amounts actually received are recognized as a component of “Net realized gain (loss) from investments and foreign currency” on the Statement of Operations, when applicable.
The unrealized gains and losses resulting from changes in foreign currency exchange rates and changes in foreign exchange rates associated with (i) investments and (ii) other assets and liabilities are recognized as a component of “Change in net unrealized appreciation (depreciation) of investments and foreign currency” on the Statement of Operations, when applicable. The unrealized gains and losses resulting from changes in foreign exchange rates associated with investments in derivatives are recognized as a component of the respective derivative’s related “Change in net unrealized appreciation (depreciation)” on the Statement of Operations, when applicable.
As of the end of the reporting period, the Funds’ investments in non-U.S. securities were as follows:
| | | | | | | | |
| JPC | | Value | | | % of Total
Investments | |
| Country: | | | | | | | | |
| United Kingdom | | $ | 170,831,831 | | | | 12.2 | % |
| Switzerland | | | 106,329,701 | | | | 7.6 | |
| France | | | 73,782,647 | | | | 5.3 | |
| Spain | | | 33,104,134 | | | | 2.4 | |
| Netherlands | | | 30,355,138 | | | | 2.2 | |
| Canada | | | 28,303,874 | | | | 2.0 | |
| Australia | | | 24,017,904 | | | | 1.7 | |
| Germany | | | 21,467,951 | | | | 1.5 | |
| Ireland | | | 19,470,421 | | | | 1.4 | |
| Bermuda | | | 15,330,265 | | | | 1.1 | |
| Other | | | 30,966,854 | | | | 2.1 | |
| Total non-U.S. securities | | $ | 553,960,720 | | | | 39.5 | % |
| | |
| JPI | | | | | | |
| Country: | | | | | | | | |
| United Kingdom | | $ | 94,668,491 | | | | 12.4 | % |
| Switzerland | | | 57,428,184 | | | | 7.6 | |
| France | | | 41,094,185 | | | | 5.4 | |
| Spain | | | 17,738,815 | | | | 2.3 | |
| Netherlands | | | 17,050,504 | | | | 2.3 | |
| Canada | | | 16,675,627 | | | | 2.2 | |
| Australia | | | 16,277,846 | | | | 2.2 | |
| Germany | | | 12,352,939 | | | | 1.6 | |
| Bermuda | | | 9,425,452 | | | | 1.2 | |
| Ireland | | | 9,267,482 | | | | 1.2 | |
| Other | | | 18,505,416 | | | | 2.4 | |
| Total non-U.S. securities | | $ | 310,484,941 | | | | 40.8 | % |
| | |
| JPS | | | | | | |
| Country: | | | | | | | | |
| United Kingdom | | $ | 310,690,572 | | | | 11.4 | % |
| France | | | 280,875,525 | | | | 10.3 | |
| Switzerland | | | 244,300,042 | | | | 9.0 | |
| Finland | | | 80,322,082 | | | | 3.0 | |
| Spain | | | 57,193,331 | | | | 2.1 | |
| Canada | | | 44,259,505 | | | | 1.6 | |
| Netherlands | | | 35,821,948 | | | | 1.3 | |
| Norway | | | 33,885,432 | | | | 1.3 | |
| Australia | | | 33,025,145 | | | | 1.2 | |
| Japan | | | 30,847,685 | | | | 1.1 | |
| Other | | | 82,534,702 | | | | 3.1 | |
| Total non-U.S. securities | | $ | 1,233,755,969 | | | | 45.4 | % |
81
Notes to Financial Statements
(continued)
| | | | | | | | |
| JPT | | Value | | | % of Total
Investments | |
| Country: | | | | | | | | |
| United Kingdom | | $ | 16,358,888 | | | | 11.8 | % |
| Switzerland | | | 10,431,660 | | | | 7.5 | |
| France | | | 8,065,019 | | | | 5.8 | |
| Spain | | | 3,110,593 | | | | 2.2 | |
| Ireland | | | 3,106,324 | | | | 2.2 | |
| Germany | | | 3,101,128 | | | | 2.2 | |
| Netherlands | | | 3,059,974 | | | | 2.2 | |
| Canada | | | 3,021,443 | | | | 2.2 | |
| Australia | | | 2,574,696 | | | | 1.9 | |
| Bermuda | | | 2,282,323 | | | | 1.6 | |
| Other | | | 2,577,814 | | | | 1.9 | |
| Total non-U.S. securities | | $ | 57,689,862 | | | | 41.5 | % |
| | |
| NPFD | | | | | | |
| Country: | | | | | | | | |
| United Kingdom | | $ | 67,711,139 | | | | 8.5 | % |
| Canada | | | 38,414,194 | | | | 4.8 | |
| Switzerland | | | 38,067,756 | | | | 4.8 | |
| France | | | 26,456,541 | | | | 3.3 | |
| Ireland | | | 18,033,149 | | | | 2.3 | |
| Australia | | | 16,204,202 | | | | 2.0 | |
| Spain | | | 11,605,914 | | | | 1.5 | |
| Netherlands | | | 10,974,541 | | | | 1.4 | |
| Bermuda | | | 8,232,840 | | | | 1.0 | |
| Other | | | 18,318,704 | | | | 2.3 | |
| Total non-U.S. securities | | $ | 254,018,980 | | | | 31.9 | % |
Under the Funds’ organizational documents, their officers and trustees are indemnified against certain liabilities arising out of the performance of their duties to the Funds. In addition, in the normal course of business, the Funds enter into contracts that provide general indemnifications to other parties. The Funds’ maximum exposure under these arrangements is unknown as this would involve future claims that may be made against the Funds that have not yet occurred. However, the Funds have not had prior claims or losses pursuant to these contracts and expect the risk of loss to be remote.
Investments and Investment Income
Securities transactions are accounted for as of the trade date for financial reporting purposes. Realized gains and losses on securities transactions are based upon the specific identification method. Dividend income is recorded on the ex-dividend date or, for certain foreign securities, when information is available. Non-cash dividends received in the form of stock, if any, are recorded on the ex-dividend date and recorded at fair value. Interest income, which is recorded on an accrual basis and includes accretion of discounts and amortization of premiums for financial reporting purposes. Interest income also reflects
(“PIK”) interest and paydown gains and losses, if any. PIK interest represents income received in the form of securities in lieu of cash. Rehypothecation income is comprised of fees earned in connection with the rehypothecation of pledged collateral as further described in Note 9 – Borrowing Arrangements and Reverse Repurchase Agreements.
In the ordinary course of business, the Funds may enter into transactions subject to enforceable master repurchase agreements, International Swaps and Derivatives Association, Inc. (ISDA) master agreements or other similar arrangements (“netting agreements”). Generally, the right to offset in netting agreements allows each Fund to offset certain securities and derivatives with a specific counterparty, when applicable, as well as any collateral received or delivered to that counterparty based on the terms of the agreements. Generally, each Fund manages its cash collateral and securities collateral on a counterparty basis.
The Funds’ investments subject to netting agreements as of the end of the reporting period, if any, are further described in Note 4 – Portfolio Securities and Investments in Derivatives.
Organizational Expenses for NPFD
Prior to the commencement of operations on December 15, 2021, NPFD had no operations other than those related to organizational matters, the Fund’s initial contribution of $100,000 by the Adviser, the recording of the Fund’s organizational expenses of $16,000 and their reimbursement by the Adviser.
82
New Accounting Pronouncements and Rule Issuances
In March 2020, FASB issued Accounting Standards Update (“ASU”) 2020-04, Reference Rate Reform: Facilitation of the Effects of Reference Rate Reform on Financial Reporting. The main objective of the new guidance is to provide relief to companies that will be impacted by the expected change in benchmark interest rates, when participating banks will no longer be required to submit London Interbank Offered Rate (LIBOR) quotes by the UK Financial Conduct Authority (FCA). The new guidance allows companies to, provided the only changes to existing contracts are a change to an approved benchmark interest rate, account for modifications as a continuance of the existing contract without additional analysis. For new and existing contracts, the Funds may elect to apply the amendments as of March 12, 2020 through December 31, 2022. Management has not yet elected to apply the amendments, is continuously evaluating the potential effect a discontinuation of LIBOR could have on the Funds’ investments and has currently determined that it is unlikely the ASU’s adoption will have a significant impact on the Funds’ financial statements and various filings.
New Rules to Modernize Fund Valuation Framework Take Effect
A new rule adopted by the Securities and Exchange Commission (the “SEC”) governing fund valuation practices, Rule 2a-5 under the 1940 Act, has established requirements for determining fair value in good faith for purposes of the 1940 Act. Rule 2a-5 permits fund boards to designate certain parties to perform fair value determinations, subject to board oversight and certain other conditions. Rule 2a-5 also defines when market quotations are “readily available” for purposes of Section 2(a)(41) of the 1940 Act, which requires a fund to fair value a security when market quotations are not readily available. Separately, new SEC Rule 31a-4 under the 1940 Act sets forth the recordkeeping requirements associated with fair value determinations. The Funds adopted a valuation policy conforming to the new rules, effective September 1, 2022, and there was no material impact to the Funds.
Financial Accounting Standards Board (“FASB”) issues Accounting Standards Update (“ASU”) 2022-03 — Fair Value Measurement (Topic 820), Fair Value Measurement of Equity Securities Subject to Contractual Sale Restrictions (“ASU 2022-03”)
In June 2022, the FASB issued ASU 2022-03 to clarify the guidance in Topic 820, Fair Value Measurement (“Topic 820”). The amendments in ASU 2022-03 affect all entities that have investments in equity securities measured at fair value that are subject to a contractual sale restriction. ASU 2022-03 (1) clarifies the guidance in Topic 820, when measuring the fair value of an equity security subject to contractual restrictions that prohibit the sale of an equity security, (2) amends a related illustrative example, and (3) introduces new disclosure requirements for equity securities subject to contractual sale restrictions that are measured at fair value in accordance with Topic 820. For public business entities, the amendments in ASU 2022-03 are effective for fiscal years beginning after December 15, 2023, and interim periods within those fiscal years. For all other entities, the amendments are effective for fiscal years beginning after December 15, 2024, and interim periods within those fiscal years. Early adoption is permitted for both interim and annual financial statements that have not yet been issued or made available for issuance. Management is currently assessing the impact of these provisions on the Funds’ financial statements.
3. Investment Valuation and Fair Value Measurements
The Funds’ investments in securities are recorded at their estimated fair value utilizing valuation methods approved by the Board. Fair value is defined as the price that would be received upon selling an investment or transferring a liability in an orderly transaction to an independent buyer in the principal or most advantageous market for the investment. U.S. GAAP establishes the three-tier hierarchy which is used to maximize the use of observable market data and minimize the use of unobservable inputs and to establish classification of fair value measurements for disclosure purposes. Observable inputs reflect the assumptions market participants would use in pricing the asset or liability. Observable inputs are based on market data obtained from sources independent of the reporting entity. Unobservable inputs reflect management’s assumptions about the assumptions market participants would use in pricing the asset or liability. Unobservable inputs are based on the best information available in the circumstances. The following is a summary of the three-tiered hierarchy of valuation input levels.
| | |
| Level 1 – | | Inputs are unadjusted and prices are determined using quoted prices in active markets for identical securities. |
| Level 2 – | | Prices are determined using other significant observable inputs (including quoted prices for similar securities, interest rates, credit spreads, etc.). |
| Level 3 – | | Prices are determined using significant unobservable inputs (including management’s assumptions in determining the fair value of investments). |
A description of the valuation techniques applied to the Funds’ major classifications of assets and liabilities measured at fair value follows:
Equity securities and exchange-traded funds listed or traded on a national market or exchange are valued based on their sale price at the official close of business of such market or exchange on the valuation date. Foreign equity securities and registered investment companies that trade on a foreign exchange are valued at the last sale price or official closing price reported on the exchange where traded and converted to U.S. dollars at the prevailing rates of exchange on the date of valuation. To the extent these securities are actively traded and that valuation adjustments are not applied, they are generally classified as Level 1. If there is no official close of business, then the latest available sale price is utilized. If no sales are reported, then the mean of the latest available bid and ask prices is utilized and these securities are generally classified as Level 2.
Prices of fixed-income securities are generally provided by an independent pricing service (“pricing service”) approved by the Board. The pricing service establishes a security’s fair value using methods that may include consideration of the following: yields or prices of investments of comparable quality, type of issue, coupon, maturity and rating, market quotes or indications of value from security dealers, evaluations of anticipated cash flows or collateral,
83
Notes to Financial Statements
(continued)
general market conditions and other information and analysis, including the obligor’s credit characteristics considered relevant. In pricing certain securities, particularly less liquid and lower quality securities, the pricing service may consider information about a security, its issuer or market activity provided by the Adviser. These securities are generally classified as Level 2.
For events affecting the value of foreign securities between the time when the exchange on which they are traded closes and the time when the Funds’ net assets are calculated, such securities will be valued at fair value in accordance with procedures adopted by the Board. These foreign securities are generally classified as Level 2.
Investments in investment companies are valued at their respective NAVs on the valuation date and are generally classified as Level 1.
Repurchase agreements are valued at contract amount plus accrued interest, which approximates market value. These securities are generally classified as Level 2.
Futures contracts are valued using the closing settlement price or, in the absence of such a price, the last traded price and are generally classified as Level 1.
Swap contracts are
daily based upon a price supplied by a pricing service. Swaps are generally classified as Level 2.
Any portfolio security or derivative for which market quotations are not readily available or for which the above valuation procedures are deemed not to reflect fair value are valued at fair value, as determined in good faith using procedures approved by the Board. As a general principle, the fair value of a security would appear to be the amount that the owner might reasonably expect to receive for it in a current sale. A variety of factors may be considered in determining the fair value of such securities, which may include consideration of the following: yields or prices of investments of comparable quality, type of issue, coupon, maturity and rating, market quotes or indications of value from security dealers, evaluations of anticipated cash flows or collateral, general market conditions and other information and analysis, including the obligor’s credit characteristics considered relevant. To the extent the inputs are observable and timely, the values would be classified as Level 2 of the fair value hierarchy; otherwise they would be classified as Level 3.
The following table summarizes the market value of the Funds’ investments as of the end of the reporting period, based on the inputs used to value them:
| | | | | | | | | | | | | | | | |
| JPC | | Level 1 | | | Level 2 | | | Level 3 | | | Total | |
| Long-Term Investments*: | | | | | | | | | | | | | | | | |
| $1,000 Par (or similar) Institutional Preferred | | $ | — | | | $ | 692,587,126 | | | $ | — | | | $ | 692,587,126 | |
| Contingent Capital Securities | | | — | | | | 448,246,983 | | | | — | | | | 448,246,983 | |
| $25 Par (or similar) Retail Preferred | | | 192,942,422 | | | | 56,666,704 | ** | | | — | | | | 249,609,126 | |
| Corporate Bonds | | | — | | | | 5,815,800 | | | | — | | | | 5,815,800 | |
| | | | |
| Short-Term Investments: | | | | | | | | | | | | | | | | |
| Repurchase Agreements | | | — | | | | 4,813,498 | | | | — | | | | 4,813,498 | |
| | | | |
| Investments in Derivatives: | | | | | | | | | | | | | | | | |
| Interest Rate Swaps*** | | | — | | | | 2,271,394 | | | | — | | | | 2,271,394 | |
| Total | | $ | 192,942,422 | | | $ | 1,210,401,505 | | | $ | — | | | $ | 1,403,343,927 | |
| | | | |
| JPI | | Level 1 | | | Level 2 | | | Level 3 | | | Total | |
| Long-Term Investments*: | | | | | | | | | | | | | | | | |
| $1,000 Par (or similar) Institutional Preferred | | $ | — | | | $ | 361,970,645 | | | $ | — | | | $ | 361,970,645 | |
| Contingent Capital Securities | | | — | | | | 247,315,148 | | | | — | | | | 247,315,148 | |
| $25 Par (or similar) Retail Preferred | | | 104,441,839 | | | | 39,715,878 | ** | | | — | | | | 144,157,717 | |
| Corporate Bonds | | | — | | | | 3,464,264 | | | | — | | | | 3,464,264 | |
| | | | |
| Short-Term Investments: | | | | | | | | | | | | | | | | |
| Repurchase Agreements | | | — | | | | 4,622,286 | | | | — | | | | 4,622,286 | |
| | | | |
| Investments in Derivatives: | | | | | | | | | | | | | | | | |
| Interest Rate Swaps*** | | | — | | | | 941,418 | | | | — | | | | 941,418 | |
| Total | | $ | 104,441,839 | | | $ | 658,029,639 | | | $ | — | | | $ | 762,471,478 | |
| | | | |
| JPS | | Level 1 | | | Level 2 | | | Level 3 | | | Total | |
| Long-Term Investments*: | | | | | | | | | | | | | | | | |
| $1,000 Par (or similar) Institutional Preferred | | $ | — | | | $ | 1,341,131,122 | | | $ | — | | | $ | 1,341,131,122 | |
| Contingent Capital Securities | | | — | | | | 922,396,327 | | | | — | | | | 922,396,327 | |
| $25 Par (or similar) Retail Preferred | | | 247,078,257 | | | | 47,072,568 | ** | | | — | | | | 294,150,825 | |
| Corporate Bonds | | | — | | | | 79,151,805 | | | | — | | | | 79,151,805 | |
| Convertible Preferred Securities | | | 29,677,696 | | | | — | | | | — | | | | 29,677,696 | |
| Investment Companies | | | 19,466,928 | | | | — | | | | — | | | | 19,466,928 | |
| | | | |
| Short-Term Investments: | | | | | | | | | | | | | | | | |
| Repurchase Agreements | | | — | | | | 31,360,397 | | | | — | | | | 31,360,397 | |
| | | | |
| Investments in Derivatives: | | | | | | | | | | | | | | | | |
| Interest Rate Swaps*** | | | — | | | | 4,669,988 | | | | — | | | | 4,669,988 | |
| Total | | $ | 296,222,881 | | | $ | 2,425,782,207 | | | $ | — | | | $ | 2,722,005,088 | |
84
| | | | | | | | | | | | | | | | |
| | | | |
| JPT | | Level 1 | | | Level 2 | | | Level 3 | | | Total | |
| Long-Term Investments*: | | | | | | | | | | | | | | | | |
| $1,000 Par (or similar) Institutional Preferred | | $ | — | | | $ | 69,764,067 | | | $ | — | | | $ | 69,764,067 | |
| Contingent Capital Securities | | | — | | | | 41,709,974 | | | | — | | | | 41,709,974 | |
| $25 Par (or similar) Retail Preferred | | | 18,515,493 | | | | 5,166,081 | ** | | | — | | | | 23,681,574 | |
| Corporate Bonds | | | — | | | | 3,605,528 | | | | — | | | | 3,605,528 | |
| | | | |
| Short-Term Investments: | | | | | | | | | | | | | | | | |
| Repurchase Agreements | | | — | | | | 194,673 | | | | — | | | | 194,673 | |
| Total | | $ | 18,515,493 | | | $ | 120,440,323 | | | $ | — | | | $ | 138,955,816 | |
| NPFD | | Level 1 | | | Level 2 | | | Level 3 | | | Total | |
| Long-Term Investments*: | | | | | | | | | | | | | | | | |
| $1,000 Par (or similar) Institutional Preferred | | $ | — | | | $ | 493,514,176 | | | $ | — | | | $ | 493,514,176 | |
| Contingent Capital Securities | | | — | | | | 149,592,258 | | | | — | | | | 149,592,258 | |
| $25 Par (or similar) Retail Preferred | | | 138,134,627 | | | | 10,383,450 | ** | | | — | | | | 148,518,077 | |
| | | | |
| Short-Term Investments: | | | | | | | | | | | | | | | | |
| Repurchase Agreements | | | — | | | | 4,814,971 | | | | — | | | | 4,814,971 | |
| Investments in Derivatives: | | | | | | | | | | | | | | | | |
| Futures Contracts*** | | | (176,597 | ) | | | — | | | | — | | | | (176,597 | ) |
| Total | | $ | 137,958,030 | | | $ | 658,304,855 | | | $ | — | | | $ | 796,262,885 | |
| * | Refer to the Fund’s Portfolio of Investments for industry classifications, when applicable. |
| ** | Refer to the Fund’s Portfolio of Investments for securities classified as Level 2. |
| *** | Represents net unrealized appreciation (depreciation) as reported in the Fund’s Portfolio of Investments. |
The Funds hold liabilities in preferred shares, where applicable, which are not reflected in the tables above. The fair values of the Funds’ liabilities for preferred shares approximate their liquidation preference. Preferred shares are generally classified as Level 2 and further described in Note 5 — Fund Shares.
4. Portfolio Securities and Investments in Derivatives
Portfolio Securities
In connection with transactions in repurchase agreements, it is each Fund’s policy that its custodian take possession of the underlying collateral securities, the fair value of which exceeds the principal amount of the repurchase transaction, including accrued interest, at all times. If the counterparty defaults, and the fair value of the collateral declines, realization of the collateral may be delayed or limited.
The following table presents the repurchase agreements for the Funds that are subject to netting agreements as of the end of the reporting period, and the collateral delivered related to those repurchase agreements.
| | | | | | | | | | |
| Fund | | Counterparty | | Short-Term
Investments, at Value | | | Collateral
Pledged (From)
Counterparty | |
| JPC | | Fixed Income Clearing Corporation | | $ | 4,813,498 | | | $ | (4,909,777 | ) |
| JPI | | Fixed Income Clearing Corporation | | | 4,622,286 | | | | (4,714,836 | ) |
| JPS | | Fixed Income Clearing Corporation | | | 31,360,397 | | | | (31,987,750 | ) |
| JPT | | Fixed Income Clearing Corporation | | | 194,673 | | | | (198,690 | ) |
| NPFD | | Fixed Income Clearing Corporation | | | 4,814,971 | | | | (4,911,339 | ) |
A zero coupon security does not pay a regular interest coupon to its holders during the life of the security. Income to the holder of the security comes from accretion of the difference between the original purchase price of the security at issuance and the par value of the security at maturity and is effectively paid at maturity. The market prices of zero coupon securities generally are more volatile than the market prices of securities that pay interest periodically.
Long-term purchases and sales (including maturities but excluding derivative transactions, where applicable) during the current fiscal period, were as follows:
| | | | | | | | | | | | | | | | | | | | |
| | | JPC | | | JPI | | | JPS | | | JPT | | | NPFD | |
| Purchases | | $ | 1,065,218,624 | | | $ | 76,350,812 | | | $ | 341,330,102 | | | $ | 60,041,463 | | | $ | 957,552,596 | |
| Sales and maturities | | | 1,088,424,268 | | | | 85,146,382 | | | | 440,401,303 | | | | 116,802,842 | | | | 68,477,715 | |
85
Notes to Financial Statements
(continued)
The Funds may purchase securities on a when-issued or delayed-delivery basis. Securities purchased on a when-issued or delayed-delivery basis may have extended settlement periods; interest income is not accrued until settlement date. Any securities so purchased are subject to market fluctuation during this period. The Funds have earmarked securities in their portfolios with a current value at least equal to the amount of the when-issued/delayed-delivery purchase commitments. If a Fund has outstanding when-issued/delayed-delivery purchases commitments as of the end of the reporting period, such amounts are recognized on the Statement of Assets and Liabilities.
Investments in Derivatives
Each Fund is authorized to invest in certain derivative instruments such as futures, options and swap contracts. Each Fund limits its investments in futures, options on futures and swap contracts to the extent necessary for the Adviser to claim the exclusion from registration by the Commodity Futures Trading Commission as a commodity pool operator with respect to the Fund. The Funds record derivative instruments at fair value, with changes in fair value recognized on the Statement of Operations, when applicable. Even though the Funds’ investments in derivatives may represent economic hedges, they are not considered to be hedge transactions for financial reporting purposes.
Upon execution of a futures contract, a Fund is obligated to deposit cash or eligible securities, also known as ‘‘initial margin,’’ into an account at its clearing broker equal to a specified percentage of the contract amount. Cash held by the broker to cover initial margin requirements on open futures contracts, if any, is recognized as ‘‘Cash collateral at broker for investments in futures contracts’’ on the Statement of Assets and Liabilities. Investments in futures contracts obligate a Fund and the clearing broker to settle monies on a daily basis representing changes in the prior days
of the open contracts. If a Fund has unrealized appreciation the clearing broker would credit the Fund’s account with an amount equal to appreciation and conversely if a Fund has unrealized depreciation the clearing broker would debit the Fund’s account with an amount equal to depreciation. These daily cash settlements are also known as ‘‘variation margin.’’ Variation margin is recognized as a receivable and/or payable for ‘‘Variation margin on futures contracts’’ on the Statement of Assets and Liabilities.
During the period the futures contract is open, changes in the value of the contract are recognized as an unrealized gain or loss by
on a daily basis to reflect the changes in market value of the contract, which is recognized as a component of ‘‘Change in net unrealized appreciation (depreciation) of futures contracts’’ on the Statement of Operations. When the contract is closed or expired, a Fund records a realized gain or loss equal to the difference between the value of the contract on the closing date and value of the contract when originally entered into, which is recognized as a component of ‘‘Net realized gain (loss) from futures contracts’’ on the Statement of Operations.
Risks of investments in futures contracts include the possible adverse movement in the price of the securities or indices underlying the contracts, the possibility that there may not be a liquid secondary market for the contracts and/or that a change in the value of the contract may not correlate with a change in the value of the underlying securities or indices.
During the current fiscal period, JPC, JPI, JPT and NPFD invested in short interest rate futures to manage the Fund’s exposure to various points along the yield curve, with a net effect of decreasing the Fund’s overall interest rate sensitivity.
The average notional amount of futures contracts outstanding during the current fiscal period was as follows:
| | | | | | | | | | | | | | | | |
| | | JPC | | | JPI | | | JPT | | | NPFD | |
| Average notional amount of futures contracts outstanding* | | | 42,314,452 | | | | 39,843,544 | | | | 6,483,945 | �� | | | 57,733,465 | |
| * | The average notional amount is calculated based on the absolute aggregate notional amount of contracts outstanding at the beginning of the current fiscal period and at the end of each quarter within the current fiscal period. |
The following table presents the fair value of all futures contracts held as of end of the reporting period, the location of these instruments on the Statement of Assets and Liabilities and the primary underlying risk exposure.
| | | | | | | | | | | | | | | | |
| | | | | Location on the Statement of Assets and Liabilities | |
Underlying
Risk Exposure | | Derivative
Instrument | | Asset Derivatives | | | | | (Liability) Derivatives | |
| | Location | | Value | | | | | Location | | Value | |
| NPFD | | | | | | | | | | | | | | | | |
| Interest rate | | Futures contracts | | — | | $ | — | | | | | Payable for variation margin on futures contracts* | | $ | (176,597 | ) |
| * | Value represents the cumulative unrealized appreciation (depreciation) of futures contracts as reported in the Fund’s Portfolio of Investments and not the daily asset and/or liability derivative location as described in the table above. |
86
The following table presents the amount of net realized gain (loss) and change in net unrealized appreciation (depreciation) recognized on futures contracts on the Statement of Operations during the current fiscal period, and the primary underlying risk exposure.
| | | | | | | | | | | | |
| Fund | | Underlying Risk
Exposure | | Derivative Instrument | | Net Realized Gain (Loss) from Futures Contracts | | | Change in Net
Unrealized Appreciation
(Depreciation)
of Futures
Contracts | |
| JPC | | Interest rate | | Futures contracts | | $ | 1,713,691 | | | $ | 896,503 | |
| JPI | | Interest rate | | Futures contracts | | | 1,612,854 | | | | 844,887 | |
| JPT | | Interest rate | | Futures contracts | | | 265,502 | | | | 138,551 | |
| NPFD | | Interest rate | | Futures contracts | | | 985,489 | | | | (176,597 | ) |
Interest Rate Swap Contracts
Interest rate swap contracts involve a Fund’s agreement with the counterparty to pay or receive a fixed rate payment in exchange for the counterparty receiving or paying a variable rate payment. Forward interest rate swap contracts involve a Fund’s agreement with a counterparty to pay, in the future, a fixed or variable rate payment in exchange for the counterparty paying the Fund a variable or fixed rate payment, the accruals for which would begin at a specified date in the future (the “effective date”).
The amount of the payment obligation for an interest rate swap is based on the notional amount and the termination date of the contract. Interest rate swap contracts do not involve the delivery of securities or other underlying assets or principal. Accordingly, the risk of loss with respect to the swap counterparty on such transactions is limited to the net amount of interest payments that the Fund is to receive.
Interest rate swap contracts are valued daily. Upon entering into an interest rate swap contract (and beginning on the effective date for a forward interest rate swap contract), the Fund accrues the fixed rate payment expected to be paid or received and the variable rate payment expected to be received or paid on the interest rate swap contracts on a daily basis, and recognizes the daily change in the fair value of the Fund’s contractual rights and obligations under the contracts. For an over-the-counter (“OTC”) swap, that is not cleared through a clearing house (“OTC Uncleared”), the amount recorded on these transactions is recognized on the Statement of Assets and Liabilities as a component of “Unrealized appreciation or depreciation on interest rate swaps.”
Upon the execution of an OTC swap cleared through a clearing house (“OTC Cleared”), the Fund is obligated to deposit cash or eligible securities, also known as “initial margin,” into an account at its clearing broker equal to a specified percentage of the contract amount. Cash deposited by the Fund to cover initial margin requirements on open swap contracts, if any, is recognized as a component of “Cash collateral at brokers for investments in swaps” on the Statement of Assets and Liabilities. Investments in OTC Cleared swaps obligate the Fund and the clearing broker to settle monies on a daily basis representing changes in the prior day’s “mark-to-market” of the swap contract. If the Fund has unrealized appreciation, the clearing broker will credit the Fund’s account with an amount equal to the appreciation. Conversely, if the Fund has unrealized depreciation, the clearing broker will debit the Fund’s account with an amount equal to the depreciation. These daily cash settlements are also known as “variation margin.” Variation margin for OTC Cleared swaps is recognized as a receivable and/or payable for “Variation margin on swap contracts” on the Statement of Assets and Liabilities. Upon the execution of an OTC Uncleared swap, neither the Fund nor the counterparty is required to deposit initial margin as the trades are recorded bilaterally between both parties to the swap contract, and the terms of the variation margin are subject to a predetermined threshold negotiated by the Fund and the counterparty. Variation margin for OTC Uncleared swaps is recognized as a component of “Unrealized appreciation or depreciation on interest rate swaps” as described in the preceding paragraph.
The net amount of periodic payments settled in cash are recognized as a component of “Net realized gain (loss) from swaps” on the Statement of Operations, in addition to the net realized gain or loss recorded upon the termination of the swap contract. For tax purposes, payments expected to be received or paid on the swap contracts are treated as ordinary income or expense, respectively. Changes in the value of the swap contracts during the fiscal period are recognized as a component of “Change in net unrealized appreciation (depreciation) of swaps” on the Statement of Operations. In certain instances, payments are made or received upon entering into the swap contract to compensate for differences between the stated terms of the swap agreements and prevailing market conditions (credit spreads, currency exchange rates, interest rates, and other relevant factors). Payments received or made at the beginning of the measurement period, if any, are recognized as “Interest rate swaps premiums received and/or paid” on the Statement of Assets and Liabilities.
During the current fiscal period, JPC, JPI and JPS continued to use interest rate swap contracts to partially hedge the interest cost of leverage, which is through the use of bank borrowings.
The average notional amount of interest rate swap contracts outstanding during the current fiscal period was as follows:
| | | | | | | | | | | | |
| | | JPC | | | JPI | | | JPS | |
| Average notional amount of interest rate swap contracts outstanding* | | $ | 325,500,000 | | | $ | 157,000,000 | | | $ | 611,000,000 | |
| * | The average notional amount is calculated based on the outstanding notional at the beginning of the current fiscal period and at the end of each fiscal quarter within the current fiscal period. |
87
Notes to Financial Statements
(continued)
The following table presents the fair value of all swap contracts held by the Funds as of the end of the reporting period, the location of these instruments on the Statement of Assets and Liabilities and the primary underlying risk exposure.
| | | | | | | | | | | | | | | | | | |
| | | | | Location on the Statement of Assets and Liabilities | |
Underlying Risk Exposure | | Derivative Instrument | | Asset Derivatives | | | | | | (Liability) Derivatives | |
| | Location | | Value | | | | | | Location | | Value | |
| JPC | |
| Interest rate | | Swaps (OTC Uncleared) | | Unrealized appreciation on interest rate swaps** | | $ | 2,520,950 | | | | | | | Unrealized depreciation on interest rate swaps** | | $ | (249,556 | ) |
| JPI | |
| Interest rate | | Swaps (OTC Uncleared) | | Unrealized appreciation on interest rate swaps** | | $ | 941,418 | | | | | | | Unrealized depreciation on interest rate swaps** | | $ | �� | |
| JPS | |
| Interest rate | | Swaps (OTC Uncleared) | | Unrealized appreciation on interest rate swaps** | | $ | 5,265,234 | | | | | | | Unrealized depreciation on interest rate swaps** | | $ | (595,246 | ) |
| ** | Some swap contracts require a counterparty to pay or receive a premium, which is disclosed in the Statement of Assets and Liabilities, when applicable, and is not reflected in the cumulative unrealized appreciation (depreciation) presented above. |
The following table presents the swap contracts subject to netting agreements and the collateral delivered related to those swap contracts as of the end of the reporting period.
| | | | | | | | | | | | | | | | | | | | | | |
| Fund | | Counterparty | | Gross
Unrealized
Appreciation on
Interest Rate
Swaps*** | | | Gross
Unrealized
(Depreciation) on
Interest Rate
Swaps*** | | | Net
Unrealized
Appreciation
(Depreciation) on
Interest Rate
Swaps | | | Collateral
Pledged
to (from)
Counterparty | | | Net
Exposure | |
| JPC | | Morgan Stanley Capital Services LLC | | $ | 2,520,950 | | | $ | (249,556 | ) | | $ | 2,271,394 | | | $ | (2,837,189 | ) | | $ | 565,795 | |
| JPI | | Morgan Stanley Capital Services LLC | | | 941,418 | | | | — | | | | 941,418 | | | | (1,056,099 | ) | | | 114,681 | |
| JPS | | Morgan Stanley Capital Services LLC | | | 5,265,234 | | | | (595,246 | ) | | | 4,669,988 | | | | (5,327,201 | ) | | | 657,213 | |
| *** | Represents gross unrealized appreciation (depreciation) for the counterparty as reported in the Fund’s Portfolio of Investments. |
The following table presents the amount of net realized gain (loss) and change in net unrealized appreciation (depreciation) recognized on swap contracts on the Statement of Operations during the current fiscal period, and the primary underlying risk exposure.
| | | | | | | | | | | | |
| Fund | | Underlying
Risk Exposure | | Derivative
Instrument | | Net Realized
Gain (Loss)
from Swaps | | | Change in Net
Unrealized
Appreciation
(Depreciation)
of Swaps | |
| JPC | | Interest rate | | Swaps | | $ | (5,165,009 | ) | | $ | 29,067,374 | |
| JPI | | Interest rate | | Swaps | | | (2,649,333 | ) | | | 8,472,981 | |
| JPS | | Interest rate | | Swaps | | | (10,105,705 | ) | | | 54,965,989 | |
Market and Counterparty Credit Risk
In the normal course of business each Fund may invest in financial instruments and enter into financial transactions where risk of potential loss exists due to changes in the market (market risk) or failure of the other party to the transaction to perform (counterparty credit risk). The potential loss could exceed the value of the financial assets recorded on the financial statements. Financial assets, which potentially expose each Fund to counterparty credit risk, consist principally of cash due from counterparties on forward, option and swap transactions, when applicable. The extent of each Fund’s exposure to counterparty credit risk in respect to these financial assets approximates their carrying value as recorded on the Statement of Assets and Liabilities.
Each Fund helps manage counterparty credit risk by entering into agreements only with counterparties the Adviser believes have the financial resources to honor their obligations and by having the Adviser monitor the financial stability of the counterparties. Additionally, counterparties may be required to pledge collateral daily (based on the daily valuation of the financial asset) on behalf of each Fund with a value approximately equal to the amount of any unrealized gain above a pre-determined threshold. Reciprocally, when each Fund has an unrealized loss, the Funds have instructed the custodian to pledge assets of the Funds as collateral with a value approximately equal to the amount of the unrealized loss above a pre-determined threshold. Collateral pledges are monitored and subsequently adjusted if and when the valuations fluctuate, either up or down, by at least the pre-determined threshold amount.
88
5. Fund Shares
The Board has authorized JPT to conduct a tender offer pursuant to which the Fund would offer to purchase up to 100% of its then outstanding shares for cash on a pro rata basis at a price per share equal 100% of the NAV per share as determined as of the close of regular trading on the NYSE on the expiration date of the tender offer.
On January 19, 2022, Nuveen announced the Fund’s tender offer, which commenced on January 20, 2022 and expired on February 17, 2022. In the tender offer 2,454,617 shares were tendered, representing approximately 36% of the Fund’s common shares outstanding from participating shareholders.
The final results of the tender offer are as shown in the accompanying table.
| | | | |
| | | JPT | |
| Number of common shares outstanding before tender offer | | | 6,846,241 | |
| Number of common shares authorized for tender offer | | | 2,454,617 | |
| Purchase price (100% of share NAV on expiration date) | | $ | 23.2613 | |
| Number of common shares outstanding after tender offer | | | 4,391,624 | |
Common Share Equity Shelf Programs and Offering Costs
JPC and JPS have filed a registration statement with the SEC authorizing each Fund to issue additional common shares through one or more equity shelf programs (“Shelf Offering”), which became effective with the SEC during a prior fiscal period.
Under these Shelf Offerings, the Funds, subject to market conditions, may raise additional equity capital by issuing additional common shares from time to time in varying amounts and by different offering methods at a net price at or above each Fund’s NAV per common share. In each event the Fund’s Shelf Offering registration statement is no longer current, the Funds may not issue additional common shares until a post-effective amendment to the registration statement has been filed with the SEC.
Maximum aggregate offering, common shares sold and offering proceeds, net of offering costs under each Fund’s Shelf Offering during the Funds’ current and prior fiscal period were as follows:
| | | | | | | | | | | | | | | | |
| | | JPC | | | JPS | |
| | | Year Ended
7/31/2022 | | | Year Ended
7/31/21* | | | Year Ended
7/31/2022 | | | Year Ended
7/31/2021 | |
| Maximum aggregate offering | | | Unlimited | | | | Unlimited | | | | Unlimited | | | | Unlimited | |
| Common shares sold | | | 1,185,860 | | | | 480,154 | | | | 921,252 | | | | 932,349 | |
| Offering proceeds, net of offering costs | | $ | 11,703,948 | | | $ | 4,757,224 | | | $ | 9,114,000 | | | $ | 9,215,446 | |
| * | For the period March 19, 2021 through July 31, 2021. |
Costs incurred by each Fund in connection with their initial shelf registration are recorded as a prepaid expense and recognized as “Deferred offering costs” on the Statement of Assets and Liabilities. These costs are amortized pro rata as common shares are sold and are recognized as a component of “Proceeds from shelf offering, net of offering costs” on the Statement of Changes in Net Assets. Any deferred offering costs remaining after the effectiveness of the initial shelf registration will be expensed. Costs incurred by the Funds to keep the shelf registration current are expensed as incurred and recognized as a component of “Other expenses” on the Statement of Operations.
89
Notes to Financial Statements
(continued)
Common Share Transactions
Transactions in common shares during the Funds’ current and prior fiscal period were as follows:
| | | | | | | | | | | | | | | | | | | | | | | | | | | | | | | | | | | | |
| | | JPC | | | JPI | | | JPS | | | JPT | | | NPFD* | |
| | | Year
Ended
7/31/22 | | | Year
Ended
7/31/21 | | | Year
Ended
7/31/22 | | | Year
Ended
7/31/21 | | | Year
Ended
7/31/22 | | | Year
Ended
7/31/21 | | | Year
Ended
7/31/22 | | | Year
Ended
7/31/21 | | | For the period
12/15/2021
commencement
of operations)
through 7/31/22 | |
| Common shares: | | | | | | | | | | | | | | | | | | | | | | | | | | | | | | | | | | | | |
| Sold through shelf offering | | | 1,185,860 | | | | 480,154 | | | | — | | | | — | | | | 921,252 | | | | 932,349 | | | | — | | | | — | | | | — | |
| Sold | | | — | | | | — | | | | — | | | | — | | | | — | | | | — | | | | — | | | | — | | | | 24,160,141 | |
| Repurchased and retired through tender offer | | | — | | | | — | | | | — | | | | — | | | | — | | | | — | | | | (2,454,617 | ) | | | — | | | | — | |
| Issued to shareholders due to reinvestment of distributions | | | 38,614 | | | | 9,455 | | | | 6,156 | | | | 4,872 | | | | 29,125 | | | | 48,338 | | | | 2,174 | | | | 4,887 | | | | — | |
| Total | | | 1,224,474 | | | | 489,609 | | | | 6,156 | | | | 4,872 | | | | 950,377 | | | | 980,687 | | | | (2,452,443 | ) | | | 4,887 | | | | 24,160,141 | |
| Weighted average common share: | | | | | | | | | | | | | | | | | | | | | | | | | | | | | | | | | | | | |
| Premium to NAV per shelf offering sold | | | 1.18 | % | | | 1.08 | % | | | — | | | | — | | | | 1.16 | % | | | 1.12 | % | | | — | | | | — | | | | — | |
| Tender offer: | | | | | | | | | | | | | | | | | | | | | | | | | | | | | | | | | | | | |
| Price per common share | | | — | | | | — | | | | — | | | | — | | | | — | | | | — | | | $ | 23.26 | | | | — | | | | — | |
| Discount per common share | | | — | | | | — | | | | — | | | | — | | | | — | | | | — | | | | 0.00 | % | | | — | | | | — | |
| * | Prior to the commencement of operations, the Adviser purchased 4,000 shares, which are still held as of the end of the reporting period. |
Taxable Fund Preferred Shares
JPS has issued and has outstanding Taxable Fund Preferred (“TFP”) Shares, with a $1,000 liquidation preference per share. These TFP Shares were issued via private placement and are not publicly available.
The Fund is obligated to redeem its TFP Shares by the date as specified in its offering documents (“Term Redemption Date”), unless earlier redeemed by the Fund. TFP Shares are initially issued in a pre-specified mode, however, TFP Shares can be subsequently designated as an alternative mode at a later date at the discretion of the Funds. The modes within TFP Shares detail the dividend mechanics and are described as follows. At a subsequent date, the Fund may establish additional mode structures with the TFP Share.
| | • | | Variable Rate Mode (“VRM”) – Dividends for TFP Shares designated in this mode are based upon a short-term index plus an additional fixed “spread” amount established at the time of issuance or renewal / conversion of its mode. At the end of the period of the mode, the Fund will be required to either extend the term of the mode, designate an alternative mode or redeem the TFP Shares. |
The fair value of TFP Shares while in VRM are expected to approximate their liquidation preference so long as the fixed “spread” on the shares remains roughly in line with the “spread’ being demanded by investors on instruments having similar terms in the current market. In current market conditions, the Adviser has determined that the fair value of the shares are approximately their liquidation preference, but their fair value could vary if market conditions change materially.
| | • | | Variable Rate Demand Mode (“VRDM”) – Dividends for TFP Shares designated in this mode will be established by a remarketing agent; therefore, the market value of the TFP Shares is expected to approximate its liquidation preference. While in this mode, shares will have an unconditional liquidity feature that enable its shareholders to require a liquidity provider, which each Fund has entered into a contractual agreement, to purchase shares in the event that the shares are not able to be successfully remarketed. In the event that shares within this mode are unable to be successfully remarketed and are purchased by the liquidity provider, the dividend rate will be the maximum rate which is designed to escalate according to a specified schedule in order to enhance the remarketing agent’s ability to successfully remarket the shares. Each Fund is required to redeem any shares that are still owned by a liquidity provider after six months of continuous, unsuccessful remarketing. |
The Fund will pay a liquidity and remarketing fee on the aggregate principal amount of all TFP Shares while within VRDM. Payments made by the Funds to the liquidity provider and remarketing agent are recognized as “Liquidity fees” and “Remarketing fees”, respectively, on the Statement of Operations.
For financial reporting purposes, the liquidation preference of TFP Shares is recorded as a liability and is recognized as a component of “Taxable Fund Preferred (“TFP”) Shares, net of deferred offering costs” on the Statement of Assets and Liabilities. Dividends on the TFP shares are treated as interest payments for financial reporting purposes. Unpaid dividends on TFP shares are recognized as a component on “Interest payable” on the Statement of Assets and Liabilities. Dividends accrued on TFP Shares are recognized as a component of “Interest expense and amortization of offering costs” on the Statement of Operations.
90
Subject to certain conditions, TFP Shares may be redeemed, in whole or in part, at any time at the option of the Funds. Each Fund may also be required to redeem certain TFP shares if the Fund fails to maintain certain asset coverage requirements and such failures are not cured by the applicable cure date. The redemption price per share in all circumstances is equal to the liquidation preference per share plus any accumulated but unpaid dividends.
JPS incurred offering costs of $1,090,000 in connection with its offering of TFP Shares, which were recorded as a deferred charge and are being amortized over the life of the shares. These offering costs are recognized as a component of “Taxable Fund Preferred (“TFP”) Shares, net of deferred offering costs” on the Statement of Assets and Liabilities and “Interest expense and amortization of offering costs” on the Statement of Operations.
As of the end of the reporting period, JPS had $268,930,316 TFP Shares at liquidation preference, net of deferred offering costs. Further details of the Fund’s TFP Shares outstanding as of the end of the reporting period, were as follows:
| | | | | | | | | | | | | | | | | | | | |
| Fund | | Series | | | Shares
Outstanding | | | Liquidation
Preference | | | Term
Redemption
Date | | | Mode | |
| JPS | | | A | | | | 270,000 | | | $ | 270,000,000 | | | | July 1, 2032 | | | | VRDM | |
The average liquidation preference of TFP Shares outstanding and the annualized dividend rate for the Fund during the current fiscal period were as follows:
| | | | |
| | | JPS* | |
| Average liquidation preference of TFP Shares outstanding | | $ | 270,000,000 | |
| Annualized dividend rate | | | 2.27 | % |
| * | For the period July 14, 2022 (first issuance date of shares) through July 31, 2022. |
Preferred Share Transactions
Transactions in preferred shares during the Fund’s current and prior fiscal period, where applicable, are noted in the following table.
Transactions in TFP Shares for the Fund, where applicable, were as follows:
| | | | | | | | | | | | |
| | | Year Ended July 31, 2022 | |
| JPS | | Series | | | Shares | | | Amount | |
| TFP Shares issued | | | A | | | | 270,000 | | | $ | 270,000,000 | |
6. Income Tax Information
Each Fund is a separate taxpayer for federal income tax purposes. Each Fund intends to distribute substantially all of its net investment income and net capital gains to shareholders and otherwise comply with the requirements of Subchapter M of the Internal Revenue Code applicable to regulated investment companies. Therefore, no federal income tax provision is required.
Each Fund files income tax returns in U.S. federal and applicable state and local jurisdictions. A Fund’s federal income tax returns are generally subject to examination for a period of three fiscal years after being filed. State and local tax returns may be subject to examination for an additional period of time depending on the jurisdiction. Management has analyzed each Fund’s tax positions taken for all open tax years and has concluded that no provision for income tax is required in the Fund’s financial statements.
Differences between amounts for financial statement and federal income tax purposes are primarily due to timing differences in recognizing gains and losses on investment transactions. Temporary differences do not require reclassification. As of year end, permanent differences that resulted in reclassifications among the components of net assets relate primarily to bond premium amortization adjustments, complex securities character adjustments, return of capital and long-term capital gain distributions received from portfolio investments, taxes paid and treatment of notional principal contracts. Temporary and permanent differences have no impact on a Fund’s net assets.
As of year end, the aggregate cost and the net unrealized appreciation/(depreciation) of all investments for federal income tax purposes was as follows:
| | | | | | | | | | | | | | | | |
| Fund | | Tax Cost | | | Gross
Unrealized
Appreciation | | | Gross
Unrealized
(Depreciation) | | | Net Unrealized
Appreciation
(Depreciation) | |
| JPC | | $ | 1,457,498,286 | | | $ | 12,491,268 | | | $ | (66,645,627 | ) | | $ | (54,154,359 | ) |
| JPI | | | 791,190,369 | | | | 8,857,986 | | | | (37,576,877 | ) | | | (28,718,891 | ) |
| JPS | | | 2,809,073,773 | | | | 41,859,264 | | | | (128,927,949 | ) | | | (87,068,685 | ) |
| JPT | | | 145,207,041 | | | | 943,674 | | | | (7,194,899 | ) | | | (6,251,225 | ) |
| NPFD | | | 886,286,051 | | | | 446,869 | | | | (90,470,035 | ) | | | (90,023,166 | ) |
91
Notes to Financial Statements
(continued)
For purposes of this disclosure, tax cost generally includes the cost of portfolio investments as well as
up-front
fees or premiums exchanged on derivatives and any amounts unrealized for income statement reporting but realized income and/or capital gains for tax reporting, if applicable.
As of year end, the components of accumulated earnings on a tax basis were as follows:
| | | | | | | | | | | | | | | | | | | | | | | | | | |
| Fund | | Undistributed
Ordinary Income | | Undistributed
Long-Term
Capital Gains | | | Unrealized
Appreciation
(Depreciation) | | | Capital Loss
Carryforwards | | | | | | | | | Total | |
| JPC | | $ 4,295,389 | | $ | — | | | $ | (54,156,995 | ) | | $ | (111,151,957 | ) | | $ | — | | | $ | (5,228,985 | ) | | $ | (166,242,548 | ) |
| JPI | | 1,493,449 | | | — | | | | (28,718,891 | ) | | | (23,811,514 | ) | | | — | | | | (2,824,176 | ) | | | (53,861,132 | ) |
| JPS | | 2,451,794 | | | — | | | | (87,068,685 | ) | | | (89,493,764 | ) | | | — | | | | (8,095,028 | ) | | | (182,205,683 | ) |
| JPT | | 206,075 | | | — | | | | (6,251,225 | ) | | | (11,601,485 | ) | | | — | | | | (551,149 | ) | | | (18,197,784 | ) |
| NPFD | | 2,850,698 | | | — | | | | (90,023,166 | ) | | | (4,735,220 | ) | | | — | | | | (3,334,651 | ) | | | (95,242,339 | ) |
The tax character of distributions paid were as follows:
| | | | | | | | | | | | | | | | | | | | |
| | | 7/31/22 | | | | | | 7/31/21 |
| Fund | | Ordinary
Income | | | Long-Term
Capital Gains | | | Ordinary
Income | | | | |
| JPC | | $ | 66,660,132 | | | $ | — | | | | | | | $ | 65,752,057 | | | $ | — | |
| JPI | | | 35,659,439 | | | | — | | | | | | | | 35,645,968 | | | | — | |
| JPS | | | 121,278,321 | | | | — | | | | | | | | 123,552,214 | | | | — | |
| JPT | | | 8,310,452 | | | | — | | | | | | | | 9,728,671 | | | | — | |
| NPFD | | | 20,007,909 | | | | — | | | | | | | | — | | | | — | |
As of year end, the Funds had capital loss carryforwards, which will not expire:
| | | | | | | | | | | | |
| Fund | | | | | | | | Total | |
| JPC | | $ | 45,557,568 | | | $ | 65,594,389 | | | $ | 111,151,957 | |
| JPI | | | 11,051,618 | | | | 12,759,896 | | | | 23,811,514 | |
| JPS | | | 12,058,682 | | | | 77,435,082 | | | | 89,493,764 | |
| JPT | | | 2,833,013 | | | | 8,768,472 | | | | 11,601,485 | |
| NPFD | | | 4,735,220 | | | | — | | | | 4,735,220 | |
As of year end, the Funds utilized the following capital loss carryforwards:
| | | | |
| Fund | | Utilized | |
| JPC | | $ | — | |
| JPI | | | — | |
| JPS | | | 1,539,145 | |
| JPT | | | — | |
| NPFD | | | — | |
7. Management Fees
Each Fund’s management fee compensates the Adviser for overall investment advisory and administrative services and general office facilities. The Sub-Advisers are compensated for their services to the Funds from the management fees paid to the Adviser. Spectrum also receives compensation on certain portfolio transactions for providing brokerage services to JPS. During the current fiscal period, JPS paid Spectrum commissions of $12,230.
Each Fund’s management fee consists of two components – a fund-level fee, based only on the amount of assets within each individual Fund, and a complex-level fee, based on the aggregate amount of all eligible fund assets managed by the Adviser. This pricing structure enables each Fund’s shareholders to benefit from growth in the assets within their respective Fund as well as from growth in the amount of complex-wide assets managed by the Adviser.
The annual fund-level fee, payable monthly, for each Fund is calculated according to the following schedule:
| | | | | | | | | | | | | | | | | | | | |
| Fund-Level Average Daily Managed Assets | | JPC | | | JPI | | | JPS | | | JPT | | | NPFD | |
| For the first $500 million | | | 0.6800 | % | | | 0.7000 | % | | | 0.7000 | % | | | 0.7000 | % | | | 0.7500 | % |
| For the next $500 million | | | 0.6550 | | | | 0.6750 | | | | 0.6750 | | | | 0.6750 | | | | 0.7250 | |
| For the next $500 million | | | 0.6300 | | | | 0.6500 | | | | 0.6500 | | | | 0.6500 | | | | 0.7000 | |
| For the next $500 million | | | 0.6050 | | | | 0.6250 | | | | 0.6250 | | | | 0.6250 | | | | 0.6750 | |
| For managed assets over $2 billion | | | 0.5800 | | | | 0.6000 | | | | 0.6000 | | | | 0.6000 | | | | 0.6500 | |
92
The annual complex-level fee, payable monthly, for each Fund is calculated by multiplying the current complex-wide fee rate, determined according to the following schedule by the Funds’ daily managed assets:
| | | | |
| Complex-Level Eligible Asset Breakpoint Level* | | Effective Complex-Level Fee Rate at Breakpoint Level | |
| $55 billion | | | 0.2000 | % |
| $56 billion | | | 0.1996 | |
| $57 billion | | | 0.1989 | |
| $60 billion | | | 0.1961 | |
| $63 billion | | | 0.1931 | |
| $66 billion | | | 0.1900 | |
| $71 billion | | | 0.1851 | |
| $76 billion | | | 0.1806 | |
| $80 billion | | | 0.1773 | |
| $91 billion | | | 0.1691 | |
| $125 billion | | | 0.1599 | |
| $200 billion | | | 0.1505 | |
| $250 billion | | | 0.1469 | |
| $300 billion | | | 0.1445 | |
| * | For the complex-level fees, managed assets include closed-end fund assets managed by the Adviser that are attributable to certain types of leverage. For these purposes, leverage includes the funds’ use of preferred stock and borrowings and certain investments in the residual interest certificates (also called inverse floating rate securities) in tender option bond (TOB) trusts, including the portion of assets held by a TOB trust that has been effectively financed by the trust’s issuance of floating rate securities, subject to an agreement by the Adviser as to certain funds to limit the amount of such assets for determining managed assets in certain circumstances. The complex-level fee is calculated based upon the aggregate daily managed assets of all Nuveen open-end and closed-end funds that constitute “eligible assets.” Eligible assets do not include assets attributable to investments in other Nuveen funds or assets in excess of a determined amount (originally $2 billion) added to the Nuveen fund complex in connection with the Adviser’s assumption of the management of the former First American Funds effective January 1, 2011, but do not include certain assets of certain Nuveen funds that were reorganized into funds advised by an affiliate of the Adviser during the 2019 calendar year. As of July 31, 2022, the complex-level fee rate for each Fund was 0.1562%. |
Beginning February 8, 2022, and for a one-year period, the Adviser is waiving 50% of JPT’s net management fees.
8. Commitments and Contingencies
In the normal course of business, each Fund enters into a variety of agreements that may expose the Fund to some risk of loss. These could include certain agreements related to preferred shares, which are described elsewhere in these Notes to Financial Statements. The risk of future loss arising from such agreements, while not quantifiable, is expected to be remote. As of the end of the reporting period, the Funds did not have any unfunded commitments.
From time to time, the Funds may be a party to certain legal proceedings in the ordinary course of business, including proceedings relating to the enforcement of the Funds’ rights under contracts. As of the end of the reporting period, management has determined that any legal proceeding(s) the Funds are subject to, including those described within this report, are unlikely to have a material impact to any of the Funds’ financial statements.
9. Borrowing Arrangements and Reverse Repurchase Agreements
Each Fund entered into a borrowing arrangement (“Borrowings”) as a means of leverage. As of the end of the reporting period, each Fund’s maximum commitment amount under these Borrowings is as follows:
| | | | | | | | | | | | | | | | | | | | |
| | | JPC | | | JPI | | | JPS | | | JPT | | | NPFD | |
| Maximum commitment amount | | $ | 485,000,000 | | | $ | 255,000,000 | | | $ | 560,000,000 | | | $ | 47,000,000 | | | $ | 250,000,000 | |
As of the end of the reporting period, each Fund’s outstanding balance on its Borrowings was as follows:
| | | | | | | | | | | | | | | | | | | | |
| | | JPC | | | JPI | | | JPS | | | JPT | | | NPFD | |
| Outstanding balance on Borrowings | | $ | 423,400,000 | | | $ | 216,000,000 | | | $ | 499,300,000 | | | $ | 47,000,000 | | | $ | 188,600,000 | |
On July 1, 2022 JPC, JPI and JPS amended their Borrowings and changed their interest on these Borrowings to OBFR (“Overnight Bank Funding Rate”) plus 0.85% per annum on the amounts borrowed (1-Month LIBOR (London Inter-Bank Offered Rate) plus 0.75% prior to July 1, 2022). All the other terms remain unchanged. JPT’s interest is charged on the Borrowings at a rate equal to the 1-Month Term SOFR (“Secured Overnight Financing Rate”) plus 0.825% (this is comprised of a 0.05% credit adjustment spread to account for SOFR basis plus 0.775% prior to drawn rate). (1-month LIBOR plus 0.775%
93
Notes to Financial Statements
(continued)
prior to February 2, 2022) per annum on the amount borrowed and a 0.125% per annum commitment fee on the undrawn portion of the Borrowings. For NPFD, interest is charged on these Borrowings at OBFR plus 0.75% per annum on the amounts borrowed and 0.25% per annum on the undrawn balance if the undrawn portion of the Borrowings on a particular day is more than 25% of the maximum commitment amount.
During the current fiscal period, the average daily balance outstanding and average annual interest rate on each Fund’s Borrowings were as follows:
| | | | | | | | | | | | | | | | | | | | |
| | | JPC | | | JPI | | | JPS | | | JPT | | | | |
| Utilization period | | | 365 | | | | 365 | | | | 365 | | | | 365 | | | | 202 | |
| Average daily balance outstanding | | $ | 455,111,644 | | | $ | 231,129,315 | | | $ | 829,047,945 | | | $ | 47,000,000 | | | $ | 197,116,832 | |
| Average annual interest rate | | | 1.23 | % | | | 1.23 | % | | | 1.20 | % | | | 1.19 | % | | | 1.37 | % |
|
1 For the period January 11, 2022 (inital draw) through July 31, 2022. | |
In order to maintain these Borrowings, the Funds must meet certain collateral, asset coverage and other requirements. The Funds’ borrowings outstanding are fully secured by eligible securities held in each Fund’s portfolio of investments. (“Pledged Collateral”)
Borrowings outstanding are recognized as “Borrowings” on the Statement of Assets and Liabilities. Interest expense incurred on the borrowed amount and undrawn balance and amendment fees are recognized as a component of “Interest expense and amortization of offering costs” on the Statement of Operations.
JPC, JPI and JPS have each entered into a Rehypothecation Side Letter (“Side Letter”) with its prime brokerage lender, allowing it to re-register the Pledged Collateral in its own name or in a name other than the Funds’ to pledge, repledge, hypothecate, rehypothecate, sell, lend or otherwise transfer or use the Pledged Collateral (the “Hypothecated Securities”) with all rights of ownership as described in the Side Letter. Subject to certain conditions, the total value of the outstanding Hypothecated Securities shall not exceed the lesser of (i) 98% of the outstanding balance on the Borrowings to which the Pledged Collateral relates and (ii) 33
1
⁄
3
% of the Funds’ total assets. The Funds may designate any Pledged Collateral as ineligible for rehypothecation. The Funds may also recall Hypothecated Securities on demand.
The Funds also have the right to apply and set-off an amount equal to one-hundred percent (100%) of the then-current fair market value of such Pledged Collateral against the current Borrowings under the Side Letter in the event that the prime brokerage lender fails to timely return the Pledged Collateral and in certain other circumstances. In such circumstances, however, the Funds may not be able to obtain replacement financing required to purchase replacement securities and, consequently, the Funds’ income generating potential may decrease. Even if a Fund is able to obtain replacement financing, it might not be able to purchase replacement securities at favorable prices.
The Funds will receive a fee in connection with the Hypothecated Securities (“Rehypothecation Fees”) in addition to any principal, interest, dividends and other distributions paid on the Hypothecated Securities.
As of the end of the reporting period, JPC, JPI and JPS each had Hypothecated Securities as follows:
| | | | | | | | | | | | |
| | | JPC | | | JPI | | | JPS | |
| Hypothecated Securities | | $ | 378,989,172 | | | $ | 197,806,164 | | | $ | 389,505,910 | |
JPC, JPI and JPS earn Rehypothecation Fees, which are recognized as “Rehypothecation income” on the Statement of Operations. During the current fiscal period, the Rehypothecation Fees earned by each Fund were as follows:
| | | | | | | | | | | | |
| | | JPC | | | JPI | | | JPS | |
| Rehypothecation Fees | | $ | 74,994 | | | $ | 68,003 | | | $ | 255,820 | |
Reverse Repurchase Agreements
During the current fiscal period, JPC, JPI, JPS and NPFD used reverse repurchase agreements as a means of leverage.
Each Fund may enter into a reverse repurchase agreement with brokers, dealers, banks or other financial institutions that have been determined by the Adviser to be creditworthy. In a reverse repurchase agreement, a Fund sells to the counterparty a security that it holds with a contemporaneous agreement to repurchase the same security at an agreed-upon price and date, reflecting the interest rate effective for the term of the agreement. It may also be viewed as the borrowing of money by the Fund. Cash received in exchange for securities delivered, plus accrued interest payments to be made by the Fund to a counterparty, are reflected as a liability on the Statement of Assets and Liabilities. Interest payments made by the Fund to counterparties are recognized as a component of “Interest expense and amortization of offering costs” on the Statement of Operations.
94
In a reverse repurchase agreement, the Fund retains the risk of loss associated with the sold security. In order to minimize risk, the Fund identifies for coverage securities and cash as collateral with a fair value at least equal to its purchase obligations under these agreements (including accrued interest). Reverse repurchase agreements also involve the risk that the purchaser fails to return the securities as agreed upon, files for bankruptcy or becomes insolvent. Upon a bankruptcy or insolvency of a counterparty, the Fund is considered to be an unsecured creditor with respect to excess collateral and as such the return of excess collateral may be delayed. The Fund will identify assets determined to be liquid by the Adviser to cover its obligations under reverse repurchase agreements.
As of the end of the reporting period, the Funds’ outstanding balances on its reverse repurchase agreements were as follows:
| | | | | | | | | | | | | | | | | | | | |
| Fund | | Counterparty | | Rate | | Principal
Amount | | | Maturity* | | | Value | | | Value and
Accrued Interest | |
| JPC | | BNP Paribas | | OBFR + 0.80% | | $ | (102,100,000 | ) | | | N/A | | | $ | (102,100,000 | ) | | $ | (102,318,630 | ) |
| JPI | | BNP Paribas | | OBFR + 0.80% | | | (65,000,000 | ) | | | N/A | | | | (65,000,000 | ) | | | (65,189,978 | ) |
| JPS | | BNP Paribas | | OBFR + 0.80% | | | (275,000,000 | ) | | | N/A | | | | (275,000,000 | ) | | | (275,588,867 | ) |
| NPFD | | Royal Bank of Canada | | 1.900% | | | (103,402,000 | ) | | | 8/4/22 | | | | (103,402,000 | ) | | | (103,887,702 | ) |
| * | The Fund may repurchase the reverse repurchase agreement prior to the maturity date and/or counterparty may accelerate maturity upon pre-specified advance notice. |
During the current fiscal period, the average daily balance outstanding and average annual interest rate on the Funds’ reverse repurchase agreements were as follows:
| | | | | | | | | | | | | | | | |
| | | JPC | | | JPI | | | JPS | | | | |
| Utilization period (days outstanding) | | | 365 | | | | 365 | | | | 365 | | | | 208 | |
| Average daily balance outstanding | | $ | (115,558,630 | ) | | $ | (64,426,301 | ) | | $ | (275,000,000 | ) | | $ | (107,266,712 | ) |
| Average annual interest rate | | | 1.16 | % | | | 1.28 | % | | | 1.21 | % | | | 1.58 | % |
|
2 For the period January 5, 2022 (initial purchase of reverse repurchase agreements) through July 31, 2022. | |
The following table presents the reverse repurchase agreements subject to netting agreements and the collateral delivered related to those reverse repurchase agreements.
| | | | | | | | | | |
| Fund | | Counterparty | | Reverse
Repurchase
Agreements** | | | Collateral
Pledged to
Counterparty | |
| JPC | | BNP Paribas | | $ | (102,318,630 | ) | | $ | 255,549,076 | |
| JPI | | BNP Paribas | | | (65,189,978 | ) | | | 157,389,618 | |
| JPS | | BNP Paribas | | | (275,588,867 | ) | | | 707,100,826 | |
| NPFD | | Royal Bank of Canada | | | (103,887,702 | ) | | | 145,022,279 | |
| ** | Represents gross value and accrued interest for the counterparty as reported in the preceding table. |
10. Inter-Fund Lending
Inter-Fund Borrowing and Lending
The SEC has granted an exemptive order permitting registered
open-end
and
closed-end
Nuveen funds to participate in an inter-fund lending facility whereby the Nuveen funds may directly lend to and borrow money from each other for temporary purposes (e.g., to satisfy redemption requests or when a sale of securities “fails,” resulting in an unanticipated cash shortfall) (the “Inter-Fund Program”). The
closed-end
Nuveen funds, including the Funds covered by this shareholder report, will participate only as lenders, and not as borrowers, in the Inter-Fund Program because such
closed-end
funds rarely, if ever, need to borrow cash to meet redemptions. The Inter-Fund Program is subject to a number of conditions, including, among other things, the requirements that (1) no fund may borrow or lend money through the Inter-Fund Program unless it receives a more favorable interest rate than is typically available from a bank or other financial institution for a comparable transaction; (2) no fund may borrow on an unsecured basis through the Inter-Fund Program unless the fund’s outstanding borrowings from all sources immediately after the inter-fund borrowing total 10% or less of its total assets; provided that if the borrowing fund has a secured borrowing outstanding from any other lender, including but not limited to another fund, the inter-fund loan must be secured on at least an equal priority basis with at least an equivalent percentage of collateral to loan value; (3) if a fund’s total outstanding borrowings immediately after an inter-fund borrowing would be greater than 10% of its total assets, the fund may borrow through the inter-fund loan on a secured basis only; (4) no fund may lend money if the loan would cause its aggregate outstanding loans through the Inter-Fund Program to exceed 15% of its net assets at the time of the loan; (5) a fund’s inter-fund loans to any one fund shall not exceed 5% of the lending fund’s net assets; (6) the duration of inter-fund loans will be limited to the time required to receive payment for securities sold, but in no event more than seven days; and (7) each
95
Notes to Financial Statements
(continued)
inter-fund
loan may be called on one business day’s notice by a lending fund and may be repaid on any day by a borrowing fund. In addition, a Nuveen fund may participate in the Inter-Fund Program only if and to the extent that such participation is consistent with the fund’s investment objective and investment policies. The Board is responsible for overseeing the Inter-Fund Program.
The limitations detailed above and the other conditions of the SEC exemptive order permitting the Inter-Fund Program are designed to minimize the risks associated with Inter-Fund Program for both the lending fund and the borrowing fund. However, no borrowing or lending activity is without risk. When a fund borrows money from another fund, there is a risk that the loan could be called on one day’s notice or not renewed, in which case the fund may have to borrow from a bank at a higher rate or take other actions to payoff such loan if an inter-fund loan is not available from another fund. Any delay in repayment to a lending fund could result in a lost investment opportunity or additional borrowing costs.
During the current reporting period, none of the Funds covered by this shareholder report have entered into any inter-fund loan activity.
11. Subsequent Events
Taxable Fund Preferred TFP Shares Issuance
On August 18, 2022, JPC announced the issuance of $150,000,000 of TFP Shares at liquidation preference, through a private placement with qualified institutional buyers, as defined in Rule 144A under the Securities Act of 1933. The Fund used the net proceeds from the sale of the TFP Shares to repay a portion of its outstanding borrowings.
On September 1, 2022, NPFD announced the issuance of $85,000,000 of TFP Shares at liquidation preference, through a private placement with qualified institutional buyers, as defined in Rule 144A under the Securities Act of 1933. The Fund used the net proceeds from the sale of the TFP Shares to repay a portion of its outstanding borrowings and reverse repurchase agreements.
On August 18, 2022, JPC amended its Borrowings and decreased its maximum commitment amount to $320,000,000.
On September 1, 2022, NPFD amended its Borrowings and decreased it maximum commitment amount to $190,000,000.
96
CURRENT INVESTMENT OBJECTIVES, INVESTMENT POLICIES AND PRINCIPAL RISKS OF THE FUNDS
NUVEEN PREFERRED & INCOME OPPORTUNITIES FUND (JPC)
Investment Objectives
The Fund’s primary investment objective is high current income. The Fund’s secondary investment objective is total return.
Investment Policies
The Fund will invest at least 80% of its Assets (as defined below) in preferred securities and other income producing securities, including hybrid securities such as contingent capital securities and up to 20% in other securities, primarily income-oriented securities such as corporate and taxable municipal debt and common equity.
“Assets” mean the net assets of the Fund plus the amount of any borrowings for investment purposes. “Managed Assets” mean the total assets of the Fund, minus the sum of its accrued liabilities (other than Fund liabilities incurred for the express purpose of creating leverage). Total assets for this purpose shall include assets attributable to the Fund’s use of leverage (whether or not those assets are reflected in the Fund’s financial statements for purposes of generally accepted accounting principles), and derivatives will be valued at their market value.
Under normal circumstances:
| | • | | The Fund will invest at least 50% of its Managed Assets in securities rated investment grade (BBB/Baa and above) at the time of investment. Investment grade quality securities are those securities that, at the time of investment, are (i) rated by at least one nationally recognized statistical rating organization (“NRSRO”) within the four highest grades (Baa or BBB or better by Moody’s Investors Service, Inc. (“Moody’s”), Standard & Poor’s Corporation, a division of The McGraw-Hill Companies (“S&P”), or Fitch Ratings (“Fitch”)), or are unrated but judged to be of comparable quality. |
| | • | | The Fund will invest more than 25% of its Managed Assets in the securities of companies principally engaged in financial services. |
| | • | | The Fund is not limited in the amount of its investments in non-U.S. issuers. The Fund may invest up to 10% of its Managed Assets in non-U.S. dollar-denominated securities. The Fund may invest up to 5% of its Managed Assets in preferred securities issued by companies located in emerging market countries. |
The foregoing policies apply only at the time of any new investment.
Approving Changes in Investment Policies
The Board of Trustees of the Fund may change the policies described above without a shareholder vote. However, with respect to the Fund’s policy of investing at least 80% of its Assets in preferred securities and other income producing securities, such policy may not be changed without 60 days’ prior written notice.
The Fund invests in preferred securities. The Fund may invest in all types of preferred securities, including both traditional preferred securities and
non-traditional
preferred securities. Traditional preferred securities are generally equity securities of the issuer that have priority over the issuer’s common shares as to the payment of dividends (
i.e.
, the issuer cannot pay dividends on its common shares until the dividends on the preferred shares are current) and as to the payout of proceeds of bankruptcy or other liquidation, but are subordinate to an issuer’s senior debt and junior debt as to both types of payments. Additionally, in a bankruptcy or other liquidation, traditional preferred shares are generally subordinate to an issuer’s trade creditors and other general obligations.
Traditional preferred securities pay a dividend, typically contingent both upon declaration by the issuer’s board and at times approval by regulators, and on the existence of current earnings (or retained earnings) in sufficient amount to source the payment. Dividend payments can be either cumulative or
non-cumulative
and can be passed or deferred without limitation at the option of the issuer. Traditional preferred securities typically have no ordinary right to vote for the board of directors, except in some cases voting rights may arise if the issuer fails to pay the preferred share dividends. Traditional preferred securities may be perpetual, or have a term and typically have a fixed liquidation (or “par”) value.
While some preferred securities are issued with a final maturity date, others are perpetual in nature. In certain instances, a final maturity date may be extended and/or the final payment of principal may be deferred at the issuer’s option for a specified time without triggering an event of default for the issuer. No redemption can typically take place unless all cumulative payment obligations to preferred security investors have been met, although issuers may be able to engage in open-market repurchases without regard to any cumulative dividends or interest payable. A portion of the portfolio may include investments in
non-cumulative preferred securities,
whereby the issuer does not have an obligation to make up any arrearages to holders of such securities. Should an issuer default on its obligations under such a security, the amount of income earned by the Fund may be adversely affected.
97
Non-traditional
preferred securities include hybrid preferred securities, contingent convertible capital securities and other types of preferred securities that do not have the traditional features described above. Hybrid-preferred securities often behave similarly as investments in traditional preferred securities and are regarded by market investors as being part of the preferred securities market. Hybrid-preferred securities possess varying combinations of features of both debt and preferred shares and as such they may constitute senior debt, junior debt or preferred shares in an issuer’s capital structure. As such, hybrid-preferred securities may not be subordinate to a company’s debt securities (as are traditional preferred shares). Given the various debt and equity characteristics of hybrid-preferred securities, whether a hybrid-preferred security is classified as debt or equity for purposes of reporting the Fund’s portfolio holdings may be based on the portfolio managers’ determination as to whether its debt or preferred features are preponderant, or based on the assessment of an independent data provider. Such determinations may be subjective.
Hybrid-preferred securities include trust preferred securities. Trust preferred securities are typically issued by corporations, generally in the form of interest-bearing notes with preferred securities characteristics, or by an affiliated business trust of a corporation, generally in the form of beneficial interests in subordinated debentures or similarly structured securities. The trust preferred securities market consists of both fixed and adjustable coupon rate securities that are either perpetual in nature or have stated maturity dates. Trust preferred securities may defer payment of income without triggering an event of default. These securities may have many characteristics of equity due to their subordinated position in an issuer’s capital structure. Trust preferred securities may be issued by trusts or other special purpose entities.
Preferred securities may also include certain forms of debt that have many characteristics of preferred shares, and that are regarded by the investment marketplace to be part of the broader preferred securities market. Among these “preferred securities” are certain exchange-listed debt issues that historically have several attributes, including trading and investment performance characteristics, in common with exchange-listed traditional preferred stock and hybrid-preferred securities. Generally, these types of “preferred securities” are senior debt or junior debt in the capital structure of an issuer.
Preferred securities generally pay fixed or adjustable rate dividends or interest to investors and have preference over common stock in the payment of dividends or interest and generally the liquidation of a company’s assets, which means that a company typically must pay dividends or interest on its preferred securities before paying any dividends on its common stock. As a general matter, dividend or interest payments on preferred securities may be cumulative or
non-cumulative.
The dividend or interest rates on preferred securities may be fixed or floating, or convert from fixed to floating at a specified future time; the Fund may invest without limit in such floating-rate
and fixed-to-floating rate
preferred securities. Floating-rate and
rate preferred securities may be traditional preferred or hybrid-preferred securities. Floating-rate preferred securities pay a rate of income that resets periodically based on short- and/or longer-term interest rate benchmarks. If the associated interest rate benchmark rises, the income received from the security may increase and therefore the return offered by the floating-rate security may rise as well, making such securities less price sensitive to rising interest rates (or yields).
Similarly, a fixed-to-floating rate security
may be less price sensitive to rising interest rates (or yields), because the period over which the rate of payment is fixed is shorter than the maturity term of the bond, after which period a floating rate of payment applies. On the other hand, preferred securities are junior to most other forms of the company’s debt, including both senior and subordinated debt. Because of their subordinated position in the capital structure of an issuer, the ability to defer dividend or interest payments for extended periods of time without triggering an event of default for the issuer, and certain other features, preferred securities may have, at times, risks similar to equity instruments. The Fund’s portfolio of preferred securities may consist of fixed rate preferred and adjustable rate preferred securities.
The preferred securities market continues to evolve. New securities may be developed that may be regarded by market investors as being part of the preferred securities market. Where such securities will fall in the capital structure of the issuer will depend on the structure and characteristics of the new security. For purposes of the Fund’s policy of investing at least 80% of its Assets in preferred securities and other income producing securities, the Fund considers all of the foregoing types of securities that are commonly viewed in the marketplace as preferred securities to be preferred securities, regardless of their classification in the capital structure of the issuer.
Preferred securities are typically issued by corporations, generally in the form of interest or dividend bearing instruments, or by an affiliated business trust of a corporation, generally in the form of beneficial interests in subordinated debentures or similarly structured securities. Preferred securities may either trade
over-the-counter, or trade
on an exchange. The preferred securities market is generally divided into the $25 par “retail” and the $1,000 par “institutional” segments. The $25 par segment is typified by securities that are listed on the New York Stock Exchange (“NYSE”), which trade and are quoted with accrued dividend or interest income, and which are often callable. The institutional segment is typified by $1,000 par value securities that are not exchange-listed. The Fund may invest in preferred securities of either segment.
The Fund may invest in contingent capital securities. Contingent capital securities (sometimes referred to as “CoCos”) are securities issued primarily by
non-U.S.
financial institutions. Specific CoCo structures vary by country of domicile and by each issue. All CoCos have mechanisms that absorb losses or reduces the value of the CoCo due to deterioration of the issuer’s financial condition and status as a going concern. Loss absorption mechanisms, which may include conversion into common equity and principal write-down, are intended for the benefit of the issuer and when triggered will likely negatively impact the value of the CoCo to the detriment of the CoCo investor. Loss absorption mechanisms can be triggered by capital levels or market value metrics of the issuers dropping below a certain predetermined level or at the discretion of the issuer regulator/supervisory entity. Unlike traditional convertible securities, the conversion is not voluntary and the equity conversion or principal write-down features are tailored to the issuer and its
98
regulatory requirements. Due to increased regulatory requirements for higher capital levels for financial institutions, the issuance of CoCo instruments has increased in the last several years and is expected to continue.
The Fund may invest in common stock. Common stock generally represents an equity ownership interest in an issuer. Although common stocks have historically generated higher average total returns than fixed-income securities over the long term, common stocks also have experienced significantly more volatility in those returns and may underperform relative to fixed-income securities during certain periods. An adverse event, such as an unfavorable earnings report, may depress the value of a particular common stock held by the Fund. Also, prices of common stocks are sensitive to general movements in the stock market and a drop in the stock market may depress the price of common stocks to which the Fund has exposure. Common stock prices fluctuate for several reasons including changes in investors’ perceptions of the financial condition of an issuer or the general condition of the relevant stock market, or the occurrence of political or economic events which affect the issuer. In addition, common stock prices may be particularly sensitive to rising interest rates, which increases borrowing costs and the costs of capital.
Additional types of equity securities (other than preferred securities) in which the Fund may invest include convertible securities, real estate investment trusts (“REITs”), warrants, rights, depositary receipts (which reference ownership
of underlying non-U.S. securities) and
other types of securities with equity characteristics. The Fund’s equity investments also may include securities of other investment companies (including
open-end
funds,
closed-end
funds and exchange-traded funds (“ETFs”)).
The Fund will invest in securities of companies primarily engaged in the financial services industry. A financial services company is one that is primarily involved in banking, mortgage finance, consumer finance, specialized finance, investment banking and brokerage, asset management and custody, corporate lending, insurance, financial instruments or real estate, including business development companies (“BDCs”) and REITs.
The Fund may invest in debt securities. The debt securities in which the Fund may invest include corporate debt securities and U.S. government and agency debt securities. Generally, debt securities typically, but not always, possess the following characteristics: a specified maturity or term, at which time the issuer is contractually obligated to pay the associated principal amount of debt to the debtholders; interest payments that are a contractual and enforceable obligation as of the stated payment date, and not contingent either
on payment-by-payment declaration by
the issuer’s board or on the demonstrated existence of company earnings as a source for the payment; and do not entitle the holder to exercise governance of or control over the issuer.
In the capital structure of an issuer, debt securities can be senior debt or junior debt. A senior debt security has priority over any other type of security in a company’s capital structure as to the payment of any promised income (typically denoted as interest) from the issuer, and as to payout of the proceeds of the bankruptcy or other liquidation of the company. At times, the issuer will have pledged specific assets or revenues to secure the rights of the holder of the debt security to payments of interest and principal such that the proceeds of the specific assets or revenues must be used to satisfy these debt obligations prior to being applied to any of the issuer’s other obligations in a bankruptcy or other liquidation. In the event that the assets securing the debt security are not sufficient to fully satisfy such obligations in a bankruptcy or other liquidation, the remainder of such obligations will generally have the same priority as an issuer’s trade creditors and other general obligations, but still have priority of payment relative to the issuer’s preferred shares and common shares. Sometimes referred to as subordinated or mezzanine debt, junior debt stands behind the senior debt as to its rights to receive promised income payments (again, typically denoted as interest) from the issuer, and payouts of the proceeds of bankruptcy or other liquidation, but will have priority of payment relative to the issuer’s preferred shares and common shares.
The Fund may invest in convertible securities. Convertible securities are hybrid securities that combine the investment characteristics of bonds and common stocks. Convertible securities typically consist of debt securities or preferred securities that may be converted within a specified period of time (typically for the entire life of the security) into a certain amount of common stock or other equity security of the same or a different issuer at a predetermined price. They also include debt securities with warrants or common stock attached and derivatives combining features of debt securities and equity securities. Convertible securities entitle the holder to receive interest paid or accrued on debt securities, or dividends paid or accrued on preferred securities, until the securities mature or are redeemed, converted or exchanged.
Before conversion, convertible securities have characteristics similar to nonconvertible income securities in that they ordinarily provide a stable stream of income with generally higher yields than those of common stocks of the same or similar issuers, but lower yields than comparable nonconvertible securities. The value of a convertible security is influenced by changes in interest rates, with investment value generally declining as interest rates increase and increasing as interest rates decline. The credit standing of the issuer and other factors also may have an effect on the convertible security’s investment value. Convertible securities are subordinate in rank to any senior debt obligations of the same issuer and, therefore, an issuer’s convertible securities entail more risk than its debt obligations.
The Fund may invest in REITs. REITs are typically publicly traded corporations or trusts that invest in residential or commercial real estate. REITs generally can be divided into the following three types: (i) equity REITs which invest the majority of their assets directly in real property and derive their income primarily from rents and capital gains or real estate appreciation; (ii) mortgage REITs which invest the majority of their assets in real estate mortgage loans and derive their income primarily from interest payments; and (iii) hybrid REITs which combine the characteristics of equity REITs and mortgage REITs. The Fund can invest in common stock, preferred securities, debt securities and convertible securities issued by REITs.
99
The Fund may invest in securities of foreign issuers through the direct investment in securities of such companies and through depositary receipts. For purposes of identifying foreign issuers, the Fund will use Bloomberg classifications, which employ the following factors listed in order of importance: (i) the country in which the company’s management is located, (ii) the country in which the company’s securities are primarily listed, (iii) the country from which the company primarily receives revenue and (iv) the company’s reporting currency. The Fund may purchase depositary receipts such as American Depositary Receipts (“ADRs”), European Depositary Receipts (“EDRs”) and Global Depositary Receipts (“GDRs”). ADRs, EDRs and GDRs are certificates evidencing ownership of shares of foreign issuers and are alternatives to purchasing directly the underlying foreign securities in their national markets and currencies.
The Fund may invest in securities of emerging markets issuers. Emerging markets issuers are those (i) whose securities are traded principally on a stock exchange or
emerging market country, (ii) organized under the laws of an emerging market country or (iii) whose principal place of business or principal office(s) is in an emerging market country. Emerging market countries include any country other than Canada, the United States and the countries comprising the MSCI EAFE
®
Index (currently, Australia, Austria, Belgium, Denmark, Finland, France, Germany, Hong Kong, Ireland, Israel, Italy, Japan, the Netherlands, New Zealand, Norway, Portugal, Singapore, Spain, Sweden, Switzerland and the United Kingdom).
The Fund may invest in zero coupon bonds. A zero coupon bond is a bond that typically does not pay interest for the entire life of the obligation or for an initial period after the issuance of the obligation.
The Fund may buy and sell securities on a when-issued or delayed delivery basis, making payment or taking delivery at a later date, normally within 15 to 45 days of the trade date.
The Fund may invest in illiquid securities (
i.e.,
securities that are not readily marketable), including, but not limited to, restricted securities (securities the disposition of which is restricted under the federal securities laws), securities that may be resold only pursuant to Rule 144A under the Securities Act of 1933, as amended (the “1933 Act”), and repurchase agreements with maturities in excess of seven days.
The Fund may use derivative instruments to seek to hedge some of the risk of the Fund’s investments or its leverage, to enhance return, to serve as a substitute for a position in an underlying asset, to reduce transaction costs, to manage the Fund’s effective interest rate exposure, to maintain full market exposure, to manage cash flows or to preserve capital. Such instruments may include financial futures contracts, swap contracts (including interest rate and credit default swaps), options on equity securities, options on financial futures or other derivative instruments.
The Fund may also invest in securities of other open-
or closed-end investment
companies (including ETFs) that invest primarily in the types in which the Fund may invest directly, to the extent permitted by the Investment Company Act of 1940, as amended (the “1940 Act”), the rules and regulations issued thereunder and applicable exemptive orders issued by the Securities and Exchange Commission (“SEC”).
The Fund uses leverage to pursue its investment objectives. The Fund may use leverage to the extent permitted by the 1940 Act, including the following forms of leverage: (a) borrowings, including loans from certain financial institutions, and/or the issuance of debt securities; (b) the issuance of preferred shares of beneficial interest (“Preferred Shares”); and (c) engaging in reverse repurchase agreements and economically similar transactions. The Fund also may borrow money for repurchase of its shares or as a temporary measure for extraordinary or emergency purposes, including the payment of dividends and the settlement of securities transactions which otherwise might require untimely dispositions of Fund securities.
Temporary Defensive Periods
During temporary defensive periods, the Fund may invest up to 100% of its assets in high quality, short-term securities, and in short-, intermediate-, or long-term U.S. Treasury securities. There can be no assurance that such techniques will be successful. Accordingly, during such periods, the Fund may not achieve its investment objectives.
100
NUVEEN PREFERRED AND INCOME TERM FUND (JPI)
Investment Objectives
The Fund’s investment objective is to provide a high level of current income and total return.
Investment Policies
The Fund will invest at least 80% of its Assets (as defined below) in preferred securities and other income producing securities issued by U.S. and
non-U.S.
companies, including debt securities, hybrid securities and convertible securities.
On or before August 31, 2024 (the “Termination Date”), the Fund intends to cease its investment operations, liquidate its portfolio, retire or redeem leverage facilities and distribute substantially all of its net assets to shareholders of record as of the date of termination. The Fund’s Termination Date may be extended for one period of up to 12 months by a vote of the Board of Trustees, if the Fund’s Board of Trustees determines it is in the best interest of the shareholders to do so. The Fund’s term may not be extended further than one period without a shareholder vote. The amount distributed to common shareholders at the termination of the Fund will be based on the Fund’s net asset value (“NAV”) at that time. Depending upon a variety of factors, including the performance of the Fund’s portfolio over the life of the Fund, the amount distributed to common shareholders at the termination of the Fund may be less, and potentially significantly less, than their original investment. As the Fund approaches the Termination Date, its monthly distributions are likely to decline.
“Assets” mean the net assets of the Fund plus the amount of any borrowings for investment purposes. “Managed Assets” mean the total assets of the Fund, minus the sum of its accrued liabilities (other than Fund liabilities incurred for the express purpose of creating leverage). Total assets for this purpose shall include assets attributable to the Fund’s use of leverage (whether or not those assets are reflected in the Fund’s financial statements for purposes of generally accepted accounting principles), and derivatives will be valued at their market value.
Under normal circumstances:
| | • | | The Fund may invest up to 20% of its Managed Assets in securities issued by federal, state and local governments and U.S. government agencies. |
| | • | | The Fund invests at least 50% of its Managed Assets in securities rated investment grade (BBB-/Baa3 or higher) at the time of purchase. A security is considered to have the highest rating assigned to it by a rating agency or, in the case of an unrated security, to have the same rating as rated securities judged by the Fund’s sub-adviser to be of comparable quality. |
| | • | | The Fund may invest up to 10% of its Managed Assets in securities rated below B-/B3 at the time of purchase. |
| | • | | The Fund may invest up to 10% of its Managed Assets in securities of issuers in emerging market countries. |
| | • | | The Fund will invest 100% of its Managed Assets in U.S. dollar denominated securities. |
| | • | | The Fund may invest up to 10% of its total assets in securities of other open- or closed-end investment companies (including ETFs) that invest primarily in securities of the types in which the Fund may invest directly. |
The foregoing policies apply only at the time of any new investment.
Approving Changes in Investment Policies
The Board of Trustees of the Fund may change the policies described above without a shareholder vote. However, with respect to the Fund’s policy of investing at least 80% of its Assets in preferred securities and other income producing securities, such policy may not be changed without 60 days’ prior written notice.
The Fund invests in preferred securities. The Fund may invest in all types of preferred securities, including both traditional preferred securities and
non-traditional
preferred securities. Traditional preferred securities are generally equity securities of the issuer that have priority over the issuer’s common shares as to the payment of dividends (
i.e.
, the issuer cannot pay dividends on its common shares until the dividends on the preferred shares are current) and as to the payout of proceeds of bankruptcy or other liquidation, but are subordinate to an issuer’s senior debt and junior debt as to both types of payments. Additionally, in a bankruptcy or other liquidation, traditional preferred shares are generally subordinate to an issuer’s trade creditors and other general obligations.
Traditional preferred securities pay a dividend, typically contingent both upon declaration by the issuer’s board and at times approval by regulators, and on the existence of current earnings (or retained earnings) in sufficient amount to source the payment. Dividend payments can be either cumulative or
non-cumulative
and can be passed or deferred without limitation at the option of the issuer. Traditional preferred securities typically have no ordinary right to vote for the board of directors, except in some cases voting rights may arise if the issuer fails to pay the preferred share dividends. Traditional preferred securities may be perpetual, or have a term and typically have a fixed liquidation (or “par”) value.
101
While some preferred securities are issued with a final maturity date, others are perpetual in nature. In certain instances, a final maturity date may be extended and/or the final payment of principal may be deferred at the issuer’s option for a specified time without triggering an event of default for the issuer. No redemption can typically take place unless all cumulative payment obligations to preferred security investors have been met, although issuers may be able to engage in open-market repurchases without regard to any cumulative dividends or interest payable. A portion of the portfolio may include investments in
non-cumulative
preferred securities, whereby the issuer does not have an obligation to make up any arrearages to holders of such securities. Should an issuer default on its obligations under such a security, the amount of income earned by the Fund may be adversely affected. Non-traditional preferred securities include hybrid preferred securities, contingent convertible capital securities and other types of preferred securities that do not have the traditional features described above. Hybrid-preferred securities often behave similarly as investments in traditional preferred securities and are regarded by market investors as being part of the preferred securities market. Hybrid-preferred securities possess varying combinations of features of both debt and preferred shares and as such they may constitute senior debt, junior debt or preferred shares in an issuer’s capital structure. As such, hybrid-preferred securities may not be subordinate to a company’s debt securities (as are traditional preferred shares). Given the various debt and equity characteristics of hybrid-preferred securities, whether a hybrid-preferred security is classified as debt or equity for purposes of reporting the Fund’s portfolio holdings may be based on the portfolio managers’ determination as to whether its debt or preferred features are preponderant, or based on the assessment of an independent data provider. Such determinations may be subjective.
Hybrid-preferred securities include trust preferred securities. Trust preferred securities are typically issued by corporations, generally in the form of interest-bearing notes with preferred securities characteristics, or by an affiliated business trust of a corporation, generally in the form of beneficial interests in subordinated debentures or similarly structured securities. The trust preferred securities market consists of both fixed and adjustable coupon rate securities that are either perpetual in nature or have stated maturity dates. Trust preferred securities may defer payment of income without triggering an event of default. These securities may have many characteristics of equity due to their subordinated position in an issuer’s capital structure. Trust preferred securities may be issued by trusts or other special purpose entities.
Preferred securities may also include certain forms of debt that have many characteristics of preferred shares, and that are regarded by the investment marketplace to be part of the broader preferred securities market. Among these “preferred securities” are certain exchange-listed debt issues that historically have several attributes, including trading and investment performance characteristics, in common with exchange-listed traditional preferred stock and hybrid-preferred securities. Generally, these types of “preferred securities” are senior debt or junior debt in the capital structure of an issuer.
Preferred securities generally pay fixed or adjustable rate dividends or interest to investors and have preference over common stock in the payment of dividends or interest and generally the liquidation of a company’s assets, which means that a company typically must pay dividends or interest on its preferred securities before paying any dividends on its common stock. As a general matter, dividend or interest payments on preferred securities may be cumulative or
non-cumulative.
The dividend or interest rates on preferred securities may be fixed or floating, or convert from fixed to floating at a specified future time; the Fund may invest without limit in such floating-rate and
rate preferred securities. Floating-rate and
rate preferred securities may be traditional preferred or hybrid-preferred securities. Floating-rate preferred securities pay a rate of income that resets periodically based on short- and/or longer-term interest rate benchmarks. If the associated interest rate benchmark rises, the income received from the security may increase and therefore the return offered by the floating-rate security may rise as well, making such securities less price sensitive to rising interest rates (or yields). Similarly, a
fixed-to-floating rate security
may be less price sensitive to rising interest rates (or yields), because the period over which the rate of payment is fixed is shorter than the maturity term of the bond, after which period a floating rate of payment applies. On the other hand, preferred securities are junior to most other forms of the company’s debt, including both senior and subordinated debt. Because of their subordinated position in the capital structure of an issuer, the ability to defer dividend or interest payments for extended periods of time without triggering an event of default for the issuer, and certain other features, preferred securities may have, at times, risks similar to equity instruments. The Fund’s portfolio of preferred securities may consist of fixed rate preferred and adjustable rate preferred securities.
The preferred securities market continues to evolve. New securities may be developed that may be regarded by market investors as being part of the preferred securities market. Where such securities will fall in the capital structure of the issuer will depend on the structure and characteristics of the new security. For purposes of the Fund’s policy of investing at least 80% of its Assets in preferred securities and other income producing securities, the Fund considers all of the foregoing types of securities that are commonly viewed in the marketplace as preferred securities to be preferred securities, regardless of their classification in the capital structure of the issuer.
Preferred securities are typically issued by corporations, generally in the form of interest or dividend bearing instruments, or by an affiliated business trust of a corporation, generally in the form of beneficial interests in subordinated debentures or similarly structured securities. Preferred securities may either trade
over-the-counter, or trade
on an exchange. The preferred securities market is generally divided into the $25 par “retail” and the $1,000 par “institutional” segments. The $25 par segment is typified by securities that are listed on the NYSE, which trade and are quoted with accrued dividend or interest income, and which are often callable. The institutional segment is typified by $1,000 par value securities that are not exchange-listed. The Fund may invest in preferred securities of either segment.
102
The Fund may invest in contingent capital securities. Contingent capital securities (sometimes referred to as “CoCos”) are securities issued primarily by
non-U.S.
financial institutions. Specific CoCo structures vary by country of domicile and by each issue. All CoCos have mechanisms that absorb losses or reduces the value of the CoCo due to deterioration of the issuer’s financial condition and status as a going concern. Loss absorption mechanisms, which may include conversion into common equity and principal write-down, are intended for the benefit of the issuer and when triggered will likely negatively impact the value of the CoCo to the detriment of the CoCo investor. Loss absorption mechanisms can be triggered by capital levels or market value metrics of the issuers dropping below a certain predetermined level or at the discretion of the issuer regulator/supervisory entity. Unlike traditional convertible securities, the conversion is not voluntary and the equity conversion or principal write-down features are tailored to the issuer and its regulatory requirements. Due to increased regulatory requirements for higher capital levels for financial institutions, the issuance of CoCo instruments has increased in the last several years and is expected to continue.
The Fund may invest in taxable municipal bonds. States, local governments and municipalities issue municipal bonds to raise money for certain purposes. Municipal bonds issued to finance activities with a broad public purpose are generally exempt from federal income tax. Taxable municipal bonds, however, are issued to finance activities with less significant benefits to the public, such as the construction of sports facilities, and as such the interest paid to holders of such bonds is taxable as ordinary income. Many taxable municipal bonds offer yields comparable to those of other taxable bonds, such as corporate and agency bonds. Taxable municipal bonds may be rated investment-grade or below investment-grade and pay interest based on fixed or floating rate coupons. Maturities may range from long-term to short-term.
The Fund may invest in high yield bonds. Bonds that are rated lower than investment grade are commonly referred to as high yield bonds or junk bonds. These bonds generally provide high income in an effort to compensate investors for their higher risk of default, which is the failure to make required interest or principal payments. High yield bond issuers include small or relatively new companies lacking the history or capital to merit investment-grade status, former blue chip companies downgraded because of financial problems, companies electing to borrow heavily to finance or avoid a takeover or buyout, and firms with heavy debt loads.
The Fund may invest in U.S. Government securities. U.S. Government securities include (1) U.S. Treasury obligations, which differ in their interest rates, maturities and times of issuance: U.S. Treasury bills (maturities of one year or less), U.S. Treasury notes (maturities of one year to ten years) and U.S. Treasury bonds (generally maturities of greater than ten years) and (2) obligations issued or guaranteed by U.S. Government agencies and instrumentalities that are supported by any of the following: (i) the full faith and credit of the U.S. Treasury, (ii) the right of the issuer to borrow an amount limited to a specific line of credit from the U.S. Treasury, (iii) discretionary authority of the U.S. Government to purchase certain obligations of the U.S. Government agency or instrumentality or (iv) the credit of the agency or instrumentality.
The Fund will invest in securities of companies primarily engaged in the financial services industry. A financial services company is one that is primarily involved in banking, mortgage finance, consumer finance, specialized finance, investment banking and brokerage, asset management and custody, corporate lending, insurance, financial instruments or real estate, including business development companies BDCs and REITs.
The Fund may invest in other equity securities, including common stock, convertible securities, hybrid securities (which have characteristics of both equity and fixed-income instruments), warrants, rights and depositary receipts (which reference ownership of underlying
non-U.S.
securities).
The Fund may invest in corporate debt securities. Corporate debt securities are fully taxable debt obligations issued by corporations. These securities fund capital improvements, expansions, debt refinancing or acquisitions that require more capital than would ordinarily be available from a single lender. Investors in corporate debt securities lend money to the issuing corporation in exchange for interest payments and repayment of the principal at a set maturity date. Rates on corporate debt securities are set according to prevailing interest rates at the time of the issue, the credit rating of the issuer, the length of the maturity and other terms of the security, such as a call feature. Corporate debt securities are subject to the risk of an issuer’s inability to meet principal and interest payments on the obligations and may also be subject to price volatility due to such factors as market interest rates, market perception of the creditworthiness of the issuer and general market liquidity. In addition, corporate restructurings, such as mergers, leveraged buyouts, takeovers or similar corporate transactions are often financed by an increase in a corporate issuer’s indebtedness. As a result of the added debt burden, the credit quality and market value of an issuer’s existing debt securities may decline significantly.
The Fund may invest in convertible securities. Convertible securities are hybrid securities that combine the investment characteristics of bonds and common stocks. Convertible securities typically consist of debt securities or preferred securities that may be converted within a specified period of time (typically for the entire life of the security) into a certain amount of common stock or other equity security of the same or a different issuer at a predetermined price. They also include debt securities with warrants or common stock attached and derivatives combining features of debt securities and equity securities. Convertible securities entitle the holder to receive interest paid or accrued on debt securities, or dividends paid or accrued on preferred securities, until the securities mature or are redeemed, converted or exchanged.
Before conversion, convertible securities have characteristics similar to nonconvertible income securities in that they ordinarily provide a stable stream of income with generally higher yields than those of common stocks of the same or similar issuers, but lower yields than comparable nonconvertible securities. The value of a convertible security is influenced by changes in interest rates, with investment value generally declining as interest rates increase
103
and increasing as interest rates decline. The credit standing of the issuer and other factors also may have an effect on the convertible security’s investment value. Convertible securities are subordinate in rank to any senior debt obligations of the same issuer and, therefore, an issuer’s convertible securities entail more risk than its debt obligations.
The Fund may invest in REITs. REITs are typically publicly traded corporations or trusts that invest in residential or commercial real estate. REITs generally can be divided into the following three types: (i) equity REITs which invest the majority of their assets directly in real property and derive their income primarily from rents and capital gains or real estate appreciation; (ii) mortgage REITs which invest the majority of their assets in real estate mortgage loans and derive their income primarily from interest payments; and (iii) hybrid REITs which combine the characteristics of equity REITs and mortgage REITs. The Fund can invest in common stock, preferred securities, debt securities and convertible securities issued by REITs.
The Fund may invest in securities of foreign issuers through the direct investment in securities of such companies and through depositary receipts. For purposes of identifying foreign issuers, the Fund will use Bloomberg classifications, which employ the following factors listed in order of importance: (i) the country in which the company’s management is located, (ii) the country in which the company’s securities are primarily listed, (iii) the country from which the company primarily receives revenue and (iv) the company’s reporting currency. The Fund may purchase depositary receipts such as ADRs, EDRs and GDRs. ADRs, EDRs and GDRs are certificates evidencing ownership of shares of foreign issuers and are alternatives to purchasing directly the underlying foreign securities in their national markets and currencies.
The Fund may invest in securities of emerging markets issuers. Emerging markets issuers are those (i) whose securities are traded principally on a stock exchange or
emerging market country, (ii) organized under the laws of an emerging market country or (iii) whose principal place of business or principal office(s) is in an emerging market country. Emerging market countries include any country other than Canada, the United States and the countries comprising the MSCI EAFE
®
Index (currently, Australia, Austria, Belgium, Denmark, Finland, France, Germany, Hong Kong, Ireland, Israel, Italy, Japan, the Netherlands, New Zealand, Norway, Portugal, Singapore, Spain, Sweden, Switzerland and the United Kingdom).
The Fund may invest in zero coupon bonds. A zero coupon bond is a bond that typically does not pay interest for the entire life of the obligation or for an initial period after the issuance of the obligation.
The Fund may buy and sell securities on a when-issued or delayed delivery basis, making payment or taking delivery at a later date, normally within 15 to 45 days of the trade date.
The Fund may invest in illiquid securities (
i.e.,
securities that are not readily marketable), including, but not limited to, restricted securities (securities the disposition of which is restricted under the federal securities laws), securities that may be resold only pursuant to Rule 144A under the 1933 Act, and repurchase agreements with maturities in excess of seven days.
The Fund also may invest in certain derivative instruments in pursuit of its investment objective. Such instruments may include financial futures contracts, swap contracts (including interest rate and credit default swaps), options on financial futures, options on swap contracts, or other derivative instruments. The Fund may use derivative instruments to, among other things, seek to enhance return, to hedge some of the risk of the Fund’s investments or as a substitute for a position in the underlying asset.
The Fund may also invest in securities of other open-
or closed-end investment
companies (including ETFs) that invest primarily in the types in which the Fund may invest directly, to the extent permitted by the 1940 Act, the rules and regulations issued thereunder and applicable exemptive orders issued by the SEC.
The Fund uses leverage to pursue its investment objective. The Fund’s use of leverage will not exceed 38% of Managed Assets. The Fund may source leverage through a number of methods including through borrowings, issuing Preferred Shares and the issuance of debt securities. In addition, the Fund may use derivatives that may have the economic effect of leverage. The amount and sources of leverage will vary depending on market conditions.
Temporary Defensive Periods
During temporary defensive periods, the Fund may invest up to 100% of its assets in high quality, short-term securities, and in short-, intermediate-, or long-term U.S. Treasury securities. There can be no assurance that such techniques will be successful. Accordingly, during such periods, the Fund may not achieve its investment objective.
104
NUVEEN PREFERRED & INCOME SECURITIES FUND (JPS)
Investment Objectives
The Fund’s primary investment objective is high current income consistent with capital preservation. The Fund’s secondary investment objective is to enhance portfolio value relative to the market for preferred securities by investing in (i) securities that the
Fund’s sub-adviser
believes are underrated or undervalued or (ii) sectors that the Fund’s
Sub-Adviser believes
are undervalued.
Investment Policies
The Fund will invest at least 80% of its Assets (as defined below) in preferred securities and other income producing securities, including hybrid securities such as contingent capital securities.
“Assets” mean the net assets of the Fund plus the amount of any borrowings for investment purposes. “Managed Assets” mean the total assets of the Fund, minus the sum of its accrued liabilities (other than Fund liabilities incurred for the express purpose of creating leverage). Total assets for this purpose shall include assets attributable to the Fund’s use of leverage (whether or not those assets are reflected in the Fund’s financial statements for purposes of generally accepted accounting principles), and derivatives will be valued at their market value.
Under normal circumstances:
| | • | | The Fund will invest at least 50% of its Managed Assets in securities rated investment grade (BBB/Baa and above) at the time of investment. Investment grade quality securities are those securities that, at the time of investment, are rated by at least one NRSRO within the four highest grades (Baa or BBB or better by Moody’s, S&P, or Fitch), or are unrated but judged to be of comparable quality by the Fund’s investment adviser or sub-adviser. The Fund may invest in securities of below investment grade quality, commonly referred to as “high yield” or “junk” bonds, which are regarded as having predominantly speculative characteristics with respect to the issuer’s capacity to pay interest and repay principal when due, and they are more susceptible to default or decline in market value due to adverse economic and business developments than investment grade securities. |
| | • | | The Fund will invest more than 25% of its Managed Assets in the securities of companies principally engaged in financial services. |
| | • | | The Fund may invest without limit in U.S. dollar denominated securities of foreign issuers. |
| | • | | The Fund, in implementing its hedging strategies, may enter into futures transactions with a notional principal amount that will not exceed 35% of its Managed Assets, and may invest in options on futures the purchase of which will not exceed 0.5% of its Managed Assets in any calendar quarter. |
The foregoing policies apply only at the time of any new investment.
Approving Changes in Investment Policies
The Board of Trustees of the Fund may change the policies described above without a shareholder vote. However, with respect to the Fund’s policy of investing at least 80% of its Assets in preferred securities and other income producing securities, such policy may not be changed without 60 days’ prior written notice.
The Fund invests in preferred securities. The Fund may invest in all types of preferred securities, including both traditional preferred securities and
non-traditional preferred
securities. Traditional preferred securities are generally equity securities of the issuer that have priority over the issuer’s common shares as to the payment of dividends (
i.e.
, the issuer cannot pay dividends on its common shares until the dividends on the preferred shares are current) and as to the payout of proceeds of bankruptcy or other liquidation, but are subordinate to an issuer’s senior debt and junior debt as to both types of payments. Additionally, in a bankruptcy or other liquidation, traditional preferred shares are generally subordinate to an issuer’s trade creditors and other general obligations.
Traditional preferred securities pay a dividend, typically contingent both upon declaration by the issuer’s board and at times approval by regulators, and on the existence of current earnings (or retained earnings) in sufficient amount to source the payment. Dividend payments can be either cumulative or
non-cumulative
and can be passed or deferred without limitation at the option of the issuer. Traditional preferred securities typically have no ordinary right to vote for the board of directors, except in some cases voting rights may arise if the issuer fails to pay the preferred share dividends. Traditional preferred securities may be perpetual, or have a term and typically have a fixed liquidation (or “par”) value.
While some preferred securities are issued with a final maturity date, others are perpetual in nature. In certain instances, a final maturity date may be extended and/or the final payment of principal may be deferred at the issuer’s option for a specified time without triggering an event of default for the issuer. No redemption can typically take place unless all cumulative payment obligations to preferred security investors have been met, although issuers may be able to engage in open-market repurchases without regard to any cumulative dividends or interest payable. A portion of the portfolio may include
105
investments in
non-cumulative preferred securities,
whereby the issuer does not have an obligation to make up any arrearages to holders of such securities. Should an issuer default on its obligations under such a security, the amount of income earned by the Fund may be adversely affected.
Non-traditional preferred
securities include hybrid preferred securities, contingent convertible capital securities and other types of preferred securities that do not have the traditional features described above. Hybrid-preferred securities often behave similarly as investments in traditional preferred securities and are regarded by market investors as being part of the preferred securities market. Hybrid-preferred securities possess varying combinations of features of both debt and preferred shares and as such they may constitute senior debt, junior debt or preferred Shares in an issuer’s capital structure. As such, hybrid-preferred securities may not be subordinate to a company’s debt securities (as are traditional preferred shares). Given the various debt and equity characteristics of hybrid-preferred securities, whether a hybrid-preferred security is classified as debt or equity for purposes of reporting the Fund’s portfolio holdings may be based on the portfolio managers’ determination as to whether its debt or preferred features are preponderant, or based on the assessment of an independent data provider. Such determinations may be subjective.
Hybrid-preferred securities include trust preferred securities. Trust preferred securities are typically issued by corporations, generally in the form of interest-bearing notes with preferred securities characteristics, or by an affiliated business trust of a corporation, generally in the form of beneficial interests in subordinated debentures or similarly structured securities. The trust preferred securities market consists of both fixed and adjustable coupon rate securities that are either perpetual in nature or have stated maturity dates. Trust preferred securities may defer payment of income without triggering an event of default. These securities may have many characteristics of equity due to their subordinated position in an issuer’s capital structure. Trust preferred securities may be issued by trusts or other special purpose entities.
Preferred securities may also include certain forms of debt that have many characteristics of preferred shares, and that are regarded by the investment marketplace to be part of the broader preferred securities market. Among these “preferred securities” are certain exchange-listed debt issues that historically have several attributes, including trading and investment performance characteristics, in common with exchange-listed traditional preferred stock and hybrid-preferred securities. Generally, these types of “preferred securities” are senior debt or junior debt in the capital structure of an issuer.
Preferred securities generally pay fixed or adjustable rate dividends or interest to investors and have preference over common stock in the payment of dividends or interest and generally the liquidation of a company’s assets, which means that a company typically must pay dividends or interest on its preferred securities before paying any dividends on its common stock. As a general matter, dividend or interest payments on preferred securities may be cumulative or
non-cumulative. The
dividend or interest rates on preferred securities may be fixed or floating, or convert from fixed to floating at a specified future time; the Fund may invest without limit in such floating-rate
and fixed-to-floating rate
preferred securities. Floating-rate and
fixed-to-floating rate preferred
securities may be traditional preferred or hybrid-preferred securities. Floating-rate preferred securities pay a rate of income that resets periodically based on short- and/or longer-term interest rate benchmarks. If the associated interest rate benchmark rises, the income received from the security may increase and therefore the return offered by the floating-rate security may rise as well, making such securities less price sensitive to rising interest rates (or yields).
Similarly, a fixed-to-floating rate security
may be less price sensitive to rising interest rates (or yields), because the period over which the rate of payment is fixed is shorter than the maturity term of the bond, after which period a floating rate of payment applies. On the other hand, preferred securities are junior to most other forms of the company’s debt, including both senior and subordinated debt. Because of their subordinated position in the capital structure of an issuer, the ability to defer dividend or interest payments for extended periods of time without triggering an event of default for the issuer, and certain other features, preferred securities may have, at times, risks similar to equity instruments. The Fund’s portfolio of preferred securities may consist of fixed rate preferred and adjustable rate preferred securities.
The preferred securities market continues to evolve. New securities may be developed that may be regarded by market investors as being part of the preferred securities market. Where such securities will fall in the capital structure of the issuer will depend on the structure and characteristics of the new security. For purposes of the Fund’s policy of investing at least 80% of its Assets in preferred securities and other income producing securities, the Fund considers all of the foregoing types of securities that are commonly viewed in the marketplace as preferred securities to be preferred securities, regardless of their classification in the capital structure of the issuer.
Preferred securities are typically issued by corporations, generally in the form of interest or dividend bearing instruments, or by an affiliated business trust of a corporation, generally in the form of beneficial interests in subordinated debentures or similarly structured securities. Preferred securities may either trade
over-the-counter, or trade
on an exchange. The preferred securities market is generally divided into the $25 par “retail” and the $1,000 par “institutional” segments. The $25 par segment is typified by securities that are listed on the NYSE, which trade and are quoted with accrued dividend or interest income, and which are often callable. The institutional segment is typified by $1,000 par value securities that are not exchange-listed. The Fund may invest in preferred securities of either segment.
The Fund may invest in contingent capital securities. Contingent capital securities (sometimes referred to as “CoCos”) are securities issued primarily by
non-U.S.
financial institutions. Specific CoCo structures vary by country of domicile and by each issue. All CoCos have mechanisms that absorb losses or reduces the value of the CoCo due to deterioration of the issuer’s financial condition and status as a going concern. Loss absorption mechanisms, which may include conversion into common equity and principal write-down, are intended for the benefit of the issuer and when triggered will likely negatively impact the value of the CoCo to the detriment of the CoCo investor. Loss absorption mechanisms can be triggered by capital levels or market value
106
metrics of the issuers dropping below a certain predetermined level or at the discretion of the issuer regulator/supervisory entity. Unlike traditional convertible securities, the conversion is not voluntary and the equity conversion or principal write-down features are tailored to the issuer and its regulatory requirements. Due to increased regulatory requirements for higher capital levels for financial institutions, the issuance of CoCo instruments has increased in the last several years and is expected to continue.
The Fund may invest in common stock. Common stock generally represents an equity ownership interest in an issuer. Although common stocks have historically generated higher average total returns than fixed-income securities over the long term, common stocks also have experienced significantly more volatility in those returns and may underperform relative to fixed-income securities during certain periods. An adverse event, such as an unfavorable earnings report, may depress the value of a particular common stock held by the Fund. Also, prices of common stocks are sensitive to general movements in the stock market and a drop in the stock market may depress the price of common stocks to which the Fund has exposure. Common stock prices fluctuate for several reasons including changes in investors’ perceptions of the financial condition of an issuer or the general condition of the relevant stock market, or the occurrence of political or economic events which affect the issuer. In addition, common stock prices may be particularly sensitive to rising interest rates, which increases borrowing costs and the costs of capital.
Additional types of equity securities (other than preferred securities) in which the Fund may invest include convertible securities (discussed below), REITs, warrants, rights, depositary receipts (which reference ownership
of underlying non-U.S. securities) and
other types of securities with equity characteristics. The Fund’s equity investments also may include securities of other investment
companies (including open-end funds, closed-end funds and
ETFs).
The Fund may invest in debt securities. Debt securities in which the Fund may invest include corporate debt securities and U.S. government and agency debt securities. Generally, debt securities typically, but not always, possess the following characteristics: a specified maturity or term, at which time the issuer is contractually obligated to pay the associated principal amount of debt to the debtholders; interest payments that are a contractual and enforceable obligation as of the stated payment date, and not contingent
either on payment-by-payment declaration by
the issuer’s board or on the demonstrated existence of company earnings as a source for the payment; and do not entitle the holder to exercise governance of or control over the issuer.
In the capital structure of an issuer, debt securities can be senior debt or junior debt. A senior debt security has priority over any other type of security in a company’s capital structure as to the payment of any promised income (typically denoted as interest) from the issuer, and as to payout of the proceeds of the bankruptcy or other liquidation of the company. At times, the issuer will have pledged specific assets or revenues to secure the rights of the holder of the debt security to payments of interest and principal such that the proceeds of the specific assets or revenues must be used to satisfy these debt obligations prior to being applied to any of the issuer’s other obligations in a bankruptcy or other liquidation. In the event that the assets securing the debt security are not sufficient to fully satisfy such obligations in a bankruptcy or other liquidation, the remainder of such obligations will generally have the same priority as an issuer’s trade creditors and other general obligations, but still have priority of payment relative to the issuer’s preferred shares and common shares. Sometimes referred to as subordinated or mezzanine debt, junior debt stands behind the senior debt as to its rights to receive promised income payments (again, typically denoted as interest) from the issuer, and payouts of the proceeds of bankruptcy or other liquidation, but will have priority of payment relative to the issuer’s preferred shares and common shares.
The Fund will invest in securities of companies primarily engaged in the financial services industry. A financial services company is one that is primarily involved in banking, mortgage finance, consumer finance, specialized finance, investment banking and brokerage, asset management and custody, corporate lending, insurance, financial instruments or real estate, including business development companies BDCs and REITs.
The Fund may invest in convertible securities. Convertible securities are hybrid securities that combine the investment characteristics of bonds and common stocks. Convertible securities typically consist of debt securities or preferred securities that may be converted within a specified period of time (typically for the entire life of the security) into a certain amount of common stock or other equity security of the same or a different issuer at a predetermined price. They also include debt securities with warrants or common stock attached and derivatives combining features of debt securities and equity securities. Convertible securities entitle the holder to receive interest paid or accrued on debt securities, or dividends paid or accrued on preferred securities, until the securities mature or are redeemed, converted or exchanged.
Before conversion, convertible securities have characteristics similar to nonconvertible income securities in that they ordinarily provide a stable stream of income with generally higher yields than those of common stocks of the same or similar issuers, but lower yields than comparable nonconvertible securities. The value of a convertible security is influenced by changes in interest rates, with investment value generally declining as interest rates increase and increasing as interest rates decline. The credit standing of the issuer and other factors also may have an effect on the convertible security’s investment value. Convertible securities are subordinate in rank to any senior debt obligations of the same issuer and, therefore, an issuer’s convertible securities entail more risk than its debt obligations.
The Fund may invest in REITs. REITs are typically publicly traded corporations or trusts that invest in residential or commercial real estate. REITs generally can be divided into the following three types: (i) equity REITs which invest the majority of their assets directly in real property and derive their income primarily from rents and capital gains or real estate appreciation; (ii) mortgage REITs which invest the majority of their assets in real estate mortgage loans
107
and derive their income primarily from interest payments; and (iii) hybrid REITs which combine the characteristics of equity REITs and mortgage REITs. The Fund can invest in common stock, preferred securities, debt securities and convertible securities issued by REITs.
The Fund may invest in securities of foreign issuers through the direct investment in securities of such companies and through depositary receipts. For purposes of identifying foreign issuers, the Fund will use Bloomberg classifications, which employ the following factors listed in order of importance: (i) the country in which the company’s management is located, (ii) the country in which the company’s securities are primarily listed, (iii) the country from which the company primarily receives revenue and (iv) the company’s reporting currency. The Fund may purchase depositary receipts such as ADRs, EDRs and GDRs. ADRs, EDRs and GDRs are certificates evidencing ownership of shares of foreign issuers and are alternatives to purchasing directly the underlying foreign securities in their national markets and currencies.
The Fund may invest in securities of emerging markets issuers. Emerging markets issuers are those (i) whose securities are traded principally on a stock exchange or
emerging market country, (ii) organized under the laws of an emerging market country or (iii) whose principal place of business or principal office(s) is in an emerging market country. Emerging market countries include any country other than Canada, the United States and the countries comprising the MSCI EAFE
®
Index (currently, Australia, Austria, Belgium, Denmark, Finland, France, Germany, Hong Kong, Ireland, Israel, Italy, Japan, the Netherlands, New Zealand, Norway, Portugal, Singapore, Spain, Sweden, Switzerland and the United Kingdom).
The Fund may invest in zero coupon bonds. A zero coupon bond is a bond that typically does not pay interest for the entire life of the obligation or for an initial period after the issuance of the obligation.
The Fund may buy and sell securities on a when-issued or delayed delivery basis, making payment or taking delivery at a later date, normally within 15 to 45 days of the trade date.
The Fund may invest in illiquid securities (
i.e.,
securities that are not readily marketable), including, but not limited to, restricted securities (securities the disposition of which is restricted under the federal securities laws), securities that may be resold only pursuant to Rule 144A under the 1933 Act, and repurchase agreements with maturities in excess of seven days.
The Fund may engage in hedging transactions from time to time. The use of derivatives for purposes of hedging the portfolio will be restricted to reducing the portfolio’s exposure to interest rates. The Fund also may enter into interest rate swap transactions, including forward starting swaps, in which the entire swap is scheduled to start at a later date, and deferred swaps in which the parties do not exchange payments until a future date.
The Fund may also invest in securities of other open-
or closed-end investment
companies (including ETFs) that invest primarily in the types in which the Fund may invest directly, to the extent permitted by the 1940 Act, the rules and regulations issued thereunder and applicable exemptive orders issued by the SEC.
The Fund uses leverage to pursue its investment objectives. The Fund may use leverage to the extent permitted by the 1940 Act, including the following forms of leverage: (a) borrowings, including loans from certain financial institutions, and/or the issuance of debt securities; (b) the issuance of Preferred Shares; and (c) engaging in reverse repurchase agreements and economically similar transactions. The Fund also may borrow money for repurchase of its shares or as a temporary measure for extraordinary or emergency purposes, including the payment of dividends and the settlement of securities transactions which otherwise might require untimely dispositions of Fund securities.
Temporary Defensive Periods
During temporary defensive periods, the Fund may invest up to 100% of its assets in high quality, short-term securities, and in short-, intermediate-, or long-term U.S. Treasury securities. There can be no assurance that such techniques will be successful. Accordingly, during such periods, the Fund may not achieve its investment objectives.
108
NUVEEN PREFERRED AND INCOME FUND (formerly known as NUVEEN PREFERRED AND INCOME 2022 TERM FUND) (JPT)
Investment Objectives
The Fund’s investment objective is to provide a high level of current income and total return.
Investment Policies
The Fund will invest at least 80% of its Assets (as defined below) in preferred securities and other income producing securities, including hybrid securities such as contingent capital securities (sometimes referred to as “CoCos”).
“Assets” mean the net assets of the Fund plus the amount of any borrowings for investment purposes. “Managed Assets” mean the total assets of the Fund, minus the sum of its accrued liabilities (other than Fund liabilities incurred for the express purpose of creating leverage). Total assets for this purpose shall include assets attributable to the Fund’s use of leverage (whether or not those assets are reflected in the Fund’s financial statements for purposes of generally accepted accounting principles), and derivatives will be valued at their market value.
Under normal circumstances:
| | • | | The Fund’s levered effective duration may vary over time based on market conditions, but as a matter of policy the Fund’s levered effective duration will not exceed six years. Levered effective duration” takes into account the effects of leverage and optional call provisions of the securities in the Fund’s portfolio. |
| | • | | The Fund may invest without limit in below investment grade securities (BB+/Ba1 or lower); however, the Fund may invest no more than 10% of its Managed Assets in securities rated below B-/B3 at the time of purchase, which may include distressed securities. A security is considered to have the highest rating assigned to it by a rating agency or, in the case of an unrated security, to have the same rating as rated securities judged by the Fund’s sub-adviser to be of comparable quality. |
| | • | | The Fund will not invest in defaulted securities or in the securities of an issuer that is in bankruptcy or insolvency proceedings, however the Fund may hold investments that at the time of purchase are not in default or involved in bankruptcy or insolvency proceedings, but may later become so, and the Fund is under no obligation to sell or dispose of such securities should their solvency change. |
| | • | | The Fund may invest up to 40% of its Managed Assets in securities issued by companies located anywhere in the world outside of the U.S.; however, the Fund may invest no more than 10% of its Managed Assets in securities of issuers in emerging market countries. |
| | • | | The Fund will only invest in U.S. dollar denominated securities. |
The foregoing policies apply only at the time of any new investment.
Approving Changes in Investment Policies
The Board of Trustees of the Fund may change the policies described above without a shareholder vote. However, with respect to the Fund’s policy of investing at least 80% of its Assets in preferred securities and other income producing securities, such policy may not be changed without 60 days’ prior written notice.
The Fund invests in preferred securities. The Fund may invest in all types of preferred securities, including both traditional preferred securities and
non-traditional preferred
securities. Traditional preferred securities are generally equity securities of the issuer that have priority over the issuer’s common shares as to the payment of dividends (
i.e.
, the issuer cannot pay dividends on its common shares until the dividends on the preferred shares are current) and as to the payout of proceeds of bankruptcy or other liquidation, but are subordinate to an issuer’s senior debt and junior debt as to both types of payments. Additionally, in a bankruptcy or other liquidation, traditional preferred shares are generally subordinate to an issuer’s trade creditors and other general obligations.
Traditional preferred securities pay a dividend, typically contingent both upon declaration by the issuer’s board and at times approval by regulators, and on the existence of current earnings (or retained earnings) in sufficient amount to source the payment. Dividend payments can be either cumulative or
non-cumulative and can
be passed or deferred without limitation at the option of the issuer. Traditional preferred securities typically have no ordinary right to vote for the board of directors, except in some cases voting rights may arise if the issuer fails to pay the preferred share dividends. Traditional preferred securities may be perpetual, or have a term and typically have a fixed liquidation (or “par”) value.
While some preferred securities are issued with a final maturity date, others are perpetual in nature. In certain instances, a final maturity date may be extended and/or the final payment of principal may be deferred at the issuer’s option for a specified time without triggering an event of default for the issuer. No redemption can typically take place unless all cumulative payment obligations to preferred security investors have been met, although issuers may be able to engage in open-market repurchases without regard to any cumulative dividends or interest payable. A portion of the portfolio may include
109
investments in
non-cumulative preferred securities,
whereby the issuer does not have an obligation to make up any arrearages to holders of such securities. Should an issuer default on its obligations under such a security, the amount of income earned by the Fund may be adversely affected.
Non-traditional
preferred securities include hybrid preferred securities, contingent convertible capital securities and other types of preferred securities that do not have the traditional features described above. Hybrid-preferred securities often behave similarly as investments in traditional preferred securities and are regarded by market investors as being part of the preferred securities market. Hybrid-preferred securities possess varying combinations of features of both debt and preferred shares and as such they may constitute senior debt, junior debt or preferred shares in an issuer’s capital structure. As such, hybrid-preferred securities may not be subordinate to a company’s debt securities (as are traditional preferred shares). Given the various debt and equity characteristics of hybrid-preferred securities, whether a hybrid-preferred security is classified as debt or equity for purposes of reporting the Fund’s portfolio holdings may be based on the portfolio managers’ determination as to whether its debt or preferred features are preponderant, or based on the assessment of an independent data provider. Such determinations may be subjective.
Hybrid-preferred securities include trust preferred securities. Trust preferred securities are typically issued by corporations, generally in the form of interest-bearing notes with preferred securities characteristics, or by an affiliated business trust of a corporation, generally in the form of beneficial interests in subordinated debentures or similarly structured securities. The trust preferred securities market consists of both fixed and adjustable coupon rate securities that are either perpetual in nature or have stated maturity dates. Trust preferred securities may defer payment of income without triggering an event of default. These securities may have many characteristics of equity due to their subordinated position in an issuer’s capital structure. Trust preferred securities may be issued by trusts or other special purpose entities.
Preferred securities may also include certain forms of debt that have many characteristics of preferred shares, and that are regarded by the investment marketplace to be part of the broader preferred securities market. Among these “preferred securities” are certain exchange-listed debt issues that historically have several attributes, including trading and investment performance characteristics, in common with exchange-listed traditional preferred stock and hybrid-preferred securities. Generally, these types of “preferred securities” are senior debt or junior debt in the capital structure of an issuer.
Preferred securities generally pay fixed or adjustable rate dividends or interest to investors and have preference over common stock in the payment of dividends or interest and generally the liquidation of a company’s assets, which means that a company typically must pay dividends or interest on its preferred securities before paying any dividends on its common stock. As a general matter, dividend or interest payments on preferred securities may be cumulative or
non-cumulative. The
dividend or interest rates on preferred securities may be fixed or floating, or convert from fixed to floating at a specified future time; the Fund may invest without limit in such floating-rate
and fixed-to-floating rate
preferred securities. Floating-rate and
rate preferred securities may be traditional preferred or hybrid-preferred securities. Floating-rate preferred securities pay a rate of income that resets periodically based on short- and/or longer-term interest rate benchmarks. If the associated interest rate benchmark rises, the income received from the security may increase and therefore the return offered by the floating-rate security may rise as well, making such securities less price sensitive to rising interest rates (or yields).
Similarly, a fixed-to-floating rate security
may be less price sensitive to rising interest rates (or yields), because the period over which the rate of payment is fixed is shorter than the maturity term of the bond, after which period a floating rate of payment applies. On the other hand, preferred securities are junior to most other forms of the company’s debt, including both senior and subordinated debt. Because of their subordinated position in the capital structure of an issuer, the ability to defer dividend or interest payments for extended periods of time without triggering an event of default for the issuer, and certain other features, preferred securities may have, at times, risks similar to equity instruments. The Fund’s portfolio of preferred securities may consist of fixed rate preferred and adjustable rate preferred securities.
The preferred securities market continues to evolve. New securities may be developed that may be regarded by market investors as being part of the preferred securities market. Where such securities will fall in the capital structure of the issuer will depend on the structure and characteristics of the new security. For purposes of the Fund’s policy of investing at least 80% of its Assets in preferred securities and other income producing securities, the Fund considers all of the foregoing types of securities that are commonly viewed in the marketplace as preferred securities to be preferred securities, regardless of their classification in the capital structure of the issuer.
Preferred securities are typically issued by corporations, generally in the form of interest or dividend bearing instruments, or by an affiliated business trust of a corporation, generally in the form of beneficial interests in subordinated debentures or similarly structured securities. Preferred securities may either trade
over-the-counter, or trade
on an exchange. The preferred securities market is generally divided into the $25 par “retail” and the $1,000 par “institutional” segments. The $25 par segment is typified by securities that are listed on the NYSE, which trade and are quoted with accrued dividend or interest income, and which are often callable. The institutional segment is typified by $1,000 par value securities that are not exchange-listed. The Fund may invest in preferred securities of either segment.
The Fund may also invest in contingent capital securities or contingent convertible securities (sometimes referred to as “CoCos”). CoCos are hybrid securities created by regulators after the
2007-08
global financial crisis as a way to reduce the likelihood of government-orchestrated bailouts. CoCos are designed to automatically absorb losses, thereby helping the issuing bank satisfy regulatory capital requirements. CoCos are not preferred securities. CoCos are primarily issued by European financial institutions to help fulfill their capital requirements, while U.S. banks issue preferred stock. Because
110
CoCos and preferred stock play nearly identical roles and rank similarly within an issuer’s capital structure, CoCos are commonly held in strategies that invest in preferred securities.
The “contingent” nature of the security is due to a feature that automatically imposes a loss on the investor should an issuer’s capital fall below a predetermined threshold. When this occurs, depending on the structure, there are three possible outcomes:
| | • | | The security is converted to common equity; |
| | • | | The investor is forced to assume a temporary writedown of the security’s value; and |
| | • | | The investor is forced to assume a permanent writedown of the security’s value. |
Equity conversion or principal write-down features are tailored to the issuer and its regulatory requirements and, unlike traditional convertible securities, conversions are not voluntary and are not intended to benefit the investor.
The Fund may invest in taxable municipal bonds. States, local governments and municipalities issue municipal bonds to raise money for certain purposes. Municipal bonds issued to finance activities with a broad public purpose are generally exempt from federal income tax. Taxable municipal bonds, however, are issued to finance activities with less significant benefits to the public, such as the construction of sports facilities, and as such the interest paid to holders of such bonds is taxable as ordinary income. Many taxable municipal bonds offer yields comparable to those of other taxable bonds, such as corporate and agency bonds. Taxable municipal bonds may be rated investment-grade or below investment-grade and pay interest based on fixed or floating rate coupons. Maturities may range from long-term to short-term.
The Fund may invest in high yield bonds. Bonds that are rated lower than investment grade are commonly referred to as high yield bonds or junk bonds. These bonds generally provide high income in an effort to compensate investors for their higher risk of default, which is the failure to make required interest or principal payments. High yield bond issuers include small or relatively new companies lacking the history or capital to merit investment-grade status, former blue chip companies downgraded because of financial problems, companies electing to borrow heavily to finance or avoid a takeover or buyout, and firms with heavy debt loads.
The Fund may invest in U.S. Government securities. U.S. Government securities include (1) U.S. Treasury obligations, which differ in their interest rates, maturities and times of issuance: U.S. Treasury bills (maturities of one year or less), U.S. Treasury notes (maturities of one year to ten years) and U.S. Treasury bonds (generally maturities of greater than ten years) and (2) obligations issued or guaranteed by U.S. Government agencies and instrumentalities that are supported by any of the following: (i) the full faith and credit of the U.S. Treasury, (ii) the right of the issuer to borrow an amount limited to a specific line of credit from the U.S. Treasury, (iii) discretionary authority of the U.S. Government to purchase certain obligations of the U.S. Government agency or instrumentality or (iv) the credit of the agency or instrumentality.
The Fund may invest in other equity securities, including common stock, convertible securities, hybrid securities (which have characteristics of both equity and fixed-income instruments), warrants, rights and depositary receipts (which reference ownership of underlying
non-U.S.
securities).
The Fund may invest in corporate debt securities. Corporate debt securities are fully taxable debt obligations issued by corporations. These securities fund capital improvements, expansions, debt refinancing or acquisitions that require more capital than would ordinarily be available from a single lender. Investors in corporate debt securities lend money to the issuing corporation in exchange for interest payments and repayment of the principal at a set maturity date. Rates on corporate debt securities are set according to prevailing interest rates at the time of the issue, the credit rating of the issuer, the length of the maturity and other terms of the security, such as a call feature. Corporate debt securities are subject to the risk of an issuer’s inability to meet principal and interest payments on the obligations and may also be subject to price volatility due to such factors as market interest rates, market perception of the creditworthiness of the issuer and general market liquidity. In addition, corporate restructurings, such as mergers, leveraged buyouts, takeovers or similar corporate transactions are often financed by an increase in a corporate issuer’s indebtedness. As a result of the added debt burden, the credit quality and market value of an issuer’s existing debt securities may decline significantly.
The Fund may invest in convertible securities. Convertible securities are hybrid securities that combine the investment characteristics of bonds and common stocks. Convertible securities typically consist of debt securities or preferred securities that may be converted within a specified period of time (typically for the entire life of the security) into a certain amount of common stock or other equity security of the same or a different issuer at a predetermined price. They also include debt securities with warrants or common stock attached and derivatives combining features of debt securities and equity securities. Convertible securities entitle the holder to receive interest paid or accrued on debt securities, or dividends paid or accrued on preferred securities, until the securities mature or are redeemed, converted or exchanged.
Before conversion, convertible securities have characteristics similar to nonconvertible income securities in that they ordinarily provide a stable stream of income with generally higher yields than those of common stocks of the same or similar issuers, but lower yields than comparable nonconvertible securities. The value of a convertible security is influenced by changes in interest rates, with investment value generally declining as interest rates increase and increasing as interest rates decline. The credit standing of the issuer and other factors also may have an effect on the convertible security’s investment
111
value. Convertible securities are subordinate in rank to any senior debt obligations of the same issuer and, therefore, an issuer’s convertible securities entail more risk than its debt obligations.
The Fund may invest in REITs. REITs are typically publicly traded corporations or trusts that invest in residential or commercial real estate. REITs generally can be divided into the following three types: (i) equity REITs which invest the majority of their assets directly in real property and derive their income primarily from rents and capital gains or real estate appreciation; (ii) mortgage REITs which invest the majority of their assets in real estate mortgage loans and derive their income primarily from interest payments; and (iii) hybrid REITs which combine the characteristics of equity REITs and mortgage REITs. The Fund can invest in common stock, preferred securities, debt securities and convertible securities issued by REITs.
The Fund may invest in securities of foreign issuers through the direct investment in securities of such companies and through depositary receipts. For purposes of identifying foreign issuers, the Fund will use Bloomberg classifications, which employ the following factors listed in order of importance: (i) the country in which the company’s management is located, (ii) the country in which the company’s securities are primarily listed, (iii) the country from which the company primarily receives revenue and (iv) the company’s reporting currency. The Fund may purchase depositary receipts such as ADRs, EDRs and GDRs. ADRs, EDRs and GDRs are certificates evidencing ownership of shares of foreign issuers and are alternatives to purchasing directly the underlying foreign securities in their national markets and currencies.
The Fund may invest in securities of emerging markets issuers. Emerging markets issuers are those (i) whose securities are traded principally on a stock exchange or
emerging market country, (ii) organized under the laws of an emerging market country or (iii) whose principal place of business or principal office(s) is in an emerging market country. Emerging market countries include any country other than Canada, the United States and the countries comprising the MSCI EAFE
®
Index (currently, Australia, Austria, Belgium, Denmark, Finland, France, Germany, Hong Kong, Ireland, Israel, Italy, Japan, the Netherlands, New Zealand, Norway, Portugal, Singapore, Spain, Sweden, Switzerland and the United Kingdom).
The Fund may invest in zero coupon bonds. A zero coupon bond is a bond that typically does not pay interest for the entire life of the obligation or for an initial period after the issuance of the obligation.
The Fund may buy and sell securities on a when-issued or delayed delivery basis, making payment or taking delivery at a later date, normally within 15 to 45 days of the trade date.
The Fund may invest in illiquid securities (
i.e.,
securities that are not readily marketable), including, but not limited to, restricted securities (securities the disposition of which is restricted under the federal securities laws), securities that may be resold only pursuant to Rule 144A under the 1933 Act, and repurchase agreements with maturities in excess of seven days.
The Fund also may invest in certain derivative instruments in pursuit of its investment objective. Such instruments may include financial futures contracts, swap contracts (including interest rate and credit default swaps), options on financial futures, options on swap contracts, or other derivative instruments. The Fund may use derivative instruments to hedge some of the risk of the Fund’s investments or as a temporary substitute for a position in the underlying asset. For example, the Fund may use derivatives to help manage the portfolio’s levered effective duration over time.
The Fund may also invest in securities of other open-
or closed-end investment
companies (including ETFs) that invest primarily in the types in which the Fund may invest directly, to the extent permitted by the 1940 Act, the rules and regulations issued thereunder and applicable exemptive orders issued by the SEC.
The Fund uses leverage to pursue its investment objective. The Fund may use leverage to the extent permitted by the 1940 Act. The Fund may source leverage through a number of methods including through borrowings, issuing Preferred Shares and the issuance of debt securities. In addition, the Fund may use derivatives that may have the economic effect of leverage. The amount and sources of leverage will vary depending on market conditions.
Temporary Defensive Periods
During temporary defensive periods, the Fund may invest up to 100% of its assets in high quality, short-term securities, and in short-, intermediate-, or long-term U.S. Treasury securities. There can be no assurance that such techniques will be successful. Accordingly, during such periods, the Fund may not achieve its investment objectives.
112
NUVEEN VARIABLE RATE PREFERRED AND INCOME FUND (NPFD)
Investment Objectives
The Fund’s investment objective is to provide a high level of current income and total return.
The Fund will invest at least 80% of its Assets (as defined below) in variable rate preferred securities and other variable rate income producing securities. “Assets” means net assets of the Fund plus the amount of any borrowings for investment purposes. “Managed Assets” means the total assets of the Fund, minus the sum of its accrued liabilities (other than Fund liabilities incurred for the express purpose of creating leverage). Total assets for this purpose shall include assets attributable to the Fund’s use of leverage (whether or not those assets are reflected in the Fund’s financial statements for purposes of generally accepted accounting principles), and derivatives will be valued at their market value.
Under normal circumstances:
| | • | | The Fund will invest at least 50% of its Managed Assets (as defined below) in securities that are rated investment grade or are unrated but judged to be of comparable quality by the Fund’s subadviser. |
| | • | | The Fund may invest up to 20% of its Managed Assets in contingent capital securities or contingent convertible securities (sometimes referred to as “CoCos”). |
| | • | | The Fund may invest up to 15% of its Managed Assets in companies located in emerging market countries. |
| | • | | The Fund will only invest in U.S. dollar denominated securities. |
| | • | | The Fund will invest more than 25% of its Managed Assets in the securities of companies principally engaged in the financial services sector. |
The foregoing policies apply only at the time of any new investment.
Approving Changes in Investment Policies
The Fund cannot change its fundamental policies without the approval of the holders of a “majority of the outstanding” Common Shares. When used with respect to particular shares of the Fund, a “majority of the outstanding” shares means (i) 67% or more of the shares present at a meeting, if the holders of more than 50% of the shares are present or represented by proxy or (ii) more than 50% of the shares, whichever is less.
The Fund generally investS in variable rate preferred securities and other variable rate income producing securities. The Fund may also invest to a lesser extent in fixed income securities, of any type, Including contingent capital securities or contingent convertible securities (sometimes referred to as “CoCos”), convertible securities, corporate debt securities, U.S. government securities (securities issued or guaranteed by the U.S. government or its agencies or instrumentalities), residential and commercial mortgage-backed securities, fixed-rate preferred securities, senior loans and loan participations and assignments, sovereign debt instruments, debt securities issued by supranational agencies, and taxable and
tax-exempt
municipal bonds.
The Fund invests in preferred securities. The Fund may invest in all types of preferred securities, including both perpetual preferred securities and hybrid securities. Perpetual preferred securities are generally equity securities of the issuer that have priority over the issuer’s common shares as to the payment of dividends (i.e., the issuer cannot pay dividends on its common shares until the dividends on the preferred shares are current) and as to the payout of proceeds of a bankruptcy or other liquidation, but are subordinate to an issuer’s senior debt and junior debt as to both types of payments. Additionally, in a bankruptcy or other liquidation, perpetual preferred securities are generally subordinate to an issuer’s trade creditors and other general obligations. Perpetual preferred securities typically have a fixed liquidation (or “par”) value.
The term “preferred securities” also includes hybrid securities and other types of preferred securities that do not have the features described above. Preferred securities that are hybrid securities often behave similarly to investments in perpetual preferred securities and are regarded by market investors as being part of the preferred securities market. Such hybrid securities possess varying combinations of features of both debt and perpetual preferred securities and as such they may constitute senior debt, junior debt or preferred shares in an issuer’s capital structure.
The term “preferred securities” also includes certain forms of debt that are regarded by the investment marketplace to be part of the broader preferred securities market. Among these preferred securities are certain exchange-listed debt issues that historically have several attributes, including trading and investment performance characteristics, in common with exchange-listed perpetual preferred securities and hybrid securities. Generally, these types of preferred securities are senior debt in the capital structure of an issuer.
As a general matter, dividend or interest payments on preferred securities may be cumulative or
non-cumulative
and may be deferred (in the case of cumulative payments) or skipped (in the case of
non-cumulative
payments) at the option of the issuer.
Generally, preferred security holders have no voting rights with respect to the issuing company, except in some cases voting rights may arise if the issuer fails to pay the preferred share dividends or if a declaration of default occurs and is continuing.
113
Preferred securities may either trade
(“OTC”) or trade on an exchange. Preferred securities can be structured differently for retail and institutional investors, and the Fund may invest in preferred securities of either structure. The retail segment is typified by $25 par value exchange-traded securities, which trade on exchanges such as the NYSE and the institutional segment is typified by $1,000 par value OTC securities. Typically, most $25 par value exchange-traded securities have fixed-rate coupon structures, while the institutional segment of $1,000 par securities are variable-rate securities. Both $25 and $1,000 par value securities are often callable at par value, typically at least five years after their original issuance date (i.e., the issuer has the right to call in or redeem the preferred security at a
pre-set
price after a specified date).
The Fund’s investments in preferred securities may include convertible preferred securities, which are hybrid securities that combine the investment characteristics of bonds and common stocks. Convertible preferred securities typically consist of preferred securities that may be converted within a specified period of time (typically for the entire life of the security) into a certain amount of common stock or other equity security of the same or a different issuer. Convertible preferred securities entitle the holder to receive interest or dividends paid or accrued on preferred securities until the securities mature or are redeemed, converted or exchanged.
The Fund may also invest in contingent capital securities or contingent convertible securities (sometimes referred to as “CoCos”). CoCos are hybrid securities created by regulators after the
2007-08
global financial crisis as a way to reduce the likelihood of government-orchestrated bailouts. CoCos are designed to automatically absorb losses, thereby helping the issuing bank satisfy regulatory capital requirements. CoCos are not preferred securities. CoCos are primarily issued by European financial institutions to help fulfill their capital requirements, while U.S. banks issue preferred stock. Because CoCos and preferred stock play nearly identical roles and rank similarly within an issuer’s capital structure, CoCos are commonly held in strategies that invest in preferred securities.
The “contingent” nature of the security is due to a feature that automatically imposes a loss on the investor should an issuer’s capital fall below a predetermined threshold. When this occurs, depending on the structure, there are three possible outcomes:
| | • | | The security is converted to common equity; |
| | • | | The investor is forced to assume a temporary writedown of the security’s value; and |
| | • | | The investor is forced to assume a permanent writedown of the security’s value. |
Equity conversion or principal write-down features are tailored to the issuer and its regulatory requirements and, unlike traditional convertible securities, conversions are not voluntary and are not intended to benefit the investor.
The Fund may invest in corporate debt securities issued by companies of all kinds, including those with small-,
mid-
and large capitalizations. Corporate debt securities are fixed income securities issued by businesses to finance their operations. Notes, bonds, debentures and commercial paper are the most common types of corporate debt securities, with the primary difference being their maturities and secured or unsecured status. Commercial paper has the shortest term and is usually unsecured. Corporate debt securities may be rated investment-grade or below investment-grade and may carry fixed or floating rates of interest.
The Fund may invest in U.S. dollar-denominated securities of
non-U.S.
issuers traded over the counter or listed on an exchange. The Fund will classify an issuer of a security as being a U.S. or
non-U.S.
issuer based on the determination of an unaffiliated, recognized financial data provider. Such determinations are based on a number of criteria, such as the issuer’s country of domicile, the primary exchange on which the security trades, the location from which the majority of the issuer’s revenue comes, and the issuer’s reporting currency.
The Fund may invest in common stocks which generally represents an equity ownership interest in an issuer. Additional types of equity securities (other than preferred securities) in which the Fund may invest include convertible securities (discussed below), REITs, warrants, rights and depositary receipts (which reference ownership of underlying
non-U.S.
securities). The Fund’s equity investments also may include securities of other investment companies (including
open-end
funds,
closed-end
funds and ETFs).
The Fund may invest in U.S. government securities, including U.S. Treasury obligations and securities issued or guaranteed by various agencies of the U.S. government, or by various instrumentalities which have been established or sponsored by the U.S. government. U.S. Treasury obligations are backed by the “full faith and credit” of the U.S. government. Securities issued or guaranteed by federal agencies and U.S. government sponsored instrumentalities may or may not be backed by the full faith and credit of the U.S. government.
The Fund may invest in mortgage-backed securities (“MBS”). A MBS (“MBS”) is a type of pass-through security, which is a security representing pooled debt obligations repackaged as interests that pass income through an intermediary to investors. In the case of mortgage-backed securities, the ownership interest is in a pool of mortgage loans. Commercial mortgage-backed securities (“CMBS”) are backed by a pool of mortgages on commercial property.
The Fund may invest in asset-backed securities (“ABS”). ABS are securities that are primarily serviced by the cash flows of a discrete pool of receivables or other financial assets, either fixed or revolving, that by their terms convert into cash within a finite time period. Asset-backed securitization is a financing technique in which financial assets, in many cases themselves less liquid, are pooled and converted into instruments that may be offered and sold in the
114
capital markets. In a basic securitization structure, an entity, often a financial institution, originates or otherwise acquires a pool of financial assets, either directly or through an affiliate. It then sells the financial assets, again either directly or through an affiliate, to a specially created investment vehicle that issues securities “backed” or supported by those financial assets, which securities are ABS. Payment on the ABS depends primarily on the cash flows generated by the assets in the underlying pool and other rights designed to assure timely payment, such as liquidity facilities, guarantees or other features generally known as credit enhancements.
The Fund may invest in loans, including senior secured loans, unsecured and/or subordinated loans, loan participations, unfunded contracts and assignments. These loans are typically made by or issued to corporations primarily to finance acquisitions, refinance existing debt, support organic growth, or pay out dividends, and are typically originated by large banks and are then syndicated out to institutional investors as well as to other banks. The loans that the Fund invests typically bear interest at a floating rate, although some loans may pay a fixed rate. Floating rate loans have interest rates that reset periodically, typically monthly or quarterly. The interest rates on floating rate loans are generally based on a percentage above the London Inter-Office Bank Rate (“LIBOR”), the Secured Oversight Financing Rate (“SOFR”), a U.S. bank’s prime or base rate, the overnight federal funds rate or another rate. The use of the LIBOR will begin to be phased out in the near future. While SOFR has been recommended as the replacement rate for LIBOR, and some product markets have adopted the use of SOFR, LIBOR may still be used as a reference rate until such time that private markets have fully transitioned to using SOFR or other alternative reference rates recommended by applicable market regulators.. Loan participations are loans that are shared by a group of lenders. Unfunded commitments are contractual obligations by lenders (such as the Fund) to loan an amount in the future or that is due to be contractually funded in the future. Assignments may be arranged through private negotiations between potential assignees and potential assignors, and the rights and obligations acquired by the purchaser of an assignment may differ from, and be more limited than, those held by the assigning lender.
Loans may have restrictive covenants limiting the ability of a borrower to further encumber its assets. The types of covenants included in loan agreements generally vary depending on market conditions, the creditworthiness of the borrower, the nature of the collateral securing the loan and other factors. Such restrictive covenants normally allow for early intervention and proactive mitigation of credit risk by providing lenders with the ability to (1) intervene and either prevent or restrict actions that may potentially compromise the borrower’s ability to repay the loan and/or (2) obtain concessions from the borrower in exchange for waiving or amending a particular covenant. Loans with fewer or weaker restrictive covenants may limit the Fund’s ability to intervene or obtain additional concessions from borrowers.
The Fund may invest in sovereign securities. Sovereign securities are issued or guaranteed by foreign sovereign governments or their agencies, authorities, political subdivisions or instrumentalities, and supranational agencies. A supranational agency is a multinational union or association in which member countries cede authority and sovereignty on a limited number of matters to the group, whose decisions are binding upon its members. Quasi-sovereign securities typically are issued by companies or agencies that may receive financial support or backing from a local government or in which the government owns a majority of the issuer’s voting shares.
The ability of a foreign sovereign issuer, especially in an emerging market country, to make timely and ultimate payments on its debt obligations will be strongly influenced by the sovereign issuer’s balance of payments, including export performance, its access to international credits and investments, fluctuations of interest rate and the extent of its foreign reserves. A country whose exports are concentrated in a few commodities or whose economy depends on certain strategic imports could be vulnerable to fluctuations in international prices of these commodities or imports. To the extent that a country receives payment for its export in currencies other than dollars, its ability to make debt payments denominated in dollars could be adversely affected. If a sovereign issuer cannot generate sufficient earnings from foreign trade to service its external debt, it may need to depend on continuing loans and aid from foreign governments, commercial banks and multinational organizations. There may be no bankruptcy proceedings similar to those in the U.S. by which defaulted interest may be collected.
The Fund may invest in taxable and
tax-exempt
municipal securities, including municipal bonds, and notes and other securities issued by states, cities and local authorities and certain possessions and territories of the United States (such as Puerto Rico and Guam) to finance or refinance public purpose projects such as roads, schools, and water supply systems. Municipal bonds may also be issued to finance and refinance privately owned facilities or projects deemed to serve a public purpose. Municipal bonds may be issued on a long-term basis to provide long-term financing. The repayment of such debt may be secured generally by a pledge of the full faith and credit taxing power of the issuer, a limited or special tax, or any other revenue source, including project revenue. Municipal bonds may also be issued to finance projects on a short-term interim basis, anticipating repayment with the proceeds of long-term debt.
While the Fund does not currently anticipate investing to a material extent in restricted and illiquid investments (
i.e.,
investments that are not readily marketable), the Fund’s portfolio may contain restricted and illiquid investments, including, but not limited to, restricted investments (investments the disposition of which is restricted under the federal securities laws), investments that may be resold only pursuant to Rule 144A under the 1933 Act that are deemed to be illiquid, and certain repurchase agreements. Restricted investments may be sold only in privately negotiated transactions or in a public offering with respect to which a registration statement is in effect under the 1933 Act.
115
The Fund may invest in securities of other
open-end
or
closed-end
investment companies, including ETFs, that invest primarily in the types of investments in which the Fund may invest directly.
The Fund may invest without limitation in credit default swaps, and may enter into credit default swaps as either a buyer or a seller.
In addition to credit default swaps, the Fund also may invest in certain derivative instruments in pursuit of its investment objective. Such instruments include financial futures contracts and options thereon, forward contracts, swaps (with varying terms, including interest rate swaps), options on swaps and other derivative instruments. The Fund’s
sub-adviser
may use derivative instruments to attempt to hedge some of the risk of the Fund’s investments or as a substitute for a position in the underlying asset.
The Fund may use leverage to the extent permitted by the 1940 Act. The Fund may source leverage initially and throughout the life of the Fund through a number of methods including through borrowings, issuing Preferred Shares, the issuance of debt securities, entering into reverse repurchase agreements (effectively a borrowing), and investing in residual interest certificates of tender option bond trusts, also called inverse floating rate securities, that have the economic effect of leverage because the Fund’s investment exposure to the underlying securities held by the trust have been effectively financed by the trust’s issuance of floating rate certificates.
Temporary Defensive Periods
During temporary defensive periods, the period in which the net proceeds of this offering of Common Shares are first being invested (the
“invest-up
period”), the
“wind-up”
period (the approximately six month period during which the Fund is transitioning its portfolio as the Fund’s Termination Date approaches) or the period in which the Fund’s assets are being liquidated in anticipation of the Fund’s termination, the Fund may deviate from its investment policies and objective. During such periods, the Fund may invest up to 100% of its Managed Assets in cash, short-term investments, including high quality, short-term securities or may invest in short-, intermediate-, or long-term U.S. Treasury securities. During the
invest-up
period, the Fund may also purchase securities issued by ETFs that invest primarily in investments of the types in which the Fund may invest directly. Any such investments in ETFs will be in compliance with the limitations imposed by the 1940 Act, the rules promulgated thereunder, or pursuant to any exemptive relief obtained thereunder. There can be no assurance that such techniques will be successful. Accordingly, during such periods, the Fund may not achieve its investment objective.
116
PRINCIPAL RISKS OF THE FUNDS
The factors that are most likely to have a material effect on a particular Fund’s portfolio as a whole are called “principal risks.” Each Fund is subject to the principal risks indicated below, whether through direct investment or derivative positions. Each Fund may be subject to additional risks other than those identified and described below because the types of investments made by a Fund can change over time.
| | | | | | | | | | | | | | | | | | | | | | | | | |
| Risk | | Nuveen
Preferred & Income
Opportunities Fund (JPC) | | Nuveen
Preferred and
Income
Term Fund (JPI) | | Nuveen
Preferred &
Income
Securities Fund (JPS) | | Nuveen
Preferred and
Income Fund (JPT) | | Nuveen
Variable Rate
Preferred &
Income Fund
(NPFD) |
| | | | | |
| | | | | | | | | | |
| | | | | |
| Asset-Backed Securities (“ABS”) Risk | | — | | — | | — | | — | | X |
| Below Investment Grade Risk | | X | | X | | X | | X | | X |
| Call Risk | | X | | X | | X | | X | | X |
| Collateralized Mortgage-Backed Securities (“CMBS”) and Mortgage-Backed Securities (“MBS”) Risk | | — | | — | | — | | — | | X |
| Common Stock Risk | | X | | X | | X | | X | | — |
| Concentration and Financial Services Sector Risk | | X | | X | | X | | X | | X |
| Contingent Capital Securities (“CoCos”) Risk | | X | | X | | X | | X | | X |
| Convertible Securities Risk | | X | | X | | X | | X | | X |
| Credit Risk | | X | | X | | X | | X | | X |
| Credit Spread Risk | | X | | X | | X | | X | | X |
| Debt Securities Risk | | X | | X | | X | | X | | X |
| Defaulted and Distressed Securities Risk | | — | | — | | — | | X | | — |
| Deflation Risk | | X | | X | | X | | X | | X |
| Derivatives Risk | | X | | X | | X | | X | | X |
| Duration Risk | | X | | X | | X | | X | | X |
| Emerging Markets Risk | | X | | X | | X | | X | | X |
| Equity Securities Risk | | — | | — | | — | | — | | X |
| Financial Futures and Options Transactions Risk | | X | | X | | X | | X | | X |
Floating-Rate and Rate Securities Risk | | X | | X | | X | | X | | — |
| Foreign Currency Risk | | X | | — | | X | | — | | — |
| Hedging Risk | | X | | X | | X | | X | | X |
| Illiquid Investments Risk | | X | | X | | X | | X | | X |
| Income Risk | | X | | X | | X | | X | | X |
| Inflation Risk | | X | | X | | X | | X | | X |
| Inflation Correlation Risk | | X | | X | | X | | X | | X |
| Interest Rate Risk | | X | | X | | X | | X | | X |
| Inverse Floating Rate Securities Risk | | — | | — | | — | | — | | X |
| LIBOR Floor Risk | | X | | X | | X | | X | | X |
| LIBOR Replacement Risk | | X | | X | | X | | X | | X |
| Loan Risk | | — | | — | | — | | — | | X |
| Municipal Securities Market Liquidity Risk | | — | | X | | — | | X | | X |
| Municipal Securities Market Risk | | — | | X | | — | | X | | X |
| | X | | X | | X | | X | | X |
| Other Investment Companies Risk | | X | | X | | X | | X | | X |
117
| | | | | | | | | | | | | | | | | | | | | | | | | |
| | | | Nuveen
Preferred and
Income
Term Fund | | Nuveen
Preferred &
Income
Securities Fund | | Nuveen
Preferred and
Income Fund | | Nuveen
Variable Rate
Preferred &
Income Fund
(NPFD) |
| Preferred and Hybrid Preferred Securities Risk | | X | | X | | X | | X | | X |
| Reinvestment Risk | | X | | X | | X | | X | | X |
| Senior Loan Risk | | — | | — | | — | | — | | X |
| Sovereign Government and Supranational Debt Risk | | — | | — | | — | | — | | X |
| Swap Transactions Risk | | X | | X | | X | | X | | X |
| Unrated Securities Risk | | X | | X | | X | | X | | X |
| U.S. Government Securities Risk | | X | | X | | X | | X | | X |
| Valuation Risk | | X | | X | | X | | X | | X |
| Warrants and Equity Securities Risk | | X | | X | | X | | X | | — |
| When-Issued and Delayed-Delivery Transactions | | X | | X | | X | | X | | X |
| Zero Coupon Bonds Risk | | X | | X | | X | | X | | — |
| | | | | |
Fund Level and Other Risks | | | | | | | | | | |
| | | | | |
| Anti-Takeover Provisions | | X | | X | | X | | X | | X |
| Borrowing Risk | | X | | X | | X | | X | | X |
| Counterparty Risk | | X | | X | | X | | X | | X |
| Cybersecurity Risk | | X | | X | | X | | X | | X |
| Global Economic Risk | | X | | X | | X | | X | | X |
| Investment and Market Risk | | X | | X | | X | | X | | X |
| Legislation and Regulatory Risk | | X | | X | | X | | X | | X |
| Leverage Risk | | X | | X | | X | | X | | X |
| Limited Term Risk | | — | | X | | — | | — | | — |
| Market Discount from Net Asset Value | | X | | X | | X | | X | | X |
| Recent Market Conditions | | X | | X | | X | | X | | X |
| Reverse Repurchase Agreement Risk | | X | | X | | X | | X | | X |
| Tax Risk | | X | | X | | X | | X | | X |
Asset-Backed Securities (“ABS”) Risk.
ABS involve certain risks in addition to those presented by MBS. There is the possibility that recoveries on the underlying collateral may not, in some cases, be available to support payments on these securities. Relative to MBS, ABS may provide the Fund with a less effective security interest in the underlying collateral and are more dependent on the borrower’s ability to pay. If many borrowers on the underlying loans default, losses could exceed the credit enhancement level and result in losses to investors in an ABS transaction. Finally, ABS have structure risk due to a unique characteristic known as early amortization, or early payout, risk. Built into the structure of most ABS are triggers for early payout, designed to protect investors from losses. These triggers are unique to each transaction and can include a significant rise in defaults on the underlying loans, a sharp drop in the credit enhancement level or the bankruptcy of the originator. Once early amortization begins, all incoming loan payments (after expenses are paid) are used to pay investors as quickly as possible based upon a predetermined priority of payment. As a result, proceeds that would otherwise be distributed to holders of a junior tranche may be diverted to pay down more senior tranches.
Below Investment Grade Risk.
Investments of below investment grade quality are regarded as having speculative characteristics with respect to the issuer’s capacity to pay dividends or interest and repay principal, and may be subject to higher price volatility and default risk than investment grade investments of comparable terms and duration. Issuers of lower grade investments may be highly leveraged and may not have available to them more traditional methods of financing. The prices of these lower grade investments are typically more sensitive to negative developments, such as a decline in the issuer’s revenues or a general economic downturn. The secondary market for lower rated investments may not be as liquid as the secondary market for more highly rated investments, a factor which may have an adverse effect on the Fund’s ability to dispose of a particular investment.
118
If a below investment grade investment goes into default, or its issuer enters bankruptcy, it might be difficult to sell that investment in a timely manner at a reasonable price.
The Fund may invest in securities that are subject to call risk. Such securities may be redeemed at the option of the issuer, or “called,” before their stated maturity or redemption date. In general, an issuer will call its instruments if they can be refinanced by issuing new instruments that bear a lower interest rate. The Fund is subject to the possibility that during periods of falling interest rates, an issuer will call its high yielding securities. The Fund would then be forced to invest the unanticipated proceeds at lower interest rates, resulting in a decline in the Fund’s income.
Collateralized Mortgage-Backed Securities (“CMBS”) and Mortgage-Backed Securities (“MBS”) Risk.
CMBS and MBS, including collateralized debt obligations and collateralized mortgage obligations, differ from conventional debt securities because principal is paid back over the life of the security rather than at maturity. CMBS and MBS are subject to prepayment or call risk, which is the risk that a borrower’s payments may be received earlier than expected due to changes in prepayment rates on underlying loans. Faster prepayments often happen when interest rates are falling. As a result, the Fund may reinvest these early payments at lower interest rates, thereby reducing the Fund’s income. CMBS and MBS also are subject to extension risk. An unexpected rise in interest rates could reduce the rate of prepayments and extend the life of the CMBS and MBS, causing the price of the CMBS and MBS and the Fund’s share price to fall and would make the CMBS and MBS more sensitive to interest rate changes. An unexpectedly high rate of defaults on the mortgages held by a mortgage pool will adversely affect the value of CMBS and MBS and will result in losses to the Fund. Privately issued mortgage-related securities are not subject to the same underwriting requirements for the underlying mortgages that are applicable to those mortgage-related securities that have government or government-sponsored entity guarantee. As a result, the mortgage loans underlying privately issued mortgage-related securities may, and frequently do, have less favorable collateral, credit risk or other underwriting characteristics than government or government-sponsored mortgage-related securities and have wider variances in a number of terms including interest rate, term, size, purpose and borrower characteristics.
Common stocks have experienced significantly more volatility in returns and may significantly underperform relative to fixed-income securities during certain periods. An adverse event, such as an unfavorable earnings report, may depress the value of a particular common stock held by the Fund. Also, prices of common stocks are sensitive to general movements in the stock market, and a drop in the stock market may depress the price of common stocks to which the Fund has exposure. Common stock prices fluctuate for several reasons, including changes in investors’ perceptions of the financial condition of an issuer, the general condition of the relevant stock market or the current and expected future conditions of the broader economy, or when political or economic events affecting the issuer in particular or the stock market in general occur. In addition, common stock prices may be particularly sensitive to rising interest rates, as the cost of capital rises and borrowing costs increase.
Concentration and Financial Services Sector Risk.
The preferred securities market is comprised predominantly of securities issued by companies in the financial services sector. Therefore, preferred securities present substantially increased risks at times of financial turmoil, which could affect financial services companies more than companies in other sectors and industries. The Fund’s investment in securities issued by financial services companies makes the Fund more susceptible to adverse economic or regulatory occurrences affecting those companies. Concentration of investments in financial services companies includes the following risks:
| | • | | financial services companies may suffer a setback if regulators change the rules under which they operate, which may increase costs for or limit the ability to offer new services or products and make it difficult to pass increased costs on to consumers; |
| | • | | unstable interest rates can have a disproportionate effect on the financial services sector; |
| | • | | financial services companies whose securities the Fund may purchase may themselves have concentrated portfolios, such as a high level of loans to real estate developers, which makes them vulnerable to economic conditions that affect that sector; and |
| | • | | financial services companies have been affected by increased competition, which could adversely affect the profitability or viability of such companies. |
The profitability of many types of financial services companies may be adversely affected in certain market cycles, including periods of rising interest rates, which may restrict the availability and increase the cost of capital, and declining economic conditions, which may cause credit losses due to financial difficulties of borrowers. Because many types of financial services companies are especially vulnerable to these economic cycles, the Fund’s investments in these companies may lose significant value during such periods.
Contingent Capital Securities (“CoCos”) Risk.
A loss absorption mechanism trigger event for CoCos would likely be the result of, or related to, the deterioration of the issuer’s financial condition (e.g., a decrease in the issuer’s capital ratio) and status as a going concern. In such a case, with respect to CoCos that provide for conversion into common stock upon the occurrence of the trigger event, the market price of the issuer’s common stock received by the Fund will have likely declined, perhaps substantially, and may continue to decline, which may adversely affect the Fund’s NAV. Further, the issuer’s common stock would be subordinate to the issuer’s other classes of securities and therefore would worsen the Fund’s standing in a bankruptcy proceeding. In addition, because the common stock of the issuer may not pay a dividend, investors in these instruments could experience a reduced income rate, potentially to zero. In view of the foregoing, CoCos are often rated below investment grade and are subject to the risks of below investment grade securities.
119
CoCos may be subject to an automatic write-down (i.e., the automatic write-down of the principal amount or value of the securities, potentially to zero, and the cancellation of the securities) under certain circumstances, which could result in the Fund losing a portion or all of its investment in such securities. In addition, the Fund may not have any rights with respect to repayment of the principal amount of the securities that has not become due or the payment of interest or dividends on such securities for any period from (and including) the interest or dividend payment date falling immediately prior to the occurrence of such automatic write-down. An automatic write-down could also result in a reduced income rate if the dividend or interest payment is based on the security’s par value. Coupon payments on CoCos may be discretionary and may be cancelled by the issuer for any reason or may be subject to approval by the issuer’s regulator and may be suspended in the event there are insufficient distributable reserves.
In certain scenarios, investors in CoCos may suffer a loss of capital ahead of equity holders or when equity holders do not. There is no guarantee that the Fund will receive a return of principal on CoCos. Any indication that an automatic write-down or conversion event may occur can be expected to have a material adverse effect on the market price of CoCos.
The prices of CoCos may be volatile. Additionally, the trading behavior of a given issuer’s CoCo may be strongly impacted by the trading behavior of other issuers’ CoCos, such that negative information from an unrelated CoCo may cause a decline in value of one or more CoCos held by afund. Accordingly, the trading behavior of CoCos may not follow the trading behavior of other similarly structured securities.
CoCos are issued primarily by financial institutions. Therefore, CoCos present substantially increased risks at times of financial turmoil, which could affect financial institutions more than companies in other sectors and industries.
Convertible Securities Risk.
Convertible securities have characteristics of both equity and debt securities and, as a result, are exposed to certain additional risks that are typically associated with debt, including but not limited to Interest Rate Risk, Credit Risk, Below Investment Grade Risk and Unrated Securities Risk. The value of a convertible security is influenced by both the yield of
non-convertible
securities of comparable issuers and by the value of the underlying common stock. Convertible securities generally offer lower interest or dividend yields than
non-convertible
securities of similar credit quality. The market values of convertible securities tend to decline as interest rates increase and, conversely, to increase as interest rates decline. However, the convertible security’s market value tends to reflect the market price of the common stock of the issuing company when that stock price is greater than the convertible security’s “conversion price.” The conversion price is defined as the predetermined price at which the convertible security could be exchanged for the associated common stock. As the market price of the underlying common stock declines, the price of the convertible security tends to be influenced more by the yield of the convertible security. Thus, the convertible security may not decline in price to the same extent as the underlying common stock. Convertible securities fall below debt obligations of the same issuer in order of preference or priority in the event of a liquidation and are typically unrated or rated lower than such debt obligations.
Issuers of securities in which the Fund may invest may default on their obligations to pay principal or interest when due. This
non-payment
would result in a reduction of income to the Fund, a reduction in the value of a security experiencing
non-payment
and potentially a decrease in the NAV of the Fund. To the extent that the credit rating assigned to a security in the Fund’s portfolio is downgraded, the market price and liquidity of such security may be adversely affected.
Debt securities held by the Fund may fail to make dividend or interest payments when due. Investments in investments below investment grade credit quality are predominantly speculative and subject to greater volatility and risk of default. Unrated investments are evaluated by Fund managers using industry data and their own analysis processes that may be similar to that of a NRSRO; however, such internal ratings are not equivalent to a national agency credit rating. Counterparty credit risk may arise if counterparties fail to meet their obligations, should the Fund hold any derivative instruments for either investment exposure or hedging purposes.
Credit spread risk is the risk that credit spreads (i.e., the difference in yield between securities that is due to differences in their credit quality) may increase when the market believes that securities generally have a greater risk of default. Increasing credit spreads may reduce the market values of the Fund’s securities. Credit spreads often increase more for lower rated and unrated securities than for investment grade securities. In addition, when credit spreads increase, reductions in market value will generally be greater for longer-maturity securities.
Issuers of debt instruments in which the Fund may invest may default on their obligations to pay principal or interest when due. This
non-payment
would result in a reduction of income to the Fund, a reduction in the value of a debt instrument experiencing
non-payment
and, potentially, a decrease in the NAV of the Fund. There can be no assurance that liquidation of collateral would satisfy the issuer’s obligation in the event of
non-payment
of scheduled interest or principal or that such collateral could be readily liquidated. In the event of bankruptcy of an issuer, the Fund could experience delays or limitations with respect to its ability to realize the benefits of any collateral securing a security. To the extent that the credit rating assigned to a security in the Fund’s portfolio is downgraded, the market price and liquidity of such security may be adversely affected.
Defaulted and Distressed Securities Risk.
The Fund may hold investments that at the time of purchase are not in default or involved in bankruptcy or insolvency proceedings, but may later become so. Moreover, the Fund may invest in
low-rated
securities that, although not in default, may be “distressed,” meaning that the issuer is experiencing financial difficulties or distress at the time of acquisition. Such securities would present a substantial
120
risk of future default which may cause the Fund to incur losses, including additional expenses, to the extent it is required to seek recovery upon a default in the payment of principal or interest on those securities. In any reorganization or liquidation proceeding relating to a portfolio security, the Fund may lose its entire investment or may be required to accept cash or securities with a value less than its original investment. Defaulted or distressed securities may be subject to restrictions on resale.
Deflation risk is the risk that prices throughout the economy decline over time. Deflation may have an adverse effect on the creditworthiness of issuers and may make issuer default more likely, which may result in a decline in the value of the Fund’s portfolio.
The use of derivatives involves additional risks and transaction costs which could leave the Fund in a worse position than if it had not used these instruments. Derivative instruments can be used to acquire or to transfer the risk and returns of a security or other asset without buying or selling the security or asset. These instruments may entail investment exposures that are greater than their cost would suggest. As a result, a small investment in derivatives can result in losses that greatly exceed the original investment. Derivatives can be highly volatile, illiquid and difficult to value. An
derivative transaction between the Fund and a counterparty that is not cleared through a central counterparty also involves the risk that a loss may be sustained as a result of the failure of the counterparty to the contract to make required payments. The payment obligation for a cleared derivative transaction is guaranteed by a central counterparty, which exposes the Fund to the creditworthiness of the central counterparty.
It is possible that regulatory or other developments in the derivatives market, including the SEC’s recently adopted new Rule
18f-4
under the 1940 Act, which imposes limits on the amount of derivatives a fund can enter into could adversely impact the Fund’s ability to successfully use derivative instruments.
Duration is the sensitivity, expressed in years, of the price of a fixed-income security to changes in the general level of interest rates (or yields). Securities with longer durations tend to be more sensitive to interest rate (or yield) changes, which typically corresponds to increased volatility and risk, than securities with shorter durations. For example, if a security or portfolio has a duration of three years and interest rates increase by 1%, then the security or portfolio would decline in value by approximately 3%. Duration differs from maturity in that it considers potential changes to interest rates, and a security’s coupon payments, yield, price and par value and call features, in addition to the amount of time until the security matures. The duration of a security will be expected to change over time with changes in market factors and time to maturity.
Emerging Markets Risk.
Risks of investing in securities of emerging markets issuers include: smaller market capitalization of securities markets, which may suffer periods of relative illiquidity; significant price volatility; restrictions on foreign investment; and possible restrictions on repatriation of investment income and capital. In addition, foreign investors may be required to register the proceeds of sales; and future economic or political crises could lead to price controls, forced mergers, expropriation or confiscatory taxation, seizure, nationalization, or creation of government monopolies. Certain emerging markets also may face other significant internal or external risks, including a heightened risk of war, and ethnic, religious and racial conflicts. In addition, governments in many emerging market countries participate to a significant degree in their economies and securities markets, which may impair investment and economic growth, and which may in turn diminish the value of the securities in those markets. The considerations noted below in
“Non-U.S.
Securities Risk” are generally intensified for investments in emerging market countries.
Equity securities in the Fund’s portfolio may decline significantly in price over short or extended periods of time, and such declines may occur because of declines in the equity market as a whole, or because of declines in only a particular country, company, industry, or sector of the market. Given the Fund’s focus on dividend-paying securities, the Fund may, from time to time, have a greater exposure to higher dividend-yield sectors and industries than the broad equity market which would make the Fund more vulnerable to adverse developments affecting such sectors or industries.
Financial Futures and Options Transactions Risk.
The Fund may use certain transactions for hedging the portfolio’s exposure to credit risk and the risk of increases in interest rates, which could result in poorer overall performance for the Fund. There may be an imperfect correlation between price movements of the futures and options and price movements of the portfolio securities being hedged.
If the Fund engages in futures transactions or in the writing of options on futures, it will be required to maintain initial margin and maintenance margin and may be required to make daily variation margin payments in accordance with applicable rules of the exchanges and the Commodity Futures Trading Commission (“CFTC”). If the Fund purchases a financial futures contract or a call option or writes a put option in order to hedge the anticipated purchase of securities, and if the Fund fails to complete the anticipated purchase transaction, the Fund may have a loss or a gain on the futures or options transaction that will not be offset by price movements in the securities that were the subject of the anticipatory hedge. There can be no assurance that a liquid market will exist at a time when the Fund seeks to close out a derivatives or futures or a futures option position, and the Fund would remain obligated to meet margin requirements until the position is closed.
Floating-Rate and
Securities Risk.
The market value of floating-rate securities is a reflection of discounted expected cash flows based on expectations for future interest rate resets. The market value of such securities may fall in a declining interest rate environment and may also fall in a rising interest rate environment if there is a lag between the rise in interest rates and the reset. This risk may also be present with respect to
securities in which the Fund may invest. A secondary risk associated with declining interest rates is the risk that income earned by the Fund on floating-rate and
securities will decline due to lower coupon payments on floating rate securities.
121
Because the Fund may invest in securities denominated or quoted in currencies other than the U.S. dollar, changes in foreign currency exchange rates may affect the value of securities held by the Fund and the unrealized appreciation or depreciation of investments. Currencies of certain countries may be volatile and therefore may affect the value of securities denominated in such currencies, which means that the Fund’s NAV could decline as a result of changes in the exchange rates between foreign currencies and the U.S. dollar. In addition, certain countries, particularly emerging market countries, may impose foreign currency exchange controls or other restrictions on the transferability, repatriation or convertibility of currency.
The Fund’s use of derivatives or other transactions to reduce risk involves costs and will be subject to the investment adviser’s and/or the
sub-adviser’s
ability to predict correctly changes in the relationships of such hedge instruments to the Fund’s portfolio holdings or other factors. No assurance can be given that the investment adviser’s and/or the
sub-adviser’s
judgment in this respect will be correct, and no assurance can be given that the Fund will enter into hedging or other transactions at times or under circumstances in which it may be advisable to do so. Hedging activities may reduce the Fund’s opportunities for gain by offsetting the positive effects of favorable price movements and may result in net losses.
Illiquid Investments Risk.
I Illiquid investments are investments that are not readily marketable. These investments may include restricted investments, including Rule 144A securities, which cannot be resold to the public without an effective registration statement under the 1933 Act, or, if they are unregistered, may be sold only in a privately negotiated transaction or pursuant to an exemption from registration. The Fund may not be able to readily dispose of such investments at prices that approximate those at which the Fund could sell such investments if they were more widely traded and, as a result of such illiquidity, the Fund may have to sell other investments or engage in borrowing transactions if necessary to raise cash to meet its obligations. Limited liquidity can also affect the market price of investments, thereby adversely affecting the Fund’s NAV and ability to make dividend distributions. The financial markets in general have in recent years experienced periods of extreme secondary market supply and demand imbalance, resulting in a loss of liquidity during which market prices were suddenly and substantially below traditional measures of intrinsic value. During such periods, some investments could be sold only at arbitrary prices and with substantial losses. Periods of such market dislocation may occur again at any time.
The Fund’s income could decline due to falling market interest rates. This is because, in a falling interest rate environment, the Fund generally will have to invest the proceeds from maturing portfolio securities in lower-yielding securities.
Inflation risk is the risk that the value of assets or income from investments will be worth less in the future as inflation decreases the value of money. As inflation increases, the real value of the common shares and distributions can decline. Currently, inflation rates are elevated relative to normal market conditions and could continue to increase.
Inflation Correlation Risk.
Although the values of certain of the Fund’s loan investments are generally linked or correlated to the rate of inflation, there is no guarantee that such investments will provide any protection against the impact of inflation. In addition, while these investments are expected to be protected from long-term inflationary trends, short-term increases in inflation may lead to a decline in their value. Further, when inflation and expectations of inflation are low or declining, the Fund’s positions in such investments are likely to underperform the overall stock markets.
Interest rate risk is the risk that securities in the Fund’s portfolio will decline in value because of changes in market interest rates. Generally, when market interest rates rise, the market value of such securities will fall, and
. As interest rates decline, issuers of securities may prepay principal earlier than scheduled, forcing the Fund to reinvest in lower-yielding securities and potentially reducing the Fund’s income. As interest rates increase, slower than expected principal payments may extend the average life of securities, potentially locking in a below-market interest rate and reducing the Fund’s value. In typical market interest rate environments, the prices of longer-term securities generally fluctuate more than prices of shorter-term securities as interest rates change. The risks associated with rising interest rates are greatly heightened in view of the US Federal Reserve Bank’s decision to raise the federal funds rate from historic lows, and may continue to raise interest rates if considered necessary to reduce inflation to acceptable levels.
Inverse Floating Rate Securities Risk.
The Fund may invest in inverse floating rate securities. In general, income on inverse floating rate securities will decrease when short-term interest rates increase and increase when short-term interest rates decrease. Investments in inverse floating rate securities may subject the Fund to the risks of reduced or eliminated interest payments and losses of principal. In addition, inverse floating rate securities may increase or decrease in value at a greater rate than the underlying interest rate, which effectively leverages the Fund’s investment. As a result, the market value of such securities generally will be more volatile than that of fixed rate securities.
The Fund may invest in inverse floating rate securities issued by special purpose trusts that have recourse to the Fund (i.e., the Fund typically bears the risk of loss with respect to any liquidity shortfall). In such instances, the Fund may be at risk of loss that exceeds its investment in the inverse floating rate securities.
The Fund may be required to sell its inverse floating rate securities at less than favorable prices, or liquidate other Fund portfolio holdings in certain circumstances, including, but not limited to, the following:
| | • | | If the Fund has a need for cash and the securities in a special purpose trust are not actively traded due to adverse market conditions; |
| | • | | If special purpose trust sponsors (as a collective group or individually) experience financial hardship and consequently seek to terminate their respective outstanding special purpose trusts; and |
122
| | • | | If the value of an underlying security declines significantly and if additional collateral has not been posted by the Fund. |
Many floating rate loans issued after 2008 include a “LIBOR floor,” based on LIBOR, or a minimum interest rate to which the loan’s spread is added, to calculate the loan’s overall interest rate. As short-term market rates rise, such loans will not pay higher interest until prevailing rates exceed the floor rate stated in the loan documents.
LIBOR Replacement Risk.
LIBOR is an index rate that historically has been widely used in lending transactions and remains a common reference rate for setting the floating interest rate on private loans. The use of the LIBOR will begin to be phased out in the near future, which may adversely affect the Fund’s investments whose value is tied to LIBOR. While SOFR has been recommended as the replacement rate for LIBOR, and some product markets have adopted the use of SOFR, LIBOR may still be used as a reference rate until such time that private markets have fully transitioned to using SOFR or other alternative reference rates recommended by applicable market regulators. The transition process away from LIBOR may involve, among other things, increased volatility or illiquidity in markets for instruments that currently rely on LIBOR. The potential effect of a discontinuation of LIBOR on the Fund’s investments will vary depending on, among other things: (1) existing fallback provisions that provide a replacement reference rate if LIBOR is no longer available; (2) termination provisions in individual contracts; and (3) how, and when industry participants develop and adopt new reference rates and fallbacks for both legacy and new products and instruments held by the Fund. Accordingly, it is difficult to predict the full impact of the transition away from LIBOR until it is clearer how the Fund’s products and instruments will be impacted by this transition.
. The lack of an active trading market for certain loans may impair the ability of the Fund to realize full value in the event of the need to sell a loan and may make it difficult to value such loans. Portfolio transactions in loans may settle in as short as seven days but typically can take up to two or three weeks, and in some cases much longer. As a result of these extended settlement periods, the Fund may incur losses if it is required to sell other investments or temporarily borrow to meet its cash needs. The risks associated with unsecured loans, which are not backed by a security interest in any specific collateral, are higher than those for comparable loans that are secured by specific collateral. For secured loans, there is a risk that the value of any collateral securing a loan in which the Fund has an interest may decline and that the collateral may not be sufficient to cover the amount owed on the loan. Interests in loans made to finance highly leveraged companies or transactions such as corporate acquisitions may be especially vulnerable to adverse changes in economic or market conditions. Loans may have restrictive covenants limiting the ability of a borrower to further encumber its assets. However, in periods of high demand by lenders like the Fund for loan investments, borrowers may limit these covenants and weaken a lender’s ability to access collateral securing the loan; reprice the credit risk associated with the borrower; and mitigate potential loss. The Fund may experience relatively greater realized or unrealized losses or delays and expenses in enforcing its rights with respect to loans with fewer restrictive covenants. Additionally, loans may not be considered “securities” and, as a result, the Fund may not be entitled to rely on the anti-fraud protections of the securities laws. Because junior loans have a lower place in an issuer’s capital structure and may be unsecured, junior loans involve a higher degree of overall risk than senior loans of the issuer.
Municipal Securities Market Liquidity Risk.
Inventories of municipal securities held by brokers and dealers have decreased in recent years, lessening their ability to make a market in these securities. This reduction in market making capacity has the potential to decrease the Fund’s ability to buy or sell municipal securities at attractive prices, and increase municipal security price volatility and trading costs, particularly during periods of economic or market stress. In addition, recent federal banking regulations may cause certain dealers to reduce their inventories of municipal securities, which may further decrease the Fund’s ability to buy or sell municipal securities. As a result, the Fund may be forced to accept a lower price to sell a security, to sell other securities to raise cash, or to give up an investment opportunity, any of which could have a negative effect on performance. If the Fund needed to sell large blocks of municipal securities to raise cash to meet its obligations, those sales could further reduce the municipal securities’ prices and hurt performance.
Municipal Securities Market Risk.
The amount of public information available about the municipal securities in the Fund’s portfolio is generally less than that for corporate equities or bonds, and the investment performance of the Fund may therefore be more dependent on the analytical abilities of the
sub-adviser
than if the Fund were a stock fund or taxable bond fund. The secondary market for municipal securities, particularly below investment grade municipal securities, also tends to be less well-developed or liquid than many other securities markets, which may adversely affect the Fund’s ability to sell its municipal securities at attractive prices.
Investments in securities of
non-U.S.
issuers involve special risks, including: less publicly available information about
non-U.S.
issuers or markets due to less rigorous disclosure or accounting standards or regulatory practices; many
non-U.S.
markets are smaller, less liquid and more volatile; the economies of
non-U.S.
countries may grow at slower rates than expected or may experience a downturn or recession; the impact of economic, political, social or diplomatic events; and withholding and other
non-U.S.
taxes may decrease the Fund’s return. These risks are more pronounced to the extent that the Fund invests a significant amount of its assets in issuers located in one region.
Other Investment Companies Risk.
The Fund may invest in the securities of other investment companies, including ETFs. Investing in an investment company exposes the Fund to all of the risks of that investment company’s investments. The Fund, as a holder of the securities of other investment companies, will bear its
portion of the other investment companies’ expenses, including advisory fees. These expenses are in addition to the
123
direct expenses of the Fund’s own operations. As a result, the cost of investing in investment company shares may exceed the costs of investing directly in its underlying investments. In addition, securities of other investment companies may be leveraged. As a result, the Fund may be indirectly exposed to leverage through an investment in such securities and therefore magnify the Fund’s leverage risk.
With respect to ETF’s, an ETF that is based on a specific index may not be able to replicate and maintain exactly the composition and relative weighting of securities in the index. The value of an ETF based on a specific index is subject to change as the values of its respective component assets fluctuate according to market volatility. ETFs typically rely on a limited pool of authorized participants to create and redeem shares, and an active trading market for ETF shares may not develop or be maintained. The market value of shares of ETFs and
closed-end
funds may differ from their NAV.
Preferred and Hybrid Preferred Securities Risk.
Preferred and other subordinated securities rank lower than bonds and other debt instruments in a company’s capital structure and therefore will be subject to greater credit risk than those debt instruments. There are various special risks associated with investing in preferred securities, including:
| | • | | Limited Voting Rights Risk. Generally, preferred security holders (such as the Fund) have no voting rights with respect to the issuing company unless preferred dividends have been in arrears for a specified number of periods, at which time the preferred security holders may elect a number of directors to the issuer’s board. Generally, once all the arrearages have been paid, the preferred security holders no longer have voting rights. In the case of certain preferred securities issued by trusts or special purpose entities, holders generally have no voting rights except if a declaration of default occurs and is continuing. In such an event, preferred security holders generally would have the right to appoint and authorize a trustee to enforce the trust’s or special purpose entity’s rights as a creditor under the agreement with its operating company. |
| | • | | Special Redemption Rights Risk. In certain circumstances, an issuer of preferred securities may redeem the securities at par prior to their stated maturity date. For instance, for certain types of preferred securities, a redemption may be triggered by a change in federal income tax or securities laws or regulatory or major corporate action. A redemption by the issuer may negatively impact the return of the security held by the Fund. |
| | • | | Payment Deferral and Omission Risk. Generally, preferred securities may be subject to provisions that allow an issuer, under certain conditions, to skip (“non-cumulative” preferred securities) or defer (“cumulative” preferred securities) distributions for a stated period without any adverse consequences to the issuer. Non-cumulative preferred securities can defer distributions indefinitely. Cumulative preferred securities typically contain provisions that allow an issuer, at its discretion, to defer distribution payments for up to 10 years. If the Fund owns a preferred security that is deferring its distribution, the Fund may be required to report income for tax purposes although it has not yet received such income. In addition, recent changes in bank regulations may increase the likelihood for issuers to defer or omit distributions. |
| | • | | Credit and Subordination Risk. Credit risk is the risk that a security in the Fund’s portfolio will decline in price or the issuer of the security will fail to make dividend, interest or principal payments when due because the issuer experiences a decline in its financial status. Preferred securities are generally subordinated to bonds and other debt instruments in a company’s capital structure in terms of having priority to corporate income, claims to corporate assets and liquidation payments, and therefore will be subject to greater credit risk than more senior debt instruments. |
| | • | | The market value of floating rate securities is a reflection of discounted expected cash flows based on expectations for future interest rate resets. The market value of such securities may fall in a declining interest rate environment and may also fall in a rising interest rate environment if there is a lag between the rise in interest rates and the reset. This risk may also be present with respect to fixed-to-floating rate securities in which the Fund may invest. A secondary risk associated with declining interest rates is the risk that income earned by the Fund on floating rate and fixed-to-floating rate securities may decline due to lower coupon payments on floating-rate securities. |
| | • | | Certain preferred securities may be substantially less liquid than many other securities, such as U.S. Government securities or common stock. Illiquid securities involve the risk that the securities will not be able to be sold at the time desired by the Fund or at prices approximating the value at which the Fund is carrying the securities on its books. |
| | • | | Issuers of preferred securities may be in industries that are heavily regulated and that may receive government funding. The value of preferred securities issued by these companies may be affected by changes in government policy, such as increased regulation, ownership restrictions, deregulation or reduced government funding. |
| | • | | New Types of Securities Risk. From time to time, preferred securities, including hybrid-preferred securities, have been, and may in the future be, offered having features other than those described herein. The Fund reserves the right to invest in these securities if the Sub-Advisers believe that doing so would be consistent with the Fund’s investment objective and policies. Since the market for these instruments would be new, the Fund may have difficulty disposing of them at a suitable price and time. In addition to limited liquidity, these instruments may present other risks, such as high price volatility. |
124
Reinvestment risk is the risk that income from the Fund’s portfolio will decline if and when the Fund invests the proceeds from matured, traded or called securities at market interest rates that are below the portfolio’s current earnings rate. A decline in income could affect the common shares’ market price, NAV and/or a common shareholder’s overall returns.
Senior loans typically hold the most senior position in the capital structure of a business entity, are typically secured with specific collateral and have a claim on the assets and/or stock of the issuer that is senior to that held by subordinated debt holders and stockholders of the issuer. Senior loans are usually rated below investment grade, and share the same risks of other below investment grade debt instruments.
Although the Fund may invest in senior loans that are secured by specific collateral, there can be no assurance that the liquidation of such collateral would satisfy an issuer’s obligation to the Fund in the event of issuer default or that such collateral could be readily liquidated under such circumstances. If the terms of a senior loan do not require the issuer to pledge additional collateral in the event of a decline in the value of the already pledged collateral, the Fund will be exposed to the risk that the value of the collateral will not at all times equal or exceed the amount of the issuer’s obligations under the senior loan.
In the event of bankruptcy of an issuer, the Fund could also experience delays or limitations with respect to its ability to realize the benefits of any collateral securing a senior loan. Some senior loans are subject to the risk that a court, pursuant to fraudulent conveyance or other similar laws, could subordinate the senior loans to presently existing or future indebtedness of the issuer or take other action detrimental to lenders, including the Fund. Such court action could under certain circumstances include invalidation of senior loans.
Sovereign Government and Supranational Debt Risk.
Investments in sovereign debt, including supranational debt, involve special risks. Foreign governmental issuers of debt or the governmental authorities that control the repayment of the debt may be unable or unwilling to repay principal or pay interest when due. In the event of default, there may be limited or no legal recourse in that, generally, remedies for defaults must be pursued in the courts of the defaulting party. Political conditions, especially a sovereign entity’s willingness to meet the terms of its debt obligations, are of considerable significance. The ability of a foreign sovereign issuer, especially an emerging market country, to make timely payments on its debt obligations will also be strongly influenced by the sovereign issuer’s balance of payments, including export performance, its access to international credit facilities and investments, fluctuations of interest rates and the extent of its foreign reserves. A country whose exports are concentrated in a few commodities or whose economy depends on certain strategic imports could be vulnerable to fluctuations in international prices of these commodities or imports. If a sovereign issuer cannot generate sufficient earnings from foreign trade to service its external debt, it may need to depend on continuing loans and aid from foreign governments, commercial banks, and multinational organizations. The cost of servicing external debt will also generally be adversely affected by rising international interest rates, as many external debt obligations bear interest at rates which are adjusted based upon international interest rates. Foreign investment in certain sovereign debt is restricted or controlled to varying degrees, including requiring governmental approval for the repatriation of income, capital or proceeds of sales by foreign investors. There are no bankruptcy proceedings similar to those in the U.S. by which defaulted sovereign debt may be collected.
The Fund may enter into derivative instruments such as credit default swap contracts and interest rate swaps. Like most derivative instruments, the use of swaps is a highly specialized activity that involves investment techniques and risks different from those associated with ordinary portfolio securities transactions. In addition, the use of swaps requires an understanding by the investment adviser and/or the
sub-adviser
of not only the referenced asset, rate or index, but also of the swap itself. If the investment adviser and/or the
sub-adviser
is incorrect in its forecasts of default risks, market spreads or other applicable factors or events, the investment performance of the Fund would diminish compared with what it would have been if these techniques were not used.
Unrated Securities Risk.
The Fund may purchase securities that are not rated by any rating organization. Unrated securities determined by the Fund’s investment adviser to be of comparable quality to rated investments which the Fund may purchase may pay a higher dividend or interest rate than such rated investments and be subject to a greater risk of illiquidity or price changes. Less public information is typically available about unrated investments or issuers than rated investments or issuers. Some unrated securities may not have an active trading market or may be difficult to value, which means the Fund might have difficulty selling them promptly at an acceptable price. To the extent that the Fund invests in unrated securities, the Fund’s ability to achieve its investment objectives will be more dependent on the investment adviser’s credit analysis than would be the case when the Fund invests in rated securities.
U.S. Government Securities Risk.
U.S. government securities are guaranteed only as to the timely payment of interest and the payment of principal when held to maturity. Accordingly, the current market values for these securities will fluctuate with changes in interest rates. Securities issued or guaranteed by U.S. government agencies and instrumentalities are supported by varying degrees of credit but generally are not backed by the full faith and credit of the U.S. government. No assurance can be given that the U.S. government will provide financial support to its agencies and instrumentalities if it is not obligated by law to do so.
The securities in which the Fund invests typically are valued by a pricing service utilizing a range of market-based inputs and assumptions, including readily available market quotations obtained from broker-dealers making markets in such instruments, cash flows and transactions for
125
comparable instruments. There is no assurance that the Fund will be able to sell a portfolio security at the price established by the pricing service, which could result in a loss to the Fund. Pricing services generally price securities assuming orderly transactions of an institutional “round lot” size, but some trades may occur in smaller, “odd lot” sizes, often at lower prices than institutional round lot trades. Different pricing services may incorporate different assumptions and inputs into their valuation methodologies, potentially resulting in different values for the same securities. As a result, if the Fund were to change pricing services, or if the Fund’s pricing service were to change its valuation methodology, there could be a material impact, either positive or negative, on the Fund’s NAV.
Warrants and Equity Securities Risk.
Investments in warrants and equity securities entail certain risks in addition to those associated with investments in adjustable rate instruments or other debt instruments. The value of warrants and equity securities may be affected more rapidly, and to a greater extent, by company-specific developments and general market conditions. These risks may increase fluctuations in the Fund’s NAV. The Fund may possess material
non-public
information about an issuer as a result of its ownership of an adjustable rate instrument or other debt instrument of such issuer. Because of prohibitions on trading in securities of issuers while in possession of such information, the Fund might be unable to enter into a transaction in a security of such an issuer when it would otherwise be advantageous to do so.
When-Issued and Delayed-Delivery Transactions Risk.
The Fund may invest in securities on a “when-issued” or “delayed-delivery” basis. When-issued and delayed-delivery transactions may involve an element of risk because no interest accrues on the securities prior to settlement and, because securities are subject to market fluctuations, the value of the securities at time of delivery may be less (or more) than their cost. A separate account of the Fund will be established with its custodian consisting of cash equivalents or liquid securities having a market value at all times at least equal to the amount of any delayed payment commitment.
Because interest on zero coupon bonds is not paid on a current basis, the values of zero coupon bonds will be more volatile in response to interest rate changes than the values of bonds that distribute income regularly. Although zero coupon bonds generate income for accounting purposes, they do not produce cash flow, and thus the Fund could be forced to liquidate securities at an inopportune time in order to generate cash to distribute to shareholders as required by tax laws.
Fund Level and Other Risks:
Anti-Takeover Provisions.
The Fund’s organizational documents include provisions that could limit the ability of other entities or persons to acquire control of the Fund or convert the Fund to
open-end
status. Although the application of the “Control Share Acquisition” provisions has currently been suspended, these provisions could have the effect of depriving the common shareholders of opportunities to sell their common shares at a premium over the then-current market price of the common shares.
In addition to borrowing for leverage, the Fund may borrow for temporary or emergency purposes, to pay dividends, repurchase its shares, or clear portfolio transactions. Borrowing may exaggerate changes in the NAV of the Fund’s shares and may affect the Fund’s net income. When the Fund borrows money, it must pay interest and other fees, which will reduce the Fund’s returns if such costs exceed the returns on the portfolio securities purchased or retained with such borrowings. Any such borrowings are intended to be temporary. However, under certain market circumstances, such borrowings might be outstanding for longer periods of time.
Changes in the credit quality of the companies that serve as the Fund’s counterparties with respect to derivatives or other transactions supported by another party’s credit will affect the value of those instruments. Certain entities that have served as counterparties in the markets for these transactions have incurred or may incur in the future significant financial hardships including bankruptcy and losses as a result of exposure to
sub-prime
mortgages and other lower-quality credit investments. As a result, such hardships have reduced these entities’ capital and called into question their continued ability to perform their obligations under such transactions. By using such derivatives or other transactions, the Fund assumes the risk that its counterparties could experience similar financial hardships. In the event of the insolvency of a counterparty, the Fund may sustain losses or be unable to liquidate a derivatives position.
The Fund and its service providers are susceptible to operational and information security risk resulting from cyber incidents. Cyber incidents refer to both intentional attacks and unintentional events including: processing errors, human errors, technical errors including computer glitches and system malfunctions, inadequate or failed internal or external processes, market-wide technical-related disruptions, unauthorized access to digital systems (through “hacking” or malicious software coding), computer viruses, and cyber-attacks which shut down, disable, slow or otherwise disrupt operations, business processes or website access or functionality (including denial of service attacks). Cyber incidents could adversely impact the Fund and cause the Fund to incur financial loss and expense, as well as face exposure to regulatory penalties, reputational damage, and additional compliance costs associated with corrective measures. In addition, substantial costs may be incurred in order to prevent any cyber incidents in the future. Furthermore, the Fund cannot control the cybersecurity plans and systems put in place by its service providers or any other third parties whose operations may affect the Fund.
126
National and regional economies and financial markets are becoming increasingly interconnected, which increases the possibilities that conditions in one country, region or market might adversely impact issuers in a different country, region or market. Changes in legal, political, regulatory, tax and economic conditions may cause fluctuations in markets and securities prices around the world, which could negatively impact the value of the Fund’s investments. Major economic or political disruptions, particularly in large economies like China’s, may have global negative economic and market repercussions. Additionally, the aftermath of the war in Iraq, instability in Afghanistan, Pakistan, Egypt, Libya, Syria, Russia, Ukraine and the Middle East, and environmental disasters and the spread of infectious illnesses or other public health emergencies, possible terrorist attacks in the United States and around the world, continued tensions between North Korea and the United States and the international community generally, growing social and political discord in the United States, the European debt crisis, the response of the international community – through economic sanctions and otherwise – further downgrade of U.S. government securities, the change in the U.S. president and the new administration and other similar events may adversely affect the global economy and the markets and issuers in which the Fund invests. Recent examples of such events include the outbreak of a novel coronavirus known as
COVID-19
that was first detected in China in December 2019 and heightened concerns regarding North Korea’s nuclear weapons and long-range ballistic missile programs. These events could reduce consumer demand or economic output, result in market closure, travel restrictions or quarantines, and generally have a significant impact on the economy. These events could also impair the information technology and other operational systems upon which the Fund’s service providers, including the investment adviser and
sub-adviser,
rely, and could otherwise disrupt the ability of employees of the Fund’s service providers to perform essential tasks on behalf of the Fund. Governmental and quasi-governmental authorities and regulators throughout the world have in the past responded to major economic disruptions with a variety of significant fiscal and monetary policy changes, including but not limited to, direct capital infusions into companies, new monetary programs and dramatically lower interest rates. An unexpected or quick reversal of these policies, or the ineffectiveness of these policies, could increase volatility in securities markets, which could adversely affect the Fund’s investments.
In late February 2022, Russia launched a large scale military attack on Ukraine. The invasion significantly amplified already existing geopolitical tensions among Russia, Ukraine, Europe, North Atlantic Treaty Organization and the West, including the U.S. The military attack may have an adverse impact on the Fund’s investments in Ukraine or Russia and Ukrainian or Russian companies. In response to the military action by Russia, various countries, including the U.S., the United Kingdom, and European Union issued broad-ranging economic sanctions against Russia. Such sanctions included, among other things, a prohibition on doing business with certain Russian companies, large financial institutions, officials and oligarchs; a commitment by certain countries and the European Union to remove selected Russian banks from the Society for Worldwide Interbank Financial Telecommunications (“SWIFT”), the electronic banking network that connects banks globally; and restrictive measures to prevent the Russian Central Bank from undermining the impact of the sanctions. Additional sanctions may be imposed in the future. Such sanctions (and any future sanctions) and other actions against Russia may adversely impact, among other things, the Russian economy and various sectors of the economy, including but not limited to, financials, energy, metals and mining, engineering and defense and defense-related materials sectors; result in a decline in the value and liquidity of Russian securities; result in boycotts, tariffs, and purchasing and financing restrictions on Russia’s government, companies and certain individuals; weaken the value of the ruble; downgrade the country’s credit rating; freeze Russian securities and/or funds invested in prohibited assets and impair the ability to trade in Russian securities and/or other assets; and have other adverse consequences on the Russian government, economy, companies and region. Further, several large corporations and U.S. states have announced plans to divest interests or otherwise curtail business dealings with certain Russian businesses.
The ramifications of the hostilities and sanctions, however, may not be limited to Russia, Ukraine and Russian and Ukrainian companies but may spill over to and negatively impact other regional and global economic markets (including Europe and the United States), companies in other countries (particularly those that have done business with Russia and Ukraine) and on various sectors, industries and markets for securities and commodities globally, such as oil and natural gas. Accordingly, the actions discussed above and the potential for a wider conflict could increase financial market volatility, cause severe negative effects on regional and global economic markets, industries, and companies and have a negative effect on your Fund’s investments and performance beyond any direct exposure to Russian and Ukrainian issuers or those of adjoining geographic regions. In addition, Russia may take retaliatory actions and other countermeasures, including cyberattacks and espionage against other countries and companies around the world, which may negatively impact such countries and the companies in which the Fund invests.
The extent and duration of the military action or future escalation of such hostilities, the extent and impact of existing and future sanctions, market disruptions and volatility, and the result of any diplomatic negotiations cannot be predicted. These and any related events could have a significant impact on Fund performance and the value of an investment in the Fund, particularly with respect to Russian and Ukrainian exposure.
Investment and Market Risk.
An investment in the Fund’s common shares is subject to investment risk, including the possible loss of the entire principal amount that you invest. Common shares frequently trade at a discount to their NAV. An investment in common shares represents an indirect investment in the securities owned by the Fund. Common shares at any point in time may be worth less than your original investment, even after taking into account the reinvestment of Fund dividends and distributions.
Legislation and Regulatory Risk.
At any time after the date of this report, legislation or additional regulations may be enacted that could negatively affect the assets of the Fund, securities held by the Fund or the issuers of such securities. Fund shareholders may incur increased costs resulting from such
127
legislation or additional regulation. There can be no assurance that future legislation, regulation or deregulation will not have a material adverse effect on the Fund or will not impair the ability of the Fund to achieve its investment objectives.
The use of leverage creates special risks for common shareholders, including potential interest rate risks and the likelihood of greater volatility of NAV and market price of, and distributions on, the common shares. The use of leverage in a declining market will likely cause a greater decline in the Fund’s NAV, which may result at a greater decline of the common share price, than if the Fund were not to have used leverage.
The Fund will pay (and common shareholders will bear) any costs and expenses relating to the Fund’s use of leverage, which will result in a reduction in the Fund’s NAV. The investment adviser may, based on its assessment of market conditions and composition of the Fund’s holdings, increase or decrease the amount of leverage. Such changes may impact the Fund’s distributions and the price of the common shares in the secondary market.
The Fund may seek to refinance its leverage over time, in the ordinary course, as current forms of leverage mature or it is otherwise desirable to refinance; however, the form that such leverage will take cannot be predicted at this time. If the Fund is unable to replace existing leverage on comparable terms, its costs of leverage will increase. Accordingly, there is no assurance that the use of leverage may result in a higher yield or return to common shareholders.
The amount of fees paid to the investment adviser and the
sub-advisor
for investment advisory services will be higher if the Fund uses leverage because the fees will be calculated based on the Fund’s Managed Assets – this may create an incentive for the investment adviser and the
sub-advisor
to leverage the Fund or increase the Fund’s leverage.
Because the assets of the Fund will be liquidated in connection with its termination, the Fund may be required to sell portfolio securities when it otherwise would not, including at times when market conditions are not favorable, which may cause the Fund to lose money. The Fund’s investment objectives and policies are not designed to return to investors who purchase common shares in this offering their initial investment on the termination date. When terminated, the Fund’s distributions will be based upon the Fund’s NAV at the end of the term and such initial investors and any investors that purchase common shares after the completion of this offering may receive more or less than their original investment upon termination.
Market Discount from Net Asset Value.
Shares of
closed-end
investment companies like the Fund frequently trade at prices lower than their NAV. This characteristic is a risk separate and distinct from the risk that the Fund’s NAV could decrease as a result of investment activities. Whether investors will realize gains or losses upon the sale of the common shares will depend not upon the Fund’s NAV but entirely upon whether the market price of the common shares at the time of sale is above or below the investor’s purchase price for the common shares. Furthermore, management may have difficulty meeting the Fund’s investment objectives and managing its portfolio when the underlying securities are redeemed or sold during periods of market turmoil and as investors’ perceptions regarding
closed-end
funds or their underlying investments change. Because the market price of the common shares will be determined by factors such as relative supply of and demand for the common shares in the market, general market and economic circumstances, and other factors beyond the control of the Fund, the Fund cannot predict whether the common shares will trade at, below or above NAV. The common shares are designed primarily for long-term investors, and you should not view the Fund as a vehicle for short-term trading purposes.
Recent Market Conditions.
In response to the financial crisis and recent market events, the United States and other governments and the Federal Reserve and certain foreign central banks have taken steps to support financial markets. Policy and legislative changes by the United States government and the Federal Reserve to assist in the ongoing support of financial markets, both domestically and in other countries, are changing many aspects of financial regulation. The impact of these changes on the markets, and the practical implications for market participants, may not be fully known for some time. In some countries where economic conditions are recovering, such countries are nevertheless perceived as still fragile. Withdrawal of government support, failure of efforts in response to the crisis, or investor perception that such efforts are not succeeding, could adversely impact the value and liquidity of certain investments. The severity or duration of adverse economic conditions may also be affected by policy changes made by governments or quasigovernmental organizations, including changes in tax laws and the imposition of trade barriers. The impact of new financial regulation legislation on the markets and the practical implications for market participants may not be fully known for some time. Changes to the Federal Reserve policy, including with respect to certain interest rates, may affect the value, volatility and liquidity of dividend and interest paying securities. Regulatory changes are causing some financial services companies to exit long-standing lines of business, resulting in dislocations for other market participants. The U.S. government has recently reduced the federal corporate income tax rate, and future legislative, regulatory and policy changes may result in more restrictions on international trade, less stringent prudential regulation of certain players in the financial markets, and significant new investments in infrastructure and national defense. Markets may react strongly to expectations about the changes in these policies, which could increase volatility, especially if the markets’ expectations for changes in government policies are not borne out.
Changes in market conditions will not have the same impact on all types of investments. Interest rates have been unusually low in recent years in the United States and abroad but there is consensus that interest rates will increase during the life of the Fund, which could negatively impact the price of debt securities. Because there is little precedent for this situation, it is difficult to predict the impact of a significant rate increase on various markets. In addition, there is a risk that the prices of goods and services in the United States and many foreign economies may decline over time, known as deflation (the opposite of inflation). Deflation may have an adverse effect on stock prices and creditworthiness and may make defaults on debt more likely. If a country’s economy slips into a deflationary pattern, it could last for a prolonged period and may be difficult to reverse.
128
On June 23, 2016, the United Kingdom (“UK”) held a referendum on whether to remain a member state of the European Union (“EU”), in which voters favored the UK’s withdrawal from the EU, an event widely referred to as “Brexit” and which triggered a
two-year
period of negotiations on the terms of withdrawal. The formal notification to the European Council required under Article 50 of the Treaty on EU was made on March 29, 2017, following which the terms of exit were negotiated. On January 31, 2020, the UK formally withdrew from the EU and the two sides entered into a transition phase, where the UK effectively remained in the EU from an economic perspective, but no longer had any political representation in the EU parliament. The transition period concluded on December 31, 2020, and EU law no longer applies in the UK. On December 30, 2020, the UK and EU signed an
EU-UK
Trade and Cooperation Agreement (“UK/EU Trade Agreement”), which went into effect on January 1, 2021 and sets out the foundation of the economic and legal framework for trade between the UK and EU. As the UK/EU Trade Agreement is a new legal framework, the implementation of the UK/EU Trade Agreement may result in uncertainty in its application and periods of volatility in both the UK and wider European markets. The longer term economic, legal, political and social framework to be put in place between the UK and the EU are unclear at this stage, remain subject to negotiation and are likely to lead to ongoing political and economic uncertainty and periods of exacerbated volatility in both the UK and in wider European markets for some time. The outcomes may cause increased volatility and have a significant adverse impact on world financial markets, other international trade agreements, and the UK and European economies, as well as the broader global economy for some time. Additionally, a number of countries in Europe have suffered terror attacks, and additional attacks may occur in the future. Ukraine has experienced ongoing military conflict, most recently in February 2022 when Russia invaded Ukraine; this conflict may expand and military attacks could occur elsewhere in Europe. Europe has also been struggling with mass migration from the Middle East and Africa. The ultimate effects of these events and other socio-political or geographical issues are not known but could profoundly affect global economies and markets.
The ongoing trade war between China and the United States, including the imposition of tariffs by each country has recently imposed tariffs on the other country’s products, has created a tense political environment. These actions may trigger a significant reduction in international trade, the oversupply of certain manufactured goods, substantial price reductions of goods and possible failure of individual companies and/or large segments of China’s export industry, which could have a negative impact on the Fund’s performance. U.S. companies that source material and goods from China and those that make large amounts of sales in China would be particularly vulnerable to an escalation of trade tensions. Uncertainty regarding the outcome of the trade tensions and the potential for a trade war could cause the U.S. dollar to decline against safe haven currencies, such as the Japanese yen and the euro. Events such as these and their consequences are difficult to predict and it is unclear whether further tariffs may be imposed or other escalating actions may be taken in the future.
The impact of these developments in the near- and long-term is unknown and could have additional adverse effects on economies, financial markets and asset valuations around the world.
Reverse Repurchase Agreement Risk.
A reverse repurchase agreement, in economic essence, constitutes a securitized borrowing by the Fund from the security purchaser. The Fund may enter into reverse repurchase agreements for the purpose of creating a leveraged investment exposure and, as such, their usage involves essentially the same risks associated with a leveraging strategy generally since the proceeds from these agreements may be invested in additional portfolio securities. Reverse repurchase agreements tend to be short-term in tenor, and there can be no assurances that the purchaser (lender) will commit to extend or “roll” a given agreement upon its agreed-upon repurchase date or an alternative purchaser can be identified on similar terms. Reverse repurchase agreements also involve the risk that the purchaser fails to return the securities as agreed upon, files for bankruptcy or becomes insolvent. The Fund may be restricted from taking normal portfolio actions during such time, could be subject to loss to the extent that the proceeds of the agreement are less than the value of securities subject to the agreement and may experience adverse tax consequences.
The Fund has elected to be treated and intends to qualify each year as a Regulated Investment Company (“RIC”) under the Internal Revenue Code of 1986, as amended (the “Code”). As a RIC, the Fund is not expected to be subject to U.S. federal income tax to the extent that it distributes its investment company taxable income and net capital gains. To qualify for the special tax treatment available to a RIC, the Fund must comply with certain investment, distribution, and diversification requirements. Under certain circumstances, the Fund may be forced to sell certain assets when it is not advantageous in order to meet these requirements, which may reduce the Fund’s overall return. If the Fund fails to meet any of these requirements, subject to the opportunity to cure such failures under applicable provisions of the Code, the Fund’s income would be subject to a double level of U.S. federal income tax. The Fund’s income, including its net capital gain, would first be subject to U.S. federal income tax at regular corporate rates, even if such income were distributed to shareholders and, second, all distributions by the Fund from earnings and profits, including distributions of net capital gain (if any), would be taxable to shareholders as dividends.
129
EFFECTS OF LEVERAGE
The following table is furnished in response to requirements of the SEC. It is designed to illustrate the effects of leverage through the use of senior securities, as that term is defined under Section 18 of the 1940 Act, as well as certain other forms of leverage, such as reverse repurchase agreements, on common share total return, assuming investment portfolio total returns (consisting of income and changes in the value of investments held in the Fund’s portfolio) of
-10%,
-5%,
0%, 5% and 10%. The table below reflects each Fund’s (i) continued use of leverage as of July 31, 2022 as a percentage of Managed Assets (including assets attributable to such leverage), (ii) the estimated annual effective interest expense rate payable by the Funds on such instruments (based on actual leverage costs incurred during the fiscal year ended July 31, 2022) as set forth in the table, and (iii) the annual return that the Fund’s portfolio must experience (net of expenses) in order to cover such costs of leverage based on such estimated annual effective interest expense rate. The information below does not reflect any Fund’s use of certain other forms of economic leverage achieved through the use of certain derivative instruments.
The numbers are merely estimates, used for illustration. The costs of leverage may vary frequently and may be significantly higher or lower than the estimated rate. The assumed investment portfolio returns in the table below are hypothetical figures and are not necessarily indicative of the investment portfolio returns e
xperienc
ed or expected to be experienced by the Funds. Your actual returns may be
greate
r or less than those appearing below.
| | | | | | | | | | | | | | | | | | | | |
| | | Nuveen
Preferred &
Income
Opportunities
Fund (JPC) | | | Nuveen
Preferred and
Income Term
Fund (JPI) | | | Nuveen
Preferred &
Income
Securities Fund
(JPS) | | | Nuveen
Preferred and
Income Fund
(JPT) | | | Nuveen
Variable Rate
Preferred &
Income Fund
(NPFD) | |
| Estimated Leverage as a Percentage of Managed Assets (Including Assets Attributable to Leverage) | | | 37.28% | | | | 36.72% | | | | 38.09% | | | | 33.59% | | | | 36.46% | |
| Estimated Annual Effective Leverage Expense Rate Payable by Fund on Leverage | | | 1.22% | | | | 1.25% | | | | 1.23% | | | | 1.19% | | | | 1.59% | |
| Annual Return Fund Portfolio Must Experience (net of expenses) to Cover Estimated Annual Effective Interest Expense Rate on Leverage | | | 0.45% | | | | 0.46% | | | | 0.47% | | | | 0.40% | | | | 0.58% | |
| Common Share Total Return for (10.00)% Assumed Portfolio Total Return | | | -16.67% | | | | -16.53% | | | | -16.91% | | | | -15.66% | | | | -16.65% | |
| Common Share Total Return for (5.00)% Assumed Portfolio Total Return | | | -8.69% | | | | -8.63% | | | | -8.83% | | | | -8.13% | | | | -8.78% | |
| Common Share Total Return for 0.00% Assumed Portfolio Total Return | | | -0.72% | | | | -0.72% | | | | -0.76% | | | | -0.60% | | | | -0.91% | |
| Common Share Total Return for 5.00% Assumed Portfolio Total Return | | | 7.25% | | | | 7.18% | | | | 7.32% | | | | 6.93% | | | | 6.96% | |
| Common Share Total Return for 10.00% Assumed Portfolio Total Return | | | 15.22% | | | | 15.08% | | | | 15.40% | | | | 14.46% | | | | 14.83% | |
Common Share total return is composed of two elements — the distributions paid by the Fund to holders of common shares (the amount of which is largely determined by the net investment income of the Fund after paying dividend payments on any preferred shares issued by the Fund and expenses on any forms of leverage outstanding) and gains or losses on the value of the securities and other instruments the Fund owns. As required by SEC rules, the table assumes that the Funds are more likely to suffer capital losses than to enjoy capital appreciation. For example, to assume a total return of 0%, the Fund must assume that the income it receives on its investments is entirely offset by losses in the value of those investments. This table reflects hypothetical performance of the Fund’s portfolio and not the actual performance of the Fund’s common shares, the value of which is determined by market forces and other factors. Should the Fund elect to add additional leverage to its portfolio, any benefits of such additional leverage cannot be fully achieved until the proceeds resulting from the use of such leverage have been received by the Fund and invested in accordance with the Fund’s investment objectives and policies. As noted above, the Fund’s willingness to use additional leverage, and the extent to which leverage is used at any time, will depend on many factors.
130
DIVIDEND REINVESTMENT PLAN
Nuveen
Closed-End
Funds Automatic Reinvestment Plan
Your Nuveen
Closed-End
Fund allows you to conveniently reinvest distributions in additional Fund shares. By choosing to reinvest, you’ll be able to invest money regularly and automatically, and watch your investment grow through the power of compounding. Just like distributions in cash, there may be times when income or capital gains taxes may be payable on distributions that are reinvested. It is important to note that an automatic reinvestment plan does not ensure a profit, nor does it protect you against loss in a declining market.
Easy and convenient
To make recordkeeping easy and convenient, each quarter you’ll receive a statement showing your total distributions, the date of investment, the shares acquired and the price per share, and the total number of shares you own.
How shares are purchased
The shares you acquire by reinvesting will either be purchased on the open market or newly issued by the Fund. If the shares are trading at or above NAV at the time of valuation, the Fund will issue new shares at the greater of the NAV or 95% of the then-current market price. If the shares are trading at less than NAV, shares for your account will be purchased on the open market. If Computershare Trust Company, N.A. (the “Plan Agent”) begins purchasing Fund shares on the open market while shares are trading below NAV, but the Fund’s shares subsequently trade at or above their NAV before the Plan Agent is able to complete its purchases, the Plan Agent may cease open-market purchases and may invest the uninvested portion of the distribution in newly-issued Fund shares at a price equal to the greater of the shares’ NAV or 95% of the shares’ market value on the last business day immediately prior to the purchase date. Distributions received to purchase shares in the open market will normally be invested shortly after the distribution payment date. No interest will be paid on distributions awaiting reinvestment. Because the market price of the shares may increase before purchases are completed, the average purchase price per share may exceed the market price at the time of valuation, resulting in the acquisition of fewer shares than if the distribution had been paid in shares issued by the Fund. A pro rata portion of any applicable brokerage commissions on open market purchases will be paid by Dividend Reinvestment Plan (the “Plan”) participants. These commissions usually will be lower than those charged on individual transactions.
Flexible
You may change your distribution option or withdraw from the Plan at any time, should your needs or situation change. You can reinvest whether your shares are registered in your name, or in the name of a brokerage firm, bank, or other nominee. Ask your investment advisor if his or her firm will participate on your behalf. Participants whose shares are registered in the name of one firm may not be able to transfer the shares to another firm and continue to participate in the Plan. The Fund reserves the right to amend or terminate the Plan at any time. Although the Fund reserves the right to amend the Plan to include a service charge payable by the participants, there is no direct service charge to participants in the Plan at this time.
Call today to start reinvesting distributions
For more information on the Nuveen Automatic Reinvestment Plan or to enroll in or withdraw from the Plan, speak with your financial professional or call us at (800)
257-8787.
131
CHANGES OCCURRING DURING THE FISCAL YEAR
The following information in this annual report is a summary of certain changes during the most recent fiscal year. This information may not reflect all of the changes that have occurred since you purchased shares of a Fund.
During the most recent fiscal year, there have been no changes to: (i) the Funds’ investment objectives and principal investment policies that have not been approved by shareholders, (ii) the principal risks of the Fund, (iii) the portfolio managers of the Funds; (iv) a Fund’s charter or
by-laws
that would delay or prevent a change of control of the Fund that have not been approved by shareholders
except as follows
:
Changes to Investment
Sub-Adviser
The Board of Trustees of Nuveen Preferred & Income Opportunities Fund (JPC) approved the termination by the Fund’s investment adviser, Nuveen Fund Advisors, LLC, of
its sub-advisory agreement
with NWQ Investment Management Company, LLC (“NWQ”) with respect to the Fund, effective December 31, 2021. The termination was approved in connection with the transfer of investment management personnel from NWQ into its affiliate, Nuveen Asset Management, LLC (“Nuveen Asset Management”), also
a sub-adviser to
the Fund, which occured on December 31, 2021. On that date, any Fund assets managed by NWQ were reallocated to Nuveen Asset Management, with the NWQ personnel who currently serve as portfolio managers continuing to do so as Nuveen Asset Management personnel.
The terms of Nuveen Asset Management’s
existing sub-advisory agreement
with respect to the Fund are substantially identical to the terms of
NWQ’s sub-advisory agreement.
As such, this change will have no impact on the Fund’s fees, nor will it impact the Fund’s investment objectives or policies. Policies that apply only to a
particular sub-adviser will
not be impacted and will continue to apply only to those portfolio managers subject to such policies prior to the termination of NWQ on December 31, 2021. For example, the Fund’s policy to invest up to 5% of the portion of its portfolio managed by Nuveen Asset Management in preferred securities issued by companies located in emerging market countries continue to apply only to those portfolio managers employed by Nuveen Asset Management prior to the termination of NWQ and will not impact those portfolio managers previously employed by NWQ who will serve as Nuveen Asset Management personnel beginning December 31, 2021.
Changes to Portfolio Managers
Effective April 1, 2022, Thomas J. Ray and Susi Budiman will no
longer co-manage the
Nuveen Preferred & Income Opportunities Fund (JPC) with Douglas Baker and Brenda A. Langenfeld. Mr. Baker and Ms. Langenfeld will assume sole responsibility for the portfolio management of the Fund.
Changes to Investment Policies
Effective April 1, 2022, the Nuveen Preferred & Income Opportunities Fund (JPC) clarified its policy related to the percentage of the Fund’s portfolio that may be invested in “preferred securities issued by companies located in emerging market countries.” Accordingly, each such reference to this policy, is hereby deleted in its entirety and replaced with the following sentence:
The Fund may invest up to 5% of its Managed Assets in preferred securities issued by companies located in emerging market countries.
Effective February 28, 2022, the Nuveen Preferred & Income Fund (JPT) amended its investment policies to permit investment in contingent capital securities (“CoCos”). The following investment policy now states:
The Fund will invest at least 80% of its Assets (as defined below) in preferred securities and other income producing securities, including hybrid securities such as contingent capital securities (sometimes referred to as “CoCos”).
Additionally, the following investment policy was removed from JPT effective February 28, 2022:
The Fund will not invest, either directly or indirectly through derivatives, in contingent capital securities.
The following principal risk has been added for the Nuveen Preferred & Income Fund (JPT):
Contingent Capital Securities (“CoCos”) Risk.
A loss absorption mechanism trigger event for CoCos would likely be the result of, or related to, the deterioration of the issuer’s financial condition (e.g., a decrease in the issuer’s capital ratio) and status as a going concern. In such a case, with respect to CoCos that provide for conversion into common stock upon the occurrence of the trigger event, the market price of the issuer’s common stock received by the Fund will have likely declined, perhaps substantially, and may continue to decline, which may adversely affect the Fund’s NAV. Further, the issuer’s common stock would be subordinate to the issuer’s other classes of securities and therefore would worsen the Fund’s standing in a bankruptcy proceeding. In addition, because the common stock of the issuer may not pay a dividend, investors in these instruments could experience a reduced income rate, potentially to zero. In view of the foregoing, CoCos are often rated below investment grade and are subject to the risks of below investment grade securities.
132
CoCos may be subject to an automatic write-down (i.e., the automatic write-down of the principal amount or value of the securities, potentially to zero, and the cancellation of the securities) under certain circumstances, which could result in the Fund losing a portion or all of its investment in such securities. In addition, the Fund may not have any rights with respect to repayment of the principal amount of the securities that has not become due or the payment of interest or dividends on such securities for any period from (and including) the interest or dividend payment date falling immediately prior to the occurrence of such automatic write-down. An automatic write-down could also result in a reduced income rate if the dividend or interest payment is based on the security’s par value. Coupon payments on CoCos may be discretionary and may be cancelled by the issuer for any reason or may be subject to approval by the issuer’s regulator and may be suspended in the event there are insufficient distributable reserves.
In certain scenarios, investors in CoCos may suffer a loss of capital ahead of equity holders or when equity holders do not. There is no guarantee that the Fund will receive a return of principal on CoCos. Any indication that an automatic write-down or conversion event may occur can be expected to have a material adverse effect on the market price of CoCos.
The prices of CoCos may be volatile. Additionally, the trading behavior of a given issuer’s CoCo may be strongly impacted by the trading behavior of other issuers’ CoCos, such that negative information from an unrelated CoCo may cause a decline in value of one or more CoCos held by afund. Accordingly, the trading behavior of CoCos may not follow the trading behavior of other similarly structured securities.
CoCos are issued primarily by financial institutions. Therefore, CoCos present substantially increased risks at times of financial turmoil, which could affect financial institutions more than companies in other sectors and industries.
The following principal risk has been removed for the Nuveen Preferred & Income Fund (JPT):
Because the assets of the Fund will be liquidated in connection with its termination, the Fund may be required to sell portfolio securities when it otherwise would not, including at times when market conditions are not favorable, which may cause the Fund to lose money. The Fund’s investment objectives and policies are not designed to return to investors who purchase common shares in this offering their initial investment on the termination date. When terminated, the Fund’s distributions will be based upon the Fund’s NAV at the end of the term and such initial investors and any investors that purchase common shares after the completion of this offering may receive more or less than their original investment upon termination.
The following principal risks have been added for the Nuveen Preferred & Income Opportunities Fund (JPC), Nuveen Preferred & Income Term Fund (JPI), Nuveen Preferred & Income Securities Fund (JPS), Nuveen Preferred & Income Fund (JPT) and the Nuveen Variable Rate Preferred & Income Fund (JQC):
Inflation Correlation Risk.
Although the values of certain of the Fund’s investments are generally linked or correlated to the rate of inflation, there is no guarantee that such investments will provide any protection against the impact of inflation. In addition, while these investments are expected to be protected from long-term inflationary trends, short-term increases in inflation may lead to a decline in their value. Further, when inflation and expectations of inflation are low or declining, the Fund’s positions in such investments are likely to underperform the overall stock markets.
Many floating rate loans issued after 2008 include a “LIBOR floor,” based on LIBOR, or a minimum interest rate to which the loan’s spread is added, to calculate the loan’s overall interest rate. As short-term market rates rise, such loans will not pay higher interest until prevailing rates exceed the floor rate stated in the loan documents.
Developments Regarding the Funds’ Control Share
By-Law
On October 5, 2020, the Nuveen Preferred & Income Opportunities Fund, Nuveen Preferred & Income Term Fund, Nuveen Preferred & Income Securities Fund, Nuveen Preferred & Income Fund and the Nuveen Variable Rate Preferred & Income Fund (each a “Fund” and collectively the “Funds”) and certain other
closed-end
funds in the Nuveen fund complex amended their
by-laws.
Among other things, the amended
by-laws
included provisions pursuant to which, in summary, a shareholder who obtains beneficial ownership of common shares in a Control Share Acquisition (as defined in the
by-laws)
shall have the same voting rights as other common shareholders only to the extent authorized by the other disinterested shareholders (the “Control Share
By-Law”).
On January 14, 2021, a shareholder of certain Nuveen
closed-end
funds filed a civil complaint in the U.S. District Court for the Southern District of New York (the “District Court”) against certain Nuveen funds and their trustees, seeking a declaration that such funds’ Control Share
By-Laws
violate the 1940 Act, rescission of such fund’s Control Share
By-Laws
and a permanent injunction against such funds applying the Control Share
By-Laws.
On February 18, 2022, the District Court granted judgment in favor of the plaintiff’s claim for rescission of such funds’ Control Share
By-Laws
and the plaintiff’s declaratory judgment claim, and declared that such funds’ Control Share
By-Laws
violate Section 18(i) of the 1940 Act. Following review of the judgment of the District Court, on February 22, 2022, the Board amended the Funds’ bylaws to provide that the Funds’ Control Share
By-Law
shall be of no force and effect for so long as the judgment of the District Court is effective and that if the judgment of the District Court is reversed, overturned, vacated, stayed, or otherwise nullified, the Fund’s Control Share
By-Law
will be automatically reinstated and apply to any beneficial owner of common shares acquired in a Control Share Acquisition, regardless of whether such Control Share Acquisition occurs before or after such reinstatement, for the duration of the stay or upon issuance of the mandate reversing, overturning, vacating or otherwise nullifying the judgment of the District Court. On February 25, 2022, the Board and the Funds appealed the District Court’s decision to the U.S. Court of Appeals for the Second Circuit.
133
Fund Restructuring for Nuveen Preferred and Income Fund (JPT)
On January 19, 2022, shareholders of Nuveen Preferred and Income Fund (JPT) approved a proposal to restructure the fund (the “restructuring”). The restructuring allowed shareholders the opportunity to maintain their investment in JPT and its exposure to a leveraged strategy focused on preferred and other income producing securities in lieu of the scheduled termination of the fund. The effectiveness of the restructuring was contingent on the success of the fund’s tender offer.
On January 20, 2022, JPT conducted a tender offer, which allowed shareholders to offer up to 100% of their shares for repurchase for cash at a price per share equal to 100% of the NAV per share determined on the date the tender offer expired.
JPT’s tender offer expired on February 17, 2022. In the tender offer 2,454,617 shares were tendered, representing approximately 36% of JPT’s common shares outstanding. Properly tendered shares were repurchased at $23.2613 per share, which was the NAV of the fund as of the close of ordinary trading on the New York Stock Exchange on February 17, 2022.
As a result of the successful completion of the tender offer, the restructuring of the JPT was completed and on February 28, 2022 the following changes became effective.
| | • | | JPT’s declaration of trust was amended to eliminate the term of the fund. |
| | • | | JPT’s investment policies were amended to permit investment in contingent capital securities (sometimes referred to as “CoCos”). |
| | • | | JPT’s name changed to Nuveen Preferred and Income Fund. |
| | • | | Nuveen Fund Advisors, LLC, the investment adviser to the fund, will waive 50% of the fund’s net management fees beginning February 28, 2022, and continuing over the first year following the elimination of the term. |
More details about JPT’s restructuring is available on www.nuveen.com/cef.
134
UPDATED DISCLOSURES FOR FUNDS WITH AN EFFECTIVE SHELF OFFERING REGISTRATION STATEMENT
The following includes additional disclosures for the Funds in this annual report with an effective shelf offering registration statement as of the fiscal year ended July 31, 2022.
NUVEEN PREFERRED & INCOME OPPORTUNITIES FUND (JPC)
NUVEEN PREFERRED & INCOME SECURITIES FUND (JPS)
SUMMARY OF FUND EXPENSES
The purpose of the tables and the examples below are to help you understand all fees and expenses that you, as a common shareholder,
would
bear directly or indirectly. The tables show the expenses of the Fund as a percentage of the average net assets attributable to Common Shares and not as a percentage of total assets or managed assets.
| | | | | | | | |
| Shareholder Transaction Expenses | | Nuveen
Preferred &
Income
Opportunities
Fund (JPC) | | | Nuveen
Preferred &
Income
Securities Fund (JPS) | |
| Maximum Sales Charge (as a percentage of offering price) (1) | | | 4.00% | | | | 4.00% | |
| Dividend Reinvestment Plan Fees (2) | | $ | 2.50 | | | $ | 2.50 | |
| (1) | A maximum sales charge of 4.00% applies only to offerings pursuant to a syndicated underwriting. The maximum sales charge for offerings made is 1.00%. There is no sales charge for offerings pursuant to a private transaction. |
| (2) | You will be charged a $2.50 service charge and pay brokerage charges if you direct ComputerShare Inc. and ComputerShare Trust Company, N.A., as agent for the common shareholders, to sell your Common Shares held in a dividend reinvestment account. |
| | | | | | | | |
| | | As a Percentage of Net Assets
Attributable to Common Shares (1) | |
| Annual Expenses | | Nuveen
Preferred &
Income
Opportunities
Fund (JPC) | | | Nuveen
Preferred &
Income
Securities Fund (JPS) | |
| Management Fees | | | 1.28% | | | | 1.26% | |
| Interest and Other Related Expenses (2) | | | 0.72% | | | | 0.73% | |
| Other Expenses (3) | | | 0.06% | | | | 0.07% | |
| Total Annual Expenses | | | 2.06% | | | | 2.06% | |
| (1) | Stated as percentages of average net assets attributable to Common Shares for the fiscal year ended July 31, 2022. |
| (2) | Interest and Other Related Expenses reflect actual expenses and fees for leverage incurred by a Fund for the fiscal year ended July 31, 2022. The types of leverage used by each Fund during the fiscal year ended July 31, 2022 are described in the Fund Leverage and the Notes to Financial Statements (Note 4 – Portfolio Securities and Investments in Derivatives, Portfolio Securities; Note 5 – Fund Shares, Preferred Shares; and Note 9 – Borrowing Arrangements and Reverse Repurchase Agreements) sections of this annual report. Actual Interest and Other Related Expenses incurred in the future may be higher or lower. If short-term market interest rates rise in the future, and if a Fund continues to maintain leverage the cost of which is tied to short-term interest rates, a Fund’s interest expenses on its short-term borrowings can be expected to rise in tandem. A Fund’s use of leverage will increase the amount of management fees paid to the Fund’s adviser and sub-advisor(s). |
| (3) | Other Expenses are based on estimated amounts for the current fiscal year. Expenses attributable to the Fund’s investments, if any, in other investment companies are currently estimated not to exceed 0.01%. |
The
following
examples
illustrate the expenses, including the applicable transaction fees (referred to as the “Maximum Sales Charge” in the Shareholder Transaction Expenses table above), if any, that a common shareholder would pay on a $1,000 investment that is held for the time periods provided in the tables. Each example assumes that all dividends and other distributions are reinvested in the Fund and that the Fund’s Annual Expenses, as provided above, remain the same. The examples also assume a 5% annual return. Actual expenses may be greater or less than those assumed. Moreover, the Fund’s actual rate of return may be greater or less than the hypothetical 5% return shown in the examples.
135
The following example assumes a transaction fee of 1.00%, as a percentage of the offering price.
| | | | | | | | |
| | | Nuveen
Preferred &
Income
Opportunities
Fund (JPC) | | | Nuveen
Preferred &
Income
Securities | |
| 1 Year | | $ | 31 | | | $ | 31 | |
| 3 Years | | $ | 74 | | | $ | 74 | |
| 5 Years | | $ | 120 | | | $ | 120 | |
| 10 Years | | $ | 247 | | | $ | 247 | |
Example # 2 (Underwriting Syndicate Transaction)
The following example assumes a transaction fee of 4.00%, as a percentage of the offering price.
| | | | | | | | |
| | | Nuveen
Preferred &
Income
Opportunities
Fund (JPC) | | | Nuveen
Preferred &
Income
Securities | |
| 1 Year | | $ | 60 | | | $ | 60 | |
| 3 Years | | $ | 102 | | | $ | 102 | |
| 5 Years | | $ | 146 | | | $ | 146 | |
| 10 Years | | $ | 269 | | | $ | 269 | |
Example # 3 (Privately Negotiated Transaction)
The following example assumes there is no transaction fee.
| | | | | | | | |
| | | Nuveen
Preferred &
Income
Opportunities
Fund (JPC) | | | Nuveen
Preferred &
Income
Securities | |
| 1 Year | | $ | 21 | | | $ | 21 | |
| 3 Years | | $ | 65 | | | $ | 65 | |
| 5 Years | | $ | 111 | | | $ | 111 | |
| 10 Years | | $ | 239 | | | $ | 239 | |
These examples should not be considered a representation of future expenses. Actual expenses may be greater or less than those shown above.
TRADING AND NET ASSET VALUE INFORMATION
The following table shows for the periods indicated: (i) the high and low market prices for the Common Shares reported as of the end of the day on the New York Stock Exchange (NYSE), (ii) the high and low net asset value (NAV) of the Common Shares, and (iii) the high and low of the premium/(discount) to NAV (expressed as a percentage) of shares of the Common Shares.
Nuveen Preferred & Income Opportunities Fund (JPC)
| | | | | | | | | | | | | | | | | | | | | | | | |
| | | | | | | | | | |
| | | | | | | | | | | | | | | | | | |
| July 2022 | | $ | 8.29 | | | $ | 7.35 | | | $ | 8.70 | | | $ | 7.99 | | | | (2.50 | )% | | | (9.25 | )% |
| April 2022 | | $ | 9.31 | | | $ | 7.99 | | | $ | 9.53 | | | $ | 8.70 | | | | (2.31 | )% | | | (8.91 | )% |
| January 2022 | | $ | 9.99 | | | $ | 8.99 | | | $ | 9.90 | | | $ | 9.48 | | | | 1.33 | % | | | (6.05 | )% |
| October 2021 | | $ | 10.06 | | | $ | 9.84 | | | $ | 9.98 | | | $ | 9.81 | | | | 1.41 | % | | | (0.50 | )% |
| July 2021 | | $ | 10.05 | | | $ | 9.51 | | | $ | 9.94 | | | $ | 9.67 | | | | 1.11 | % | | | (1.65 | )% |
| April 2021 | | $ | 9.75 | | | $ | 9.05 | | | $ | 9.82 | | | $ | 9.61 | | | | (0.51 | )% | | | (5.89 | )% |
| January 2021 | | $ | 9.50 | | | $ | 8.30 | | | $ | 9.68 | | | $ | 9.06 | | | | (1.35 | )% | | | (8.55 | )% |
| October 2020 | | $ | 8.93 | | | $ | 8.22 | | | $ | 9.16 | | | $ | 8.83 | | | | 0.34 | % | | | (8.87 | )% |
136
Nuveen Preferred & Income Securities Fund (JPS)
| | | | | | | | | | | | | | | | | | | | | | | | |
| | | | | | | | | Premium/(Discount) to NAV | |
| | | | | | | | | | | | | | | | | | |
| July 2022 | | $ | 7.81 | | | $ | 7.00 | | | $ | 8.50 | | | $ | 7.80 | | | | (5.82 | )% | | | (11.17 | )% |
| April 2022 | | $ | 9.43 | | | $ | 7.75 | | | $ | 9.44 | | | $ | 8.50 | | | | (0.11 | )% | | | (9.86 | )% |
| January 2022 | | $ | 9.94 | | | $ | 8.97 | | | $ | 9.85 | | | $ | 9.41 | | | | 1.33 | % | | | (5.37 | )% |
| October 2021 | | $ | 10.06 | | | $ | 9.78 | | | $ | 9.97 | | | $ | 9.81 | | | | 1.33 | % | | | (0.81 | )% |
| July 2021 | | $ | 10.06 | | | $ | 9.65 | | | $ | 9.93 | | | $ | 9.70 | | | | 1.31 | % | | | (0.82 | )% |
| April 2021 | | $ | 9.87 | | | $ | 9.21 | | | $ | 9.83 | | | $ | 9.63 | | | | 0.61 | % | | | (4.95 | )% |
| January 2021 | | $ | 9.73 | | | $ | 8.76 | | | $ | 9.74 | | | $ | 9.24 | | | | 0.00 | % | | | (5.88 | )% |
| October 2020 | | $ | 9.23 | | | $ | 8.64 | | | $ | 9.38 | | | $ | 9.06 | | | | 0.11 | % | | | (6.05 | )% |
The following table shows, as of July 31, 2022, each Fund’s: (i) NAV per Common Share, (ii) market price, (iii) percentage of premium/(discount) to NAV per Common Share, and (iv) net assets attributable to Common Shares.
| | | | | | | | |
| | Nuveen
Preferred &
Income
Opportunities
Fund (JPC) | | | Nuveen
Preferred &
Income
Securities | |
| NAV per Common Share | | $ | 8.41 | | | $ | 8.25 | |
| Market Price | | $ | 8.20 | | | $ | 7.77 | |
| Percentage of Premium/(Discount) to NAV per Common Share | | | (2.50 | )% | | | (5.82 | )% |
| Net Assets Attributable to Common Shares | | $ | 884,062,038 | | | $ | 1,697,696,797 | |
Shares of
closed-end
investment companies, including those of the Funds, may frequently trade at prices lower than NAV. The Funds’ Board of Trustees (Board) has currently determined that, at least annually, it will consider action that might be taken to reduce or eliminate any material discount from NAV in respect of Common Shares, which may include the repurchase of such shares in the open market or in private transactions, the making of a tender offer for such shares at NAV, or the conversion of the Fund to an
open-end
investmen
t company. The Funds cannot assure you that their Board will decide to take any of these actions, or that share repurchases or tender offers will actually reduce market discount.
The following table sets forth information regarding each Fund’s outstanding senior securities as of the end of each of the Fund’s last ten fiscal periods, as applicable. Each Fund’s senior securities during this time period are comprised of borrowings that constitute “senior securities” as defined in the Investment Company Act of 1940, as amended (1940 Act). The information in this table as of and for the fiscal years ended 2022 through 2015, have been audited by KPMG LLP, independent registered public accounting firm. The information with respect to the fiscal years ended prior to 2015 has been audited by other auditors. The Funds’ audited financial statements, including the report of KPMG LLP thereon, and accompanying notes thereto, are included in this Annual Report.
Nuveen Preferred & Income Opportunities Fund (JPC)
| | | | | | | | |
| | | Borrowings Outstanding
at the End of Period | |
| | | | | | |
| | | | | | | | |
| 2022 | | $ | 423,400 | | | $ | 3,088 | |
| 2021 | | $ | 462,700 | | | $ | 3,223 | |
| 2020 | | $ | 400,000 | | | $ | 3,280 | |
| 2019 | | $ | 455,000 | | | $ | 3,303 | |
| 2018 | | $ | 437,000 | | | $ | 3,403 | |
| 2017 | | $ | 540,000 | | �� | $ | 3,079 | |
| 2016 | | $ | 404,100 | | | $ | 3,526 | |
| 2015 | | $ | 404,100 | | | $ | 3,506 | |
| 2014 | | $ | 402,500 | | | $ | 3,572 | |
| 2013 (3) | | $ | 402,500 | | | $ | 3,473 | |
| | | | | | | | |
| 2012 | | $ | 383,750 | | | $ | 3,599 | |
| (1) | Aggregate Amount Outstanding: Aggregate amount outstanding represents the principal amount outstanding as of the end of the relevant fiscal year owed by the Fund to lenders under arrangements in place at the time. |
137
| (2) | Asset Coverage per $1,000: Asset coverage per $1,000 of debt is calculated by subtracting the Fund’s liabilities and indebtedness not represented by senior securities from the Fund’s total assets, dividing the result by the aggregate amount of the Fund’s senior securities representing indebtedness then outstanding, and multiplying the result by 1,000. |
| (3) | For the seven months ended July 31, 2013. |
Nuveen Preferred & Income Securities Fund (JPS)
| | | | | | | | | | | | | | | | |
| | | Borrowings Outstanding
at the End of Period | | | Taxable Fund Preferred (TFP) Shares
at the End of Period | |
Fiscal Year Ended July 31 | | | | | | | | Aggregate Amount
Outstanding (000) (3) | | | Asset Coverage
Per $1,000 Share (2) | |
| 2022 | | $ | 499,300 | | | $ | 4,941 | | | $ | 270,000 | | | $ | 9,137 | |
| 2021 | | $ | 873,300 | | | $ | 3,323 | | | $ | 0 | | | $ | 0 | |
| 2020 | | $ | 740,300 | | | $ | 3,495 | | | $ | 0 | | | $ | 0 | |
| 2019 | | $ | 853,300 | | | $ | 3,349 | | | $ | 0 | | | $ | 0 | |
| 2018 | | $ | 845,300 | | | $ | 3,346 | | | $ | 0 | | | $ | 0 | |
| 2017 | | $ | 845,300 | | | $ | 3,506 | | | $ | 0 | | | $ | 0 | |
| 2016 | | $ | 945,000 | | | $ | 3,086 | | | $ | 0 | | | $ | 0 | |
| 2015 | | $ | 465,800 | | | $ | 3,521 | | | $ | 0 | | | $ | 0 | |
| 2014 | | $ | 464,000 | | | $ | 3,581 | | | $ | 0 | | | $ | 0 | |
| 2013 | | $ | 464,000 | | | $ | 3,451 | | | $ | 0 | | | $ | 0 | |
| (1) | Aggregate Amount Outstanding: Aggregate amount outstanding represents the principal amount outstanding as of the end of the relevant fiscal year. |
| (2) | Asset Coverage per $1,000 Share: Asset coverage per $1,000 of share is calculated by subtracting the Fund’s liabilities and indebtedness not represented by senior securities from the Fund’s total assets, dividing the result by the aggregate amount of the Fund’s senior securities representing indebtedness then outstanding, and multiplying the result by 1,000. |
| (3) | Aggregate Amount Outstanding: Aggregate amount outstanding represents the liquidation preference as of the end of the relevant fiscal year. |
UNRESOLVED STAFF COMMENTS
Each Fund believes that there are no material unresolved written comments, received 180 days or more before July 31, 2022, from the Staff of the Securities and Exchange Commission (SEC) regarding any of its periodic or current reports under the Securities Exchange Act or 1940 Act, or its registration statement.
138
Important Tax Information
(Unaudited)
As required by the Internal Revenue Code and Treasury Regulations, certain tax information, as detailed below, must be provided to shareholders. Shareholders are advised to consult their tax advisor with respect to the tax implications of their investment. The amounts listed below may differ from the actual amounts reported on Form
1099-DIV,
which will be sent to shareholders shortly after calendar year end.
As of year end, each Fund designates the following distribution amounts, or maximum amount allowable, as being from net long-term capital gains pursuant to Section 852(b)(3) of the Internal Revenue Code:
| | | | |
| | Net Long-Term Capital Gains | |
| | $ | — | |
| | | — | |
| | | — | |
| | | — | |
| | | — | |
Dividends Received Deduction (DRD)
Each Fund listed below had the following percentage, or maximum amount allowable, of ordinary income distributions eligible for the dividends received deduction for corporate shareholders:
Qualified Dividend Income (QDI)
Each Fund listed below had the following percentage, or maximum amount allowable, of ordinary income distributions treated as qualified dividend income for individuals pursuant to Section 1(h)(11) of the Internal Revenue Code:
Qualified Interest Income (QII)
Each Fund listed below had the following percentage, or maximum amount allowable, of ordinary income distributions treated as qualified interest income and/or short-term capital gain dividends pursuant to Section 871(k) of the Internal Revenue Code:
| | | | | | | | |
| Fund | | Prior Year End to
12/31 Percentage | | | 1/1 to Current Year
End Percentage | |
| JPC | | | 20.8 | % | | | 15.6 | % |
| JPI | | | 13.5 | | | | 4.4 | |
| JPS | | | 24.7 | | | | 10.9 | |
| JPT | | | 18.3 | | | | 8.9 | |
| NPFD | | | — | | | | 1.1 | |
139
Important Tax Information
(continued)
163(j)
Each Fund listed below had the following percentage, or maximum amount allowable, of ordinary dividends treated as Section 163(j) interest dividends pursuant to Section 163(j) of the Internal Revenue Code:
| | | | |
| Fund | | Percentage | |
| JPC | | | 21.0 | % |
| JPI | | | 10.3 | |
| JPS | | | 26.1 | |
| JPT | | | 19.0 | |
| NPFD | | | — | |
140
Additional Fund Information
(Unaudited)
| | | | | | | | | | |
| Board of Trustees | | | | | | |
| Jack B. Evans | | William C. Hunter | | Amy B. R. Lancellotta | | Joanne T. Medero | | Albin F. Moschner | | John K. Nelson |
| Judith M. Stockdale | | Carole E. Stone | | Matthew Thornton III | | Terence J. Toth | | Margaret L. Wolff | | Robert L. Young |
| | | | | | | | |
| | | | | |
Investment Adviser Nuveen Fund Advisors, LLC 333 West Wacker Drive Chicago, IL 60606 | | Custodian State Street Bank
& Trust Company
One Lincoln Street Boston, MA 02111 | | Legal Counsel Chapman and Cutler LLP Chicago, IL 60603 | | Independent Registered
Public Accounting Firm KPMG LLP
200 East Randolph Street Chicago, IL 60601 | | Transfer Agent and
Shareholder Services Computershare Trust Company, N.A. 150 Royall Street Canton, MA 02021 (800) 257-8787 |
Portfolio of Investments Information
Each Fund is required to file its complete schedule of portfolio holdings with the Securities and Exchange Commission (SEC) for the first and third quarters of each fiscal year as an exhibit to its report on Form N-PORT. You may obtain this information on the SEC’s website at http://www.sec.gov.
Active Shelf Offering Statement of Additional Information (SAI) for JPC and JPS
The SAI for the active shelf offerings for each JPC and JPS contains additional information about the Fund’s Board of Trustees. You may obtain a copy of the fund’s SAI without charge, upon request, by calling Nuveen at (312) 917-7700, by writing to the Fund, or on Nuveen’s website at www.nuveen.com. You may also obtain this information on the SEC’s website at http://www.sec.gov.
Nuveen Funds’ Proxy Voting Information
You may obtain (i) information regarding how each fund voted proxies relating to portfolio securities held during the most recent twelve-month period ended June 30, without charge, upon request, by calling Nuveen toll-free at (800) 257-8787 or on Nuveen’s website at www.nuveen.com and (ii) a description of the policies and procedures that each fund used to determine how to vote proxies relating to portfolio securities without charge, upon request, by calling Nuveen toll free at (800) 257-8787. You may also obtain this information directly from the SEC. Visit the SEC on-line at http://www.sec.gov.
CEO Certification Disclosure
Each Fund’s Chief Executive Officer (CEO) has submitted to the New York Stock Exchange (NYSE) the annual CEO certification as required by Section 303A.12(a) of the NYSE Listed Company Manual. Each Fund has filed with the SEC the certification of its CEO and Chief Financial Officer required by Section 302 of the
Sarbanes-Oxley
Act.
Common Share Repurchases
Each Fund intends to repurchase, through its open market share repurchase program, shares of their own common stock at such times and in such amounts as is deemed advisable. During the period covered by this report, each Fund repurchased shares of its common stock, as shown in the accompanying table. Any future repurchases will be reported to shareholders in the next annual or semi-annual report.
| | | | | | | | | | | | | | | | |
| | | JPC | | | JPI | | | JPS | | | JPT | |
| Common shares repurchased | | | 0 | | | | 0 | | | | 0 | | | | 0 | |
FINRA BrokerCheck
The Financial Industry Regulatory Authority (FINRA) provides information regarding the disciplinary history of FINRA member firms and associated investment professionals. This information as well as an investor brochure describing FINRA BrokerCheck is available to the public by calling the FINRA BrokerCheck Hotline number at (800) 289-9999 or by visiting www.FINRA.org.
141
Glossary of Terms Used in this Report
| ∎ | | Average Annual Total Return: This is a commonly used method to express an investment’s performance over a particular, usually multi-year time period. It expresses the return that would have been necessary each year to equal the investment’s actual cumulative performance (including change in NAV or offer price and reinvested dividends and capital gains distributions, if any) over the time period being considered. |
| ∎ | | Bloomberg Capital Securities Index: An index is designed to measure the performance of USD-denominated preferred securities, including Tier 1 and Tier 2 securities. Index returns assume reinvestment of distributions, but do not reflect any applicable sales charges or management fees. |
| ∎ | | Bloomberg Capital Securities Tier-1 Index: An index designed to measure the performance of hybrid fixed-income securities, including Tier 1 securities. Index returns assume reinvestment of distributions, but do not reflect any applicable sales charges or management fees. |
| ∎ | | Contingent Capital Securities (CoCos): CoCos are debt or capital securities of primarily non-U.S. issuers with loss absorption contingency mechanisms built into the terms of the security, for example a mandatory conversion into common stock of the issuer, or a principal write-down, which if triggered would likely cause the CoCo investment to lose value. Loss absorption mechanisms would become effective upon the occurrence of a specified contingency event, or at the discretion of a regulatory body. Specified contingency events, as identified in the CoCo’s governing documents, usually reference a decline in the issuer’s capital below a specified threshold level, and/or certain regulatory events. A loss absorption contingency event for CoCos would likely be the result of, or related to, the deterioration of the issuer’s financial condition and/or its status as a going concern. In such a case, with respect to CoCos that provide for conversion into common stock upon the occurrence of the contingency event, the market price of the issuer’s common stock received by the Acquiring Fund will have likely declined, perhaps substantially, and may continue to decline after conversion. CoCos rated below investment grade should be considered high yield securities, or “junk,” but often are issued by entities whose more senior securities are rated investment grade. CoCos are a relatively new type of security; and there is a risk that CoCo security issuers may suffer the sort of future financial distress that could materially increase the likelihood (or the market’s perception of the likelihood) that an automatic write-down or conversion event on those issuers’ CoCos will occur. Additionally, the trading behavior of a given issuer’s CoCo may be strongly impacted by the trading behavior of other issuers’ CoCos, such that negative information from an unrelated CoCo security may cause a decline in value of one or more CoCos held by the Fund. Accordingly, the trading behavior of CoCos may not follow the trading behavior of other types of debt and preferred securities. Despite these concerns, the prospective reward vs. risk characteristics of at least certain CoCos may be very attractive relative to other fixed-income alternatives. |
| ∎ | | Duration: Duration is a measure of the expected period over which a bond’s principal and interest will be paid, and consequently is a measure of the sensitivity of a bond’s or bond fund’s value to changes when market interest rates change. Generally, the longer a bond’s or fund’s duration, the more the price of the bond or fund will change as interest rates change. |
| ∎ | | Effective Leverage: Effective leverage is a fund’s effective economic leverage, and includes both regulatory leverage (see below) and the leverage effects of certain derivative investments in the fund’s portfolio. |
| ∎ | | Gross Domestic Product (GDP): The total market value of all final goods and services produced in a country/region in a given year, equal to total consumer, investment and government spending, plus the value of exports, minus the value of imports. |
| ∎ | | ICE BofA Fixed Rate Preferred Securities Index: An index designed to measure the performance of investment grade fixed-rate, USD-denominated preferred securities issued in the U.S. domestic market. Index returns assume reinvestment of distributions, but do not reflect any applicable sales charges or management fees. |
| ∎ | | ICE BofA U.S. All Capital Securities Index: An index designed to measure the performance of investment grade and below investment grade fixed rate and fixed-to-floating rate, USD-denominated hybrid corporate and preferred securities publicly issued in the U.S. domestic market. Index returns assume reinvestment of distributions, but do not reflect any applicable sales charges or management fees. |
142
| ∎ | | ICE USD Contingent Capital Index (CDLR): An index designed to measure the performance of USD-denominated contingent capital debt publicly issued in the major domestic and Eurobond markets, including investment grade and below investment grade issues. Index returns assume reinvestment of distributions, but do not reflect any applicable sales charges or management fees. |
| ∎ | | ICE Variable Rate Preferred & Hybrid Securities Index: An index designed to measure the performance of floating- and variable-rate investment grade and below investment grade USD-denominated preferred stock and hybrid debt publicly issued by corporations in the U.S. domestic market. Index returns assume reinvestment of distributions, but do not reflect any applicable sales charges or management fees. |
| ∎ | | JPC Blended Benchmark (effective April 1, 2022): Consists of: 1) 60% ICE BofA U.S. All Capital Securities Index (defined herein), and 2) 40% ICE USD Contingent Capital Index (CDLR) (defined herein). Index returns assume reinvestment of distributions, but do not reflect any applicable sales charges or management fees. |
| ∎ | | JPC Blended Benchmark (from December 31, 2013 through March 31, 2022): Consists of: 1) 50% ICE BofA Fixed Rate Preferred Securities Index (defined herein), 2) 30% ICE BofA U.S. All Capital Securities Index (defined herein), and 3) 20% ICE USD Contingent Capital Index (CDLR) (defined herein). Index returns assume reinvestment of distributions, but do not reflect any applicable sales charges or management fees. |
| ∎ | | JPC Blended Benchmark (through December 30, 2013): Consists of: 1) 82.5% ICE BofA Fixed Rate Preferred Securities Index, (defined herein), and 2) 17.5% Bloomberg Capital Securities Index (defined herein). Index returns assume reinvestment of distributions, but do not reflect any applicable sales charges or management fees. |
| ∎ | | JPI Blended Benchmark (effective December 31, 2013): Consists of: 1) 60% ICE BofA U.S. All Capital Securities Index (defined herein), and 2) 40% ICE USD Contingent Capital Index (CDLR) (defined herein). Index returns assume reinvestment of distributions, but do not reflect any applicable sales charges or management fees. |
| ∎ | | JPI Blended Benchmark (through December 30, 2013): Consists of: 1) 65% ICE BofA Fixed Rate Preferred Securities Index (defined herein), and 2) 35% Bloomberg Capital Securities Index (defined herein). Index returns assume reinvestment of distributions, but do not reflect any applicable sales charges or management fees. |
| ∎ | | JPS Blended Benchmark (effective December 31, 2013): Consists of: 1) 60% ICE BofA U.S. All Capital Securities Index (defined herein), and 2) 40% ICE USD Contingent Capital Index (CDLR) (defined herein). Index returns assume reinvestment of distributions, but do not reflect any applicable sales charges or management fees. |
| ∎ | | JPS Blended Benchmark (through December 30, 2013): Consists of: 1) 55% ICE BofA Fixed Rate Preferred Securities Index (defined herein), and 2) 45% Bloomberg Capital Securities Tier-1 Index (defined herein). Index returns assume reinvestment of distributions, but do not reflect any applicable sales charges or management fees. |
| ∎ | | JPT Blended Benchmark (effective February 28, 2022): Consists of: 1) 60% ICE BofA U.S. All Capital Securities Index (defined herein), and 2) 40% ICE USD Contingent Capital Index (CDLR) (defined herein). Index returns assume reinvestment of distributions, but do not reflect any applicable sales charges or management fees. |
| ∎ | | Leverage: Leverage is created whenever a fund has investment exposure (both reward and/or risk) equivalent to more than 100% of the investment capital. |
| ∎ | | Net Asset Value (NAV) Per Share: A fund’s Net Assets is equal to its total assets (securities, cash, accrued earnings and receivables) less its total liabilities. NAV per share is equal to the fund’s Net Assets divided by its number of shares outstanding. |
| ∎ | | NPFD Blended Benchmark: Consists of: 1) 80% ICE Variable Rate Preferred & Hybrid Securities Index (defined herein), and 2) 20% ICE USD Contingent Capital Index (CDLR) (defined herein). Index returns assume reinvestment of distributions, but do not reflect any applicable sales charges or management fees. |
| ∎ | | Regulatory Leverage: Regulatory leverage consists of preferred shares issued by or borrowings of a fund. Both of these are part of a fund’s capital structure. Regulatory leverage is subject to asset coverage limits set forth in the Investment Company Act of 1940. |
143
Annual Investment Management Agreement Approval Process
NUVEEN PREFERRED & INCOME OPPORTUNITIES FUND (JPC)
NUVEEN PREFERRED AND INCOME TERM FUND (JPI)
NUVEEN PREFERRED & INCOME SECURITIES FUND (JPS)
NUVEEN PREFERRED AND INCOME FUND (JPT)
NUVEEN VARIABLE RATE PREFERRED & INCOME FUND (NPFD)
The Boards of Trustees (collectively, the “
Board
” and each Trustee, a
“Board Member”
) of Nuveen Preferred & Income Opportunities Fund (the
“Preferred
& Income Opportunities Fund”
), Nuveen Preferred and Income Term Fund (the
“Preferred and Income Term Fund”
), Nuveen Preferred & Income Securities Fund (the
“Preferred
& Income Securities Fund”
), Nuveen Preferred and Income Fund (the
“Preferred and Income Fund”
), and Nuveen Variable Rate Preferred & Income Fund (the
“Variable Rate Preferred
& Income Fund”
), which are comprised entirely of Board Members who are not “interested persons” (as defined under the Investment Company Act of 1940 (the
“1940 Act”
)) (the
“Independent Board Members”
), are responsible for determining whether to initially approve or, after an initial term, to renew, the advisory arrangements of their respective funds. A discussion of the Board’s most recent approval of the renewal of the advisory arrangements for the Preferred & Income Opportunities Fund, the Preferred and Income Term Fund, the Preferred & Income Securities Fund and the Preferred and Income Fund is set forth below. The advisory arrangements of the Variable Rate Preferred & Income Fund have not yet been up for renewal. A discussion of the Board’s initial approval of the advisory arrangements for the Variable Rate Preferred & Income Fund is set forth in its semi-annual report for the period ended January 31, 2022.
NUVEEN PREFERRED & INCOME OPPORTUNITIES FUND (JPC)
NUVEEN PREFERRED AND INCOME TERM FUND (JPI)
NUVEEN PREFERRED & INCOME SECURITIES FUND (JPS)
NUVEEN PREFERRED AND INCOME FUND (JPT)
At a meeting held on May
23-25,
2022 (the
“May Meeting”
), the Board approved for the Preferred & Income Opportunities Fund, the Preferred and Income Term Fund, the Preferred & Income Securities Fund and the Preferred and Income Fund (for purposes of this discussion, the
“Funds”
and each, a
“Fund”
), respectively, the renewal of the management agreement (each, an
“Investment Management Agreement”
) with Nuveen Fund Advisors, LLC (the
“Adviser”
), pursuant to which the Adviser serves as the investment adviser to each Fund and the
sub-advisory
agreement (each, a
) with (a) in the case of the Preferred & Income Securities Fund, Spectrum Asset Management, Inc. (
“Spectrum”
), pursuant to which Spectrum serves as the investment
sub-adviser
to such Fund; and (b) in the case of the Preferred & Income Opportunities Fund, the Preferred and Income Term Fund and the Preferred and Income Fund, Nuveen Asset Management, LLC (
“NAM,”
and Spectrum and NAM are each, a
“Sub
), pursuant to which NAM serves as the investment
sub-adviser
to each such Fund, for an additional
one-year
term. As the Board is comprised of all Independent Board Members, the references to the Board and the Independent Board Members are interchangeable.
Following up to an initial
two-year
period, the Board considers the renewal of each Investment Management Agreement and
Sub-Advisory
Agreement on behalf of the applicable Fund on an annual basis. The Investment Management Agreements and
Sub-Advisory
Agreements are collectively referred to as the
“Advisory Agreements,”
and the Adviser and the
Sub-Advisers
are collectively, the
“Fund Advisers”
and each, a
“Fund Adviser.”
The Board has established various standing committees composed of various Independent Board Members that are assigned specific responsibilities to enhance the effectiveness of the Board’s oversight and decision making. Throughout the year, the Board and its committees meet regularly and, at these meetings, receive regular and/or special reports that cover an extensive array of topics and information that are relevant to the Board’s annual consideration of the renewal of the advisory agreements for the Nuveen funds. Such information may address, among other things, fund performance and risk information; the Adviser’s strategic plans; product initiatives for various funds; the review of the funds and investment teams; compliance, regulatory and risk management matters; the trading practices of the various
sub-advisers
to the Nuveen funds; management of distributions; valuation of securities; fund expenses; securities lending;
144
liquidity management; overall market and regulatory developments; and with respect to
closed-end
funds, capital management initiatives, institutional ownership, management of leverage financing and the secondary market trading of the
closed-end
funds and any actions to address discounts. The Board also seeks to meet periodically with the Nuveen funds’
sub-advisers
and/or portfolio teams, when feasible. The Board further meets, among other things, to specifically consider the annual renewal of the advisory agreements for the Nuveen funds.
In connection with its annual consideration of the advisory agreements for the Nuveen funds, the Board, through its independent legal counsel, requested and received extensive materials and information prepared specifically for its review of such advisory agreements by the Adviser and by Broadridge Financial Solutions, Inc. (“
Broadridge
”), an independent provider of investment company data. The materials cover a wide range of topics including, but not limited to, a description of the nature, extent and quality of services provided by the Fund Advisers; a review of product actions taken during 2021 (such as mergers, liquidations, fund launches, changes to investment teams, and changes to investment policies); a review of each
sub-adviser
to the Nuveen funds and/or the applicable investment teams; an analysis of fund performance in absolute terms and as compared to the performance of certain peer funds and benchmarks with a focus on any performance outliers; an analysis of the fees and expense ratios of the Nuveen funds in absolute terms and as compared to those of certain peer funds with a focus on any expense outliers; a review of management fee schedules; a description of portfolio manager compensation; an overview of the secondary market trading of shares of the Nuveen
closed-end
funds (including, among other things, an analysis of secondary market performance and commentary regarding the leverage management, share repurchase and shelf offering programs of Nuveen
closed-end
funds); a review of the performance of various service providers; a description of various initiatives Nuveen had undertaken or continued in 2021 and 2022 for the benefit of particular fund(s) and/or the complex; a description of the profitability or financial data of Nuveen and the
sub-advisers
to the Nuveen funds; and a description of indirect benefits received by the Adviser and the
sub-advisers
as a result of their relationships with the Nuveen funds. The information prepared specifically for the annual review supplemented the information provided to the Board and its committees and the evaluations of the Nuveen funds by the Board and its committees during the year. The Board’s review of the advisory agreements for the Nuveen funds is based on all the information provided to the Board and its committees throughout the year as well as the information prepared specifically with respect to the annual review of such advisory agreements.
In continuing its practice, the Board met prior to the May Meeting to begin its considerations of the renewal of the Advisory Agreements. Accordingly, on April
13-14,
2022 (the “
April Meeting
”), the Board met to review and discuss, in part, the performance of the Nuveen funds and the Adviser’s evaluation of each
sub-adviser
to the Nuveen funds and/or its investment teams. At the April Meeting, the Board Members asked questions and requested additional information that was provided for the May Meeting.
The Independent Board Members considered the review of the advisory agreements for the Nuveen funds to be an ongoing process and employed the accumulated information, knowledge and experience the Board Members had gained during their tenure on the boards governing the Nuveen funds and working with the Adviser and
sub-advisers
in their review of the advisory agreements. The contractual arrangements are a result of multiple years of review, negotiation and information provided in connection with the boards’ annual review of the Nuveen funds’ advisory arrangements and oversight of the Nuveen funds.
The Independent Board Members were advised by independent legal counsel during the annual review process as well as throughout the year, including meeting in executive sessions with such counsel at which no representatives from the Adviser or the
Sub-Advisers
were present. In connection with their annual review, the Independent Board Members also received a memorandum from independent legal counsel outlining their fiduciary duties and legal standards in reviewing the Advisory Agreements, including guidance from court cases evaluating advisory fees.
The Board’s decision to renew the Advisory Agreements was not based on a single identified factor, but rather the decision reflected the comprehensive consideration of all the information provided to the Board and its committees throughout the year as well as the materials prepared specifically in connection with the renewal process. Each Board Member may have attributed different levels of importance to the various factors and information considered in connection with the approval process and may place different emphasis on the relevant information year to year in light of, among other things, changing market and economic
145
Annual Investment Management Agreement Approval Process
(continued)
conditions. A summary of the principal factors and information, but not all the factors, the Board considered in deciding to renew the Advisory Agreements is set forth below.
| A. | | Nature, Extent and Quality of Services |
In evaluating the renewal of the Advisory Agreements, the Independent Board Members received and considered information regarding the nature, extent and quality of the applicable Fund Adviser’s services provided to the respective Fund with particular focus on the services and enhancements to such services provided during the last year. The Independent Board Members considered the Investment Management Agreements and the
Sub-Advisory
Agreements separately in the course of their review. With this approach, they considered the respective roles of the Adviser and the
Sub-Advisers
in providing services to the applicable Fund(s).
The Board recognized that the Nuveen funds operate in a highly regulated industry and, therefore, the Adviser has provided a wide array of management, oversight and administrative services to manage and operate the funds, and the scope and complexity of these services have expanded over time as a result of, among other things, regulatory, market and other developments. The Board accordingly considered the Adviser’s dedication of extensive resources, time, people and capital employed to support and manage the Nuveen funds as well as the Adviser’s continued program of developing improvements and innovations for the benefit of the funds and shareholders and to meet the ever increasing regulatory requirements applicable to the funds. In this regard, the Board received and reviewed information regarding, among other things, the Adviser’s investment oversight responsibilities, regulatory and compliance services, administrative duties and other services. The Board considered the Adviser’s investment oversight team’s extensive services in overseeing the various
sub-advisers
to the Nuveen funds; evaluating fund performance; and preparing reports to the Board addressing, among other things, fund performance, market conditions, investment team matters, product developments and management proposals. The Board further recognized the range of services the various teams of the Adviser provided including, but not limited to, overseeing operational and risk management; managing liquidity; overseeing the daily valuation process; and managing distributions in seeking to deliver long-term fund earnings to shareholders consistent with the respective Nuveen fund’s product design and positioning. The Board also considered the structure of investment personnel compensation of each Fund Adviser and whether the structure provides appropriate incentives to attract and maintain qualified personnel and to act in the best interests of the respective Nuveen fund.
The Board further recognized that the Adviser’s compliance and regulatory functions were integral to the investment management of the Nuveen funds. The Board recognized such services included, but were not limited to, managing compliance policies; monitoring compliance with applicable policies, law and regulations; devising internal compliance programs and a framework to review and assess compliance programs; overseeing
sub-adviser
compliance testing; preparing compliance training materials; and responding to regulatory requests. The Board further considered information regarding the Adviser’s business continuity and disaster recovery plans as well as information regarding its information security program, including presentations of such program provided at a site visit in 2022, to help identify and manage information security risks.
In addition to the above functions, the Board considered that the Adviser also provides, among other things, fund administration services (such as preparing fund tax returns and other tax compliance services; preparing regulatory filings; interacting with the Nuveen funds’ independent public accountants and overseeing other service providers; and managing fund budgets and expenses); product management services (such as evaluating and enhancing products and strategies); legal services (such as helping to prepare and file registration statements and proxy statements; overseeing fund activities and providing legal interpretations regarding such activities; maintaining regulatory registrations and negotiating agreements with other fund service providers; and monitoring changes in regulatory requirements and commenting on rule proposals impacting investment companies); oversight of shareholder services and transfer agency functions (such as overseeing transfer agent service providers which include registered shareholder customer service and transaction processing; overseeing proxy solicitation and tabulation services; and overseeing the production and distribution of financial reports by service providers); and with respect to the Nuveen
closed-end
funds, managing leverage, monitoring asset coverage and seeking to promote an orderly secondary market.
146
The Board also considered the quality of support services and communications the Adviser provided the Board, including, in part, organizing and administrating Board meetings and supporting Board committees; preparing regular and ad hoc reports on fund performance, market conditions and investment team matters; providing due diligence reports addressing product development and management proposals; and coordinating site visits of the Board and presentations by investment teams and senior management.
In addition to the services provided, the Board considered the financial resources of the Adviser and its affiliates and their willingness to make investments in the technology, personnel and infrastructure to support the Nuveen funds, including maintaining a seed capital budget to support new or existing funds and/or facilitate changes for a respective fund. Further, the Board noted the benefits to shareholders of investing in a fund that is a part of a large fund complex with a variety of investment disciplines, capabilities, expertise and resources available to navigate and support the Nuveen funds including during stressed times. The Board recognized the overall reputation and capabilities of the Adviser and its affiliates, the Adviser’s continuing commitment to provide high quality services, its willingness to implement operational or organizational changes in seeking, among other things, to enhance efficiencies and services to the Nuveen funds and its responsiveness to the Board’s questions and/or concerns raised throughout the year and during the annual review of advisory agreements. The Board also considered the significant risks borne by the Adviser and its affiliates in connection with their services to the Nuveen funds, including entrepreneurial risks in sponsoring new funds and ongoing risks with managing the funds such as investment, operational, reputational, regulatory, compliance and litigation risks.
In evaluating services, the Board reviewed various highlights of the initiatives the Adviser and its affiliates have undertaken or continued in 2021 and 2022 to benefit the Nuveen complex and/or particular Nuveen funds and meet the requirements of an increasingly complex regulatory environment including, but not limited to:
| | • | | Centralization of Functions – ongoing initiatives to centralize investment leadership and create a more cohesive market approach and centralized shared support model (including through the consolidation of certain affiliated sub-advisers) in seeking to operate more effectively and enhance the research capabilities and services to the Nuveen funds; |
| | • | | Fund Improvements and Product Management Initiatives – continuing to proactively manage the Nuveen fund complex as a whole and at the individual fund level with an aim to continually improve product platforms and investment strategies to better serve shareholders through, among other things, rationalizing the product line and gaining efficiencies through mergers, repositionings and liquidations; launching new funds; reviewing and updating investment policies and benchmarks; soft closing certain funds; modifying the conversion periods on certain share classes; and evaluating and adjusting portfolio management teams as appropriate for various funds; |
| | • | | Capital Initiatives – continuing to invest capital to support new Nuveen funds with initial capital as well as to support existing funds; |
| | • | | Compliance Program Initiatives – continuing efforts to mitigate compliance risk with a focus on environmental, social and governance ( “ESG” ) controls and processes, increase operating efficiencies, implement enhancements to strengthen ongoing execution of key compliance program elements, support international business growth and facilitate integration of Nuveen’s operating model; |
| | • | | Investment Oversight – preparing reports to the Board addressing, among other things, fund performance; market conditions; investment team matters; product developments; changes to mandates, policies and benchmarks; and other management proposals as well as preparing and coordinating investment presentations to the Board; |
| | • | | Risk Management and Valuation Services – continuing to oversee and manage risk including, among other things, conducting ongoing calculations and monitoring of risk measures across the Nuveen funds, instituting investment risk controls, providing risk reporting throughout Nuveen, participating in internal oversight committees, dedicating the resources and time to develop the processes necessary to help address fund compliance with the new derivatives rule and continuing to implement an operational risk framework that seeks to provide greater transparency of operational risk matters across the complex as well as provide multiple other risk programs that seek to provide a more disciplined and consistent approach to identifying and mitigating Nuveen’s operational risks. Further, the securities valuation team |
147
Annual Investment Management Agreement Approval Process
(continued)
| | continues, among other things, to oversee the daily valuation process of the portfolio securities of the funds, maintain the valuation policies and procedures, facilitate valuation committee meetings, manage relationships with pricing vendors, prepare relevant valuation reports and design methods to simplify and enhance valuation workflow within the organization and implement processes and procedures to help address compliance with the new valuation rule applicable to the funds; |
| | • | | Regulatory Matters – continuing efforts to monitor regulatory trends and advocate on behalf of Nuveen and/or the Nuveen funds, to implement and comply with new or revised rules and mandates and to respond to regulatory inquiries and exams; |
| | • | | Government Relations – continuing efforts of various Nuveen teams and Nuveen’s affiliates to develop policy positions on a broad range of issues that may impact the Nuveen funds, advocate and communicate these positions to lawmakers and other regulatory authorities and work with trade associations to ensure these positions are represented; |
| | • | | Business Continuity, Disaster Recovery and Information Security – continuing efforts of Nuveen to periodically test and update business continuity and disaster recovery plans and, together with its affiliates, to maintain an information security program that seeks to identify and manage information security risks, and provide reports to the Board, at least annually, addressing, among other things, management’s security risk assessment, cyber risk profile, potential impact of new or revised laws and regulations, incident tracking and other relevant information technology risk-related reports; |
| | • | | Distribution Management Services – continuing to manage the distributions among the varying types of Nuveen funds within the Nuveen complex to be consistent with the respective fund’s product design and positioning in striving to deliver those earnings to shareholders in a relatively consistent manner over time as well as assisting in the development of new products or the restructuring of existing funds; and |
| | • | | with respect specifically to closed-end funds, such continuing services also included: |
| | • | | Leverage Management Services – continuing to actively manage the various forms of leverage utilized across the complex, including through committing resources and focusing on sourcing/structure development and bank provider management; |
| | • | | Capital Management, Market Intelligence and Secondary Market Services – ongoing capital management efforts which may include at times shelf offerings, tender offers, capital return programs and share repurchases as well as providing market data analysis to help understand closed-end fund ownership cycles and their impact on secondary market trading as well as to improve proxy solicitation efforts; and |
| | • | | Closed-end Fund Investor Relations Program – maintaining the closed-end fund investor relations program which, among other things, raises awareness, provides educational materials and cultivates advocacy for closed-end funds and the Nuveen closed-end fund product line. |
The Board further considered the division of responsibilities between the Adviser and the respective
Sub-Adviser
and recognized that each
Sub-Adviser
and its investment personnel generally are responsible for the management of each applicable Fund’s portfolio under the oversight of the Adviser and the Board. The Board considered an analysis of each
Sub-Adviser
provided by the Adviser which included, among other things, information regarding the assets under management of the
Sub-Adviser
or applicable investment team and changes thereto, a summary of the applicable investment team and changes thereto, the investment process and philosophy of the applicable investment team, the performance of the Nuveen funds
sub-advised
by the
Sub-Adviser
over various periods of time and a summary of any significant policy and/or other changes to the Nuveen funds
sub-advised
by the
Sub-Adviser.
The Board further considered at the May Meeting or prior meetings evaluations of each
Sub-Adviser’s
compliance programs and trade execution. The Board noted that the Adviser recommended the renewal of the
Sub-Advisory
Agreements.
Based on its review, the Board determined, in the exercise of its reasonable business judgment, that it was satisfied with the nature, extent and quality of services provided to the respective Funds under each applicable Advisory Agreement.
148
| B. | | The Investment Performance of the Funds and Fund Advisers |
In evaluating the quality of the services provided by the Fund Advisers, the Board also received and considered a variety of investment performance data of the Nuveen funds they advise. In evaluating performance, the Board recognized that performance data may differ significantly depending on the ending date selected, particularly during periods of market volatility, and therefore considered the broader perspective of performance over a variety of time periods that may include full market cycles. In this regard, the Board reviewed, among other things, Fund performance over the quarter,
one-,
three- and
five-year
periods ending December 31, 2021 and March 31, 2022 (or for shorter periods available to the extent a Fund was not in existence during such periods). The performance data prepared for the annual review of the advisory agreements for the Nuveen funds supplemented the fund performance data that the Board received throughout the year at its meetings representing differing time periods. In its review, the Board took into account the discussions with representatives of the Adviser; the Adviser’s analysis regarding fund performance that occurred at these Board meetings with particular focus on funds that were considered performance outliers (both overperformance and underperformance); the factors contributing to the performance; and any recommendations or steps taken to address performance concerns. Regardless of the time period reviewed by the Board, the Board recognized that shareholders may evaluate performance based on their own holding periods which may differ from the periods reviewed by the Board and lead to differing results.
In its review, the Board reviewed both absolute and relative fund performance during the annual review over the various time periods. With respect to the latter, the Board considered fund performance in comparison to the performance of peer funds (the
“Performance Peer Group”
) and recognized and/or customized benchmarks (
i.e.,
generally benchmarks derived from multiple recognized benchmarks). For Nuveen funds that had changes in portfolio managers or other significant changes to their investment strategies or policies since March 2019, the Board reviewed certain tracking performance data comparing the performance of such funds before and after such changes.
In considering performance data, the Board is aware of certain inherent limitations with such data, including that differences between the objective(s), strategies and other characteristics of the Nuveen funds compared to the respective Performance Peer Group and/or benchmark(s); differences in the composition of the Performance Peer Group over time; and differences in the types and/or levels of any leverage and related costs with that of the Performance Peer Group would all necessarily contribute to differences in performance results and limit the value of the comparative information. Further, the Board recognized the inherent limitations in comparing the performance of an actively managed fund to a benchmark index due to the fund’s pursuit of an investment strategy that does not directly follow the index. To assist the Board in its review of the comparability of the relative performance, the Adviser has ranked the relevancy of the peer group to the Funds as low, medium or high.
The Board also evaluated performance in light of various relevant factors which may include, among other things, general market conditions, issuer-specific information, asset class information, leverage and fund cash flows. In relation to general market conditions, the Board had recognized the recent periods in 2022 of general market volatility and underperformance. In their review from year to year, the Board Members consider and may place different emphasis on the relevant information in light of changing circumstances in market and economic conditions. Further, the Board recognized that the market and economic conditions may significantly impact a fund’s performance, particularly over shorter periods, and such performance may be more reflective of such economic or market events and not necessarily reflective of management skill. Accordingly, depending on the facts and circumstances including any differences between the respective Nuveen fund and its benchmark and/or Performance Peer Group, the Board may be satisfied with a fund’s performance notwithstanding that its performance may be below that of its benchmark or peer group for certain periods. However, with respect to any Nuveen funds for which the Board has identified performance issues, the Board monitors such funds closely until performance improves, discusses with the Adviser the reasons for such results, considers whether any steps are necessary or appropriate to address such issues, and reviews the results of any steps undertaken.
The secondary market trading of shares of the Nuveen
closed-end
funds also continues to be a priority for the Board given its importance to shareholders, and therefore the Board and/or its
Closed-end
Fund committee reviews certain performance data reflecting, among other things, the premiums and discounts at which the shares of the
closed-end
funds have traded over specified periods throughout the year. In its review, the Board considers, among other things, changes to investment
149
Annual Investment Management Agreement Approval Process
(continued)
mandates and guidelines, distribution policies, leverage levels and types; share repurchases and similar capital market actions; and effective communications programs to build greater awareness and deepen understanding of
closed-end
funds.
The Board’s determinations with respect to each Fund are summarized below.
For the Preferred & Income Opportunities Fund, the Board noted that although the Fund’s performance was below the performance of its blended benchmark for the five-year period ended December 31, 2021, the Fund outperformed its blended benchmark for the
one-
and three-year periods ended December 31, 2021. Although the Fund ranked in the fourth quartile of its Performance Peer Group for the three-year period ended December 31, 2021, the Fund ranked in the second quartile of its Performance Peer Group for the
one-year
period and third quartile for the five-year period ended December 31, 2021. Further, although the Fund’s performance was below the performance of its blended benchmark for the
five-year
period ended March 31, 2022, the Fund outperformed its blended benchmark for the
one-
and
three-year
periods ended March 31, 2022. Although the Fund ranked in the fourth quartile of its Performance Peer Group for the three- and five-year periods ended March 31, 2022, the Fund ranked in the third quartile of its Performance Peer Group for the
one-year
period ended March 31, 2022. Based on its review, the Board was generally satisfied with the Fund’s overall performance.
For the Preferred and Income Term Fund, the Board noted that the Fund outperformed its blended benchmark and ranked in the third quartile of its Performance Peer Group for the
one-,
three- and five-year periods ended December 31, 2021 and March 31, 2022. Based on its review, the Board was generally satisfied with the Fund’s overall performance.
For the Preferred & Income Securities Fund, the Board noted that although the Fund ranked in the fourth quartile of its Performance Peer Group for the
one-year
period ended December 31, 2021, the Fund ranked in the third quartile of its Performance Peer Group for the three- and five-year periods ended December 31, 2021 and outperformed its blended benchmark for the
one-,
three- and five-year periods ended December 31, 2021. In addition, although the Fund ranked in the fourth quartile of its Performance Peer Group for the
one-,
three- and five-year periods ended March 31, 2022 and the Fund’s performance was below the performance of its blended benchmark for the three-year period ended March 31, 2022, the Fund outperformed its blended benchmark for the
one-
and five-year periods ended March 31, 2022. The Board considered the factors that impacted Fund performance in recent periods. Based on its review, the Board was generally satisfied with the Fund’s overall performance.
For the Preferred and Income Fund, the Board noted that the Fund outperformed its benchmark and ranked in the third quartile of its Performance Peer Group for the
one-
and three-year periods ended December 31, 2021. Although the Fund’s performance was below the performance of its blended benchmark for the five-year period ended March 31, 2022 and the Fund ranked in the fourth quartile of its Performance Peer Group for the
one-
and five-year periods ended March 31, 2022, the Fund outperformed its blended benchmark for the
one-
and three-year periods ended March 31, 2022 and ranked in the third quartile of its Performance Peer Group for the three-year period ended March 31, 2022. In its review, the Board noted that effective in February 2022, the Fund, among other things, eliminated its term structure and removed certain investment restrictions. The Board recognized that the performance prior to such time would not reflect these changes. Based on its review, the Board was generally satisfied with the Fund’s overall performance.
| C. | | Fees, Expenses and Profitability |
As part of its annual review, the Board considered the contractual management fee and net management fee (the management fee after taking into consideration fee waivers and/or expense reimbursements, if any) paid by a Nuveen fund to the Adviser in light of the nature, extent and quality of the services provided. The Board also considered the total operating expense ratio of a fund before and after any fee waivers and/or expense reimbursements. More specifically, the Independent Board Members reviewed, among other things, each fund’s gross and net management fee rates (
i.e.,
before and after expense reimbursements and/or fee waivers, if any) and net total expense ratio in relation to those of a comparable universe of funds (the
“Peer Universe”
) established by Broadridge (subject to certain exceptions). The Independent Board Members reviewed the methodology Broadridge employed to establish its Peer Universe and recognized that differences between the applicable fund and its respective Peer Universe as well as changes to the composition of the Peer Universe from year to year
150
may limit some of the value of the comparative data. The Independent Board Members take these limitations and differences into account when reviewing comparative peer data. The Independent Board Members also considered a fund’s operating expense ratio as it more directly reflected the shareholder’s costs in investing in the respective fund.
In their review, the Independent Board Members considered, in particular, each fund with a net expense ratio (excluding investment-related costs of leverage) of six basis points or higher compared to that of its peer average (each, an
“Expense
Outlier Fund”
) and an analysis as to the factors contributing to each such fund’s higher relative net expense ratio. In addition, although the Board reviewed a fund’s total net expenses both including and excluding
investment-related
expenses (
i.e.,
leverage costs) for certain of the
closed-end
funds, the Board recognized that leverage expenses will vary across funds and in comparison to peers because of differences in the forms and terms of leverage employed by the respective fund. Accordingly, in reviewing the comparative data between a fund and its peers, the Board generally considered the fund’s net expense ratio and fees (excluding leverage costs and leveraged assets) to be higher if they were over 10 basis points higher, slightly higher if they were 6 to 10 basis points higher, in line if they were within approximately 5 basis points higher than the peer average and below if they were below the peer average of the Peer Universe. The Independent Board Members also considered, in relevant part, a fund’s net management fee and net total expense ratio in light of its performance history.
In their review of the fee arrangements for the Nuveen funds, the Independent Board Members considered the management fee schedules, including the
complex-wide
and
fund-level
breakpoint schedules, as applicable. The Board noted that across the Nuveen fund complex, the complex-wide fee breakpoints reduced fees by approximately $72.5 million and fund-level breakpoints reduced fees by approximately $89.1 million in 2021.
With respect to each
Sub-Adviser,
the Board also considered, among other things, the
sub-advisory
fee schedule paid to the
Sub-Adviser
in light of the
sub-advisory
services provided to the respective Fund and comparative data of the fees the
Sub-Adviser
charges to other clients, if any. In its review, the Board recognized that the compensation paid to each
Sub-Adviser
is the responsibility of the Adviser, not the applicable Fund(s).
The Independent Board Members noted that (a) the Preferred & Income Opportunities Fund, Preferred and Income Term Fund and Preferred & Income Securities Fund each had a net management fee that was higher than the respective peer average, but a net expense ratio that was below the respective peer average; and (b) the Preferred and Income Fund had a net management fee and a net expense ratio that were below the respective peer average.
Based on its review of the information provided, the Board determined that each Fund’s management fees (as applicable) to a Fund Adviser were reasonable in light of the nature, extent and quality of services provided to the Fund.
| | 2. | | Comparisons with the Fees of Other Clients |
In determining the appropriateness of fees, the Board also considered information regarding the fee rates the respective Fund Advisers charged to certain other types of clients and the type of services provided to these other clients. With respect to the Adviser and/or NAM, such other clients may include: retail and institutional managed accounts advised by such
Sub-Adviser;
hedge funds or other structured products managed by such
Sub-Adviser;
investment companies offered outside the Nuveen family and
sub-advised
by such
Sub-Adviser;
foreign investment companies offered by Nuveen and
sub-advised
by such
Sub-Adviser;
and collective investment trusts
sub-advised
by such
Sub-Adviser.
The Board further noted that the Adviser also advised, and NAM
sub-advised,
certain exchange-traded funds (
“ETFs”
) sponsored by Nuveen. The Board recognized that NAM was an affiliated
sub-adviser
and, with respect to affiliated
sub-advisers,
the Board reviewed, among other things, the range of fees assessed for managed accounts, hedge funds (along with their performance fee), foreign investment companies and ETFs offered by Nuveen, as applicable. The Board also reviewed the fee range and average fee rate of certain selected investment strategies offered in retail and institutional managed accounts advised by NAM, the hedge funds advised by NAM (along with their performance fee) and
non-Nuveen
investment companies
sub-advised
by certain affiliated
sub-advisers.
In considering the fee data of other clients, the Board recognized, among other things, that differences in the amount, type and level of services provided to the Nuveen funds relative to other types of clients as well as any differences in portfolio investment policies, the types of assets managed and related complexities in managing such assets, the entrepreneurial and
151
Annual Investment Management Agreement Approval Process
(continued)
other risks associated with a particular strategy, investor profiles, account sizes and regulatory requirements will contribute to the variations in the fee schedules. The Board recognized the breadth of services the Adviser had provided to the Nuveen funds compared to these other types of clients as the funds operate in a highly regulated industry with increasing regulatory requirements as well as the increased entrepreneurial, legal and regulatory risks that the Adviser incurs in sponsoring and managing the funds. Similarly, with respect to foreign funds, the Board recognized that the differences in the client base, governing bodies, distribution jurisdiction and operational complexities would also contribute to variations in management fees of the Nuveen funds compared to those of the foreign funds. Further, with respect to ETFs, the Board considered that certain Nuveen ETFs were passively managed compared to the active management of other Nuveen funds which also contributed to the differences in fee levels between such Nuveen ETFs and the actively-managed funds. In general, higher fee levels reflect higher levels of service provided by the Adviser, increased investment management complexity, greater product management requirements, and higher levels of business risk or some combination of these factors. The Board further considered that NAM’s fee is essentially for portfolio management services and therefore more comparable to the fees it receives for retail wrap accounts and other external
sub-advisory
mandates. The Board concluded the varying levels of fees were justified given, among other things, the inherent differences in the products and the level of services provided to the Nuveen funds versus other clients, the differing regulatory requirements and legal liabilities and the entrepreneurial, legal and regulatory risks incurred in sponsoring and advising a registered investment company.
The Board recognized that Spectrum was an unaffiliated
sub-adviser.
With respect to Spectrum, the Independent Board Members reviewed the pricing schedule that such
Sub-Adviser
charges for other clients. The Independent Board Members noted that the
Sub-Advisory
Agreement with Spectrum, including the fees thereunder, was the result of arm’s length negotiations and that Spectrum’s fees were reasonable in relation to the fees it assessed other clients.
| | 3. | | Profitability of Fund Advisers |
In their review, the Independent Board Members considered information regarding Nuveen’s level of profitability for its advisory services to the Nuveen funds for the calendar years 2021 and 2020. The Board reviewed, among other things, the net margins
(pre-tax)
for Nuveen Investments, Inc. (
“Nuveen Investments”
), the gross and net revenue margins
(pre-
and
post-tax
and excluding distribution) and the revenues, expenses and net income
(pre-
and
post-tax
and before distribution expenses) of Nuveen Investments from the Nuveen funds only; and comparative profitability data comparing the operating margins of Nuveen Investments compared to the adjusted operating margins of certain peers that had publicly available data and with the most comparable assets under management (based on asset size and asset composition) for each of the last two calendar years. The Board also reviewed the revenues, expenses and operating margin
(pre-
and
post-tax)
the Adviser derived from its ETF product line for the 2021 and 2020 calendar years.
In reviewing the profitability data, the Independent Board Members recognized the subjective nature of calculating profitability as the information is not audited and is dependent on cost allocation methodologies to allocate corporate-wide overhead/shared service expenses, TIAA (defined below) corporate-wide overhead expenses and partially fund related expenses to the Nuveen complex and its affiliates and to further allocate such expenses between the Nuveen fund and
non-fund
businesses. The Independent Board Members reviewed a description of the cost allocation methodologies employed to develop the financial information, a summary of the history of changes to the methodology over the years from 2010 to 2021, and the net revenue margins derived from the Nuveen funds
(pre-tax
and including and excluding distribution) and total company margins from Nuveen Investments compared to the firm-wide adjusted operating margins of the peers for each calendar year from 2012 to 2021.
The Board had also appointed four Independent Board Members to serve as the Board’s liaisons, with the assistance of independent counsel, to review the development of the profitability data and to report to the full Board. In its evaluation, the Board, however, recognized that other reasonable and valid allocation methodologies could be employed and could lead to significantly different results. The Independent Board Members also reviewed a summary of the key drivers that affected Nuveen’s revenues and expenses impacting profitability in 2021 versus 2020.
In reviewing the comparative peer data noted above, the Board considered that the operating margins of Nuveen Investments compared favorably to the peer group range of operating margins; however, the Independent Board Members
152
also recognized the limitations of the comparative data given that peer data is not generally public and the calculation of profitability is subjective and affected by numerous factors (such as types of funds a peer manages, its business mix, its cost of capital, the numerous assumptions underlying the methodology used to allocate expenses and other factors) that can have a significant impact on the results.
Aside from Nuveen’s profitability, the Board recognized that the Adviser is a subsidiary of Nuveen, LLC, the investment management arm of Teachers Insurance and Annuity Association of America (
“TIAA”
). Accordingly, the Board also reviewed a balance sheet for TIAA reflecting its assets, liabilities and capital and contingency reserves for the 2021 and 2020 calendar years to consider the financial strength of TIAA. The Board recognized the benefit of an investment adviser and its parent with significant resources, particularly during periods of market volatility. The Board also noted the reinvestments Nuveen, its parent and/or other affiliates made into its business through, among other things, the investment of seed capital in certain Nuveen funds and continued investments in enhancements to technological capabilities.
In addition to Nuveen, the Independent Board Members considered the profitability of each
Sub-Adviser
from its relationships with the Nuveen funds. In this regard, with respect to NAM, the Independent Board Members reviewed, among other things, NAM’s revenues, expenses and net revenue margins
(pre-
and
post-tax)
for its advisory activities to the respective funds for the calendar years ended December 31, 2021 and December 31, 2020. With respect to NAM, the Independent Board Members also reviewed a profitability analysis reflecting the revenues, expenses and revenue margin
(pre-
and
post-tax)
by asset type for such
Sub-Adviser
for the calendar years ending December 31, 2021 and December 31, 2020 and the
pre-
and
post-tax
revenue margins from 2021 and 2020. With respect to Spectrum, the Independent Board Members considered a profitability and margin analysis for such
Sub-Adviser,
generally including revenues, expenses and operating margins for its advisory services to the applicable Nuveen funds for the calendar years 2021 and 2020.
In evaluating the reasonableness of the compensation, the Independent Board Members also considered any other ancillary benefits derived by the respective Fund Adviser from its relationship with the Nuveen funds as discussed in further detail below.
Based on a consideration of all the information provided, the Board noted that Nuveen’s and each
Sub-Adviser’s
level of profitability was acceptable and not unreasonable in light of the services provided.
| D. | | Economies of Scale and Whether Fee Levels Reflect These Economies of Scale |
The Board considered whether there have been economies of scale with respect to the management of the Nuveen funds and whether these economies of scale have been appropriately shared with the funds. The Board recognized that although economies of scale are difficult to measure and certain expenses may not decline with a rise in assets, there are several methods to help share the benefits of economies of scale, including breakpoints in the management fee schedule, fee waivers and/or expense limitations, the pricing of Nuveen funds at scale at inception and investments in Nuveen’s business which can enhance the services provided to the funds for the fees paid. The Board noted that Nuveen generally has employed these various methods, and the Board considered the extent to which the Nuveen funds will benefit from economies of scale as their assets grow. In this regard, the Board recognized that the management fee of the Adviser is generally comprised of a fund-level component and a complex-level component each with its own breakpoint schedule, subject to certain exceptions. The Board reviewed the fund-level and complex-level fee schedules. The Board considered that the fund-level breakpoint schedules are designed to share economies of scale with shareholders if the particular fund grows, and the complex-level breakpoint schedule is designed to deliver the benefits of economies of scale to shareholders when the eligible assets in the complex pass certain thresholds even if the assets of a particular fund are unchanged or have declined. Further, with respect to the Nuveen
closed-end
funds, the Independent Board Members noted that, although such funds may from time to time make additional share offerings, the growth of their assets would occur primarily through the appreciation of such funds’ investment portfolios. As noted above, the Independent Board Members also recognized the continued reinvestment in Nuveen’s business.
Based on its review, the Board concluded that the current fee arrangements together with the reinvestment in Nuveen’s business appropriately shared any economies of scale with shareholders.
153
Annual Investment Management Agreement Approval Process
(continued)
The Independent Board Members received and considered information regarding other benefits the respective Fund Adviser or its affiliates may receive as a result of their relationship with the Nuveen funds. The Board considered the compensation that an affiliate of the Adviser received for serving as
co-manager
in the initial public offerings of new
closed-end
funds and for serving as an underwriter on shelf offerings of existing
closed-end
funds.
However, the Independent Board Members also noted that various
sub-advisers
(including NAM) may engage in soft dollar transactions pursuant to which they may receive the benefit of research products and other services provided by broker-dealers executing portfolio transactions on behalf of the applicable Nuveen funds. In addition, the Board noted that any benefits for a
sub-adviser
when transacting in fixed-income securities may be more limited as such securities generally trade on a principal basis and therefore do not generate brokerage commissions.
The Board noted that Spectrum does not participate in soft dollar arrangements with respect to Nuveen fund portfolio transactions. Although Spectrum may not engage in soft dollar transactions, the Board noted that Spectrum may still receive some indirect compensation as it utilized its own
broker-dealer.
Based on its review, the Board concluded that any indirect benefits received by a Fund Adviser as a result of its relationship with the applicable Fund(s) were reasonable and within acceptable parameters.
The Board Members did not identify any single factor discussed previously as
all-important
or controlling. The Board Members, including the Independent Board Members, concluded that the terms of each Advisory Agreement were reasonable, that the respective Fund Adviser’s fees were reasonable in light of the services provided to each Fund and that the Advisory Agreements be renewed.
154
The management of the Funds, including general supervision of the duties performed for the Funds by the Adviser, is the responsibility of the Board of Trustees of the Funds. None of the trustees who are not “interested” persons of the Funds (referred to herein as “independent board members”) has ever been a director or employee of, or consultant to, Nuveen or its affiliates. The names and business addresses of the trustees and officers of the Funds, their principal occupations and other affiliations during the past five years, the number of portfolios each Trustee oversees and other directorships they hold are set forth below.
| | | | | | | | |
| | | | |
| | | | | | | | | |
Name, Year of Birth & Address | | Position(s) Held
with the Funds | | Year First Elected or Appointed and Term (1) | | Principal Occupation(s) Including other Directorships During Past 5 Years | | Number
of Portfolios
in Fund Complex
Overseen by
Board Member |
| | | | |
| | | | | | | | | |
| | | |
Independent Board Members: | | | | | | |
| | | | |
| | | | | | Formerly, a Co-Founding Partner, Promus Capital (investment advisory firm) (2008-2017); formerly, Director, Quality Control Corporation (manufacturing) (since 2012-2021); Chair of the Board of the Kehrein Center for the Arts (philanthropy) (since 2021); member: Catalyst Schools of Chicago Board (since 2008) and Mather Foundation Board (philanthropy) (since 2012), and chair of its Investment Committee; formerly, Member, Chicago Fellowship Board (philanthropy) (2005-2016); formerly, Director, Fulcrum IT Services LLC (information technology services firm to government entities) (2010-2019); formerly, Director, LogicMark LLC (health services) (2012-2016); formerly, Director, Legal & General Investment Management America, Inc. (asset management) (2008-2013); formerly, CEO and President, Northern Trust Global Investments (financial services) (2004-2007): Executive Vice President, Quantitative Management & Securities Lending (2000-2004); prior thereto, various positions with Northern Trust Company (financial services) (since 1994); formerly, Member, Northern Trust Mutual Funds Board (2005-2007), Northern Trust Global Investments Board (2004-2007), Northern Trust Japan Board (2004-2007), Northern Trust Securities Inc. Board (2003-2007) and Northern Trust Hong Kong Board (1997-2004). | | |
1959 333 W. Wacker Drive Chicago, IL 60606 | | Chair and Board Member | | 2oo8 Class II | | 140 |
| | | | | | |
| | | | | | |
| | | | | | |
| | | | | | |
| | | | | | |
| | | | | | |
| | | | | | |
| | | | | | |
| | | | | | |
| | | | | | |
| | | | | | |
| | | | | | |
| | | | | | |
| | | | |
| | | | | | Chairman (since 2019), formerly, President (1996-2019), The Hall-Perrine Foundation, (private philanthropic corporation); Life Trustee of Coe College; formerly, Member and President Pro-Tern of the Board of Regents for the State of Iowa University System (2007- 2013); Director and Chairman (2009-2021), United Fire Group, a publicly held company; Director, Public Member, American Board of Orthopaedic Surgery (2015-2020); Director (2000-2004), Alliant Energy; Director (1996-2015), The Gazette Company (media and publishing); Director (1997- 2003), Federal Reserve Bank of Chicago; President and Chief Operating Officer (1972-1995), SCI Financial Group, Inc., (regional financial services firm). | | |
1948 333 W. Wacker Drive Chicago, IL 60606 | | Board Member | | 1999 Class Ill | | 140 |
| | | | | | |
| | | | | | |
| | | | | | |
| | | | | | |
| | | | | | |
| | | | | | |
| | | | |
| | | | | | Dean Emeritus, formerly, Dean, Tippie College of Business, University of (2006-2012); Director of Well mark, Inc. (since 2009); past Director (2005-2015), and past President (2010-2014) Beta Gamma Sigma, Inc., The International Business Honor Society; formerly, Director (2004-2018) of Xerox Corporation; formerly, Dean and Distinguished Professor of Finance, School of Business at the University of Connecticut (2003-2006); previously, Senior Vice President and Director of Research at the Federal Reserve Bank of Chicago (1995-2003); formerly, Director (1997-2007), Credit Research Center at Georgetown University. | | |
1948 333 W. Wacker Drive Chicago, IL 60606 | | Board Member | | 2003 Class I | | 140 |
| | | | | | |
155
| | | | | | | | |
| | | | |
| | | | | | | | | |
Name, Year of Birth & Address | | Position(s) Held
with the Funds | | Year First Elected or Appointed and Term (1) | | Principal Occupation(s) Including other Directorships During Past 5 Years | | Number of
Portfolios
in Fund Complex
Overseen by
Board Member |
| | | | |
| | | | | | | | | |
| |
Independent Board Members (continued) | | |
| | | | |
| | | | | | Formerly, Managing Director, Independent Directors Council (IDC) (supports the fund independent director community and is part of the Investment Company Institute (ICI), which represents regulated investment companies) (2006-2019); formerly, various positions with ICI (1989-2006); Member of the Board of Directors, Jewish Coalition Against Domestic Abuse (UCADA) (since 2020). | | |
1959 333 W. Wacker Drive Chicago, IL 60606 | | Board Member | | 2021 Class II | | 140 |
| | | | | | | |
| | | | |
| | | | | | Formerly, Managing Director, Government Relations and Public Policy (2009-2020) and Senior Advisor to the Vice Chairman (2018-2020). BlackRock, Inc. (global investment management firm); formerly, Managing (Director, Global Head of Government Relations and Public Policy, Barclays Group (IBIM) (investment banking, investment management and wealth management businesses) (2006-2009); formerly, Managing Director, Global General Counsel and Corporate Secretary, Barclays Global Investors (global investment management firm) (1996-2006); formerly, Partner, Orrick, Herrington & Sutcliffe LLP (law firm) (1993-1995); formerly, General Counsel, Commodity Futures Trading Commission (government agency overseeing U.S. derivatives markets) (1989-1993); formerly, Deputy Associate Director/ Associate Director for Legal and Financial Affairs, Office of Presidential Personnel, The White House (1986-1989); Member of the Board of Directors, Baltic-American Freedom Foundation (seeks to provide opportunities for citizens of the Baltic states to gain education and professional development through exchanges in the U.S.) (since 2019). | | |
1954 333 W. Wacker Drive Chicago, IL 60606 | | Board Member | | 2021 Class III | | 140 |
| | | | | | |
| | | | | | |
| | | | | | |
| | | | | | |
| | | | | | |
| | | | | | |
| | | | | | |
| | | | | | |
| | | | | | |
| | | | |
| | | | | | Founder and Chief Executive Officer, Northcroft Partners, LLC, (management consulting) (since 2012); formerly, Chairman (2019), and Director (2012-2019), USA Technologies, Inc., (provider of solutions and services to facilitate electronic payment transactions); formerly, Director, Wintrust Financial Corporation (1996-2016); previously, held positions at Leap Wireless International, Inc., (consumer wireless services) including Consultant (2011- 2012), Chief Operating Officer (2008-2011), and Chief Marketing Officer (2004- 2008); formerly, President, Verizon Card Services division of Verizon Communications, Inc. (2000-2003); formerly, President, One Point Services at One Point Communications (telecommunication services) (1999-2000); formerly, Vice Chairman of the Board, Diba, Incorporated (internet technology provider) (1996-1997); formerly, various executive positions (1991-1996) including Chief Executive Officer (1995-1996) of Zenith Electronics Corporation (consumer electronics). | | |
1952 333 W. Wacker Drive Chicago, IL 60606 | | Board Member | | 2016 Class Ill | | 140 |
| | | | | | |
| | | | | | |
| | | | | | |
| | | | | | |
| | | | | | |
| | | | | | |
| | | | | | |
| | | | | | |
| | | | |
| | | | | | Member of Board of Directors of Corel 2 LLC. (private firm which develops branding, marketing and communications strategies for clients) (since 2008); served on The President’s Council of Fordham University (2010-2019) and previously a Director of the Curran Center for Catholic American Studies (2009- 2018); formerly, senior external advisor to the Financial Services practice of Deloitte Consulting LLP. (2012-2014); former Chair of the Board of Trustees of Marian University (2010-2014 as trustee, 2011-2014 as Chair); formerly Chief Executive Officer of ABN AMRO Bank N.V., North America, and Global Head of the Financial Markets Division (2007-2008), with various executive leadership roles in ABN AMRO Bank N.V. between 1996 and 2007. | | |
1962 333 W. Wacker Drive Chicago, IL 60606 | | Board Member | | 2013 Class II | | 140 |
| | | | | | |
156
| | | | | | | | |
| | | | |
| | | | | | | | | |
Name, Year of Birth & Address | | Position(s) Held
with the Funds | | Year First Elected or Appointed and Term (1) | | Principal Occupation(s) Including other Directorships During Past 5 Years | | Number of
Portfolios
in Fund Complex
Overseen by
Board Member |
| | | | |
| | | | | | | | | |
| |
Independent Board Members (continued) | | |
| | | | |
| | | | | | Board Member, Land Trust Alliance (national public charity addressing natural land and water conservation in the U.S.) (since 2013); formerly, Board Member, U.S. Endowment for Forestry and Communities (national endowment addressing forest health, sustainable forest production and markets, and economic health of forest-reliant communities in the U.S.) (2013-2019); formerly, Executive Director (1994-2012), Gaylord and Dorothy Donnelley Foundation (private foundation endowed to support both natural land conservation and artistic vitality); prior thereto, Executive Director, Great Lakes Protection Fund (endowment created jointly by seven of the eight Great Lake states’ Governors to take a regional approach to improving the health of the Great Lakes) (1990-1994). | | |
1947 333 W. Wacker Drive Chicago, IL 60606 | | Board Member | | 1997 Class I | | 140 |
| | | | | | |
| | | | |
| | | | | | Former Director, Chicago Board Options Exchange, Inc. (2006-2017); and C2 Options Exchange, Incorporated (2009-2017); formerly Director, Cboe, Global Markets, Inc., (2010-2020) formerly named CBOE Holdings, Inc.; formerly, Commissioner, New York State Commission on Public Authority Reform (2005-2010). | | |
1947 333 W. Wacker Drive Chicago, IL 60606 | | Board Member | | 2007 Class I | | 140 |
| | | | | | | |
| | | | |
| | | | | | Formerly, Executive Vice President and Chief Operating Officer (2018-2019), Fed Ex Freight Corporation, a subsidiary of FedEx Corporation (“FedEx”) (provider of transportation, e-commerce and business services through its portfolio of companies); formerly, Senior Vice President, U.S. Operations (2006-2018), Federal Express Corporation, a subsidiary of FedEx;formerly, Member of the Board of Directors (2012-2018), Safe Kids Worldwide® (anon-profit organization dedicated to preventing childhood injuries). Member of the Board of Directors (since 2014), The Sherwin-Williams Company (develops, manufactures, distributes and sells paints, coatings and related products); Director (since 2020), Crown Castle International (provider of communications infrastructure). | | |
1958 333 W. Wacker Drive Chicago, IL 60606 | | Board Member | | 2020 Class Ill | | 140 |
| | | | | | |
| | | | |
| | | | | | Formerly, member of the Board of Directors (2013-2017) of Travelers Insurance Company of Canada and The Dominion of Canada General Insurance Company (each, a part of Travelers Canada, the Canadian operation of The Travelers Companies, Inc.); formerly, Of Counsel, Skadden, Arps, Slate, Meagher & Flom LLP (Mergers & Acquisitions Group) (legal services) (2005-2014); Member of the Board of Trustees of New York-Presbyterian Hospital (since 2005); Member (since 2004), formerly, Chair (2015-2022) of the Board of Trustees of The John A. Hartford Foundation (philanthropy dedicated to improving the care of older adults); formerly, Member (2005-2015) and Vice Chair (2011-2015) of the Board of Trustees of Mt. Holyoke College. | | |
1955 333 W. Wacker Drive Chicago, IL 60606 | | Board Member | | 2016 Class I | | 140 |
| | | | | | |
| | | | |
| | | | | | Formerly, Chief Operating Officer and Director, J.P.Morgan Investment Management Inc. (financial services) (2010-2016); formerly, President and Principal Executive Officer (2013-2016), and Senior Vice President and Chief Operating Officer (2005-2010), of J.P.Morgan Funds; formerly, Director and various officer positions for J.P.Morgan Investment Management Inc. (formerly, JPMorgan Funds Management, Inc. and formerly, One Group Administrative Services) and JPMorgan Distribution Services, Inc. (financial services) (formerly, One Group Dealer Services, Inc.) (1999-2017). | | |
1963 333 W. Wacker Drive Chicago, IL 60606 | | Board Member | | 2017 Class II | | 140 |
| | | | | | |
157
| | | | | | |
| | | |
| | | | | | | |
Name, Year of Birth & Address | | Position(s) Held
with the Funds | | Year First Elected or Appointed (2) | | Principal Occupation(s) During Past 5 Years |
| | | |
| | | | | | | |
| | | |
| | | | | | |
| | | |
| | | | | | Managing Director of Nuveen Fund Advisors, LLC (since 2019) Senior Managing Director (since 2021), formerly, Managing Director (2020-2021) of Nuveen Securities, LLC; Senior Managing Director (since 2021), formerly, Managing Director (2017-2021), Senior Vice President of Nuveen (2006-2017), Vice President prior to 2006. |
1963 333 W. Wacker Drive Chicago, IL 60606 | | Chief Administrative Officer | | 2015 |
| | | |
| | | | | | Enterprise Senior Compliance Officer of Nuveen (since 2022); formerly, Vice President (2014-2022), Chief Compliance Officer (2017-2022), Deputy Chief Compliance Officer (2014-2017) and Senior Compliance Officer (2012-2014) of BMO Funds, Inc.; formerly Senior Compliance Officer of BMO Asset Management Corp. (2012-2014). |
1972 333 W. Wacker Drive Chicago, IL 60606 | | Vice President and Chief Compliance Officer | | 2022 |
| | | |
| | | | | | Vice President and Assistant Secretary of Nuveen Securities, LLC (since 2016); Managing Director (since 2022), formerly, Vice President (2017-2022) and Assistant Secretary (since 2017) of Nuveen Fund Advisors, LLC; Managing Director and Associate General Counsel (since January 2022), formerly, Vice President and Associate General Counsel of Nuveen (2013-2021); Managing Director (since 2022), formerly, Vice President (2018-2022), Assistant Secretary and Associate General Counsel (since 2018) of Nuveen Asset Management LLC. |
1979 901 Marquette Avenue Minneapolis, MN 55402 | | Vice President and Assistant Secretary | | 2013 |
| | | | |
| | | | |
| | | |
| | | | | | Vice President and Assistant Secretary of Nuveen Fund Advisors, LLC (since 2017); Vice President, Associate General Counsel and Assistant Secretary of Nuveen Asset Management, LLC (since 2022); Vice President and Associate General Counsel of Nuveen (since 2017); formerly, Associate General Counsel of Jackson National Asset Management (2012-2017). |
1978 8500 Andrew Carnegie Blvd. Charlotte, NC 28262 | | Vice President and Assistant Secretary | | 2017 |
| | | |
| | | | | | Senior Managing Director (since 2021), formerly, Managing Director (2017-2021), Senior Vice President (2016-2017), Vice President (2077-2016) of Nuveen; Managing Director (since 2015) of Nuveen Fund Advisors, LLC; Chartered Financial Analyst. |
1979 333 W. Wacker Drive Chicago, IL 60606 | | Vice President and Treasurer | | 2016 |
| | | |
| | | | | | Managing Director (since 2017), formerly, Senior Vice President (2014-2017) of Nuveen Securities, LLC. |
1961 333 W. Wacker Drive Chicago, IL 60606 | | Vice President | | |
| | | |
| | | | | | Managing Director (since 2019) of Nuveen Fund Advisors, LLC; Senior Managing Director (since 2021), formerly, Managing Director (2017-2021), Vice President (2010-2017) of Nuveen; Head of Investment Oversight (since 2017), formerly, Team Leader of Manager Oversight (2015-2017); Chartered Financial Analyst and Certified Financial Risk Manager. |
1974 333 W. Wacker Drive Chicago, IL 60606 | | Vice President | | |
| | | |
| | | | | | Managing Director and Assistant Secretary of Nuveen Fund Advisors, LLC (since 2021); Managing Director, Associate General Counsel and Assistant Secretary of Nuveen Asset Management, LLC (since 2021); Managing Director of TIAA SMA Strategies LLC (since 2021); Managing Director (since 2019, formerly, Vice President and Director), Associate General Counsel and Assistant Secretary of College Retirement Equities Fund, TIAA Separate Account VA-1, TIAA-CREF Funds and TIAA-CREF Life Funds; Managing Director (since 2018), formerly, Vice President and Director, Associate General Counsel and Assistant Secretary of Teachers Insurance and Annuity Association of America, Teacher Advisors LLC and TIAA-CREF Investment Management, LLC; Vice President (since 2017), Associate General Counsel and Assistant Secretary (since 2077) of Nuveen Alternative Advisors LLC; General Counsel and Assistant Secretary of Covariance Capital Management, Inc. (2014-2017). |
1975 8500 Andrew Carnegie Blvd. Charlotte, NC 28262 | | Vice President and Assistant Secretary | | 2022 |
| | | | |
| | | | |
| | | | |
| | | | |
| | | | |
158
| | | | | | | |
| | | | |
| | | | | | | |
| | Position(s) Held
with the Funds | | Year First Elected or Appointed (2) | | |
| | | | |
| | | | | | | |
| | |
Officers of the Funds (continued): | | |
| | | | |
| | | | | | Senior Managing Director (since 2017) and Secretary and General Counsel (since 2016) of Nuveen Investments, Inc., formerly, Executive Vice President (2016-2017) and Managing Director and Assistant Secretary (2008-2016); Senior Managing Director (since 2017) and Assistant Secretary (since 2008) of Nuveen Securities, LLC, formerly Executive Vice President (2016-2017) and Managing Director (2008- 2016); Senior Managing Director (since 2017), and Secretary (since 2016) of Nuveen Fund Advisors, LLC, formerly, Co-General Counsel (2011-2020), Executive Vice President (2016-2017), Managing Director (2008-2016) and Assistant Secretary (2007-2016); Senior Managing Director (since 2017), Secretary (since 2016) of Nuveen Asset Management, LLC, formerly, Associate General Counsel (2011-2020), Executive Vice President (2016-2017) and Managing Director and Assistant Secretary (2011- 2016); formerly, Vice President (2007-2021) and Secretary (2016-2021), of NWQ Investment Management Company, LLC, and Santa Barbara Asset Management, LLC; Vice President and Secretary of Winslow Capital Management, LLC (since 2010). Senior Managing Director (since 2017) and Secretary (since 2016) of Nuveen Alternative Investments, LLC. |
1966 333 W. Wacker Drive Chicago, IL 60606 | | Vice President and Assistant Secretary | | |
| | | | | |
| | | | | |
| | | | | |
| | | | | |
| | | | | |
| | | | | |
| | | | | |
| | | | | |
| | | | | |
| | | | |
| | | | | | Managing Director of Mutual Fund Tax and Financial Reporting groups at Nuveen (since 2017); Managing Director of Nuveen Fund Advisors, LLC (since 2019); Senior Director of Teachers Advisors, LLC and TIAA-CREF Investment Management, LLC (since 2016); Senior Director (since 2015) Mutual Fund Taxation to the TIAA-CREF Funds, the TIAA-CREF Life Funds, the TIAA Separate Account VA-1 and the CREF Accounts; has held various positions with TIAA since 2004. |
1973 8500 Andrew Carnegie Blvd. Charlotte, NC 28262 | | Vice President and Assistant Secretary | | |
| | | | | |
| | | | |
| | | | | | President, Nuveen Fund Advisors, LLC (since 2020); Executive Vice President, Global Head of Product at Nuveen (since 2019); Co-Chief Executive Officer of Nuveen Securities, LLC since 2020); Managing Member of MDR Collaboratory LLC (since 2018); formerly, Managing Director, (Head of Wealth Management Product Structuring & COO Multi Asset Investing. The Blackstone Group (2013-2017). |
1969 730 Third Avenue New York, NY 10017 | | Vice President | | |
| | | | |
| | | | | | Managing Director (since 2017), formerly Senior Vice President (2016-2017) and Vice President (2011-2016) of Nuveen. |
1975 333 W. Wacker Drive Chicago, IL 60606 | | Vice President | | |
| | | | |
| | | | | | Senior Managing Director of Teacher Advisors LLC and TIAACREF Investment Management, LLC (since 2018); Senior Managing Director (since 2019) and Chief Risk Officer (since 2022), formerly Head of Investment Risk Management (2017-2022) of Nuveen; Senior Managing Director (since 2018) of Nuveen Alternative Advisors LLC. |
1965 8500 Andrew Carnegie Blvd. Charlotte, NC 28262 | | Vice President | | |
| | | | |
| | | | | | Senior Managing Director, Head of Public Investment Finance at Nuveen (since 2019), formerly, Managing Director; Senior Managing Director (since 2019) of Nuveen Fund Advisers, (LLC; Principal Financial Officer, Principal Accounting Officer and Treasurer (since 2017) of the TIAA CREF Funds, the TIAA-CREF Life Funds, the TIAA Separate Account VA-1 and Principal Financial Financial Officer, Principal Accounting Officer (since 2020) and Treasurer (since 2017) to the CREF Accounts; formerly, Senior Director, TIAA-CREF Fund Administration (2014-2015); has held various positions with TIAA since 2006. |
1973 8500 Andrew Carnegie Blvd. Charlotte, NC 28262 | | Vice President and Controller | | |
| | | | | |
| | | | | |
| | | | |
| | | | | | Vice President and Assistant Secretary of Nuveen Securities, LLC (since 2008), and Nuveen Fund Advisors, LLC (since 2019); Vice President, Associate General Counsel and Assistant Secretary of Nuveen Asset Management, LLC (since 2020); Vice President (since 2010) and Associate General Counsel (since 2019), formerly, Assistant General Counsel (2008-2016) of Nuveen. |
1968 333 W. Wacker Drive Chicago, IL 60606 | | Vice President and Secretary | | |
| | | | |
| | | | | | Managing Director and Assistant Secretary of Nuveen Securities, LLC (since 2022); Managing Director, Assistant Secretary and General Counsel (since 2022), formerly, Co-General Counsel (2011- 2020) of Nuveen Fund Advisors, LLC; formerly, Managing Director (2004-2020) and Assistant Secretary (1994-2020) of Nuveen Investments, Inc.; Managing Director, Assistant Secretary and Associate General Counsel (since 2022) of Nuveen Asset Management, LLC; formerly, Vice President and Assistant Secretary of NWQ Investment Management Company, LLC (2002-2020), Santa Barbara Asset Management, LLC(2006-2020) and Winslow Capital Management, LLC (2010-2020); Chartered Financial Analyst. |
1956 333 W. Wacker Drive Chicago, IL 60606 | | Vice President and Assistant Secretary | | |
| | | | | |
| | | | | |
| | | | | |
159
| | | | | | | |
| | | | |
| | | | | | | |
| | Position(s) Held
with the Funds | | Year First Elected or Appointed (2) | | |
| | | | |
| | | | | | | |
| | |
Officers of the Funds (continued): | | |
| | | | |
| | | | | | Managing Director (since 2017), Associate General Counsel and Assistant Secretary (since 2014) of the CREF Accounts, TIAA Separate Account VA-1, TIAA-CREF Funds and TIAA-CREF Life Funds; Managing Director (since 2017), Associate General Counsel and Assistant Secretary (since 2011) of Teacher Advisors, LLC and TIAA-CREF Investment Management, LLC; Managing Director of Nuveen, LLC and of TIAA (since 2017). |
1973 8500 Andrew Carnegie Blvd. Charlotte, NC 28262 | | Vice President and Assistant Secretary | | |
| (1) | The Board of Trustees is divided into three classes, Class I, Class 11, and Class 111, with each being elected to serve until the third succeeding annual shareholders’ meeting subsequent to its election or thereafter in each case when its respective successors are duly elected or appointed, except two board members are elected by the holders of Preferred Shares, when applicable, to serve until the next annual shareholders’ meeting subsequent to its election or thereafter in each case when its respective successors are duly elected or appointed. The year first elected or appointed represents the year in which the board member was first elected or appointed to any fund in the Nuveen complex. |
| (2) | Officers serve indefinite terms until their successor has been duly elected and qualified, their death or their resignation or removal. The year first elected or appointed represents the year in which the Officer was first elected or appointed to any fund in the Nuveen complex. |
160
161
162
163
Serving Investors for Generations
Since 1898, financial professionals and their clients have relied on Nuveen to provide dependable investment solutions through continued adherence to proven, long-term investing principles. Today, we offer a range of high quality solutions designed to be integral components of a well-diversified core portfolio.
Focused on meeting investor needs.
Nuveen is the investment manager of TIAA. We have grown into one of the world’s premier global asset managers, with specialist knowledge across all major asset classes and particular strength in solutions that provide income for investors and that draw on our expertise in alternatives and responsible investing. Nuveen is driven not only by the independent investment processes across the firm, but also the insights, risk management, analytics and other tools and resources that a truly world-class platform provides. As a global asset manager, our mission is to work in partnership with our clients to create solutions which help them secure their financial future.
Find out how we can help you.
To learn more about how the products and services of Nuveen may be able to help you meet your financial goals, talk to your financial professional, or call us at
(800) 257-8787.
Please read the information provided carefully before you invest. Investors should consider the investment objective and policies, risk considerations, charges and expenses of any investment carefully. Where applicable, be sure to obtain a prospectus, which contains this and other relevant information. To obtain a prospectus, please contact your securities representative or Nuveen, 333 W. Wacker Dr., Chicago, IL 60606. Please read the prospectus carefully before you invest or send money.
Learn more about Nuveen Funds at:
www.nuveen.com/closed-end-funds
| | | | | |
| Nuveen Securities, LLC, member FINRA and SIPC | 333 West Wacker Drive Chicago, IL 60606 | www.nuveen.com | | | | EAN-B-0722D
2399428-INV-Y-09/23 |
ITEM 2. CODE OF ETHICS.
As of the end of the period covered by this report, the registrant has adopted a code of ethics that applies to the registrant’s principal executive officer, principal financial officer, principal accounting officer or controller, or persons performing similar functions. There were no amendments to or waivers from the Code during the period covered by this report. The registrant has posted the code of ethics on its website at www.nuveen.com/fund-governance. (To view the code, click on Code of Conduct.)
ITEM 3. AUDIT COMMITTEE FINANCIAL EXPERT.
As of the end of the period covered by this report, the registrant’s Board of Directors or Trustees (“Board”) determined that the registrant has at least one “audit committee financial expert” (as defined in Item 3 of Form N-CSR) serving on its Audit Committee. The registrant’s audit committee financial experts are Carole E. Stone, Jack B. Evans, Albin F. Moschner, John K. Nelson and Robert L. Young, who are “independent” for purposes of Item 3 of Form N-CSR.
Ms. Stone served for five years as Director of the New York State Division of the Budget. As part of her role as Director, Ms. Stone was actively involved in overseeing the development of the State’s operating, local assistance and capital budgets, its financial plan and related documents; overseeing the development of the State’s bond-related disclosure documents and certifying that they fairly presented the State’s financial position; reviewing audits of various State and local agencies and programs; and coordinating the State’s system of internal audit and control. Prior to serving as Director, Ms. Stone worked as a budget analyst/examiner with increasing levels of responsibility over a 30 year period, including approximately five years as Deputy Budget Director. Ms. Stone has also served as Chair of the New York State Racing Association Oversight Board, as Chair of the Public Authorities Control Board, as a Commissioner on the New York State Commission on Public Authority Reform and as a member of the Boards of Directors of several New York State public authorities. These positions have involved overseeing operations and finances of certain entities and assessing the adequacy of project/entity financing and financial reporting. Ms. Stone formerly served on the Board of Directors of CBOE Global Markets, Inc. (formerly, CBOE Holdings, Inc.), the Chicago Board Options Exchange, and the C2 Options Exchange. Ms. Stone’s position on the boards of these entities and as a member of both CBOE Holdings’ Audit Committee and its Finance Committee involved, among other things, the oversight of audits, audit plans and preparation of financial statements.
Mr. Evans was formerly President and Chief Operating Officer of SCI Financial Group, Inc., a full service registered broker-dealer and registered investment adviser (“SCI”). As part of his role as President and Chief Operating Officer, Mr. Evans actively supervised the Chief Financial Officer (the “CFO”) and actively supervised the CFO’s preparation of financial statements and other filings with various regulatory authorities. In such capacity, Mr. Evans was actively involved in the preparation of SCI’s financial statements and the resolution of issues raised in connection therewith. Mr. Evans has also served on the audit committee of various reporting companies. At such companies, Mr. Evans was involved in the oversight of audits, audit plans, and the preparation of financial statements. Mr. Evans also formerly chaired the audit committee of the Federal Reserve Bank of Chicago.
Mr. Moschner is a consultant in the wireless industry and, in July 2012, founded Northcroft Partners, LLC, a management consulting firm that provides operational, management and governance solutions. Prior to founding Northcroft Partners, LLC, Mr. Moschner held various positions at Leap Wireless International, Inc., a provider of wireless services, where he was as a consultant from February 2011 to July 2012, Chief Operating Officer from July 2008 to February 2011, and Chief Marketing Officer from August 2004 to June 2008. Before he joined Leap Wireless International, Inc., Mr. Moschner was President of the Verizon Card Services division of Verizon Communications, Inc. from 2000 to 2003, and President of One Point Services at One Point Communications from 1999 to 2000. Mr. Moschner also served at Zenith Electronics Corporation as Director, President and Chief Executive Officer from 1995 to 1996, and as Director, President and Chief Operating Officer from 1994 to 1995.
Mr. Nelson is on the Board of Directors of Core12, LLC. (since 2008), a private firm which develops branding, marketing, and communications strategies for clients. Mr. Nelson has extensive experience in global banking and markets, having served in several senior executive positions with ABN AMRO Holdings N.V. and its affiliated entities and predecessors, including LaSalle Bank Corporation from 1996 to 2008, ultimately serving as Chief Executive Officer of ABN AMRO N.V. North America. During his tenure at the bank, he also served as Global Head of its Financial Markets Division, which encompassed the bank’s Currency, Commodity, Fixed Income, Emerging Markets, and Derivatives businesses. He was a member of the Foreign Exchange Committee of the Federal Reserve Bank of the United States and during his tenure with ABN AMRO served as the bank’s representative on various committees of The Bank of Canada, European Central Bank, and The Bank of England. Mr. Nelson previously served as a senior, external advisor to the financial services practice of Deloitte Consulting LLP. (2012-2014).
Mr. Young has more than 30 years of experience in the investment management industry. From 1997 to 2017, he held various positions with J.P. Morgan Investment Management Inc. (“J.P. Morgan Investment”) and its affiliates (collectively, “J.P. Morgan”). Most recently, he served as Chief Operating Officer and Director of J.P. Morgan Investment (from 2010 to 2016) and as President and Principal Executive Officer of the J.P. Morgan Funds (from 2013 to 2016). As Chief Operating Officer of J.P. Morgan Investment, Mr. Young led service, administration and business platform support activities for J.P. Morgan’s domestic retail mutual fund and institutional commingled and separate account businesses, and co-led these activities for J.P. Morgan’s global retail and institutional investment management businesses. As President of the J.P. Morgan Funds, Mr. Young interacted with various service providers to these funds, facilitated the relationship between such funds and their boards, and was directly involved in establishing board agendas, addressing regulatory matters, and establishing policies and procedures. Before joining J.P. Morgan, Mr. Young, a former Certified Public Accountant (CPA), was a Senior Manager (Audit) with Deloitte & Touche LLP (formerly, Touche Ross LLP), where he was employed from 1985 to 1996. During his tenure there, he actively participated in creating, and ultimately led, the firm’s midwestern mutual fund practice.
ITEM 4. PRINCIPAL ACCOUNTANT FEES AND SERVICES.
Nuveen Preferred & Income Securities Fund
The following tables show the amount of fees that KPMG LLP, the Fund’s auditor, billed to the Fund during the Fund’s last two full fiscal years. For engagements with KPMG LLP the Audit Committee approved in advance all audit services and non-audit services that KPMG LLP provided to the Fund, except for those non-audit services that were subject to the pre-approval exception under Rule 2-01 of Regulation S-X (the “pre-approval exception”). The pre-approval exception for services provided directly to the Fund waives the pre-approval requirement for services other than audit, review or attest services if: (A) the aggregate amount of all such services provided constitutes no more than 5% of the total amount of revenues paid by the Fund to its accountant during the fiscal year in which the services are provided; (B) the Fund did not recognize the services as non-audit services at the time of the engagement; and (C) the services are promptly brought to the Audit Committee’s attention, and the Committee (or its delegate) approves the services before the audit is completed.
The Audit Committee has delegated certain pre-approval responsibilities to its Chair (or, in her absence, any other member of the Audit Committee).
SERVICES THAT THE FUND’S AUDITOR BILLED TO THE FUND
| | | | | | | | | | | | | | | | |
Fiscal Year Ended | | Audit Fees Billed
to Fund 1 | | | Audit-Related Fees
Billed to Fund 2 | | | Tax Fees Billed
to Fund 3 | | | All Other Fees Billed
to Fund 4 | |
July 31, 2022 | | $ | 30,150 | | | $ | 2,500 | | | $ | 0 | | | $ | 0 | |
| | | | | | | | | | | | | | | | |
| | | | | | | | | | | | | | | | |
Percentage approved pursuant to pre-approval exception | | | 0 | % | | | 0 | % | | | 0 | % | | | 0 | % |
| | | | | | | | | | | | | | | | |
| | | | | | | | | | | | | | | | |
July 31, 2021 | | $ | 29,010 | | | $ | 5,500 | | | $ | 0 | | | $ | 0 | |
| | | | | | | | | | | | | | | | |
| | | | | | | | | | | | | | | | |
Percentage approved pursuant to pre-approval exception | | | 0 | % | | | 0 | % | | | 0 | % | | | 0 | % |
| | | | | | | | | | | | | | | | |
1 “Audit Fees” are the aggregate fees billed for professional services for the audit of the Fund’s annual financial statements and services provided in connection with statutory and regulatory filings or engagements.
2 “Audit Related Fees” are the aggregate fees billed for assurance and related services reasonably related to the performance of the audit or review of financial statements that are not reported under “Audit Fees”. These fees include offerings related to the Fund’s common shares and leverage.
3 “Tax Fees” are the aggregate fees billed for professional services for tax advice, tax compliance, and tax planning. These fees include: all global withholding tax services; excise and state tax reviews; capital gain, tax equalization and taxable basis calculation performed by the principal accountant.
4 “All Other Fees” are the aggregate fees billed for products and services other than “Audit Fees”, “Audit-Related Fees” and “Tax Fees”. These fees represent all “Agreed-Upon Procedures” engagements pertaining to the Fund’s use of leverage.
SERVICES THAT THE FUND’S AUDITOR BILLED TO THE
ADVISER AND AFFILIATED FUND SERVICE PROVIDERS
The following tables show the amount of fees billed by KPMG LLP to Nuveen Fund Advisors, LLC (formerly Nuveen Fund Advisors, Inc.) (the “Adviser”), and any entity controlling, controlled by or under common control with the Adviser that provides ongoing services to the Fund (“Affiliated Fund Service Provider”), for engagements directly related to the Fund’s operations and financial reporting, during the Fund’s last two full fiscal years.
The tables also show the percentage of fees subject to the pre-approval exception. The pre-approval exception for services provided to the Adviser and any Affiliated Fund Service Provider (other than audit, review or attest services) waives the pre-approval requirement if: (A) the aggregate amount of all such services provided constitutes no more than 5% of the total amount of revenues paid to KPMG LLP by the Fund, the Adviser and Affiliated Fund Service Providers during the fiscal year in which the services are provided that would have to be pre-approved by the Audit Committee; (B) the Fund did not recognize the services as non-audit services at the time of the engagement; and (C) the services are promptly brought to the Audit Committee’s attention, and the Committee (or its delegate) approves the services before the Fund’s audit is completed.
| | | | | | | | | | | | |
Fiscal Year Ended | | Audit-Related Fees
Billed to Adviser and
Affiliated Fund
Service Providers | | | Tax Fees Billed to
Adviser and
Affiliated Fund
Service Providers | | | All Other Fees
Billed to Adviser
and Affiliated Fund
Service Providers | |
July 31, 2022 | | $ | 0 | | | $ | 0 | | | $ | 0 | |
| | | | | | | | | | | | |
| | | | | | | | | | | | |
Percentage approved pursuant to pre-approval exception | | | 0 | % | | | 0 | % | | | 0 | % |
| | | | | | | | | | | | |
| | | | | | | | | | | | |
July 31, 2021 | | $ | 0 | | | $ | 0 | | | $ | 0 | |
| | | | | | | | | | | | |
| | | | | | | | | | | | |
Percentage approved pursuant to pre-approval exception | | | 0 | % | | | 0 | % | | | 0 | % |
| | | | | | | | | | | | |
| | | | | | | | | | | | |
NON-AUDIT SERVICES
The following table shows the amount of fees that KPMG LLP billed during the Fund’s last two full fiscal years for non-audit services. The Audit Committee is required to pre-approve non-audit services that KPMG LLP provides to the Adviser and any Affiliated Fund Services Provider, if the engagement related directly to the Fund’s operations and financial reporting (except for those subject to the pre-approval exception described above). The Audit Committee requested and received information from KPMG LLP about any non-audit services that KPMG LLP rendered during the Fund’s last fiscal year to the Adviser and any Affiliated Fund Service Provider. The Committee considered this information in evaluating KPMG LLP ’s independence.
| | | | | | | | | | | | | | | | |
Fiscal Year Ended | | Total Non-Audit Fees
Billed to Fund | | | Total Non-Audit Fees
billed to Adviser and
Affiliated Fund Service
Providers (engagements
related directly to the
operations and
financial reporting of
the Fund) | | | Total Non-Audit Fees
billed to Adviser and
Affiliated Fund Service
Providers (all other
engagements) | | | Total | |
July 31, 2022 | | $ | 0 | | | $ | 0 | | | $ | 0 | | | $ | 0 | |
July 31, 2021 | | $ | 0 | | | $ | 0 | | | $ | 0 | | | $ | 0 | |
“Non-Audit Fees billed to Fund” for both fiscal year ends represent “Tax Fees” and “All Other Fees” billed to Fund in their respective amounts from the previous table.
Less than 50 percent of the hours expended on the principal accountant’s engagement to audit the registrant’s financial statements for the most recent fiscal year were attributed to work performed by persons other than the principal accountant’s full-time, permanent employees.
Audit Committee Pre-Approval Policies and Procedures. Generally, the Audit Committee must approve (i) all non-audit services to be performed for the Fund by the Fund’s independent accountants and (ii) all audit and non-audit services to be performed by the Fund’s independent accountants for the Affiliated Fund Service Providers with respect to operations and financial reporting of the Fund. Regarding tax and research projects conducted by the independent accountants for the Fund and Affiliated Fund Service Providers (with respect to operations and financial reports of the Fund) such engagements will be (i) pre-approved by the Audit Committee if they are expected to be for amounts greater than $10,000; (ii) reported to the Audit Committee chair for her verbal approval prior to engagement if they are expected to be for amounts under $10,000 but greater than $5,000; and (iii) reported to the Audit Committee at the next Audit Committee meeting if they are expected to be for an amount under $5,000.
ITEM 5. AUDIT COMMITTEE OF LISTED REGISTRANTS.
The registrant’s Board has a separately designated Audit Committee established in accordance with Section 3(a)(58)(A) of the Securities Exchange Act of 1934, as amended (15 U.S.C. 78c(a)(58)(A)). As of the end of the period covered by this report, the members of the audit committee are Jack B. Evans, John K. Nelson, Judith M. Stockdale, Albin F. Moschner, Robert L. Young and Carole E. Stone, Chair.
ITEM 6. SCHEDULE OF INVESTMENTS.
(a) See Portfolio of Investments in Item 1.
(b) Not applicable.
ITEM 7. DISCLOSURE OF PROXY VOTING POLICIES AND PROCEDURES FOR CLOSED-END MANAGEMENT INVESTMENT COMPANIES.
The Adviser has engaged Spectrum Asset Management, Inc. (“Spectrum”, “Sub-Adviser”) as Sub-Adviser to provide discretionary investment advisory services. As part of these services, the Adviser has also delegated to the Sub-Adviser the full responsibility for proxy voting and related duties in accordance with the Sub-Adviser’s policy and procedures. The Adviser periodically will monitor the Sub-Adviser’s voting to ensure that they are carrying out their duties. The Sub-Adviser’s proxy voting policies and procedures are summarized as follows:
Spectrum has adopted a Policy on Proxy Voting for Investment Advisory Clients (the “Voting Policy”), which provides that Spectrum aims to ensure that, when delegated proxy voting authority by a client, Spectrum act (1) solely in the interest of the client in providing for ultimate long-term stockholder value, and (2) without undue influence from individuals or groups who may have an economic interest in the outcome of a proxy vote. Spectrum relies on the custodian bank to deliver proxies to Spectrum for voting.
Spectrum has selected Institutional Shareholder Services (“ISS”) to assist with Spectrum’s proxy voting responsibilities. Spectrum generally follows ISS standard proxy voting guidelines which embody the positions and factors Spectrum considers important in casting proxy votes. In connection with each proxy vote, ISS prepares a written analysis and recommendation based on its guidelines. In order to avoid any conflict of interest for ISS, the CCO will require ISS to deliver additional information or certify that ISS has adopted policies and procedures to detect and mitigate such conflicts of interest in issuing voting recommendations. Spectrum also may obtain voting recommendations from two proxy voting services as an additional check on the independence of ISS’ voting recommendations.
Spectrum may, on any particular proxy vote, diverge from ISS’ guidelines or recommendations. In such a case, Spectrum’s Voting Policy requires that: (i) the requesting party document the reason for the request; (ii) the approval of the Chief Investment Officer; (iii) notification to appropriate compliance personnel; (iv) a determination that the decision is not influenced by any conflict of interest; and (v) a written record of the process.
When Spectrum determines not to follow ISS’ guidelines or recommendations, Spectrum classifies proxy voting issues into three broad categories: (1) Routine Administrative Items; (2) Special Interest Issues; and (3) Issues having the Potential for Significant Economic Impact, and casts proxy votes in accordance with the philosophy and decision guidelines developed for that category in the Voting Policy.
| | • | | Routine Administrative Items. Spectrum is willing to defer to management on matters a routine administrative nature. Examples of issues on which Spectrum will normally defer to management’s recommendation include selection of auditors, increasing the authorized number of common shares and the election of unopposed directors. |
| | • | | Special Interest Issues. In general, Spectrum will abstain from voting on shareholder social, political, environmental proposals because their long-term impact on share value cannot be calculated with any reasonable degree of confidence. |
| | • | | Issues Having the Potential for Significant Economic Impact. |
Spectrum is not willing to defer to management on proposals which have the potential for major economic impact on the corporation and value of its shares and believes such issues should be carefully analyzed and decided by shareholders. Examples of such issues are classification of board of directors’ cumulative voting and supermajority provisions, defensive strategies (e.g., greenmail prevention), business combinations and restructurings and executive and director compensation.
Conflicts of Interest. There may be a material conflict of interest when Spectrum votes, on behalf of a client, a proxy that is solicited by an affiliated person of Spectrum or another Spectrum client. To avoid such
conflicts, Spectrum has established procedures under its Voting Policy to seek to ensure that voting decisions are based on a client’s best interests and are not the product of a material conflict. In addition to employee monitoring for potential conflicts, the CCO reviews Spectrum’s and its affiliates’ material business relationships and personal and financial relationships of senior personnel of Spectrum and its affiliates to monitor for conflicts of interest.
If a conflict of interest is identified, Spectrum considers both financial and non-financial materiality to determine if a conflict of interest is material. If a material conflict of interest is found to exist, the CCO discloses the conflict to affected clients and obtains consent from each client in the manner in which Spectrum proposed to vote.
Spectrum clients can obtain a copy of the Voting Policy or information on how Spectrum voted their proxies by calling Spectrum’s Compliance Department at (203) 322-0189.
ITEM 8. PORTFOLIO MANAGERS OF CLOSED-END MANAGEMENT INVESTMENT COMPANIES.
Nuveen Fund Advisors, LLC is the Fund’s investment adviser (also referred to as the “Adviser”.) The Adviser is responsible for the selection and on-going monitoring of the Fund’s investment portfolio, managing the Fund’s business affairs and providing certain clerical, bookkeeping and administrative services. The Adviser has engaged Spectrum Asset Management, Inc. (the “Sub-Adviser”), as sub-adviser to provide discretionary investment advisory services. The following section provides information on the portfolio managers at the Sub-Adviser.
| ITEM 8(a)(1). | PORTFOLIO MANAGER BIOGRAPHIES |
As of the date of filing this report, the following individual at the Sub-Adviser (the “Portfolio Managers”) had primary responsibility for the day-to-day implementation of the Fund’s investment strategy:
Mark A. Lieb is the Founder, President and Chief Executive Officer of Spectrum. Prior to founding Spectrum in 1987, Mr. Lieb was a Founder, Director and Partner of DBL Preferred Management, Inc., a wholly owned corporate cash management subsidiary of Drexel Burnham Lambert, Inc. Mr. Lieb was instrumental in the formation and development of all aspects of DBL Preferred Management, Inc., including the daily management of preferred stock portfolios for institutional clients, hedging strategies, and marketing strategies. Mr. Lieb’s prior employment included the development of the preferred stock trading desk at Mosley Hallgarten & Estabrook. BA Economics, Central Connecticut State College; MBA Finance, University of Hartford.
L. Phillip Jacoby, IV is an Executive Director and Chief Investment Officer of Spectrum. Mr. Jacoby joined Spectrum in 1995 as a Portfolio Manager and held the position of Managing Director and Senior Portfolio Manager until his appointment as CIO on January 1, 2010, following the planned retirement of his predecessor. Prior to joining Spectrum, Mr. Jacoby was a Senior Investment Officer at USL Capital Corporation (a subsidiary of Ford Motor Corporation) and co-manager of the preferred stock portfolio of its US Corporate Financing Division for six years. Mr. Jacoby began his career in 1981 with The Northern Trust Company, Chicago and then moved to Los Angeles to join E.F. Hutton & Co. as a Vice President and Institutional Salesman, Generalist Fixed Income Sales through most of the 1980s. BSBA Finance, Boston University School of Management.
| ITEM 8(a)(2). | OTHER ACCOUNTS MANAGED BY PORTFOLIO MANAGERS |
Other Accounts Managed. In addition to managing the Fund, as of July 31, 2022, the Portfolio Managers are also primarily responsible for the day-to-day portfolio management of the following accounts:
| | | | | | | | | | |
Portfolio Manager | | Type of Account Managed | | Number of
Accounts | | | Assets* | |
| Phillip Jacoby | | Separately Managed Accounts | | | 70 | | | | 7,300,000,000 | |
| | Pooled Accounts | | | 8 | | | | 4,000,000,000 | |
| | Registered Investment Vehicles | | | 8 | | | | 8,800,000,000 | |
| Mark Lieb | | Separately Managed Accounts | | | 70 | | | | 7,300,000,000 | |
| | Pooled Accounts | | | 8 | | | | 4,000,000,000 | |
| | Registered Investment Vehicles | | | 8 | | | | 8,800,000,000 | |
*Assets are as of July 31, 2022.
POTENTIAL MATERIAL CONFLICTS OF INTEREST
There are no potential material conflicts of interest to report, other than that Spectrum executes all transactions for the Fund through its wholly owned FINRA member broker/dealer, SAMI Brokerage LLC, certain of which transactions involve commission charges. The potential conflicts of interests related to this arrangement are disclosed in Spectrum’s SEC Form ADV and are mitigated by, among other things, Spectrum’s Best Execution Policies and Procedures.
| ITEM 8(a)(3). | FUND MANAGER COMPENSATION |
As of the most recently completed fiscal year end, the primary Portfolio Managers’ compensation is as follows:
Spectrum Asset Management offers investment professionals a competitive compensation structure that is evaluated relative to other asset management firms to ensure its continued competitiveness and alignment with industry best practices. The objective of the structure is to align individual and team contributions with client performance objectives in a manner that is consistent with industry standards and business results.
Compensation for investment professionals at all levels is comprised of base salary and variable incentive components. As team members advance in their careers, the variable component increases in its proportion commensurate with responsibility levels. The incentive component is aligned with performance and goals of the firm. Salaries are established based on a benchmark of salary levels of relevant asset management firms, taking into account each portfolio manager’s position and
responsibilities, experience, contribution to client servicing, compliance with firm and/or regulatory policies and procedures, work ethic, seniority and length of service, and contribution to the overall functioning of the organization. Spectrum attempts to award all compensation in a manner that promotes sound risk management principles. Base salaries are fixed, but are subject to periodic adjustments, usually on an annual basis.
The variable incentive is in the form of a discretionary bonus and may represent a significant proportion of an individual’s total annual compensation. Discretionary bonuses are determined quarterly and are based on a methodology used by senior management that takes into consideration several factors, including but not necessarily limited to those listed below:
| | • | | Changes in overall firm assets under management, including those assets in the Fund. (Portfolio managers are not directly incentivized to increase assets (“AUM”), although they are indirectly compensated as a result of an increase in AUM) |
| | • | | Portfolio performance (on a pre-tax basis) relative to benchmarks measured annually. |
| | • | | Contribution to client servicing |
| | • | | Compliance with firm and/or regulatory policies and procedures |
| | • | | Seniority and length of service |
| | • | | Contribution to overall functioning of organization |
| ITEM 8(a)(4). | OWNERSHIP OF JPS SECURITIES AS OF JULY 31, 2022. |
| | | | | | | | | | | | | | |
Name of Portfolio Manager | | None | | $1 - $10,000 | | $10,001- $50,000 | | $50,001- $100,000 | | $100,001 - $500,000 | | $500,001- $1,000,000 | | Over $1,000,000 |
Phillip Jacoby | | | | | | | | X | | | | | | |
Mark Lieb | | | | | | | | | | | | | | X |
ITEM 9. PURCHASES OF EQUITY SECURITIES BY CLOSED-END MANAGEMENT INVESTMENT COMPANY AND AFFILIATED PURCHASERS.
Not applicable.
ITEM 10. SUBMISSION OF MATTERS TO A VOTE OF SECURITY HOLDERS.
There have been no material changes to the procedures by which shareholders may recommend nominees to the registrant’s Board implemented after the registrant last provided disclosure in response to this Item.
ITEM 11. CONTROLS AND PROCEDURES.
| | (a) | The registrant’s principal executive and principal financial officers, or persons performing similar functions, have concluded that the registrant’s disclosure controls and procedures (as defined in Rule 30a-3(c) under the Investment Company Act of 1940, as amended (the “1940 Act”) (17 CFR 270.30a-3(c))) are effective, as of a date within 90 days of the filing date of this report that includes the disclosure required by this paragraph, based on their evaluation of the controls and procedures required by Rule 30a-3(b) under the 1940 Act (17 CFR 270.30a-3(b)) and Rules 13a-15(b) or 15d-15 (b) under the Securities Exchange Act of 1934, as amended (the “Exchange Act”) (17 CFR 240.13a-15(b) or 240.15d-15 (b)). |
| | (b) | There were no changes in the registrant’s internal control over financial reporting (as defined in Rule 30a-3(d) under the 1940 Act (17 CFR 270.30a-3(d)) that occurred during the period covered by this report that has materially affected, or is reasonably likely to materially affect, the registrant’s internal control over financial reporting. |
ITEM 12. DISCLOSURE OF SECURITIES LENDING ACTIVITIES FOR CLOSED-END MANAGEMENT INVESTMENT COMPANIES.
Not applicable.
ITEM 13. EXHIBITS.
File the exhibits listed below as part of this Form.
(a)(1) Any code of ethics, or amendment thereto, that is the subject of the disclosure required by Item 2, to the extent that the registrant intends to satisfy the Item 2 requirements through filing of an exhibit: Not applicable because the code is posted on registrant’s website at www.nuveen.com/fund-governance and there were no amendments during the period covered by this report. (To view the code, click on Code of Conduct.)
(a)(2) A separate certification for each principal executive officer and principal financial officer of the registrant as required by Rule 30a-2(a) under the 1940 Act (17 CFR 270.30a-2(a)) in the exact form set forth below: Ex-99.CERT Attached hereto.
(a)(3) Any written solicitation to purchase securities under Rule 23c-1 under the 1940 Act (17 CFR 270.23c-1) sent or given during the period covered by the report by or on behalf of the registrant to 10 or more persons. Not applicable.
(a)(4) Change in the registrant’s independent public accountant. Not applicable.
(b) If the report is filed under Section 13(a) or 15(d) of the Exchange Act, provide the certifications required by Rule 30a-2(b) under the 1940 Act (17 CFR 270.30a-2(b)); Rule 13a-14(b) or Rule 15d-14(b) under the Exchange Act (17 CFR 240.13a-14(b) or 240.15d-14(b)), and Section 1350 of Chapter 63 of Title 18 of the United States Code (18 U.S.C. 1350) as an exhibit. A certification furnished pursuant to this paragraph will not be deemed “filed” for purposes of Section 18 of the Exchange Act (15 U.S.C. 78r), or otherwise subject to the liability of that section. Such certification will not be deemed to be incorporated by reference into any filing under the Securities Act of 1933 or the Exchange Act, except to the extent that the registrant specifically incorporates it by reference. Ex-99.906 CERT attached hereto.
(c) Consent of Independent Registered Public Accounting Firm
SIGNATURES
Pursuant to the requirements of the Securities Exchange Act of 1934 and the Investment Company Act of 1940, the registrant has duly caused this report to be signed on its behalf by the undersigned, thereunto duly authorized.
(Registrant) Nuveen Preferred & Income Securities Fund
| | | | |
| By (Signature and Title) | | /s/ Mark L. Winget | | |
| | Mark L. Winget | | |
| | Vice President and Secretary | | |
| |
| Date: October 7, 2022 | | |
Pursuant to the requirements of the Securities Exchange Act of 1934 and the Investment Company Act of 1940, this report has been signed below by the following persons on behalf of the registrant and in the capacities and on the dates indicated.
| | | | |
| By (Signature and Title) | | /s/ David J. Lamb | | |
| | David J. Lamb | | |
| | Chief Administrative Officer | | |
| | (principal executive officer) | | |
| |
| Date: October 7, 2022 | | |
| | |
| By (Signature and Title) | | /s/ E. Scott Wickerham | | |
| | E. Scott Wickerham | | |
| | Vice President and Controller | | |
| | (principal financial officer) | | |
| |
| Date: October 7, 2022 | | |