Use these links to rapidly review the document
TABLE OF CONTENTS
Table of Contents
UNITED STATES
SECURITIES AND EXCHANGE COMMISSION
Washington, D.C. 20549
FORM 10-Q
| | |
ý |
|
QUARTERLY REPORT PURSUANT TO SECTION 13 OR 15(d) OF THE SECURITIES EXCHANGE ACT OF 1934 |
For the quarterly period ended March 31, 2014 |
OR |
o |
|
TRANSITION REPORT PURSUANT TO SECTION 13 OR 15(d) OF THE SECURITIES EXCHANGE ACT OF 1934 |
For the transition period to
|
Commission File No. 001-36429
ARES MANAGEMENT, L.P.
(Exact name of Registrant as specified in its charter)
| | |
Delaware
(State or other jurisdiction of
incorporation or organization) | | 80-0962035
(I.R.S. Employer
Identification Number) |
2000 Avenue of the Stars, 12th Floor, Los Angeles, CA 90067
(Address of principal executive office) (Zip Code)
(310) 201-4100
(Registrant's telephone number, including area code)
N/A
(Former name, former address and former fiscal year, if changed since last report)
Indicate by check mark whether the registrant (1) has filed all reports required to be filed by Section 13 or 15(d) of the Securities Exchange Act of 1934 during the preceding 12 months (or for such shorter period that the registrant was required to file such reports), and (2) has been subject to such filing requirements for the past 90 days: Yes o No ý
Indicate by check mark whether the registrant has submitted electronically and posted on its corporate Web site, if any, every Interactive Data File required to be submitted and posted pursuant to Rule 405 of Regulation S-T (§232.405 of this chapter) during the preceding 12 months (or for such shorter period that the registrant was required to submit and post such files). Yes ý No o
Indicate by check mark whether the registrant is a large accelerated filer, an accelerated filer, a non-accelerated filer, or a smaller reporting company. See definitions of "large accelerated filer," "accelerated filer," and "smaller reporting company" in Rule 12b-2 of the Exchange Act. (Check one):
| | | | | | |
| Large accelerated filer o | | Accelerated filer o | | Non-accelerated filer ý
(Do not check if a
smaller reporting company) | | Smaller reporting company o |
Indicate by check mark whether the registrant is a shell company (as defined in Rule 12b-2 of the Exchange Act). Yes o No ý
The number of common units representing limited partner interests outstanding as of June 9, 2014 was 80,667,664.
Table of Contents
ARES MANAGEMENT, L.P.
INDEX
| | | | | | | | |
Part I. | | Financial Information | | | | |
Item 1. | | Ares Management, L.P.: | | | | |
| | | | Statements of Financial Condition as of March 31, 2014 (unaudited) and December 31, 2013 | | | 5 | |
| | | | Notes to Financial Statements (unaudited) | | |
6 | |
| | Ares Holdings Inc. and Ares Investments LLC (Predecessors to Ares Management, L.P.): | | | | |
| | Combined and Consolidated Financial Statements | | | | |
| | | | Combined and Consolidated Statements of Financial Condition as of March 31, 2014 (unaudited) and December 31, 2013 | | |
8 | |
| | | | Combined and Consolidated Statements of Operations for the three months ended March 31, 2014 and March 31, 2013 (unaudited) | | |
9 | |
| | | | Combined and Consolidated Statements of Comprehensive Income for the three months ended March 31, 2014 and March 31, 2013 (unaudited) | | |
10 | |
| | | | Combined and Consolidated Statements of Changes in Equity for the three months ended March 31, 2014 (unaudited) | | |
11 | |
| | | | Combined and Consolidated Statements of Cash Flows for the three months ended March 31, 2014 and March 31, 2013 (unaudited) | | |
12 | |
| | | | Notes to Combined and Consolidated Financial Statements (unaudited) | | |
13 | |
Item 2. | | Management's Discussion and Analysis of Financial Condition and Results of Operations | | |
86 | |
Item 3. | | Quantitative and Qualitative Disclosures About Market Risk | | |
151 | |
Item 4. | | Controls and Procedures | | |
154 | |
Part II. | | Other Information | | | | |
Item 1. | | Legal Proceedings | | |
154 | |
Item 1A. | | Risk Factors | | |
154 | |
Item 2. | | Unregistered Sales of Equity Securities and Use of Proceeds | | |
154 | |
Item 3. | | Defaults Upon Senior Securities | | |
155 | |
Item 4. | | Mine Safety Disclosures | | |
155 | |
Item 5. | | Other Information | | |
155 | |
Item 6. | | Exhibits | | |
156 | |
Table of Contents
Forward-Looking Statements
This Quarterly Report on Form 10-Q may contain forward-looking statements within the meaning of Section 27A of the Securities Act of 1933 and Section 21E of the Securities Exchange Act of 1934, that reflect our current views with respect to, among other things, future events and financial performance. You can identify these forward-looking statements by the use of forward-looking words such as "outlook," "believes," "expects," "potential," "continues," "may," "will," "should," "seeks," "approximately," "predicts," "intends," "plans," "estimates," "anticipates" or the negative version of these words or other comparable words. The forward-looking statements are based on our beliefs, assumptions and expectations of our future performance, taking into account all information currently available to us. Such forward-looking statements are subject to various risks and uncertainties and assumptions relating to our operations, financial results, financial condition, business prospects, growth strategy and liquidity. We believe these factors include but are not limited to those described under "Risk Factors" in our prospectus dated May 1, 2014, filed with the Securities and Exchange Commission (the "SEC") in accordance with Rule 424(b) of the Securities Act of 1933 on May 5, 2014, which is accessible on the SEC's website at www.sec.gov. These factors should not be construed as exhaustive and should be read in conjunction with the risk factors and other cautionary statements that are included or incorporated by reference in this Quarterly Report on Form 10-Q and in the prospectus. If one or more of these or other risks or uncertainties materialize, or if our underlying assumptions prove to be incorrect, our actual results may vary materially from those indicated in these forward-looking statements. New risks and uncertainties arise over time, and it is not possible for us to predict those events or how they may affect us. Therefore, you should not place undue reliance on these forward-looking statements. Any forward-looking statement speaks only as of the date on which it is made. We do not undertake any obligation to publicly update or review any forward-looking statement, whether as a result of new information, future developments or otherwise, except as required by law.
Prior to the reorganization on May 1, 2014 in connection with our initial public offering, our business was conducted through operating subsidiaries held directly or indirectly by Ares Holdings LLC and Ares Investments LLC (or "AI"). These two entities were principally owned by Ares Partners Management Company LLC ("APMC"), the Abu Dhabi Investment Authority and its affiliate (collectively, "ADIA") and an affiliate of Alleghany Corporation (NYSE: Y) (such affiliate, "Alleghany"). ADIA and Alleghany each own minority interests with limited voting rights in our business. We refer to APMC, ADIA and Alleghany collectively as our "existing owners." APMC is controlled by our Co-Founders. Ares Management, L.P. was formed on November 15, 2013 to serve as a holding partnership for our businesses. Prior to the consummation of our initial public offering, Ares Management, L.P. had not commenced operations and had nominal assets and liabilities. Unless the context suggests otherwise, references in this Quarterly Report on Form 10-Q to (1) "Ares," "we," "us" and "our" refer to our businesses, both before and after the consummation of our reorganization into a holding partnership structure and (2) our "Predecessors" refer to Ares Holdings Inc. ("AHI") and Ares Investments LLC, our accounting predecessors, as well as their wholly owned subsidiaries and managed funds, in each case prior to the reorganization. References in this Quarterly Report on Form 10-Q to "our general partner" refer to Ares Management GP LLC, an entity wholly owned by Ares Partners Holdco LLC, which is in turn owned and controlled by our Co-Founders.
Under generally accepted accounting principles in the United States ("GAAP"), we are required to consolidate (a) entities in which we hold a majority voting interest or have majority ownership and control over the operational, financial and investing decisions of that entity, including Ares-affiliates and affiliated funds and co-investment entities, for which we are the general partner and are presumed to have control, and (b) entities that we concluded are variable interest entities ("VIEs"), including limited partnerships in which we have a nominal economic interest and the CLOs, for which we are deemed to be the primary beneficiary. When a fund is consolidated, we reflect the assets, liabilities, revenues, expenses and cash
1
Table of Contents
flows of the fund in our combined and consolidated financial statements on a gross basis, subject to eliminations from consolidation, including the elimination of the management fees, performance fees and other fees that we earn from Consolidated Funds. However, the presentation of performance fee compensation and other expenses associated with generating such revenues are not affected by the consolidation process. In addition, as a result of the consolidation process, the net income attributable to third-party investors in Consolidated Funds is presented as net income attributable to non-controlling interests and redeemable non-controlling interests in Consolidated Funds in our Combined and Consolidated Statements of Operations.
In this Quarterly Report on Form 10-Q, in addition to presenting our results on a consolidated basis in accordance with GAAP, we present revenues, expenses and other results on a (i) "segment basis," which deconsolidates these funds and therefore shows the results of our reportable segments without giving effect to the consolidation of the funds and (ii) "Stand Alone basis," which shows the results of our reportable segments on a combined segment basis together with our Operations Management Group. In addition to our four segments, we have an Operations Management Group (the "OMG") that consists of five independent, shared resource groups to support our reportable segments by providing infrastructure and administrative support in the areas of accounting/finance, operations/information technology, business development, legal/compliance and human resources. The OMG's expenses are not allocated to our four reportable segments but we consider the cost structure of the OMG when evaluating our financial performance. This information constitutes non-GAAP financial information within the meaning of Regulation G, as promulgated by the SEC. Our management uses this information to assess the performance of our reportable segments and our Operations Management Group, and we believe that this information enhances the ability of unitholders to analyze our performance.
When used in this Quarterly Report on Form 10-Q, unless the context otherwise requires:
- •
- "assets under management" or "AUM" refers to the assets we manage. For our funds other than CLOs, our AUM represents the sum of the net asset value of such funds, the drawn and undrawn debt (at the fund-level including amounts subject to restrictions) and uncalled committed capital (including commitments to funds that have yet to commence their investment periods). For our funds that are CLOs, our AUM represents subordinated notes (equity) plus all drawn and undrawn debt tranches;
- •
- "CLOs" refers to collateralized loan obligations;
- •
- "Consolidated Funds" refers collectively to certain Ares-affiliated funds, related co-investment entities and certain CLOs that are required under GAAP to be consolidated in our combined and consolidated financial statements;
- •
- "Co-Founders" refers to Michael Arougheti, David Kaplan, John Kissick, Antony Ressler and Bennett Rosenthal;
- •
- "distributable earnings" or "DE" refers to a pre-income tax measure that is used to assess amounts potentially available for distributions to stakeholders. Distributable earnings is calculated as the sum of Fee Related Earnings, realized performance fees, realized performance fee compensation expense, realized net other income, and further adjusts for expenses arising from transaction costs associated with acquisitions, placement fees and underwriting costs, expenses incurred in connection with corporate reorganization and depreciation. Distributable earnings differs from income before taxes computed in accordance with GAAP as it is presented before giving effect to unrealized performance fee income, unrealized performance fee compensation expense, unrealized net investment income, amortization of intangibles, equity compensation expense and is further adjusted by certain items described in "Management's Discussion and Analysis of Financial Condition and Results of Operations—Reconciliation of Certain Non-GAAP Measures to Consolidated GAAP Financial Measures;"
2
Table of Contents
- •
- "economic net income" or "ENI" refers to net income excluding (a) income tax expense, (b) operating results of our Consolidated Funds, (c) depreciation expense, (d) the effects of changes arising from corporate actions, and (e) certain other items that we believe are not indicative of our performance. Changes arising from corporate actions include equity-based compensation expenses, the amortization of intangible assets, transaction costs associated with acquisitions and capital transactions, placement fees and underwriting costs and expenses incurred in connection with corporate reorganization;
- •
- "fee earning AUM" refers to the AUM on which we directly or indirectly earn management fees. Fee earning AUM is equal to the sum of all the individual fee bases of our funds that contribute directly or indirectly to our management fees;
- •
- "fee related earnings" or "FRE" refers to a component of ENI that is used to assess the ability of our business to cover direct base compensation and operating expenses from management fees. FRE differs from income before taxes computed in accordance with GAAP as it adjusts for the items included in the calculation of ENI and further adjusts for performance fees, performance fee compensation, investment income from our Consolidated Funds and certain other items that we believe are not indicative of our performance;
- •
- "management fees" refers to fees we earn for advisory services provided to our funds, which are generally based on a defined percentage of fair value of assets, total commitments, invested capital, net asset value, net investment income, total assets or par value of the investment portfolios managed by us and also include ARCC Part I Fees (as defined in "Management's Discussion and Analysis of Financial Condition and Results of Operations—Overview of Combined and Consolidated Results of Operations—Revenues") that are classified as management fees as they are predictable and are recurring in nature, are not subject to repayment (or clawback) and are generally cash-settled each quarter;
- •
- "net performance fees" refers to performance fees net of performance fee compensation, which is the portion of the performance fees earned from certain funds that is payable to professionals;
- •
- "our funds" refers to the funds, alternative asset companies and other entities and accounts that are managed or co-managed by the Ares Operating Group. It also includes funds managed by Ivy Hill Asset Management, L.P., a wholly owned portfolio company of Ares Capital Corporation (Nasdaq: ARCC) ("ARCC"), and a registered investment adviser;
- •
- "performance fees" refers to fees we earn based on the performance of a fund, which are generally based on certain specific hurdle rates as defined in the fund's investment management or partnership agreements and may be either an incentive fee or carried interest; and
- •
- "performance related earnings" or "PRE" refers to a measure used to assess our investment performance. PRE differs from income (loss) before taxes computed in accordance with GAAP as it only includes performance fee income, performance fee compensation and investment income earned from our Consolidated Funds and non-consolidated funds.
Many of the terms used in this Quarterly Report on Form 10-Q, including AUM, fee earning AUM, ENI, FRE, PRE and distributable earnings, may not be comparable to similarly titled measures used by other companies. In addition, our definitions of AUM and fee earning AUM are not based on any definition of AUM or fee earning AUM that is set forth in the agreements governing the investment funds that we manage and may differ from definitions of AUM set forth in other agreements to which we are a party from time to time. Further, ENI, FRE, PRE and distributable earnings are not measures of performance calculated in accordance with GAAP. We use ENI, FRE, PRE and distributable earnings as measures of operating performance, not as measures of liquidity. ENI, FRE, PRE and distributable earnings should not be considered in isolation or as substitutes for operating income, net income, operating cash flows, or other income or cash flow statement data prepared in accordance with GAAP. The
3
Table of Contents
use of ENI, FRE, PRE and distributable earnings without consideration of related GAAP measures is not adequate due to the adjustments described above. Our management compensates for these limitations by using ENI, FRE, PRE and distributable earnings as supplemental measures to our GAAP results, to provide a more complete understanding of our performance as our management measures it. Amounts and percentages throughout this prospectus may reflect rounding adjustments and consequently totals may not appear to sum.
4
Table of Contents
Ares Management, L.P.
Statements of Financial Condition
(Amounts in Dollars)
| | | | | | | |
| | As of March 31,
2014 | | As of December 31,
2013 | |
|---|
| | (unaudited)
| |
| |
|---|
Assets | | | | | | | |
Cash | | $ | 350 | | $ | 350 | |
Prepaid assets | | | 650 | | | 650 | |
| | | | | | |
| | | | | | | | |
Total assets | | $ | 1,000 | | $ | 1,000 | |
| | | | | | |
| | | | | | | | |
| | | | | | | | |
| | | | | | |
Partners' Capital | | | | | | | |
Partners' capital | | $ | 1,000 | | $ | 1,000 | |
| | | | | | |
| | | | | | | | |
| | | | | | | | |
| | | | | | |
5
Table of Contents
Ares Management, L.P.
Notes to the Statement of Financial Condition
For the Three Months Ended March 31, 2014
(unaudited)
1. ORGANIZATION
In anticipation of its initial public offering (the "IPO") that closed on May 7, 2014, Ares Management, L.P. (the "Company") was formed as a Delaware limited partnership on November 15, 2013.
Pursuant to a reorganization effectuated in connection with the IPO, on May 1, 2014 the Company became a holding partnership. The Company's sole assets became equity interests through wholly owned subsidiary entities in Ares Holdings Inc. ("AHI"), Ares Domestic Holdings Inc., Ares Offshore Holdings, Ltd., Ares Investments LLC and Ares Real Estate Holdings LLC. The Company, either directly or through direct subsidiaries, is the general partner of each of the Ares Operating Group (as defined below) entities, and operates and controls all of the businesses and affairs of the Ares Operating Group. Ares Management GP LLC is the general partner of the Company.
Additionally, on May 1, 2014, in connection with the IPO, Ares Holdings LLC was converted into a limited partnership, Ares Holdings L.P. ("Ares Holdings"), and Ares Investments LLC was converted into a limited partnership, Ares Investments L.P. ("Ares Investments"). In addition, the Company formed Ares Domestic Holdings L.P. ("Ares Domestic"), Ares Offshore Holdings L.P. ("Ares Offshore") and Ares Real Estate Holdings L.P. ("Ares Real Estate"). Ares Holdings, Ares Domestic, Ares Offshore, Ares Investments and Ares Real Estate are collectively referred to as the "Ares Operating Group."
In exchange for its interest in the Company, prior to the consummation of the IPO, Ares Owners Holdings L.P. transferred to the Company its interests in each of AHI, Ares Domestic Holdings Inc., Ares Offshore Holdings, Ltd., Ares Real Estate Holdings LLC and a portion of its interest in Ares Investments. Similarly, the Abu Dhabi Investment Authority contributed its direct interest in AHI to its affiliate, AREC Holdings Ltd., a Cayman Islands exempted company ("AREC"), and subsequently, in exchange for its interest in the Company, AREC transferred to the Company its interest in each of AHI, Ares Domestic, Ares Offshore, Ares Investments and Ares Real Estate. As a result of the foregoing, Ares Owners Holdings L.P. holds 34,540,079 common units in the Company and AREC holds 34,538,155 common units in the Company. Following the foregoing exchanges, Ares Owners Holding L.P. retained a 59.21% direct interest, or 118,421,766 partnership units in each of the Ares Operating Group entities (collectively, the "Ares Operating Group Units"), in each of the Ares Operating Group entities. AREC has no direct interest in the Ares Operating Group entities. An affiliate of Alleghany Corporation ("Alleghany") owns a 6.25% direct interest, or 12,500,000 Ares Operating Group Units, in each of the Ares Operating Group entities.
On May 7, 2014, the Company issued 11,363,636 common units in the IPO at the price of $19.00 per common unit. In addition, on June 4, 2014 the Company issued an additional 225,794 common units at $19.00 per common unit pursuant to the partial exercise by the underwriters of their overallotment option. Total proceeds from the IPO, including from the partial exercise by the underwriters of their overallotment option, net of underwriting discounts, were $209.2 million. The Company entered into an exchange agreement with the holders of Ares Operating Group units so that such holders, subject to any applicable transfer restrictions and other provisions, may up to four times each year from and after the second anniversary of the date of the closing of the IPO exchange their Ares Operating Group Units for common units on a one-for-one basis (provided that Alleghany may exchange up to half of its Ares Operating Group Units from and after the first anniversary of the IPO).
6
Table of Contents
Ares Management, L.P.
Notes to the Statement of Financial Condition (Continued)
For the Three Months Ended March 31, 2014
(unaudited)
1. ORGANIZATION (Continued)
Following the consummation of the IPO, including the partial exercise by the underwriters of their overallotment option, assuming no exchange of Ares Operating Group Units for common units, Ares Owners Holdings L.P. holds a 42.82% direct interest in the Company, AREC holds a 42.82% direct interest in the Company and the public holds a 14.37% direct interest in the Company.
Following the consummation of the IPO, including the partial exercise by the underwriters of their overallotment option, Ares Owners Holdings L.P. holds a 72.29% direct and indirect interest in the Ares Operating Group, an affiliate of Alleghany holds a 5.91% direct interest in the Ares Operating Group, AREC holds a 16.32% indirect interest in the Ares Operating Group and the public holds 5.48% indirect interest in the Ares Operating Group.
The Company intends to conduct all of its material business activities through the Ares Operating Group. Following the IPO, the Company will consolidate the financial results of the Ares Operating Group entities, their consolidated subsidiaries and certain Consolidated Funds. The accompanying statement of financial condition of the Company does not reflect the effect of the reorganization, the IPO and the related transactions which occurred subsequent to the reporting date.
2. SUMMARY OF SIGNIFICANT ACCOUNTING POLICIES
There have been no significant changes to the Company's accounting policies since it filed its audited financial statements for the year ended December 31, 2013. For further information about the Company's accounting policies, refer to our prospectus dated May 1, 2014, filed with the SEC in accordance with Rule 424(b) of the Securities Act of 1933 on May 5, 2014.
Basis of Accounting—The statement of financial condition has been prepared in accordance with accounting principles generally accepted in the United States of America. Separate statements of operations, changes in equity and cash flows have not been presented in the financial statements because there have been no activities of this entity that would impact those statements.
3. PARTNERS' CAPITAL
Partners' capital is comprised of a $1,000 contribution from the limited partner of the Company, as of March 31, 2014.
7
Table of Contents
Ares Holdings Inc. and Ares Investments LLC
(Predecessors to Ares Management, L.P.)
Combined and Consolidated Statements of Financial Condition
(Amounts in Thousands, Except Share Data)
| | | | | | | |
| | As of March 31,
2014 | | As of December 31,
2013 | |
|---|
| | (unaudited)
| |
| |
|---|
Assets | | | | | | | |
Cash and cash equivalents | | $ | 36,634 | | $ | 89,802 | |
Restricted cash and cash equivalents | | | 7,657 | | | 13,344 | |
Investments, at fair value | | | 121,608 | | | 89,438 | |
Performance fees receivable | | | 136,430 | | | 137,682 | |
Derivative assets, at fair value | | | 1,132 | | | 1,164 | |
Due from affiliates | | | 119,330 | | | 108,920 | |
Intangible assets, net | | | 59,938 | | | 68,742 | |
Goodwill | | | 60,531 | | | 58,159 | |
Other assets | | | 71,957 | | | 73,600 | |
Assets of Consolidated Funds: | | | | | | | |
Cash and cash equivalents | | | 1,276,657 | | | 1,638,003 | |
Investments, at fair value | | | 19,485,067 | | | 20,823,338 | |
Due from affiliates | | | 9,930 | | | 2,010 | |
Dividends and interest receivable | | | 170,490 | | | 133,158 | |
Receivable for securities sold | | | 447,263 | | | 427,871 | |
Derivative assets, at fair value | | | 8,961 | | | 14,625 | |
Other assets | | | 21,916 | | | 25,528 | |
| | | | | | |
| | | | | | | | |
Total assets | | $ | 22,035,501 | | $ | 23,705,384 | |
| | | | | | |
| | | | | | | | |
| | | | | | | | |
| | | | | | |
Liabilities | | | | | | | |
Debt obligations | | $ | 172,119 | | $ | 153,119 | |
Accounts payable, accrued expenses and other liabilities | | | 63,621 | | | 67,486 | |
Deferred tax liability, net | | | 20,793 | | | 21,002 | |
Performance fee compensation payable | | | 304,015 | | | 295,978 | |
Derivative liabilities, at fair value | | | 2,942 | | | 2,907 | |
Accrued compensation | | | 55,557 | | | 132,917 | |
Due to affiliates | | | 23,312 | | | 32,690 | |
Liabilities of Consolidated Funds: | | | | | | | |
Accounts payable, accrued expenses and other liabilities | | | 66,010 | | | 95,839 | |
Payable for securities purchased | | | 601,349 | | | 945,115 | |
Derivative liabilities, at fair value | | | 53,643 | | | 75,115 | |
Due to affiliates | | | 2,530 | | | 2,695 | |
Securities sold short, at fair value | | | — | | | 1,633 | |
Deferred tax liability, net | | | 20,449 | | | 35,904 | |
CLO loan obligations | | | 11,275,857 | | | 11,774,157 | |
Fund borrowings | | | 1,769,737 | | | 2,070,598 | |
Mezzanine debt | | | 327,892 | | | 323,164 | |
| | | | | | |
| | | | | | | | |
Total liabilities | | | 14,759,826 | | | 16,030,319 | |
| | | | | | |
| | | | | | | | |
Commitments and contingencies | | | | | | | |
Redeemable interest in Consolidated Funds | | | 1,119,585 | | | 1,093,770 | |
Redeemable interest in AHI, AI and consolidated subsidiaries | | | 43,587 | | | 40,751 | |
Non-controlling interest in Consolidated Funds: | | | | | | | |
Non-controlling interest in Consolidated Funds | | | 5,283,933 | | | 5,691,874 | |
Equity appropriated for Consolidated Funds | | | 106,758 | | | 155,261 | |
| | | | | | |
| | | | | | | | |
Non-controlling interest in Consolidated Funds | | | 5,390,691 | | | 5,847,135 | |
| | | | | | |
| | | | | | | | |
Non-controlling interest in equity of AHI, AI and consolidated subsidiaries | | | 178,543 | | | 167,731 | |
Controlling interest in equity of AHI, AI and consolidated subsidiaries: | | | | | | | |
Members' Equity | | | 350,862 | | | 321,891 | |
Common Stock (class A shares, 50,000 authorized, 5,010 issued and outstanding, $0.001 par value) | | | 0 | | | 0 | |
Additional paid-in-capital | | | 315,553 | | | 338,375 | |
Retained earnings | | | (124,408 | ) | | (135,573 | ) |
Accumulated other comprehensive gain | | | 1,262 | | | 985 | |
| | | | | | |
| | | | | | | | |
Total controlling interest in equity of AHI, AI and consolidated subsidiaries | | | 543,269 | | | 525,678 | |
| | | | | | |
| | | | | | | | |
Total equity | | | 6,112,503 | | | 6,540,544 | |
| | | | | | |
| | | | | | | | |
Total liabilities, redeemable interests, non-controlling interests and equity | | $ | 22,035,501 | | $ | 23,705,384 | |
| | | | | | |
| | | | | | | | |
| | | | | | | | |
| | | | | | |
8
Table of Contents
Ares Holdings Inc. and Ares Investments LLC
(Predecessors to Ares Management, L.P.)
Combined and Consolidated Statements of Operations
(Amounts in Thousands)
(unaudited)
| | | | | | | |
| | For the Three Months
Ended March 31, | |
|---|
| | 2014 | | 2013 | |
|---|
Revenues | | | | | | | |
Management fees (includes ARCC Part I Fees of $28,318 and $23,836 for the periods ended March 31, 2014 and 2013, respectively) | | $ | 110,549 | | $ | 78,394 | |
Performance fees | | | 16,214 | | | 25,154 | |
Other fees | | | 6,865 | | | 3,989 | |
| | | | | | |
| | | | | | | | |
Total revenues | | | 133,628 | | | 107,537 | |
| | | | | | |
| | | | | | | | |
Expenses | | | | | | | |
Compensation and benefits | | | 95,693 | | | 71,975 | |
Performance fee compensation | | | 40,725 | | | 63,002 | |
General, administrative and other expenses | | | 38,775 | | | 16,982 | |
Consolidated Funds expenses | | | 8,937 | | | 61,108 | |
| | | | | | |
| | | | | | | | |
Total expenses | | | 184,130 | | | 213,067 | |
| | | | | | |
| | | | | | | | |
Other income (expense) | | | | | | | |
Interest and other income | | | 124 | | | 651 | |
Interest expense | | | (1,639 | ) | | (2,425 | ) |
Net realized loss on investments | | | (66 | ) | | (1,137 | ) |
Net change in unrealized appreciation on investments | | | 4,146 | | | 8,285 | |
Interest and other income of Consolidated Funds | | | 345,345 | | | 311,490 | |
Interest expense of Consolidated Funds | | | (145,042 | ) | | (125,958 | ) |
Net realized gain on investments of Consolidated Funds | | | 54,965 | | | 57,956 | |
Net change in unrealized appreciation on investments of Consolidated Funds | | | 67,344 | | | 104,252 | |
| | | | | | |
| | | | | | | | |
Total other income | | | 325,177 | | | 353,114 | |
| | | | | | |
| | | | | | | | |
Income before taxes | | | 274,675 | | | 247,584 | |
Income tax expense (benefit) | | | (6,695 | ) | | 24,450 | |
| | | | | | |
| | | | | | | | |
Net income | | | 281,370 | | | 223,134 | |
| | | | | | |
| | | | | | | | |
Less: Net income attributable to non-controlling interests and redeemable non-controlling interests in Consolidated Funds | | | 225,181 | | | 148,591 | |
Less: Net income attributable to non-controlling interests and redeemable non-controlling interests in consolidated subsidiaries | | | 13,342 | | | 12,601 | |
| | | | | | |
| | | | | | | | |
Net income attributable to controlling interests in AHI, AI and consolidated subsidiaries | | $ | 42,847 | | $ | 61,942 | |
| | | | | | |
| | | | | | | | |
| | | | | | | | |
| | | | | | |
Substantially all revenue is earned from affiliated funds of the Company. See accompanying notes.
9
Table of Contents
Ares Holdings Inc. and Ares Investments LLC
(Predecessors to Ares Management, L.P.)
Combined and Consolidated Statements of Comprehensive Income
(Amounts in Thousands)
(unaudited)
| | | | | | | |
| | For the Three Months
Ended March 31, | |
|---|
| | 2014 | | 2013 | |
|---|
Net income | | $ | 281,370 | | $ | 223,134 | |
| | | | | | |
| | | | | | | | |
Other comprehensive income (loss): | | | | | | | |
Foreign currency translation adjustments | | | 180 | | | (13,764 | ) |
| | | | | | |
| | | | | | | | |
Other comprehensive income (loss) | | | 180 | | | (13,764 | ) |
| | | | | | |
| | | | | | | | |
Total comprehensive income | | | 281,550 | | | 209,370 | |
| | | | | | |
| | | | | | | | |
Less: comprehensive income attributable to non-controlling interests and redeemable interests in Consolidated Funds | | | (225,002 | ) | | (136,163 | ) |
Less: comprehensive income attributable to non-controlling interests and redeemable interests in consolidated subsidiaries | | | (13,424 | ) | | (12,211 | ) |
| | | | | | |
| | | | | | | | |
Comprehensive income attributable to controlling interests | | $ | 43,124 | | $ | 60,996 | |
| | | | | | |
| | | | | | | | |
| | | | | | | | |
| | | | | | |
10
Table of Contents
Ares Holdings Inc. and Ares Investments LLC
(Predecessors to Ares Management, L.P.)
Combined and Consolidated Statements of Changes in Equity
(Amounts in Thousands)
(unaudited)
| | | | | | | | | | | | | | | | | | | | | | | | | | | | |
| | Controlling interest in equity of AHI, AI and consolidated subsidiaries | |
| | Consolidated Funds | |
| |
|---|
| | Members'
Equity | | Common Stock
(A shares) | | Additional
Paid in
Capital | | Retained
Earnings | | Accumulated
Other
Comprehensive
Income (Loss) | | Non-controlling
interest in AHI,
AI and
consolidated
subsidiaries | | Equity
Appropriated
for Consolidated
Funds | | Non-Redeemable
Non-Controlling
Interest in
Consolidated
Funds | | Total Equity | |
|---|
Balance at January 1, 2014 | | $ | 321,891 | | $ | 0 | | $ | 338,375 | | $ | (135,573 | ) | $ | 985 | | $ | 167,731 | | $ | 155,261 | | $ | 5,691,874 | | $ | 6,540,544 | |
Relinquished with deconsolidation of funds | | | — | | | — | | | — | | | — | | | — | | | — | | | — | | | (354,737 | ) | | (354,737 | ) |
Contributions | | | — | | | — | | | — | | | — | | | — | | | — | | | — | | | 116,958 | | | 116,958 | |
Distributions | | | (1,514 | ) | | — | | | (25,915 | ) | | — | | | — | | | (2,802 | ) | | — | | | (406,619 | ) | | (436,850 | ) |
Net income | | | 30,698 | | | — | | | — | | | 12,149 | | | — | | | 12,936 | | | (48,007 | ) | | 236,140 | | | 243,916 | |
Currency translation adjustment | | | — | | | — | | | — | | | — | | | 277 | | | 79 | | | (496 | ) | | 317 | | | 177 | |
Revaluation of redeemable equity | | | (259 | ) | | — | | | — | | | (984 | ) | | — | | | (395 | ) | | — | | | — | | | (1,638 | ) |
Equity compensation | | | 46 | | | — | | | 3,093 | | | — | | | — | | | 994 | | | — | | | — | | | 4,133 | |
| | | | | | | | | | | | | | | | | | | | |
| | | | | | | | | | | | | | | | | | | | | | | | | | | | | |
Balance at March 31, 2014 | | $ | 350,862 | | $ | 0 | | $ | 315,553 | | $ | (124,408 | ) | $ | 1,262 | | $ | 178,543 | | $ | 106,758 | | $ | 5,283,933 | | $ | 6,112,503 | |
| | | | | | | | | | | | | | | | | | | | |
| | | | | | | | | | | | | | | | | | | | | | | | | | | | | |
| | | | | | | | | | | | | | | | | | | | | | | | | | | | | |
| | | | | | | | | | | | | | | | | | | | |
11
Table of Contents
Ares Holdings Inc. and Ares Investments LLC
(Predecessors to Ares Management, L.P.)
Combined and Consolidated Statements of Cash Flows
(Amounts in Thousands)
(unaudited)
| | | | | | | |
| | For the Three Months Ended March 31, | |
|---|
| | 2014 | | 2013 | |
|---|
Cash flows from operating activities: | | | | | | | |
Net income | | $ | 281,370 | | $ | 223,134 | |
Adjustments to reconcile net income to net cash provided by operating activities: | | | | | | | |
Equity compensation expense | | | 5,339 | | | 6,310 | |
Depreciation and amortization | | | 11,120 | | | 3,803 | |
Net realized loss on investments | | | 66 | | | 1,137 | |
Net change in unrealized appreciation on investments | | | (4,146 | ) | | (8,285 | ) |
Investments purchased | | | (21,600 | ) | | (503 | ) |
Cash proceeds from sale of investments | | | 3,964 | | | 375 | |
Allocable to non-controlling interests in Consolidated Funds: | | | | | | | |
Receipt of non-cash interest income and dividends from investments | | | (2,999 | ) | | (9,671 | ) |
Net realized gain on investments | | | (54,965 | ) | | (57,956 | ) |
Amortization on debt and investments | | | (4,672 | ) | | (13,091 | ) |
Net change in unrealized appreciation on investments | | | (67,344 | ) | | (104,252 | ) |
Investments purchased | | | (2,321,820 | ) | | (4,369,254 | ) |
Cash proceeds from sale or pay down of investments | | | 3,075,968 | | | 4,668,173 | |
Cash flows due to changes in operating assets and liabilities: | | | | | | | |
Net change in restricted cash | | | 5,687 | | | 1,784 | |
Net change in performance fees receivable and payable | | | 12,455 | | | 38,662 | |
Net change in due from and due to affiliates | | | (19,788 | ) | | (17,712 | ) |
Net change in other assets | | | 1,142 | | | 4,975 | |
Net change in accrued compensation and benefits | | | (77,360 | ) | | 21,448 | |
Net change in accounts payable, accrued expenses and other liabilities | | | (4,209 | ) | | 10,766 | |
Net change in deferred taxes | | | (209 | ) | | — | |
Allocable to non-controlling interest in Consolidated Funds: | | | | | | | |
Change in cash and cash equivalents held at Consolidated Funds | | | 363,800 | | | (1,065,209 | ) |
Cash relinquished with deconsolidation of Consolidated Funds | | | (40,089 | ) | | — | |
Change in other assets and receivables held at Consolidated Funds | | | 129,596 | | | (53,486 | ) |
Change in other liabilities and payables held at Consolidated Funds | | | (261,691 | ) | | 738,666 | |
| | | | | | |
| | | | | | | | |
Net cash provided by operating activities | | | 1,009,615 | | | 19,814 | |
| | | | | | |
| | | | | | | | |
Cash flows from investing activities: | | | | | | | |
Purchase of furniture, equipment and leasehold improvements, net | | | (4,290 | ) | | (3,946 | ) |
| | | | | | |
| | | | | | | | |
Net cash used in investing activities | | | (4,290 | ) | | (3,946 | ) |
| | | | | | |
| | | | | | | | |
Financing activities: | | | | | | | |
Proceeds from issuance of debt obligations | | | 30,000 | | | 50,000 | |
Repayments of debt obligations | | | (11,000 | ) | | (56,000 | ) |
Capital distributions | | | (30,648 | ) | | (112,395 | ) |
Allocable to non-controlling interest in Consolidated Funds: | | | | | | | |
Contributions from non-controlling interest holders in Consolidated Funds | | | 158,613 | | | 164,452 | |
Distributions to non-controlling interest holders in Consolidated Funds | | | (459,507 | ) | | (550,444 | ) |
Borrowings under loan obligations by Consolidated Funds | | | 44,584 | | | 1,683,658 | |
Repayments under loan obligations by Consolidated Funds | | | (791,091 | ) | | (1,164,698 | ) |
| | | | | | |
| | | | | | | | |
Net cash (used in) provided by financing activities | | | (1,059,049 | ) | | 14,573 | |
| | | | | | |
| | | | | | | | |
Effect of exchange rate changes and translation | | | 556 | | | (13,661 | ) |
| | | | | | |
| | | | | | | | |
Net increase (decrease) in cash and cash-equivalents | | | (53,168 | ) | | 16,780 | |
Cash and cash-equivalents, beginning of period | | | 89,802 | | | 68,456 | |
| | | | | | |
| | | | | | | | |
Cash and cash-equivalents, end of period | | $ | 36,634 | | $ | 85,236 | |
| | | | | | |
| | | | | | | | |
| | | | | | | | |
| | | | | | |
Supplemental information: | | | | | | | |
AHI, AI and consolidated subsidiaries | | | | | | | |
Cash paid during the period for interest | | $ | 1,072 | | $ | 1,561 | |
Cash paid during the period for income taxes | | $ | 4,892 | | $ | 7,047 | |
Consolidated Funds | | | | | | | |
Cash paid during the period for interest | | $ | 53,807 | | $ | 55,959 | |
Cash paid during the period for income taxes | | $ | 1 | | $ | 6 | |
12
Table of Contents
ARES HOLDINGS INC. AND ARES INVESTMENTS LLC
(Predecessors to Ares Management, L.P.)
Notes to the Combined and Consolidated Financial Statements
For the Three Months Ended March 31, 2014 and 2013
and as of March 31, 2014 and December 31, 2013
(unaudited)
(Dollars in Thousands, Except Share Data and as Otherwise Noted)
1. ORGANIZATION AND BASIS OF PRESENTATION
The accompanying combined and consolidated financial statements include the results of two affiliated entities, Ares Holdings Inc. ("AHI") and Ares Investments LLC ("AI"), which directly or indirectly hold controlling interests in Ares Management LLC ("AM LLC") and Ares Investments Holdings LLC ("AIH LLC"), as well as their wholly owned subsidiaries (collectively the "Company" or "Ares"). Ares Partners Management Company LLC ("APMC") directs the operations of AHI and AI through its controlling ownership interest of approximately 50.1% and 70.3%, respectively, in each entity. The remaining ownership of AHI and AI is shared among various minority non-control-oriented strategic investment partners, whose financial interest in the consolidated and combined results are reflected as non-controlling interests in consolidated subsidiaries.
AM LLC is a leading global alternative asset management firm that operates four distinct but complementary investment groups: the Tradable Credit Group, the Direct Lending Group, the Private Equity Group and the Real Estate Group. Information about segments should be read together with Note 12, "Segment Reporting." Subsidiaries of AM LLC serve as the general partners and/or investment managers to various investment funds within each investment group (the "Ares Funds"), which are generally organized as pass-through entities for income tax purposes. Such subsidiaries provide investment advisory services to the Ares Funds in exchange for management fees. In addition, AM LLC consolidates the following foreign operating subsidiaries: Ares Management Limited and Ares Asia Management (HK), Ltd.
AIH LLC is a holding company that primarily holds carried interest and co-investment interests in partnerships and other investment vehicles managed directly or indirectly by Ares.
In addition, certain Ares-affiliated funds, related co-investment entities and certain collateralized loan obligations ("CLOs") (collectively, the "Consolidated Funds") managed by AM LLC and its wholly owned subsidiaries have been consolidated in the accompanying financial statements for the periods presented pursuant to U.S. generally accepted accounting principles ("U.S. GAAP") as described in Note 2, "Summary of Significant Accounting Policies." Including the results of the Consolidated Funds significantly increases the reported amounts of the assets, liabilities, revenues, expenses and cash flows of the Company; however, the Consolidated Funds results included herein have no direct effect on the net income attributable to controlling interests or on total controlling equity. Instead, economic ownership interests of the investors in the Consolidated Funds are reflected as non-controlling interests in Consolidated Funds and as equity appropriated for Consolidated Funds in the accompanying combined and consolidated financial statements.
The accompanying combined and consolidated financial statements have been prepared in accordance with U.S. GAAP for interim financial information. These statements and notes have not been audited, exclude some of the disclosures required for annual audited financial statements and should be read in conjunction with the audited combined and consolidated financial statements and notes for the year ended December 31, 2013, included in Ares Management, L.P.'s final prospectus dated May 1, 2014 filed with the Securities and Exchange Commission in accordance with Rule 424(b) of the Securities Act of 1933 on
13
Table of Contents
ARES HOLDINGS INC. AND ARES INVESTMENTS LLC
(Predecessors to Ares Management, L.P.)
Notes to the Combined and Consolidated Financial Statements (Continued)
For the Three Months Ended March 31, 2014 and 2013
and as of March 31, 2014 and December 31, 2013
(unaudited)
(Dollars in Thousands, Except Share Data and as Otherwise Noted)
1. ORGANIZATION AND BASIS OF PRESENTATION (Continued)
May 5, 2014. The operating results presented for interim periods are not necessarily indicative of the results that may be expected for any other interim period or for the entire year. In the opinion of management, the combined and consolidated financial statements reflect all adjustments, consisting of normal recurring accruals, which are necessary for the fair presentation of the financial condition and results of operations for the interim periods presented.
The accompanying combined and consolidated financial statements of AHI and AI reflect the predecessor entities, and do not reflect the effect of the reorganization, the initial public offering and the related transactions which occurred in May 2014. Refer to Note 13, "Subsequent Events" for more information.
2. SUMMARY OF SIGNIFICANT ACCOUNTING POLICIES
There have been no significant changes to the Company's accounting policies since it filed its audited financial statements for the year ended December 31, 2013. For further information about the Company's accounting policies, refer to our prospectus dated May 1, 2014, filed with the SEC in accordance with Rule 424(b) of the Securities Act of 1933 on May 5, 2014.
Principles of Consolidation
The Company consolidates those entities in which it has a direct and indirect controlling financial interest based on either a variable interest model or voting interest model. As such, the Company consolidates (a) entities in which it holds a majority voting interest or has majority ownership and control over the operational, financial and investing decisions of that entity, including Ares-affiliates and affiliated funds and co-investment entities for which the Company is the general partner and is presumed to have control and (b) entities that the Company concludes are variable interest entities ("VIEs"), including limited partnerships in which the Company has a nominal economic interest and CLOs for which the Company is deemed to be the primary beneficiary.
With respect to the Consolidated Funds, which typically represent limited partnerships and single member limited liability companies, the Company earns a fixed management fee based on invested capital or a derivation thereof, and a performance fee based upon the investment returns in excess of a stated benchmark or hurdle rate. The Company, as the general partner of various funds, generally has operational discretion and control, and limited partners have no substantive rights to impact ongoing governance and operating activities of the fund. Such a fund is required to be consolidated unless the Company has a less than significant level of equity at risk. The fund is typically considered a VIE as described below, to the extent that the Company's equity at risk is less than significant in a given fund and it has no obligation to fund any future losses. In these cases, the fund investors are generally deemed to be the primary beneficiaries, and the Company does not consolidate the fund. In cases where the Company's equity at risk is deemed to be significant, the fund is generally not considered to be a VIE, and the
14
Table of Contents
ARES HOLDINGS INC. AND ARES INVESTMENTS LLC
(Predecessors to Ares Management, L.P.)
Notes to the Combined and Consolidated Financial Statements (Continued)
For the Three Months Ended March 31, 2014 and 2013
and as of March 31, 2014 and December 31, 2013
(unaudited)
(Dollars in Thousands, Except Share Data and as Otherwise Noted)
2. SUMMARY OF SIGNIFICANT ACCOUNTING POLICIES (Continued)
Company will generally consolidate the fund unless the limited partners are granted substantive rights to remove the general partner or liquidate the partnership, also known as kick-out rights.
Variable Interest Model. The Company consolidates entities that are determined to be VIEs where the Company is deemed to be the primary beneficiary. An entity is determined to be the primary beneficiary if it holds a controlling financial interest. A controlling financial interest is defined as (a) the power to direct the activities of a VIE that most significantly impact the entity's business and (b) the obligation to absorb losses of the entity or the right to receive benefits from the entity that could potentially be significant to the VIE. The consolidation rules, which were revised effective January 1, 2010, require an analysis to determine whether (i) an entity in which the Company holds a variable interest is a VIE and (ii) the Company's involvement, through holding interests directly or indirectly in the entity or contractually through other variable interests (e.g., management and performance related fees), would give the Company a controlling financial interest. The consolidation rules may be deferred for VIEs if the VIE and the reporting entity's interest in VIE meet deferral conditions set forth in FASB Accounting Standards Codification ("ASC") 810-10-65-2. Certain limited partnerships meet the deferral conditions if: (a) the limited partnerships generally have all the attributes of an investment company, (b) the Company does not have the obligation to fund losses of the limited partnership and (c) the limited partnership is not a securitization, asset-backed financing entity or qualifying special purpose vehicle. Where a VIE qualifies for the deferral of the consolidation rules, the analysis is based on consolidation rules prior to January 1, 2010. These rules require an analysis to determine (i) whether an entity in which the Company holds a variable interest is a VIE and (ii) whether the Company's involvement, through holding interests directly or indirectly in the entity or contractually through other variable interests (e.g., management and performance related fees) would be expected to absorb a majority of the variability of the entity. Under either guideline, the Company determines whether it is the primary beneficiary of a VIE at the time it becomes involved with a VIE and reconsiders the conclusion at each reporting date. In evaluating whether the Company is the primary beneficiary, the Company evaluates its direct and indirect economic interests in the entity. The consolidation analysis is generally performed qualitatively; however, if the primary beneficiary is not readily determinable, a quantitative assessment may also be performed. This analysis requires judgment. These judgments include: (1) determining whether the equity investment at risk is sufficient to permit the entity to finance its activities without additional subordinated financial support, (2) evaluating whether the equity holders, as a group, can make decisions that have a significant effect on the success of the entity, (3) determining whether two or more parties' equity interests should be aggregated, (4) determining whether the equity investors have proportionate voting rights to their obligations to absorb losses or rights to receive returns from an entity, (5) evaluating the nature of relationships and activities of the parties involved in determining which party within a related-party group is most closely associated with a VIE and (6) estimating cash flows in evaluating which member within the equity group absorbs a majority of the expected losses and hence would be deemed the primary beneficiary.
15
Table of Contents
ARES HOLDINGS INC. AND ARES INVESTMENTS LLC
(Predecessors to Ares Management, L.P.)
Notes to the Combined and Consolidated Financial Statements (Continued)
For the Three Months Ended March 31, 2014 and 2013
and as of March 31, 2014 and December 31, 2013
(unaudited)
(Dollars in Thousands, Except Share Data and as Otherwise Noted)
2. SUMMARY OF SIGNIFICANT ACCOUNTING POLICIES (Continued)
Certain funds that have historically been consolidated in the financial statements are no longer consolidated because, as of the reporting period, they were: (a) liquidated, (b) the Company no longer holds a majority voting interest or (c) the Company is no longer deemed to be the primary beneficiary of the VIEs as it has no economic interest, no obligation to absorb losses and no rights to receive benefits from the VIEs.
Basis of Accounting
The accompanying financial statements are prepared in accordance with U.S. GAAP. Management has determined that the Company's Consolidated Funds are investment companies under U.S. GAAP for the purposes of financial reporting based on the following characteristics: the Consolidated Fund obtains funds from one or more investors and provides investment management services, and the Consolidated Fund's business purpose and substantive activities are investing funds for returns from capital appreciation and/or investment income. Therefore, U.S. GAAP for an investment company requires investments to be recorded at fair value and the unrealized appreciation (depreciation) in an investment's fair value is recognized on a current basis in the Combined and Consolidated Statements of Operations. Additionally, the Consolidated Funds do not consolidate their majority-owned and controlled investments in portfolio companies. In the preparation of these combined and consolidated financial statements, the Company has retained the specialized accounting guidance for the Consolidated Funds under U.S. GAAP.
All of the investments held and CLO loan obligations issued by the Consolidated Funds are presented at their estimated fair values in the Company's Combined and Consolidated Statements of Financial Condition. The excess of the CLO assets over the CLO liabilities upon consolidation is reflected in the Company's Combined and Consolidated Statements of Financial Condition as equity appropriated for Consolidated Funds. Net income attributable to the investors in the CLOs is included in net income (loss) attributable to non-controlling interests in consolidated entities in the Combined and Consolidated Statements of Operations and equity appropriated for Consolidated Funds in the Combined and Consolidated Statements of Financial Condition.
Use of Estimates
The preparation of financial statements in conformity with U.S. GAAP requires management to make assumptions and estimates that affect the reported amounts of assets and liabilities and disclosure of contingent assets and liabilities at the date of the financial statements and the reported amounts of revenues and expenses during the reporting period. Management's estimates are based on historical experiences and other factors, including expectations of future events that management believes to be reasonable under the circumstances. These assumptions and estimates require management to exercise judgment in the process of applying the Company's accounting policies. Assumptions and estimates regarding the valuation of investments and their resulting impact on performance fee revenue and performance fee compensation involve a higher degree of judgment and complexity, and these assumptions and estimates may be significant to the combined and consolidated financial statements.
16
Table of Contents
ARES HOLDINGS INC. AND ARES INVESTMENTS LLC
(Predecessors to Ares Management, L.P.)
Notes to the Combined and Consolidated Financial Statements (Continued)
For the Three Months Ended March 31, 2014 and 2013
and as of March 31, 2014 and December 31, 2013
(unaudited)
(Dollars in Thousands, Except Share Data and as Otherwise Noted)
2. SUMMARY OF SIGNIFICANT ACCOUNTING POLICIES (Continued)
Actual results could differ from these estimates and such differences could be material. Certain comparative amounts for prior periods have been reclassified to conform with the current year's presentation.
Goodwill and Intangible Assets
The Company's finite-lived intangible assets consist of contractual rights to earn future management fees and performance fees from investment funds it acquires. Finite-lived intangibles are amortized on a straight-line basis over their estimated useful lives, ranging from approximately 1 to 10 years. Finite-lived intangible assets arise from the Company's acquisition of management contracts, which provide the right to receive future fee income. The purchase price is treated as an intangible asset and is amortized over the life of the contracts. Amortization is included as part of general, administrative and other expense in the Combined and Consolidated Statements of Operations.
The Company tests finite-lived intangibles for impairment if certain events occur or circumstances change that indicate the carrying amount of an intangible may not be recoverable. The Company will use a two-step process to evaluate impairment. The first step compares the estimated undiscounted future cash flow attributable to the intangible being evaluated with its carrying amount. The second step, used to measure the amount of potential impairment, compares the fair value of the intangible with their carrying amount.
The Company tests goodwill annually for impairment. If, after assessing qualitative factors, the Company believes that it is more likely than not that the fair value of the reporting unit is less than its carrying value, the Company will use a two-step process to evaluate impairment. The first step compares the fair value of the reporting unit with its carrying amount, including goodwill. The second step, used to measure the amount of any potential impairment, compares the implied fair value of the reporting unit with the carrying amount of goodwill.
The Company also tests goodwill for impairment in other periods if an event occurs or circumstances change such that is more likely than not to reduce the fair value of the reporting unit below its carrying amounts. Inherent in such fair value determinations are certain judgments and estimates relating to future cash flows, including the Company's interpretation of current economic indicators and market valuations, and assumptions about the Company's strategic plans with regard to its operations. Due to the uncertainties associated with such estimates, actual results could differ from such estimates.
Goodwill is not amortized and is not deductible for income tax purposes.
Recent Accounting Pronouncements
In June 2013, FASB issued guidance to clarify the characteristics of an investment company and to provide guidance for assessing whether an entity is an investment company. Consistent with existing guidance for investment companies, all investments are to be measured at fair value including
17
Table of Contents
ARES HOLDINGS INC. AND ARES INVESTMENTS LLC
(Predecessors to Ares Management, L.P.)
Notes to the Combined and Consolidated Financial Statements (Continued)
For the Three Months Ended March 31, 2014 and 2013
and as of March 31, 2014 and December 31, 2013
(unaudited)
(Dollars in Thousands, Except Share Data and as Otherwise Noted)
2. SUMMARY OF SIGNIFICANT ACCOUNTING POLICIES (Continued)
non-controlling ownership interests in other investment companies. There are no changes to the current requirements relating to the retention of specialized accounting in the consolidated financial statements of a non-investment company parent. The guidance is effective for interim and annual periods beginning after December 15, 2013. The Company adopted this guidance as of January 1, 2014, and the adoption did not have a material impact on its financial statements.
In July 2013, FASB issued guidance to eliminate the diversity in practice on the financial statement presentation of an unrecognized tax benefit when a net operating loss carryforward, a similar tax loss or a tax credit carryforward exists. Under the new guidance, an unrecognized tax benefit, or a portion of an unrecognized tax benefit, should be presented in the financial statements as a reduction to a deferred tax asset for a net operating loss carryforward, a similar tax loss or a tax credit carry forward, with exceptions as defined. The guidance does not require new recurring disclosures. The guidance applies to all entities that have unrecognized tax benefits when a net operating loss carryforward, a similar tax loss or a tax credit carryforward exists at the reporting date. The guidance is effective for fiscal years, and interim periods within those years, beginning after December 15, 2013. The Company adopted this guidance as of January 1, 2014, and the adoption did not have a material impact on its financial statements.
In May 2014, FASB and International Accounting Standards Board (IASB) jointly issued a new revenue recognition standard that will improve financial reporting by creating common recognition guidance for U.S. GAAP and International Financial reporting Standard ("IFRS"). The standard affects any entity using U.S. GAAP that either enters into contracts with customers to transfer goods or services or enters into contracts for the transfer of nonfinancial assets unless those contracts are within the scope of other standards (e.g., insurance contracts or lease contracts). It will supersede the revenue recognition requirements in Topic 605, Revenue Recognition, and most industry-specific guidance. It will also supersede some cost guidance included in Subtopic 605-35, Revenue Recognition—Construction-Type and Production-Type Contracts. In addition, the existing requirements for the recognition of a gain or loss on the transfer of nonfinancial assets that are not in a contract with a customer (e.g., assets within the scope of Topic 360, Property, Plant, and Equipment, and intangible assets within the scope of Topic 350, Intangibles—Goodwill and Other) are amended to be consistent with the guidance on recognition and measurement (including the constraint on revenue) in this standard. The core principle of the guidance is that an entity should recognize revenue to depict the transfer of promised goods or services to customers in an amount that reflects the consideration to which the entity expects to be entitled in exchange for those goods or services. The guidance is effective for annual reporting periods beginning after December 15, 2016, including interim periods within that reporting period. Early application is not permitted. The Company continues to evaluate the impact this guidance will have on its financial statements.
18
Table of Contents
ARES HOLDINGS INC. AND ARES INVESTMENTS LLC
(Predecessors to Ares Management, L.P.)
Notes to the Combined and Consolidated Financial Statements (Continued)
For the Three Months Ended March 31, 2014 and 2013
and as of March 31, 2014 and December 31, 2013
(unaudited)
(Dollars in Thousands, Except Share Data and as Otherwise Noted)
3. GOODWILL AND INTANGIBLE ASSETS
Business Combinations
During the three months ended March 31, 2014, the Company re-evaluated one of the leases assumed in connection with its acquisition of AREA Management Holdings, LLC ("AREA"). Based upon remaining lease payments, the Company determined that the lease payments were in excess of current market conditions. The Company recorded an unfavorable lease liability of $2.3 million with a corresponding increase to goodwill. The unfavorable lease liability represents the difference between the discounted cash flows associated with the remaining lease payments and the lease payments for a similar lease at current market rates and is amortized on a straight-line basis over the term of the lease agreements. The amount of the unfavorable lease amortization for the three months ended March 31, 2014 was $0.4 million and is presented within general, administrative and other expenses within the Combined and Consolidated Statement of Operations.
There were no impairments of goodwill recorded as of March 31, 2014.
During the three months ended March 31, 2014, in connection with the termination of certain management contracts within its Tradable Credit Group, the Company evaluated for impairment certain intangible assets associated with acquired management fees and performance fees contracts. The Company determined the fair value of these intangibles was zero because no future cash flows are expected from these contracts. As a result, the Company recorded amortization expense of $3.0 million to remove the remaining carrying value of the related intangibles.
19
Table of Contents
ARES HOLDINGS INC. AND ARES INVESTMENTS LLC
(Predecessors to Ares Management, L.P.)
Notes to the Combined and Consolidated Financial Statements (Continued)
For the Three Months Ended March 31, 2014 and 2013
and as of March 31, 2014 and December 31, 2013
(unaudited)
(Dollars in Thousands, Except Share Data and as Otherwise Noted)
4. INVESTMENTS
Investments are comprised of (a) the investments held by AIH LLC at fair value and (b) investments held by the Consolidated Funds at fair value.
Investments held by AIH LLC are summarized below:
| | | | | | | | | | | | | |
| | Fair value at | | Fair value as a
percentage of total
investments at | |
|---|
| | March 31,
2014 | | December 31,
2013 | | March 31,
2014 | | December 31,
2013 | |
|---|
Private Investment Partnership Interests: | | | | | | | | | | | | | |
Ares Credit Strategies Fund II, L.P. | | $ | 884 | | $ | 1,998 | | | 0.7 | % | | 2.2 | % |
Ares Credit Strategies Fund III, L.P. | | | 18 | | | — | | | 0.0 | % | | — | |
Ares Strategic Investment Partners, L.P. | | | 77 | | | — | | | 0.1 | % | | — | |
Ares Strategic Investment Partners III, L.P. | | | 2,757 | | | 2,714 | | | 2.3 | % | | 3.0 | % |
Ares Corporate Opportunities Fund, L.P.(1) | | | 1,116 | | | 1,009 | | | 0.9 | % | | 1.1 | % |
Ares Special Situations Fund III, L.P. | | | 26,235 | | | 24,253 | | | 21.6 | % | | 27.2 | % |
Ares SSF Riopelle, L.P. | | | 2,223 | | | — | | | 1.8 | % | | — | |
Ares Enhanced Loan Investment Strategy IX, L.P. | | | 517 | | | 512 | | | 0.4 | % | | 0.6 | % |
Ares Europe CSF Fund (C) LP | | | 581 | | | 301 | | | 0.5 | % | | 0.3 | % |
Ares Multi-Strategy Credit Fund V (H), L.P. | | | 1,054 | | | 1,022 | | | 0.9 | % | | 1.1 | % |
AREA European Property Enhancement Program L.P. | | | 1,344 | | | 1,735 | | | 1.1 | % | | 1.9 | % |
AREA Sponsor Holdings LLC | | | 32,294 | | | 31,560 | | | 26.6 | % | | 35.4 | % |
Resolution Life L.P. | | | 39,955 | | | 21,846 | | | 32.8 | % | | 24.4 | % |
Ares Strategic Real Estate Program—HHC, LLC | | | 1,256 | | | 1,227 | | | 1.0 | % | | 1.4 | % |
Ares Capital Europe II (D), L.P. | | | 10,010 | | | — | | | 8.2 | % | | — | |
Ares Capital Europe II (E), L.P. | | | 21 | | | — | | | 0.0 | % | | — | |
| | | | | | | | | | |
| | | | | | | | | | | | | | |
Total private investment partnership interests (cost: $96,023 and $68,580 at March 31, 2014 and December 31, 2013, respectively) | | | 120,342 | | | 88,177 | | | 98.9 | % | | 98.6 | % |
| | | | | | | | | | |
| | | | | | | | | | | | | | |
Common Stock: | | | | | | | | | | | | | |
Ares Multi-Strategy Credit Fund, Inc. | | | 92 | | | 89 | | | 0.1 | % | | 0.1 | % |
| | | | | | | | | | |
| | | | | | | | | | | | | | |
Total common stock (cost: $100 and $100 at March 31, 2014 and December 31, 2013, respectively) | | | 92 | | | 89 | | | 0.1 | % | | 0.1 | % |
| | | | | | | | | | |
| | | | | | | | | | | | | | |
Corporate Bonds: | | | | | | | | | | | | | |
Ares Commercial Real Estate Corporation Convertible Senior Notes | | | 1,174 | | | 1,172 | | | 1.0 | % | | 1.3 | % |
| | | | | | | | | | |
| | | | | | | | | | | | | | |
Total corporate bond (cost: $1,150 and $1,150, at March 31, 2014 and December 31, 2013, respectively) | | | 1,174 | | | 1,172 | | | 1.0 | % | | 1.3 | % |
| | | | | | | | | | |
| | | | | | | | | | | | | | |
Total investments (cost: $97,273 and $69,830 at March 31, 2014 and December 31, 2013, respectively) | | $ | 121,608 | | $ | 89,438 | | | 100.0 | % | | 100.0 | % |
| | | | | | | | | | |
| | | | | | | | | | | | | | |
| | | | | | | | | | | | | | |
| | | | | | | | | | |
- (1)
- Security represents the sole underlying investment within ACOF Co-Investors LLC.
20
Table of Contents
ARES HOLDINGS INC. AND ARES INVESTMENTS LLC
(Predecessors to Ares Management, L.P.)
Notes to the Combined and Consolidated Financial Statements (Continued)
For the Three Months Ended March 31, 2014 and 2013
and as of March 31, 2014 and December 31, 2013
(unaudited)
(Dollars in Thousands, Except Share Data and as Otherwise Noted)
4. INVESTMENTS (Continued)
Investments held in the Consolidated Funds are summarized below:
| | | | | | | | | | | | | |
| | Fair value at | | Fair value as a
percentage of total
investments at | |
|---|
| | March 31,
2014 | | December 31,
2013 | | March 31,
2014 | | December 31,
2013 | |
|---|
United States: | | | | | | | | | | | | | |
Fixed income securities: | | | | | | | | | | | | | |
Consumer discretionary | | $ | 4,036,222 | | $ | 4,146,611 | | | 20.8 | % | | 20.0 | % |
Consumer staples | | | 179,326 | | | 338,735 | | | 0.9 | % | | 1.6 | % |
Energy | | | 507,527 | | | 535,857 | | | 2.6 | % | | 2.6 | % |
Financials | | | 579,374 | | | 544,879 | | | 3.0 | % | | 2.6 | % |
Healthcare, education and childcare | | | 1,072,158 | | | 1,176,418 | | | 5.5 | % | | 5.6 | % |
Industrials | | | 2,009,958 | | | 2,038,390 | | | 10.4 | % | | 9.8 | % |
Information technology | | | 490,988 | | | 542,377 | | | 2.5 | % | | 2.6 | % |
Materials | | | 338,512 | | | 463,864 | | | 1.7 | % | | 2.2 | % |
Telecommunication services | | | 1119,397 | | | 1,153,691 | | | 5.7 | % | | 5.5 | % |
Utilities | | | 235,137 | | | 222,410 | | | 1.2 | % | | 1.1 | % |
| | | | | | | | | | |
| | | | | | | | | | | | | | |
Total fixed income securities (cost: $10,511,946 and $11,071,982, at March 31, 2014 and December 31, 2013, respectively) | | | 10,568,599 | | | 11,163,232 | | | 54.3 | % | | 53.6 | % |
| | | | | | | | | | |
| | | | | | | | | | | | | | |
Equity securities: | | | | | | | | | | | | | |
Consumer discretionary | | | 2,327,631 | | | 2,464,520 | | | 12.0 | % | | 11.9 | % |
Consumer staples | | | 252,157 | | | 201,059 | | | 1.3 | % | | 1.0 | % |
Energy | | | 191,165 | | | 193,946 | | | 1.0 | % | | 1.0 | % |
Financials | | | 7,069 | | | 6,172 | | | 0.0 | % | | 0.0 | % |
Healthcare, education and childcare | | | 316,317 | | | 296,817 | | | 1.6 | % | | 1.5 | % |
Industrials | | | 133,071 | | | 134,544 | | | 0.7 | % | | 0.6 | % |
Materials | | | 1 | | | 31 | | | 0.0 | % | | 0.0 | % |
Partnership and LLC interests | | | 43,993 | | | 41,001 | | | 0.2 | % | | 0.2 | % |
Telecommunication services | | | 32,934 | | | 51,921 | | | 0.2 | % | | 0.2 | % |
| | | | | | | | | | |
| | | | | | | | | | | | | | |
Total equity securities (cost: $2,548,496 and $2,733,448 at March 31, 2014 and December 31, 2013, respectively) | | | 3,304,338 | | | 3,390,011 | | | 17.0 | % | | 16.4 | % |
| | | | | | | | | | |
| | | | | | | | | | | | | | |
21
Table of Contents
ARES HOLDINGS INC. AND ARES INVESTMENTS LLC
(Predecessors to Ares Management, L.P.)
Notes to the Combined and Consolidated Financial Statements (Continued)
For the Three Months Ended March 31, 2014 and 2013
and as of March 31, 2014 and December 31, 2013
(unaudited)
(Dollars in Thousands, Except Share Data and as Otherwise Noted)
4. INVESTMENTS (Continued)
| | | | | | | | | | | | | |
| | Fair value at | | Fair value as a
percentage of total
investments at | |
|---|
| | March 31,
2014 | | December 31,
2013 | | March 31,
2014 | | December 31,
2013 | |
|---|
Europe: | | | | | | | | | | | | | |
Fixed income securities: | | | | | | | | | | | | | |
Consumer discretionary | | | 1,381,696 | | | 1,858,364 | | | 7.2 | % | | 8.9 | % |
Consumer staples | | | 189,839 | | | 175,440 | | | 1.0 | % | | 0.8 | % |
Energy | | | 17,293 | | | 4,906 | | | 0.1 | % | | 0.0 | % |
Financials | | | 434,952 | | | 322,355 | | | 2.2 | % | | 1.5 | % |
Healthcare, education and childcare | | | 341,277 | | | 410,726 | | | 1.8 | % | | 2.0 | % |
Industrials | | | 442,971 | | | 485,243 | | | 2.3 | % | | 2.3 | % |
Information technology | | | 106,368 | | | 140,976 | | | 0.5 | % | | 0.7 | % |
Materials | | | 295,924 | | | 328,867 | | | 1.5 | % | | 1.6 | % |
Telecommunication services | | | 881,047 | | | 944,800 | | | 4.5 | % | | 4.5 | % |
Utilities | | | 7,205 | | | 37,001 | | | 0.0 | % | | 0.2 | % |
| | | | | | | | | | |
| | | | | | | | | | | | | | |
Total fixed income securities (cost: $4,023,703 and $4,747,808 at March 31, 2014 and December 31, 2013, respectively) | | | 4,098,572 | | | 4,708,678 | | | 21.1 | % | | 22.5 | % |
| | | | | | | | | | |
| | | | | | | | | | | | | | |
Equity securities: | | | | | | | | | | | | | |
Consumer discretionary | | | 9,924 | | | 10,686 | | | 0.1 | % | | 0.1 | % |
Consumer staples | | | 762 | | | 668 | | | 0.0 | % | | 0.0 | % |
Healthcare, education and childcare | | | 28,075 | | | 28,607 | | | 0.1 | % | | 0.1 | % |
Industrials | | | 86 | | | 8,595 | | | 0.0 | % | | 0.0 | % |
Materials | | | 34 | | | 773 | | | 0.0 | % | | 0.0 | % |
Telecommunication services | | | 1,937 | | | 1,524 | | | 0.0 | % | | 0.0 | % |
| | | | | | | | | | |
| | | | | | | | | | | | | | |
Total equity securities (cost: $79,206 and $83,277 at March 31, 2014 and December 31, 2013, respectively) | | | 40,818 | | | 50,853 | | | 0.2 | % | | 0.2 | % |
| | | | | | | | | | |
| | | | | | | | | | | | | | |
Asia and other: | | | | | | | | | | | | | |
Fixed income securities: | | | | | | | | | | | | | |
Consumer discretionary | | | 41,216 | | | 43,538 | | | 0.2 | % | | 0.2 | % |
Financials | | | 457,245 | | | 456,463 | | | 2.3 | % | | 2.2 | % |
Healthcare, education and childcare | | | 14,543 | | | 14,556 | | | 0.1 | % | | 0.1 | % |
Information Technology | | | 22,247 | | | 22,012 | | | 0.1 | % | | 0.1 | % |
Materials | | | 16,212 | | | 15,885 | | | 0.1 | % | | 0.1 | % |
Telecommunication services | | | 80,872 | | | 81,978 | | | 0.4 | % | | 0.4 | % |
| | | | | | | | | | |
| | | | | | | | | | | | | | |
Total fixed income securities (cost: $570,815 and $593,188, at March 31, 2014 and December 31, 2013, respectively) | | | 632,335 | | | 634,432 | | | 3.2 | % | | 3.1 | % |
| | | | | | | | | | |
| | | | | | | | | | | | | | |
Equity securities: | | | | | | | | | | | | | |
Consumer staples | | | 30,874 | | | 77,572 | | | 0.2 | % | | 0.4 | % |
Healthcare, education and childcare | | | 33,610 | | | 23,493 | | | 0.2 | % | | 0.1 | % |
Materials | | | 52,947 | | | 52,947 | | | 0.3 | % | | 0.3 | % |
Partnership and LLC interests | | | 8,825 | | | — | | | 0.0 | % | | 0.3 | % |
Utilities | | | 10,203 | | | 4,724 | | | 0.1 | % | | 0.0 | % |
| | | | | | | | | | |
| | | | | | | | | | | | | | |
Total equity securities (cost: $118,859 and $135,631 at March 31, 2014 and December 31, 2013, respectively) | | | 136,459 | | | 158,736 | | | 0.8 | % | | 0.8 | % |
| | | | | | | | | | |
| | | | | | | | | | | | | | |
22
Table of Contents
ARES HOLDINGS INC. AND ARES INVESTMENTS LLC
(Predecessors to Ares Management, L.P.)
Notes to the Combined and Consolidated Financial Statements (Continued)
For the Three Months Ended March 31, 2014 and 2013
and as of March 31, 2014 and December 31, 2013
(unaudited)
(Dollars in Thousands, Except Share Data and as Otherwise Noted)
4. INVESTMENTS (Continued)
| | | | | | | | | | | | | |
| | Fair value at | | Fair value as a
percentage of total
investments at | |
|---|
| | March 31,
2014 | | December 31,
2013 | | March 31,
2014 | | December 31,
2013 | |
|---|
Canada: | | | | | | | | | | | | | |
Fixed income securities: | | | | | | | | | | | | | |
Consumer discretionary | | | 113,336 | | | 121,132 | | | 0.6 | % | | 0.6 | % |
Energy | | | 92,273 | | | 87,469 | | | 0.5 | % | | 0.4 | % |
Healthcare, education and childcare | | | 78,570 | | | 104,464 | | | 0.4 | % | | 0.5 | % |
Industrials | | | 16,308 | | | 16,331 | | | 0.1 | % | | 0.1 | % |
Telecommunication services | | | 143,770 | | | 142,374 | | | 0.7 | % | | 0.7 | % |
| | | | | | | | | | |
| | | | | | | | | | | | | | |
Total fixed income securities (cost: $448,124 and $480,231at March 31, 2014 and December 31, 2013, respectively) | | | 444,257 | | | 471,770 | | | 2.3 | % | | 2.3 | % |
| | | | | | | | | | |
| | | | | | | | | | | | | | |
Equity securities: | | | | | | | | | | | | | |
Consumer discretionary | | | 901 | | | 892 | | | 0.0 | % | | 0.0 | % |
Energy | | | 34,125 | | | 51,187 | | | 0.2 | % | | 0.2 | % |
| | | | | | | | | | |
| | | | | | | | | | | | | | |
Total equity securities (cost: $75,256 and $75,256 at March 31, 2014 and December 31, 2013, respectively) | | | 35,026 | | | 52,079 | | | 0.2 | % | | 0.2 | % |
| | | | | | | | | | |
| | | | | | | | | | | | | | |
Australia: | | | | | | | | | | | | | |
Fixed income securities: | | | | | | | | | | | | | |
Consumer discretionary | | | — | | | 203 | | | — | | | 0.0 | % |
Energy | | | 43,433 | | | — | | | 0.0 | % | | — | |
Industrials | | | 97,605 | | | 99,376 | | | 0.5 | % | | 0.5 | % |
Telecommunication services | | | | | | — | | | — | | | — | |
Utilities | | | 67,715 | | | 68,513 | | | 0.3 | % | | 0.3 | % |
| | | | | | | | | | |
| | | | | | | | | | | | | | |
Total fixed income securities (cost: $208,979 and $169,831 at March 31, 2014 and December 31, 2013, respectively) | | | 208,753 | | | 168,092 | | | 0.8 | % | | 0.8 | % |
| | | | | | | | | | |
| | | | | | | | | | | | | | |
Equity Securities: | | | | | | | | | | | | | |
Telecommunication services | | | 10,860 | | | 16,102 | | | 0.1 | % | | 0.1 | % |
Utilities | | | 5,050 | | | 9,353 | | | 0.0 | % | | 0.0 | % |
| | | | | | | | | | |
| | | | | | | | | | | | | | |
Total equity securities (cost: $22,545 and $30,140 at March 31, 2014 and December 31, 2013, respectively) | | | 15,910 | | | 25,455 | | | 0.1 | % | | 0.1 | % |
| | | | | | | | | | |
| | | | | | | | | | | | | | |
Total fixed income securities | | | 15,952,516 | | | 17,146,204 | | | 81.7 | % | | 82.3 | % |
| | | | | | | | | | |
| | | | | | | | | | | | | | |
Total equity securities | | | 3,532,551 | | | 3,677,134 | | | 18.3 | % | | 17.7 | % |
| | | | | | | | | | |
| | | | | | | | | | | | | | |
Total Investments, at fair value | | $ | 19,485,067 | | $ | 20,823,338 | | | 100.0 | % | | 100.0 | % |
| | | | | | | | | | |
| | | | | | | | | | | | | | |
| | | | | | | | | | | | | | |
| | | | | | | | | | |
Securities sold short, at fair value | | $ | — | | $ | (1,633 | ) | | | | | | |
| | | | | | | | | | | | |
| | | | | | | | | | | | | | |
| | | | | | | | | | | | | | |
| | | | | | | | | | | | |
At March 31, 2014 and December 31, 2013, no single issuer or investment, including derivative instruments and underlying portfolio investments of the Consolidated Funds, had a fair value that exceeded 5.0% of the Company's total consolidated net assets.
23
Table of Contents
ARES HOLDINGS INC. AND ARES INVESTMENTS LLC
(Predecessors to Ares Management, L.P.)
Notes to the Combined and Consolidated Financial Statements (Continued)
For the Three Months Ended March 31, 2014 and 2013
and as of March 31, 2014 and December 31, 2013
(unaudited)
(Dollars in Thousands, Except Share Data and as Otherwise Noted)
5. FAIR VALUE
U.S. GAAP establishes a hierarchal disclosure framework which prioritizes the inputs used in measuring financial instruments at fair value into three levels based on their market observability. Market price observability is affected by a number of factors, including the type of instrument and the characteristics specific to the instrument. Financial instruments with readily available quoted prices from an active market or for which fair value can be measured based on actively quoted prices generally will have a higher degree of market price observability and a lesser degree of judgment inherent in measuring fair value.
Financial assets and liabilities measured and reported at fair value are classified as follows:
- •
- Level I—Quoted unadjusted prices for identical instruments in active markets to which the Company has access at the date of measurement.
- •
- Level II—Quoted prices for similar instruments in active markets; quoted prices for identical or similar instruments in markets that are not active; and model-derived valuations in which all significant inputs are directly or indirectly observable. Level II inputs include prices in markets for which there are few transactions, prices that are not current, prices for which little public information exists or prices that vary substantially over time or among brokered market makers. Other inputs include interest rates, yield curves, volatilities, prepayment risks, loss severities, credit risks and default rates.
- •
- Level III—Model-derived valuations for which one or more significant inputs are unobservable. These inputs reflect the Company's assessment of the assumptions that market participants use to value the investment based on the best available information.
In some instances, an instrument may fall into different levels of the fair value hierarchy. In such instances, the instrument's level within the fair value hierarchy is based on the lowest of the three levels (with Level III being the lowest) that is significant to the fair value measurement. The Company's assessment of the significance of an input requires judgment and considers factors specific to the instrument. The Company accounts for the transfer of assets into or out of each fair value hierarchy level as of the beginning of the reporting period.
Investment / Liability Valuations
The valuation techniques used by the Company to measure fair value maximize the use of observable inputs and minimize the use of unobservable inputs. The valuation techniques applied to the Consolidated Funds and AIH LLC vary depending on the nature of the investment.
CLO loan obligations: The Company has elected the fair value option to measure the CLO loan obligations at fair value as the Company has determined that measurement of the loan obligations issued by the CLOs at fair value better correlates with the value of the assets held by the CLOs, which are held to provide the cash flows for the note obligations.
24
Table of Contents
ARES HOLDINGS INC. AND ARES INVESTMENTS LLC
(Predecessors to Ares Management, L.P.)
Notes to the Combined and Consolidated Financial Statements (Continued)
For the Three Months Ended March 31, 2014 and 2013
and as of March 31, 2014 and December 31, 2013
(unaudited)
(Dollars in Thousands, Except Share Data and as Otherwise Noted)
5. FAIR VALUE (Continued)
The fair value of CLO liabilities is estimated based on various valuation models of third party pricing services as well as internal models. The valuation models generally utilize discounted cash flows and take into consideration prepayment and loss assumptions, based on historical experience and projected performance, economic factors, the characteristics and condition of the underlying collateral, comparable yields for similar securities and recent trading activity. These securities are classified as Level III.
Corporate debt, bonds, bank loans, securities sold short and derivative instruments: The fair value of corporate debt, bonds, bank loans, securities sold short and derivative instruments is estimated based on quoted market prices, dealer quotations or alternative pricing sources supported by observable inputs. These investments are generally classified within Level II. The Company obtains prices from independent pricing services that generally utilize broker quotes and may use various other pricing techniques which take into account appropriate factors such as yield, quality, coupon rate, maturity, type of issue, trading characteristics and other data. If the pricing services are only able to obtain a single broker quote or utilize a pricing model, such securities will be classified as Level III. If the pricing services are unable to provide prices, the Company will attempt to obtain one or more broker quotes directly from a dealer, price such securities at the last bid price obtained and classify such securities as Level III.
Equity and equity-related securities: Securities traded on a national securities exchange are stated at the last reported sales price on the day of valuation. To the extent these securities are actively traded and valuation adjustments are not applied, they are classified as Level I. Securities that trade in markets that are not considered to be active but are valued based on quoted market prices, dealer quotations or alternative pricing sources supported by observable inputs obtained by the Company from independent pricing services are classified as Level II.
Partnership interests: In accordance withASU 2009-12,Investments in Certain Entities that Calculate Net Asset Value per Share (or its Equivalent), the Company generally values its investments using the net asset value ("NAV") per share equivalent calculated by the investment manager as a practical expedient to determining an independent fair value or estimates based on various valuation models of third-party pricing services, as well as internal models. Such valuations are classified as Level II to the extent the investments are currently redeemable; if the investments are subject to a lock-up period, they are classified as Level III.
Certain investments of AIH and the Consolidated Funds are valued at NAV per share of the fund. In limited circumstances, the Company may determine, based on its own due diligence and investment procedures, that NAV per share does not represent fair value. In such circumstances, the Company will estimate the fair value in good faith and in a manner that it reasonably chooses, in accordance with the requirements of GAAP. However, for the three months ended March 31, 2014, the Company believes that NAV per share represents the fair value of the investments.
The substantial majority of the Company's comingled funds are closed-ended, and accordingly, do not permit investors to redeem their interest other than in limited circumstances that are beyond the control of
25
Table of Contents
ARES HOLDINGS INC. AND ARES INVESTMENTS LLC
(Predecessors to Ares Management, L.P.)
Notes to the Combined and Consolidated Financial Statements (Continued)
For the Three Months Ended March 31, 2014 and 2013
and as of March 31, 2014 and December 31, 2013
(unaudited)
(Dollars in Thousands, Except Share Data and as Otherwise Noted)
5. FAIR VALUE (Continued)
the Company, such as instances in which retaining the limited partnership interest could cause the limited partner to violate a law, regulation or rule. Investors in open ended and evergreen funds generally have the right to withdraw their capital, subject to the terms of the respective limited partnership agreements, over periods ranging from one month to three years. In addition, separately managed investment vehicles for a single fund investor may allow such investors to terminate the fund at the discretion of the investor pursuant to the terms of the applicable constituent documents of such vehicle.
In the absence of observable market prices, the Company values Level III investments using consistent valuation methodologies, typically market- or income-based approaches. The main inputs into the Company's valuation model for Level III securities include earnings multiples (based on the historical earnings of the issuer) and discounted cash flows. The Company may also consider original transaction price, recent transactions in the same or similar instruments, completed third-party transactions in comparable instruments and other liquidity, credit and market risk factors. The quarterly valuation process for Level III investments begins with each investment or loan being valued by the investment or valuation teams. The valuations are then reviewed and approved by the valuation committee, which consists of senior members of the investment team and other senior managers. All Level III investment values are ultimately approved by the valuation committees and designated investment professionals. For certain investments, the valuation process also includes a review by independent valuation parties, at least annually, to determine whether the fair values determined by management are reasonable. Results of the valuation process are evaluated each quarter, including an assessment of whether the underlying calculations should be adjusted. In connection with this process, the Company evaluates changes in fair-value measurements from period to period for reasonableness, considering items such as industry trends, general economic and market conditions and factors specific to the investment.
Certain Level III assets are valued using prices obtained from brokers or pricing vendors. The Company obtains an average of one to two broker non-binding quotes. The Company seeks to obtain at least one quote directly from a broker making a market for the asset and one price from a pricing vendor for each security or similar securities. These investments are classified as Level III because the quoted prices may be indicative in nature for securities that are in an inactive market, may be for similar securities or may require adjustment for investment-specific factors or restrictions. Generally, the Company does not adjust any of the prices received from these sources but material prices are reviewed against the Company's valuation models with a limited exception for securities that are deemed to have no value. The Company evaluates the prices obtained from brokers and pricing vendors based on available market information, including trading activity of the subject or similar securities or by performing a comparable security analysis to ensure that fair values are reasonably estimated. The Company may also perform back-testing of valuation information obtained from brokers and pricing vendors against actual prices received in transactions to validate pricing discrepancies. In addition to on-going monitoring and back-testing, the Company performs due diligence procedures over pricing vendors to understand their methodology and controls to support their use in the valuation process and to ensure compliance with required accounting disclosures.
26
Table of Contents
ARES HOLDINGS INC. AND ARES INVESTMENTS LLC
(Predecessors to Ares Management, L.P.)
Notes to the Combined and Consolidated Financial Statements (Continued)
For the Three Months Ended March 31, 2014 and 2013
and as of March 31, 2014 and December 31, 2013
(unaudited)
(Dollars in Thousands, Except Share Data and as Otherwise Noted)
5. FAIR VALUE (Continued)
Fair Value of Financial Instruments Held by the Company and Consolidated Funds
The table below summarizes the valuation of investments and other financial instruments by fair value hierarchy levels as of March 31, 2014:
Investments of the Company
| | | | | | | | | | | | | |
| | Level I | | Level II | | Level III | | Total | |
|---|
Investments, at fair value | | | | | | | | | | | | | |
Equity securities | | $ | 92 | | $ | — | | $ | — | | $ | 92 | |
Bonds | | | — | | | 1,174 | | | — | | | 1,174 | |
Partnership interests | | | — | | | — | | | 120,342 | | | 120,342 | |
| | | | | | | | | | |
| | | | | | | | | | | | | | |
Total investments, at fair value | | | 92 | | | 1,174 | | | 120,342 | | | 121,608 | |
| | | | | | | | | | |
| | | | | | | | | | | | | | |
Derivative assets, at fair value | | | | | | | | | | | | | |
Forward foreign currency contracts | | | — | | | 367 | | | — | | | 367 | |
Purchased option contracts | | | — | | | 765 | | | — | | | 765 | |
| | | | | | | | | | |
| | | | | | | | | | | | | | |
Total derivative assets, at fair value | | | — | | | 1,132 | | | — | | | 1,132 | |
| | | | | | | | | | |
| | | | | | | | | | | | | | |
Total | | $ | 92 | | $ | 2,306 | | $ | 120,342 | | $ | 122,740 | |
| | | | | | | | | | |
| | | | | | | | | | | | | | |
| | | | | | | | | | | | | | |
| | | | | | | | | | |
Derivative liabilities, at fair value | | | | | | | | | | | | | |
Forward foreign currency contracts | | $ | — | | $ | (1,745 | ) | $ | — | | $ | (1,745 | ) |
Interest rate contracts | | | — | | | (1,197 | ) | | — | | | (1,197 | ) |
| | | | | | | | | | |
| | | | | | | | | | | | | | |
Total derivative liabilities, at fair value | | $ | — | | $ | (2,942 | ) | $ | — | | $ | (2,942 | ) |
| | | | | | | | | | |
| | | | | | | | | | | | | | |
| | | | | | | | | | | | | | |
| | | | | | | | | | |
27
Table of Contents
ARES HOLDINGS INC. AND ARES INVESTMENTS LLC
(Predecessors to Ares Management, L.P.)
Notes to the Combined and Consolidated Financial Statements (Continued)
For the Three Months Ended March 31, 2014 and 2013
and as of March 31, 2014 and December 31, 2013
(unaudited)
(Dollars in Thousands, Except Share Data and as Otherwise Noted)
5. FAIR VALUE (Continued)
The table below summarizes the valuation of investments and other financial instruments by fair value hierarchy levels as of March 31, 2014:
Investments of Consolidated Funds
| | | | | | | | | | | | | |
| | Level I | | Level II | | Level III | | Total | |
|---|
Investments, at fair value | | | | | | | | | | | | | |
Equity securities | | $ | 112,075 | | $ | 538,158 | | $ | 2,825,221 | | $ | 3,475,454 | |
Bonds | | | — | | | 1,466,070 | | | 1,477,844 | | | 2,943,914 | |
Loans | | | — | | | 11,448,952 | | | 983,174 | | | 12,432,126 | |
Collateralized loan obligations | | | — | | | — | | | 567,846 | | | 567,846 | |
Partnership interests | | | — | | | — | | | 43,993 | | | 43,993 | |
Other | | | — | | | 19,141 | | | 2,593 | | | 21,734 | |
| | | | | | | | | | |
| | | | | | | | | | | | | | |
Total investments, at fair value | | | 112,075 | | | 13,472,321 | | | 5,900,671 | | | 19,485,067 | |
| | | | | | | | | | |
| | | | | | | | | | | | | | |
Derivative assets, at fair value | | | | | | | | | | | | | |
Interest rate contracts | | | — | | | 0 | | | — | | | 0 | |
Credit contracts | | | — | | | 6,272 | | | 2,330 | | | 8,602 | |
Equity contracts | | | — | | | 244 | | | — | | | 244 | |
Foreign exchange contracts | | | — | | | 115 | | | — | | | 115 | |
| | | | | | | | | | |
| | | | | | | | | | | | | | |
Total derivative assets, at fair value | | | — | | | 6,631 | | | 2,330 | | | 8,961 | |
| | | | | | | | | | |
| | | | | | | | | | | | | | |
Total | | $ | 112,075 | | $ | 13,478,952 | | $ | 5,903,001 | | $ | 19,494,028 | |
| | | | | | | | | | |
| | | | | | | | | | | | | | |
| | | | | | | | | | | | | | |
| | | | | | | | | | |
Derivative liabilities, at fair value | | | | | | | | | | | | | |
Forward foreign currency contracts | | $ | — | | $ | (2,544 | ) | $ | — | | $ | (2,544 | ) |
Written options | | | — | | | — | | | (78 | ) | | (78 | ) |
Credit contracts | | | — | | | (39,177 | ) | | (9,299 | ) | | (48,476 | ) |
Interest rate swaps | | | — | | | (2,545 | ) | | — | | | (2,545 | ) |
| | | | | | | | | | |
| | | | | | | | | | | | | | |
Total derivative liabilities, at fair value | | | — | | | (44,266 | ) | | (9,377 | ) | | (53,643 | ) |
Loan obligations of CLOs(1) | | | — | | | — | | | (11,066,253 | ) | | (11,066,253 | ) |
| | | | | | | | | | |
| | | | | | | | | | | | | | |
Total liabilities | | $ | — | | $ | (44,266 | ) | $ | (11,075,630 | ) | $ | (11,119,896 | ) |
| | | | | | | | | | |
| | | | | | | | | | | | | | |
| | | | | | | | | | | | | | |
| | | | | | | | | | |
- (1)
- Ares Enhanced Loan Investment Strategy II, Ltd. has not elected to fair value its loan obligation and is therefore carried at cost of $209,604.
28
Table of Contents
ARES HOLDINGS INC. AND ARES INVESTMENTS LLC
(Predecessors to Ares Management, L.P.)
Notes to the Combined and Consolidated Financial Statements (Continued)
For the Three Months Ended March 31, 2014 and 2013
and as of March 31, 2014 and December 31, 2013
(unaudited)
(Dollars in Thousands, Except Share Data and as Otherwise Noted)
5. FAIR VALUE (Continued)
The table below summarizes the valuation of investments and other financial instruments by fair value hierarchy levels as of December 31, 2013:
Investments of the Company
| | | | | | | | | | | | | |
| | Level I | | Level II | | Level III | | Total | |
|---|
Investments, at fair value | | | | | | | | | | | | | |
Equity securities | | $ | 89 | | $ | — | | $ | — | | $ | 89 | |
Bonds | | | — | | | 1,172 | | | — | | | 1,172 | |
Partnership interests | | | — | | | — | | | 88,177 | | | 88,177 | |
| | | | | | | | | | |
| | | | | | | | | | | | | | |
Total investments, at fair value | | | 89 | | | 1,172 | | | 88,177 | | | 89,438 | |
| | | | | | | | | | |
| | | | | | | | | | | | | | |
Derivative assets, at fair value | | | | | | | | | | | | | |
Forward foreign currency contracts | | | — | | | 247 | | | — | | | 247 | |
Purchased option contracts | | | — | | | 917 | | | — | | | 917 | |
| | | | | | | | | | |
| | | | | | | | | | | | | | |
Total derivative assets, at fair value | | | — | | | 1,164 | | | — | | | 1,164 | |
| | | | | | | | | | |
| | | | | | | | | | | | | | |
Total | | $ | 89 | | $ | 2,336 | | $ | 88,177 | | $ | 90,602 | |
| | | | | | | | | | |
| | | | | | | | | | | | | | |
| | | | | | | | | | | | | | |
| | | | | | | | | | |
Derivative liabilities, at fair value | | | | | | | | | | | | | |
Forward foreign currency contracts | | $ | — | | $ | (1,653 | ) | $ | — | | $ | (1,653 | ) |
Interest rate contracts | | | — | | | (1,254 | ) | | — | | | (1,254 | ) |
| | | | | | | | | | |
| | | | | | | | | | | | | | |
Total derivative liabilities, at fair value | | $ | — | | $ | (2,907 | ) | $ | — | | $ | (2,907 | ) |
| | | | | | | | | | |
| | | | | | | | | | | | | | |
| | | | | | | | | | | | | | |
| | | | | | | | | | |
29
Table of Contents
ARES HOLDINGS INC. AND ARES INVESTMENTS LLC
(Predecessors to Ares Management, L.P.)
Notes to the Combined and Consolidated Financial Statements (Continued)
For the Three Months Ended March 31, 2014 and 2013
and as of March 31, 2014 and December 31, 2013
(unaudited)
(Dollars in Thousands, Except Share Data and as Otherwise Noted)
5. FAIR VALUE (Continued)
The table below summarizes the valuation of investments and other financial instruments by fair value hierarchy levels as of December 31, 2013:
Investments of Consolidated Funds
| | | | | | | | | | | | | |
| | Level I | | Level II | | Level III | | Total | |
|---|
Investments, at fair value | | | | | | | | | | | | | |
Equity securities | | $ | 166,535 | | $ | 482,568 | | $ | 2,958,232 | | $ | 3,607,335 | |
Bonds | | | — | | | 1,576,942 | | | 2,052,984 | | | 3,629,926 | |
Loans | | | — | | | 11,868,584 | | | 1,058,635 | | | 12,927,219 | |
Collateralized loan obligations | | | — | | | 65,405 | | | 515,534 | | | 580,939 | |
Partnership interests | | | — | | | — | | | 41,001 | | | 41,001 | |
Other | | | — | | | 34,546 | | | 2,372 | | | 36,918 | |
| | | | | | | | | | |
| | | | | | | | | | | | | | |
Total investments, at fair value | | | 166,535 | | | 14,028,045 | | | 6,628,758 | | | 20,823,338 | |
| | | | | | | | | | |
| | | | | | | | | | | | | | |
Derivative assets, at fair value | | | | | | | | | | | | | |
Interest rate contracts | | | — | | | 8 | | | — | | | 8 | |
Credit contracts | | | — | | | 2,651 | | | — | | | 2,651 | |
Equity contracts | | | — | | | 179 | | | — | | | 179 | |
Foreign exchange contracts | | | — | | | 8,652 | | | — | | | 8,652 | |
Other financial instruments | | | — | | | — | | | 3,135 | | | 3,135 | |
| | | | | | | | | | |
| | | | | | | | | | | | | | |
Total derivative assets, at fair value | | | — | | | 11,490 | | | 3,135 | | | 14,625 | |
| | | | | | | | | | |
| | | | | | | | | | | | | | |
Total | | $ | 166,535 | | $ | 14,039,535 | | $ | 6,631,893 | | $ | 20,837,963 | |
| | | | | | | | | | |
| | | | | | | | | | | | | | |
| | | | | | | | | | | | | | |
| | | | | | | | | | |
Derivative liabilities, at fair value | | | | | | | | | | | | | |
Forward foreign currency contracts | | $ | — | | $ | (38,594 | ) | $ | (899 | ) | $ | (39,493 | ) |
Written options | | | — | | | (34 | ) | | — | | | (34 | ) |
Credit contracts | | | — | | | (25,754 | ) | | (1,633 | ) | | (27,387 | ) |
Interest rate swaps | | | — | | | (3,703 | ) | | (371 | ) | | (4,074 | ) |
Other financial instruments | | | — | | | (175 | ) | | (3,952 | ) | | (4,127 | ) |
| | | | | | | | | | |
| | | | | | | | | | | | | | |
Total derivative liabilities, at fair value | | | — | | | (68,260 | ) | | (6,855 | ) | | (75,115 | ) |
Loan obligations of CLOs(1) | | | — | | | — | | | (11,534,956 | ) | | (11,534,956 | ) |
Securities sold short, at fair value | | | — | | | (1,633 | ) | | — | | | (1,633 | ) |
| | | | | | | | | | |
| | | | | | | | | | | | | | |
Total liabilities | | $ | — | | $ | (69,893 | ) | $ | (11,541,811 | ) | $ | (11,611,704 | ) |
| | | | | | | | | | |
| | | | | | | | | | | | | | |
| | | | | | | | | | | | | | |
| | | | | | | | | | |
- (1)
- Ares Enhanced Loan Investment Strategy II, Ltd. has not elected to fair value its loan obligation and is therefore carried at cost of $239,201.
30
Table of Contents
ARES HOLDINGS INC. AND ARES INVESTMENTS LLC
(Predecessors to Ares Management, L.P.)
Notes to the Combined and Consolidated Financial Statements (Continued)
For the Three Months Ended March 31, 2014 and 2013
and as of March 31, 2014 and December 31, 2013
(unaudited)
(Dollars in Thousands, Except Share Data and as Otherwise Noted)
5. FAIR VALUE (Continued)
The following tables set forth a summary of changes in the fair value of the Level III investments for the three months ended March 31, 2014:
| | | | | | | | | | |
| | For the Three Months Ended March 31, 2014
Investments of AIH LLC | |
|---|
| | Fixed Income | | Partnership Interests | | Total | |
|---|
Balance, beginning of period | | $ | — | | $ | 88,177 | | $ | 88,177 | |
Initial consolidation of new funds | | | — | | | 9,951 | | | 9,951 | |
Transfer out | | | — | | | — | | | — | |
Purchases | | | — | | | 21,504 | | | 21,504 | |
Sales | | | — | | | (23,124 | ) | | (23,124 | ) |
Realized and unrealized appreciation, net | | | — | | | 23,834 | | | 23,834 | |
| | | | | | | | |
| | | | | | | | | | | |
Balance, end of period | | $ | — | | $ | 120,342 | | $ | 120,342 | |
| | | | | | | | |
| | | | | | | | | | | |
| | | | | | | | | | | |
| | | | | | | | |
Changes in unrealized appreciation included in earnings related to financial assets still held at the reporting date | | $ | — | | $ | 4,286 | | $ | 4,286 | |
| | | | | | | | |
| | | | | | | | | | | |
| | | | | | | | | | | |
| | | | | | | | |
| | | | | | | | | | | | | | | | |
| | For the Three Months Ended March 31, 2014
Investments of Consolidated Funds | |
|---|
| | Equity
Securities | | Fixed
Income | | Partnership
Interests | | Other
Financial
Instruments | | Total | |
|---|
Balance, beginning of period | | $ | 2,958,232 | | $ | 3,627,153 | | $ | 41,001 | | $ | (1,348 | ) | $ | 6,625,038 | |
Initial consolidation of new funds | | | 8,152 | | | — | | | — | | | — | | | 8,152 | |
Deconsolidation of previous funds | | | — | | | (378,397 | ) | | — | | | — | | | (378,397 | ) |
Transfer in | | | — | | | 222,382 | | | — | | | — | | | 222,382 | |
Transfer out | | | — | | | (364,608 | ) | | — | | | — | | | (364,608 | ) |
Purchases | | | 11,337 | | | 215,514 | | | 2,276 | | | 5 | | | 229,132 | |
Sales | | | (167,142 | ) | | (274,491 | ) | | — | | | (6,387 | ) | | (448,020 | ) |
Accrued discounts/premiums | | | 15 | | | 10,849 | | | — | | | (0 | ) | | 10,864 | |
Realized and unrealized appreciation (depreciation), net | | | 14,627 | | | (29,540 | ) | | 717 | | | 3,277 | | | (10,919 | ) |
| | | | | | | | | | | | |
| | | | | | | | | | | | | | | | | |
Balance, end of period | | $ | 2,825,221 | | $ | 3,028,862 | | $ | 43,994 | | $ | (4,453 | ) | $ | 5,893,624 | |
| | | | | | | | | | | | |
| | | | | | | | | | | | | | | | | |
| | | | | | | | | | | | | | | | | |
| | | | | | | | | | | | |
Changes in unrealized appreciation (depreciation) included in earnings related to financial assets still held at the reporting date | | $ | 118,757 | | $ | (21,711 | ) | $ | 717 | | $ | 1,102 | | $ | 98,865 | |
| | | | | | | | | | | | |
| | | | | | | | | | | | | | | | | |
| | | | | | | | | | | | | | | | | |
| | | | | | | | | | | | |
31
Table of Contents
ARES HOLDINGS INC. AND ARES INVESTMENTS LLC
(Predecessors to Ares Management, L.P.)
Notes to the Combined and Consolidated Financial Statements (Continued)
For the Three Months Ended March 31, 2014 and 2013
and as of March 31, 2014 and December 31, 2013
(unaudited)
(Dollars in Thousands, Except Share Data and as Otherwise Noted)
5. FAIR VALUE (Continued)
The following tables set forth a summary of changes in the fair value of the Level III investments for the year ended December 31, 2013:
| | | | | | | | | | |
| | For the Year Ended December 31, 2013
Investments of AIH LLC | |
|---|
| | Fixed Income | | Partnership Interests | | Total | |
|---|
Balance, beginning of period | | $ | 1,170 | | $ | 21,695 | | $ | 22,865 | |
Transfer out | | | (1,170 | ) | | — | | | (1,170 | ) |
Purchases | | | — | | | 51,329 | | | 51,329 | |
Sales | | | — | | | (2,447 | ) | | (2,447 | ) |
Realized and unrealized appreciation, net | | | — | | | 17,600 | | | 17,600 | |
| | | | | | | | |
| | | | | | | | | | | |
Balance, end of period | | $ | — | | $ | 88,177 | | $ | 88,177 | |
| | | | | | | | |
| | | | | | | | | | | |
| | | | | | | | | | | |
| | | | | | | | |
Changes in unrealized appreciation included in earnings related to financial assets still held at the reporting date | | $ | — | | $ | 16,816 | | $ | 16,816 | |
| | | | | | | | |
| | | | | | | | | | | |
| | | | | | | | | | | |
| | | | | | | | |
| | | | | | | | | | | | | | | | |
| | For the Year Ended December 31, 2013
Investments of Consolidated Funds | |
|---|
| | Equity Securities | | Fixed Income | | Partnership
Interests | | Other
Financial
Instruments | | Total | |
|---|
Balance, beginning of period | | $ | 1,978,138 | | $ | 3,920,451 | | $ | 6,177 | | $ | 5,202 | | $ | 5,909,968 | |
Initial consolidation of new funds | | | — | | | 29,570 | | | — | | | — | | | 29,570 | |
Transfer in | | | 74,438 | | | 237,312 | | | — | | | (29 | ) | | 311,721 | |
Transfer out | | | (52,573 | ) | | (249,763 | ) | | — | | | — | | | (302,336 | ) |
Purchases | | | 555,589 | | | 1,313,850 | | | 34,369 | | | 1,135 | | | 1,904,943 | |
Sales | | | (43,695 | ) | | (1,704,939 | ) | | (851 | ) | | (23,743 | ) | | (1,773,228 | ) |
Accrued discounts/premiums | | | — | | | 27,149 | | | — | | | 88 | | | 27,237 | |
Realized and unrealized appreciation (depreciation), net | | | 446,335 | | | 53,523 | | | 1,306 | | | 15,999 | | | 517,163 | |
| | | | | | | | | | | | |
| | | | | | | | | | | | | | | | | |
Balance, end of period | | $ | 2,958,232 | | $ | 3,627,153 | | $ | 41,001 | | $ | (1,348 | ) | $ | 6,625,038 | |
| | | | | | | | | | | | |
| | | | | | | | | | | | | | | | | |
| | | | | | | | | | | | | | | | | |
| | | | | | | | | | | | |
Changes in unrealized appreciation (depreciation) included in earnings related to financial assets still held at the reporting date | | $ | 417,659 | | $ | (26,038 | ) | $ | 1,306 | | $ | (4,896 | ) | $ | 388,031 | |
| | | | | | | | | | | | |
| | | | | | | | | | | | | | | | | |
| | | | | | | | | | | | | | | | | |
| | | | | | | | | | | | |
32
Table of Contents
ARES HOLDINGS INC. AND ARES INVESTMENTS LLC
(Predecessors to Ares Management, L.P.)
Notes to the Combined and Consolidated Financial Statements (Continued)
For the Three Months Ended March 31, 2014 and 2013
and as of March 31, 2014 and December 31, 2013
(unaudited)
(Dollars in Thousands, Except Share Data and as Otherwise Noted)
5. FAIR VALUE (Continued)
The following tables set forth a summary of changes in the fair value of the Level III investments for the three months ended March 31, 2013:
| | | | | | | | | | |
| | For the Three Months Ended March 31, 2013
Investments of AIH LLC | |
|---|
| | Fixed Income | | Partnership Interests | | Total | |
|---|
Balance, beginning of period | | $ | 1,170 | | $ | 21,695 | | $ | 22,865 | |
Transfer out | | | (1,170 | ) | | — | | | (1,170 | ) |
Purchases | | | — | | | 503 | | | 503 | |
Sales | | | — | | | (86 | ) | | (86 | ) |
Realized and unrealized appreciation (depreciation), net | | | — | | | 1,207 | | | 1,207 | |
| | | | | | | | |
| | | | | | | | | | | |
Balance, end of period | | $ | — | | $ | 23,319 | | $ | 23,319 | |
| | | | | | | | |
| | | | | | | | | | | |
| | | | | | | | | | | |
| | | | | | | | |
Changes in unrealized appreciation (depreciation) included in earnings related to financial assets still held at the reporting date | | $ | — | | $ | 1,179 | | $ | 1,179 | |
| | | | | | | | |
| | | | | | | | | | | |
| | | | | | | | | | | |
| | | | | | | | |
| | | | | | | | | | | | | | | | |
| | For the Three Months Ended March 31, 2013
Investments of Consolidated Funds | |
|---|
| | Equity Securities | | Fixed Income | | Partnership
Interests | | Other
Financial
Instruments | | Total | |
|---|
Balance, beginning of period | | $ | 1,978,138 | | $ | 3,920,451 | | $ | 6,177 | | $ | 5,202 | | $ | 5,909,968 | |
Initial consolidation of new funds | | | — | | | 28,471 | | | — | | | — | | | 28,471 | |
Transfer in | | | 135 | | | 362,811 | | | — | | | — | | | 362,946 | |
Transfer out | | | (8,725 | ) | | (316,201 | ) | | — | | | (2,420 | ) | | (327,346 | ) |
Purchases | | | 21,794 | | | 310,985 | | | 43 | | | (3,974 | ) | | 328,848 | |
Sales | | | (7,382 | ) | | (285,685 | ) | | — | | | (7,446 | ) | | (300,513 | ) |
Accrued discounts/premiums | | | — | | | 10,342 | | | — | | | 9 | | | 10,351 | |
Realized and unrealized appreciation (depreciation), net | | | 119,481 | | | (86,157 | ) | | (41 | ) | | 17,780 | | | 51,063 | |
| | | | | | | | | | | | |
| | | | | | | | | | | | | | | | | |
Balance, end of period | | $ | 2,103,441 | | $ | 3,945,017 | | $ | 6,179 | | $ | 9,151 | | $ | 6,063,788 | |
| | | | | | | | | | | | |
| | | | | | | | | | | | | | | | | |
| | | | | | | | | | | | | | | | | |
| | | | | | | | | | | | |
Changes in unrealized appreciation (depreciation) included in earnings related to financial assets still held at the reporting date | | $ | (1,441 | ) | $ | (35,663 | ) | $ | 1,307 | | $ | 5,657 | | $ | (30,140 | ) |
| | | | | | | | | | | | |
| | | | | | | | | | | | | | | | | |
| | | | | | | | | | | | | | | | | |
| | | | | | | | | | | | |
33
Table of Contents
ARES HOLDINGS INC. AND ARES INVESTMENTS LLC
(Predecessors to Ares Management, L.P.)
Notes to the Combined and Consolidated Financial Statements (Continued)
For the Three Months Ended March 31, 2014 and 2013
and as of March 31, 2014 and December 31, 2013
(unaudited)
(Dollars in Thousands, Except Share Data and as Otherwise Noted)
5. FAIR VALUE (Continued)
Total realized and unrealized appreciation (depreciation) recorded for AIH's Level III investments are included in net realized gain (loss) on investments and net change in unrealized appreciation (depreciation) on investments in the Combined and Consolidated Statements of Operations, respectively.
Total realized and unrealized appreciation (depreciation) recorded for the Consolidated Funds' Level III investments are included in net realized gain (loss) on investments of Consolidated Funds and net change in unrealized appreciation (depreciation) on investments of Consolidated Funds in the Combined and Consolidated Statements of Operations, respectively.
The Company recognizes transfers between the levels as of the beginning of the period. Transfers out of Level III were generally attributable to certain investments that experienced a more significant level of market activity during the period and thus were valued using observable inputs either from independent pricing services or multiple brokers. Transfers into Level III were generally attributable to certain investments that experienced a less significant level of market activity during the period and thus were only able to obtain one quote from a broker or independent pricing service. Transfers from Level I to Level II for the three months ended March 31, 2014 included $15.4 million due to restricted common stock received in exchange for an exchange-traded common equity investment upon the exercise of warrants.
The following table sets forth a summary of changes in the fair value of the Level III investments for the CLO loan obligations for the three months ended March 31, 2014 and the year ended December 31, 2013:
| | | | | | | |
| | For the Three Months
Ended March 31, 2014 | | For the Year Ended
December 31, 2013 | |
|---|
Balance, beginning of period | | $ | 11,534,956 | | $ | 9,422,570 | |
Equity appropriated for Consolidated Funds | | | — | | | 3,309,986 | |
Borrowings | | | 23,528 | | | 79,859 | |
Paydowns | | | (475,467 | ) | | (1,511,971 | ) |
Issuances | | | — | | | — | |
Realized and unrealized gains, net | | | (16,764 | ) | | 234,512 | |
| | | | | | |
| | | | | | | | |
Balance, end of period | | $ | 11,066,253 | | $ | 11,534,956 | |
| | | | | | |
| | | | | | | | |
| | | | | | | | |
| | | | | | |
34
Table of Contents
ARES HOLDINGS INC. AND ARES INVESTMENTS LLC
(Predecessors to Ares Management, L.P.)
Notes to the Combined and Consolidated Financial Statements (Continued)
For the Three Months Ended March 31, 2014 and 2013
and as of March 31, 2014 and December 31, 2013
(unaudited)
(Dollars in Thousands, Except Share Data and as Otherwise Noted)
5. FAIR VALUE (Continued)
The following tables summarize the quantitative inputs and assumptions used for the Company's Level III inputs as of March 31, 2014:
ARES INVESTMENTS HOLDINGS LLC
As of March 31, 2014
| | | | | | | | | |
Investments | | Fair
Value | | Valuation Technique(s) | | Unobservable
Input(s) | | Range |
|---|
Assets | | | | | | | | | |
Partnership interests | | $ | 120,342 | | NAV | | N/A | | N/A |
| | | | | | | | | |
| | | | | | | | | | |
Total | | $ | 120,342 | | | | | | |
| | | | | | | | | |
| | | | | | | | | | |
| | | | | | | | | | |
| | | | | | | | | |
35
Table of Contents
ARES HOLDINGS INC. AND ARES INVESTMENTS LLC
(Predecessors to Ares Management, L.P.)
Notes to the Combined and Consolidated Financial Statements (Continued)
For the Three Months Ended March 31, 2014 and 2013
and as of March 31, 2014 and December 31, 2013
(unaudited)
(Dollars in Thousands, Except Share Data and as Otherwise Noted)
5. FAIR VALUE (Continued)
CONSOLIDATED FUNDS
As of March 31, 2014
| | | | | | | | | | | | | |
Investments | | Fair Value | | Valuation Technique(s) | | Unobservable Input(s) | | Range | | Weighted
Average | |
|---|
Assets | | | | | | | | | | | | | |
Equity securities | | |
| | | | | | | | |
| |
Consumer discretionary | |
$ |
11,168 | | Broker quotes and/or 3rd party pricing services | �� | N/A | | N/A | | |
N/A | |
| | | 5,491 | | EV market multiple analysis | | EBITDA multiple | | 6.6x - 9.0x | | | 8.4x | |
| | | 1,035 | | Discounted cash flow | | Yield to worst | | 5.0% | | | 5.0 | % |
| | | 231,434 | | Market approach (comparable companies) | | Book value multiple | | 2.0x - 2.3x | | | 2.1x | |
| | | 1,228,877 | | Market approach (comparable companies) | | EBITDA multiple | | 7.5x - 15.0x | | | 10.6x | |
| | | 71,288 | | Market approach (comparable companies) | | Net income multiple | | 15.0x | | | 15.0x | |
| | | 1,112 | | Market approach (other) | | Other | | N/A | | | N/A | |
| | | 1,642 | | Other | | N/A | | N/A | | | N/A | |
| | | 4,961 | | Other | | Volume weighted average price | | 25.2x | | | 25.2x | |
| | | 1,478 | | Other | | Volume weighted average price / illiquidity discount | | 15%/25.2x | | | 15%/25.2x | |
| | | 250,000 | | Recent transaction price(1) | | N/A | | N/A | | | N/A | |
Consumer staples | | |
762 | | EV market multiple analysis | | EBITDA multiple | | 7.9x | | |
7.9x | |
| | | 221,864 | | Market approach (comparable companies) | | EBITDA multiple | | 6.0x - 8.0x | | | 7.5x | |
| | | 30,293 | | Market approach (comparable companies) | | Net income multiple | | 8.0x - 10.0x | | | 9.0x | |
Energy | | |
128,493 | | Market approach (comparable companies) | | EBITDA multiple | | 1.0x - 1.4x | | |
1.2x | |
| | | 34,125 | | Other | | N/A | | N/A | | | N/A | |
| | | 6,600 | | Option pricing model | | Volatility | | 26.0% | | | 26.0 | % |
Financials | | |
7,069 | | EV market multiple analysis | | EBITDA multiple | | 10.5x | | |
10.5x | |
Healthcare, education, and childcare | | |
28,075 | | EV market multiple analysis | | EBITDA multiple | | 7.8x - 19.7x | | |
7.3x | |
| | | 316,317 | | Market approach (comparable companies) | | EBITDA multiple | | 8.0x - 12.0x | | | 10.4x | |
| | | 33,610 | | Market approach (comparable companies) | | Net income multiple | | 30.0x - 40.0x | | | 35.0x | |
Industrials | | |
86 | | Broker quotes and/or 3rd party pricing services | | N/A | | N/A | | |
N/A | |
| | | 130,478 | | Market approach (comparable companies) | | EBITDA multiple | | 8.0x - 12.7x | | | 10.0x | |
Materials | | |
52,947 | | Market approach (comparable companies) | | Net income multiple | | 8.0x - 10.0x | | |
9.0x | |
Telecommunication services | | |
1,367 | | Broker quotes and/or 3rd party pricing services | | N/A | | N/A | | |
N/A | |
| | | 570 | | EV market multiple analysis | | EBITDA multiple | | 6.9x | | | 6.9x | |
Utilities | | |
15,253 | | Broker quotes and/or 3rd party pricing services | | N/A | | N/A | | |
N/A | |
Fixed Income | | |
| | | | | | | | |
| |
Consumer discretionary | | |
340,008 | | Broker quotes and/or 3rd party pricing services | | N/A | | N/A | | |
N/A | |
| | | 18,508 | | EV market multiple analysis | | EBITDA multiple | | 6.2x - 10.0x | | | 7.3x | |
| | | 6,741 | | Income approach (other) | | Yield to worst | | 4.8% - 5.8% | | | 5.3 | % |
| | | 115,076 | | Market approach (comparable companies) | | Book value multiple | | 2.0x - 2.3x | | | 2.1x | |
| | | 15,454 | | Market approach (comparable companies) | | EBITDA multiple | | 8.1x | | | 8.1x | |
| | | 783,465 | | Recent transaction price(1) | | N/A | | N/A | | | N/A | |
| | | 291,435 | | Yield analysis | | Market yield | | 2.5% - 13.0% | | | 9.9 | % |
Consumer staples | | |
515 | | Discounted cash flow | | Other | | 20.0% | | |
20.0 |
% |
| | | 4,297 | | Income approach (other) | | Yield | | 18.4% | | | 18.4 | % |
Energy | | |
66,912 | | Broker quotes and/or 3rd party pricing services | | N/A | | N/A | | |
N/A | |
| | | 11,888 | | Recent transaction price(1) | | N/A | | N/A | | | N/A | |
36
Table of Contents
ARES HOLDINGS INC. AND ARES INVESTMENTS LLC
(Predecessors to Ares Management, L.P.)
Notes to the Combined and Consolidated Financial Statements (Continued)
For the Three Months Ended March 31, 2014 and 2013
and as of March 31, 2014 and December 31, 2013
(unaudited)
(Dollars in Thousands, Except Share Data and as Otherwise Noted)
5. FAIR VALUE (Continued)
| | | | | | | | | | | | | |
Investments | | Fair Value | | Valuation Technique(s) | | Unobservable Input(s) | | Range | | Weighted
Average | |
|---|
Financials | | | 491,152 | | Broker quotes and/or 3rd party pricing services | | N/A | | N/A | | | N/A | |
| | | 74,439 | | Discounted cash flow | | Discount rate, Constant default rate, Recovery rate, prepayment rate | | 10.8%, 2.0%,
70.0%,
20.0% | | | 36.0 | % |
| | | 13,201 | | EV market multiple analysis | | EBITDA multiple | | 2.4x | | | 2.4x | |
| | | 287,824 | | Yield analysis | | Market yield | | 4.5% - 13.5% | | | 10.6 | % |
| | | 2,030 | | Income approach (other) | | Weighted average collection rate | | 1.2x | | | 1.2x | |
| | | 2,892 | | Recent transaction price(1) | | N/A | | N/A | | | N/A | |
Healthcare, education, and childcare | | |
57,847 | | Broker quotes and/or 3rd party pricing services | | N/A | | N/A | | |
N/A | |
| | | 5,959 | | EV market multiple analysis | | EBITDA multiple | | 32.0x | | | 32.0x | |
| | | 7,390 | | Income approach (other) | | Yield to worst | | 6.0% | | | 6.0 | % |
| | | 72,874 | | Yield analysis | | Market yield | | 6.0% - 10.0% | | | 7.5 | % |
Industrials | | |
83,495 | | Broker quotes and/or 3rd party pricing services | | N/A | | N/A | | |
N/A | |
| | | 5,075 | | Yield analysis | | Market yield | | 18.8% | | | 18.8 | % |
| | | 4,773 | | Income approach (other) | | Yield | | 4.8% - 5.6% | | | 5.3 | % |
| | | 31,018 | | Market approach (comparable companies) | | EBITDA multiple | | 10.0x - 12.7x | | | 11.4x | |
| | | 43,400 | | Yield analysis | | Market yield | | 2.5% - 12.8% | | | 8.9 | % |
Information technology | | |
18,410 | | Broker quotes and/or 3rd party pricing services | | N/A | | N/A | | |
N/A | |
| | | 39,748 | | Yield analysis | | Market yield | | 5.3% - 14.0% | | | 11.5 | % |
Materials | | |
31,369 | | Broker quotes and/or 3rd party pricing services | | N/A | | N/A | | |
N/A | |
| | | 14,850 | | Market approach (comparable companies) | | EBITDA multiple | | 8.0x - 10.0x | | | 9.3x | |
| | | 731 | | Market approach (comparable companies) | | Recovery rate | | 1.1% - 2.5% | | | 1.8 | % |
| | | 16,212 | | Yield analysis | | Market yield | | 6.0% - 13.0% | | | 8.8 | % |
Telecommunication services | | |
69,877 | | Broker quotes and/or 3rd party pricing services | | N/A | | N/A | | |
N/A | |
Partnership and LLC interests | | |
52,818 | | NAV | | N/A | | N/A | | |
N/A | |
Other | | |
2,593 | | Broker quotes and/or 3rd party pricing services | | N/A | | N/A | | |
N/A | |
Derivative instruments of Consolidated Funds | | |
2,330 | | Broker quotes and/or 3rd party pricing services | | N/A | | N/A | | |
N/A | |
| | | | | | | | | | | | | |
| | | | | | | | | | | | | | |
Total assets | | $ | 5,903,001 | | | | | | | | | | |
| | | | | | | | | | | | | |
| | | | | | | | | | | | | | |
| | | | | | | | | | | | | | |
| | | | | | | | | | | | | |
Liabilities | | | | | | | | | | | | | |
Loans payable of Consolidated Funds: | | | | | | | | | | | | | |
Fixed income | |
$ |
10,860,388 | | Broker quotes and/or 3rd party pricing services | | N/A | | N/A | | |
N/A | |
| | | 42,228 | | Discounted cash flow | | Discount Rate | | 10.7% | | | 10.7 | % |
| | | 163,637 | | Market approach (other) | | Other | | N/A | | | N/A | |
Derivatives instruments of Consolidated Funds | | |
9,377 | | Broker quotes and/or 3rd party pricing services | | N/A | | N/A | | |
N/A | |
| | | | | | | | | | | | | |
| | | | | | | | | | | | | | |
Total liabilities | | $ | 11,075,630 | | | | | | | | | | |
| | | | | | | | | | | | | |
| | | | | | | | | | | | | | |
| | | | | | | | | | | | | | |
| | | | | | | | | | | | | |
- (1)
- Recent transaction price consists of securities purchased or restructured within the last six months. The Company has determined that there has been no change to the valuation based on the underlying assumptions used at the closing of such transactions.
37
Table of Contents
ARES HOLDINGS INC. AND ARES INVESTMENTS LLC
(Predecessors to Ares Management, L.P.)
Notes to the Combined and Consolidated Financial Statements (Continued)
For the Three Months Ended March 31, 2014 and 2013
and as of March 31, 2014 and December 31, 2013
(unaudited)
(Dollars in Thousands, Except Share Data as Otherwise Noted)
5. FAIR VALUE (Continued)
The following tables summarize the quantitative inputs and assumptions used for the Company's Level III inputs as of December 31, 2013:
ARES INVESTMENTS HOLDINGS LLC
As of December 31, 2013
| | | | | | | | | |
Investments | | Fair
Value | | Valuation Technique(s) | | Unobservable
Input(s) | | Range |
|---|
Assets | | | | | | | | | |
Partnership interests | | $ | 88,177 | | NAV | | N/A | | N/A |
| | | | | | | | | |
| | | | | | | | | | |
Total | | $ | 88,177 | | | | | | |
| | | | | | | | | |
| | | | | | | | | | |
| | | | | | | | | | |
| | | | | | | | | |
CONSOLIDATED FUNDS
As of December 31, 2013
| | | | | | | | | | | | | |
Investments | | Fair
Value | | Valuation Technique(s) | | Unobservable Input(s) | | Range | | Weighted
Average | |
|---|
Assets | | | | | | | | | | | | | |
Equity securities | | | | | | | | | | | | | |
Consumer discretionary | | $ | 13,044 | | Broker quotes and/or 3rd party pricing services | | N/A | | N/A | | | N/A | |
| | | 6,146 | | EV market multiple analysis | | EBITDA multiple | | 6.2x - 18.0x | | | 9.3x | |
| | | 246,227 | | Market approach (comparable companies) | | Book value multiple | | 1.5x - 1.8x | | | 1.6x | |
| | | 1,162,641 | | Market approach (comparable companies) | | EBITDA multiple | | 7.5x - 15.0x | | | 10.6x | |
| | | 42,080 | | Market approach (comparable companies) | | Net income multiple | | 9.6x | | | 9.6x | |
| | | 1,114 | | Market approach (comparable companies) | | Yield to worst | | 5.0% | | | 5.0 | % |
| | | 1,557 | | Market approach (other) | | Other | | N/A | | | N/A | |
| | | 1,729 | | Other | | Other | | N/A | | | N/A | |
| | | 8,466 | | Other | | Volume weighted average price | | 25.2x | | | 25.2x | |
| | | 1,418 | | Other | | Volume weighted average
price / illiquidity discount | | 25.2x / 15% | | | 25.2x / 15 | % |
| | | 505,270 | | Recent transaction price(1) | | N/A | | N/A | | | N/A | |
Consumer staples | | | 668 | | EV market multiple analysis | | EBITDA multiple | | 7.9x | | | 7.9x | |
| | | 201,059 | | Market approach (comparable companies) | | EBITDA multiple | | 6.0x - 8.5x | | | 7.5x | |
| | | 25,000 | | Recent transaction price(1) | | N/A | | N/A | | | N/A | |
Energy | | | 119,344 | | Market approach (comparable companies) | | EBITDA multiple | | 1.0x - 1.4x | | | 1.2x | |
| | | 58,987 | | Other | | Other | | N/A | | | N/A | |
Financials | | | 6,172 | | EV market multiple analysis | | EBITDA multiple | | 10.5x | | | 10.5x | |
Healthcare, education, and childcare | | | 28,607 | | EV market multiple analysis | | EBITDA multiple | | 7.8x - 43.7x | | | 10.9x | |
| | | 296,817 | | Market approach (comparable companies) | | EBITDA multiple | | 8.0x - 12.0x | | | 10.5x | |
| | | 23,493 | | Market approach (comparable companies) | | Net income multiple | | 20.0x - 25.0x | | | 22.5x | |
Industrials | | | 8,595 | | Broker quotes and/or 3rd party pricing services | | N/A | | N/A | | | N/A | |
| | | 130,478 | | Market approach (comparable companies) | | EBITDA multiple | | 8.0x - 14.5x | | | 10.3x | |
Materials | | | 773 | | EV market multiple analysis | | EBITDA multiple | | 6.0x | | | 6.0x | |
| | | 52,947 | | Market approach (comparable companies) | | Net income multiple | | 8.0x - 10.0x | | | 9.0x | |
Telecommunication services | | | 957 | | Broker quotes and/or 3rd party pricing services | | N/A | | N/A | | | N/A | |
| | | 566 | | EV market multiple analysis | | EBITDA multiple | | 6.9x | | | 6.9x | |
Utilities | | | 14,077 | | Broker quotes and/or 3rd party pricing services | | N/A | | N/A | | | N/A | |
38
Table of Contents
ARES HOLDINGS INC. AND ARES INVESTMENTS LLC
(Predecessors to Ares Management, L.P.)
Notes to the Combined and Consolidated Financial Statements (Continued)
For the Three Months Ended March 31, 2014 and 2013
and as of March 31, 2014 and December 31, 2013
(unaudited)
(Dollars in Thousands, Except Share Data as Otherwise Noted)
5. FAIR VALUE (Continued)
| | | | | | | | | | | | | |
Investments | | Fair
Value | | Valuation Technique(s) | | Unobservable Input(s) | | Range | | Weighted
Average | |
|---|
Fixed Income | | | | | | | | | | | | | |
Consumer discretionary | | | 287,572 | | Broker quotes and/or 3rd party pricing services | | N/A | | N/A | | | N/A | |
| | | 394,891 | | Discounted cash flow | | Yield to maturity | | 7.0% - 10.0% | | | 8.5 | % |
| | | 18,383 | | EV market multiple analysis | | EBITDA multiple | | 6.2x - 18.0x | | | 8.0x | |
| | | 4,565 | | Income approach (other) | | Yield | | 17.9% | | | 17.9 | % |
| | | 5,366 | | Income approach (other) | | Yield to worst | | 4.8% - 5.8% | | | 5.3 | % |
| | | 113,305 | | Market approach (comparable companies) | | Book value multiple | | 1.5x - 1.8x | | | 1.6x | |
| | | 406,854 | | Market approach (comparable companies) | | EBITDA multiple | | 8.0x 10.5x | | | 9.2x | |
| | | 9,730 | | Recent transaction price(1) | | N/A | | N/A | | | N/A | |
| | | 623,437 | | Yield analysis | | Market yield | | 2.5% - 13.0% | | | 9.2 | % |
Consumer staples | | | 469 | | Discounted cash flow | | Other | | 20.0% | | | 20.0 | % |
| | | 4,032 | | Income approach (other) | | Yield | | 4.4% | | | 4.4 | % |
Energy | | | 112,362 | | Broker quotes and/or 3rd party pricing services | | N/A | | N/A | | | N/A | |
| | | 7,327 | | Recent transaction price(1) | | N/A | | N/A | | | N/A | |
Financials | | | 561,569 | | Broker quotes and/or 3rd party pricing services | | N/A | | N/A | | | N/A | |
| | | 942 | | Discounted cash flow | | Weighted average
collection rate | | N/A | | | N/A | |
| | | 13,177 | | EV market multiple analysis | | EBITDA multiple | | 2.4x | | | 2.4x | |
| | | 214,719 | | Yield analysis | | Market yield | | 2.8% - 13.5% | | | 9.3 | % |
Healthcare, education, and childcare | | | 100,868 | | Broker quotes and/or 3rd party pricing services | | N/A | | N/A | | | N/A | |
| | | 5,919 | | EV market multiple analysis | | EBITDA multiple | | 7.8x - 43.7x | | | 10.9x | |
| | | 3,916 | | Income approach (other) | | Discount rate | | 4.1% - 4.2% | | | 4.2 | % |
| | | 146,983 | | Yield analysis | | Market yield | | 6.0% - 10.0% | | | 7.7 | % |
39
Table of Contents
ARES HOLDINGS INC. AND ARES INVESTMENTS LLC
(Predecessors to Ares Management, L.P.)
Notes to the Combined and Consolidated Financial Statements (Continued)
For the Three Months Ended March 31, 2014 and 2013
and as of March 31, 2014 and December 31, 2013
(unaudited)
(Dollars in Thousands, Except Share Data as Otherwise Noted)
5. FAIR VALUE (Continued)
| | | | | | | | | | | | | |
Investments | | Fair
Value | | Valuation Technique(s) | | Unobservable Input(s) | | Range | | Weighted
Average | |
|---|
Industrials | | | 89,817 | | Broker quotes and/or 3rd party pricing services | | N/A | | N/A | | | N/A | |
| | | 17,894 | | Income approach (other) | | Yield | | 4.4% - 5.8% | | | 4.6 | % |
| | | 30,579 | | Market approach (comparable companies) | | EBITDA multiple | | 9.7x - 14.5x | | | 12.1x | |
| | | 4,760 | | Market approach (comparable companies) | | Illiquidity premium | | 2.0% - 2.5% | | | 2.3 | % |
| | | 53,194 | | Yield analysis | | Market yield | | 2.5% - 12.8% | | | 9.6 | % |
Information technology | | | 51,357 | | Broker quotes and/or 3rd party pricing services | | N/A | | N/A | | | N/A | |
| | | 6,851 | | Recent transaction price(1) | | N/A | | N/A | | | N/A | |
| | | 38,317 | | Yield analysis | | Market yield | | 5.3% - 14.0% | | | 11.5 | % |
Materials | | | 39,743 | | Broker quotes and/or 3rd party pricing services | | N/A | | N/A | | | N/A | |
| | | 20,259 | | Discounted cash flow | | Discount rate | | 13.0% | | | 13.0 | % |
| | | 14,056 | | Market approach (comparable companies) | | EBITDA multiple | | 6.0x - 10.0x | | | 9.0x | |
| | | 54,714 | | Yield analysis | | Market yield | | 6.0% - 13.0% | | | 7.7 | % |
Telecommunication services | | | 112,901 | | Broker quotes and/or 3rd party pricing services | | N/A | | N/A | | | N/A | |
| | | 52,989 | | Yield analysis | | Market yield | | 8.8% | | | 8.8 | % |
Utilities | | | 3,336 | | Broker quotes and/or 3rd party pricing services | | N/A | | N/A | | | N/A | |
Partnership and LLC interests | | | 41,001 | | NAV | | N/A | | N/A | | | N/A | |
Other | | | 2,372 | | Broker quotes and/or 3rd party pricing services | | N/A | | N/A | | | N/A | |
Derivative instruments of Consolidated Funds | | | 3,135 | | Broker quotes and/or 3rd party pricing services | | N/A | | N/A | | | N/A | |
| | | | | | | | | | | | | |
| | | | | | | | | | | | | | |
Total assets | | $ | 6,631,893 | | | | | | | | | | |
| | | | | | | | | | | | | |
| | | | | | | | | | | | | | |
| | | | | | | | | | | | | | |
| | | | | | | | | | | | | |
Liabilities | | | | | | | | | | | | | |
Loans payable of Consolidated Funds: | | | | | | | | | | | | | |
Fixed income | | $ | 10,931,836 | | Broker quotes and/or 3rd party pricing services | | N/A | | N/A | | | N/A | |
| | | 41,920 | | Discounted cash flow | | Discount Rate | | 10.7% | | | 10.7 | % |
| | | 561,200 | | Market approach (other) | | Other | | N/A | | | N/A | |
Derivatives instruments of Consolidated Funds | | | 6,855 | | Broker quotes and/or 3rd party pricing services | | N/A | | N/A | | | N/A | |
| | | | | | | | | | | | | |
| | | | | | | | | | | | | | |
Total liabilities | | $ | 11,541,811 | | | | | | | | | | |
| | | | | | | | | | | | | |
| | | | | | | | | | | | | | |
| | | | | | | | | | | | | | |
| | | | | | | | | | | | | |
- (1)
- Recent transaction price consists of securities purchased or restructured within the last six months. The Company has determined that there has been no change to the valuation based on the underlying assumptions used at the closing of such transactions.
40
Table of Contents
ARES HOLDINGS INC. AND ARES INVESTMENTS LLC
(Predecessors to Ares Management, L.P.)
Notes to the Combined and Consolidated Financial Statements (Continued)
For the Three Months Ended March 31, 2014 and 2013
and as of March 31, 2014 and December 31, 2013
(unaudited)
(Dollars in Thousands, Except Share Data and as Otherwise Noted)
5. FAIR VALUE (Continued)
The significant unobservable inputs used in the fair value measurement of the Company's investments in equity securities include earnings before interest, tax, depreciation and amortization ("EBITDA"), book value, and net income multiples. Significant increase (decrease) in EBITDA, book value, or net income multiples in isolation would result in a significantly higher (lower) fair value measurement.
The significant unobservable inputs used in the fair value measurement of the Company's investments in bonds are EBITDA and book value multiples, discount rates, prepayment rates, recovery rates, and market yields. Significant increases (decreases) in EBITDA and book value multiples and recovery rates, would result in a significantly higher (lower) fair value measurement. Significant increases (decreases) in prepayment rates and market yields would result in lower (higher) fair value measurements.
The significant unobservable inputs used in the fair value measurement of the Company's loans payable are discount rates, default rates, prepayment rates and other. Significant increases (decreases) in discount rates or default rates in isolation would result in a significantly lower (higher) fair value measurement.
For investments valued using NAV per share, a summary of fair value by segment along with the remaining unfunded commitment and any redemption restriction of such investments as of March 31, 2014 is presented below:
| | | | | | | | | | |
Strategy | | Fair Value | | Unfunded
Commitments | | Redemption
Restriction | |
|---|
Direct Lending Group | | $ | 20,336 | | $ | 30,503 | | | (1)(3) | |
Real Estate Group | | | 34,894 | | | 9,686 | | | (1) | |
Tradable Credit Group | | | 72,818 | | | 150,464 | | | (1)(2)(3) | |
Private Equity Group | | | 45,112 | | | 153,327 | | | (1) | |
| | | | | | | | |
| | | | | | | | | | | |
Totals | | $ | 173,160 | | $ | 343,980 | | | | |
| | | | | | | | | |
| | | | | | | | | | | |
| | | | | | | | | | | |
| | | | | | | | | |
41
Table of Contents
ARES HOLDINGS INC. AND ARES INVESTMENTS LLC
(Predecessors to Ares Management, L.P.)
Notes to the Combined and Consolidated Financial Statements (Continued)
For the Three Months Ended March 31, 2014 and 2013
and as of March 31, 2014 and December 31, 2013
(unaudited)
(Dollars in Thousands, Except Share Data and as Otherwise Noted)
5. FAIR VALUE (Continued)
For investments valued using NAV per share, a summary of fair value by segment along with the remaining unfunded commitment and any redemption restriction of such investments as of December 31, 2013 is presented below:
| | | | | | | | | | |
Strategy | | Fair
Value | | Unfunded
Commitments | | Redemption
Restriction | |
|---|
Direct Lending Group | | $ | 2,298 | | $ | 1,045 | | | (3) | |
Real Estate Group | | | 34,521 | | | 9,734 | | | (1) | |
Tradable Credit Group | | | 50,349 | | | 145,818 | | | (1)(2)(3) | |
Private Equity Group | | | 42,010 | | | 156,966 | | | (1) | |
| | | | | | | | |
| | | | | | | | | | | |
Totals | | $ | 129,178 | | $ | 313,563 | | | | |
| | | | | | | | | |
| | | | | | | | | | | |
| | | | | | | | | | | |
| | | | | | | | | |
- (1)
- The funds within these strategies are closed-ended and generally do not permit investors to redeem their interests. Distributions are received as the underlying investments are liquidated.
- (2)
- The funds within these strategies are open-ended and subject to a lock-up period of six months after the closing date, an investor has the right to withdraw their capital. Distributions are received as the underlying investments are liquidated.
- (3)
- The funds within these strategies are separately managed investment vehicles, which may be redeemed only upon dissolution or liquidation of the fund at the discretion of the investor. Distributions are received as the underlying investments are liquidated.
6. DERIVATIVE FINANCIAL INSTRUMENTS
In the normal course of business, AM LLC, AIH LLC and the Consolidated Funds use various types of derivative instruments primarily to mitigate against credit and foreign exchange risk. The derivative instruments held by these funds do not qualify for hedge accounting under the accounting standards for derivatives and hedging. The Company recognizes all of its derivative instruments at fair value as either assets or liabilities in the Combined and Consolidated Statements of Financial Condition. In accordance with ASC 815, changes in the fair value of derivative instruments are included in net change in unrealized gain (loss) on investments in the Combined and Consolidated Statements of Operations. The Company does not designate its derivatives as hedging instruments in accordance with ASC 815.
The Company is exposed to certain risks relating to its ongoing operations; the primary risks managed by using derivative instruments are credit risk and foreign exchange risk. The Company's derivative instruments include warrants, currency options, purchased options, interest rate swaps and credit default swaps and forward contracts.
42
Table of Contents
ARES HOLDINGS INC. AND ARES INVESTMENTS LLC
(Predecessors to Ares Management, L.P.)
Notes to the Combined and Consolidated Financial Statements (Continued)
For the Three Months Ended March 31, 2014 and 2013
and as of March 31, 2014 and December 31, 2013
(unaudited)
(Dollars in Thousands, Except Share Data and as Otherwise Noted)
6. DERIVATIVE FINANCIAL INSTRUMENTS (Continued)
By using derivatives, the Company is exposed to counterparty credit risk if counterparties to the derivative contracts do not perform as expected. If a counterparty fails to perform, the Company's counterparty credit risk is equal to the amount reported as a derivative asset in the Company's Combined and Consolidated Statements of Financial Condition. The Company minimizes counterparty credit risk through credit approvals, limits, monitoring procedures, executing master netting arrangements and obtaining collateral, where appropriate.
To the extent the master netting arrangements and other criteria meet the applicable requirements, which includes determining the legal enforceability of the arrangements, the Company may choose to offset the derivative assets and liabilities in the same currency by specific derivative type, or in the event of default by the counterparty, offset derivative assets and liabilities with the same counterparty. AM LLC and AIH LLC generally presents derivative and other financial instruments on a gross basis within the Combined and Consolidated Statements of Financial Condition, with certain instruments subject to enforceable master netting arrangements that could allow for the derivative and other financial instruments to be offset. The Consolidated Funds present derivative and other financial instruments, and any related cash collateral amounts, on both a gross and a net basis. This election is generally determined at management's discretion on a fund by fund basis. The Company has retained each fund's presentation upon consolidation.
Certain Consolidated Funds have entered into transactions where cash collateral is received and/or pledged with the counterparty. Generally, the collateral practices are governed within each agreement entered into between the Consolidated Funds and the respective counterparty. These agreements specify how the collateral will be handled between the two parties, and the terms of the agreements may dictate that the derivatives be marked to market on a daily basis (or other specified period) and that any collateral needs be met by posting collateral based upon certain financial thresholds and/or upon certain dates, after any applicable minimum thresholds are met. The collateral may also be required to be held in segregated accounts with a custodian in compliance with the terms of the agreements.
Qualitative Disclosures of Derivative Financial Instruments
Following is a description of the significant derivative instruments utilized by AM LLC, AIH LLC and the Consolidated Funds during the reporting periods.
Forward Foreign Currency Contracts
The Company and the Consolidated Funds enter into foreign currency forward exchange contracts to hedge against foreign currency exchange rate risk on their non-U.S. dollar denominated cash flow. When entering into a forward currency contract, the Company agrees to receive and/or deliver a fixed quantity of foreign currency for an agreed-upon price on an agreed-upon future date. Forward foreign currency contracts involve elements of market risk in excess of the amounts reflected in the Combined and Consolidated Statements of Financial Condition. The Company bears the risk of an unfavorable change in
43
Table of Contents
ARES HOLDINGS INC. AND ARES INVESTMENTS LLC
(Predecessors to Ares Management, L.P.)
Notes to the Combined and Consolidated Financial Statements (Continued)
For the Three Months Ended March 31, 2014 and 2013
and as of March 31, 2014 and December 31, 2013
(unaudited)
(Dollars in Thousands, Except Share Data and as Otherwise Noted)
6. DERIVATIVE FINANCIAL INSTRUMENTS (Continued)
the foreign exchange rate underlying the forward foreign currency contract. In addition, the potential inability of the counterparties to meet the terms of their contracts poses a risk to the Company.
Interest Rate Swaps
AIH LLC and the Consolidated Funds enter into interest rate swap contracts to mitigate their interest rate risk exposure. Interest rate swaps represent an agreement between two counterparties to exchange cash flows based on the difference in two interest rates, applied to the notional principal amount for a specified period. The payment flows are generally netted, with the difference being paid by one party to the other. The interest rate swap contracts effectively mitigate the Company's exposure to interest rate risk by converting a portion of the Company's floating-rate debt to a fixed-rate basis.
The interest rate swaps are marked-to-market based upon quotations from pricing services or by the Company and the change in value, if any, is recorded as a net change in unrealized appreciation (depreciation) on investments until settlement at which time the Company records net realized gain (loss) on investment in the Combined and Consolidated Statements of Operations.
Credit Default Swaps
The Consolidated Funds enter into credit default swap contracts for investment purposes and to manage credit risk. As a seller in a credit default swap contract, a Consolidated Fund is required to pay the notional or other agreed-upon value to the counterparty in the event of a default by a third party, either a U.S. or foreign corporate issuer (or an index of U.S. or foreign corporate issuers), on the referenced debt obligation. In return, the Consolidated Fund receives from the counterparty a periodic stream of payments over the term of the contract, provided that no event of default has occurred, and has no payment obligations. Such payments are accrued daily and accounted for as net realized gain (loss) in the Combined and Consolidated Statements of Operations.
The Consolidated Funds may also purchase credit default swap contracts to mitigate the risk of default by debt securities held. In these cases, the Consolidated Fund functions as the counterparty referenced in the preceding paragraph. As a purchaser of a credit default swap contract, the Consolidated Fund receives the notional or other agreed upon value from the counterparty in the event of default by a third party, either a U.S. or foreign corporate issuer (or an index of U.S. or foreign corporate issuers) on the referenced debt obligation. In return, the Consolidated Fund makes periodic payments to the counterparty over the term of the contract provided no event of default has occurred. Such payments are accrued daily and accounted for as realized loss in the Combined and Consolidated Statements of Operations.
Entering into credit default swaps exposes the Consolidated Funds to credit, market and documentation risk in excess of the related amounts recognized in the Combined and Consolidated Statements of Financial Condition. Such risks involve the possibility that there will be no liquid market for these agreements, that the counterparty to the agreements may default on its obligations to perform or
44
Table of Contents
ARES HOLDINGS INC. AND ARES INVESTMENTS LLC
(Predecessors to Ares Management, L.P.)
Notes to the Combined and Consolidated Financial Statements (Continued)
For the Three Months Ended March 31, 2014 and 2013
and as of March 31, 2014 and December 31, 2013
(unaudited)
(Dollars in Thousands, Except Share Data and as Otherwise Noted)
6. DERIVATIVE FINANCIAL INSTRUMENTS (Continued)
disagree as to the meaning of the contractual terms in the agreements, and that there will be unfavorable changes in net interest rates.
The credit default swaps are marked-to-market daily based upon quotations from pricing services and the change in value, if any, is recorded as a net change in unrealized appreciation (depreciation) on investments in the Combined and Consolidated Statements of Operations.
Quantitative Disclosures of Derivative Financial Instruments
The following tables identify the fair value and notional amounts of derivative contracts by major product type on a gross basis for AM LLC, AIH LLC and the Consolidated Funds as of March 31, 2014 and December 31, 2013, which amounts may be offset to the extent that there is a legal right to offset and presented on a net basis in derivative assets or derivative liabilities in the Combined and Consolidated Statements of Financial Condition:
| | | | | | | | | | | | | |
| | As of March 31, 2014 | |
|---|
| | Assets | | Liabilities | |
|---|
AM LLC and AIH LLC | | Notional(1) | | Fair Value | | Notional(1) | | Fair Value | |
|---|
Interest rate contracts | | $ | — | | $ | — | | $ | 250,000 | | $ | 1,197 | |
Foreign exchange contracts | | | 53,406 | | | 1,132 | | | 126,002 | | | 1,745 | |
| | | | | | | | | | |
| | | | | | | | | | | | | | |
Total derivatives, at fair value | | $ | 53,406 | | $ | 1,132 | | $ | 376,002 | | $ | 2,942 | |
| | | | | | | | | | |
| | | | | | | | | | | | | | |
| | | | | | | | | | | | | | |
| | | | | | | | | | |
| | | | | | | | | | | | | |
| | As of March 31, 2014 | |
|---|
| | Assets | | Liabilities | |
|---|
Consolidated Funds | | Notional(1) | | Fair Value | | Notional(1) | | Fair Value | |
|---|
Interest rate contracts | | $ | 34,000 | | $ | 0 | | $ | 89,000 | | $ | 2,545 | |
Credit contracts | | | 51,500 | | | 6,271 | | | 703,700 | | | 39,178 | |
Equity contracts | | | 64 | | | 245 | | | — | | | — | |
Foreign exchange contracts | | | 35,832 | | | 115 | | | 166,756 | | | 3,751 | |
Other financial instruments | | | 8,538 | | | 2,330 | | | 92,386 | | | 8,169 | |
| | | | | | | | | | |
| | | | | | | | | | | | | | |
Total derivatives, at fair value | | | 129,934 | | | 8,961 | | | 1,051,842 | | | 53,643 | |
| | | | | | | | | | |
| | | | | | | | | | | | | | |
Warrants—equity(2) | | | 68,859 | | | 21,734 | | | — | | | — | |
| | | | | | | | | | |
| | | | | | | | | | | | | | |
TOTAL | | $ | 198,793 | | $ | 30,695 | | $ | 1,051,842 | | $ | 53,643 | |
| | | | | | | | | | |
| | | | | | | | | | | | | | |
| | | �� | | | | | | | | | | | |
| | | | | | | | | | |
- (1)
- Represents the total contractual amount of derivative assets and liabilities outstanding.
45
Table of Contents
ARES HOLDINGS INC. AND ARES INVESTMENTS LLC
(Predecessors to Ares Management, L.P.)
Notes to the Combined and Consolidated Financial Statements (Continued)
For the Three Months Ended March 31, 2014 and 2013
and as of March 31, 2014 and December 31, 2013
(unaudited)
(Dollars in Thousands, Except Share Data and as Otherwise Noted)
6. DERIVATIVE FINANCIAL INSTRUMENTS (Continued)
- (2)
- The fair value of warrants is included within investments, at fair value in the Combined and Consolidated Statements of Financial Condition.
| | | | | | | | | | | | | |
| | As of December 31, 2013 | |
|---|
| | Assets | | Liabilities | |
|---|
AM LLC and AIH LLC | | Notional(1) | | Fair Value | | Notional(1) | | Fair Value | |
|---|
Interest rate contracts | | $ | — | | $ | — | | $ | 250,000 | | $ | 1,254 | |
Foreign exchange contracts | | | 66,733 | | | 1,164 | | | 76,419 | | | 1,653 | |
| | | | | | | | | | |
| | | | | | | | | | | | | | |
Total derivatives, at fair value | | $ | 66,733 | | $ | 1,164 | | $ | 326,419 | | $ | 2,907 | |
| | | | | | | | | | |
| | | | | | | | | | | | | | |
| | | | | | | | | | | | | | |
| | | | | | | | | | |
| | | | | | | | | | | | | |
| | As of December 31, 2013 | |
|---|
| | Assets | | Liabilities | |
|---|
Consolidated Funds | | Notional(1) | | Fair Value | | Notional(1) | | Fair Value | |
|---|
Interest rate contracts | | $ | 70,000 | | $ | 8 | | $ | 623,225 | | $ | 3,878 | |
Credit contracts | | | 25,437 | | | 4,489 | | | 537,921 | | | 28,385 | |
Equity contracts | | | 50 | | | 179 | | | — | | | — | |
Foreign exchange contracts | | | 211,324 | | | 8,653 | | | 813,997 | | | 38,631 | |
Other financial instruments | | | 6,174 | | | 1,296 | | | 83,662 | | | 4,221 | |
| | | | | | | | | | |
| | | | | | | | | | | | | | |
Total derivatives, at fair value | | | 312,985 | | | 14,625 | | | 2,058,805 | | | 75,115 | |
| | | | | | | | | | |
| | | | | | | | | | | | | | |
Warrants—equity(2) | | | 68,253 | | | 46,802 | | | — | | | — | |
| | | | | | | | | | |
| | | | | | | | | | | | | | |
TOTAL | | $ | 381,238 | | $ | 61,427 | | $ | 2,058,805 | | $ | 75,115 | |
| | | | | | | | | | |
| | | | | | | | | | | | | | |
| | | | | | | | | | | | | | |
| | | | | | | | | | |
- (1)
- Represents the total contractual amount of derivative assets and liabilities outstanding.
- (2)
- The fair value of warrants is included within investments, at fair value in the Combined and Consolidated Statements of Financial Condition.
The following tables present a summary of net realized and unrealized appreciation (depreciation) on derivative instruments as of March 31, 2014 and 2013, which is included in net realized gain (loss) on
46
Table of Contents
ARES HOLDINGS INC. AND ARES INVESTMENTS LLC
(Predecessors to Ares Management, L.P.)
Notes to the Combined and Consolidated Financial Statements (Continued)
For the Three Months Ended March 31, 2014 and 2013
and as of March 31, 2014 and December 31, 2013
(unaudited)
(Dollars in Thousands, Except Share Data and as Otherwise Noted)
6. DERIVATIVE FINANCIAL INSTRUMENTS (Continued)
investments of AM LLC, AIH LLC and the Consolidated Funds and the corresponding line item where these changes are presented within the Combined and Consolidated Statements of Operations:
| | | | | | | | | | |
| | As of March 31, 2014 | |
|---|
AM LLC and AIH LLC | | Interest Rate
Contracts | | Foreign
Exchange
Contracts | | Total | |
|---|
Net realized loss on investments | | | | | | | | | | |
Swaps | | $ | (341 | ) | $ | — | | $ | (341 | ) |
Foreign currency forward contracts | | | — | | | (793 | ) | | (793 | ) |
| | | | | | | | |
| | | | | | | | | | | |
Net realized loss on investments | | $ | (341 | ) | $ | (793 | ) | $ | (1,134 | ) |
| | | | | | | | |
| | | | | | | | | | | |
| | | | | | | | | | | |
| | | | | | | | |
Net change in unrealized appreciation (depreciation) on investments | | | | | | | | | | |
Purchased options | | $ | — | | $ | (61 | ) | $ | (61 | ) |
Swaps | | | 57 | | | — | | | 57 | |
Foreign currency forward contracts | | | — | | | (63 | ) | | (63 | ) |
| | | | | | | | |
| | | | | | | | | | | |
Total net change in unrealized appreciation (depreciation) on investments | | $ | 57 | | $ | (124 | ) | $ | (67 | ) |
| | | | | | | | |
| | | | | | | | | | | |
| | | | | | | | | | | |
| | | | | | | | |
47
Table of Contents
ARES HOLDINGS INC. AND ARES INVESTMENTS LLC
(Predecessors to Ares Management, L.P.)
Notes to the Combined and Consolidated Financial Statements (Continued)
For the Three Months Ended March 31, 2014 and 2013
and as of March 31, 2014 and December 31, 2013
(unaudited)
(Dollars in Thousands, Except Share Data and as Otherwise Noted)
6. DERIVATIVE FINANCIAL INSTRUMENTS (Continued)
| | | | | | | | | | | | | | | | | | | |
| | As of March 31, 2014 | |
|---|
Consolidated Funds | | Interest Rate
Contracts | | Credit
Contracts | | Equity
Contracts | | Foreign
Exchange
Contracts | | Other | | Total | |
|---|
Net realized gain (loss) on investments of Consolidated Funds | | | | | | | | | | | | | | | | | | | |
Purchased options | | $ | — | | $ | — | | $ | (2,019 | ) | $ | (273 | ) | $ | — | | $ | (2,292 | ) |
Written options | | | — | | | — | | | — | | | 1,853 | | | — | | | 1,853 | |
Swaps | | | (514 | ) | | (10,206 | ) | | — | | | — | | | 3,546 | | | (7,174 | ) |
Warrants(1) | | | — | | | — | | | 1,261 | | | — | | | — | | | 1,261 | |
Foreign currency forward contracts | | | — | | | — | | | — | | | (17,888 | ) | | — | | | (17,888 | ) |
| | | | | | | | | | | | | | |
| | | | | | | | | | | | | | | | | | | | |
Total net realized gain (loss) on investments of Consolidated Funds | | $ | (514 | ) | $ | (10,206 | ) | $ | (758 | ) | $ | (16,308 | ) | $ | 3,546 | | $ | (24,240 | ) |
| | | | | | | | | | | | | | |
| | | | | | | | | | | | | | | | | | | | |
| | | | | | | | | | | | | | | | | | | | |
| | | | | | | | | | | | | | |
Net change in unrealized appreciation (depreciation) on investments of Consolidated Funds | | | | | | | | | | | | | | | | | | | |
Purchased options | | $ | — | | $ | — | | $ | 108 | | $ | (1,663 | ) | $ | (113 | ) | $ | (1,668 | ) |
Written options | | | — | | | — | | | — | | | (1,214 | ) | | — | | | (1,214 | ) |
Swaps | | | (342 | ) | | 3,476 | | | — | | | (15 | ) | | (3,591 | ) | | (472 | ) |
Interest rate caps/floor | | | (4 | ) | | — | | | — | | | — | | | — | | | (4 | ) |
Warrants(1) | | | — | | | — | | | (7,180 | ) | | — | | | — | | | (7,180 | ) |
Foreign currency forward contracts | | | (22 | ) | | — | | | 1,222 | | | 17,142 | | | — | | | 18,342 | |
| | | | | | | | | | | | | | |
| | | | | | | | | | | | | | | | | | | | |
Total net change in unrealized appreciation (depreciation) on investments of Consolidated Funds | | $ | (368 | ) | $ | 3,476 | | $ | (5,850 | ) | $ | 14,250 | | $ | (3,704 | ) | $ | 7,804 | |
| | | | | | | | | | | | | | |
| | | | | | | | | | | | | | | | | | | | |
| | | | | | | | | | | | | | | | | | | | |
| | | | | | | | | | | | | | |
- (1)
- Realized and unrealized gains (losses) on warrants are also reflected in the changes presented on the investment, at fair value footnote table.
48
Table of Contents
ARES HOLDINGS INC. AND ARES INVESTMENTS LLC
(Predecessors to Ares Management, L.P.)
Notes to the Combined and Consolidated Financial Statements (Continued)
For the Three Months Ended March 31, 2014 and 2013
and as of March 31, 2014 and December 31, 2013
(unaudited)
(Dollars in Thousands, Except Share Data and as Otherwise Noted)
6. DERIVATIVE FINANCIAL INSTRUMENTS (Continued)
| | | | | | | | | | |
| | As of March 31, 2013 | |
|---|
AM LLC and AIH LLC | | Interest Rate
Contracts | | Foreign
Exchange
Contracts | | Total | |
|---|
Net realized loss on investments | | | | | | | | | | |
Swaps | | $ | (302 | ) | $ | — | | $ | (302 | ) |
Foreign currency forward contracts | | | — | | | (863 | ) | | (863 | ) |
| | | | | | | | |
| | | | | | | | | | | |
Net realized loss on investments | | $ | (302 | ) | $ | (863 | ) | $ | (1,165 | ) |
| | | | | | | | |
| | | | | | | | | | | |
| | | | | | | | | | | |
| | | | | | | | |
Net change in unrealized appreciation on investments | | | | | | | | | | |
Purchased options | | $ | — | | $ | 247 | | $ | 247 | |
Swaps | | | 223 | | | — | | | 223 | |
Foreign currency forward contracts | | | — | | | 4,203 | | | 4,203 | |
| | | | | | | | |
| | | | | | | | | | | |
Total net change in unrealized appreciation on investments | | $ | 223 | | $ | 4,450 | | $ | 4,673 | |
| | | | | | | | |
| | | | | | | | | | | |
| | | | | | | | | | | |
| | | | | | | | |
49
Table of Contents
ARES HOLDINGS INC. AND ARES INVESTMENTS LLC
(Predecessors to Ares Management, L.P.)
Notes to the Combined and Consolidated Financial Statements (Continued)
For the Three Months Ended March 31, 2014 and 2013
and as of March 31, 2014 and December 31, 2013
(unaudited)
(Dollars in Thousands, Except Share Data and as Otherwise Noted)
6. DERIVATIVE FINANCIAL INSTRUMENTS (Continued)
| | | | | | | | | | | | | | | | | | | |
| | As of March 31, 2013 | |
|---|
Consolidated Funds | | Interest
Rate
Contracts | | Credit
Contracts | | Equity
Contracts | | Foreign
Exchange
Contracts | | Other | | Total | |
|---|
Net realized gain (loss) on investments of Consolidated Funds | | | | | | | | | | | | | | | | | | | |
Purchased options | | $ | — | | $ | — | | $ | (1,565 | ) | $ | (318 | ) | $ | — | | $ | (1,883 | ) |
Written options | | | — | | | — | | | — | | | 337 | | | — | | | 337 | |
Swaps | | | (2,755 | ) | | — | | | — | | | 233 | | | — | | | (2,522 | ) |
Interest rate caps/floor | | | — | | | — | | | — | | | 1,526 | | | — | | | 1,526 | |
Warrants(1) | | | — | | | — | | | 33 | | | — | | | — | | | 33 | |
Foreign currency forward contracts | | | — | | | — | | | — | | | (565 | ) | | — | | | (565 | ) |
| | | | | | | | | | | | | | |
| | | | | | | | | | | | | | | | | | | | |
Total net realized gain (loss) on investments of Consolidated Funds | | $ | (2,755 | ) | $ | — | | $ | (1,532 | ) | $ | 1,213 | | $ | — | | $ | (3,074 | ) |
| | | | | | | | | | | | | | |
| | | | | | | | | | | | | | | | | | | | |
| | | | | | | | | | | | | | | | | | | | |
| | | | | | | | | | | | | | |
Net change in unrealized appreciation (depreciation) on investments of Consolidated Funds | | | | | | | | | | | | | | | | | | | |
Purchased options | | $ | — | | $ | — | | $ | 140 | | $ | (170 | ) | $ | — | | $ | (30 | ) |
Written options | | | — | | | — | | | — | | | (35 | ) | | — | | | (35 | ) |
Swaps | | | 1,785 | | | (734 | ) | | 762 | | | 971 | | | 1,805 | | | 4,589 | |
Interest rate caps/floor | | | (2 | ) | | — | | | — | | | (1,711 | ) | | — | | | (1,713 | ) |
Warrants(1) | | | — | | | 2,137 | | | 802 | | | — | | | — | | | 2,939 | |
Foreign currency forward contracts | | | — | | | — | | | 28,778 | | | 187 | | | (234 | ) | | 28,731 | |
| | | | | | | | | | | | | | |
| | | | | | | | | | | | | | | | | | | | |
Total net change in unrealized appreciation (depreciation) on investments of Consolidated Funds | | $ | 1,783 | | $ | 1,403 | | $ | 30,482 | | $ | (758 | ) | $ | 1,571 | | $ | 34,481 | |
| | | | | | | | | | | | | | |
| | | | | | | | | | | | | | | | | | | | |
| | | | | | | | | | | | | | | | | | | | |
| | | | | | | | | | | | | | |
- (1)
- Realized and unrealized gains (losses) on warrants are also reflected in the changes presented on the investment, at fair value footnote table.
50
Table of Contents
ARES HOLDINGS INC. AND ARES INVESTMENTS LLC
(Predecessors to Ares Management, L.P.)
Notes to the Combined and Consolidated Financial Statements (Continued)
For the Three Months Ended March 31, 2014 and 2013
and as of March 31, 2014 and December 31, 2013
(unaudited)
(Dollars in Thousands, Except Share Data and as Otherwise Noted)
6. DERIVATIVE FINANCIAL INSTRUMENTS (Continued)
The table below sets forth the rights of setoff and related arrangements associated with the Company's derivative and other financial instruments as of March 31, 2014 and December 31, 2013. The "Gross Amounts Not Offset in the Statement of Financial Position" column in the table below relates to derivative instruments that are eligible to be offset in accordance with applicable accounting guidance but for which management has elected not to offset in the Combined and Consolidated Statements of Financial Condition.
Derivative and Other Instruments of the Company as of March 31, 2014
| | | | | | | | | | | | | | | | |
| |
| |
| |
| | Gross
Amounts
Not Offset
in the
Statement
of Financial
Position | |
| |
|---|
| | Gross Amounts
of
Recognized Assets
(Liabilities) | |
| |
| |
| |
|---|
Description | | Gross Amounts
Offset in Assets
(Liabilities) | | Net Amounts of
Assets (Liabilities)
Presented | | Financial
Instruments | | Net Amount | |
|---|
Assets: | | | | | | | | | | | | | | | | |
Derivatives | | $ | 1,132 | | $ | — | | $ | 1,132 | | $ | 366 | | $ | 766 | |
| | | | | | | | | | | | |
| | | | | | | | | | | | | | | | | |
Total | | | 1,132 | | | — | | | 1,132 | | | 366 | | | 766 | |
| | | | | | | | | | | | |
| | | | | | | | | | | | | | | | | |
Liabilities: | | | | | | | | | | | | | | | | |
Derivatives | | | (2,942 | ) | | — | | | (2,942 | ) | | (366 | ) | | (2,576 | ) |
| | | | | | | | | | | | |
| | | | | | | | | | | | | | | | | |
Total | | | (2,942 | ) | | — | | | (2,942 | ) | | (366 | ) | | (2,576 | ) |
| | | | | | | | | | | | |
| | | | | | | | | | | | | | | | | |
Grand Total | | $ | (1,810 | ) | $ | — | | $ | (1,810 | ) | $ | — | | $ | (1,810 | ) |
| | | | | | | | | | | | |
| | | | | | | | | | | | | | | | | |
| | | | | | | | | | | | | | | | | |
| | | | | | | | | | | | |
51
Table of Contents
ARES HOLDINGS INC. AND ARES INVESTMENTS LLC
(Predecessors to Ares Management, L.P.)
Notes to the Combined and Consolidated Financial Statements (Continued)
For the Three Months Ended March 31, 2014 and 2013
and as of March 31, 2014 and December 31, 2013
(unaudited)
(Dollars in Thousands, Except Share Data and as Otherwise Noted)
6. DERIVATIVE FINANCIAL INSTRUMENTS (Continued)
Derivative and Other Instruments of the Company as of December 31, 2013
| | | | | | | | | | | | | | | | |
| |
| |
| |
| | Gross Amounts Not Offset in the Statement of Financial Position | |
| |
|---|
| | Gross Amounts
of
Recognized Assets
(Liabilities) | |
| |
| |
| |
|---|
Description | | Gross Amounts
Offset in Assets
(Liabilities) | | Net Amounts of
Assets (Liabilities)
Presented | | Financial
Instruments | | Net Amount | |
|---|
Assets: | | | | | | | | | | | | | | | | |
Derivatives | | $ | 1,164 | | $ | — | | $ | 1,164 | | $ | 338 | | $ | 826 | |
| | | | | | | | | | | | |
| | | | | | | | | | | | | | | | | |
Total | | | 1,164 | | | — | | | 1,164 | | | 338 | | | 826 | |
| | | | | | | | | | | | |
| | | | | | | | | | | | | | | | | |
Liabilities: | | | | | | | | | | | | | | | | |
Derivatives | | | (2,907 | ) | | — | | | (2,907 | ) | | (338 | ) | | (2,569 | ) |
| | | | | | | | | | | | |
| | | | | | | | | | | | | | | | | |
Total | | | (2,907 | ) | | — | | | (2,907 | ) | | (338 | ) | | (2,569 | ) |
| | | | | | | | | | | | |
| | | | | | | | | | | | | | | | | |
Grand Total | | $ | (1,743 | ) | $ | — | | $ | (1,743 | ) | $ | — | | $ | (1,743 | ) |
| | | | | | | | | | | | |
| | | | | | | | | | | | | | | | | |
| | | | | | | | | | | | | | | | | |
| | | | | | | | | | | | |
The table below sets forth the rights of setoff and related arrangements associated with the Consolidated Funds' derivative and other financial instruments as of March 31, 2014 and December 31, 2013. The "Gross Amounts Not Offset in the Statement of Financial Position" column in the table below relates to derivative instruments that are eligible to be offset in accordance with applicable accounting guidance but for which management has elected not to offset in the Combined and Consolidated Statements of Financial Condition.
52
Table of Contents
ARES HOLDINGS INC. AND ARES INVESTMENTS LLC
(Predecessors to Ares Management, L.P.)
Notes to the Combined and Consolidated Financial Statements (Continued)
For the Three Months Ended March 31, 2014 and 2013
and as of March 31, 2014 and December 31, 2013
(unaudited)
(Dollars in Thousands, Except Share Data and as Otherwise Noted)
6. DERIVATIVE FINANCIAL INSTRUMENTS (Continued)
Derivative and Other Instruments of the Consolidated Funds as of March 31, 2014
| | | | | | | | | | | | | | | | | | | |
| |
| |
| |
| | Gross Amounts Not Offset
in the Statement of
Financial Position | |
| |
|---|
| | Gross Amounts
of
Recognized Assets
(Liabilities) | |
| |
| |
| |
|---|
Description | | Gross Amounts
Offset in Assets
(Liabilities) | | Net Amounts of
Assets (Liabilities)
Presented | | Financial
Instruments | | Cash Collateral
Received
(Pledged) | | Net Amount | |
|---|
Assets: | | | | | | | | | | | | | | | | | | | |
Derivatives | | $ | 54,171 | | $ | 45,210 | | $ | 8,961 | | $ | 5,271 | | $ | 1,746 | | $ | 1,944 | |
Total | | | 54,171 | | | 45,210 | | | 8,961 | | | 5,271 | | | 1,746 | | | 1,944 | |
| | | | | | | | | | | | | | |
| | | | | | | | | | | | | | | | | | | | |
Liabilities: | | | | | | | | | | | | | | | | | | | |
Derivatives | | | (98,853 | ) | | (45,210 | ) | | (53,643 | ) | | (5,481 | ) | | (36,540 | ) | | (11,622 | ) |
| | | | | | | | | | | | | | |
| | | | | | | | | | | | | | | | | | | | |
Total | | | (98,853 | ) | | (45,210 | ) | | (53,643 | ) | | (5,481 | ) | | (36,540 | ) | | (11,622 | ) |
| | | | | | | | | | | | | | |
| | | | | | | | | | | | | | | | | | | | |
Grand Total | | $ | (44,682 | ) | $ | — | | $ | (44,682 | ) | $ | (210 | ) | $ | (34,794 | ) | $ | (9,678 | ) |
| | | | | | | | | | | | | | |
| | | | | | | | | | | | | | | | | | | | |
| | | | | | | | | | | | | | | | | | | | |
| | | | | | | | | | | | | | |
Derivative and Other Instruments of the Consolidated Funds as of December 31, 2013
| | | | | | | | | | | | | | | | | | | |
| |
| |
| |
| | Gross Amounts Not Offset
in the Statement of
Financial Position | |
| |
|---|
| | Gross Amounts
of
Recognized Assets
(Liabilities) | |
| |
| |
| |
|---|
Description | | Gross Amounts
Offset in Assets
(Liabilities) | | Net Amounts of
Assets (Liabilities)
Presented | | Financial
Instruments | | Cash Collateral
Received
(Pledged) | | Net Amount | |
|---|
Assets: | | | | | | | | | | | | | | | | | | | |
Derivatives | | $ | 27,081 | | $ | 12,456 | | $ | 14,625 | | $ | 9,642 | | $ | 4,675 | | $ | 308 | |
Reverse repurchase, securities borrowing, and similar arrangements(1) | | | 1,695 | | | — | | | 1,695 | | | — | | | — | | | 1,695 | |
| | | | | | | | | | | | | | |
| | | | | | | | | | | | | | | | | | | | |
Total | | | 28,776 | | | 12,456 | | | 16,320 | | $ | 9,642 | | $ | 4,675 | | $ | 2,003 | |
| | | | | | | | | | | | | | |
| | | | | | | | | | | | | | | | | | | | |
Liabilities: | | | | | | | | | | | | | | | | | | | |
Derivatives | | | (87,571 | ) | | (12,456 | ) | | (75,115 | ) | | (9,642 | ) | | (42,903 | ) | | (22,570 | ) |
| | | | | | | | | | | | | | |
| | | | | | | | | | | | | | | | | | | | |
Total | | | (87,571 | ) | | (12,456 | ) | | (75,115 | ) | | (9,642 | ) | | (42,903 | ) | | (22,570 | ) |
| | | | | | | | | | | | | | |
| | | | | | | | | | | | | | | | | | | | |
Grand Total | | $ | (58,795 | ) | $ | — | | $ | (58,795 | ) | $ | — | | $ | (38,228 | ) | $ | (20,567 | ) |
| | | | | | | | | | | | | | |
| | | | | | | | | | | | | | | | | | | | |
| | | | | | | | | | | | | | | | | | | | |
| | | | | | | | | | | | | | |
- (1)
- Included within investments, at fair value in the Combined and Consolidated Statement of Financial Condition
53
Table of Contents
ARES HOLDINGS INC. AND ARES INVESTMENTS LLC
(Predecessors to Ares Management, L.P.)
Notes to the Combined and Consolidated Financial Statements (Continued)
For the Three Months Ended March 31, 2014 and 2013
and as of March 31, 2014 and December 31, 2013
(unaudited)
(Dollars in Thousands, Except Share Data and as Otherwise Noted)
7. DEBT
Debt represents the (a) credit facility of the Company, (b) term note of AHI, (c) promissory notes issued in connection with an acquisition, (d) loan obligations of the consolidated CLOs and (e) credit facilities of the consolidated non-CLOs. The Company has elected to measure the loan obligations of the consolidated CLOs at fair value and reflect the credit facilities of the Company and consolidated non-CLOs at cost.
Credit Facility of the Company
During the period for the three months ended March 31, 2014 and 2013, there were no changes to the Company's credit facility. As of March 31, 2014 and December 31, 2013, the Company had $151.3 million and $121.3 million, respectively, outstanding under its credit facility that are presented as debt obligations on the Combined and Consolidated Statement of Financial Condition. For the three months ended March 31, 2014 and 2013, accrued interest of $0.2 million and $0.4 million, respectively, are included in interest expense in the Combined and Consolidated Statements of Operations.
Term Note of AHI
On December 18, 2012, AHI borrowed $55.0 million under a term note with a financial institution. Interest is paid quarterly and accrues based on the Company's option of LIBOR plus 1.75% or Prime Rate plus 0.75% with a floor of 1.50% per annum. Principal is payable in seven consecutive quarterly installments with increasing principal payments, commencing on January 15, 2013 and continuing up to and including June 15, 2014. The Company paid off this term note on March 20, 2014; therefore, no balance was outstanding as of March 31, 2014. As of December 31, 2013, principal outstanding under this term note was $11.0 million. The term note is secured by account balances on deposit with the same financial institution. AHI remained in compliance with all provisions of the term note from inception to repayment. In connection with this note, for the three months ended March 31, 2014 and 2013, the Company recorded interest expense of $0.1 million and $1.6 million, respectively, in the Combined and Consolidated Statements of Operations.
Promissory Notes of the Company
On July 1, 2013, in connection with the AREA acquisition, the Company entered into two promissory notes of $13.7 million and $7.2 million, with two former AREA partners. The maturity date of the notes is July 1, 2016. Beginning on July 1, 2014, the notes will be repaid in three equal consecutive principal payments of $4.6 million and $2.4 million, respectively. Interest will be accrued at a per annum rate equal to LIBOR plus 4.00%. As of March 31, 2014, the Company had $20.9 million outstanding under the two notes, presented as debt obligations in the Combined and Consolidated Statements of Financial Condition. For the three months ended March 31, 2014, accrued interest of $0.1 million is included in interest expense in the Combined and Consolidated Statements of Operations.
54
Table of Contents
ARES HOLDINGS INC. AND ARES INVESTMENTS LLC
(Predecessors to Ares Management, L.P.)
Notes to the Combined and Consolidated Financial Statements (Continued)
For the Three Months Ended March 31, 2014 and 2013
and as of March 31, 2014 and December 31, 2013
(unaudited)
(Dollars in Thousands, Except Share Data and as Otherwise Noted)
7. DEBT (Continued)
Loan Obligations of the Consolidated CLOs
Loan obligations of the Consolidated Funds that are CLOs ("Consolidated CLOs") represent amounts due to holders of debt securities issued by the Consolidated CLOs. Several of the Consolidated CLOs issued preferred shares representing the subordinated interests that are mandatorily redeemable upon the maturity dates of the senior secured loan obligations. As a result, these shares have been classified as liabilities and are included in CLO loan obligations in the Combined and Consolidated Statements of Financial Condition.
As of March 31, 2014 and December 31, 2013, the following borrowings were outstanding and classified as liabilities:
| | | | | | | | | | |
| | As of March 31, 2014 | |
|---|
| | Borrowing
Outstanding | | Market Value | | Weighted Average
Remaining
Maturity In Years | |
|---|
Senior secured notes(1) | | $ | 10,556,804 | | $ | 10,239,074 | | | 8.81 | |
Subordinated notes / preferred shares(2) | | | 1,367,796 | | | 917,275 | | | 7.70 | |
| | | | | | | | | |
| | | | | | | | | | | |
Total loan obligations of Consolidated CLOs | | | 11,924,600 | | | 11,156,349 | | | | |
| | | | | | | | | |
| | | | | | | | | | | |
| | | | | | | | | | | | | | | | | | | |
Type of Facility | | Total Facility
(Capacity) | | Outstanding
Loan | | Market
Value | | Effective
Rate | | Commitment
Fee | | Maturity
Date | |
|---|
Revolvers of Consolidated CLOs | | | | | | | | | | | | | | | | |
Revolving credit line | | $ | 48,949 | | $ | 48,949 | | $ | 48,184 | | | 0.42 | % | | 0.17 | % | | 04/16/21 | |
Revolving credit line | | | 1,035 | | | — | | | — | | | 0.51 | % | | 0.19 | % | | 02/24/18 | |
Revolving credit line | | | 13,808 | | | 13,808 | | | 13,728 | | | 0.51 | % | | 0.18 | % | | 03/12/18 | |
Revolving credit line | | | 48,510 | | | 48,510 | | | 47,553 | | | 0.44 | % | | 0.17 | % | | 10/11/21 | |
Revolving credit line | | | 10,043 | | | 10,042 | | | 10,043 | | | 0.52 | % | | 0.14 | % | | 01/26/20 | |
| | | | | | | | | | | | | | | | | | |
| | | | | | | | | | | | | | | | | | | | |
Total revolvers of Consolidated CLOs | | | 121,309 | | | 119,508 | | | | | | | | | | |
| | | | | | | | | | | | | | | | | | |
| | | | | | | | | | | | | | | | | | | | |
Total notes payable and credit facilities of Consolidated CLOs | | $ | 12,045,909 | | $ | 11,275,857 | | | | | | | | | | |
| | | | | | | | | | | | | | | | | | |
| | | | | | | | | | | | | | | | | | | | |
| | | | | | | | | | | | | | | | | | | | |
| | | | | | | | | | | | | | | | | | |
- (1)
- Weighted average interest rate of 2.35%.
55
Table of Contents
ARES HOLDINGS INC. AND ARES INVESTMENTS LLC
(Predecessors to Ares Management, L.P.)
Notes to the Combined and Consolidated Financial Statements (Continued)
For the Three Months Ended March 31, 2014 and 2013
and as of March 31, 2014 and December 31, 2013
(unaudited)
(Dollars in Thousands, Except Share Data and as Otherwise Noted)
7. DEBT (Continued)
- (2)
- The subordinated notes do not have contractual interest rates, but instead receive distributions from the excess cash flows generated by each Consolidated CLO.
| | | | | | | | | | |
| | As of December 31, 2013 | |
|---|
| | Borrowing
Outstanding | | Market
Value | | Weighted Average
Remaining
Maturity In Years | |
|---|
Senior secured notes(1) | | $ | 10,967,524 | | $ | 10,679,878 | | | 8.92 | |
Subordinated notes / preferred shares(2) | | | 1,325,446 | | | 962,098 | | | 8.64 | |
| | | | | | | | | |
| | | | | | | | | | | |
Total loan obligations of Consolidated CLOs | | | 12,292,970 | | | 11,641,976 | | | | |
| | | | | | | | | |
| | | | | | | | | | | |
| | | | | | | | | | | | | | | | | | | |
Type of Facility | | Total Facility
(Capacity) | | Outstanding
Loan | | Market
Value | | Effective
Rate | | Commitment
Fee | | Maturity
Date | |
|---|
Revolvers of Consolidated CLOs | | | | | | | | | | | | | | | | |
Revolving credit line | | $ | 48,949 | | $ | 48,949 | | $ | 48,119 | | | 0.43 | % | | 0.17 | % | | 04/16/21 | |
Revolving credit line | | | 1,035 | | | 1,035 | | | 1,034 | | | 0.51 | % | | 0.19 | % | | 02/24/18 | |
Revolving credit line | | | 23,567 | | | 23,567 | | | 23,351 | | | 0.52 | % | | 0.18 | % | | 03/12/18 | |
Revolving credit line | | | 48,510 | | | 48,510 | | | 46,812 | | | 0.45 | % | | 0.17 | % | | 10/11/21 | |
Revolving credit line | | | 12,865 | | | 12,865 | | | 12,865 | | | 0.52 | % | | 0.14 | % | | 01/26/20 | |
| | | | | | | | | | | | | | | | | | |
| | | | | | | | | | | | | | | | | | | | |
Total revolvers of Consolidated CLOs | | | 134,926 | | | 132,181 | | | | | | | | | | |
| | | | | | | | | | | | | | | | | | |
| | | | | | | | | | | | | | | | | | | | |
Total notes payable and credit facilities of Consolidated CLOs | | $ | 12,427,896 | | $ | 11,774,157 | | | | | | | | | | |
| | | | | | | | | | | | | | | | | | |
| | | | | | | | | | | | | | | | | | | | |
| | | | | | | | | | | | | | | | | | | | |
| | | | | | | | | | | | | | | | | | |
- (1)
- Weighted average interest rate of 2.36%.
- (2)
- The subordinated notes do not have contractual interest rates, but instead receive distributions from the excess cash flows generated by each Consolidated CLO.
Loan obligations of the Consolidated CLOs are collateralized by the assets held by the Consolidated CLOs, consisting of cash and cash equivalents, corporate loans, corporate bonds and other securities. The assets of one Consolidated CLO may not be used to satisfy the liabilities of another Consolidated CLO. Loan obligations of the Consolidated CLOs include floating rate notes, deferrable floating rate notes, revolving lines of credit, and subordinated notes. Amounts borrowed under the notes are repaid based on available cash flows subject to priority of payments under each Consolidated CLO's governing documents. The Company has elected to apply the fair value option to all of the loan obligations of the Consolidated CLOs, with the exception of the loan obligation of Ares Enhanced Investment Strategy II, Ltd., which is carried at cost.
56
Table of Contents
ARES HOLDINGS INC. AND ARES INVESTMENTS LLC
(Predecessors to Ares Management, L.P.)
Notes to the Combined and Consolidated Financial Statements (Continued)
For the Three Months Ended March 31, 2014 and 2013
and as of March 31, 2014 and December 31, 2013
(unaudited)
(Dollars in Thousands, Except Share Data and as Otherwise Noted)
7. DEBT (Continued)
Credit Facilities of the Consolidated Non-CLOs
Certain consolidated non-CLOs maintain credit facilities to fund investments between capital drawdowns. These facilities generally are collateralized by the unfunded capital commitments of the Consolidated Funds' limited partners, bear an annual commitment fee based on unfunded commitments and contain various affirmative and negative covenants and reporting obligations, including restrictions on additional indebtedness, liens, margin stock, affiliate transactions, dividends and distributions, release of capital commitments, and portfolio asset dispositions. The obligations of these entities have no recourse to the Company. As of March 31, 2014 and December 31, 2013, the Consolidated Funds were in compliance with all financial and non-financial covenants under such credit facilities.
Credit Facilities of the Consolidated Funds
The Consolidated Funds had the following revolving bank credit facilities and term loans outstanding as of March 31, 2014:
| | | | | | | | | | | | | | |
Type of Facility | | Total Facility
(Capacity) | | Outstanding
Loan(1)(3) | | Effective
Rate | | Commitment
Fee | | Maturity
Date | |
|---|
Short-term borrowings of Consolidated Funds | | | | | | | | | | | |
Credit facility | | $ | 40,000 | | $ | — | | LIBOR + 1.75% | | 0.25% | | | 06/06/14 | |
Credit facility | | | 100,000 | | | — | | LIBOR + 2.00% | | 0.75% | | | 06/30/14 | |
Credit facility | | | 35,000 | | | 35,000 | | LIBOR + 0.50% | | 0.50% | | | 07/19/14 | |
Term loan payable | | | 1,805,000 | | | 987,078 | | (2) | | 0.50% | | | 07/19/14 | |
| | | | | | | | | | | | | | |
| | | | | | | | | | | | | | | |
Total short-term borrowings of Consolidated Funds | | | 1,022,078 | | | | | | | | |
| | | | | | | | | | | | | | |
| | | | | | | | | | | | | | | |
Long-term borrowings of Consolidated Funds | | | | | | | | | | | |
Credit facility | | £ | 100,182 | | | 167,014 | | LIBOR + 1.85% | | N/A | | | 01/15/16 | |
Credit facility | | $ | 523,400 | | | 523,400 | | LIBOR + 2.20% | | N/A | | | 10/15/15 | |
Notes payable | | | 46,733 | | | 16,644 | | 1.93% | | N/A | | | 09/19/15 | |
Notes payable | | | 114,048 | | | 40,601 | | 1.93% | | N/A | | | 09/19/15 | |
| | | | | | | | | | | | | | |
| | | | | | | | | | | | | | | |
Total long-term borrowings of Consolidated Funds | | | 747,659 | | | | | | | | |
| | | | | | | | | | | | | | |
| | | | | | | | | | | | | | | |
Total borrowings of Consolidated Funds | | | | | $ | 1,769,737 | | | | | | | | |
| | | | | | | | | | | | | | |
| | | | | | | | | | | | | | | |
| | | | | | | | | | | | | | | |
| | | | | | | | | | | | | | |
- (1)
- The market values of the long term notes approximate the current carrying value that is tied to the LIBOR rate.
- (2)
- Rate depends on the tranche of each note held. The rates during the period ranged from One Month LIBOR +0.35% to Three Month LIBOR +0.90%.
- (3)
- For loan maintained in a foreign currency, outstanding loan balances are converted and reported into U.S. dollars at the spot rate at reporting date.
57
Table of Contents
ARES HOLDINGS INC. AND ARES INVESTMENTS LLC
(Predecessors to Ares Management, L.P.)
Notes to the Combined and Consolidated Financial Statements (Continued)
For the Three Months Ended March 31, 2014 and 2013
and as of March 31, 2014 and December 31, 2013
(unaudited)
(Dollars in Thousands, Except Share Data and as Otherwise Noted)
7. DEBT (Continued)
The Consolidated Funds had the following revolving bank credit facilities and term loans outstanding as of December 31, 2013:
| | | | | | | | | | | | | | |
Type of Facility | | Total Facility
(Capacity) | | Outstanding
Loan(1)(3) | | Effective
Rate | | Commitment
Fee | | Maturity
Date | |
|---|
Short-term borrowings of Consolidated Funds | | | | | | | | | | | |
Credit facility | | $ | 40,000 | | $ | — | | LIBOR + 1.75% | | 0.25% | | | 06/06/14 | |
Credit facility | | | 116,841 | | | — | | LIBOR + 2.00% | | 0.38% | | | 06/13/14 | |
Credit facility | | | 100,000 | | | — | | LIBOR + 2.00% | | 0.75% | | | 06/30/14 | |
Credit facility | | | 35,000 | | | 35,000 | | LIBOR + 0.50% | | 0.50% | | | 07/19/14 | |
Term loan payable | | | 1,805,000 | | | 1,137,526 | | (2) | | 0.50% | | | 07/19/14 | |
| | | | | | | | | | | | | | |
| | | | | | | | | | | | | | | |
Total short-term borrowings of Consolidated Funds | | | 1,172,526 | | | | | | | | |
| | | | | | | | | | | | | | |
| | | | | | | | | | | | | | | |
Long-term borrowings of Consolidated Funds | | | | | | | | | | | |
Credit facility | | £ | 186,290 | | | 308,477 | | LIBOR + 1.85% | | N/A | | | 01/15/16 | |
Credit facility | | $ | 532,350 | | | 532,350 | | LIBOR + 2.20% | | N/A | | | 10/15/15 | |
Credit facility | | € | 200,000 | | | — | | LIBOR + 3.00% | | 0.38% | | | 08/16/19 | |
Notes payable | | $ | 46,733 | | | 16,644 | | 1.93% | | N/A | | | 09/19/15 | |
Notes payable | | | 114,048 | | | 40,601 | | 1.93% | | N/A | | | 09/19/15 | |
| | | | | | | | | | | | | | |
| | | | | | | | | | | | | | | |
Total long-term borrowings of Consolidated Funds | | | 898,072 | | | | | | | | |
| | | | | | | | | | | | | | |
| | | | | | | | | | | | | | | |
Total borrowings of Consolidated Funds | | $ | 2,070,598 | | | | | | | | |
| | | | | | | | | | | | | | |
| | | | | | | | | | | | | | | |
| | | | | | | | | | | | | | | |
| | | | | | | | | | | | | | |
- (1)
- The market values of the long term notes approximate the current carrying value that is tied to the LIBOR rate.
- (2)
- Rate depends on the tranche of each note held. The rates during the period ranged from One Month LIBOR +0.35% to Three Month LIBOR +0.90%.
- (3)
- For loan maintained in a foreign currency, outstanding loan balances are converted and reported into U.S. dollars at the spot rate at reporting date.
Loan Obligations of the Consolidated Mezzanine Debt Funds
Loan obligations of consolidated mezzanine debt funds represent amounts due to holders of debt securities issued by Ares Institutional Loan Fund B.V. (the "AILF Master Fund"), a Netherlands limited liability company. The AILF Master Fund issued Class A, Class B and Class C participating notes that have equal rights and privileges, except with respect to management fees and the performance fee that are applicable to only the Class A participating notes. These participating notes are redeemable debt instruments that do not have a stated interest rate or fixed maturity date. The AILF Master Fund may cause any holders to redeem all or any portion of such notes at any time upon at least five days prior written notice for any reason or no reason. A participating note holder may withdraw all or some of its notes as of the last business day of each calendar month by providing at least 30 days prior written notice. The holders of these participating notes have the right to receive the AILF Master Fund's first gains and the obligation to absorb the AILF Master Fund's first losses. As of March 31, 2014 and December 31, 2013,
58
Table of Contents
ARES HOLDINGS INC. AND ARES INVESTMENTS LLC
(Predecessors to Ares Management, L.P.)
Notes to the Combined and Consolidated Financial Statements (Continued)
For the Three Months Ended March 31, 2014 and 2013
and as of March 31, 2014 and December 31, 2013
(unaudited)
(Dollars in Thousands, Except Share Data and as Otherwise Noted)
7. DEBT (Continued)
outstanding loan obligations of the consolidated mezzanine debt funds were $327.9 million and $323.2 million, respectively and are presented as mezzanine debt in the Combined and Consolidated Statements of Financial Condition. The residual interests of the consolidated mezzanine debt funds are carried at cost plus accrued interest. The mezzanine funds are collateralized by all of the assets of the AILF Master Fund with no recourse to the Company.
8. REDEEMABLE AND NON-CONTROLLING INTERESTS
The following table sets forth a summary of changes in the redeemable interests in AHI, AI and consolidated subsidiaries and redeemable interest in Consolidated Funds for the three months ended March 31, 2014 and the year ended December 31, 2013:
| | | | | | | |
| | As of March 31,
2014 | | As of December 31,
2013 | |
|---|
Redeemable interests in Consolidated Funds | | | | | | | |
Redeemable non-controlling interests in Consolidated Funds, beginning of period | | $ | 1,093,770 | | $ | 1,100,108 | |
Net income attributable to redeemable, non-controlling interests in Consolidated Funds | | | 37,048 | | | 137,924 | |
Contributions from redeemable, non-controlling interests in Consolidated Funds | | | 41,655 | | | — | |
Distributions to redeemable, non-controlling interests in Consolidated Funds | | | (52,888 | ) | | (143,378 | ) |
Currency translation adjustment attributable to redeemable, non-controlling interests in Consolidated Funds | | | — | | | (884 | ) |
| | | | | | |
| | | | | | | | |
Redeemable interests in Consolidated Funds | | $ | 1,119,585 | | $ | 1,093,770 | |
| | | | | | |
| | | | | | | | |
| | | | | | | | |
| | | | | | |
59
Table of Contents
ARES HOLDINGS INC. AND ARES INVESTMENTS LLC
(Predecessors to Ares Management, L.P.)
Notes to the Combined and Consolidated Financial Statements (Continued)
For the Three Months Ended March 31, 2014 and 2013
and as of March 31, 2014 and December 31, 2013
(unaudited)
(Dollars in Thousands, Except Share Data and as Otherwise Noted)
8. REDEEMABLE AND NON-CONTROLLING INTERESTS (Continued)
| | | | | | | |
| | As of March 31,
2014 | | As of December 31,
2013 | |
|---|
Redeemable interests in consolidated subsidiaries | | | | | | | |
Redeemable non-controlling interests in consolidated subsidiaries, beginning of period | | $ | 40,751 | | $ | 30,488 | |
Net income attributable to redeemable, non-controlling interests in consolidated subsidiaries | | | 406 | | | 2,451 | |
Contributions from redeemable, non-controlling interests in consolidated subsidiaries | | | — | | | 3,712 | |
Distributions to redeemable, non-controlling interests in consolidated subsidiaries | | | (417 | ) | | (4,641 | ) |
Currency translation adjustment attributable to redeemable, non-controlling interests in consolidated subsidiaries | | | 3 | | | 13 | |
Revaluation of redeemable interest | | | 1,638 | | | 8,437 | |
Equity compensation | | | 1,206 | | | 291 | |
| | | | | | |
| | | | | | | | |
Redeemable interests in consolidated subsidiaries | | $ | 43,587 | | $ | 40,751 | |
| | | | | | |
| | | | | | | | |
| | | | | | | | |
| | | | | | |
The following table sets forth a summary of changes in the non-controlling interest in AHI, AI and consolidated subsidiaries for the three months ended March 31, 2014:
| | | | | | | | | | | | | | | | | | | |
| | Non-controlling interest in AHI, AI and consolidated subsidiaries | |
| |
|---|
| | Members'
Equity | | Common
Stock
(B shares) | | Additional
Paid in
Capital | | Retained
Earnings | | Accumulated
Other
Comprehensive
Income (Loss) | | Total Equity | |
|---|
Balance at December 31, 2013 | | $ | 109,992 | | $ | 0 | | $ | 57,842 | | $ | (417 | ) | $ | 314 | | $ | 167,731 | |
Distributions | | | (2,802 | ) | | — | | | — | | | — | | | — | | | (2,802 | ) |
Net income | | | 11,017 | | | — | | | — | | | 1,919 | | | — | | | 12,936 | |
Revaluation of redeemable equity | | | (165 | ) | | — | | | — | | | (230 | ) | | — | | | (395 | ) |
Currency translation adjustment | | | — | | | — | | | — | | | — | | | 79 | | | 79 | |
Equity compensation | | | 271 | | | — | | | 723 | | | — | | | — | | | 994 | |
| | | | | | | | | | | | | | |
| | | | | | | | | | | | | | | | | | | | |
Balance at March 31, 2014 | | $ | 118,313 | | $ | 0 | | $ | 58,565 | | $ | 1,272 | | $ | 393 | | $ | 178,543 | |
| | | | | | | | | | | | | | |
| | | | | | | | | | | | | | | | | | | | |
| | | | | | | | | | | | | | | | | | | | |
| | | | | | | | | | | | | | |
9. COMMITMENTS AND CONTINGENCIES
Performance Fees
Performance fees from certain limited partnerships are subject to reversal in the event that the funds incur future losses. The reversal is limited to the extent of the cumulative performance fees received to
60
Table of Contents
ARES HOLDINGS INC. AND ARES INVESTMENTS LLC
(Predecessors to Ares Management, L.P.)
Notes to the Combined and Consolidated Financial Statements (Continued)
For the Three Months Ended March 31, 2014 and 2013
and as of March 31, 2014 and December 31, 2013
(unaudited)
(Dollars in Thousands, Except Share Data and as Otherwise Noted)
9. COMMITMENTS AND CONTINGENCIES (Continued)
date. If all of the existing investments became worthless, the amount of cumulative revenues that had been received by the Company would be returned less the income taxes paid thereon. Management believes the possibility of all of the investments becoming worthless is remote. The Company may be liable to repay certain limited partnerships for previously received performance fees. This obligation is generally referred to as a clawback. At March 31, 2014 and December 31, 2013, if we assumed all existing investments were valued at $0, the amount of performance fees subject to potential clawback would have been approximately $565.2 million and $608.5 million, respectively, of which approximately $454.6 million and $489.8 million, respectively, is reimbursable to the Company by professionals. If the funds were liquidated at their then current fair values as of March 31, 2014 and December 31, 2013, there would be no event of clawback. For all periods presented, the Company did not accrue any expense associated with the clawback obligation.
10. RELATED PARTY TRANSACTIONS
Substantially all of the Company's revenue is earned from its affiliates, including management fees, performance fees, administrative expense reimbursements and service fees. The related accounts receivable are included within due from affiliates within the Combined and Consolidated Statements of Financial Condition, except that performance fees receivable, which are entirely due from affiliated funds, are presented separately within the Combined and Consolidated Statements of Financial Condition.
The Company has investment management agreements with various funds and accounts that it manages. In accordance with these agreements, the Consolidated Funds bear certain operating costs and expenses which are initially paid by the Company and subsequently reimbursed by the Consolidated Funds. In addition, the Company has agreements to provide administrative services to various entities.
The Company also has entered into agreements to provide administrative services in exchange for a fee to related parties, including Ares Capital Corporation (Nasdaq: ARCC) ("ARCC"), Ares Commercial Real Estate Corporation (NYSE: ACRE) ("ACRE"), Ares Dynamic Credit Allocation Fund, Inc. (NYSE: ARDC), Ares Multi-Strategy Credit Fund, Inc. (NYSE: ARMF), Ivy Hill Asset Management, L.P. and European Senior Secured Loan Programme S.à.r.l.
Employees and other related parties may be permitted to participate in co-investment vehicles that generally invest in Ares funds alongside fund investors. Participation is limited by law to individuals who qualify under applicable securities laws. These co-investment vehicles generally do not require these individuals to pay management or performance fees.
Performance fees from the funds can be distributed to professionals on a current basis, subject to repayment by the subsidiary of the Company that acts as general partner of the relevant fund in the event that certain specified return thresholds are not ultimately achieved. The professionals have personally guaranteed, subject to certain limitations, the obligations of these subsidiaries in respect of this general partner obligation. Such guarantees are several and not joint and are limited to distributions received by the relevant recipient.
61
Table of Contents
ARES HOLDINGS INC. AND ARES INVESTMENTS LLC
(Predecessors to Ares Management, L.P.)
Notes to the Combined and Consolidated Financial Statements (Continued)
For the Three Months Ended March 31, 2014 and 2013
and as of March 31, 2014 and December 31, 2013
(unaudited)
(Dollars in Thousands, Except Share Data and as Otherwise Noted)
10. RELATED PARTY TRANSACTIONS (Continued)
The Company considers its professionals and non-consolidated funds to be affiliates. Amounts due from and to affiliates were comprised of the following:
| | | | | | | |
| | March 31, 2014 | | December 31, 2013 | |
|---|
Due from affiliates: | | | | | | | |
Management fees receivable from non-consolidated funds | | $ | 97,853 | | $ | 91,917 | |
Payments made on behalf of non-consolidated funds | | | 21,477 | | | 17,003 | |
| | | | | | |
| | | | | | | | |
Due from affiliates—Company | | $ | 119,330 | | $ | 108,920 | |
| | | | | | |
| | | | | | | | |
| | | | | | | | |
| | | | | | |
Amounts due from non-consolidated funds | | $ | 9,930 | | $ | 2,010 | |
| | | | | | |
| | | | | | | | |
Due from affiliates—Consolidated Funds | | $ | 9,930 | | $ | 2,010 | |
| | | | | | |
| | | | | | | | |
| | | | | | | | |
| | | | | | |
Due to affiliates: | | | | | | | |
Management fee rebate payable to non-consolidated funds | | $ | 12,183 | | $ | 28,715 | |
Payments made by non-consolidated funds on behalf of Company | | | 11,129 | | | 3,975 | |
| | | | | | |
| | | | | | | | |
Due to affiliates—Company | | $ | 23,312 | | $ | 32,690 | |
| | | | | | |
| | | | | | | | |
| | | | | | | | |
| | | | | | |
Amounts due to non-consolidated funds | | $ | 2,530 | | $ | 2,695 | |
| | | | | | |
| | | | | | | | |
Due to affiliates—Consolidated Funds | | $ | 2,530 | | $ | 2,695 | |
| | | | | | |
| | | | | | | | |
| | | | | | | | |
| | | | | | |
Due from Ares Funds and Portfolio Companies
In the normal course of business, the Company pays certain expenses on behalf of Consolidated Funds and non-consolidated funds for which it is reimbursed. Amounts advanced on behalf of Consolidated Funds are eliminated in consolidation. Certain expenses initially paid by the Company, primarily professional travel and other costs associated with particular portfolio company holdings, are reimbursed by the portfolio companies.
11. INCOME TAXES
A substantial portion of the Company's earnings flow through to owners of the Company without being subject to entity level income taxes. Consequently, a significant portion of the Company's earnings reflects no provision for income taxes except those for foreign, city and local income taxes incurred at the entity level. A portion of the Company's operations is held through AHI, which is a U.S. corporation for tax purposes. Because AHI is a U.S. corporation, its income is subject to U.S. federal, state and local income taxes and certain of its foreign subsidiaries are subject to foreign income taxes (for which a foreign tax credit can generally offset U.S. corporate taxes imposed on the same income). A provision for corporate level income taxes imposed on AHI's earnings is included in the Company's tax provision. The Company's tax provision also includes entity level income taxes incurred by certain affiliated funds and co-investment entities that are consolidated in these financial statements. The Company's income tax
62
Table of Contents
ARES HOLDINGS INC. AND ARES INVESTMENTS LLC
(Predecessors to Ares Management, L.P.)
Notes to the Combined and Consolidated Financial Statements (Continued)
For the Three Months Ended March 31, 2014 and 2013
and as of March 31, 2014 and December 31, 2013
(unaudited)
(Dollars in Thousands, Except Share Data and as Otherwise Noted)
11. INCOME TAXES (Continued)
benefit was $6.7 million for three months ended March 31, 2014 and income tax expense was $24.5 million for the three months ended March 31, 2013.
The Company's effective income tax rate is dependent on many factors, including the estimated nature of many amounts and the mix of revenues and expenses between U.S. corporate subsidiaries that are subject to income taxes and those subsidiaries that are not. Additionally, the Company's effective tax rate is influenced by the amount of income tax provision recorded for any affiliated funds and co-investment entities that are consolidated in these financial statements. Consequently, the effective income tax rate is subject to significant variation from period to period.
The Company files its tax returns as prescribed by the tax laws of the jurisdictions in which it operates. In the normal course of business, the Company is subject to examination by federal, state, local and foreign tax regulators. With limited exceptions, the Company is no longer subject to income tax audits by taxing authorities for any years before 2010. Although the outcome of tax audits is always uncertain, the Company does not believe the outcome of any future audit will have a material adverse effect on the Company's combined and consolidated financial statements.
12. SEGMENT REPORTING
The Company conducts its alternative asset management business through four operating segments:
- •
- Tradable Credit Group: The Company's Tradable Credit Group is a participant in the tradable, non-investment grade corporate credit markets with approximately $31.4 billion of assets under management as of March 31, 2014. The group manages various types of investment funds, ranging from comingled and separately managed accounts for institutional investors to publicly traded vehicles and sub-advised funds for retail investors. While each of the group's approximately 70 funds is tailored to specific investment objectives, mandates can be broadly categorized between long-only credit and alternative credit investment strategies. Long-only credit funds primarily seek to outperform the corresponding performing bank loan or high yield market indices. Alternative credit funds primarily seek to deliver compelling absolute risk-adjusted returns relative to publicly traded stocks, hedge funds, distressed funds, bank loans, high yield bonds or other investment types.
- •
- Direct Lending Group: The Company's Direct Lending Group is a direct lender to the U.S. and European markets, with approximately $27.6 billion of assets under management across over 30 funds or investment vehicles as of March 31, 2014. The group provides one-stop financing solutions to small-to-medium sized companies, which the Company believes are increasingly underserved by traditional lenders. The group launched its inaugural vehicle dedicated to direct lending, ARCC, ten years ago as a business development company. In 2007, the group extended its direct lending capabilities into Europe and raised its first dedicated fund. The group generates fees from over 30 other funds that include separately managed accounts for large institutional investors seeking tailored investment solutions, comingled funds and joint venture lending programs with affiliates of General Electric Company.
63
Table of Contents
ARES HOLDINGS INC. AND ARES INVESTMENTS LLC
(Predecessors to Ares Management, L.P.)
Notes to the Combined and Consolidated Financial Statements (Continued)
For the Three Months Ended March 31, 2014 and 2013
and as of March 31, 2014 and December 31, 2013
(unaudited)
(Dollars in Thousands, Except Share Data and as Otherwise Noted)
12. SEGMENT REPORTING (Continued)
- •
- Private Equity Group: The Company's Private Equity Group has approximately $9.8 billion of assets under management as of March 31, 2014. The group focuses on majority or shared-control investments, principally in under-capitalized companies. The group manages five private equity comingled funds which focus primarily on markets in North America, and to a lesser extent, Europe and Asia.
- •
- Real Estate Group: The Company's Real Estate Group manages comprehensive public and private equity and debt strategies, with approximately $8.3 billion of assets under management as of March 31, 2014. The group focuses on lending and investing assets that have been under-managed or need repositioning in their markets. The group provides investors access to its capabilities through its publicly traded commercial mortgage REIT, ACRE, focused on direct lending on properties owned by commercial real estate sponsors and operators, U.S. and European real estate private equity comingled funds, separately managed accounts and other fund types. In addition to the $8.3 billion of assets under management, the Company services a portfolio of over $5.2 billion in mortgage loans principally through a subsidiary of ACRE.
The Company established an Operations Management Group (the "OMG") that consists of five independent, shared resource groups to support the Company's operating segments by providing infrastructure and administrative support in the areas of accounting/finance, operations/information technology, business development, legal/compliance and human resources. Additionally, the OMG provides services to certain of the Company's investment companies and partnerships, which reimburse the OMG for expenses equal to the costs of services provided. The Company's clients seek to partner with investment management firms that not only have compelling investment track records across multiple investment products but also possess seasoned infrastructure support functions. As such, significant investments have been made to develop the OMG. The Company has successfully launched new business lines, integrated acquired businesses into the operations and created scale within the OMG to support a much larger platform in the future. The OMG's expenses are not allocated to the Company's four reportable segments but the Company does consider the cost structure of the OMG when evaluating its financial performance.
Economic net income ("ENI") is a key performance indicator used in the alternative asset management industry. ENI represents net income excluding (a) income tax expense, (b) operating results of Consolidated Funds, (c) depreciation expense, (d) the effects of changes arising from corporate actions and (e) certain other items that the Company does not believe are indicative of its performance. Changes arising from corporate actions include equity-based compensation expenses, the amortization of intangible assets, transaction costs associated with acquisitions and capital transactions, placement fees and underwriting costs and expenses incurred in connection with corporate reorganization. The Company believes the exclusion of these items provides investors with a meaningful indication of the Company's core operating performance. ENI is evaluated regularly by management as a decision tool for deployment of resources and assess performances of each of the business segments. The Company believes that reporting ENI is helpful in understanding its business and that investors should review the same supplemental
64
Table of Contents
ARES HOLDINGS INC. AND ARES INVESTMENTS LLC
(Predecessors to Ares Management, L.P.)
Notes to the Combined and Consolidated Financial Statements (Continued)
For the Three Months Ended March 31, 2014 and 2013
and as of March 31, 2014 and December 31, 2013
(unaudited)
(Dollars in Thousands, Except Share Data and as Otherwise Noted)
12. SEGMENT REPORTING (Continued)
non-U.S. GAAP financial measures that management uses to analyze the segment performance. These measures supplement and should be considered in addition to, and not in lieu of, the Combined and Consolidated Statements of Operations prepared in accordance with U.S. GAAP.
Fee related earnings ("FRE") is a component of ENI and is used to assess the ability of the business to cover direct base compensation and operating expenses from total management fees. FRE differs from income before taxes computed in accordance with U.S. GAAP as it adjusts for the items included in the calculation of ENI and excludes performance fee income, performance fee compensation expenses and investment income from Consolidated Funds and certain other items.
Performance related earnings ("PRE") is a measure used to assess the Company's investment performance and its ability to cover performance fee compensation expenses from performance fee income and total investment income. PRE differs from income before taxes computed in accordance with U.S. GAAP as it only includes performance fee income, performance fee compensation expense and total investment income earned from Consolidated Funds and non-consolidated funds.
Distributable earnings ("DE") is a pre-income tax measure that is used to assess performance and amounts potentially available for distributions to stakeholders. Distributable earnings is calculated as the sum of FRE, realized performance fees, realized performance fee compensation expense and realized net other income, and further adjusts for expenses arising from transaction costs associated with acquisitions, placement fees and underwriting costs, expenses incurred in connection with corporate reorganization and depreciation. Distributable earnings differs from income (loss) before taxes computed in accordance with U.S. GAAP as it is presented before giving effect to unrealized performance fee income, unrealized performance fee compensation expense, unrealized net investment income, amortization of intangibles, equity compensation expense and is further adjusted by certain items described in the table set forth in (d) below.
65
Table of Contents
ARES HOLDINGS INC. AND ARES INVESTMENTS LLC
(Predecessors to Ares Management, L.P.)
Notes to the Combined and Consolidated Financial Statements (Continued)
For the Three Months Ended March 31, 2014 and 2013
and as of March 31, 2014 and December 31, 2013
(unaudited)
(Dollars in Thousands, Except Share Data and as Otherwise Noted)
12. SEGMENT REPORTING (Continued)
Management makes operating decisions and assesses the performance of each of the Company's business segments based on financial and operating metrics and other data that is presented before giving effect to the consolidation of any of the Consolidated Funds. Consequently, all segment data excludes the assets, liabilities and operating results related to the Consolidated Funds and non-consolidated funds.
The following table presents the financial results for the Company's operating segments, as well as the OMG, as of and for the three months ended March 31, 2014:
| | | | | | | | | | | | | | | | | | | | | | |
| | Private
Equity
Group | | Direct
Lending
Group | | Tradable
Credit
Group | | Real
Estate
Group | | Total
Segments | | OMG | | Total
Stand
Alone | |
|---|
Management fees | | | | | | | | | | | | | | | | | | | | | | |
Recurring fees (includes, in the case of the Direct Lending Group, $28,318 of ARCC Part I Fees) | | $ | 23,196 | | $ | 66,204 | | $ | 33,693 | | $ | 16,768 | | $ | 139,861 | | $ | — | | $ | 139,861 | |
Previously deferred fees | | | — | | | — | | | — | | | — | | | — | | | — | | | — | |
| | | | | | | | | | | | | | | | |
| | | | | | | | | | | | | | | | | | | | | | | |
Total management fees | | | 23,196 | | | 66,204 | | | 33,693 | | | 16,768 | | | 139,861 | | | — | | | 139,861 | |
Administrative fees and other income | | | 76 | | | 90 | | | 17 | | | 1,290 | | | 1,473 | | | 5,392 | | | 6,865 | |
General, administrative and other expenses | | | (2,000 | ) | | (1,914 | ) | | (3,696 | ) | | (4,267 | ) | | (11,877 | ) | | (13,535 | ) | | (25,412 | ) |
Compensation and benefits | | | (8,195 | ) | | (32,212 | ) | | (10,805 | ) | | (11,485 | ) | | (62,697 | ) | | (27,657 | ) | | (90,354 | ) |
| | | | | | | | | | | | | | | | |
| | | | | | | | | | | | | | | | | | | | | | | |
Fee related earnings (loss) | | | 13,077 | | | 32,168 | | | 19,209 | | | 2,306 | | | 66,760 | | | (35,800 | ) | | 30,960 | |
| | | | | | | | | | | | | | | | |
| | | | | | | | | | | | | | | | | | | | | | | |
Performance fees—realized | | | 13,086 | | | 39 | | | 10,213 | | | — | | | 23,338 | | | — | | | 23,338 | |
Performance fees—unrealized | | | 21,341 | | | 2,292 | | | 13,509 | | | 2,950 | | | 40,092 | | | — | | | 40,092 | |
Performance fee compensation expense—realized | | | (10,472 | ) | | (29 | ) | | (5,506 | ) | | — | | | (16,007 | ) | | — | | | (16,007 | ) |
Performance fee compensation expense—unrealized | | | (16,912 | ) | | (1,451 | ) | | (6,355 | ) | | — | | | (24,718 | ) | | — | | | (24,718 | ) |
| | | | | | | | | | | | | | | | |
| | | | | | | | | | | | | | | | | | | | | | | |
Net performance fees | | | 7,043 | | | 851 | | | 11,861 | | | 2,950 | | | 22,705 | | | — | | | 22,705 | |
Investment income (loss)—realized | | | 1,131 | | | (597 | ) | | 18,018 | | | 730 | | | 19,282 | | | — | | | 19,282 | |
Investment income (loss)—unrealized | | | 15,156 | | | 1,524 | | | (12,866 | ) | | (862 | ) | | 2,952 | | | — | | | 2,952 | |
Interest and other income | | | 2,785 | | | 98 | | | 251 | | | 11 | | | 3,145 | | | — | | | 3,145 | |
Interest expense | | | (623 | ) | | (304 | ) | | (387 | ) | | (325 | ) | | (1,639 | ) | | — | | | (1,639 | ) |
| | | | | | | | | | | | | | | | |
| | | | | | | | | | | | | | | | | | | | | | | |
Net investment income (loss) | | | 18,449 | | | 721 | | | 5,016 | | | (446 | ) | | 23,740 | | | — | | | 23,740 | |
| | | | | | | | | | | | | | | | |
| | | | | | | | | | | | | | | | | | | | | | | |
Performance related earnings | | | 25,492 | | | 1,572 | | | 16,877 | | | 2,504 | | | 46,445 | | | — | | | 46,445 | |
| | | | | | | | | | | | | | | | |
| | | | | | | | | | | | | | | | | | | | | | | |
Economic net income (loss) | | $ | 38,569 | | $ | 33,740 | | $ | 36,086 | | $ | 4,810 | | $ | 113,205 | | $ | (35,800 | ) | $ | 77,405 | |
| | | | | | | | | | | | | | | | |
| | | | | | | | | | | | | | | | | | | | | | | |
| | | | | | | | | | | | | | | | | | | | | | | |
| | | | | | | | | | | | | | | | |
Distributable earnings (loss) | | $ | 18,698 | | $ | 31,158 | | $ | 40,704 | | $ | 1,499 | | $ | 92,059 | | $ | (37,512 | ) | $ | 54,547 | |
| | | | | | | | | | | | | | | | |
| | | | | | | | | | | | | | | | | | | | | | | |
| | | | | | | | | | | | | | | | | | | | | | | |
| | | | | | | | | | | | | | | | |
Total assets | | $ | 477,710 | | $ | 195,543 | | $ | 555,851 | | $ | 167,315 | | $ | 1,396,419 | | $ | 10,437 | | $ | 1,406,856 | |
| | | | | | | | | | | | | | | | |
| | | | | | | | | | | | | | | | | | | | | | | |
| | | | | | | | | | | | | | | | | | | | | | | |
| | | | | | | | | | | | | | | | |
66
Table of Contents
ARES HOLDINGS INC. AND ARES INVESTMENTS LLC
(Predecessors to Ares Management, L.P.)
Notes to the Combined and Consolidated Financial Statements (Continued)
For the Three Months Ended March 31, 2014 and 2013
and as of March 31, 2014 and December 31, 2013
(unaudited)
(Dollars in Thousands, Except Share Data and as Otherwise Noted)
12. SEGMENT REPORTING (Continued)
The following table presents the financial results for the Company's operating segments, as well as the OMG, as of and for the three months ended March 31, 2013:
| | | | | | | | | | | | | | | | | | | | | | |
| | Private
Equity
Group | | Direct
Lending
Group | | Tradable
Credit
Group | | Real
Estate
Group | | Total
Segments | | OMG | | Total
Stand
Alone | |
|---|
Management fees | | | | | | | | | | | | | | | | | | | | | | |
Recurring fees (includes, in the case of the Direct Lending Group, $23,836 of ARCC Part I Fees) | | $ | 23,543 | | $ | 51,450 | | $ | 30,031 | | $ | 2,467 | | $ | 107,491 | | $ | — | | $ | 107,491 | |
Previously deferred fees | | | — | | | — | | | 1,139 | | | — | | | 1,139 | | | — | | | 1,139 | |
| | | | | | | | | | | | | | | | |
| | | | | | | | | | | | | | | | | | | | | | | |
Total management fees | | | 23,543 | | | 51,450 | | | 31,170 | | | 2,467 | | | 108,630 | | | — | | | 108,630 | |
Administrative fees and other income | | | 117 | | | 83 | | | — | | | 5 | | | 205 | | | 4,455 | | | 4,660 | |
General, administrative and other expenses | | | (2,238 | ) | | (1,802 | ) | | (2,475 | ) | | (1,258 | ) | | (7,773 | ) | | (5,554 | ) | | (13,327 | ) |
Compensation and benefits | | | (6,596 | ) | | (26,902 | ) | | (8,767 | ) | | (3,568 | ) | | (45,833 | ) | | (19,082 | ) | | (64,915 | ) |
| | | | | | | | | | | | | | | | |
| | | | | | | | | | | | | | | | | | | | | | | |
Fee related earnings (loss) | | | 14,826 | | | 22,829 | | | 19,928 | | | (2,354 | ) | | 55,229 | | | (20,181 | ) | | 35,048 | |
| | | | | | | | | | | | | | | | |
| | | | | | | | | | | | | | | | | | | | | | | |
Performance fees—realized | | | 9,012 | | | — | | | 9,038 | | | — | | | 18,050 | | | — | | | 18,050 | |
Performance fees—unrealized | | | 25,513 | | | 1,499 | | | 54,351 | | | — | | | 81,363 | | | — | | | 81,363 | |
Performance fee compensation expense—realized | | | (7,209 | ) | | — | | | (36 | ) | | — | | | (7,245 | ) | | — | | | (7,245 | ) |
Performance fee compensation expense—unrealized | | | (20,269 | ) | | (823 | ) | | (34,665 | ) | | — | | | (55,757 | ) | | — | | | (55,757 | ) |
| | | | | | | | | | | | | | | | |
| | | | | | | | | | | | | | | | | | | | | | | |
Net performance fees | | | 7,047 | | | 676 | | | 28,688 | | | — | | | 36,411 | | | — | | | 36,411 | |
Investment income (loss)—realized | | | 926 | | | (825 | ) | | 19,513 | | | (37 | ) | | 19,577 | | | — | | | 19,577 | |
Investment income (loss)—unrealized | | | 2,424 | | | 3,839 | | | (3,961 | ) | | 1,048 | | | 3,350 | | | — | | | 3,350 | |
Interest and other income | | | 406 | | | 1,151 | | | 312 | | | 39 | | | 1,908 | | | — | | | 1,908 | |
Interest expense | | | (919 | ) | | (637 | ) | | (656 | ) | | (213 | ) | | (2,425 | ) | | — | | | (2,425 | ) |
| | | | | | | | | | | | | | | | |
| | | | | | | | | | | | | | | | | | | | | | | |
Net investment income (loss) | | | 2,837 | | | 3,528 | | | 15,208 | | | 837 | | | 22,410 | | | — | | | 22,410 | |
| | | | | | | | | | | | | | | | |
| | | | | | | | | | | | | | | | | | | | | | | |
Performance related earnings | | | 9,884 | | | 4,204 | | | 43,896 | | | 837 | | | 58,821 | | | — | | | 58,821 | |
| | | | | | | | | | | | | | | | |
| | | | | | | | | | | | | | | | | | | | | | | |
Economic net income (loss) | | $ | 24,710 | | $ | 27,033 | | $ | 63,824 | | $ | (1,517 | ) | $ | 114,050 | | $ | (20,181 | ) | $ | 93,869 | |
| | | | | | | | | | | | | | | | |
| | | | | | | | | | | | | | | | | | | | | | | |
| | | | | | | | | | | | | | | | | | | | | | | |
| | | | | | | | | | | | | | | | |
Distributable earnings (loss) | | $ | 16,752 | | $ | 22,342 | | $ | 47,607 | | $ | (3,422 | ) | $ | 83,279 | | $ | (20,472 | ) | $ | 62,807 | |
| | | | | | | | | | | | | | | | |
| | | | | | | | | | | | | | | | | | | | | | | |
| | | | | | | | | | | | | | | | | | | | | | | |
| | | | | | | | | | | | | | | | |
Total assets | | $ | 407,526 | | $ | 211,238 | | $ | 656,974 | | $ | 53,547 | | $ | 1,329,285 | | $ | 9,444 | | $ | 1,338,729 | |
| | | | | | | | | | | | | | | | |
| | | | | | | | | | | | | | | | | | | | | | | |
| | | | | | | | | | | | | | | | | | | | | | | |
| | | | | | | | | | | | | | | | |
67
Table of Contents
ARES HOLDINGS INC. AND ARES INVESTMENTS LLC
(Predecessors to Ares Management, L.P.)
Notes to the Combined and Consolidated Financial Statements (Continued)
For the Three Months Ended March 31, 2014 and 2013
and as of March 31, 2014 and December 31, 2013
(unaudited)
(Dollars in Thousands, Except Share Data and as Otherwise Noted)
12. SEGMENT REPORTING (Continued)
The following tables reconcile segment results to the Company's income before taxes and total assets:
| | | | | | | | | | |
| | For the Three Months Ended March 31, 2014 | |
|---|
| | Total
Segments | | Consolidation Adjustments
and Reconciling Items | | Consolidated
Results | |
|---|
Revenues | | $ | 204,764 | (1) | $ | (71,136 | )(a) | $ | 133,628 | |
Expenses | | | 115,299 | (2) | | 68,831 | (b) | | 184,130 | |
Other income | | | 23,740 | (3) | | 301,437 | (c) | | 325,177 | |
Economic net income / Income before taxes | | | 113,205 | | | 161,470 | (d) | | 274,675 | |
Total assets | | | 1,396,419 | | | 20,639,082 | (e) | | 22,035,501 | |
| | | | | | | | | | |
| | For the Three Months Ended March 31, 2013 | |
|---|
| | Total
Segments | | Consolidation Adjustments
and Reconciling Items | | Consolidated
Results | |
|---|
Revenues | | $ | 208,248 | (1) | $ | (100,711 | )(a) | $ | 107,537 | |
Expenses | | | 116,608 | (2) | | 96,459 | (b) | | 213,067 | |
Other income | | | 22,410 | (3) | | 330,704 | (c) | | 353,114 | |
Economic net income / Income before taxes | | | 114,050 | | | 133,534 | (d) | | 247,584 | |
Total assets | | | 1,329,285 | | | 23,898,471 | (e) | | 25,227,756 | |
- (1)
- Segment revenues consist of management fees, administrative fees and other income, as well as realized and unrealized performance fees.
| | | | | | | |
| | March 31, 2014 | | March 31, 2013 | |
|---|
Management fees | | $ | 139,861 | | $ | 108,630 | |
Administrative fees and other income | | | 1,473 | | | 205 | |
Performance fees—realized | | | 23,338 | | | 18,050 | |
Performance fees—unrealized | | | 40,092 | | | 81,363 | |
| | | | | | |
| | | | | | | | |
Total segment revenue | | $ | 204,764 | | $ | 208,248 | |
| | | | | | |
| | | | | | | | |
| | | | | | | | |
| | | | | | |
68
Table of Contents
ARES HOLDINGS INC. AND ARES INVESTMENTS LLC
(Predecessors to Ares Management, L.P.)
Notes to the Combined and Consolidated Financial Statements (Continued)
For the Three Months Ended March 31, 2014 and 2013
and as of March 31, 2014 and December 31, 2013
(unaudited)
(Dollars in Thousands, Except Share Data and as Otherwise Noted)
12. SEGMENT REPORTING (Continued)
- (2)
- Segment expenses consist of compensation and benefits, and general, administrative and other expenses, as well as realized and unrealized performance fee expenses.
| | | | | | | |
| | March 31, 2014 | | March 31, 2013 | |
|---|
Compensation and benefits | | $ | 62,697 | | $ | 45,833 | |
General, administrative and other expenses | | | 11,877 | | | 7,773 | |
Performance fee compensation expense—realized | | | 16,007 | | | 7,245 | |
Performance fee compensation expense—unrealized | | | 24,718 | | | 55,757 | |
| | | | | | |
| | | | | | | | |
Total segment expense | | $ | 115,299 | | $ | 116,608 | |
| | | | | | |
| | | | | | | | |
| | | | | | | | |
| | | | | | |
- (3)
- Segment other income consists of realized and unrealized investment income and expenses, interest and other income and interest expenses.
| | | | | | | |
| | March 31, 2014 | | March 31, 2013 | |
|---|
Investment income (loss)—realized | | $ | 19,282 | | $ | 19,577 | |
Investment income (loss)—unrealized | | | 2,952 | | | 3,350 | |
Interest and other income | | | 3,145 | | | 1,908 | |
Interest expense | | | (1,639 | ) | | (2,425 | ) |
| | | | | | |
| | | | | | | | |
Net investment income | | $ | 23,740 | | $ | 22,410 | |
| | | | | | |
| | | | | | | | |
| | | | | | | | |
| | | | | | |
- (a)
- The revenues adjustment principally represents management and performance fees earned from Consolidated Funds which were eliminated in consolidation to arrive at Ares consolidated revenues.
| | | | | | | |
| | March 31, 2014 | | March 31, 2013 | |
|---|
Consolidated Fund income eliminated in consolidation | | $ | (73,578 | ) | $ | (105,166 | ) |
Administrative fees and other income attributable to OMG | | | 5,392 | | | 4,455 | |
Performance fee reclass(1) | | | (2,950 | ) | | — | |
| | | | | | |
| | | | | | | | |
Total consolidated adjustments and reconciling items | | $ | (71,136 | ) | $ | (100,711 | ) |
| | | | | | |
| | | | | | | | |
| | | | | | | | |
| | | | | | |
- (1)
- Related to performance fees for AREA Sponsor Holdings LLC, an investment pool. Changes in value of this investment are reflected within other income (expense) in the Company's Combined and Consolidated Statements of Operations.
69
Table of Contents
ARES HOLDINGS INC. AND ARES INVESTMENTS LLC
(Predecessors to Ares Management, L.P.)
Notes to the Combined and Consolidated Financial Statements (Continued)
For the Three Months Ended March 31, 2014 and 2013
and as of March 31, 2014 and December 31, 2013
(unaudited)
(Dollars in Thousands, Except Share Data and as Otherwise Noted)
12. SEGMENT REPORTING (Continued)
- (b)
- The expenses adjustment represents the addition of expenses of the Consolidated Funds to the Ares unconsolidated expenses, depreciation expense, equity-based compensation and expenses associated with acquisitions and corporate actions necessary to arrive at Ares consolidated expenses.
| | | | | | | |
| | March 31, 2014 | | March 31, 2013 | |
|---|
Consolidated Fund expenses added in consolidation | | $ | 40,637 | | $ | 122,345 | |
Consolidated Fund expenses eliminated in consolidation | | | (31,700 | ) | | (61,237 | ) |
OMG expenses | | | 41,192 | | | 24,636 | |
Acquisition related expenses | | | 1,421 | | | 750 | |
Equity compensation expense | | | 5,339 | | | 6,310 | |
Income tax expenses(1) | | | — | | | 41 | |
Placement fees and underwriting costs | | | 1,052 | | | 82 | |
Amortization of intangibles | | | 8,831 | | | 2,299 | |
Depreciation expense | | | 2,059 | | | 1,233 | |
| | | | | | |
| | | | | | | | |
Total consolidation adjustments and reconciling items | | $ | 68,831 | | $ | 96,459 | |
| | | | | | |
| | | | | | | | |
| | | | | | | | |
| | | | | | |
- (1)
- Relates to local income taxes paid by subsidiary operating entities included in general, administrative and other expenses.
- (c)
- The other income adjustment represents the addition of net investment income (loss) and net interest income (expense) to arrive at Ares consolidated other income.
| | | | | | | |
| | March 31, 2014 | | March 31, 2013 | |
|---|
Other income from Consolidated Funds eliminated in consolidation, net | | $ | (22,630 | ) | $ | (12,985 | ) |
Consolidated Funds other income added in consolidation, net | | | 321,117 | | | 343,689 | |
Performance fee reclass(1) | | | 2,950 | | | — | |
| | | | | | |
| | | | | | | ��� | |
Total consolidation adjustments and reconciling items | | $ | 301,437 | | $ | 330,704 | |
| | | | | | |
| | | | | | | | |
| | | | | | | | |
| | | | | | |
- (1)
- Related to performance fees for AREA Sponsor Holdings LLC. Changes in value of this investment are reflected within other (income) expense in the Company's Combined and Consolidated Statements of Operations.
70
Table of Contents
ARES HOLDINGS INC. AND ARES INVESTMENTS LLC
(Predecessors to Ares Management, L.P.)
Notes to the Combined and Consolidated Financial Statements (Continued)
For the Three Months Ended March 31, 2014 and 2013
and as of March 31, 2014 and December 31, 2013
(unaudited)
(Dollars in Thousands, Except Share Data and as Otherwise Noted)
12. SEGMENT REPORTING (Continued)
- (d)
- The reconciliation of income before taxes as reported in the Combined and Consolidated Statements of Operations to economic net income, to fee related earnings, to performance related earnings and to distributable earnings consists of the following:
| | | | | | | |
| | March 31, 2014 | | March 31, 2013 | |
|---|
Economic net income | | | | | | | |
Income before taxes | | $ | 274,675 | | $ | 247,584 | |
| | | | | | |
| | | | | | | | |
Adjustments | | | | | | | |
Amortization of intangibles | | | 8,831 | | | 2,299 | |
Depreciation expense | | | 2,059 | | | 1,233 | |
Equity compensation expenses | | | 5,339 | | | 6,310 | |
Income tax expense(1) | | | — | | | 41 | |
Acquisition-related expenses | | | 1,421 | | | 750 | |
Placement fees and underwriting costs | | | 1,052 | | | 82 | |
OMG expenses, net | | | 35,800 | | | 20,181 | |
Income of non-controlling interests in Consolidated Funds | | | (225,181 | ) | | (148,591 | ) |
Income tax expense (benefit) of non-controlling interests in Consolidated Funds | | | 9,209 | | | (15,839 | ) |
| | | | | | |
| | | | | | | | |
Economic net income | | $ | 113,205 | | $ | 114,050 | |
| | | | | | |
| | | | | | | | |
| | | | | | | | |
| | | | | | |
Fee related earnings | | | | | | | |
Income before taxes | | $ | 274,675 | | $ | 247,584 | |
| | | | | | |
| | | | | | | | |
Adjustments | | | | | | | |
Amortization of intangibles | | | 8,831 | | | 2,299 | |
Depreciation expense | | | 2,059 | | | 1,233 | |
Equity compensation expenses | | | 5,339 | | | 6,310 | |
Income tax expense(1) | | | — | | | 41 | |
Acquisition-related expenses | | | 1,421 | | | 750 | |
Placement fees and underwriting costs | | | 1,052 | | | 82 | |
OMG expenses, net | | | 35,800 | | | 20,181 | |
Income of non-controlling interests in Consolidated Funds | | | (225,181 | ) | | (148,591 | ) |
Income tax (expense) benefit of non-controlling interests in Consolidated Funds | | | 9,209 | | | (15,839 | ) |
| | | | | | |
| | | | | | | | |
Total consolidation adjustments and reconciling items | | | (161,470 | ) | | (133,534 | ) |
| | | | | | |
| | | | | | | | |
Economic net income | | | 113,205 | | | 114,050 | |
| | | | | | |
| | | | | | | | |
71
Table of Contents
ARES HOLDINGS INC. AND ARES INVESTMENTS LLC
(Predecessors to Ares Management, L.P.)
Notes to the Combined and Consolidated Financial Statements (Continued)
For the Three Months Ended March 31, 2014 and 2013
and as of March 31, 2014 and December 31, 2013
(unaudited)
(Dollars in Thousands, Except Share Data and as Otherwise Noted)
12. SEGMENT REPORTING (Continued)
| | | | | | | |
| | March 31, 2014 | | March 31, 2013 | |
|---|
Total performance fee income—realized | | | (23,338 | ) | | (18,050 | ) |
Total performance fee income—unrealized | | | (40,092 | ) | | (81,363 | ) |
Total performance fee expense—realized | | | 16,007 | | | 7,245 | |
Total performance fee expense—unrealized | | | 24,718 | | | 55,757 | |
Net investment income | | | (23,740 | ) | | (22,410 | ) |
| | | | | | |
| | | | | | | | |
Fee related earnings | | $ | 66,760 | | $ | 55,229 | |
| | | | | | |
| | | | | | | | |
| | | | | | | | |
| | | | | | |
Management fees | | $ | 139,861 | | $ | 108,630 | |
Administrative fees and other income | | | 1,473 | | | 205 | |
Compensation and benefits | | | (62,697 | ) | | (45,833 | ) |
General, administrative and other expenses | | | (11,877 | ) | | (7,773 | ) |
| | | | | | |
| | | | | | | | |
Fee related earnings | | $ | 66,760 | | $ | 55,229 | |
| | | | | | |
| | | | | | | | |
| | | | | | | | |
| | | | | | |
72
Table of Contents
ARES HOLDINGS INC. AND ARES INVESTMENTS LLC
(Predecessors to Ares Management, L.P.)
Notes to the Combined and Consolidated Financial Statements (Continued)
For the Three Months Ended March 31, 2014 and 2013
and as of March 31, 2014 and December 31, 2013
(unaudited)
(Dollars in Thousands, Except Share Data and as Otherwise Noted)
12. SEGMENT REPORTING (Continued)
| | | | | | | |
| | March 31, 2014 | | March 31, 2013 | |
|---|
Performance related earnings: | | | | | | | |
Income before taxes | | $ | 274,675 | | $ | 247,584 | |
| | | | | | |
| | | | | | | | |
Adjustments | | | | | | | |
Amortization of intangibles | | | 8,831 | | | 2,299 | |
Depreciation expense | | | 2,059 | | | 1,233 | |
Equity compensation expenses | | | 5,339 | | | 6,310 | |
Income tax expense(1) | | | — | | | 41 | |
Acquisition-related expenses | | | 1,421 | | | 750 | |
Placement fees and underwriting costs | | | 1,052 | | | 82 | |
OMG expenses, net | | | 35,800 | | | 20,181 | |
Income of non-controlling interests in Consolidated Funds | | | (225,181 | ) | | (148,591 | ) |
Income tax expense (benefit) of non-controlling interests in Consolidated Funds | | | 9,209 | | | (15,839 | ) |
| | | | | | |
| | | | | | | | |
Economic net income | | | 113,205 | | | 114,050 | |
| | | | | | |
| | | | | | | | |
Total management fees | | $ | (139,861 | ) | $ | (108,630 | ) |
Administrative fees and other income | | | (1,473 | ) | | (205 | ) |
Compensation and benefits | | | 62,697 | | | 45,833 | |
General, administrative and other expenses | | | 11,877 | | | 7,773 | |
| | | | | | |
| | | | | | | | |
Performance related earnings | | $ | 46,445 | | $ | 58,821 | |
| | | | | | |
| | | | | | | | |
| | | | | | | | |
| | | | | | |
Total performance fee income—realized | | $ | 23,338 | | $ | 18,050 | |
Total performance fee income—unrealized | | | 40,092 | | | 81,363 | |
Total performance fee expense—realized | | | (16,007 | ) | | (7,245 | ) |
Total performance fee expense—unrealized | | | (24,718 | ) | | (55,757 | ) |
Net investment income | | | 23,740 | | | 22,410 | |
| | | | | | |
| | | | | | | | |
Performance related earnings | | $ | 46,445 | | $ | 58,821 | |
| | | | | | |
| | | | | | | | |
| | | | | | | | |
| | | | | | |
- (1)
- Relates to local income taxes paid by subsidiary operating entities included in general, administrative and other expenses.
73
Table of Contents
ARES HOLDINGS INC. AND ARES INVESTMENTS LLC
(Predecessors to Ares Management, L.P.)
Notes to the Combined and Consolidated Financial Statements (Continued)
For the Three Months Ended March 31, 2014 and 2013
and as of March 31, 2014 and December 31, 2013
(unaudited)
(Dollars in Thousands, Except Share Data and as Otherwise Noted)
12. SEGMENT REPORTING (Continued)
| | | | | | | |
| | March 31, 2014 | | March 31, 2013 | |
|---|
Distributable Earnings | | | | | | | |
Income before taxes | | $ | 274,675 | | $ | 247,584 | |
| | | | | | |
| | | | | | | | |
Adjustments | | | | | | | |
Amortization of intangibles | | | 8,831 | | | 2,299 | |
Equity compensation expenses | | | 5,339 | | | 6,310 | |
OMG distributable loss(1) | | | 37,512 | | | 20,472 | |
Income of non-controlling interests in Consolidated Funds | | | (225,181 | ) | | (148,591 | ) |
Income tax (expense) benefit of non-controlling interests in Consolidated Funds | | | 9,209 | | | (15,839 | ) |
Unrealized performance fee | | | (40,092 | ) | | (81,363 | ) |
Unrealized performance fee compensation expense | | | 24,718 | | | 55,757 | |
Unrealized investment and other loss | | | (2,952 | ) | | (3,350 | ) |
| | | | | | |
| | | | | | | | |
Distributable Earnings | | $ | 92,059 | | $ | 83,279 | |
| | | | | | |
| | | | | | | | |
| | | | | | | | |
| | | | | | |
Fee related earnings | | $ | 66,760 | | $ | 55,229 | |
Performance fees—realized | | |
23,338 | | |
18,050 | |
Performance fee compensation expense—realized | | | (16,007 | ) | | (7,245 | ) |
Other income realized, net | | | 20,788 | | | 19,060 | |
| | | | | | |
| | | | | | | | |
Net performance fee—realized | | | 28,119 | | | 29,865 | |
Less: | | | | | | | |
One-time acquisition costs | | | — | | | (750 | ) |
Income tax expense(2) | | | — | | | (41 | ) |
Placement fees and underwriting costs | | | (1,052 | ) | | (82 | ) |
Non-cash depreciation and amortization(3) | | | (1,768 | ) | | (942 | ) |
| | | | | | |
| | | | | | | | |
Distributable earnings | | $ | 92,059 | | $ | 83,279 | |
| | | | | | |
| | | | | | | | |
| | | | | | | | |
| | | | | | |
- (1)
- Represents OMG distributable earnings which includes depreciation expense.
- (2)
- Relates to local income taxes paid by subsidiary operating entities included in general, administrative and other expenses.
- (3)
- Depreciation and amortization is reduced by the amounts attributed to OMG equal to $291 and $291 for the periods ended March 31, 2014 and 2013, respectively.
74
Table of Contents
ARES HOLDINGS INC. AND ARES INVESTMENTS LLC
(Predecessors to Ares Management, L.P.)
Notes to the Combined and Consolidated Financial Statements (Continued)
For the Three Months Ended March 31, 2014 and 2013
and as of March 31, 2014 and December 31, 2013
(unaudited)
(Dollars in Thousands, Except Share Data and as Otherwise Noted)
12. SEGMENT REPORTING (Continued)
- (e)
- The reconciliation of total segment assets to total assets reported in the Combined and Consolidated Statements of Financial Condition consists of the following:
| | | | | | | |
| | March 31, 2014 | | March 31, 2013 | |
|---|
Total assets from Consolidated Funds eliminated in consolidation | | $ | (791,639 | ) | $ | (829,629 | ) |
Total assets from Consolidated Funds added in consolidation | | | 21,420,284 | | | 24,718,656 | |
OMG assets | | | 10,437 | | | 9,444 | |
| | | | | | |
| | | | | | | | |
Total consolidation adjustments and reconciling items | | $ | 20,639,082 | | $ | 23,898,471 | |
| | | | | | |
| | | | | | | | |
| | | | | | | | |
| | | | | | |
13. SUBSEQUENT EVENTS
The Company has evaluated the possibility of subsequent events existing in the Company's financial statements through the date of issuance, and has determined that the following events require disclosure in the Company's financial statements.
On April 4, 2014, the Company made a distribution from AI of $150.0 million, a portion of which related to previously undistributed earnings, to its members. On April 24, 2014, the Company made a distribution equal to 85.0% of pre-tax distributable earnings to its members in the aggregate amount of $46.0 million.
On May 1, 2014, in connection with the initial public offering ("IPO") of common units representing limited partnership interests in Ares Management, L.P., Ares Holdings LLC, the immediate parent of AM LLC, was converted into a limited partnership, Ares Holdings L.P. ("Ares Holdings"), and Ares Investments LLC was converted into a limited partnership, Ares Investments L.P. ("Ares Investments"). In addition, Ares Domestic Holdings L.P. ("Ares Domestic"), Ares Offshore Holdings L.P. ("Ares Offshore") and Ares Real Estate Holdings L.P. ("Ares Real Estate") were formed. Ares Holdings, Ares Domestic, Ares Offshore, Ares Investments and Ares Real Estate are collectively referred to as the "Ares Operating Group." The Ares Operating Group holds:
- •
- in the case of Ares Holding, interests in the general partners, managing members and other management interests of the U.S. fee-generating and most of the non-U.S. fee generating business as well as certain investments;
- •
- in the case of Ares Domestic, interests in certain U.S. investments that are fiscally transparent for U.S. federal income tax purposes;
- •
- in the case of Ares Offshore, interests in the general partners of certain non-U.S. direct lending and tradable credit funds and certain other private equity and real estate funds;
75
Table of Contents
ARES HOLDINGS INC. AND ARES INVESTMENTS LLC
(Predecessors to Ares Management, L.P.)
Notes to the Combined and Consolidated Financial Statements (Continued)
For the Three Months Ended March 31, 2014 and 2013
and as of March 31, 2014 and December 31, 2013
(unaudited)
(Dollars in Thousands, Except Share Data and as Otherwise Noted)
13. SUBSEQUENT EVENTS (Continued)
- •
- in the case of Ares Investments, interests in the general partners of certain U.S. and non-U.S. tradable credit funds, certain U.S. and non-U.S. private equity funds, certain real estate funds and other investment assets, in each case that are expected to produce primary interest, dividend income, capital gains and non-U.S. rental income; and
- •
- in the case of Ares Real Estate, interests in the general partners of certain of the real estate funds and certain other real estate investments.
Prior to the IPO, APMC was converted into a limited partnership and renamed Ares Owners Holding L.P. In exchange for its interest in the Ares Management, L.P., prior to the consummation of the initial public offering, Ares Owners Holdings L.P. transferred to the Ares Management, L.P. its interests in each of AHI, Ares Domestic Holdings Inc., Ares Offshore Holdings, Ltd., Ares Real Estate Holdings LLC and a portion of its interest in Ares Investments. Similarly, the Abu Dhabi Investment Authority contributed its direct interest in AHI to its affiliate, AREC Holdings Ltd., a Cayman Islands exempted company ("AREC"), and subsequently, in exchange for its interest in the Ares Management, L.P., AREC transferred to Ares Management, L.P. its interest in each of AHI, Ares Domestic, Ares Offshore, Ares Investments and Ares Real Estate. As a result of the foregoing, Ares Owners Holdings L.P. holds 34,540,079 common units in Ares Management, L.P. and AREC holds 34,538,155 common units in Ares Management, L.P.. Following the foregoing exchanges, Ares Owners Holding L.P. retained a 59.21% direct interest, or 118,421,766 partnership units in each of the Ares Operating Group entities (collectively, the "Ares Operating Group Units"), in each of the Ares Operating Group entities. AREC has no direct interest in the Ares Operating Group entities. An affiliate of Alleghany Corporation ("Alleghany") owns a 6.25% direct interest, or 12,500,000 Ares Operating Group Units, in each of the Ares Operating Group entities.
On May 7, 2014, Ares Management, L.P. issued 11,363,636 common units in the IPO at $19.00 per common unit. In addition, on June 4, 2014, the Company issued an additional 225,794 common units at $19.00 per common unit pursuant to the partial exercise by the underwriters of their overallotment option. Total proceeds from the IPO, including from the partial exercise by the underwriters of their overallotment option, net of underwriting discounts, were $209.2 million.
Following the IPO, Ares Management, L.P.is a holding partnership and, either directly or through direct subsidiaries, controls and holds equity interests in each of the Ares Operating Group entities, which in turn own the operating entities included in the historical combined and consolidated financial statements. Ares Management, L.P. conducts all of the material business activities through the Ares Operating Group entities. Ares Management, L.P., either directly or through direct subsidiaries, is the general partner of each of the Ares Operating Group entities. In addition, Ares Management, L.P. consolidates the financial results of the Ares Operating Group entities, their consolidated subsidiaries and certain Consolidated Funds. Following the IPO, Ares Management, L.P.'s senior professional owners hold their ownership interest in common units of Ares Management, L.P. and in the Ares Operating Group Units either directly or indirectly through Ares Owners Holding L.P. Ares Management, L.P. entered into
76
Table of Contents
ARES HOLDINGS INC. AND ARES INVESTMENTS LLC
(Predecessors to Ares Management, L.P.)
Notes to the Combined and Consolidated Financial Statements (Continued)
For the Three Months Ended March 31, 2014 and 2013
and as of March 31, 2014 and December 31, 2013
(unaudited)
(Dollars in Thousands, Except Share Data and as Otherwise Noted)
13. SUBSEQUENT EVENTS (Continued)
an exchange agreement with the holders of Ares Operating Group units so that such holders, subject to any applicable transfer restrictions and other provisions, may up to four times each year from and after the second anniversary of the date of the closing of the IPO exchange their Ares Operating Group Units for common units in Ares Management, L.P. on a one-for-one basis (provided that Alleghany may exchange up to half of its Ares Operating Group Units from and after the first anniversary of the IPO). Following the consummation of the IPO, including the partial exercise by the underwriters of their overallotment option, assuming no exchange of Ares Operating Group Units for common units in Ares Management, L.P., Ares Owners Holdings L.P. holds a 42.82% direct interest in Ares Management, L.P., AREC holds a 42.82% direct interest in Ares Management, L.P. and the public holds a 14.37% direct interest in Ares Management, L.P.
Following the consummation of the IPO, including the partial exercise by the underwriters of their overallotment option, Ares Owners Holdings L.P. holds a 72.29% direct and indirect interest in the Ares Operating Group, an affiliate of Alleghany holds a 5.91% direct interest in the Ares Operating Group, AREC holds a 16.32% indirect interest in the Ares Operating Group and the public holds 5.48% indirect interest in the Ares Operating Group.
77
Table of Contents
ARES HOLDINGS INC. AND ARES INVESTMENTS LLC
(Predecessors to Ares Management, L.P.)
Notes to the Combined and Consolidated Financial Statements (Continued)
For the Three Months Ended March 31, 2014 and 2013
and as of March 31, 2014 and December 31, 2013
(unaudited)
(Dollars in Thousands, Except Share Data and as Otherwise Noted)
13. SUBSEQUENT EVENTS (Continued)
The diagram below (which omits certain wholly owned intermediate holding companies) depicts Ares Management, L.P.'s organizational structure following the IPO, including the partial exercise by the underwriters of their overallotment option. Entities are generally organized in the State of Delaware, except as otherwise indicated:
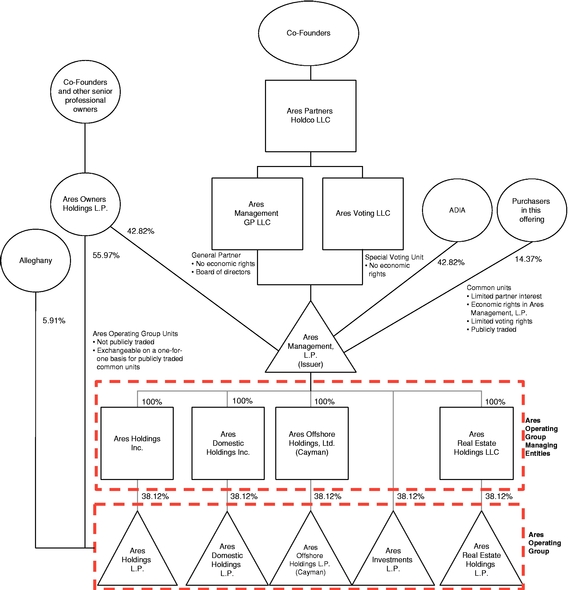
78
Table of Contents
ARES HOLDINGS INC. AND ARES INVESTMENTS LLC
(Predecessors to Ares Management, L.P.)
Notes to the Combined and Consolidated Financial Statements (Continued)
For the Three Months Ended March 31, 2014 and 2013
and as of March 31, 2014 and December 31, 2013
(unaudited)
(Dollars in Thousands, Except Share Data and as Otherwise Noted)
13. SUBSEQUENT EVENTS (Continued)
Ares Management, L.P. used the net proceeds of the IPO to purchase newly issued Ares Operating Group Units concurrently with the consummation of the IPO, and to partially repay outstanding borrowing under its credit facility and for general corporate purposes and to fund growth initiatives. The Ares Operating Group reimbursed Ares Management, L.P. for all of the offering related expenses of the IPO, which were approximately $27.7 million except the underwriters' commissions.
On May 7, 2014, the credit facility was amended and restated to provide for a $1.03 billion revolving credit facility. Under the amended credit facility, the Ares Operating Group entities replaced AM LLC and AIH LLC as borrowers. Consistent with the previous credit facility, interest rates are dependent upon corporate credit ratings. As of May 7, 2014, base rate loans bear interest calculated based on the base rate plus 0.75% and the LIBOR rate loans bear interest calculated based on LIBOR rate plus 1.75%. Unused commitment fees are payable at a rate of 0.25% per annum. The credit facility's maturity was extended to April 30, 2019. The Company repaid $163.3 million of outstanding balance under the credit facility from proceeds of the IPO on May 7, 2014.
In June 2014, an affiliate of the Company completed the acquisition of 100% ownership in Keltic Financial Services LLC ("Keltic"), a commercial finance company headquartered in New York that provides asset based loans to small and middle market companies. In conjunction with the acquisition of Keltic, an affiliate of the Company also acquired substantially all of the assets of Keltic Financial Partners II, to which Keltic acts as the general partner.
79
Table of Contents
ARES HOLDINGS INC. AND ARES INVESTMENTS LLC
(Predecessors to Ares Management, L.P.)
Notes to the Combined and Consolidated Financial Statements (Continued)
For the Three Months Ended March 31, 2014 and 2013
and as of March 31, 2014 and December 31, 2013
(unaudited)
(Dollars in Thousands, Except Share Data and as Otherwise Noted)
14. CONSOLIDATING SCHEDULES
The following supplemental financial information illustrates the consolidating effects of the Consolidated Funds on the Company's financial condition as of March 31, 2014 and December 31, 2013, and results from operations for the three months ended March 31, 2014 and 2013.
| | | | | | | | | | | | | |
| | For the Three Months Ended March 31, 2014 | |
|---|
| | Consolidated
Company Entities | | Consolidated
Funds | | Eliminations | | Consolidated | |
|---|
Assets | | | | | | | | | | | | | |
Cash and cash equivalents | | $ | 36,634 | | $ | — | | $ | — | | $ | 36,634 | |
Restricted cash and cash equivalents | | | 7,657 | | | — | | | — | | | 7,657 | |
Investments, at fair value | | | 519,750 | | | — | | | (398,142 | ) | | 121,608 | |
Performance fees receivable | | | 490,883 | | | — | | | (354,453 | ) | | 136,430 | |
Derivative assets, at fair value | | | 1,132 | | | — | | | — | | | 1,132 | |
Due from affiliates | | | 136,986 | | | — | | | (17,656 | ) | | 119,330 | |
Intangible assets, net | | | 59,938 | | | — | | | — | | | 59,938 | |
Goodwill | | | 60,531 | | | — | | | — | | | 60,531 | |
Other assets | | | 93,345 | | | — | | | (21,388 | ) | | 71,957 | |
Assets of Consolidated Funds | | | | | | | | | | | | | |
Cash and cash equivalents | | | — | | | 1,276,657 | | | — | | | 1,276,657 | |
Investments, at fair value | | | — | | | 19,485,067 | | | — | | | 19,485,067 | |
Due from affiliates | | | — | | | 9,930 | | | — | | | 9,930 | |
Dividends and interest receivable | | | — | | | 170,490 | | | — | | | 170,490 | |
Receivable for securities sold | | | — | | | 447,263 | | | — | | | 447,263 | |
Derivative assets, at fair value | | | — | | | 8,961 | | | — | | | 8,961 | |
Other assets | | | — | | | 21,916 | | | — | | | 21,916 | |
| | | | | | | | | | |
| | | | | | | | | | | | | | |
Total assets | | $ | 1,406,856 | | $ | 21,420,284 | | $ | (791,639 | ) | $ | 22,035,501 | |
| | | | | | | | | | |
| | | | | | | | | | | | | | |
| | | | | | | | | | | | | | |
| | | | | | | | | | |
Liabilities | | | | | | | | | | | | | |
Debt obligations | | $ | 172,119 | | $ | — | | $ | — | | $ | 172,119 | |
Accounts payable, accrued expenses and other liabilities | | | 63,621 | | | — | | | — | | | 63,621 | |
Deferred tax liability, net | | | 20,793 | | | — | | | — | | | 20,793 | |
Performance fee compensation payable | | | 304,015 | | | — | | | — | | | 304,015 | |
Derivative liabilities, at fair value | | | 2,942 | | | — | | | — | | | 2,942 | |
Accrued compensation | | | 55,557 | | | — | | | — | | | 55,557 | |
Due to affiliates | | | 22,410 | | | — | | | 902 | | | 23,312 | |
Liabilities of Consolidated Funds | | | | | | | | | | | | | |
Accounts payable, accrued expenses and other liabilities | | | — | | | 66,010 | | | — | | | 66,010 | |
Payable for securities purchased | | | — | | | 601,349 | | | — | | | 601,349 | |
Derivative liabilities, at fair value | | | — | | | 53,643 | | | — | | | 53,643 | |
Due to affiliates | | | — | | | 83,649 | | | (81,119 | ) | | 2,530 | |
Deferred tax liability | | | — | | | 20,449 | | | — | | | 20,449 | |
CLO loan obligations | | | — | | | 11,330,112 | | | (54,255 | ) | | 11,275,857 | |
Fund borrowings | | | — | | | 1,769,737 | | | — | | | 1,769,737 | |
Mezzanine debt | | | — | | | 327,892 | | | — | | | 327,892 | |
| | | | | | | | | | |
| | | | | | | | | | | | | | |
80
Table of Contents
ARES HOLDINGS INC. AND ARES INVESTMENTS LLC
(Predecessors to Ares Management, L.P.)
Notes to the Combined and Consolidated Financial Statements (Continued)
For the Three Months Ended March 31, 2014 and 2013
and as of March 31, 2014 and December 31, 2013
(unaudited)
(Dollars in Thousands, Except Share Data and as Otherwise Noted)
14. CONSOLIDATING SCHEDULES (Continued)
| | | | | | | | | | | | | |
| | For the Three Months Ended March 31, 2014 | |
|---|
| | Consolidated
Company Entities | | Consolidated
Funds | | Eliminations | | Consolidated | |
|---|
Total liabilities | | | 641,457 | | | 14,252,841 | | | (134,472 | ) | | 14,759,826 | |
| | | | | | | | | | |
| | | | | | | | | | | | | | |
Commitments and contingencies | | | | | | | | | | | | | |
Redeemable interest in Consolidated Funds | | | — | | | 1,119,585 | | | — | | | 1,119,585 | |
Redeemable interest in AHI, AI and consolidated subsidiaries | | | 43,587 | | | — | | | — | | | 43,587 | |
Non-controlling interest in Consolidated Funds: | | | | | | | | | | | | | |
Non-controlling interest in Consolidated Funds | | | — | | | 5,941,100 | | | (657,167 | ) | | 5,283,933 | |
Equity appropriated for Consolidated Funds | | | — | | | 106,758 | | | — | | | 106,758 | |
| | | | | | | | | | |
| | | | | | | | | | | | | | |
Non-controlling interest in Consolidated Funds | | | — | | | 6,047,858 | | | (657,167 | ) | | 5,390,691 | |
| | | | | | | | | | |
| | | | | | | | | | | | | | |
Non-controlling interest in equity of AHI, AI and consolidated subsidiaries | | | 178,543 | | | — | | | — | | | 178,543 | |
Controlling interest in equity of AHI, AI and consolidated subsidiaries: | | | | | | | | | | | | | |
Members' equity | | | 350,862 | | | — | | | — | | | 350,862 | |
Common stock (class A shares, 50,000 authorized, 5,010 shares issued and outstanding, $0.001 par value) | | | 0 | | | — | | | — | | | 0 | |
Additional paid in capital | | | 315,553 | | | — | | | — | | | 315,553 | |
Retained earnings | | | (124,408 | ) | | — | | | — | | | (124,408 | ) |
Accumulated other comprehensive gain | | | 1,262 | | | — | | | — | | | 1,262 | |
| | | | | | | | | | |
| | | | | | | | | | | | | | |
Total controlling interest in equity of AHI, AI and consolidated subsidiaries | | | 543,269 | | | — | | | — | | | 543,269 | |
| | | | | | | | | | |
| | | | | | | | | | | | | | |
Total equity | | | 721,812 | | | 6,047,858 | | | (657,167 | ) | | 6,112,503 | |
| | | | | | | | | | |
| | | | | | | | | | | | | | |
Total liabilities, redeemable interests, non-controlling interests and equity | | $ | 1,406,856 | | $ | 21,420,284 | | $ | (791,639 | ) | $ | 22,035,501 | |
| | | | | | | | | | |
| | | | | | | | | | | | | | |
| | | | | | | | | | | | | | |
| | | | | | | | | | |
81
Table of Contents
ARES HOLDINGS INC. AND ARES INVESTMENTS LLC
(Predecessors to Ares Management, L.P.)
Notes to the Combined and Consolidated Financial Statements (Continued)
For the Three Months Ended March 31, 2014 and 2013
and as of March 31, 2014 and December 31, 2013
(unaudited)
(Dollars in Thousands, Except Share Data and as Otherwise Noted)
14. CONSOLIDATING SCHEDULES (Continued)
| | | | | | | | | | | | | |
| | For the Three Months Ended March 31, 2014 | |
|---|
| | Consolidated
Company Entities | | Consolidated
Funds | | Eliminations | | Consolidated | |
|---|
Revenues | | | | | | | | | | | | | |
Management fees (includes ARCC Part I Fees of $28,318) | | $ | 139,861 | | $ | — | | $ | (29,312 | ) | $ | 110,549 | |
Performance fees | | | 60,480 | | | — | | | (44,266 | ) | | 16,214 | |
Other fees | | | 6,865 | | | — | | | — | | | 6,865 | |
| | | | | | | | | | |
| | | | | | | | | | | | | | |
Total revenues | | | 207,206 | | | — | | | (73,578 | ) | | 133,628 | |
| | | | | | | | | | |
| | | | | | | | | | | | | | |
Expenses | | | | | | | | | | | | | |
Compensation and benefits | | | 95,693 | | | — | | | — | | | 95,693 | |
Performance fee compensation | | | 40,725 | | | — | | | — | | | 40,725 | |
General, administrative and other expense | | | 38,775 | | | — | | | — | | | 38,775 | |
Consolidated Fund expenses | | | — | | | 40,637 | | | (31,700 | ) | | 8,937 | |
| | | | | | | | | | |
| | | | | | | | | | | | | | |
Total expenses | | | 175,193 | | | 40,637 | | | (31,700 | ) | | 184,130 | |
| | | | | | | | | | |
| | | | | | | | | | | | | | |
Other income (expense) | | | | | | | | | | | | | |
Interest and other income | | | 3,483 | | | — | | | (3,359 | ) | | 124 | |
Interest expense | | | (1,639 | ) | | — | | | — | | | (1,639 | ) |
Net realized gain (loss) on investments | | | 19,281 | | | — | | | (19,347 | ) | | (66 | ) |
Net change in unrealized appreciation (depreciation) on investments | | | 5,565 | | | — | | | (1,419 | ) | | 4,146 | |
Interest and other income of Consolidated Funds | | | — | | | 345,476 | | | (131 | ) | | 345,345 | |
Interest expense of Consolidated Funds | | | — | | | (145,737 | ) | | 695 | | | (145,042 | ) |
Net realized gain on investments of Consolidated Funds | | | — | | | 54,965 | | | — | | | 54,965 | |
Net change in unrealized appreciation on investments of Consolidated Funds | | | — | | | 66,413 | | | 931 | | | 67,344 | |
| | | | | | | | | | |
| | | | | | | | | | | | | | |
Total other income | | | 26,690 | | | 321,117 | | | (22,630 | ) | | 325,177 | |
| | | | | | | | | | |
| | | | | | | | | | | | | | |
Income before taxes | | | 58,703 | | | 280,480 | | | (64,508 | ) | | 274,675 | |
Income tax expense (benefit) | | | 2,514 | | | (9,209 | ) | | — | | | (6,695 | ) |
| | | | | | | | | | |
| | | | | | | | | | | | | | |
Net income | | | 56,189 | | | 289,689 | | | (64,508 | ) | | 281,370 | |
| | | | | | | | | | |
| | | | | | | | | | | | | | |
Less: Net income attributable to non-controlling interests and redeemable non-controlling interests in Consolidated Funds | | | — | | | 289,689 | | | (64,508 | ) | | 225,181 | |
Less: Net income attributable to non-controlling interests in consolidated subsidiaries | | | 13,342 | | | — | | | — | | | 13,342 | |
| | | | | | | | | | |
| | | | | | | | | | | | | | |
Net income attributable to controlling interests in AHI, AI and consolidated subsidiaries | | $ | 42,847 | | $ | — | | $ | — | | $ | 42,847 | |
| | | | | | | | | | |
| | | | | | | | | | | | | | |
| | | | | | | | | | | | | | |
| | | | | | | | | | |
82
Table of Contents
ARES HOLDINGS INC. AND ARES INVESTMENTS LLC
(Predecessors to Ares Management, L.P.)
Notes to the Combined and Consolidated Financial Statements (Continued)
For the Three Months Ended March 31, 2014 and 2013
and as of March 31, 2014 and December 31, 2013
(unaudited)
(Dollars in Thousands, Except Share Data and as Otherwise Noted)
14. CONSOLIDATING SCHEDULES (Continued)
| | | | | | | | | | | | | |
| | For the Year Ended December 31, 2013 | |
|---|
| | Consolidated
Company Entities | | Consolidated
Funds | | Eliminations | | Consolidated | |
|---|
Assets | | | | | | | | | | | | | |
Cash and cash equivalents | | $ | 89,802 | | $ | — | | $ | — | | $ | 89,802 | |
Restricted cash and cash equivalents | | | 13,344 | | | — | | | — | | | 13,344 | |
Investments, at fair value | | | 504,291 | | | — | | | (414,853 | ) | | 89,438 | |
Performance fees receivable | | | 481,751 | | | — | | | (344,069 | ) | | 137,682 | |
Derivative assets, at fair value | | | 1,164 | | | — | | | — | | | 1,164 | |
Due from affiliates | | | 130,625 | | | — | | | (21,705 | ) | | 108,920 | |
Intangible assets, net | | | 68,742 | | | — | | | — | | | 68,742 | |
Goodwill | | | 58,159 | | | — | | | — | | | 58,159 | |
Other assets | | | 96,904 | | | — | | | (23,304 | ) | | 73,600 | |
Assets of Consolidated Funds | | | | | | | | | | | | | |
Cash and cash equivalents | | | — | | | 1,638,003 | | | — | | | 1,638,003 | |
Investments, at fair value | | | — | | | 20,823,338 | | | — | | | 20,823,338 | |
Due from affiliates | | | — | | | 2,010 | | | — | | | 2,010 | |
Dividends and interest receivable | | | — | | | 133,158 | | | — | | | 133,158 | |
Receivable for securities sold | | | — | | | 427,871 | | | — | | | 427,871 | |
Derivative assets, at fair value | | | — | | | 14,625 | | | — | | | 14,625 | |
Other assets | | | — | | | 27,505 | | | (1,977 | ) | | 25,528 | |
| | | | | | | | | | |
| | | | | | | | | | | | | | |
Total assets | | $ | 1,444,782 | | $ | 23,066,510 | | $ | (805,908 | ) | $ | 23,705,384 | |
| | | | | | | | | | |
| | | | | | | | | | | | | | |
| | | | | | | | | | | | | | |
| | | | | | | | | | |
Liabilities | | | | | | | | | | | | | |
Debt obligations | | $ | 153,119 | | $ | — | | $ | — | | $ | 153,119 | |
Accounts payable, accrued expenses and other liabilities | | | 69,550 | | | — | | | (2,064 | ) | | 67,486 | |
Deferred tax liability, net | | | 21,002 | | | — | | | — | | | 21,002 | |
Performance fee compensation payable | | | 295,978 | | | — | | | — | | | 295,978 | |
Derivative liabilities, at fair value | | | 2,907 | | | — | | | — | | | 2,907 | |
Accrued compensation | | | 132,917 | | | — | | | — | | | 132,917 | |
Due to affiliates | | | 35,149 | | | — | | | (2,459 | ) | | 32,690 | |
Liabilities of Consolidated Funds | | | | | | | | | | | | | |
Accounts payable, accrued expenses and other liabilities | | | — | | | 95,839 | | | — | | | 95,839 | |
Payable for securities purchased | | | — | | | 945,115 | | | — | | | 945,115 | |
Derivative liabilities, at fair value | | | — | | | 75,115 | | | — | | | 75,115 | |
Due to affiliates | | | — | | | 92,211 | | | (89,516 | ) | | 2,695 | |
Securities sold short, at fair value | | | — | | | 1,633 | | | — | | | 1,633 | |
Deferred tax liability | | | — | | | 35,904 | | | — | | | 35,904 | |
CLO loan obligations | | | — | | | 11,838,396 | | | (64,239 | ) | | 11,774,157 | |
Fund borrowings | | | — | | | 2,070,598 | | | — | | | 2,070,598 | |
Mezzanine debt | | | — | | | 323,164 | | | — | | | 323,164 | |
| | | | | | | | | | |
| | | | | | | | | | | | | | |
Total liabilities | | | 710,622 | | | 15,477,975 | | | (158,278 | ) | | 16,030,319 | |
| | | | | | | | | | |
| | | | | | | | | | | | | | |
83
Table of Contents
ARES HOLDINGS INC. AND ARES INVESTMENTS LLC
(Predecessors to Ares Management, L.P.)
Notes to the Combined and Consolidated Financial Statements (Continued)
For the Three Months Ended March 31, 2014 and 2013
and as of March 31, 2014 and December 31, 2013
(unaudited)
(Dollars in Thousands, Except Share Data and as Otherwise Noted)
14. CONSOLIDATING SCHEDULES (Continued)
| | | | | | | | | | | | | |
| | For the Year Ended December 31, 2013 | |
|---|
| | Consolidated
Company Entities | | Consolidated
Funds | | Eliminations | | Consolidated | |
|---|
Commitments and contingencies | | | | | | | | | | | | | |
Redeemable interest in Consolidated Funds | | | — | | | 1,093,770 | | | — | | | 1,093,770 | |
Redeemable interest in AHI, AI and consolidated subsidiaries | | | 40,751 | | | — | | | — | | | 40,751 | |
Non-controlling interest in Consolidated Funds: | | | | | | | | | | | | | |
Non-controlling interest in Consolidated Funds | | | — | | | 6,339,504 | | | (647,630 | ) | | 5,691,874 | |
Equity appropriated for Consolidated Funds | | | — | | | 155,261 | | | — | | | 155,261 | |
| | | | | | | | | | |
| | | | | | | | | | | | | | |
Non-controlling interest in Consolidated Funds | | | — | | | 6,494,765 | | | (647,630 | ) | | 5,847,135 | |
| | | | | | | | | | |
| | | | | | | | | | | | | | |
Non-controlling interest in equity of AHI, AI and consolidated subsidiaries | | | 167,731 | | | — | | | — | | | 167,731 | |
Controlling interest in equity of AHI, AI and consolidated subsidiaries: | | | | | | | | | | | | | |
Members' equity | | | 321,891 | | | — | | | — | | | 321,891 | |
Common stock (class A shares, 50,000 authorized, 5,010 shares issued and outstanding, $0.001 par value) | | | 0 | | | — | | | — | | | 0 | |
Additional paid in capital | | | 338,375 | | | — | | | — | | | 338,375 | |
Retained earnings | | | (135,573 | ) | | — | | | — | | | (135,573 | ) |
Accumulated other comprehensive gain | | | 985 | | | — | | | — | | | 985 | |
| | | | | | | | | | |
| | | | | | | | | | | | | | |
Total controlling interest in equity of AHI, AI and consolidated subsidiaries | | | 525,678 | | | — | | | — | | | 525,678 | |
| | | | | | | | | | |
| | | | | | | | | | | | | | |
Total equity | | | 693,409 | | | 6,494,765 | | | (647,630 | ) | | 6,540,544 | |
| | | | | | | | | | |
| | | | | | | | | | | | | | |
Total liabilities, redeemable interests, non-controlling interests and equity | | $ | 1,444,782 | | $ | 23,066,510 | | $ | (805,908 | ) | $ | 23,705,384 | |
| | | | | | | | | | |
| | | | | | | | | | | | | | |
| | | | | | | | | | | | | | |
| | | | | | | | | | |
84
Table of Contents
ARES HOLDINGS INC. AND ARES INVESTMENTS LLC
(Predecessors to Ares Management, L.P.)
Notes to the Combined and Consolidated Financial Statements (Continued)
For the Three Months Ended March 31, 2014 and 2013
and as of March 31, 2014 and December 31, 2013
(unaudited)
(Dollars in Thousands, Except Share Data and as Otherwise Noted)
14. CONSOLIDATING SCHEDULES (Continued)
| | | | | | | | | | | | | |
| | For the Three Months Ended March 31, 2013 | |
|---|
| | Consolidated
Company Entities | | Consolidated
Funds | | Eliminations | | Consolidated | |
|---|
Revenues | | | | | | | | | | | | | |
Management fees (includes ARCC Part I Fees of $23,836) | | $ | 108,630 | | $ | — | | $ | (30,236 | ) | $ | 78,394 | |
Performance fees | | | 99,413 | | | — | | | (74,259 | ) | | 25,154 | |
Other fees | | | 4,660 | | | — | | | (671 | ) | | 3,989 | |
| | | | | | | | | | |
| | | | | | | | | | | | | | |
Total revenues | | | 212,703 | | | — | | | (105,166 | ) | | 107,537 | |
| | | | | | | | | | |
| | | | | | | | | | | | | | |
Expenses | | | | | | | | | | | | | |
Compensation and benefits | | | 71,975 | | | — | | | — | | | 71,975 | |
Performance fee compensation | | | 63,002 | | | — | | | — | | | 63,002 | |
General, administrative and other expense | | | 16,982 | | | — | | | — | | | 16,982 | |
Consolidated Fund expenses | | | — | | | 122,345 | | | (61,237 | ) | | 61,108 | |
| | | | | | | | | | |
| | | | | | | | | | | | | | |
Total expenses | | | 151,959 | | | 122,345 | | | (61,237 | ) | | 213,067 | |
| | | | | | | | | | |
| | | | | | | | | | | | | | |
Other income (expense) | | | | | | | | | | | | | |
Interest and other income | | | 2,208 | | | — | | | (1,557 | ) | | 651 | |
Interest expense | | | (2,425 | ) | | — | | | — | | | (2,425 | ) |
Net realized gain (loss) on investments | | | 19,577 | | | — | | | (20,714 | ) | | (1,137 | ) |
Net change in unrealized appreciation on investments | | | 3,050 | | | — | | | 5,235 | | | 8,285 | |
Interest and other income of Consolidated Funds | | | — | | | 311,686 | | | (196 | ) | | 311,490 | |
Interest expense of Consolidated Funds | | | — | | | (131,178 | ) | | 5,220 | | | (125,958 | ) |
Net realized gain on investments of Consolidated Funds | | | — | | | 57,956 | | | — | | | 57,956 | |
Net change in unrealized appreciation (depreciation) on investments of Consolidated Funds | | | — | | | 105,225 | | | (973 | ) | | 104,252 | |
| | | | | | | | | | |
| | | | | | | | | | | | | | |
Total other income | | | 22,410 | | | 343,689 | | | (12,985 | ) | | 353,114 | |
| | | | | | | | | | |
| | | | | | | | | | | | | | |
Income before taxes | | | 83,154 | | | 221,344 | | | (56,914 | ) | | 247,584 | |
Income tax expense | | | 8,611 | | | 15,839 | | | — | | | 24,450 | |
| | | | | | | | | | |
| | | | | | | | | | | | | | |
Net income | | | 74,543 | | | 205,505 | | | (56,914 | ) | | 223,134 | |
| | | | | | | | | | |
| | | | | | | | | | | | | | |
Less: Net income attributable to non-controlling interests and redeemable non-controlling interests in Consolidated Funds | | | — | | | 205,505 | | | (56,914 | ) | | 148,591 | |
Less: Net income attributable to non-controlling interests in consolidated subsidiaries | | | 12,601 | | | — | | | — | | | 12,601 | |
| | | | | | | | | | |
| | | | | | | | | | | | | | |
Net income attributable to controlling interests in AHI, AI and consolidated subsidiaries | | $ | 61,942 | | $ | — | | $ | — | | $ | 61,942 | |
| | | | | | | | | | |
| | | | | | | | | | | | | | |
| | | | | | | | | | | | | | |
| | | | | | | | | | |
85
Table of Contents
MANAGEMENT'S DISCUSSION AND ANALYSIS
OF FINANCIAL CONDITION AND RESULTS OF OPERATIONS
The historical combined and consolidated financial statements included elsewhere in this Quarterly Report on Form 10-Q and discussed below are those of AHI and AI, which directly or indirectly hold controlling interests in Ares Management LLC and AIH LLC, as well as their wholly owned subsidiaries that, prior to the reorganization on May 1, 2014 in connection with our initial public offering, were under common control of our individual partners and common ownership of our individual partners with minority non-control oriented investments with limited voting rights by entities affiliated with ADIA and Alleghany. Our "Predecessors" refers to AHI and AI, our accounting predecessors, as well as their wholly owned subsidiaries and managed funds, in each case prior to our Reorganization (as described under "—Recent Transactions").
Such analysis should be read in conjunction with the historical combined and consolidated financial statements of AHI and Ares Investments LLC and the related notes included in this Quarterly Report on Form 10-Q, our prospectus dated May 1, 2014 filed with the SEC in accordance with Rule 424(b) of the Securities Act of 1933 on May 5, 2014, and the audited financial statements and footnotes of AHI and Ares Investments LLC included therein. For ease of reference, we refer to the historical financial results of AHI and Ares Investments LLC as being "our" historical financial results. Unless the context otherwise requires, references to "we," "us," "our," and "the Company" are intended to mean the business and operations of Ares Management, L.P. and its consolidated subsidiaries since the consummation of the reorganization on May 1, 2014 in connection with our initial public offering. When used in the historical context (i.e., prior to May 1, 2014), these terms are intended to mean the business and operations of AHI and Ares Investments LLC.
Amounts and percentages presented throughout our discussion and analysis of financial condition and results of operations may reflect rounding adjustments and consequently totals may not appear to sum. The highlights listed below have had significant effects on many items within our combined and consolidated financial statements and affect the comparison of the current period's activity with those of prior periods.
Our Business
We are a leading global alternative asset manager that operates four distinct but complementary investment groups, which are our reportable segments: Tradable Credit Group, Direct Lending Group, Private Equity Group and Real Estate Group.
- •
- Tradable Credit Group: Our Tradable Credit Group is a leading participant in the tradable, non-investment grade corporate credit markets, with approximately $31.4 billion of assets under management as of March 31, 2014. The group manages various types of investment funds, ranging from comingled and separately managed accounts for institutional investors to publicly traded vehicles and sub-advised funds for retail investors. While each of the group's approximately 70 funds is tailored to specific investment objectives, mandates can be broadly categorized between long-only credit and alternative credit investment strategies. Long-only credit funds primarily seek to outperform the corresponding performing bank loan or high yield market indices. Alternative credit funds primarily seek to deliver compelling absolute risk-adjusted returns relative to publicly traded stocks, hedge funds, distressed funds, bank loans, high yield bonds or other investment types.
- •
- Direct Lending Group: Our Direct Lending Group is one of the largest self-originating direct lenders to the U.S. and European markets, with approximately $27.6 billion of assets under management across over 30 funds or investment vehicles as of March 31, 2014. The group provides one-stop financing solutions to small-to-medium sized companies, which we believe are increasingly underserved by traditional lenders. The group launched its inaugural vehicle dedicated to direct lending, ARCC, ten years ago as a business development company. ARCC has grown to become the largest business development company, by both market capitalization and total assets, and has a nearly ten year track record of investment outperformance. In 2007, the group extended its direct lending capabilities into Europe and raised its first dedicated fund. The Direct Lending Group's European platform is one of the most significant participants in the European middle market. The group generates fees from over 30 other funds that include separately managed accounts for large institutional investors seeking tailored investment solutions, comingled funds and joint venture lending programs with affiliates of General Electric Company.
86
Table of Contents
- •
- Private Equity Group: Our Private Equity Group has achieved compelling investment returns for a loyal and growing group of high profile limited partners and has approximately $9.8 billion of assets under management as of March 31, 2014. The group focuses on majority or shared-control investments, principally in under-capitalized companies. The group manages five private equity comingled funds: Ares Corporate Opportunities Fund I ("ACOF I") ($751 million fund size / 2003 vintage), Ares Corporate Opportunities Fund II ("ACOF II") ($2.1 billion fund size / 2006 vintage), Ares Corporate Opportunities Fund III ("ACOF III") ($3.5 billion fund size / 2008 vintage) and Ares Corporate Opportunities Fund IV ("ACOF IV") ($4.7 billion fund size / 2012 vintage), which focus primarily on North America and, to a lesser extent, Europe, and Ares Corporate Opportunities Fund Asia ("ACOF Asia") ($220 million fund size / 2011 vintage), which focuses on growth equity opportunities in China.
- •
- Real Estate Group: Our Real Estate Group manages comprehensive public and private equity and debt strategies, with approximately $8.3 billion of assets under management as of March 31, 2014. Our Real Estate Group focuses on lending and investing assets that have been under-managed or need repositioning in their markets. The group has achieved significant scale in a short period of time through various acquisitions and successful fundraising efforts, including our recent acquisition of AREA Property Partners, L.P. ("AREA") in July 2013 ("AREA Acquisition"). The group provides investors access to its capabilities through its publicly traded commercial mortgage REIT, ACRE, focused on direct lending on properties owned by commercial real estate sponsors and operators, U.S. and European real estate private equity comingled funds, separately managed accounts and other fund types. In addition to our $8.3 billion of assets under management, we service a portfolio of over $5.2 billion in mortgage loans principally through a subsidiary of ACRE.
Our Operations Management Group ("OMG") consists of five independent, shared resource groups to support our reportable segments by providing infrastructure and administrative support in the areas of accounting/finance, operations/information technology, business development, legal/compliance and human resources. Additionally, the OMG provides services to certain of our investment companies and partnerships, which reimburse the OMG for expenses equal to the costs of services provided. Our clients seek to partner with investment management firms that not only have compelling investment track records across multiple investment products but also possess seasoned infrastructure support functions. As such, significant investments have been made to develop the OMG. We have successfully launched new business lines, integrated acquired businesses into the operations and created scale within the OMG to support a much larger platform in the future. The OMG's expenses are not allocated to our four reportable segments but we do consider the cost structure of the OMG when evaluating our financial performance.
The focus of our business model is to provide our investment management capabilities through various funds and products that meet the needs of a wide range of institutional and retail investors. Our revenues consist primarily of management fees and performance fees, as well as investment income and administrative expense reimbursements. Management fees are generally based on a defined percentage of average fair value of assets, total commitments, invested capital, net asset value, net investment income or par value of the investment portfolios we manage. Performance fees are based on certain specific hurdle rates as defined in our Consolidated Funds' and non-consolidated funds' applicable investment management or partnership agreements and may be either an incentive fee or carried interest. Investment income (loss) represents the realized and unrealized appreciation (depreciation) resulting from the investments of AIH LLC and the Consolidated Funds. We also provide administrative services to certain of our affiliated funds that are reported as other fees. In accordance with GAAP, we are required to consolidate those funds in which we hold a general partner interest that gives us substantive control rights over those funds. However, for segment reporting purposes, we present revenues and expenses on a combined segment basis, which deconsolidates these funds and therefore shows the results of our reportable segments without giving effect to the consolidation of the funds. Accordingly, our segment revenues consist of management fees, administrative fees and other income, as well as realized and unrealized performance fees, and net investment income. Our segment expenses consist of compensation and benefits, general, administrative and other expenses, as well as realized and unrealized performance fee compensation.
87
Table of Contents
Our businesses are subject to a number of inherent risks. We believe that the primary risks affecting our businesses which could have an adverse impact on our revenues and profitability include:
- •
- a complex regulatory and tax environment, which could restrict our operations or the operations of our funds and portfolio companies and subject us to increased compliance costs and administrative burdens, as well as restrictions on our business activities;
- •
- the potential enactment of legislation that would preclude us from qualifying for treatment as a partnership for U.S. federal income tax purposes under the publicly traded partnership rules. If this or any similar legislation or regulation were to be enacted and were to apply to us, we would incur a material increase in our tax liability;
- •
- poor performance by our funds due to market conditions, political environments, monetary and fiscal policy or other conditions beyond our control;
- •
- the reputational harm that we would experience as a result of inappropriately addressing conflicts of interest, poor performance by the investments we and our funds make or the actual or alleged failure by us, our employees, our funds or our portfolio companies to comply with applicable regulations and the increasingly complex political and regulatory environment;
- •
- potential variability in our period to period earnings due primarily to mark-to-market valuations of our unrealized investments. As a result of this variability, the market price of our common units may be volatile and subject to fluctuations;
- •
- the increasing demands of the investing community, including the potential for fee compression and changes to other terms, which could materially adversely affect our revenues; and
- •
- an investment in our common units is not an investment in our underlying funds. Moreover, there can be no assurance that projections respecting performance of our underlying funds or unrealized values will be achieved.
Trends Affecting Our Business
We believe that our disciplined investment philosophy across our four distinct but complementary investment groups contributes to the stability of our firm's performance throughout market cycles. Additionally, as approximately 60.5% of our AUM was in funds with a contractual life of seven years or more as of March 31, 2014, our funds have a stable base of committed capital which enables us to invest in assets with a long term focus over different points in a market cycle and take advantage of market volatility. However, our results of operations, including the fair value of our AUM, are affected by a variety of factors, including conditions in the global financial markets and the economic and political environments, particularly in the United States and Western Europe.
In general, 2013 was characterized by the ongoing economic recovery and increasing investor demand to achieve higher yields given historically low interest rates fueled by central banks' activities. While the economic recovery in the United States and elsewhere has continued, it has bypassed certain sub-sectors of the finance and non-investment grade credit markets. In Europe, monetary measures forestalled long-anticipated fire-sales by banks of their troubled assets, but the banks' weakened financial condition created a partial void in the availability of debt capital for many of their traditional corporate borrowers. Investors' desire to achieve higher yield, coupled with low interest rates, continue to drive corporate bond issuance to record levels in the United States and Europe, while the generally positive economic and liquidity environments kept corporate default rates low. Credit indices continued to rise in 2013, with the Merrill Lynch U.S. High Yield Master II Index returning 7.42% and the Credit Suisse Leveraged Loan Index returning 6.15% during the year. Amid improving economic conditions and tapering initiatives by the Federal Open Market Committee, benchmark Treasury rates moved up from historic lows, increasing market speculation surrounding rising interest rates. As rising equity markets neared pre-crisis highs, new issuance of convertible securities slowly restarted after residing at historically low levels since the onset of the crisis.
88
Table of Contents
U.S. economic activity stalled during the first quarter of 2014, as an abnormally harsh winter limited spending and production while job growth slowed. Benchmark Treasury rates fell, alleviating (at least temporarily) concerns surrounding rising interest rates. As a result, fixed rate instruments led performance during the first quarter of 2014, with the BofA Merrill Lynch U.S. High Yield Master II Index returning 3.00% versus a 1.30% return for the Credit Suisse Leveraged Loan Index. Following a strong 2013, equity markets seemingly looked for direction during the first quarter, returning 1.81% with intermittent bouts of volatility. Amid expectations that weak first quarter results were a temporary phenomenon, the Federal Open Market Committee continued tapering initiatives, a position supported by improving economic activity reported in the second quarter.
In Europe, economic activity continued to improve, with market sentiment supported by expectations of future stimulus measures from the European Central Bank. However, risks remain elevated amid uncertainty surrounding political unrest in Ukraine, particularly given Europe's significant reliance on Russia for gas.
For Ares' businesses, these markets and economies have created opportunities, particularly in the Direct Lending Group and Tradable Credit Group alternative credit funds, which utilize flexible investment mandates to manage portfolios through market cycles. As market conditions shift and default risk and interest rate risk come under greater focus, having the ability to move up and down the capital structure enables both our Direct Lending and Tradable Credit Groups to reduce risk and defensively position portfolios in senior secured assets in advance of an increase in expected default risk, while at the same time reallocating to higher returning, unsecured assets as defaults peak and begin to decline. Similarly, given our broad capabilities in leveraged loans, such flexibility enables our Tradable Credit and Direct Lending Groups to reduce sensitivities to changing interest rates by increasing allocations to floating rate leveraged loans. On a market value basis, approximately 80% of the debt assets within our Tradable Credit Group and approximately 90% within our Direct Lending Group are floating rate instruments, which we believe helps mitigate volatility associated with changes in the treasury curve.
In addition to these macroeconomic trends and market factors, our future performance is heavily dependent on our ability to attract new capital, generate strong, stable returns, source investments with attractive risk-adjusted returns and provide attractive products to a growing investor base. We believe the following factors will influence our future performance:
- •
- The extent to which investors favor alternative investments. Our ability to attract new capital is dependent on investors' views of alternative assets relative to traditional assets. We believe fundraising efforts will continue to be impacted by certain fundamental asset management trends that include: (1) the increasing importance and market share of alternative investment strategies to investors of all types as investors focus on lower-correlated and absolute levels of return, (2) increasing demand for alternative assets from retail investors, (3) shifting asset allocation policies of institutional investors, (4) de-leveraging of the global banking system, bank consolidation and increased regulatory requirements and (5) increasing barriers to entry and growth.
- •
- Our ability to generate strong, stable returns and retain investor capital throughout the market cycle. The strength and stability of our funds' investment performance is a significant factor in investors' willingness to allocate capital to us. The capital we are able to attract and retain drives the growth of our AUM, fee earning AUM and management fees we earn. Although over the past ten years we have grown AUM and management fees at compound annual growth rates of 30% and 33%, respectively, adverse market conditions or an outflow of capital in general from alternative asset classes could impact our future growth rate. Furthermore, market dislocations, contractions or volatility could put pressure on our returns in the future, which could in turn impact our fundraising abilities. Our ability to retain and attract investors is also exposed to an increasing desire on the part of limited partners to build deeper relationships with fewer general partners. Limited partners continue to place great emphasis on track record and distributions, making fundraising challenging for new managers.
89
Table of Contents
- •
- Our ability to source investments with attractive risk-adjusted returns. Our ability to continue to grow our revenue is dependent on our continued ability to source attractive investments and completely utilize the capital that we have raised. Because we pursue investment opportunities strategically as they arise and we have a long-term investment horizon, the capital deployed in any one quarter may vary significantly from the cumulative capital deployed in a given year. We believe that the current economic environment provides significant opportunities to pursue attractive investment opportunities. In addition, we believe that our ability to efficiently and effectively invest our growing pool of AUM puts us in a position to maintain our revenue growth over time. Our ability to identify attractive investments and execute on those investments is dependent on a number of factors, including the general macroeconomic environment, valuation, size, and the liquidity of such investment opportunity. A significant decrease in the quality or quantity of new issuance non-investment grade securities or a substantial increase in the corporate default rate could adversely affect our ability to source investments with attractive risk-adjusted returns.
- •
- The attractiveness of our product offering to the evolving complexion of investor types. Defined contribution plans and retail investors are demanding more exposure to alternative investment products to seek differentiated returns and current yields. Our publicly traded funds capitalize on these opportunities by offering retail investors the ability to take advantage of our market-leading investment groups. We believe that the breadth, diversity and number of investment vehicles we offer allow us to maximize our reach with investors.
- •
- Our ability to generate growth and stable earnings despite increased regulatory and compliance requirements. Following the most recent financial crisis, investors in alternative investments, including those managed by us, have heightened their focus on matters such as manager diligence, reporting transparency and compliance infrastructure. In response to this focus, we have invested heavily in our investment monitoring systems, compliance and enterprise risk management systems to proactively address both evolving investor expectations and the evolving regulatory landscape. While our financial margins have experienced some near term compression through incremental cost burdens as a result of the increased complexity in operating our business under these new requirements, our ability to generate stable earnings has helped us attract and retain investors who are now allocating a greater proportion of their assets to established, well-developed asset managers, such as Ares. We believe these investments will continue to support our strategic plans and enable stability of our earnings over time, particularly as our AUM grows.
Recent Transactions
On May 1, 2014, we executed a series of reorganization transactions to facilitate the initial public offering by the Company. The primary impact of the reorganization transactions was as follows:
- •
- We converted Ares Holdings LLC into a limited partnership, Ares Holdings L.P. ("Ares Holdings"), and converted Ares Investments LLC into a limited partnership, Ares Investments L.P. ("Ares Investments"). In addition, we formed Ares Domestic Holdings L.P. ("Ares Domestic"), Ares Offshore Holdings L.P. ("Ares Offshore") and Ares Real Estate Holdings L.P. ("Ares Real Estate"). Ares Holdings, Ares Domestic, Ares Offshore, Ares Investments and Ares Real Estate are collectively referred to as the "Ares Operating Group."
- •
- APMC was converted into a limited partnership and renamed Ares Owners Holdings L.P. In exchange for its interest in the Company, prior to the consummation of the initial public offering, Ares Owners Holdings L.P. transferred to the Company its interests in each of AHI, Ares Domestic Holdings Inc., Ares Offshore Holdings, Ltd., Ares Real Estate Holdings LLC and a portion of its interest in Ares Investments. Similarly, ADIA contributed its direct interest in AHI to its affiliate, AREC, and subsequently, AREC transferred to the Company its interests in each of AHI, Ares Domestic Holdings Inc., Ares Offshore Holdings, Ltd., Ares Investments and Ares Real Estate
90
Table of Contents
Holdings LLC. As a result of the foregoing, Ares Owners Holdings L.P. holds 34,540,079 common units in the Company and AREC holds 34,538,155 common units in the Company. Following the foregoing exchanges, Ares Owners Holdings L.P. retains a 59.21% direct interest, or 118,421,766 Ares Operating Group Units, in each of the Ares Operating Group entities and AREC has no direct interests in the Ares Operating Group entities. An affiliate of Alleghany Corporation owns a 6.25% direct interest, or 12,500,000 Ares Operating Group Units, in each of the Ares Operating Group entities.
On May 1, 2014, the board of directors of our general partner adopted the Ares Management, L.P. 2014 Equity Incentive Plan (the "Equity Incentive Plan"). The Equity Incentive Plan will be a source of new equity-based awards permitting us to grant to our employees, professionals, consultants, members, partners of our partnership or any affiliate and directors of our general partner non-qualified options, unit appreciation rights, common units, restricted units, deferred restricted units, phantom units, unit equivalent awards and other awards based on common units, to which we collectively refer as our "units." The total number of units which that were initially available for grants under the Equity Incentive Plan was 31,704,545.
In connection with the initial public offering, our general partner granted 4,650,525 restricted units to be settled in common units, 686,395 phantom common units to be settled in cash and options to acquire 24,729,541 common units under the Equity Incentive Plan. The weighted-average grant-date fair value was $16.15 per unit for the restricted units, $19.00 per unit for the phantom units and $4.01 per unit for the options. The options and restricted units will vest at a rate of one-third per year, beginning on the third anniversary of the grant date. The phantom units will vest at a rate of one-fifth per year on each of the first five anniversaries of the grant date. Refer to our prospectus dated May 1, 2014, filed with the SEC in accordance with Rule 424(b) of the Securities Act of 1933 on May 5, 2014, for additional information on the Equity Incentive Plan.
On May 7, 2014, the Company issued 11,363,636 common units in the initial public offering at the price of $19.00 per unit. In addition, on June 4, 2014, the Company issued an additional 225,794 common units at $19.00 per common unit pursuant to the partial exercise by the underwriters of their overallotment option. The common units are listed on the New York Stock Exchange under the symbol "ARES".
- •
- The net proceeds to the Company from the initial public offering, including from the partial exercise by the underwriters of their overallotment option, were approximately $209.2 million, after deducting underwriting discounts.
- •
- The Company (i) loaned a portion of the net proceeds from the initial public offering to its wholly owned subsidiary, AHI, which then contributed such amount to Ares Holdings in exchange for 11,589,430 partnership units of Ares Holdings, (ii) contributed a portion of the net proceeds from the initial public offering to Ares Domestic Holdings Inc., which then contributed such amount to Ares Domestic in exchange for 11,589,430 partnership units of Ares Domestic, (iii) contributed a portion of the net proceeds from the initial public offering to Ares Offshore Holdings, Ltd., which then contributed such amount to Ares Offshore in exchange for 11,589,430 partnership units of Ares Offshore, (iv) contributed a portion of the net proceeds from the initial public offering to Ares Investments in exchange for 11,589,430 partnership units of Ares Investments and (v) contributed a portion of the net proceeds from the initial public offering to Ares Real Estate Holdings LLC, which then contributed such amount to Ares Real Estate in exchange for 11,589,430 partnership units of Ares Real Estate. After the initial public offering, the Company owns, directly or indirectly, in aggregate, 80,667,664 Ares Operating Group Units (approximately 38.12%) in each of the Ares Operating Group entities.
91
Table of Contents
Following the reorganization and the initial public offering, the Company has become a holding partnership and, either directly or through direct subsidiaries, controls and holds equity interests in each of the Ares Operating Group entities, which in turn own the operating entities included in our historical combined and consolidated financial statements. We intend to conduct all of our material business activities through the Ares Operating Group. The Company, either directly or through direct subsidiaries, is the general partner of each of the Ares Operating Group entities, and operates and controls all of the businesses and affairs of the Ares Operating Group. In addition, the Company consolidates the financial results of the Ares Operating Group entities, their consolidated subsidiaries and certain Consolidated Funds. The ownership interest of the limited partners of the Ares Operating Group entities is reflected as a non-controlling interest in consolidated subsidiaries in the Company's combined and consolidated financial statements.
The Company entered into an exchange agreement with the holders of Ares Operating Group units so that such holders, subject to any applicable transfer restrictions and other provisions, may up to four times each year from and after the second anniversary of the date of the closing of the initial public offering exchange their Ares Operating Group Units for common units on a one-for-one basis (provided that Alleghany may exchange up to half of its Ares Operating Group Units from and after the first anniversary of the initial public offering).
Following the consummation of the initial public offering, including the partial exercise by the underwriters of their overallotment option, assuming no exchange of Ares Operating Group Units for common units, Ares Owners Holdings L.P. holds a 42.82% direct interest in the Company, AREC holds a 42.82% direct interest in the Company and the public holds a 14.37% direct interest in the Company.
Following the consummation of the initial public offering, including the partial exercise by the underwriters of their overallotment option, Ares Owners Holdings L.P. holds a 72.29% direct and indirect interest in the Ares Operating Group, an affiliate of Alleghany holds a 5.91% direct interest in the Ares Operating Group, AREC holds a 16.32% indirect interest in the Ares Operating Group and the public holds 5.48% indirect interest in the Ares Operating Group.
Refer to our prospectus dated May 1, 2014, filed with the SEC in accordance with Rule 424(b) of the Securities Act of 1933 on May 5, 2014, for additional information on the reorganization transactions and the initial public offering. For additional information concerning our recent transactions, please see our unaudited combined and consolidated financial statements included in this Quarterly Report on Form 10-Q.
Consolidation and Deconsolidation of Ares Funds
Pursuant to GAAP, we consolidate our Consolidated Funds in our combined and consolidated financial statements presented in this Quarterly Report on Form 10-Q. These funds represented approximately 31.0% of our AUM as of March 31, 2014 and 21.0% of our management fees and 73.2% of our performance fees for the three months ended March 31, 2014. As of March 31, 2014 and 2013, we consolidated 26 and 30 CLOs, respectively and 33 and 38 non-CLOs, respectively.
Under GAAP, we are required to consolidate (a) entities in which we hold a majority voting interest or have majority ownership and control over the operational, financial and investing decisions of that entity, including Ares-affiliates and affiliated funds and co-investment entities, for which we are the general partner and are presumed to have control, and (b) entities that we concluded are VIEs, including limited partnerships in which we have a nominal economic interest and the CLOs, for which we are deemed to be the primary beneficiary. However, we are not required under GAAP to consolidate in our combined and consolidated financial statements certain investment funds that we advise because such funds provide the limited partners with the right to dissolve the fund without cause by a simple majority vote of the Ares non-affiliated limited partners, which overcomes the presumption of control by us.
92
Table of Contents
In June 2009, the Financial Accounting Standards Board ("FASB") amended its guidance on accounting for VIEs. The new accounting guidance resulted in a change in our accounting policy effective January 1, 2010. Among other things, the new guidance (a) requires more qualitative than quantitative analysis to determine the primary beneficiary of a VIE, (b) requires continuous assessments of whether an enterprise is the primary beneficiary of a VIE, (c) enhances disclosures about an enterprise's involvement with a VIE, and (d) amends certain guidance for determining whether an entity is a VIE. Under the new guidance, a VIE must be consolidated if the enterprise has both (a) the power to direct the activities of the VIE that most significantly impact the entity's economic performance and (b) the obligation to absorb losses or the right to receive benefits from the VIE that could potentially be significant to the VIE. Beginning in January 2010, we consolidated the CLOs that we advise as a result of revisions to the accounting standards governing consolidations. As of March 31, 2014, the Company held $58.3 million of investments in these CLOs, which represents its maximum exposure to loss. During the three months ended March 31, 2014, we did not acquire any management contracts for CLOs.
The assets and liabilities of our Consolidated Funds are held within separate legal entities and, as a result, the liabilities of our Consolidated Funds are non-recourse to us. Generally, the consolidation of our Consolidated Funds has a significant gross-up effect on our assets, liabilities and cash flows but has no net effect on the net income attributable to our combined and consolidated results or on our total controlling equity. The majority of the net economic ownership interests of our Consolidated Funds are reflected as redeemable and non-redeemable non-controlling interests in the Consolidated Funds and equity appropriated for our Consolidated Funds in our combined and consolidated financial statements.
We generally deconsolidate CLOs upon liquidation or dissolution at the end of their finite lives. In contrast, the funds we advise are deconsolidated when we are no longer deemed to control the entity. For the three months ended March 31, 2014, one CLO and one partnership fund liquidated or dissolved and three VIEs experienced a significant change in ownership or control that resulted in deconsolidation.
The performance of our Consolidated Funds is not necessarily consistent with or representative of the combined performance trends of all of our funds. See Note 2, "Summary of Significant Accounting Policies," to our unaudited combined and consolidated financial statements included in this Quarterly Report on Form 10-Q.
Managing Business Performance
Non-GAAP Financial Measures
Economic Net Income. Economic net income (or "ENI") is a key performance indicator used in the alternative asset management industry. ENI represents net income excluding (a) income tax expense, (b) operating results of our Consolidated Funds, (c) depreciation expense, (d) the effects of changes arising from corporate actions, and (e) certain other items that we believe are not indicative of our performance. Changes arising from corporate actions include equity-based compensation expenses, the amortization of intangible assets, transaction costs associated with acquisitions and capital transactions, placement fees and underwriting costs and expenses incurred in connection with corporate reorganization. We believe the exclusion of these items provides investors with a meaningful indication of our core operating performance. ENI is evaluated regularly by our management as a decision tool for deployment of resources and to assess performance of our business segments. We believe that reporting ENI is helpful in understanding our business and that investors should review the same supplemental non-GAAP financial measures that our management uses to analyze our segment performance.
93
Table of Contents
Distributable Earnings. Distributable earnings (or "DE") is a pre income tax measure that is used to assess performance and amounts potentially available for distributions to stakeholders. Distributable earnings is calculated as the sum of Fee Related Earnings, realized performance fees, realized performance fee compensation expense, realized net other income, and further adjusts for expenses arising from transaction costs associated with acquisitions, placement fees and underwriting costs, expenses incurred in connection with corporate reorganization and depreciation. Distributable earnings differs from income before taxes computed in accordance with GAAP as it is presented before giving effect to unrealized performance fee income, unrealized performance fee compensation expense, unrealized net investment income, amortization of intangibles, equity compensation expense and is further adjusted by certain items described in "—Reconciliation of Certain Non GAAP Measures to Consolidated GAAP Financial Measures."
Fee Related Earnings. Fee related earnings (or "FRE") is a component of ENI and is used to assess the ability of our business to cover direct base compensation and operating expenses from management fees. FRE differs from income before taxes computed in accordance with GAAP as it adjusts for the items included in the calculation of ENI and excludes performance fees, performance fee compensation, investment income from our Consolidated Funds and certain other items.
Performance Related Earnings. Performance related earnings (or "PRE") is a measure used to assess our investment performance. PRE differs from income before taxes computed in accordance with GAAP as it only includes performance fee income, performance fee compensation expense and investment income earned from our Consolidated Funds and non-consolidated funds.
These non-GAAP financial measures supplement and should be considered in addition to and not in lieu of the results of operations discussed further under "—Overview of Combined and Consolidated Results of Operations", which are prepared in accordance with GAAP. For a reconciliation of these measures to the most comparable measure in accordance with GAAP, see "—Results of Operations by Segment—Reconciliation of Certain Non-GAAP Measures to Consolidated GAAP Financial Measures." See Note 12, "Segment Reporting," to our unaudited combined and consolidated financial statements included in this Quarterly Report on Form 10-Q.
Operating Metrics
We monitor certain operating metrics that are common to the alternative asset management industry.
Assets Under Management
Assets under management refers to the assets we manage. We view AUM as a metric to measure our investment and fundraising performance as it reflects assets generally at fair value plus available uncalled capital. For our funds other than CLOs, our AUM equals the sum of the following:
- •
- net asset value ("NAV") of such funds;
- •
- the drawn and undrawn debt (at the fund-level including amounts subject to restrictions); and
- •
- uncalled committed capital (including commitments to funds that have yet to commence their investment periods).
"NAV" refers to the:
- •
- value of all the assets of a fund (including cash and accrued interest and dividends); less
- •
- all liabilities of the fund (including accrued expenses and reserves for contingent liabilities).
For our funds that are CLOs, our AUM is equal to subordinated notes (equity) plus all drawn and undrawn debt tranches.
94
Table of Contents
The table below provides the period-to-period roll forward of AUM:
| | | | | | | |
| | As of March 31, | |
|---|
| | 2014 | | 2013 | |
|---|
| | (Dollars in millions)
| |
|---|
Consolidated Segments | | | | | | | |
Change in AUM: | | | | | | | |
Beginning of period | | $ | 74,005 | | $ | 60,158 | |
Commitments(1) | | | 4,834 | | | 2,285 | |
Capital reduction(2) | | | (1,394 | ) | | (1,388 | ) |
Distributions(3) | | | (1,280 | ) | | (902 | ) |
Change in fund value(4) | | | 881 | | | 543 | |
| | | | | | |
| | | | | | | | |
End of period | | $ | 77,046 | | $ | 60,696 | |
| | | | | | |
| | | | | | | | |
| | | | | | | | |
| | | | | | |
Average AUM | | $ | 75,525 | | $ | 60,427 | |
- (1)
- Represents new commitments during the period, including equity and debt commitments and gross inflows into our open-ended managed accounts and sub-advised accounts, as well as equity offerings by our publicly traded vehicles.
- (2)
- Represents the permanent reduction in leverage during the period.
- (3)
- Represents distributions and redemptions net of recallable amounts.
- (4)
- Includes fund net income, including interest income, realized and unrealized gains (losses), fees and expenses and the impact of foreign currency.
As of March 31, 2014 and 2013, our uninvested AUM was $18.2 billion and $13.3 billion, respectively, primarily attributable to the Direct Lending Group and the Private Equity Group.
Please refer to "—Results of Operations by Segment" for a detailed discussion by segment of the activity affecting total AUM for each of the periods presented.
Fee Earning Assets Under Management
Fee earning AUM refers to the AUM on which we directly or indirectly earn management fees. We view fee earning AUM as a metric to measure changes in the assets from which we earn management fees. Our fee earning AUM is the sum of all the individual fee bases of our funds that contribute directly or indirectly to our management fees and generally equals the sum of:
- •
- for certain closed-end funds within the reinvestment period in the Tradable Credit Group, the Private Equity Group funds and certain private funds in the Real Estate Group, the amount of limited partner capital commitments (see "Fee earning AUM based on capital commitments" in the "Components of fee earning AUM" table below for the amount of this component of fee earning AUM as of each period);
- •
- for the aforementioned closed-end funds beyond the reinvestment period as well as the structured assets funds in the Tradable Credit Group, certain managed accounts within their reinvestment period, the mezzanine fund in the Direct Lending Group and European funds in the Direct Lending Group and co-invest vehicles in the Real Estate Group, the amount of limited partner invested capital (see "Fee earning AUM based on invested capital" in the "Components of fee earning AUM" table below for the amount of this component of fee earning AUM as of each period);
95
Table of Contents
- •
- for CLOs, the gross amount of aggregate collateral balance at par, adjusted for defaulted or discounted collateral (see "Fee earning AUM based on collateral balances, at par" in the "Components of fee earning AUM" table below for the amount of this component of fee earning AUM as of each period); and
- •
- for the remaining funds in the Tradable Credit Group, ARCC, certain managed accounts in the Direct Lending Group and certain debt funds in the Real Estate Group, the portfolio value, gross asset value or NAV, adjusted in certain instances for cash or certain accrued expenses (see "Fee earning AUM based on market value and other" in the "Components of fee earning AUM" table below for the amount of this component of fee earning AUM as of each period).
Fee earning AUM in the Direct Lending Group includes the AUM of Senior Secured Loan Fund LLC (the "SSLP"), a program co-managed by a subsidiary of Ares through which ARCC co-invests with affiliates of General Electric Company, and from Ivy Hill Asset Management, L.P., a wholly owned portfolio company of ARCC and a registered investment adviser, on which we indirectly generate fees, in each case calculated in accordance with the above.
Our calculations of fee earning AUM and AUM may differ from the calculations of other alternative asset managers and, as a result, this measure may not be comparable to similar measures presented by others. In addition, our calculations of fee earning AUM and AUM may not be based on any definition of fee earning AUM or AUM that is set forth in the agreements governing the investment funds that we advise.
The table below provides the period-to-period roll forward of fee earning AUM:
| | | | | | | |
| | As of March 31, | |
|---|
| | 2014 | | 2013 | |
|---|
| | (Dollars in millions)
| |
|---|
Consolidated segments | | | | | | | |
Change in fee earning AUM: | | | | | | | |
Beginning of period | | $ | 59,162 | | $ | 47,582 | |
Acquisitions | | | — | | | — | |
Commitments(1) | | | 259 | | | 1,160 | |
Subscriptions/deployment/increase in leverage(2) | | | 1,731 | | | 371 | |
Redemption/distributions/decrease in leverage(3) | | | (4,653 | ) | | (1,721 | ) |
Change in fund value(4) | | | 768 | | | 363 | |
Change in fee basis(5) | | | (39 | ) | | (167 | ) |
| | | | | | |
| | | | | | | | |
End of period | | $ | 57,228 | | $ | 47,588 | |
| | | | | | |
| | | | | | | | |
| | | | | | | | |
| | | | | | |
Average AUM | | $ | 58,195 | | $ | 47,585 | |
- (1)
- Represents new commitments during the period for funds that earn management fees based on committed capital.
- (2)
- Represents subscription, capital deployment and increase in leverage (for funds that earn fees on a gross asset basis).
- (3)
- Represents redemptions, distributions and decrease in leverage (for funds that earn fees on a gross asset basis).
- (4)
- Includes fund net income, including interest income, realized and unrealized gains (losses), fees and expenses and the impact of foreign currency for funds that earn management fees based on market value.
- (5)
- Represents the change of fee basis from committed capital to invested capital.
96
Table of Contents
The table below breaks out fee earning AUM by its respective components at each period:
| | | | | | | |
| | As of March 31, | |
|---|
| | 2014 | | 2013 | |
|---|
| | (Dollars in millions)
| |
|---|
Consolidated segments | | | | | | | |
Components of fee earning AUM | | | | | | | |
Fee earning AUM based on capital commitments(1) | | $ | 5,975 | | $ | 4,828 | |
Fee earning AUM based on invested capital(2) | | | 10,594 | | | 6,916 | |
Fee earning AUM based on market value/other(3) | | | 19,463 | | | 14,879 | |
Fee earning AUM based on collateral balances, at par(4) | | | 21,196 | | | 20,964 | |
| | | | | | |
| | | | | | | | |
Total fee earning AUM | | $ | 57,228 | | $ | 47,588 | |
| | | | | | |
| | | | | | | | |
| | | | | | | | |
| | | | | | |
- (1)
- Reflects limited partner capital commitments to funds for which the investment period has not expired.
- (2)
- Reflects limited partner invested capital and GP invested capital for certain funds in the Real Estate Group.
- (3)
- Market value/other include variances for some funds that are attributable to management fee basis calculations based on average portfolio values or beginning of period values.
- (4)
- Reflects the gross amount of aggregate collateral balances, at par, for our CLOs and the SSLP.
Fund Performance Metrics
Fund performance information for our investment funds that contributed at least 1% of our total management fees for the three months ended March 31, 2014, which we refer to as our "significant funds," is included throughout this discussion and analysis to facilitate an understanding of our results of operations for the periods presented. In addition to management fees, each of these funds is eligible to receive incentive fees upon the achievement of performance hurdles. The fund performance information reflected in this discussion and analysis is not necessarily indicative of our performance and is also not necessarily indicative of the future performance of any particular fund. An investment in Ares is not an investment in any of our funds. Past performance is not necessarily indicative of future results. As with any investment there is always the potential for gains as well as the possibility of losses. There can be no assurance that any of our funds or our other existing and future funds will achieve similar returns. See "—Results of Operations by Segment—Tradable Credit Group—Fund Performance Metrics for the Three Months Ended March 31, 2014," "—Direct Lending Group—Fund Performance Metrics for the Three Months Ended March 31, 2014," "—Private Equity Group—Fund Performance Metrics for the Three Months Ended March 31, 2014" and "—Real Estate Group—Fund Performance Metrics for the Three Months Ended March 31, 2014."
Overview of Combined and Consolidated Results of Operations
Revenues
Revenues primarily consist of management fees and performance fees.
Management Fees. Management fees are generally based on a defined percentage of average fair value of assets, total commitments, invested capital, NAV, net investment income or par value of the investment portfolios managed by us. The fees are generally based on a quarterly measurement period and amounts can be paid in advance or in arrears depending on each specific fund. Management fees also include a quarterly performance fee on investment income ("ARCC Part I Fees") from ARCC, our publicly traded business development company registered under the Investment Company Act of 1940, which is managed by our subsidiary. ARCC Part I Fees are equal to 20% of its net investment income (before
97
Table of Contents
ARCC Part I Fees and incentive fees payable based on ARCC's net capital gains ("ARCC Part II Fees")), subject to a fixed "hurdle rate" of 1.75% per quarter, or 7.0% per annum. No fee is earned until ARCC's net investment income exceeds a 1.75% hurdle rate, with a "catch up" provision that serves to ensure that we receive 20% of ARCC's fee net investment income from the first dollar earned. ARCC Part I Fees are classified as management fees as they are predictable and are recurring in nature, are not subject to repayment (or clawback) and are generally cash-settled each quarter. Management fees are recognized as revenue in the period advisory services are rendered, subject to our assessment of collectability.
- •
- Tradable Credit Group long-only credit funds: Management fees generally range from 0.45% to 0.65% of principal par plus cash or NAV. The funds in the leveraged loan funds strategy have an average management contract term of 12.4 years as of March 31, 2014, and the fee ranges generally remain unchanged at the close of the re-investment period. The funds in the high-yield strategy generally represent open-ended managed accounts, which typically do not include investment period termination or management contract expiration dates. The funds may provide for management fee rate decreases as the NAV of the funds exceeds certain negotiated amounts.
- •
- Tradable Credit Group alternative credit funds: Management fees generally range from 0.50% to 1.75% of NAV, gross asset value, committed capital or invested capital. The funds in the credit opportunities strategy generally include open-ended or managed account structures, which typically do not include investment period termination or management contract expiration dates. The funds in the dynamic credit strategy are comprised of publicly-traded closed-end funds, which typically do not include investment period termination or management contract termination dates. The funds in the special situations strategy are comprised of closed-end funds, with investment period termination or management contract termination dates and managed accounts, which do not include investment period termination or management contract termination dates. For certain closed-end funds in this strategy, following the expiration or termination of the investment period the management fees step down to 1.00% of the aggregate adjusted cost of unrealized portfolio investments. The funds in this strategy have an average management contract term of 10.0 years as of March 31, 2014.
- •
- Direct Lending Group funds: Management fees generally range from 0.75% to 2.00% of invested capital, NAV or total assets. Following the expiration or termination of the investment period, the management fees, for certain closed end funds and managed accounts in this strategy generally step down to between 0.50% and 1.50% of the aggregate cost or market value of the portfolio investments. In addition, management fees include the ARCC Part I Fees. The funds in this strategy have an average management contract term of 9.5 years as of March 31, 2014.
- •
- Private Equity Group funds: Management fees generally range from 1.50% to 2.00% of total capital commitments during the investment period. The management fees for such funds generally step down to between 0.75% and 1.125% of the aggregate adjusted cost of unrealized portfolio investments following the earlier to occur of: (i) the expiration or termination of the investment period or (ii) the launch of a successor fund. The funds in this strategy have an average management contract term of 12.5 years as of March 31, 2014.
- •
- Real Estate Group funds: Management fees generally range from 0.50% to 1.50% of invested capital, stockholders' equity or total capital commitments. Following the expiration or termination of the investment period, the basis on which management fees are earned, for certain closed-end funds, managed accounts and co-investment vehicles in this strategy, changes from committed capital to invested capital with no change in the management fee rate. The funds in this strategy have an average management contract term of 9.6 years as of March 31, 2014.
98
Table of Contents
One-time deferred management fees represent base management fees that are generally calculated on a fixed percentage of principal par. Deferred management fees arise when a fund does not have sufficient liquidity to make payments or may be restricted by certain covenants from making payment. In some instances, we also defer management fees until certain performance conditions are met. If management fees are deferred, we will not recognize any management fees until collectability is assured. The amount of deferred management fees recognized by us typically increases with the length of time the fees are deferred. As of March 31, 2014, we do not have any management fees that are deferred.
As of the reporting date, accrued but unpaid management fees, net of management fee reductions and management fee offsets, are included under management fees receivable in Note 10, "Related Party Transactions," to our unaudited combined and consolidated financial statements included in this Quarterly Report on Form 10-Q.
Performance Fees. Performance fees are based on certain specific hurdle rates as defined in our Consolidated Funds' and non-consolidated funds' applicable investment management or partnership agreements. Performance fees are recorded on an accrual basis to the extent such amounts are contractually due. We have elected to adopt Method 2 of FASB Accounting Standards Codification ("ASC") 605-20, Revenue Recognition ("ASC 605") for revenue based on a formula. Under this method, we generally accrue for a performance-based fee if the return has exceeded certain hurdles or benchmarks. The investment returns of most of our funds are volatile. Performance fees are assessed as a percentage of the investment performance of the funds. The performance fee measurement period varies from type of fund. The performance fees from our alternative credit funds and ARCC Part II Fees are measured and paid on an annual basis. The performance fees from our Tradable Credit Group long-only credit funds, Tradable Credit Group alternative credit funds, Direct Lending Group managed accounts and Private Equity Group funds are generally measured at liquidation of the fund, as fund return hurdles are cumulative. For the Tradable Credit Group long-only credit funds, Tradable Credit Group alternative funds and Direct Lending Group managed accounts, realizations occur as the fund is liquidating. Private Equity Group funds generally distribute performance fees as investment realizations occur. Further, Private Equity Group funds, Tradable Credit Group alternative credit funds and certain leveraged loan funds generally may make annual tax distributions depending on whether the tax obligation at year-end is greater than the performance fees that were distributed during the year.
- •
- Tradable Credit Group long-only credit funds: Performance fees generally represent 10% to 20% of each incentive eligible fund's profits, subject to a preferred return of approximately 7% to 12% per annum.
- •
- Tradable Credit Group alternative credit funds: Performance fees generally represent 10% to 20% of each incentive eligible fund's profits, subject to a preferred return of approximately 5% to 9% per annum.
- •
- Direct Lending Group funds: Performance fees generally represent 10% to 20% of each incentive eligible fund's profits, or cumulative realized capital gains (net of realized capital losses and unrealized capital depreciation). Some funds are also subject to a preferred return of approximately 5% to 8% per annum.
- •
- Private Equity Group funds: Performance fees represent 20% of each incentive eligible fund's profits, subject to a preferred return of approximately 8% per annum.
- •
- Real Estate Group funds: Performance fees generally represent 10% to 25% of each incentive eligible fund's profits, subject to a preferred return of approximately 8% to 10% per annum.
We may be liable to certain funds for previously realized performance fees if the fund's investment values decline below certain return hurdles, which vary from fund to fund. As of each of the three months ended March 31, 2014 and 2013, if the funds were liquidated at their fair values at that date, there would have been no clawback obligation or liability. When the fair value of a fund's investment remains constant
99
Table of Contents
or falls below certain return hurdles, previously recognized performance fees are reversed. In all cases, each investment fund is considered separately in evaluating carried interest and potential clawback obligations. For any given period, performance fee income could therefore be negative; however, cumulative performance fees can never be negative over the life of a fund. If upon a hypothetical liquidation of a fund's investments at the then-current fair values previously recognized and distributed performance fees would be required to be returned, a liability is established in our financial statements for the potential clawback obligation. At March 31, 2014 and December 31, 2013, if we assumed all existing investments were valued at $0, the total amount of performance fees subject to clawback would have been approximately $565.2 million and $608.5 million, respectively, of which approximately $454.6 million and $489.8 million, respectively, would be reimbursable by professionals who have received such performance fees.
In addition, we are entitled to receive incentive fees from certain funds when the return on investment exceeds previous calendar year-end or date of investment high-watermarks. Some of our funds pay annual incentive fees or allocations equal to 10% to 20% of the fund's profit for the year, subject to a high-watermark. The high-watermark is the highest historical NAV attributable to a fund investor's account on which incentive fees were paid and means that we will not earn incentive fees with respect to such fund investor for a year if the NAV of such investor's account at the end of the year is lower than any prior year-end NAV or the NAV at the date of such fund investor's investment, generally excluding any contribution and redemptions for purposes of calculating NAV. In these arrangements, incentive fees are recognized when the performance benchmark has been achieved based on the funds' then-current fair value and are included in performance fees in our combined and consolidated statement of operations. These incentive fees are a component of performance fees in our combined and consolidated financial statements and are treated as accrued until paid to us.
For any given period, performance fee revenue in our combined and consolidated statement of operations may include reversals of previously recognized performance fees due to a decrease in the value of a particular fund that results in a decrease of cumulative performance fees earned to date. Since fund return hurdles are cumulative, previously recognized fees also may be reversed in a period of appreciation that is lower than the particular fund's hurdle rate. For the three months ended March 31, 2014 and 2013, the reversal of performance fees was $3.6 million and $1.1 million, respectively. This includes $1.2 million and $0.4 million from our Tradable Credit Group for the three months ended March 31, 2014 and 2013, respectively, of which the balances relate to Consolidated Funds that eliminate upon consolidation, $0.8 million from our Direct Lending Group for the three months ended March 31, 2014 and $1.6 million and $0.7 million from our Private Equity Group for the three months ended March 31, 2014 and 2013, respectively, of which the balances relate to Consolidated Funds that eliminate upon consolidation.
As of the reporting date, accrued but unpaid performance fees are reflected in unrealized performance fee in Note 12, "Segment Reporting," to our unaudited combined and consolidated financial statements included in this Quarterly Report on Form 10-Q.
Other Fees. We also provide administrative services to certain of our affiliated funds that are reported as other fees. Such fees are recognized as revenue in the period that administrative and investment advisory services are rendered. These fees are generally based on expense reimbursements that represent the portion of overhead and other expenses incurred by certain support group professionals directly attributable to the fund but may also be based on the fund's NAV, for certain funds domiciled outside the United States. These fees are reported within total revenues in our unaudited combined and consolidated financial statements included in this Quarterly Report on Form 10-Q.
Deal fees include special fees such as consulting fees, advisory fees, closing fees, transaction fees and similar fees paid to us in connection with portfolio investments of our Consolidated Funds. These fees are specific to particular transactions and the contractual terms of the portfolio investments, and are recognized when earned and may offset management fees payable to us as specified in certain limited partnership agreements.
100
Table of Contents
Expenses
Compensation and Benefits. Compensation generally includes salaries, bonuses, benefits paid and payable to our professionals and equity-based compensation associated with the grants of equity-based awards to our senior professionals. Compensation cost relating to the issuance of certain equity-based awards is measured at fair value at the grant date, taking into consideration expected forfeitures, and expensed over the vesting period on a straight line basis. Other equity-based awards are re-measured at the end of each reporting period. Bonuses are accrued over the service period to which they relate. All payments made to our senior partners are accounted for as distributions on the equity held by such senior partners rather than as employee compensation. Following the initial public offering, all compensation to our senior partners will continue to be accounted for as distributions on the equity held by such senior partners rather than as employee compensation.
Performance Fee Compensation. Performance fee compensation includes compensation directly related to segment performance fees, which generally consists of percentage interests that we grant to our professionals. Depending on the nature of each fund, the performance fee participation is generally structured as a fixed percentage or as an annual award. The liability is calculated based upon the changes to realized and unrealized performance fees but not is payable until the performance fees are realized. We have an obligation to pay our professionals a portion of the performance fees earned from certain funds, including performance fees from Consolidated Funds that is eliminated in consolidation.
Although changes in performance fee compensation are directly correlated with changes in performance fees reported within our segment results, this correlation does not always exist when our results are prepared on a fully consolidated basis in accordance with GAAP. This discrepancy is caused by the fact that performance fees earned from our Consolidated Funds are eliminated upon consolidation while performance fee compensation is not eliminated.
Consolidated Fund Expenses. Consolidated Fund expenses consist primarily of costs incurred by our Consolidated Funds, including travel expenses, professional fees, research expenses, trustee fees and other costs associated with administering these funds and launching new products. These expenses are generally attributable to the related funds' limited partners or CLO noteholders and are allocated to non-controlling interests. As such, these expenses have no material impact on the net income attributable to AHI, Ares Investments LLC and consolidated subsidiaries.
General, Administrative and Other Expenses. General and administrative expenses include costs primarily related to placement fees, professional services, occupancy and equipment expenses, depreciation and amortization expenses, travel and related expenses, communication and information services and other general operating items. These expenses are not borne by fund investors and are not offset by credits attributable to fund investors' non- controlling redeemable interests in Consolidated Funds. Placement fees typically represent expenses paid upfront in connection with our capital raising activities. Occupancy and equipment expense represents charges related to office leases and associated expenses, such as utilities and maintenance fees. Depreciation of fixed assets is normally calculated using the straight-line method over their estimated useful lives, ranging from three to seven years, taking into consideration any residual value. Leasehold improvements are amortized over the shorter of the useful life of the asset or the expected term of the lease. Intangible assets are amortized based on the future cash flows over the expected useful lives of the assets. See Note 3, "Goodwill and Intangible Assets," to our unaudited combined and consolidated financial statements included in this Quarterly Report on Form 10-Q for more information.
101
Table of Contents
Other Income
Interest and Other Income. Interest and other income consist primarily of interest income and dividend income. Interest and other income are recognized on an accrual basis to the extent that such amounts are expected to be collected.
Interest Expense. Our subsidiaries amended and restated an unsecured credit agreement on October 29, 2013 that provides for a $735.0 million revolving credit facility (the "Credit Facility"). Interest expense consists primarily of interest expense relating to the Credit Facility which has a variable interest rate based on LIBOR.
Net Realized Gain (Loss) on Investments. Net gains (loss) from investment activities include both realized gains and losses in our investment portfolio. Net realized gain (loss) is realized when we redeem all or a portion of our investment or when we receive cash income, such as dividends or distributions.
Net Change in Unrealized Appreciation (Depreciation) on Investments. Net change in unrealized appreciation (depreciation) on investments represents the unrealized and realized appreciation (depreciation) resulting from the investments of AIH LLC. Unrealized appreciation (depreciation) on investments results from changes in the fair value of the underlying investment as well as the reversal of unrealized appreciation (depreciation) at the time an investment is realized.
Interest and Other Income of Consolidated Funds. Interest income of our Consolidated Funds relates to interest and dividend income generated from the underlying investment securities. The CLOs generate interest income from investments in bonds and loans, inclusive of amortization of discounts. Interest and other income are recognized on an accrual basis to the extent such amounts are expected to be collected. These sources of revenue are generally attributable to the related funds' limited partners or CLO noteholders and are allocated to non-controlling interests. As such, these sources of revenue have no direct material impact on the net income attributable to AHI, Ares Investments LLC and consolidated subsidiaries.
Interest Expense of Consolidated Funds. The interest expenses of Consolidated Funds are principally comprised of interest expense related to our CLOs' loans payable. This interest expense is generally attributable to CLO noteholders and is allocated to non-controlling interests. As such, this expense has no direct material impact on the net income attributable to AHI, Ares Investments LLC and consolidated subsidiaries.
Net Realized Gain (Loss) on Investments of Consolidated Funds. Net realized gain on investments of Consolidated Funds consists of realized gains and losses arising from dispositions of investments held by our Consolidated Funds. Substantially all of the net investment gains (losses) of our Consolidated Funds are attributable to the limited partner investors and allocated to non-controlling interests. As such, a gain or loss from our Consolidated Funds has no direct material impact on the net income attributable to AHI, Ares Investments LLC and consolidated subsidiaries.
Net Change in Unrealized Appreciation (Depreciation) on Investments of Consolidated Funds. Net change in unrealized appreciation (depreciation) on investments of Consolidated Funds reflects both unrealized gains and losses on investments from periodic changes in fair value of investments held by our Consolidated Funds and the reversal upon disposition of investments of unrealized gains and losses previously recognized for those investments. The net change in unrealized appreciation (depreciation) on investments of Consolidated Funds is substantially attributable to the limited partners and allocated to non-controlling interests. As such, this change has no direct material impact on the net income attributable to AHI, Ares Investments LLC and consolidated subsidiaries.
102
Table of Contents
Income Taxes. A substantial portion of our earnings flow through to our owners without being subject to an entity level tax. Consequently, a significant portion of our earnings has no provision for income taxes except for foreign, city and local income taxes incurred at the entity level. A portion of our operations is conducted through a domestic corporation that is subject to corporate level taxes and for which we record current and deferred income taxes at the prevailing rates in the various jurisdictions in which these entities operate.
Income taxes are accounted for using the liability method of accounting. Under this method, deferred tax assets and liabilities are recognized for the expected future tax consequences of differences between the carrying amounts of assets and liabilities and their respective tax basis, using tax rates in effect for the year in which the differences are expected to reverse. The effect on deferred assets and liabilities of a change in tax rates is recognized in income in the period when the change is enacted. Deferred tax assets are reduced by a valuation allowance when it is more likely than not that some portion or all of the deferred tax assets will not be realized.
Non-Controlling Interests in Consolidated Funds. Net income (loss) attributable to non-controlling interests represents the ownership interests that third parties hold in entities that are consolidated in our combined and consolidated financial statements.
The substantial majority of our commingled funds are closed-end funds, and accordingly do not permit investors to redeem their interests other than in limited circumstances that are beyond our control, such as instances in which retaining the limited partnership interest could cause the limited partner to violate a law, regulation or rule. Investors in open-ended and evergreen funds generally have the right to withdraw their capital, subject to the terms of the respective limited partnership agreements, over periods ranging from one month to three years. In addition, separately managed investment vehicles for a single investor may allow such investor to terminate the fund at the discretion of the investor pursuant to the terms of the applicable constituent documents of such vehicle.
Results of Operations
Combined and Consolidated Results of Operations
The following table and discussion sets forth information regarding our combined and consolidated results of operations for the three months ended March 31, 2014 and 2013. The combined and consolidated financial statements of our Predecessors have been prepared on substantially the same basis for all historical periods presented; however, our Consolidated Funds are not the same entities in all periods shown due to changes in GAAP, changes in fund terms and the creation and termination of funds. We consolidated funds where through our management contract and other interests we are deemed to hold a controlling financial interest. As further described below, the consolidation of these funds had the impact of increasing interest and other income of Consolidated Funds, interest and other expenses of Consolidated Funds and net investment gains (losses) of Consolidated Funds for the three months ended
103
Table of Contents
March 31, 2014 and 2013. The consolidation of these funds had no effect on net income attributable to us for the periods presented.
| | | | | | | |
| | Three months Ended
March 31, | |
|---|
| | 2014 | | 2013 | |
|---|
| | (Dollars in thousands)
| |
|---|
Statements of operations data | | | | | | | |
Revenues | | | | | | | |
Management fees (includes ARCC Part I Fees of $28,318 and $23,836 for the periods ended March 31, 2014 and 2013, respectively) | | $ | 110,549 | | $ | 78,394 | |
Performance fees | | | 16,214 | | | 25,154 | |
Other fees | | | 6,865 | | | 3,989 | |
| | | | | | |
| | | | | | | | |
Total revenues | | | 133,628 | | | 107,537 | |
Expenses | | | | | | | |
Compensation and benefits | | | 95,693 | | | 71,975 | |
Performance fee compensation | | | 40,725 | | | 63,002 | |
General, administrative and other expenses | | | 38,775 | | | 16,982 | |
Consolidated Funds expenses | | | 8,937 | | | 61,108 | |
| | | | | | |
| | | | | | | | |
Total expenses | | | 184,130 | | | 213,067 | |
Other Income (loss) | | | | | | | |
Interest and other income | | | 124 | | | 651 | |
Interest expense | | | (1,639 | ) | | (2,425 | ) |
Net realized loss on investments | | | (66 | ) | | (1,137 | ) |
Net change in unrealized appreciation on investments | | | 4,146 | | | 8,285 | |
Interest and other income of Consolidated Funds | | | 345,345 | | | 311,490 | |
Interest expense of Consolidated Funds | | | (145,042 | ) | | (125,958 | ) |
Net realized gain on investments of Consolidated Funds | | | 54,965 | | | 57,956 | |
Net change in unrealized appreciation on investments of Consolidated Funds | | | 67,344 | | | 104,252 | |
| | | | | | |
| | | | | | | | |
Total other income | | | 325,177 | | | 353,114 | |
| | | | | | |
| | | | | | | | |
Income before taxes | | | 274,675 | | | 247,584 | |
Income tax expense (benefit) | | | (6,695 | ) | | 24,450 | |
| | | | | | |
| | | | | | | | |
Net income | | | 281,370 | | | 223,134 | |
| | | | | | |
| | | | | | | | |
Less: Net income attributable to non-controlling interests in Consolidated Funds | | | 225,181 | | | 148,591 | |
Less: Net income attributable to non-controlling interests and redeemable non-controlling interests in consolidated subsidiaries | | | 13,342 | | | 12,601 | |
| | | | | | |
| | | | | | | | |
Net income attributable to controlling interests in AHI, AI and consolidated subsidiaries | | $ | 42,847 | | $ | 61,942 | |
| | | | | | |
| | | | | | | | |
| | | | | | | | |
| | | | | | |
Three months Ended March 31, 2014 Compared to Three months Ended March 31, 2013
Revenues
Management Fees. Total management fees increased by $32.2 million, or 41.0%, to $1170.5 million for the three months ended March 31, 2014 compared to the three months ended March 31, 2013. In addition, the management fees from our Consolidated Funds, which are eliminated upon consolidation, decreased by $0.9 million, or 3.1%, to $29.3 million for the three months ended March 31, 2014 compared to the three months ended March 31, 2013.
- •
- Our Direct Lending Group generated an additional $14.5 million in management fees for the three months ended March 31, 2014 compared to the three months ended March 31, 2013. The increase was primarily due to additional capital raises for ARCC and expansion of our Direct Lending Group's European platform starting in 2013.
104
Table of Contents
- •
- Our Real Estate Group generated an additional $14.3 million in management fees for the three months ended March 31, 2014 compared to the three months ended March 31, 2013. The increase was principally attributable to the management fee contracts acquired in the AREA Acquisition in the third quarter of 2013 and additional capital raises by our publicly traded real estate fund, ACRE.
- •
- Our Tradable Credit Group generated an additional $3.4 million in recurring management fees for the three months ended March 31, 2014 compared to the three months ended March 31, 2013. The increase was principally attributable to incremental fees from new funds that were launched during 2013.
Other Fees. Administrative fees and other income increased by $2.9 million, or 72.1%, to $6.9 million for the three months ended March 31, 2014 compared to the same period in 2013, primarily due to increase in administrative service fees from ARCC and ACRE and other property management fees in our Real Estate Group platform.
Performance Fees. Performance fees decreased by $8.9 million, or 35.5%, to $16.2 million for the three months ended March 31, 2014 compared to the three months ended March 31, 2013. $0.8 million of performance fees were reversed for the three months ended March 31, 2014 related to our Direct Lending Group. No performance fees were reversed for the three months ended March 31, 2013 related to our Tradable Credit Group. In addition, performance fees from our Consolidated Funds, which are eliminated upon consolidation, decreased by $30.0 million to $44.3 million for the three months ended March 31, 2014 compared to the three months ended March 31, 2013. The decrease in performance fees was primarily driven by the Tradable Credit Group and the Direct Lending Group.
- •
- The decrease of $9.9 million of the total performance fees was due to decreases in our Tradable Credit Group for the three months ended March 31, 2014 compared to the three months ended March 31, 2013. The decrease was principally attributable to Ares Credit Strategies Fund I ("CSF"), BVK-B and Ares Strategic Investment Partners II ("ASIP II"), which declined $5.7 million, $1.6 million and $2.0 million, respectively, primarily due to lower market appreciation in the three months ended March 31, 2014.
- •
- Our Direct Lending Group contributed $1.0 million to the total performance fees increase for the three months ended March 31, 2014 compared to the three months ended March 31, 2013. The increase in performance fees was principally attributable to Ares Capital Europe II ("ACE II"), which contributed $1.3 million.
Expenses
Compensation and Benefits. Compensation and benefits increased by $23.7 million, or 33.0%, to $95.7 million for the three months ended March 31, 2014 compared to the three months ended March 31, 2013. The increase was primarily due to merit-based increases and an increase in headcount from 2013 to 2014, including additional professionals from the AREA Acquisition, and the March 2013 externalization of management of our Direct Lending Group in Europe, which previously had been internally managed (the "ACE Externalization"). Allocated profit distributions to our senior partners are accounted for as equity distributions and are not included as part of compensation and benefits.
Performance Fee Compensation. Performance fee compensation decreased by $22.3 million, or 35.4%, to $40.7 million for the three months ended March 31, 2014 compared to the three months ended March 31, 2013. The change in performance fee compensation was directly correlated with change in performance fees before giving effect to the performance fees earned from our Consolidated Funds that are eliminated upon consolidation.
105
Table of Contents
Expenses of our Consolidated Funds. Expenses of Consolidated Funds decreased by $52.2 million, or 85.4%, to $8.9 million for the three months ended March 31, 2014 compared to the three months ended March 31, 2013. This expense decreased primarily due to the deconsolidation of sixteen Ares funds from the first quarter of 2013 to the first quarter of 2014.
General, Administrative and Other Expenses. General, administrative and other expenses increased by $21.8 million, or 128.3%, to $38.8 million for the three months ended March 31, 2014 compared to the three months ended March 31, 2013. The increase was driven primarily by an increase in office expense due to ACE Externalization, an increase in amortization of intangibles due to the acquisition of management fee contracts acquired in the AREA Acquisition, and an increase in consulting expenses and office expenses due to the AREA Acquisition.
Other Income (Loss)
When evaluating the changes in other income (loss), we separately analyze the returns generated by AIH LLC's investment portfolio from the investment returns generated by our Consolidated Funds. Within each group's returns, we aggregate interest and other income with interest expense and aggregate the net realized and unrealized gains and losses to derive net investment gain (loss). Analyzing net investment gain (loss) helps assess the contributions of single issuer, investment security or portfolio company.
For the three months ended March 31, 2014 and 2013, the other income associated with the Company and our Consolidated Funds is summarized below:
| | | | | | | |
| | Three Months Ended
March 31, | |
|---|
| | 2014 | | 2013 | |
|---|
| | (Dollars in thousands)
| |
|---|
Other income (loss) of AIH LLC investment portfolio: | | | | | | | |
Interest and other income | | $ | 124 | | $ | 651 | |
Interest expense | | | (1,639 | ) | | (2,425 | ) |
| | | | | | |
| | | | | | | | |
Net interest expense attributed to AIH LLC | | | (1,515 | ) | | (1,774 | ) |
| | | | | | |
| | | | | | | | |
Net realized loss on investments | | | (66 | ) | | (1,137 | ) |
Net change in unrealized appreciation on investments | | | 4,146 | | | 8,285 | |
| | | | | | |
| | | | | | | | |
Net investments gains attributed to AIH LLC | | | 4,080 | | | 7,148 | |
| | | | | | |
| | | | | | | | |
Other income loss attributed to AIH LLC's investment portfolio | | | 2,565 | | | 5,374 | |
| | | | | | |
| | | | | | | | |
Other income (loss) of Consolidated Funds' investments: | | | | | | | |
Interest and other income of Consolidated Funds | | | 345,345 | | | 311,490 | |
Interest expense of Consolidated Funds | | | (145,042 | ) | | (125,958 | ) |
| | | | | | |
| | | | | | | | |
Net interest income of Consolidated Funds | | | 200,303 | | | 185,532 | |
| | | | | | |
| | | | | | | | |
Net realized gain on investments of Consolidated Funds | | | 54,965 | | | 57,956 | |
Net change in unrealized appreciation on investments of Consolidated Funds | | | 67,344 | | | 104,252 | |
| | | | | | |
| | | | | | | | |
Net investments gains of Consolidated Funds | | | 122,309 | | | 162,208 | |
| | | | | | |
| | | | | | | | |
Other income of Consolidated Funds | | | 322,612 | | | 347,740 | |
| | | | | | |
| | | | | | | | |
Total other income | | $ | 325,177 | | $ | 353,114 | |
| | | | | | |
| | | | | | | | |
| | | | | | | | |
| | | | | | |
106
Table of Contents
Investments of the Company
Net interest expense attributed to AIH LLC decreased by $0.3 million, or 14.6%, to $1.5 million for the three months ended March 31, 2014, compared to the three months ended March 31, 2013. The decrease in net interest expense was due to a $0.8 million decrease in interest expense based on decreased utilization of the Credit Facility offset by a $0.5 million decrease in interest and other income as a result of shrinking yields from our investments in non-consolidated Tradable Credit Group and Direct Lending Group funds. In addition, we also earned interest income on deferred management fees in 2013. We did not earn any interest income on deferred management fees in the three months ended March 31, 2014.
Net investment gains attributed to AIH LLC decreased $3.1 million, or 42.9%, to $4.1 million for the three months ended March 31, 2014, compared to the three months ended March 31, 2013. The decrease in net investment gains was the result of a decrease in unrealized appreciation on investments of $4.1 million, which was offset by an increase in realized gains of $1.1 million. Upon the disposition of an investment, previously recognized unrealized gains and losses are reversed and an offsetting realized gain or loss is recognized in the current period.
The net change in realized loss attributable to investments held by AIH LLC decreased by $1.1 million, or 94.2% to a $0.1 million loss for the three months ended March 31, 2014, compared to the three months ended March 31, 2013. The net realized losses as of March 31, 2014 were primarily due to AIH LLC's positions in hedging instruments that resulted in a net loss of $1.2 million, offset against $0.7 million from distributions received from the Real Estate Group funds. The net realized losses of $1.1 million as of March 31, 2013 were due primarily to positions held in the hedging instruments.
The net change in unrealized appreciation on AIH LLC's investments decreased by $4.1 million, or 50.0% to $4.1 million for the three months ended March 31, 2014, compared to the three months ended March 31, 2013. The net change was due primarily to a decrease in the unrealized appreciation of $2.7 million from investments held in 2013 that were no longer held in 2014. In addition, $0.9 million of the change was due to unrealized depreciation recognized in 2014 on new Real Estate Group funds in which we invested in during the second half of 2013.
Net interest income of Consolidated Funds increased by $14.8 million, or 8.0%, to $200.3 million for the three months ended March 31, 2014, compared to the three months ended March 31, 2013. The increase in net interest income was primarily due to $73.2 million increase from the Private Equity Group primarily as a result of additional dividend income received, offset by a $38.5 million decrease as a result of shrinking yields from our investments in the Tradable Credit and Direct Lending Groups as evidenced by a decline in average yield to a 3-year life of the Credit Suisse Leveraged Loan Index ("CSLLI") from 5.35% as of the first quarter of 2013 to 5.14% as of the first quarter of 2014. The increase in net interest income was further offset by an approximately $19.5 million increase in interest expense in our Tradable Credit Group. The increase in interest expense was directly attributable to the closing of four new CLOs after the three months ended March 31, 2013, which carry a higher cost of capital versus legacy CLOs that have rolled off.
Net investment gains of Consolidated Funds decreased by $39.9 million, or 24.6%, from $162.2 million net gain for the three months ended March 31, 2013 compared to the three months ended March 31, 2014. The decrease in net investment gain was the result of a $36.9 million decrease in net unrealized appreciation coupled with a $3.0 million decrease in net realized appreciation. The decrease in the net change in unrealized appreciation was due primarily to the reversal from unrealized gain to realized gain resulting from significant realization of investments and reduced valuation gains in the Private Equity Group as compared to the first quarter of 2013. Investments within the Private Equity Group contributed $52.2 million, or approximately 80%, of the total net change in unrealized appreciation of the Consolidated Funds for the three months ended March 31, 2014.
107
Table of Contents
Income Tax Expense/Benefits. Income tax expense decreased by $31.1 million, or 127.4%, to a $6.7 million income tax benefit for the three months ended March 31, 2014 from $24.5 million income tax expense for the three months ended March 31, 2013. The effective tax rate is a function of the mix of income we earn and other factors that often vary significantly within or between years.
Non-Controlling Interests. Net income attributable to non-controlling interests in consolidated entities was $225.2 million for the three months ended March 31, 2014 compared to $148.6 million for the three months ended March 31, 2013. The increase in net income attributable to non-controlling interests of $76.6 million was primarily due to the recognition of substantial gains in 2014 from the realization of various underlying investments by our Consolidated Funds in the Private Equity Group coupled with a decrease in expenses from the Consolidated Funds due as a result of the deconsolidation of several of our affiliated funds in 2014.
Segment Analysis
Under GAAP, we are required to consolidate (a) entities in which we hold a majority voting interest or have majority ownership and control over the operational, financial and investing decisions of that entity, including Ares-affiliates and affiliated funds and co-investment entities, for which we are the general partner and are presumed to have control, and (b) entities that we concluded are VIEs, including limited partnerships in which we have a nominal economic interest and the CLOs, for which we are deemed to be the primary beneficiary. See Note 2, "Summary of Significant Accounting Policies," to our unaudited combined and consolidated financial statements included in this Quarterly Report on Form 10-Q.
Discussed below are our results of operations for each of our four reportable segments on a standalone basis and on a combined segment basis. In addition to the four segments, we have the OMG. Accordingly, also discussed below are our results of operations for the OMG on a standalone basis and, together with our four reportable segments, on a combined standalone basis. This information is used by our management to make operating decisions, assess performance and allocate resources.
For segment reporting purposes, revenues and expenses are presented on a basis that deconsolidates our Consolidated Funds. As a result, segment revenues from management fees, performance fees and investment income are greater than those presented on a combined and consolidated basis in accordance with GAAP because certain revenues recognized in certain segments are received from Consolidated Funds and are eliminated in consolidation. Furthermore, expenses are lower than related amounts presented on a combined and consolidated basis in accordance with GAAP due to the exclusion of expenses of Consolidated Funds.
108
Table of Contents
Combined ENI and Other Measures
The following table sets forth FRE, PRE, ENI and distributable earnings on a segment basis and Stand Alone basis for the three months ended March 31, 2014 and 2013. FRE, PRE, ENI and distributable earnings are non-GAAP financial measures our management uses when making resource deployment decisions and in assessing performance of our segments. Please see "—Reconciliation of Certain Non-GAAP Measures to Consolidated GAAP Financial Measures."
| | | | | | | |
| | Three Months Ended
March 31, | |
|---|
| | 2014 | | 2013 | |
|---|
| | (Dollars in thousands)
| |
|---|
Fee related earnings (loss) | | | | | | | |
Tradable Credit Group | | $ | 19,209 | | $ | 19,928 | |
Direct Lending Group | | | 32,168 | | | 22,829 | |
Private Equity Group | | | 13,077 | | | 14,826 | |
Real Estate Group | | | 2,306 | | | (2,354 | ) |
| | | | | | |
| | | | | | | | |
Segment fee related earnings | | | 66,760 | | | 55,229 | |
| | | | | | |
| | | | | | | | |
Operations Management Group | | | (35,800 | ) | | (20,181 | ) |
| | | | | | |
| | | | | | | | |
Stand Alone fee related earnings | | $ | 30,960 | | $ | 35,048 | |
| | | | | | |
| | | | | | | | |
Performance related earnings (loss): | | | | | | | |
Tradable Credit Group | | $ | 16,877 | | $ | 43,896 | |
Direct Lending Group | | | 1,572 | | | 4,204 | |
Private Equity Group | | | 25,492 | | | 9,884 | |
Real Estate Group | | | 2,504 | | | 837 | |
| | | | | | |
| | | | | | | | |
Segment performance related earnings | | | 46,445 | | | 58,821 | |
| | | | | | |
| | | | | | | | |
Operations Management Group | | | — | | | — | |
| | | | | | |
| | | | | | | | |
Stand Alone performance related earnings | | $ | 46,445 | | $ | 58,821 | |
| | | | | | |
| | | | | | | | |
Economic net income (loss): | | | | | | | |
Tradable Credit Group | | $ | 36,086 | | $ | 63,824 | |
Direct Lending Group | | | 33,740 | | | 27,033 | |
Private Equity Group | | | 38,569 | | | 24,710 | |
Real Estate Group | | | 4,810 | | | (1,517 | ) |
| | | | | | |
| | | | | | | | |
Segment economic net income | | | 113,205 | | | 114,050 | |
| | | | | | |
| | | | | | | | |
Operations Management Group | | | (35,800 | ) | | (20,181 | ) |
| | | | | | |
| | | | | | | | |
Stand Alone economic net income | | $ | 77,405 | | $ | 93,869 | |
| | | | | | |
| | | | | | | | |
Distributable earnings (loss): | | | | | | | |
Tradable Credit Group | | $ | 40,704 | | $ | 47,607 | |
Direct Lending Group | | | 31,158 | | | 22,342 | |
Private Equity Group | | | 18,698 | | | 16,752 | |
Real Estate Group | | | 1,499 | | | (3,422 | ) |
| | | | | | |
| | | | | | | | |
Segment distributable earnings | | | 92,059 | | | 83,279 | |
| | | | | | |
| | | | | | | | |
Operations Management Group | | | (37,512 | ) | | (20,472 | ) |
| | | | | | |
| | | | | | | | |
Stand Alone distributable earnings | | $ | 54,547 | | $ | 62,807 | |
| | | | | | |
| | | | | | | | |
109
Table of Contents
Results of Operations by Segment
Tradable Credit Group
The following table sets forth certain statement of operations and other data of our Tradable Credit Group segment on a standalone basis for the periods presented.
| | | | | | | |
| | Three Months Ended
March 31, | |
|---|
| | 2014 | | 2013 | |
|---|
| | (Dollars in thousands)
| |
|---|
Tradable Credit Group | | | | | | | |
Management fees—recurring | | $ | 33,693 | | $ | 30,031 | |
Management fees—one-time deferrals | | | — | | | 1,139 | |
| | | | | | |
| | | | | | | | |
Total management fees | | | 33,693 | | | 31,170 | |
Administrative fees and other income | | | 17 | | | — | |
Compensation and benefits | | | (10,805 | ) | | (8,767 | ) |
General, administrative and other expenses | | | (3,696 | ) | | (2,475 | ) |
| | | | | | |
| | | | | | | | |
Fee related earnings | | $ | 19,209 | | $ | 19,928 | |
| | | | | | |
| | | | | | | | |
| | | | | | | | |
| | | | | | |
Performance fees—realized | | $ | 10,213 | | $ | 9,038 | |
Performance fees—unrealized | | | 13,509 | | | 54,351 | |
Performance fee compensation—realized | | | (5,506 | ) | | (36 | ) |
Performance fee compensation—unrealized | | | (6,355 | ) | | (34,665 | ) |
| | | | | | |
| | | | | | | | |
Net performance fees | | | 11,861 | | | 28,688 | |
Investment income—realized | | | 18,018 | | | 19,513 | |
Investment income (loss)—unrealized | | | (12,866 | ) | | (3,961 | ) |
Interest and other income | | | 251 | | | 312 | |
Interest expense | | | (387 | ) | | (656 | ) |
| | | | | | |
| | | | | | | | |
Net investment income | | | 5,016 | | | 15,208 | |
Performance related earnings | | $ | 16,877 | | $ | 43,896 | |
| | | | | | |
| | | | | | | | |
| | | | | | | | |
| | | | | | |
Economic net income | | $ | 36,086 | | $ | 63,824 | |
| | | | | | |
| | | | | | | | |
| | | | | | | | |
| | | | | | |
Distributable earnings | | $ | 40,704 | | $ | 47,607 | |
| | | | | | |
| | | | | | | | |
| | | | | | | | |
| | | | | | |
Tradable Credit Group—Three Months Ended March 31, 2014 Compared to Three Months Ended March 31, 2013
Management Fees. Total management fees increased by $2.5 million, or 8.1%, to $33.7 million for the three months ended March 31, 2014 compared to the three months ended March 31, 2013. The effective management fee rate increased by 0.01% from 0.53% as of March 31, 2013, to 0.54% as of March 31, 2014. Although total management fees remained relatively flat from 2013 to 2014, the three months ended March 31, 2014 includes a $5.9 million increase from new funds, offset by a $2.0 million decrease from our Tradable Credit Group alternative credit funds. The $5.9 million increase from new funds includes $2.3 million from new CLOs launched after the first quarter of 2013. This was offset against a $2.0 million decrease from our Tradable Credit Group alternative credit funds from a decrease in the appreciation of the funds, and a $1.5 million decrease for Ares Enhanced Loan Investment Strategy Fund VI ("AELIS VI") due to a decrease in assets held as the fund is in the process of liquidating.
110
Table of Contents
Performance Fees. Performance fees decreased by $39.7 million, or 62.6%, to $23.7 million for the three months ended March 31, 2014 compared to the three months ended March 31, 2013. The three months ended March 31, 2014 includes performance fees reversals of approximately $0.8 million and $0.5 million related to Tradable Credit Group long-only credit funds and Tradable Credit Group alternative credit funds, respectively. The three months ended March 31, 2013 includes performance fees reversals of approximately $0.4 million related to Tradable Credit Group alternative credit funds. Performance fees for this segment by type of fund are as follows:
| | | | | | | |
| | Three Months
Ended
March 31, | |
|---|
| | 2014 | | 2013 | |
|---|
| | (Dollars in
millions)
| |
|---|
Tradable Credit Group long-only credit funds | | $ | 3.7 | | $ | 35.6 | |
Tradable Credit Group alternative credit funds | | | 20.0 | | | 27.8 | |
| | | | | | |
| | | | | | | | |
Total | | $ | 23.7 | | $ | 63.4 | |
| | | | | | |
| | | | | | | | |
| | | | | | | | |
| | | | | | |
Our Tradable Credit Group experienced a substantial increase in appreciation across our funds for the three months ended 2013 as compared to 2014. Performance fees for the three months ended March 31, 2014 were generated primarily by the Tradable Credit Group alternative credit funds, including $6.8 million from CSF and $3.7 million from Ares Enhanced Credit Opportunities Fund I ("ECO"), as well as the Tradable Credit Group long-only credit funds, including $2.4 million from the CLOs.
Performance fees for the three months ended March 31, 2013 were driven primarily by the Tradable Credit Group long-only credit funds, including $27.3 million from the CLOs and $4.3 million from AELIS VI. The Tradable Credit Group alternative credit funds also contributed $27.8 million, including $12.4 million from CSF and $5.8 million from Ares Special Situations Fund I LP.
Performance fees realized in our Tradable Credit Group increased by $1.2 million, or 13.0%, to $10.2 million, for the three months ended March 31, 2014 compared to the three months ended March 31, 2013.
Compensation and Benefits. Compensation and benefits increased by $2.0 million, or 23.2%, to $10.8 million for the three months ended March 31, 2014 compared to the three months ended March 31, 2013. The increase was driven primarily by merit-based increases and an increase in headcount. Compensation and benefits represented 32.1% of total management fees for the three months ended March 31, 2014 compared to 28.1% for the three months ended March 31, 2013.
General, Administrative and Other Expenses. General, administrative and other expenses increased by $1.2 million, or 49.3%, to $3.7 million for the three months ended March 31, 2014 compared to the three months ended March 31, 2013. The increase was primarily attributable to an increase in office lease costs associated with the consolidation of our London offices in the first quarter of 2014.
Net Investment Income (Loss). Net investment income decreased by $10.2 million, or 67.0%, to $5.0 million for the three months ended March 31, 2014 compared to the three months ended March 31, 2013. The decrease in net investment income was principally attributable to a decrease in yield for the Tradable Credit Group long-only credit funds and alternative credit funds in 2014, as evidenced by a decline in the average yield to a three-year life of the CSLLI from 5.4% as of March 31, 2013 to 5.1% as of March 31, 2014. For the three months ended March 31, 2014, 33% of the balance sheet investments at fair value were attributable to the Tradable Credit Group.
111
Table of Contents
Economic Net Income. ENI was $36.1 million for the three months ended March 31, 2014 compared to $63.8 million for the three months ended March 31, 2013, representing a decrease of $27.7 million. The decrease in ENI was primarily driven by decreases in net performance fees of $16.8 million, in net investment income of $10.2 million and in FRE of $0.7 million.
Fee Related Earnings. FRE was $19.2 million for the three months ended March 31, 2014 compared to $19.9 million for the three months ended March 31, 2013, representing a decrease of $0.7 million. The decrease in FRE was primarily due to a decrease in one-time deferred management fees of $1.1 million earned in the first quarter of 2013 and an increase in compensation and benefits and general, administrative and other expenses of $2.0 million and $1.2 million, respectively. This decrease was partially offset by an increase in recurring management fees of $3.7 million in 2014.
Performance Related Earnings. PRE was $16.9 million for the three months ended March 31, 2014 compared to $43.9 million for the three months ended March 31, 2013. The decrease in PRE of $27.0 million was primarily attributable to the decrease in unrealized net performance fees of $12.5 million, the increase in unrealized investment loss of $8.9 million, the decrease in realized net performance fees of $4.3 million and the decrease in realized net investment income of $1.5 million.
Distributable Earnings. DE decreased to $40.7 million for the three months ended March 31, 2014 from $47.6 million for the three months ended March 31, 2013. The decrease was primarily due to a $4.3 million decrease in realized net performance fees and lower FRE.
Tradable Credit Group—Assets Under Management
The table below provides the period-to-period roll forward of AUM for the Tradable Credit Group:
| | | | | | | |
| | Three Months Ended
March 31, | |
|---|
| | 2014 | | 2013 | |
|---|
| | (Dollars in millions)
| |
|---|
Tradable Credit Group | | | | | | | |
Change in AUM: | | | | | | | |
Beginning of period | | $ | 27,928 | | $ | 25,872 | |
Commitments(1) | | | 4,357 | | | 1,660 | |
Capital reduction(2) | | | (584 | ) | | (1,138 | ) |
Distributions/Redemptions(3) | | | (596 | ) | | (659 | ) |
Change in fund value(4) | | | 255 | | | 323 | |
| | | | | | |
| | | | | | | | |
End of period | | $ | 31,361 | | $ | 26,058 | |
| | | | | | |
| | | | | | | | |
| | | | | | | | |
| | | | | | |
Average AUM | | $ | 29,644 | | $ | 25,965 | |
- (1)
- Represents new commitments during the period including both equity and debt commitments, gross inflows into our open-ended managed accounts and sub-advised accounts, as well as equity offerings by our publicly traded vehicles.
- (2)
- Represents the permanent reduction in leverage during the period.
- (3)
- Represents distributions and redemptions net of recallable amounts.
- (4)
- Includes fund net income, including interest income, realized and unrealized gains (losses), fees and expenses and the impact of foreign currency.
112
Table of Contents
Total AUM was $31.4 billion as of March 31, 2014, an increase of $3.4 billion, or 12.3%, compared to total AUM of $27.9 billion as of December 31, 2013. During the three months ended March 31, 2014, the increase in AUM was primarily due to $4.4 billion of new commitments to our funds which was comprised of:
Capital reduction of $584.1 million was primarily driven by the net pay down of credit facilities by leveraged loan funds which include amounts related to subordinated notes. Distributions for the three months totaled $199.1 million, of which $165.7 million was attributable to special situation funds. In addition, redemptions of $396.6 million were comprised of $73.1 million in leveraged loan funds and $279.4 million in special situation funds. As of March 31, 2014, change in fund value totaled $255.1 million across our portfolio.
Total AUM was $26.1 billion as of March 31, 2013, an increase of $186.3 million, or 0.7%, compared to total AUM of $25.9 billion as of December 31, 2012. During the three months ended March 31, 2013, the increase in AUM was primarily due to $1.7 billion of new commitments to our funds which was comprised of:
This increase was partially offset by capital reduction of $1.1 billion, largely driven by the net pay down of credit facilities by leveraged loan funds, of which $395.2 million was attributable to ELIS VI. Distributions for the three months totaled $466.3 million, of which $242.9 million was attributable to leveraged loan funds and $217.4 million to special situation funds. In addition, redemptions totaled $191.5 million. As of March 31, 2013, change in fund value totaled $322.5 million across our portfolio.
113
Table of Contents
Tradable Credit Group—Fee Earning AUM
The table below provides the period-to-period roll forward of fee earning AUM for the Tradable Credit Group:
| | | | | | | |
| | Three Months Ended
March 31, | |
|---|
| | 2014 | | 2013 | |
|---|
| | (Dollars in millions)
| |
|---|
Tradable Credit Group | | | | | | | |
Change in fee earning AUM: | | | | | | | |
Beginning of period | | $ | 25,982 | | $ | 23,183 | |
Commitments(1) | | | — | | | 1,056 | |
Subscriptions/deployment/increase in leverage(2) | | | 971 | | | 336 | |
Redemption/distribution/decrease in leverage(3) | | | (3,433 | ) | | (763 | ) |
Change in fund value(4) | | | 340 | | | (58 | ) |
Change in fee basis(5) | | | — | | | (147 | ) |
| | | | | | |
| | | | | | | | |
End of period | | $ | 23,860 | | $ | 23,606 | |
| | | | | | |
| | | | | | | | |
| | | | | | | | |
| | | | | | |
Average fee earning AUM | | $ | 24,921 | | $ | 23,394 | |
- (1)
- Represents new commitments during the period for funds that earn management fees based on committed capital.
- (2)
- Represents subscriptions, capital deployment and increase in leverage (for funds that earn fees on a gross asset basis).
- (3)
- Represents redemptions, distributions and decrease in leverage (for funds that earn fees on a gross asset basis).
- (4)
- Includes fund net income, including interest income, realized and unrealized gains (losses), fees and expenses and the impact of foreign currency for funds that earn management fees based on market value.
- (5)
- Represents the change of fee basis from committed capital to invested capital.
Total fee earning AUM was $23.9 billion as of March 31, 2014, a decrease of $2.1 billion, or 8.2%, compared to total fee earning AUM of $26.0 billion as of December 31, 2013. During the three months ended March 31, 2014, the decrease in fee earning AUM was primarily due to reduction in leverage of $2.8 billion (for funds that earn fees on a gross asset basis), which includes amounts related to subordinated notes. In addition, distributions of $270.4 million, of which $201.1 million was attributable to ELIS VI, and total redemptions of $346.6 million, mainly comprised of $295.3 million from special situation funds, contributed to the decrease for the period. The decreases in fee earning AUM were partially offset by $339.7 million in change in fund value, of which $164.5 million related to leveraged loan funds, and $971.0 million of new subscriptions comprised of:
114
Table of Contents
Total fee earning AUM was $23.6 billion as of March 31, 2013, an increase of $0.4 billion, or 1.8%, compared to total fee earning AUM of $23.2 billion as of December 31, 2012. During the three months ended March 31, 2013, the increase in fee earning AUM was primarily due to $1.1 billion of new equity commitments to our leveraged loan funds. This increase was partially offset by capital reduction of $713.9 million and redemptions of $139.3 million mainly attributable to our leveraged loan funds.
The table below breaks out fee earning AUM by its respective components for each period:
| | | | | | | |
| | Three Months Ended
March 31, | |
|---|
| | 2014 | | 2013 | |
|---|
| | (Dollars in millions)
| |
|---|
Tradable Credit Group | | | | | | | |
Components of fee earning AUM | | | | | | | |
Fee earning AUM based on invested capital(1) | | | 1,767 | | | 3,054 | |
Fee earning AUM based on market value/other(2) | | | 10,270 | | | 7,169 | |
Fee earning AUM based on collateral balances, at par(3) | | | 11,822 | | | 13,383 | |
| | | | | | |
| | | | | | | | |
Total fee earning AUM | | $ | 23,860 | | $ | 23,606 | |
| | | | | | |
| | | | | | | | |
| | | | | | | | |
| | | | | | |
- (1)
- Reflects limited partner invested capital.
- (2)
- Market value/other includes variances for some funds that are attributable to management fee basis calculations based on average portfolio values or beginning of period values.
- (3)
- Reflects the gross amount of aggregate collateral balances, at par, for our CLOs.
Tradable Credit Group fee earning AUM may vary from AUM for variety of reasons including the following:
- •
- leverage for certain funds that utilize leverage strategies and for which management fees are based on NAV, drawn equity or invested equity;
- •
- investments made by the general partner and/or certain of its affiliates;
- •
- undrawn capital commitments to funds for which management fees are based on invested capital; and
- •
- fee earning AUM based on invested or committed capital does not reflect the impact of changes in market value.
The reconciliation of AUM to fee earning AUM for the Tradable Credit Group is presented below for each period.
| | | | | | | |
| | Three Months Ended
March 31, | |
|---|
| | 2014 | | 2013 | |
|---|
| | (Dollars in millions)
| |
|---|
Tradable Credit Group | | | | | | | |
AUM | | $ | 31,361 | | $ | 26,058 | |
Non-fee paying debt | | | (4,930 | ) | | (1,465 | ) |
General partner and affiliates | | | (163 | ) | | (174 | ) |
Undeployed | | | (1,143 | ) | | (456 | ) |
Market value/other | | | (750 | ) | | (357 | ) |
Fees not activated | | | (514 | ) | | — | |
| | | | | | |
| | | | | | | | |
Fee earning AUM | | $ | 23,860 | | $ | 23,606 | |
| | | | | | |
| | | | | | | | |
| | | | | | | | |
| | | | | | |
115
Table of Contents
Total AUM was $31.4 billion as of March 31, 2014 compared to fee earning AUM of $23.9 billion, reflecting a difference of $7.5 billion. The difference was primarily due to non-fee paying debt in the amount of $4.9 billion from the utilization of leveraged strategies for which management fees are earned on drawn equity or invested equity. In addition, $1.1 billion of the total difference was due to undrawn capital commitments for which management fees are earned on invested capital or market value of assets. The net difference in market value was $0.8 billion as of March 31, 2014.
Total AUM was $26.1 billion as of March 31, 2013 compared to fee earning AUM of $23.6 billion, reflecting a difference of $2.5 billion. The difference was primarily due to non-fee paying debt in the amount of $1.5 billion entirely attributable to ECO. In addition, $455.6 million of the total difference was due to undrawn capital commitments for which management fees are earned on invested capital or market value of assets. The net difference in market value was $357.3 million as of March 31, 2013.
Tradable Credit Group—Fund Performance Metrics for the Three Months Ended March 31, 2014
The Tradable Credit Group manages approximately 70 funds across strategies in long-only and alternative credit. One fund, CSF, contributed 10% or more of the Tradable Credit Group's total management fees for the three months ended March 31, 2014, whereas over 34 funds contributed over 1% of the group's total management fees for the three months ended March 31, 2014. The Tradable Credit Group manages four of our significant funds: ECO I, an alternative credit hedge fund designed as an enhancement to existing fixed income strategies or as an alternative to global equity strategies, AELIS VI, a long-only comingled fund that opportunistically acquired a credit portfolio from a bank in 2008 and is currently in harvest mode, CSF, an alternative credit managed account with a flexible and opportunistic mandate to invest in corporate credit funds, and ASIP II, an alternative credit managed account with a flexible and opportunistic mandate to invest in corporate credit. In addition, the following table includes performance information for the fund with the greatest amount of management fees for the three months
116
Table of Contents
ended March 31, 2014 for each of the high yield, special situations and dynamic credit sub-strategies within the Tradable Credit Group, which are not otherwise represented by the significant funds.
| | | | | | | | | | | | | | | | | | | |
| |
| | As of March 31, 2014 | |
| |
|---|
| |
| |
| | Net Returns
(%)(2) | |
| |
|---|
Fund | | Year of
Inception | | Assets Under
Management(1) | | Since
Inception | | Past
5 Years | | Past
3 Years | | Investment Strategy | |
|---|
| |
| | (Dollars in millions)
| |
| |
| |
| |
| |
|---|
ECO I(3)(4) | | | 2006 | | $ | 2,655 | | | 2.2 | | | 23.6 | | | 9.9 | | | Alternative: Credit Opportunities | |
HY II(3) | | | 2007 | | $ | 393 | | | 9.0 | | | 16.8 | | | 8.3 | | | Long-Only: High yield | |
AELIS VI(6) | | | 2008 | | $ | 826 | | | 16.5 | | | n/a | | | 9.6 | | | Long-Only: Loans | |
CSF(5) | | | 2008 | | $ | 1,652 | | | 14.3 | | | 13.1 | | | 8.5 | | | Alternative: Credit Opportunities | |
BVK(3) | | | 2009 | | $ | 412 | | | 6.4 | | | n/a | | | 5.6 | | | Alternative: Special Situations | |
ASIP II(3) | | | 2009 | | $ | 838 | | | 11.1 | | | n/a | | | 7.1 | | | Alternative: Credit Opportunities | |
ARDC(7) | | | 2012 | | $ | 487 | | | n/a | | | n/a | | | n/a | | | Alternative: Dynamic Credit | |
- (1)
- Assets under management equals the sum of the NAV for such fund, the drawn and undrawn debt (at the fund-level including amounts subject to restrictions) and uncalled committed capital.
- (2)
- Returns are net of management fees and performance fees as applicable. ECO I, AELIS VI and CSF net numbers are also after giving effect to other expenses.
- (3)
- The net return is an annualized net return calculated using the modified Dietz method, which is an estimate of the time-weighted return and adjusts portfolio cash flows according to the time they were invested in the portfolio and is calculated by dividing (A) net asset value change over the period minus cash flow, by (B) (i) beginning net asset value plus (ii) weighted cash flow.
- (4)
- From the inception of ECO I through year-end 2008, the fund was managed primarily as a long-only strategy, employing 3-4x debt to equity leverage during a period of high volatility within the credit markets, which impacted fund performance. Beginning in 2009, ECO I's strategy was modified to incorporate a broader array of hedges and other shorting instruments with targeted leverage levels reduced to 1-1.5x on a debt to equity basis. AUM includes capital committed by CSF, a fund of funds.
- (5)
- The net return is an annualized net internal rate of return of cash flows on investments and the investments ending valuations for the period. The past five and three years net returns are calculated using beginning investment valuations for such period. CSF is a fund of funds and AUM represented may include AUM that has been committed to other Ares funds.
- (6)
- The net return is an annualized net internal rate of return of cash flows to and from fee-paying limited partners and the fee-paying limited partners' ending capital for the period. The past five and three years net returns are calculated using beginning fee-paying limited partners' capital for such period.
- (7)
- The net return is not shown due to the fund's recent vintage.
For the group's significant funds and other funds that in each case are structured as closed-end private comingled funds, the following table presents certain additional performance data.
| | | | | | | | | | | | | | | | | | | | | | |
| | As of March 31, 2014 (Dollars in millions) | |
|---|
Fund | | Original Capital
Commitments | | Cumulative Invested
Capital | | Realized
Proceeds(1) | | Unrealized
Value(2) | | Total
Value | | Gross
MoIC(3) | | Net
MoIC(4) | |
|---|
AELIS VI | | $ | 660 | | $ | 660 | | $ | 1,269 | | $ | 207 | | $ | 1,476 | | | 2.2x | | | 2.0x | |
- (1)
- Realized proceeds represent the total distributions made from the fund to the partners, including any amounts paid to the general partner as management fees, carried interest and other expenses.
- (2)
- Unrealized value represents the fund's net asset value as of March 31, 2014. There can be no assurance that unrealized investments will be realized at the valuations shown.
- (3)
- The gross multiple of invested capital ("Gross MoIC") as of March 31, 2014 is before giving effect to taxes, management fees and the general partner's carried interest and other expenses.
- (4)
- The net multiple of invested capital ("Net MoIC") as of March 31, 2014 is after giving effect to management fees and the general partner's carried interest and other expenses.
117
Table of Contents
Direct Lending Group
The following table sets forth certain statement of operations data and certain other data of our Direct Lending Group segment on a standalone basis for the periods presented.
| | | | | | | |
| | Three Months Ended
March 31, | |
|---|
| | 2014 | | 2013 | |
|---|
| | (Dollars in thousands)
| |
|---|
Direct Lending Group | | | | | | | |
Management fees—recurring (includes ARCC Part I Fees of $28,318 and $23,836 for the periods ended March 31, 2014 and 2013, respectively) | | $ | 66,204 | | $ | 51,450 | |
Management fees—one-time deferrals | | | — | | | — | |
| | | | | | |
| | | | | | | | |
Total management fees | | | 66,204 | | | 51,450 | |
Administrative fees and other income | | | 90 | | | 83 | |
Compensation and benefits | | | (32,212 | ) | | (26,902 | ) |
General, administrative and other expenses | | | (1,914 | ) | | (1,802 | ) |
| | | | | | |
| | | | | | | | |
Fee related earnings | | $ | 32,168 | | $ | 22,829 | |
| | | | | | |
| | | | | | | | |
| | | | | | | | |
| | | | | | |
Performance fees—realized | | $ | 39 | | $ | — | |
Performance fees—unrealized | | | 2,292 | | | 1,499 | |
Performance fee compensation—realized | | | (29 | ) | | — | |
Performance fee compensation—unrealized | | | (1,451 | ) | | (823 | ) |
| | | | | | |
| | | | | | | | |
Net performance fees | | | 851 | | | 676 | |
Investment income (loss)—realized | | | (597 | ) | | (825 | ) |
Investment income (loss)—unrealized | | | 1,524 | | | 3,839 | |
Interest and other income | | | 98 | | | 1,151 | |
Interest expense | | | (304 | ) | | (637 | ) |
| | | | | | |
| | | | | | | | |
Net investment income | | | 721 | | | 3,528 | |
Performance related earnings | | $ | 1,572 | | $ | 4,204 | |
| | | | | | |
| | | | | | | | |
| | | | | | | | |
| | | | | | |
Economic net income | | $ | 33,740 | | $ | 27,033 | |
| | | | | | |
| | | | | | | | |
| | | | | | | | |
| | | | | | |
Distributable earnings | | $ | 31,158 | | $ | 22,342 | |
| | | | | | |
| | | | | | | | |
| | | | | | | | |
| | | | | | |
Direct Lending Group—Three Months Ended March 31, 2014 Compared to Three Months Ended March 31, 2013
Management Fees. Total management fees increased by $14.8 million, or 28.7%, to $66.2 million for the three months ended March 31, 2014 compared to the three months ended March 31, 2013 and the effective management fee rate increased by 0.01% from 1.32% as of March 31, 2013, to 1.33% as of March 31, 2014. The increase was principally driven by additional capital raises of ARCC, resulting in an incremental management fee of $6.8 million for the three months ended March 31, 2014 compared to the three months ended March 31, 2013. In addition, our Direct Lending Group's European platform generated an additional $5.4 million in management fees for the three months ended March 31, 2014 compared to the three months ended March 31, 2013 primarily due to ACE II. Management fees of the Direct Lending Group also include quarterly fees on the net investment income from ARCC Part I Fees. Total ARCC management fees for the three months ended March 31, 2014 were $58.4 million, of which $28.3 million related to ARCC Part I Fees.
118
Table of Contents
Performance Fees. Performance fees increased by $0.8 million, or 55.5%, to $2.3 million for the three months ended March 31, 2014 compared to the three months ended March 31, 2013. The three months ended March 31, 2014 includes performance fees reversals of approximately $0.8 million primarily related to a Direct Lending Group managed account. No performance fees were reversed for the three months ended March 31, 2013. The increase in performance fees was principally attributable to an increase in ARCC Part II Fees from additional net realized capital gains and due to ACE II, which had realizations on the underlying investment during the first quarter of 2014 and first exceeded its hurdle in the third quarter of 2013.
Compensation and Benefits. Compensation and benefits increased by $5.3 million, or 19.7%, to $32.2 million for the three months ended March 31, 2014 compared to the three months ended March 31, 2013. The increase was primarily driven by merit-based increases and due to the ACE Externalization. Compensation and benefits represented 48.7% of total management fees for the three months ended March 31, 2014 compared to 52.3% for the three months ended March 31, 2013.
General, Administrative and Other Expenses. General, administrative and other expenses increased by $0.1 million, or 6.2%, to $1.9 million for the three months ended March 31, 2014 compared to the three months ended March 31, 2013. The increase was driven primarily by an increase in headcount from 2013 to 2014 and the ACE Externalization.
Net Investment Income (Loss). Net investment income decreased by $2.8 million, or 79.6%, to $0.7 million for the three months ended March 31, 2014 compared to the three months ended March 31, 2013. The decrease in net investment income was primarily due to the decrease in unrealized appreciation and income earned from an investment in ARCC common stock of $2.8 million, as the Company's investment in ARCC was distributed in kind to the Company's owners in the fourth quarter of 2013. For the three months ended March 31, 2014, 17% of the balance sheet investments at fair value were attributable to the Direct Lending Group.
Economic Net Income. ENI was $33.7 million for the three months ended March 31, 2014 compared to $27.0 million for the three months ended March 31, 2013, representing an increase of $6.7 million. The increase in ENI for the three months ended March 31, 2014 was due to an increase in FRE of $9.3 million. The increase was partially offset by a decrease in net investment income of $2.8 million.
Fee Related Earnings. FRE was $32.2 million for the three months ended March 31, 2014 compared to $22.8 million for the three months ended March 31, 2013. The increase was due to an increase in management fees of $14.8 million partially offset by an increase in compensation and benefits expense of $5.3 million.
Performance Related Earnings. PRE was $1.6 million for the three months ended March 31, 2014 compared to $4.2 million for the three months ended March 31, 2013, representing a decrease of $2.6 million. The PRE decrease was attributable primarily to lower corporate investment in ARCC.
Distributable Earnings. DE increased by $8.8 million, or 39.5%, to $31.2 million for the three months ended March 31, 2014 compared to the three months ended March 31, 2013. The increase was primarily due to an increase in FRE.
119
Table of Contents
Direct Lending Group—Assets Under Management
The table below provides the period-to-period roll forward of AUM for the Direct Lending Group:
| | | | | | | |
| | Three Months Ended
March 31, | |
|---|
| | 2014 | | 2013 | |
|---|
| | (Dollars in millions)
| |
|---|
Direct Lending Group | | | | | | | |
Change in AUM: | | | | | | | |
Beginning of period | | $ | 27,493 | | $ | 22,480 | |
Acquisitions | | | — | | | — | |
Commitments(1) | | | 128 | | | 571 | |
Capital reduction(2) | | | (83 | ) | | (214 | ) |
Distributions(3) | | | (153 | ) | | (175 | ) |
Change in fund value(4) | | | 178 | | | 43 | |
| | | | | | |
| | | | | | | | |
End of period | | $ | 27,563 | | $ | 22,706 | |
| | | | | | |
| | | | | | | | |
| | | | | | | | |
| | | | | | |
Average AUM | | $ | 27,528 | | $ | 22,593 | |
- (1)
- Represents new commitments during the period, including equity and debt commitments, as well as equity offerings by our publicly traded vehicles.
- (2)
- Represents the permanent reduction in leverage during the period.
- (3)
- Represents distributions and redemptions net of callable amounts.
- (4)
- Includes fund net income, including interest income, realized and unrealized gains (losses), fees and expenses and the impact of foreign currency.
Total AUM was $27.6 billion as of March 31, 2014, an increase of $70 million, or 0.3%, compared to total AUM of $27.5 billion as of December 31, 2013. During the three months ended March 31, 2014, the increase in AUM was primarily due to $127.8 million of new commitments to our funds, which was mainly comprised of $110.0 million in new debt commitments for ARCC. The increases in AUM were partially offset by distributions of $140.2 million, redemptions of $2.6 million, and decrease in leverage of $82.7 million, which includes amounts related to subordinated notes. ARCC accounted for $128.1 million of the total distributions, and ACE I accounted for $141.5 million of the total net reduction in leverage. In addition, change in fund value totaled $177.9 million across the portfolio for the three months ended March 31, 2014, of which $116.7 million was attributable to ARCC.
Total AUM was $22.7 billion as of March 31, 2013, an increase of $225.6 million, or 1.0%, compared to total AUM of $22.5 billion as of December 31, 2012. During the three months ended March 31, 2013, the increase in AUM was primarily due to $570.9 million of new commitments, which was mainly comprised of $513.0 million in new equity commitments to our Direct Lending Group's European funds. This increase was partially offset by reduction of capital of $214.2 million and distributions of $172.5 million, of which $94.5 million was attributable to ARCC. In addition, change in fund value totaled $43.5 million across the portfolio.
120
Table of Contents
Direct Lending Group—Fee Earning AUM
The table below provides the period-to-period roll forward of fee earning AUM for the Direct Lending Group:
| | | | | | | |
| | Three Months Ended
March 31, | |
|---|
| | 2014 | | 2013 | |
|---|
| | (Dollars in millions)
| |
|---|
Direct Lending Group | | | | | | | |
Change in fee earning AUM: | | | | | | | |
Beginning of period | | $ | 19,581 | | $ | 15,450 | |
Commitments(1) | | | 5 | | | 104 | |
Subscriptions/deployment/increase in leverage(2) | | | 487 | | | 32 | |
Redemption/distribution/decrease in leverage(3) | | | (395 | ) | | (691 | ) |
Change in fund value(4) | | | 454 | | | 423 | |
End of period | | $ | 20,133 | | $ | 15,318 | |
| | | | | | |
| | | | | | | | |
| | | | | | | | �� |
| | | | | | |
Average fee earning AUM | | $ | 19,857 | | $ | 15,384 | |
- (1)
- Represents new commitments during the period for funds that earn management fees based on committed capital.
- (2)
- Represents subscriptions, capital deployment and increase in leverage (for funds that earn fees on a gross asset basis).
- (3)
- Represents redemptions, distributions and decrease in leverage (for funds that earn fees on a gross asset basis).
- (4)
- Includes fund net income, including interest income, realized and unrealized gains (losses), fees and expenses and the impact of foreign currency for funds that earn management fees based on market value.
Total fee earning AUM was $20.1 billion as of March 31, 2014, an increase of $0.6 billion, or 2.8%, compared to total fee earning AUM of $19.6 billion as of December 31, 2013. During the three months ended March 31, 2014, the increase in fee earning AUM was primarily due to $487.2 million of subscriptions and capital deployment in our funds, of which $237.8 million was attributable to our Direct Lending Group's European funds. The increases in fee earning AUM were partially offset by net distributions, redemptions, and reduction in leverage (for funds that earn fees on a gross asset basis) of $394.5 million. Total distributions for the three months were $195.9 million, of which $128.1 million was attributable to ARCC. Total reduction in leverage for the three months was $198.6 million, which includes amounts related to subordinated notes. In addition, change in fund value totaled $454.2 million across our portfolio during the three months ended March 31 2014.
Total fee earning AUM was $15.3 billion as of March 31, 2013, a decrease of $0.1 billion, or 0.9%, compared to total fee earning AUM of $15.4 billion as of December 31, 2012. During the three months ended March 31, 2013, the decrease in fee earning AUM was primarily due to reduction in leverage of $424.9 million and distributions of $265.8 million. This decrease was partially offset by change in fund value totaling $422.6 million across our portfolio for the three months ended March 31, 2013.
121
Table of Contents
Fee earning AUM for the Direct Lending Group is presented below for each period. The table below breaks out fee earning AUM by its respective components for each period.
| | | | | | | |
| | Three Months Ended
March 31, | |
|---|
| | 2014 | | 2013 | |
|---|
| | (Dollars in millions)
| |
|---|
Direct Lending Group | | | | | | | |
Components of fee earning AUM | | | | | | | |
Fee earning AUM based on capital commitments(1) | | $ | — | | $ | 295 | |
Fee earning AUM based on invested capital(2) | | | 2,178 | | | 851 | |
Fee earning AUM based on market value/other(3) | | | 8,581 | | | 6,591 | |
Fee earning AUM based on collateral balances, at par(4) | | | 9,374 | | | 7,581 | |
| | | | | | |
| | | | | | | | |
Total fee earning AUM | | $ | 20,133 | | $ | 15,318 | |
| | | | | | |
| | | | | | | | |
| | | | | | | | |
| | | | | | |
- (1)
- Reflects limited partner capital commitments to funds for which the investment period has not expired.
- (2)
- Reflects limited partner invested capital.
- (3)
- Market value/other includes ARCC fee earning AUM which is based on the average value of total assets less cash.
- (4)
- Reflects the gross amount of aggregate collateral balances, at par, for our CLOs and SSLP.
Direct Lending Group fee earning AUM may vary from AUM for variety of reasons including the following:
- •
- investments made by the general partner and/or certain of its affiliates;
- •
- undrawn capital commitments to funds for which management fees are based on invested capital;
- •
- funds for which fee earning AUM does not reflect the impact of changes in market value; and
- •
- funds for which management fee accrual has not been activated.
The reconciliation of fee earning AUM for the Direct Lending Group is presented below for each period.
| | | | | | | |
| | Three Months Ended
March 31, | |
|---|
| | 2014 | | 2013 | |
|---|
| | (Dollars in millions)
| |
|---|
Direct Lending Group | | | | | | | |
AUM | | $ | 27,563 | | $ | 22,706 | |
Non-fee paying debt | | | (276 | ) | | — | |
AIH co-invest/cross holdings | | | (297 | ) | | (259 | ) |
Undeployed | | | (6,894 | ) | | (6,696 | ) |
Market value/other | | | 36 | | | (433 | ) |
Fees not activated | | | — | | | — | |
| | | | | | |
| | | | | | | | |
Fee earning AUM | | $ | 20,133 | | $ | 15,318 | |
| | | | | | |
| | | | | | | | |
| | | | | | | | |
| | | | | | |
122
Table of Contents
Total AUM was $27.6 billion as of March 31, 2014 compared to fee earning AUM of $20.1 billion, reflecting a difference of $7.4 billion. The difference was primarily due to $6.9 billion of undrawn capital commitments (including $2.0 billion of undrawn commitments for ARCC) for which management fees are earned on invested capital or portfolio value excluding cash.
Total AUM was $22.7 billion as of March 31, 2013 compared to fee earning AUM of $15.3 billion, reflecting a difference of $7.4 billion. The difference was primarily driven by $6.7 billion of undrawn capital commitments (including $1.5 billion of undrawn commitments for ARCC) for which management fees are earned on invested capital or portfolio value excluding cash. The net difference in market value was $433.0 million as of March 31, 2013.
Direct Lending Group—Fund Performance Metrics for the Three Months Ended March 31, 2014
The Direct Lending Group manages over 30 funds in the United States and Europe. While the group manages a range of funds, ARCC and ACE II, each considered a significant fund, combine for over 90% of the group's total management fees for the three months ended March 31, 2014. ARCC is a publicly traded business development company that principally originates and invests in first lien senior secured loans, second lien senior secured loans and mezzanine debt in the United States. ARCC has increased its AUM from approximately $300 million in 2004 to $9.9 billion in 2014 and is the largest of our funds both by AUM and management fee revenue. ACE II is a 2013 comingled fund focused on direct lending to European middle market companies.
| | | | | | | | | | | | | | | | | |
| |
| | As of March 31, 2014 | |
|
|---|
| |
| |
| | Annualized Returns
(%) | |
|
|---|
Fund | | Year of
Inception | | Assets Under
Management(1) | | Since
Inception | | Past
5 Years | | Past
3 Years | | Investment Strategy |
|---|
| |
| | (Dollars in millions)
| |
| |
| |
| |
|
|---|
ARCC(2) | | | 2004 | | $ | 9,913 | | | 13.9 | | | 43.0 | | | 11.0 | | U.S. Direct Lending |
ACE II(3) | | | 2013 | | $ | 1,536 | | | n/a | | | n/a | | | n/a | | European Direct Lending |
- (1)
- Assets under management equals the sum of the NAV for such fund, the drawn and undrawn debt (at the fund-level including amounts subject to restrictions) and uncalled committed capital but, with respect to ARCC, does not include AUM of the SSLP (through which ARCC co-invests with affiliates of General Electric Company) or Ivy Hill Asset Management, L.P. (a wholly owned portfolio company of ARCC).
- (2)
- The annualized return is the return to ARCC's stockholders based on ARCC's public stock price and is calculated assuming dividends are reinvested at the end of day stock price on the relevant quarterly ex-dividend dates. The return is calculated assuming stockholders did not participate in the rights issuance as of March 20, 2008.
- (3)
- The annualized return is not shown due to the fund's recent vintage.
123
Table of Contents
For the group's significant funds and other funds that in each case are structured as closed-end private comingled funds, the following table presents certain additional performance data.
| | | | | | | | | | | | | | | | | | | | | | |
| | As of March 31, 2014 (Dollars in millions) | |
|---|
Fund | | Original Capital
Commitments | | Cumulative Invested
Capital | | Realized
Proceeds(1) | | Unrealized
Value(2) | | Total
Value | | Gross
MoIC(3) | | Net
MoIC(4) | |
|---|
ACE II | | $ | 1,229 | | $ | 465 | | $ | 6 | | $ | 489 | | $ | 495 | | | 1.1x | | | 1.1x | |
- (1)
- Realized proceeds represent the sum of all cash distributions to limited partners.
- (2)
- Unrealized value represents the fund's net asset value as of March 31, 2014.
- (3)
- The Gross MoIC as of March 31, 2014 is before giving effect to management fees, the general partner's carried interest and other expenses.
- (4)
- The Net MoIC as of March 31, 2014 is after giving effect to management fees, the general partner's carried interest and other expenses.
Private Equity Group
The following table sets forth certain statement of operations data and certain other data of our Private Equity Group segment on a standalone basis for the periods presented.
| | | | | | | |
| | Three Months Ended
March 31, | |
|---|
| | 2014 | | 2013 | |
|---|
| | (Dollars in thousands)
| |
|---|
Private Equity Group | | | | | | | |
Management fees—recurring | | $ | 23,196 | | $ | 23,543 | |
Management fees—one-time deferrals | | | — | | | — | |
| | | | | | |
| | | | | | | | |
Total management fees | | | 23,196 | | | 23,543 | |
Administrative fees and other income | | | 76 | | | 117 | |
Compensation and benefits | | | (8,195 | ) | | (6,596 | ) |
General, administrative and other expenses | | | (2,000 | ) | | (2,238 | ) |
| | | | | | |
| | | | | | | | |
Fee related earnings | | $ | 13,077 | | $ | 14,826 | |
| | | | | | |
| | | | | | | | |
| | | | | | | | |
| | | | | | |
Performance fees—realized | | $ | 13,086 | | $ | 9,012 | |
Performance fees—unrealized | | | 21,341 | | | 25,513 | |
Performance fee compensation—realized | | | (10,472 | ) | | (7,209 | ) |
Performance fee compensation—unrealized | | | (16,912 | ) | | (20,269 | ) |
| | | | | | |
| | | | | | | | |
Net performance fees | | | 7,043 | | | 7,047 | |
Investment income—realized | | | 1,131 | | | 926 | |
Investment income (loss)—unrealized | | | 15,156 | | | 2,424 | |
Interest and other income | | | 2,785 | | | 406 | |
Interest expense | | | (623 | ) | | (919 | ) |
| | | | | | |
| | | | | | | | |
Net investment income | | | 18,449 | | | 2,837 | |
Performance related earnings | | $ | 25,492 | | $ | 9,884 | |
| | | | | | |
| | | | | | | | |
| | | | | | | | |
| | | | | | |
Economic net income | | $ | 38,569 | | $ | 24,710 | |
| | | | | | |
| | | | | | | | |
| | | | | | | | |
| | | | | | |
Distributable earnings | | $ | 18,698 | | $ | 16,752 | |
| | | | | | |
| | | | | | | | |
| | | | | | | | |
| | | | | | |
124
Table of Contents
Private Equity Group—Three Months Ended March 31, 2014 Compared to Three Months Ended March 31, 2013
Management Fees. Total management fees decreased by $0.3 million, or 1.5%, to $23.2 million for the three months ended March 31, 2014 compared to the three months ended March 31, 2013 and the effective management fee increased by 0.04% from 1.23% as of March 31, 2013, to 1.27% as of March 31, 2014. The management fee remained relatively flat from 2013 to 2014.
Performance Fees. Performance fees decreased by $0.1 million, or 0.3%, to $34.4 million for the three months ended March 31, 2014 compared to the three months ended March 31, 2013. The three months ended March 31, 2014 includes performance fees reversed of approximately $1.6 million primarily related to ACOF II. The three months ended March 31, 2013 includes performance fees reversed of approximately $0.7 million primarily related to ACOF I. The decrease was driven by our legacy funds, ACOF II and ACOF III, principally attributable to substantial realizations on the underlying investments during 2013. The decrease was partially offset by the increase in ACOF Asia which contributed $2.8 million of unrealized performance fees by exceeding its hurdle rate for the first time in the fourth quarter of 2013.
Compensation and Benefits. Compensation and benefits increased by $1.6 million, or 24.2%, to $8.2 million for the three months ended March 31, 2014 compared to the three months ended March 31, 2013. The increase was primarily driven by incremental compensation expenses from merit-based increases and an increase in headcount. Compensation and benefits represented 35.3% of total management fees for the three months ended March 31, 2014 compared to 28.0% for the three months ended March 31, 2013.
General, Administrative and Other Expenses. General, administrative and other expenses decreased by $0.2 million, or 10.6%, to $2.0 million for the three months ended March 31, 2014 compared to the three months ended March 31, 2013. General, administrative and other expenses for the three months ended March 31, 2013 was higher than the same period in 2014 due to an increase in professional fees to support the expansion of the business.
Net Investment Income (Loss). Net investment income increased by $15.6 million, or 550.3%, to $18.4 million for the three months ended March 31, 2014 compared to the three months ended March 31, 2013. The increase in net investment income was primarily driven by an increase in the unrealized appreciation recognized for ACOF Asia of $15.0 million due to significant valuation increase on the fund's equity investments held. For the three months ended March 31, 2014, 43% of the Company's balance sheet investments at fair value were attributable to the Private Equity Group.
Economic Net Income. ENI was $38.6 million for the three months ended March 31, 2014 compared to $24.7 million for the three months ended March 31, 2013, representing an increase of $13.9 million. The increase in ENI for the three months ended March 31, 2014 was due to an increase in net investment income of $15.6 million. This increase was partially offset by a decrease in FRE of $1.7 million in 2014.
Fee Related Earnings. FRE was $13.1 million for the three months ended March 31, 2014 compared to $14.8 million for the three months ended March 31, 2013, representing a decrease of $1.7 million. The decrease was due to a decrease in management fees of $0.3 million and an increase in compensation and benefits expenses.
Performance Related Earnings. PRE was $25.5 million for the three months ended March 31, 2014 compared to $9.9 million for the three months ended March 31, 2013, representing an increase of $15.6 million. The PRE increase was primarily attributable to the increase in net investment income of $15.6 million.
Distributable Earnings. DE increased by $1.9 million, or 11.6%, to $18.7 million for the three months ended March 31, 2014 compared to the three months ended March 31, 2013. The increase was primarily due to an increase in realized investment income of $2.9 million and an increase in net realized performance fees of $0.8 million.
125
Table of Contents
Private Equity Group—Assets Under Management
The table below provides the period-to-period roll forward of AUM for the Private Equity Group:
| | | | | | | |
| | Three Months Ended
March 31, | |
|---|
| | 2014 | | 2013 | |
|---|
| | (Dollars in millions)
| |
|---|
Private Equity Group | | | | | | | |
Change in AUM: | | | | | | | |
Beginning of period | | $ | 9,862 | | $ | 10,141 | |
Acquisitions | | | — | | | — | |
Commitments(1) | | | — | | | 54 | |
Capital reductions(2) | | | (3 | ) | | (2 | ) |
Distributions(3) | | | (288 | ) | | (61 | ) |
Change in fund value(4) | | | 255 | | | 169 | |
| | | | | | |
| | | | | | | | |
End of period | | $ | 9,826 | | $ | 10,302 | |
| | | | | | |
| | | | | | | | |
| | | | | | | | |
| | | | | | |
Average AUM | | $ | 9,844 | | $ | 10,221 | |
- (1)
- Represents new commitments during the period, including equity and debt commitments.
- (2)
- Represents the permanent reduction in leverage during the period.
- (3)
- Represents distributions and redemptions net of recallable amounts.
- (4)
- Includes fund net income, including interest income, realized and unrealized gains (losses), fees and expenses and the impact of foreign currency.
Total AUM was $9.8 billion as of March 31, 2014, a decline of $35.8 million, or 0.36%, compared to total AUM of $9.9 billion as of December 31, 2013. For the three months ended March 31, 2014, the decrease in AUM was primarily driven by net distributions of $288.0 million, comprised of gross distributions of $359.4 million offset by $71.4 million in recallable amounts. ACOF II and ACOF III accounted for $263.4 million and $95.9 million of the total gross distributions, respectively. Change in fund value totaled $254.9 million across our private equity portfolio as of March 31, 2014.
Total AUM was $10.3 billion as of March 31, 2013, an increase of $160.6 million, or 1.6%, compared to total AUM of $10.1 billion as of December 31, 2012. For the three months ended March 31, 2013, the increase in AUM was primarily driven by the change in fund value of $168.9 million and new equity commitments of $54.3 million. This increase was partially offset by gross distributions of $175.6 million in ACOF III.
126
Table of Contents
Private Equity Group—Fee Earning AUM
The table below provides the period-to-period roll forward of fee earning AUM for the Private Equity Group:
| | | | | | | |
| | Three Months
Ended March 31, | |
|---|
| | 2014 | | 2013 | |
|---|
| | (Dollars in millions)
| |
|---|
Private Equity Group | | | | | | | |
Change in fee earning AUM: | | | | | | | |
Beginning of period | | $ | 7,212 | | $ | 7,808 | |
Acquisitions | | | — | | | — | |
Commitments(1) | | | — | | | — | |
Subscriptions/deployment(2) | | | 268 | | | 3 | |
Redemption/distribution(3) | | | (52 | ) | | (267 | ) |
Change in fund value(4) | | | — | | | — | |
Change in fee basis(5) | | | — | | | — | |
| | | | | | |
| | | | | | | | |
End of period | | $ | 7,428 | | $ | 7,544 | |
| | | | | | |
| | | | | | | | |
| | | | | | | | |
| | | | | | |
Average fee earning AUM | | $ | 7,320 | | $ | 7,676 | |
- (1)
- Represents new commitments during the period for funds that earn management fees based on committed capital.
- (2)
- Represents subscriptions and capital deployment.
- (3)
- Represents redemptions and distributions.
- (4)
- Includes fund net income, including interest income, realized and unrealized gains (losses), fees and expenses and the impact of foreign currency for funds that earn management fees based on market value.
- (5)
- Represents the change of fee basis from committed capital to invested capital.
Total fee earning AUM was $7.4 billion as of March 31, 2014, an increase of $215.5 million, or 3.0%, compared to total fee earning AUM of $7.2 billion as of December 31, 2013. For the three months ended March 31, 2014, the increase in fee earning AUM was primarily driven by subscriptions and capital deployment in funds of limited partner capital totaling $268.2 million comprised of $15.4 million and $252.8 million attributable to ACOF II and ACOF III, respectively.
Total fee earning AUM was $7.5 billion as of March 31, 2013, a decrease of $0.3 billion, or 3.4%, compared to total fee earning AUM of $7.8 billion as of December 31, 2012. For the three months ended March 31, 2013, the decrease in fee earning AUM was driven by distributions totaling $266.6 million mainly comprised of $125.5 million and $90.8 million attributable to ACOF II and ACOF III, respectively.
127
Table of Contents
Fee earning AUM for the Private Equity Group is presented below for each period. The table below breaks out fee earning AUM by its respective components for each period:
| | | | | | | |
| | Three Months
Ended March 31, | |
|---|
| | 2014 | | 2013 | |
|---|
| | (Dollars in millions)
| |
|---|
Private Equity Group | | | | | | | |
Components of fee earning AUM | | | | | | | |
Fee earning AUM based on capital commitments(1) | | $ | 4,555 | | $ | 4,533 | |
Fee earning AUM based on invested capital(2) | | | 2,873 | | | 3,011 | |
| | | | | | |
| | | | | | | | |
Total fee earning AUM | | $ | 7,428 | | $ | 7,544 | |
| | | | | | |
| | | | | | | | |
| | | | | | | | |
| | | | | | |
- (1)
- Reflects limited partner capital commitments to funds for which the investment period has not expired.
- (2)
- Reflects limited partner invested capital.
Private Equity Group fee earning AUM may vary from AUM for variety of reasons including the following:
- •
- undrawn capital commitments to funds for which management fees are based on invested capital;
- •
- capital commitments to funds that have not commenced their investment periods;
- •
- investments made by the general partner and/or certain of its affiliates; and
- •
- Fee earning AUM does not reflect the impact of changes in market value.
The reconciliation of AUM to fee earning AUM for the Private Equity Group is presented below for each period.
| | | | | | | |
| | Three Months Ended
March 31, | |
|---|
| | 2014 | | 2013 | |
|---|
| | (Dollars in millions)
| |
|---|
Private Equity Group | | | | | | | |
AUM | | $ | 9,826 | | $ | 10,302 | |
General partner and affiliates | | | (643 | ) | | (600 | ) |
Undeployed | | | (737 | ) | | (956 | ) |
Market value/other | | | (864 | ) | | (1,202 | ) |
Fees not activated | | | (154 | ) | | — | |
| | | | | | |
| | | | | | | | |
Fee earning AUM | | $ | 7,428 | | $ | 7,544 | |
| | | | | | |
| | | | | | | | |
| | | | | | | | |
| | | | | | |
Total AUM was $9.8 billion as of March 31, 2014 compared to fee earning AUM of $7.4 billion, reflecting a difference of $2.4 billion. The difference is attributable to investments made by the general partner and/or certain of its affiliates, undrawn capital commitments to funds that earn fees based on invested capital and market value which were $643.3 million, $736.8 million and $864.6 million, respectively, as of March 31, 2014.
Total AUM was $10.3 billion as of March 31, 2013 compared to fee earning AUM of $7.5 billion, reflecting a difference of $2.8 billion. The difference is attributable to investments made by the general partner and/or certain of its affiliates, undrawn capital commitments to funds that earn fees based on invested capital and market value which were $600.0 million, $955.8 million and $1.2 billion, respectively, as of March 31, 2013.
128
Table of Contents
Private Equity Group—Fund Performance Metrics for the Three Months Ended March 31, 2014
The Private Equity Group manages five comingled funds in private equity. ACOF II, ACOF III and ACOF IV, each considered a significant fund, combine for over 90% of the Private Equity Group's management fees for the three months ended March 31, 2014. Each fund focuses on majority or shared-control investments, principally in under-capitalized companies. Both ACOF II and III are in harvest mode while ACOF IV is in deployment mode. In addition, performance information for ACOF Asia has been included to provide information about the China growth capital sub-strategy within the Private Equity Group.
| | | | | | | | | | | | | | | | | | | |
| |
| | As of March 31, 2014 | |
| |
|---|
| |
| |
| | Net Annualized Returns
(%)(2) | |
| |
|---|
Fund | | Year of
Inception | | Assets Under
Management(1) | | Since
Inception | | Past
5 Years | | Past
3 Years | | Investment Strategy | |
|---|
| |
| | (Dollars in millions)
| |
| |
| |
| |
| |
|---|
ACOF II(3) | | | 2006 | | $ | 949 | | | 14.7 | | | 24.6 | | | 11.1 | | | U.S./European Flexible Capital | |
ACOF III(3) | | | 2008 | | $ | 3,813 | | | 24.5 | | | 26.7 | | | 16.7 | | | U.S./European Flexible Capital | |
ACOF Asia(4) | | | 2011 | | $ | 259 | | | n/a | | | n/a | | | n/a | | | China Growth Capital | |
ACOF IV(4) | | | 2012 | | $ | 4,648 | | | n/a | | | n/a | | | n/a | | | U.S./European Flexible Capital | |
- (1)
- Assets under management equals the sum of the NAV for such fund, the drawn and undrawn debt (at the fund-level including amounts subject to restrictions) and uncalled committed capital.
- (2)
- Returns are net of management fees, the general partner's carried interest and other expenses.
- (3)
- The net annualized return is the internal rate of return computed based on cash flows to and from investments and the partners' ending capital for the period. The past five and three years net return is calculated using beginning partners' capital for such period.
- (4)
- The net return is not shown due to the fund's recent vintage.
For the group's significant funds and other funds that in each case are structured as closed-end private comingled funds, the following table presents certain additional performance data.
| | | | | | | | | | | | | | | | | | | | | | |
| | As of March 31, 2014 (Dollars in millions) | |
|---|
Fund | | Original Capital
Commitments | | Cumulative Invested
Capital | | Realized
Proceeds(1) | | Unrealized
Value(2) | | Total
Value | | Gross
MoIC(3) | | Net
MoIC(4) | |
|---|
ACOF II | | $ | 2,065 | | $ | 2,069 | | $ | 3,508 | | $ | 678 | | $ | 4,186 | | | 2.0x | | | 1.8x | |
ACOF III | | $ | 3,510 | | $ | 3,730 | | $ | 3,566 | | $ | 3,245 | | $ | 6,811 | | | 1.8x | | | 1.6x | |
ACOF Asia | | $ | 220 | | $ | 170 | | $ | 10 | | $ | 226 | | $ | 237 | | | 1.4x | | | 1.3x | |
ACOF IV | | $ | 4,700 | | $ | 975 | | $ | — | | $ | 1,036 | | $ | 1,036 | | | 1.1x | | | 1.0x | |
- (1)
- Realized proceeds represent the sum of all cash dividends, interest income, other fees and cash proceeds from realizations of interests in portfolio investments.
- (2)
- Unrealized value represents the fair value of remaining investments as of March 31, 2014. There can be no assurance that unrealized investments will be realized at the valuations shown.
- (3)
- The Gross MoIC as of March 31, 2014 is before giving effect to taxes, management fees, the general partner's carried interest and other expenses.
- (4)
- The Net MoIC as of March 31, 2014 is after giving effect to management fees, the general partner's carried interest and other expenses.
129
Table of Contents
Real Estate Group
The following table set forth certain statement of operations data and certain other data of our Real Estate Group segment on a standalone basis for the periods presented.
| | | | | | | |
| | Three Months Ended
March 31, | |
|---|
| | 2014 | | 2013 | |
|---|
| | (Dollars in thousands)
| |
|---|
Real Estate Group | | | | | | | |
Management fees—recurring | | $ | 16,768 | | $ | 2,467 | |
Management fees—one-time deferrals | | | — | | | — | |
| | | | | | |
| | | | | | | | |
Total management fees | | | 16,768 | | | 2,467 | |
Administrative fees and other income | | | 1,290 | | | 5 | |
Compensation and benefits | | | (11,485 | ) | | (3,568 | ) |
General, administrative and other expenses | | | (4,267 | ) | | (1,258 | ) |
| | | | | | |
| | | | | | | | |
Fee related earnings (loss) | | $ | 2,306 | | $ | (2,354 | ) |
| | | | | | |
| | | | | | | | |
| | | | | | | | |
| | | | | | |
Performance fees—realized | | $ | — | | $ | — | |
Performance fees—unrealized | | | 2,950 | | | — | |
Performance fee compensation—realized | | | — | | | — | |
Performance fee compensation—unrealized | | | — | | | — | |
| | | | | | |
| | | | | | | | |
Net performance fees | | | 2,950 | | | — | |
Investment loss—realized | | | 730 | | | (37 | ) |
Investment income (loss)—unrealized | | | (862 | ) | | 1,048 | |
Interest and other income | | | 11 | | | 39 | |
Interest expense | | | (325 | ) | | (213 | ) |
| | | | | | |
| | | | | | | | |
Net investment loss | | | (446 | ) | | 837 | |
Performance related earnings (loss) | | $ | 2,504 | | $ | 837 | |
| | | | | | |
| | | | | | | | |
| | | | | | | | |
| | | | | | |
Economic net income (loss) | | $ | 4,810 | | $ | (1,517 | ) |
| | | | | | |
| | | | | | | | |
| | | | | | | | |
| | | | | | |
Distributable earnings (loss) | | $ | 1,499 | | $ | (3,422 | ) |
| | | | | | |
| | | | | | | | |
| | | | | | | | |
| | | | | | |
Real Estate Group—Three Months Ended March 31, 2014 Compared to Three Months Ended March 31, 2013
Management Fees. Total management fees increased by $14.3 million, or 579.7%, to $16.8 million for the three months ended March 31, 2014 compared to the three months ended March 31, 2013 and the effective management fee rate increased by 0.23% from 0.87% as of March 31, 2013, to 1.10% as of March 31, 2014. Of the $14.3 million increase in management fees, $13.7 million was contributed by the acquired management fee contracts acquired in the AREA Acquisition. Of the $14.3 million increase, Ares European Real Estate Fund III and Ares US Real Estate Fund VII contributed $3.5 million and $1.9 million, respectively. The increase was also attributable to our publicly traded real estate fund, ACRE, which contributed $0.9 million, from additional capital raised.
Performance Fees. Performance fees were $3.0 million for the three months ended March 31, 2014 compared to no performance fees earned for the three months ended March 31, 2013. The increase in performance fees was attributable to the AREA Acquisition. Since the acquisition, market appreciation in the underlying acquired funds resulted in unrealized performance fees of $3.0 million for the three months ended March 31, 2014.
130
Table of Contents
Compensation and Benefits. Compensation and benefits increased by $7.9 million, or 221.9%, to $11.5 million for the three months ended March 31, 2014 compared to the three months ended March 31, 2013. The increase was driven by incremental compensation expenses from merit-based increases and an increase in headcount primarily due to additional professionals employed following the AREA Acquisition. Compensation and benefits represented 68.5% of total management fees for the three months ended March 31, 2014 compared to 144.7% for the three months ended March 31, 2013. The decrease was principally attributable to an increase in management fees for the three months ended March 31, 2014 as a result of the AREA Acquisition.
General, Administrative and Other Expenses. General, administrative and other expenses increased by $3.0 million, or 239.2%, to $4.3 million for the three months ended March 31, 2014 compared to the three months ended March 31, 2013. The increase was primarily due to additional office expenses due to the AREA Acquisition.
Net Investment Income (Loss). Net investment income decreased by $1.3 million, or 153.3%, to a $0.4 million loss for the three months ended March 31, 2014 compared to the three months ended March 31, 2013. The decrease in net investment income was primarily due to a decrease in unrealized appreciation earned from ACRE, as the Company's investment in ACRE common stock was distributed in kind to the Company's owners in the fourth quarter of 2013, of $1.0 million, in addition to market depreciation from new investments held in the Real Estate Group funds. For the three months ended March 31, 2014, 7% of the balance sheet investments at fair value were attributable to the Real Estate Group.
Economic Net Income (Loss). ENI was $4.8 million for the three months ended March 31, 2014 compared to a $1.5 million loss for the three months ended March 31, 2013, representing an increase of $6.3 million. The increase in ENI for the three months ended March 31, 2014 was primarily driven by increases in net performance fees of $3.0 million and in FRE of $4.7 million. The increase was partially offset by a decrease in net investment income of $1.3 million in 2014.
Fee Related Earnings. FRE was $2.3 million for the three months ended March 31, 2014 compared to ($2.4) million for the three months ended March 31, 2013. The increase in FRE of $4.7 million was primarily attributable to an increase in management fee revenue of $14.3 million partially offset by increases in compensation and benefits expense and general, administrative and other expenses of $10.9 million.
Performance Related Earnings. PRE was $2.5 million for the three months ended March 31, 2014 compared to $0.8 million for the three months ended March 31, 2013. The increase in PRE of $1.7 million was primarily attributable to increases in unrealized performance fees of $3.0 million from market appreciation. The increase was partially offset by a decrease in net investment income of $1.3 million in 2014.
Distributable Earnings (Loss). DE increased by $4.9 million to $1.5 million for the three months ended March 31, 2014 compared to the three months ended March 31, 2013. The increase was primarily driven by an increase in FRE of $4.7 million.
131
Table of Contents
Real Estate Group—Assets Under Management
The table below provides the period-to-period roll forward of AUM for the Real Estate Group.
| | | | | | | |
| | Three Months Ended
March 31 | |
|---|
| | 2014 | | 2013 | |
|---|
| | (Dollars in millions)
| |
|---|
Real Estate Group | | | | | | | |
Change in AUM: | | | | | | | |
Beginning of period | | $ | 8,721 | | $ | 1,664 | |
Acquisitions | | | — | | | — | |
Commitments(1) | | | 350 | | | — | |
Capital reductions(2) | | | (724 | ) | | (34 | ) |
Distributions(3) | | | (244 | ) | | (8 | ) |
Change in fund value(4) | | | 193 | | | 9 | |
| | | | | | |
| | | | | | | | |
End of period | | $ | 8,296 | | $ | 1,630 | |
| | | | | | |
| | | | | | | | |
| | | | | | | | |
| | | | | | |
Average AUM | | $ | 8,509 | | $ | 1,648 | |
- (1)
- Represents new commitments during the period, including equity and debt commitments, as well as equity offerings by our publicly traded vehicles and is offset by return of uncalled commitments to the investors.
- (2)
- Represents the permanent reduction in leverage during the period.
- (3)
- Represents distributions and redemptions net of callable amounts.
- (4)
- Includes fund net income, including interest income, realized and unrealized gains (losses), fees and expenses and the impact of foreign currency.
Total AUM was $8.3 billion as of March 31, 2014, a decline of $0.4 billion, or 4.9%, compared to total AUM of $8.7 billion as of December 31, 2013. For the three months ended March 31, 2014, the decrease in AUM was primarily due to reduction in leverage of $724.1 million and distributions of $243.6 million, comprised of $204.1 million and $39.5 million of real estate equity funds and real estate debt funds, respectively. This decrease was partially offset by $445.0 million of new debt commitments attributable to ACRE and change in fund value of $192.7 million across our portfolios.
Total AUM was $1.6 billion as of March 31, 2013, a decline of $33.8 million, or 2.0%, compared to total AUM of $1.7 billion as of December 31, 2012. For the three months ended March 31, 2013, the decrease in AUM was driven by reduction in leverage of $34.3 million and distributions of $8.4 million. This decrease was partially offset by the change in fund value totaling $8.8 million.
132
Table of Contents
Real Estate Group—Fee Earning AUM
The table below provides the period-to-period roll forward of fee earning AUM for the Real Estate Group.
| | | | | | | |
| | Three Months Ended
March 31, | |
|---|
| | 2014 | | 2013 | |
|---|
| | (Dollars in millions)
| |
|---|
Real Estate Group | | | | | | | |
Change in fee earning AUM: | | | | | | | |
Beginning of period | | $ | 6,388 | | $ | 1,142 | |
Acquisitions | | | — | | | — | |
Commitments(1) | | | 254 | | | — | |
Subscriptions/deployment/increase in leverage(2) | | | 5 | | | — | |
Redemption/distribution/decrease in leverage(3) | | | (773 | ) | | (1 | ) |
Change in fund value(4) | | | (26 | ) | | (2 | ) |
Change in fee basis(5) | | | (39 | ) | | (20 | ) |
| | | | | | |
| | | | | | | | |
End of period | | $ | 5,808 | | $ | 1,119 | |
| | | | | | |
| | | | | | | | |
| | | | | | | | |
| | | | | | |
Average fee earning AUM | | $ | 6,098 | | $ | 1,130 | |
- (1)
- Represents new commitments during the period for funds that earn management fees based on committed capital.
- (2)
- Represents subscriptions, capital deployment and increase in leverage (for funds that earn fees on a gross asset basis).
- (3)
- Represents redemptions, distributions and decrease in leverage (for funds that earn fees on a gross asset basis).
- (4)
- Includes fund net income, including interest income, realized and unrealized gains (losses), fees and expenses and the impact of foreign currency for funds that earn management fees based on market value.
- (5)
- Represents the change of fee basis from committed capital to invested capital.
Total fee earning AUM was $5.8 billion as of March 31, 2014, a decline of $0.6 billion, or 9.1%, compared to total fee earning AUM of $6.4 billion as of December 31, 2013. For the three months ended March 31, 2014, the decrease in fee earning AUM was primarily driven by net distributions, redemption and decrease in leverage (for funds that earn fees on a gross asset basis) in the amount of $773.3 million. Total distributions of $219.4 million for the three months consisted $205.5 million and $14.0 million of real estate equity funds and real estate debt funds, respectively. In addition, total reduction in leverage for the three months was $553.8 million, which is primarily related to the sale of collateral debt obligation.
Total fee earning AUM was $1.1 billion as of March 31, 2013, with no significant difference compared to total fee earning AUM of $1.1 billion as of December 31, 2012.
133
Table of Contents
Fee earning AUM for the Real Estate Group is presented below for each period. The table below breaks out fee earning AUM by its respective components for each period.
| | | | | | | |
| | Three Months Ended
March 31, | |
|---|
| | 2014 | | 2013 | |
|---|
| | (Dollars in millions)
| |
|---|
Real Estate Group | | | | | | | |
Components of fee earning AUM | | | | | | | |
Fee earning AUM based on capital commitments(1) | | $ | 1,420 | | $ | — | |
Fee earning AUM based on invested capital(2) | | | 3,776 | | | — | |
Fee earning AUM based on market value/other(3) | | | 612 | | | 1,119 | |
| | | | | | |
| | | | | | | | |
Total fee earning AUM | | $ | 5,808 | | $ | 1,119 | |
| | | | | | |
| | | | | | | | |
| | | | | | | | |
| | | | | | |
- (1)
- Reflects limited partner capital commitments to funds for which the investment period has not expired.
- (2)
- Reflects limited partner invested capital and includes amounts committed to or reserved for investments for certain real assets funds.
- (3)
- Market value/other includes ACRE fee earning AUM, which is based on our NAV.
Real Estate Group fee earning AUM may vary from AUM for a variety of reasons including the following:
- •
- undrawn capital commitments to funds for which management fees are based on invested capital;
- •
- capital commitments to funds that have not commenced their investment periods;
- •
- fee earning AUM does not reflect the impact of changes in market value;
- •
- funds for which management fee accrual has not been activated; and
- •
- funds that are beyond the term during which management fees are paid.
The reconciliation of fee earning AUM for the Real Estate Group is presented below for each period.
| | | | | | | |
| | Three Months Ended
March 31, | |
|---|
| | 2014 | | 2013 | |
|---|
| | (Dollars in millions)
| |
|---|
Real Estate Group | | | | | | | |
AUM | | $ | 8,296 | | $ | 1,630 | |
SUN joint venture | | | (142 | ) | | — | |
AIH co-invest/cross holdings | | | (54 | ) | | — | |
Non-fee paying debt | | | (964 | ) | | (309 | ) |
Undeployed | | | (352 | ) | | — | |
Market value/other | | | (420 | ) | | (203 | ) |
Fees not activated | | | (167 | ) | | — | |
Fees deactivated | | | (389 | ) | | — | |
| | | | | | |
| | | | | | | | |
Fee earning AUM | | $ | 5,808 | | $ | 1,119 | |
| | | | | | |
| | | | | | | | |
| | | | | | | | |
| | | | | | |
134
Table of Contents
Total AUM was $8.3 billion as of March 31, 2014 compared to fee earning AUM of $5.8 billion, reflecting a difference of $2.5 billion. The difference between AUM and fee earning AUM as of March 31, 2014 was attributable to $964.0 million of non-fee paying debt in ACRE, $352.0 million of undrawn capital for funds for which management fees are earned based on invested capital and AUM of new funds, for which management fees were not activated, contributing $167.5 million.
Total AUM was $1.6 billion as of March 31, 2013 compared to fee earning AUM of $1.1 billion, reflecting a difference of $0.5 billion. The difference between AUM and fee earning AUM was attributable to $308.7 million of non-fee paying debt in ACRE and $202.4 million related to market value.
Real Estate Group—Fund Performance Metrics for the Three Months Ended March 31, 2014
The Real Estate Group manages over 40 funds in real estate debt and real estate equity. Two funds, Ares European Real Estate Fund III ("EU III") and Ares US Real Estate Fund VII ("U.S. VII"), contributed 10% or more of the Real Estate Group's management fees for the three months ended March 31, 2014, whereas over 14 funds contributed over 1%. The Real Estate Group managed two significant funds, EU III and U.S. VII, which are comingled private equity funds focused on real estate assets located in Europe, with a focus on the UK, France and Germany, and the United States, respectively. In addition, performance information for one additional fund, ACRE, has been included to provide additional information about the real estate debt sub-strategies within the Real Estate Group.
| | | | | | | | | | | | | | | | | | | |
| |
| | As of March 31, 2014 | |
| |
|---|
| |
| |
| | Annualized Returns(2)/
Effective Yield
(%) | |
| |
|---|
Fund | | Year of
Inception | | Assets Under
Management(1) | | Since
Inception | | Past
5 Years | | Past
3 Years | | Investment
Strategy | |
|---|
| |
| | (Dollars in millions)
| |
| |
| |
| |
| |
|---|
EU III(3) | | | 2007 | | $ | 1,245 | | | 5.7 | | | 9.0 | | | 8.2 | | | Real Estate Equity | |
U.S. VII(3)(4) | | | 2008 | | $ | 778 | | | 14.4 | | | n/a | | | 17.3 | | | Real Estate Equity | |
ACRE(5) | | | 2012 | | $ | 1,368 | | | 6.4 | | | n/a | | | n/a | | | Real Estate Debt | |
- (1)
- Assets under management equals the sum of the NAV for such fund, the drawn and undrawn debt (at the fund-level including amounts subject to restrictions) and uncalled committed capital.
- (2)
- Returns are net of management fees, the general partner's carried interest and other expenses.
- (3)
- The annualized return shown is a net internal rate of return computed based on cash flows to and from partners and the partners' ending capital for the period. The past five and three years, if presented, net returns are calculated using beginning partners' capital for such period.
- (4)
- Returns since inception are from the first capital event which took place on July 23, 2010 and was a distribution of capital.
- (5)
- The effective yield shown represents the dollar weighted average of the unleveraged effective yield of ACRE's principal lending portfolio measured at the end of the eight quarterly periods ending March 31, 2014. Unleveraged effective yield is based on the contractual interest rate (adjusted for any deferred loan fees, costs, premium or discount) and assumes no dispositions, early prepayments or defaults and does not take into consideration the impact of leverage utilized by ACRE, fees, expenses and other costs incurred by ACRE or its stockholders, which are expected to be significant. Unleveraged effective yield does not represent net returns to investors of ACRE.
135
Table of Contents
For the group's significant funds and other funds that in each case are structured as closed-end private comingled funds, the following table presents certain additional performance data.
| | | | | | | | | | | | | | | | | | | | | | |
| | As of March 31, 2014 (Dollars in millions) | |
|---|
Fund | | Original Capital
Commitments | | Cumulative Invested
Capital(1) | | Realized
Proceeds(2) | | Unrealized
Value(3) | | Total
Value | | Gross
MoIC(4) | | Net
MoIC(5) | |
|---|
EU III | | $ | 1,375 | | $ | 1,185 | | $ | 544 | | $ | 1,100 | | $ | 1,644 | | | 1.4x | | | 1.2x | |
U.S. VII | | $ | 756 | | $ | 689 | | $ | 392 | | $ | 804 | | $ | 1,196 | | | 1.7x | | | 1.4x | |
- (1)
- Includes equity committed, but not yet deployed, to investments that have closed as of March 31, 2014.
- (2)
- Realized proceeds include distributions of operating income, sales and financing proceeds received through March 31, 2014. Returns include the reinvestment of proceeds from asset liquidations, income, and other earnings and reflect the deduction of any relevant transactional costs/expenses.
- (3)
- Unrealized value represents the fair value of remaining real estate investments and commitments as of March 31, 2014 (excluding balance sheet items). There can be no assurance that unrealized investments will be realized at the valuations shown.
- (4)
- The Gross MoIC as of March 31, 2014 is before giving effect to taxes, management fees, the general partner's carried interest and other expenses.
- (5)
- The Net MoIC as of March 31, 2014 is after giving effect to management fees, the general partner's carried interest and other expenses.
136
Table of Contents
Operations Management Group
The following table set forth certain statement of operations data and certain other data of the OMG on a standalone basis for the periods presented.
| | | | | | | |
| | Three Months Ended
March 31, | |
|---|
| | 2014 | | 2013 | |
|---|
| | (Dollars in thousands)
| |
|---|
Operations Management Group | | | | | | | |
Management fees—recurring | | $ | — | | $ | — | |
Management fees—one-time deferrals | | | — | | | — | |
| | | | | | |
| | | | | | | | |
Total management fees | | | — | | | — | |
Administrative fees and other income | | | 5,392 | | | 4,455 | |
Compensation and benefits | | | (27,657 | ) | | (19,082 | ) |
General, administrative and other expenses | | | (13,535 | ) | | (5,554 | ) |
| | | | | | |
| | | | | | | | |
Fee related loss | | $ | (35,800 | ) | $ | (20,181 | ) |
| | | | | | |
| | | | | | | | |
| | | | | | | | |
| | | | | | |
Performance fees—realized | | $ | — | | $ | — | |
Performance fees—unrealized | | | — | | | — | |
Performance fee compensation—realized | | | — | | | — | |
Performance fee compensation—unrealized | | | — | | | — | |
| | | | | | |
| | | | | | | | |
Net performance fees | | | — | | | — | |
Investment income (loss)—realized | | | — | | | — | |
Investment income (loss)—unrealized | | | — | | | — | |
Interest and other income | | | — | | | — | |
Interest expense | | | — | | | — | |
| | | | | | |
| | | | | | | | |
Net investment income (loss) | | | — | | | — | |
Performance related earnings (loss) | | $ | — | | $ | — | |
| | | | | | |
| | | | | | | | |
| | | | | | | | |
| | | | | | |
Economic net loss | | $ | (35,800 | ) | $ | (20,181 | ) |
| | | | | | |
| | | | | | | | |
| | | | | | | | |
| | | | | | |
Distributable loss | | $ | (37,512 | ) | $ | (20,472 | ) |
| | | | | | |
| | | | | | | | |
| | | | | | | | |
| | | | | | |
Operations Management Group—Three Months Ended March 31, 2014 Compared to Three Months Ended March 31, 2013
Administrative Fees and Other Income. Administrative fees and other income increased by $0.9 million, or 21.0%, to $5.4 million for the three months ended March 31, 2014, compared to the three months ended March 31, 2013. The increase was primarily due to an increase of the ARCC and ACRE administrative fees of $1.2 million and $0.5 million, respectively, offset against $0.7 million from the termination of the ACE administrative fee arrangement at the end of the first quarter of 2013 due to the ACE Externalization.
Compensation and Benefits. Compensation and benefits increased by $8.6 million, or 44.9%, to $27.7 million for the three months ended March 31, 2014 compared to the three months ended March 31, 2013. The increase was primarily driven by incremental compensation expenses from merit-based increases and an increase in headcount due to the expansion of our infrastructure group, particularly in our business development group, the addition of professionals from the AREA Acquisition and increased headcount to support the regulations and requirements to which we will be subject as a public company.
137
Table of Contents
General, Administrative and Other Expenses. General, administrative and other expenses increased by $8.0 million, or 143.7%, to $13.5 million for the three months ended March 31, 2014 compared to the three months ended March 31, 2013. The increase was due to additional occupancy, communication and information systems costs related to the AREA Acquisition, additional professional fees to support the growth of the four reportable segments and professional service fees associated with the regulatory requirements to which we will be subject as a public company.
Distributable Loss. Total distributable loss increased by $17.0 million, or 83.2%, to $(37.5) million for the three months ended March 31, 2014 compared to the three months ended March 31, 2013. The increase was due to continued infrastructure expansion and increase in headcount.
Reconciliation of Certain Non-GAAP Measures to Consolidated GAAP Financial Measures
Income before provision for income taxes is the GAAP financial measure most comparable to ENI, FRE and distributable earnings. The following table is a reconciliation of income before provision for income taxes on a consolidated basis to ENI, to FRE and to distributable earnings on a combined segment basis and a reconciliation of FRE to distributable earnings.
| | | | | | | |
| | Three Months Ended
March 31, | |
|---|
| | 2014 | | 2013 | |
|---|
| | (Dollars in thousands)
| |
|---|
Economic net income and fee related earnings: | | | | | | | |
Income before taxes | | $ | 274,675 | | $ | 247,584 | |
| | | | | | |
| | | | | | | | |
Adjustments | | | | | | | |
Amortization of intangibles | | | 8,831 | | | 2,299 | |
Depreciation expense | | | 2,059 | | | 1,233 | |
Equity compensation expenses | | | 5,339 | | | 6,310 | |
Income tax expense | | | — | | | 41 | |
Acquisition-related expenses | | | 1,421 | | | 750 | |
Placement fees and underwriting costs | | | 1,052 | | | 82 | |
OMG expenses, net | | | 35,800 | | | 20,181 | |
Income of non-controlling interests in Consolidated Funds | | | (225,181 | ) | | (148,591 | ) |
Income tax expense (benefit) of non-controlling interests in Consolidated Funds | | | 9,209 | | | (15,839 | ) |
| | | | | | |
| | | | | | | | |
Economic net income | | $ | 113,205 | | $ | 114,050 | |
| | | | | | |
| | | | | | | | |
| | | | | | | | |
| | | | | | |
Total performance fee income—realized | | $ | (23,338 | ) | $ | (18,050 | ) |
Total performance fee income—unrealized | | | (40,092 | ) | | (81,363 | ) |
Total performance fee expense—realized | | | 16,007 | | | 7,245 | |
Total performance fee expense—unrealized | | | 24,718 | | | 55,757 | |
Net investment income | | | (23,740 | ) | | (22,410 | ) |
| | | | | | |
| | | | | | | | |
Fee related earnings | | $ | 66,760 | | $ | 55,229 | |
| | | | | | |
| | | | | | | | |
| | | | | | | | |
| | | | | | |
Management fees | | | 139,861 | | | 108,630 | |
Administrative fees and other income | | | 1,473 | | | 205 | |
Compensation and benefits | | | (62,697 | ) | | (45,833 | ) |
General, administrative and other expenses | | | (11,877 | ) | | (7,773 | ) |
| | | | | | |
| | | | | | | | |
Fee related earnings | | $ | 66,760 | | $ | 55,229 | |
| | | | | | |
| | | | | | | | |
| | | | | | | | |
| | | | | | |
138
Table of Contents
| | | | | | | |
| | Three Months Ended
March 31, | |
|---|
| | 2014 | | 2013 | |
|---|
| | (Dollars in thousands)
| |
|---|
Distributable earnings: | | | | | | | |
Income before taxes | | $ | 274,675 | | $ | 247,584 | |
| | | | | | |
| | | | | | | | |
Adjustments: | | | | | | | |
Amortization of intangibles | | | 8,831 | | | 2,299 | |
Equity compensation expenses | | | 5,339 | | | 6,310 | |
OMG distributable loss | | | 37,512 | | | 20,472 | |
Income of non-controlling interests in Consolidated Funds | | | (225,181 | ) | | (148,591 | ) |
Income tax expense (benefit) of non-controlling interests in Consolidated Funds | | | 9,209 | | | (15,839 | ) |
Unrealized performance fees | | | (40,092 | ) | | (81,363 | ) |
Unrealized performance fee compensation expense | | | 24,718 | | | 55,757 | |
Unrealized investment and other loss | | | (2,952 | ) | | (3,350 | ) |
| | | | | | |
| | | | | | | | |
Distributable earnings | | $ | 92,059 | | $ | 83,279 | |
| | | | | | |
| | | | | | | | |
| | | | | | | | |
| | | | | | |
| | | | | | | |
| | Three Months Ended
March 31, | |
|---|
| | 2014 | | 2013 | |
|---|
| | (Dollars in thousands)
| |
|---|
Fee related earnings | | $ | 66,760 | | $ | 55,229 | |
Performance fee—realized | | | 23,338 | | | 18,050 | |
Performance fee compensation expense—realized | | | (16,007 | ) | | (7,245 | ) |
Other income realized net | | | 20,788 | | | 19,060 | |
| | | | | | |
| | | | | | | | |
Net performance fee income—realized | | $ | 28,119 | | $ | 29,865 | |
Less: | | | | | | | |
One-time acquisition costs | | | — | | | (750 | ) |
Placement fees and underwriting costs | | | (1,052 | ) | | (82 | ) |
Income tax expense | | | — | | | (41 | ) |
Non-cash depreciation and amortization | | | (1,768 | ) | | (942 | ) |
| | | | | | |
| | | | | | | | |
Distributable earnings | | $ | 92,059 | | $ | 83,279 | |
| | | | | | |
| | | | | | | | |
| | | | | | | | |
| | | | | | |
Liquidity and Capital Resources
Historical Liquidity and Capital Resources
We have managed our historical liquidity and capital requirements by focusing on our cash flows before giving effect to our Consolidated Funds. Our credit facilities have historically provided, and we expect will continue to provide, a significant source of our liquidity. Our primary cash flow activities on an unconsolidated basis involve: (1) generating cash flow from operations, which largely includes management fees, (2) realizations generated from our investment activities, (3) funding capital commitments that we have made to our funds, (4) funding complementary acquisitions to support our growth, (5) making distributions to our owners, and (6) borrowings, interest payments and repayments under the Credit Facility. As of March 31, 2014, our cash and cash equivalents were $36.6 million, including investments in money market funds.
Our material sources of cash from our operations include: (1) management fees, which are collected monthly, quarterly or semi-annually, (2) performance fees, which are volatile and largely unpredictable as to amount and timing and (3) fund distributions related to our investments in products that we manage. We primarily use cash flow from operations to pay compensation and related expenses, general, administrative and other expenses, state and local taxes, debt service, capital expenditures and distributions. Our cash flows, together with the proceeds from equity and debt issuances, are also used to fund investments in limited partnerships, fixed assets and other capital items. If cash flow from operations were insufficient to fund distributions, we expect that we would suspend paying such distributions.
139
Table of Contents
Our historical combined and consolidated financial statements reflect the cash flows of our operating businesses as well as the results of our Consolidated Funds. The assets of our Consolidated Funds, on a gross basis, are significantly larger than the assets of our operating businesses and therefore have a substantial effect on our reported cash flows. Our fee earning AUM, which is largely comprised of the assets of our funds, has grown significantly during the periods reflected in our unaudited combined and consolidated financial statements included in this Quarterly Report on Form 10-Q. This growth is primarily due to these funds raising additional capital and re-investing capital generated from gains on investments during these periods. The primary cash flow activities of our Consolidated Funds include: (1) raising capital from third-party investors, which is reflected as non-controlling interests of our Consolidated Funds when required to be consolidated into our combined and consolidated financial statements, (2) financing certain investments by issuing debt, (3) purchasing and selling investment securities, (4) generating cash through the realization of certain investments, (5) collecting interest and dividend income, and (6) distributing cash to investors. Our Consolidated Funds are treated as investment companies for financial accounting purposes under GAAP; therefore, the character and classification of all Consolidated Fund transactions are presented as cash flows from operations.
Cash Flows
The significant captions and amounts from our combined and consolidated financial statements, which include the effects of our Consolidated Funds and CLOs in accordance with GAAP, are summarized below. Negative amounts represent a net outflow, or use of cash.
| | | | | | | |
| | Three Months
Ended March 31, | |
|---|
| | 2014 | | 2013 | |
|---|
| | (Dollars in millions)
| |
|---|
Statements of cash flows data | | | | | | | |
Net cash provided by operating activities | | $ | 1,009 | | $ | 20 | |
Net cash used in investing activities | | | (4 | ) | | (4 | ) |
Net cash used in financing activities | | | (1,059 | ) | | 15 | |
Effect of foreign exchange rate change | | | 1 | | | (14 | ) |
| | | | | | |
| | | | | | | | |
Net change in cash and cash equivalents | | $ | (53 | ) | $ | 17 | |
| | | | | | |
| | | | | | | | |
| | | | | | | | |
| | | | | | |
Operating Activities
Net cash provided by operating activities is primarily driven by our earnings in the respective periods after adjusting for non-cash compensation and performance fees, net realized (gain) loss on investments and net change in unrealized (appreciation) depreciation on investments that are included in net income. Cash used to purchase investments, as well as the proceeds from the sale of such investments, is also reflected in our operating activities as investing activities of our Consolidated Funds. Our senior partners do not receive salary and benefits that we would otherwise record as compensation expense. Cash distributions made to these senior partners are not presented in cash flows from operations, rather these payments are presented in financing activities.
Our net cash flow provided by operating activities was $1.0 billion and $19.8 million for the three months ended March 31, 2014 and 2013, respectively. These amounts primarily include (1) net proceeds (purchases) from investments by our Consolidated Funds, net of purchases of investments, of $0.8 billion and $0.3 billion for the three months ended March 31, 2014 and 2013, respectively, and (2) net income attributable to non-controlling interests in our Consolidated Funds of $225.2 million and $148.6 million for the three months ended March 31, 2014 and 2013, respectively. These amounts also represent the significant variances between net income and cash flows from operations and are reflected as operating activities pursuant to investment company accounting guidance. The increase in net cash provided of
140
Table of Contents
$1.0 billion between the three months ended March 31, 2014 and 2013 is primarily due to our Consolidated Funds reflecting an increase of $0.5 billion in net proceeds (purchases) from investments and a $1.4 billion increase in cash and cash equivalents held by the Consolidated Funds, partially offset by a $1.0 billion decrease in the change in other liabilities and payables held by the Consolidated Funds.
Investing Activities
Our investing activities generally reflect cash used for certain acquisitions and fixed assets. Purchases of fixed assets were $4.3 million, and $3.9 million for the three months ended March 31, 2014 and 2013, respectively. In connection with certain business combinations and acquisitions of certain investment management contracts, we record the fair value of such contracts as an intangible asset. During the three months ended March 31, 2014 and 2013, we did not purchase any management contracts.
Financing Activities
Financing activities are a net use of cash in each of the historical periods presented. Net (distributions) contributions from non-controlling interests in our Consolidated Funds were $(0.3) billion and $(0.4) billion for the three months ended March 31, 2014 and 2013, respectively. As previously stated, distributions to our senior partners are presented as a use of cash from financing activities and were $30.6 million, and $112.4 million for the three months ended March 31, 2014 and 2013, respectively.
Net proceeds from (repayments of) our debt obligations provided an increase (decrease) in cash to us of $19.0 million and $(6.0) million for the three months ended March 31, 2014 and 2013. For our Consolidated Funds, net proceeds from (repayments of) debt obligations were $(746.5) million and $519.0 million for the three months ended March 31, 2014 and 2013, respectively. This change was primarily due to the new CLO funds that were launched or ramping up in the first quarter of 2013, compared to the same period in 2014 in which there were no new CLO funds, and instead greater repayments on the debt obligations for CLOs going through liquidation.
Future Sources and Uses of Liquidity
Our initial sources of liquidity will be (1) cash on hand, (2) net working capital, (3) cash flows from operations, including carried interest and performance fees, (4) realizations on our investments, (5) net borrowing provided by the Credit Facility and (6) net proceeds from the initial public offering. Based on our current expectations, we believe that these sources of liquidity will be sufficient to fund our working capital requirements and to meet our commitments in the foreseeable future.
We expect that our primary liquidity needs will be comprised of cash to (1) provide capital to facilitate the growth of our existing investment management businesses, (2) fund a portion of our commitments to funds that we advise, (3) provide capital to facilitate our expansion into businesses that are complementary to our existing investment management businesses, (4) pay operating expenses, including cash compensation to our employees and payments under the TRA, (5) fund capital expenditures, (6) repay borrowings under the Credit Facility and related interest costs, (7) pay income taxes and (8) make distributions to our unitholders in accordance with our distribution policy.
In the normal course of business, we have made distributions to our existing owners, including distributions sourced from investment income and performance fees. On April 4, 2014, we made a cash distribution in the amount of $150.0 million to our existing owners, a portion of which related to previously undistributed earnings of Ares Investments LLC. The distribution was made from cash and borrowings under the Credit Facility.
141
Table of Contents
Performance fees also provide a significant source of liquidity. Performance fees are realized when an underlying investment is profitably disposed of and the fund's cumulative returns are in excess of the preferred return. Performance fees are typically realized at the end of each fund's measurement period when investment performance exceeds a stated benchmark or hurdle rate. Realization typically occurs near the end of our CLO vehicles' lives.
Our accrued performance fees by segment as of March 31, 2014, gross and net of accrued clawback obligations, are set forth below:
| | | | | | | | | | |
| | As of March 31, 2014 | |
|---|
| | Accrued
Performance
Fees | | Accrued
Clawback
Obligation | | Net Accrued
Performance
Fees | |
|---|
| | (Dollars in thousands)
| |
|---|
Asset class | | | | | | | | | | |
Tradable Credit Group | | $ | 259,278 | | $ | — | | $ | 259,278 | |
Direct Lending Group | | | 7,011 | | | — | | | 7,011 | |
Private Equity Group | | | 224,591 | | | — | | | 224,591 | |
Real Estate Group | | | — | | | — | | | — | |
| | | | | | | | |
| | | | | | | | | | | |
Total | | $ | 490,880 | | $ | — | | $ | 490,880 | |
| | | | | | | | |
| | | | | | | | | | | |
| | | | | | | | | | | |
| | | | | | | | |
In addition to our ongoing sources of liquidity, our subsidiaries amended and restated the unsecured credit agreement dated October 29, 2013 that provides for a $735.0 million revolving credit facility with the ability to upsize to $850.0 million. The Credit Facility currently bears a variable interest rate based on LIBOR plus 1.75% with an unused commitment fee of 0.25%, and is subject to change with our underlying credit agency rating. The Credit Facility contains customary affirmative and negative covenants for agreements of this type, including financial maintenance requirements, delivery of financial and other information, compliance with laws, further assurances and limitations with respect to indebtedness, liens, fundamental changes, restrictive agreements, dispositions of assets, acquisitions and other investments, conduct of business and transactions with affiliates. As of March 31, 2014, we were in compliance with all covenants contained in our Credit Facility. Proceeds from the Credit Facility were used to refinance the existing term loan and a revolving line of credit. As of March 31, 2014, approximately $151.3 million was outstanding under the Credit Facility.
In connection with the initial public offering, on May 7, 2014, we entered into the New Credit Facility, an unsecured facility that provides for a $1.03 billion revolving credit facility with the ability to upsize to $1.25 billion (subject to obtaining commitments for any such additional borrowing capacity). The New Credit Facility replaced the Credit Facility. The New Credit Facility bears interest at a variable rate based on either LIBOR or a base rate plus an applicable margin with an unused commitment fee paid quarterly, which is subjected to change with our underlying credit agency rating. As of May 7, 2014, base rate loans bear interest calculated based on the base rate plus 0.75% and the LIBOR rate loans bear interest calculated based on LIBOR rate plus 1.75%. Unused commitment fees are payable at a rate of 0.25% per annum. The New Credit Facility contains customary affirmative and negative covenants for agreements of this type, including financial maintenance requirements, delivery of financial and other information, compliance with laws, further assurances and limitations with respect to indebtedness, liens, fundamental changes, restrictive agreements, dispositions of assets, acquisitions and other investments, conduct of business and transactions with affiliates. The New Credit Facility matures on April 30, 2019.
142
Table of Contents
Since our inception through March 31, 2014, we, our senior partners and other senior professionals have invested or committed to invest in excess of $1.7 billion in or alongside (through funds managed by us) our funds. As of March 31, 2014, our current invested capital and unfunded commitments, together with that of our senior partners and other senior professionals, are presented in the table below:
| | | | | | | | | | |
| | As of March 31, 2014 | |
|---|
| | Invested
Capital | | Unfunded
Commitment | | Total Invested
Capital and
Unfunded Commitment | |
|---|
| | (Dollars in millions)
| |
|---|
Asset class | | | | | | | | | | |
Tradable Credit Group | | $ | 296 | | $ | 151 | | $ | 447 | |
Direct Lending Group | | | 96 | | | 35 | | | 131 | |
Private Equity Group | | | 453 | | | 217 | | | 670 | |
Real Estate Group | | | 20 | | | 19 | | | 39 | |
| | | | | | | | |
| | | | | | | | | | | |
Total | | $ | 865 | | $ | 422 | | $ | 1,287 | |
| | | | | | | | |
| | | | | | | | | | | |
| | | | | | | | | | | |
| | | | | | | | |
We intend to use a portion of our available liquidity to make cash distributions to our common unitholders on a quarterly basis in accordance with our distribution policy. Our ability to make cash distributions to our common unitholders is dependent on a myriad of factors, including among others: general economic and business conditions; our strategic plans and prospects; our business and investment opportunities; timing of capital calls by our funds in support of our commitments; our financial condition and operating results; working capital requirements and other anticipated cash needs; contractual restrictions and obligations; legal, tax and regulatory restrictions; restrictions on the payment of distributions by our subsidiaries to us and other relevant factors.
We used a portion of the proceeds from the initial public offering to purchase newly issued Ares Operating Group Units concurrently with the consummation of the initial public offering, as described under "—Recent Transactions." Ares Operating Group used approximately $163.3 million of the proceeds to repay short term borrowings and the remainder for general corporate purposes and to fund growth initiatives. The Ares Operating Group also reimbursed Ares Management, L.P. for all of the expenses of the initial public offering, which were approximately $27.7 million.
We are required to maintain minimum net capital balances for regulatory purposes for our United Kingdom subsidiary and for our subsidiary that operates as a broker-dealer. These net capital requirements are met in part by retaining cash, cash-equivalents and investment securities. As a result, we may be restricted in our ability to transfer cash between different operating entities and jurisdictions. As of March 31, 2014, we were required to maintain approximately $18.0 million in liquid net assets within these subsidiaries to meet regulatory net capital and capital adequacy requirements. We are in compliance with all regulatory requirements.
Holders of Ares Operating Group Units, subject to any applicable transfer restrictions or other provisions, may on a quarterly basis, from and after the second anniversary of the date of the closing of the initial public offering (subject to the terms of the exchange agreement), exchange their Ares Operating Group Units for Ares Management, L.P. common units on a one-for-one basis (provided that Alleghany may exchange up to half of its Ares Operating Group Units from and after the first anniversary of the initial public offering) or, at our option, for cash. A holder of Ares Operating Group Units must exchange one Ares Operating Group Unit in each of the five Ares Operating Group entities to effect an exchange for a common unit of Ares Management, L.P. Subsequent exchanges are expected to result in increases in the tax basis of the tangible and intangible assets of Ares Management, L.P. that otherwise would not have been available. These increases in tax basis may increase (for tax purposes) depreciation and amortization and therefore reduce the amount of tax that Ares Management, L.P.'s wholly owned subsidiaries that are taxable as corporations for U.S. federal income purposes, which we refer to as the "corporate taxpayers,"
143
Table of Contents
would otherwise be required to pay in the future. The corporate taxpayers will enter into a tax receivable agreement with the TRA Recipients that will provide for the payment by the corporate taxpayers to the TRA Recipients of 85% of the amount of cash savings, if any, in U.S. federal, state, local and foreign income tax or franchise tax that the corporate taxpayers actually realize as a result of these increases in tax basis and of certain other tax benefits related to entering into the tax receivable agreement, including tax benefits attributable to payments under the tax receivable agreement. This payment obligation is an obligation of the corporate taxpayers and not of Ares Management, L.P. Future payments under the tax receivable agreement in respect of subsequent exchanges are expected to be substantial.
Critical Accounting Estimates
We prepare our combined and consolidated financial statements in accordance with GAAP. In applying many of these accounting principles, we need to make assumptions, estimates or judgments that affect the reported amounts of assets, liabilities, revenues and expenses in our combined and consolidated financial statements. We base our estimates and judgments on historical experience and other assumptions that we believe are reasonable under the circumstances. These assumptions, estimates or judgments, however, are both subjective and subject to change, and actual results may differ from our assumptions and estimates. If actual amounts are ultimately different from our estimates, the revisions are included in our results of operations for the period in which the actual amounts become known. We believe the following critical accounting policies could potentially produce materially different results if we were to change underlying assumptions, estimates or judgments. See "—Overview of Combined and Consolidated Results of Operations" and Note 2, "Summary of Significant Accounting Policies," to our unaudited combined and consolidated financial statements included in this Quarterly Report on Form 10-Q for a summary of our significant accounting estimates.
Performance Fees
Performance fees are based on certain specific hurdle rates as defined in the Consolidated Funds' applicable investment management or partnership agreements. Performance fees are recorded on an accrual basis to the extent such amounts are contractually due.
We have elected to adopt Method 2 of ASC 605-20,Revenue Recognition for revenue based on a formula. Under this method, we are entitled to performance-based fees that can amount to as much as 25.0% of a fund's profits, subject to certain hurdles or benchmarks. Performance-based fees are assessed as a percentage of the investment performance of the funds. The performance fee for any period is based upon an assumed liquidation of the fund's net assets on the reporting date, and distribution of the net proceeds in accordance with the fund's income allocation provisions. The performance fees may be subject to reversal to the extent that the performance fees recorded exceeds the amount due to the general partner or investment manager based on a fund's cumulative investment returns.
Performance fees receivable is presented separately in our unaudited combined and consolidated financial statements included in this Quarterly Report on Form 10-Q and represents performance fees recognized but not yet collected. The timing of the payment of performance fees due to the general partner or investment manager varies depending on the terms of the applicable fund agreements.
Performance Fees Due to Professionals and Advisers
We have an obligation to pay our professionals a portion of the performance fees earned from certain funds, including revenue from Consolidated Funds that is eliminated in consolidation. These amounts are accounted for as compensation expense in conjunction with the recognition of the related performance fee revenue and, until paid, are recognized as a component of the accrued compensation and benefits liability. Performance fee compensation is recognized in the same period that the related performance fees are recognized. Performance fee compensation can be reversed during periods when there is a decline in performance fees that were previously recognized.
144
Table of Contents
Income Taxes
A substantial portion of our earnings flow through to our owners without being subject to an entity level tax. Consequently, a significant portion of our earnings has no provision for U.S. federal income taxes except for foreign, city and local income taxes incurred at the entity level. A portion of our operations is conducted through a domestic corporation that is subject to corporate level taxes and for which we record current and deferred income taxes at the prevailing rates in the various jurisdictions in which these entities operate.
We use the liability method of accounting for deferred income taxes pursuant to GAAP. Under this method, deferred tax assets and liabilities are recognized for the future tax consequences attributable to temporary differences between the carrying value of existing assets and liabilities and their respective tax bases. Deferred tax assets and liabilities are measured using the statutory tax rates expected to be applied in the periods in which those temporary differences are settled. The effect of a change in tax rates on deferred tax assets and liabilities is recognized in the period of the change. A valuation allowance is recorded on our net deferred tax assets when it is more likely than not that such assets will not be realized. When evaluating the realizability of our deferred tax assets, all evidence, both positive and negative, is evaluated. Items considered in this analysis include the ability to carry back losses, the reversal of temporary differences, tax planning strategies and expectations of future earnings.
Under GAAP for income taxes, the amount of tax benefit to be recognized is the amount of benefit that is "more likely than not" to be sustained upon examination. We analyze our tax filing positions in all of the U.S. federal, state, local and foreign tax jurisdictions where we are required to file income tax returns, as well as for all open tax years in these jurisdictions. If, based on this analysis, we determine that uncertainties in tax positions exist, a liability is established, which is included in accounts payable, accrued expenses and other liabilities in our combined and consolidated financial statements. We recognize accrued interest and penalties related to unrecognized tax positions in the provision for income taxes. If recognized, the entire amount of unrecognized tax positions would be recorded as a reduction in the provision for income taxes.
Tax laws are complex and subject to different interpretations by the taxpayer and respective governmental taxing authorities. Significant judgment is required in determining tax expense and in evaluating tax positions, including evaluating uncertainties under GAAP. We review our tax positions quarterly and adjust our tax balances as new information becomes available.
Fair Value Measurement
GAAP establishes a hierarchal disclosure framework which prioritizes the inputs used in measuring financial instruments at fair value into three levels based on their market observability. Market price observability is affected by a number of factors, including the type of instrument and the characteristics specific to the instrument. Financial instruments with readily available quoted prices from an active market or for which fair value can be measured based on actively quoted prices generally will have a higher degree of market price observability and a lesser degree of judgment inherent in measuring fair value.
Financial assets and liabilities measured and reported at fair value are classified as follows:
- •
- Level I—Quoted unadjusted prices for identical instruments in active markets to which we have access at the date of measurement.
- •
- Level II—Quoted prices for similar instruments in active markets; quoted prices for identical or similar instruments in markets that are not active; and model-derived valuations in which all significant inputs are directly or indirectly observable. Level II inputs include prices in markets for which there are few transactions, prices that are not current, prices for which little public information exists or prices that vary substantially over time or among brokered market makers. Other inputs include interest rates, yield curves, volatilities, prepayment risks, loss severities, credit risks and default rates.
145
Table of Contents
- •
- Level III—Model-derived valuations for which one or more significant inputs are unobservable. These inputs reflect our assessment of the assumptions that market participants use to value the investment based on the best available information.
In some instances, an instrument may fall into different levels of the fair value hierarchy. In such instances, the instrument's level within the fair value hierarchy is based on the lowest of the three levels (with Level III being the lowest) that is significant to the fair value measurement. Our assessment of the significance of an input requires judgment and considers factors specific to the instrument. We account for the transfer of assets into or out of each fair value hierarchy level as of the beginning of the reporting period. See Note 5, "Fair Value," to our unaudited combined and consolidated financial statements included in this Quarterly Report on Form 10-Q for a summary of our valuation of investments and other financial instruments by fair value hierarchy levels.
The table below summarizes the valuation of investments and other financial instruments included within our AUM, by segment and fair value hierarchy levels, as of March 31, 2014:
| | | | | | | | | | | | | | | | |
| | As of March 31, 2014 | |
|---|
| | Tradable
Credit | | Private
Equity | | Direct
Lending | | Real
Estate | | Total | |
|---|
| | (Dollars in millions)
| |
|---|
Level I | | $ | 144 | | $ | 94 | | $ | 1 | | $ | — | | $ | 239 | |
Level II | | | 10,369 | | | 548 | | | 9 | | | 148 | | | 11,074 | |
Level III | | | 2,016 | | | 4,688 | | | 10,149 | | | 5,238 | | | 22,091 | |
| | | | | | | | | | | | |
| | | | | | | | | | | | | | | | | |
Total fair value | | | 12,529 | | | 5,330 | | | 10,159 | | | 5,386 | | | 33,404 | |
Other net asset value and available capital(2) | | | 18,832 | | | 4,496 | | | 17,404 | | | 2,911 | | | 43,643 | |
| | | | | | | | | | | | |
| | | | | | | | | | | | | | | | | |
Total AUM | | $ | 31,361 | | $ | 9,826 | | $ | 27,563 | | $ | 8,297 | | $ | 77,047 | |
| | | | | | | | | | | | |
| | | | | | | | | | | | | | | | | |
| | | | | | | | | | | | | | | | | |
| | | | | | | | | | | | |
- (1)
- Includes fund net non-investment assets, AUM for funds that are not reported at fair value, and available capital (uncalled equity capital and undrawn debt).
Investment / Liability Valuations
In the absence of observable market prices, we value our investments using valuation methodologies applied on a consistent basis. For some investments little market activity may exist. Our determination of fair value is then based on the best information available in the circumstances and may incorporate our own assumptions and involves a significant degree of judgment, taking into consideration a combination of internal and external factors, including the appropriate risk adjustments for non-performance and liquidity risks.
The valuation techniques used by us to measure fair value maximizes the use of observable inputs and minimizes the use of unobservable inputs. The valuation techniques applied to our Consolidated Funds vary depending on the nature of the investment.
CLO loan obligations: We have elected the fair value option to measure the CLO loan obligations as we have determined that measurement of the loan obligations issued by the CLOs at fair value better correlates with the value of the assets held by the CLOs, which are held to provide the cash flows for the note obligations. The investments of the CLOs are also carried at fair value.
The fair value of CLO liabilities are estimated based on various valuation models of third-party pricing services as well as internal models. The valuation models generally utilize discounted cash flows and take into consideration prepayment and loss assumptions, based on historical experience and projected performance, economic factors, the characteristics and condition of the underlying collateral, comparable yields for similar securities and recent trading activity. These securities are classified as Level III.
146
Table of Contents
Corporate debt, bonds, bank loans, securities sold short and derivative instruments: The fair value of corporate debt, bonds, bank loans, securities sold short and derivative instruments is estimated based on quoted market prices, dealer quotations or alternative pricing sources supported by observable inputs. These investments are generally classified within Level II. We obtain prices from independent pricing services which generally utilize broker quotes and may use various other pricing techniques that take into account appropriate factors such as yield, quality, coupon rate, maturity, type of issue, trading characteristics and other data. If the pricing services are only able to obtain a single broker quote or utilize a pricing model, such securities will be classified as Level III. If the pricing services are unable to provide prices, we will attempt to obtain one or more broker quotes directly from a dealer, price such securities at the last bid price obtained and classify such securities as Level III.
Equity and equity-related securities: Securities traded on a national securities exchange are stated at the last reported sales price on the day of valuation. To the extent these securities are actively traded and valuation adjustments are not applied, they are classified as Level I. Securities that trade in markets that are not considered to be active but are valued based on quoted market prices, dealer quotations or alternative pricing sources supported by observable inputs obtained by us from independent pricing services are classified as Level II.
Partnership interests: In accordance withASU 2009-12,Investments in Certain Entities that Calculate Net Asset Value per Share (or its Equivalent), we generally value our investments using the net asset value per share equivalent calculated by the investment manager as a practical expedient to determining an independent fair value or estimates based on various valuation models of third-party pricing services, as well as internal models. Such valuations are classified as Level II to the extent the investments are currently redeemable; if the investments are subject to a lock-up period, they are classified as Level III.
We are responsible for all inputs and assumptions related to the pricing of securities. We have internal controls in place that support our reliance on information received from third-party pricing sources. As part of our internal controls, we obtain, review and test information to corroborate prices received from third-party pricing sources. For any securities, if market or dealer quotations are not readily available, or if we determine that a quotation of a security does not represent a fair value, then the security is valued at a fair value as determined in good faith by us and will be classified as Level III. In such instances, we use valuation techniques consistent with the market or income approach to measure fair value and will give consideration to all factors which might reasonably affect the fair value. The main inputs into our valuation model for these Level III securities include earnings multiples (based on the historical earnings of the issuer) and discounted cash flows. We may also consider original transaction price, recent transactions in the same or similar instruments, completed third-party transactions in comparable instruments and other liquidity, credit and market risk factors. Models will be adjusted as deemed necessary by us.
Intangible Assets and Goodwill
Our intangible assets consist of contractual rights to earn future management fees and incentive management fees and carried interest from investment funds we acquire. Finite-lived intangibles are amortized on a straight-line basis over their estimated useful lives which range from approximately 1 to 10 years and are reviewed for impairment whenever events or changes in circumstances indicate that the carrying amount of the asset may not be recoverable.
Goodwill represents the excess of cost over the identifiable net assets of businesses acquired and is recorded in the functional currency of the acquired entity. Goodwill is recognized as an asset and is reviewed for impairment annually as of July 31 and between annual tests when events and circumstances indicate that impairment may have occurred.
147
Table of Contents
The assessment requires us to make judgments and involves the use of significant estimates and assumptions. These estimates and assumptions include long-term growth rates and margins used to calculate projected future cash flows, risk-adjusted discount rates based on our weighted average cost of capital and future economic and market conditions. These estimates and assumptions have to be made for each reporting unit evaluated for impairment. Our estimates for market growth, our market share and costs are based on historical data, various internal estimates and certain external sources, and are based on assumptions that are consistent with the plans and estimates we are using to manage the underlying business. If future forecasts are revised, they may indicate or require future impairment charges. We base our fair value estimates on assumptions we believe to be reasonable but that are unpredictable and inherently uncertain. Actual future results may differ from those estimates.
As the goodwill associated in the Real Estate Group was acquired as a result of the AREA Acquisition, we have not performed goodwill impairment testing on that reporting unit as of March 31, 2014 as we have not identified any impairment indicators. However, changes in our assumptions underlying our estimates of fair value, which will be a function of our future financial performance, and changes in economic conditions could result in future impairment charges.
Equity-Based Compensation
Equity-based compensation expense represents expenses associated with the granting of: (a) direct and indirect profit interests in us; (b) put options to sell certain interests at a minimum value; and (c) purchase (or call) options to acquire additional membership interests in us.
Equity-based compensation expense is determined based on the fair value of the respective equity award on the grant date and is recognized on a straight-line basis over the requisite service period, with a corresponding increase in additional paid in capital. Equity-based compensation expense is adjusted, as necessary, for actual forfeitures so as to reflect expenses only for the portion of the option that ultimately vests. We estimate the fair value of the purchase option as of the grant date using an option pricing model.
In determining the aggregate fair value of any award grants, we make judgments as to the grant date volatility and estimated forfeiture rates. Each of these elements, particularly the forfeiture assumptions used in valuing our equity awards, are subject to significant judgment and variability and the impact of changes in such elements on equity-based compensation expense could be material.
In connection with the AREA Acquisition on July 1, 2013, Ares issued an indirect 1.2% membership interest ("AREA Membership Interest") in Ares Investments LLC and Ares Holdings LLC to a group of former AREA partners who joined Ares. The grant date fair value of the AREA Membership Interest was $42.2 million and is comprised of $21.8 million of purchase price consideration that was recorded as an increase to members' equity within non-controlling interests in AHI and $20.4 million in equity compensation. The fair value of these awards was determined using a recent market transaction. No AREA Membership Interest has been forfeited.
In connection with the initial public offering, we granted to our professionals and non-employee directors 4,650,525 restricted units to be settled in common units, 686,395 phantom common units to be settled in cash and options to acquire 24,729,541 common units. The options and restricted units are vested at a rate of one-third per year, beginning on the third anniversary of the grant date. The phantom common units are vested over a service period of five years. The total compensation expense expected to be recognized in all future periods associated with the awards, considering assumed forfeitures, is approximately $130.3 million.
Off-Balance Sheet Arrangements
In the normal course of business, we engage in off-balance sheet arrangements, including transactions in derivatives, guarantees, commitments, indemnifications and potential contingent repayment obligations.
148
Table of Contents
Contractual Obligations, Commitments and Contingencies
The following table sets forth information relating to our contractual obligations as of March 31, 2014 on a combined basis and on a basis deconsolidating our funds:
| | | | | | | | | | | | | | | | |
Ares Obligations | | Less than 1 year | | 1 - 3 years | | 4 - 5 years | | Thereafter | | Total | |
|---|
| | (Dollars in thousands)
| |
|---|
Predecessors: | | | | | | | | | | | | | | | | |
Operating lease obligations(1) | | $ | 12,238 | | $ | 30,286 | | $ | 13,747 | | $ | 63,441 | | $ | 119,712 | |
Debt obligations payable(2) | | | 6,956 | | | 13,913 | | | — | | | — | | | 20,869 | |
Interest obligations on debt(3) | | | 1,443 | | | 478 | | | — | | | — | | | 1,921 | |
Capital commitments to Ares funds(4) | | | 258,054 | | | — | | | — | | | — | | | 258,054 | |
| | | | | | | | | | | | |
| | | | | | | | | | | | | | | | | |
Sub-total | | $ | 278,691 | | $ | 44,677 | | $ | 13,747 | | $ | 63,441 | | $ | 400,556 | |
Consolidated Funds: | | | | | | | | | | | | | | | | |
Operating lease obligations(1) | | | — | | | — | | | — | | | — | | | — | |
Debt obligations payable | | | 1,022,078 | | | 790,453 | | | 809,874 | | | 10,477,445 | | | 13,099,850 | |
Interest obligations on debt(3) | | | 173,772 | | | 323,346 | | | 305,985 | | | 665,339 | | | 1,468,442 | |
Capital commitments of the CLOs and Consolidated Funds(5) | | | 2,017,629 | | | — | | | — | | | — | | | 2,017,629 | |
| | | | | | | | | | | | |
| | | | | | | | | | | | | | | | | |
Total | | $ | 3,492,170 | | $ | 1,158,476 | | $ | 1,129,606 | | $ | 11,206,225 | | $ | 16,986,477 | |
| | | | | | | | | | | | |
| | | | | | | | | | | | | | | | | |
| | | | | | | | | | | | | | | | | |
| | | | | | | | | | | | |
- (1)
- Office space is leased under agreements with expirations ranging from month-to-month contracts to lease commitments through 2026. Rent expense includes only base contractual rent. The table includes future minimum commitments for our operating leases.
- (2)
- Debt obligations consist of $20.9 million of a guaranteed loan, which amortizes equally over three years on July 1, 2014, July 1, 2015 and July 1, 2016.
- (3)
- Interest obligations include interest accrued on outstanding indebtedness.
- (4)
- Represent commitments by us to fund a portion of the purchase price paid for each investment made by our funds. These amounts are generally due on demand and are therefore presented in the less than one year category.
- (5)
- Represents commitments by the CLOs and Consolidated Funds to fund certain investments. These amounts are generally due on demand and are therefore presented in the less than one year category.
In connection with the initial public offering, we have entered into the TRA with the TRA Recipients that requires us to pay them 85% of any tax savings realized by Ares Management, L.P.'s wholly owned subsidiaries that are taxable as corporations for U.S. federal income tax purposes from any step-up in tax basis resulting from an exchange of Ares Operating Group Units for Ares Management, L.P. common units or, at our option, for cash. Because the timing of amounts to be paid under the tax receivable agreement cannot be determined, this contractual commitment has not been presented in the table above. The tax savings achieved may not ensure that we have sufficient cash available to pay this liability and we might be required to incur additional debt to satisfy this liability.
149
Table of Contents
Guarantees
As of March 31, 2014, we guaranteed loans for certain employees in affiliated co-investment entities. These entities were formed to permit certain employees and members to invest alongside us and our investors in the funds managed by us. We would be responsible for all outstanding payments due in the event of a default on the loans by an affiliated entity. As of March 31, 2014, the total outstanding loan balance was approximately $4.1 million, with an additional $1.2 million in unfunded commitments. There has been no history of default and we have determined that the likelihood of default is remote. These guarantees are not considered to be compensation. See Note 9, "Commitments and Contingencies," to our unaudited combined and consolidated financial statements included in this Quarterly Report on Form 10-Q.
Indemnifications
Consistent with standard business practices in the normal course of business, we enter into contracts that contain indemnities for our affiliates, persons acting on our behalf or such affiliates and third parties. The terms of the indemnities vary from contract to contract and the maximum exposure under these arrangements, if any, cannot be determined and has neither been recorded in the above table nor in our combined and consolidated financial statements. As of March 31, 2014, we have not had prior claims or losses pursuant to these contracts and expect the risk of loss to be remote.
Contingent Obligations
The partnership documents governing our funds generally include a clawback provision that, if triggered, may give rise to a contingent obligation that may require the general partner to return amounts to the fund for distribution to investors. Therefore, performance fees, generally, are subject to reversal in the event that the funds incur future losses. These losses are limited to the extent of the cumulative performance fees recognized in income to date. Due in part to our investment performance and the fact that our performance fees are generally determined on a liquidation basis, as of March 31, 2014 and 2013, if the funds were liquidated at their fair values at that date, there would have been no clawback obligation or liability. There can be no assurance that we will not incur a clawback obligation in the future. If all of the existing investments were valued at $0, the amount of cumulative revenues that has been recognized would be reversed. We believe that the possibility of all of the existing investments becoming worthless is remote. At March 31, 2014 and December 31, 2013, had we assumed all existing investments were valued at $0, the net amount of performance fees subject to clawback would have been approximately $110.6 million and $118.7 million, respectively.
Performance fees are also affected by changes in the fair values of the underlying investments in the funds that we advise. Valuations, on an unrealized basis, can be significantly affected by a variety of external factors including, but not limited to, bond yields and industry trading multiples.
Our senior professionals and investment professionals who have received carried interest distributions are responsible for funding their proportionate share of any giveback obligations. However, the governing agreements of certain of our funds provide that if a current or former professional from such funds does not fund his or her respective share, then we may have to fund additional amounts beyond what we received in carried interest, although we will generally retain the right to pursue any remedies that we have under such governing agreements against those carried interest recipients who fail to fund their obligations.
Additionally, at the end of the life of the funds there could be a payment due to a fund by us if we have recognized more performance fees than was ultimately earned. The general partner obligation amount, if any, will depend on final realized values of investments at the end of the life of the fund.
150
Table of Contents
Item 3. Quantitative and Qualitative Disclosures about Market Risk
Our primary exposure to market risk is related to our role as general partner or investment adviser to our investment funds and the sensitivity to movements in the fair value of their investments, including the effect on management fees, performance fees and investment income.
The market price of investments may significantly fluctuate during the period of investment. Investments may decline in value due to factors affecting securities markets generally or particular industries represented in the securities markets. The value of an investment may decline due to general market conditions, which are not specifically related to such investment, such as real or perceived adverse economic conditions, changes in the general outlook for corporate earnings, changes in interest or currency rates or adverse investor sentiment generally. They may also decline due to factors that affect a particular industry or industries, such as labor shortages or increased production costs and competitive conditions within an industry.
Our credit orientation has been a central tenet of our business across our debt and equity investment strategies. All of our investment professionals benefit from our independent research and relationship networks in over 30 industries, and insights from our portfolio of active investments. We believe the combination of high-quality proprietary information flow and a consistent, rigorous approach to managing investments across our strategies has been, and we believe will continue to be, a major driver of our strong risk-adjusted returns and the stability and predictability of our income.
Effect on Management Fees
Management fees are generally based on a defined percentage of fair value of assets, total commitments, invested capital, net asset value, net investment income, total assets or par value of the investment portfolios we manage. Management fees calculated based on fair value of assets or net investment income are affected by short-term changes in market values.
The overall impact of a short-term change in market value may be mitigated by a number of factors including, but not limited to, fee definitions that are not based on market value including invested capital and committed capital, market value definitions that exclude the impact of realized and/or unrealized gains and losses, market value definitions based on beginning of the period values or a form of average market value including daily, monthly or quarterly averages as well monthly or quarterly payment terms.
As such, based on an incremental 10% change in fair value of the funds' investments as of March 31, 2014, we calculated a $1.8 million increase in the case of an increase in value and a $1.8 million decrease in the case of a decline in value.
Effect on Performance Fees
Performance fees are based on certain specific hurdle rates as defined in the funds' applicable investment management or partnership agreements. The performance fees for any period are based upon an assumed liquidation of the fund's net assets on the reporting date, and distribution of the net proceeds in accordance with the fund's income allocation provisions, which can result in a performance-based fee to us, subject to certain hurdles and benchmarks. See "Management's Discussion and Analysis of Financial Condition and Results of Operations—Overview of Combined and Consolidated Results of Operations" and "Management's Discussion and Analysis of Financial Condition and Results of Operations—Critical Accounting Estimates." The performance fees may be subject to reversal to the extent that the performance fees recorded exceeds the amount due to the general partner or investment manager based on a fund's cumulative investment returns.
151
Table of Contents
Changes in the fair values of funds' investments may materially impact performance fees depending on the respective funds' performance relative to applicable hurdles or benchmarks. The following table summarizes the incremental impact, including to our Consolidated Funds, of an incremental 10% change in fair value of the funds' investments by segment as of March 31, 2014 on our performance fees revenue:
| | | | | | | |
| | As of March 31, 2014 | |
|---|
| | 10% Increase in Total
Remaining Fair Value | | 10% Decrease in Total
Remaining Fair Value | |
|---|
| | (Dollars in millions)
| |
|---|
Effect on performance fees | | | | | | | |
Tradable Credit Group | | $ | 264 | | $ | (113 | ) |
Direct Lending Group | | | 17 | | | (6 | ) |
Private Equity Group | | | 92 | | | (79 | ) |
Real Estate Group | | | 5 | | | (5 | ) |
| | | | | | |
| | | | | | | | |
Total | | $ | 378 | | $ | (203 | ) |
| | | | | | |
| | | | | | | | |
| | | | | | | | |
| | | | | | |
Effect on Investment Income
Investment income (loss) represents the realized and unrealized appreciation (depreciation) resulting from our equity method investments and other investments. Investment income (loss) is realized when we redeem all or a portion of our investment or when we receive cash income, such as dividends or distributions. Unrealized investment income (loss) results from changes in the fair value of the underlying investment as well as the reversal of unrealized appreciation (depreciation) at the time an investment is realized.
Changes in the fair values of funds' investments directly impacts investment income. The following table summarizes the incremental impact, including to our Consolidated Funds, of an incremental 10% change in fair value of the funds' investments by segment as of March 31, 2014 on our investment income:
| | | | | | | |
| | As of March 31, 2014 | |
|---|
| | 10% Increase in Total
Remaining Fair Value | | 10% Decrease in Total
Remaining Fair Value | |
|---|
| | (Dollars in millions)
| |
|---|
Effect on investment income | | | | | | | |
Tradable Credit Group | | $ | 17 | | $ | (17 | ) |
Direct Lending Group | | | 9 | | | (9 | ) |
Private Equity Group | | | 23 | | | (23 | ) |
Real Estate Group | | | 2 | | | (2 | ) |
| | | | | | |
| | | | | | | | |
Total | | $ | 51 | | $ | (51 | ) |
| | | | | | |
| | | | | | | | |
| | | | | | | | |
| | | | | | |
Exchange Rate Risk
Our funds hold investments that are denominated in non-U.S. dollar currencies that may be affected by movements in the rate of exchange between the U.S. dollar and non-U.S. dollar currencies. Movements in the rate of exchange between the U.S. dollar and non-U.S. dollar currencies impact the management fees earned by funds with fee earning AUM denominated in non-U.S. dollar currencies as well as by funds with fee earning AUM denominated in U.S. dollars that hold investments denominate in non-U.S. dollar currencies. Additionally, movements in the rate of exchanges impacts operating expenses for our foreign offices that are denominated in non-U.S. currencies, cash balances we hold in non-U.S. currencies and investments in funds we hold in non-U.S. currencies.
152
Table of Contents
We manage our exposure to exchange rate risks through our regular operating activities, wherein we utilize payments received in non-U.S. dollar currencies to fulfill obligations in non-U.S dollar foreign currencies, and, when appropriate, through the use of derivative financial instruments to hedge the net non-U.S. exposure in the funds that we advise, the balance sheet exposure for certain direct investments denominated in non-U.S. dollar currencies and the cash flow exposure for non-U.S. dollar currencies.
Interest Rate Risk
As of March 31, 2014, we had $151.3 million outstanding under the Credit Facility, presented as debt obligations in our unaudited combined and consolidated financial statements included in this Quarterly Report on Form 10-Q. The annual interest rate on the Credit Facility was 1.94% as of March 31, 2014. In April 2012, AIH LLC entered into two four-year interest rate swap contracts to mitigate the impact of the fluctuations in the interest rate on $50.0 million and $75.0 million notional amounts of the Credit Facility. The swaps converted the variable rate index to a fixed rate index of 0.85%, thereby effectively converting the floating rate Credit Facility to a fixed rate obligation of 3.10%. The interest rate swaps mature on May 2, 2016 and May 3, 2016. In July 2012, AIH LLC entered into two four-year interest rate swap contracts to mitigate the impact of the fluctuations in the interest rate on an additional $50.0 million and $75.0 million notional amounts of the Credit Facility. The swaps converted the variable rate index to a fixed rate index of 0.56% and 0.64%, thereby effectively converting the floating rate Credit Facility to a fixed rate obligation of 2.81% and 2.89%, respectively. The interest rate swaps mature on May 3, 2016.
Based on the floating rate component of our debt obligations payable as of March 31, 2014, which is mitigated by the impact of our interest rate swaps, we estimate that in the event of a 100 basis point increase in interest rates and the outstanding revolver as of March 31, 2014, interest expense related to variable rates would remain the same for the year.
On May 7, 2014, in connection with the initial public offering, we further amended and restated the Credit Facility to provide for a $1.03 billion revolving credit facility. Under the New Credit Facility, the new borrowers became certain Ares Operating Group entities. Consistent with the previous Credit Facility, interest rates are dependent upon corporate credit ratings. As of May 7, 2014, base rate loans bear interest calculated based on the base rate plus 0.75% and the LIBOR rate loans bear interest calculated based on LIBOR rate plus 1.75%. Unused commitment fees are payable at a rate of 0.25% per annum. The New Credit Facility's maturity was extended to April 30, 2019.
As credit-oriented investors, we are also subject to interest rate risk through the securities we hold in our Consolidated Funds. A 100 basis point increase in interest rates would be expected to negatively affect prices of securities that accrue interest income at fixed rates and therefore negatively impact net change in unrealized appreciation (depreciation) on the consolidated funds' investments. The actual impact is dependent on the average duration of such holdings. Conversely, securities that accrue interest at variable rates would be expected to benefit from a 100 basis points increase in interest rates because these securities would generate higher levels of current income and therefore positively impact interest and dividend income. In the cases where our funds pay management fees based on NAV, we would expect our segment management fees to experience a change in direction and magnitude corresponding to that experienced by the underlying portfolios.
Credit Risk
We are party to agreements providing for various financial services and transactions that contain an element of risk in the event that the counterparties are unable to meet the terms of such agreements. In such agreements, we depend on the respective counterparty to make payment or otherwise perform. We generally endeavor to minimize our risk of exposure by limiting to reputable financial institutions the counterparties with which we enter into financial transactions. In other circumstances, availability of financing from financial institutions may be uncertain due to market events, and we may not be able to access these financing markets.
153
Table of Contents
Item 4. Controls and Procedures
Evaluation of Disclosure Controls and Procedures
We maintain disclosure controls and procedures (as that term is defined in Rules 13a-15(e) and 15d-15(e) under the Securities Exchange Act of 1934, as amended (the "Exchange Act")) that are designed to ensure that information required to be disclosed in our reports under the Exchange Act is recorded, processed, summarized and reported within the time periods specified in the SEC's rules and forms, and that such information is accumulated and communicated to our management, including our co-principal executive officers and principal financial officer, as appropriate, to allow timely decisions regarding required disclosures. Any controls and procedures, no matter how well designed and operated, can provide only reasonable assurance of achieving the desired control objectives. Our management, with the participation of our principal executive officer and principal financial officer, has evaluated the effectiveness of the design and operation of our disclosure controls and procedures as of March 31, 2014. Based upon that evaluation and subject to the foregoing, our principal executive officers and principal financial officer concluded that, as of March 31, 2014, the design and operation of our disclosure controls and procedures were effective to accomplish their objectives at the reasonable assurance level.
Changes in Internal Control over Financial Reporting
There have been no changes in our internal control over financial reporting (as defined in Rule 13a-15(f) and 15d-15(f) under the Exchange Act) during the quarter ended March 31, 2014 that have materially affected, or that are reasonably likely to materially affect, our internal control over financial reporting.
PART II—OTHER INFORMATION
Item 1. Legal Proceedings
In the normal course of business, we may be subject to various legal proceedings from time to time. As of March 31, 2014 and December 31, 2013, we were not subject to any material pending legal proceedings.
Item 1A. Risk Factors
For a discussion of our potential risks and uncertainties, see the information under the heading "Risk Factors" in our Company's final prospectus dated May 1, 2014, included in the Company's Registration Statement on Form S-1, as amended (SEC File No. 333-194919). There have been no material changes to the risk factors disclosed in the prospectus.
Item 2. Unregistered Sales of Equity Securities and Use of Proceeds
On May 1, 2014, in connection with the initial public offering, the Company issued (a) 34,540,079 common units to Ares Owners Holdings L.P. as consideration for its contribution to the Company of (i) all of its shares of Class A Common Stock in AHI, (ii) all of its shares of common stock in Ares Domestic Holdings Inc., (iii) 34,501,391 of its Class A Units in Ares Investments, (iv) (x) all of its preference shares in Ares Offshore Holdings, Ltd. and (y) a note in the principal amount of $3,853,390, dated May 1 2014, between Ares Owners Holdings L.P. and Ares Offshore Holdings, Ltd., and (v) all of its interests in Ares Real Estate Holdings LLC and (b) one Special Voting Unit (as defined in our Amended and Restated Agreement of Limited Partnership) to Ares Voting LLC, a Delaware limited liability company owned and controlled by Ares Partners Holdco LLC.
154
Table of Contents
On May 1, 2014, in connection with the initial public offering, the Company issued 34,538,155 common units to AREC, as consideration for its contribution to the Company of (i) all of its shares of Class B Common Stock in AHI, (ii) all of its shares of common stock in Ares Domestic Holdings Inc., (iii) all of its Class A Units in Ares Investments, (iv) all of its interests in Ares Offshore Holdings, Ltd. and (v) all of its interests in Ares Real Estate Holdings LLC.
The foregoing issuances of common units and our Special Voting Unit were made in reliance upon Section 4(2) of the Securities Act, as amended, and did not involve any underwriters, underwriting discounts or commissions, or any public offering.
The effective date of the Company's registration statement filed on Form S-1 under the Securities Act of 1933 (File No. 333-194919) relating to the Company's initial public offering of common units representing limited partner interests was May 1, 2014. A total of 11,589,430 common units were sold, including 225,794 common units sold pursuant to the partial exercise by the underwriters of their overallotment option. J.P. Morgan Securities LLC; Merrill Lynch, Pierce, Fenner & Smith Incorporated; Goldman, Sachs & Co.; Morgan Stanley & Co. LLC and Wells Fargo Securities, LLC acted as representatives of the underwriters and joint book-running managers of the offering.
The offering was completed on May 7, 2014. The aggregate offering price for the common units sold pursuant to the initial public offering, including common units sold pursuant to the partial exercise by the underwriters of their overallotment option, was $220.2 million. The underwriting discounts were $11.0 million, none of which was paid to affiliates of the Company. The Company incurred approximately $27.7 million of other expenses in connection with the offering. The net proceeds to the Company from the initial public offering totaled approximately $181.5 million.
The Company used the net proceeds from the initial public offering to purchase newly issued Ares Operating Group Units substantially concurrently with the consummation of the initial public offering. The Ares Operating Group entities used approximately $163.3 million of these proceeds to repay outstanding indebtedness under the Credit Facility and the remaining $18.2 million has been or will be used for general corporate purposes and to fund growth initiatives.
Item 3. Defaults Upon Senior Securities
None.
Item 4. Mine Safety Disclosures
Not applicable.
Item 5. Other Information
None.
155
Table of Contents
Item 6. Exhibits
EXHIBIT INDEX
| | | |
Exhibit
Number | | Exhibit Description |
|---|
| | 3.1 | | Certificate of Limited Partnership of Ares Management, L.P.(1) |
|
3.2 |
|
Form of Amended and Restated Agreement of Limited Partnership of Ares Management, L.P.(2) |
|
31.1 |
|
Certification of Chief Executive Officer pursuant to Rule 13a-14(a) and Rule 15d-14(a), as adopted pursuant to Section 302 of the Sarbanes-Oxley Act of 2002 |
|
31.2 |
|
Certification of Chief Financial Officer pursuant to Rule 13a-14(a) and Rule 15d-14(a), as adopted pursuant to Section 302 of the Sarbanes-Oxley Act of 2002 |
|
32.1 |
|
Certification of Chief Executive Officer and Chief Financial Officer pursuant to 18 U.S.C. Section 1350, as adopted pursuant to Section 906 of the Sarbanes-Oxley Act of 2002 |
|
99.1 |
|
Prospectus of Ares Management, L.P., dated May 1, 2014 and filed with the Securities and Exchange Commission in accordance with Rule 424(b) of the Securities Act of 1933 on May 5, 2014(3) |
|
101.INS |
|
XBRL Instance Document. |
|
101.SCH |
|
XBRL Taxonomy Extension Schema Document. |
|
101.CAL |
|
XBRL Taxonomy Extension Calculation Linkbase Document. |
|
101.DEF |
|
XBRL Taxonomy Extension Definition Linkbase Document. |
|
101.LAB |
|
XBRL Taxonomy Extension Label Linkbase Document. |
|
101.PRE |
|
XBRL Taxonomy Extension Presentation Linkbase Document. |
- (1)
- Incorporated by reference to Exhibit 3.1 to the Company's Form 8-K (File No. 001-36429), filed on May 7, 2014.
- (2)
- Incorporated by reference to Exhibit 3.2 to the Company's Registration Statement on Form S-1 (File No. 333-194919), filed on April 22, 2014.
- (3)
- Incorporated by reference to the Prospectus of Ares Management, L.P., dated May 1, 2014 and filed with the Securities and Exchange Commission in accordance with Rule 424(b) of the Securities Act of 1933 on May 5, 2014 (SEC File No. 333-194919).
156
Table of Contents
SIGNATURES
Pursuant to the requirements of the Securities Exchange Act of 1934, the registrant has duly caused this report to be signed on its behalf by the undersigned thereunto duly authorized.
| | | | | | |
| | | ARES MANAGEMENT, L.P. |
|
|
By: |
|
Ares Management GP LLC, its general partner |
Dated: June 10, 2014 |
|
By |
|
/s/ ANTONY P. RESSLER
|
| | | | | Name: | | Antony P. Ressler |
| | | | | Title: | | Chairman, Co-Founder & Chief Executive Officer (Principal Executive Officer) |
Dated: June 10, 2014 |
|
By |
|
/s/ DANIEL F. NGUYEN
|
| | | | | Name: | | Daniel F. Nguyen |
| | | | | Title: | | Executive Vice President, Chief Financial Officer & Treasurer (Principal Financial and Accounting Officer) |
157