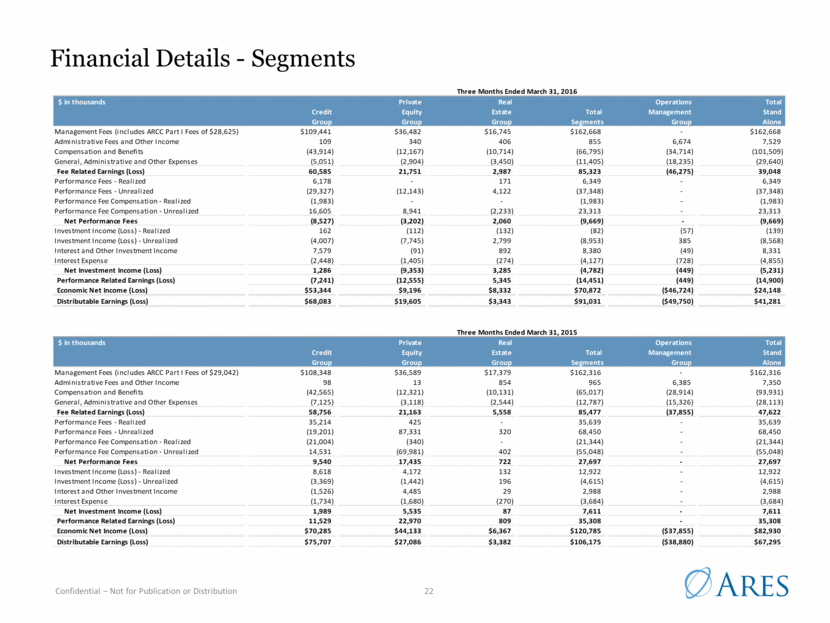
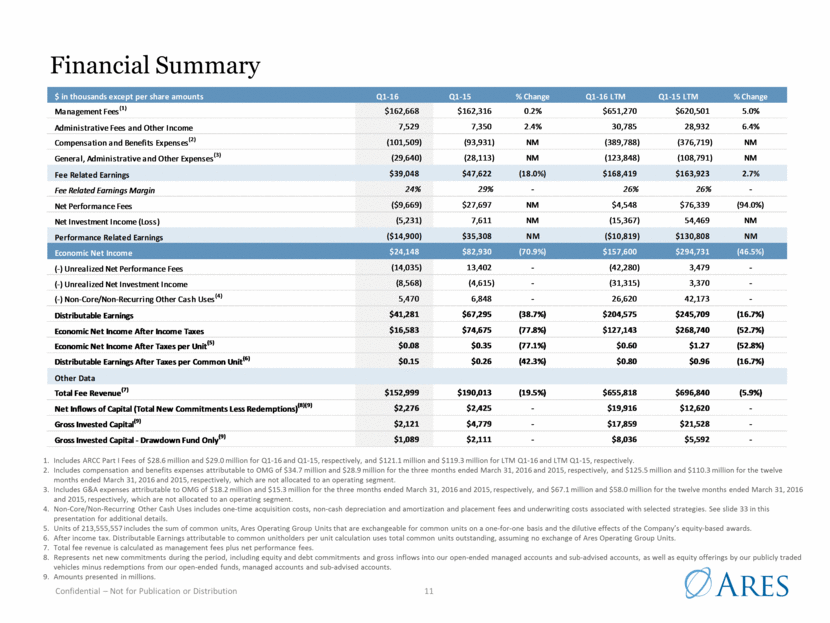
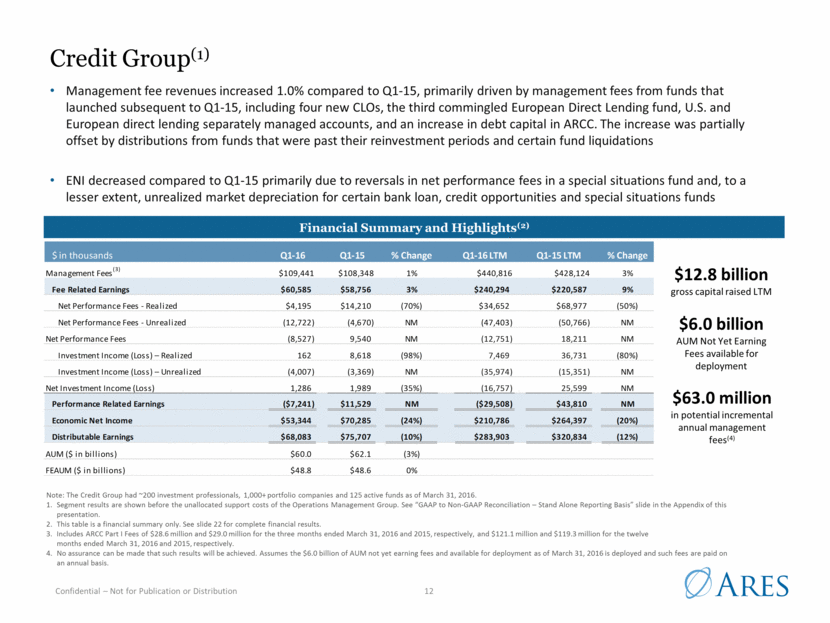
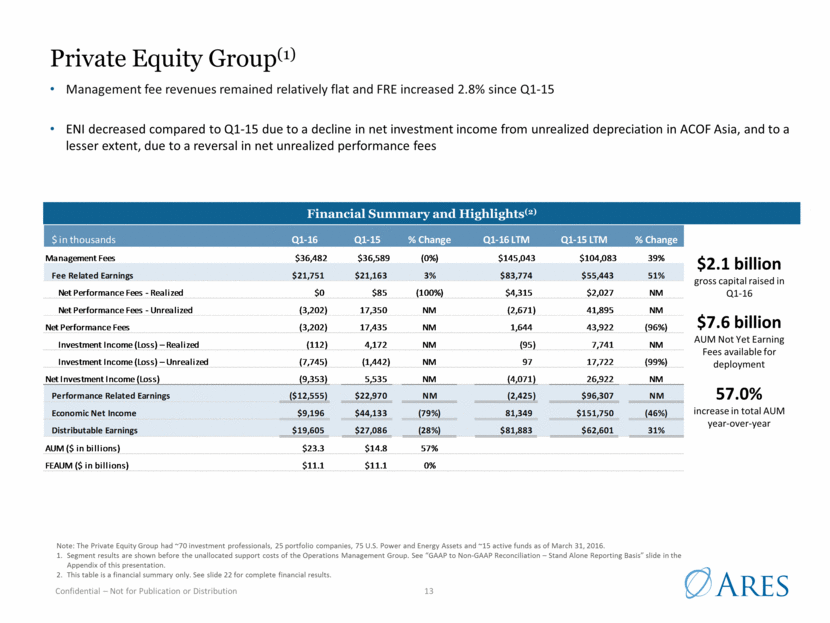
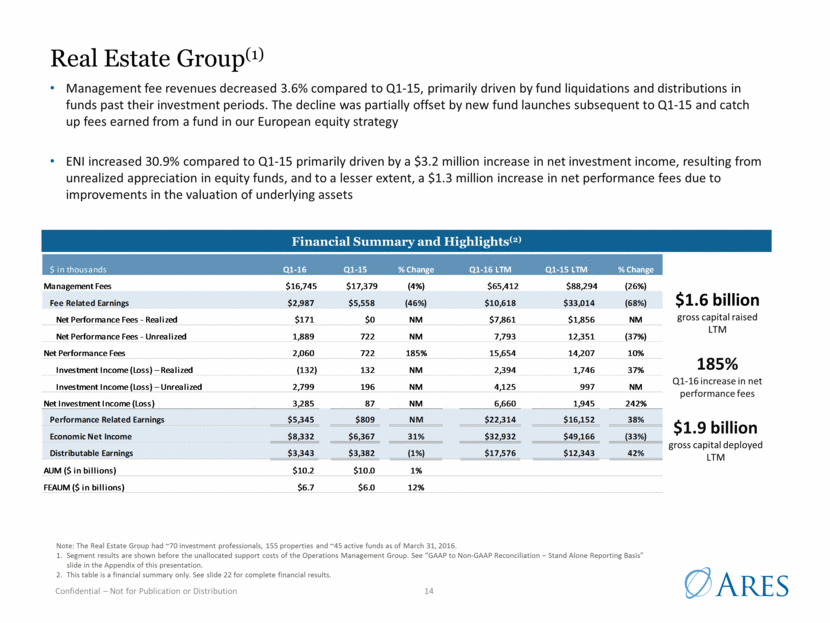
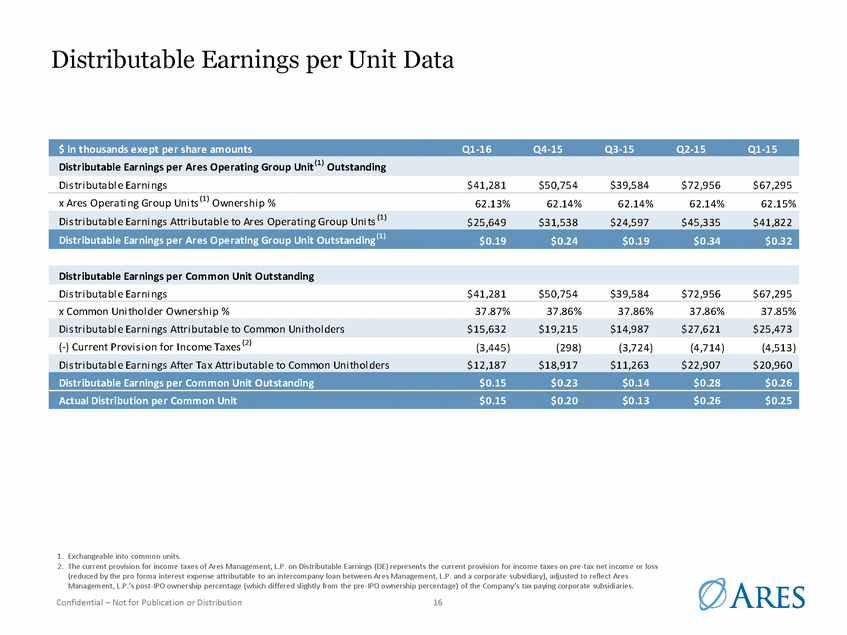
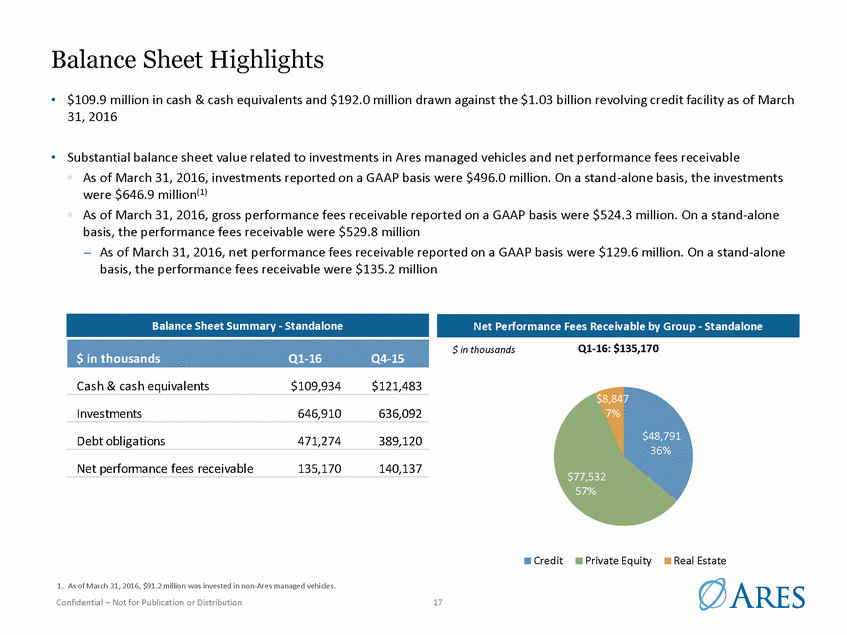
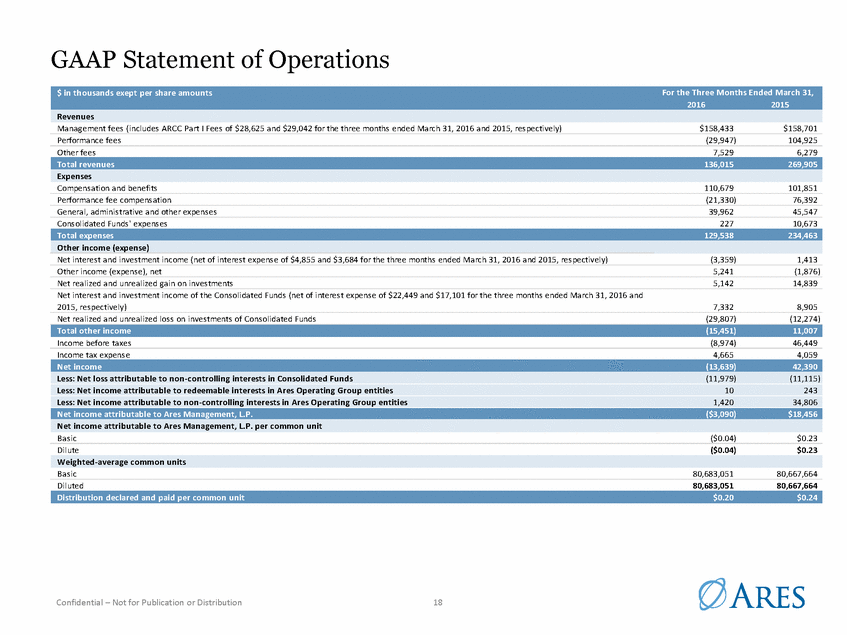
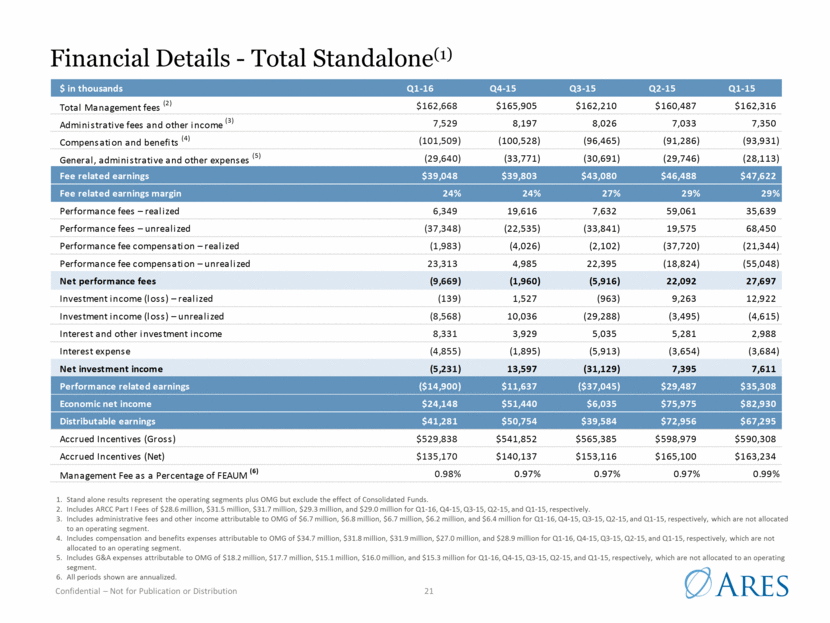
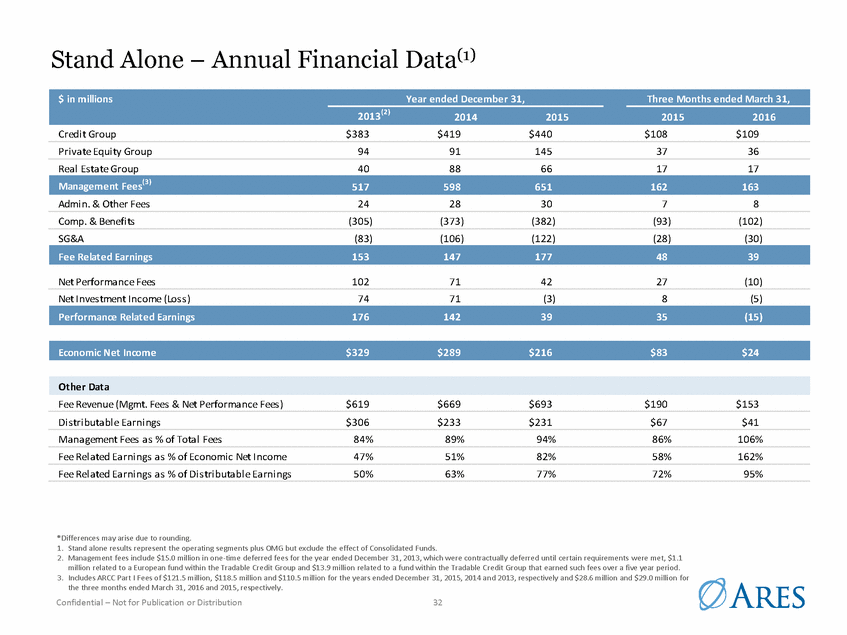
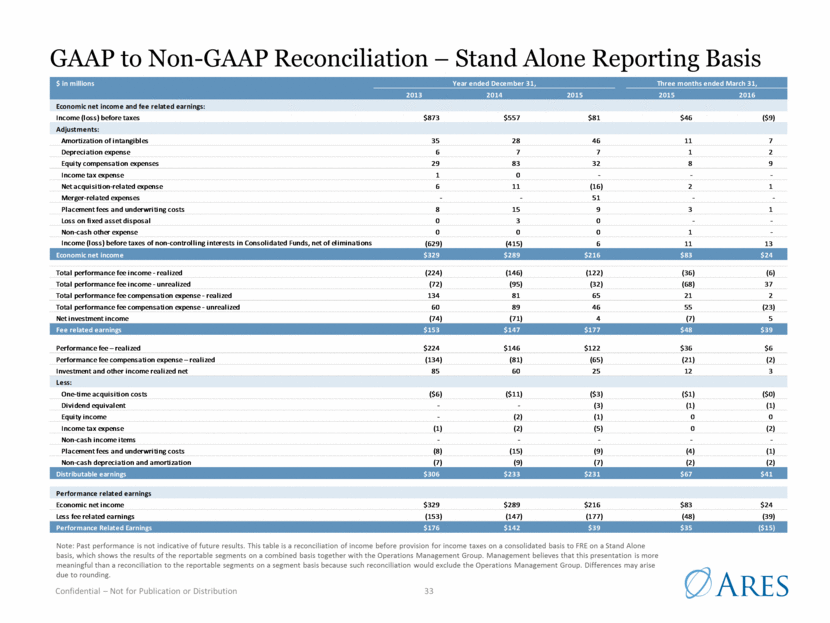
Financial Details - Segments $ in thousands Private Real Operations Total Credit Equity Estate Total Management Stand Group Group Group Segments Group Alone Management Fees (includes ARCC Part I Fees of $28,625) $109,441 $36,482 $16,745 $162,668 - $162,668 Administrative Fees and Other Income 1 09 3 40 4 06 8 55 6 ,674 7 ,529 Compensation and Benefits (43,914) (12,167) (10,714) (66,795) (34,714) (101,509) General, Administrative and Other Expenses (5,051) (2,904) (3,450) (11,405) (18,235) (29,640) Fee Related Earnings (Loss) 60,585 21,751 2,987 85,323 (46,275) 39,048 Performance Fees - Realized 6,178 - 1 71 6 ,349 - 6 ,349 Performance Fees - Unrealized (29,327) (12,143) 4,122 (37,348) - (37,348) Performance Fee Compensation - Realized (1,983) - - (1,983) - (1,983) Performance Fee Compensation - Unrealized 16,605 8,941 (2,233) 2 3,313 - 2 3,313 Net Performance Fees (8,527) (3,202) 2,060 (9,669) - (9,669) Investment Income (Loss) - Realized 162 (112) (132) (82) (57) (139) Investment Income (Loss) - Unrealized (4,007) (7,745) 2 ,799 (8,953) 385 (8,568) Interest and Other Investment Income 7 ,579 (91) 8 92 8 ,380 (49) 8 ,331 Interest Expense (2,448) (1,405) (274) (4,127) (728) (4,855) Net Investment Income (Loss) 1,286 (9,353) 3,285 (4,782) (449) (5,231) Performance Related Earnings (Loss) (7,241) (12,555) 5,345 (14,451) (449) (14,900) Economic Net Income (Loss) $53,344 $9,196 $8,332 $70,872 ($46,724) $24,148 Distributable Earnings (Loss) $68,083 $19,605 $3,343 $91,031 ($49,750) $41,281 $ in thousands Private Real Operations Total Credit Equity Estate Total Management Stand Group Group Group Segments Group Alone Management Fees (includes ARCC Part I Fees of $29,042) $108,348 $36,589 $17,379 $162,316 - $162,316 Administrative Fees and Other Income 9 8 1 3 8 54 9 65 6 ,385 7 ,350 Compensation and Benefits (42,565) (12,321) (10,131) (65,017) (28,914) (93,931) General, Administrative and Other Expenses (7,125) (3,118) (2,544) (12,787) (15,326) (28,113) Fee Related Earnings (Loss) 58,756 21,163 5,558 85,477 (37,855) 47,622 Performance Fees - Realized 35,214 425 - 3 5,639 - 3 5,639 Performance Fees - Unrealized (19,201) 8 7,331 320 6 8,450 - 6 8,450 Performance Fee Compensation - Realized (21,004) (340) - (21,344) - (21,344) Performance Fee Compensation - Unrealized 14,531 (69,981) 402 (55,048) - (55,048) Net Performance Fees 9,540 17,435 722 27,697 - 27,697 Investment Income (Loss) - Realized 8,618 4 ,172 132 1 2,922 - 1 2,922 Investment Income (Loss) - Unrealized (3,369) (1,442) 196 (4,615) - (4,615) Interest and Other Investment Income (1,526) 4,485 29 2 ,988 - 2 ,988 Interest Expense (1,734) (1,680) (270) (3,684) - (3,684) Net Investment Income (Loss) 1,989 5,535 87 7,611 - 7,611 Performance Related Earnings (Loss) 11,529 22,970 809 35,308 - 35,308 Economic Net Income (Loss) $70,285 $44,133 $6,367 $120,785 ($37,855) $82,930 Distributable Earnings (Loss) $75,707 $27,086 $3,382 $106,175 ($38,880) $67,295
