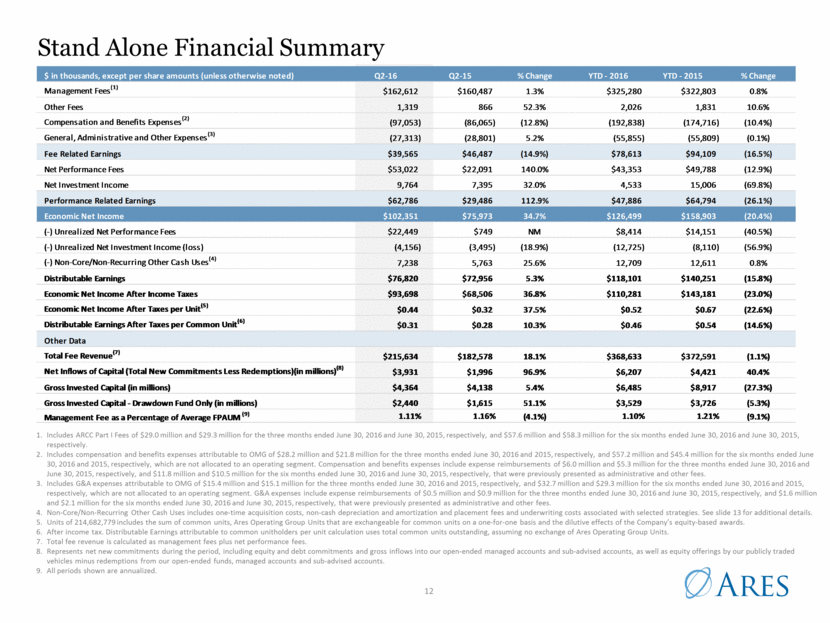
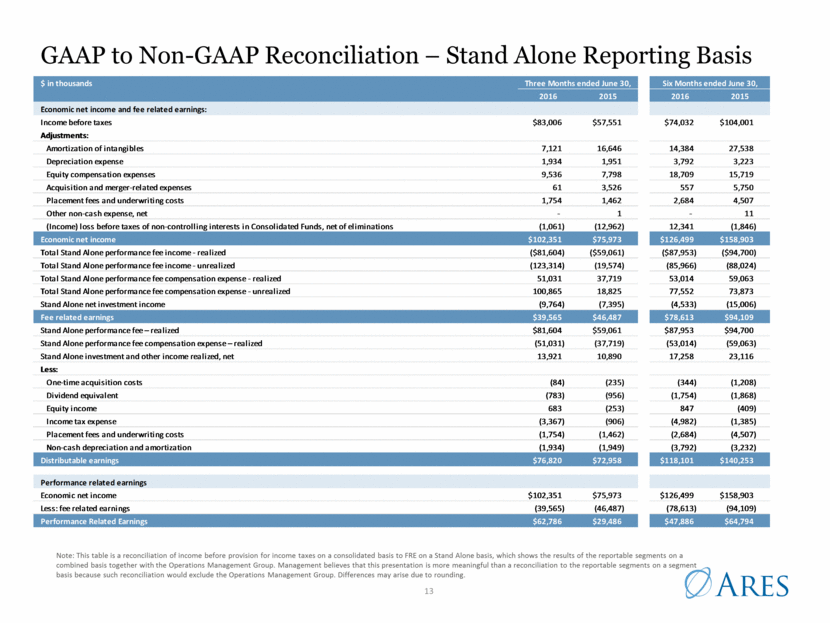
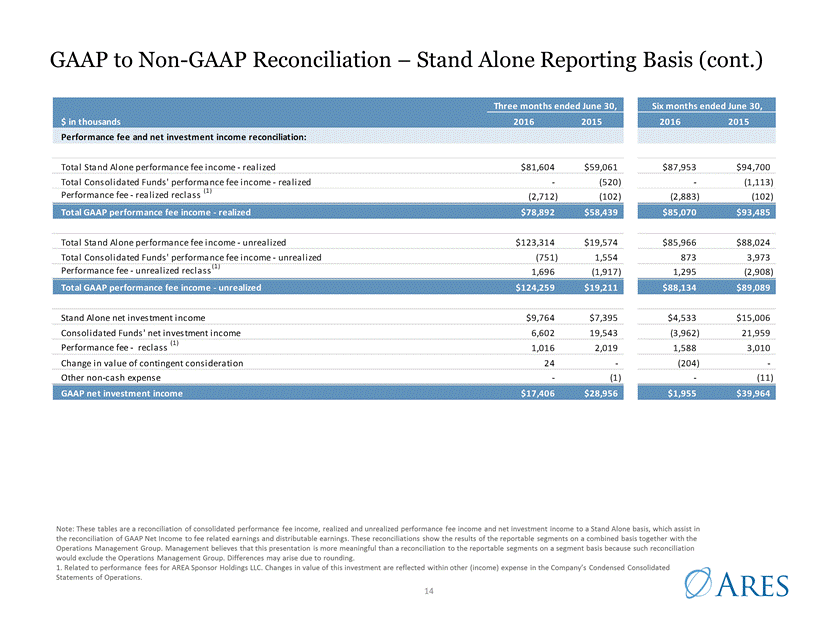
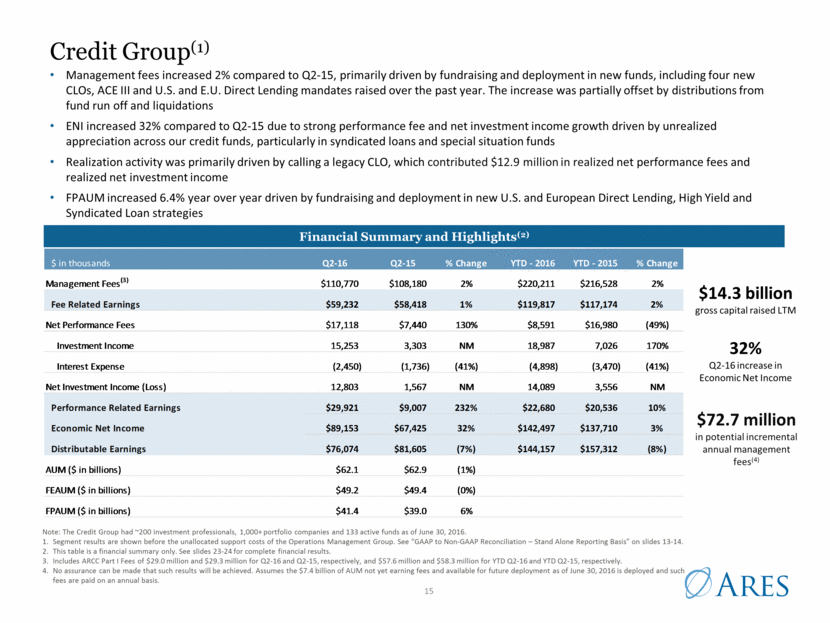
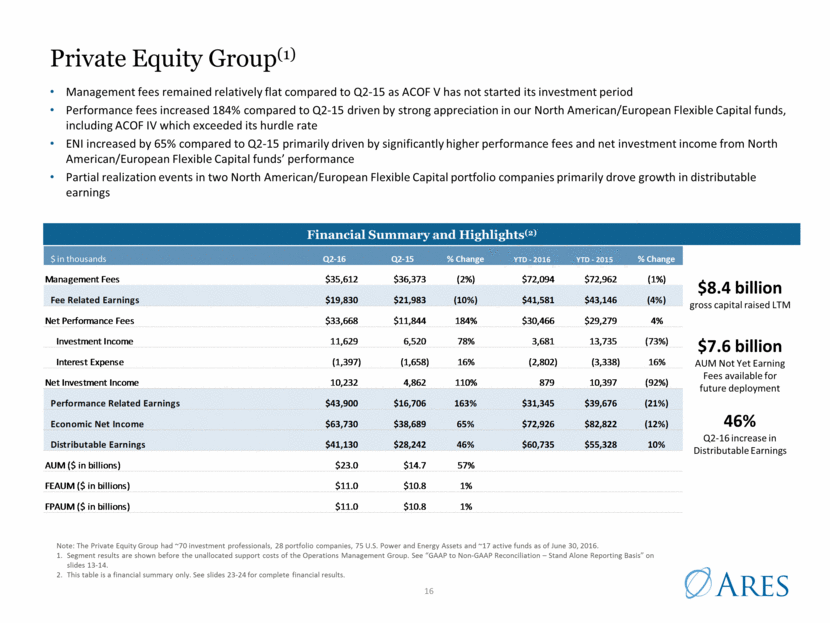
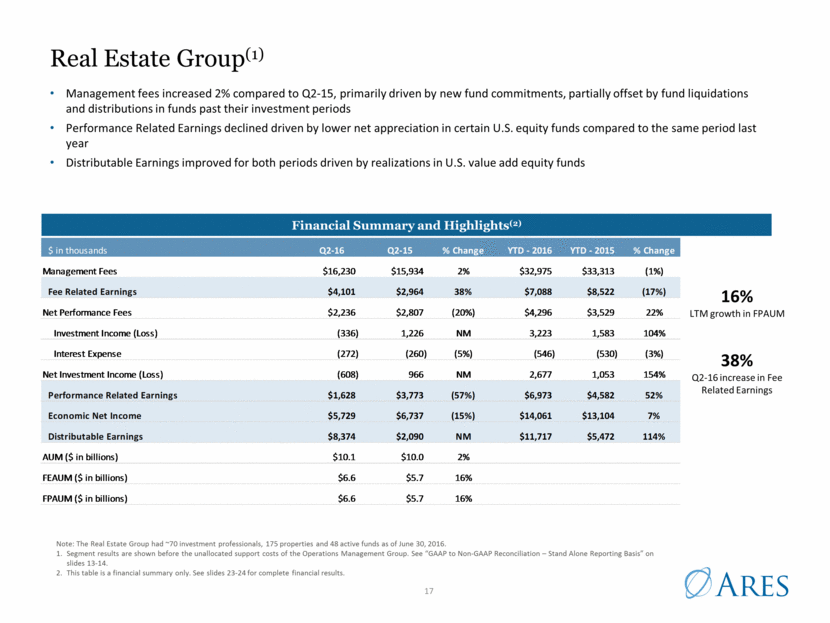
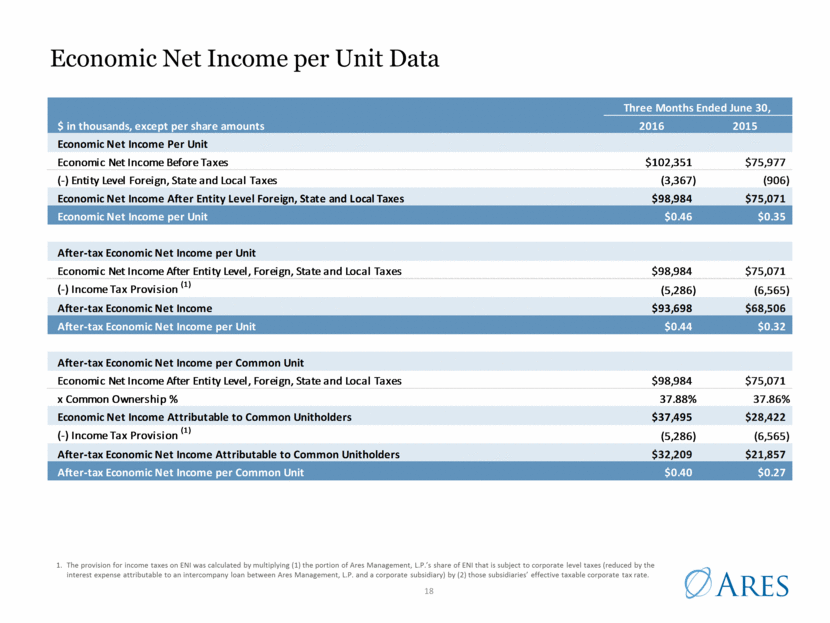
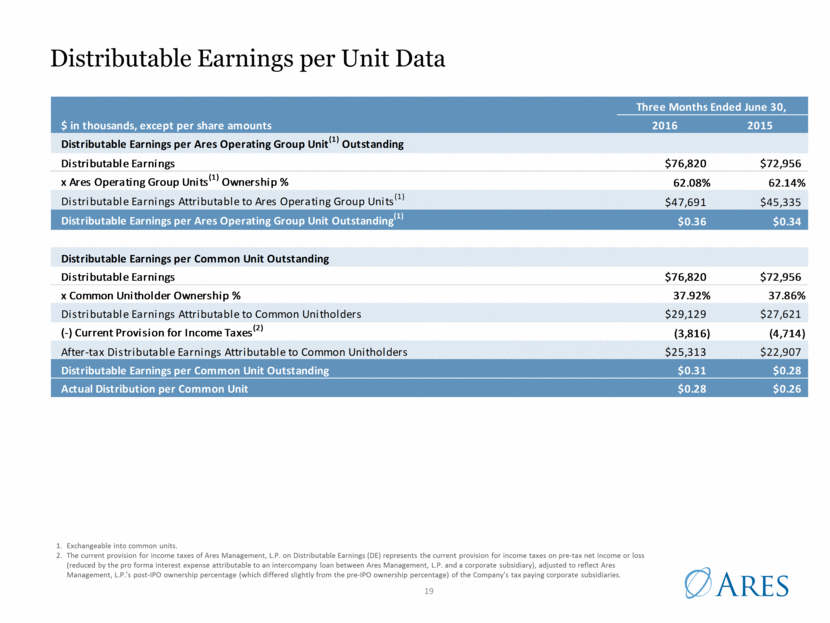
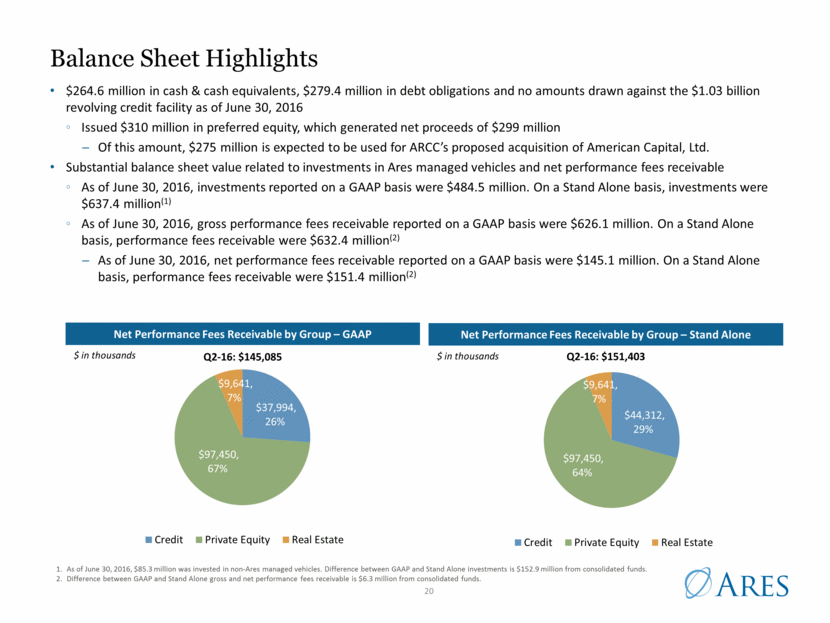
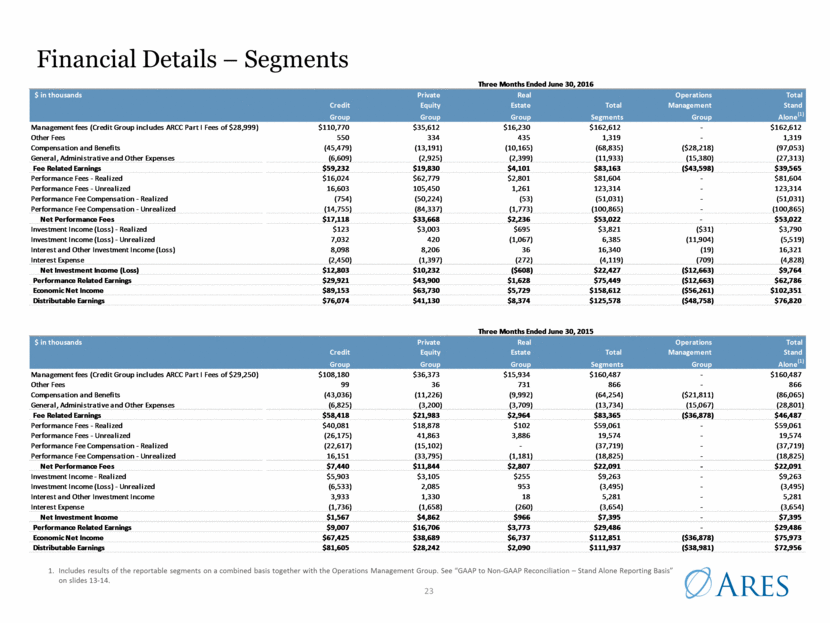
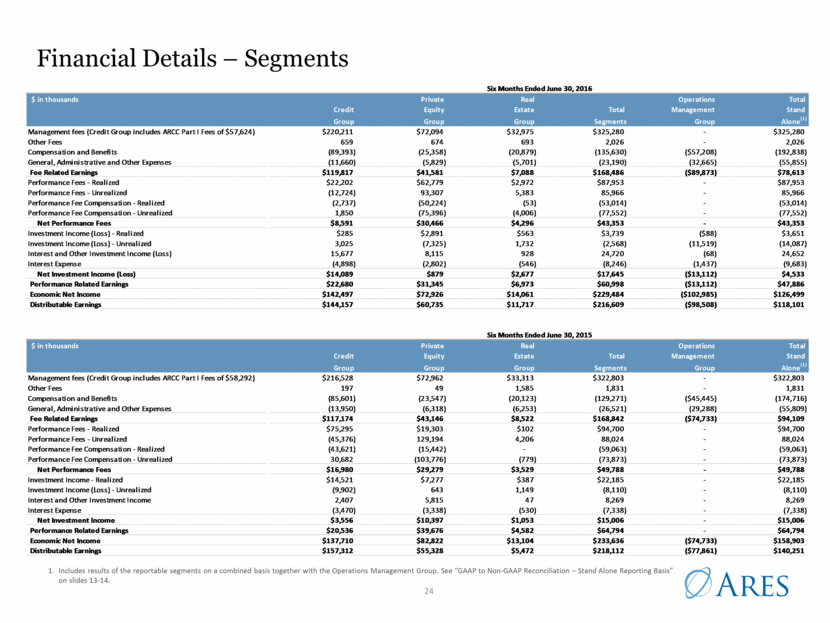
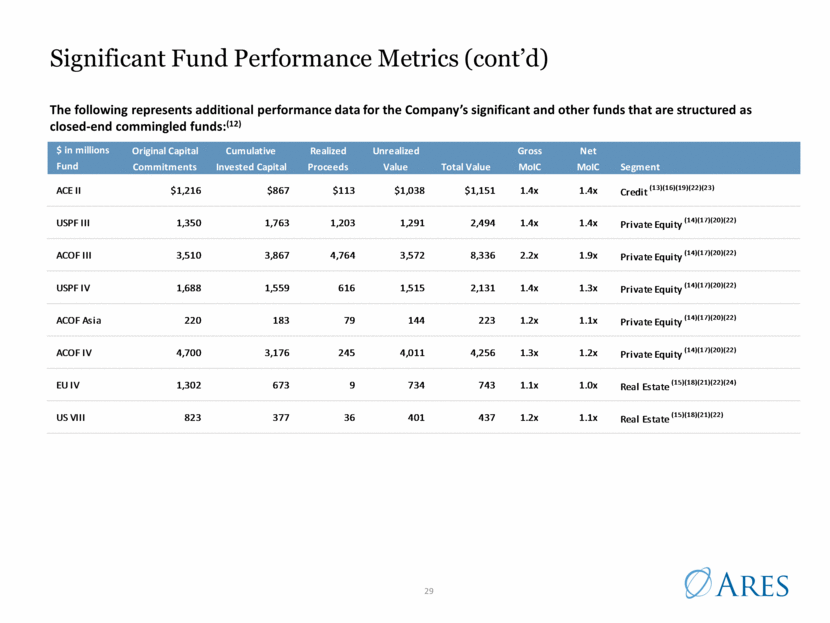
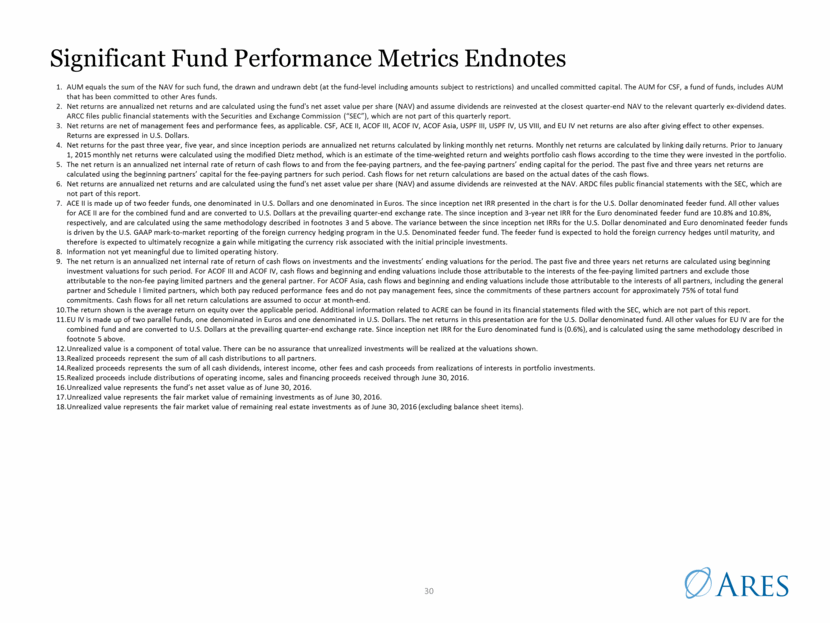
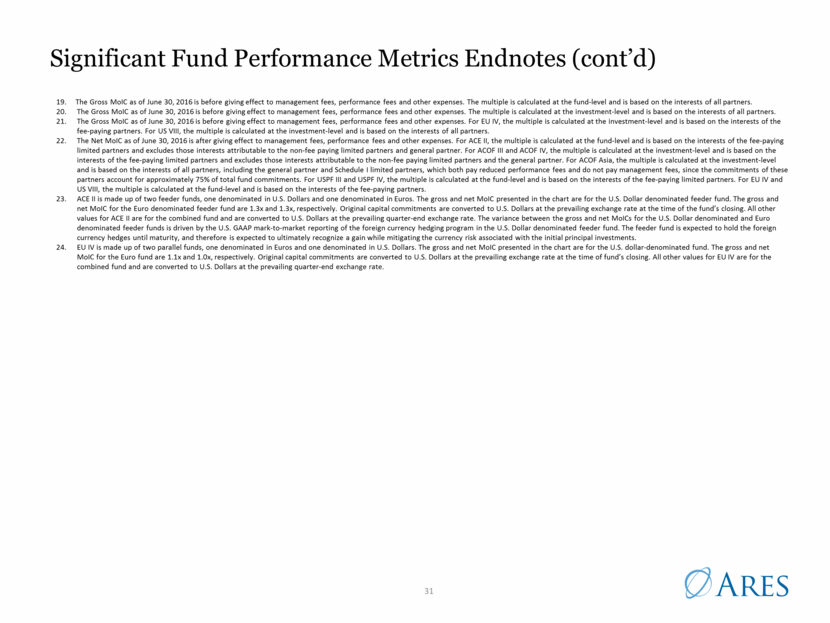
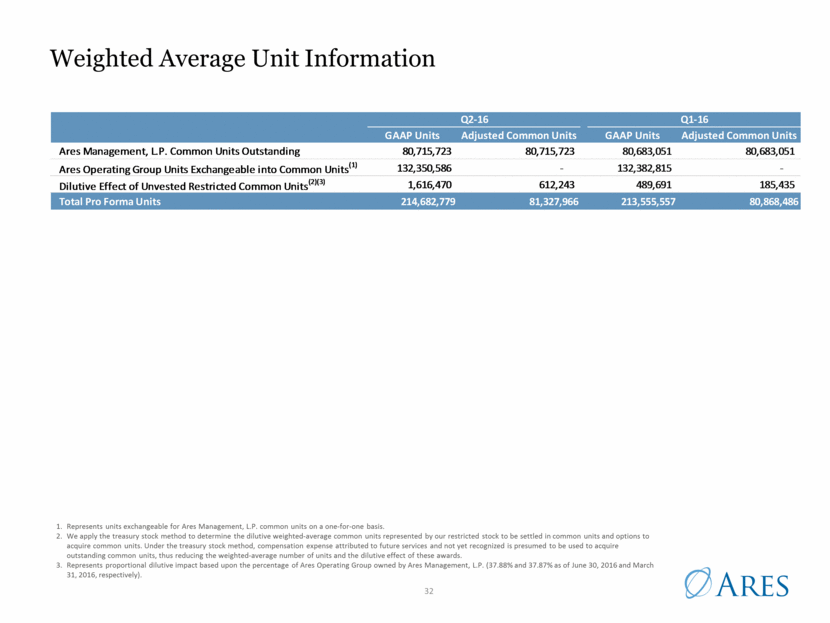
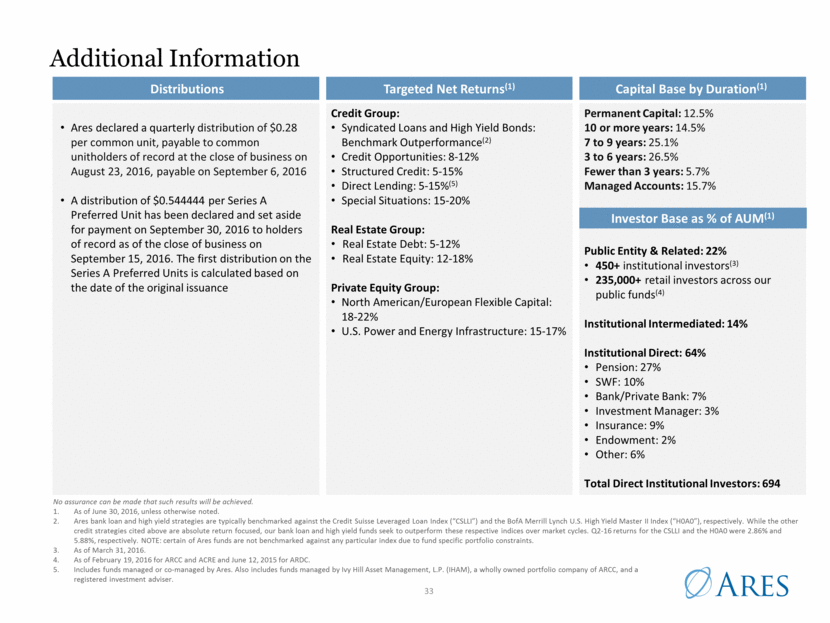
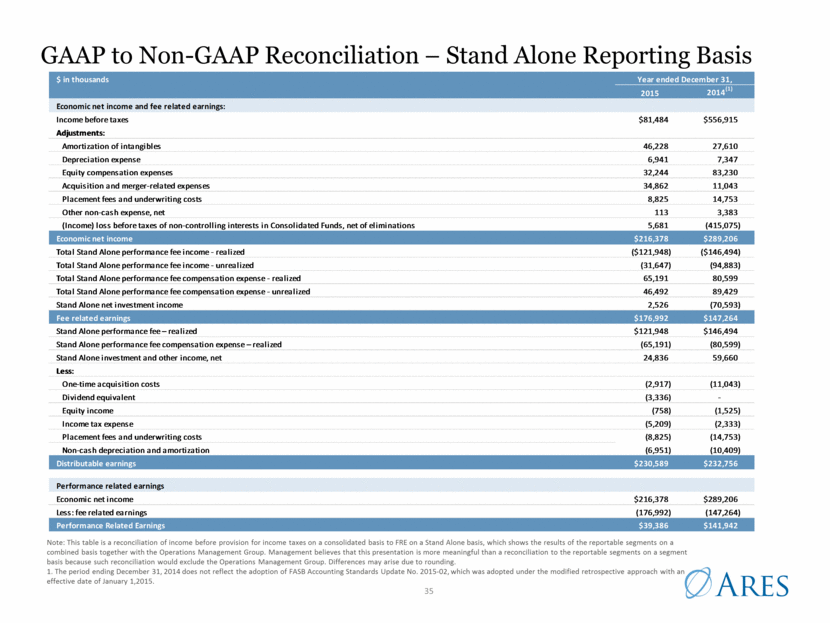
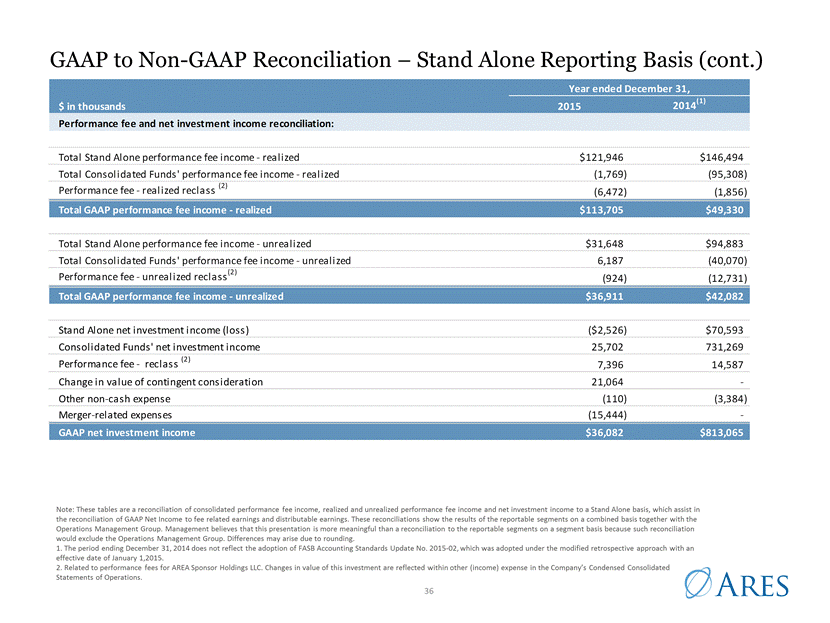
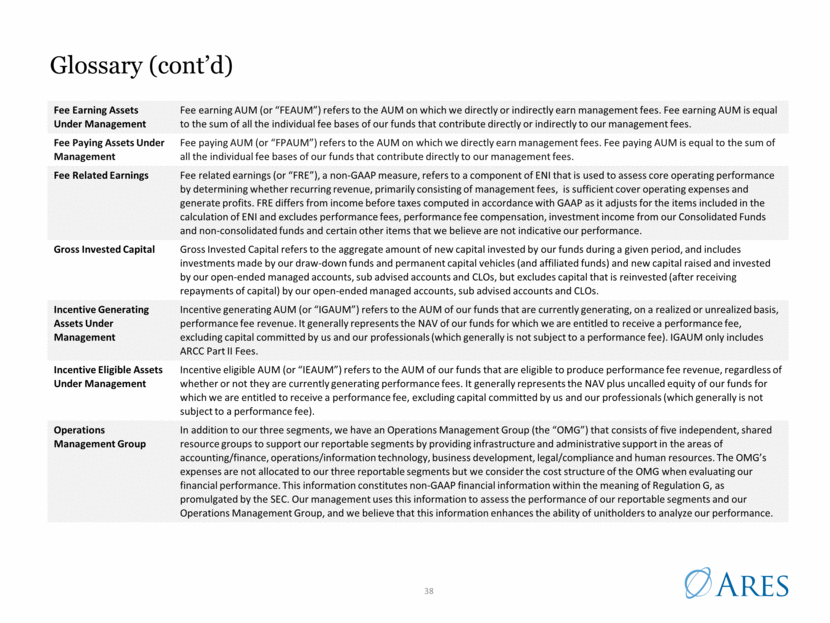
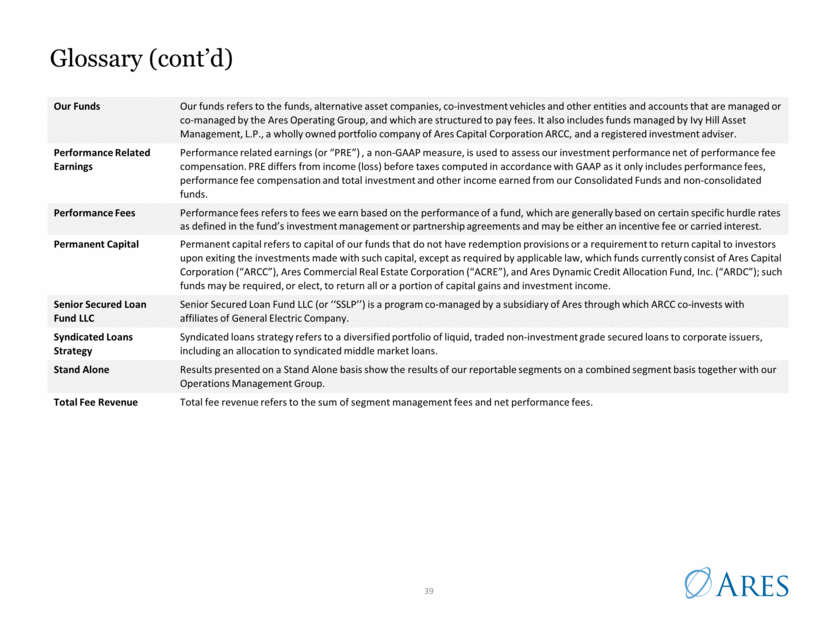
Stand Alone Financial Summary 1. Includes ARCC Part I Fees of $29.0 million and $29.3 million for the three months ended June 30, 2016 and June 30, 2015, respectively, and $57.6 million and $58.3 million for the six months ended June 30, 2016 and June 30, 2015, respectively. 2. Includes compensation and benefits expenses attributable to OMG of $28.2 million and $21.8 million for the three months ended June 30, 2016 and 2015, respectively, and $57.2 million and $45.4 million for the six months ended June 30, 2016 and 2015, respectively, which are not allocated to an operating segment. Compensation and benefits expenses include expense reimbursements of $6.0 million and $5.3 million for the three months ended June 30, 2016 and June 30, 2015, respectively, and $11.8 million and $10.5 million for the six months ended June 30, 2016 and June 30, 2015, respectively, that were previously presented as administrative and other fees. 3. Includes G&A expenses attributable to OMG of $15.4 million and $15.1 million for the three months ended June 30, 2016 and 2015, respectively, and $32.7 million and $29.3 million for the six months ended June 30, 2016 and 2015, respectively, which are not allocated to an operating segment. G&A expenses include expense reimbursements of $0.5 million and $0.9 million for the three months ended June 30, 2016 and June 30, 2015, respectively, and $1.6 million and $2.1 million for the six months ended June 30, 2016 and June 30, 2015, respectively, that were previously presented as administrative and other fees. 4. Non-Core/Non-Recurring Other Cash Uses includes one-time acquisition costs, non-cash depreciation and amortization and placement fees and underwriting costs associated with selected strategies. See slide 13 for additional details. 5. Units of 214,682,779 includes the sum of common units, Ares Operating Group Units that are exchangeable for common units on a one-for-one basis and the dilutive effects of the Company’s equity-based awards. 6. After income tax. Distributable Earnings attributable to common unitholders per unit calculation uses total common units outstanding, assuming no exchange of Ares Operating Group Units. 7. Total fee revenue is calculated as management fees plus net performance fees. 8. Represents net new commitments during the period, including equity and debt commitments and gross inflows into our open-ended managed accounts and sub-advised accounts, as well as equity offerings by our publicly traded vehicles minus redemptions from our open-ended funds, managed accounts and sub-advised accounts. 9. All periods shown are annualized. $ in thousands, except per share amounts (unless otherwise noted) Q2-16 Q2-15 % Change YTD - 2016 YTD - 2015 % Change Management Fees(1) $162,612 $160,487 1.3% $325,280 $322,803 0.8% Other Fees 1,319 866 52.3% 2,026 1,831 10.6% Compensation and Benefits Expenses (2) (97,053) (86,065) (12.8%) (192,838) (174,716) (10.4%) General, Administrative and Other Expenses (3) (27,313) (28,801) 5.2% (55,855) (55,809) (0.1%) Fee Related Earnings $39,565 $46,487 (14.9%) $78,613 $94,109 (16.5%) Net Performance Fees $53,022 $22,091 140.0% $43,353 $49,788 (12.9%) Net Investment Income 9,764 7,395 32.0% 4,533 15,006 (69.8%) Performance Related Earnings $62,786 $29,486 112.9% $47,886 $64,794 (26.1%) Economic Net Income $102,351 $75,973 34.7% $126,499 $158,903 (20.4%) (-) Unrealized Net Performance Fees $22,449 $749 NM $8,414 $14,151 (40.5%) (-) Unrealized Net Investment Income (loss) (4,156) (3,495) (18.9%) (12,725) (8,110) (56.9%) (-) Non-Core/Non-Recurring Other Cash Uses (4) 7,238 5,763 25.6% 12,709 12,611 0.8% Distributable Earnings $76,820 $72,956 5.3% $118,101 $140,251 (15.8%) Economic Net Income After Income Taxes $93,698 $68,506 36.8% $110,281 $143,181 (23.0%) Economic Net Income After Taxes per Unit(5) $0.44 $0.32 37.5% $0.52 $0.67 (22.6%) Distributable Earnings After Taxes per Common Unit(6) $0.31 $0.28 10.3% $0.46 $0.54 (14.6%) Other Data Total Fee Revenue(7) $215,634 $182,578 18.1% $368,633 $372,591 (1.1%) Net Inflows of Capital (Total New Commitments Less Redemptions)(in millions)(8) $3,931 $1,996 96.9% $6,207 $4,421 40.4% Gross Invested Capital (in millions) $4,364 $4,138 5.4% $6,485 $8,917 (27.3%) Gross Invested Capital - Drawdown Fund Only (in millions) $2,440 $1,615 51.1% $3,529 $3,726 (5.3%) Management Fee as a Percentage of Average FPAUM (9) 1.11% 1.16% (4.1%) 1.10% 1.21% (9.1%)
