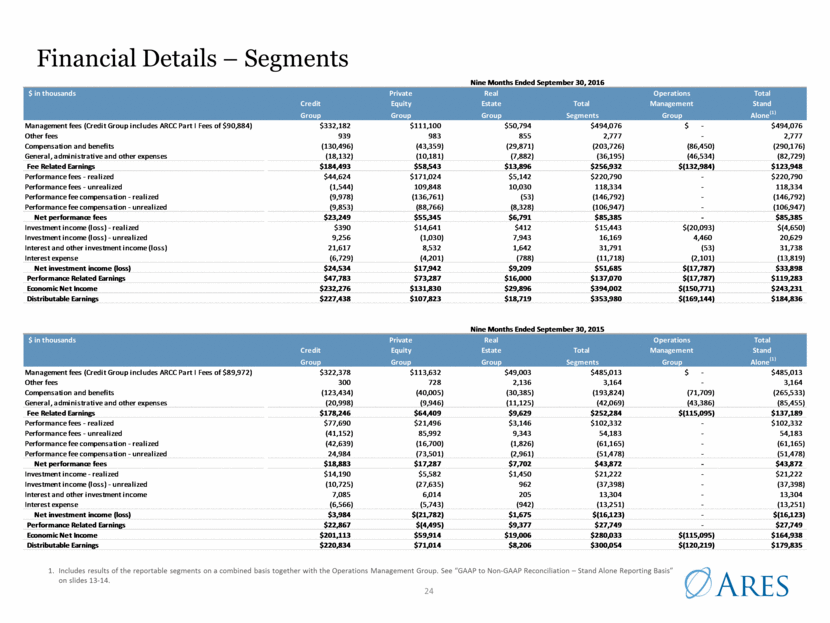
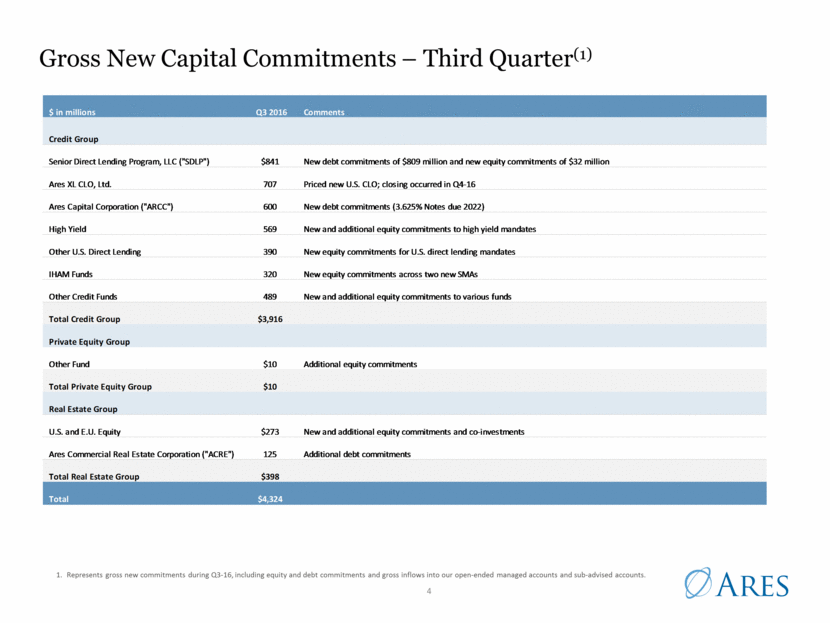
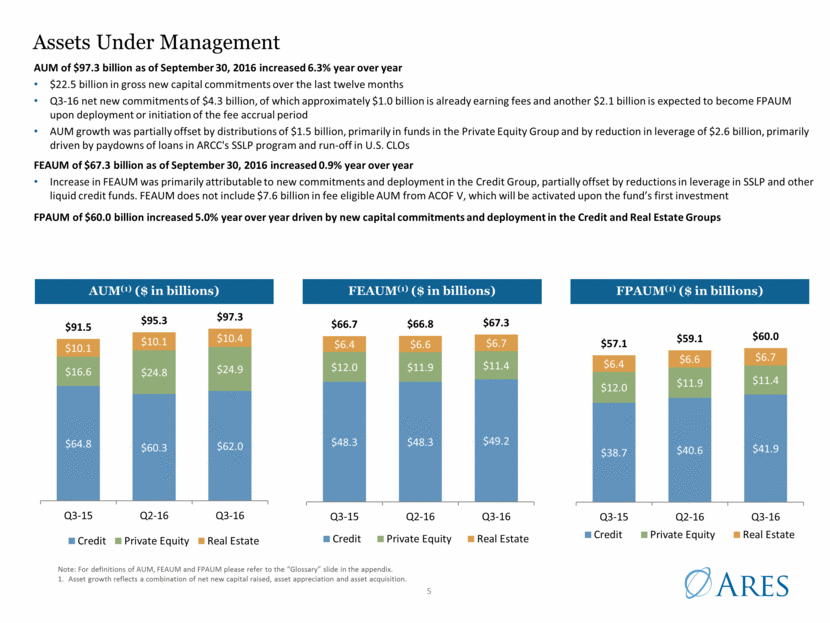
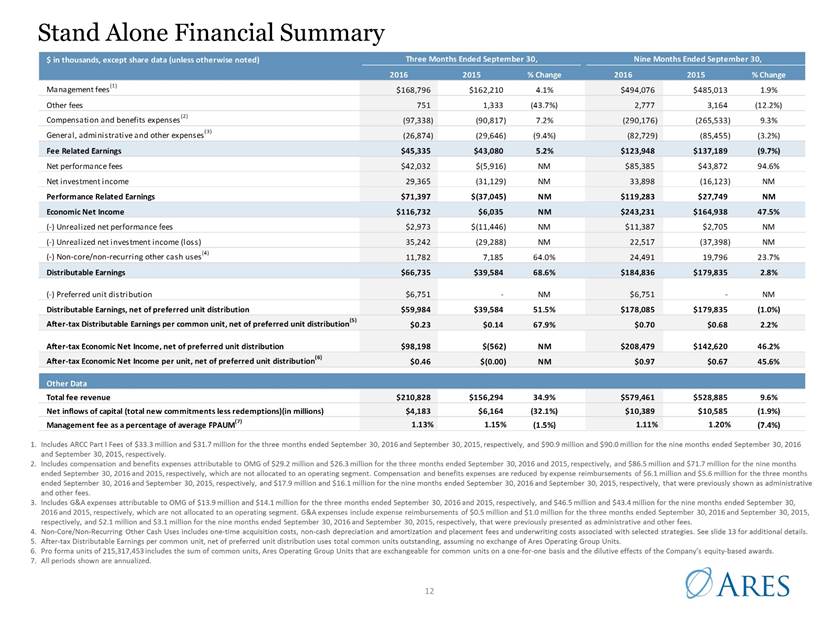
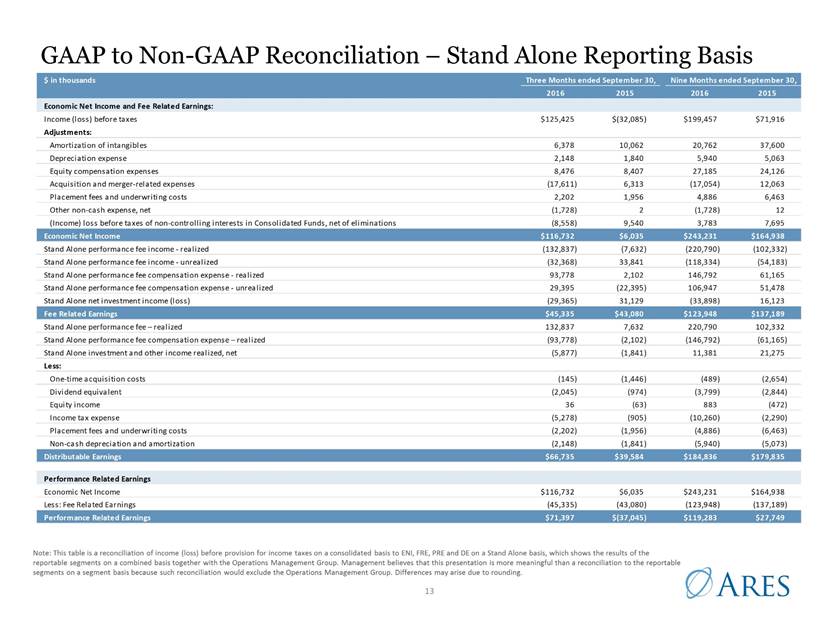
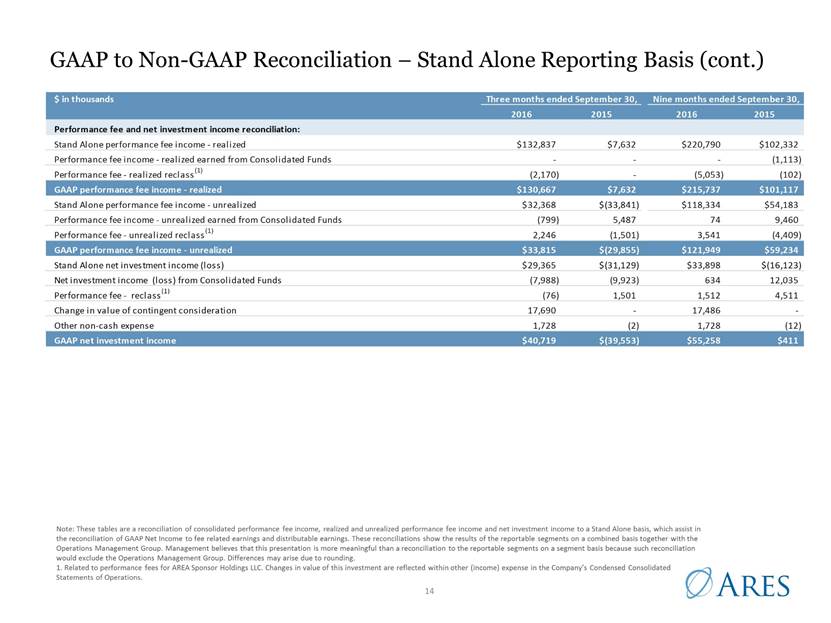
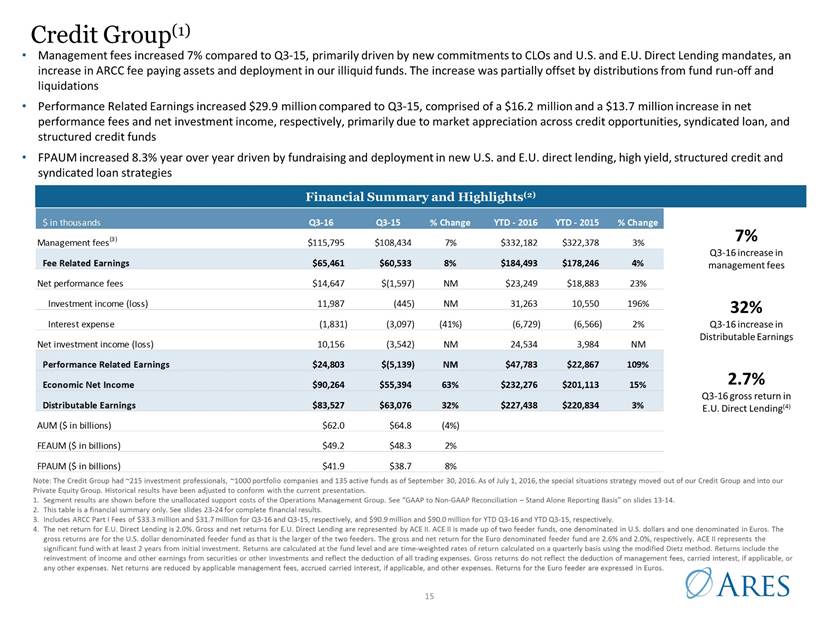
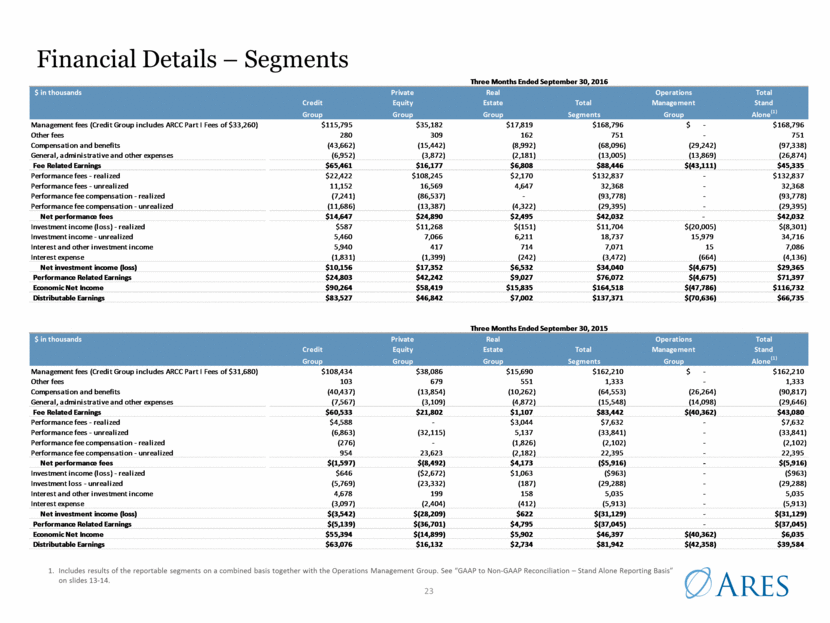
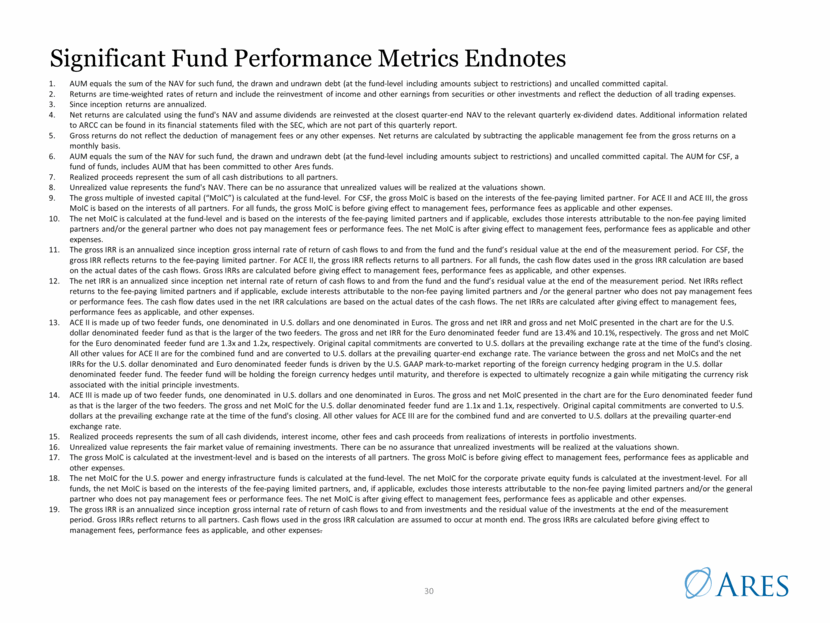
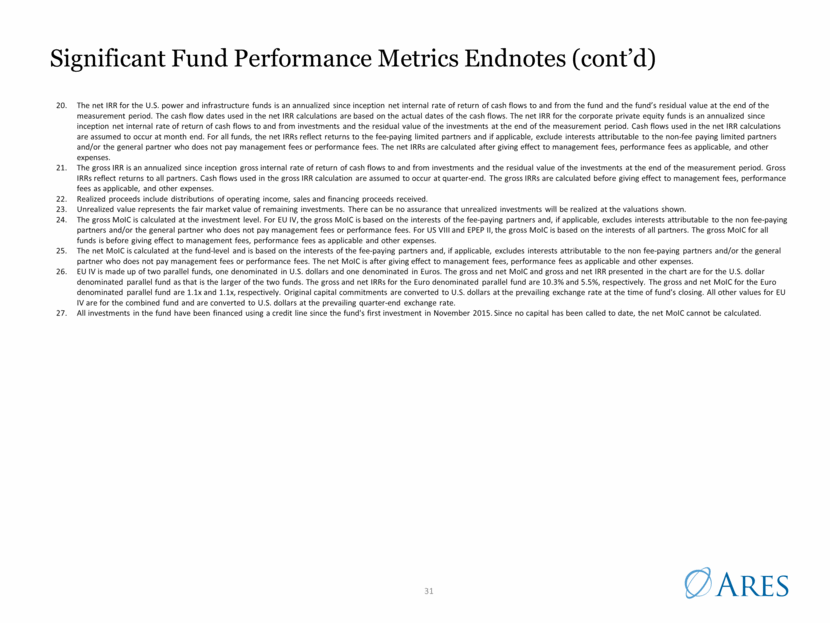
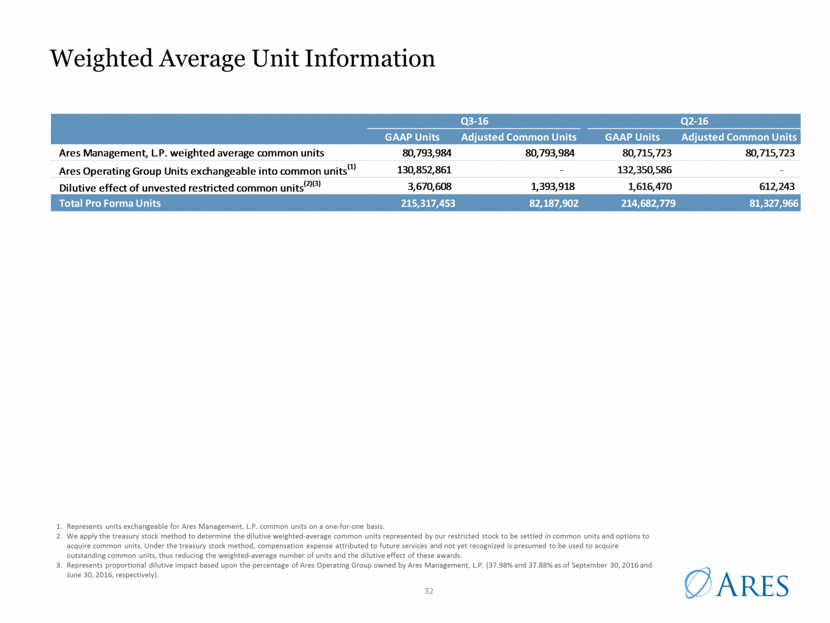
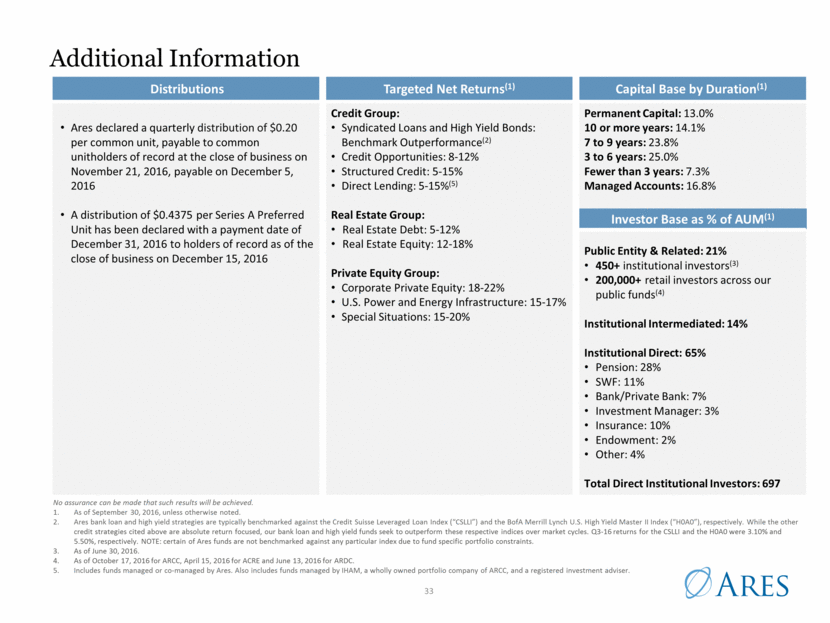
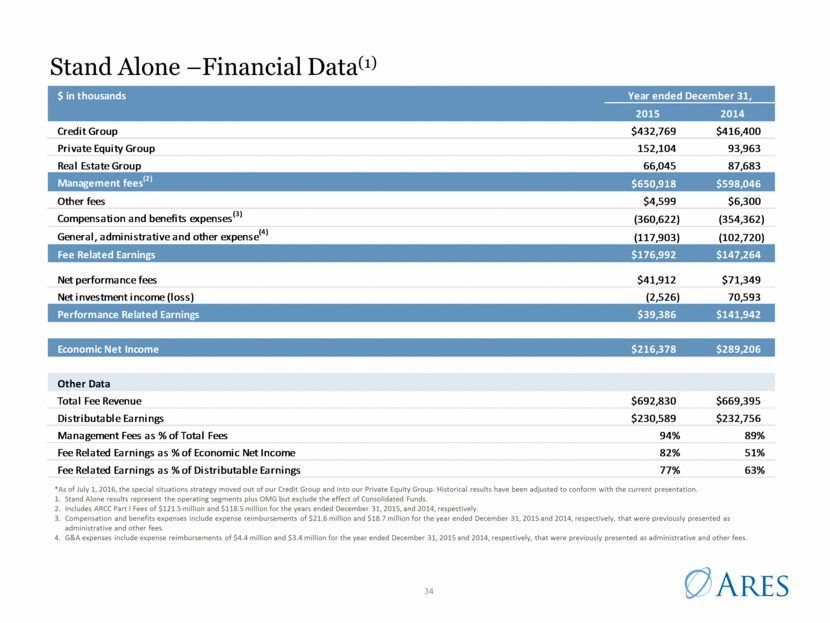
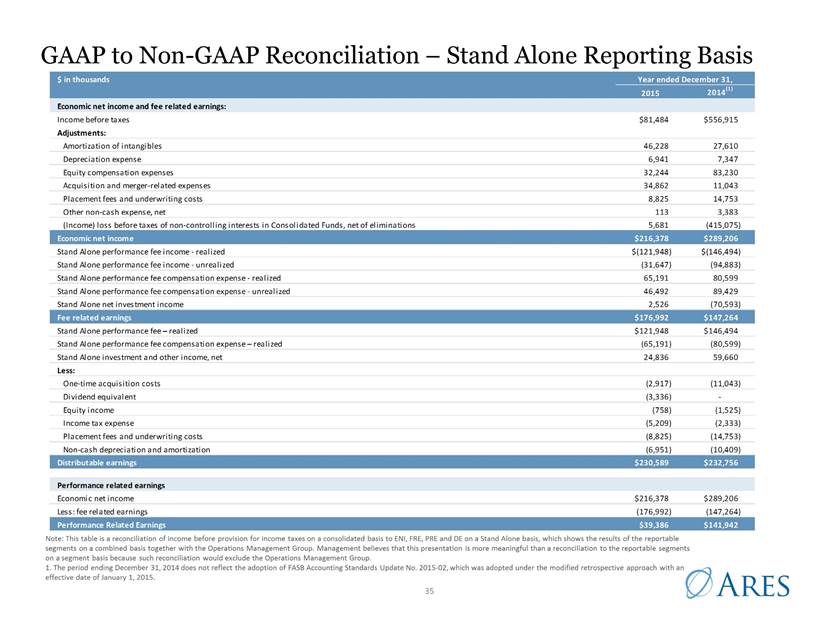
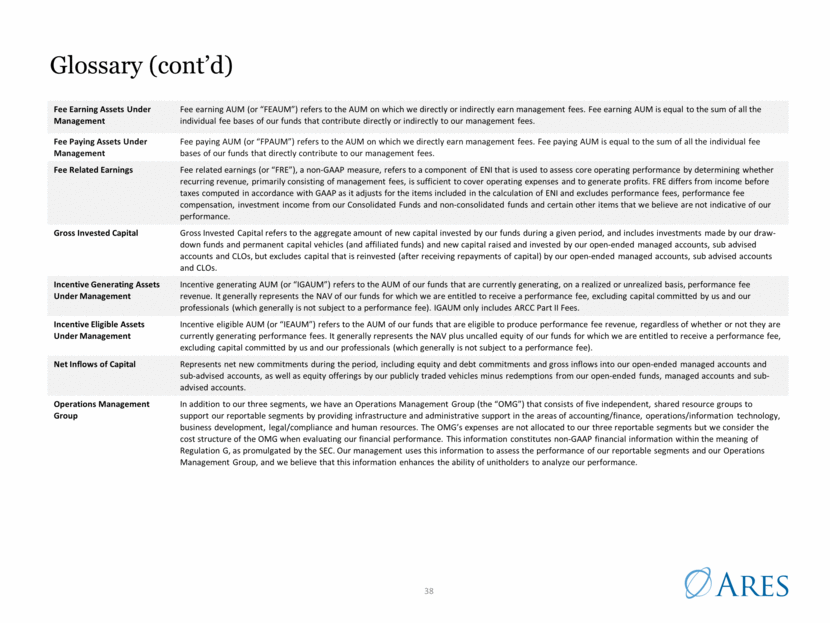
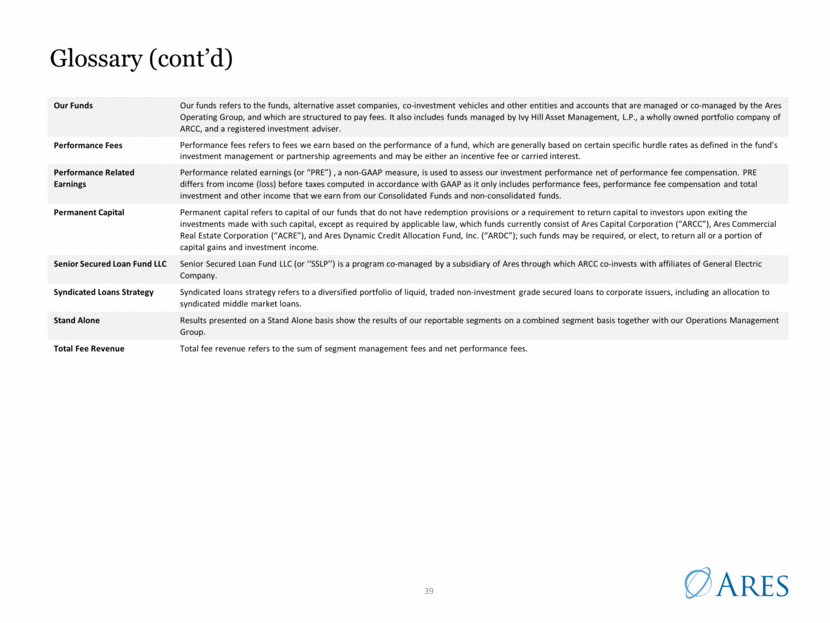
Financial Details – Segments 24 1. Includes results of the reportable segments on a combined basis together with the Operations Management Group. See “GAAP to Non-GAAP Reconciliation – Stand Alone Reporting Basis” on slides 13-14. $ in thousands Private Real Operations Total Credit Equity Estate Total Management Stand Group Group Group Segments Group Alone(1) Management fees (Credit Group includes ARCC Part I Fees of $90,884) $332,182 $111,100 $50,794 $494,076 $ - $494,076 Other fees 939 983 855 2,777 - 2,777 Compensation and benefits (130,496) (43,359) (29,871) (203,726) (86,450) (290,176) General, administrative and other expenses (18,132) (10,181) (7,882) (36,195) (46,534) (82,729) Fee Related Earnings $184,493 $58,543 $13,896 $256,932 $(132,984) $123,948 Performance fees - realized $44,624 $171,024 $5,142 $220,790 - $220,790 Performance fees - unrealized (1,544) 109,848 10,030 118,334 - 118,334 Performance fee compensation - realized (9,978) (136,761) (53) (146,792) - (146,792) Performance fee compensation - unrealized (9,853) (88,766) (8,328) (106,947) - (106,947) Net performance fees $23,249 $55,345 $6,791 $85,385 - $85,385 Investment income (loss) - realized $390 $14,641 $412 $15,443 $(20,093) $(4,650) Investment income (loss) - unrealized 9,256 (1,030) 7,943 16,169 4,460 20,629 Interest and other investment income (loss) 21,617 8,532 1,642 31,791 (53) 31,738 Interest expense (6,729) (4,201) (788) (11,718) (2,101) (13,819) Net investment income (loss) $24,534 $17,942 $9,209 $51,685 $(17,787) $33,898 Performance Related Earnings $47,783 $73,287 $16,000 $137,070 $(17,787) $119,283 Economic Net Income $232,276 $131,830 $29,896 $394,002 $(150,771) $243,231 Distributable Earnings $227,438 $107,823 $18,719 $353,980 $(169,144) $184,836 $ in thousands Private Real Operations Total Credit Equity Estate Total Management Stand Group Group Group Segments Group Alone(1) Management fees (Credit Group includes ARCC Part I Fees of $89,972) $322,378 $113,632 $49,003 $485,013 $ - $485,013 Other fees 300 728 2,136 3,164 - 3,164 Compensation and benefits (123,434) (40,005) (30,385) (193,824) (71,709) (265,533) General, administrative and other expenses (20,998) (9,946) (11,125) (42,069) (43,386) (85,455) Fee Related Earnings $178,246 $64,409 $9,629 $252,284 $(115,095) $137,189 Performance fees - realized $77,690 $21,496 $3,146 $102,332 - $102,332 Performance fees - unrealized (41,152) 85,992 9,343 54,183 - 54,183 Performance fee compensation - realized (42,639) (16,700) (1,826) (61,165) - (61,165) Performance fee compensation - unrealized 24,984 (73,501) (2,961) (51,478) - (51,478) Net performance fees $18,883 $17,287 $7,702 $43,872 - $43,872 Investment income - realized $14,190 $5,582 $1,450 $21,222 - $21,222 Investment income (loss) - unrealized (10,725) (27,635) 962 (37,398) - (37,398) Interest and other investment income 7,085 6,014 205 13,304 - 13,304 Interest expense (6,566) (5,743) (942) (13,251) - (13,251) Net investment income (loss) $3,984 $(21,782) $1,675 $(16,123) - $(16,123) Performance Related Earnings $22,867 $(4,495) $9,377 $27,749 - $27,749 Economic Net Income $201,113 $59,914 $19,006 $280,033 $(115,095) $164,938 Distributable Earnings $220,834 $71,014 $8,206 $300,054 $(120,219) $179,835 Nine Months Ended September 30, 2016 Nine Months Ended September 30, 2015 Confidential – Not for Publication or Distribution
