UNITED STATES
SECURITIES AND EXCHANGE COMMISSION
Washington, D.C. 20549
FORM 10-K
| | | | | |
| ☒ | ANNUAL REPORT PURSUANT TO SECTION 13 OR 15(d) OF THE SECURITIES EXCHANGE ACT OF 1934 |
For the fiscal year ended December 31, 2024
OR
| | | | | |
| ☐ | TRANSITION REPORT PURSUANT TO SECTION 13 OR 15(d) OF THE SECURITIES EXCHANGE ACT OF 1934 |
For the transition period from to
Commission File No. 001-36429
ARES MANAGEMENT CORPORATION
(Exact name of Registrant as specified in its charter) | | | | | |
| Delaware | 80-0962035 |
(State or other jurisdiction of
incorporation or organization) | (I.R.S. Employer
Identification Number) |
1800 Avenue of the Stars, Suite 1400, Los Angeles, CA 90067
(Address of principal executive office) (Zip Code)
(310) 201-4100
(Registrant’s telephone number, including area code)
N/A
(Former name, former address and former fiscal year, if changed since last report)
Securities registered pursuant to Section 12(b) of the Act: | | | | | | | | |
| Title of each class | Trading Symbol(s) | Name of each exchange on which registered |
| Class A common stock, par value $0.01 per share | ARES | New York Stock Exchange |
| 6.75% Series B mandatory convertible preferred stock, par value $0.01 per share | ARES.PRB | New York Stock Exchange |
Securities registered pursuant to Section 12(g) of the Act: None
Indicate by check mark if the registrant is a well-known seasoned issuer, as defined in Rule 405 of the Securities Act. Yes x No ☐
Indicate by check mark if the registrant is not required to file reports pursuant to Section 13 or Section 15(d) of the Act. Yes ¨ No x
Indicate by check mark whether the registrant (1) has filed all reports required to be filed by Section 13 or 15(d) of the Securities Exchange Act of 1934 during the preceding 12 months (or for such shorter period that the registrant was required to file such reports), and (2) has been subject to such filing requirements for the past 90 days: Yes x No ¨
Indicate by check mark whether the registrant has submitted electronically every Interactive Data File required to be submitted pursuant to Rule 405 of Regulation S-T (§232.405 of this chapter) during the preceding 12 months (or for such shorter period that the registrant was required to submit such files). Yes x No ¨
Indicate by check mark whether the registrant is a large accelerated filer, an accelerated filer, a non-accelerated filer, a smaller reporting company, or an emerging growth company. See definitions of “large accelerated filer,” “accelerated filer,” “smaller reporting company.” and “emerging growth company” in Rule 12b-2 of the Exchange Act.
| | | | | | | | | | | | | | | | | | | | | | | | | | | | | |
| Large Accelerated Filer | x | Accelerated Filer | ☐ | Non-Accelerated Filer | ☐ | Smaller Reporting Company | ☐ | Emerging Growth Company | ☐ |
If an emerging growth company, indicate by check mark if the registrant has elected not to use the extended transition period for complying with any new or revised financial accounting standards provided pursuant to Section 13(a) of the Exchange Act. ¨
Indicate by check mark whether the registrant has filed a report on and attestation to its management’s assessment of the effectiveness of its internal control over financial reporting under Section 404(b) of the Sarbanes-Oxley Act (15 U.S.C. 7262(b)) by the registered public accounting firm that prepared or issued its audit report. Yes x No ¨
If securities are registered pursuant to Section 12(b) of the Act, indicate by check mark whether the financial statements of the registrant included in the filing reflect the correction of an error to previously issued financial statements. o
Indicate by check mark whether any of those error corrections are restatements that required a recovery analysis of incentive-based compensation received by any of the registrant’s executive officers during the relevant recovery period pursuant to §240.10D-1(b). o
Indicate by check mark whether the registrant is a shell company (as defined in Rule 12b-2 of the Exchange Act). Yes ☐ No x
The aggregate market value of the common shares held by non-affiliates of the registrant on June 30, 2024, based on the closing price on that date of $133.28 on the New York Stock Exchange, was approximately $25,545,399,693. As of February 21, 2025 there were 204,107,275 of the registrant’s shares of Class A common stock outstanding, 3,489,911 of the registrant’s shares of non-voting common stock outstanding, 1,000 shares of the registrant’s Class B common stock outstanding, 107,811,420 of the registrant’s Class C common stock outstanding and 30,000,000 of the registrant’s Series B mandatory convertible preferred stock outstanding.
DOCUMENTS INCORPORATED BY REFERENCE
Part III of this Form 10-K incorporates by reference information from the registrant’s definitive proxy statement related to the 2025 annual meeting of stockholders.
Cautionary Note Regarding Forward-Looking Statements
This report contains forward-looking statements within the meaning of Section 27A of the Securities Act of 1933, as amended (the “Securities Act”), and Section 21E of the Securities Exchange Act of 1934, as amended (the “Exchange Act”), which reflect our current views with respect to, among other things, future events, operations and financial performance. You can identify these forward-looking statements by the use of forward-looking words such as “outlook,” “believes,” “expects,” “potential,” “continues,” “may,” “will,” “should,” “seeks,” “predicts,” “intends,” “plans,” “estimates,” “anticipates,” “foresees” or negative versions of those words, other comparable words or other statements that do not relate to historical or factual matters. The forward-looking statements are based on our beliefs, assumptions and expectations of our future performance, taking into account all information currently available to us. Such forward-looking statements are subject to various risks and uncertainties and assumptions relating to our operations, financial results, financial condition, business prospects, growth strategy and liquidity. Some of these factors are described in this Annual Report on Form 10-K for the year ended December 31, 2024, under the headings “Item 7. Management’s Discussion and Analysis of Financial Condition and Results of Operations” and “Item 1A. Risk Factors.” These factors should not be construed as exhaustive and should be read in conjunction with the risk factors and other cautionary statements that are included in this report and in our other periodic filings. If one or more of these or other risks or uncertainties materialize, or if our underlying assumptions prove to be incorrect, our actual results may vary materially from those indicated in these forward-looking statements. New risks and uncertainties arise over time, and it is not possible for us to predict those events or how they may affect us. Therefore, you should not place undue reliance on these forward-looking statements. Any forward-looking statement speaks only as of the date on which it is made. We do not undertake any obligation to publicly update or review any forward-looking statement, whether as a result of new information, future developments or otherwise, except as required by law.
References in this Annual Report on Form 10-K to the “Ares Operating Group” refer to Ares Holdings L.P. (“Ares Holdings”). References in this Annual Report on Form 10-K to an “Ares Operating Group Unit” or an “AOG Unit” refers to a partnership unit in the Ares Operating Group entity.
The use of any defined term in this report to mean more than one entities, persons, securities or other items collectively is solely for convenience of reference and in no way implies that such entities, persons, securities or other items are one indistinguishable group. For example, notwithstanding the use of the defined terms “Ares,” “we” and “our” in this report to refer to Ares Management Corporation and its subsidiaries, each subsidiary of Ares Management Corporation is a standalone legal entity that is separate and distinct from Ares Management Corporation and any of its other subsidiaries.
Under generally accepted accounting principles in the United States (“U.S.”) (“GAAP”), we are required to consolidate (i) entities other than limited partnerships and entities similar to limited partnerships in which we hold a majority voting interest or have majority ownership and control over the operational, financial and investing decisions of that entity, including Ares-affiliates and affiliated funds and co-investment vehicles, for which we are presumed to have controlling financial interests, and (ii) entities that we concluded are variable interest entities (“VIEs”), including limited partnerships and collateralized loan obligations, for which we are deemed to be the primary beneficiary. When an entity is consolidated, we reflect the assets, liabilities, revenues, expenses and cash flows of the entity in our consolidated financial statements on a gross basis, subject to eliminations from consolidation, including the elimination of the management fees, carried interest, incentive fees and other fees that we earn from the entity. However, the presentation of performance related compensation and other expenses associated with generating such revenues is not affected by the consolidation process. In addition, as a result of the consolidation process, the net income attributable to third-party investors in consolidated entities is presented as net income attributable to non-controlling interests in Consolidated Funds within Consolidated Statements of Operations. We also consolidate joint ventures that we have established with third-party investors for strategic distribution and expansion purposes. The results of these entities are reflected on a gross basis in the consolidated financial statements, subject to eliminations from consolidation, and net income attributable to third-party investors in the consolidated joint ventures is presented within net income attributable to redeemable interest and non-controlling interests in Ares Operating Group entities or an “AOG Entity,” which refers to, collectively, Ares Holdings and any future entity designated by our board of directors in its sole discretion as an Ares Operating Group entity.
In this Annual Report on Form 10-K, in addition to presenting our results on a consolidated basis in accordance with GAAP, we present revenues, expenses and other results on a: (i) “segment basis,” which deconsolidates the consolidated funds and removes the proportional results attributable to third-party investors in the consolidated joint ventures, and therefore shows the results of our operating segments without giving effect to the consolidation of these entities; and (ii) “unconsolidated reporting basis,” which shows the results of our operating segments on a combined segment basis together with the Operations Management Group (the “OMG”). In addition to our operating segments, the OMG consists of shared resource groups to support our operating segments by providing infrastructure and administrative support in the areas of accounting/finance, operations, information technology, legal, compliance, human resources, strategy and relationship management, and
distribution, including Ares Wealth Management Solutions, LLC (“AWMS”). AWMS facilitates the product development, distribution, marketing and client management activities for investment offerings in the global wealth management channel. Additionally, the OMG provides services to certain of our managed funds and vehicles, which reimburse the OMG for expenses either equal to the costs of services provided or as a percentage of invested capital. The OMG’s revenues and expenses are not allocated to our operating segments but we consider the cost structure of the OMG when evaluating our financial performance. This information constitutes non-GAAP financial information within the meaning of Regulation G, as promulgated by the SEC. Our management uses this information to assess the performance of our operating segments and the OMG, and we believe that this information enhances the ability of shareholders to analyze our performance. For more information, see “Note 14. Segment Reporting,” within our consolidated financial statements included in this Annual Report on Form 10-K.
Glossary
When used in this report, unless the context otherwise requires:
•“American-style waterfall” generally refers to carried interest that the general partner is entitled to receive after a fund investment is realized and the investors in the fund have received distributions in excess of the capital contributed for that investment and all prior realized investments (including allocable expenses) plus a preferred return;
•“Ares”, the “Company”, “AMC”, “we”, “us” and “our” refer to Ares Management Corporation and its subsidiaries;
•“Ares Operating Group entities” or an “AOG Entity” refers to, collectively, Ares Holdings L.P. (“Ares Holdings”) and any future entity designated by our board of directors in its sole discretion as an Ares Operating Group entity;
•“Ares Operating Group Unit” or an “AOG Unit” refers to, collectively, a partnership unit in the Ares Operating Group entities including Ares Holdings and any future entity designated by our board of directors in its sole discretion as an Ares Operating Group entity;
•“assets under management” or “AUM” generally refers to the assets we manage. For our funds other than CLOs, our AUM represents the sum of the net asset value (“NAV”) of such funds, the drawn and undrawn debt (at the fund-level including amounts subject to restrictions) and uncalled committed capital (including commitments to funds that have yet to commence their investment periods). NAV generally refers to fair value of the assets of the fund less the liabilities of the fund but may represent carrying value of assets and liabilities of funds that are not reported at fair value. For the CLOs we manage, our AUM is equal to initial principal of collateral adjusted for paydowns. AUM also includes the proceeds raised in the initial public offerings of special purpose acquisition companies (“SPACs”) sponsored by us, less any redemptions;
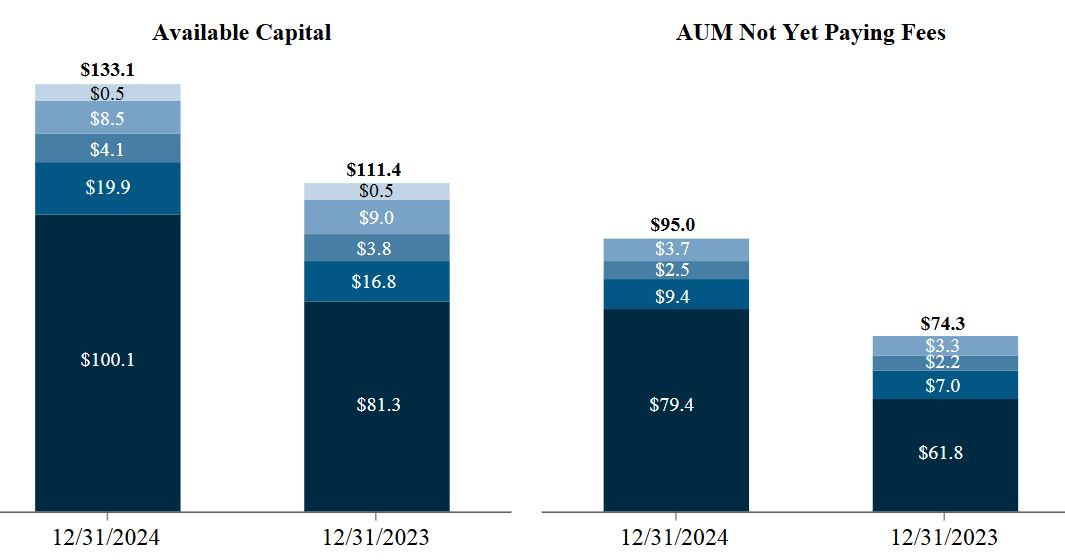
•“AUM not yet paying fees” (also referred to as “shadow AUM”) refers to AUM that is not currently paying fees and is eligible to earn management fees upon deployment;
•“available capital” (also referred to as “dry powder”) is comprised of uncalled committed capital and undrawn amounts under credit facilities and may include AUM that may be canceled or not otherwise available to invest;
•“catch-up fees” refers to management fees charged retroactively on limited partner commitments to a fund following the initial close date of that fund. These fees are charged to ensure that all limited partners’ share of the net assets of that fund are ratable with their commitment. Catch-up fees reflect the fees generated between the fund’s initial close date and the last day of the quarter prior to the new limited partner’s commitment;
•“CLOs” refers to “our funds” that are structured as collateralized loan obligations;
•“Consolidated Funds” refers collectively to certain Ares funds, co-investment vehicles, CLOs and SPACs that are required under GAAP to be consolidated in our consolidated financial statements;
•“Credit Facility” refers to the revolving credit facility of the Ares Operating Group;
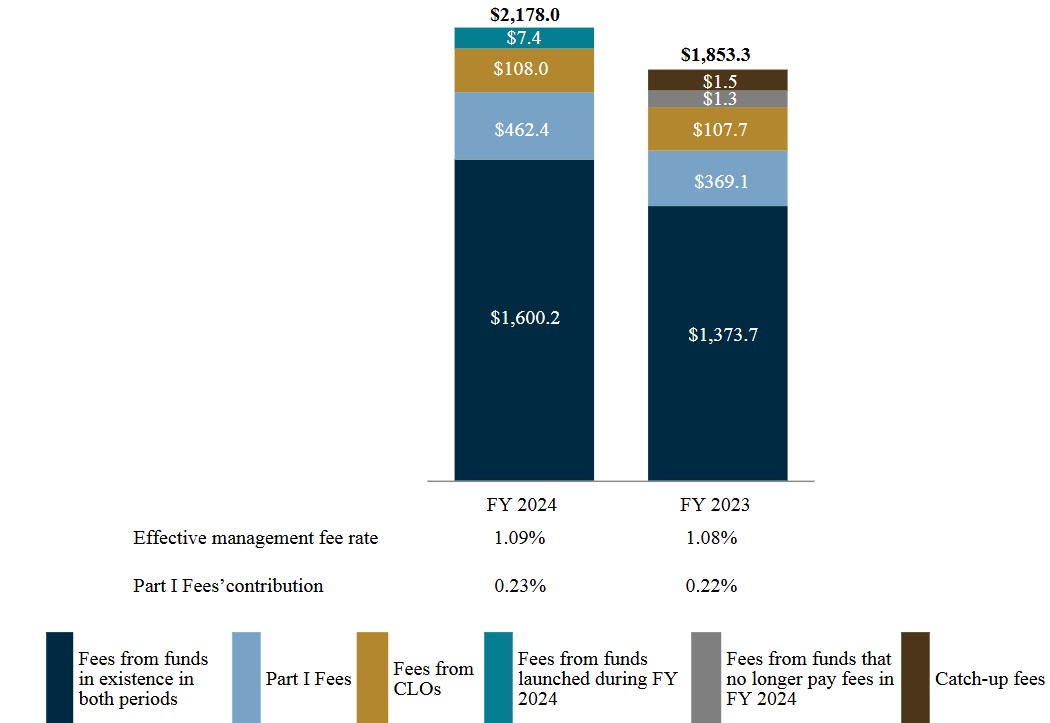
•“effective management fee rate” represents annualized management fees divided by the average fee paying AUM for the period, excluding the impact of catch-up fees;
•“European-style waterfall” generally refers to carried interest that the general partner is entitled to receive after the investors in a fund have received distributions in an amount equal to all prior capital contributions plus a preferred return;
•“fee paying AUM” or “FPAUM” refers to the AUM from which we directly earn management fees. FPAUM is equal to the sum of all the individual fee bases of our funds that directly contribute to our management fees. For
our funds other than CLOs, our FPAUM represents the amount of limited partner capital commitments for certain closed-end funds within the reinvestment period, the amount of limited partner invested capital for the aforementioned closed-end funds beyond the reinvestment period and the portfolio value, gross asset value or NAV. For the CLOs we manage, our FPAUM is equal to the gross amount of aggregate collateral balance, at par, adjusted for defaulted or discounted collateral;
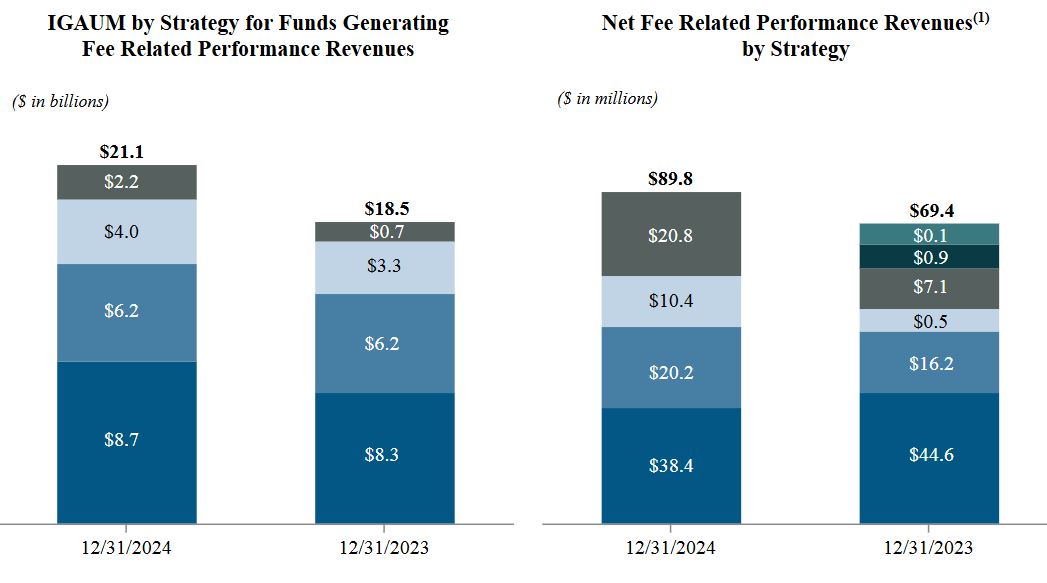
•“fee related earnings” or “FRE”, a non-GAAP measure that is a component of Realized Income, is used to assess core operating performance by determining whether recurring revenue, primarily consisting of management fees and fee related performance revenues, is sufficient to cover operating expenses and to generate profits. FRE differs from income before taxes computed in accordance with GAAP as FRE excludes net performance income, investment income from our funds and adjusts for certain other items that we believe are not indicative of our core operating performance. Fee related performance revenues, together with fee related performance compensation, is presented within FRE because it represents incentive fees from perpetual capital vehicles that are measured and eligible to be received on a recurring basis and are not dependent on realization events from the underlying investments;
•“fee related performance revenues” refers to incentive fees from perpetual capital vehicles that are: (i) measured and eligible to be received on a recurring basis; and (ii) not dependent on realization events from the underlying investments. Certain vehicles are subject to hold back provisions that limit the amounts paid in a particular year. Such hold back amounts may be paid in subsequent years, subject to their extended performance conditions;
•“GAAP” refers to accounting principles generally accepted in the United States of America;
•“Holdco Members” refers to Michael Arougheti, David Kaplan, Antony Ressler, Bennett Rosenthal and R. Kipp deVeer;
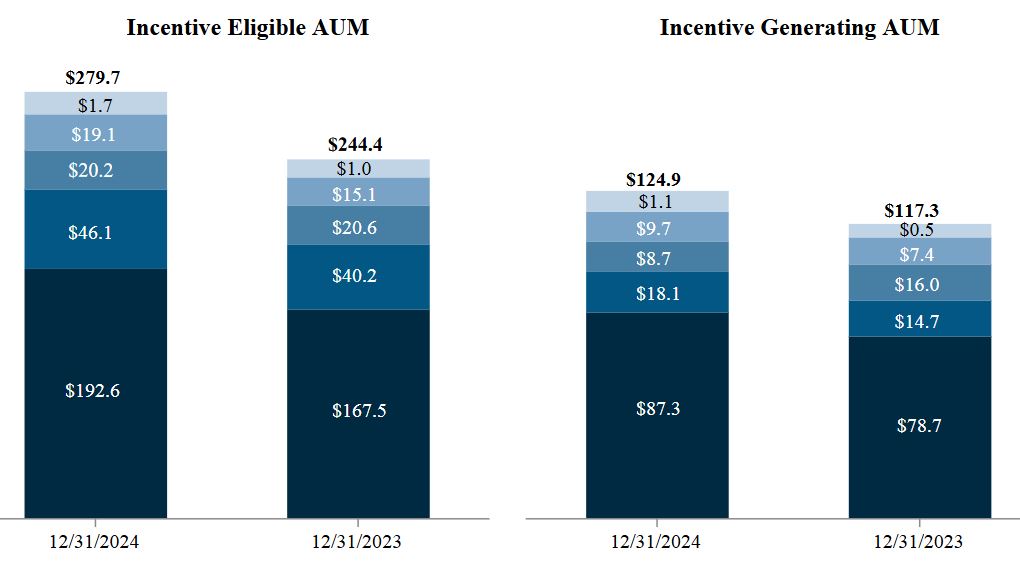
•“incentive eligible AUM” or “IEAUM” generally refers to the AUM of our funds and other entities from which carried interest and incentive fees may be generated, regardless of whether or not they are currently generating carried interest and incentive fees. It generally represents the NAV plus uncalled equity or total assets plus uncalled debt, as applicable, of our funds for which we are entitled to receive carried interest and incentive fees, excluding capital committed by us and our professionals (from which we generally do not earn carried interest and incentive fees), as well as proceeds raised in the initial public offerings of SPACs sponsored by us, less any redemptions. With respect to Ares Capital Corporation (NASDAQ: ARCC) (“ARCC”), Ares Strategic Income Fund (“ASIF”), our open-ended European direct lending fund and our infrastructure private business development company (“BDC”) AUM, only Part II Fees may be generated from IEAUM;
•“incentive generating AUM” or “IGAUM” refers to the AUM of our funds and other entities that are currently generating carried interest and incentive fees on a realized or unrealized basis. It generally represents the NAV or total assets of our funds, as applicable, for which we are entitled to receive carried interest and incentive fees, excluding capital committed by us and our professionals (from which we generally do not earn carried interest and incentive fees). ARCC, ASIF, our open-ended European direct lending fund and our infrastructure private BDC are only included in IGAUM when Part II Fees are being generated;
•“management fees” refers to fees we earn for advisory services provided to our funds, which are generally based on a defined percentage of fair value of assets, total commitments, invested capital, net asset value, net investment income, total assets or par value of the investment portfolios managed by us. Management fees include Part I Fees, a quarterly fee based on the net investment income of certain funds;
•“net performance income” refers to performance income net of related compensation that is typically payable to our professionals;
•“our funds” refers to the funds, alternative asset companies, trusts, co-investment vehicles and other entities and accounts that are managed or co-managed by the Ares Operating Group, and which are structured to pay fees. It
also includes funds managed by Ivy Hill Asset Management, L.P., a wholly owned portfolio company of ARCC and an SEC-registered investment adviser;
•“Part I Fees” refers to a quarterly fee on the net investment income of ARCC, CION Ares Diversified Credit Fund (“CADC”), ASIF, our open-ended European direct lending fund and our infrastructure private BDC. Such fees are classified as management fees as they are predictable and recurring in nature, not subject to contingent repayment and generally cash-settled each quarter, unless subject to a payment deferral;
•“Part II Fees” refers to fees from ARCC, ASIF, our open-ended European direct lending fund and our infrastructure private BDC that are paid in arrears as of the end of each calendar year when the respective cumulative aggregate realized capital gains exceed the cumulative aggregate realized capital losses and aggregate unrealized capital depreciation, less the aggregate amount of respective Part II Fees paid in all prior years since inception;
•“performance income” refers to income we earn based on the performance of a fund that is generally based on certain specific hurdle rates as defined in the fund’s investment management or partnership agreements and may be either incentive fees earned from funds with stated investment periods or carried interest;
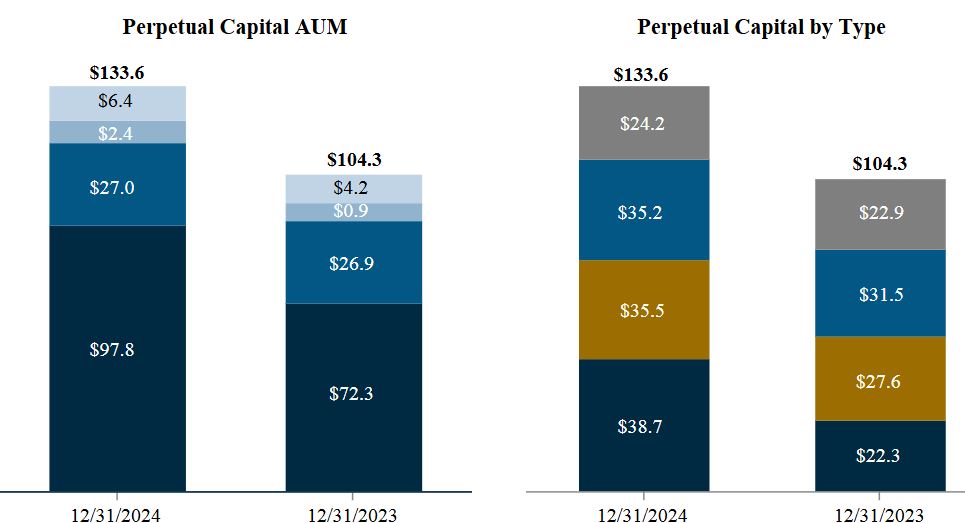
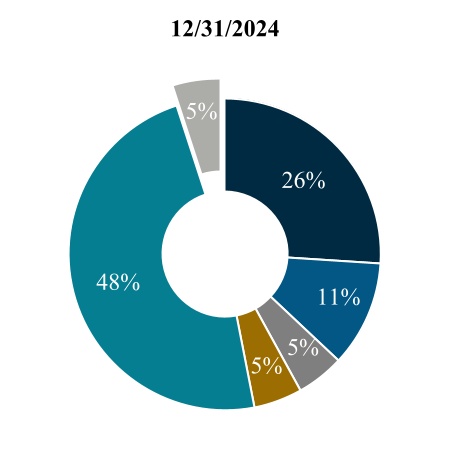
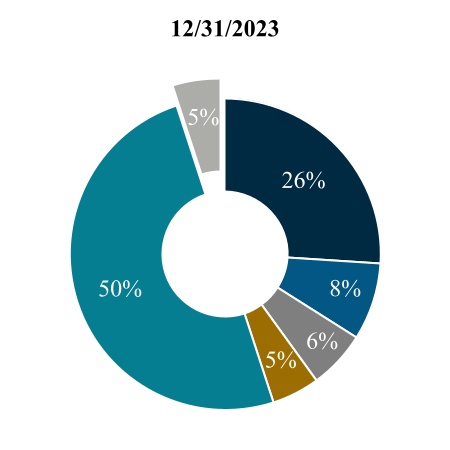
•“perpetual capital” refers to the AUM of: (i) our publicly-traded vehicles, including ARCC, Ares Commercial Real Estate Corporation (NYSE: ACRE) (“ACRE”) and Ares Dynamic Credit Allocation Fund, Inc. (NYSE: ARDC) (“ARDC”); (ii) our non-listed, perpetual wealth vehicles that are primarily distributed through financial intermediaries, including ASIF, CADC, our open-ended European direct lending fund, our infrastructure private BDC, our non-traded real estate investment trusts (“REITs”) and Ares Private Markets Fund (“APMF”); (iii) Aspida Holdings Ltd. (together with its subsidiaries, “Aspida”); and (iv) certain other commingled funds and managed accounts that have an indefinite term, are not in liquidation, and for which there is no immediate requirement to return invested capital to investors upon the realization of investments. Perpetual Capital - Managed Accounts refers to managed accounts for single investors primarily in illiquid strategies that meet the perpetual capital criteria. Perpetual Capital - Private Commingled Funds refers to commingled funds that meet the perpetual capital criteria, not including our publicly-traded or perpetual wealth vehicles. Perpetual capital may be withdrawn by investors under certain conditions, including through an election to redeem an investor’s fund investment or to terminate the investment management agreement, which in certain cases may be terminated on 30 days’ prior written notice. In addition, the investment management or advisory agreements of certain of our publicly-traded and perpetual wealth vehicles have one year terms, which are subject to annual renewal by such vehicles;
•“realized income” or “RI”, a non-GAAP measure, is an operating metric used by management to evaluate performance of the business based on operating performance and the contribution of each of the business segments to that performance, while removing the fluctuations of unrealized income and losses, which may or may not be eventually realized at the levels presented and whose realizations depend more on future outcomes than current business operations. RI differs from income before taxes by excluding: (i) operating results of our Consolidated Funds; (ii) depreciation and amortization expense; (iii) the effects of changes arising from corporate actions; and (iv) unrealized gains and losses related to carried interest, incentive fees and investment performance; and adjusting for certain other items that we believe are not indicative of our operating performance. Changes arising from corporate actions include equity-based compensation expenses, the amortization of intangible assets, transaction costs associated with mergers, acquisitions and capital activities, underwriting costs and expenses incurred in connection with corporate reorganization. Placement fee adjustment represents the net portion of either expense deferral or amortization of upfront fees to placement agents that is presented to match the timing of expense recognition with the period over which management fees are expected to be earned from the associated fund for segment purposes but have been expensed in advance in accordance with GAAP. For periods in which the amortization of upfront fees for segment purposes is higher than the GAAP expense, the placement fee adjustment is presented as a reduction to RI;
•“SEC” refers to the Securities and Exchange Commission;
•2024 Senior Notes” refers to senior notes issued by a wholly owned subsidiary of Ares Holdings in October 2014 with a maturity in October 2024. On October 8, 2024, Ares Holdings repaid the 2024 Senior Notes at maturity;
•“2028 Senior Notes” refers to senior notes issued by the Company in November 2023 with a maturity in November 2028;
•“2030 Senior Notes” refers to senior notes issued by a wholly owned subsidiary of Ares Holdings in June 2020 with a maturity in June 2030;
•“2051 Subordinated Notes” refers to subordinated notes issued by a wholly owned subsidiary of Ares Holdings in June 2021 with a maturity in June 2051;
•“2052 Senior Notes” refers to senior notes issued by a wholly owned subsidiary of Ares Holdings in January 2022 with a maturity in February 2052; and
•“2054 Senior Notes” refers to senior notes issued by the Company in October 2024 with a maturity in October 2054.
Many of the terms used in this report, including AUM, FPAUM, FRE and RI, may not be comparable to similarly titled measures used by other companies. In addition, our definitions of AUM and FPAUM are not based on any definition of AUM or FPAUM that is set forth in the agreements governing the funds that we manage and may differ from definitions of AUM or FPAUM set forth in other agreements to which we are a party or definitions used by the SEC or other regulatory bodies. Further, FRE and RI are not measures of performance calculated in accordance with GAAP. We use FRE and RI as measures of operating performance, not as measures of liquidity. FRE and RI should not be considered in isolation or as substitutes for operating income, net income, operating cash flows, or other income or cash flow statement data prepared in accordance with GAAP. The use of FRE and RI without consideration of related GAAP measures is not adequate due to the adjustments described above. Our management compensates for these limitations by using FRE and RI as supplemental measures to our GAAP results. We present these measures to provide a more complete understanding of our performance as our management measures it.
Amounts and percentages throughout this report may reflect rounding adjustments and consequently totals may not appear to sum.
PART I
Item 1. Business
Overview
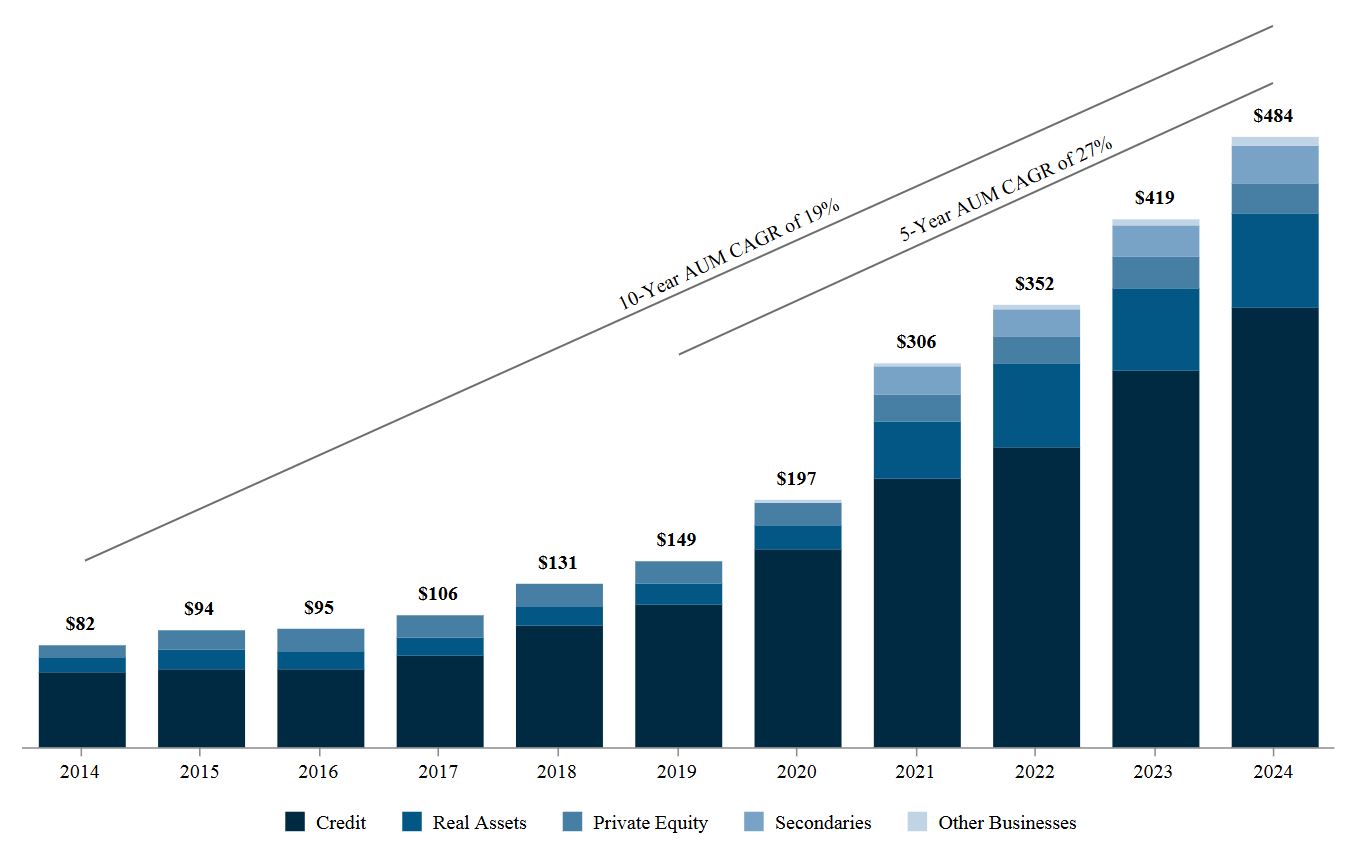
Ares is a leading global alternative investment manager with $484.4 billion of assets under management and over 3,200 employees in over 35 offices in more than 15 countries. We offer our investors a range of investment strategies and seek to deliver attractive performance to an investor base that includes approximately 2,700 direct institutional relationships and a significant retail investor base across our publicly-traded funds, sub-advised accounts and perpetual wealth vehicles. Since our inception in 1997, we have adhered to a disciplined investment philosophy that focuses on delivering strong risk-adjusted investment returns through market cycles. Ares believes each of its distinct but complementary investment groups in Credit, Real Assets, Private Equity and Secondaries is a market leader based on assets under management and investment performance. We believe we create value for our stakeholders not only through our investment performance, but also by expanding our product offerings, enhancing our distribution channels, increasing our global presence, investing in our non-investment functions, securing strategic partnerships and completing strategic acquisitions and portfolio purchases.
Our AUM has grown to $484.4 billion as of December 31, 2024 from $82.0 billion a decade earlier. As shown in the chart below, over the past five and ten years, our assets under management have achieved a compound annual growth rate (“CAGR”) of 27% and 19%, respectively ($ in billions):
We have an established track record of delivering strong risk-adjusted returns through market cycles. We believe our consistent and strong performance in a broad range of alternative investments has been shaped by several distinguishing features of our platform:
•Comprehensive Multi-Asset Class Expertise and Flexible Capital: Our proficiency at evaluating every level of the capital structure, from senior debt to common equity, across companies, structured assets, real estate projects, and infrastructure and energy assets enables us to effectively assess relative value. This proficiency is complemented by our flexibility in deploying capital in a range of structures and different market environments to maximize risk-adjusted returns.
•Differentiated Market Intelligence: Our proprietary research on over 55 industries and insights from a broad, global investment portfolio enable us to more effectively diligence and structure our products and investments.
•Consistent Investment Approach: We believe our rigorous, credit-oriented investment approach across each of our investment groups is a key contributor to our strong investment performance and ability to expand our product offering.
•Robust Sourcing Model: Our investment professionals’ local market presence and ability to effectively cross-source for other investment groups generates a robust pipeline of high-quality investment opportunities across our platform.
•Talented and Committed Professionals: We attract, develop and retain highly accomplished professionals who not only demonstrate deep and broad investment and non-investment expertise but also have a strong sense of commitment to our firm.
•Collaborative Culture: We share ideas, relationships and information across our investment groups, which enables us to more effectively source, evaluate and manage investments. We also leverage the OMG to help drive the efficiencies across the platforms and support our investment process.
Integrated Investment Platform and Process
We operate our firm as an integrated investment platform with a collaborative culture that emphasizes sharing of knowledge and expertise. We believe the exchange of information enhances our ability to analyze investments, deploy capital and improve the performance of our funds and portfolio companies. We have established deep and sophisticated independent research capabilities in over 55 industries and insights from investments in over 1,900 companies, over 1,750 alternative credit investments, over 555 properties, over 60 infrastructure assets and over 885 limited partnership interests.
Our investment process leverages the power of the Ares platform and an extensive network of professionals across our investment areas to identify and source attractive risk adjusted return opportunities while emphasizing capital preservation. We utilize our collective market and company knowledge, proprietary internal industry and company research, third-party information and financial modeling to drive fundamental credit analysis and investment selection. We are able to invest up and down a company’s capital structure, which we believe helps us capitalize on out-performance opportunities and assess relative value for a particular investment. The investment committees of our investment groups review and evaluate investment opportunities in a framework that includes a qualitative and quantitative assessment of the key risks of each investment. We do not have a centralized investment committee and instead our investment committees are structured with overlapping membership from different investment groups to ensure consistency of approach, shared investment experience and collaboration across our platform. Our extensive network of investment professionals includes local and other individuals based in our markets with the knowledge, experience and relationships that enable them to identify and take advantage of a wide range of investment opportunities. In addition, our investment vehicles have investment policies and procedures that generally contain requirements and limitations, such as concentrations of securities, industries, and geographies in which such investment vehicles will invest, as well as other limitations required by law.
•Credit: Our experienced team takes a value-oriented approach which, among other factors, considers industry and market analysis, technical analysis, fundamental credit analysis and in-house research to identify investments that offer attractive value in comparison to the perceived credit risk profile. We use our longstanding relationships, considerable scale, research, industry knowledge, structuring expertise and often our direct-origination capabilities to invest actively across capital structures with a focus on selecting the best risk-adjusted returns for our investors, while also seeking to provide our borrowers a valued capital solution. Each investment decision involves an intensive due diligence process that is generally focused on evaluating the target company or portfolio, as applicable, and its current and future prospects, its management team and industry, its ability to withstand adverse conditions and its capital structure, sponsorship and structural protection, among others.
On January 1, 2024, we changed our segment composition. The special opportunities strategy, historically part of the Private Equity Group, is now referred to as opportunistic credit and is presented within the Credit Group.
•Real Assets: With our experienced team, along with our expansive network of relationships, our Real Assets Group manages equity and debt strategies across real estate and infrastructure investments. Across our real estate equity and debt investment strategies, our team differentiates itself through its cycle-tested leadership, demonstrated performance across market cycles, access to real-time property market and corporate trends, and proven ability to create value
through a disciplined investment process. Our real estate activities are managed by equity and debt teams in North America and Europe, along with our vertically-integrated operating platform. These professionals collaborate frequently within and across strategies to enhance sourcing, exchange information to inform underwriting and leverage relationships to drive pricing power. Our real estate equity and debt teams have the flexibility to invest across the risk-return spectrum through core/core-plus, value-add and opportunistic investment strategies.
On December 1, 2024, Ares completed the acquisition of Walton Street Capital Mexico S. de R.L. de C.V. and certain of its affiliates (“WSM”) (the “WSM Acquisition”), a real estate asset management platform focused primarily on the industrial real estate sector in Mexico. The activities of WSM are presented within the Real Assets Group within our North American real estate equity strategy, which we renamed from U.S. real estate equity following the WSM Acquisition. The strategy name change did not result in any change to the historical composition of our segments.
The infrastructure strategy invests through both debt and equity in infrastructure assets and companies that provide essential services with stable cash flows and high barriers to entry. These investments typically demonstrate a lower correlation to public markets and may have inflation protections. Across our infrastructure opportunities and debt investment strategies, we have a long-tenured global team utilizing deep local sourcing capabilities and extensive sector experience to originate and manage a portfolio of diverse, high-quality investments across the globe. We have dedicated direct infrastructure opportunities and debt teams that collaborate to share market insights, support underwriting and enhance origination. Our infrastructure opportunities strategy focuses on value-add equity with a flexible mandate in climate infrastructure. Our infrastructure debt strategy targets global assets and businesses with defensive characteristics across the digital, transport, energy and utility sectors. Leveraging the established long-standing relationships, the strategy seeks to generate exclusive deal flow and high-quality investment opportunities.
•Private Equity: Our private equity investment professionals have deep domain expertise and a demonstrated ability to deploy capital across market environments, which allows them to be disciplined in their assessment of the best relative value opportunities and pursuit of attractive returns. We seek to be a private equity partner of choice to management teams and believe our partnership mentality and growth-oriented mindset helps well-position our portfolio companies for long-term success, whereby management teams gain access to our value creation expertise and extensive internal and external networks from diligence to exit. We believe our team’s continuity, significant industry and regional experience, accumulated knowledge of investing across market cycles and transaction types, along with our culture of collaboration, have been critical to our success.
•Secondaries: Our team invests in secondary markets across a range of alternative asset class strategies, including private equity, real estate, infrastructure and credit. Our secondary funds acquire interests across a range of partnership vehicles, including funds, multi-asset portfolios, single asset joint ventures, as well as build structured solutions to provide primary and secondary investors with flexible investment and exit options. These strategies involve the acquisition of interests from investors in existing funds as well as recapitalizing and restructuring the funds, including transactions that can address pending fund maturity, strategy change or the need for additional equity capital.
•Our other businesses include: (i) Ares Insurance Solutions (“AIS”); (ii) activities from our company sponsored SPAC that is formed for the purpose of effecting a merger, share exchange, asset acquisition, share purchase, reorganization or similar business combination; and (iii) a venture capital business with fund strategies that are focused on applied artificial intelligence, among others.
We also recognize the importance of what we consider material environmental, social and governance (“ESG”) factors in our investment process to help enable us to generate attractive risk-adjusted returns and have adopted a Responsible Investment Program for this purpose. We work collaboratively with our various underwriting, asset management, legal and compliance teams to appropriately integrate relevant ESG considerations into our investment process.
In addition, as part of our growth strategy, we from time to time engage in discussions with counterparties with respect to various potential strategic transactions, including investments in, and acquisitions of, other companies or assets. We incur significant expenses for the evaluation, due diligence investigation and negotiation of potential strategic transactions.
Breadth, Depth and Tenure of our Senior Management
Ares was built upon the fundamental principle that each of our distinct but complementary investment groups benefits from being part of our broader platform. We believe that our strong performance, consistent growth and high talent retention through economic cycles is due largely to the effective application of this principle across our broad organization of over 3,200 employees. The management of our operating businesses is currently overseen by our board of directors and managed by our
senior leadership. We have an Operating Committee comprised of leadership from our investment and business operations groups that meets regularly to discuss strategy and operational matters. We also have a Partners Committee comprised of senior leadership from across the firm that meets periodically to discuss our business, including investment and operating performance, fundraising, market conditions, strategic initiatives and other firm matters. Each of our investment groups is led by its own deep leadership team of highly accomplished investment professionals, who average approximately 25 years of investment experience in managing, advising, underwriting and restructuring companies. While primarily focused on managing strategies within their own investment group, these senior professionals are integrated within our platform through economic, cultural and structural measures. Our senior professionals have the opportunity to participate in the incentive programs of multiple investment groups to reward collaboration across our investment activities. This collaboration takes place on a daily basis and is formally promoted through internal systems and widely attended weekly or monthly meetings.
Human Capital
We believe that our people and our culture are the most critical strategic drivers of our success as a firm. Creating a welcoming and inclusive work environment with opportunities for growth and development is essential to attracting and retaining a high-performance team, which in turn is necessary to drive differentiated outcomes. We believe that our unique culture, which centers upon values of collaboration, responsibility, entrepreneurialism, self-awareness and trustworthiness makes Ares a preferred place for top talent at all levels to build a long-term career within the alternative investment management industry. To foster this culture, we invest heavily in our human capital efforts, including:
Talent Management: As of December 31, 2024, we had over 3,200 employees, comprised of over 1,100 professionals in our investment groups and over 2,100 operations management professionals, located in over 35 offices in more than 15 countries. We provide a comprehensive set of programs, policies and benefits to enable team members to thrive, grow and contribute to their highest potential.
•Governance and Policies: Ares is committed to providing a work environment in which all individuals act with integrity, and are treated with respect and dignity. Our equal opportunity employment, compliance, anti-harassment and anti-discrimination policies reinforce our culture.
•Recruiting and Onboarding: We pursue several strategic paths to hire top talent, including campus and lateral recruiting efforts. We prioritize making all new team members feel welcome and set them up for success through comprehensive onboarding training, ongoing touchpoints, and connections with our employee resource groups (“ERGs”), which are grassroots, employee-led, executive-sponsored groups and open to all team members. We seek feedback throughout the year to improve our recruiting and onboarding processes.
•Internship Training Program: Ares offers a formal internship program for students between their junior and senior years of college with the possibility of conversion to a full-time position in our analyst program upon graduation. Available roles span our investment and non-investment teams.
•Mentoring, Training and Employee Engagement: We provide formal and informal mentoring, learning and development, and employee engagement opportunities. We host frequent townhall meetings hosted by senior leadership and events to foster belonging. We also conduct anonymous firmwide surveys at least annually to evaluate employee morale, productivity and overall well-being.
•Education Sponsorship Program: Employees are encouraged to participate in degree programs, business-related seminars, workshops, ad-hoc academic courses, continued education seminars to maintain job-related licenses and other outside training courses to facilitate professional development.
•Internal Training and Development Programs: We continue to foster an environment that cultivates company and employee growth through educational programs focused on professional development, mandatory training and other learning opportunities that are offered in person or online. Our team is focused on the training and development of our employees and has invested in management development training for our leaders.
•Performance Management: We take a continuous feedback approach to performance management, encouraging leaders and team members to participate in goal setting and ongoing feedback discussions throughout the year. Our formal, firm-wide annual review process includes a self-assessment, a 360-degree feedback component, and round table discussions. Year-end evaluations are provided to employees by managers and include ratings to provide transparent feedback. In addition to the annual review, we also conduct mid-year performance reviews that are less formal and serve to evaluate progress against goals and as an opportunity to discuss specific career development
objectives that were identified in the annual assessment. Training is provided for each phase of our performance assessment process.
•Retention, Rewards and Recognition: We provide competitive compensation and benefits to: (i) attract and retain talent; (ii) align the incentives of our employees with our investors and stakeholders; and (iii) support our employees across many aspects of their lives. We also have programs that seek to recognize significant team member contributions at the firm level.
Environmental, Social and Governance: We believe that targeted ESG efforts are a part of our objective of delivering attractive investment returns to our investors. We pursue a strategy that is designed to mitigate risks and create value by seeking to address business-relevant ESG issues. Our strategy starts with a corporate sustainability program focused on our corporate operations and then scales through our Responsible Investment Program that focuses on our investment platform.
•Governance: We have defined three tiers of roles and responsibilities for our ESG integration process: (i) oversight responsibility; (ii) defining implementation; and (iii) driving implementation. The oversight responsibility tier is led by our Global Head of ESG and consists of our most-senior professionals and decision-making bodies, including our board of directors. Next, our dedicated ESG team is responsible for defining implementation steps and processes in partnership with respective investment teams and ESG champions embedded within each business line to adapt Ares’ approach to strategy-specific implementation steps. Finally, we focus on driving implementation utilizing strategy-specific processes. Investment professionals, including our portfolio management teams, seek to execute ESG-related tasks for select investments and scalability of our approach.
•Responsible Investment Program: Our Responsible Investment Program describes our ESG integration and management processes. We believe our approach to integrating and managing what we consider to be material ESG considerations in the investment process can help manage risk, shape the long-term growth and performance of our investments and enable value creation opportunities. We aim to engage portfolio companies and assets to address business-relevant risks and opportunities and act responsibly towards stakeholders in line with our fiduciary duties.
•Reports and Disclosures: Our annual Sustainability Report communicates Ares’ corporate and strategy-specific progress and select highlights of our sustainability efforts. Additionally, where appropriate, we aim to engage with industry organizations to help shape emerging areas of ESG practice. Our Sustainability Disclosures supplement our annual Sustainability Report and are aligned with applicable Sustainability Accounting Standards Board (“SASB”) Standards and also considers the Global Reporting Initiative (“GRI”) Standards. We also publish our annual Climate Action Report aligned with the Taskforce on Climate-related Financial Disclosures (“TCFD”) recommendations. We believe the TCFD recommendations provide a useful framework to increase transparency on climate-related risks and opportunities within financial markets.
Diversity, Equity and Inclusion: We consider diversity, equity and inclusion (“DEI”) in connection with various talent processes and global business practices. Our human resources function, our global DEI Council, our DEI team and business leaders across the Ares platform work in partnership to implement a strategic framework to attract, engage and develop diverse talent within a welcoming environment, as well as to support DEI efforts in select investments and through our broader involvement in our communities.
•People and Culture: As part of our ongoing effort to foster a culture built on apprenticeship, we support the growth and advancement of talent through various mentorship and professional development programs. In line with our continued commitment to support an environment where all team members experience a genuine sense of belonging, we hold educational trainings and employee engagement events, often in partnership with our 14 employee communities that help to support our DEI strategy and recognize the different cultures, backgrounds and experiences of our employees. To create more transparency, we also aim to conduct periodic reviews with business leadership to assess our people and strategies to enable the long-term success of talent at Ares. In addition, as part of our commitment to equitable pay for all employees, we monitor and assess total compensation to help ensure we have alignment with role responsibilities and contributions.
•Business Processes and Investment Platform: We seek to embed DEI best practices into our business and investment diligence processes in an effort to drive innovation and returns. We have identified DEI champions within each investment group to help develop strategies for their asset class and integrate DEI considerations into the investment lifecycle, as appropriate. We also partner with select Ares private equity portfolio companies to understand their DEI efforts.
•Communities: We partner with organizations to foster diversity within our communities and promote corporate citizenship through charity and volunteerism. In partnership with our ERGs, we donated to various community organizations.
Health and Wellness: We believe that healthy team members are more productive, and we invest heavily in benefits and initiatives to support our working families. In addition to medical, dental, vision, life insurance, disability insurance and retirement benefits, we provide generous primary and non-primary caregiver leave, domestic partner health and life insurance, adoption and reproductive assistance, family care resources (including back-up care benefits and baby baskets for new parents) and mental health benefits. We also provide employees with access to a medical advisory team and concierge service at no cost to help them navigate complex health situations and concerns. We also host several wellness-related events throughout the year on topics such as nutrition and stress management.
Flexibility: We believe that our culture benefits from people collaborating in-person in our offices, while also recognizing the value of flexibility. We are committed to providing flexibility to our employees, and in 2024, we continued to offer business group flexibility frameworks as well as our summer “Work From Anywhere” program, which allows people to work virtually for up to a maximum of three weeks. We will continue to offer a flexible working structure in 2025, while evaluating the ongoing effectiveness and determining what works best for our organization.
Philanthropy: We strive to be a force for good and to be a leader in our approach to giving and engagement. Our core values are to be collaborative, responsible, entrepreneurial, self-aware and trustworthy. These core values motivate us to seek innovative yet practical solutions to some of society’s most pressing concerns. Empathy and compassion guide our approach to “doing good” such that our charitable efforts aim to help improve people’s quality of life. Philanthropy at Ares includes:
•Ares Charitable Foundation (the “Ares Foundation”): A 501(c)(3) qualifying organization sponsored by the firm, the Ares Foundation, launched in 2021, envisions a world in which people have access to the financial knowledge, resources and opportunities needed to achieve their full potential and chart pathways to self-sufficiency.
The Ares Foundation funds initiatives that help provide career preparation and reskilling, encourage entrepreneurship and deepen individuals’ understanding of personal finance. This includes support for the design, pilot and scale up of new approaches that encourage innovation to help close the wealth gap in the communities where the firm does business. Moreover, the Ares Foundation undertakes research and special initiatives intended to inform both the philanthropic sector and policy.
In addition, the Ares Foundation Learning Communities support grantees through knowledge-building and exchange to complement the funding they receive. These communities of practice help organizations establish aligned networks, develop knowledge to inform their work and build organizational capacity for innovation by accessing support from other funders. The year-long, cohort experience explores topics like measurement, evaluation and storytelling.
Guided by the belief that as the firm thrives, so should our communities and our society, Ares is committed to donating a portion of our annualized, realized net performance income from select Ares funds to tie investment performance to social impact.
•Pathfinder and Other Funds: In addition, Ares committed to donate a minimum of 10% of the carried interest generated from Ares Pathfinder Fund, L.P. (“Pathfinder I”) and Ares Pathfinder Fund II, L.P. (“Pathfinder II”) and 5% of the incentive fees generated from an open-ended core alternative credit fund to global health and educational charities, contributed by the firm and our team members.
•Ares in Motion (“AIM”): Our signature platform for employee engagement has empowered our team members to support local communities and nonprofit organizations since 2012. AIM engages employees in grassroots volunteerism, encourages their service with nonprofit boards and other pro bono opportunities, and amplifies their personal donations with charitable matches. Furthermore, employees who volunteer as AIM Champions enjoy opportunities to organize and lead volunteer activities in the U.S., Europe and Asia-Pacific (“APAC”) to benefit the communities in which they live and work.
Our annual Summer of Service engages Ares employees around the world in both service and skills-based “give back” opportunities. In addition, our nonprofit board training and placement program provides a way for team members to make a difference in their communities beyond firm-sponsored volunteer activities. AIM also helps bring our team members into thoughtful dialogue with nonprofit leaders through virtual fireside chat events so that employees can
learn more about their organizations, understand the purpose and significance of their work, and glean valuable insights to apply professionally and personally.
Furthermore, we leverage AIM to sponsor and match team members’ support of charitable causes like disaster relief, mental health, and education. In addition, we offer matching funds to augment team members’ sponsorship of nonprofits’ mission-driven events. The firm also sponsors these kinds of events through our business lines, and offers opportunities for employees to participate in these funded activities.
2024 Highlights
Fundraising
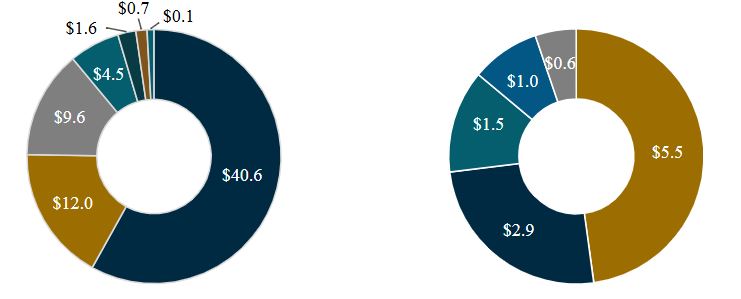
In 2024, we raised $92.7 billion in gross new capital commitments for more than 185 different investment vehicles. Of the $92.7 billion, $70.4 billion was raised directly from over 660 institutional investors, of which over 310 were new to Ares, and $22.3 billion was raised through intermediaries. The charts below summarize our gross new capital commitments by investment group and strategy ($ in billions):
| | | | | | | | | | | | | | | | | | | | |
| Credit: $69.1 | | | | Real Assets: $11.5 | |
| | | | | | | | | | | | | | | | | | | | | | | | | | | | | | | | | | | | | | | | | | | | | | | | | | | | | |
| U.S. Direct Lending | | European Direct Lending | | Liquid Credit | | Alternative Credit | | | | | | Real Estate Debt | | North American Real Estate Equity | | European Real Estate Equity |
| | | | | | | | | | | | | | | | | |
| Opportunistic Credit | | APAC Credit | | Other | | | | | | | | Infrastructure Debt | | Infrastructure Opportunities | | |
| | | | | | | | | | | | | | | | | |
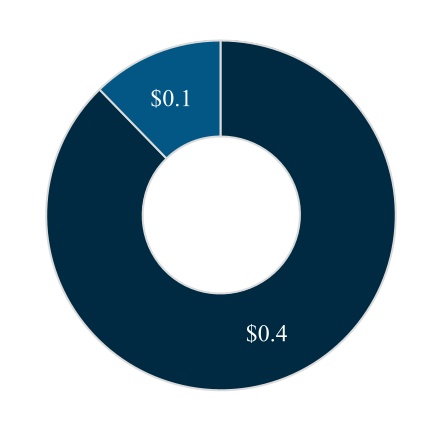
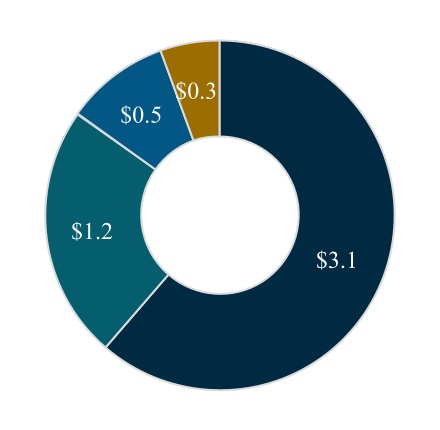
| Private Equity: $0.5 | | | Secondaries: $5.1 | |
| | | | | | | | | | | | | | | | | | | | | | | | | | | | | | | | | | | | | | | | | | | | | | | |
| | | | Corporate Private Equity | | Other | | | | | | | Private Equity Secondaries | | Infrastructure Secondaries |
| | | | | | | | | | | | | | | |
| | | | | | | | | | | | | Credit
Secondaries | | Real Estate Secondaries |
The chart below summarizes gross new capital raised from existing and new direct institutional investors for the year ended December 31, 2024:
| | | | | | | | | | | | | | | | | | | | |
| | Existing -
Re-Up | | Existing - New Product | | New |
In 2024, 85% of our fundraising from direct institutional investors was from existing investors that either committed to a new product or re-upped their commitment to a subsequent fund vintage within the same product. We believe the fundraising from existing investors demonstrates our investors’ satisfaction with our performance, disciplined management of their capital and diverse product offering.
Capital Deployment
In 2024, we invested $106.7 billion across our diverse global platform as shown in the following charts ($ in billions):
| | | | | | | | | | | | | | |
| Credit $87.6 | | Real Assets: $9.8 | |
| | | | | | | | | | | | | | | | | | | | | | | | | | | | | | | | | | | | | | | | | | | | | | | |
| U.S. Direct Lending | | Alternative Credit | | European Direct Lending | | Liquid Credit | | | North American Real Estate Equity | | Real Estate Debt | | Infrastructure Debt | |
| | | | | | | | | | | | | | | |
| Opportunistic Credit | | APAC Credit | | Other | | | | | European Real Estate Equity | | Infrastructure Opportunities | | | |
| | | | | | | | | | | | | | | | | |
| Private Equity: $0.4 | |
| Secondaries: $5.1 |
|
| | | | | | | | | | | | | | | | | | | | | | | | | | | | | | | | | | | | | | |
| | | Corporate Private Equity | | APAC Private Equity | | | | | Private Equity Secondaries | | Real Estate Secondaries |
| | | | | | | | | | | | |
| | | | | | | | | | Infrastructure Secondaries | | Credit
Secondaries |
Of the $106.7 billion invested, $50.1 billion was from our drawdown funds. Our capital deployment in drawdown funds was comprised of the following ($ in billions):
| | | | | | | | | | | | | | | | | | | | | | | | | |
| Credit | | Real Assets | | Private Equity | | Secondaries | | |
Investment Groups
Each of our investment groups employs a disciplined, credit-oriented investment philosophy and is managed by a seasoned leadership team of senior professionals with extensive experience investing in, advising and underwriting assets held by our funds.
(1)As of December 31, 2024, AUM amounts include vehicles managed by Ivy Hill Asset Management, L.P., a wholly owned portfolio company of ARCC and an SEC-registered investment adviser (“IHAM”).
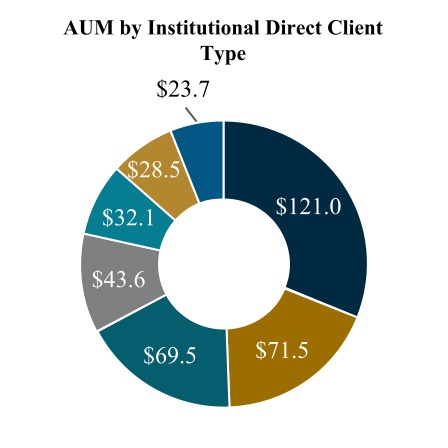
(2)$71.5 billion in AUM represents investments by insurance companies in various Ares’ funds, SMAs and co-investments versus one discrete insurance platform.
Credit Group
Through our Credit Group, we serve as one of the largest managers of credit strategies across the non-investment grade credit universe, with $348.8 billion of AUM and over 280 funds as of December 31, 2024. The Credit Group provides solutions for investors seeking to access a wide range of credit assets, including liquid credit, alternative credit and direct lending products. The Credit Group capitalizes on opportunities across traded and non-traded corporate and consumer debt across the U.S. and European markets, providing investors access to directly originated fixed and floating rate credit assets along with the ability to capitalize on illiquidity premiums across the credit spectrum. Our U.S. and European direct lending strategies are among the largest in their respective markets.
The Credit Group offers the following credit strategies across the liquid and illiquid spectrum:
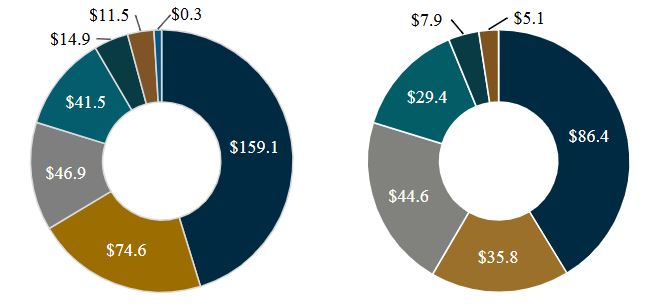
Liquid Credit: Our liquid credit investment solutions help fixed income investors access the syndicated loan and high yield bond markets in North America and Europe and capitalize on opportunities across multi-asset credit. The syndicated loans strategy focuses on evaluating individual credit opportunities related primarily to non-investment grade senior secured loans and primarily targets first lien senior secured loans, with a secondary focus on second lien senior secured loans and subordinated and other unsecured loans. The high yield bond strategy seeks to deliver a diversified portfolio of liquid, traded non-investment grade corporate bonds, including secured, unsecured and subordinated debt instruments. Multi-asset credit is a “go anywhere” strategy designed to offer investors a flexible solution to global credit investing by allowing us to tactically allocate between multiple asset classes in various market conditions. As of December 31, 2024, our liquid credit team of over 45 investment professionals managed $46.9 billion of AUM in over 115 funds and separately managed accounts (“SMAs”).
Alternative Credit: Our alternative credit strategy seeks to capitalize on asset-focused investment opportunities that fall outside of traditional, well-defined markets such as corporate debt, real estate and private equity. As of December 31, 2024, our alternative credit team of over 75 professionals managed $41.5 billion of AUM in over 25 private funds and SMAs for a global investor base. Our alternative credit strategy emphasizes downside protection and capital preservation through a focus on investments that tend to share the following key attributes: asset security, covenants, cash flow velocity and other features designed to capture value and minimize risk to principal. Our investment approach is designed to capture and create value by including our firm’s platform insights to assess risk and relative value.
Opportunistic Credit: Our opportunistic credit strategy seeks to invest in middle market companies that need flexible capital solutions, primarily in the form of debt and preferred equity and to a lesser extent, common equity. We partner with healthy, stressed and distressed companies across North America and Europe, operating in the void between traditional senior private debt and private equity. We seek to consistently invest in private market opportunities and, when deemed attractive, flex into stressed public markets, often seeking to leverage a public investment into a private follow-on opportunity. As of December 31, 2024, our opportunistic credit team of over 30 investment professionals managed $14.9 billion of AUM in four funds as of December 31, 2024. Our special opportunities strategy, formerly part of the Private Equity Group, was integrated into the Credit Group in 2024 to form the foundation for our opportunistic credit strategy.
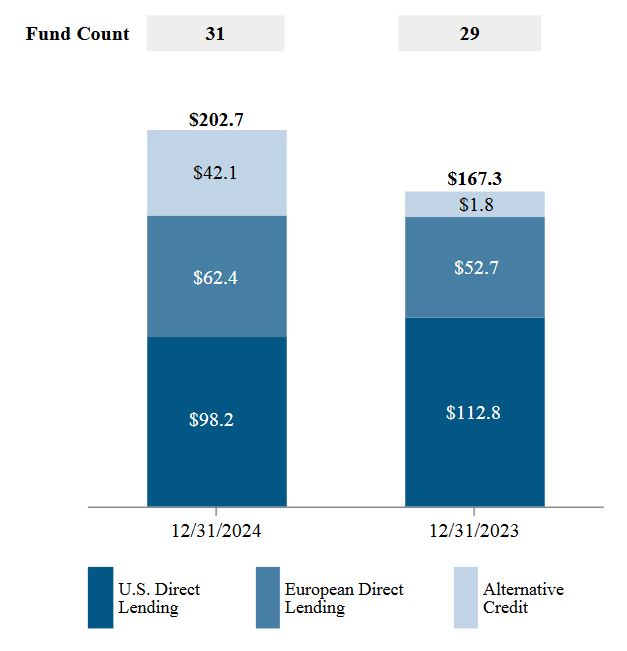
Direct Lending: Through our direct lending strategy, we serve as one of the largest self-originating direct lenders to the U.S. and European markets, with $233.7 billion of AUM in over 115 funds and investment vehicles, including more than 40 SMAs, as of December 31, 2024. We manage various types of direct lending vehicles within our U.S. and European direct lending teams including commingled funds, SMAs for large institutional investors seeking tailored investment solutions and joint venture lending programs.
Our direct lending team has a multi-channel origination strategy designed to address a broad set of investment opportunities in the middle market. We focus on being the lead or sole lender to our portfolio companies which we believe allows us to exert greater influence over deal terms, capital structure, documentation, fees and pricing, while securing our position as a preferred source of financing for our transaction partners. The team maintains a flexible investment strategy with the capability to invest in first lien senior secured loans (including “unitranche” loans which are loans that combine senior and subordinated debt, generally in a first lien position), second lien senior secured loans, subordinated debt, preferred equity and non-control equity co-investments in middle market companies.
U.S. Direct Lending: Our U.S. direct lending team is comprised of over 225 investment professionals that cover more than 565 financial sponsors and provide a wide range of financing solutions to middle market companies that typically range from $10 million to over $500 million in earnings before interest, tax, depreciation and amortization (“EBITDA”). As of December 31, 2024, our U.S. direct lending team and its affiliates managed $159.1 billion of AUM in over 80 funds and investment vehicles. Primary areas of focus for our U.S. direct lending teams include:
•Ares Capital Corporation: ARCC is a leading specialty finance company focused on providing direct loans to and making other investments in middle market companies in the U.S. ARCC has elected to be regulated as a BDC and was the largest publicly-traded BDC by market capitalization in the U.S. as of December 31, 2024.
•Ares Strategic Income Fund: ASIF is a closed-end investment company focused primarily on providing direct loans to private market companies in the U.S., and to a lesser extent, broadly syndicated loans and other more liquid credit opportunities, including in publicly-traded debt instruments. ASIF has elected to be regulated as a BDC.
•U.S. Commingled Funds and SMAs: Outside of ARCC and ASIF, U.S. direct lending also generates fees from other funds, including commingled funds which focus on: (i) first lien senior secured loans to middle market companies; (ii) junior debt investments in upper middle market companies; (iii) flexible capital to sports leagues and teams, sports industry related companies and entertainment companies; (iv) flexible capital to commercial-stage specialty healthcare companies; and (v) asset-based loans to middle market and specialty finance companies.
European Direct Lending: Our European direct lending team is comprised of over 90 investment professionals, with the ability to invest across the capital structure and across several geographies in Europe. The team covers over 395 financial sponsors, offers self-originated, flexible and scaled debt capital predominantly to companies with EBITDA typically ranging from €10 million to over €250 million. As of December 31, 2024, our European direct lending team managed $74.6 billion of AUM in over 35 funds, including commingled funds and SMAs. Our European team also manages an open-ended fund that primarily invests in directly originated, senior secured, floating-rate loans to European companies. Our open-ended European direct lending fund provides investors the opportunity to generate attractive current income and increased portfolio diversification.
APAC Credit: Our APAC credit team manages credit and special situations investments in the APAC region. Our APAC special situations strategy focuses on primary and secondary special situations, primarily targeting restructuring-related situations, deep value acquisitions and distressed financing. Our APAC private credit strategy targets privately sourced loans in high quality businesses across the region. APAC credit primarily employs a direct origination model and aims to provide flexible capital solutions to its investee companies and compelling risk-reward investment opportunities to our investors. As of December 31, 2024, our APAC credit team of over 70 investment professionals managed $11.5 billion of AUM in over 15 funds and related co-investment vehicles.
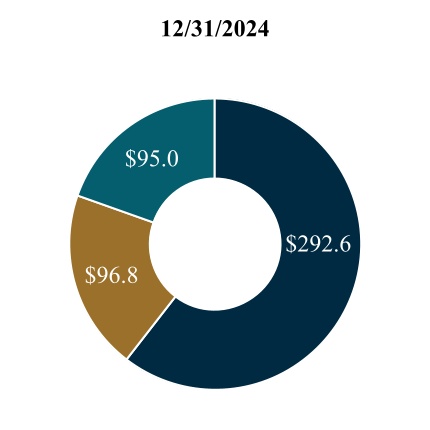
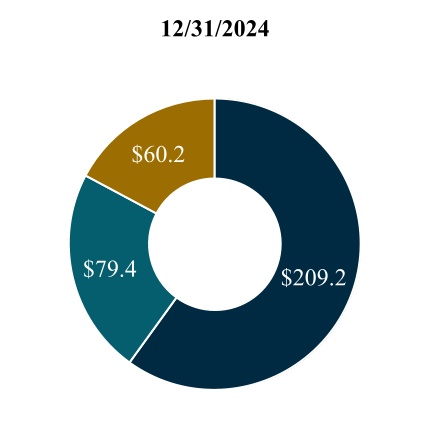
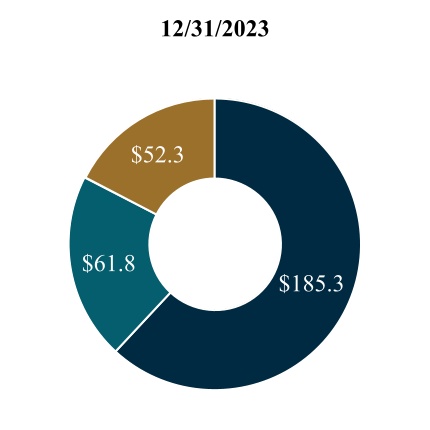
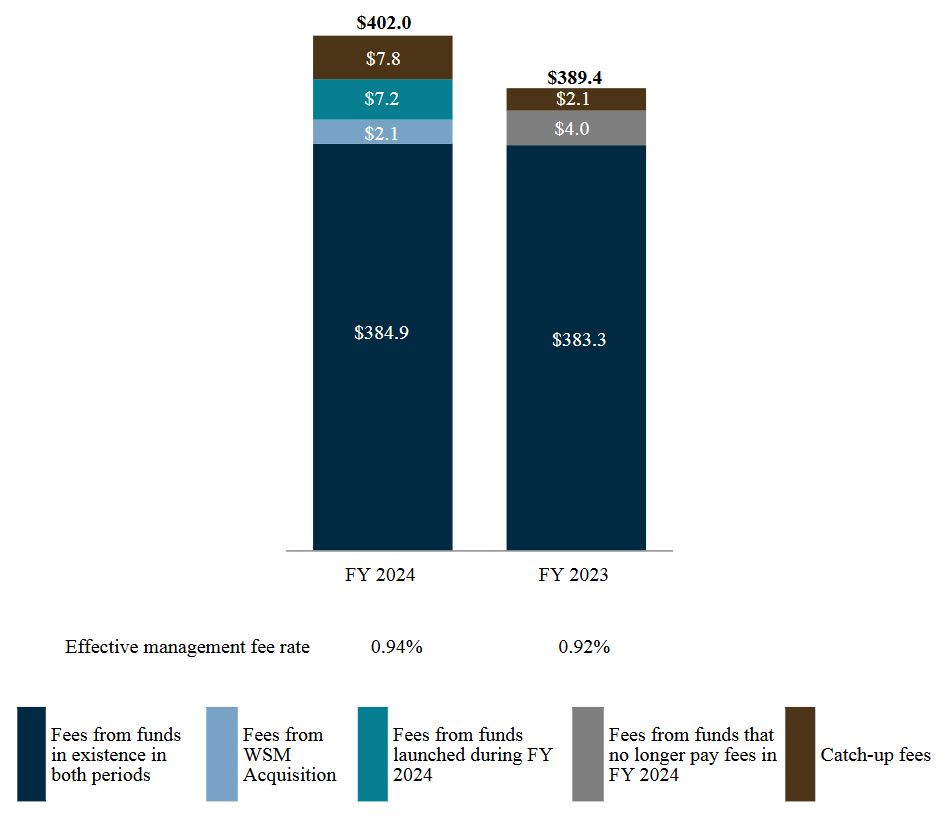
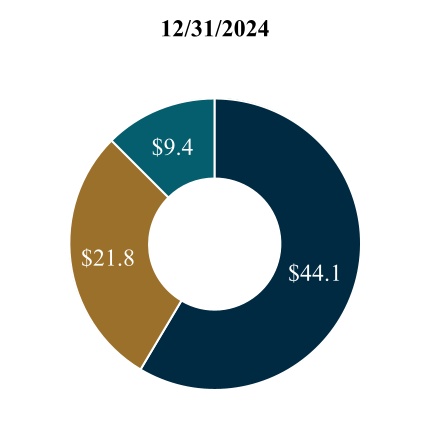
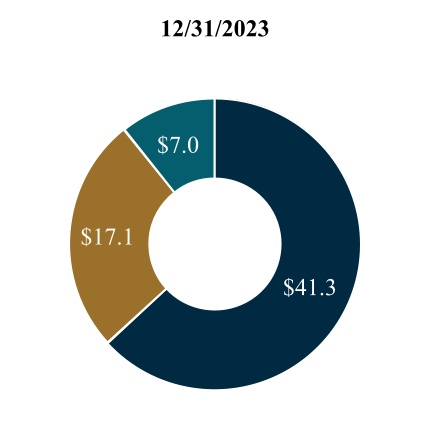
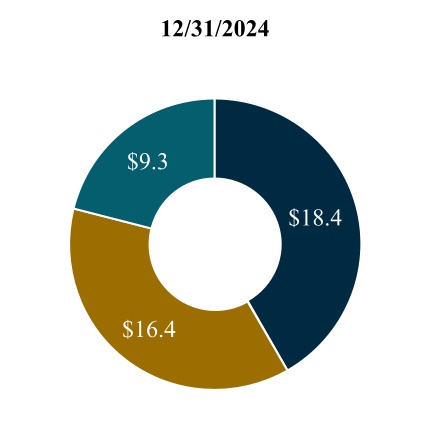
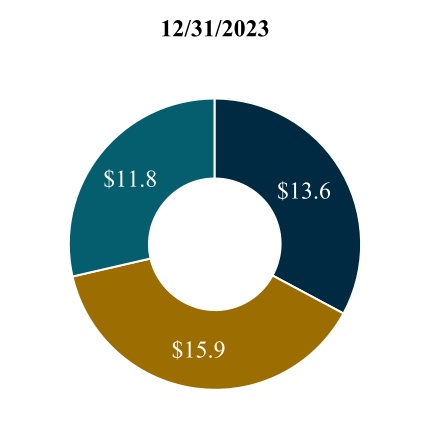
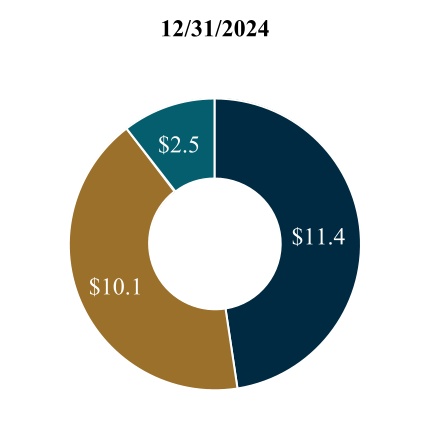
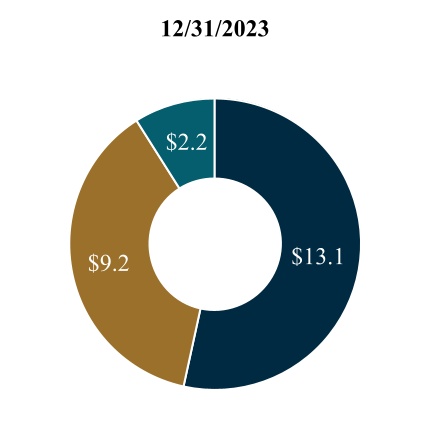
The following charts present the Credit Group’s AUM and FPAUM as of December 31, 2024 by investment strategy ($ in billions):
| | | | | | | | | | | | | | | | | | | | | | | | | | | | | | | | | | | | | | | | | |
| U.S. Direct Lending | | European Direct Lending | | Liquid Credit | | Alternative Credit | | Opportunistic Credit | | APAC Credit | | Other |
Real Assets Group
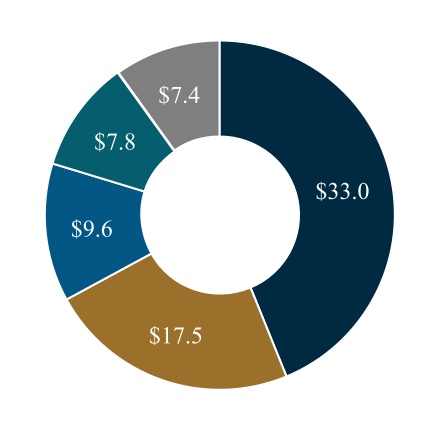
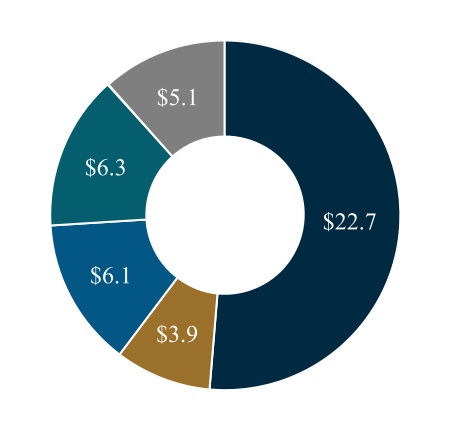
Our Real Assets Group manages comprehensive public and private equity and debt strategies with $75.3 billion of AUM in over 80 investment vehicles as of December 31, 2024. With our experienced team, along with our expansive network of relationships, our Real Assets Group capitalizes on opportunities in equity and debt investing across real estate and infrastructure investment strategies.
Real Estate: Our real estate strategies encompass equity and debt across core, value-add and opportunistic strategies in North America and Europe. We provide investors access to our real estate investment capabilities through several vehicles: closed-end North American and European multi-sector equity funds, an open-ended industrial real estate fund, open-ended U.S. and European debt funds, SMAs, our diversified non-traded REIT, our industrial non-traded REIT and our publicly-traded commercial mortgage REIT, ACRE. Our regional teams have local expertise and relationships and plug into Ares’ global network to gain insights into the companies and industries that are often the tenants in our buildings or are driving commercial activity in the markets where we invest. Our real estate portfolio is primarily allocated to industrial, multifamily and adjacent sectors. As we manage strategies across the return spectrum, capital stack and across geographies, we provide our investors with a full range of solutions and access to the widest set of opportunities sourced by our team. Our real estate platform has achieved significant scale over time through both organic fundraising efforts as well as various acquisitions.
Real Estate Equity: Our real estate equity team, with over 255 investment professionals, has extensive real estate private equity experience in North America and Europe. Our team primarily acquires standing assets and improves them through renovating, repositioning and retenanting and selectively developing assets in supply-constrained markets. As of December 31, 2024, our real estate equity team managed $40.8 billion of AUM in over 45 investment vehicles. Primary areas of focus for our real estate equity teams include:
•Real Estate Core/Core-Plus: Our U.S. core/core-plus real estate strategy focuses on the acquisition of assets with strong long-term cash flow potential and durable tenancy diversified across end-user industries and geographies. We deploy capital across all major property types, with a strong focus on industrial and multifamily assets located in top-tier primary and regional distribution markets across the U.S.
•Real Estate Value-Add: Our North American and European value-add real estate strategy focuses on undermanaged and underfunded income-producing assets across various property sectors in North America and Europe. The strategy seeks to create value and generate stable and growing distributions to investors by buying properties at attractive valuations, implementing asset management initiatives to increase income and identifying multiple exit strategies upfront.
•Real Estate Opportunistic: Our North American and European opportunistic real estate strategy capitalizes on increased investor demand for developed and stabilized assets by focusing on the repositioning of assets, capitalization of distressed and special situations, and risk-mitigated developments across all major property types, as well as select and adjacent sectors, across North America and Europe.
Real Estate Debt: Our real estate debt team, with over 40 professionals, primarily focuses on directly originating a wide range of financing opportunities in the U.S. and Europe. As of December 31, 2024, our real estate debt team managed $17.5 billion of AUM globally through open-ended funds, SMAs and ACRE. By investing through multiple investment vehicles, our real estate debt team has the ability to provide flexible financing across the capital structure and risk-return spectrum, including core/core-plus, value-add, and opportunistic debt. While our real estate debt strategy focuses predominantly on directly originated transactions, we also have the ability to selectively pursue secondary market acquisitions and syndicated transactions.
Infrastructure: Our long-tenured global infrastructure team seeks to utilize its strong local sourcing capabilities and extensive sector experience to originate and manage diverse, high-quality infrastructure investments across the globe and, as of December 31, 2024, managed $17.0 billion of AUM in more than 20 investment vehicles.
Infrastructure Opportunities: Our infrastructure opportunities team consists of over 30 investment professionals and managed $7.4 billion of AUM in more than ten investment vehicles as of December 31, 2024. We seek to utilize a broad origination strategy, flexible investment approach, and leverage industry relationships and the Ares platform to build a portfolio of high-quality climate investments and deliver attractive risk-adjusted returns. We believe our experience as value-add investors, flexible approach, and broad infrastructure experience positions us well to take advantage of the growing opportunity set across the climate infrastructure market. Our infrastructure opportunities team also manages an infrastructure private BDC,
which primarily invests in stable, operating infrastructure assets that provide current income in a perpetual, semi-liquid and tax-efficient structure.
Infrastructure Debt: Our global infrastructure debt team consists of over 25 investment professionals and sources assets and businesses across regions with defensive characteristics across the digital, transport, energy and utility sectors. As of December 31, 2024, our global infrastructure debt team managed $9.6 billion of AUM in ten investment vehicles. We employ a direct origination and tailored structuring approach to provide borrowers with flexible financing solutions. We aim to deliver attractive risk adjusted returns focused on cash yield by targeting infrastructure debt investments with defensive characteristics that have the potential to perform across different market cycles. Our structuring experience helps enhance cash yield and reduce downside risks in a core asset class.
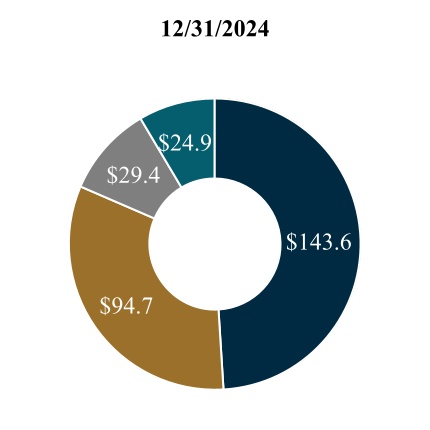
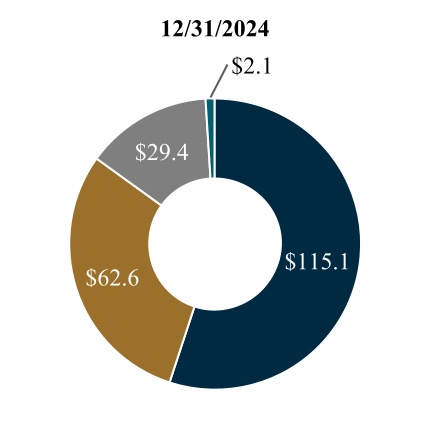
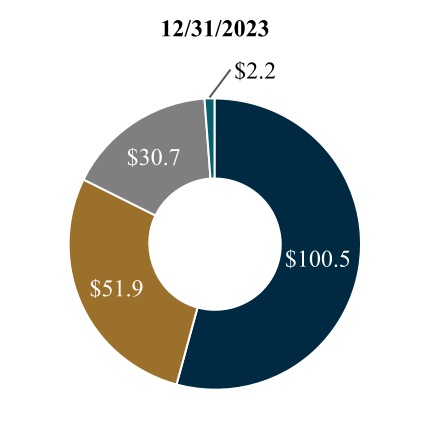
The following charts present the Real Assets Group’s AUM and FPAUM as of December 31, 2024 by investment strategy ($ in billions):
| | | | | | | | | | | | | | | | | | | | | | | | | | | | | |
| North American Real Estate Equity | | Real Estate Debt | | Infrastructure Debt | | European Real Estate Equity | | Infrastructure Opportunities |
Private Equity Group
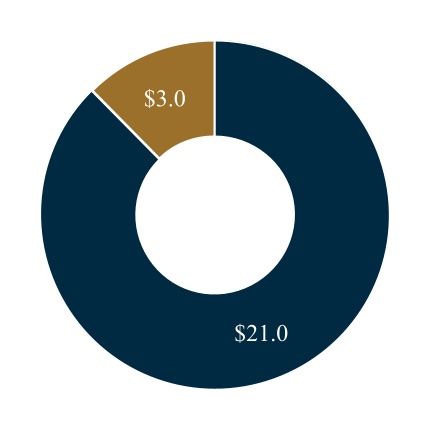
Our Private Equity Group has achieved compelling investment returns for limited partners and, as of December 31, 2024, managed $24.0 billion of AUM in over 60 funds. The group broadly categorizes its investment strategies into corporate private equity, which focuses on investments in North America and Europe, and APAC private equity, which focuses on investments in the APAC region.
Corporate Private Equity: Our team consists of over 50 investment professionals based primarily in Los Angeles and London. Our private equity funds are leaders in the North American and European middle market, where they focus on growth buyouts, with the ability to flex into distressed investing during periods of market transition and dislocation. We seek to invest in high-quality middle market companies in our core industries of healthcare, services, industrials and consumer where we can utilize the team’s extensive growth-oriented investing experience and dedicated value creation system to target attractive returns across market environments. This differentiated strategy, together with the broad resources of the Ares platform, widens our universe of potential investment opportunities and allows us to remain active across various market environments.
APAC Private Equity: Our APAC private equity strategy focuses on investing in seven key consumer categories that we believe benefit disproportionately from higher disposable income levels. The strategy focuses on primarily pursuing structured growth equity investments in control, joint control and minority ownership formats. Our APAC private equity team consists of over 25 investment professionals as of December 31, 2024 and focuses on investing in companies that give us exposure to increasing consumer spending and urbanization in our target markets. In times of economic dislocation, we also seek to invest opportunistically where the focus is on dislocations and catalysts that lead to high-quality assets becoming available for purchase at deeply discounted prices. While we look for deep value opportunities in consumer-driven companies, our deep value approach can develop into asset-oriented opportunities.
The following charts present the Private Equity Group’s AUM and FPAUM as of December 31, 2024 by investment strategy ($ in billions):
| | | | | | | | | | | | | |
| Corporate Private Equity | | APAC Private Equity | | |
Secondaries Group
Our Secondaries Group invests in secondary markets primarily in North America and across a range of alternative asset class strategies, including private equity, real estate, infrastructure and credit. As of December 31, 2024, our team manages $29.2 billion of AUM in over 85 funds. Our team has a track record of innovation through customized transaction solutions tailored to meet the needs of limited partners and general partners. We have established ourselves among the most active secondary investors engaged in recapitalizing and restructuring existing limited partnership interests in funds with a focus on transactions that can address pending fund maturity, strategy change or the need for additional equity capital.
Private Equity Secondaries: The private equity secondaries strategy seeks to achieve attractive secondary cash flow and diversification characteristics by investing across the spectrum of private equity secondaries transactions. As of December 31, 2024, our private equity secondaries team of more than 35 investment professionals managed $15.8 billion of AUM in over 40 funds and related co-investment vehicles. We continue to maintain a differentiated investment strategy that utilizes our skills in fundamental manager and portfolio analysis, our quantitative research capabilities and the support and insights from the wider Ares platform with the aim to generate strong risk-adjusted returns. Our private equity secondaries team also manages APMF. APMF invests in an actively managed portfolio of private equity and other private assets across the spectrum of private equity secondaries transactions.
Real Estate Secondaries: As of December 31, 2024, our real estate secondaries team of more than 20 investment professionals managed $7.8 billion of AUM in over 30 funds and related co-investment vehicles. Our real estate secondaries team acquires interests and provides secondary solutions across a range of partnership vehicles, including private real estate funds, multi-asset portfolios and single property joint ventures. Our team seeks broad diversification by property sector and geography and to drive investment results through underwriting, transaction structuring and portfolio construction.
Infrastructure Secondaries: The infrastructure secondaries strategy seeks to accelerate the benefits of traditional infrastructure by providing diversified low risk exposure through preferred structure, traditional limited partnership and general partner led continuation vehicle transactions. As of December 31, 2024, our infrastructure secondaries team of more than ten investment professionals managed $3.7 billion of AUM in more than ten funds and related co-investment vehicles. Our team focuses on achieving diversification through building a portfolio that provides inflation protection and exposure to uncorrelated assets.
Credit Secondaries: Our credit secondaries strategy seeks to create a highly diversified portfolio of primarily senior secured private credit interests across North America and Europe, acquired directly or indirectly through secondary market transactions. As of December 31, 2024, our credit secondaries team of more than ten investment professionals managed $1.9 billion of AUM in three funds and related co-investment vehicles. Our team represents a combination of our credit and
secondaries capabilities, leveraging extensive industry experience and a cycle-tested investment approach that enable us to identify attractive risk-adjusted opportunities.
The following charts present the Secondaries Group’s AUM and FPAUM as of December 31, 2024 by investment strategy ($ in billions):
| | | | | | | | | | | | | | | | | | | | | | | | | | | | |
| | Private Equity Secondaries | | Real Estate Secondaries | | Infrastructure Secondaries | | Credit
Secondaries | | |
Other Businesses
Certain operating segments and growth opportunities have not reached the scale and magnitude to be presented individually; therefore, we present the results for these businesses collectively. These strategies seek to expand our reach in new global markets and include AIS, our SPAC business and our venture capital business.
Ares Insurance Solutions: AIS is Ares’ dedicated, in-house team that provides solutions to insurance clients including asset management, capital solutions and corporate development. AIS strives to provide insurers with attractive risk and capital adjusted return profiles that fit within regulatory, rating agency and other counterparty guidelines. Leveraging over 1,100 investment professionals across the firm’s investment groups, AIS creates tailored investment solutions that meet the unique objectives of our insurance clients. AIS is overseen by an experienced management team with direct insurance industry experience in many areas directly applicable to AIS and our insurance company clients. Members of the Ares team have previously held senior positions at leading insurers. AIS acts as the dedicated investment manager, capital solutions and corporate development partner to Aspida Life Insurance Company and Aspida Life Re Limited (collectively referred to as “Aspida”), which are insurance companies that focus on the U.S. life and annuity insurance and reinsurance markets, respectively. AIS manages $18.7 billion of AUM as of December 31, 2024, of which $12.3 billion is sub-advised by Ares vehicles and included within other strategies.
Ares Acquisition Corporation II: Ares Acquisition Corporation II (NYSE: AACT) (“AAC II”) is a SPAC sponsored by Ares and formed in 2021 for the purpose of effecting a merger, share exchange, asset acquisition, share purchase, reorganization or similar business combination. AAC II is seeking to pursue an initial business combination target in any industry or sector in North America, Europe or Asia.
Venture Capital: Our venture capital business is focused on fund strategies that seek to advance proprietary artificial intelligence solutions and to partner with industry leading vendors to help drive efficiencies for our portfolio companies, assets and certain investment and business processes.
The following charts present Other Businesses AUM and FPAUM as of December 31, 2024 by investment strategy ($ in billions):
Product Offering
To meet investors’ growing demand for alternative investments, we manage investments in an increasingly comprehensive range of funds across a spectrum of compelling and complementary strategies. We have demonstrated an ability to consistently generate attractive and differentiated investment returns across these investment strategies and through various market environments. We believe the breadth of our product offering, our expertise in various investment strategies and our proficiency in attracting and satisfying our growing institutional and wealth client base has enabled and will continue to enable us to increase our AUM across each of our investment groups.
Investor Base and Fundraising
Our diverse investor base includes direct institutional relationships and a significant number of wealth investors. Our high-quality institutional investor base includes corporate and public pension funds, insurance companies, sovereign wealth funds, banks, investment managers, endowments and foundations. We have grown the number of these relationships from over 850 in 2019 to approximately 2,700 in 2024.
As of December 31, 2024, $389.9 billion, or 80% of our $484.4 billion of AUM, was attributable to our direct institutional relationships. As of December 31, 2024, our total AUM was divided by channel, and further our institutional direct AUM by client type and geographic origin as follows ($ in billions):
| | | | | | | | | | | | | | | | | | | | | | | | | | | | | | | | | | | | | | | | | | | | | | | | | | | | | | | | | | | |
| Institutional Direct | | Retail | | Institutional Intermediaries | | | Pension | | Insurance | | Bank | | | North America | | Europe | | APAC |
| | | | | | | | Sovereign Wealth Fund | | Other | | High Net Worth and Private Bank | | | Middle East & Africa | | | | |
| | | | | | | | Investment Manager | | | | | | | | | | | |
The following chart presents the AUM of investors committed to more than one of our funds as of December 31, 2024 compared to December 31, 2019 ($ in billions):
We believe that the AUM of multi-fund investors demonstrates our investors’ satisfaction with our performance, disciplined management of their capital and diverse product offering. Their loyalty has facilitated the growth of our existing businesses and we believe improves our ability to raise new funds and successor funds in existing strategies in the future.
Institutional investors continue to demonstrate interest in SMAs, which include contractual arrangements and single investor vehicles and funds, because these accounts can provide investors with greater levels of transparency, liquidity and control over their investments as compared to more traditional commingled funds. As of December 31, 2024, $106.0 billion, or 27%, of our direct institutional AUM was managed through SMAs.
We believe that client relationships are fundamental to our business and that our performance across our investment groups coupled with our focus on client service has resulted in strong relationships with our investors. Our dedicated and extensive in-house relationship management team, comprised of over 175 professionals located in North America, Europe,
APAC and the Middle East, is dedicated to raising capital globally across all of our funds, servicing existing fund investors and tailoring offerings to meet their needs, developing products to complement our existing offerings, and deepening existing relationships to expand them across our platform. We also have strategic initiatives focused on expanding our presence in Latin America and Australia. Our senior relationship management team maintains an active and transparent dialogue with an expansive list of investors. This team is supported by product managers and investor relations professionals with deep experience in each of our complementary investment groups that are dedicated to servicing our existing and prospective investors.
In addition to our expansive relationships with institutional investors, we have further diversified our investor base through our publicly-traded vehicles and through our wealth distribution platform, AWMS. AWMS facilitates the product development, distribution, marketing and client management activities for investment offerings in the global wealth management channel with over 140 professionals. As of December 31, 2024, our publicly-traded and perpetual wealth vehicles account for $74.3 billion, or 15%, of our AUM.
Operations Management Group
The OMG consists of shared resource groups to support our operating segments by providing infrastructure and administrative support in the areas of accounting/finance, operations, information technology, legal, compliance, human resources, strategy and relationship management, and distribution, including AWMS. Our clients seek to partner with investment management firms that not only have compelling investment track records across multiple investment products but also possess seasoned operational support functions. As such, significant investments have been made to develop the OMG. We have successfully launched new business lines, integrated acquired businesses into our operations and created scale within the OMG to support a much larger platform.
Organizational Structure
The simplified diagram below (which omits certain intermediate holding companies) depicts our legal organizational structure. Ownership information in the diagram below is presented as of December 31, 2024. Ares Management Corporation (“AMC”) is a holding company and through subsidiaries is the general partner of the Ares Operating Group entity and operates and controls the business and affairs of the Ares Operating Group. AMC consolidates the financial results of the Ares Operating Group, its consolidated subsidiaries and certain consolidated funds.
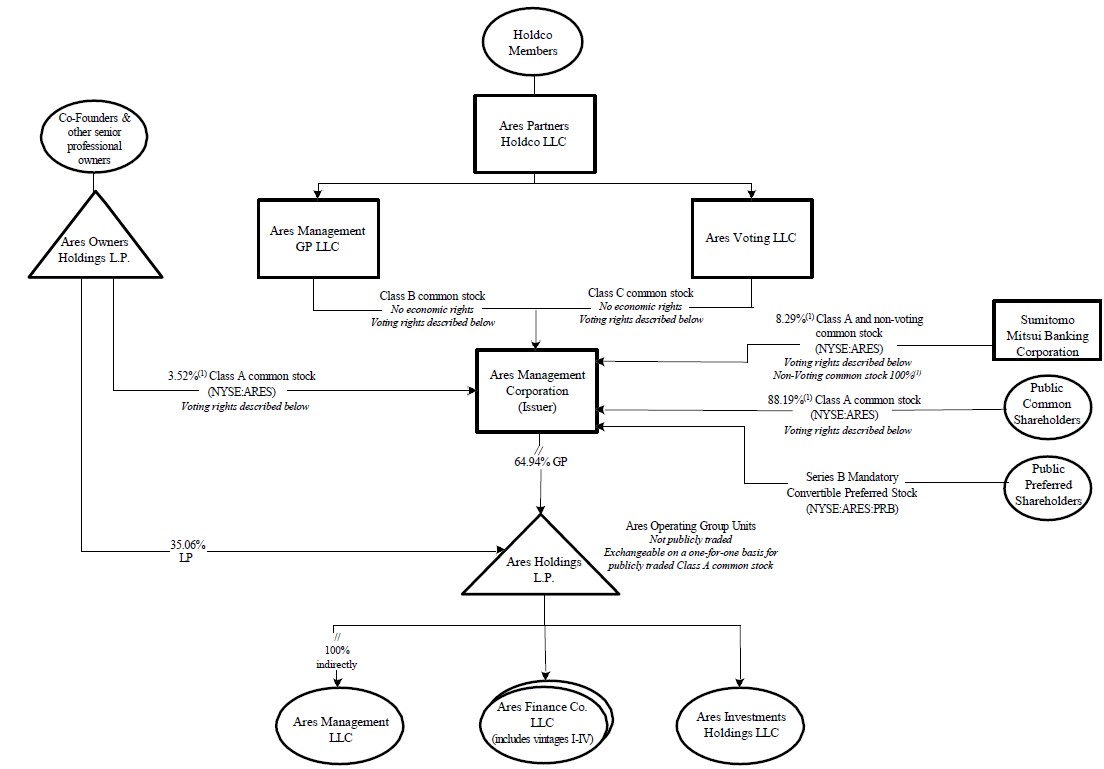
(1)Assuming the full exchange of AOG Units for shares of our Class A common stock, as of December 31, 2024, Ares Owners Holdings L.P. would hold 37.35%, Sumitomo Mitsui Banking Corporation (“SMBC”) would hold 5.38% and the public would hold 57.27% of AMC. Inclusive of Class A common stock held directly by Ares employees and assuming the full exchange of AOG Units for shares of our Class A common stock, Ares employee ownership would represent 42.05% of all outstanding shares. Economic interests of AMC are calculated based on 199,872,571 outstanding shares of Class A common stock and 3,489,911 outstanding shares of non-voting common stock.
Holding Company Structure
Our common stockholders are entitled to vote on all matters on which stockholders of a corporation are generally entitled to vote under the Delaware General Corporation Law (the “DGCL”), including the election of our board of directors. Holders of shares of our Class A common stock are entitled to one vote per share of our Class A common stock. On any date on which the Ares Ownership Condition (as defined in the Certificate of Incorporation) is satisfied, the holder of shares of our Class B common stock is, in the aggregate, entitled to a number of votes equal to (x) four times the aggregate number of votes attributable to our Class A common stock minus (y) the aggregate number of votes attributable to our Class C common stock. On any date on which the Ares Ownership Condition is not satisfied, the holder of shares of our Class B common stock is not entitled to vote on any matter submitted to a vote of our stockholders. The holder of shares of our Class C common stock is generally entitled to a number of votes equal to the number of AOG Units (as defined in the Certificate of Incorporation) held of record by each Ares Operating Group Limited Partner (as defined in the Certificate of Incorporation) other than the Company and its subsidiaries. Ares Management GP LLC is the sole holder of shares of our Class B common stock and Ares Voting LLC is the sole holder of shares of our Class C common stock. Our Class B common stock and our Class C common stock are non-economic and holders thereof shall not be entitled to: (i) dividends from the Company or (ii) receive any assets of the Company in the event of any dissolution, liquidation or winding up of the Company. Ares Management GP LLC and Ares Voting LLC are both wholly owned by Ares Partners Holdco LLC. As a result, the Company is a “controlled company” within the meaning of the corporate governance standards of the New York Stock Exchange (“NYSE”) and qualifies for exceptions from certain corporate governance rules of the NYSE. The Company also has non-voting common stock solely held by SMBC, which has the same economic rights as the Class A common stock. Our Series B mandatory convertible preferred stock has voting rights with respect to certain amendments to our Certificate of Incorporation or the Certificate of Designations, certain business combination transactions and certain other matters, subject to certain exceptions. However, holders of our Series B mandatory convertible preferred stock are not entitled to vote on an as-converted basis with common stockholders on matters on which holders of common stockholders are entitled to vote.
Accordingly, AMC and any direct subsidiaries of AMC that are treated as corporations for U.S. federal income tax purposes and that are the holders of AOG Units are subject to U.S. federal, state and local income taxes in respect of their interests in the Ares Operating Group. The Ares Operating Group entity is treated as a partnership for U.S. federal income tax purposes. An entity that is treated as a partnership for U.S. federal income tax purposes generally incurs no U.S. federal income tax liability at the entity level. Instead, each partner is required to take into account its allocable share of items of income, gain, loss, deduction and credit of the partnership in computing its U.S. federal, state and local income tax liability each taxable year, whether or not cash distributions are made.
AMC holds through subsidiaries a number of AOG Units equal to the number of shares of Class A common stock that AMC has issued. The AOG Units held by AMC and its subsidiaries are economically identical in all respects to the AOG Units that are not held by AMC and its subsidiaries. In connection with the issuance of the Series B mandatory convertible preferred stock, the Ares Operating Group entity also issued preferred “mirror units” with economic terms designed to mirror those of our Series B mandatory convertible preferred stock. Accordingly, AMC receives the distributive share of income of the Ares Operating Group from its equity interest in the Ares Operating Group.
Structure and Operation of our Funds
We conduct the management of our funds and other similar private vehicles primarily through organizing a limited partnership or other limited liability structure in which entities organized by us accept commitments and/or funds for investment from institutional investors and other investors. Such commitments are generally drawn down from investors on an as needed basis to fund investments over a specified term. Our Credit Group funds also include structured funds in which the investor’s capital is fully funded upon or soon after the subscription for interests in the fund. The CLOs that we manage are structured investment vehicles that are generally private limited liability companies. Our drawdown funds are generally organized as limited partnerships or limited liability companies. However, there are non-U.S. funds that are structured as corporate or non-partnership entities under applicable law. We also advise a number of investors through SMA relationships structured as contractual arrangements or single investor vehicles. In the case of our SMAs that are not structured as single investor vehicles, the investor, rather than us, generally controls custody of the investments with respect to which we advise. We also manage several publicly-traded and perpetual wealth vehicles with varying redemption criteria. In addition, Class A ordinary shares issued by AAC II are redeemable for cash by the public shareholders in the event that AAC II does not complete a business combination or tender offer associated with stockholder approval provisions.
Our funds are generally advised by Ares Management LLC, which is registered under the Investment Advisers Act of 1940, as amended (the “Investment Advisers Act”), a wholly owned subsidiary thereof or subsidiary controlled by AMC. Responsibility for the day-to-day operations of each investment vehicle is typically delegated to the Ares entity serving as
investment adviser pursuant to an investment advisory, management or similar agreement. Generally, the material terms of our investment advisory agreements relate to the scope of services to be rendered by the investment adviser to the applicable vehicle, the calculation of management fees to be borne by investors in our investment vehicles and certain rights of termination with respect to our investment advisory agreements. With the exception of certain of the publicly-traded and perpetual wealth vehicles, the investment vehicles themselves do not generally register as investment companies under the Investment Company Act of 1940, as amended (the “Investment Company Act”), in reliance on applicable exemptions thereunder.
The governing agreements of many of our funds provide that, subject to certain conditions, third-party investors in those funds have the right to terminate the investment period or the fund without cause. The governing agreements of some of our funds provide that, subject to certain conditions, third-party investors have the right to remove the general partner. In addition, the governing agreements of certain of our funds provide that upon the occurrence of certain events, the investment period will be suspended or the investors have the right to vote to terminate the investment period in accordance with specified procedures. Such events may include certain “key persons” in our funds that engage in bad acts or depart the firm.
Fee Structure
See “Item 7. Management’s Discussion and Analysis of Financial Condition and Results of Operations—Components of Consolidated Results of Operations” for an overview of our fee structure, including management fee, incentive fee and carried interest arrangements with our funds.
Capital Invested In and Through Our Funds
To further align our interests with those of investors in our funds, we have invested the firm’s capital and that of our professionals in the funds we sponsor and manage. General partner capital commitments to our funds are determined separately with respect to our funds and, generally, do not exceed 5% of the total commitments of any particular fund. We determine the general partner capital commitments based on a variety of factors, including regulatory requirements, investor requirements, estimates regarding liquidity over the estimated time period during which commitments will be funded, estimates regarding the amounts of capital that may be appropriate for other opportunities or other funds we may be in the process of raising or are considering raising, prevailing industry standards with respect to sponsor commitments and our general working capital requirements. Our general partner capital commitments are typically funded with cash and not with carried interest or deferring management fees. We offer a portion of the general partner commitments to our eligible professionals in many of our funds. As of December 31, 2024, we and our employees had more than $6.0 billion invested in or committed to Ares-managed vehicles, including $3.0 billion of capital commitments from Ares, $2.8 billion of capital commitments from our employee co-investment vehicles and $0.2 billion of employee investments in our publicly-traded and perpetual wealth vehicles.
Regulatory and Compliance Matters
Our businesses, as well as the financial services industry, generally are subject to extensive regulation, including periodic examinations and potential investigations by governmental agencies and self-regulatory organizations or exchanges in the U.S. and foreign jurisdictions in which we operate relating to, among other things, the management of our funds, antitrust laws, anti-money laundering laws, anti-bribery laws relating to foreign officials, tax laws and data privacy laws with respect to client and other information, and some of our funds invest in businesses that operate in highly regulated industries. Each of the regulatory bodies with jurisdiction over us has regulatory powers dealing with many aspects of financial services, including the authority to grant, and in specific circumstances to cancel, permissions to carry on particular activities. Any failure to comply with these rules and regulations could expose us to liability and/or reputational damage. Additional legislation, increasing global regulatory oversight of fundraising activities, changes in rules promulgated by self-regulatory organizations or exchanges or changes in the laws or rules, or interpretation or enforcement of existing laws and rules, either in the U.S. or elsewhere, may directly affect our mode of operation and profitability. See “Item 1A. Risk Factors—Risks Related to Regulation.”
Rigorous legal and compliance analysis of our businesses and investments is important to our culture. We strive to maintain a culture of compliance through the use of policies and procedures such as oversight compliance, codes of ethics, compliance systems, communication of compliance guidance and employee education and training. All employees must annually certify their understanding of, compliance with and adherence to key global Ares policies, procedures and code of ethics. We maintain a compliance group, supervised by our Chief Compliance Officer, that is responsible for monitoring our compliance with the regulatory and legal requirements to which we are subject and managing our compliance policies and procedures, which seek to address a variety of regulatory and compliance risks.
Many jurisdictions in which we operate have laws and regulations relating to data privacy, cybersecurity and protection of personal information, including the General Data Protection Regulation (“GDPR”), a European Union (“EU”)
regulation designed to protect privacy rights of individuals residing in the European Economic Area (the “EEA”), the GDPR as it forms part of the laws of England and Wales, Scotland and Northern Ireland by virtue of Section 3 of the European Union Withdrawal Act 2018 (as amended) and the Data Protection Act 2018 (collectively, “U.K. GDPR”) with respect to individuals residing in the United Kingdom (the “U.K.”), and numerous state and federal privacy laws applicable to individuals residing in the U.S. Various global privacy laws also apply to our business. These privacy laws and related regulations are quickly evolving and may conflict with one another. Any failure to comply with such laws or regulations could result in substantial fines, penalties and/or sanctions, litigation, as well as reputational harm. Moreover, to the extent that these laws and regulations or the enforcement of the same become more stringent, or if new laws or regulations or enacted, our financial performance or plans for growth may be adversely impacted.
U.S.
The SEC oversees the activities of our subsidiaries that are registered investment advisers under the Investment Advisers Act. The Financial Industry Regulatory Authority (“FINRA”) and the SEC oversee the activities of our wholly owned subsidiaries, AWMS and Ares Management Capital Markets LLC (“AMCM”), as registered broker-dealers. In addition, we regularly rely on exemptions from various requirements of the Securities Act, the Exchange Act, the Investment Company Act, the Commodity Exchange Act and the U.S. Employee Retirement Income Security Act of 1974, as amended (“ERISA”). These exemptions are sometimes highly complex and may in certain circumstances depend on compliance by third parties who we do not control.
Additionally, the SEC and various self-regulatory organizations have in recent years increased their regulatory activities in respect of investment management firms. See “Item 1A. Risk Factors—Risks Related to Regulation—Extensive regulation affects our activities, increases the cost of doing business and creates the potential for significant liabilities and penalties that could adversely affect our businesses and results of operations.” Since September 2019, the SEC has required broker-dealers, or natural persons who are associated persons of broker-dealers, to act in the best interest of a retail customer when making a recommendation of any securities transaction or investment strategy involving securities, without placing the financial or other interest of the broker, dealer or natural person who is an associated person of a broker-dealer making the recommendation ahead of the interest of the retail customer (“Regulation Best Interest”). Regulation Best Interest requires broker-dealers to evaluate available alternatives, including those that may have lower expenses and/or lower investment risk than our investment funds. The term “retail customer” is defined as a natural person who uses such a recommendation primarily for personal, family or household purposes, without reference to investor sophistication or net worth. The “best interest” standard is satisfied through compliance with certain disclosure, duty of care, conflict of interest mitigation and compliance obligations. Under Regulation Best Interest, high cost, high risk and complex products may be subject to greater scrutiny by broker-dealers and their salespersons. Regulation Best Interest may negatively impact whether broker-dealers and their associated persons are willing to recommend investment products, including our funds, to retail customers, which may adversely impact our ability to distribute our products to certain investors. As such, Regulation Best Interest may reduce the ability of our funds to raise capital, which would adversely affect our business and results of operations. In addition, the U.S. Department of Labor as well as several states have proposed regulations or taken other actions pertaining to conduct standards for investment advisers and broker-dealers that may result in additional regulatory requirements related to our business.
Funds and Portfolio Companies of our Funds
All of our funds are advised by SEC registered investment advisers (or wholly owned subsidiaries thereof). Registered investment advisers are subject to more stringent requirements and regulations under the Investment Advisers Act than unregistered investment advisers. Such requirements relate to, among other things, fiduciary duties to clients, maintaining an effective compliance program, managing conflicts of interest and general anti-fraud prohibitions. In addition, the SEC requires investment advisers registered or required to register with the SEC under the Investment Advisers Act that advise one or more private funds and have at least $150 million in private fund assets under management to periodically file reports on Form PF. We have filed, and will continue to file, quarterly reports on Form PF, which has resulted in increased administrative costs and a significant amount of attention and time to be spent by our personnel. The SEC adopted changes to Form PF in 2023, which, among other requirements, requires current reporting upon the occurrence of certain fund-level events. In 2024, the SEC and the Commodity Futures Trading Commission (the “CFTC”) adopted joint amendments to Form PF that will require additional basic information about advisers and the private funds they advise which will likely increase related administrative costs and burdens.
ARCC, ASIF and our infrastructure private BDC have each elected to be treated as a business development company under the Investment Company Act. APMF, ARDC and CADC are diversified, closed-ended management investment companies registered under the Investment Company Act. With the exception of our infrastructure private BDC, which has elected to be treated as a corporation for U.S. federal tax purposes, each of the other five companies has elected, for U.S. federal
tax purposes, to be treated as a regulated investment company (“RIC”) under Subchapter M of the U.S. Internal Revenue Code of 1986, as amended (the “Code”).
ACRE, in addition to our diversified non-traded REIT and industrial non-traded REIT, have each elected and qualified to be taxed as a real estate investment trust, or REIT, under the Code.
AWMS and AMCM, our wholly owned subsidiaries, are registered as broker-dealers with the SEC, maintain licenses in many states, and are members of FINRA. As a broker-dealer, each subsidiary is subject to regulation and oversight by the SEC and state securities regulators. In addition, FINRA promulgates and enforces rules governing the conduct of, and examines the activities of, its member firms. Due to the limited authority granted to each of our subsidiaries in their capacity as broker-dealers, they are not required to comply with certain regulations covering trade practices among broker-dealers and the use and safekeeping of customers’ funds and securities. As registered broker-dealers and members of a self-regulatory organization, AWMS and AMCM are, however, subject to the SEC’s uniform net capital rule. Rule 15c3-1 of the Exchange Act, which specifies the minimum level of net capital a broker-dealer must maintain and also requires that a significant part of a broker-dealer’s assets be kept in relatively liquid form.
See “Item 1A. Risk Factors—Risks Related to Regulation—The publicly-traded and perpetual wealth investment vehicles that we manage are subject to regulatory complexities that limit the way in which they do business and may subject them to a higher level of regulatory scrutiny.”
Other Jurisdictions
Certain of our subsidiaries operate outside the U.S. In Luxembourg, Ares Management Luxembourg (“AM Lux”) is subject to authorization and regulation by the Commission de Surveillance du Secteur Financier (“CSSF”). In the U.K., Ares Management Limited (“AML”) and Ares Management U.K. Limited (“AMUKL”) are subject to regulation and authorization by the U.K. Financial Conduct Authority (the “FCA”). Ares European Loan Management LLP (“AELM”), which is not a subsidiary, but in which we are indirectly invested and which procures certain services from AML, is also subject to regulation by the FCA. In some circumstances, AML, AMUKL, AELM (the “U.K. Regulated Entities”) and other Ares entities are or may become subject to U.K. or EU laws, for instance in relation to marketing our funds to investors in the EEA.
The U.K. exited the EU on January 31, 2020. Various EU laws were “on-shored” into domestic U.K. legislation and certain transitional regimes and deficiency-correction powers exist to ease the transition. The Trade and Cooperation Agreement (the “TCA”) between the U.K. and the EU formally came into force on May 1, 2021 and since its effectiveness, the TCA has governed certain matters between the U.K. and the EU. There remains considerable uncertainty as to the nature of the U.K.’s future relationship with the EU, creating continuing uncertainty as to the full extent to which the businesses of the U.K. Regulated Entities and our businesses generally could be adversely affected by Brexit. See “Item 1A. Risk Factors—Risks Related to Regulation—The U.K.’s exit from the EU (“Brexit”) could adversely affect our business and our operations.” Despite the U.K.’s departure from the EU, new and existing EU legislation is expected to continue to impact our business in the U.K. (whether because its effect is preserved in the U.K. as a matter of domestic policy or because compliance with such legislation (whether in whole or part) is a necessary condition for market access into the EEA) and other EEA member states where we have operations.
AM Lux operates under the EU legislative frameworks. Notwithstanding the U.K.’s withdrawal from the EU, the U.K. Regulated Entities generally continue to be regulated under these frameworks to the extent they were preserved in U.K. law. In some circumstances other Ares entities are or may become subject to EU laws or the law of EEA member states, including with respect to marketing our funds to investors in the EEA.
AM Lux and AMUKL are both AIFMs. Their operations are primarily governed by Directive 2011/61/EU on Alternative Investment Fund Managers and other associated legislation, rules and guidance (“AIFMD”). The U.K. implemented AIFMD while it was still a member of the EU and similar requirements therefore continue to apply in the U.K. notwithstanding Brexit. The AIFMD imposes significant regulatory requirements on AIFMs established in the EEA. AIFMD regulates fund managers by, amongst other things, prescribing authorization conditions for an AIFM, restricting the activities that can be undertaken by an AIFM and prescribing the organizational requirements, operating conditions, and regulatory standards relating to such things as initial capital, remuneration, conflicts, risk management, leverage, liquidity management, delegation of duties, transparency and reporting requirements.
In the EU, an amending directive to AIFMD, commonly referred to as “AIFMD II”, was published on March 26, 2024 and will become effective from April 16, 2026, subject to the grandfathering period for certain of the loan origination provisions and certain Annex IV disclosure requirements which will become effective a year later (see “—Alternative Investment Fund Managers Directive” for further detail). It is not yet clear to what extent (if any) the U.K. will seek to reflect AIFMD II in its domestic rules implementing AIFMD.
AML and AELM are both investment firms within the meaning of Directive 2014/65/EU on Markets in Financial Instruments (“MiFID II”). Notwithstanding Brexit, the U.K.’s rules implementing MiFID II continue to have effect and the accompanying Markets in Financial Instruments Regulation 600/2014/EU (“MiFIR”) has been on-shored into U.K. law in connection with this withdrawal. The operations of AML and AELM are primarily governed by U.K. laws and regulatory rules implementing MiFID II, MiFIR and other associated legislation, rules and guidance. AMUKL is subject to certain provisions of U.K.-retained MiFID II because it has top-up permissions to provide certain U.K.-retained MiFID investment services. AM Lux is subject to certain provisions of EU MiFID II because it has top-up permissions to provide certain MIFID investment services. Certain aspects of MIFID II and MiFIR are subject to review and change in both the EU and the U.K.
In addition to Europe, our operations and our investment activities are subject to a variety of other regulatory regimes that vary by country. These include operating subsidiaries of Ares Management Asia (Holdings) Limited, which are subject to regulation by various regulatory authorities, including the Securities and Futures Commission of Hong Kong and Monetary Authority of Singapore. In addition, as the ultimate parent of the controlling entity of Aspida Re, a Bermuda Class E insurance company, we are considered its “shareholder controller” (as defined in the Bermuda Insurance Act) by the Bermuda Monetary Authority (the “BMA”).
Competition
The investment management industry is intensely competitive, and we expect it to remain so. We compete globally and on a regional, industry and asset basis.
We face competition both in the pursuit of fund investors and investment opportunities. Generally, our competition varies across business lines, geographies and financial markets. We compete for outside investors based on a variety of factors, including investment performance, investor perception of investment managers’ drive, focus and alignment of interest, quality of service provided to and duration of relationship with investors, breadth of our product offering, business reputation and the level of fees and expenses charged for services. We compete for investment opportunities both at our funds and for strategic acquisitions by us based on a variety of factors, including breadth of market coverage and relationships, access to capital, transaction execution skills, the range of products and services offered, innovation and price.
We face competition in our direct lending, trading, acquisitions and other investment activities primarily from traditional asset managers, business development companies, specialized funds, investment managers and other financial institutions, and we expect that competition will continue to increase. Many of these competitors in some of our businesses are substantially larger and have considerably greater financial, technical and marketing resources than are available to us. Many of these competitors have similar investment objectives to us, which may create additional competition for investment opportunities. Some of these competitors may also have a lower cost of capital and access to funding sources that are not available to us, which may create competitive disadvantages for us with respect to investment opportunities. In addition, some of these competitors may have higher risk tolerances, different risk assessments or lower return thresholds, which could allow them to consider a wider variety of investments and to bid more aggressively than us for investments that we want to make. Corporate buyers may be able to achieve synergistic cost savings with regard to an investment that may provide them with a competitive advantage in bidding for an investment. Additionally, institutional and individual investors are allocating increasing amounts of capital to alternative investment strategies. Several large institutional investors have announced a desire to consolidate their investments in a more limited number of managers. We expect that this will cause competition in our industry to intensify and could lead to a reduction in the size and duration of pricing inefficiencies that many of our funds seek to exploit.
Additionally, technological innovation, including the use of artificial intelligence and data science, has the potential to disrupt the financial industry and change the way financial institutions, including asset managers, do business. Some of our competitors may be more successful than us in the development and implementation of new technologies, including services and platforms based on artificial intelligence, to address various matters including investor demand, operations or investment activity. If we are unable to adequately advance our capabilities in these areas, or do so at a slower pace than others in our industry, we may be at a competitive disadvantage.
Competition is also intense for the attraction and retention of qualified employees. Our ability to continue to compete effectively in our businesses will depend upon our ability to attract new employees and retain and motivate our existing employees.
For additional information concerning the competitive risks that we face, see “Item 1A. Risk Factors—Risks Related to Our Businesses—The investment management business is intensely competitive.”
Available Information
Ares Management Corporation is a Delaware corporation. Our telephone number is (310) 201-4100 and our website address is http://www.aresmgmt.com. Information on our website is not a part of this report and is not incorporated by reference herein. We make available free of charge on our website our Annual Report on Form 10-K, Quarterly Reports on Form 10-Q, Current Reports on Form 8-K, proxy statements and any amendments to those reports filed or furnished pursuant to Section 13(a) or 15(d) of the Exchange Act, as soon as reasonably practicable after those reports are electronically filed with, or furnished to, the SEC. To access these filings, go to the “Investor Resources” section of our website and then click on “SEC Filings.” In addition, these reports and the other documents we file with the SEC are available at a website maintained by the SEC at http://www.sec.gov.
Item 1A. Risk Factors
Risk Factor Summary
Our businesses are subject to a number of inherent risks. We believe that the primary risks affecting our businesses and an investment in shares of our Class A common stock or Series B mandatory convertible preferred stock are:
•difficult, volatile market and political conditions may adversely affect our businesses in many ways, including by reducing the value or hampering the performance of the investments made by our funds or reducing the ability of our funds to raise or deploy capital;
•we operate in a complex regulatory and tax environment involving rules and regulations (both domestic and foreign), some of which are outdated relative to today’s global financial activities and some of which are subject to political influence, which could restrict or require us to adjust our operations or the operations of our funds or portfolio companies and subject us to increased compliance costs and administrative burdens, as well as restrictions on our business activities;
•inflation has adversely affected and may continue to adversely affect our business, results of operations and financial condition of our funds and their portfolio companies;
•if we are unable to raise capital from investors or deploy capital into investments, or experience reduced capital raising or deployment activity, or if any of our management fees are waived or reduced, or if we fail to realize investments and generate carried interest or incentive fees, our revenues and cash flows would be materially reduced;
•we are subject to risks related to our dependence on our executive officers, senior professionals and other key personnel as well as attracting, retaining and developing human capital in a highly competitive talent market;
•we may experience reputational harm if we fail to appropriately address conflicts of interest or if we, our employees, our funds or their portfolio companies fail (or are alleged to have failed) to comply with applicable regulations in an increasingly complex political and regulatory environment;
•we face intense competition in the investment management business for investment opportunities;
•our growth strategy contemplates acquisitions and entering new lines of business and expanding into new investment strategies, geographic markets and businesses, which subject us to numerous risks, expenses and uncertainties, including related to the integration of development opportunities, acquisitions or joint ventures;
•we derive a significant portion of our management fees from ARCC;
•economic U.S. and foreign sanction laws may prohibit us and our affiliates from transacting with certain countries, individuals and companies;
•our international operations subject us to numerous regulatory, operational and reputational risks and expenses;
•we are subject to operational risks and risks in using prime brokers, custodians, counterparties, administrators and other agents;
•the increasing demands of fund investors, including the potential for fee compression and changes to other terms, could materially adversely affect our future revenues;
•security incidents or cyber-attacks could adversely affect our business, financial condition and operating results;
•we are subject to numerous privacy laws, and violation of such laws may subject us to significant fines or penalties, litigation, or reputational damage, and new privacy laws could impact our business and financial performance;
•we may be subject to litigation and reputational risks and related liabilities or risks related to employee misconduct, fraud and other deceptive practices;
•increases in interest rates could negatively impact the values of certain assets or investments and the ability of our funds and their portfolio companies to access the debt markets on attractive terms, which could adversely impact investment and realization opportunities;
•the use of leverage by us and our funds exposes us to substantial risks, including related to the use of Secured Overnight Financing Rate (“SOFR”) and Sterling Overnight Interbank Average Rate (“SONIA”);
•asset valuation methodologies can be highly subjective and our value of an asset may differ materially from the value ultimately realized;
•our funds may perform poorly due to market conditions, political actions or environments, monetary and fiscal policy or other conditions beyond our control;
•third-party investors in our funds may not satisfy their contractual obligation to fund capital calls or may exercise redemption, termination or dissolution rights;
•we are subject to risks relating to our contractual rights and obligations under our funds’ governing documents and investment management agreements;
•a downturn in the global credit markets could adversely affect certain of our investments, including CLO investments and other liquid credit portfolios;
•due to our and our funds’ investments in certain market sectors, such as power, infrastructure and energy, real estate and insurance, we are subject to risks and regulations inherent to those industries;
•if we were deemed to be an “investment company” under the Investment Company Act, applicable restrictions could make it impractical for us to continue our businesses as contemplated;
•due to the Holdco Members ownership and control of our shares of common stock, holders of our Class A common stock will generally have no influence over matters on which holders of our common stock vote and limited ability to influence decisions regarding our business;
•we are subject to risks related to our categorization as a “controlled company” within the meaning of the NYSE listing standards;
•potential conflicts of interest may arise among the holders of Class B and Class C common stock and the holders of our Class A common stock and/or Series B mandatory convertible preferred stock;
•our holding company structure, Delaware law and contractual restrictions may limit our ability to pay dividends to the holders of our Class A and non-voting common stock;
•other anti-takeover provisions in our charter documents could delay or prevent a change in control; and
•we are subject to risks related to our tax receivable agreement (the “TRA”).
Risks Related to Our Businesses
Difficult market and political conditions may adversely affect our businesses in many ways, including by reducing the value or hampering the performance of the investments made by our funds or reducing the ability of our funds to raise or deploy capital, each of which could materially reduce our revenue, earnings and cash flow and adversely affect our financial prospects and condition.
Our businesses are materially affected by conditions in the global financial markets and economic and political conditions throughout the world that are outside our control. These conditions may affect the level and volatility of securities prices and the liquidity and value of investments, and we may not be able to or may choose not to manage our exposure to these conditions. This could in turn materially reduce our revenue, earnings and cash flow and adversely affect our financial prospects and condition.
Global financial markets have experienced heightened volatility in recent periods, including as a result of economic and political events in or affecting the world’s major economies, such as the ongoing war between Russia and Ukraine and conflicts in the Middle East. Sanctions imposed by the U.S. and other countries in connection with hostilities between Russia and Ukraine and the tensions between China and Taiwan have caused additional financial market volatility and affected the global economy. Concerns over future increases in inflation, economic recession, as well as interest rate volatility and fluctuations in oil and gas prices resulting from global production and demand levels, as well as geopolitical tension, have exacerbated market volatility. Market uncertainty and volatility have also been magnified as a result of the 2024 U.S. presidential and congressional elections and resulting uncertainties regarding actual and potential shifts in U.S. and foreign,
trade, economic and other policies, including with respect to treaties and tariffs. The United States has recently enacted and proposed to enact significant new tariffs, including on Mexican, Canadian and Chinese goods. Additionally, the new Presidential Administration has directed various federal agencies to further evaluate key aspects of U.S. trade policy and there has been ongoing discussion and commentary regarding potential significant changes to U.S. trade policies, treaties and tariffs.
In addition, numerous structural dynamics and persistent market trends have exacerbated volatility and market uncertainty. Concerns over significant volatility in the commodities markets, sluggish economic expansion in foreign economies, including continued concerns over growth prospects in China and emerging markets, growing debt loads for certain countries, uncertainty about the consequences of the U.S. and other governments withdrawing monetary stimulus measures and speculation about a possible recession all highlight the fact that economic conditions remain unpredictable and volatile. U.S. debt ceiling and budget deficit concerns have increased the possibility of additional credit-rating downgrades and economic slowdowns or a recession in the U.S. In recent periods, geopolitical tensions, including between the U.S. and China, have escalated. Further escalation of such tensions and the related imposition of sanctions or other trade barriers may negatively impact the rate of global growth, particularly in China, where growth has slowed. Moreover, there is a risk of both sector-specific and broad-based volatility, corrections and/or downturns in the commodities, equity and credit markets. Any of the foregoing could have a significant impact on the markets in which we operate and a material adverse impact on our business prospects and financial condition.
A number of factors have had and may continue to have an adverse impact on credit markets in particular. The weakness and the uncertainty regarding the stability of the oil and gas markets resulted in a tightening of credit across multiple sectors. In addition, the Federal Reserve has decreased the federal funds rate multiple times in 2024. Changes in and uncertainty surrounding interest rates may have a material effect on our business, particularly with respect to the cost and availability of financing for significant acquisition and disposition transactions. Moreover, while conditions in the U.S. economy have generally improved since the credit crisis, many other economies continue to experience weakness, tighter credit conditions and a decreased availability of foreign capital. Since credit represents a significant portion of our business and ongoing strategy, any of the foregoing could have a material adverse impact on our business prospects and financial condition.
These and other conditions in the global financial markets and the global economy may result in adverse consequences for us and our funds, each of which could adversely affect the business of such funds, restrict such funds’ investment activities, impede such funds’ ability to effectively achieve their investment objectives and result in lower returns than we anticipated at the time certain of our investments were made. More specifically, these economic conditions could adversely affect our operating results by causing:
•decreases in the market value of securities, debt instruments or investments held by some of our funds;
•illiquidity in the market, which could adversely affect transaction volumes and the pace of realization of our funds’ investments or otherwise restrict the ability of our funds to realize value from their investments, thereby adversely affecting our ability to generate performance or other income;
•our assets under management to decrease, thereby lowering a portion of our management fees payable by our funds to the extent they are based on market values; and
•increases in costs or reduced availability of financial instruments that finance our funds.
During periods of difficult market conditions or slowdowns (which may be across one or more industries, sectors or geographies), companies in which we and our funds invest may experience decreased revenues, financial losses, credit rating downgrades, difficulty in obtaining access to financing and increased funding costs. During such periods, these companies may also have difficulty in expanding their businesses and operations and be unable to meet their debt service obligations or other expenses as they become due, including expenses payable to us and our funds. Negative financial results in our funds’ portfolio companies may reduce the value of their portfolio companies, the net asset value of our funds and the investment returns for our funds, which could have a material adverse effect on our operating results and cash flow. In addition, such conditions would increase the risk of default with respect to credit-oriented or debt investments. Our funds may be adversely affected by reduced opportunities to exit and realize value from their investments, by lower than expected returns on investments made prior to the deterioration of the credit markets and by our inability to find suitable investments for the funds to effectively deploy capital, which could adversely affect our ability to raise new funds and thus adversely impact our prospects for future growth.
Inflation has adversely affected and may continue to adversely affect our business, results of operations and financial condition of our funds and their portfolio companies.
Certain of our funds and their portfolio companies are in industries that have been impacted by inflation. Although U.S. inflation rates have fluctuated in recent periods, they remain well above the historic levels over the past several decades.
Such inflationary pressures have increased the costs of labor, energy and raw materials and have adversely affected consumer spending, economic growth and our funds’ portfolio companies’ operations. If these portfolio companies are unable to pass any increases in their costs of operations along to their customers, it could adversely affect their operating results. In addition, any projected future decreases in the operating results of our funds’ portfolio companies due to inflation could adversely impact the fair value of those investments. Any decreases in the fair value of our fund investments could result in future realized or unrealized losses.
Our business depends in large part on our ability to raise capital from investors. If we were unable to raise such capital, we would be unable to collect management fees or deploy such capital into investments, which would materially reduce our revenues and cash flow and adversely affect our financial condition.
Our ability to raise capital from investors depends on a number of factors, including many that are outside our control. Investors may downsize their investment allocations to alternative asset managers to rebalance a disproportionate weighting of their overall investment portfolio among asset classes. If the value of an investor’s portfolio decreases as a whole, the amount available to allocate to alternative investments could decline. Further, investors often evaluate the amount of distributions they have received from existing funds when considering commitments to new funds. Poor performance of our funds, or regulatory or tax constraints, could also make it more difficult for us to raise new capital. Our investors and potential investors continually assess our funds’ performance independently and relative to market benchmarks and our competitors, which affects our ability to raise capital for existing and future funds. If economic and market conditions deteriorate or continue to be volatile, investors may delay making new commitments to funds and/or we may be unable to raise sufficient amounts of capital to support the investment activities of future funds. We may not be able to find suitable investments for the funds to effectively deploy capital, which could reduce our revenues and cash flow and adversely affect our financial condition as well as our ability to raise new funds and our prospects for future growth. In addition, certain investors have implemented or may implement restrictions against investing in certain types of asset classes, such as fossil fuels, which would affect our ability to raise new funds focused on those asset classes. If we were unable to successfully raise capital, our revenue and cash flow would be reduced, and our financial condition would be adversely affected. Furthermore, while our senior professionals have committed substantial capital to our funds, commitments from new investors may depend on the commitments made by our senior professionals to new funds and there can be no assurance that there will be further commitments to our funds by these individuals, and any future investments by them in our funds or other alternative investment categories will likely depend on the performance of our funds, the performance of their overall investment portfolios and other investment opportunities available to them.
We depend on our executive officers, senior professionals and other key personnel, and our ability to retain them and attract additional qualified personnel is critical to our success and our growth prospects.
We depend on the diligence, skill, judgment, business contacts and personal reputations of our executive officers, senior professionals and other key personnel depart. Our future success will depend upon our ability to retain our senior professionals and other key personnel and our ability to recruit additional qualified personnel. These individuals possess substantial experience and expertise in investing, are responsible for locating and executing our funds’ investments, have significant relationships with the institutions that are the source of many of our funds’ investment opportunities and, in certain cases, have strong relationships with our investors. Therefore, if any of our senior professionals or other key personnel depart and join competitors or form competing companies, it could result in the loss of significant investment opportunities, limit our ability to raise capital from certain existing investors or result in the loss of certain existing investors. There is no guarantee that the non-competition and non-solicitation agreements to which certain of our senior professionals and other key personnel are subject, together with our other arrangements with them, will prevent them from leaving, joining our competitors or otherwise competing with us. Such agreements also expire after a certain period of time, at which point such senior personnel would be free to compete against us and solicit our clients and employees. In addition, there is no assurance that such agreements will be enforceable in all cases, particularly as U.S. states and/or federal agencies enact legislation or adopt rules aimed at effectively prohibiting non-competition agreements.
The departure or bad acts of any of our senior professionals, or a significant number of our other investment professionals, could have a material adverse effect on our ability to achieve our investment objectives, cause certain of our investors to withdraw capital they invest with us or elect not to commit additional capital to our funds or otherwise have a material adverse effect on our business and our prospects. Turnover and associated costs of rehiring, the loss of human capital through attrition and the reduced ability to attract talent could impair our ability to implement our growth strategy and maintain our standards of excellence. Competition for qualified, motivated, and highly-skilled executives, professionals and other key personnel in investment management firms is significant, both in the U.S. and internationally, and we may not succeed in recruiting additional personnel or we may fail to effectively replace current personnel who depart with qualified or effective successors. Further the departure of some or all of those individuals could also trigger certain “key person” provisions in the documentation governing certain of our funds, which would permit the investors in those funds to suspend or terminate such
funds’ investment periods or, in the case of certain funds, permit investors to withdraw their capital prior to expiration of the applicable lock-up date. We do not carry any “key person” insurance that would provide us with proceeds in the event of the death or disability of any of our senior professionals, and we do not have a policy that prohibits our senior professionals from traveling together. See “—Risks Related to Regulation—Employee misconduct could harm us by impairing our ability to attract and retain investors and subjecting us to significant legal liability, regulatory scrutiny and reputational harm.”
Our efforts to retain and attract investment professionals may also result in significant additional expenses, which could adversely affect our profitability or result in an increase in the portion of our carried interest and incentive fees that we grant to our investment professionals. Additionally, we expect expenses related to equity-based compensation to increase in the future as we grant equity-based awards to attract, retain and compensate employees.
Our failure to appropriately address conflicts of interest could damage our reputation and adversely affect our businesses.
As we expand the number and scope of our businesses, we increasingly confront potential conflicts of interest relating to our and our funds’ investment activities. These conflicts are most likely to arise between or among our funds or between one or more funds across our Credit, Real Assets, Private Equity and Secondaries Groups, and other businesses including any SPACs and similar investment vehicles that we sponsor. These conflicts of interest include:
•we and certain of our funds may have overlapping investment objectives, including funds that have different fee structures, and potential conflicts may arise with respect to our decisions regarding how to allocate investment opportunities. For example, a decision to receive material non-public information about a company while pursuing an investment opportunity may give rise to a potential conflict of interest if it results in our having to restrict any fund or other part of our business from trading in the securities of such company;
•we may allocate an investment opportunity that is appropriate for Ares and/or multiple funds in a manner that excludes one or more funds or results in a disproportionate allocation based on factors or criteria that we determine, such as differences with respect to available capital, the size of a fund, minimum investment amounts and remaining life of a fund, differences in investment objectives or current investment strategies, such as objectives or strategies, differences in risk profile at the time an opportunity becomes available, the potential transaction and other costs of allocating an opportunity among various funds, potential conflicts of interest, including whether multiple funds have an existing investment in the security in question or the issuer of such security, the nature of the security or the transaction including the size of investment opportunity, minimum investment amounts and the source of the opportunity, current and anticipated market and general economic conditions, existing positions in an issuer/security, prior positions in an issuer/security and other considerations deemed relevant to us;
•our funds may acquire positions in a single portfolio company, for example, where the fund that made an initial investment no longer has capital available to invest;
•our funds may invest in different parts of the capital structure of a company in which one or more of our other funds invests. For example, one or more funds may invest in a controlling or other equity interest issued by a portfolio company in which a different fund holds debt securities. Additionally, in connection with an investment we may create multiple tranches of a capital structure and our funds may be allocated investments in these tranches on terms established by us. The interests of our funds may not always be aligned, which may give rise to actual or potential conflicts of interest, or the appearance of conflicts of interest. Further, a direct conflict of interest could arise between the security holders if such a company were to become distressed or develop insolvency concerns. Actions taken for one or more of our funds may be adverse to us or other of our funds;
•our affiliates or portfolio companies may be service providers or counterparties to our funds or portfolio companies and receive fees or other compensation for services that are not shared with our fund investors. In such instances, we may be incentivized to cause our funds or portfolio companies to purchase such services from our affiliates or portfolio companies rather than an unaffiliated service provider despite the fact that a third-party service provider could potentially provide higher quality services or offer them at a lower cost;
•funds in one group could be restricted from selling their positions in such companies for extended periods because investment professionals in another group sit on the boards of such companies or because another part of the firm has received private information;
•certain funds in different groups may invest alongside each other in the same security. For example, ARCC, ASIF and certain other registered closed-end management investment companies managed by us are permitted to co-invest in portfolio companies with each other and with affiliated funds pursuant to an SEC order (the “Co-Investment Exemptive Order”). The different investment objectives or terms of such funds may result in a potential conflict of
interest, including in connection with the allocation of investments between the funds made pursuant to the Co-Investment Exemptive Order;
•conflicts of interest may exist in the valuation of our investments (which can affect fees and carried interest) and regarding decisions about the allocation of specific investment opportunities among us and our funds and the allocation of fees and costs among us, our funds and their portfolio companies; and
•fund investors may perceive conflicts of interest regarding investment decisions for funds in which our investment professionals, who have made and may continue to make significant personal investments, are personally invested.
Though we believe we have appropriate means and oversight to resolve these conflicts, our judgment on any particular allocation could be challenged. While we have developed general guidelines regarding when two or more funds can invest in different parts of the same company’s capital structure and created a process that we employ to handle such conflicts if they arise, our decision to permit the investments to occur in the first instance or our judgment on how to minimize the conflict could be challenged. Further, our employees may make investments which may conflict with investments made by our funds or prevent our funds from investing in an opportunity. If we fail to appropriately address any such conflicts, it could negatively impact our reputation and ability to raise additional funds and the willingness of counterparties to do business with us or result in potential litigation or regulatory action against us, which may adversely impact our business.
Conflicts of interest may arise in our allocation of co-investment opportunities.
As a general matter, our allocation of co-investment opportunities is entirely within our discretion and there can be no assurance that co-investments of any particular type or amount will be allocated to any of our funds or investors. There can be no assurance that co-investments will become available and we will take into account a variety of factors and considerations we deem relevant in our sole discretion in allocating co-investment opportunities, including, without limitation, whether a potential co-investor has expressed an interest in evaluating co-investment opportunities, our assessment of a potential co-investor’s ability to invest an amount of capital that fits the needs of the co-investment and its history of participating in Ares co-investments, the potential co-investor’s strategic value to the co-investment, our funds or future funds, the length and nature of our relationship with the potential co-investor, including whether the potential co-investor has demonstrated a long-term and/or continuing commitment to the potential success of Ares or any of its funds, our assessment of a potential co-investor’s ability to commit to a co-investment opportunity within the required timeframe of the particular transaction, the economic and other terms of such co-investment (e.g., whether management fees and/or carried interest would be payable to us and the extent thereof), and such other factors and considerations that we deem relevant in our sole discretion under the circumstances.
Certain funds in different groups may invest alongside each other in the same security. For example, ARCC, ASIF and certain other registered closed-end management investment companies managed by us are permitted to co-invest in portfolio companies with each other and with affiliated funds pursuant to the Co-Investment Exemptive Order. The different investment objectives or terms of such funds may result in a potential conflict of interest, including in connection with the allocation of investments between the funds made pursuant to the Co-Investment Exemptive Order. In addition, conflicts of interest may exist in the valuation of our investments and regarding decisions about the allocation of specific investment opportunities among us and our funds and the allocation of fees and costs among us, our funds and their portfolio companies. We, from time to time, incur fees, costs, and expenses on behalf of more than one fund. To the extent such fees, costs, and expenses are incurred for the account or benefit of more than one fund, each such fund will typically bear an allocable portion of any such fees, costs, and expenses in proportion to the size of its investment in the activity or entity to which such expense relates (subject to the terms of each fund’s governing documents) or in such other manner as we consider fair and equitable under the circumstances such as the relative fund size or capital available to be invested by such funds. Where a fund’s governing documents do not permit the payment of a particular expense, we will generally pay such fund’s allocable portion of such expense.
Potential conflicts will arise with respect to our decisions regarding how to allocate co-investment opportunities among our funds and investors and the terms of any such co-investments. Our fund documents typically do not mandate specific allocations with respect to co-investments. The investment advisers of our funds may have an incentive to provide co-investment opportunities to certain investors in lieu of others. Co-investment arrangements may be structured through one or more of our investment vehicles, and in such circumstances, co-investors will generally bear the costs and expenses thereof (which may lead to conflicts of interest regarding the allocation of costs and expenses between such co-investors and investors in our other funds). The terms of any such existing and future co-investment vehicles may differ materially, and in some instances may be more favorable to us, than the terms of certain of our funds or prior co-investment vehicles, and such different terms may create an incentive for us to allocate a greater or lesser percentage of an investment opportunity to such funds or such co-investment vehicles, as the case may be. Such incentives will from time to time give rise to conflicts of interest. There can be no assurance that any conflicts of interest will be resolved in favor of any particular funds or investors (including any
applicable co-investors) and such investment fund or investor (or the SEC) may challenge our treatment of such conflict, which could impose costs on our business and expose us to potential liability.
We may also decide to provide a co-investment opportunity to certain investors in lieu of allocating more of that investment to our funds, which may adversely impact our fundraising activity.
The investment management business is intensely competitive.
The investment management business is intensely competitive, with competition based on a variety of factors, including investment performance, business relationships, quality of service provided to investors, investor liquidity and willingness to invest, fund terms (including fees), brand recognition and business reputation. We compete with a number of private equity funds, specialized funds, hedge funds, corporate buyers, traditional asset managers, real estate development companies, commercial banks, investment banks, other investment managers and other financial institutions, as well as domestic and international pension funds and sovereign wealth funds, and we expect that competition will continue to increase.
Numerous factors increase our competitive risks, including, but not limited to:
•a number of our competitors in some of our businesses have greater financial, technical, marketing and other resources and more personnel than we do;
•some of our funds may not perform as well as competitors’ funds or other available investment products;
•several of our competitors have raised significant amounts of capital, and many of them have similar investment objectives to ours, which may create additional competition for investment opportunities;
•some of our competitors may have a lower cost of capital and access to funding sources that are not available to us, which may create competitive disadvantages for us with respect to our funds, particularly our funds that directly use leverage or rely on debt financing of their portfolio investments to generate superior investment returns;
•some of our competitors may have higher risk tolerances, different risk assessments or lower return thresholds than us, which could allow them to consider a wider variety of investments and to bid more aggressively than us for investments that we want to make;
•some of our competitors may be subject to less regulation and, accordingly, may have more flexibility to undertake and execute certain businesses or investments than we do and/or bear less compliance expense than we do;
•some of our competitors may not have the same types of conflicts of interest as we do;
•some of our competitors may have more flexibility than us in raising certain types of funds under the investment management contracts they have negotiated with their investors;
•some of our competitors may have better expertise or be regarded by investors as having better expertise or reputation in a specific asset class or geographic region than we do;
•our competitors that are corporate buyers may be able to achieve synergistic cost savings in respect of an investment, which may provide them with a competitive advantage in bidding for an investment;
•our competitors have instituted or may institute low cost high speed financial applications and services based on artificial intelligence and new competitors may enter the asset management space using new investment platforms based on artificial intelligence; and
•other industry participants may, from time to time, seek to recruit our investment professionals and other employees away from us.
Developments in financial technology, such as artificial intelligence or distributed ledger technology (or blockchain), have the potential to disrupt the financial industry and change the way financial institutions, including investment managers, do business, and could exacerbate these competitive pressures.
We may lose investment opportunities in the future if we do not match pricing, structures and terms offered by our competitors. Alternatively, we may experience decreased profitability, rates of return and increased risks of loss if we match pricing, structures and terms offered by our competitors.
In addition, the attractiveness of investments in our funds relative to other investment products could decrease depending on economic conditions. This competitive pressure could adversely affect our ability to make successful investments and limit our ability to raise future funds, either of which would adversely impact our businesses, revenues, results of operations and cash flow.
Lastly, institutional and individual investors are allocating increasing amounts of capital to alternative investment strategies. Several large institutional investors have announced a desire to consolidate their investments in a more limited number of managers. We expect that this will cause competition in our industry to intensify and could lead to a reduction in the size and duration of pricing inefficiencies that many of our funds seek to exploit. Increased competition may adversely impact our ability to deploy capital, which could reduce our revenues and cash flow and adversely affect our financial condition.
Poor performance of our funds, or a failure of slowdown in deployment, would cause a decline in our revenue and results of operations and could adversely affect our ability to raise capital for future funds.
We derive revenues primarily from:
•management fees, which are based generally on the amount of capital committed to or invested by our funds;
•carried interest and incentive fees, which are based on the performance of our funds; and
•returns on investments of our own capital in the funds and other investment vehicles, including SPACs, that we sponsor and manage.
When any of our funds perform poorly, either by incurring losses or underperforming benchmarks, as compared to our competitors or otherwise, our investment record suffers. As a result, our carried interest and incentive fees may be adversely affected and, all else being equal, the value of our assets under management could decrease, which may, in turn, reduce our management fees. Moreover, we may experience losses on investments of our own capital as a result of poor investment performance. If a fund performs poorly, we will receive little or no carried interest and incentive fees with regard to the fund and little income or possibly losses from our own principal investment in such fund. Furthermore, if, as a result of poor performance or otherwise, a fund does not achieve total investment returns that exceed a specified investment return threshold over the life of the fund or other measurement period, we may be obligated to repay the amount by which carried interest that was previously distributed or paid to us exceeds amounts to which we were entitled. Poor performance of our funds and other vehicles could also make it more difficult for us to raise new capital. Investors in our closed-end funds may decline to invest in future closed-end funds we raise as a result of poor performance. Investors in our open-ended funds may redeem their investment as a result of poor performance. Poor performance of our publicly-traded funds may result in stockholders selling their stock in such vehicles, thereby causing a decline in the stock price and limiting our ability to access capital. For further information on the impact of poor fund performance, see “—We may not be able to maintain our current fee structure as a result of industry pressure from fund investors to reduce fees, which could have an adverse effect on our profit margins and results of operations.”
The pace and consistency of our funds’ capital deployment has been, and may in the future continue to be, affected by a range of factors which are beyond our control. Our inability to deploy capital on the timeframe we expect, or at all, and on terms that we believe are attractive, would reduce or delay the management fees, carried interest and incentive fees that we would otherwise expect to earn on this capital. Moreover, we could be delayed in raising successor funds. The impact of any such reduction or delay would be particularly adverse with respect to funds where management fees are paid on invested capital.
In addition, if any of our subsidiaries become the sponsor of any SPACs that are unable to successfully complete a business combination within the time limitation provided for such SPAC, we may lose the entirety of our investment. See “—Risks Related to Regulation—Our investments in subsidiaries that have sponsored SPACs and invested in their business combination targets may expose us to increased liabilities, and we may suffer the loss of all or a portion of our investments if the SPAC does not complete a business combination by the applicable deadline or the target is unsuccessful.”
ARCC’s management fee comprises a significant portion of our management fees.
The management fees we receive from ARCC (including fees attributable to ARCC Part I Fees) comprise a significant percentage of our management fees. The investment advisory and management agreement we have with ARCC categorizes the fees we receive as: (i) base management fees, which are paid quarterly and generally increase or decrease based on ARCC’s total assets (excluding cash and cash equivalents); (ii) fees based on ARCC’s net investment income (before ARCC Part I Fees and ARCC Part II Fees), which are paid quarterly (“ARCC Part I Fees”); and (iii) fees based on ARCC’s net capital gains, which are paid annually (“ARCC Part II Fees”). We classify the ARCC Part I Fees as management fees because they are
predictable and recurring in nature, not subject to contingent repayment and generally cash-settled each quarter. If ARCC’s total assets or its net investment income (before ARCC Part I Fees and ARCC Part II Fees) were to decline significantly for any reason, including, without limitation, due to fair value accounting requirements, the poor performance of its investments or the failure to successfully access or invest capital, the amount of the fees we receive from ARCC, including the base management fee and the ARCC Part I Fees, would also decline significantly, which could have an adverse effect on our revenues and results of operations. In addition, because ARCC Part II Fees are not paid unless ARCC achieves cumulative aggregate realized capital gains (net of cumulative aggregate realized capital losses and aggregate unrealized capital depreciation), ARCC’s Part II Fees payable to us are variable and not predictable. In addition, ARCC Part I Fees and ARCC Part II Fees may be subject to cash payment deferral if certain return hurdles in accordance with the contractual terms are not met, which could have an adverse effect on our cash flows if such deferral is sustained for an extended period. In such cases, the contractual payments to employees as compensation related to such ARCC Part I Fees and ARCC Part II Fees are also deferred, which would limit the associated impact to our liquidity. We may also, from time to time, waive or voluntarily defer any fees payable by ARCC in connection with strategic transactions.
Our investment advisory and management agreement with ARCC renews for successive annual periods subject to the approval of ARCC’s board of directors or by the affirmative vote of the holders of a majority of ARCC’s outstanding voting securities. In addition, as required by the Investment Company Act, both ARCC and its investment adviser have the right to terminate the agreement without penalty upon 60 days’ written notice to the other party. Termination or non-renewal of this agreement would reduce our revenues significantly and could have a material adverse effect on our financial condition.
We may not be able to maintain our current fee structure as a result of industry pressure from fund investors to reduce fees, which could have an adverse effect on our profit margins and results of operations.
We may not be able to maintain our current fee structure as a result of industry pressure from fund investors to reduce fees. Although our investment management fees vary among and within asset classes, historically we have competed primarily on the basis of our performance and not on the level of our investment management fees relative to those of our competitors. In recent years, however, there has been a general trend toward lower fees in the investment management industry. The Institutional Limited Partners Association (“ILPA”) published a set of Private Equity Principles (the “Principles”) which called for enhanced “alignment of interests” between general partners and limited partners through modifications of some of the terms of fund arrangements, including proposed guidelines for fee structures. We promptly provided ILPA with our endorsement of the Principles, representing an indication of our general support for the efforts of ILPA. Although we have no obligation to modify any of our fees with respect to our existing funds, we may experience pressure to do so. More recently, institutional investors have been increasing pressure to reduce management and investment fees charged by external managers, whether through direct reductions, deferrals, rebates or other means. In addition, we may be asked by investors to waive or defer fees for various reasons, including during economic downturns or as a result of poor performance of our funds. We may not be successful in providing investment returns and service that will allow us to maintain our current fee structure. Fee reductions on existing or future new businesses could have an adverse effect on our profit margins and results of operations. For more information about our fees, see “Item 7. Management’s Discussion and Analysis of Financial Condition and Results of Operations.”
In addition, we may not be able to maintain our current fee structure if we fail to grow the assets of our funds. This would limit our ability to earn additional management fees, carried interest and incentive fees, and ultimately affect our operating results. Our fund investors and potential fund investors continually assess our funds’ performance independently and relative to market benchmarks and our competitors, and our ability to raise capital for existing and future funds and avoid excessive redemption levels depends on our funds’ performance. Accordingly, poor fund performance may deter future investment in our funds and thereby decrease the capital invested in our funds and, ultimately, our management fee income. In the face of poor fund performance, investors could demand lower fees or fee concessions for existing or future funds which would likewise decrease our revenue.
Rapid growth of our businesses, particularly outside the U.S., may be difficult to sustain and may place significant demands on our administrative, operational and financial resources.
Our assets under management have grown significantly in the past, and we are pursuing further growth in the near future, both organic and through acquisitions. Our rapid growth has placed, and planned growth, if successful, will continue to place significant demands on our legal, accounting, compliance and operational infrastructure and has increased expenses. The complexity of these demands, and the expense required to address them, is a function not simply of the amount by which our assets under management has grown, but of the growth in the variety and complexity of, as well as the differences in strategy between, our different funds. In addition, we are required to continuously develop our systems and infrastructure in response to the increasing sophistication of the investment management market and legal, accounting, regulatory and tax developments.
Our future growth will depend in part on our ability to maintain an operating platform and management system sufficient to address our growth and will require us to incur significant additional expenses and to commit additional senior management and operational resources. As a result, we face significant challenges in:
•maintaining adequate financial, regulatory (legal, tax and compliance) and business controls;
•providing current and future investors with accurate and consistent reporting;
•implementing new or updated information and financial systems and procedures;
•monitoring and enhancing our cybersecurity and data privacy risk management; and
•training, managing and appropriately sizing our work force and other components of our businesses on a timely and cost-effective basis.
We may not be able to manage our expanding operations effectively or be able to continue to grow, and any failure to do so could adversely affect our ability to generate revenue and control our expenses.
In addition, pursuing investment opportunities outside the U.S. presents challenges not faced by U.S. investments, such as different legal and tax regimes and currency fluctuations, which require additional resources to address. To accommodate the needs of global investors and strategies we must structure investment products in a manner that addresses tax, regulatory and legislative provisions in different, and sometimes multiple, jurisdictions. These laws may not always be consistent with each other. Further, in conducting business in foreign jurisdictions, we are often faced with the challenge of ensuring that our activities and those of our funds and, in some cases, our funds’ portfolio companies, are consistent with U.S. or other laws with extraterritorial application, such as the USA PATRIOT Act and the U.S. Foreign Corrupt Practices Act (the “FCPA”). Moreover, actively pursuing international investment opportunities may require that we increase the size or number of our international offices. Pursuing foreign fund investors means that we must comply with international laws governing the sale of interests in our funds, different investor reporting, investor “know your customer” requirements and information processes and other requirements, which may impact our ability to service such investors. As a result, we are required to continuously develop our systems and infrastructure, including employing and contracting with foreign businesses and entities, in response to the increasing complexity and sophistication of the investment management market and legal, accounting and regulatory situations. This growth has required, and will continue to require, us to incur significant additional expenses and to commit additional senior management and operational resources. There can be no assurance that we will be able to manage or maintain appropriate oversight over our expanding international operations effectively or that we will be able to continue to grow this part of our businesses, and any failure to do so could adversely affect our ability to generate revenues and control our expenses. See “—Risks Related to Regulation—Regulatory changes in jurisdictions outside the U.S. could adversely affect our businesses” and “—Risks Related to Our Funds—Our funds make investments in companies that are based outside of the United States, which may expose us to additional risks not typically associated with investing in companies that are based in the United States.”
We may enter into new lines of business and expand into new investment strategies, geographic markets, strategic partnerships and businesses, each of which may result in additional risks, expenses and uncertainties in our businesses.
We intend, if market conditions warrant, to grow our businesses by increasing assets under management in existing businesses and expanding into new investment strategies, geographic markets, strategic partnerships and businesses. We may pursue growth through acquisitions of other investment management companies, acquisitions of critical business partners, acquisition of companies, or other strategic initiatives (including through our other businesses), which may include entering into new lines of business. In addition, consistent with our past experience, we expect opportunities will arise to acquire other alternative or traditional asset managers, including asset managers located outside of the U.S. We have in the past opened many offices to conduct our asset management and capital markets businesses around the world, including in Europe and APAC, which we intend to grow and expand. We have also launched a number of new investment initiatives in various asset classes and geographies, which subject us to additional risk. For example, in connection with the WSM Acquisition, we expanded our real estate capabilities into Mexico. Additionally, in connection with the acquisition of the international business of GLP Capital Partners Limited and certain of its affiliates, excluding its operations in Greater China (“GCP International”), and existing capital commitments to certain managed funds (the “GCP Acquisition”), which is expected to close in the first quarter of 2025, we expect to launch investment initiatives in Japan, Vietnam and Brazil. Each of these geographies may subject us to heightened risks due to jurisdictional limitations or political or economic uncertainty in these regions. See “—Investments in emerging markets are subject to greater risks than those in more developed markets.” Introducing new types of investment structures and products could increase the complexities involved in managing such investments, including ensuring compliance with applicable regulatory requirements and terms of the investment vehicles.
Attempts to expand our businesses involve a number of special risks, including some or all of the following:
•the required investment of capital and other resources;
•the diversion of management’s attention from our core businesses;
•the assumption of liabilities in any acquired business;
•the disruption of our ongoing businesses;
•entry into markets or lines of business in which we may have limited or no experience;
•increasing demands on our operational and management systems and controls;
•our assumption of the imposition on us of known or unknown claims or liabilities in an acquisition, including claims by government agencies or authorities, current or former employees or customers, former stockholders or other third parties;
•compliance with or applicability to our business or our funds’ portfolio companies of regulations and laws, including, in particular, local regulations and laws and customs in the numerous jurisdictions in which we operate and the impact that noncompliance or even perceived noncompliance could have on us and our funds’ portfolio companies;
•our inability to realize the anticipated operation and financial benefits from an acquisition for a number of reasons, including if we are unable to effectively integrate acquired businesses;
•potential increase in investor concentration; and
•the broadening of our geographic footprint, increasing the risks associated with conducting operations in certain foreign jurisdictions where we currently have little or no presence.
Entry into certain lines of business may subject us to new laws and regulations with which we are not familiar, or from which we are currently exempt, and may lead to increased litigation and regulatory risk. If a new business does not generate sufficient revenues or if we are unable to efficiently manage our expanded operations, our results of operations will be adversely affected. Our strategic initiatives may include joint ventures and business combinations through subsidiary sponsored SPACs, in which case we will be subject to additional risks and uncertainties in that we may be dependent upon, and subject to liability, losses or reputational damage relating to systems, controls and personnel that are not under our control or disputes with our joint venture partners. Because we have not yet identified these potential new investment strategies, geographic markets or lines of business, we cannot identify all of the specific risks we may face and the potential adverse consequences on us and their investment that may result from any attempted expansion.
If we are unable to consummate or successfully integrate development opportunities, acquisitions or joint ventures, we may not be able to implement our growth strategy successfully.
Our growth strategy is based, in part, on the selective development or acquisition of asset management businesses, advisory businesses or other businesses complementary to our business where we think we can add substantial value or generate substantial returns. The success of this strategy will depend on, among other things, (i) the availability of suitable opportunities, (ii) the level of competition from other companies that may have greater financial resources, (iii) our ability to value potential development or acquisition opportunities accurately and negotiate acceptable terms for those opportunities, (iv) our ability to obtain requisite approvals and licenses from the relevant governmental authorities and to comply with applicable laws and regulations without incurring undue costs and delays, (v) our ability to identify and enter into mutually beneficial relationships with venture partners, and (vi) our ability to properly manage conflicts of interest. In addition, our ability to integrate personnel at acquired businesses into our operations and culture may be impacted by the structure of acquisitions we make, such as contingent consideration and continuing governance rights retained by the sellers.
This strategy also contemplates the use of shares of our publicly-traded Class A common stock as acquisition consideration. Volatility or declines in the trading price of shares of our Class A common stock may make shares of our Class A common stock less attractive to acquisition targets. Moreover, even if we are able to identify and successfully complete an acquisition, we may encounter unexpected difficulties or incur unexpected costs associated with integrating and overseeing the operations of the new businesses. If we are not successful in implementing our growth strategy, our business, financial results and the market price for shares of our Class A common stock may be adversely affected.
Risks Related to Regulation
Extensive regulation affects our activities, increases the cost of doing business and creates the potential for significant liabilities and penalties that could adversely affect our businesses and results of operations.
Overview of our regulatory environment and exemptions from certain laws. Our businesses are subject to extensive regulation, including periodic examinations and potential investigations, by governmental agencies and self-regulatory organizations in the jurisdictions in which we operate. The SEC oversees the activities of our subsidiaries that are registered investment advisers under the Investment Advisers Act. FINRA and the SEC oversee the activities of our wholly owned subsidiaries AMCM and AWMS as registered broker-dealers, which also maintain licenses in many states. We are subject to audits by the Defense Security Service to determine whether we are under foreign ownership, control or influence. We are also increasingly subject to various data privacy and protection laws. If we are unable or fail to comply with such laws, we could be subject to fines, penalties, litigation or reputational harm.
Regulators are also increasing scrutiny and considering regulation of the use of artificial intelligence technologies. We cannot predict what, if any, actions may be taken, but such regulation could have a material adverse effect on our business and results of operations.
SEC enforcement activity has increased in recent years. While we have a robust compliance program in place, it is possible this enforcement activity will target practices which we believe are compliant, and which were not historically targeted by the SEC. The SEC has also increased emphasis on investment adviser and private fund regulation and sought to enact rules that could meaningfully affect investment advisers and their management of private funds, which could materially impact private funds and private fund advisers and their operations, including increasing compliance burdens and regulatory costs, and heightened risk of regulatory enforcement action such as public sanctions, restrictions on activities, fines and reputational damage.
Federal regulation. Under the Dodd-Frank Act, the Financial Stability Oversight Council (“FSOC”) has the authority to review the activities of certain nonbank financial firms engaged in financial activities and designate them as systemically important financial institutions (“SIFI”). Currently, there are no non-bank financial companies with a non-bank SIFI designation. The FSOC has, however, designated certain non-bank financial companies as SIFIs in the past, and additional non-bank financial companies, which may include large asset management companies such as us, may be designated as SIFIs in the future. In November 2023, FSOC adopted amendments to its guidance regarding procedures for designating non-bank financial companies as SIFIs which eliminated the prior guidance’s prioritization of an “activities-based” approach for identifying, assessing and addressing potential risks to financial stability. Under the previous guidance’s “activities-based” approach, FSOC indicated that it would primarily focus on regulating activities that pose systemic risk rather than focusing on individual firm-specific determinations. The elimination of an “activities-based” approach over designation of an individual firm as a non-bank SIFI may increase the likelihood of FSOC designating one or more firms as a non-bank SIFI. If we were designated as such, it would result in increased regulation of our businesses, including the imposition of capital, leverage, liquidity and risk management standards, credit exposure reporting and concentration limits, enhanced public disclosures, restrictions on acquisitions and annual stress tests by the Federal Reserve. Requirements such as these, which were designed to regulate banking institutions, would likely need to be modified to be applicable to an asset manager, although no proposals have been made indicating how such measures would be adapted for asset managers.
Pursuant to the Dodd-Frank Act, regulation of the U.S. derivatives market is bifurcated between the CFTC and the SEC. Under the Dodd-Frank Act, the CFTC has jurisdiction over swaps and the SEC has jurisdiction over security-based swaps. Under CFTC rules, all swaps (other than security-based swaps) included in the definition of commodity interests. As a result, funds that utilize swaps (whether or not related to a physical commodity) may fall within the statutory definition of a commodity pool. If a fund qualifies as a commodity pool, then, absent an available exemption, the operator of such fund is required to register with the CFTC as a CPO. Registration with the CFTC renders such CPO subject to regulation, including with respect to disclosure, reporting, recordkeeping and business conduct, which could significantly increase operating costs by requiring additional resources.
Certain classes of interest rate swaps and certain classes of credit default swaps are subject to mandatory clearing, unless an exemption applies. Many of these swaps are also subject to mandatory trading on designated contract markets or swap execution facilities. Mandatory clearing and trade execution requirements may change the cost and availability of the swaps that we use, and expose our funds to the credit risk of the clearing house through which any cleared swap is cleared. In addition, federal bank regulatory authorities and the CFTC have adopted initial and variation margin requirements for swap dealers, security-based swap dealers and swap entities, including permissible forms of margin, custodial arrangements and documentation requirements for uncleared swaps and security-based swaps. As a result of these variation margin requirements,
some of our funds are required to post collateral to satisfy the variation margin requirements which has made transacting in uncleared swaps more expensive.
Position limits imposed by various regulators, self-regulatory organizations or trading facilities on derivatives may also limit our ability to effect desired trades. The Dodd-Frank Act also authorizes the SEC to establish position limits on security-based swaps, which rules could have a similar impact on our business. These rules and any additional proposals could affect our ability and the ability for our funds to enter into derivatives transactions.
It is difficult to determine the full extent of the impact on us of new laws, regulations or initiatives that may be proposed or whether any of the proposals will become law. In addition, as a result of proposed legislation, shifting areas of focus of regulatory enforcement bodies or otherwise, regulatory compliance practices may shift such that formerly accepted industry practices become disfavored or less common. Any changes or other developments in the regulatory framework applicable to our businesses, including the changes described above and changes to formerly accepted industry practices, may impose additional costs on us, require the attention of our senior management or result in limitations on the manner in which we conduct our businesses. Moreover, as calls for additional regulation have increased, there may be a related increase in regulatory investigations of the trading and other investment activities of alternative asset management funds, including our funds. In addition, we may be adversely affected by changes in the interpretation or enforcement of existing laws and rules by these governmental authorities and self-regulatory organizations. Compliance with any new laws or regulations could make compliance more difficult and expensive, affect the manner in which we conduct our businesses and adversely affect our profitability.
Additionally, in June 2024, the U.S. Supreme Court reversed its longstanding approach under the Chevron doctrine, which provided for judicial deference to regulatory agencies. As a result of this decision, we cannot be sure whether there will be increased challenges to existing agency regulations or how lower courts will apply the decision in the context of other regulatory schemes without more specific guidance from the U.S. Supreme Court. For example, the decision could significantly impact consumer protection, advertising, privacy, artificial intelligence, anti-corruption and anti-money laundering practices and other regulatory regimes with which we are required to comply. Any such regulatory developments could result in uncertainty about and changes in the ways such regulations apply to us and our portfolio companies, and may require additional resources to ensure our continued compliance. We cannot predict which, if any, of these actions will be taken or, if taken, their effect on the financial stability of the U.S. Such actions could have a significant adverse effect on our business, financial condition and results of operations.
State regulation. A number of states and regulatory authorities require investment managers to register as lobbyists. We have registered as such in a number of jurisdictions, including California, Illinois, New York, Pennsylvania, Louisiana, Texas and Kentucky. Other states or municipalities may consider similar legislation or adopt regulations or procedures with similar effect. These registration requirements impose significant compliance obligations on registered lobbyists and their employers, which may include annual registration fees, periodic disclosure reports and internal recordkeeping, and may also prohibit the payment of contingent fees.
Regulatory environment of our funds and portfolio companies of our funds. Each of the regulatory bodies with jurisdiction over us has regulatory powers dealing with many aspects of financial services, including the authority to grant, and in specific circumstances to cancel, permissions to carry on particular activities. A failure to comply with the obligations imposed by the Investment Advisers Act, including recordkeeping, marketing and operating requirements, disclosure obligations and prohibitions on fraudulent activities, could result in investigations, sanctions, restrictions on the activities of us or our personnel and reputational damage. We are involved regularly in trading activities that implicate a broad number of U.S. and foreign securities and tax law regimes, including laws governing trading on inside information, market manipulation and a broad number of technical trading requirements that implicate fundamental market regulation policies. Violation of these laws could result in severe restrictions on our activities and damage to our reputation.
Compliance with existing and new or changing laws and regulations subjects us to significant costs. Moreover, our failure to comply with applicable laws or regulations, including labor and employment laws, could result in fines, censure, suspensions of personnel or other sanctions, including revocation of the registration of our relevant subsidiaries as investment advisers or registered broker-dealers. For example, the SEC requires investment advisers registered or required to register with the SEC under the Investment Advisers Act that advise one or more private funds and have at least $150.0 million in private fund assets under management to periodically file reports on Form PF. We have filed, and will continue to file, quarterly reports on Form PF, which has resulted in increased administrative costs and requires a significant amount of attention and time to be spent by our personnel. The SEC recently adopted changes to Form PF which, among other requirements, require current reporting upon the occurrence of certain fund-level events, which will likely further increase related administrative costs and burdens. Most of the regulations to which our businesses are subject are designed primarily to protect investors in our funds and portfolio companies and to ensure the integrity of the financial markets. They are not designed to protect our stockholders. Even
if a sanction is imposed against us, one of our subsidiaries or our personnel by a regulator for a small monetary amount, the costs incurred in responding to such matters could be material, the adverse publicity related to the sanction could harm our reputation, which in turn could have a material adverse effect on our businesses in a number of ways, making it harder for us to raise new funds and discouraging others from doing business with us.
In the past several years, the financial services industry, and private equity and alternative asset managers in particular, has been the subject of heightened scrutiny by regulators around the globe. In particular, the SEC and its staff have focused more narrowly on issues relevant to alternative asset management firms, including by forming specialized units devoted to examining such firms and, in certain cases, bringing enforcement actions against the firms, their principals and employees. In recent periods there have been a number of enforcement actions within the industry, and it is expected that the SEC will continue to pursue enforcement actions against private fund managers. This enforcement activity may cause us to reevaluate certain practices and adjust our compliance control function as necessary and appropriate.
A number of our investing activities, such as our direct lending business, are also subject to regulation by various U.S. and foreign regulators, and may become subject to new laws, regulations or initiatives. It is impossible to determine the full extent of the impact on us of existing regulation or any other new laws, regulations or initiatives that may be proposed or whether any of the proposals will become law. Any changes in the regulatory framework applicable to our businesses, including the changes described above, may impose additional costs on us, require the attention of our senior management or result in limitations on the manner in which we conduct our business. Complying with any new laws or regulations could be more difficult and expensive, affect the manner in which we conduct our businesses and adversely affect our profitability. As of December 31, 2024, our direct lending AUM represented 48% of our total AUM.
The SEC’s recent lists of examination priorities for investment advisers includes numerous items related to the oversight of asset managers to private funds, and many firms have received inquiries during examinations or directly from the SEC’s Division of Enforcement regarding private funds, including the calculation of fees and expenses, the allocation of broken-deal expenses, the disclosure of operating partner or operating executive compensation, outside business activities of firm principals and employees, group purchasing arrangements and general conflicts of interest disclosures.
Further, the SEC has highlighted valuation practices as one of its areas of focus in investment adviser examinations and has instituted enforcement actions against advisers for misleading investors about valuation. If the SEC were to investigate and find errors in our methodologies or procedures, we and/or members of our management could be subject to penalties and fines, which could harm our reputation and our business, financial condition and results of operations could be materially and adversely affected.
Changes in relevant data protection laws could necessitate changes to the steps taken by our funds for the purposes of complying with such laws and the way in which personal data is transferred between our funds.
Following Brexit, the provisions of the GDPR were incorporated directly into U.K. law as the U.K. GDPR, and the two regimes have remained materially similar since this date. However, the U.K. government has recently introduced the draft Data (Use and Access) Bill (“DUA Bill”) which, if it becomes law, will introduce a number of changes to the U.K.’s data protection regime. Some of these changes would reduce the current burden of data protection compliance on businesses (for example, removing the need to obtain consent to use analytics cookies), whereas others would introduce additional obligations (for example, the scope of what constitutes special category data for the purposes of the U.K. GDPR may be expanded). It is unlikely that our U.K. funds will have to make any material changes to their data protection practices to ensure compliance with any resulting reforms to U.K. data protection laws, but we will continue to monitor the progress of the DUA Bill.
Any changes to the U.K.’s data protection regime may impact the finding by the EU Commission on June 28, 2021 that the U.K. provides adequate protection for personal data transferred from the EU to the U.K. The U.K.’s adequacy status expires on June 27, 2025 and is therefore due for imminent review by EU Commission. Whilst any divergence from the GDPR may increase the possibility of a successful challenge to the U.K.’s adequacy status, on the basis that the scope of the reforms proposed pursuant to the DUA Bill are reasonably limited, we believe it is unlikely that these reforms alone will threaten the U.K.’s adequacy status. To the extent that any data is transferred from the EU funds to the U.K. funds on the basis of the adequacy decision, we will continue to monitor developments in this area of the law and ensure that any transfer mechanisms which are necessary to facilitate any EU-U.K. data flows are in place.
Regulations impacting the insurance industry could adversely affect our business and our operations, and our provision of products and services to insurance companies, including through Aspida, subjects us to a variety of risks and uncertainties.
The insurance industry is subject to significant regulatory oversight, both in the U.S. and abroad. Regulatory authorities in many relevant jurisdictions have broad administrative, and in some cases discretionary, authority with respect to
insurance companies and/or their investment advisors, which may include, among other things, the investments insurance companies may acquire and hold, marketing practices, affiliate transactions, reserve requirements, capital adequacy including insurance company licensing and examination, agent licensing, establishment of reserve requirements and solvency standards, premium rate regulation, admissibility of assets, policy form approval, unfair trade and claims practices, advertising, maintaining policyholder privacy, payment of dividends and distributions to shareholders, investments, review and/or approval of transactions with affiliates, reinsurance, acquisitions, mergers and other matters. Insurance regulatory authorities regularly review and update these and other requirements. Currently, there are proposals to increase the scope of regulation of insurance holding companies in the U.S., Bermuda and other jurisdictions. Effective March 31, 2024, new legislation became operative in Bermuda (subject to certain transitional and grandfathering arrangements) which relates to changes to the calculation of the technical provisions framework of insurers and insurance groups, amendments to the computation and flexibility of the Bermuda Solvency Capital Requirement, updates to the prudential rules and reporting forms to modify capital requirements and revisions to the fees charged to life insurers regulated by the BMA. In 2024, the National Association of Insurance Commissioners in the U.S. adopted changes to its Financial Analysis Handbook to provide additional guidance to regulators reviewing affiliated investment management agreements and added new regulatory considerations and guidance to assist regulators in assessing complex ownership structures.
Changes in rules and regulations impacting the insurance industry could adversely impact our expansion into the insurance industry, the prospects of our Bermuda insurance company subsidiary Aspida Re and other investments we make in the insurance industry, both in the U.S. and abroad and limit our ability to raise capital for our funds from insurance companies, which could limit our ability to grow.
The U.S. and foreign insurance industries are subject to significant regulation. Regulatory authorities in the U.S. and many relevant jurisdictions have broad regulatory (including through any regulatory support organization), administrative, and in some cases discretionary, authority with respect to insurance companies and/or their investment advisors, which may include, among other things, the investments insurance companies may acquire and hold, marketing practices, affiliate transactions, reserve requirements and capital adequacy. Because these requirements are primarily designed to protect policyholders, regulatory authorities often have wide discretion in applying restrictions and regulations, which may indirectly affect Aspida, Aspida Life, Aspida Re and other parts of our business that operate within or offer products or services to insurance industry.
We may be the target or subject of, or may have indemnification obligations related to, litigation, enforcement investigations or regulatory scrutiny. Regulators and other authorities generally have the power to bring administrative or judicial proceedings against insurance companies, which could result in, among other things, suspension or revocation of licenses, cease and desist orders, fines, civil penalties, criminal penalties or other disciplinary action. To the extent AIS or another Ares business that offers products to insurance companies, Aspida Life or Aspida Re is directly or indirectly involved in such regulatory actions, our reputation could be harmed, we may become liable for indemnification obligations and we could potentially be subject to enforcement actions, fines and penalties from both U.S. and foreign regulators.
Insurance company investment portfolios are often subject to internal and regulatory requirements governing the categories and ratings of investment products they may acquire and hold. Many of the investment products we develop for, or other assets or investments we include in, insurance company portfolios will be rated and a ratings downgrade or any other negative action by a rating agency with respect to such products, assets or investments could make them less attractive and limit our ability to offer such products to, or invest or deploy capital on behalf of, insurers.
As the ultimate parent of the controlling entity of Aspida Re, a Bermuda Class E insurance company, we are considered its “shareholder controller” (as defined in the Bermuda Insurance Act) by the BMA. Aspida Re is subject to regulation and supervision by the BMA, and compliance with all applicable Bermuda law and Bermuda insurance statutes and regulations, including but not limited to the Bermuda Insurance Act. Under the Bermuda Insurance Act, the BMA maintains supervision over the “controllers” of all registered insurers in Bermuda. For these purposes, a “controller” includes a shareholder controller (as defined in the Bermuda Insurance Act). The Bermuda Insurance Act imposes certain notice requirements upon any person that has become, or as a result of a disposition ceased to be, a shareholder controller, and failure to comply with such requirements is punishable by a fine or imprisonment or both. In addition, the BMA may file a notice of objection to any person or entity who has become a controller of any description where it appears that such person or entity is not, or is no longer, fit and proper to be a controller of the registered insurer, and such person or entity can be subject to fines or imprisonment or both. These laws may discourage potential acquisition proposals for us and could delay, deter or prevent an acquisition of controllers of Bermuda insurers.
Employee misconduct could harm us by impairing our ability to attract and retain investors and subjecting us to significant legal liability, regulatory scrutiny and reputational harm.
We are subject to a number of laws, obligations and standards arising from our investment management business and our authority over the assets managed by our investment management business. Further, our employees are subject to various internal policies including a Compliance Manual, a Code of Ethics and our Employee Handbook. The violation of these laws, obligations, standards or policies by any of our employees could adversely affect investors in our funds and us. Our businesses often require that we deal with confidential matters of great significance to companies in which our funds may invest. If our current or former employees were to use or disclose confidential information improperly, we could suffer serious harm to our reputation, financial position and current and future business relationships. Additionally, we allow certain of our employees to work on a hybrid schedule or remotely, which has required us to develop and implement additional precautions in order to detect and prevent employee misconduct. Employee misconduct could also include, binding us to transactions that exceed authorized limits or present unacceptable risks and other unauthorized activities or concealing unsuccessful investments (which, in either case, may result in unknown and unmanaged risks or losses), concealing or failing to disclose conflicts of interest with our funds or portfolio companies or otherwise charging (or seeking to charge) inappropriate expenses or inappropriate or unlawful behavior or actions directed towards other employees, or misappropriation of confidential or proprietary information relating to us or our funds’ portfolio companies. Such misconduct could subject us to whistleblower claims, regulatory action and monetary or other penalties. Any claims of retaliation against whistleblowers would exacerbate the consequences of any wrongdoing. The growth of our employee base and increasing operational footprint in new jurisdictions as a result of our expanding global presence may heighten the risk of any of the foregoing, particularly in the context of employees who may not have a close familiarity with industries that are regulated in the same way as ours.
It is not always possible to detect or deter employee misconduct, and the extensive precautions we take to detect and prevent this activity may not be effective in all cases. If one or more of our current or former employees were to engage in misconduct or were to be accused of such misconduct, our businesses and our reputation could be adversely affected and a loss of investor confidence could result, which would adversely impact our ability to raise future funds. Our current and former employees and those of our funds’ portfolio companies may also become subject to allegations of sexual harassment, racial and gender discrimination or other similar misconduct, which, regardless of the ultimate outcome, may result in adverse publicity that could harm our and such portfolio company’s brand and reputation. The pervasiveness of social media, coupled with increased public focus on the externalities of activities unrelated to the business, could further magnify the reputational risks associated with negative publicity.
Regulatory changes in jurisdictions outside the U.S. could adversely affect our businesses.
Certain of our subsidiaries operate outside the U.S. In Luxembourg, AM Lux is subject to regulation by the CSSF. In the U.K., the U.K. Regulated Entities are subject to regulation by the FCA. In some circumstances, the U.K. Regulated Entities and other Ares entities are or become subject to U.K. or EU laws, for instance in relation to marketing our funds to investors in the EEA.
Despite the U.K.’s departure from the EU on January 31, 2020 (see “—The U.K.’s exit from the EU (“Brexit”) could adversely affect our business and our operations” for further detail), new and existing EU legislation is expected to continue to impact our business in the U.K. The following EU and U.K. measures are of particular relevance to our business.
Securitisation Regulation.
The EU Securitisation Regulation (the “Securitisation Regulation”) includes requirements in relation to transparency and risk retention and restricts AIFMs from investing in securitizations which do not comply with its provisions (“non-compliant securitizations”). The Securitisation Regulation also imposes an obligation on AIFMs to divest any interest in a non-compliant securitization. It is currently unclear if the Regulation applies to non-EU marketing one or more alternative investment funds in the EEA under a national private placement regime. This lack of clarity may hamper our ability to raise capital for some of our non-EEA funds from investors in the EEA or subject such fund raising to additional risks, including, if application of the Securitisation Regulation to non-EEA AIFMs is confirmed, that their funds that market in the EEA could be required to divest of interests in non-compliant securitizations at sub-optimal prices.
The U.K. has since assimilated the EU Securitisation Regulation and has published the Securitisation Regulations 2024 (the “U.K. Securitisation Regulation”). The U.K. Securitisation Regulation deviates from the EU’s Securitisation Regulation in a number of ways. We are assessing the impact of these changes to existing securitization activities and our funds.
EMIR
The EU Regulation on over-the-counter (“OTC”) derivative transactions, central counterparties and trade repositories (the “European Market Infrastructure Regulation” or “EMIR”) requires the mandatory clearing of certain OTC derivatives through central counterparties. EMIR creates additional risk mitigation requirements (including, in particular, margining requirements) in respect of certain OTC derivative transactions that are not cleared by a central counterparty and imposes reporting and record keeping requirements in respect of most derivative transactions. The requirements are similar to, but not the same as, those in Title VII of the Dodd-Frank Act. The latest amendments to EMIR (“EMIR 3.0”) came into effect on December 24, 2024. EMIR 3.0 introduces a new active account requirement and amends existing requirements under EMIR (including with respect to the reporting obligation and clearing threshold calculations).
The U.K. has on-shored EMIR, with the effect that a similar but not identical set of rules apply in the U.K. (“U.K. EMIR”). Certain cross-border arrangements (e.g., where an Ares European fund enters into derivatives transactions with a U.K. counterparty, transacts on a U.K. trading venue or clears its derivatives transactions through a U.K. clearing house, and vice versa) may be impacted. Although EMIR and U.K. EMIR are substantively similar, there are some areas of regulatory divergence (including differences in the way in which derivatives are reported and a lack of equivalence declarations between the U.K. and the EU with respect to trade repositories) which have been exacerbated by EMIR 3.0, and there can be no guarantee that the U.K. will move in lockstep with the future changes proposed by the EU.
The EU regulation on transparency of securities financing transactions (“SFTR”) requires the mandatory reporting of certain securities financing transactions (“SFTs”), disclosure obligations to counterparties regarding the re-use of collateral, and certain transparency and disclosure obligations for managers of UCITS and AIFs in respect of SFTs and total return swaps. The U.K. has on-shored SFTR, with the effect that a similar but not identical set of rules apply in the U.K. (“U.K. SFTR”). Certain cross-border arrangements (such as those where an Ares European fund enters into an SFT with a U.K. counterparty) may be impacted. Although SFTR and U.K. SFTR are substantively similar, there are some areas of regulatory divergence (including with respect to the differing new validation rules) and there can be no guarantee that the U.K. will move in lockstep with the future changes proposed by the EU.
Our U.K., other European and Asian operations and our investment activities worldwide are subject to a variety of regulatory regimes that vary by country. In the EU, examples of further legislation may include proposals for further changes to or reviews of the extent and interpretation of pay regulation, including under the EU Regulation on the prudential requirements of investment firms (Regulation (EU) 2019/2033) and its accompanying Directive (Directive (EU) 2019/2034) or the U.K. version, the Investment Firms Prudential Regime (which may have an impact on the retention and recruitment of key personnel), proposals for enhanced regulation of loan origination (see “—Alternative Investment Fund Managers Directive”) and new reporting requirements in relation to securities financing transactions. In the U.K., additional rule changes have affected the approval of certain Ares professionals in the U.K. to work in the regulated financial services sector. Implementation of these new rules may increase our compliance burden and costs. In addition, we regularly rely on exemptions from various requirements of the regulations of certain foreign countries in conducting our asset management activities.
Each of the regulatory bodies with jurisdiction over us has regulatory powers dealing with many aspects of financial services, including the authority to grant, and in specific circumstances to cancel, permissions to carry on particular activities. We are involved regularly in trading activities that implicate a broad number of foreign (as well as U.S.) securities law regimes, including laws governing trading on inside information and market manipulation and a broad number of technical trading requirements that implicate fundamental market regulation policies. Violation of these laws could result in severe restrictions or prohibitions on our activities and damage to our reputation, which in turn could have a material adverse effect on our businesses in a number of ways, making it harder for us to raise new funds and discouraging others from doing business with us. In addition, increasing global regulatory oversight of fundraising activities, including local registration requirements in various jurisdictions and the addition of new compliance regimes, could make it more difficult for us to raise new funds or could increase the cost of raising such funds.
Alternative Investment Fund Managers Directive
AIFMD applies to: (i) AIFMs established in the EEA that manage EEA or non-EEA AIFs; (ii) non-EEA AIFMs that manage EEA AIFs; and (iii) non-EEA AIFMs that market their AIFs to professional investors within the EEA. Non-EEA AIFMs do not currently benefit from marketing passport rights and may only market AIFs to investors in some EEA jurisdictions in accordance with national private placement regimes. The U.K. implemented AIFMD while it was still a member of the EU and “on-shored” it as part of U.K. law, such that similar requirements continue to apply in the U.K. notwithstanding Brexit.
In the EU, an amending directive to AIFMD, commonly referred to as “AIFMD II” was published on March 26, 2024 and will become effective from April 16, 2026, subject to the grandfathering period for certain of the loan origination provisions and certain Annex IV disclosure requirements which will become effective a year later. It is not yet clear to what extent (if any) the U.K. will seek to reflect AIFMD II in its domestic rules implementing AIFMD.
The amending directive contains a number of amendments to AIFMD, including more onerous delegation requirements which may require a review of AM Lux’s existing arrangements, enhanced substance requirements, additional liquidity management provisions for AIFMs to the extent that they manage open-ended AIFs, and revised regulatory reporting and investor disclosures requirements. The directive also proposed significant new requirements relating to the activities of funds managed by AM Lux which originate loans including new restrictions on the structure which such funds may take.
AIFMD II may, depending on the jurisdiction of the AIF and the AIFM, result in new restrictions on the ability of certain of our affiliates other than AM Lux to register funds for marketing to investors in certain EEA states.
AIFMD II imposes a range of requirements on AIFMs which may increase the cost of doing business for AM Lux and Ares’ non-EEA AIFMs (including AMUKL) to the extent they market funds in the EEA and potentially disadvantages our funds as investors in private companies located in EEA member states compared to non-AIF/AIFM competitors that may not be subject to such requirements. It is not yet clear to what extent (if any) the U.K. will seek to reflect AIFMD II in its domestic rules implementing AIFMD.
We will continue to assess the impact of AIFMD II to AM Lux, our non-EEA AIFMs and AIFs that are managed and/or marketed in the EEA.
Solvency II
The European solvency framework and prudential regime for insurers and reinsurers, under the Solvency II Directive 2009/138/EC (“Solvency II”) imposes economic risk-based solvency requirements across all EU member states. Solvency II is supplemented by European Commission Delegated Regulation (EU) 2015/35 (the “Delegated Regulation”), other European Commission “delegated acts” and binding technical standards and guidelines issued by the European Insurance and Occupational Pensions Authority.
We are not subject to Solvency II; however, many of our European insurer or reinsurer fund investors are subject to this directive, as applied under applicable domestic law and any amendments may impact insurers’ and reinsurers’ investment decisions and their asset allocations. On September 22, 2021, the European Commission published proposed legislation to amend the Solvency II Directive, which has since been approved by the European Parliament on October 8, 2024 and the Council of the EU on November 5, 2024. The amending directive is expected to take effect from December 2026.
Post Brexit, Solvency II assimilated into U.K. law as “Solvency U.K.” and is undergoing reform to simplify the administrative and reporting requirements, reduce costs and widen the categories of assets which insurers can hold in their portfolios. The amendments have been staggered, with certain provisions entering into force on December 31, 2023, June 30, 2024 and the remaining reforms on December 31, 2024.
It is unclear at this stage the extent to which the amendments to Solvency II or Solvency U.K. will have an indirect effect on our businesses.
Economic Crime and Corporate Transparency Act 2023
The U.K. introduced the Economic Crime and Transparency Act 2023 (“ECCTA”) on October 26, 2023. As part of ECCTA, a new ‘failure to prevent fraud’ offence was introduced in the U.K. (the “FTPF Offence”). The FTPF Offence is modeled on similar existing offences for ‘failure to prevent bribery’ and ‘failure to prevent the facilitation of tax evasion.’
The FTPF Offence imposes criminal liability on bodies corporate and partnerships, wherever incorporated, meeting specified size thresholds (so-called ‘large organizations’) where an ‘associate’ (being an employee, agent, subsidiary undertaking or person who provides services for or on behalf of the large organization) commits a U.K. fraud offence, unless the large organization has in place reasonable fraud prevention policies and procedures (or it was not reasonable to have policies and procedures in place). Owing to the complexity of this definition, certain fund structures (and potentially portfolio companies) could be caught in scope too. The FTPF Offence comes into effect on September 1, 2025. We are assessing the impact to our business and are reviewing our existing fraud prevention policies and procedures.
Hong Kong Security Law
On June 30, 2020, the National People’s Congress of China passed a national security law (the “National Security Law”), which criminalizes certain offenses including secession, subversion of the Chinese government, terrorism and collusion with foreign entities. The National Security Law also applies to non-permanent residents. Although the extra-territorial reach of the National Security Law remains unclear, the application of the National Security Law to conduct outside Hong Kong by non-permanent residents of Hong Kong could limit the activities of or negatively affect the Company, our funds and/or portfolio companies. The National Security Law has been condemned by the U.S., the U.K. and several EU countries and has created additional tensions between the U.S. and China. Escalation of tensions resulting from the National Security Law, including conflict between China and other countries, protests and other government measures, as well as other economic, social or political unrest in the future, could adversely impact the security and stability of the region and may have a material adverse effect on countries in which the Company, our funds and portfolio companies or any of their respective personnel or assets are located. In addition, any downturn in Hong Kong’s economy could adversely affect the financial performance of the Company and our investments, or could have a significant impact on the industries in which the Company participates, and may adversely affect the operations of the Company, its funds and portfolio companies, including the retention of investment and other key professionals located in Hong Kong.
Regulations governing the operation of our business development companies affect their ability to raise, and the way in which they raise, additional capital.
Our funds organized as BDCs operate as highly regulated businesses within the provisions of the Investment Company Act. Many of the regulations governing BDCs restrict, among other things, leverage incurrence, co-investments and other transactions with other entities within the Ares Operating Group. Certain of our funds may be restricted from engaging in transactions with our BDCs and their respective subsidiaries. As funds registered under the Investment Company Act, our BDCs may issue debt securities or preferred stock and borrow money from banks or other financial institutions, which we refer to collectively as “senior securities,” up to the maximum amount permitted by the Investment Company Act. Under the provisions of the Investment Company Act, our BDCs are currently permitted to incur indebtedness or issue senior securities only in amounts such that their respective asset coverage ratio, as calculated pursuant to the Investment Company Act, equals at least 150% after each such issuance. Our BDCs are also generally prohibited from issuing and selling their respective common stock at a price below net asset value per share without first obtaining approval from their respective stockholders and independent directors.
BDCs may issue and sell common stock at a price below net asset value per share only in limited circumstances, one of which is after obtaining stockholder approval for such issuance in accordance with the Investment Company Act. ARCC’s stockholders have, in the past, approved such issuances so that during the subsequent 12-month period, ARCC may, in one or more public or private offerings of its common stock, sell or otherwise issue shares of its common stock at a price below the then-current net asset value per share, subject to certain conditions including parameters on the amount of shares sold, approval of the sale by the directors and a requirement that the sale price be not less than approximately the market price of the shares of its common stock at specified times, less the expenses of the sale. ARCC may ask its stockholders for additional approvals from year to year. There can be no assurance that such approvals will be obtained. The extent to which ARCC is negatively affected by these regulations may affect our overall profitability.
The publicly-traded and perpetual wealth investment vehicles that we manage are subject to regulatory complexities that limit the way in which they do business and may subject them to a higher level of regulatory scrutiny.
The publicly-traded and perpetual wealth investment vehicles that we manage operate under a complex regulatory environment. Such companies require the application of complex tax and securities regulations and may entail a higher level of regulatory scrutiny. In addition, regulations affecting our publicly-traded and perpetual wealth investment vehicles generally affect their ability to take certain actions. Certain of our vehicles have elected to be treated as a RIC or a REIT for U.S. federal income tax purposes. To maintain their status as a RIC or a REIT, such vehicles must meet, among other things, certain source of income, asset diversification and annual distribution requirements. ARCC and ASIF are required to generally distribute to their respective stockholders at least 90% of their respective investment company taxable income to maintain their RIC status. To maintain its qualification as a REIT, ACRE, in addition to our diversified non-traded REIT and industrial non-traded REIT must distribute at least 90% of its taxable income to its stockholders and meet, on a continuing basis, certain other complex requirements under the Code. Certain of our perpetual wealth vehicles are subject to complex rules under the Investment Company Act, including rules that restrict certain of our funds from engaging in transactions with these perpetual wealth vehicles. In addition, subject to certain exceptions, our BDCs are generally prohibited from issuing and selling their common stock at a price below net asset value per share and from incurring indebtedness (including for this purpose, preferred stock), if the BDCs’ respective asset coverage ratio, as calculated pursuant to the Investment Company Act, equals less than 150% after giving effect to such incurrence. The extent to which the publicly-traded and perpetual wealth investment vehicles that we manage are negatively affected by these regulations may affect our overall profitability.
Failure to comply with “pay to play” regulations implemented by the SEC and certain states, and changes to the “pay to play” regulatory regimes, could adversely affect our businesses.
In recent years, the SEC and several states have initiated investigations alleging that certain private equity firms and hedge funds or agents acting on their behalf have paid money to current or former government officials or their associates in exchange for improperly soliciting contracts with state pension funds. Under SEC rules addressing “pay to play” practices, investment advisers are prohibited from providing advisory services for compensation to a government entity for two years, subject to very limited exceptions, after the investment adviser, its senior executives or its personnel involved in soliciting investments from government entities make contributions to certain candidates and officials in a position to influence the hiring of an investment adviser by such government entity. Advisers are required to implement compliance policies designed, among other matters, to track contributions by certain of the adviser’s employees and engagements of third parties that solicit government entities and to keep certain records to enable the SEC to determine compliance with the rule. In addition, there have been similar rules on a state level regarding “pay to play” practices by investment advisers. FINRA also has its own set of “pay to play” regulations that are similar to the SEC’s regulations.
As we have a significant number of public pension plans that are investors in our funds, these rules could impose significant economic sanctions on our businesses if we or one of the other persons covered by the rules make any such contribution or payment, whether or not material or with an intent to secure an investment from a public pension plan. We may also acquire other investment managers or hire additional personnel who are not subject to the same restrictions as us, but whose activity, and the activity of their principals, prior to our ownership or employment of such person could affect our fundraising. In addition, such investigations may require the attention of senior management and may result in fines if any of our funds are deemed to have violated any regulations, thereby imposing additional expenses on us. Any failure on our part to comply with these rules could cause us to lose compensation for our advisory services or expose us to significant penalties and reputational damage.
Increasing scrutiny from stakeholders and regulators with respect to ESG matters could impact our or our funds’ portfolio companies’ reputation, the cost of our or their operations, or result in investors ceasing to allocate their capital to us, all of which could adversely affect our business and results of operations.
We, our funds and their portfolio companies face increasing public scrutiny related to ESG activities. A variety of organizations measure the performance of companies on ESG topics, and the results of these assessments are widely publicized. Investment in funds that specialize in companies that perform well in such assessments remain popular, and major institutional investors have publicly discussed their consideration of such ESG ratings and measures in making their investment decisions. If our ESG ratings or practices do not meet the standards set by such investors or our stockholders, or if we fail, or are perceived to fail, to demonstrate progress toward our ESG goals and initiatives, they may choose not to invest in our funds or exclude our common stock from their investments. Relatedly, we, our funds and their portfolio companies risk damage to our brands and reputations, if we or they do not or are perceived to not act responsibly in a number of areas, including, but not limited to human rights, climate change and environmental stewardship, support for local communities, corporate governance and transparency, or consideration of ESG factors in our investment processes. Adverse incidents with respect to ESG activities could impact the value of our brand, the brand of our funds or their portfolio companies, or the cost of our or their operations and relationships with investors, all of which could adversely affect our business and results of operations.
Conversely, anti-ESG sentiment has gained momentum across the U.S., with a growing number of states, federal agencies, the executive branch and Congress having enacted or proposed or indicated an intent to pursue “anti-ESG” policies, legislation, issued related legal opinions and engaged in related investigation and litigation. For example: (i) boycott bills target financial institutions that “boycott” or “discriminate against” companies in certain industries (e.g., energy and mining) and prohibit state entities from doing business with such institutions and/or investing the state’s assets (including pension plan assets) through such institutions; and (ii) ESG investment prohibitions require that state entities or managers/administrators of state investments make investments based solely on pecuniary factors without consideration of ESG factors. If investors subject to such legislation viewed our funds or responsible investing or ESG practices, including our climate-related goals and commitments, as being in contradiction of such “anti-ESG” policies, legislation or legal opinions, such investors may not invest in our funds, our ability to maintain the size of our funds could be impaired, and it could negatively affect results of our operations, cash flow or the price of our common stock. Further, asset managers have been subject to recent scrutiny related to ESG-focused industry working groups, initiatives and associations, including organizations advancing action to address ESG matters, climate change or climate-related risk. In addition, some advocacy groups and federal and state officials have asserted that the Supreme Court’s decision striking down race-based affirmative action in higher education in June 2023 should be analogized to private employment matters and private contract matters. Several media campaigns and cases alleging discrimination based on such arguments have been initiated since the decision, with scrutiny of certain corporate DEI practices increasing. In January 2025, the new Presidential Administration signed a number of Executive Orders focused on DEI, which
include a broad mandate to eliminate federal DEI programs and indicate continued scrutiny of DEI initiatives, potential investigations of certain private entities, including publicly traded companies, and changes to federal contracting regulations.
If we do not successfully manage expectations across these varied stakeholder interests, it could erode stakeholder trust, impact our reputation and constrain our investment opportunities. Such scrutiny of both ESG and DEI related practices could expose us to the risk of litigation, investigations or challenges by federal or state authorities, result in reputational harm and/or discourage certain investors from investing in our products. In addition, clients and investors may decide not to commit capital to future fundraises as a result of their assessment of our approach to and consideration of ESG. To the extent our access to capital from clients or investors focused on ESG ratings or matters is impaired, we may not be able to maintain or increase the size of our specialized funds or raise sufficient capital for new specialized funds, which may adversely affect our revenues.
In addition, our ESG initiatives, goals, targets, intentions and expectations are subject to change, and no assurance or guarantee can be given that such goals, targets, intentions or expectations (some of which are aspirational in nature) will be met. Statistics and metrics that we report relating to ESG matters are estimates and may be based on assumptions or developing standards (including our internal standards and policies). There can be no assurance that our ESG policies and procedures, including policies and procedures related to responsible investment or the application of ESG-related criteria or reviews to the investment process, including certain metrics or frameworks, will continue. Such policies and procedures may change, even materially, or may not be applied to certain investments. In addition, the act of selecting and evaluating material ESG factors is subjective by nature, and there is no guarantee that the criteria utilized, or judgement exercised by Ares, will reflect the beliefs or values, internal policies or preferred practices of investors or other managers, or align with market trends. Further, Ares may determine at any point that it is not feasible or practical to implement or complete certain of its ESG initiatives, policies and procedures based on cost, timing or other considerations.
Additionally, certain regulations related to ESG that are applicable to us, our funds and their portfolio companies could adversely affect our business. The European Commission’s “action plan on financing sustainable growth” (“Action Plan”) is designed to, among other things, define and reorient investment toward more sustainable economic activities. The Action Plan contemplates, among other things: establishing EU labels for green financial products; clarifying asset managers’ and institutional investors’ duties regarding sustainability in their investment decision-making processes; increasing disclosure requirements in the financial services sector around sustainability and increasing the transparency of companies on their ESG policies and related processes and management systems; and introducing a ‘green supporting factor’ in the EU prudential rules for banks and insurance companies to incorporate climate risks into banks’ and insurance companies’ risk management policies.
The Taxonomy Regulation is a classification system that establishes a list of environmentally sustainable economic activities and sets out four overarching conditions that an economic activity has to meet in order to qualify as environmentally sustainable. The Taxonomy Regulation, amongst other things, introduces mandatory disclosure and reporting requirements and supplements the framework set out in the SFDR, which requires certain disclosures at both firm and fund level.
For Ares, this primarily impacts our AIFMs and the funds they manage by requiring certain firm-level website disclosures regarding how sustainability risks are integrated into our investment process, consideration of adverse impacts of investment decisions on sustainability factors and transparency of remuneration practices and inclusion of certain fund-level information in pre-contractual and periodic disclosures. There is a risk that a significant reorientation in the market following the implementation of these regulations and further measures could be adverse to our funds’ portfolio companies if they are perceived to be less valuable as a consequence of, among other things, their carbon footprint or allegations or evidence of “greenwashing” (i.e., the holding out of a product as having green or sustainable characteristics where this is not, in fact, the case). There is also a risk that market expectations in relation to SFDR categorization of financial products could adversely affect our ability to raise capital from EEA investors. In September 2023, the European Commission announced a consultation on refinement versus a wholesale re-write of product categorization criteria under SFDR and in May 2024, the European Commission published a summary of the consultation but there are currently no formal proposals for legislative change. Ares cannot guarantee that its current approach will meet future regulatory requirements, reporting frameworks or best practices, increasing the risk of related enforcement. Compliance with new requirements may lead to increased management burdens and costs.
Guidance from EU policymakers and supervisors moves the goalposts frequently, for example, the finalized ESMA Guidelines on Fund Names (the “Guidelines”), which took effect on November 21, 2024 for new funds and May 21, 2025 for funds launched before November 21, 2024. It is not possible at this stage to fully assess how our business will be affected by EU sustainable finance and corporate sustainability reporting initiatives. Such guidelines may require changes to either the names of certain Ares funds or changes to their portfolio composition. We, our funds and their portfolio companies are subject to the risk that similar measures might be introduced in other jurisdictions in which we or they currently have investments or plan to invest in the future. Additionally, compliance with any new laws or regulations (including recent heightened SEC scrutiny regarding advisor compliance with advisors’ own internal policies) increases our regulatory burden and could make
compliance more difficult and expensive, affect the manner in which we, our funds or their portfolio companies conduct our businesses and adversely affect our profitability.
Moreover, on January 5, 2023, the Corporate Sustainability Reporting Directive (“CSRD”) came into effect. Broadly, CSRD amends and strengthens the rules introduced on sustainability reporting for companies, banks and insurance companies under the Non-Financial Reporting Directive (2014/95/EU) (“NFRD”). CSRD requires a much broader range of companies to produce detailed and prescriptive reports on sustainability-related matters within their financial statements – including large EU companies (including EU subsidiaries of non-EU parent companies), EU and non-EU-companies (including small and medium sized enterprises) with listed securities on EU-regulated markets (except micro-undertakings) and non-EU companies with significant turnover and a legal presence on EU markets.
The reporting requirements started being phased in from 2024, with the first reports including audited information on sustainability-related matters expected to be published in 2025 to cover the 2024 financial year. For EU companies, disclosures must be made in accordance with European Sustainability Reporting Standards, the first set of which were published in the Official Journal on December 22, 2023 under the form of a delegated regulation. Sector-specific, non-EU company and small and medium enterprise reporting standards are still being developed. CSRD remains subject to change and there can be no assurance that adverse developments with respect to CSRD will not adversely affect Ares or assets held by Ares managed funds that are held in certain countries or the returns from these assets. One or more of our businesses may fall within scope of CSRD and this may lead to increased management burdens and costs.
In the U.K., the FCA has introduced a regulatory framework focused on implementing the recommendations of the Financial Stability Board’s TCFD and, in particular, by introducing mandatory TCFD-aligned disclosure requirements for certain FCA authorized firms. Pursuant to these rules AML and AMUKL will have to disclose certain climate-related financial information in line with the four overarching pillars of the TCFD recommendations (Governance, Strategy, Risk Management, Metrics & Targets) annually on a mandatory basis. Collating the relevant data and preparing the relevant report under these new rules could impose additional compliance and administrative burden which could in turn increase costs.
The U.K. Sustainability Labelling and Disclosure of Sustainability-Related Financial Information Instrument 2023 (“SDR”) introduces sustainability disclosure requirements, investment product labels and an ‘anti-greenwashing’ rule. The anti-greenwashing rule applies to all U.K.-authorized firms in their communications with clients in the U.K. in relation to a product or service or when communicating or approving a financial promotion to a person in the U.K. The FCA has consulted in early 2024 on alternative approaches to applying the labelling regime to portfolio managers and continues to work with His Majesty’s Treasury to consider its approach in respect of overseas funds. If these rules become applicable to our funds or products, then additional regulatory costs may be incurred and they may also have an impact on our ability to deliver on our fund’s investment strategies and financial returns could be adversely impacted as a result.
In Asia, regulators in Singapore and Hong Kong have released guidelines for asset managers to integrate climate risk considerations in investment and risk management processes, together with enhanced disclosure and reporting and have also issued enhanced rules for certain ESG funds on general ESG risk management and disclosure. Australia’s securities regulator issued information on “greenwashing”, and the Australian government is seeking input on the design and implementation of a climate-related financial disclosure regime.
There is also regulatory interest across jurisdictions in improving transparency regarding the definition, measurement and disclosure of ESG factors in order to allow investors to validate and better understand sustainability claims. For example, the SEC sometimes reviews compliance with ESG commitments in examinations, and it has taken enforcement actions against registered investment advisers for not establishing adequate or consistently implementing ESG policies and procedures to meet ESG commitments to investors. Growing interest on the part of investors and regulators in ESG factors and increased demand for, and scrutiny of, ESG-related disclosure by asset managers, have also increased the risk that asset managers could be perceived as, or accused of, making inaccurate or misleading statements regarding the ESG-related investment strategies or their and their funds’ ESG efforts or initiatives, or “greenwashing.” Such perception or accusation could damage our reputation, result in litigation or regulatory actions and adversely impact our ability to raise capital.
In March 2024, the SEC adopted final rules intended to enhance and standardize climate-related disclosures; however these rules are stayed pending the outcome of consolidated legal challenges in the Eighth Circuit Court of Appeals. At the state level, in October 2023, California enacted legislation that will ultimately require certain companies that do business in California to publicly disclose their Scopes 1, 2, and 3 greenhouse gas emissions, with third party assurance of such data, and issue public reports on their climate-related financial risk and related mitigation measures.
Compliance with any new laws or regulations increases our regulatory burden and could result in increased legal, accounting and financial compliance costs, make some activities more difficult, time-consuming and costly, place strain on our
personnel, systems and resources, affect the manner in which we or our funds’ portfolio companies conduct our businesses and adversely affect our profitability.
Economic sanction laws in the U.S. and other jurisdictions may prohibit us and our affiliates from transacting with certain countries, individuals and companies, which could negatively impact our business, financial condition and operating results.
Economic sanction laws in the U.S. and other jurisdictions may restrict or prohibit us or our affiliates from transacting with certain countries, territories, individuals and entities. In the U.S., the U.S. Department of the Treasury’s Office of Foreign Assets Control (“OFAC”) administers and enforces laws, executive orders and regulations establishing U.S. economic and trade sanctions, which restrict or prohibit, among other things, direct and indirect transactions with, and the provision of services to, certain foreign countries, territories, individuals and entities. These types of sanctions may significantly restrict or completely prohibit lending activities in certain jurisdictions, and if we were to violate any such laws or regulations, we may face significant legal and monetary penalties, as well as reputational damage. OFAC sanctions programs change frequently, which may make it more difficult for us or our affiliates to ensure compliance. Moreover, OFAC enforcement is increasing, which may increase the risk that an issuer or we become subject of such actual or threatened enforcement.
For instance, the Iran Threat Reduction and Syria Human Rights Act of 2012 (the “ITRA”) expanded the scope of U.S. sanctions against Iran. Additionally, Section 219 of the ITRA amended the Exchange Act to require companies subject to SEC reporting obligations under Section 13 of the Exchange Act to disclose in their periodic reports specified dealings or transactions involving Iran or other individuals and entities targeted by certain OFAC sanctions engaged in by the reporting company or any of its affiliates during the period covered by the relevant periodic report. In some cases, the ITRA requires companies to disclose these types of transactions even if they were permissible under U.S. law. Companies that currently may be or may have been at the time considered our affiliates have from time to time publicly filed and/or provided to us the disclosures reproduced in our Quarterly Reports. We do not independently verify or participate in the preparation of these disclosures. Disclosure of such activity, even if such activity is not subject to sanctions under applicable law, and any sanctions actually imposed on us or our affiliates as a result of these activities, could harm our reputation and have a negative impact on our business, financial condition and results of operations, and any failure to disclose any such activities as required could additionally result in fines or penalties. In addition, any sanctions imposed by the U.S. and other countries in connection with hostilities between Russia and Ukraine and more recently between Israel and Hamas may impact us, our funds and their portfolio companies.
The U.K.’s exit from the EU (“Brexit”) could adversely affect our business and our operations
Following the U.K.'s exit from the EU on January 31, 2020 and a transitional period, EEA “passporting rights” which previously facilitated certain EEA investor-facing activities by AML and AMUKL, are no longer available. AM Lux and its EU branches were established to enable Ares to continue certain regulated activities in the EU post Brexit, such as the management and marketing of funds (including funds managed by affiliates of AM Lux) to European investors.
The Trade and Cooperation Agreement (the “TCA”) governs certain matters between the U.K. and the EU. While the TCA includes a commitment by the U.K. and the EU to keep their markets open for persons wishing to provide financial services through a permanent establishment, it does not substantively address future cooperation in the financial services sector or reciprocal market access into the EU by U.K. firms under equivalence arrangements or otherwise.
The U.K. is currently reviewing its financial services and markets regime. To the extent that the revised U.K. regime materially diverges from the EU regime, compliance with two diverging regulatory regimes may increase the operational burden and cost to our operations in these jurisdictions.
These complex issues and other by-products of Brexit may increase the costs of having operations, conducting business and making investments in the U.K. and Europe. As a result, the performance of our funds which are focused on investing in the U.K. and to a lesser extent across Europe, such as certain funds in our Credit and Real Assets Groups may be disproportionately affected compared to those funds that invest more broadly across global geographies or are focused on different regions. In addition, Brexit could potentially disrupt the tax jurisdictions in which we operate and affect the tax benefits or liabilities in these or other jurisdictions in a manner that is adverse to us and/or our funds.
We are subject to risks in using prime brokers, custodians, counterparties, administrators and other agents.
Many of our funds depend on the services of prime brokers, custodians, counterparties, administrators and other agents to carry out certain securities and derivatives transactions and other administrative services. We are subject to risks of errors and mistakes made by these third parties, which may be attributed to us and subject us or our fund investors to reputational
damage, penalties or losses. We may be unsuccessful in seeking reimbursement or indemnification from these third-party service providers.
The terms of the contracts with these third-party service providers are often customized and complex, and many of these arrangements occur in markets or relate to products that are not subject to regulatory oversight, although the Dodd-Frank Act provides for regulation of the derivatives market. In particular, some of our funds utilize prime brokerage arrangements with a relatively limited number of counterparties, which has the effect of concentrating the transaction volume (and related counterparty default risk) of these funds with these counterparties.
Our funds are subject to the risk that the counterparty to one or more of these contracts defaults, either voluntarily or involuntarily, on its performance under the contract. Any such default may occur suddenly and without notice to us. Moreover, if a counterparty defaults, we may be unable to take action to cover our exposure, either because we lack contractual recourse or because market conditions make it difficult to take effective action. This inability could occur in times of market stress, which is when defaults are most likely to occur.
In addition, our risk-management models may not accurately anticipate the impact of market stress or counterparty financial condition, and as a result, we may not have taken sufficient action to reduce our risks effectively. Default risk may arise from events or circumstances that are difficult to detect, foresee or evaluate. In addition, concerns about, or a default by, one large participant could lead to significant liquidity problems for other participants, which may in turn expose us to significant losses.
Although we have risk-management models and processes to ensure that we are not exposed to a single counterparty for significant periods of time, given the large number and size of our funds, we often have large positions with a single counterparty. For example, most of our funds have credit lines. If the lender under one or more of those credit lines were to become insolvent, we may have difficulty replacing the credit line and one or more of our funds may face liquidity problems.
In the event of a counterparty default, particularly a default by a major investment bank or a default by a counterparty to a significant number of our contracts, one or more of our funds may have outstanding trades that they cannot settle or are delayed in settling. As a result, these funds could incur material losses and the resulting market impact of a major counterparty default could harm our businesses, results of operation and financial condition.
In the event of the insolvency of a prime broker, custodian, counterparty or any other party that is holding assets of our funds as collateral, our funds might not be able to recover equivalent assets in full as they will rank among the prime broker’s, custodian’s or counterparty’s unsecured creditors in relation to the assets held as collateral. In addition, our funds’ cash held with a prime broker, custodian or counterparty generally will not be segregated from the prime broker’s, custodian’s or counterparty’s own cash, and our funds may therefore rank as unsecured creditors in relation thereto.
The counterparty risks that we face have increased in complexity and magnitude as a result of disruption in the financial markets in recent years. In addition, counterparties have generally reacted to recent market volatility by tightening their underwriting standards and increasing their margin requirements for all categories of financing, which has the result of decreasing the overall amount of leverage available and increasing the costs of borrowing.
A portion of our revenue, earnings and cash flow is variable, which may make it difficult for us to achieve steady earnings growth on a quarterly basis and may cause the price of shares of our Class A common stock to decline.
A portion of our revenue, earnings and cash flow is variable, primarily due to the fact that carried interest and incentive fees that we receive from certain of our funds can vary from quarter to quarter and year to year. In addition, the investment returns of most of our funds are volatile. We may also experience fluctuations in our results from quarter to quarter and year to year due to a number of other factors, including changes in the values of our funds’ investments, changes in the amount of distributions, dividends or interest paid in respect of investments, changes in our operating expenses, the degree to which we encounter competition and general economic and market conditions. Such variability may lead to volatility in the trading price of shares of our Class A common stock and cause our results for a particular period not to be indicative of our performance in a future period. It may be difficult for us to achieve steady growth in earnings and cash flow on a quarterly basis, which could in turn lead to large adverse movements in the price of shares of our Class A common stock or increased volatility in the price of shares of our Class A common stock generally.
The timing and amount of carried interest and incentive fees generated by our funds is uncertain and contributes to the volatility of our results. It takes a substantial period of time to identify attractive investment opportunities, to diligence and finance an investment and then to realize the cash value or other proceeds of an investment through a sale, public offering, recapitalization or other exit. Even if an investment proves to be profitable, it may be several years before any profits can be realized in cash or other proceeds. We cannot predict when, or if, any realization of investments will occur. If we were to have a
realization event in a particular quarter or year, it may have a significant impact on our results for that particular quarter or year that may not be replicated in subsequent periods. We recognize revenue on investments in our funds based on our allocable share of realized and unrealized gains (or losses) reported by such funds, and a decline in realized or unrealized gains, or an increase in realized or unrealized losses, would adversely affect our revenue, which could increase the volatility of our results.
With respect to our funds that generate carried interest, the timing and receipt of such carried interest varies with the life cycle of our funds. During periods in which a relatively large portion of our assets under management is attributable to funds and investments in their “harvesting” period, our funds would make larger distributions than in the fund-raising or investment periods that precede harvesting. During periods in which a significant portion of our assets under management is attributable to funds that are not in their harvesting periods, we may receive substantially lower carried interest distributions. Moreover in some cases, we receive carried interest payments only upon realization of investments by the relevant fund, which contributes to the volatility of our cash flow and in other funds we are only entitled to carried interest payments after a return of all contributions and a preferred return to investors.
With respect to our funds that pay an incentive fee, the incentive fee is generally paid annually. In many cases, we earn this incentive fee only if the net asset value of a fund has increased or, in the case of certain funds, increased beyond a particular threshold. Some of our funds also have “high water marks.” If the high water mark for a particular fund is not surpassed, we would not earn an incentive fee with respect to that fund during a particular period even if the fund had positive returns in such period as a result of losses in prior periods. If the fund were to experience losses, we would not be able to earn an incentive fee from such fund until it surpassed the previous high water mark. The incentive fees we earn are, therefore, dependent on the net asset value of our fund investments, which could lead to significant volatility in our results. Finally, the timing and amount of incentive fees generated by our closed-end funds are uncertain and will contribute to the volatility of our earnings. Incentive fees depend on our closed-end funds’ investment performance and opportunities for realizing gains, which may be limited.
Because a portion of our revenue, earnings and cash flow can be variable from quarter to quarter and year to year, we do not plan to provide any guidance regarding our expected quarterly and annual operating results. The lack of guidance may affect the expectations of public market analysts and could cause increased volatility in the price of shares of our Class A common stock.
Fraud and other deceptive practices or other misconduct at our funds’ portfolio companies, properties or projects could similarly subject us to liability and reputational damage and also harm our businesses.
In recent years, the U.S. Department of Justice and the SEC have devoted greater resources to enforcement of the FCPA. In the U.K., the Bribery Act of 2010 (the “U.K. Bribery Act”) prohibits companies that conduct business in the U.K. and their employees and representatives from giving, offering or promising bribes to any person, including non-U.K. government officials, as well as requesting, agreeing to receive or accepting bribes from any person. Under the U.K. Bribery Act, companies may be held liable for failing to prevent their employees and associated persons from violating the Act. While we have developed and implemented policies and procedures designed to ensure strict compliance by us and our personnel with the FCPA and U.K. Bribery Act, such policies and procedures may not be effective in all instances to prevent violations. Any determination that we have violated the FCPA, the U.K. Bribery Act or other applicable anti-corruption laws could subject us to, among other things, civil and criminal penalties, material fines, profit disgorgement, injunctions on future conduct, securities litigation and a general loss of investor confidence, any one of which could adversely affect our business prospects, financial position or the market value of shares of our Class A common stock.
In addition, we could be adversely affected as a result of actual or alleged misconduct by personnel of portfolio companies, properties or projects in which our funds invest, if there are failures to comply with regulations or other legal and regulatory requirements that could expose us to litigation or regulatory action and otherwise adversely affect our businesses and reputation. Such misconduct could negatively affect the valuation of a fund’s investments and consequently affect our funds’ performance and negatively impact our businesses. In addition, we may face an increased risk of such misconduct to the extent our investment in foreign markets, particularly emerging markets, increase. Such markets may not have established laws and regulations that are as stringent as in more developed nations, or existing laws and regulations may not be consistently enforced. Due diligence on investment opportunities in these jurisdictions is frequently more complicated because consistent and uniform commercial practices in such locations may not have developed. Misconduct may be especially difficult to detect in such locations, and compliance with applicable laws may be difficult to maintain and monitor.
Our use of leverage to finance our businesses exposes us to substantial risks.
As of December 31, 2024, we had no borrowings outstanding under our credit facility (the “Credit Facility”), and aggregate principal amount of senior notes and subordinated notes of $2,150.0 million and $450.0 million, respectively, are outstanding. We may choose to finance our businesses operations through further borrowings under the Credit Facility or by issuing additional debt. Our existing and future indebtedness exposes us to the typical risks associated with the use of leverage,
including the same risks that are applicable to our funds that use leverage as discussed below under “—Risks Related to Our Funds—Dependence on significant leverage by our funds subjects us to volatility and contractions in the debt financing markets could adversely affect our ability to achieve attractive rates of return on those investments.” The occurrence or continuation of any of these events or trends could cause us to suffer a decline in the credit ratings assigned to our debt by rating agencies, which would cause the interest rate applicable to borrowings under the Credit Facility to increase and could result in other material adverse effects on our businesses. We depend on financial institutions extending credit to us on terms that are reasonable to us. There is no guarantee that such institutions will continue to extend credit to us or renew any existing credit agreements we may have with them, or that we will be able to refinance outstanding facilities when they mature. In addition, the incurrence of additional debt in the future could result in potential downgrades of our existing corporate credit ratings, which could limit the availability of future financing and/or increase our cost of borrowing. Furthermore, the Credit Facility and the indenture governing our senior notes contain certain covenants with which we need to comply. Non-compliance with any of the covenants without cure or waiver would constitute an event of default, and an event of default resulting from a breach of certain covenants could result, at the option of the lenders, in an acceleration of the principal and interest outstanding. In addition, if we incur additional debt, our credit rating could be adversely impacted.
Borrowings under the Credit Facility will mature in March 2029, our tranches of senior notes mature in November 2028, June 2030, February 2052 and October 2054, respectively, and our subordinated notes mature in June 2051. As these borrowings and other indebtedness mature (or are otherwise repaid prior to their scheduled maturities), we may be required to either refinance them by entering into new facilities or issuing additional debt, which could result in higher borrowing costs, or issuing equity, which would dilute existing stockholders. We could also repay these borrowings by using cash on hand, cash provided by our continuing operations or cash from the sale of our assets, which could reduce distributions to holders of our Class A or non-voting common stock. We may be unable to enter into new facilities or issue debt or equity in the future on attractive terms, or at all. Borrowings under the Credit Facility are SOFR-based obligations. As a result, an increase in short-term interest rates will increase our interest costs if such borrowings have not been hedged into fixed rates.
The risks related to our use of leverage may be exacerbated by our funds’ use of leverage to finance investments. See “—Risks Related to Our Funds—Dependence on significant leverage by our funds subjects us to volatility and contractions in the debt financing markets could adversely affect our ability to achieve attractive rates of return on those investments.”
We are exposed to risks associated with changes in interest rates.
General interest rate fluctuations may have a substantial negative impact on our investments and investment opportunities and, accordingly, may have a material adverse effect on our investment objective and our net investment income. Because we borrow money and may issue debt securities or preferred stock to make investments, our net investment income is dependent upon the difference between the rate at which we borrow funds or pay interest or dividends on such debt securities or preferred stock and the rate at which we invest these funds. If market rates decrease we may earn less interest income from investments made during such lower rate environment. From time to time, we may also enter into certain hedging transactions to mitigate our exposure to changes in interest rates. In the past, we have entered into certain hedging transactions, such as interest rate swap agreements, to mitigate our exposure to adverse fluctuations in interest rates, and we may do so again in the future. In addition, we may increase our floating rate instruments to position the portfolio for rate increases. On a market value basis, approximately 84% of the debt assets within our Credit Group were floating rate instruments as of December 31, 2024, which we believe helps mitigate volatility associated with changes in interest rates. However, we cannot assure you that such transactions will be successful in mitigating our exposure to interest rate risk. There can be no assurance that a significant change in market interest rates will not have a material adverse effect on our net investment income.
Trading prices tend to fluctuate more for fixed rate securities that have longer maturities. Although we have no policy governing the maturities of our investments, under current market conditions we expect that we will invest in a portfolio of debt generally having maturities of up to ten years. Trading prices for debt that pays a fixed rate of return tend to fall as interest rates rise. This means that we are subject to greater risk (other things being equal) than a fund invested solely in shorter-term securities. A decline in the prices of the debt we own could adversely affect the trading price of our common stock. Also, an increase in interest rates available to investors could make an investment in our common stock less attractive if we are not able to increase our dividend rate, which could reduce the value of our common stock.
Operational risks may disrupt our businesses, result in losses or limit our growth.
We face operational risk from errors made in the execution, confirmation or settlement of transactions. We also face operational risk from transactions and key data not being properly recorded, evaluated or accounted for in our funds. In particular, our Credit Group, and to a lesser extent our Private Equity Group, are highly dependent on our ability to process and evaluate, on a daily basis, transactions across markets and geographies in a time-sensitive, efficient and accurate manner. Consequently, we rely heavily on our financial, accounting and other data processing systems. New investment products we
may introduce could create a significant risk that our existing systems may not be adequate to identify or control the relevant risks in the investment strategies employed by such new investment products.
In addition, we operate in a business that is highly dependent on information systems and technology. Our information systems and technology may not continue to be able to accommodate our growth, particularly our growth internationally, and the cost of maintaining the information systems technology may increase from its current level. Such a failure to accommodate growth, or an increase in costs related to the information systems technology, could have a material adverse effect on our business and results of operations.
Furthermore, our headquarters and a substantial portion of our personnel are located in Los Angeles. An earthquake or other disaster or a disruption in the infrastructure that supports our businesses, including a disruption involving electronic communications, our internal human resources systems or other services used by us or third parties with whom we conduct business, or directly affecting our headquarters, could have a material adverse effect on our ability to continue to operate our businesses without interruption. Although we have disaster recovery programs in place, these may not be sufficient to mitigate the harm that may result from such a disaster or disruption. In addition, insurance and other safeguards might only partially reimburse us for our losses, if at all.
We also rely on third-party service providers for certain aspects of our businesses, including for certain information systems, technology and administration of our funds and compliance matters. Operational risks could increase as third-party service providers increasingly offer mobile and cloud-based software services rather than software services that can be operated within our own data centers, as certain aspects of the security of such technologies may be complex, unpredictable or beyond our control, and any failure by mobile technology or cloud service providers to adequately safeguard their systems and prevent cyber-attacks could disrupt our operations and result in misappropriation, corruption or loss of confidential, proprietary or personal information. In addition, our counterparties’ information systems, technology or accounts may be the target of cyber-attacks. Any interruption or deterioration in the performance of these third parties or the service providers of our counterparties or failures or vulnerabilities of their respective information systems or technology could impair the quality of our funds’ operations and could impact our reputation, adversely affect our businesses and limit our ability to grow.
Finally, there continues to be significant evolution and developments in the use of artificial intelligence and machine learning technologies, including generative artificial intelligence and large language models. We cannot fully determine the impact of such evolving technology to our business at this time.
Our investments in subsidiaries that have sponsored SPACs and invested in their business combination targets may expose us to increased liabilities, and we may suffer the loss of all or a portion of our investments if the SPAC does not complete a business combination by the applicable deadline or the target is unsuccessful.
In February 2021, we invested $23.0 million into a subsidiary that is the sponsor of Ares Acquisition Corporation (formerly NYSE: AAC) (“AAC I”), a blank check company. On December 5, 2022, AAC I entered into a business combination agreement among AAC I, X-Energy Reactor Company, LLC (“X-energy”), a Delaware limited liability company and additional parties thereto. On October 31, 2023, AAC I announced that it mutually agreed to terminate its previously announced business combination with X-energy, given challenging market conditions, peer-company trading performance and a balancing of the benefits and drawbacks of becoming a publicly-traded company under current circumstances. Because AAC I did not complete a business combination within the time period required by its amended and restated memorandum and articles of association, AAC I redeemed all outstanding Class A ordinary shares and ceased all operations other than legal dissolution and liquidation. In December 2023, we invested $50.0 million into X-energy to support X-energy’s continued growth as a private company. We may lose all or a portion of our investment if X-energy is unsuccessful as a private company.
In April 2023, we invested $14.3 million into a subsidiary that is the sponsor of AAC II, a blank check company. AAC II has until April 25, 2025 to complete a business combination. Prior to a business combination, the sponsor of AAC II (and its permitted transferees) holds 100% of the Class B ordinary shares outstanding of AAC II. The Class B ordinary shares equal 20% of the outstanding ordinary shares of AAC II. Upon the successful completion of an acquisition the pro forma ownership of the new company will vary depending on the business combination terms. There can be no assurances that this scenario and the resulting ownership will manifest, as changes may be made depending upon business combination terms. There is no assurance that AAC II will be successful in completing a business combination or that any business combination will be successful.
Adverse regulatory and legal developments relating to SPACs and their sponsors could adversely affect our business and reputation and result in significant losses and expenses.
We have sponsored SPACs including AAC I, AAC II and may in the future continue to sponsor or otherwise utilize SPACs or other blank check companies in connection with the operation of our business. Regulatory and legal scrutiny of
SPACs and other blank check companies increased significantly in recent years. On July 1, 2024, new rules became effective that, among other items, impose additional disclosure requirements in business combination transactions involving SPACs and private operating companies; amend the financial statement requirements applicable to business combination transactions involving such companies; update and expand guidance regarding the general use of projections in SEC filings, including requiring disclosure of all material bases of the projections and all material assumptions underlying the projections; increase the potential liability of certain participants in proposed business combination transactions; and could impact the extent to which SPACs could become subject to regulation under the Investment Company Act. The SEC has also recently brought enforcement actions against a SPAC and its sponsor for misleading claims in advance of a proposed business combination. In addition, litigation challenging completed and pending acquisitions by SPACs has increased, and in such litigation, it is possible that sponsors and/or their director designees may be held liable either for breaches of fiduciary duties owed to the SPAC’s public stockholders or for certain actions or omissions by the SPAC, including the failure by the SPAC to comply with applicable securities laws. Litigation has also arisen asserting that SPACs are violating federal securities laws by operating as unregistered investment companies. Any liabilities arising from these developments could adversely impact our business as well as harm our professional reputation. Moreover, we may lose all or a portion of our investment in any SPAC that we sponsor or become affiliated with if a business combination is not completed as contemplated or if the business combination is unsuccessful, which may also result in significant regulatory scrutiny, litigation costs and other expenses.
Risks Related to Our Funds
The historical returns attributable to our funds should not be considered as indicative of the future results of our funds or of our future results or of any returns expected on an investment in shares of our Class A common stock.
We have presented returns relating to the historical performance of the funds we manage and certain targets of our future performance, including by reference to the internal rate of return (“IRR”) of certain funds’ performance using a gross IRR and a net IRR calculation. The historical performance of our funds is relevant to us primarily insofar as it is indicative of carried interest and incentive fees we have earned in the past and may earn in the future and our reputation and ability to raise new funds and therefore earn management fees on such new funds. The historical and potential returns of the funds we advise are not, however, directly linked to returns on shares of our Class A common stock. Therefore, holders of our Class A common stock should not conclude that positive performance of the funds we advise will necessarily result in positive returns on an investment in shares of our Class A common stock. An investment in shares of our Class A common stock is not an investment in any of our funds. Also, there is no assurance that projections in respect of our funds or unrealized valuations will be realized.
Moreover, the historical returns of our funds should not be considered indicative of the future returns of these or from any future funds we may raise. Performance metrics, such as IRR, going forward for any current or future fund may vary considerably from the historical performance generated by any particular fund, or for our funds as a whole. Future returns will also be affected by the risks described elsewhere in this Annual Report on Form 10-K, including risks of the industries and businesses in which a particular fund invests.
Valuation methodologies for certain assets can be subject to significant subjectivity, and our value of an asset may differ materially from the value ultimately realized.
Many of the investments of our funds are illiquid and thus have no readily ascertainable market prices. We value these investments based on our estimate, or an independent third party’s estimate, of their fair value as of the date of determination, which often involves significant subjectivity. There is no single standard for determining fair value in good faith and in many cases fair value is best expressed as a range of fair values from which a single estimate may be derived. We estimate the fair value of our investments based on third-party models, or models developed by us, which include discounted cash flow analyses and other techniques and may be based, at least in part, on independently sourced market parameters. The material estimates and assumptions used in these models include the timing and expected amount of cash flows, the appropriateness of discount rates used, and, in some cases, the ability to execute, the timing of and the estimated proceeds from expected financings, some or all of which factors may be ascribed more or less weight in light of the particular circumstances. The actual results related to any particular investment often vary materially as a result of the inaccuracy of these estimates and assumptions. In addition, because many of the illiquid investments held by our funds are in industries or sectors which are unstable, in distress or undergoing some uncertainty, such investments are subject to rapid changes in value caused by sudden company-specific or industry-wide developments.
We include the fair value of illiquid assets in the calculations of net asset values, returns of our funds and our assets under management. Furthermore, we recognize carried interest and incentive fees from affiliates based in part on these estimated fair values. Because these valuations are inherently uncertain, they may fluctuate greatly from period to period. Also, they may vary greatly from the prices that would be obtained if the assets were to be liquidated on the date of the valuation and
often do vary greatly from the prices we eventually realize; as a result, there can be no assurance that such unrealized valuations will be fully or timely realized.
In addition, the values of our investments in publicly-traded assets are subject to significant volatility, including due to a number of factors beyond our control. These include actual or anticipated fluctuations in the quarterly and annual results of these companies or other companies in their industries, market perceptions concerning the availability of additional securities for sale, general economic, social or political developments, changes in industry conditions or government regulations, changes in management or capital structure and significant acquisitions and dispositions. Because the market prices of these securities can be volatile, the valuations of these assets change from period to period, and the valuation for any particular period may not be realized at the time of disposition. In addition, market values may be based on indicative rather than actual trading prices, and may therefore lack precision. Further, because our funds often hold large positions in their portfolio companies, the disposition of these securities often is delayed for, or takes place over, long periods of time, which can further expose us to volatility risk. Even if we hold a quantity of public securities that may be difficult to sell in a single transaction, we do not discount the market price of the security for purposes of our valuations.
Although we frequently engage independent third parties to perform the foregoing valuations, the valuation process remains inherently subjective for the reasons described above.
If we realize value on an investment that is significantly lower than the value at which it was reflected in a fund’s net asset values, we would suffer losses in the applicable fund. This could in turn lead to a decline in asset management fees and a loss equal to the portion of the carried interest and incentive fees from affiliates reported in prior periods that was not realized upon disposition. These effects could become applicable to a large number of our investments if our estimates and assumptions used in estimating their fair values differ from future valuations due to market developments. See “Item 7. Management’s Discussion and Analysis of Financial Condition and Results of Operations—Segment Analysis” for information related to fund activity that is no longer consolidated. If asset values turn out to be materially different than values reflected in fund net asset values, fund investors could lose confidence which could, in turn, result in difficulties in raising additional investments.
The valuation process for the portfolio holdings of our registered funds and business development companies that we manage may create a conflict of interest.
Rule 2a-5 under the Investment Company Act establishes requirements for good faith determinations of fair value, and addresses both the board’s and the “valuation designee’s” roles and responsibilities relating to determinations of the fair value of securities without readily available market quotations. Each of the boards of the investment companies registered under the Investment Company Act (collectively, the “registered funds”) and the business development companies that we manage have designated their respective investment advisers to serve as valuation designee. These investment advisers are subsidiaries of the Company.
A substantial majority of our registered funds’ and business development companies’ portfolio holdings are comprised of investments that are not publicly-traded and do not otherwise have readily available market quotations. As a result, as required by the Investment Company Act and pursuant to Rule 2a-5 under the Investment Company Act, each of our registered funds’ and business development companies’ valuation designees will determine the fair value of these securities in good faith. The participation of employees of the Company’s subsidiaries in our business development companies’ valuation processes could result in a conflict of interest since certain of our funds pay base management fees that may fluctuate with changes in value.
Market values of debt instruments and publicly-traded securities that our funds hold as investments may be volatile.
The market prices of debt instruments and publicly-traded securities held by some of our funds may be volatile and are likely to fluctuate due to a number of factors beyond our control, including actual or anticipated changes in the profitability of the issuers of such securities, general economic, social or political developments, changes in industry conditions, changes in government regulation, shortfalls in operating results from levels forecast by securities analysts, inflation and rapid fluctuations in inflation rates and the general state of the securities markets as described above under “—Risks Related to Our Businesses—Difficult market and political conditions may adversely affect our businesses in many ways, including by reducing the value or hampering the performance of the investments made by our funds or reducing the ability of our funds to raise or deploy capital, each of which could materially reduce our revenue, earnings and cash flow and adversely affect our financial prospects and condition,” and other material events, such as significant management changes, financings, re-financings, securities issuances, acquisitions and dispositions. The value of publicly-traded securities in which our funds invest may be particularly volatile as a result of these factors. In addition, debt instruments that are held by our funds to maturity or for long terms must be “marked-to-market” periodically, and their values are therefore vulnerable to interest rate fluctuations and the changes in the general state of
the credit environment, notwithstanding their underlying performance. Changes in the values of these investments may adversely affect our investment performance and our results of operations.
Our funds may be unable to deploy capital at a steady and consistent pace, which could have an adverse effect on our results of operations and future fundraising.
The pace and consistency of our funds’ capital deployment has been, and may in the future continue to be, affected by a range of factors, including market conditions, regulatory developments and increased competition, which are beyond our control. In particular, the private equity and certain real estate markets have experienced a slowdown in deal activity. In addition, the private markets have from time to time experienced challenges with downward pressure on valuations and muted opportunities for investment and realizations. To the extent these market dynamics continue, it may continue to impact the pace and consistency of our funds’ capital deployment. During the same period, our AUM not yet paying fees may increase due to ongoing fundraising. While this AUM not yet paying fees represents significant future fee-earning potential, our inability to deploy this capital on the timeframe we expect, or at all, and on terms that we believe are attractive, would reduce or delay the management fees, carried interest and incentive fees that we would otherwise expect to earn on this capital. Any such reduction or delay would impair our ability to offset investments in additional resources that we often make to manage new capital, including hiring additional professionals. Moreover, we could be delayed in raising successor funds. The impact of any such reduction or delay would be particularly adverse with respect to funds where management fees are paid on invested capital. Any of the foregoing could have a material adverse effect on our results of operations and growth.
Our funds depend on investment cycles, and any change in such cycles could have an adverse effect on our investment prospects.
Cyclicality is important to our businesses. Weak economic environments have often provided attractive investment opportunities and strong relative investment performance. Conversely, we tend to realize value from our investments in times of economic expansion, when opportunities to sell investments may be greater. Thus, we depend on the cyclicality of the market to sustain our businesses and generate attractive risk-adjusted returns over extended periods. Any significant ongoing volatility or prolonged economic expansion or recession could have an adverse impact on certain of our funds and materially affect our ability to deliver attractive investment returns or generate incentive or other income.
Dependence on significant leverage by our funds subjects us to volatility and contractions in the debt financing markets could adversely affect our ability to achieve attractive rates of return on those investments.
Some of our funds and their investments rely on the use of leverage, and our ability to achieve attractive rates of return on investments will depend on our ability to access sufficient sources of indebtedness at attractive rates. If our funds or the companies in which our funds invest raise capital in the structured credit, leveraged loan, high yield bond or investment grade bond markets, the results of their operations may suffer if such markets experience dislocations, contractions or volatility. Any such events could adversely impact the availability of credit to businesses generally and could lead to an overall weakening of the U.S. and global economies.
Recently, the credit markets have experienced heightened volatility. Significant ongoing volatility or a protracted economic downturn could adversely affect the financial resources of our funds and their investments (in particular those investments that depend on credit from third parties or that otherwise participate in the credit markets) and their ability to make principal and interest payments on outstanding debt, or refinance outstanding debt when due. Moreover, these events could affect the terms of available debt financing with, for example, higher rates, higher equity requirements and/or more restrictive covenants, particularly in the area of acquisition financings for leveraged buyout and real estate assets transactions.
The absence of available sources of sufficient debt financing for extended periods of time or an increase in either the general levels of interest rates or in the risk spread demanded by sources of indebtedness would make it more expensive to finance those investments. Future increases in interest rates could also make it more difficult to locate and consummate investments because other potential buyers, including operating companies acting as strategic buyers, may be able to bid for an asset at a higher price due to a lower overall cost of capital or their ability to benefit from a higher amount of cost savings following the acquisition of the asset. In addition, a portion of the indebtedness used to finance investments often includes high yield debt securities issued in the capital markets. Availability of capital from the high yield debt markets is subject to significant volatility, and there may be times when our funds are unable to access those markets at attractive rates, or at all, when completing an investment. Certain investments may also be financed through borrowings on fund-level debt facilities, which may or may not be available for a refinancing at the end of their respective terms.
In the event that our funds are unable to obtain committed debt financing for potential acquisitions or can only obtain debt at an increased interest rate or on unfavorable terms, our funds may have difficulty completing otherwise profitable acquisitions or may generate profits that are lower than would otherwise be the case, either of which could reduce the
performance and investment income earned by us. Similarly, our funds’ portfolio companies regularly utilize the corporate debt markets to obtain financing for their operations. If the credit markets render such financing difficult to obtain or more expensive, this may negatively impact the operating performance of those portfolio companies and, therefore, the investment returns of our funds. In addition, if the markets make it difficult or impossible to refinance debt that is maturing in the near term, some of our funds’ portfolio companies may be unable to repay such debt at maturity and may be forced to sell assets, undergo a recapitalization or seek bankruptcy protection. Any of the foregoing circumstances could have a material adverse effect on our financial condition, results of operations and cash flow.
When our funds’ existing portfolio investments reach the point when debt incurred to finance those investments matures in significant amounts and must be either repaid or refinanced, those investments may materially suffer if they have not generated sufficient cash flow to repay maturing debt and there is insufficient capacity and availability in the financing markets to permit them to refinance maturing debt on satisfactory terms, or at all. A persistence of the limited availability of financing for such purposes for an extended period of time when significant amounts of the debt incurred to finance our funds’ existing portfolio investments becomes due could have a material adverse effect on these funds.
Our funds may choose to use leverage as part of their respective investment programs and certain funds, particularly in our Credit Group, regularly borrow a substantial amount of their capital. The use of leverage poses a significant degree of risk and enhances the possibility of a significant loss in the value of the investment portfolio. A fund may borrow money from time to time to purchase or carry securities or may enter into derivative transactions with counterparties that have embedded leverage. The interest expense and other costs incurred in connection with such borrowing may not be recovered by appreciation in the securities purchased or carried and will be lost, and the timing and magnitude of such losses may be accelerated or exacerbated, in the event of a decline in the market value of such securities. Gains realized with borrowed funds may cause the fund’s net asset value to increase at a faster rate than would be the case without borrowings. However, if investment results fail to cover the cost of borrowings, the fund’s net asset value could also decrease faster than if there had been no borrowings. In addition, as business development companies registered under the Investment Company Act, ARCC and ASIF are currently permitted to incur indebtedness or issue senior securities only in amounts such that its asset coverage ratio equals at least 150% after each such issuance. ARCC and ASIF’s ability to pay dividends will be restricted if their respective asset coverage ratio falls below 150% and any amounts that they use to service their respective indebtedness are not available for dividends to its common stockholders. Any of the foregoing circumstances could have a material adverse effect on our financial condition, results of operations and cash flow.
Some of our funds may invest in companies that are highly leveraged, which may increase the risk of loss associated with those investments.
Some of our funds may invest in companies whose capital structures involve significant leverage. For example, in many non-distressed private equity investments, indebtedness may be as much as 75% or more of a portfolio company’s or real estate asset’s total debt and equity capitalization, including debt that may be incurred in connection with the investment, whether incurred at or above the investment-level entity. In distressed situations, indebtedness may exceed 100% or more of a portfolio company’s capitalization. Investments in highly leveraged entities are inherently more sensitive to declines in revenues, increases in expenses and interest rates and volatile or adverse economic, market and industry developments. Additionally, the debt positions acquired by our funds may be the most junior in what could be a complex capital structure, and thus subject us to the greatest risk of loss in the event of insolvency, liquidation, dissolution, reorganization or bankruptcy of one of these companies. Furthermore, the incurrence of a significant amount of indebtedness by an entity could, among other things:
•subject the entity to a number of restrictive covenants, terms and conditions, any violation of which could be viewed by creditors as an event of default and could materially impact our ability to realize value from the investment;
•allow even moderate reductions in operating cash flow to render the entity unable to service its indebtedness, leading to a bankruptcy or other reorganization of the entity and a loss of part or all of our fund’s equity investment in it; and
•give rise to an obligation to make mandatory prepayments of debt using excess cash flow, which might limit the entity’s ability to respond to changing industry conditions if additional cash is needed for the response, to make unplanned but necessary capital expenditures or to take advantage of growth opportunities;
As a result, the risk of loss associated with a leveraged entity is generally greater than for companies with comparatively less debt.
Many of our funds invest in assets that are high risk, illiquid or subject to restrictions on transfer and we may fail to realize any profits from these activities ever or for a considerable period of time or lose some or all of the capital invested.
Many of our funds invest in securities that are not publicly-traded. In many cases, our funds may be prohibited by contract or by applicable securities laws from selling such securities for a period of time. Our funds generally cannot sell these securities publicly unless either their sale is registered under applicable securities laws or an exemption from such registration is available, and then only at such times when we do not possess material nonpublic information. Accordingly, our funds may be forced, under certain conditions, to sell securities at a loss. The ability of many of our funds, particularly our Private Equity Group funds, to dispose of these investments is heavily dependent on the capital markets and in particular the public equity markets. For example, the ability to realize any value from an investment may depend upon the ability of the portfolio company in which such investment is held to complete an initial public offering. Even if the securities are publicly-traded, large holdings of securities can often be disposed of only over a substantial period of time. Moreover, because the investment strategy of many of our funds, particularly our Private Equity Group funds, often entails our having representation on our funds’ public portfolio company boards, our funds can affect such sales only during limited trading windows. Each of these exposes investment returns to risks of downward movement in market prices during the intended disposition period. As a result, we may fail to realize any profits from our investments in the funds that hold these securities for a considerable period of time or at all, and we may lose some or all of the principal amount of our investments. In addition, market conditions can also delay our funds’ ability to exit and realize value from their investments. For example, fluctuations in interest rates and challenging credit markets may make it difficult for potential buyers to raise sufficient capital to purchase our funds’ investments. Although the equity markets are not the only means by which we exit investments from our funds, the strength and liquidity of the U.S. and relevant global equity markets generally, and the initial public offering market specifically, affect the valuation of, and our ability to successfully exit, our equity positions in the portfolio companies of our funds in a timely manner. We may also realize investments through strategic sales. When financing is not available or becomes too costly, it may be more difficult to find a buyer that can successfully raise sufficient capital to purchase our investments. In addition, volatile debt and equity markets may also make the exit of our investments more difficult to execute.
Certain investments may trade on an “over-the-counter” market, which may be any location where the buyer and seller can settle a price. A significant portion of our funds’ investments are not expected to trade in any market. Due to the lack of centralized information and trading, the valuation of such instruments may carry more risk than publicly-traded common stock. Uncertainties in the conditions of the financial market, unreliable reference data, lack of transparency and inconsistency of valuation models and processes may lead to inaccurate asset pricing (or valuation). In addition, other market participants may value a fund’s investments differently than us.
As many of our funds have a finite term, we could also be forced to dispose of investments sooner than otherwise desirable. Accordingly, under certain conditions, our funds may be forced to either sell their investments at lower prices than they had expected to realize or defer sales that they had planned to make, potentially for a considerable period of time. We have made and expect to continue to make significant capital investments in our current and future funds and other strategies. Contributing capital to these funds and new strategies is risky, and we may lose some or all of the principal amount of our investments.
Government policies regarding certain regulations, such as antitrust law, or restrictions on foreign investment in certain of our funds’ portfolio companies or assets can also make it more difficult for us to deploy capital in certain jurisdictions and limit our funds’ exit opportunities.
The U.S. and many non-U.S. jurisdictions have laws designed to protect national security or to restrict foreign direct investment. For example, under the U.S. Foreign Investment Risk Review Modernization Act (“FIRRMA”), the Committee on Foreign Investment in the United States (“CFIUS”) has the authority to review, block or impose conditions on investments by non-U.S. persons in U.S. companies or real assets deemed critical or sensitive to the U.S. Many non-U.S. jurisdictions restrict foreign investment in assets important to national security by taking steps including, but not limited to, placing limitations, restrictions or conditions on foreign equity investment, implementing investment screening or approval mechanisms and restricting the employment of foreigners as key personnel. These U.S. and foreign laws could limit our funds’ ability to invest in certain businesses or entities or impose burdensome notification requirements, operational restrictions or delays in pursuing and consummating transactions.
Certain of our investments may be subject to review and approval by CFIUS or any non-U.S. equivalents thereof, which may have outsized impacts on transaction certainty, timing, feasibility and cost, and may prevent us from maintaining or pursuing investment opportunities that we otherwise would have maintained or pursued. CFIUS or any non-U.S. equivalents thereof may seek to impose limitations, conditions or restrictions on or prohibit one or more of our investments, which may adversely affect the ability of our funds to execute on their investment strategy with respect to such transaction as well as limit our flexibility in structuring or financing certain transactions. In addition, CFIUS is actively pursuing transactions that were not
notified to it and may ask questions regarding, or impose restrictions, conditions or limitations on, transactions post-closing. Our funds may also invest in companies that are, or may become, subject to CFIUS requirements based on pre-existing foreign ownership and control; in such cases, CFIUS requirements may adversely impact a portfolio company’s ability to obtain or retain business or otherwise make it more difficult for us to realize a profit from an investment.
The foregoing laws could limit our ability to find suitable investments and could also negatively impact our fundraising and syndication activities by causing us to exclude or limit certain investors in our funds or co-investors for our transactions. Moreover, these laws may make it difficult for us to identify suitable buyers for our investments that we want to exit and could constrain the universe of exit opportunities generally. Complying with these laws imposes potentially significant costs and complex additional burdens, and any failure by us or our portfolio companies to comply with them could expose us to significant penalties, sanctions, loss of future investment opportunities, additional regulatory scrutiny and reputational harm. See “—Risks Related to Regulation—Extensive regulation affects our activities, increases the cost of doing business and creates the potential for significant liabilities and penalties that could adversely affect our businesses and results of operations.”
In addition to undertaking active ongoing investigative agendas, the U.S. Department of Justice Antitrust Division and the FTC, the two agencies responsible for enforcing federal antitrust and competition laws, issued new Merger Guidelines in December 2023, designed to invigorate enforcement of the antitrust and competition laws. Antitrust and competition law enforcers and regulators in foreign jurisdictions have been similarly active. These initiatives are expected to increase scrutiny of mergers and acquisitions and to result in the adoption of more stringent guidelines for pre-approval of mergers, and potentially for review of previously consummated transactions as well. As a result, the process of obtaining pre-approval from U.S. antitrust agencies and other non-U.S. antitrust authorities for mergers and acquisitions undertaken by the investment funds we manage is expected to become more challenging, more time consuming and more expensive. We may even be required to undergo investigations concerning previously closed transactions. If certain proposed acquisitions or dispositions of portfolio companies by our managed investment funds are delayed or rejected by antitrust enforcers, or if previously closed transactions are investigated, it could have an adverse impact on our ability to generate future performance revenues and to fully invest the available capital in our funds, as well as reduce opportunities to exit and realize value from our fund investments.
In August 2023, President Biden issued an Executive Order establishing an outbound investment screening regime that is intended to regulate or prohibit certain investments by U.S. persons in advanced technology sectors in China and other jurisdictions that may be designated as a “country of concern.” The U.S. Department of the Treasury issued final regulations implementing this Executive Order in October 2024, which took effect on January 2, 2025. The final rule prohibits or imposes notification requirements on certain outbound investments involving semiconductors and microelectronics, quantum information technologies and artificial intelligence by U.S. persons into certain entities with a nexus to China. Moreover, there is a high likelihood that the number of targeted sectors will expand over the life of our funds. These restrictions on U.S. outbound investments could limit the universe of prospective investments available to us, making it more difficult to deploy capital or identify buyers for investments, and/or adversely affect the governance and operations of our investments and thus our overall performance.
State regulatory agencies may also impose restrictions on private funds’ investments in certain types of assets, which could affect our funds’ ability to find attractive and diversified investments and to complete such investments in a timely manner. For example, more than two dozen U.S. states have enacted or are considering legislation that would prohibit, restrict, or regulate foreign investment in real property in such states. We cannot exclude that some or all of these states may prohibit, restrict or regulate (including requiring disclosure of) our funds’ transactions, including based on the composition of our investor base. Collectively, these laws also elevate the likelihood that we will be required or requested to disclose to U.S. federal and/or state regulators information about us, our funds, our investors, our structure, and our beneficial ownership and control and may impact the ability of non-U.S. limited partners to participate in certain of our investment strategies.
Many of the power, infrastructure and energy companies in which certain of our funds invest are subject to regulation by the Federal Energy Regulatory Commission (“FERC”), which oversees acquisition and disposition of electric generation, transmission and other electric facilities in most of the U.S., along with transmission of electricity in interstate commerce in the U.S., and wholesale purchases and sales of electric energy in interstate commerce in the U.S., among other things. In some U.S. states, public utility commissions can also (or alternatively) regulate investments in, or transfers of, certain electric sector holdings and infrastructure. Under existing regulations, FERC and public utility commissions may, in some circumstances, slow, or impose restrictions on, investments in or transfers of regulated assets. Changes to regulations, or changes to interpretations thereof, by FERC or public utility commissions may similarly make regulated investments, acquisitions or dispositions more challenging or time-consuming, and may subject previously-exempt classes of transactions to new authorization requirements. While our investments are exposed to FERC and public utility commission regulation in a manner that is consistent with other participants in the power, infrastructure and energy sector, such regulations could nonetheless result in delays in making investments, delays in exiting investments or limitations or conditions that may adversely affect the ability
of our funds to execute on their investment strategy with respect to such transactions as well as limit our flexibility in structuring or financing certain transactions.
Certain of our funds make preferred and common equity investments that rank junior to preferred equity and debt in a company’s capital structure.
In most cases, the companies in which our investment funds invest have, or are permitted to have, outstanding indebtedness or equity securities that rank senior to our fund’s investment. By their terms, such instruments may provide that their holders are entitled to receive payments of dividends, interest or principal on or before the dates on which payments are to be made in respect of our investment. In addition, in the event of insolvency, liquidation, dissolution, reorganization or bankruptcy of a company in which an investment is made, holders of securities ranking senior to our investment would typically be entitled to receive payment in full before distributions could be made in respect of our investment. After repaying senior security holders, the company may not have any remaining assets to use for repaying amounts owed in respect of our investment. To the extent that any assets remain, holders of claims that rank equally with our investment would be entitled to share on an equal and ratable basis in distributions that are made out of those assets. Moreover, during periods of financial distress or following an insolvency, the ability of our funds to influence a company’s affairs and to take actions to protect their
investments may be substantially less than that of the senior creditors.
Certain of our funds utilize special situations and distressed debt investment strategies that involve significant risks.
Certain of the funds in our Credit Group invest in obligors and issuers with weak financial conditions, poor operating results, substantial financing needs, negative net worth and/or special competitive problems. These funds also invest in obligors and issuers that are involved in bankruptcy or reorganization proceedings. In such situations, it may be difficult to obtain full information as to the exact financial and operating conditions of these obligors and issuers. Additionally, the fair values of such investments are subject to abrupt and erratic market movements and significant price volatility if they are publicly-traded securities, and are subject to significant uncertainty in general if they are not publicly-traded securities. Furthermore, some of our funds’ distressed investments may not be widely traded or may have no recognized market. A fund’s exposure to such investments may be substantial in relation to the market for those investments, and the assets are likely to be illiquid and difficult to sell or transfer. As a result, it may take a number of years for the market value of such investments to ultimately reflect their intrinsic value as perceived by us.
A central feature of our distressed investment strategy is our ability to effectively anticipate the occurrence of certain corporate events, such as debt and/or equity offerings, restructurings, reorganizations, mergers, takeover offers and other transactions, that we believe will improve the condition of the business. Similarly, we perform significant analysis of the company’s capital structure, operations, industry and ability to generate income, as well as market valuation of the company and its debt, and develop a strategy with respect to a particular distressed investment based on such analysis. In furtherance of that strategy our funds seek to identify the best position in the capital structure in which to invest. If the relevant corporate event that we anticipate is delayed, changed or never completed, or if our analysis or investment strategy is inaccurate, the market price and value of the applicable fund’s investment could decline sharply.
In addition, these investments could subject a fund to certain potential additional liabilities that may exceed the value of its original investment. Under certain circumstances, payments or distributions on certain investments may be reclaimed if any such payment or distribution is later determined to have been a fraudulent conveyance, a preferential payment or similar transaction under applicable bankruptcy and insolvency laws. In addition, under certain circumstances, a lender that has inappropriately exercised control of the management and policies of a debtor may have its claims subordinated or disallowed, or may be found liable for damages suffered by parties as a result of such actions. In the case where the investment in securities of troubled companies is made in connection with an attempt to influence a restructuring proposal or plan of reorganization in bankruptcy, our funds may become involved in substantial litigation.
Certain of the funds or accounts we advise or manage are subject to the fiduciary responsibility and prohibited transaction provisions of ERISA and Section 4975 of the Code, and our businesses could be adversely affected if certain of our other funds or accounts fail to satisfy an exception under the U.S. Department of Labor’s “plan assets” regulation.
Certain of the funds and accounts we advise or manage are subject to the fiduciary responsibility and prohibited transaction provisions of ERISA and Section 4975 of the Code. For example, we currently manage some of our funds or accounts as “plan assets” under ERISA. With respect to these funds or accounts, this results in the application of the fiduciary responsibility standards of ERISA to investments made by such funds or accounts, including the requirement of investment prudence and diversification, and the possibility that certain transactions that we enter into, or may have entered into, on behalf of these funds or accounts, in the normal course of business, might constitute or result in, or have constituted or resulted in, non-exempt prohibited transactions under Section 406 of ERISA or Section 4975 of the Code. A non-exempt prohibited
transaction, in addition to imposing potential liability upon fiduciaries of an ERISA plan, may also result in the imposition of an excise tax under the Code upon a “party in interest” (as defined in ERISA) or “disqualified person” (as defined in the Code) with whom we engaged in the transaction. Some of our other funds or accounts are intended to qualify as “venture capital operating companies” or rely on another exception under the “plan assets” regulation under ERISA and therefore not be subject to the fiduciary or prohibited transaction provisions of ERISA or Section 4975 of the Code with respect to their assets. However, if these funds or accounts fail to satisfy an exception to holding “plan assets” under relevant regulations by the U.S. Department of Labor for any reason, including as a result of an amendment of the relevant regulations by the U.S. Department of Labor, such failure could materially interfere with our activities in relation to these funds or accounts or expose us to risks related to our failure to comply with the applicable requirements.
Contingent liabilities could harm fund performance.
We may cause our funds to acquire an investment that is subject to contingent liabilities. Such contingent liabilities could be unknown to us at the time of acquisition or, if they are known to us, we may not accurately assess or protect against the risks that they present. Acquired contingent liabilities could therefore result in unforeseen losses for our funds. In addition, in connection with the disposition of an investment in a portfolio company, a fund may be required to make representations about the business and financial affairs of such portfolio company typical of those made in connection with the sale of a business. A fund may also be required to indemnify the purchasers of such investment to the extent that any such representations are inaccurate. These arrangements may result in the incurrence of contingent liabilities by a fund, even after the disposition of an investment. Accordingly, the inaccuracy of representations and warranties made by a fund could harm such fund’s performance.
Our funds may be held liable for the underfunded pension liabilities of their portfolio companies.
In at least one circuit, a court found that, in certain circumstances, an investment fund could be treated as a “trade or business” for purposes of determining pension liability under ERISA. Therefore, where an investment fund owns 80% or more (or possibly, under certain circumstances, less than 80%) of a portfolio company, such investment fund (and any other 80%-owned portfolio companies of such fund) might be found liable for certain pension liabilities of such a portfolio company to the extent the portfolio company is unable to satisfy such liabilities. Our funds may, from time to time, invest in a portfolio company that has unfunded pension fund liabilities, including structuring the investment in a manner where a fund may own an 80% or greater interest in such a portfolio company. If a fund (or other 80%-owned portfolio companies of such fund) were deemed to be liable for such pension liabilities, this could have a material adverse effect on the operations of such fund and the companies in which such fund invests. This discussion is based on current court decisions, statutes and regulations regarding control group liability under ERISA, as in effect as of the date hereof, which may change in the future as the case law and guidance develops.
Our failure to comply with investment guidelines set by our clients and/or investors could result in damage awards against us or a reduction in AUM, either of which would cause our earnings to decline and adversely affect our business.
When clients retain us to manage assets on their behalf, they specify certain guidelines regarding investment allocation and strategy that we are required to observe in the management of their portfolios. Similarly, investors in our funds often require certain investment restrictions or limitations be included in their side letters that we are contractually obligated to observe in the management of such investors’ interests in the applicable fund. Similarly, investors in our funds often require certain investment restrictions or limitations be included in their side letters that we are contractually obligated to observe in the management of such investors’ interests in the applicable fund. Our failure to comply with these guidelines, restrictions and other limitations could result in clients terminating their investment management agreement with us or investors seeking to withdraw from our funds. Clients or investors could also sue us for breach of contract and seek to recover damages from us. In addition, such guidelines may restrict our ability to pursue certain investments and strategies on behalf of our clients or limit an investor’s exposure to such investments and strategies that we believe are economically desirable, which could similarly result in losses to a client account or investor capital account or termination or potential withdrawal of the account or investor and a corresponding reduction in AUM. Even if we comply with all applicable investment guidelines, restrictions and limitations, a client or investor may be dissatisfied with its investment performance or our services or fees, and may terminate their customized separate accounts or advisory accounts, seek to withdraw from our funds or be unwilling to commit new capital to our specialized funds, customized separate accounts or advisory accounts. Any of these events could cause our earnings to decline and materially and adversely affect our business, financial condition and results of operations.
Third-party investors in certain of our funds with commitment-based structures may not satisfy their contractual obligation to fund capital calls when requested by us, which could adversely affect a fund’s operations and performance.
Investors in certain of our funds make capital commitments to those funds that we are entitled to call from those investors at any time during prescribed periods. We depend on investors fulfilling and honoring their commitments when we call capital from them for those funds to consummate investments and otherwise pay their obligations when due. Any investor that did not fund a capital call would be subject to several possible penalties, including possibly having a meaningful amount of its existing investment forfeited in that fund. However, the impact of the penalty is directly correlated to the amount of capital previously invested by the investor in the fund and if an investor has invested little or no capital, for instance early in the life of the fund, then the forfeiture penalty may not be as meaningful. Investors may also negotiate for lesser or reduced penalties at the outset of the fund, thereby limiting our ability to enforce the funding of a capital call. In cases where valuations of existing investments fall and the pace of distributions slows, investors may be unable to make new commitments to third-party managed funds such as those advised by us using distributions they received from prior fund investments. A failure of investors to honor a significant amount of capital calls for any particular fund or funds could have a material adverse effect on the operation and performance of those funds.
Certain of our funds may utilize subscription lines of credit to fund investments prior to the receipt of capital contributions from the fund’s investors. As capital calls made to a fund’s investors are delayed when using a subscription line of credit, the investment period of such investor capital is shortened, which may increase the net internal rate of return of an investment fund. However, since interest expense and other costs of borrowings under subscription lines of credit are an expense of the investment fund, the investment fund’s net multiple of invested capital will be reduced, as will the amount of carried interest generated by the fund. Any material reduction in the amount of carried interest generated by a fund will adversely affect our revenues.
Our funds make investments in companies that are based outside of the United States, which may expose us to additional risks not typically associated with investing in companies that are based in the United States.
Some of our funds invest a portion of their assets in the equity, debt, loans or other securities of issuers located outside the U.S., including Europe and APAC, while certain of our funds invest substantially all of their assets in these types of securities, and we expect that international investments will increase as a proportion of certain of our funds’ portfolios in the future. Investments in foreign securities involve certain factors not typically associated with investing in U.S. securities, including risks relating to:
•our funds’ abilities to exchange local currencies for U.S. dollars and other currency exchange matters, including fluctuations in currency exchange rates and costs associated with conversion of investment principal and income from one currency into another;
•controls on, and changes in controls on, foreign investment and limitations on repatriation of invested capital;
•less developed or less efficient financial markets than exist in the United States, which may lead to price volatility and relative illiquidity;
•the absence of uniform accounting, auditing and financial reporting standards, practices and disclosure requirements and less government supervision and regulation;
•changes in laws or clarifications to existing laws (and changes in administrative practices) that could impact our tax treaty positions, which could adversely impact the returns on our investments;
•differences in legal and regulatory environments, particularly with respect to bankruptcy and reorganization, labor and employment laws, less developed corporate laws regarding fiduciary duties and the protection of investors and less reliable judicial systems to enforce contracts and applicable law;
•political hostility to investments by foreign or private equity investors;
•less publicly available information in respect of companies in foreign markets;
•reliance on a more limited number of commodity inputs, service providers and/or distribution mechanisms;
•higher rates of inflation;
•higher transaction costs;
•difficulty in enforcing contractual obligations;
•fewer investor protections;
•limitations on the deductibility of interest and other financing costs and expenses for income tax purposes in certain jurisdictions;
•certain economic and political risks, including potential exchange control regulations and restrictions on our foreign investments and repatriation of capital, potential political, economic or social instability, the possibility of nationalization or expropriation or confiscatory taxation and adverse economic and political developments; and
•the imposition of foreign taxes or withholding taxes on income and gains recognized with respect to such securities.
See “—Investments in emerging markets are subject to greater risks than those in more developed markets” for additional risks related to such investments made outside of the United States. While our funds will take these factors into consideration in making investment decisions, including when hedging positions, there can be no assurance that adverse developments with respect to these risks will not adversely affect our funds that invest in securities of foreign issuers. In addition, certain of these funds are managed outside the United States, which may increase the foregoing risks.
Investments in emerging markets are subject to greater risks than those in more developed markets.
We have invested and expect to continue to invest in businesses in emerging markets. Investing in emerging markets exposes us to heightened risks compared to developed economies, including political, social, and economic instability. Local economic and social conditions, such as cultural and communication challenges, as well as local laws and regulations, add complexity to operations. Companies in these markets might lack depth of management and may be vulnerable to political or economic developments such as the nationalization of key industries. Many emerging markets are developing both economically and politically and are at greater risk of having unstable governments and economies. Certain of the emerging markets in which we operate have histories of political and military unrest and financial instability, and their markets may experience significant volatility, even when compared to those of other emerging market countries, which could have a destabilizing effect on our investments and operations in such regions. See also “—Risks Related to Our Businesses—Difficult market and political conditions may adversely affect our businesses in many ways, including by reducing the value or hampering the performance of the investments made by our funds or reducing the ability of our funds to raise or deploy capital, each of which could materially reduce our revenue, earnings and cash flow and adversely affect our financial prospects and condition.”
Further, due to jurisdictional limitations, matters of comity, and other factors, the SEC, the U.S. Department of Justice, and other U.S. and non-U.S. authorities will be limited in their ability to pursue enforcement or other actions against companies in such emerging market jurisdictions that engage in fraud or other wrongdoing. Similar limitations also apply to the pursuit of actions against individuals in certain other emerging markets, including officers, directors, and gatekeepers, individuals such as compliance officers, lawyers, accountants and auditors, who have engaged in fraud or other wrongdoing. In addition, local authorities in certain emerging markets are often constrained in their ability to assist foreign authorities and foreign investors more generally.
In addition, the political, administrative, and judiciary institutions in emerging markets are not as mature as their peers in developed markets. As a result, these institutions might not sustain their independence against political pressure or corruption by individuals in positions of power. The heightened potential for fraud and political corruption in certain emerging markets increases operational uncertainties. There can be no assurance that adverse developments with respect to such risks will not adversely affect any portfolio companies based in such countries.
Our funds are also permitted to acquire portfolio companies in countries where generally accepted accounting standards and practices differ significantly from those in the United States. As a result, financial information from these entities may not align with U.S. standards, potentially affecting the reliability of evaluations and due diligence processes. These factors could materially and adversely impact the performance of our portfolio companies and our operations.
Many of our funds make investments in companies that we do not control.
Investments by many of our funds will include debt instruments and equity securities of companies that we do not control. Such instruments and securities may be acquired by our funds through trading activities or through purchases of securities from the issuer. In addition, our funds may seek to acquire minority equity interests more frequently and may also dispose of a portion of their majority equity investments in portfolio companies over time in a manner that results in the funds retaining a minority investment. Furthermore, while certain of our funds may make “toe-hold” distressed debt investments in a company with the intention of obtaining control, there is no assurance that a control position may be obtained and such fund
may retain a minority investment. Those investments will be subject to the risk that the company in which the investment is made may make business, financial or management decisions with which we do not agree or that the majority stakeholders or the management of the company may take risks or otherwise act in a manner that does not serve our interests. If any of the foregoing were to occur, the values of the investments held by our funds could decrease and our financial condition, results of operations and cash flow could suffer as a result.
Increased regulatory scrutiny and uncertainty with regards to expense allocation may increase risk of harm.
While we historically have and will continue to allocate the expenses of our funds in good faith and in accordance with the terms of the relevant fund agreements and our expense allocation policy in effect from time to time, due to increased regulatory scrutiny of expense allocation policies in the private funds realm, there is no guarantee that our policies and practices will not be challenged by our supervising regulatory bodies. If we or our supervising regulators were to determine that we have improperly allocated such expenses, we could be required to refund amounts to the funds and could be subject to regulatory censure, litigation from our fund investors and/or reputational harm, each of which could have a material adverse effect on our financial condition.
We may need to pay “clawback” or “contingent repayment” obligations if and when they are triggered under the governing agreements with our funds.
Generally, if at the termination of a fund and in certain cases at interim points in the life of a fund, the fund has not achieved investment returns that exceed the preferred return threshold or the general partner receives net profits over the life of the fund in excess of its allocable share under the applicable partnership agreement, we will be obligated to repay an amount equal to the excess of amounts previously distributed to us over the amounts to which we are ultimately entitled. This obligation is known as a “clawback” or contingent repayment obligation. Due to the fact that our carried interest is generally determined on a liquidation basis, as of December 31, 2024, if the funds were liquidated at their fair values at that date, there would have been no contingent repayment obligation or liability. There can be no assurance that we will not incur a contingent repayment obligation in the future. As of December 31, 2024, had we assumed all existing investments were worthless, the amount of carried interest, net of tax distributions, subject to contingent repayment would have been approximately $59.6 million of which approximately $39.5 million is reimbursable to the Company by certain professionals. Although a contingent repayment obligation is several to each person who received a distribution, and not a joint obligation, if a recipient does not fund his or her respective share of a contingent repayment obligation, we may have to fund such additional amounts beyond the amount of carried interest we retained, although we generally will retain the right to pursue remedies against those carried interest recipients who fail to fund their obligations. We may need to use or reserve cash to repay such contingent repayment obligations instead of using the cash for other purposes. See “Item 7. Management’s Discussion and Analysis of Financial Condition and Results of Operations—Contractual Obligations, Commitments and Contingencies and Other Arrangements,” “Note 2. Summary of Significant Accounting Policies,” and “Note 8. Commitments and Contingencies” within our consolidated financial statements appearing elsewhere in this Annual Report on Form 10-K.
We derive a substantial portion of our revenues from funds managed pursuant to management agreements that may be terminated or fund partnership agreements that permit fund investors to request liquidation of investments in our funds on short notice.
The terms of our funds generally give either the manager of the fund or the fund itself the right to terminate our investment management agreement with the fund. However, insofar as we control the general partners of our funds that are limited partnerships, the risk of termination of investment management agreement for such funds is limited, subject to our fiduciary or contractual duties as general partner. This risk is more significant for certain of our funds that have independent boards of directors.
With respect to our funds that are not exempt from registration under the Investment Company Act, each fund’s investment management agreement must be approved annually by (i) such fund’s board of directors or by the vote of a majority of such fund’s stockholders, and (ii) the majority of the independent members of such fund’s board of directors and, in certain cases, by its stockholders, as required by law. The funds’ investment management agreements can also be terminated by the majority of such fund’s stockholders. Termination of these agreements would reduce the fees we earn from the relevant funds, which could have a material adverse effect on our results of operations. Currently, ARCC and ASIF, registered investment companies that have elected to be treated as business development companies under the Investment Company Act, are subject to these provisions of the Investment Company Act.
Investors in certain of our funds, including our open-ended funds, may redeem their investments in these funds. Third-party investors in many of our funds have the right to remove the general partner of the fund and to terminate the investment period under certain circumstances. In addition, the investment management agreements related to our separately managed accounts may permit the investor to terminate our management of such accounts on short notice. These events would lead to a decrease in our revenues, which could be substantial.
Investors in certain of our funds, including our open-ended funds and perpetual wealth vehicles may generally redeem their investments on a periodic basis subject to the expiration of a specified period of time during which capital may not be withdrawn. Such redemptions would result in a reduction of our AUM and decrease in our management fees. The governing agreements of many of our funds provide that, subject to certain conditions, third-party investors in those funds have the right to remove the general partner of the fund or terminate the fund, including in certain cases without cause by a simple majority vote. Any such removal or dissolution could result in a cessation in management fees we would earn from such funds and/or a significant reduction in the expected amounts of carried interest and incentive fees from those funds. Carried interest could be significantly reduced as a result of our inability to maximize the value of investments by a fund during the liquidation process or in the event of the triggering of a “contingent repayment” obligation. Finally, the applicable funds would cease to exist after completion of liquidation and winding-up.
In addition, the governing agreements of many of our funds provide that, subject to certain conditions, third-party investors in those funds have the right to terminate the investment period of the fund, including in certain cases without cause. Such an event could have a significant negative impact on our revenue, earnings and cash flow of such fund. The governing agreements of our funds may also provide that upon the occurrence of events, including in the event that certain “key persons” in our funds do not meet specified time commitments with regard to managing the fund (including due to death, disability or departure), investors in those funds have the right to vote to suspend or terminate the investment period, including in certain cases by a simple majority vote in accordance with specified procedures. In addition to having a significant negative impact on our revenue, earnings and cash flow, the occurrence of such an event with respect to any of our funds would likely result in significant reputational damage to us and could negatively impact our future fundraising efforts.
We currently manage a portion of investor assets through separately managed accounts, whereby we earn management fees and carried interest or incentive fees, and we intend to continue to seek additional separately managed account mandates. The investment management agreements we enter into in connection with managing separately managed accounts on behalf of certain clients may in certain cases be terminated by such clients on as little as 30 days’ prior written notice. In addition, the boards of directors of the investment management companies we manage could terminate our advisory engagement of those companies on as little as 30 days’ prior written notice. Each respective investment advisory and management agreement with our BDCs can be terminated by the majority of their respective voting securities holders upon 60 days’ prior written notice. We serve as the sub-adviser for the existing manager of certain funds. Although in some cases there can be economic payments made by the manager for termination of such sub-advisory contracts, such as in connection with our sub-advisory arrangement of AMP Capital’s Infrastructure Debt platform, in the case of any such terminations, the management fees and carried interest or incentive fees we earn in connection with managing such account or company would immediately cease, which could result in a significant adverse impact on our revenues.
In addition, if we were to experience a change of control (as defined under the Investment Advisers Act or as otherwise set forth in the partnership agreements of our funds), continuation of the investment management agreements of our funds would be subject to investor consent. There can be no assurance that required consents will be obtained if a change of control occurs. In addition, with respect to our funds that are subject to the Investment Company Act, each fund’s investment management agreement must be approved annually (i) by such fund’s board of directors or by a vote of the majority of such fund’s stockholders, and (ii) by the independent members of such fund’s board of directors and, in certain cases, by its stockholders, as required by law. Termination of these agreements would cause us to lose the management fees and carried interest or incentive fees we earn from such funds, which could have a material adverse effect on our results of operations.
Customized separate account and advisory account fee revenue is not a long-term contracted source of revenue and is subject to intense competition.
Our revenue in any given period is dependent on the number of fee-paying clients and corresponding level of AUM in such period. Our customized separate account and advisory account business operates in a highly competitive environment where typically there are no long-term contracts. While clients of our customized separate account and advisory account businesses may have multi-year contracts, many of these contracts are terminable upon 30 to 90 days’ advance notice to us. We may lose clients as a result of a change in ownership, control or senior management, a client’s decision to transition to in-house asset management rather than partner with a third-party provider such as us, competition from other financial advisors and financial institutions, changes to their investment policies and other causes. Isolated departures have occurred in the past but have not had a material impact on our business. Moreover, a number of our contracts with state government-sponsored clients
are secured through such government’s mandated procurement process, and are subject to periodic renewal. If multiple clients were to exercise their termination rights or fail to renew their existing contracts and we were unable to secure new clients or maintain our levels of AUM, our customized separate account and advisory account fees would decline materially. A significant reduction in the number of fee-paying clients and/or AUM levels in any given period could reduce our revenue and materially and adversely affect our business, financial condition and results of operations.
We are vulnerable to an increased number of investors seeking to participate in share redemption programs or tender offers of our perpetual wealth vehicles.
We manage non-traded REITs, BDCs and other perpetual wealth vehicles. These perpetual wealth vehicles often conduct share redemption programs or tender offers to provide liquidity to investors in such vehicles, subject to certain limitations. For example, with respect to our non-traded REITs, the total amount of aggregate redemptions is limited by a certain percentage of each of the non-traded REIT’s NAV for each calendar month and quarter, which percentage is generally based on the excess of share redemptions (capital outflows) over the proceeds from the sale of shares (capital inflows), not including proceeds related to sales of beneficial interests in specific Delaware statutory trusts holding real properties, or the exchange program for the applicable period. While such share redemption programs and tender offers may contain restrictions that limit the amount of shares or other equity, as applicable, that may be redeemed or purchased in particular periods, an increased number of investors requesting redemptions in excess of capital inflows or participating in tender offers of our perpetual wealth vehicles could lead to a decline in the management fees and incentive fees we receive. Economic events affecting the economy or market in general, such as volatility in the financial markets related to changes in markets, inflation, changes in interest rates or global or national events that are beyond our control, could cause investors to request redemption of an increased number of shares pursuant to the share redemption programs of our perpetual wealth vehicles, potentially in excess of established limits. Such prolonged economic disruptions have caused a number of similar vehicles to deny redemption requests or to suspend or partially suspend their share redemption programs and tender offers. Our perpetual wealth vehicles may redeem or purchase fewer shares than investors request due to a lack of readily available funds because of such adverse market conditions beyond our control or the need to maintain liquidity for operations. Certain of our perpetual wealth vehicles may amend or suspend share repurchase programs during periods of market dislocation where selling assets to fund a repurchase could have a materially negative impact on remaining investors. With respect to our perpetual wealth vehicles, the vast majority of their assets will consist of investments that cannot generally be readily liquidated on short notice without impacting the vehicle’s ability to realize full value upon their disposition. This may further limit the amount of cash available to immediately satisfy redemption requests. Any redemptions or purchases of less than amounts requested could undermine investor confidence in our perpetual wealth vehicles and adversely impact our reputation.
A downturn in the global credit markets could adversely affect our CLO investments.
CLOs are subject to credit, liquidity, interest rate and other risks. From time to time, liquidity in the credit markets is reduced sometimes significantly, resulting in an increase in credit spreads and a decline in ratings, performance and market values for leveraged loans. We have significant exposure to these markets through our investments in our CLO funds. CLOs invest on a leveraged basis in loans or securities that are themselves highly leveraged investments in the underlying collateral, which increases both the opportunity for higher returns as well as the magnitude of losses compared to unlevered investments. As a result of such funds’ leveraged position, CLOs and their investors are at greater risk of suffering losses. CLOs have failed in the past and may in the future fail one or more of their “overcollateralization” tests. The failure of one or more of these tests will result in reduced cash flows that may have been otherwise available for distribution to us. This could reduce the value of our investment. There can be no assurance that market conditions giving rise to these types of consequences will not once again occur, subsist or become more acute in the future.
Our funds may face risks relating to undiversified investments.
While diversification is generally an objective of our funds, there can be no assurance as to the degree of diversification, if any, that will be achieved in any fund investments. Difficult market conditions or volatility or slowdowns affecting a particular asset class, geographic region, industry or other category of investment could have a significant adverse impact on a fund if its investments are concentrated in that area, which would result in lower investment returns. This lack of diversification may expose a fund to losses disproportionate to market declines in general if there are disproportionately greater adverse price movements in the particular investments. If a fund holds investments concentrated in a particular issuer, security, asset class or geographic region, such fund may be more susceptible than a more widely diversified investment partnership to the negative consequences of a single corporate, economic, political or regulatory event. Accordingly, a lack of diversification
on the part of a fund could adversely affect a fund’s performance and, as a result, our financial condition and results of operations.
Our funds may be forced to dispose of investments at a disadvantageous time. Furthermore, we may have to waive management fees for certain of our funds in certain circumstances.
Our funds may make investments that they do not advantageously dispose of prior to the date the applicable fund is dissolved, either by expiration of such fund’s term or otherwise. Although we generally expect that investments will be disposed of prior to dissolution or be suitable for in-kind distribution at dissolution, and the general partners of the funds have only a limited ability to extend the term of the fund with the consent of fund investors or the advisory board of the fund, as applicable, our funds may have to sell, distribute or otherwise dispose of investments at a disadvantageous time as a result of dissolution. This would result in a lower than expected return on the investments and, perhaps, on the fund itself. In addition, our limited partners may require that we waive management fees during periods after the contractual term of a fund, which would reduce the amount of management fees we earn and therefore could negatively impact our revenues and results of operations.
Our real estate funds are subject to the risks inherent in the ownership and operation of real estate and the construction and development of real estate.
Investments in our real estate funds are subject to the risks inherent in the ownership and operation of real estate and real estate-related businesses and assets. These investments are subject to the potential for deterioration of real estate fundamentals and the risk of adverse changes in local market and economic conditions, which may include changes in supply of and demand for competing properties in an area, fluctuating occupancy rates and changes in demand for commercial office properties (including as a result of an increased prevalence of remote work). Additionally, our funds’ properties may be managed by third parties, which makes us dependent upon such third parties and subjects us to risks associated with the actions and financial resources of such third parties.
More generally, investments in real estate-related businesses and assets are subject to risks including the following:
•those associated with the burdens of ownership of real property;
•fluctuations in the average occupancy and room rates for hotel properties;
•the financial resources of tenants;
•changes in building, environmental and other laws;
•energy and supply shortages;
•various uninsured or uninsurable risks;
•liability for “slip-and-fall” and other accidents on properties held by our funds;
•natural disasters, extreme weather events and other physical risks related to climate change;
•changes in government regulations (such as rent control, digital infrastructure regulation and tax laws);
•changes in real property tax and transfer tax rates;
•changes in interest rates;
•the reduced availability of mortgage funds which may render the sale or refinancing of properties difficult or impracticable;
•negative developments in the economy that depress travel activity;
•environmental liabilities;
•contingent liabilities on disposition of assets;
•unexpected cost overruns in connection with development projects;
•terrorist attacks, war and other factors that are beyond our control; and
•dependence on local operating partners.
If our real estate funds acquire direct or indirect interests in undeveloped land or underdeveloped real property, which may often be non-income producing, they will be subject to the risks normally associated with such assets and development activities, including risks relating to the availability and timely receipt of zoning and other regulatory or environmental approvals, the cost and timely completion of construction (including risks beyond the control of our fund, such as weather or labor conditions or material shortages) and the availability of both construction and permanent financing on favorable terms. Any of these factors may cause the value of the investments in our real estate funds to decline, which may have a material impact on our results of operations.
Certain of our funds invest in the power, infrastructure and energy sector which is subject to significant market volatility and may expose us to increased environmental risks and liabilities inherent in the ownership of real assets. As such, the performance of investments in the energy sector is subject to a high degree of business and market risk.
The power, infrastructure and energy companies in which certain of our funds invest have been and may be negatively impacted by material declines in power and energy related commodity prices and are subject to other risks, including among others, supply and demand risk, operational risk, regulatory risk, depletion risk, reserve risk, reputational risk, severe weather, climate change and catastrophic event risk (including of cyber-attacks). Commodity prices fluctuate for several reasons, including changes in market and economic conditions, the impact of weather on demand, climate initiatives of government entities, levels of domestic production and international production, policies implemented by the Organization of Petroleum Exporting Countries, power and energy conservation, domestic and foreign governmental regulation and taxation and the availability of local, intrastate and interstate transportation systems.
The performance of our investments with underlying exposure to the commodities markets is subject to a high degree of business and market risk, as it is dependent upon prevailing prices of commodities such as oil, natural gas and coal, which are subject to wide fluctuation for a variety of factors that are beyond our control, such as geopolitical developments like hostilities in the Middle East region and between Russia and Ukraine. It is common in making investments with underlying exposure to the commodities markets to deploy hedging strategies to protect against pricing fluctuations but such strategies may or may not protect our investments. Declining global commodity prices have impacted the value of securities held by our funds. Continued volatility could result in lower returns than we anticipated at the time certain of our investments were made. As of December 31, 2024, less than 1% of our total AUM was invested in debt and equity investments in the energy sector, including midstream investments, oil and gas exploration, and renewable energy investments.
Ownership of real assets in our funds or vehicles may increase our risk of liability under environmental laws that impose, regardless of fault, joint and several liability for the cost of remediating contamination and compensation for damages. In addition, changes in environmental laws or regulations or the environmental condition of an investment may create liabilities that did not exist at the time of acquisition. Even in cases where we are indemnified by a seller against liabilities arising out of violations of environmental laws and regulations, there can be no assurance as to the financial viability of the seller to satisfy such indemnities or our ability to achieve enforcement of such indemnities.
Climate change, climate change-related regulation and other efforts to reduce climate change and address sustainability concerns could adversely affect our business.
Climate change is widely considered to be a significant threat to the global economy. Our business operations, our funds’ portfolio companies, and the companies in which our funds invest may face risks associated with climate change, including “transition risks” such as risks related to the impact of climate-related legislation and regulation (both domestically and internationally), risks related to climate-related business trends (such as the process of transitioning to a lower-carbon economy) and risks stemming from the physical impacts of climate change, such as the increasing frequency or severity of extreme weather events (including wildfires, droughts, hurricanes and floods) and rising sea levels and temperatures. These events and the disruptions they cause, alone or in combination, could also lead to increased costs of insurance (particularly for real estate in certain regions). See “—Our real estate funds are subject to the risks inherent in the ownership and operation of real estate and the construction and development of real estate.”
Our investments in infrastructure assets may expose us to increased risks and liabilities.
Investments in infrastructure assets may expose us to increased risks and liabilities that are inherent in the ownership of real assets. For example,
•Ownership of infrastructure assets may also present additional risk of liability for personal and property injury or impose significant operating challenges and costs with respect to, for example, compliance with zoning, environmental or other applicable laws.
•Infrastructure asset investments may face construction risks including, without limitation: (i) labor disputes, shortages of material and skilled labor, or work stoppages; (ii) slower than projected construction progress and the unavailability or late delivery of necessary equipment; (iii) less than optimal coordination with public utilities in the relocation of their facilities; (iv) adverse weather conditions and unexpected construction conditions; (v) accidents or the breakdown or failure of construction equipment or processes; and (vi) catastrophic events such as explosions, fires, terrorist activities and other similar events. These risks could result in substantial unanticipated delays or expenses (which may exceed expected or forecasted budgets) and, under certain circumstances, could prevent completion of construction activities once undertaken. Certain infrastructure asset investments may remain in construction phases for a prolonged period and, accordingly, may not be cash generative for a prolonged period. Recourse against the contractor may be subject to liability caps or may be subject to default or insolvency on the part of the contractor.
•The operation of infrastructure assets is exposed to potential unplanned interruptions caused by significant catastrophic or force majeure events, including cyber-attacks. These risks could, among other effects, adversely impact the cash flows available from investments in infrastructure assets, cause personal injury or loss of life, damage property, or instigate disruptions of service. In addition, the cost of repairing or replacing damaged assets could be considerable. Repeated or prolonged service interruptions may result in permanent loss of customers, litigation, or penalties for regulatory or contractual noncompliance. Force majeure events that are incapable of, or too costly to, cure may also have a permanent adverse effect on an investment.
•The management of the business or operations of an infrastructure asset may be contracted to a third-party management company unaffiliated with us. Although it would be possible to replace any such operator, the failure of such an operator to adequately perform its duties or to act in ways that are in our best interest, or the breach by an operator of applicable agreements or laws, rules and regulations, could have an adverse effect on the investment’s financial condition or results of operations. Infrastructure investments may involve the subcontracting of design and construction activities in respect of projects, and as a result our investments are subject to the risks that contractual provisions passing liabilities to a subcontractor could be ineffective, the subcontractor fails to perform services which it has agreed to perform and the subcontractor becomes insolvent.
Infrastructure investments often involve an ongoing commitment to a municipal, state, federal or foreign government or regulatory agencies. The nature of these obligations exposes us to a higher level of regulatory control than typically imposed on other businesses and may require us to rely on complex government licenses, concessions, leases or contracts, which may be difficult to obtain or maintain. Infrastructure investments may require operators to manage such investments and such operators’ failure to comply with laws, including prohibitions against bribing of government officials, may adversely affect the value of such investments and cause us serious reputational and legal harm. Revenues for such investments may rely on contractual agreements for the provision of services with a limited number of counterparties, and are consequently subject to counterparty default risk. The operations and cash flow of infrastructure investments are also more sensitive to inflation and, in certain cases, commodity price risk. Furthermore, services provided by infrastructure investments may be subject to rate regulations by government entities that determine or limit prices that may be charged. Similarly, users of applicable services or government entities in response to such users may react negatively to any adjustments in rates and thus reduce the profitability of such infrastructure investments.
Hedging strategies may adversely affect the returns on our funds’ investments.
When managing our exposure to market risks, we may (on our own behalf or on behalf of our funds) from time to time use forward contracts, options, swaps, caps, collars, floors, foreign currency forward contracts, currency swap agreements, currency option contracts, among other strategies. Currency fluctuations in particular can have a substantial effect on our cash flow and financial condition. The success of any hedging or other derivative transactions generally will depend on our ability to correctly predict market or foreign exchange changes, the degree of correlation between price movements of a derivative instrument and the position being hedged, the creditworthiness of the counterparty and other factors. As a result, while we may enter into a transaction to reduce our exposure to market or foreign exchange risks, the transaction may result in poorer overall investment performance than if it had not been executed. Such transactions may also limit the opportunity for gain if the value of a hedged position increases.
While such hedging arrangements may reduce certain risks, such arrangements themselves may entail certain other risks. These arrangements may require the posting of cash collateral at a time when a fund has insufficient cash or illiquid assets such that the posting of the cash is either impossible or requires the sale of assets at prices that do not reflect their underlying value. Moreover, these hedging arrangements may generate significant transaction costs, including potential tax costs, that reduce the returns generated by a fund.
Our risk management strategies and procedures may leave us exposed to unidentified or unanticipated risks.
Risk management applies to our investment management operations as well as to the investments we make for our specialized funds and customized separate accounts. We have developed and continue to update strategies and procedures specific to our business for managing risks, which include market risk, liquidity risk, operational risk and reputational risk. Management of these risks can be very complex. These strategies and procedures may fail under some circumstances, particularly if we are confronted with risks that we have underestimated or not identified, including those related to difficult market or geopolitical conditions. Given the large number and size of our funds, we often have large positions with a single counterparty. For example, we and most of our funds have credit lines. If the lender under one or more of those credit lines were to freeze the account in response to sanctions or become insolvent, we may have difficulty replacing the credit line and the affected fund(s) or we may face liquidity challenges, which may adversely affect our business operations or the fund’s ability to close on an investment. If that counterparty is unable to perform its obligations or performs below our standards, we, our specialized funds, customized separate accounts and other investments may be adversely affected. In addition, some of our methods for managing the risks related to our clients’ investments are based upon our analysis of historical private markets behavior. Statistical techniques are applied to these observations in order to arrive at quantifications of some of our risk exposures. Historical analysis of private markets returns requires reliance on valuations performed by fund managers, which may not be reliable measures of current valuations. These statistical methods may not accurately quantify our risk exposure if circumstances arise that were not observed in our historical data. In particular, as we introduce new types of investment structures, products or services, our historical data may be incomplete. Failure of our risk management techniques could materially and adversely affect our business, financial condition and results of operations, including our right to receive incentive fees.
Restrictions on our ability to collect and analyze data regarding our clients’ investments could adversely affect our business.
Our database of private markets investments includes funds and direct investments that we monitor and report on for our specialized funds, customized separate accounts and advisory accounts. We rely on our database to provide regular reports to our clients, to research developments and trends in private markets and to support our investment processes. We depend on the continuation of our relationships with the general partners and sponsors of the underlying funds and investments in order to maintain current data on these investments and private markets activity. The termination of such relationships or the imposition of restrictions on our ability to use the data we obtain for our reporting and monitoring services could adversely affect our business, financial condition and results of operations. We are also highly dependent upon the technology platforms within which our data is stored and analyzed, and any disruption in the services provided by such platforms, whether temporary or permanent, could have a material adverse effect on our ability to effectively continue to operate our business without interruption.
Risks Related to Our Organization and Structure
If we were deemed to be an “investment company” under the Investment Company Act, applicable restrictions could make it impractical for us to continue our businesses as contemplated and could have a material adverse effect on our businesses.
An entity will generally be deemed to be an “investment company” for purposes of the Investment Company Act if:
•it is or holds itself out as being engaged primarily, or proposes to engage primarily, in the business of investing, reinvesting or trading in securities; or
•absent an applicable exemption, it owns or proposes to acquire investment securities having a value exceeding 40% of the value of its total assets (exclusive of U.S. government securities and cash items) on an unconsolidated basis.
We believe that we are engaged primarily in the business of providing investment management services and not primarily in the business of investing, reinvesting or trading in securities. We hold ourselves out as an asset management firm and do not propose to engage primarily in the business of investing, reinvesting or trading in securities. Accordingly, we do not believe that we are an “orthodox” investment company as defined in Section 3(a)(1)(A) of the Investment Company Act and described in the first bullet point above. Furthermore, we have no material assets other than interests in certain direct and indirect wholly owned subsidiaries (within the meaning of the Investment Company Act), which in turn have no material assets other than partnership units in the AOG entities. These wholly owned subsidiaries are the general partners of certain of the AOG entities and are vested with all management and control over such AOG entities. We do not believe that the equity interests of AMC in its wholly owned subsidiaries or the partnership units of these wholly owned subsidiaries in the AOG entities are investment securities. Moreover, because we believe that the capital interests of the general partners of our funds in their respective funds are neither securities nor investment securities, we believe that less than 40% of Ares Management Corporation’s total assets (exclusive of U.S. government securities and cash items) on an unconsolidated basis are composed of
assets that could be considered investment securities. Accordingly, we do not believe that AMC is an inadvertent investment company by virtue of the 40% test in Section 3(a)(1)(C) of the Investment Company Act as described in the second bullet point above.
The Investment Company Act and the rules thereunder contain detailed parameters for the organization and operation of investment companies. Among other things, the Investment Company Act and the rules thereunder limit or prohibit transactions with affiliates, impose limitations on the issuance of debt and equity securities, generally prohibit the issuance of options and impose certain governance requirements. We intend to conduct our operations so that we will not be deemed to be an investment company under the Investment Company Act. If anything were to happen that would cause us to be deemed to be an investment company under the Investment Company Act, requirements imposed by the Investment Company Act, including limitations on capital structure, the ability to transact business with affiliates and the ability to compensate senior employees, could make it impractical for us to continue our businesses as currently conducted, impair the agreements and arrangements between and among the Ares Operating Group, us, our funds and our senior management, or any combination thereof, and have a material adverse effect on our businesses, financial condition and results of operations. In addition, we may be required to limit the amount of investments that we make as a principal or otherwise conduct our businesses in a manner that does not subject us to the registration and other requirements of the Investment Company Act.
Due to the disparity in voting power among the classes of our common stock, holders of our Class A common stock will generally have no influence over matters on which holders of our common stock vote and limited ability to influence decisions regarding our business.
Unless otherwise provided in our certificate of incorporation and bylaws or required by the DGCL or the rules of the NYSE, holders of our common stock vote together as a single class on all matters on which stockholders generally are entitled to vote under the DGCL. On any date on which the Ares Ownership Condition is satisfied, the shares of our Class B common stock held by the Class B Stockholder entitles it to a number of votes, in the aggregate, equal to (x) four times the aggregate number of votes attributable to the shares of our Class A common stock minus (y) the aggregate number of votes attributable to the shares of our Class C common stock. On any date on which the Ares Ownership Condition is not satisfied, the shares of our Class B common stock held by the Class B Stockholder will not be entitled to vote on any matter submitted to a vote of our stockholders. Ares Voting LLC, as the initial holder of the shares of our Class C common stock (in such capacity, the “Class C Stockholder”), is generally entitled to a number of votes equal to the number of AOG Units held of record by each limited partner of the AOG entities (other than us and our subsidiaries). When AOG Units are exchanged for shares of our Class A common stock, the number of votes to which the shares of our Class C common stock are entitled shall be reduced by the number of AOG Units so exchanged. However, so long as the Ares Ownership Condition is satisfied, the issuance of shares of our Class A common stock would increase the number of votes to which holders of our Class B common stock are entitled. As a result, so long as the Ares Ownership Condition is satisfied, practically all matters submitted to our stockholders will be decided by the vote of the holder of our Class B common stock, Ares Management GP LLC (in such capacity, the “Class B Stockholder”), and Class C Stockholder. Our certificate of incorporation also provides that the number of authorized shares of our Class A common stock may be increased solely by the holders of a majority of the voting power of our outstanding capital stock entitled to vote thereon, voting together as a single class, and no other vote of the holders of any class or series of our stock, voting together or separately as a class, shall be required therefor. As a result, holders of our Class A common stock will have very limited or no ability to influence stockholder decisions, including decisions regarding our business.
The voting rights of holders of our Class A common stock are further restricted by provisions in our certificate of incorporation stating that any of our shares of stock held by a person or group that beneficially owns 20% or more of any class of stock then outstanding (other than the holders of our Class B common stock, Ares Owners Holdings L.P. (“Ares Owners”), any Holdco Member or any of their respective affiliates, or a direct or subsequently approved transferee of the foregoing) cannot be voted on any matter. The Class B Stockholder and Class C Stockholder are both exempt from this limitation.
These limits on the ability of the holders of our Class A common stock to exercise voting rights restrict the ability of the holders of our Class A common stock to influence matters subject to a vote of our stockholders.
The Holdco Members are able to significantly influence the outcome of any matter that may be submitted for a vote of holders of our common stock.
The Class B Stockholder and Class C Stockholder, entities wholly owned by Ares Partners Holdco LLC, which is in turn owned and controlled by the Holdco Members, hold the shares of our Class B common stock and the shares of our Class C common stock, respectively. On any date on which the Ares Ownership Condition is satisfied, the shares of our Class B common stock held by the Class B Stockholder entitles it to a number of votes, in the aggregate, equal to (x) four times the aggregate number of votes attributable to the shares of our Class A common stock minus (y) the aggregate number of votes attributable to the shares of our Class C common stock. On any date on which the Ares Ownership Condition is not satisfied,
the shares of our Class B common stock held by the Class B Stockholder will not be entitled to vote on any matter submitted to a vote of our stockholders. The Class C Stockholder, as the holder of our Class C common stock, is entitled to a number of votes equal to the number of AOG Units held of record by each limited partner of the AOG entities (other than us and our subsidiaries). In addition, Ares Partners Holdco LLC, in its capacity as general partner of Ares Owners, is entitled to direct the vote of all the shares of our Class A common stock held by Ares Owners. Accordingly, the Holdco Members have sufficient voting power to determine the outcome of matters submitted for a vote of our common stockholders.
Furthermore, our certificate of incorporation provides that special meetings of our stockholders may be called at any time only by or at the direction of our board of directors, a record holder of our Class B common stock or stockholders representing 50% or more of the voting power of the outstanding stock of the class or classes of stock which are entitled to vote at such meeting. Our Class A common stock and our Class C common stock are considered the same class of common stock for this purpose.
Each year, our board of directors determines whether, as of January 31, the total voting power held by: (i) holders of our Class C common stock; (ii) then-current or former Ares personnel (including indirectly through related entities); and (iii) Ares Owners, without duplication, is at least 10% of the voting power of the shares of our Class A common stock and the shares of our Class C common stock, voting together as a single class (the “Designated Stock”) (the “Ares Ownership Condition”). For purposes of determining whether the Ares Ownership Condition is satisfied, our board of directors will treat as outstanding, and as held by the foregoing persons, all shares of our common stock deliverable to such persons pursuant to equity awards granted to such persons. The Ares Ownership Condition is currently satisfied because Ares Owners owns a number of shares of our Class A common stock and AOG Units such that the Class C Stockholder and Ares Owners control over 70% of the voting power of the Designated Stock. In addition, certain Ares personnel (including the Holdco Members) also hold shares of our Class A common stock and are entitled to shares of our Class A common stock pursuant to equity awards. All such additional shares of our Class A common stock would be considered in determining whether the Ares Ownership Condition is satisfied.
If the Ares Ownership Condition is satisfied, our certificate of incorporation provides that our board of directors will be divided into two classes: Class I directors and Class II directors. Mr. Antony P. Ressler, a Holdco Member, is the only Class I director and will continue to be a Class I director until his ownership of our common stock decreases below certain specified thresholds. All other directors are Class II directors. Furthermore, so long as the Ares Ownership Condition is satisfied, (x) a quorum for the transaction of business at any meeting of our board of directors and (y) any act of our board of directors, requires a majority of the board of directors, which majority must include the Class I director. This effectively provides Mr. Ressler a veto right over all actions taken by our board of directors.
As a result of these matters and the provisions referred to under “—Due to the disparity in voting power among the classes of our common stock, holders of our Class A common stock will generally have no influence over matters on which holders of our common stock vote and limited ability to influence decisions regarding our business,” holders of our Class A common stock may be deprived of an opportunity to receive a premium for their shares of our Class A common stock in the future through a sale of AMC, and the trading prices of shares of our Class A common stock may be adversely affected by the absence or reduction of a takeover premium in the trading price.
Potential conflicts of interest may arise among the Class B Stockholder and the Class C Stockholder, on the one hand, and the holders of our Class A common stock and/or Series B mandatory convertible preferred stock, on the other hand.
The Class B Stockholder and the Class C Stockholder are controlled by the Holdco Members, certain of whom also serve on our board of directors and all of whom serve as executive officers. As a result, conflicts of interest may arise among the Class B Stockholder and the Class C Stockholder, and their respective controlling persons, on the one hand, and us and the holders of our Class A common stock and/or Series B mandatory convertible preferred stock, on the other hand.
The Class B Stockholder and the Class C Stockholder, and thereby the Holdco Members, have the ability to influence our business and affairs through their ownership of the shares of our Class B common stock and the shares of our Class C common stock, respectively, and provisions under our certificate of incorporation requiring the approval of the holders of our Class B common stock for certain corporate actions. Due to the disparity in voting power among the classes of our common stock, the Class B Stockholder and the Class C Stockholder will effectively control the election of directors while the Ares Ownership Condition is satisfied, and holders of our Class A common stock will generally have limited ability to elect directors and no ability to remove any of our directors, with or without cause.
As such, the Class B Stockholder and Class C Stockholder, and thereby the Holdco Members, have the ability to indirectly, and in some cases directly, influence the determination of the amount and timing of the Ares Operating Group’s investments and dispositions, cash expenditures, including those relating to compensation, indebtedness, issuances of additional
partner interests, tax liabilities and amounts of reserves, each of which can affect the amount of cash that is available for distribution to holders of AOG Units.
In addition, conflicts may arise relating to the selection and structuring of investments or transactions, declaring dividends and other distributions. For example, certain of our principals and senior professional owners indirectly hold their AOG Units through Ares Owners, which, unlike us, is not subject to corporate income taxation. See “—Risks Related to Taxation—Tax consequences to the direct and indirect holders of AOG Units or to general partners in our funds may give rise to conflicts of interests.”
Certain actions by our board of directors require the approval of the Class B Stockholder, which is controlled by the Holdco Members.
Although the affirmative vote of a majority of our directors (which, so long as the Ares Ownership Condition is satisfied, must include the Class I director) is required for any action to be taken by our board of directors, certain specified actions will also require the approval of the Class B Stockholder, which is controlled by the Holdco Members. These actions consist of the following:
•certain amendments to our certificate of incorporation (including amendments to the definition of “Ares Ownership Condition” therein), or the amendment or repeal, in whole or in part, of certain provisions of our bylaws relating to our board of directors and officers (including the adoption of any provision inconsistent therewith);
•the sale or exchange of all or substantially all of our and our subsidiaries’ assets, taken as a whole, in a single transaction or a series of related transactions; and
•the merger, consolidation or other combination of our company with or into any other person.
As a “controlled company,” we qualify for some exemptions from the corporate governance and other requirements of the NYSE.
We are a “controlled company” within the meaning of the corporate governance standards of the NYSE. Under the NYSE rules, a company of which more than 50% of the voting power for the election of directors is held by an individual, group or another company is a “controlled company” and may elect, and we have elected, and expect to continue to elect, not to comply with certain corporate governance requirements of the NYSE, including the requirement that the listed company have a nominating and corporate governance committee that is composed entirely of independent directors. Accordingly, holders of our Class A common stock and/or Series B mandatory convertible preferred stock do not have the same protections afforded to stockholders of companies that are subject to all of the corporate governance requirements of the NYSE.
Our certificate of incorporation states that the Class B Stockholder is under no obligation to consider the separate interests of our other stockholders and contains provisions limiting the liability of the Class B Stockholder.
Due to the disparity in the voting power of the classes of our common stock, holders of our Class A common stock will generally have no influence over matters on which holders of our common stock vote. As a result, on any date on which the Ares Ownership Condition is satisfied, nearly all matters submitted to a vote of the holders of our common stock will be determined by the vote of the Class B Stockholder. Although controlling stockholders may owe duties to minority stockholders, our certificate of incorporation contains provisions limiting the duties owed by the Class B Stockholder and contains provisions allowing the Class B Stockholder to favor its own interests and the interests of its controlling persons over us and the holders of our Class A common stock. Our certificate of incorporation contains provisions stating that the Class B Stockholder is under no obligation to consider the separate interests of our other stockholders (including the tax consequences to such stockholders) in deciding whether or not to cause us to take (or decline to take) any action as well as provisions stating that the Class B Stockholder shall not be liable to our other stockholders for monetary damages or equitable relief for losses sustained, liabilities incurred or benefits not derived by such stockholders in connection with such decisions. See “—Potential conflicts of interest may arise among the Class B Stockholder and the Class C Stockholder, on the one hand, and the holders of our Class A common stock and/or Series B mandatory convertible preferred stock, on the other hand.”
The Class B Stockholder will not be liable to us or holders of our Class A common stock for any acts or omissions unless there has been a final and non-appealable judgment determining that the Class B Stockholder acted in bad faith or with criminal intent, and we have also agreed to indemnify other designated persons to a similar extent.
Even if there is deemed to be a breach of the obligations set forth in our certificate of incorporation, our certificate of incorporation provides that the Class B Stockholder will not be liable to us or the holders of our Class A common stock for any acts or omissions unless there has been a final and non-appealable judgment entered by a court of competent jurisdiction determining that, in respect of the matter in question, the Class B Stockholder acted in bad faith or with criminal intent. These
provisions are detrimental to the holders of our Class A common stock because they restrict the remedies available to our stockholders for actions of the Class B Stockholder.
In addition, we have agreed to indemnify and hold harmless (i) each member of our board of directors and each of our officers, (ii) each holder of record of our Class B common stock, (iii) Ares Management GP LLC, in its capacity as the former general partner of our company when we were a Delaware limited partnership, and any successor or permitted assign, (iv) any person who is or was a “tax matters partner” (as defined in the Section 6231 of the Code prior to amendment by P.L. 114-74) or “partnership representative” (as defined in Section 6223 of the Code after amendment by P.L. 114-74), member, manager, officer or director of any holder of record of our Class B common stock or Ares Management GP LLC, and (v) any member, manager, officer or director of any holder of record of our Class B common stock or Ares Management GP LLC who is or was serving at the request of any holder of record of our Class B common stock or Ares Management GP LLC as a director, officer, manager, employee, trustee, fiduciary, partner, tax matters partner, partnership representative, member, representative, agent or advisor of another person (collectively, the “Indemnitees”), in each case, to the fullest extent permitted by law, on an after tax basis from and against any and all losses, claims, damages, liabilities, joint or several, expenses (including legal fees and expenses), judgments, fines, penalties, interests, settlements or other amounts arising from any and all threatened, pending or completed claim, demand, action, suit or proceeding, whether civil, criminal, administrative or investigative, and whether formal or informal, and including appeals, in which any Indemnitee may be involved, or is threatened to be involved, as a party or otherwise, by reason of its status as an Indemnitee, whether arising from acts or omissions to act occurring on, before or after the date of our certificate of incorporation. We have agreed to provide this indemnification unless there has been a final and non-appealable judgment entered by a court of competent jurisdiction determining that, in respect of the matter in question, the Indemnitee acted in bad faith or with criminal intent.
The provision of our certificate of incorporation requiring exclusive venue in the Court of Chancery in the State of Delaware for certain types of lawsuits may have the effect of discouraging lawsuits against us and our directors, officers and stockholders.
Our certificate of incorporation requires, to the fullest extent permitted by law, that any claim, demand, action, suit or proceeding, whether civil, criminal, administrative or investigative, and whether formal or informal, and including appeals, arising out of or relating in any way to our certificate of incorporation or any of our stock may only be brought in the Court of Chancery of the State of Delaware or, if such court does not have subject matter jurisdiction thereof, any other court in the State of Delaware with subject matter jurisdiction. This provision may have the effect of discouraging lawsuits against us and our directors, officers and stockholders.
Our ability to pay dividends to the holders of our Class A and non-voting common stock may be limited by our holding company structure, applicable provisions of Delaware law and contractual restrictions or obligations.
As a holding company, our ability to pay dividends will be subject to the ability of our subsidiaries to provide cash to us. AMC has no material assets other than investments in the AOG entities, either directly or through subsidiaries. We have no independent means of generating revenues. Accordingly, we intend to cause the AOG entities to fund any dividends we may declare on shares of our Class A and non-voting common stock. If the AOG entities make distributions to fund such dividends, all holders of AOG Units will be entitled to receive equivalent distributions pro rata based on their partnership interests in the Ares Operating Group.
Because as a U.S. corporation we will be subject to entity-level corporate income taxes and may be obligated to make payments under the TRA, the amount of dividends ultimately paid by us to holders of our Class A and non-voting common stock are generally expected to be less, on a per share basis, than the amounts distributed by the Ares Operating Group to the holders of AOG Units (including us) in respect of their or our AOG Units.
Our dividend policy contemplates a steady quarterly dividend for each calendar year that will be based on fee related earnings after an allocation of current taxes paid. The declaration, payment and determination of the amount of quarterly dividends, if any, will be at the sole discretion of our board of directors, and reassessed each year based on the level and growth of our fee related earnings after an allocation of current taxes paid. We may change our dividend policy at any time. There can be no assurance that any dividends, whether quarterly or otherwise, can or will be paid. Our ability to make cash dividends to holders of our Class A and non-voting common stock depends on a number of factors, including among other things, general economic and business conditions, our strategic plans and prospects, our businesses and investment opportunities, our financial condition and operating results, working capital requirements and other anticipated cash needs, contractual restrictions and obligations, including fulfilling our current and future capital commitments, legal, tax and regulatory restrictions, restrictions and other implications on the payment of dividends by us to our common stockholders or by our subsidiaries to us, payments required to be made pursuant to the TRA and such other factors as our board of directors may deem relevant.
Under the DGCL, we may only pay dividends to our stockholders out of: (i) our surplus, as defined and computed under the provisions of the DGCL or (ii) our net profits for the fiscal year in which the dividend is declared and/or the preceding fiscal year. If we do not have sufficient surplus or net profits, we will be prohibited by law from paying any such dividend. In addition, the terms of the Credit Facility or other financing arrangements may from time to time include covenants or other restrictions that could constrain our ability to make dividends. Furthermore, the Ares Operating Group’s cash flow may be insufficient to enable them to make required minimum tax distributions to their members and partners, in which case the Ares Operating Group may have to borrow funds or sell assets, which could have a material adverse effect on our liquidity and financial condition. Our certificate of incorporation contains provisions authorizing us, subject to the approval of our stockholders, to issue additional classes or series of stock that have designations, preferences, rights, powers and duties that are different from, and may be senior to, those applicable to shares of our Class A common stock.
Furthermore, by making cash dividends to our stockholders rather than investing that cash in our businesses, we risk slowing the pace of our growth, or not having a sufficient amount of cash to fund our operations, new investments or unanticipated capital expenditures, should the need arise.
In addition, on October 10, 2024, we issued 30,000,000 shares of Series B mandatory convertible preferred stock with a dividend rate of 6.75% per annum on the liquidation preference thereof. The Series B mandatory convertible preferred stock ranks senior to our Class A common stock and non-voting common stock, with respect to the payment of dividends. As long as any share of Series B mandatory convertible preferred stock is outstanding, unless all accumulated and unpaid dividends on the Series B mandatory convertible preferred stock for all preceding dividend periods have been declared and paid in full or declared and set apart for payment, we may not declare, pay or set apart for payment any dividends on our Class A common stock or any other class or series of stock that ranks junior to the Series B mandatory convertible preferred stock. Dividends on the Series B mandatory convertible preferred stock are discretionary and cumulative. Holders of Series B mandatory convertible preferred stock will only receive dividends on their shares when, as and if declared by our board of directors. If dividends on the Series B mandatory convertible preferred stock have not been declared and paid for the equivalent of six or more quarterly dividend periods, whether or not consecutive, holders of Series B mandatory convertible preferred stock, together as a class with holders of any other series of parity stock with like voting rights, will be entitled to vote in an election for two additional directors to our board of directors. This right to elect additional directors to our board of directors will dilute the representation of our stockholders on our board of directors and may adversely affect the market price of our Class A common stock. When all accumulated and unpaid dividends have been paid in full, the right of the holders of Series B mandatory convertible preferred stock to elect these two additional directors will terminate, the terms of office of these two directors will forthwith terminate and the number of directors constituting our board of directors will be reduced accordingly. Additional risks related to the Series B mandatory convertible preferred stock are contained in the prospectus supplement filed with the SEC on October 9, 2024.
The Class B Stockholder or the Class C Stockholder may transfer their interests in the shares of our Class B common stock or the shares of our Class C common stock, respectively, which could materially alter our operations.
Subject to certain restrictions outlined in our certificate of incorporation, our stock is freely transferable and the Class B Stockholder or the Class C Stockholder may transfer their shares of our Class B common stock and our Class C common stock, respectively, to a third party without the consent of the holders of any other class or series of our stock. Further, the members of the Class B Stockholder or the Class C Stockholder may sell or transfer all or part of their limited liability company interests in the Class B Stockholder or the Class C Stockholder, respectively, at any time without restriction. Any such transfer could constitute or cause a change of control under the Investment Advisers Act, the Credit Facility or other debt instruments and/or governing documents of our funds and other vehicles, which could require consents or waivers or cause defaults under any such documents. In addition, a new holder of shares of our Class B common stock or shares of our Class C common stock, or new controlling members of the Class B Stockholder or Class C Stockholder, may choose to vote for the election of directors to our board of directors who may not be willing or able to cause us to form new funds and could cause us to form funds that have investment objectives and governing terms that differ materially from those of our current funds. A new holder of our Class B common stock or our Class C Common Stock, new controlling members of the Class B Stockholder or Class C Stockholder and/or the directors they each respectively may appoint to our board of directors could also have a different investment philosophy, cause us or our affiliates to employ investment professionals who are less experienced, be unsuccessful in identifying investment opportunities or have a track record that is not as successful as our track record. If any of the foregoing were to occur, we could experience difficulty in making new investments, and the value of our existing investments, our business, our results of operations and our financial condition could materially suffer.
Our certificate of incorporation also provides us with a right to acquire shares of our Class A common stock under specified circumstances, which may adversely affect the price of shares of our Class A common stock.
Our certificate of incorporation provides that, if at any time, either: (i) less than 10% of the total shares of any class of our stock then outstanding (other than our Class B common stock, and our Class C common stock) is held by persons other than a record holder of our Class B common stock, any person who is, was or will be a member of Ares Partners Holdco LLC or their respective affiliates or (ii) we are required to register as an investment company under the Investment Company Act, we may exercise our right to purchase shares of our Class A common stock or assign this right to a record holder of our Class B common stock or any of its affiliates. As a result, a stockholder may have his or her shares of our Class A common stock purchased from him or her at an undesirable time or price.
Other anti-takeover provisions in our charter documents could delay or prevent a change in control.
In addition to the provisions described elsewhere relating to the relative voting power of our classes of common stock, other provisions in our certificate of incorporation and bylaws may discourage, delay or prevent a merger or acquisition that a holder of our Class A common stock may consider favorable by, for example:
•permitting our board of directors to issue one or more series of preferred stock;
•providing for the loss of voting rights for certain series or classes of our capital stock;
•imposing supermajority voting requirements for certain amendments to our certificate of incorporation;
•requiring advance notice for stockholder proposals and nominations at annual and special meetings of our stockholders; and
•placing limitations on convening stockholder meetings.
These provisions may also discourage acquisition proposals or delay or prevent a change in control.
Risks Related to Shares of Our Common Stock
The market price and trading volume of shares of our Class A common stock may be volatile, which could result in rapid and substantial losses for holders of our Class A common stock.
The market price of shares of our Class A common stock may be highly volatile and could be subject to wide fluctuations. In addition, the trading volume in shares of our Class A common stock may fluctuate and cause significant price variations to occur. If the market price of shares of our Class A common stock declines significantly, holders of our Class A common stock may be unable to resell their shares of our Class A common stock at or above their purchase price, if at all. The market price of shares of our Class A common stock may fluctuate or decline significantly in the future.
In the past few years, stock markets have experienced extreme price and volume fluctuations. In the past, following periods of volatility in the overall market and the market price of a company’s securities, securities class action litigation has often been instituted against public companies. This type of litigation, if instituted against us, could result in substantial costs and a diversion of our management’s attention and resources.
The market price of shares of our Class A common stock may decline due to the large number of shares of Class A common stock eligible for exchange and future sale.
The market price of shares of our Class A common stock could decline as a result of sales of a large number of shares of our Class A common stock in the market and non-voting common stock, to the extent that sales happen in the future or the perception that such sales could occur, including pursuant to Rule 10b5-1 trading plans. These sales, or the possibility that these sales may occur, also might make it more difficult for us to sell shares of our Class A common stock in the future at a time and at a price that we deem appropriate. We may freely issue and sell in the future additional shares of our Class A common stock. In addition, some of our directors and executive officers have entered into, or may enter into, Rule 10b5-1 trading plans pursuant to which they may sell shares of our Class A common stock from time to time in the future.
As of December 31, 2024, our professionals owned, indirectly, an aggregate of 109,806,689 AOG Units. We have entered into an exchange agreement with the holders of AOG Units so that such holders may, up to four times each year (subject to the terms of the exchange agreement and any contractual lock-up arrangements), exchange their AOG Units for shares of our Class A common stock on a one-for-one basis, subject to customary conversion rate adjustments for splits, stock dividends and reclassifications, or, at our option, for cash. A holder of AOG Units must exchange one AOG Unit in the Ares Operating Group entity to effect an exchange for a share of Class A common stock of AMC.
Ares Owners Holdings L.P. has the right, under certain circumstances and subject to certain restrictions, to require us to register under the Securities Act shares of Class A common stock delivered in exchange for AOG Units or shares of Class A
common stock of AMC otherwise held by them. In addition, we may be required to make available shelf registration statements permitting sales of shares of our Class A common stock into the market from time to time over an extended period. Lastly, Ares Owners Holdings L.P. will have the ability to exercise certain piggyback registration rights in respect of shares of our Class A common stock held by them in connection with registered offerings requested by other registration rights holders or initiated by us.
As of December 31, 2024, there were 17,968,940 restricted units outstanding to be settled in shares of our Class A common stock, which are subject to specified vesting requirements, and were granted to certain of our senior professionals under the 2023 Ares Management Corporation Equity Incentive Plan (the “Equity Incentive Plan”). As of December 31, 2024, 62,634,307 shares of our Class A common stock were available to be issued under the Equity Incentive Plan. We have filed a registration statement on Form S-8 with the SEC covering the shares of our Class A common stock issuable under the Equity Incentive Plan. Subject to vesting arrangements such shares of our Class A common stock are freely tradable. Vesting of those shares of restricted units would dilute the ownership interest of existing stockholders.
In addition, the governing agreements of the AOG entities authorize the direct subsidiaries of AMC which are the general partners of those entities to issue an unlimited number of additional units of the Ares Operating Group entity with such designations, preferences, rights, powers and duties that are different from, and may be senior to, those applicable to the AOG Units, and which may be exchangeable for shares of our Class A common stock.
Risks Related to Taxation
Changes in relevant tax laws, regulations or treaties or an adverse interpretation of these items by tax authorities may adversely affect our effective tax rate, tax liability and financial condition and results.
Any substantial changes in domestic or international corporate tax policies, regulations or guidance, enforcement activities or legislative initiatives may adversely affect our business, the amount of taxes we are required to pay and our financial condition and results of operations generally. Our effective tax rate and tax liability is based on the application of current income tax laws, regulations and treaties. These laws, regulations and treaties are complex, and the manner in which they apply to us and our funds is sometimes open to interpretation. Significant management judgment is required in determining our provision for income taxes, our deferred tax assets and liabilities and any valuation allowance recorded against our net deferred tax assets. Although management believes its application of current laws, regulations and treaties to be correct and sustainable upon examination by the tax authorities, the tax authorities could challenge our interpretation resulting in additional tax liability or adjustment to our income tax provision that could increase our effective tax rate. For an overview of certain relevant U.S. tax laws and relevant foreign tax laws, see “—Applicable U.S. and foreign tax law, regulations, or treaties, and changes in such tax laws, regulations or treaties or an adverse interpretation of these items by tax authorities could adversely affect our effective tax rate, tax liability, financial condition and results, ability to raise funds from certain foreign investors, increase our compliance or withholding tax costs and conflict with our contractual obligations.” The introduction of additional tax regimes both globally and domestically, the implementation of which are uncertain, require significant judgment and will depend on the facts and circumstances of each year. These regimes may not be compatible with one another and may cause adverse tax consequences.
Applicable U.S. and foreign tax law, regulations, or treaties, and changes in such tax laws, regulations or treaties or an adverse interpretation of these items by tax authorities could adversely affect our effective tax rate, tax liability, financial condition and results, ability to raise funds from certain foreign investors, increase our compliance or withholding tax costs and conflict with our contractual obligations.
Overview of certain relevant U.S. tax laws. Tax laws, regulations or treaties newly enacted or enacted in the future may cause us to revalue our net deferred tax assets and have a material change to our effective tax rate and tax liabilities. Moreover, significant management judgment is involved applying tax laws, regulations and treaties to us and our funds such that tax authorities could challenge our interpretation, resulting in additional tax liability or adjustment to our income tax provision that could increase our effective tax rate. For example, on March 11, 2021, the American Rescue Plan Act of 2021 (Pub. L. No. 117-2) (the “ARPA”) was enacted. The ARPA added a new subsection to Section 162(m) of the Code to expand the disallowance for deduction of certain compensation paid by publicly held corporations to cover the next five most highly compensated employees for the taxable year, which expansion will be effective for tax years beginning after December 31, 2026. The expansion of Section 162(m) is expected to generally reduce the amount of tax deductions available to us. In addition, on August 16, 2022, the Inflation Reduction Act (Pub. L. No. 117-169) (the “IRA”) was signed into law. The IRA introduced a 15% minimum tax (“CAMT”) for corporations whose average annual adjusted financial statement income for any consecutive three-tax-year period preceding the tax year exceeds $1 billion and a 1% excise tax on the fair market value of stock repurchased by certain corporations after December 31, 2022. The IRA has not had a material impact on our income tax liability for 2024, but if we were to reach the applicable financial statement income thresholds, the CAMT rules could increase
tax compliance complexity and result in additional administrative costs and income tax liabilities. The potential impact of CAMT on future taxable years, including as early as the 2026 taxable year, will depend on the facts and circumstances of such years.
Under Sections 1471 to 1474 of the Code (such Sections, along with the Treasury Regulations promulgated thereunder, “FATCA”), a broadly defined class of foreign financial institutions are required to comply with a U.S. tax reporting regime or be subject to certain U.S. withholding taxes. The reporting obligations imposed under FATCA require foreign financial institutions to enter into agreements with the IRS to obtain and disclose information about certain account holders and investors to the IRS (or in the case of certain foreign financial institutions that are resident in a jurisdiction that has entered into an intergovernmental agreement (the “IGA”) to implement this legislation, to comply with comparable foreign laws implementing the IGA). Additionally, certain foreign entities that are not foreign financial institutions are required to provide certain certifications or other information regarding their U.S. beneficial ownership or be subject to certain U.S. withholding taxes under FATCA. Failure to comply with these requirements could expose us and/or our investors to a 30% withholding tax on certain U.S. payments, and possibly limit our ability to open bank accounts and secure funding in the global capital markets. There are uncertainties regarding the implementation of FATCA and it is difficult to determine at this time what impact any future administrative guidance may have. The administrative and economic costs of compliance with FATCA may discourage some foreign investors from investing in U.S. funds, which could adversely affect our ability to raise funds from these investors or reduce the demand for shares of our Class A common stock. Moreover, we expect to incur additional expenses related to our compliance with FATCA, which could increase our tax compliance costs generally. As discussed below, other countries, such as the U.K., Luxembourg, and the Cayman Islands, have implemented regimes similar to that of FATCA, and a growing number of countries have adopted (or are in process of introducing) similar legislation designed to provide increased transparency about our investors and their tax planning and profile. One or more of these information exchange regimes are likely to apply to our funds, and we may be obligated to collect and share with applicable taxing authorities information concerning investors in our funds (including identifying information and amounts of certain income allocable or distributable to them).
Overview of certain relevant foreign tax laws. HM Treasury, the Organization for Economic Co-operation and Development (the “OECD”) and other government agencies in jurisdictions where we and our affiliates invest or conduct business have maintained a focus on issues related to the taxation of businesses, including multinational entities.
The U.K. has implemented two corporate criminal offenses: failure to prevent facilitation of U.K. tax evasion and failure to prevent facilitation of overseas tax evasion. Liability under these offences can be mitigated where the relevant business has in place reasonable prevention procedures. The scope of these offences is extremely wide and could have an impact on Ares’ global businesses. The U.K. has also implemented transparency legislation that requires many large businesses to publish their U.K. tax strategies and their approach to dealing with the U.K. tax authority on their websites. Our U.K. tax policy statement is published on our website. These developments show that the U.K. is seeking to bring tax matters further into the public domain. As a result, tax matters may pose an increased reputational risk to our business.
The EU, the U.K. and many other countries have implemented the OECD’s Common Reporting Standard for the automatic exchange of financial account information in tax matters (the “CRS”). EU Council Directive 2011/16/EU requires a mandatory automatic exchange of information regime on administrative co-operation in the field of taxation (as amended) (the “Directive on Administrative Co-Operation” or the “DAC”). The DAC, which effectively incorporates (among other items) the CRS into European law, like the CRS, requires governments to obtain detailed account information from financial institutions and exchange that information automatically with other jurisdictions annually. Neither the CRS nor the DAC imposes withholding taxes. EU Council Directive 2018/822 (“DAC 6”) amended the DAC to require ‘intermediaries’ (as defined in DAC 6) and, in some cases, taxpayers to disclose information to tax authorities about cross-border arrangements bearing specific hallmarks involving one or more EU member states. Certain cross-border arrangements are reportable to relevant taxing authorities. Similar reporting rules may apply or be introduced in other jurisdictions which implement the OECD mandatory disclosure rules (“OECD MDR”). With effect from December 31, 2020, the U.K. narrowed the scope of DAC 6 and the corresponding arrangements that need to be reported in the U.K. pursuant to DAC 6 (as implemented under U.K. law by the International Tax Enforcement (Disclosable Arrangements) Regulations 2020 (the “U.K. Regulations”)). In line with OECD standards (as a minimum) on exchange of information on cross-border planning arrangements such that only arrangements, very broadly, relating to the avoidance of obligations to report information in financial accounts or that obscure beneficial ownership (Category D Hallmarks), are required to be reporting in the U.K. under DAC 6. On March 28, 2023, new U.K. regulations (the International Tax Enforcement (Disclosable Arrangements) Regulations 2023 (the “U.K. MDR Regulations 2023”)) came into force in the U.K. which repealed and replaced the U.K. Regulations. The U.K. MDR Regulations 2023 implement OECD MDR into U.K. law and require U.K. 'intermediaries' (as defined under OECD MDR), and in some cases taxpayers, to report information to HMRC about certain types of arrangements known as CRS avoidance arrangements and opaque offshore structures. The EU has also signed separate automatic exchange of information agreements with certain non-EU countries, under which the EU and the relevant jurisdiction will automatically exchange information on the financial
accounts of each other’s residents. Investors in our funds will be required: (i) to consent to the taking of any action in connection with FATCA, the CRS, the DAC (including DAC 6), the OECD MDR and/or any local law relating to, implementing or having similar effect to any of these regimes, including the disclosure of information to tax authorities which may in turn be exchanged between other tax authorities; and (ii) to agree to provide the AIFM and/or the general partner with the information they require to comply with FATCA, the CRS, the DAC (including DAC 6), the OECD MDR and/or any local law relating to, implementing or having similar effect to any of these regimes in any relevant jurisdiction. The breadth of the disclosure requirements under such tax reporting regimes will likely create costs and administrative burdens and penalties and withholding taxes could be imposed for non-compliance.
Pursuant to the OECD’s Base Erosion and Profit Shifting (“BEPS”) Project, many individual jurisdictions have now introduced domestic legislation implementing certain of the BEPS actions. Several of the areas of tax law (including double taxation treaties) on which the BEPS Project focuses are relevant to the ability of our funds to efficiently realize income or capital gains and to efficiently repatriate income and capital gains from the jurisdictions in which they arise to partners and, depending on the extent to and manner in which relevant jurisdictions have implemented (or implement, as the case may be) changes in such areas of tax law (including double taxation treaties), the ability of our funds to do these things may be adversely impacted. Changes in tax laws as a result of the BEPS Project may, for example, result in: (i) the restriction or loss of existing access by partners in our funds or their subsidiaries to tax relief under applicable double taxation treaties or EU directives, such as the EU Interest and Royalties Directive; (ii) restrictions on permitted levels of deductibility of expenses (such as interest) for tax purposes; (iii) rules affecting profit allocation and local nexus requirements, transfer pricing, or the treatment of hybrid entities/investments; or (iv) an increased risk of activity undertaken in a jurisdiction constituting a permanent establishment of our funds and/or any of their subsidiaries.
Many of the jurisdictions in which our funds will make investments have now ratified, accepted and approved the OECD’s draft Multilateral Instrument (“MLI”) which brings into force a number of relevant changes to double tax treaties within scope. The MLI is intended to facilitate the speedy introduction by participating states of double tax treaty-related BEPS recommendations. While these changes continue to be introduced, there remains significant uncertainty as to whether and, if so, to what extent our funds or their subsidiaries may benefit from the protections afforded by such treaties and whether our funds may look to their partners in order to derive tax treaty or other benefits. This position is likely to remain uncertain for a number of years.
In May 2017, the Council of the EU formally adopted the Council Directive amending Directive (EU) 2016/1164 as regards hybrid mismatches with third countries (commonly referred to as “ATAD II”), which came into force in member states on January 1, 2020 (subject to relevant derogations) and which contains a set of anti-hybrid rules.
ATAD II was implemented into Luxembourg domestic law by way of a law dated December 20, 2019. ATAD II covers inter alia hybrid mismatches and imported hybrid mismatches resulting from the different characterization of a financial instrument or an entity leading to situations of deduction without inclusion or double deduction. For hybrid mismatches resulting in a situation of deduction without inclusion, the primary rule is that the member state of the payor shall deny such deduction. For hybrid mismatches resulting in a situation of double deduction, a deduction shall only be given to the member state where the payment has its source. However, if, the jurisdiction of the payee does not deny the deduction, the secondary rule would oblige the jurisdiction of the payor to deny the deduction at the level of the payor.
If ATAD II anti-hybrid rules apply, they can act to deny (to a greater or lesser extent) deductibility in Luxembourg to corporate entities of interest/expenses or bring otherwise transparent vehicles within the charge to Luxembourg corporate tax. However, these anti-hybrid rules only apply to arrangements: (i) between associated enterprises or (ii) that constitute “structured arrangements.” In the context of hybrid mismatches resulting from the different characterization of a financial instrument, an entity will need to hold a direct or indirect interest of 25% or more of the voting rights, capital interests or rights to share a profit to be considered an associated enterprise. The 25% requirement is replaced by a 50% requirement if the hybrid mismatch results from a different characterization of an entity (i.e., a hybrid entity). With respect to the computation of this 25% or 50% threshold requirement, ATAD II makes reference to the OECD concept of “persons acting together”, as it is specifically mentioned that for purposes of the anti-hybrid rules under ATAD II, “a person who acts together with another person in respect of the voting rights or capital ownership of an entity shall be treated as holding a participation in all of the voting rights or capital ownership of that entity that are held by the other person.” However, the Luxembourg law implementing ATAD II provides that an investor in an investment fund who holds directly or indirectly less than 10% of the interest in the investment fund and who is entitled to receive less than 10% of the fund’s profits is presumed not to act together with the other investors in the same investment fund (since the investors have in principle no effective control over the investments realized by the fund), unless proved otherwise (the de minimis rule). As a consequence of this rebuttable presumption, any investor holding less than 10% in an investment fund should not be regarded as an “associated enterprise” of the fund and of any underlying Luxembourg entities. Any investor holding more than 10% will only be regarded as an “associated enterprise” if it meets the requisite threshold in its own right, or it can be demonstrated that it is acting together with other investors, which would cause it
to be deemed to reach the requisite threshold. Our funds have sought their own tax advice in relation to these rules and their potential impact on our funds and their future investments.
The impacts of ATAD II on interest and other finance costs in the context of European investments are jurisdiction specific and will be examined on an investment-by-investment basis.
Further to the BEPS Project, and in particular BEPS Action 1 (“Addressing the Tax Challenges of the Digital Economy”), the OECD published a Report on May 31, 2019 entitled “Programme of Work to Develop a Consensus Solution to the Tax Challenges Arising from the Digitalisation of the Economy” (as updated on several occasions since and most recently on October 8, 2021 by the “Statement on a Two-Pillar Solution to Address the Tax Challenges Arising from the Digitalisation of the Economy”), which proposes fundamental changes to the international tax system. The proposals (commonly referred to as “BEPS 2.0”) are based on two “pillars”, involving the reallocation of taxing rights (“Amount A of Pillar One”), and a new global minimum corporate tax rate (“Pillar Two”). Under Amount A of Pillar One, multinational enterprises (“MNEs”) with total group revenues exceeding EUR 20 billion (or equivalent) in a given period and pre-tax profitability exceeding 10% calculated using an averaging mechanism will be subject to rules allocating 25% of profits in excess of a 10% profit margin to the jurisdictions within which they carry on business (subject to threshold rules). Certain entities are excluded, including certain investment funds and real estate investment vehicles (as respectively defined) which are the ultimate parent entity of the MNE group (and certain holding vehicles of such entities). There are also specific exclusions for MNEs carrying on specific low-risk activities, including “regulated financial services” (as defined). Pillar Two imposes a minimum effective tax rate of 15% on MNEs that have consolidated revenues of at least EUR 750 million in at least two out of the last four years (i.e., broadly those MNEs which are required to undertake country by country reporting). Pillar Two introduces two related tax measures (the “GloBE Rules”): the income inclusion rule (“IIR”) imposes a top up tax on a parent entity where a constituent member of the MNE group has low taxed income while the undertaxed payment rule (“UTPR”) applies as a backstop if the constituent member’s income is not taxed by an IIR. Specified classes of entities which are typically exempt from tax are outside the scope of the Pillar Two GloBE Rules, including investment funds and real estate investment vehicles (as respectively defined) which are the ultimate parent entity of the MNE group (and certain holding vehicles of such entities). Additionally, and part of Pillar Two but separate from the GloBE Rules, a subject to tax rule (“STTR”) will permit source jurisdictions to impose limited additional taxation on certain cross-border related party payments where the recipient is subject to a nominal corporate income tax rate (subject, in some circumstances, to certain adjustments) below 9%, which will be creditable against the GloBE Rules tax liability. The GloBE Rules must be implemented through domestic legislation, and on December 20, 2021 the OECD released Pillar Two model rules providing a template for this purpose. Many jurisdictions enacted legislation, including most EU member states pursuant to the EU minimum tax directive and the U.K., with a view to the IIR and the UTPR taking effect for fiscal years beginning on or after December 31, 2023 and December 31, 2024, respectively. Amount A of Pillar One will be implemented through a multilateral convention and the STTR will be implemented, where applicable, either through modifications to bilateral tax treaties or alternatively through a multilateral instrument. The timeline for implementation of both Amount A of Pillar One and the STTR remains uncertain. Subject to the development and implementation of both Amount A of Pillar One and Pillar Two (including the implementation of the EU minimum tax directive by EU member states) and the details of any domestic legislation, double taxation treaty amendments and multilateral agreements which are necessary to implement them, effective tax rates could increase within the fund structure or on its investments, including by way of higher levels of tax being imposed than is currently the case, possible denial of deductions or increased withholding taxes and/or profits being allocated differently and/or penalties could be due. This could adversely affect the returns of investors in our funds. The implementation of BEPS 2.0 in relevant jurisdictions is complex and likely to remain uncertain for a number of years.
On December 22, 2021, the European Commission issued a proposal for a Council Directive laying down rules to prevent the misuse of shell entities for tax purposes within the EU (the “Unshell Proposal”). Whilst the European Commission initially expected the Unshell Proposal to be adopted and published into EU member states’ national laws by June 30, 2023, and to come into effect as of January 1, 2024, the proposal has not yet been adopted and there is considerable uncertainty surrounding the development of the proposal and its implementation. If adopted in its current form, the proposal could result in additional reporting and disclosure obligations for funds and/or their subsidiaries (which may require the sharing with applicable taxing or other governmental authorities of information concerning investors) and/or additional tax being suffered by investors, funds or their subsidiaries.
Effective April 1, 2022, the U.K. implemented a domestic ‘Qualifying Asset Holding Company’ regime, with a view to broadly making the U.K. a more attractive holding company jurisdiction. The extent to which this regime may be applicable or beneficial to and/or utilized by our funds (or their subsidiaries) remains under consideration.
We will be required to pay the TRA Recipients for most of the benefits relating to our use of attributes we receive from prior and future exchanges of AOG Units and related transactions. In certain circumstances, payments to the TRA Recipients may be accelerated and/or could significantly exceed the actual tax benefits we realize.
The holders of AOG Units, subject to any applicable transfer restrictions and other provisions, may, on a quarterly basis, exchange their AOG Units for shares of our Class A common stock on a one-for-one basis or, at our option, for cash. A holder of AOG Units must exchange one AOG Unit in the Ares Operating Group entity to effect an exchange for a share of Class A common stock of AMC. These exchanges are expected to result in increases (for U.S. federal income tax purposes) in the tax basis of the tangible and intangible assets of the relevant Ares Operating Group entity. These increases in tax basis generally will increase (for U.S. federal income tax purposes) depreciation and amortization deductions and potentially reduce gain on sales of assets and, therefore, reduce the amount of tax that we would otherwise be required to pay in the future, although the IRS may challenge all or part of these deductions and tax basis increases, and a court could sustain such a challenge.
We have entered into a TRA with certain direct and indirect holders of AOG Units (the “TRA Recipients”) that provides for the payment (“Tax Receivable Payment”) by us to the TRA Recipients of 85% of the amount of cash tax savings, if any, in U.S. federal, state, local and foreign income tax or franchise tax that we actually realize (or are deemed to realize in the case of an early termination payment by us or a change of control, as discussed below) as a result of increases in tax basis and certain other tax benefits related to our entering into the TRA, including tax benefits attributable to payments under the TRA. Pursuant to an amendment to the TRA, dated May 1, 2023, to the extent Ares Owners Holdings L.P. would have been a TRA Recipient of a Tax Receivable Payment under the TRA prior to the amendment, Ares Owners Holdings L.P. will no longer be entitled to any Tax Receivable Payment for taxable exchanges on or after May 1, 2023. The payments we may make to the TRA Recipients could be material in amount and we may need to incur debt to finance payments under the TRA if our cash resources are insufficient to meet our obligations under the TRA as a result of timing discrepancies or otherwise. The actual increase in tax basis (and our ability to achieve the corresponding tax benefits), as well as the amount and timing of any payments under the TRA, will vary depending upon a number of factors, including the timing of exchanges, the price of a share of our Class A common stock at the time of the exchange, the extent to which such changes are taxable and the amount and timing of our income. In certain circumstances, payments to the TRA Recipients under the TRA could be in excess of our cash tax savings. If the IRS were to challenge a tax basis increase (or the ability to amortize such increase), the TRA Recipients will not reimburse us for any payments previously made to them under the TRA.
In addition, the TRA provides that, upon a change of control, or if, at any time, we elect an early termination of the TRA, our obligations under the TRA with respect to exchanged or acquired shares of our Class A common stock (whether exchanged or acquired before or after such change of control) would be based on certain assumptions, including that we would have sufficient taxable income to fully utilize the deductions arising from the increased tax deductions and tax basis and other benefits related to entering into the TRA and, in the case of an early termination election, that any AOG Units that have not been exchanged are deemed exchanged for the market value of shares of our Class A common stock at the time of termination. Assuming that the market value of a share of our Class A common stock were to be equal to $177.03, which is the closing price per share of our Class A common stock as of December 31, 2024, and that SOFR were to be 4.49% and a blended federal and state corporate tax rate of 23.5%, we estimate that the aggregate amount of these termination payments would be approximately $2.8 billion on the 110 million AOG Units that have not been exchanged for Class A common stock. The foregoing amount is merely an estimate and the actual payments could differ materially.
Tax consequences to the direct and indirect holders of AOG Units or to general partners in our funds may give rise to conflicts of interests.
As a result of the tax gain inherent in our assets held by the Ares Operating Group, upon a realization event, certain direct and indirect holders of AOG Units may incur different and potentially significantly greater tax liabilities as a result of the disproportionately greater allocations of items of taxable income and gain to such holders. As these direct and indirect holders will not receive a correspondingly greater distribution of cash proceeds, they may, subject to applicable fiduciary or contractual duties, have different objectives regarding the appropriate pricing, timing and other material terms of any sale, refinancing, or disposition, or whether to sell such assets at all. Decisions made with respect to an acceleration or deferral of income or the sale or disposition of assets with unrealized built-in tax gains may also influence the timing and amount of payments that are received by the TRA Recipients (including, among others, the Holdco Members and other executive officers) under the TRA. In general, we anticipate that disposition of assets with unrealized built-in tax gains following an exchange will tend to accelerate such payments and increase the present value of payments under the TRA, and disposition of assets with unrealized built-in tax gains in a tax year before an exchange generally will increase an exchanging holder’s tax liability without giving rise to any rights to any payments under the TRA. Decisions made regarding a change of control also could have a material influence on the timing and amount of payments received by the TRA Recipients pursuant to the TRA.
There may be potential conflicts in the tax treatment of carried interest.
We may receive carried interest or incentive fees from our funds if specified returns are achieved by those funds. In certain circumstances, we may prefer to structure the fees as a special allocation of income, which we refer to as a carried interest, rather than as an incentive fee.
The general partner of our funds may be entitled to receive carried interest from our funds and a significant portion of that carried interest may consist of long-term capital gains. As a U.S. corporation, we will not receive preferential treatment for long-term capital gains and we may be limited in deducting capital losses. As a result, the general partners of our funds may have interests that are not entirely aligned with our stockholders and thus, subject to their fiduciary duties to fund investors, may be incentivized to seek investment opportunities that maximize favorable tax treatment to the general partners.
The tax treatment of carried interest has continued to be an area of focus for policymakers and government officials, which could result in further regulatory action by federal or state governments. Congress and the new Presidential administration may consider legislation to further extend the holding period for carried interest to qualify for long-term capital gains treatment, have carried interest taxed as ordinary income rather than as capital gain, impose surcharges on carried interest or increase the capital gains tax rate. Tax authorities and legislators in other jurisdictions in which Ares has investments or employees could clarify, modify or challenge their treatment of carried interest. For example, the U.K. government has, following a report by the Office of Tax Simplification on the U.K. Capital Gains Tax Regime, announced on October 30, 2024 that it intends to implement a new carried interest regime from April 2026. The details of such new regime remain subject to consultation and are therefore uncertain. However, any new regime could result in a change to the taxation of carried interest with respect to our U.K. investment professionals. In addition, and as part of the October 30, 2024 announcement, the rate of carried interest applicable to our U.K. investment professionals is expected to increase from April 6, 2025. As a result of these changes and potential changes, the amount of taxes that our employees and other key personnel would be required to pay could increase materially and could impact our ability to recruit, retain and motivate employees and key personnel in the relevant jurisdictions or could require us in certain circumstances to consider alternative or modified incentive arrangements for such employees or key personnel.
Limitations on the amount of interest expense that we may deduct could materially increase our tax liability and negatively affect an investment in shares of our Class A common stock.
Our deduction of net business interest expenses for each taxable year is limited generally to 30% of our “adjusted taxable income” for the relevant taxable year. Any excess business interest not allowed as a deduction in a taxable year as a result of the limitation generally will carry forward to the next year. There is no grandfather provision for outstanding debt prior to the effective date of these rules. Any failure to properly manage or address the foregoing risks may have a material adverse effect on our business, results and financial condition.
General Risk Factors
Security incidents or cyber-attacks could adversely affect our business by causing a disruption to our operations, a compromise or corruption of our confidential, personal or other sensitive information and/or damage to our business relationships or reputation, any of which could negatively impact our business, financial condition and operating results.
The efficient operation of our business is dependent on information systems and technology, including computer hardware and software systems, as well as data processing systems and the secure processing, storage and transmission of information, all of which are potentially vulnerable to security incidents and cyber-attacks, which may include intentional attacks or accidental losses, either of which may result in unauthorized access to, or corruption of, our hardware, software, or data processing systems, or to our confidential, personal, or other sensitive information. In addition, we and our employees may be the target of fraudulent emails or other targeted attempts to gain unauthorized access to confidential, personal, or other sensitive information, which are becoming more sophisticated and difficult to detect. Cybersecurity risks are also exacerbated by the rapidly increasing volume of highly sensitive data, including our proprietary business information and intellectual property, personal information of our employees, our investors and others, and other sensitive information that we collect, process and store in our data centers and on our networks or those of our third-party service providers. Many jurisdictions have also enacted laws requiring companies to notify individuals of data security breaches involving certain types of personal information, with which we must comply in the event of a security incident or cyber-attack. The rapid evolution and increasing prevalence of artificial intelligence technologies may also increase our cybersecurity risks. The result of any security incident or cyber-attack may include disrupted operations, including in our, our employees’, our fund investors, our counterparties’, or third parties’ operations, misstated or unreliable financial data, fraudulent transfers or requests for transfers of money, liability for stolen or improperly accessed assets or information (including personal information), fines or penalties, investigations, increased cybersecurity protection and insurance costs, litigation, or damage to our business relationships and reputation, in
each case, causing our business and results of operations to suffer or otherwise causing interruptions or malfunctions in our, our employees’, our fund investors’, our counterparties’ or third parties’ operations.
Although we are not currently aware of any security incidents or cyber-attacks that, individually or in the aggregate, have materially affected, or would reasonably be expected to materially affect, our operations or financial condition, there has been an increase in the frequency and sophistication of the cyber and security threats that we face, with attacks ranging from those common to businesses generally to more advanced and persistent attacks. Security incidents or cyber-attacks and other security threats could originate from a wide variety of sources, including cyber criminals, nation state hackers, hacktivists and other outside or inside parties, as well as through employee malfeasance. We, or our third-party providers, may face a heightened risk of a security breach or disruption with respect to confidential, personal or other sensitive information resulting from an attack by foreign governments or cyber terrorists. We may be a target for attacks because, as an alternative asset management firm, we hold confidential, personal and other sensitive information, including price information about existing and potential investments. Further, we are dependent on third-party service providers for hosting hardware, software and data processing systems that we do not control. We also rely on third-party service providers for certain aspects of our businesses, including for certain information systems, technology and administration of our funds and compliance matters. While we perform risk assessments on our third-party providers, our reliance on them and their potential reliance on other third-party service providers removes certain cybersecurity functions from outside of our immediate control, and cyber-attacks on our third-party service providers could adversely affect us, our business and our reputation. We cannot guarantee that third parties and infrastructure in our networks or our partners’ networks have not been compromised or that they do not contain exploitable defects or bugs that could result in a breach of or disruption to our information technology systems or the third-party information technology systems that support our services. Our ability to monitor these third parties’ information security practices is limited, and they may not have adequate information security measures in place. The costs related to cyber-attacks or other security threats or disruptions may not be fully insured or indemnified by others, including by our third-party service providers.
Security incidents and cyber-attacks may originate from a wide variety of sources, and while we have implemented processes, procedures and internal controls designed to mitigate cybersecurity risks and cyber-attacks, these measures do not guarantee that a security incident or cyber-attack will not occur or that our financial results or operations will not be negatively impacted by such an incident, especially because the techniques of threat actors change frequently and are often not recognized until launched, and may be enhanced by artificial intelligence technologies. We rely on industry accepted security measures and technology to securely maintain confidential and proprietary information maintained on our information systems, as well as our policies and procedures to protect against the unauthorized or unlawful disclosure of confidential, personal or other sensitive information. Although we take protective measures and endeavors to strengthen our computer systems, software, technology assets and networks to prevent and address potential security incidents and cyber-attacks, there can be no assurance that any of these measures prove effective. We expect to be required to devote increasing levels of funding and resources to comply with evolving cybersecurity and privacy laws and regulations and to continually monitor and enhance our cybersecurity procedures and controls.
Our funds’ portfolio companies also rely on similar systems and face similar risks. A disruption or compromise of these systems could have a material adverse effect on the value of these businesses. Our funds may invest in strategic assets having a national or regional profile or in infrastructure assets, the nature of which could expose them to a greater risk of being subject to a terrorist attack or cyber-attack than other assets or businesses. Such an event may have material adverse consequences on our investment or assets of the same type or may require applicable portfolio companies to increase preventative security measures or expand insurance coverage.
In addition, cybersecurity has become a priority for regulators in the U.S. and around the world. Recently, the SEC adopted new rules related to cybersecurity risk management for registered investment advisers, registered investment companies and business development companies (funds), as well as amendments to certain rules that govern investment adviser and fund disclosures. In July 2023, the SEC also adopted rules requiring public companies to disclose material cybersecurity incidents on Form 8-K and periodic disclosure of a registrant’s cybersecurity risk management, strategy, and governance in annual reports. The rules became effective beginning with annual reports for fiscal years ending on or after December 15, 2023 and beginning with Form 8-Ks on December 18, 2023. With the SEC particularly focused on cybersecurity, we expect increased scrutiny of our policies and systems designed to manage our cybersecurity risks and our related disclosures. We also expect to face increased costs to comply with the new SEC rules, including increased costs for cybersecurity training and management. In addition, the SEC has indicated in recent periods that one of its examination priorities for the Division of Examinations is to continue to examine cybersecurity procedures and controls, including testing the implementation of these procedures and controls.
We are subject to numerous privacy laws, and violation of such laws may subject us to significant fines or penalties, litigation, or reputational damage, and new privacy laws could impact our business and financial performance.
Many jurisdictions in which we operate have laws and regulations relating to data protection, privacy, cybersecurity and information security to which we may be subject, including the CCPA, the New York SHIELD Act, the GDPR and the U.K. GDPR (collectively, “Privacy Laws”). These Privacy Laws and related regulations are quickly evolving and may conflict with one another. Moreover, to the extent that these laws and regulations or the enforcement of the same become more stringent, or if new laws or regulations are enacted, our financial performance or plans for growth may be adversely impacted. In addition, compliance with applicable Privacy Laws may require adhering to stringent legal and operational requirements, which could increase compliance costs for us and require the dedication of additional time and resources to compliance. A failure to comply with applicable Privacy Laws could result in fines, sanctions, enforcement actions or other penalties or reputational damage.
Further, significant actual or potential theft, loss, corruption, exposure, fraudulent use or misuse of investor, employee or other personal information, proprietary business data or other sensitive information, whether by third parties or as a result of employee malfeasance or otherwise, non-compliance with our contractual or other legal obligations regarding such data or intellectual property or a violation of our privacy and security policies with respect to such data could result in significant investigation, remediation and other costs, fines, penalties, litigation or regulatory actions against us and significant reputational harm, any of which could harm our business and results of operations.
There may be substantial financial penalties or fines for breach of Privacy Laws (which may include insufficient security for our personal or other sensitive information). For example, the maximum penalty for breach of the GDPR is the greater of 20 million Euros and 4% of group annual worldwide turnover, and fines for each violation of the California Consumer Privacy Act are $2,500 per violation, or $7,500 per violation for intentional violations. Non-compliance with any applicable privacy or data security laws represents a serious risk to our business, and compliance may be complicated by conflicting or inconsistent laws and regulations.
We may be subject to litigation risks and may face liabilities and damage to our professional reputation.
In recent years, the volume of claims and amount of damages claimed in litigation and regulatory proceedings against investment managers have been increasing. We make investment decisions on behalf of investors in our funds that could result in substantial losses. This may subject us to the risk of legal liabilities or actions alleging misconduct, breach of fiduciary duty or breach of contract. Further, we may be subject to third-party litigation arising from allegations that we improperly exercised control or influence over portfolio investments. In addition, we and our affiliates that are the investment managers and general partners of our funds, our funds themselves and those of our employees who are our, our subsidiaries’ or the funds’ officers and directors are each exposed to the risks of litigation specific to the funds’ investment activities and portfolio companies and, in the case where our funds own controlling interests in public companies, to the risk of shareholder litigation by the public companies’ other shareholders. Moreover, we are exposed to risks of litigation or investigation by investors or regulators relating to our having engaged, or our funds having engaged, in transactions that presented conflicts of interest that were not properly addressed.
We and our funds and their investment advisers are more generally subject to extensive regulation, which, from time to time, results in requests for information from us or our funds and their investment advisers or regulatory proceedings or investigations against us or our funds and their investment advisers, respectively. We may incur significant costs and expenses in connection with any such information requests, proceedings or investigations. Such investigations have previously and may in the future result in penalties and other sanctions. Regulatory actions and initiatives, including by the SEC, can have an adverse effect on our financial results, including as a result of the imposition of a sanction, a limitation on our or our personnel’s activities, or changing our historic practices. Even if an investigation or proceeding did not result in a sanction, or the sanction imposed against us or our personnel by a regulator were small in monetary amount, the adverse publicity relating to the investigation, proceeding or imposition of these sanctions could harm our reputation.
Legal liability could have a material adverse effect on our businesses, financial condition or results of operations or cause reputational harm to us, which could harm our businesses. We depend, to a large extent, on our business relationships and our reputation for integrity and high-caliber professional service offerings to attract and retain investors and to pursue investment opportunities for our funds. As a result, allegations of improper conduct asserted by private litigants or regulators, regardless of whether the ultimate outcome is favorable or unfavorable to us, as well as negative publicity and press speculation about us, our investment activities or the investment industry in general, whether valid or not, may harm our reputation, which may be damaging to our businesses.
In addition, the laws and regulations governing the limited liability of such issuers and portfolio companies vary from jurisdiction to jurisdiction, and in certain contexts, the laws of certain jurisdictions may provide not only for carve-outs from limited liability protection for the issuer or portfolio company that has incurred the liabilities, but also for recourse to assets of other entities under common control with, or that are part of the same economic group as such issuer.
We may not be able to maintain sufficient insurance to cover us for potential litigation or other risks.
We may not be able to obtain or maintain sufficient insurance on commercially reasonable terms or with adequate coverage levels against potential liabilities we may face in connection with potential claims, which could have a material adverse effect on our business. We may face a risk of loss from a variety of claims, including related to securities, antitrust, contracts, cybersecurity, fraud and various other potential claims, whether or not such claims are valid. Insurance and other safeguards might only partially reimburse us for our losses, if at all, and if a claim is successful and exceeds or is not covered by our insurance policies, we may be required to pay a substantial amount in respect of such claim. Certain losses of a catastrophic nature, such as losses arising as a result of wars, systemic risk associated with cyber-kinetic warfare, earthquakes, typhoons, terrorist attacks or other similar events, may be uninsurable or may only be insurable at rates that are so high that maintaining coverage would cause an adverse impact on our business, our funds and their portfolio companies. In general, losses related to terrorism and catastrophic nation-state hacks are becoming harder and more expensive to insure against. Some insurers are excluding terrorism coverage from their all-risk policies. In some cases, insurers are offering significantly limited coverage against terrorist acts for additional premiums, which can greatly increase the total cost of casualty insurance for a property. As a result, we, our funds and their portfolio companies may not be insured against terrorism or certain other catastrophic losses.
Events which harm our reputation or brand may impact our ability to attract and retain investors and raise new capital.
As fiduciaries and stewards of our client’s capital, we value and depend on the trust they place in us. Reputation is a significant factor that increases our competitive risk. See “—Risks Related to Our Businesses—The investment management business is intensely competitive.” Increased regulatory scrutiny, actions or fines, litigation, employee misconduct, failures or perceived failures to appropriately mitigate and manage ESG incidents, conflicts of interest, cyber-attacks and management of tax disputes, could among other events, harm our reputation and thus our ability to attract and retain investors and raise new capital for our funds, adversely affecting our business. While we have a robust compliance program in place and have successfully instituted a culture of compliance through our policies and procedures aimed to mitigate potential risks and enhanced regulatory action, we may be subject to new and heighted enforcement activity resulting in public sanctions or fines which could adversely impact our reputation. See “—Risks Related to Regulation.” Similarly, to the extent we experience material litigation, employee turnover or employee misconduct, our businesses and our reputation could be adversely affected, and a loss of investor confidence could result, which could adversely impact our ability to raise future funds. Our ability to appropriately mitigate, manage and address conflicts of interests among our stakeholders could also result in increased reputational risk. Further, the impact of events which may harm our reputation and brand are heightened given media and public focus on the externalities of activities unrelated to our business, the pervasiveness of social media and public interest in the financial services and alternative investment management industry generally. The increasing prevalence of artificial intelligence may lead to faster and wider dissemination of any adverse publicity or inaccurate information about us, making effective remediation more difficult and further magnifying the reputational risks associated with negative publicity.
Item 1B. Unresolved Staff Comments
None.
Item 1C. Cybersecurity
Assessment, Identification and Management of Material Risks from Cybersecurity Threats
Our cybersecurity strategy prioritizes the detection and analysis of, and response to, known, anticipated or unexpected threats, effective management of security risks and resilience against cyber incidents. Our enterprise-wide cybersecurity program is aligned to the National Institute of Standards and Technology Cybersecurity Framework. Our cybersecurity risk management processes include technical security controls, policy enforcement mechanisms, monitoring systems, tools and related services, which include tools and services from third-party providers, and management oversight to assess, identify and manage risks from cybersecurity threats. We have implemented and continue to implement risk-based controls designed to prevent, detect and respond to information security threats and protect our information, our information systems, and the information of our investors, employees and other third parties who entrust us with their sensitive information.
Our cybersecurity program includes physical, administrative and technical safeguards, and we maintain plans and procedures designed to help us prevent and timely and effectively respond to cybersecurity threats and incidents. Through our cybersecurity risk management process, we seek to monitor cybersecurity vulnerabilities and potential attack vectors, evaluate the potential operational and financial effects of any threat and mitigate such threats. The assessment of cybersecurity threats is integrated into our Enterprise Risk Management program, which is overseen by our Enterprise Risk Committee (the “ERC”), as discussed below. In addition, we periodically engage third-party consultants and engage with key vendors to assist us in assessing, enhancing, implementing, and monitoring our cybersecurity risk management programs and responding to incidents.
Our cybersecurity risk management and awareness programs include periodic identification and testing of vulnerabilities, regular phishing simulations and annual general cybersecurity awareness and data protection training. We also have annual certification requirements for employees with respect to certain policies supporting the cybersecurity program including information security and electronic communications, data protection and privacy. We undertake periodic internal security reviews of our information systems and related controls, including systems affecting personal data and the cybersecurity risks of our critical third-party service providers and other partners. We also complete periodic external reviews of our cybersecurity program and practices, which include assessments of our data protection practices and targeted attack simulations.
In the event of a cybersecurity incident, we have developed an incident response plan that provides guidelines for responding to an incident and facilitates coordination across multiple operational functions. The incident response plan includes notification to the applicable members of cybersecurity leadership, including the Chief Information Security Officer (“CISO”), and, as appropriate, escalation to the full ERC and/or an internal ad-hoc group of senior employees, tasked with helping to manage the cybersecurity incident. Depending on their nature, incidents may also be reported to our audit committee of the board of directors and to our full board of directors, if appropriate.
Material Impact of Risks from Cybersecurity Threats
We have not experienced an information security breach incident that has materially affected our business strategy, results of operations or financial condition. The expenses we have incurred from information security breach incidents have been immaterial, and we are not aware of any cybersecurity risks that are reasonably likely to materially affect our business. However, future incidents could have a material impact on our business strategy, results of operations or financial condition. For additional discussion of the risks posed by cybersecurity threats, see “Item 1A. Risk Factors—General Risk Factors—Security incidents or cyber-attacks could adversely affect our business by causing a disruption to our operations, a compromise or corruption of our confidential, personal or other sensitive information and/or damage to our business relationships or reputation, any of which could negatively impact our business, financial condition and operating results.”
Oversight of Cybersecurity Risks
Our cybersecurity program is managed by a dedicated internal cybersecurity team, which is responsible for enterprise-wide cybersecurity strategy, policies, standards, engineering, architecture and processes. The team is led by our CISO who has a Master’s degree in Cybersecurity from Brown University and over 25 years of experience advising on, and managing risks from cybersecurity threats as well as developing and implementing cybersecurity policies and procedures. The CISO reports cybersecurity updates to the ERC. The ERC is a committee that governs and oversees our Enterprise Risk Program, including
cybersecurity. The ERC includes our Chief Executive Officer, Co-Presidents, Chief Financial Officer, General Counsel, Global Chief Compliance Officer and Head of Enterprise Risk, who acts as chairperson of the ERC. The ERC, through regular consultation with the internal cybersecurity team, assesses, discusses, and prioritizes our approach to high-level risks, mitigating controls, and ongoing cybersecurity efforts.
The audit committee has primary responsibility for oversight and review of guidelines and policies with respect to risk assessment and risk management, including cybersecurity. Periodically, reports are provided to our audit committee as well as the full board of directors, as appropriate, on cybersecurity matters, primarily through presentations by the CISO and the Head of Enterprise Risk. Such reporting includes updates on our cybersecurity program, the external threat environment, and our programs to address and mitigate the risks associated with the evolving cybersecurity threat environment. These reports also include updates on our preparedness, prevention, detection, responsiveness, and recovery with respect to cyber incidents.
Item 2. Properties
Our principal executive offices are located in leased office space at 1800 Avenue of the Stars, Suite 1400, Los Angeles, California. We also lease office space in New York, London and other cities around the world. We do not own any real property. We consider these facilities to be suitable and adequate for the management and operation of our businesses.
Item 3. Legal Proceedings
From time to time, we, our executive officers, directors and our funds and their investment advisers, and their respective affiliates and/or any of their respective principals and employees are subject to legal proceedings, including those arising from our management of such funds. Additionally, we and our funds and their investment advisers are also subject to extensive regulation, which, from time to time, results in requests for information from us or our funds and their investment advisers or legal or regulatory proceedings or investigations against us or our funds and their investment advisers, respectively. We incur significant costs and expenses in connection with any such proceedings, information requests and investigations.
Item 4. Mine Safety Disclosures
Not applicable.
PART II.
Item 5. Market for Registrant’s Common Equity, Related Stockholder Matters and Issuer Purchases of Equity Securities
Market Information
Our Class A common stock is traded on the NYSE under the symbol “ARES.” Our common shares began trading on the NYSE on May 2, 2014.
The number of holders of record of our Class A common stock as of February 21, 2025 was 24, which does not include the number of shareholders that hold shares in “street name” through banks or broker-dealers. Ares Management GP LLC is the sole holder of shares of our Class B common stock and Ares Voting LLC is the sole holder of shares of our Class C common stock.
Stock Performance Graph
The following graph depicts the total return to holders of our Class A common stock from the closing price on December 31, 2019 through December 31, 2024, relative to the performance of the S&P 500 Index and the Dow Jones U.S. Asset Managers Index. The graph assumes $100 invested on December 31, 2019 and dividends received reinvested in the security or index.
The performance graph is not intended to be indicative of future performance. The performance graph shall not be deemed “soliciting material” or to be “filed” with the SEC for purposes of Section 18 of the Exchange Act, or otherwise subject to the liabilities under that Section, and shall not be deemed to be incorporated by reference into any of our filings under the Securities Act or the Exchange Act.
Total Return Performance Table
Issuer Purchases of Equity Securities
None.
Dividend Policy for the Series B Mandatory Convertible Preferred Stock
On October 10 2024, we issued 30,000,000 shares of our Series B mandatory convertible preferred stock, for total proceeds of $1,462.5 million (after deducting underwriting discounts but before offering expenses). The Series B mandatory convertible preferred stock accumulates dividends at a rate per annum equal to 6.75% on the liquidation preference thereof, payable when, as and if declared by the our board of directors, out of funds legally available for their payment to the extent paid in cash, quarterly in arrears on January 1, April 1, July 1 and October 1 of each year, beginning on January 1, 2025 and concluding on October 1, 2027.
As of December 31, 2024, we had 30,000,000 shares of our Series B mandatory convertible preferred stock outstanding. During 2024, we declared dividends of $0.759375 per share, totaling approximately $22.8 million payable on January 1, 2025 to holders of record of shares of the Series B mandatory convertible preferred stock. In February 2025, our board of directors declared a quarterly dividend of $0.84375 per share, amounting to $25.3 million payable on April 1, 2025 to holders of record of shares of the Series B mandatory convertible preferred stock on March 15, 2025.
Dividend Policy for Class A and Non-Voting Common Stock
During 2023, we declared a dividend each quarter of $0.77 (totaling $3.08 annually) per share to Class A common stockholders and non-voting common stockholders, or approximately $571.9 million. During 2024, we declared a dividend each quarter of $0.93 (totaling $3.72 annually) per share to Class A and non-voting common stockholders, or approximately $743.0 million.
In February 2025, our board of directors declared a quarterly dividend of $1.12 per share of Class A and non-voting common stock with respect to the first quarter of 2025 payable on March 31, 2025 to common stockholders of record at the close of business on March 17, 2025.
Our dividend policy for our Class A and non-voting common stock is more closely aligned with our core management fee business. We intend to provide a fixed quarterly dividend for each calendar year that will be based on our expected fee related earnings after an allocation of current taxes paid, with future potential changes based on the level and growth of the metric. Subject to the approval of our board of directors, we intend to pay a dividend of $1.12 per share of our Class A and non-voting common stock per quarter in 2025.
Our fixed dividend will be reassessed each year based upon the level and growth of our fee related earnings after an allocation of current taxes paid. As fee related earnings reflect the core earnings of our business and consist of management fees, other fees and fee related performance revenues less compensation and benefits and general and administrative expenses, having our dividend based on this amount removes volatility from our dividend and provides more predictability to investors on an annual basis.
Our dividend policy reflects our intention to retain realized net performance income, which excludes our fee related performance revenues. We expect to use such retained earnings to fund future growth with the objective of accelerating our fee related earnings growth per share, as well as for potential stock repurchases. However, the declaration, payment and determination of the amount of future dividends, if any, is at the sole discretion of our board of directors, which may change our dividend policy at any time.
The payment of cash dividends is subject to compliance with DGCL. In addition, under the Credit Facility, certain subsidiaries of the Ares Operating Group are prohibited from paying dividends in certain circumstances, including if an Event of Default (as defined in the Credit Facility) has occurred and is continuing.
Because AMC is a holding company and has no material assets other than its indirect ownership of AOG Units, we fund dividends by AMC on shares of our Class A and non-voting common stock, if any, in three steps:
•first, we cause the AOG entities to make distributions to their partners, including AMC and its direct subsidiaries. If the AOG entities make such distributions, the partners of the AOG entities will be entitled to receive equivalent distributions based on their partnership units in the Ares Operating Group (except as set forth in the following paragraph);
•second, we cause AMC’s direct subsidiaries to distribute to AMC their share of such distributions, net of any taxes and amounts payable under the tax receivable agreement by such direct subsidiaries; and
•third, AMC pays such distributions to our holders of our Class A and non-voting common stock, net of any taxes and amounts payable under the tax receivable agreement, on a pro rata basis.
Because we and our direct subsidiaries that are corporations for U.S. federal income tax purposes may be required to pay corporate income and franchise taxes and make payments under the tax receivable agreement, the dividend amounts ultimately paid by us to holders of our Class A and non-voting common stock are expected to be generally less, on a per share basis, than the amounts distributed by the AOG entities to their respective partners in respect of their AOG Units.
In addition, governing agreements of the AOG entities provide for cash distributions, which we refer to as “tax distributions,” to the partners of such entities if the general partners of the AOG entities determine that the taxable income of the AOG entities gives rise to taxable income for its partners. Generally, these tax distributions are computed based on our estimate of the net taxable income of the entity multiplied by an assumed tax rate equal to the highest effective marginal combined U.S. federal, state and local income tax rate prescribed for an individual or corporate resident in Los Angeles, California or New York, New York, whichever is higher (taking into account the non-deductibility of certain expenses and the character of our income). The Ares Operating Group makes tax distributions only if and to the extent distributions from such entities for the relevant year were otherwise insufficient to cover such tax liabilities.
We expect any dividends paid out of current or accumulated earnings and profits to U.S. individuals and certain other qualifying holders of our Class A and non-voting common stock to constitute “qualified dividend” income that is generally taxed at a more favorable tax rate than the ordinary income tax rate, if the requisite holding periods have been met. If the dividend exceeds current and accumulated earnings and profits, the excess is treated as a nontaxable return of capital, reducing the stockholder’s tax basis in its shares to the extent of such shareholder’s tax basis in such shares. Any remaining excess is treated as capital gain. Because U.S. corporations are taxed on their own taxable income, and because owners of such entities are taxed on any dividends paid from such entities, there are two levels of potential tax upon income earned by such entities.
Unregistered Sales of Equity Securities and Purchases of Equity Securities
None.
Item 6. [Reserved]
Item 7. Management’s Discussion and Analysis of Financial Condition and Results of Operations
AMC is a Delaware corporation. Unless the context otherwise requires, references to “Ares,” “we,” “us,” “our,” and the “Company” are intended to mean the business and operations of AMC and its consolidated subsidiaries. The following discussion analyzes the financial condition and results of operations of the Company. “Consolidated Funds” refers collectively to certain Ares funds, co-investment vehicles, CLOs and SPACs that are required under generally accepted accounting principles in the United States (“GAAP”) to be consolidated within our consolidated financial statements included in this Annual Report on Form 10-K. Additional terms used by the Company are defined in the Glossary and throughout the Management’s Discussion and Analysis in this Annual Report on Form 10-K.
The following discussion and analysis should be read in conjunction with the consolidated financial statements of AMC and the related notes included in this Annual Report on Form 10-K.
This section of the Annual Report on Form 10-K discusses activity as of and for the years ended December 31, 2024 and 2023. For discussion on activity for the year ended December 31, 2022 and period-over-period analysis on results for the year ended December 31, 2023 to 2022, refer to Part II, “Item 7. Management’s Discussion and Analysis of Financial Condition and Results of Operations” in our Annual Report on Form 10-K for the year ended December 31, 2023. We have reclassified certain prior period amounts to conform to the current year presentation. Amounts and percentages presented throughout our discussion and analysis of financial condition and results of operations may reflect rounded results in thousands (unless otherwise indicated) and consequently, totals may not appear to sum. In addition, illustrative charts may not be presented at scale.
“NM” refers to not meaningful. Period-over-period analysis for current year compared to prior year may be deemed to be not meaningful and are designated as “NM” within the discussion and analysis of financial condition and results of operations.
Trends Affecting Our Business
We believe that our disciplined investment philosophy across our distinct but complementary investment groups contributes to the stability of our performance throughout market cycles. For the year ended December 31, 2024, 95% of our management fees were derived from perpetual capital vehicles or long-dated funds. Our funds have a stable base of committed capital enabling us to invest in assets with a long-term focus over different points in a market cycle and to take advantage of market volatility. However, our results from operations, including the fair value of our AUM, are affected by a variety of factors. Conditions in the global financial markets and economic and political environments may impact our business, particularly in the U.S., Europe and APAC.
The following table presents returns of selected market indices:
| | | | | | | | | | | | | | | | | | | | | | | | | | | | |
| | | | | | | Returns (%) |
| Type of Index | | Name of Index | | Region | | | | Year ended December 31, 2024 | | Year ended December 31, 2023 |
| High yield bonds | | ICE BAML High Yield Master II Index | | U.S. | | | | 8.2 | | | 13.5 |
| High yield bonds | | ICE BAML European Currency High Yield Index | | Europe | | | | 8.7 | | 12.2 |
| | | | | | | | | | |
| Leveraged loans | | Credit Suisse Leveraged Loan Index (“CSLLI”) | | U.S. | | | | 9.1 | | 13.0 |
| Leveraged loans | | Credit Suisse Western European Leveraged Loan Index | | Europe | | | | 8.5 | | 12.5 |
| Equities | | S&P 500 Index | | U.S. | | | | 25.0 | | 26.3 |
| Equities | | MSCI All Country World Ex-U.S. Index | | Non-U.S. | | | | 5.5 | | 15.6 |
| Infrastructure equities | | S&P Global Infrastructure Index | | Global | | | | 6.8 | | 15.1 |
| Real estate equities | | FTSE NAREIT All Equity REITs Index | | U.S. | | | | 0.9 | | 11.4 |
| Real estate equities | | FTSE EPRA/NAREIT Developed Europe Index | | Europe | | | | (6.5) | | 17.4 |
During 2024, global markets were fueled by the easing of monetary policy by the Federal Reserve and several other major central banks with predominately positive returns despite seeing mixed performances towards the end of the year. U.S. and European high yield bonds and leveraged loans showed positive performance driven by stable demand and improved access to capital markets. The APAC markets experienced favorable performance, with growth driven by moderate inflation, lower unemployment and lower interest rate expectations, which supported consumption in Southeast Asia, India, and Australia. China announced policy stimulus measures affecting monetary policy, the property sector and equity markets, contributing to positive investor sentiment. Globally, reduced bank lending and limited capital accessibility continued to support private credit growth.
The private equity industry benefited from lower interest rates, cooling inflation and tighter credit spreads, leading to a meaningful increase in the private equity deal value in the U.S. Despite challenges such as inflation and potential tariffs, market sentiment remains optimistic due to lower taxes, favorable regulations and technology advancements. We believe that demand for strong performance, combined with a favorable deal-making environment, will support deployment opportunities in 2025.
The U.S. and European commercial real estate markets experienced increased deal activity on a year over year basis that was largely supported by the improving macroeconomic environment. Property valuations are showing signs of recovery, and capitalization rates are stabilizing or compressing. The European real estate markets are showing slower signs of recovery, with the volatility in interest rates having a greater impact on performance during the year. Despite variations in market performance by sector and geography, we believe multifamily and industrial properties will benefit from favorable long-term structural trends. Infrastructure investment opportunities continue to be supported by the convergence of two megatrends – digital infrastructure and artificial intelligence adoption – paired with surging power demand expectations. Renewable energy transaction volume remained strong, which has supported elevated renewable energy revenue contract prices.
We believe our portfolios across all strategies are well positioned for a fluctuating interest rate environment. On a market value basis, approximately 85% of our debt assets and 57% of our total assets were floating rate instruments as of December 31, 2024.
In 2024, some of the considerations pertaining to our strategic decisions included:
• Our ability to fundraise and increase AUM and fee paying AUM. During the year ended December 31, 2024, we raised $92.7 billion of gross new capital across our commingled funds, SMAs, wealth products and other vehicles, and continued to expand our investor base, raising capital from over 185 different investment vehicles and over 660 institutional investors, including over 310 direct institutional investors that were new to Ares. Our fundraising efforts helped drive AUM growth of 16% for 2024. During 2025, we expect that our fundraising will come from a combination of our existing and new strategies in North America, Europe and APAC. As of December 31, 2024, AUM not yet paying fees includes $81.0 billion of AUM available for future deployment which could generate approximately $728.8 million in potential incremental annual management fees. Our potential future deployment, coupled with our future fundraising prospects, gives us the opportunity to increase our management fees in 2025.
• Our ability to attract new capital and investors with our broad multi-asset class product offering. Our ability to attract new capital and investors in our funds is driven, in part, by the extent to which they continue to see the alternative asset management industry generally, and our investment products specifically, as an attractive vehicle for capital appreciation and income generation. We continually seek to create avenues to meet our investors’ evolving needs by offering an expansive range of funds, developing new products and creating managed accounts and other investment vehicles tailored to our investors’ goals. We continue to expand our distribution channels throughout the wealth channel with our global wealth management offerings, as well as the needs of traditional institutional investors, such as pension funds, sovereign wealth funds and endowments. If market volatility persists or increases, investors may seek absolute return strategies that seek to mitigate volatility. We offer a variety of investment strategies depending upon investors’ risk tolerance and expected returns.
• Our disciplined investment approach and successful deployment of capital. Our ability to maintain and grow our revenue base is dependent upon our ability to successfully deploy the capital that our investors have committed to our funds. Greater competition, high valuations, cost of credit and other general market conditions have affected and may continue to affect our ability to identify and execute attractive investments. Under our disciplined investment approach, we deploy capital only when we have sourced a suitable investment opportunity at an attractive price. During the year ended December 31, 2024, we deployed $106.7 billion of gross capital across our investment groups compared to $68.1 billion deployed in 2023. We believe we continue to be well-positioned to invest our assets opportunistically. As of December 31, 2024, we had $133.1 billion of capital available for investment compared to $111.4 billion as of December 31, 2023.
• Our ability to invest capital and generate returns through market cycles. The strength of our investment performance affects investors’ willingness to commit capital to our funds. The flexibility of the capital we are able to attract is one of the main drivers of the growth of our AUM and the management fees we earn. Current market conditions and a changing regulatory environment have created opportunities for Ares’ businesses, which utilize flexible investment mandates to manage portfolios through market cycles.
See “Item 1. Business—Overview” for a comprehensive overview of our business, and “Item 1A. Risk Factors” for a discussion of the risks our businesses are subject to, both included in this Annual Report on Form 10-K.
Managing Business Performance
Operating Metrics
We measure our business performance using certain operating metrics that are common to the alternative investment management industry and are discussed below.
Assets Under Management
AUM refers to the assets we manage and is viewed as a metric to measure our investment and fundraising performance as it reflects assets generally at fair value plus available uncalled capital.
The tables below present rollforwards of our total AUM by segment ($ in millions):
| | | | | | | | | | | | | | | | | | | | | | | | | | | | | | | | | | | | | | |
| | | | | | | | | | | | |
| | | | | | | | | | | | |
| | | | | | | | | | | | |
| | | | | | | | | | | | |
| | | | | | | | | | | | |
| | | | | | | | | | | | |
| | | | | | | | | | | | |
| | | | | | | | | | | | |
| | | | | | | | | | | | |
| | | | | | | | | | | | |
| | | | | | | | | | | | |
| | | | | | | | | | | | |
| | | | | | | | | | | | |
| | | | | | | | | | | | |
| | | | | | | | | | | | |
| | | | | | | | | | | | |
| | | | | | | | | | | | |
| | | | | | | | | | | | |
| | | | | | | | | | | | |
| | | | | | | | | | | | |
| | | | | | | | | | | | |
| | | | | | | | | | | | |
| | | | | | | | | | | | |
| | | | | | | | | | | | |
| | Credit
Group | | Real Assets
Group | | Private Equity
Group | | Secondaries
Group | | Other
Businesses | | Total AUM |
| Balance at 12/31/2023 | | $ | 299,350 | | | $ | 65,413 | | | $ | 24,551 | | | $ | 24,760 | | | $ | 4,772 | | | $ | 418,846 | |
| Acquisitions | | 362 | | | 2,488 | | | — | | | — | | | 71 | | | 2,921 | |
| Net new par/equity commitments | | 39,343 | | | 7,367 | | | 519 | | | 4,453 | | | 6,442 | | | 58,124 | |
| Net new debt commitments | | 29,268 | | | 4,049 | | | — | | | 625 | | | — | | | 33,942 | |
| Capital reductions | | (10,546) | | | (1,086) | | | (4) | | | — | | | — | | | (11,636) | |
| Distributions | | (16,864) | | | (3,475) | | | (704) | | | (880) | | | (817) | | | (22,740) | |
| Redemptions | | (5,252) | | | (1,093) | | | (2) | | | — | | | — | | | (6,347) | |
| Net allocations among investment strategies | | 2,828 | | | 20 | | | (47) | | | 25 | | | (2,826) | | | — | |
| Change in fund value | | 10,369 | | | 1,615 | | | (272) | | | 170 | | | (546) | | | 11,336 | |
| Balance at 12/31/2024 | | $ | 348,858 | | | $ | 75,298 | | | $ | 24,041 | | | $ | 29,153 | | | $ | 7,096 | | | $ | 484,446 | |
| | | | | | | | | | | | |
| | Credit
Group | | Real Assets
Group | | Private Equity
Group | | Secondaries
Group | | Other
Businesses | | Total AUM |
| Balance at 12/31/2022 | | $ | 239,299 | | | $ | 66,061 | | | $ | 21,029 | | | $ | 21,961 | | | $ | 3,647 | | | $ | 351,997 | |
| Acquisitions | | — | | | — | | | 3,697 | | | — | | | — | | | 3,697 | |
| Net new par/equity commitments | | 40,393 | | | 6,076 | | | 1,621 | | | 3,648 | | | 7,008 | | | 58,746 | |
| Net new debt commitments | | 14,897 | | | 726 | | | — | | | — | | | — | | | 15,623 | |
| Capital reductions | | (3,858) | | | (480) | | | (9) | | | — | | | — | | | (4,347) | |
| Distributions | | (7,684) | | | (4,796) | | | (1,810) | | | (1,116) | | | (423) | | | (15,829) | |
| Redemptions | | (3,345) | | | (1,759) | | | — | | | (1) | | | (1,046) | | | (6,151) | |
| Net allocations among investment strategies | | 4,258 | | | — | | | — | | | 5 | | | (4,263) | | | — | |
| Change in fund value | | 15,390 | | | (415) | | | 23 | | | 263 | | | (151) | | | 15,110 | |
| Balance at 12/31/2023 | | $ | 299,350 | | | $ | 65,413 | | | $ | 24,551 | | | $ | 24,760 | | | $ | 4,772 | | | $ | 418,846 | |
| | | | | | | | | | | | |
|
The components of our AUM are presented below ($ in billions):
| | | | | | | | | | | | | | | | | |
| FPAUM | | Non-fee paying(1) | | AUM not yet paying fees |
(1) Includes $14.4 billion and $15.1 billion of AUM of funds from which we indirectly earn management fees as of December 31, 2024 and 2023, respectively, and includes $4.7 billion and $4.3 billion of non-fee paying AUM from our general partner and employee commitments as of December 31, 2024 and 2023, respectively.
Please refer to “— Results of Operations by Segment” for a more detailed presentation of AUM by segment for each of the periods presented.
Fee Paying Assets Under Management
FPAUM refers to AUM from which we directly earn management fees and is equal to the sum of all the individual fee bases of our funds that directly contribute to our management fees.
The tables below present rollforwards of our total FPAUM by segment ($ in millions):
| | | | | | | | | | | | | | | | | | | | | | | | | | | | | | | | | | | | | | |
| | | | | | | | | | | | |
| | | | | | | | | | | | |
| | | | | | | | | | | | |
| | | | | | | | | | | | |
| | | | | | | | | | | |
| | | | | | | | | | | | |
| | | | | | | | | | | | |
| | | | | | | | | | | | |
| | | | | | | | | | | | |
| | | | | | | | | | | | |
| | | | | | | | | | | | |
| | | | | | | | | | | | |
| | | | | | | | | | | | |
| | | | | | | | | | | | |
| | | | | | | | | | | | |
| | | | | | | | | | | | |
| | | | | | | | | | | | |
| | | | | | | | | | | |
| | | | | | | | | | | | |
| | | | | | | | | | | | |
| | | | | | | | | | | | |
| | | | | | | | | | | | |
| | | | | | | | | | | | |
| | | | | | | | | | | | |
| | | | | | | | | | | | |
| | | | | | | | | | | | |
| | Credit
Group | | Real Assets
Group | | Private Equity
Group | | Secondaries
Group | | Other
Businesses | | Total |
| Balance at 12/31/2023 | | $ | 185,280 | | | $ | 41,338 | | | $ | 13,124 | | | $ | 19,040 | | | $ | 3,575 | | | $ | 262,357 | |
| Acquisitions | | 244 | | | 1,554 | | | — | | | — | | | 55 | | | 1,853 | |
| Commitments | | 19,326 | | | 3,440 | | | — | | | 2,793 | | | 5,745 | | | 31,304 | |
| Deployment/subscriptions/increase in leverage | 29,479 | | | 3,180 | | | 47 | | | 395 | | | 174 | | | 33,275 | |
| Capital reductions | | (11,972) | | | (12) | | | — | | | — | | | — | | | (11,984) | |
| Distributions | | (14,843) | | | (2,157) | | | (54) | | | (505) | | | (817) | | | (18,376) | |
| Redemptions | | (5,252) | | | (1,093) | | | (2) | | | — | | | — | | | (6,347) | |
| Net allocations among investment strategies | | 3,453 | | | 20 | | | — | | | — | | | (3,473) | | | — | |
| Change in fund value | | 2,144 | | | (156) | | | (21) | | | 41 | | | 234 | | | 2,242 | |
| Change in fee basis | | 1,286 | | | (2,026) | | | (1,667) | | | 637 | | | (1) | | | (1,771) | |
| Balance at 12/31/2024 | | $ | 209,145 | | | $ | 44,088 | | | $ | 11,427 | | | $ | 22,401 | | | $ | 5,492 | | | $ | 292,553 | |
| | | | | | | | | | | | |
| | Credit
Group | | Real Assets
Group | | Private Equity
Group | | Secondaries
Group | | Other
Businesses | | Total |
| Balance at 12/31/2022 | | $ | 158,441 | | | $ | 41,607 | | | $ | 11,281 | | | $ | 17,668 | | | $ | 2,064 | | | $ | 231,061 | |
| Acquisitions | | — | | | — | | | 1,692 | | | — | | | — | | | 1,692 | |
| Commitments | | 8,333 | | | 3,674 | | | — | | | 1,645 | | | 6,181 | | | 19,833 | |
| Deployment/subscriptions/increase in leverage | 26,219 | | | 2,968 | | | 234 | | | 473 | | | 150 | | | 30,044 | |
| Capital reductions | | (3,657) | | | (455) | | | — | | | — | | | — | | | (4,112) | |
| Distributions | | (9,121) | | | (3,862) | | | (38) | | | (613) | | | (415) | | | (14,049) | |
| Redemptions | | (4,474) | | | (1,775) | | | — | | | (1) | | | — | | | (6,250) | |
| Net allocations among investment strategies | | 4,363 | | | — | | | — | | | 30 | | | (4,393) | | | — | |
| Change in fund value | | 5,176 | | | (917) | | | — | | | (164) | | | 317 | | | 4,412 | |
| Change in fee basis | | — | | | 98 | | | (45) | | | 2 | | | (329) | | | (274) | |
| Balance at 12/31/2023 | | $ | 185,280 | | | $ | 41,338 | | | $ | 13,124 | | | $ | 19,040 | | | $ | 3,575 | | | $ | 262,357 | |
|
The charts below present FPAUM by its fee bases ($ in billions):
| | | | | | | | | | | | | | |
| FPAUM: $292.6 | | FPAUM: $262.4 | |
| | | | | | | | | | | | | | | | | | | | | | | |
| Invested capital/other(1) | | Market value /reported value(2) | | Collateral balances (at par) | | Capital commitments |
(1)Other consists of ACRE’s FPAUM, which is based on ACRE’s stockholders’ equity.
(2)Includes $71.9 billion and $58.8 billion from funds that primarily invest in illiquid strategies as of December 31, 2024 and 2023, respectively. The underlying investments held in these funds are generally subject to less market volatility than investments held in liquid strategies.
Please refer to “— Results of Operations by Segment” for detailed information by segment of the activity affecting total FPAUM for each of the periods presented.
Perpetual Capital Assets Under Management
The chart below presents our perpetual capital AUM by segment and type ($ in billions):
Management Fees By Type
We view the duration of funds we manage as a metric to measure the stability of our future management fees. For both the years ended December 31, 2024 and 2023, 95% of management fees were earned from perpetual capital or long-dated funds.
The charts below present the composition of our segment management fees by the initial fund duration:
| | | | | | | | | | | | | | | | | | | | | | | | | | | | | | | | | | | |
| Perpetual Capital - Publicly-Traded
Vehicles | | Perpetual Capital - Perpetual Wealth Vehicles | | Perpetual Capital - Managed Accounts | | Perpetual Capital - Private Commingled Vehicles | | Long-Dated Funds(1) | | Other |
(1) Long-dated funds generally have a contractual life of five years or more at inception.
Available Capital and Assets Under Management Not Yet Paying Fees
The charts below present our available capital and AUM not yet paying fees by segment ($ in billions):
| | | | | | | | | | | | | | | | | | | | | | | | | | | | | |
| Credit | | Real Assets | | Private Equity | | Secondaries | | Other Businesses |
As of December 31, 2024, AUM Not Yet Paying Fees includes $81.0 billion of AUM available for future deployment that could generate approximately $728.8 million in potential incremental annual management fees, which represents 29% embedded gross base management fee growth upon deployment. As of December 31, 2023, AUM Not Yet Paying Fees included $62.9 billion of AUM available for future deployment that could generate approximately $621.6 million in potential incremental annual management fees.
Incentive Eligible Assets Under Management and Incentive Generating Assets Under Management
The charts below present our IEAUM and IGAUM by segment ($ in billions):
| | | | | | | | | | | | | | | | | | | | | | | | | | | | | |
| Credit | | Real Assets | | Private Equity | | Secondaries | | Other Businesses |
The charts below present our IGAUM by strategy for funds generating fee related performance revenues and net fee related performance revenues by strategy as of and for the years ended:
| | | | | | | | | | | | | | | | | | | | | | | | | | | | | | | | | | | |
| U.S. Direct Lending | | European Direct Lending | | Alternative Credit | | Private Equity Secondaries | | North American Real Estate Equity | | Real Estate Debt |
(1)Fee related performance revenues by strategy is presented net of the associated fee related performance compensation.
Fund Performance Metrics
Fund performance information for our funds considered to be “significant funds” is included throughout this discussion with analysis to facilitate an understanding of our results of operations for the periods presented. Our significant funds are commingled funds that either contributed at least 1% of our total management fees or comprised at least 1% of our total FPAUM for each of the last two consecutive quarters. In addition to management fees, each of our significant funds may generate carried interest or incentive fees upon the achievement of performance hurdles. The fund performance information reflected in this discussion and analysis is not indicative of our overall performance. An investment in Ares is not an investment in any of our funds. Past performance is not indicative of future results. As with any investment, there is always the potential for gains as well as the possibility of losses. There can be no assurance that any of these funds or our other existing and future funds will achieve similar returns.
Fund performance metrics for significant funds may be marked as “NM” as they may not be considered meaningful due to the limited time since the initial investment and/or early stage of capital deployment.
To further facilitate an understanding of the impact a significant fund may have on our results, we present our drawdown funds as either harvesting investments or deploying capital to indicate the fund’s stage in its life cycle. A fund harvesting investments is past its investment period and opportunistically seeking to monetize investments, while a fund deploying capital is generally seeking new investment opportunities.
Components of Consolidated Results of Operations
Revenues
Management Fees. The investment adviser of our funds generally receives an annual management fee based on a percentage of the fund’s capital commitments, contributed capital, net asset value or invested capital during the investment period, which may then change at the end of the investment period. For certain of our SMAs, we receive an annual management fee based on a percentage of invested capital, contributed capital or net asset value throughout the term of the SMA. We also may receive special fees, including agency and arrangement fees. In certain circumstances, we are contractually required to offset certain amounts of such special fees against management fees relating to the applicable fund.
The investment adviser of each of our CLOs typically receives annual management fees based on the gross aggregate collateral balance for CLOs, at par, adjusted for cash and defaulted or discounted collateral. The management fees of CLOs accounted for approximately 2% of our total management fees on a consolidated basis and 4% on an unconsolidated basis for the year ended December 31, 2024.
The management fees we receive from our drawdown style funds are typically payable on a quarterly basis over the life of the fund and do not fluctuate with the changes in investment performance of the fund. The investment management agreements we enter into with clients in connection with contractual SMAs may generally be terminated by such clients with reasonably short prior written notice. Typically, terminations do not require liquidation of the SMAs and such SMAs will continue to exist until the underlying investments are liquidated. The management fees we receive from our SMAs are generally paid on a periodic basis (typically quarterly, subject to the termination rights described above) and are based on either invested capital or on the net asset value of the SMA.
The investment advisory and management agreements of our publicly-traded and perpetual wealth vehicles must be reviewed or approved annually by their independent boards of directors.
Details regarding our management fees from our publicly-traded and perpetual wealth vehicles are presented below:
| | | | | | | | | | | | | | | | | | | | |
| Vehicle | | Strategy | | Annual Fee Rate | | Fee Base |
| | | | | | |
| Credit Group |
ARCC(1) | | U.S. Direct Lending | | 1.50% | | Total assets (other than cash and cash equivalents) |
| ARCC Part I Fees | | U.S. Direct Lending | | 20.00% | | Net investment income (before ARCC Part I Fees and ARCC Part II Fees), subject to a fixed hurdle rate of 1.75% per quarter, or 7.00% per annum. No fees are recognized until net investment income exceeds a 1.75% hurdle rate, with a catch-up provision to ensure that we receive 20.00% of the net investment income from the first dollar earned |
| ARDC | | Liquid Credit | | 1.00% | | Total assets minus liabilities (other than liabilities relating to indebtedness) |
| ASIF | | U.S. Direct Lending | | 1.25% | | NAV |
| ASIF Part I Fees | | U.S. Direct Lending | | 12.50% | | Net investment income (before ASIF Part I Fees and ASIF Part II Fees), subject to a fixed hurdle rate of 1.25% per quarter, or 5.00% per annum. No fees are recognized until net investment income exceeds a 1.25% hurdle rate, with a catch-up provision to ensure that we receive 12.50% of the net investment income from the first dollar earned |
| CADC | | U.S. Direct Lending | | 1.25% | | Total assets minus liabilities (other than liabilities relating to indebtedness) |
| CADC Part I Fees | | U.S. Direct Lending | | 15.00% | | Net investment income (before CADC Part I Fees), subject to a fixed hurdle rate of 1.50% per quarter, or 6.00% per annum. No fees are recognized until net investment income exceeds the hurdle rate, with a catch-up provision to ensure that we receive 15.00% of the net investment income from the first dollar earned |
| Open-ended European Direct Lending Fund | | European Direct Lending | | 1.25% | | NAV |
| Open-ended European Direct Lending Fund Part I Fees | | European Direct Lending | | 12.50% | | Net investment income (before open-ended European direct lending fund Part I Fees and open-ended European direct lending fund Part II Fees), subject to a fixed hurdle rate of 1.25% per quarter, or 5.00% per annum. No fees are recognized until net investment income exceeds a 1.25% hurdle rate, with a catch-up provision to ensure that we receive 12.50% of the net investment income from the first dollar earned |
| Real Assets Group |
| ACRE | | Real Estate Debt | | 1.50% | | Stockholders’ equity |
| Diversified Non-traded REIT | | North American Real Estate Equity | | 1.10% | | NAV |
| Industrial Non-traded REIT | | North American Real Estate Equity | | 1.25% | | NAV |
| Infrastructure Private BDC | | Infrastructure Opportunities | | 1.25% | | NAV |
| Infrastructure Private BDC Part I Fees | | Infrastructure Opportunities | | 12.50% | | Net investment income (before infrastructure private BDC Part I Fees and infrastructure private BDC Part II Fees), subject to a fixed hurdle rate of 1.25% per quarter, or 5.00% per annum. No fees are recognized until net investment income exceeds a 1.25% hurdle rate, with a catch-up provision to ensure that we receive 12.50% of the net investment income from the first dollar earned |
| Secondaries Group |
| APMF | | Private Equity Secondaries | | 1.40% | | Total assets (including any assets relating to indebtedness or preferred shares that may be issued) minus liabilities (other than liabilities relating to indebtedness) |
(1) ARCC’s management fee rate is reduced from 1.50% to 1.00% on all assets financed using leverage over 1.0x debt to equity.
We are party to contractual expense support agreements with certain perpetual wealth vehicles under which we may advance a portion of certain expenses to support distribution efforts to investors. These expenses are subject to reimbursement from the perpetual wealth vehicles and may result in a corresponding reduction to our Part I Fees until expenses have been recovered.
Details regarding our management fees by strategy, excluding publicly-traded and perpetual wealth vehicles described above, are presented below:
| | | | | | | | | | | | | | | | | | | | |
| Strategy | | Fee Rate | | Fee Base | | Average Remaining Contract Term(1) |
| | | | | | |
| Credit Group | | | | | | |
Liquid Credit(2) | | 0.25% - 1.00% | | Par plus cash or NAV | | 9.2 years(2) |
| Alternative Credit | | 0.50% - 1.50% | | NAV, gross asset value, capital commitments or invested capital | | 4.1 years |
Opportunistic Credit(3) | | 1.50% | | Invested capital or aggregate cost basis of unrealized portfolio investments | | 6.8 years |
U.S. and European Direct Lending(4) | | 0.75% - 1.50% | | Invested capital, NAV or total assets (in certain cases, excluding cash and cash equivalents) | | 4.2 years |
APAC Credit(5) | | 1.00% - 2.00% | | Capital commitments, aggregate cost basis of unrealized portfolio investments or a combination thereof | | 3.8 years |
| | | | | | |
| Real Assets Group |
Real Estate Equity(6) | | 0.50% - 1.50% | | Invested capital, NAV, capital commitments or a combination thereof | | 5.1 years |
| Real Estate Debt | | 0.50% - 1.00% | | Invested capital or NAV | | N/A(7) |
Infrastructure Opportunities(8) | | 1.00% - 1.50% | | Invested capital, capital commitments | | 5.0 years |
| Infrastructure Debt | | 1.00% | | Invested capital | | 5.2 years |
| | | | | | |
| Private Equity Group | | | | | | |
Corporate Private Equity(9) | | 1.50% | | Capital commitments | | 4.9 years |
APAC Private Equity(10) | | 1.00% - 2.00% | | Invested capital, capital commitments or a combination thereof | | 3.1 years |
| | | | | | |
| Secondaries Group |
Private Equity, Real Estate, Infrastructure and Credit Secondaries(11) | | 0.50% - 1.25% | | Capital commitments, invested capital, reported value (largely representing NAV of each fund’s underlying limited partnership interests), called capital plus unfunded commitments or reported value plus unfunded commitments | | 7.1 years |
| | | | | | |
| Other Businesses |
Ares Insurance Solutions(12) | | 0.30% | | Monthly weighted average market value of the assets | | N/A(12) |
(1) Represents the average remaining contract term pursuant to the funds’ governing documents within each strategy, excluding perpetual capital vehicles, as of December 31, 2024.
(2) Liquid credit includes the syndicated loan, high yield bond and multi-asset credit strategies. Fee ranges for syndicated loans generally remain unchanged at the close of the re-investment period. In certain cases, CLOs may be called upon demand by subordinated noteholders prior to the management contract term expiration date. The funds in the high yield bond and multi-asset credit strategies are generally open-ended or managed account structures, which typically do not have investment period termination or management contract expiration dates.
(3) Fee range represents typical range during the investment period. Management fees for opportunistic credit funds generally step down to between 1.00% to 1.25% of the invested capital or the aggregate cost basis of unrealized portfolio investments following the expiration or termination of the investment period.
(4) Following the expiration or termination of the investment period, the fee basis for certain closed-end funds and managed accounts in this strategy generally change either to the aggregate cost or to market value of the portfolio investments.
(5) Certain funds pay a lower management fee rate on committed capital which increases when such capital is invested. The funds in this strategy are comprised of closed-end funds, with investment period termination or management contract termination dates. The funds also include co-investment accounts with fees ranging from 0.25% to 1.00%, which generally do not include investment period termination or management contract termination dates.
(6) Certain funds pay a lower management fee rate on committed capital which increases when such capital is invested. Following the expiration or termination of the investment period the basis on which management fees are earned for certain closed-end funds, managed accounts and co-investment vehicles in this strategy changes from committed capital to invested capital with no change in the management fee rate. Our diversified non-traded REIT and our industrial non-traded REIT pay management fees based on NAV plus net capital raised and outstanding from our 1031 exchange programs.
(7) The funds in this strategy are generally open-ended or managed account structures, which typically do not have investment period termination or management contract expiration dates.
(8) Fee range represents typical range during the investment period. Certain funds pay a lower management fee rate on committed capital which increases when such capital is invested. The infrastructure opportunities funds generally step down the fee base to the aggregated adjusted cost of unrealized portfolio investments, while retaining the same fee rate, following the expiration or termination of the investment period.
(9) Fee rate represents typical rate during the investment period. Management fees for corporate private equity funds generally step down to 0.75% of the aggregate adjusted cost of unrealized portfolio investments following the earlier to occur of: (i) the expiration or termination of the investment period; and (ii) the activation of a successor fund.
(10) Fee rate represents typical rate during the investment period. Management fees for APAC private equity funds generally step down the fee base to the aggregate adjusted cost of unrealized portfolio investments following the expiration or termination of the investment period. The funds also include co-investment vehicles with fee rates of 2.00%, which generally do not include investment period termination or management contract termination dates.
(11) Funds in each strategy are comprised of closed-end funds with either investment period termination or management contract termination dates and certain open-end accounts that generally do not have termination dates.
(12) Ares Insurance Solutions earns a tiered management fee that starts at 0.30% and steps down to 0.15% of the monthly weighted average market value. Ares Insurance Solutions generally includes open-ended or managed account structures, which typically do not have investment period termination or management contract expiration dates.
Incentive Fees. The general partners, managers or similar entities of certain of our funds receive incentive fees, a performance-based fee representing a portion of the investment returns of the applicable fund for a specified measurement period, generally one year, subject to certain net loss carry-forward provisions, high-watermarks and/or preferred returns. These performance-based fees may also be based on a fund’s cumulative net investment returns for the measurement period, in some cases subject to a high-watermark or a preferred return. Incentive fees are realized at the end of a measurement period, typically quarterly or annually. Realized incentive fees are generally higher during the second half of the year, aligning with the measurement period that typically ends at the end of the calendar year. Once realized, such incentive fees are not subject to repayment. Cash from the realizations is typically received in the period subsequent to the measurement period. Incentive fees are composed of both fee related performance revenues, which are earned from perpetual capital vehicles, and those incentive fees earned from funds with stated investment periods.
Details regarding our fee related performance revenues from our publicly-traded and perpetual wealth vehicles are presented below:
| | | | | | | | | | | | | | | | | | | | | | | | | | |
| Vehicle | | Strategy | | Annual Fee Rate | | Fee Base | | Annual Hurdle Rate |
| | | | | | | | |
| Real Assets Group | | | |
| ACRE | | Real Estate Debt | | 20.0% | | The difference between ACRE’s core earnings (as defined in ACRE’s management agreement) and its shareholders' return on equity | | 8.0% |
| Diversified Non-traded REIT and Industrial Non-traded REIT | | North American Real Estate Equity | | 12.5% | | Annual investment returns, subject to certain net loss carry-forward provisions | | 5.0% |
| Secondaries Group | | | | | | | | |
| APMF | | Private Equity Secondaries | | 12.5% | | Quarterly investment returns, subject to certain net loss carry-forward provisions | | N/A |
We are party to contractual expense limitation agreements with certain perpetual wealth vehicles under which we may advance a portion of certain expenses to reduce the perpetual wealth vehicles’ expense ratios. Such expenses are subject to reimbursement from the perpetual wealth vehicles and may result in a corresponding reduction to our fee related performance revenues until the expenses have been recovered.
Details regarding our fee related performance revenues by strategy, excluding publicly-traded and perpetual wealth vehicles described above, are presented below:
| | | | | | | | | | | | | | | | | | | | |
| Strategy | | Fee Rate | | Fee Base | | Annual Hurdle Rate |
| | | | | | |
| Credit Group | | | | | | |
| Alternative Credit | | 15.0% | | Incentive eligible fund’s profits | | 6.0% |
| U.S. and European Direct Lending | | 8.0% - 16.0% | | Incentive eligible fund’s profits | | 5.0% - 8.0% |
| | | | | | |
| | | | | | |
Details regarding our incentive fees earned from funds with stated investment periods, which are generally based on a fund’s eligible profits, are presented below:
| | | | | | | | | | | | | | | | |
| Strategy | | Fee Rate | | | | Annual Hurdle Rate |
| | | | | | |
| Credit Group | | | | | | |
| | | | | | |
| Liquid Credit | | 10.0% - 20.0% | | | | 3.0% - 12.0% |
| Alternative Credit | | 12.5% - 20.0% | | | | 6.0% - 7.0% |
U.S. and European Direct Lending(1) | | 10.0% - 15.0% | | | | 5.0% - 8.0% |
| | | | | | |
| Real Assets Group | | |
| Real Estate Equity | | 15.0% - 20.0% | | | | 6.0% - 8.0% |
| Infrastructure Opportunities | | (1) | | | | (1) |
| | | | | | |
| Secondaries Group | | | | | | |
| Private Equity Secondaries | | 10.0% | | | | 8.0% |
(1) We may receive Part II Fees, which are not paid unless ARCC, ASIF, our open-ended European direct lending fund and our infrastructure private BDC achieve cumulative aggregate realized capital gains (net of cumulative aggregate realized capital losses and aggregate unrealized capital depreciation), subject to certain catch-up provisions. Incentive fees from ARCC represent 20.0% of the cumulative aggregate realized capital gains (net of cumulative aggregate realized losses and aggregate unrealized capital depreciation). For ASIF, our open-ended European direct lending fund, and for our infrastructure private BDC, incentive fees represent 12.5% of the cumulative aggregate realized capital gains (net of cumulative aggregate realized losses and aggregate unrealized capital depreciation). Such fees are presented as incentive fees earned from funds with stated investment periods.
Carried Interest Allocation. Carried interest allocation is recognized based on changes in valuation of our funds’ investments that exceed certain preferred returns as set forth in each respective partnership agreement. Carried interest allocation is based on the amount that would be due to us pursuant to the fund partnership agreement at each period end as if the funds were liquidated at such date. Accordingly, the amount recognized as carried interest allocation reflects our share of the fair value gains and losses of the associated funds’ underlying investments measured at their then-current fair values relative to the fair values as of the end of the prior period. Investment returns of one fund are not offset between or among funds.
Funds generally follow either an American-style waterfall or a European-style waterfall. For American-style waterfalls, we in our role as general partner are entitled to receive carried interest after a fund investment is realized if the investors in the fund have received distributions in excess of the capital contributed for such investment and all prior realized investments (plus allocable expenses), as well as the preferred return. For European-style waterfalls, we in our role as general partner are entitled to receive carried interest if the investors in the fund have received distributions in an amount equal to all prior capital contributions plus a preferred return.
For most funds, the carried interest is subject to a preferred return ranging from 5.0% to 10.0%, after which there is typically a catch-up allocation to the general partner. Generally, if at the termination of a fund (and in some cases at interim points in the life of a fund), the fund has not achieved investment returns that exceed the preferred return threshold or the general partner receives net profits over the life of the fund in excess of its allocable share under the applicable partnership agreement, the general partner will be obligated to repay an amount equal to the extent the previously distributed carried interest exceeds the amounts to which the general partner is entitled. These repayment obligations may be related to amounts previously distributed to us and our senior professionals and are generally referred to as contingent repayment obligations.
Contingent repayment obligations operate with respect to only a given fund’s net investment performance, and carried interest of other funds are not netted for determining this contingent obligation. Although a contingent repayment obligation is several to each person who received a distribution, and not a joint obligation, and our professionals who receive carried interest have guaranteed repayment of such contingent obligation, the governing agreements of our funds generally provide that, if a recipient does not fund his or her respective share, we may have to fund such additional amounts beyond the amount of carried interest we retained, although we generally will retain the right to pursue remedies against those carried interest recipients who fail to fund their obligations.
Certain funds may make distributions to their partners to provide them with cash sufficient to pay applicable federal, state and local tax liabilities attributable to the fund’s income that is allocated to them. These distributions are referred to as tax distributions and are not subject to contingent repayment obligations. Tax distributions from European-style waterfall funds generally precede investors in the fund receiving the preferred return.
Details regarding our carried interest, which is generally based on a fund’s eligible profits, are presented below:
| | | | | | | | | | | | | | | | |
| Strategy | | Fee Rate | | | | Annual Hurdle Rate |
| | | | | | |
| | | | | | |
| | | | | | |
| Credit Group | | | | | | |
| Liquid Credit and Alternative Credit | | 10.0% - 20.0% | | | | 6.0% - 8.0% |
| Opportunistic Credit | | 20.0% | | | | 8.0% |
| U.S. and European Direct Lending | | 10.0% - 20.0% | | | | 5.0% - 8.0% |
| APAC Credit | | 15.0% - 20.0% | | | | 6.0% - 8.0% |
| | | | | | |
| Real Assets Group | | |
| Real Estate | | 10.0% - 20.0% | | | | 7.0% - 10.0% |
| Infrastructure | | 15.0% - 20.0% | | | | 7.0% - 8.0% |
| | | | | | |
| Private Equity Group | | | | | | |
| Corporate Private Equity and APAC Private Equity | | 15.0% - 20.0% | | | | 8.0% |
| | | | | | |
| Secondaries Group | | |
| Private Equity, Real Estate, Infrastructure and Credit Secondaries | | 10.0% - 15% | | | | 7.0% - 8.0% |
| | | | | | |
| Other Businesses | | |
| Ares Insurance Solutions | | 20.0% | | | | 8.0% |
For detailed discussion of contingencies on carried interest, see “Note 8. Commitments and Contingencies,” within our consolidated financial statements and “Item 1A. Risk Factors—Risks Related to Our Funds—We may need to pay “clawback” or “contingent repayment” obligations if and when they are triggered under the governing agreements with our funds” included in this Annual Report on Form 10-K.
Performance Income. Performance income is a term that we use to refer to a sub-set of performance-based fees and only includes incentive fees earned from funds with stated investment periods or carried interest.
Principal Investment Income (Loss). Principal investment income (loss) consists of interest and dividend income and net realized and unrealized gains (losses) on equity method investments where we serve as general partner. Interest and dividend income are recognized on an accrual basis to the extent that such amounts are expected to be collected. A realized gain (loss) may be recognized when all or a portion of our investment is returned to us. Unrealized gains (losses) on investments result from appreciation (depreciation) in the fair value of our investments, as well as reversals of previously recorded unrealized appreciation (depreciation) at the time the gain (loss) on an investment becomes realized.
Administrative, Transaction and Other Fees. Details regarding our administrative, transaction and other fees are presented below:
| | | | | | | | |
| Administrative fees | | Represent fees that we earn for providing administrative services to certain funds and may reflect either expense reimbursements for the cost of certain professionals that perform services for a fund or may be based on fixed percentage of a fund’s invested capital |
| Transaction fees | | Typically represent fees earned from the arrangement and origination of loans and are generated primarily from funds within our direct lending and infrastructure debt strategies. Fees are based on a fixed percentage of original issue discount for our direct lending funds and based on a fixed percentage of loan originations for our infrastructure debt funds |
| Other fees: | | |
| Capital markets transaction fees represent fees that we earn for participating as an underwriter and/or acting as advisor on capital markets transactions |
| Property-related fees represent fees earned within our real estate equity strategies and include the following: |
| Acquisition fees | | Based on a percentage of a property’s cost at the time of property acquisition |
| Development fees | | Based on a percentage of costs to develop a property |
| Property management fees | | Based on tenancy of properties over the time associated property management services are provided |
| Sale and distribution fees represent fees earned through AWMS for the sale and distribution of fund shares in our perpetual wealth vehicles and include the following: |
| Sales-based fees | | Based on a percentage of sales or subscriptions to investors in our perpetual wealth vehicles. Sales-based fees are reported net of amounts re-allowed to participating broker-dealers for their ongoing shareholder services |
| Asset-based fees | | Based on the NAV of applicable funds and asset classes. Asset-based fees are reported net of amounts re-allowed to participating broker-dealers for their ongoing shareholder services |
| Exchange program fees | | Based on a percentage of the value associated with the properties transacted through our 1031 exchange programs. Exchange program fees are recognized when investors contribute real property through like-kind 1031 exchanges for fund shares and through other private placements. These fees are composed of a program administration fee and a facilitation fee for advisory services and sales-based efforts, respectively |
Expenses
Compensation and Benefits. Compensation generally includes salaries, bonuses, health and welfare benefits, payroll-related taxes, equity compensation, Part I Fee compensation and fee related performance compensation expenses. Compensation and benefits expenses are typically correlated to the operating performance of our segments, which is used to determine incentive-based compensation for each segment. Incentive-based compensation is accrued over the service period to which it relates. Our discretionary incentive-based compensation includes our annual bonus pool, is based on our operating performance and may fluctuate throughout the year until payments are made. The majority of our annual bonus payments are made in the fourth quarter. Certain of our senior partners are not paid an annual salary or bonus, instead they only receive distributions based on their ownership interest when declared by our board of directors. Part I Fee compensation and fee related performance compensation represent approximately 60% of Part I Fees and of fee related performance revenues, respectively, before giving effect to payroll-related taxes. We also reduce certain Part I Fee compensation and fee related performance compensation by a portion of the supplemental distribution fees paid to the extent that Part I Fees and fee related performance revenues are earned from certain perpetual wealth vehicles. We pay sales-based bonuses for the sale and distribution of our wealth products through AWMS, including our exchange programs associated with our non-traded REITs. Incremental changes in fair value of certain contingent liabilities established in connection with our various acquisitions are recognized ratably over the service period and are also presented within compensation and benefits. We use changes in headcount, which represents the full-time equivalency of active employees during each period, to analyze changes in compensation and benefits.
Equity compensation represents a form of non-cash compensation that we use to align our employees with the long-term interests of our shareholders. Equity-based awards are typically granted in the form of restricted units or restricted stock (collectively “unvested awards”) that generally vest over a service period between three and five years. We issue equity awards with a long-term focus of limiting the average dilutive impact on our Class A common stockholders to no more than 1.5% annually. Because we withhold shares equal to the fair value of our employee tax withholding liabilities and pay the taxes on their behalf in cash, fewer net shares are issued upon vesting. This result has reduced the average annual dilutive impact of
these awards to less than 1.0% annually. We expect the expenses recognized in connection with these awards to fluctuate with changes in the price of our Class A common stock.
Performance Related Compensation. Performance related compensation includes compensation directly related to carried interest allocation and incentive fees earned from funds with stated investment periods, generally consisting of percentage interests that we grant to our professionals. Depending on the nature of each fund, the performance related compensation generally represents 60% to 80% of the carried interest allocation and aforementioned incentive fees recognized by us before giving effect to payroll-related taxes. The performance related compensation payable is calculated based upon the recognition of carried interest allocation and is not paid to recipients until the carried interest allocation is received. Performance related compensation may include allocations to charitable organizations as part of our philanthropic initiatives.
Although changes in performance related compensation are directly correlated with changes in carried interest allocation and incentive fees reported within our segment results, this correlation does not always exist when our results are reported on a fully consolidated basis in accordance with GAAP. This discrepancy is caused when carried interest allocation and incentive fees earned from our Consolidated Funds is eliminated upon consolidation and performance related compensation is not.
General, Administrative and Other Expenses. General and administrative expenses include costs primarily related to occupancy, professional services, travel, information services and information technology costs, marketing costs, depreciation, amortization of intangibles and other general operating items. These expenses are largely influenced by changes in headcount growth, fundraising activities or strategic initiatives/acquisitions.
Marketing costs include placement fees and supplemental distribution fees. Placement fees are fundraising costs for campaign funds and include: (i) upfront fees based on commitments to a fund; and (ii) service fees for periodic investor services that are recognized as services are provided. Supplemental distribution fees are fundraising costs associated with wealth products, generally paid to strategic investors and/or financial intermediaries for the distribution of shares and may be upfront on a portion of sales, ongoing as a percentage of net asset value or temporary in the form of a fee concession. We may reduce Part I Fee compensation and fee related performance compensation associated with certain perpetual wealth vehicles by a portion of the supplemental distribution fees paid to the extent that Part I Fees and fee related performance revenues are earned from these vehicles. In such instances, the related compensation will be less than 60%.
Expenses of Consolidated Funds. Consolidated Funds’ expenses consist primarily of costs incurred by our Consolidated Funds, including professional services fees, research expenses, trustee fees, travel expenses and other costs associated with organizing and offering these funds.
Other Income (Expense)
Net Realized and Unrealized Gains (Losses) on Investments. A realized gain (loss) may be recognized when all or a portion of our investment is returned to us. Unrealized gains (losses) on investments result from the change in appreciation (depreciation) in the fair value of our investments.
Interest and Dividend Income. Interest and dividend income is primarily generated from investments in CLOs and other strategic investments where we do not serve as general partner. Interest and dividend income are both recognized on an accrual basis to the extent that such amounts are expected to be collected.
Interest Expense. Interest expense includes interest related to our Credit Facility, which has a variable interest rate based upon SOFR plus a credit spread that is adjusted with changes to corporate credit ratings and with the achievement of certain ESG-related targets, and to our senior and subordinated notes, each of which have fixed coupon rates.
Other Income (Expense), Net. Other income (expense), net consists of (i) non-economic transaction gains (losses) on the revaluation of assets and liabilities denominated in currencies other than an entity’s functional currency; and (ii) other non-operating and non-investment related activities, such as changes in fair value of contingent liabilities, loss on disposal of assets, among other items.
Net Realized and Unrealized Gains (Losses) on Investments of Consolidated Funds. Realized gains (losses) may arise from dispositions of investments held by our Consolidated Funds. Unrealized gains (losses) are recorded to reflect the change in appreciation (depreciation) of investments held by the Consolidated Funds due to changes in fair value of the investments.
Interest and Other Income of Consolidated Funds. Interest and other income of Consolidated Funds primarily includes interest and dividend income generated from the underlying investments of our Consolidated Funds.
Interest Expense of Consolidated Funds. Interest expense primarily consists of interest related to our Consolidated CLOs’ loans payable and, to a lesser extent, revolving credit lines, term loans and notes of other Consolidated Funds. The interest expense of the Consolidated CLOs is solely the responsibility of such CLOs, and there is no recourse to us if the CLO is unable to make interest payments.
Income Taxes
AMC is a corporation for U.S. federal income tax purposes and is subject to U.S. federal, state and local corporate income taxes at the entity level on its share of net taxable income. In addition, the AOG entities and certain of AMC’s subsidiaries operate in the U.S. as partnerships or disregarded entities for U.S. federal income tax purposes and as corporate entities in certain foreign jurisdictions. These entities, in some cases, are subject to U.S. state or local income taxes or foreign income taxes. Our effective tax rate is the result of AMC’s net taxable income and the applicable U.S. federal, state and local income taxes as well as, in some cases, foreign income taxes. Net taxable income is based on AMC’s ownership of the AOG entities. As such, our effective tax rate will be directly impacted by changes in AMC’s ownership of the AOG entities and changes to statutory rates in the U.S. and other foreign jurisdictions and, to a lesser extent, income taxes that are recorded for certain affiliated funds and co-investment vehicles that are consolidated in our financial results.
The majority of our Consolidated Funds are not subject to income tax as the funds’ investors are responsible for reporting their share of income or loss on a pass-through basis. To the extent required by federal, state and foreign income tax laws and regulations, certain funds may incur income tax liabilities.
Redeemable and Non-Controlling Interests
Net income (loss) attributable to redeemable and non-controlling interests in Consolidated Funds represents the income (loss) attributable to ownership interests that third parties hold in entities that are consolidated within our consolidated financial statements.
Net income (loss) attributable to redeemable and non-controlling interests in AOG entities represents results attributable to the owners of AOG Units and other ownership interests that are not held by AMC.
In connection with our acquisition of a majority interest in SSG Capital Holdings Limited and its operating subsidiaries (“SSG” and subsequently rebranded as “Ares SSG”) in July 2020, the former owners of SSG retained a 20% ownership interest in a subsidiary of an AOG entity that is reflected as redeemable interest in AOG entities. Net income (loss) attributable to redeemable interest in AOG entities is allocated based on the ownership percentage attributable to the redeemable interest. On March 31, 2023, we acquired a portion of the remaining ownership interest in SSG that was retained by the former owners of SSG (the “SSG Buyout”), and we now own 100% of Ares SSG’s fee-generating business. Following the SSG Buyout, legacy owners of SSG retained an ownership interest in certain non-controlled investments that will continue to be reflected as redeemable interests, and the income generated by these investments will continue to be allocated ratably based on ownership.
Net income (loss) attributable to non-controlling interests in AOG entities is generally allocated based on the weighted average daily ownership of the other AOG unitholders, except for income (loss) generated from certain joint venture partnerships. Net income (loss) is allocated to other strategic distribution partners with whom we have established joint ventures based on the respective ownership percentages and based on the activity of certain membership interests.
For additional discussion on components of our consolidated results of operations, see “Note 2. Summary of Significant Accounting Policies,” within our consolidated financial statements included in this Annual Report on Form 10-K.
Consolidation and Deconsolidation of Ares Funds
Consolidated Funds represented approximately 3% of our AUM as of December 31, 2024 and 2% of total revenues for the year ended December 31, 2024. As of December 31, 2024, we consolidated 27 CLOs, ten private funds and one SPAC, and as of December 31, 2023, we consolidated 28 CLOs, ten private funds and one SPAC.
The activity of the Consolidated Funds is reflected within the consolidated financial statement line items indicated by reference thereto. The impact of consolidation also typically will decrease management fees, carried interest allocation and incentive fees reported under GAAP to the extent these amounts are eliminated upon consolidation.
The assets and liabilities of our Consolidated Funds are held within separate legal entities and, as a result, the liabilities of our Consolidated Funds are typically non-recourse to us. Generally, the consolidation of our Consolidated Funds has a significant gross-up effect on our assets, liabilities and cash flows but has no net effect on the net income attributable to us or our stockholders’ equity, except where accounting for a redemption or liquidation preference requires the reallocation of ownership based on specific terms of a profit sharing agreement. The net economic ownership interests of our Consolidated Funds, to which we have no economic rights, are reflected as redeemable and non-controlling interests in the Consolidated Funds within our consolidated financial statements. Redeemable interest in Consolidated Funds represent the shares issued by our SPACs that are redeemable for cash by the public shareholders in the event that the SPAC does not complete a business combination or tender offer associated with shareholder approval provisions.
We generally deconsolidate funds and CLOs when we are no longer deemed to have a controlling interest in the entity. During the year ended December 31, 2024, we deconsolidated one CLO as a result of significant change in ownership. During the year ended December 31, 2023, we deconsolidated one SPAC as a result of liquidation and one private fund as a result of a significant change in ownership.
The performance of our Consolidated Funds is not necessarily consistent with, or representative of, the combined performance trends of all of our funds.
For the actual impact that consolidation had on our results and further discussion on consolidation and deconsolidation of funds, see “Note 15. Consolidation” within our consolidated financial statements included herein.
Results of Operations
Consolidated Results of Operations
Although the consolidated results presented below include the results of our operations together with those of the Consolidated Funds and other joint ventures, we separate our analysis of those items primarily impacting the Company from those of the Consolidated Funds.
The following table presents our summarized consolidated results of operations ($ in thousands):
| | | | | | | | | | | | | | | | | | | | | | | | | | | | | | | |
| | | | | | | |
| | | | | Year ended December 31, | | Favorable (Unfavorable) |
| | | | | | | | | 2024 | | 2023 | | $ Change | | % Change |
| Total revenues | | | | | | | | | $ | 3,884,781 | | | $ | 3,631,884 | | | $ | 252,897 | | | 7% |
| Total expenses | | | | | | | | | (2,938,691) | | | (2,797,858) | | | (140,833) | | | (5) |
| Total other income, net | | | | | | | | | 329,262 | | | 499,037 | | | (169,775) | | | (34) |
| | | | | | | | | | | | | | | |
| Less: Income tax expense | | | | | | | | | 164,617 | | | 172,971 | | | 8,354 | | | 5 |
| Net income | | | | | | | | | 1,110,735 | | | 1,160,092 | | | (49,357) | | | (4) |
| Less: Net income attributable to non-controlling interests in Consolidated Funds | | | | | | | | | 295,772 | | | 274,296 | | | 21,476 | | | 8 |
| Net income attributable to Ares Operating Group entities | | | | | | | | | 814,963 | | | 885,796 | | | (70,833) | | | (8) |
| Less: Net income attributable to redeemable interest in Ares Operating Group entities | | | | | | | | | 103 | | | 226 | | | (123) | | | (54) |
| Less: Net income attributable to non-controlling interests in Ares Operating Group entities | | | | | | | | | 351,118 | | | 411,244 | | | (60,126) | | | (15) |
| Net income attributable to Ares Management Corporation | | | | | | | | | 463,742 | | | 474,326 | | | (10,584) | | | (2) |
| | | | | | | | | | | | | | | |
| | | | | | | | | | | | | | | |
| Less: Series B mandatory convertible preferred stock dividends declared | | | | | | | | | 22,781 | | | — | | | 22,781 | | | NM |
| | | | | | | | | | | | | | | |
| Net income attributable to Ares Management Corporation Class A and non-voting common stockholders | | | | | | | | | $ | 440,961 | | | $ | 474,326 | | | (33,365) | | | (7) |
Year Ended December 31, 2024 Compared to Year Ended December 31, 2023
Consolidated Results of Operations of the Company
The following discussion sets forth information regarding our consolidated results of operations:
Revenues
| | | | | | | | | | | | | | | | | | | | | | | | | | | | | | | |
| | | | | Year ended December 31, | | Favorable (Unfavorable) |
| | | | | | | | | 2024 | | 2023 | | $ Change | | % Change |
| Revenues | | | | | | | | | | | | | | | |
| Management fees | | | | | | | | | $ | 2,942,126 | | | $ | 2,551,150 | | | $ | 390,976 | | | 15% |
| Carried interest allocation | | | | | | | | | 390,180 | | | 618,579 | | | (228,399) | | | (37) |
| Incentive fees | | | | | | | | | 344,157 | | | 276,627 | | | 67,530 | | | 24 |
| Principal investment income | | | | | | | | | 45,424 | | | 36,516 | | | 8,908 | | | 24 |
| Administrative, transaction and other fees | | | | | | | | | 162,894 | | | 149,012 | | | 13,882 | | | 9 |
| Total revenues | | | | | | | | | $ | 3,884,781 | | | $ | 3,631,884 | | | 252,897 | | | 7 |
Management Fees. Capital deployment in direct lending and alternative credit funds within the Credit Group led to a rise in FPAUM, contributing an increase in management fees of $230.6 million for the year ended December 31, 2024 compared to the prior year. Part I Fees increased by $96.3 million for the year ended December 31, 2024 compared to the prior year. The increase in Part I Fees was primarily due to: (i) the increase in pre-incentive fee net investment income generated by ASIF, ARCC and CADC, driven by an increase in the average size of their portfolios; and (ii) the increase in pre-incentive fee net investment income from our open-ended European direct lending fund that began generating Part I Fees after the third quarter of 2023. For detail regarding the fluctuations of management fees within each of our segments, see “—Results of Operations by Segment.”
Carried Interest Allocation. The following table sets forth carried interest allocation by segment ($ in millions):
| | | | | | | | | | | | | | | |
| | | Year ended December 31, |
| | | | | 2024 | | 2023 |
| Credit funds | | | | | $ | 607.2 | | | $ | 742.1 | |
| Real Assets funds | | | | | 105.7 | | | 8.5 | |
| Private Equity funds | | | | | (294.4) | | | (118.8) | |
| Secondaries funds | | | | | (28.3) | | | (13.2) | |
| | | | | | | |
| Carried interest allocation | | | | | $ | 390.2 | | | $ | 618.6 | |
The activity was principally composed of the following:
| | | | | | | | |
| Year ended December 31, 2024 | | Year ended December 31, 2023 |
| Credit funds | | |
•Primarily from five direct lending funds, one opportunistic credit fund and two alternative credit funds with $36.2 billion of IGAUM generating returns in excess of their hurdle rates: ◦Within our direct lending funds, Ares Capital Europe V, L.P. (“ACE V”), Ares Private Credit Solutions II, L.P. (“PCS II”) and Ares Capital Europe VI, L.P. (“ACE VI”) generated carried interest allocation of $153.2 million, $131.1 million and $54.5 million, respectively, driven by net investment income on an increasing invested capital base. Ares Capital Europe IV, L.P. (“ACE IV”) and Ares Private Credit Solutions, L.P. (“PCS I”) generated carried interest allocation of $57.0 million and $22.9 million, respectively, driven by net investment income during the period ◦Within our opportunistic credit funds, Ares Special Opportunities Fund II, L.P. (“ASOF II”) generated carried interest allocation of $177.3 million, driven by improved operating performance metrics from portfolio companies that operate in the services and retail industries ◦Within our alternative credit funds, Pathfinder I and Pathfinder II generated carried interest allocation of $62.6 million and $39.1 million, respectively, driven by market appreciation of certain investments and net investment income during the period •Reversal of unrealized carried interest allocation of $99.8 million and $23.7 million from Ares Special Situations Fund IV, L.P. (“SSF IV”) and Ares Special Opportunities Fund, L.P. (“ASOF I”), respectively, primarily due to the market depreciation of their investments in Savers Value Village, Inc. (“SVV”), driven by its lower stock price and lower operating performance of portfolio companies that primarily operate in the retail, services and healthcare industries •Reversal of unrealized carried interest allocation of $68.9 million from Ares Capital Europe III, L.P. (“ACE III”) due to lower valuations of certain investments | | •Primarily from six direct lending funds, three opportunistic credit funds and one alternative credit fund with $37.4 billion of IGAUM generating returns in excess of their hurdle rates: ◦Within our direct lending funds, ACE V, PCS II, Ares Sports Media and Entertainment Finance, L.P. and ACE VI generated carried interest allocation of $181.1 million, $37.6 million, $22.0 million and $16.6 million, respectively, driven by net investment income on an increasing invested capital base. ACE IV and PCS I generated carried interest allocation of $58.4 million and $45.3 million, respectively, primarily driven by net investment income during the period. Our direct lending funds have benefited from rising interest rates on predominately floating-rate loans ◦Within our opportunistic credit funds, ASOF I and SSF IV generated carried interest allocation of $82.7 million and $79.8 million, respectively, predominately driven by market appreciation and improved operating performance of portfolio companies that operate in the services industry. ASOF II generated carried interest allocation of $80.9 million, driven by improved operating performance of portfolio companies that operate in the healthcare industry ◦Within our alternative credit funds, Pathfinder I generated carried interest allocation of $66.3 million, driven by market appreciation of certain investments and net investment income during the period |
| Real Assets funds | | |
•Ares Infrastructure Debt Fund V, L.P. (“IDF V”) generated carried interest allocation of $63.8 million, driven by net investment income during the period •Ares Climate Infrastructure Partners, L.P. (“ACIP I”) and Ares Energy Investors Fund V, L.P. (“EIF V”) generated carried interest allocation of $44.0 million and $27.7 million, respectively, due to appreciation of certain investments •Reversal of unrealized carried interest allocation of $26.3 million from Ares European Real Estate Fund IV SCSp. (“EF IV”), primarily driven by the lower valuation of a residential property investment | | •IDF V generated carried interest allocation of $37.9 million, driven by net investment income during the period •ACIP I generated carried interest allocation of $19.0 million due to market appreciation of certain investments •U.S. Real Estate Fund IX, L.P. (“US IX”) generated carried interest allocation of $3.1 million, driven by increasing operating income primarily from industrial and multifamily investments •Reversal of unrealized carried interest allocation of $12.6 million from EF IV, $5.7 million from Ares Real Estate Opportunity Fund III, L.P. (“AREOF III”), $5.5 million from Ares European Real Estate Fund V SCSp. (“EF V”) and $19.1 million from two European real estate equity funds, primarily driven by lower valuations of certain properties, which were impacted by the market environment |
| Private Equity funds | | |
•Reversal of unrealized carried interest allocation of $474.9 million from Ares Corporate Opportunities Fund V, L.P. (“ACOF V”) due to the market depreciation of its investment in SVV, driven by its lower stock price •Ares Corporate Opportunities Fund VI, L.P. (“ACOF VI”) generated carried interest allocation of $220.3 million, driven by improved operating performance metrics from portfolio companies that primarily operate in the healthcare, services, industrial and retail industries | | •ACOF VI generated carried interest allocation of $190.0 million, driven by improved operating performance of portfolio companies that primarily operate in the retail and healthcare industries and market appreciation of an investment in a services company •Reversal of unrealized carried interest allocation of $268.1 million from ACOF V, primarily driven by a lower stock price for SVV, and $35.8 million from Ares Corporate Opportunities Fund IV, L.P. (“ACOF IV”), primarily driven by lower operating performance metrics of a portfolio company that operates in the healthcare industry |
| | | | | | | | |
| Year ended December 31, 2024 | | Year ended December 31, 2023 |
| Secondaries funds | | |
•Reversal of unrealized carried interest of $19.8 million from Landmark Real Estate Fund VIII, L.P. (“LREF VIII”), primarily driven by the lower valuation of certain investments with underlying interests in multifamily portfolios •Reversal of unrealized carried interest of $28.9 million from Landmark Equity Partners XVI, L.P. (“LEP XVI”), due to the lower valuation of certain portfolio investments •Our third infrastructure secondaries fund and four private equity secondaries funds collectively generated carried interest allocation of $27.0 million, primarily driven by the appreciation of certain portfolio investments | | •Depreciation across several investments in LEP XVI led to a reversal of unrealized carried interest |
Incentive Fees. The following table sets forth incentive fees by segment ($ in millions):
| | | | | | | | | | | | | | | |
| | | Year ended December 31, |
| | | | | 2024 | | 2023 |
| Credit funds | | | | | $ | 287.8 | | | $ | 248.4 | |
| Real Assets funds | | | | | 27.2 | | | 15.4 | |
Secondaries funds | | | | | 29.2 | | | 12.8 | |
| Incentive fees | | | | | $ | 344.2 | | | $ | 276.6 | |
We earned higher incentive fees for the year ended December 31, 2024 compared to the year ended December 31, 2023 as a result of growth in our IGAUM, primarily driven by deployment of capital within credit funds that are generating returns in excess of their hurdle rates mostly in our U.S. and European direct lending strategies and our alternative credit strategy. For further detail regarding the incentive fees within each of our segments, see discussion of fee related performance revenues and realized net performance income within “—Results of Operations by Segment.”
Principal Investment Income. For equity method investments where we serve as general partner, we present the activity of net realized and unrealized gains on investments and realized investment income together with net capital activity. The following tables present the change in fair value of our equity method investments where we serve as general partner ($ in millions):
| | | | | | | | | | | | | | | | | | | | | | | | | | | | | | | | | | | | | | | | | |
| As of December 31, 2023 | | Activity during the period | | As of December 31, 2024 |
| Cost Basis | | Fair Value | | Net Capital Activity | | Change in Unrealized | | Realized | | | | Cost Basis | | Fair Value |
| | | | | | | | | | | | | | | |
| | | | | | | | | | | | | | | |
| | | | | | | | | | | | | | | |
| | | | | | | | | | | | | | | |
| | | | | | | | | | | | | | | |
| $ | 453.3 | | | $ | 535.3 | | | $ | (43.8) | | | $ | 2.4 | | | $ | 43.0 | | | | | $ | 451.4 | | | $ | 536.9 | |
The activity for the year ended December 31, 2024 was primarily attributable to:
•Principal investment income, primarily due to: (i) realized gains generated from funds within our infrastructure debt, real estate debt and our U.S. and European direct lending strategies; and (ii) interest income from newly admitted investors in an insurance fund
•Net capital activity from our investments in credit funds, primarily driven by transfers of capital investments within European direct lending and APAC credit funds to employee co-investment vehicles
| | | | | | | | | | | | | | | | | | | | | | | | | | | | | | | | | | | | | | | | | |
| As of December 31, 2022 | | Activity during the period | | As of December 31, 2023 |
| Cost Basis | | Fair Value | | Net Capital Activity | | Change in Unrealized | | Realized | | | | Cost Basis | | Fair Value |
| | | | | | | | | | | | | | | |
| | | | | | | | | | | | | | | |
| | | | | | | | | | | | | | | |
| | | | | | | | | | | | | | | |
| | | | | | | | | | | | | | | |
| $ | 480.9 | | | $ | 543.6 | | | $ | (44.8) | | | $ | 2.3 | | | $ | 34.2 | | | | | $ | 453.3 | | | $ | 535.3 | |
The activity for the year ended December 31, 2023 was primarily attributable to:
•Principal investment income from realized gains generated from funds within our infrastructure debt and our U.S. and European direct lending strategies
•Net capital activities from our investments in credit and private equity funds, primarily driven by: (i) transfers of capital investments within opportunistic credit, alternative credit and corporate private equity funds to employee co-investment vehicles; partially offset by (ii) investments made within our real estate debt strategy
Administrative, Transaction and Other Fees. The increase for the year ended December 31, 2024 compared to the prior year was driven by: (i) higher administrative service fees of $17.8 million primarily from private funds within our Credit Group that are based on invested capital and from our perpetual wealth vehicles; and (ii) higher administrative fees of $5.2
million from a commercial finance fund that were previously eliminated when this fund was consolidated into our results until the second quarter of 2023; and (iii) higher property management and development fees of $3.5 million resulting from an increase in property-related activities within certain North American real estate equity funds; partially offset by (iv) lower credit transaction fees of $11.0 million, primarily from the infrastructure debt strategy, which are infrequent in nature and lower loan origination income earned from certain managed accounts within the U.S. direct lending strategy, driven by a lower capacity of investable capital; and (v) lower asset-based, net distribution fees associated with our non-traded REITs of $5.3 million.
Expenses
| | | | | | | | | | | | | | | | | | | | | | | | | | | | | | | |
| | | | | Year ended December 31, | | Favorable (Unfavorable) |
| | | | | | | | | 2024 | | 2023 | | $ Change | | % Change |
| Expenses | | | | | | | | | | | | | | | |
| Compensation and benefits | | | | | | | | | $ | 1,731,747 | | | $ | 1,486,698 | | | $ | (245,049) | | | (16)% |
| Performance related compensation | | | | | | | | | 449,564 | | | 607,522 | | | 157,958 | | | 26 |
| General, administrative and other expenses | | | | | | | | | 736,501 | | | 660,146 | | | (76,355) | | | (12) |
| | | | | | | | | | | | | | | |
| Expenses of Consolidated Funds | | | | | | | | | 20,879 | | | 43,492 | | | 22,613 | | | 52 |
| Total expenses | | | | | | | | | $ | 2,938,691 | | | $ | 2,797,858 | | | (140,833) | | | (5) |
Compensation and Benefits. The increase in compensation and benefits for the year ended December 31, 2024 compared to the prior year reflects the continued growth in salary and benefits for increased staff levels. The most significant expense increases were equity-based compensation, salary expense and Part I Fee compensation. Equity-based compensation expense increased by $96.9 million from the prior year as result of newly issued unvested awards, magnified by our increased stock price. In addition, we accelerated expense for certain awards requiring no future service as retirement provisions have been achieved. These provisions increased expense by $17.4 million and $10.0 million for the years ended December 31, 2024 and 2023, respectively.
The increase in compensation and benefits for the year ended December 31, 2024 compared to the prior year was also driven by: (i) an increase in salary expense of $54.2 million primarily attributable to headcount growth to support the expansion of our business; and (ii) higher Part I Fee compensation of $43.1 million.
Compensation and benefits for the year ended December 31, 2024 also included: (i) $20.0 million from the performance-based, acquisition-related compensation arrangement established in connection with the acquisition of Crescent Point Capital (“Crescent Point”) (the “Crescent Point Acquisition”) that closed in the fourth quarter of 2023; and (ii) $17.7 million of bonus payments made at the close of the WSM Acquisition. The performance-based, acquisition-related compensation arrangement for the Crescent Point Acquisition contributed $5.0 million of expense for the year ended December 31, 2023. See “Note 8. Commitments and Contingencies” for a further description of the contingent liabilities related to the Crescent Point Acquisition arrangement.
Average headcount increased by 11% to 2,971 professionals for the year-to-date period in 2024 from 2,674 professionals in 2023.
For detail regarding the fluctuations of compensation and benefits within each of our segments see “—Results of Operations by Segment.”
Performance Related Compensation. Changes in performance related compensation are directly associated with the changes in carried interest allocation and incentive fees described above and include associated payroll-related taxes as well as carried interest and incentive fees allocated to charitable organizations as part of our philanthropic initiatives. Performance related compensation generally represents 60% to 80% of carried interest allocation and incentive fees recognized before giving effect to payroll taxes and will vary based on the mix of funds generating carried interest allocation and incentive fees for that period.
General, Administrative and Other Expenses. The increase in general, administrative and other expenses for the year ended December 31, 2024 compared to the prior year reflects the continued growth to support staff levels and fundraising activities. The most significant expense increases were marketing costs, acquisition-related costs, occupancy costs, information services costs and information technology costs.
Marketing costs, which include placement fees and supplemental distribution fees, increased by $62.8 million for the year ended December 31, 2024 compared to the prior year, to support fundraising for our funds and distribution of shares in our perpetual wealth vehicles. Supplemental distribution fees increased by $37.3 million over the comparative periods as a result of increases in sales volumes and net asset value of our wealth products. We expect that these fees will fluctuate with sales
volumes and net asset value as we have expanded the diversity of our wealth products. Placement fees increased by $14.2 million for the year ended December 31, 2024 compared to the prior year primarily due to new commitments to Ares Senior Direct Lending Fund III, L.P. (“SDL III”). Marketing costs associated with fund formation, program sponsorships and investor events increased by $11.3 million for the year ended December 31, 2024 compared to the prior year, including our first firmwide annual general meeting with investors (“AGM”).
Acquisition-related costs increased by $45.4 million for the year ended December 31, 2024 compared to the prior year. Acquisition-related costs generally precede a business combination, varying with the size, scale and complexity of the transaction. The majority of the costs incurred in the current year are related to the GCP Acquisition. The GCP Acquisition is expected to close in the first half of 2025. We also incurred costs in the current year for various strategic acquisitions, including the WSM Acquisition which was completed in the fourth quarter of 2024. We expect to continue to incur acquisition-related costs until acquisitions are completed.
In addition, occupancy costs, information services and information technology costs collectively increased by $39.7 million for the year ended December 31, 2024 compared to the prior year to support our growing headcount and the expansion of our business, including costs for our new corporate headquarters that we occupied beginning in third quarter of 2024.
During the year ended December 31, 2024, we recognized a non-cash impairment charge of $8.9 million to the fair value of management contracts of certain funds primarily within the Credit Group. During the year ended December 31, 2023, we recognized a non-cash impairment charge of $78.7 million, primarily related to the value of client relationships from the acquisition of Landmark Partners, LLC (the “Landmark Acquisition”).
Other Income (Expense)
| | | | | | | | | | | | | | | | | | | | | | | | | | | | | | | |
| | | | | Year ended December 31, | | Favorable (Unfavorable) |
| | | | | | | | | 2024 | | 2023 | | $ Change | | % Change |
| Other income (expense) | | | | | | | | | | | | | | | |
| Net realized and unrealized gains on investments | | | | | | | | | $ | 16,570 | | | $ | 77,573 | | | $ | (61,003) | | | (79)% |
| Interest and dividend income | | | | | | | | | 43,054 | | | 19,276 | | | 23,778 | | | 123 |
| Interest expense | | | | | | | | | (142,966) | | | (106,276) | | | (36,690) | | | (35) |
| Other income, net | | | | | | | | | 627 | | | 4,819 | | | (4,192) | | | (87) |
| Net realized and unrealized gains on investments of Consolidated Funds | | | | | | | | | 313,963 | | | 262,700 | | | 51,263 | | | 20 |
| Interest and other income of Consolidated Funds | | | | | | | | | 933,349 | | | 995,545 | | | (62,196) | | | (6) |
| Interest expense of Consolidated Funds | | | | | | | | | (835,335) | | | (754,600) | | | (80,735) | | | (11) |
| Total other income, net | | | | | | | | | $ | 329,262 | | | $ | 499,037 | | | (169,775) | | | (34) |
Net Realized and Unrealized Gains on Investments; Interest and Dividend Income. For investments where we do not serve as general partner, we present the activity of net realized and unrealized gains on investments and interest and dividend income together with net capital activity. The following tables present the change in fair value of these investments ($ in millions):
| | | | | | | | | | | | | | | | | | | | | | | | | | | | | | | | | | | | | | | | | | | | | |
| As of December 31, 2023 | | Activity during the period | | As of December 31, 2024 |
| Cost Basis | | Fair Value | | Net Capital Activity | | Net Realized and Unrealized Gains (Losses) | | Interest and Dividend Income | | Other Adjustments | | Cost Basis | | Fair Value |
| | | | | | | | | | | | | | | |
| | | | | | | | | | | | | | | |
| | | | | | | | | | | | | | | |
| | | | | | | | | | | | | | | |
| | | | | | | | | | | | | | | |
| | | | | | | | | | | | | | | |
| $ | 591.1 | | | $ | 675.1 | | | $ | (117.8) | | | $ | 16.6 | | | $ | 43.1 | | | $ | (0.7) | | | $ | 514.3 | | | $ | 616.3 | |
The activity for the year ended December 31, 2024 was primarily attributable to:
•Net unrealized gains from the appreciation of our investment in APMF
•Interest and dividend income, primarily due to: (i) interest income generated from our investments in CLOs; and (ii) $11.5 million of interest income generated from capital raised in anticipation of the GCP Acquisition, which was temporarily invested in treasury-backed securities. Following the completion of the GCP Acquisition, this portion of interest income will subside
•Net capital activity driven by the collection of principal associated with loans that we made within our real estate debt strategy
| | | | | | | | | | | | | | | | | | | | | | | | | | | | | | | | | | | | | | | | | | | | | |
| As of December 31, 2022 | | Activity during the period | | As of December 31, 2023 |
| Cost Basis | | Fair Value | | Net Capital Activity | | Net Realized and Unrealized Gains (Losses) | | Interest and Dividend Income | | Other Adjustments | | Cost Basis | | Fair Value |
| | | | | | | | | | | | | | | |
| | | | | | | | | | | | | | | |
| | | | | | | | | | | | | | | |
| | | | | | | | | | | | | | | |
| | | | | | | | | | | | | | | |
| | | | | | | | | | | | | | | |
| $ | 291.6 | | | $ | 325.3 | | | $ | 252.6 | | | $ | 77.6 | | | $ | 19.3 | | | $ | 0.3 | | | $ | 591.1 | | | $ | 675.1 | |
The activity for the year ended December 31, 2023 was primarily attributable to:
•Net gains from our strategic investments in a U.S. energy company, primarily as a result of the increase in value of our various common and preferred equity investments, and unrealized gains on our investments from: (i) APMF; and (ii) certain strategic investments in companies that manage portfolios of non-performing loans and real estate owned properties
•Interest and dividend income, primarily due to: (i) interest income generated from our investments in CLOs; and (ii) dividends from our investment in APMF
•Net capital activity driven by an investment made in a strategic investment in a Brazilian alternative asset manager and the deployment of capital into an investment within our real estate debt strategy
Interest Expense. Interest expense increased for the year ended December 31, 2024 compared to the prior year primarily due to the issuance of the 2028 Senior Notes in November 2023 and 2054 Senior Notes in October 2024 that collectively increased interest expense by $37.8 million. The increase in interest expense was partially offset by reductions of: (i) $4.5 million from our Credit Facility due to lower average outstanding balance during the second half of 2024; and (ii) $2.5 million from the repayment of our 2024 Senior Notes in October 2024. We expect interest expense to trend higher in future periods as the issuance of our 2054 Senior Notes is expected to result in greater interest expense than the collective savings resulting from the lower anticipated balances from our Credit Facility and repayment of our 2024 Senior Notes.
The activity for the year ended December 31, 2024 also included $5.5 million of one-time interest expense related to a temporary bridge facility that was established in connection with the GCP Acquisition. The facility was not utilized and was terminated in the fourth quarter of 2024.
Other Income, Net. The activity for the years ended December 31, 2024 and 2023 included transaction gains (losses) associated with currency fluctuations impacting the revaluation of assets and liabilities denominated in foreign currencies other than an entity’s functional currency. The year ended December 31, 2024 included an insignificant amount of transaction gains associated with currency fluctuations. Transaction losses for the year ended December 31, 2023 were primarily due to the Euro weakening against the British pound.
Income Tax Expense
| | | | | | | | | | | | | | | | | | | | | | | | | | | | | | | |
| | | | | Year ended December 31, | | Favorable (Unfavorable) |
| | | | | | | | | 2024 | | 2023 | | $ Change | | % Change |
| Income before taxes | | | | | | | | | $ | 1,275,352 | | | $ | 1,333,063 | | | $ | (57,711) | | | (4)% |
| Less: Income tax expense | | | | | | | | | 164,617 | | | 172,971 | | | 8,354 | | | 5 |
| Net income | | | | | | | | | $ | 1,110,735 | | | $ | 1,160,092 | | | (49,357) | | | (4) |
The decrease in income tax expense was attributable to lower pre-tax income allocable to AMC for the year ended December 31, 2024 compared to the prior year as the income attributed to redeemable and non-controlling interests is generally passed through to partners and not subject to corporate income taxes. The calculation of income taxes is also sensitive to any changes in weighted average daily ownership.
The following table summarizes weighted average daily ownership:
| | | | | | | | | | | | | | | | | | |
| | | | Year ended December 31, |
| | | | | | 2024 | | 2023 |
| AMC common stockholders | | | | | | 63.61 | % | | 60.83 | % |
| Non-controlling AOG unitholders | | | | | | 36.39 | | | 39.17 | |
The change in ownership compared to the prior year was primarily driven by the issuances of shares of Class A common stock in connection with exchanges of AOG Units, the public offering that closed during the year ended December 31, 2024 (the “Offering”), stock option exercises and vesting of restricted unit awards.
Redeemable and Non-Controlling Interests
| | | | | | | | | | | | | | | | | | | | | | | | | | | | | | | |
| | | | | Year ended December 31, | | Favorable (Unfavorable) |
| | | | | | | | | 2024 | | 2023 | | $ Change | | % Change |
| Net income | | | | | | | | | $ | 1,110,735 | | | $ | 1,160,092 | | | $ | (49,357) | | | (4)% |
| | | | | | | | | | | | | | | |
| Less: Net income attributable to non-controlling interests in Consolidated Funds | | | | | | | | | 295,772 | | | 274,296 | | | 21,476 | | | 8 |
| Net income attributable to Ares Operating Group entities | | | | | | | | | 814,963 | | | 885,796 | | | (70,833) | | | (8) |
| Less: Net income attributable to redeemable interest in Ares Operating Group entities | | | | | | | | | 103 | | | 226 | | | (123) | | | (54) |
| Less: Net income attributable to non-controlling interests in Ares Operating Group entities | | | | | | | | | 351,118 | | | 411,244 | | | (60,126) | | | (15) |
| Net income attributable to Ares Management Corporation | | | | | | | | | 463,742 | | | 474,326 | | | (10,584) | | | (2) |
| | | | | | | | | | | | | | | |
| | | | | | | | | | | | | | | |
| Less: Series B mandatory convertible preferred stock dividends declared | | | | | | | | | 22,781 | | | — | | | (22,781) | | | NM |
| | | | | | | | | | | | | | | |
| Net income attributable to Ares Management Corporation Class A and non-voting common stockholders | | | | | | | | | $ | 440,961 | | | $ | 474,326 | | | (33,365) | | | (7) |
The change in net income attributable to non-controlling interests in AOG entities compared to the prior year was a result of the respective changes in income before taxes and weighted average daily ownership, as presented above.
Consolidated Results of Operations of the Consolidated Funds
The following table presents the results of operations of the Consolidated Funds ($ in thousands):
| | | | | | | | | | | | | | | | | | | | | | | | | | | | | | | | | | | | | | | | |
| | | | | | | | | | | | | | | |
| | | | | | Year ended December 31, | | | | | | Favorable (Unfavorable) |
| | | | | | | | | | 2024 | | 2023 | | | | | | | | $ Change | | % Change |
| Expenses of the Consolidated Funds | | | | | | | | | | $ | (20,879) | | | $ | (43,492) | | | | | | | | | $ | 22,613 | | | 52% |
| Net realized and unrealized gains on investments of Consolidated Funds | | | | | | | | | | 313,963 | | | 262,700 | | | | | | | | | 51,263 | | | 20 |
| Interest and other income of Consolidated Funds | | | | | | | | | | 933,349 | | | 995,545 | | | | | | | | | (62,196) | | | (6) |
| Interest expense of Consolidated Funds | | | | | | | | | | (835,335) | | | (754,600) | | | | | | | | | (80,735) | | | (11) |
| Income before taxes | | | | | | | | | | 391,098 | | | 460,153 | | | | | | | | | (69,055) | | | (15) |
| Less: Income tax expense of Consolidated Funds | | | | | | | | | | 7,074 | | | 3,823 | | | | | | | | | (3,251) | | | (85) |
| Net income | | | | | | | | | | 384,024 | | | 456,330 | | | | | | | | | (72,306) | | | (16) |
| Less: Revenues attributable to Ares Management Corporation eliminated upon consolidation | | | | | | | | | | 68,200 | | | 188,155 | | | | | | | | | (119,955) | | | (64) |
| Other expense (income), net attributable to Ares Management Corporation eliminated upon consolidation | | | | | | | | | | (20,052) | | | 5,688 | | | | | | | | | 25,740 | | | NM |
| General, administrative and other expense attributable to Ares Management Corporation eliminated upon consolidation | | | | | | | | | | — | | | 433 | | | | | | | | | 433 | | | 100 |
| Net income attributable to non-controlling interests in Consolidated Funds | | | | | | | | | | $ | 295,772 | | | $ | 274,296 | | | | | | | | | 21,476 | | | 8 |
The results of operations of the Consolidated Funds primarily represent activities from certain funds that we are deemed to control. When a fund is consolidated, we reflect the revenues and expenses of the entity on a gross basis, subject to eliminations from consolidation. Substantially all of our results of operations related to the Consolidated Funds are attributable to ownership interests that third parties hold in those funds. The Consolidated Funds are not necessarily the same funds in each year presented due to changes in ownership, changes in limited partners’ or investor rights, and the creation or termination of funds and entities. Accordingly, such amounts may not be comparable for the periods presented, and in any event have no material impact on net income attributable to Ares Management Corporation.
Segment Analysis
For segment reporting purposes, revenues and expenses are presented before giving effect to the results of our Consolidated Funds and the results attributable to non-controlling interests of joint ventures that we consolidate. As a result, segment revenues from management fees, fee related performance revenues, performance income and investment income are different than those presented on a consolidated basis in accordance with GAAP. Revenues recognized from Consolidated Funds are eliminated in consolidation and those attributable to the non-controlling interests of joint ventures have been excluded by us. Furthermore, expenses and the effects of other income (expense) are different than related amounts presented on a consolidated basis in accordance with GAAP due to the exclusion of the results of Consolidated Funds and the non-controlling interests of joint ventures.
Non-GAAP Financial Measures
We use Realized Income (“RI”) as a non-GAAP profit measure in making operating decisions, assessing performance and allocating resources. Fee Related Earnings (“FRE”) is a component of RI that excludes realized activities associated with investment income and performance income.
FRE and RI should be considered in addition to and not in lieu of, the results of operations, which are discussed further under “—Components of Consolidated Results of Operations” and are prepared in accordance with GAAP. We operate through our distinct operating segments. On January 1, 2024, we changed our segment composition. The special opportunities strategy, historically part of the Private Equity Group, was renamed to opportunistic credit and integrated into the Credit Group. Historical results have been modified to conform with the current presentation. On December 1, 2024, we completed the WSM Acquisition. The acquired business is presented within the Real Assets Group within our North American real estate equity strategy, which we renamed from U.S. real estate equity following the WSM Acquisition. The strategy name change did not result in any change to the historical composition of our segments.
The following table sets forth FRE and RI by reportable segment and the OMG ($ in thousands):
| | | | | | | | | | | | | | | | | | | | | | | | | | | | | | | | |
| | | | | | | | | | | | |
| | | | | | | Year ended December 31, | | Favorable (Unfavorable) |
| | | | | | | | | | 2024 | | 2023 | | $ Change | | % Change |
| Fee Related Earnings: | | | | | | | | | | | | | | | | |
| Credit Group | | | | | | | | | | $ | 1,568,157 | | | $ | 1,317,012 | | | $ | 251,145 | | | 19% |
| Real Assets Group | | | | | | | | | | 212,106 | | | 218,807 | | | (6,701) | | | (3) |
| Private Equity Group | | | | | | | | | | 60,546 | | | 53,057 | | | 7,489 | | | 14 |
| Secondaries Group | | | | | | | | | | 126,172 | | | 104,387 | | | 21,785 | | | 21 |
| Other | | | | | | | | | | 15,686 | | | 8,530 | | | 7,156 | | | 84 |
| Operations Management Group | | | | | | | | | | (620,930) | | | (538,052) | | | (82,878) | | | (15) |
| Fee Related Earnings | | | | | | | | | | $ | 1,361,737 | | | $ | 1,163,741 | | | 197,996 | | | 17 |
| Realized Income: | | | | | | | | | | | | | | | | |
| Credit Group | | | | | | | | | | $ | 1,684,817 | | | $ | 1,445,315 | | | $ | 239,502 | | | 17% |
| Real Assets Group | | | | | | | | | | 223,842 | | | 217,195 | | | 6,647 | | | 3 |
| Private Equity Group | | | | | | | | | | 48,775 | | | 46,125 | | | 2,650 | | | 6 |
| Secondaries Group | | | | | | | | | | 119,940 | | | 101,056 | | | 18,884 | | | 19 |
| Other | | | | | | | | | | 10,304 | | | (6,703) | | | 17,007 | | | NM |
| Operations Management Group | | | | | | | | | | (620,558) | | | (537,460) | | | (83,098) | | | (15) |
| Realized Income | | | | | | | | | | $ | 1,467,120 | | | $ | 1,265,528 | | | 201,592 | | | 16 |
Income before provision for income taxes is the GAAP financial measure most comparable to RI. The following table presents the reconciliation of income before taxes as reported within the Consolidated Statements of Operations to RI and FRE of the reportable segments and the OMG ($ in thousands):
| | | | | | | | | | | | | | | |
| | | Year ended December 31, |
| | | | | 2024 | | 2023 |
| Income before taxes | | | | | $ | 1,275,352 | | | $ | 1,333,063 | |
| Adjustments: | | | | | | | |
| Depreciation and amortization expense | | | | | 157,341 | | | 233,185 | |
| Equity compensation expense | | | | | 352,851 | | | 255,419 | |
Acquisition-related compensation expense(1) | | | | | 38,150 | | | 7,334 | |
| | | | | | | |
| Acquisition and merger-related expense | | | | | 57,360 | | | 12,000 | |
| Placement fee adjustment | | | | | 5,715 | | | (5,819) | |
| Other (income) expense, net | | | | | (12,172) | | | 976 | |
| Income before taxes of non-controlling interests in consolidated subsidiaries | | | | | (22,267) | | | (17,249) | |
| Income before taxes of non-controlling interests in Consolidated Funds, net of eliminations | | | | | (302,846) | | | (278,119) | |
| Total performance income—unrealized | | | | | (109,533) | | | (305,370) | |
| Total performance related compensation—unrealized | | | | | 36,823 | | | 206,923 | |
| Total net investment income—unrealized | | | | | (9,654) | | | (176,815) | |
| Realized Income | | | | | 1,467,120 | | | 1,265,528 | |
| Total performance income—realized | | | | | (430,179) | | | (415,899) | |
| Total performance related compensation—realized | | | | | 281,301 | | | 282,406 | |
| Total net investment loss—realized | | | | | 43,495 | | | 31,706 | |
| Fee Related Earnings | | | | | $ | 1,361,737 | | | $ | 1,163,741 | |
(1)Represents bonus payments and contingent liabilities (“earnouts”) in connection with various acquisitions that are recorded as compensation expense and are presented within compensation and benefits within our Consolidated Statements of Operations.
For the specific components and calculations of these non-GAAP measures, as well as additional reconciliations to the most comparable measures in accordance with GAAP, see “Note 14. Segment Reporting” within our consolidated financial statements included in this Annual Report on Form 10-K. Discussed below are our results of operations for our reportable segments and the OMG.
Results of Operations by Segment
Credit Group—Year Ended December 31, 2024 Compared to Year Ended December 31, 2023
Fee Related Earnings
The following table presents the components of the Credit Group’s FRE ($ in thousands):
| | | | | | | | | | | | | | | | | | | | | | | | | | | | | | | |
| | | | | Year ended December 31, | | Favorable (Unfavorable) |
| | | | | | | | | 2024 | | 2023 | | $ Change | | % Change |
| Management fees | | | | | | | | | $ | 2,177,816 | | | $ | 1,853,326 | | | $ | 324,490 | | | 18% |
| Fee related performance revenues | | | | | | | | | 202,703 | | | 167,333 | | | 35,370 | | | 21 |
| Other fees | | | | | | | | | 41,819 | | | 36,640 | | | 5,179 | | | 14 |
| Compensation and benefits | | | | | | | | | (692,309) | | | (624,741) | | | (67,568) | | | (11) |
| General, administrative and other expenses | | | | | | | | | (161,872) | | | (115,546) | | | (46,326) | | | (40) |
| Fee Related Earnings | | | | | | | | | $ | 1,568,157 | | | $ | 1,317,012 | | | 251,145 | | | 19 |
Management Fees. The chart below presents Credit Group management fees and effective management fee rates ($ in millions):
The following table presents the components of and causes for changes in the Credit Group’s management fees for the year ended December 31, 2024 compared to the prior year ($ in millions):
| | | | | | | | | |
| | | Year-over-year
Change |
| Perpetual wealth vehicles: | | | |
| Fees from ARCC, ASIF and CADC, excluding Part I Fees, due to increases in the average portfolio size of their portfolios | | | $ | 105.3 | |
| Part I Fees from ASIF, ARCC and CADC, driven by an increase in the average size of their portfolios | | | 83.5 | |
| Part I Fees from our open-ended European direct lending fund that began generating fees during the first quarter of 2024 | | | 9.8 | |
| Capital deployment in private funds: | | | |
| Fees from SDL III, ACE VI and Pathfinder II, which all launched during the second quarter of 2023 | | | 80.7 | |
| Fees from Ares Senior Direct Lending Fund II, L.P. (“SDL II”), ASOF II, an open-ended core alternative credit fund and ACE V | | | 61.1 | |
Distributions that reduced the fee base of ASOF I and Ares Senior Direct Lending Fund, L.P. (“SDL I”) as the funds are past their investment periods | | | (22.0) | |
| Reduction in fee rate of ACE III | | | (21.0) | |
| Cumulative effect of other changes | | | 27.1 | |
| Total | | | $ | 324.5 | |
The increase in effective management fee rate for the year ended December 31, 2024 compared to the year ended December 31, 2023 was primarily driven by the increase in Part I Fees’ contribution to the effective management fee rate.
Fee Related Performance Revenues. The chart below presents fee related performance revenues, including the number of funds generating, for the Credit Group by strategy ($ in millions):
The increase in fee related performance revenues for the year ended December 31, 2024 compared to the year ended December 31, 2023 was primarily attributable to higher incentive fees earned from an open-ended core alternative credit fund, which increased its IGAUM over the current year measurement period.
Other Fees. The increase in other fees for the year ended December 31, 2024 compared to the year ended December 31, 2023 was primarily driven by higher administrative service fees of $7.7 million, which are earned from certain private funds that pay on invested capital.
Compensation and Benefits. The increase in compensation and benefits for the year ended December 31, 2024 compared to the year ended December 31, 2023 was primarily driven by higher Part I Fee compensation of $43.1 million, corresponding to the increase in Part I Fees. For the years ended December 31, 2024 and 2023, we reduced Part I Fee compensation by $11.7 million and $2.6 million, respectively, to reclaim a portion of the supplemental distribution fees that we paid to distribution partners. The increase in compensation and benefits compared to the prior year was also driven by: (i)
higher fee related performance compensation of $27.7 million, corresponding to the increase in fee related performance revenues; and (ii) an increase in salary expense of $11.0 million, primarily attributable to headcount growth to support the expansion of our business; partially offset by (iii) lower incentive-based compensation.
Average headcount increased by 12% to 672 investment and investment support professionals for the year-to-date period in 2024 from 602 professionals in 2023 as we continued to add professionals, primarily to support our growing direct lending and alternative credit platforms.
General, Administrative and Other Expenses. The increase in general, administrative and other expenses was primarily due to costs incurred to support distribution of shares in our perpetual wealth vehicles and fundraising for our funds. Supplemental distribution fees were $30.4 million for the year ended December 31, 2024 and increased by $18.6 million for the year ended December 31, 2024 compared to the prior year as we continue to develop our distribution relationships and expand our wealth product offerings. The increase in general, administrative and other expenses for the year ended December 31, 2024 compared to the prior year was also driven by fundraising related expenses including: (i) marketing costs of $5.7 million, largely attributable to fund formation costs for ACE VI and investor events, including our firmwide AGM event; and (ii) placement fees of $2.9 million, primarily due to new commitments to SDL III.
Additionally, certain expenses increased during the current year, including occupancy costs, information services and information technology costs. These expenses collectively increased by $8.4 million for the year ended December 31, 2024 compared to the prior year to support our growing headcount and the expansion of our business, including costs for our new corporate headquarters that we occupied beginning in third quarter of 2024. Separately, professional service fees rose by $8.0 million for the year ended December 31, 2024 compared to the prior year, primarily related to certain non-recurring legal fees.
Realized Income
The following table presents the components of the Credit Group’s RI ($ in thousands):
| | | | | | | | | | | | | | | | | | | | | | | | | | | | | | | |
| | | | Year ended December 31, | | Favorable (Unfavorable) |
| | | | | | | | | 2024 | | 2023 | | $ Change | | % Change |
| Fee Related Earnings | | | | | | | | | $ | 1,568,157 | | | $ | 1,317,012 | | | $ | 251,145 | | | 19% |
| Performance income—realized | | | | | | | | | 326,202 | | | 323,733 | | | 2,469 | | | 1 |
| Performance related compensation—realized | | | | | | | | | (207,794) | | | (211,976) | | | 4,182 | | | 2 |
| Realized net performance income | | | | | | | | | 118,408 | | | 111,757 | | | 6,651 | | | 6 |
| Investment income—realized | | | | | | | | | 21,159 | | | 36,490 | | | (15,331) | | | (42) |
| Interest income | | | | | | | | | 11,671 | | | 9,788 | | | 1,883 | | | 19 |
| Interest expense | | | | | | | | | (34,578) | | | (29,732) | | | (4,846) | | | (16) |
| | | | | | | | | | | | | | | |
| Realized net investment income (loss) | | | | | | | | | (1,748) | | | 16,546 | | | (18,294) | | | NM |
| Realized Income | | | | | | | | | $ | 1,684,817 | | | $ | 1,445,315 | | | 239,502 | | | 17 |
The Credit Group’s realized activities were principally composed of and caused by the following:
| | | | | | | | |
| Year ended December 31, 2024 | | Year ended December 31, 2023 |
| Realized net performance income | | |
Carried interest from: •Aggregate tax distributions of $74.7 million primarily from ACE IV, ACE V, PCS I, ASOF I and an alternative credit fund Incentive fees from: •Incentive fees of $31.3 million, primarily generated from (i) seven direct lending funds and five alternative credit funds with $5.1 billion of IGAUM generating returns in excess of their hurdle rates; and (ii) a U.S. CLO that was driven by the reset of its capital structure and extension of its reinvestment period | | Carried interest from: •Aggregate tax distributions of $70.2 million primarily from ASOF I, ACE IV, ACE V and PCS I Incentive fees from: •Incentive fees of $27.7 million, primarily generated from ten direct lending funds and six alternative credit funds with $5.5 billion of IGAUM generating returns in excess of their hurdle rates |
| Realized investment income and interest income | | |
•Distributions of investment income of $8.9 million generated from four liquid credit vehicles that are invested in the subordinated notes of CLOs •Distributions of investment income of $6.6 million from our investment in a U.S. direct lending fund •Interest income generated from 15 CLO investments of $4.6 million •Interest income earned on treasury-backed securities of $3.0 million, which is allocated among our segments based on the cost basis of our balance sheet investments | | •Distributions of investment income of $16.9 million from our investment in a commercial finance fund that was sold during the second quarter of 2023 •Distributions of investment income of $6.4 million generated from four liquid credit vehicles that are invested in the subordinated notes of CLOs •Interest income generated from 16 CLO investments of $5.3 million |
Interest expense, which is allocated among our segments based on the cost basis of our balance sheet investments, increased over the comparative periods primarily due to the issuance of the 2028 Senior Notes in November 2023 and 2054 Senior Notes in October 2024.
Credit Group—Performance Income
The following table presents the accrued carried interest, also referred to as accrued performance income, and related performance compensation for the Credit Group. Accrued net performance income excludes net performance income that has been realized but not yet received as of the reporting date ($ in millions):
| | | | | | | | | | | | | | | | | | | | | | | | | | | | | | | | | | | |
| | | |
| As of December 31, |
| 2024 | | 2023 |
| Accrued Performance Income | | Accrued Performance Compensation | | Accrued Net Performance Income | | Accrued Performance Income | | Accrued Performance Compensation | | Accrued Net Performance Income |
| Pathfinder I | $ | 191.4 | | | $ | 165.7 | | | $ | 25.7 | | | $ | 155.1 | | | $ | 131.9 | | | $ | 23.2 | |
| ASOF I | 318.4 | | | 223.2 | | | 95.2 | | | 357.0 | | | 250.2 | | | 106.8 | |
| ASOF II | 258.2 | | | 181.4 | | | 76.8 | | | 80.9 | | | 56.6 | | | 24.3 | |
| PCS I | 130.1 | | | 76.9 | | | 53.2 | | | 124.0 | | | 73.3 | | | 50.7 | |
| PCS II | 171.4 | | | 101.5 | | | 69.9 | | | 38.1 | | | 22.6 | | | 15.5 | |
| ACE IV | 168.8 | | | 109.6 | | | 59.2 | | | 149.6 | | | 97.1 | | | 52.5 | |
| ACE V | 286.6 | | | 180.9 | | | 105.7 | | | 232.2 | | | 146.2 | | | 86.0 | |
| ACE VI | 71.1 | | | 44.8 | | | 26.3 | | | 16.6 | | | 9.9 | | | 6.7 | |
| Other credit funds | 332.0 | | | 207.0 | | | 125.0 | | | 397.7 | | | 253.6 | | | 144.1 | |
| Total Credit Group | $ | 1,928.0 | | | $ | 1,291.0 | | | $ | 637.0 | | | $ | 1,551.2 | | | $ | 1,041.4 | | | $ | 509.8 | |
The following table presents the change in accrued performance income for the Credit Group ($ in millions):
| | | | | | | | | | | | | | | | | | | | | | | | | | | | | | | | | | | | | | | |
| | | | | | | | | | | |
| | | | | | | | | | | | | |
| | | | | | | | | | | | | |
| | | | | | | | | | | | | |
| | | | | | | | | | | | | |
| | | | | | | | | | | | | |
| | | | | | | | | | | | | |
| | | | | | | | | | | | | |
| | | | | | | | | | | | | |
| | | | | | | | | | | | | |
| | | | | As of December 31, 2023 | | Activity during the period | | As of December 31, 2024 | |
| | Waterfall Type | | Accrued Performance Income | | Change in Unrealized | | Realized | | Other Adjustments | | Accrued Performance Income | |
| Accrued Carried Interest | | | | | | | | | | | | | |
| Pathfinder I | | European | | $ | 155.1 | | | $ | 62.6 | | | $ | (26.3) | | | $ | — | | | $ | 191.4 | | |
| ASOF I | | European | | 357.0 | | | (23.7) | | | (14.9) | | | — | | | 318.4 | | |
| ASOF II | | European | | 80.9 | | | 177.3 | | | — | | | — | | | 258.2 | | |
| PCS I | | European | | 124.0 | | | 22.9 | | | (16.9) | | | 0.1 | | | 130.1 | | |
| PCS II | | European | | 38.1 | | | 131.1 | | | — | | | 2.2 | | | 171.4 | | |
| | | | | | | | | | | | | |
| ACE IV | | European | | 149.6 | | | 57.0 | | | (38.7) | | | 0.9 | | | 168.8 | | |
| ACE V | | European | | 232.2 | | | 153.2 | | | (101.1) | | | 2.3 | | | 286.6 | | |
| ACE VI | | European | | 16.6 | | | 54.5 | | | — | | | — | | | 71.1 | | |
| Other credit funds | | European | | 373.3 | | | (40.2) | | | (33.9) | | | (6.6) | | | 292.6 | | |
| Other credit funds | | American | | 24.4 | | | 12.5 | | | (8.1) | | | 10.6 | | | 39.4 | | |
| Total accrued carried interest | | | | 1,551.2 | | | 607.2 | | | (239.9) | | | 9.5 | | | 1,928.0 | | |
| | | | | | | | | | | | | |
| Other credit funds | | Incentive | | — | | | 86.3 | | | (86.3) | | | — | | | — | | |
| Total Credit Group | | | | $ | 1,551.2 | | | $ | 693.5 | | | $ | (326.2) | | | $ | 9.5 | | | $ | 1,928.0 | | |
Credit Group—Assets Under Management
The tables below present rollforwards of AUM for the Credit Group ($ in millions):
| | | | | | | | | | | | | | | | | | | | | | | | | | | | | | | | | | | | | | | | | | | | | | | | | | | | | |
| | | | | | | | | | | | | | | | | |
| | | | | | | | | | | | | | | | |
| | | | | | | | | | | | | | | | |
| | | | | | | | | | | | | | | | |
| | | | | | | | | | | | | | | | |
| | | | | | | | | | | | | | | | |
| | | | | | | | | | | | | | | | |
| | | | | | | | | | | | | | | | |
| | | | | | | | | | | | | | | | |
| | | | | | | | | | | | | | | | |
| | | | | | | | | | | | | | | | |
| | | | | | | | | | | | | | | | | |
| | | | | | | | | | | | | | | | | |
| | | | | | | | | | | | | | | | |
| | | | | | | | | | | | | | | | |
| | | | | | | | | | | | | | | | |
| | | | | | | | | | | | | | | | |
| | | | | | | | | | | | | | | | |
| | | | | | | | | | | | | | | | |
| | | | | | | | | | | | | | | | |
| | | | | | | | | | | | | | | | |
| | | | | | | | | | | | | | | | |
| | | | | | | | | | | | | | | | |
| | | | | | | | | | | | | | | | | |
| | Liquid
Credit | | Alternative
Credit | | Opportunistic
Credit | | U.S. Direct
Lending | | European
Direct Lending | | APAC
Credit | | Other(1) | | Total Credit
Group |
| Balance at 12/31/2023 | | $ | 47,299 | | | $ | 33,886 | | | $ | 14,554 | | | $ | 123,073 | | | $ | 68,264 | | | $ | 11,920 | | | $ | 354 | | | $ | 299,350 | |
| Acquisitions | | — | | | — | | | — | | | 362 | | | — | | | — | | | — | | | 362 | |
| Net new par/equity commitments | | 2,995 | | | 4,222 | | | 1,653 | | | 19,408 | | | 10,234 | | | 689 | | | 142 | | | 39,343 | |
| Net new debt commitments | | 6,615 | | | 250 | | | — | | | 21,010 | | | 1,773 | | | (380) | | | — | | | 29,268 | |
| Capital reductions | | (7,011) | | | (30) | | | (1,022) | | | (2,608) | | | 55 | | | 70 | | | — | | | (10,546) | |
| Distributions | | (403) | | | (1,854) | | | (1,088) | | | (6,183) | | | (6,134) | | | (1,202) | | | — | | | (16,864) | |
| Redemptions | | (3,390) | | | (150) | | | — | | | (1,572) | | | (140) | | | — | | | — | | | (5,252) | |
| Net allocations among investment strategies | | (18) | | | 2,824 | | | 25 | | | 25 | | | 200 | | | — | | | (228) | | | 2,828 | |
| Change in fund value | | 808 | | | 2,417 | | | 842 | | | 5,614 | | | 308 | | | 373 | | | 7 | | | 10,369 | |
| Balance at 12/31/2024 | | $ | 46,895 | | | $ | 41,565 | | | $ | 14,964 | | | $ | 159,129 | | | $ | 74,560 | | | $ | 11,470 | | | $ | 275 | | | $ | 348,858 | |
| | | | | | | | | | | | | | | | |
| | Liquid
Credit | | Alternative
Credit | | Opportunistic
Credit | | U.S. Direct
Lending | | European
Direct Lending | | APAC
Credit | | Other(1) | | Total Credit
Group |
| Balance at 12/31/2022 | | $ | 43,864 | | | $ | 21,363 | | | $ | 13,720 | | | $ | 98,327 | | | $ | 50,642 | | | $ | 11,383 | | | $ | — | | | $ | 239,299 | |
| | | | | | | | | | | | | | | | |
| Net new par/equity commitments | | 2,808 | | | 8,351 | | | — | | | 15,960 | | | 12,508 | | | 387 | | | 379 | | | 40,393 | |
| Net new debt commitments | | 1,978 | | | 400 | | | — | | | 8,492 | | | 3,826 | | | 201 | | | — | | | 14,897 | |
| Capital reductions | | (858) | | | — | | | — | | | (1,935) | | | (1,065) | | | — | | | — | | | (3,858) | |
| Distributions | | (319) | | | (1,484) | | | (499) | | | (2,976) | | | (1,977) | | | (429) | | | — | | | (7,684) | |
| Redemptions | | (2,069) | | | (984) | | | — | | | (290) | | | (2) | | | — | | | — | | | (3,345) | |
| Net allocations among investment strategies | | (33) | | | 4,291 | | | — | | | — | | | — | | | 25 | | | (25) | | | 4,258 | |
| Change in fund value | | 1,928 | | | 1,949 | | | 1,333 | | | 5,495 | | | 4,332 | | | 353 | | | — | | | 15,390 | |
| Balance at 12/31/2023 | | $ | 47,299 | | | $ | 33,886 | | | $ | 14,554 | | | $ | 123,073 | | | $ | 68,264 | | | $ | 11,920 | | | $ | 354 | | | $ | 299,350 | |
| | | | | | | | | | | | | | | | | |
| (1) Activity within Other represents equity commitments to the platform that either have not yet been allocated to an investment strategy or have been allocated in a subsequent period as commitments to an investment strategy. |
The components of our AUM for the Credit Group are presented below ($ in billions):
| | | | | | | | | | | | | | | | | | | | |
| | FPAUM | | AUM not yet paying fees | | Non-fee paying(1) |
(1) Includes $14.4 billion and $15.1 billion of AUM of funds from which we indirectly earn management fees as of December 31, 2024 and 2023, respectively, and includes $2.0 billion and $1.8 billion of non-fee paying AUM from our general partner and employee commitments as of December 31, 2024 and 2023, respectively.
Credit Group—Fee Paying AUM
The tables below present rollforwards of fee paying AUM for the Credit Group ($ in millions):
| | | | | | | | | | | | | | | | | | | | | | | | | | | | | | | | | | | | | | | | | | | | | | |
| | | | | | | | | | | | | | | | |
| | | | | | | | | | | | | | | |
| | | | | | | | | | | | | | | |
| | | | | | | | | | | | | | | |
| | | | | | | | | | | | | | | |
| | | | | | | | | | | | | | | |
| | | | | | | | | | | | | | | |
| | | | | | | | | | | | | | | |
| | | | | | | | | | | | | | | |
| | | | | | | | | | | | | | | |
| | | | | | | | | | | | | | | |
| | | | | | | | | | | | | | | |
| | | | | | | | | | | | | | | | |
| | | | | | | | | | | | | | | | |
| | | | | | | | | | | | | | | |
| | | | | | | | | | | | | | | | |
| | | | | | | | | | | | | | | |
| | | | | | | | | | | | | | | |
| | | | | | | | | | | | | | | |
| | | | | | | | | | | | | | | |
| | | | | | | | | | | | | | | |
| | | | | | | | | | | | | | | |
| | | | | | | | | | | | | | | |
| | | | | | | | | | | | | | | |
| | | | | | | | | | | | | | | |
| | | | | | | | | | | | | | | | |
| Liquid
Credit | | Alternative
Credit | | Opportunistic
Credit | | U.S. Direct
Lending | | European
Direct Lending | | APAC
Credit | | | | Total Credit
Group |
| Balance at 12/31/2023 | $ | 46,140 | | | $ | 23,218 | | | $ | 8,490 | | | $ | 67,596 | | | $ | 34,246 | | | $ | 5,590 | | | | | $ | 185,280 | |
| Acquisitions | — | | | — | | | — | | | 244 | | | — | | | — | | | | | 244 | |
| Commitments | 7,897 | | | — | | | — | | | 11,088 | | | 300 | | | 41 | | | | | 19,326 | |
| Deployment/subscriptions/increase in leverage | 114 | | | 4,024 | | | 573 | | | 17,482 | | | 6,326 | | | 960 | | | | | 29,479 | |
| Capital reductions | (6,859) | | | — | | | — | | | (2,929) | | | (2,133) | | | (51) | | | | | (11,972) | |
| Distributions | (396) | | | (1,280) | | | (1,164) | | | (9,316) | | | (1,462) | | | (1,225) | | | | | (14,843) | |
| Redemptions | (3,410) | | | (150) | | | — | | | (452) | | | (1,240) | | | — | | | | | (5,252) | |
| Net allocations among investment strategies | (18) | | | 3,471 | | | — | | | — | | | — | | | — | | | | | 3,453 | |
| Change in fund value | 1,161 | | | 101 | | | — | | | 2,702 | | | (1,537) | | | (283) | | | | | 2,144 | |
| Change in fee basis | — | | | — | | | — | | | — | | | 1,286 | | | — | | | | | 1,286 | |
| Balance at 12/31/2024 | $ | 44,629 | | | $ | 29,384 | | | $ | 7,899 | | | $ | 86,415 | | | $ | 35,786 | | | $ | 5,032 | | | | | $ | 209,145 | |
| | | | | | | | | | | | | | | | |
| Liquid
Credit | | Alternative
Credit | | Opportunistic
Credit | | U.S. Direct
Lending | | European
Direct Lending | | APAC
Credit | | | | Total Credit
Group |
| Balance at 12/31/2022 | $ | 42,191 | | | $ | 15,904 | | | $ | 7,166 | | | $ | 57,568 | | | $ | 29,561 | | | $ | 6,051 | | | | | $ | 158,441 | |
| | | | | | | | | | | | | | | |
| Commitments | 4,958 | | | 65 | | | — | | | 3,068 | | | — | | | 242 | | | | | 8,333 | |
| Deployment/subscriptions/increase in leverage | 282 | | | 5,463 | | | 2,518 | | | 11,246 | | | 5,554 | | | 1,156 | | | | | 26,219 | |
| Capital reductions | (892) | | | — | | | — | | | (2,304) | | | (268) | | | (193) | | | | | (3,657) | |
| Distributions | (335) | | | (1,913) | | | (1,194) | | | (3,707) | | | (450) | | | (1,522) | | | | | (9,121) | |
| Redemptions | (2,067) | | | (901) | | | — | | | (305) | | | (1,201) | | | — | | | | | (4,474) | |
| Net allocations among investment strategies | (33) | | | 4,396 | | | — | | | — | | | — | | | — | | | | | 4,363 | |
| Change in fund value | 2,036 | | | 204 | | | — | | | 2,030 | | | 1,050 | | | (144) | | | | | 5,176 | |
| | | | | | | | | | | | | | | |
| Balance at 12/31/2023 | $ | 46,140 | | | $ | 23,218 | | | $ | 8,490 | | | $ | 67,596 | | | $ | 34,246 | | | $ | 5,590 | | | | | $ | 185,280 | |
| | | | | | | | | | | | | | | | |
|
The charts below present FPAUM for the Credit Group by its fee bases ($ in billions):
| | | | | | | | | | | | | | |
| FPAUM: $209.2 | | FPAUM: $185.3 | |
| | | | | | | | | | | | | | | | | | | | | | | | | |
| Invested capital | | Market value(1) | | Collateral balances (at par) | | Capital commitments | | |
(1)Includes $46.4 billion and $35.4 billion from funds that primarily invest in illiquid strategies as of December 31, 2024 and 2023, respectively. The underlying investments held in these funds are generally subject to less market volatility than investments held in liquid strategies.
Credit Group—Fund Performance Metrics as of December 31, 2024
ARCC contributed approximately 34% of the Credit Group’s total management fees for the year ended December 31, 2024. In addition, the Credit Group’s other significant funds, which are presented in the tables below, collectively contributed approximately 34% of the Credit Group’s management fees for the year ended December 31, 2024.
The following table presents the performance data for our significant funds that are not drawdown funds in the Credit Group as of December 31, 2024 ($ in millions):
| | | | | | | | | | | | | | | | | | | | | | | | | | | | | | | | | | | | | | | | | | | | | | | | |
| | | | | | | | | | | Returns(%) | | |
| | Year of Inception | | AUM | | | | Year-To-Date | | Since Inception(1) | | Primary
Investment Strategy |
| Fund | | | | | | | | Gross | | Net | | Gross | | Net | |
ARCC(2) | | 2004 | | $ | 32,302 | | | | | | | N/A | | 13.8 | | | N/A | | 12.1 | | | U.S. Direct Lending |
CADC(3) | | 2017 | | 7,208 | | | | | | | N/A | | 10.2 | | | N/A | | 6.9 | | | U.S. Direct Lending |
Open-ended core alternative credit fund(4) | | 2021 | | 5,841 | | | | | | | 14.6 | | | 10.9 | | | 11.6 | | | 8.6 | | | Alternative Credit |
ASIF(3) | | 2023 | | 13,711 | | | | | | | N/A | | 11.4 | | | N/A | | 11.8 | | | U.S. Direct Lending |
(1)Since inception returns are annualized.
(2)Returns are time-weighted rates of return and include the reinvestment of income and other earnings from securities or other investments and reflect the deduction of all trading expenses. Net returns are calculated using the fund’s NAV and assume dividends are reinvested at the closest quarter-end NAV to the relevant quarterly ex-dividend dates. Additional information related to ARCC can be found in its filings with the SEC, which are not part of this report.
(3)Returns are time-weighted rates of return and include the reinvestment of income and other earnings from securities or other investments and reflect the deduction of all trading expenses. Returns are shown for institutional share class. Shares of other classes may have lower returns due to higher selling commissions and fees. Net returns are calculated using the fund’s NAV and assume distributions are reinvested at the NAV on the date of distribution. Additional information related to CADC and ASIF can be found in its filings with the SEC, which are not part of this report.
(4)Returns are time-weighted rates of return and include the reinvestment of income and other earnings from securities or other investments and reflect the deduction of all trading expenses. The fund is made up of a Main Class (“Class M”) and a Constrained Class (“Class C”). Class M includes investors electing to participate in all investments and Class C includes investors electing to be excluded from exposure to liquid investments. Returns presented in the table are for onshore Class M. The current quarter gross and net returns for Class M (offshore) are 2.9% and 2.0%, respectively. The year-to-date gross and net returns for Class M (offshore) are 14.9% and 10.4%, respectively. The since inception gross and net returns for Class M (offshore) are 11.6% and 8.2%, respectively. The current quarter gross and net returns for Class C (offshore) are 2.9% and 1.6%, respectively. The year-to-date gross and net returns for Class C (offshore) are 13.6% and 9.2%, respectively. The since inception gross and net returns for Class C (offshore) are 11.3% and 8.0%, respectively.
The following table presents the performance data of the Credit Group’s significant drawdown funds as of December 31, 2024 ($ in millions):
| | | | | | | | | | | | | | | | | | | | | | | | | | | | | | | | | | | | | | | | | | | | | | | | | | | | | | | | | | | | | | | | | | | | | | | |
| Year of Inception | | AUM | | Original Capital Commitments | | Capital Invested to Date | | Realized Value(1) | | Unrealized Value(2) | | Total Value | | MoIC | | IRR(%) | | Primary Investment Strategy |
| Fund | | | | | | | | Gross(3) | | Net(4) | | Gross(5) | | Net(6) | |
| Funds Harvesting Investments | | | | | | | | | | | | | | | | | | | | |
ACE IV Unlevered(7) | 2018 | | $ | 8,252 | | | $ | 2,851 | | | $ | 2,190 | | | $ | 1,402 | | | $ | 1,441 | | | $ | 2,843 | | | 1.4x | | 1.3x | | 8.2 | | 5.9 | | European Direct Lending |
ACE IV Levered(7) | | | 4,819 | | | 3,728 | | | 2,377 | | | 2,881 | | | 5,258 | | | 1.5x | | 1.4x | | 11.4 | | 8.2 | |
| Pathfinder I | 2020 | | 4,227 | | | 3,683 | | | 3,177 | | | 566 | | | 3,503 | | | 4,069 | | | 1.4x | | 1.3x | | 15.3 | | 11.0 | | Alternative Credit |
| SDL II Unlevered | 2021 | | 16,396 | | | 1,989 | | | 1,529 | | | 274 | | | 1,537 | | | 1,811 | | | 1.2x | | 1.2x | | 12.1 | | 9.6 | | U.S. Direct Lending |
| SDL II Levered | | | 6,047 | | | 4,269 | | | 1,222 | | | 4,283 | | | 5,505 | | | 1.4x | | 1.3x | | 19.2 | | 14.6 | |
| Funds Deploying Capital | | | | | | | | | | | | | | | | | | | | | | |
| PCS II | 2020 | | 6,023 | | | 5,114 | | | 3,552 | | | 907 | | | 3,572 | | | 4,479 | | | 1.3x | | 1.2x | | 12.5 | | 8.6 | | U.S. Direct Lending |
ACE V Unlevered(8) | 2020 | | 16,256 | | | 7,026 | | | 5,194 | | | 1,058 | | | 5,198 | | | 6,256 | | | 1.3x | | 1.2x | | 11.3 | | 8.4 | | European Direct Lending |
ACE V Levered(8) | | | 6,376 | | | 4,693 | | | 1,504 | | | 4,835 | | | 6,339 | | | 1.4x | | 1.3x | | 15.9 | | 11.9 | |
| ASOF II | 2021 | | 8,596 | | | 7,128 | | | 4,725 | | | 13 | | | 5,939 | | | 5,952 | | | 1.4x | | 1.3x | | 18.8 | | 13.6 | | Opportunistic Credit |
ACE VI Unlevered(9) | 2022 | | 20,086 | | | 7,439 | | | 1,197 | | | 29 | | | 1,282 | | | 1,311 | | | 1.1x | | 1.1x | | 21.7 | | 15.9 | | European Direct Lending |
ACE VI Levered(9) | | | 9,667 | | | 2,943 | | | 119 | | | 3,179 | | | 3,298 | | | 1.2x | | 1.1x | | 23.0 | | 16.1 | |
| SDL III Unlevered | 2023 | | 23,121 | | | 3,311 | | | 747 | | | 6 | | | 771 | | | 777 | | | 1.1x | | 1.0x | | NM | | NM | | U.S. Direct Lending |
| SDL III Levered | | | 11,959 | | | 2,038 | | | 47 | | | 2,175 | | | 2,222 | | | 1.1x | | 1.1x | | NM | | NM | |
(1)For funds other than our opportunistic credit funds, realized value represent the sum of all cash distributions to all partners and if applicable, exclude tax and incentive distributions made to the general partner. For our opportunistic credit funds, realized value represent the sum of all cash distributions to the fee-paying limited partners and if applicable, exclude tax and incentive distributions made to the general partner.
(2)Unrealized value represents the fund's NAV reduced by the accrued incentive allocation, if applicable. There can be no assurance that unrealized values will be realized at the valuations indicated. For funds other than our opportunistic credit funds, the unrealized value is based on all partners. For our opportunistic credit funds, the unrealized value is based on the fee-paying limited partners.
(3)The gross multiple of invested capital (“MoIC”) is calculated at the fund-level and is based on the interests of the fee-paying limited partners and if applicable, excludes interests attributable to the non-fee paying limited partners and/or the general partner which does not pay management fees or carried interest. The gross MoIC is before giving effect to management fees, carried interest and other expenses, as applicable, but after giving effect to credit facility interest expenses, as applicable. The funds may utilize a credit facility during the investment period and for general cash management purposes. Early in the life of a fund, the gross fund-level MoICs would generally have been lower had such fund called capital from its limited partners instead of utilizing the credit facility.
(4)The net MoIC is calculated at the fund-level and is based on the interests of the fee-paying limited partners and if applicable, excludes those interests attributable to the non-fee paying limited partners and/or the general partner which does not pay management fees or carried interest. The net MoIC is after giving effect to management fees and carried interest, other expenses and credit facility interest expenses, as applicable. The funds may utilize a credit facility during the investment period and for general cash management purposes. Early in the life of a fund, the net fund-level MoICs would generally have been lower had such fund called capital from its limited partners instead of utilizing the credit facility.
(5)The gross IRR is an annualized since inception gross internal rate of return of cash flows to and from the fund and the fund’s residual value at the end of the measurement period. Gross IRR reflects returns to the fee-paying limited partners and, if applicable, excludes interests attributable to the non-fee paying limited partners and/or the general partner which does not pay management fees or carried interest. The cash flow dates used in the gross IRR calculation are based on the actual dates of the cash flows. The gross IRRs are calculated before giving effect to management fees, carried interest and other expenses, as applicable, but after giving effect to credit facility interest expenses, as applicable. The funds may utilize a credit facility during the investment period and for general cash management purposes. Gross fund-level IRRs would generally have been lower had such fund called capital from its limited partners instead of utilizing the credit facility.
(6)The net IRR is an annualized since inception net internal rate of return of cash flows to and from the fund and the fund’s residual value at the end of the measurement period. Net IRRs reflect returns to the fee-paying limited partners and, if applicable, exclude interests attributable to the non-fee paying limited partners and/or the general partner which does not pay management fees or carried interest. The cash flow dates used in the net IRR calculations are based on the actual dates of the cash flows. The net IRRs are calculated after giving effect to management fees and carried interest, other expenses and credit facility interest expenses, as applicable. The funds may utilize a credit facility during the investment period and for general cash management purposes. Net fund-level IRRs would generally have been lower had such fund called capital from its limited partners instead of utilizing the credit facility.
(7)ACE IV is made up of four parallel funds, two denominated in Euros and two denominated in pound sterling: ACE IV (E) Unlevered, ACE IV (G) Unlevered, ACE IV (E) Levered and ACE IV (G) Levered and one feeder fund: ACE IV (D) Levered. ACE IV (E) Levered includes the ACE IV (D) Levered feeder fund. The gross and net IRR and MoIC presented in the table are for ACE IV (E) Unlevered and ACE IV (E) Levered. Metrics for ACE IV (E) Levered exclude the U.S. dollar denominated feeder fund. The gross and net IRR for ACE IV (G) Unlevered are 9.7% and 7.1%, respectively. The gross and net MoIC for ACE IV (G) Unlevered are 1.5x and 1.4x, respectively. The gross and net IRR for ACE IV (G) Levered are 12.7% and 9.1%, respectively. The gross and net MoIC for ACE IV (G) Levered are 1.6x and 1.4x, respectively. The gross and net IRR for ACE IV (D) Levered are 12.9% and 9.5%, respectively. The gross and net MoIC for ACE IV (D) Levered are 1.6x and 1.5x, respectively. Original capital commitments are converted to U.S. dollars at the prevailing exchange rate at the time of the fund’s closing. All other values for ACE IV Unlevered and ACE IV Levered are for the combined levered and unlevered parallel funds and are converted to U.S. dollars at the prevailing quarter-end exchange rate.
(8)ACE V is made up of four parallel funds, two denominated in Euros and two denominated in pound sterling: ACE V (E) Unlevered, ACE V (G) Unlevered, ACE V (E) Levered, and ACE V (G) Levered, and two feeder funds: ACE V (D) Levered and ACE V (Y) Unlevered. ACE V (E) Levered includes the ACE V (D) Levered feeder fund and ACE V (E) Unlevered includes the ACE V (Y) Unlevered feeder fund. The gross and net IRR and gross and net MoIC presented in the table are for ACE V (E) Unlevered and ACE V (E) Levered. Metrics for ACE V (E) Levered exclude the ACE V (D) Levered feeder fund and metrics for ACE V (E) Unlevered exclude the ACE V (Y) Unlevered feeder fund. The gross and net IRR for ACE V (G) Unlevered are 12.7% and 9.5%, respectively. The gross and net MoIC for ACE V (G) Unlevered are 1.3x and 1.3x, respectively. The gross and net IRR for ACE V (G) Levered are 16.9% and 12.3%, respectively. The gross and net MoIC for ACE V (G) Levered are 1.4x and 1.3x, respectively. The gross and net IRR for ACE V (D) Levered are 15.7% and 11.7%, respectively. The gross and net MoIC for ACE V (D) Levered are 1.4x and 1.3x, respectively. The gross and net IRR for ACE V (Y) Unlevered are 12.0% and 8.8%, respectively. The gross and net MoIC for ACE V (Y) Unlevered are 1.3x and 1.2x, respectively. Original capital commitments are converted to U.S. dollars at the prevailing exchange rate at the time of the fund's closing. All other values for ACE V Unlevered and ACE V Levered are for the combined levered and unlevered parallel funds and are converted to U.S. dollars at the prevailing quarter-end exchange rate.
(9)ACE VI is made up of six parallel funds, four denominated in Euros and two denominated in pound sterling: ACE VI (E) Unlevered, ACE VI (E) II Unlevered, ACE VI (G) Unlevered, ACE VI (E) Levered, ACE VI (E) II Levered, and ACE VI (G) Levered, and three feeder funds: ACE VI (D) Levered, ACE VI (Y) Unlevered and ACE VI (D) Rated Notes. ACE VI (E) II Levered includes ACE VI (D) Levered feeder fund and ACE VI (E) II Unlevered includes ACE VI (Y) Unlevered and ACE VI (D) Rated Notes feeder funds. The gross and net IRR and gross and net MoIC presented in the table are for ACE VI (E) Unlevered and ACE VI (E) Levered. Metrics for ACE VI (E) II Levered exclude the ACE VI (D) Levered feeder fund and metrics for ACE VI (E) II Unlevered exclude ACE VI (Y) Unlevered and ACE VI (D) Rated Notes feeder funds. The gross and net IRR for ACE VI (G) Unlevered are 22.2% and 15.9%, respectively. The gross and net MoIC for ACE VI (G) Unlevered are 1.1x and 1.1x, respectively. The gross and net IRR for ACE VI (G) Levered are 18.9% and 7.7%, respectively. The gross and net MoIC for ACE VI (G) Levered are 1.1x and 1.1x, respectively. The gross and net IRR for ACE VI (E) II Unlevered are 22.4% and 17.5%, respectively. The gross and net MoIC for ACE VI (E) II Unlevered are 1.1x and 1.1x, respectively. The gross and net IRR for ACE VI (E) II Levered are 20.9% and 14.9%, respectively. The gross and net MoIC for ACE VI (E) II Levered are 1.1x and 1.1x, respectively. The gross and net IRR for ACE VI (D) Levered are 23.5% and 17.0%, respectively. The gross and net MoIC for ACE VI (D) Levered are 1.1x and 1.1x, respectively. The gross and net IRR for ACE VI (Y) Unlevered are 15.8% and 11.1%, respectively. The gross and net MoIC for ACE VI (Y) Unlevered are 1.1x and 1.1x, respectively. The gross and net IRR for ACE VI (D) Rated Notes are 26.0% and 14.0%, respectively. The gross and net MoIC for ACE VI (D) Rated Notes are 1.2x and 1.1x, respectively. Original capital commitments are converted to U.S. dollars at the prevailing exchange rate at the time of the fund's closing. All other values for ACE VI Unlevered and ACE VI Levered are for the combined levered and unlevered parallel funds and are converted to U.S. dollars at the prevailing quarter-end exchange rate.
Real Assets Group—Year Ended December 31, 2024 Compared to Year Ended December 31, 2023
Fee Related Earnings
The following table presents the components of the Real Assets Group’s FRE ($ in thousands):
| | | | | | | | | | | | | | | | | | | | | | | | | | | | | | | |
| | | | | | | | | | | | | | | |
| | | | | Year ended December 31, | | Favorable (Unfavorable) |
| | | | | | | | | 2024 | | 2023 | | $ Change | | % Change |
| Management fees | | | | | | | | | $ | 401,968 | | | $ | 389,437 | | | $ | 12,531 | | | 3% |
| Fee related performance revenues | | | | | | | | | — | | | 334 | | | (334) | | | (100) |
| Other fees | | | | | | | | | 27,263 | | | 29,695 | | | (2,432) | | | (8) |
| Compensation and benefits | | | | | | | | | (160,357) | | | (153,870) | | | (6,487) | | | (4) |
| General, administrative and other expenses | | | | | | | | | (56,768) | | | (46,789) | | | (9,979) | | | (21) |
| Fee Related Earnings | | | | | | | | | $ | 212,106 | | | $ | 218,807 | | | (6,701) | | | (3) |
Management Fees. The chart below presents Real Assets Group management fees and effective management fee rates ($ in millions):
The following table presents the components of and causes for changes in the Real Assets Group’s management fees for the year ended December 31, 2024 compared to the prior year ($ in millions):
| | | | | | | | | |
| | | Year-over-year Change |
| Capital commitments: | | | |
| Fees from Ares U.S. Real Estate Opportunity Fund IV, L.P. (“AREOF IV”) and our second climate infrastructure fund, excluding catch-up fees | | | $ | 14.7 | |
| Fees from our fourth European value-add real estate equity fund (excluding catch-up fees), which launched during the second quarter of 2024 | | | 4.1 | |
| Catch-up fees | | | 5.7 | |
| Capital deployment in IDF V | | | 8.6 | |
| Fees from the WSM Acquisition effective December 1, 2024 | | | 2.1 | |
| Distributions that reduced the fee bases of Infrastructure Debt Fund IV, L.P. (“IDF IV”) and Infrastructure Debt Fund III, L.P. (“IDF III”) as the funds are past their investment periods | | | (9.2) | |
| Decrease in NAV of our industrial non-traded REIT due to lower valuations of certain properties | | | (8.1) | |
| Contractual reduction in the fee base of AREOF III that was triggered at the expiration of the fund’s investment period at the end of the fourth quarter of 2023 | | | (4.6) | |
| Cumulative effect of other changes | | | (0.8) | |
| Total | | | $ | 12.5 | |
The increase in effective management fee rate for the year ended December 31, 2024 compared to the prior year was primarily driven by the deployment of capital within our real estate equity funds. Certain of our private real estate equity funds pay a fee on committed capital that increases once that capital is invested. As a result, our effective management fee rate increases as capital is deployed.
Other Fees. The decrease in other fees for the year ended December 31, 2024 compared to the prior year was driven by: (i) lower credit transaction fees of $8.1 million from the infrastructure debt strategy, which are infrequent in nature; partially offset by (ii) higher administrative service fees of $1.7 million, mostly from certain infrastructure debt funds that started paying such fees to us subsequent to the third quarter of 2023; and (iii) higher property management and development fees of $3.5 million resulting from an increase in property-related activities within certain North American real estate equity funds.
Compensation and Benefits. The increase in compensation and benefits for the year ended December 31, 2024 compared to the year ended December 31, 2023 was primarily driven by (i) an increase in salary expenses of $7.4 million, primarily attributable to headcount growth to support the expansion of our business; and (ii) an increase in payroll-related taxes of $2.8 million, primarily due to the higher stock price associated with equity awards that vested during the first quarter of 2024; partially offset by (iii) lower incentive-based compensation; and (iv) higher administrative fees reimbursement of expenses for increased services provided throughout the current year.
Average headcount increased by 10% to 391 investment and investment support professionals for the year-to-date period in 2024 from 356 professionals for the same period in 2023.
General, Administrative and Other Expenses. The increase in general, administrative and other expenses for the year ended December 31, 2024 compared to the year ended December 31, 2023 was primarily due to marketing and fundraising activities, including supplemental distribution fees charged in connection with an amended servicing arrangement with a distribution partner. Supplemental distribution fees increased by $3.3 million for the year ended December 31, 2024 compared to the prior year. Other marketing costs also increased by $2.0 million over the comparative periods, driven by: (i) investor events, including our firmwide AGM event; and (ii) fund formation costs for AREOF IV.
In addition, certain expenses increased for the year ended December 31, 2024 compared to the prior year, including: (i) higher information technology costs related to software license fees of $3.1 million; and (ii) higher professional service fees of $2.0 million, which included non-recurring legal expenses of $1.5 million incurred during the first quarter of 2024.
Realized Income
The following table presents the components of the Real Assets Group’s RI ($ in thousands):
| | | | | | | | | | | | | | | | | | | | | | | | | | | | | | | |
| | | | | | | | | | | | | | | |
| | | | | Year ended December 31, | | Favorable (Unfavorable) |
| | | | | | | | | 2024 | | 2023 | | $ Change | | % Change |
| Fee Related Earnings | | | | | | | | | $ | 212,106 | | | $ | 218,807 | | | $ | (6,701) | | | (3)% |
| Performance income—realized | | | | | | | | | 60,317 | | | 20,990 | | | 39,327 | | | 187 |
| Performance related compensation—realized | | | | | | | | | (37,283) | | | (12,768) | | | (24,515) | | | (192) |
| Realized net performance income | | | | | | | | | 23,034 | | | 8,222 | | | 14,812 | | | 180 |
| Investment income—realized | | | | | | | | | 5,184 | | | 3,392 | | | 1,792 | | | 53 |
| Interest income | | | | | | | | | 7,649 | | | 3,165 | | | 4,484 | | | 142 |
| Interest expense | | | | | | | | | (24,131) | | | (16,391) | | | (7,740) | | | (47) |
| | | | | | | | | | | | | | | |
| Realized net investment loss | | | | | | | | | (11,298) | | | (9,834) | | | (1,464) | | | (15) |
| Realized Income | | | | | | | | | $ | 223,842 | | | $ | 217,195 | | | 6,647 | | | 3 |
The Real Assets Group’s realized activities were principally composed of and caused by the following:
| | | | | | | | |
| Year ended December 31, 2024 | | Year ended December 31, 2023 |
| Realized net performance income | | |
Carried interest from: •Distributions of $8.8 million from U.S. Real Estate Fund VIII, L.P. (“US VIII”) and a North American real estate equity fund, which are both European-style waterfall funds that are past their investment periods and monetizing investments •Realized gains of $3.1 million from the partial sale of ACIP’s investment in a renewable energy company Incentive fees from: •An industrial North American real estate equity fund of $8.7 million, that is based upon a three-year measurement period •An open-ended industrial real estate fund of $2.1 million, that varies based upon a three-year measurement period calculated for each fund investor | | Carried interest from: •Distributions of $1.8 million from US VIII and a North American real estate equity fund, which are both European-style waterfall funds that are past their investment periods and monetizing investments Incentive fees from: •Incentive fees of $5.7 million generated from an open-ended industrial real estate fund that varies based upon a three-year measurement period calculated for each fund investor |
| Realized investment income and interest income | | |
•Distributions of investment income of $15.6 million, primarily from funds within our real estate debt and infrastructure debt strategies •Interest income earned on treasury-backed securities of $2.1 million, which is allocated among our segments based on the cost basis of our balance sheet investments •Interest earned from loans that we made within our real estate debt strategy •Realized gains of $1.2 million from the sale of an infrastructure opportunities fund’s investment in a wind energy company •Realized loss of $12.4 million associated with a guarantee of a credit facility provided in connection with a historical acquisition | | •Distributions of investment income of $7.8 million, primarily from funds within our real estate debt, infrastructure debt and infrastructure opportunities strategies •Realized losses of $6.2 million from a real estate debt vehicle, where interest expense was incurred with no associated investment income during the periods. These realized losses are not expected to recur as we restructured the arrangement in the fourth quarter of 2023 |
Interest expense, which is allocated among our segments based on the cost basis of our balance sheet investments, increased over the comparative periods primarily due to the issuance of the 2028 Senior Notes in November 2023 and 2054 Senior Notes in October 2024.
Real Assets Group—Performance Income
The following table presents the accrued carried interest, also referred to as accrued performance income, and related performance compensation for the Real Assets Group. Accrued net performance income excludes net performance income that has been realized but not yet received as of the reporting date ($ in millions):
| | | | | | | | | | | | | | | | | | | | | | | | | | | | | | | | | | | |
| | | |
| As of December 31, |
| 2024 | | 2023 |
| Accrued Performance Income | | Accrued Performance Compensation | | Accrued Net Performance Income | | Accrued Performance Income | | Accrued Performance Compensation | | Accrued Net Performance Income |
| US VIII | $ | 20.1 | | | $ | 12.9 | | | $ | 7.2 | | | $ | 32.2 | | | $ | 20.7 | | | $ | 11.5 | |
| US IX | 99.8 | | | 61.9 | | | 37.9 | | | 90.0 | | | 55.8 | | | 34.2 | |
| AREOF III | 24.5 | | | 14.8 | | | 9.7 | | | 35.7 | | | 21.4 | | | 14.3 | |
| EF IV | 22.9 | | | 13.7 | | | 9.2 | | | 49.2 | | | 29.5 | | | 19.7 | |
| EIF V | 121.3 | | | 90.7 | | | 30.6 | | | 93.6 | | | 70.0 | | | 23.6 | |
| IDF V | 113.7 | | | 69.3 | | | 44.4 | | | 56.1 | | | 33.7 | | | 22.4 | |
| ACIP | 97.7 | | | 66.8 | | | 30.9 | | | 61.4 | | | 42.2 | | | 19.2 | |
| Other real assets funds | 68.3 | | | 44.3 | | | 24.0 | | | 78.7 | | | 50.2 | | | 28.5 | |
| Total Real Assets Group | $ | 568.3 | | | $ | 374.4 | | | $ | 193.9 | | | $ | 496.9 | | | $ | 323.5 | | | $ | 173.4 | |
The following table presents the change in accrued performance income for the Real Assets Group ($ in millions):
| | | | | | | | | | | | | | | | | | | | | | | | | | | | | | | | | | | | | | | |
| | | | | | | | | | | |
| | | | | | | | | | | | | |
| | | | | | | | | | | | | |
| | | | | | | | | | | | | |
| | | | | | | | | | | | | |
| | | | | | | | | | | | | |
| | | | | | | | | | | | | |
| | | | | | | | | | | | | |
| | | | | | | | | | | | | |
| | | | | | | | | | | | | |
| | | | | As of December 31, 2023 | | Activity during the period | | As of December 31, 2024 | |
| | Waterfall
Type | | Accrued Performance Income | | Change in Unrealized | | Realized | | Other Adjustments | | Accrued Performance Income | |
| Accrued Carried Interest | | | | | | | | | | | | | |
| US VIII | | European | | $ | 32.2 | | | $ | (0.1) | | | $ | (12.0) | | | $ | — | | | $ | 20.1 | | |
| US IX | | European | | 90.0 | | | 9.8 | | | — | | | — | | | 99.8 | | |
| AREOF III | | European | | 35.7 | | | (11.2) | | | — | | | — | | | 24.5 | | |
| EF IV | | American | | 49.2 | | | (26.3) | | | — | | | — | | | 22.9 | | |
| EIF V | | European | | 93.6 | | | 27.7 | | | — | | | — | | | 121.3 | | |
| IDF V | | European | | 56.1 | | | 63.8 | | | — | | | (6.2) | | | 113.7 | | |
| ACIP | | European | | 61.4 | | | 44.0 | | | (7.7) | | | — | | | 97.7 | | |
| Other real assets funds | | European | | 51.0 | | | 8.8 | | | (12.2) | | | 5.0 | | | 52.6 | | |
| Other real assets funds | | American | | 27.7 | | | (10.8) | | | (1.2) | | | — | | | 15.7 | | |
| | | | | | | | | | | | | |
| | | | | | | | | | | | | |
| Total accrued carried interest | | | | 496.9 | | | 105.7 | | | (33.1) | | | (1.2) | | | 568.3 | | |
| Other real assets funds | | Incentive | | — | | | 27.2 | | | (27.2) | | | — | | | — | | |
| Total Real Assets Group | | | | $ | 496.9 | | | $ | 132.9 | | | $ | (60.3) | | | $ | (1.2) | | | $ | 568.3 | | |
Real Assets Group—Assets Under Management
The tables below present rollforwards of AUM for the Real Assets Group ($ in millions):
| | | | | | | | | | | | | | | | | | | | | | | | | | | | | | | | | | | |
| | | | | | | | | | | |
| | | | | | | | | | | |
| | | | | | | | | | | |
| | | | | | | | | | | |
| | | | | | | | | | | |
| | | | | | | | | | | |
| | | | | | | | | | | |
| | | | | | | | | | | |
| | | | | | | | | | | |
| | | | | | | | | | | |
| | | | | | | | | | | |
| | | | | | | | | | | |
| | | | | | | | | | | |
| | | | | | | | | | | |
| | | | | | | | | | | |
| | | | | | | | | | | |
| | | | | | | | | | | |
| | | | | | | | | | | |
| | | | | | | | | | | |
| | | | | | | | | | | |
| | | | | | | | | | | |
| | | | | | | | | | | |
| | | | | | | | | | | |
| | | | | | | | | | | |
| North American Real Estate Equity | | European Real
Estate Equity | | Real Estate
Debt | | Infrastructure
Opportunities | | Infrastructure
Debt | | Total Real
Assets Group |
| Balance at 12/31/2023 | $ | 29,177 | | | $ | 6,941 | | | $ | 13,597 | | | $ | 6,248 | | | $ | 9,450 | | | $ | 65,413 | |
| Acquisitions | 2,488 | | | — | | | — | | | — | | | — | | | 2,488 | |
| Net new par/equity commitments | 2,684 | | | 1,465 | | | 1,580 | | | 664 | | | 974 | | | 7,367 | |
| Net new debt commitments | 200 | | | — | | | 3,849 | | | — | | | — | | | 4,049 | |
| Capital reductions | — | | | — | | | (1,086) | | | — | | | — | | | (1,086) | |
| Distributions | (1,148) | | | (240) | | | (418) | | | (395) | | | (1,274) | | | (3,475) | |
| Redemptions | (883) | | | — | | | (210) | | | — | | | — | | | (1,093) | |
| Net allocations among investment strategies | — | | | — | | | — | | | — | | | 20 | | | 20 | |
| Change in fund value | 441 | | | (358) | | | 167 | | | 927 | | | 438 | | | 1,615 | |
| Balance at 12/31/2024 | $ | 32,959 | | | $ | 7,808 | | | $ | 17,479 | | | $ | 7,444 | | | $ | 9,608 | | | $ | 75,298 | |
| | | | | | | | | | | |
| North American Real Estate Equity | | European Real
Estate Equity | | Real Estate
Debt | | Infrastructure
Opportunities | | Infrastructure
Debt | | Total Real
Assets Group |
| Balance at 12/31/2022 | $ | 31,460 | | | $ | 7,196 | | | $ | 12,526 | | | $ | 5,194 | | | $ | 9,685 | | | $ | 66,061 | |
| | | | | | | | | | | |
| Net new par/equity commitments | 3,116 | | | 36 | | | 1,278 | | | 1,218 | | | 428 | | | 6,076 | |
| Net new debt commitments | — | | | — | | | 726 | | | — | | | — | | | 726 | |
| Capital reductions | (245) | | | — | | | (235) | | | — | | | — | | | (480) | |
| Distributions | (2,813) | | | (250) | | | (273) | | | (322) | | | (1,138) | | | (4,796) | |
| Redemptions | (1,207) | | | — | | | (552) | | | — | | | — | | | (1,759) | |
| | | | | | | | | | | |
| Change in fund value | (1,134) | | | (41) | | | 127 | | | 158 | | | 475 | | | (415) | |
| Balance at 12/31/2023 | $ | 29,177 | | | $ | 6,941 | | | $ | 13,597 | | | $ | 6,248 | | | $ | 9,450 | | | $ | 65,413 | |
The components of our AUM for the Real Assets Group are presented below ($ in billions):
| | | | | | | | | | | | | | | | | |
| FPAUM | | Non-fee paying(1) | | AUM not yet paying fees |
(1) Includes $1.0 billion and $0.6 billion of non-fee paying AUM from our general partner and employee commitments as of December 31, 2024 and 2023, respectively.
Real Assets Group—Fee Paying AUM
The tables below present rollforwards of fee paying AUM for the Real Assets Group ($ in millions):
| | | | | | | | | | | | | | | | | | | | | | | | | | | | | | | | | | | | | | |
| | | | | | | | | | | | |
| | | | | | | | | | | |
| | | | | | | | | | | |
| | | | | | | | | | | |
| | | | | | | | | | | |
| | | | | | | | | | | |
| | | | | | | | | | | |
| | | | | | | | | | | |
| | | | | | | | | | | |
| | | | | | | | | | | |
| | | | | | | | | | | |
| | | | | | | | | | | |
| | | | | | | | | | | | |
| | | | | | | | | | | | |
| | | | | | | | | | | |
| | | | | | | | | | | | |
| | | | | | | | | | | |
| | | | | | | | | | | |
| | | | | | | | | | | |
| | | | | | | | | | | |
| | | | | | | | | | | |
| | | | | | | | | | | |
| | | | | | | | | | | |
| | | | | | | | | | | |
| | | | | | | | | | | |
| | | | | | | | | | | | |
| | North American Real Estate Equity | | European Real
Estate Equity | | Real Estate
Debt | | Infrastructure
Opportunities | | Infrastructure
Debt | | Total Real
Assets Group |
| Balance at 12/31/2023 | $ | 20,844 | | | $ | 5,913 | | | $ | 3,553 | | | $ | 5,148 | | | $ | 5,880 | | | $ | 41,338 | |
| Acquisitions | 1,554 | | | — | | | — | | | — | | | — | | | 1,554 | |
| Commitments | 2,278 | | | 936 | | | — | | | 226 | | | — | | | 3,440 | |
| Deployment/subscriptions/increase in leverage | 609 | | | 668 | | | 828 | | | 98 | | | 977 | | | 3,180 | |
| Capital reductions | — | | | — | | | (12) | | | — | | | — | | | (12) | |
| Distributions | (855) | | | (178) | | | (330) | | | (340) | | | (454) | | | (2,157) | |
| Redemptions | (883) | | | — | | | (210) | | | — | | | — | | | (1,093) | |
| Net allocations among investment strategies | — | | | — | | | — | | | — | | | 20 | | | 20 | |
| Change in fund value | 197 | | | (390) | | | 94 | | | 57 | | | (114) | | | (156) | |
| Change in fee basis | (1,066) | | | (654) | | | — | | | (60) | | | (246) | | | (2,026) | |
| Balance at 12/31/2024 | $ | 22,678 | | | $ | 6,295 | | | $ | 3,923 | | | $ | 5,129 | | | $ | 6,063 | | | $ | 44,088 | |
| | | | | | | | | | | | |
| | North American Real Estate Equity | | European Real
Estate Equity | | Real Estate
Debt | | Infrastructure
Opportunities | | Infrastructure
Debt | | Total Real
Assets Group |
| Balance at 12/31/2022 | $ | 21,788 | | | $ | 5,566 | | | $ | 3,759 | | | $ | 4,524 | | | $ | 5,970 | | | $ | 41,607 | |
| | | | | | | | | | | |
| Commitments | 2,525 | | | 26 | | | (5) | | | 1,128 | | | — | | | 3,674 | |
| Deployment/subscriptions/increase in leverage | 199 | | | 221 | | | 602 | | | 350 | | | 1,596 | | | 2,968 | |
| Capital reductions | (245) | | | — | | | (210) | | | — | | | — | | | (455) | |
| Distributions | (1,125) | | | 9 | | | (280) | | | (854) | | | (1,612) | | | (3,862) | |
| Redemptions | (1,207) | | | — | | | (568) | | | — | | | — | | | (1,775) | |
| | | | | | | | | | | |
| Change in fund value | (1,091) | | | 91 | | | 157 | | | — | | | (74) | | | (917) | |
| Change in fee basis | — | | | — | | | 98 | | | — | | | — | | | 98 | |
| Balance at 12/31/2023 | $ | 20,844 | | | $ | 5,913 | | | $ | 3,553 | | | $ | 5,148 | | | $ | 5,880 | | | $ | 41,338 | |
The charts below present FPAUM for the Real Assets Group by its fee bases ($ in billions):
| | | | | | | | | | | | | | | | | |
| Invested capital/other(1) | | Market value(2) | | Capital commitments |
(1)Other consists of ACRE’s FPAUM, which is based on ACRE’s stockholders’ equity.
(2)Amounts represent FPAUM from funds that primarily invest in illiquid strategies. The underlying investments held in these funds are generally subject to less market volatility than investments held in liquid strategies.
Real Assets Group—Fund Performance Metrics as of December 31, 2024
The significant funds presented in the tables below collectively contributed approximately 37% of the Real Assets Group’s management fees for the year ended December 31, 2024.
The following table presents the performance data for our significant funds that are not drawdown funds in the Real Assets Group as of December 31, 2024 ($ in millions):
| | | | | | | | | | | | | | | | | | | | | | | | | | | | | | | | | | | | | | | | | | | | | | | | |
| | | | | | | | | | | Returns(%) | | |
| | Year of Inception | | AUM | | | | Year-To-Date | | Since Inception(1) | | Primary
Investment Strategy |
| Fund | | | | | | | | Gross | | Net | | Gross | | Net | |
Diversified non-traded REIT(2) | | 2012 | | $ | 5,663 | | | | | | | N/A | | (0.4) | | | N/A | | 6.1 | | | North American Real Estate Equity |
Industrial non-traded REIT(3) | | 2017 | | 7,354 | | | | | | | N/A | | 0.8 | | | N/A | | 8.5 | | | North American Real Estate Equity |
Open-ended industrial real estate fund(4) | | 2017 | | 5,083 | | | | | | | 4.3 | | | 3.3 | | | 17.5 | | | 14.3 | | | North American Real Estate Equity |
(1)Since inception returns are annualized.
(2)Performance is measured by total return, which includes income and appreciation and reinvestment of all distributions for the respective time period. Returns are shown for institutional share class. Shares of other classes may have lower returns due to higher selling commissions and fees. Actual individual stockholder returns will vary. Net returns are calculated using the fund’s NAV and assume distributions are reinvested at the NAV on the date of distribution. The inception date used in the calculation of the since inception return is the date in which the first shares of common stock were sold after converting to a NAV-based REIT.
(3)Performance is measured by total return, which includes income and appreciation and reinvestment of all distributions for the respective time period. Returns are shown for institutional share class. Shares of other classes may have lower returns due to higher selling commissions and fees. Actual individual stockholder returns will vary. Net returns are calculated using the fund’s NAV and assume distributions are reinvested at the NAV on the date of distribution.
(4)Returns are time-weighted rates of return and include the reinvestment of income and other earnings from securities or other investments and reflect the deduction of all trading expenses. Gross returns do not reflect the deduction of management fees, incentive fees, as applicable, or other expenses. Net returns are calculated by subtracting the applicable management fees, incentive fees, as applicable and other expenses from the gross returns on a quarterly basis.
The following table presents the performance data of the Real Assets Group’s significant drawdown fund as of December 31, 2024 ($ in millions):
| | | | | | | | | | | | | | | | | | | | | | | | | | | | | | | | | | | | | | | | | | | | | | | | | | | | | | | | | | | | | | | | | | | | | | | | | | |
| | Year of Inception | | AUM | | Original Capital Commitments | | Capital Invested to Date | | Realized Value(1) | | Unrealized Value(2) | | Total Value | | MoIC | | IRR(%) | | Primary Investment Strategy |
| Fund | | | | | | | | | Gross(3) | | Net(4) | | Gross(5) | | Net(6) | |
| | | | | | | | | | | | | | | | | | | |
| | | | | | | | | | | | | | | | | | | | | | | | |
| Fund Deploying Capital | | | | | | | | | | | | | | | | | | | |
IDF V(7) | | 2020 | | $ | 4,849 | | | $ | 4,585 | | | $ | 3,813 | | | $ | 912 | | | $ | 3,550 | | | $ | 4,462 | | | 1.2x | | 1.2x | | 12.9 | | | 10.1 | | | Infrastructure Debt |
(1)Realized proceeds include distributions of operating income, sales and financing proceeds received to the limited partners.
(2)Unrealized value represents the fund's NAV reduced by the accrued incentive allocation, if applicable. There can be no assurance that unrealized values will be realized at the valuations indicated.
(3)The gross MoIC is calculated at the fund-level and is based on the interests of the fee-paying limited partners and if applicable, excludes interests attributable to the non-fee paying limited partners and/or the general partner which does not pay management fees or carried interest. The gross MoIC is before giving effect to management fees, carried interest, as applicable, and other expenses, but after giving effect to credit facility interest expenses, as applicable. The funds may utilize a credit facility during the investment period and for general cash management purposes. Early in the life of a fund, the gross fund-level MoICs would generally have been lower had such fund called capital from its limited partners instead of utilizing the credit facility.
(4)The net MoIC is calculated at the fund-level and is based on the interests of the fee-paying limited partners and, if applicable, excludes interests attributable to the non fee-paying limited partners and/or the general partner which does not pay management fees or carried interest. The net MoIC is after giving effect to management fees, carried interest, as applicable, credit facility interest expense, as applicable, and other expenses. The funds may utilize a credit facility during the investment period and for general cash management purposes. Early in the life of a fund, the net fund-level MoICs would generally have been lower had such fund called capital from its limited partners instead of utilizing the credit facility.
(5)The gross IRR is an annualized since inception gross internal rate of return of cash flows to and from the fund and the fund’s residual value at the end of the measurement period. Gross IRR reflects returns to the fee-paying limited partners and, if applicable, excludes interests attributable to the non-fee paying limited partners and/or the general partner which does not pay management fees or carried interest. The cash flow dates used in the gross IRR calculation are based on the actual dates of the cash flows. The gross IRRs are calculated before giving effect to management fees, carried interest and other expenses, but after giving effect to credit facility interest expenses, as applicable. The funds may utilize a credit facility during the investment period and for general cash management purposes. Gross fund-level IRRs would generally have been lower had such fund called capital from its limited partners instead of utilizing the credit facility.
(6)The net IRR is an annualized since inception net internal rate of return of cash flows to and from the fund and the fund’s residual value at the end of the measurement period. Net IRRs reflect returns to the fee-paying limited partners and, if applicable, exclude interests attributable to the non-fee paying limited partners and/or the general partner which does not pay management fees or carried interest. The cash flow dates used in the net IRR calculations are based on the actual dates of the cash flows. The net IRRs are calculated after giving effect to management fees and carried interest, other expenses and credit facility interest expenses, as applicable. The funds may utilize a credit facility during the investment period and for general cash management purposes. Net fund-level IRRs would generally have been lower had such fund called capital from its limited partners instead of utilizing the credit facility.
(7)IDF V is made up of U.S. Dollar hedged, Euro unhedged, GBP hedged, Yen hedged, and single investor parallel funds. The gross and net IRR and MoIC presented in the table are for the U.S. Dollar hedged parallel fund. The gross and net IRR for the single investor U.S. Dollar parallel fund are 10.2% and 7.8%, respectively. The gross and net MoIC for the single investor U.S. Dollar parallel fund are 1.2x and 1.2x, respectively. The gross and net IRR for the Euro unhedged parallel fund are 13.7% and 10.8%, respectively. The gross and net MoIC for the Euro unhedged parallel fund are 1.3x and 1.2x, respectively. The gross and net IRR for the GBP hedged parallel fund are 12.3% and 9.3%, respectively. The gross and net MoIC for the GBP hedged parallel fund are 1.2x and 1.1x, respectively. The gross and net IRR for the Yen hedged parallel fund are 8.8% and 6.2%, respectively. The gross and net MoIC for the Yen hedged parallel fund are 1.1x and 1.1x, respectively. Original capital commitments are converted to U.S. Dollars at the prevailing exchange rate at the time of fund's closing. All other values for IDF V are for the combined fund and are converted to U.S. Dollars at the prevailing quarter-end exchange rate.
Private Equity Group—Year Ended December 31, 2024 Compared to Year Ended December 31, 2023
Fee Related Earnings
The following table presents the components of the Private Equity Group’s FRE ($ in thousands):
| | | | | | | | | | | | | | | | | | | | | | | | | | | | | | | |
| | | | | | | | | | | | | | | |
| | | | | Year ended December 31, | | Favorable (Unfavorable) |
| | | | | | | | | 2024 | | 2023 | | $ Change | | % Change |
| Management fees | | | | | | | | | $ | 137,130 | | | $ | 126,721 | | | $ | 10,409 | | | 8% |
| Other fees | | | | | | | | | 1,695 | | | 1,693 | | | 2 | | | — |
| Compensation and benefits | | | | | | | | | (56,830) | | | (58,408) | | | 1,578 | | | 3 |
| General, administrative and other expenses | | | | | | | | | (21,449) | | | (16,949) | | | (4,500) | | | (27) |
| Fee Related Earnings | | | | | | | | | $ | 60,546 | | | $ | 53,057 | | | 7,489 | | | 14 |
Management Fees. The chart below presents Private Equity Group management fees and effective management fee rates ($ in millions):
The following table presents the components of and causes for changes in the Private Equity Group’s management fees for the year ended December 31, 2024 compared to the prior year ($ in millions):
| | | | | | | | | |
| | | Year-over-year Change |
| Fees from the Crescent Point Acquisition effective October 2, 2023 | | | $ | 21.7 | |
| Change in fee base from capital commitments to invested capital and reduction in fee rate from 1.50% to 0.75% for an energy opportunities fund, which were both contractually triggered at the expiration of the fund’s investment period | | | (11.3) | |
| | | |
| Total | | | $ | 10.4 | |
The decrease in effective management fee rate for the year ended December 31, 2024 compared to the year ended December 31, 2023 was primarily driven by the reduction in fee rate for the energy opportunities fund as discussed above, partially offset by certain funds within our APAC private equity strategy that have a higher effective management fee rate than the average effective management fee rate of the funds within our corporate private equity strategy.
Compensation and Benefits. Although salary expenses increased for the year ended December 31, 2024 compared to the prior year reflecting the full year impact from the increase in headcount from the Crescent Point Acquisition, compensation and benefits decreased slightly over the comparative periods. The decrease for the year ended December 31, 2024 compared to the prior year was primarily driven by lower incentive-based compensation paid to our corporate private equity team.
Average headcount increased by 10% to 103 investment and investment support professionals for the year-to-date period in 2024 from 94 professionals in 2023, driven by the increase in headcount from the Crescent Point Acquisition and partially offset by a decrease in headcount for our corporate private equity team.
General, Administrative and Other Expenses. The increase in general, administrative and other expenses for the year ended December 31, 2024 compared to the prior year largely reflect Crescent Point’s operating expenses following the Crescent Point Acquisition.
Realized Income
The following table presents the components of the Private Equity Group’s RI ($ in thousands):
| | | | | | | | | | | | | | | | | | | | | | | | | | | | | | | |
| | | | | Year ended December 31, | | Favorable (Unfavorable) |
| | | | | | | | | 2024 | | 2023 | | $ Change | | % Change |
| Fee Related Earnings | | | | | | | | | $ | 60,546 | | | $ | 53,057 | | | $ | 7,489 | | | 14% |
| Performance income—realized | | | | | | | | | 43,299 | | | 65,716 | | | (22,417) | | | (34) |
| Performance related compensation—realized | | | | | | | | | (36,334) | | | (52,984) | | | 16,650 | | | 31 |
| Realized net performance income | | | | | | | | | 6,965 | | | 12,732 | | | (5,767) | | | (45) |
| Investment income (loss)—realized | | | | | | | | | 1,926 | | | (712) | | | 2,638 | | | NM |
| Interest income | | | | | | | | | 1,970 | | | 38 | | | 1,932 | | | NM |
| Interest expense | | | | | | | | | (22,632) | | | (18,990) | | | (3,642) | | | (19) |
| | | | | | | | | | | | | | | |
| Realized net investment loss | | | | | | | | | (18,736) | | | (19,664) | | | 928 | | | 5 |
| Realized Income | | | | | | | | | $ | 48,775 | | | $ | 46,125 | | | 2,650 | | | 6 |
The Private Equity Group’s realized activities were principally composed of and caused by the following:
| | | | | | | | |
| Year ended December 31, 2024 | | Year ended December 31, 2023 |
| Realized net performance income | | |
Carried interest from: •Realized gains from ACOF IV’s investments in various energy companies and ACOF VI’s investment in Frontier Communications Parent, Inc. (“FYBR”) | | Carried interest from: •Realized gains from the partial sale of ACOF IV’s investment in The AZEK Company (“AZEK”) |
| Realized investment income (loss) and interest income | | |
•Distributions of investment income from our corporate private equity funds •Interest income earned on treasury-backed securities, which is allocated among our segments based on the cost basis of our balance sheet investments | | •Realized losses of $4.6 million in connection with the liquidation and disposition of remaining assets of certain legacy funds •Realized gains of $4.0 million from the partial sale of ACOF IV’s investment in AZEK |
Interest expense, which is allocated among our segments based on the cost basis of our balance sheet investments, increased over the comparative periods primarily due to the issuance of the 2028 Senior Notes in November 2023 and 2054 Senior Notes in October 2024.
Private Equity Group—Performance Income
The following table presents the accrued carried interest, also referred to as accrued performance income, and related performance compensation for the Private Equity Group ($ in millions):
| | | | | | | | | | | | | | | | | | | | | | | | | | | | | | | | | | | |
| | | |
| As of December 31, |
| 2024 | | 2023 |
| Accrued Performance Income | | Accrued Performance Compensation | | Accrued Net Performance Income | | Accrued Performance Income | | Accrued Performance Compensation | | Accrued Net Performance Income |
| ACOF IV | $ | 166.8 | | | $ | 133.6 | | | $ | 33.2 | | | $ | 181.3 | | | $ | 145.2 | | | $ | 36.1 | |
| ACOF V | — | | | — | | | — | | | 474.9 | | | 380.8 | | | 94.1 | |
| ACOF VI | 523.1 | | | 442.8 | | | 80.3 | | | 337.1 | | | 289.1 | | | 48.0 | |
| Other funds | 20.9 | | | 14.8 | | | 6.1 | | | 55.2 | | | 42.3 | | | 12.9 | |
| Total Private Equity Group | $ | 710.8 | | | $ | 591.2 | | | $ | 119.6 | | | $ | 1,048.5 | | | $ | 857.4 | | | $ | 191.1 | |
The following table presents the change in accrued carried interest for the Private Equity Group ($ in millions):
| | | | | | | | | | | | | | | | | | | | | | | | | | | | | | | | | | | |
| | | | | As of December 31, 2023 | | Activity during the period | | | | As of December 31, 2024 |
| | Waterfall Type | | Accrued Carried Interest | | Change in Unrealized | | Realized | | | | Accrued Carried Interest | |
| | | | | | | | | | | | | |
| ACOF IV | | American | | $ | 181.3 | | | $ | (5.5) | | | $ | (9.0) | | | | | $ | 166.8 | | |
| ACOF V | | American | | 474.9 | | | (474.9) | | | — | | | | | — | | |
| ACOF VI | | American | | 337.1 | | | 220.3 | | | (34.3) | | | | | 523.1 | | |
| Other funds | | European | | 46.1 | | | (33.0) | | | — | | | | | 13.1 | | |
| Other funds | | American | | 9.1 | | | (1.3) | | | — | | | | | 7.8 | | |
| Total Private Equity Group | | | | $ | 1,048.5 | | | $ | (294.4) | | | $ | (43.3) | | | | | $ | 710.8 | | |
Private Equity Group—Assets Under Management
The tables below present rollforwards of AUM for the Private Equity Group ($ in millions):
| | | | | | | | | | | | | | | | | | | | | | | | | | |
| | | | | | | | |
| | | | | | | | |
| | | | | | | |
| | | | | | | |
| | | | | | | |
| | | | | | | |
| | | | | | | |
| | | | | | | |
| | | | | | | |
| | | | | | | |
| | | | | | | |
| | | | | | | | |
| | | | | | | | |
| | | | | | | |
| | | | | | | | |
| | | | | | | |
| | | | | | | |
| | | | | | | |
| | | | | | | |
| | | | | | | |
| | | | | | | |
| | | | | | | |
| | | | | | | |
| | | | | | | | |
| | Corporate Private
Equity | | APAC Private
Equity | | Other(1) | | Total Private
Equity Group |
| Balance at 12/31/2023 | $ | 20,998 | | | $ | 3,414 | | | $ | 139 | | | $ | 24,551 | |
| | | | | | | |
| Net new par/equity commitments | 458 | | | 3 | | | 58 | | | 519 | |
| | | | | | | |
| Capital reductions | (4) | | | — | | | — | | | (4) | |
| Distributions | (685) | | | (19) | | | — | | | (704) | |
| Redemptions | — | | | (2) | | | — | | | (2) | |
| Net allocations among investment strategies | 150 | | | — | | | (197) | | | (47) | |
| Change in fund value | 147 | | | (419) | | | — | | | (272) | |
| Balance at 12/31/2024 | $ | 21,064 | | | $ | 2,977 | | | $ | — | | | $ | 24,041 | |
| | | | | | | | |
| | Corporate Private
Equity | | APAC Private
Equity | | Other(1) | | Total Private
Equity Group |
| Balance at 12/31/2022 | $ | 20,939 | | | $ | 90 | | | $ | — | | | $ | 21,029 | |
| Acquisitions | — | | | 3,697 | | | — | | | 3,697 | |
| Net new par/equity commitments | 1,482 | | | — | | | 139 | | | 1,621 | |
| | | | | | | |
| Capital reductions | (9) | | | — | | | — | | | (9) | |
| Distributions | (1,794) | | | (16) | | | — | | | (1,810) | |
| | | | | | | |
| | | | | | | |
| Change in fund value | 380 | | | (357) | | | — | | | 23 | |
| Balance at 12/31/2023 | $ | 20,998 | | | $ | 3,414 | | | $ | 139 | | | $ | 24,551 | |
| | | | | | | | |
| (1) Activity within Other represents equity commitments to the platform that either have not yet been allocated to an investment strategy or have been allocated in a subsequent period as commitments to an investment strategy. |
The components of our AUM for the Private Equity Group are presented below ($ in billions):
| | | | | | | | | | | | | | | | | |
| FPAUM | | Non-fee paying(1) | | AUM not yet paying fees |
(1) Includes $1.2 billion and $1.4 billion of non-fee paying AUM from our general partner and employee commitments as of December 31, 2024 and 2023, respectively.
Private Equity Group—Fee Paying AUM
The tables below present rollforwards of fee paying AUM for the Private Equity Group ($ in millions):
| | | | | | | | | | | | | | | | | | | | | | |
| | | | | | | | |
| | | | | | | |
| | | | | | | |
| | | | | | | |
| | | | | | | |
| | | | | | | |
| | | | | | | |
| | | | | | | |
| | | | | | | |
| | | | | | | |
| | | | | | | |
| | | | | | | |
| | | | | | | | |
| | | | | | | | |
| | | | | | | |
| | | | | | | | |
| | | | | | | |
| | | | | | | |
| | | | | | | |
| | | | | | | |
| | | | | | | |
| | | | | | | |
| | | | | | | |
| | | | | | | |
| | | | | | | |
| | | | | | | | |
| | Corporate Private
Equity | | APAC Private
Equity | | | | Total Private
Equity Group |
| Balance at 12/31/2023 | $ | 11,459 | | | $ | 1,665 | | | | | $ | 13,124 | |
| | | | | | | |
| | | | | | | |
| Deployment/subscriptions/increase in leverage | 28 | | | 19 | | | | | 47 | |
| | | | | | | |
| Distributions | (54) | | | — | | | | | (54) | |
| Redemptions | — | | | (2) | | | | | (2) | |
| | | | | | | |
| Change in fund value | (21) | | | — | | | | | (21) | |
| Change in fee basis | (1,552) | | | (115) | | | | | (1,667) | |
| Balance at 12/31/2024 | $ | 9,860 | | | $ | 1,567 | | | | | $ | 11,427 | |
| | | | | | | | |
| | Corporate Private
Equity | | APAC Private
Equity | | | | Total Private
Equity Group |
| Balance at 12/31/2022 | $ | 11,277 | | | $ | 4 | | | | | $ | 11,281 | |
| Acquisitions | — | | | 1,692 | | | | | 1,692 | |
| | | | | | | |
| Deployment/subscriptions/increase in leverage | 220 | | | 14 | | | | | 234 | |
| | | | | | | |
| Distributions | (38) | | | — | | | | | (38) | |
| | | | | | | |
| | | | | | | |
| | | | | | | |
| Change in fee basis | — | | | (45) | | | | | (45) | |
| Balance at 12/31/2023 | $ | 11,459 | | | $ | 1,665 | | | | | $ | 13,124 | |
The charts below present FPAUM for the Private Equity Group by its fee bases ($ in billions):
| | | | | | | | | | | | | | | | | | |
| | Capital commitments | | | Invested capital | |
Private Equity Group—Fund Performance Metrics as of December 31, 2024
The significant funds presented in the table below collectively contributed approximately 72% of the Private Equity Group’s management fees for the year ended December 31, 2024.
The following table presents the performance data of the Private Equity Group’s significant drawdown funds as of December 31, 2024 ($ in millions):
| | | | | | | | | | | | | | | | | | | | | | | | | | | | | | | | | | | | | | | | | | | | | | | | | | | | | | | | | | | | | | | | | | | | | | | | | | |
| | Year of Inception | | AUM | | Original Capital Commitments | | Capital Invested to Date | | Realized Value(1) | | Unrealized Value(2) | | Total Value | | MoIC | | IRR(%) | | Primary Investment Strategy |
| Fund | | | | | | | | | Gross(3) | | Net(4) | | Gross(5) | | Net(6) | |
| Fund Harvesting Investments | | | | | | | | | | | | | | | | | | | | | | |
| | | | | | | | | | | | | | | | | | | | | | | | |
| ACOF V | | 2017 | | $ | 7,827 | | | $ | 7,850 | | | $ | 7,611 | | | $ | 3,510 | | | $ | 7,350 | | | $ | 10,860 | | | 1.4x | | 1.3x | | 8.1 | | 6.1 | | Corporate Private Equity |
| Fund Deploying Capital | | | | | | | | | | | | | | | | | | | | | | |
| ACOF VI | | 2020 | | 8,142 | | | 5,743 | | | 5,256 | | | 1,471 | | | 7,248 | | | 8,719 | | | 1.6x | | 1.4x | | 23.0 | | 17.0 | | Corporate Private Equity |
(1)Realized value represents the sum of all cash dividends, interest income, other fees and cash proceeds from realizations of interests in portfolio investments. Realized value excludes any proceeds related to bridge financings.
(2)Unrealized value represents the fair market value of remaining investments. Unrealized value does not take into account any bridge financings. There can be no assurance that unrealized investments will be realized at the valuations indicated.
(3)The gross MoIC is calculated at the fund-level and is based on the interests of the fee-paying limited partners and if applicable, excludes interests attributable to the non-fee paying limited partners and/or the general partner which does not pay management fees or carried interest. The gross MoIC is before giving effect to management fees, carried interest, as applicable, and other expenses, but after giving effect to credit facility interest expenses, as applicable. The gross MoICs are also calculated before giving effect to any bridge financings. The funds may utilize a credit facility during the investment period and for general cash management purposes. Early in the life of a fund, the gross fund-level MoICs would generally have been lower had such fund called capital from its limited partners instead of utilizing the credit facility.
(4)The net MoIC is calculated at the fund-level. The net MoIC is based on the interests of the fee-paying limited partners and if applicable, excludes interests attributable to the non-fee paying limited partners and/or the general partner which does not pay management fees or performance fees. The net MoIC is after giving effect to management fees, carried interest, as applicable, and other expenses. The net MoICs are also calculated before giving effect to any bridge financings. Inclusive of bridge financings, the net MoIC would be 1.3x for ACOF V and 1.4x for ACOF VI. The funds may utilize a credit facility during the investment period and for general cash management purposes. Early in the life of a fund, the net fund-level MoICs would generally have been lower had such fund called capital from its limited partners instead of utilizing the credit facility.
(5)The gross IRR is an annualized since inception gross internal rate of return of cash flows to and from the fund and the fund’s residual value at the end of the measurement period. Gross IRRs reflect returns to the fee-paying limited partners and, if applicable, excludes interests attributable to the non-fee paying limited partners and/or the general partner which does not pay management fees or carried interest. The cash flow dates used in the gross IRR calculation are based on the actual dates of the cash flows. The gross IRRs are calculated before giving effect to management fees, carried interest, as applicable, and other expenses, but after giving effect to credit facility interest expenses, as applicable. The gross IRRs are also calculated before giving effect to any bridge financings. The funds may utilize a credit facility during the investment period and for general cash management purposes. Gross fund-level IRRs would generally have been lower had such fund called capital from its limited partners instead of utilizing the credit facility.
(6)The net IRR is an annualized since inception net internal rate of return of cash flows to and from the fund and the fund’s residual value at the end of the measurement period. Net IRRs reflect returns to the fee-paying limited partners and if applicable, exclude interests attributable to the non-fee paying limited partners and/or the general partner which does not pay management fees or carried interest. The cash flow dates used in the net IRR calculation are based on the actual dates of the cash flows. The net IRRs are calculated after giving effect to management fees, carried interest as applicable, and other expenses and exclude commitments by the general partner and Schedule I investors who do not pay either management fees or carried interest. The funds may utilize a credit facility during the investment period and for general cash management purposes. Net fund-level IRRs would generally have been lower had such fund called capital from its limited partners instead of utilizing the credit facility. The net IRRs are also calculated before giving effect to any bridge financings. Inclusive of bridge financings, the net IRRs would be 6.2% for ACOF V and 16.2% for ACOF VI.
Secondaries Group—Year Ended December 31, 2024 Compared to Year Ended December 31, 2023
Fee Related Earnings
The following table presents the components of the Secondaries Group’s FRE ($ in thousands):
| | | | | | | | | | | | | | | | | | | | | | | | | | | | | | | |
| | | | | | | | | | | | | | | |
| | | | | Year ended December 31, | | Favorable (Unfavorable) |
| | | | | | | | | 2024 | | 2023 | | $ Change | | % Change |
| Management fees | | | | | | | | | $ | 197,287 | | | $ | 174,942 | | | $ | 22,345 | | | 13% |
| Fee related performance revenues | | | | | | | | | 28,834 | | | 12,782 | | | 16,052 | | | 126 |
| Other fees | | | | | | | | | 222 | | | 22 | | | 200 | | | NM |
| Compensation and benefits | | | | | | | | | (66,290) | | | (62,160) | | | (4,130) | | | (7) |
| General, administrative and other expenses | | | | | | | | | (33,881) | | | (21,199) | | | (12,682) | | | (60) |
| Fee Related Earnings | | | | | | | | | $ | 126,172 | | | $ | 104,387 | | | 21,785 | | | 21 |
Management Fees. The chart below presents Secondaries Group management fees and effective management fee rates ($ in millions):
The following table presents the components of and causes for changes in the Secondaries Group’s management fees for the year ended December 31, 2024 compared to the prior year ($ in millions):
| | | | | | | | | |
| | | Year-over-year Change |
| Fees from APMF, primarily driven by additional capital raised | | | $ | 17.5 | |
| Fees from our third infrastructure secondaries fund, which launched during the fourth quarter of 2023 (exclusive of catch-up fees) | | | 8.8 | |
| Catch-up fees in 2024 generated from our third infrastructure secondaries fund | | | 1.9 | |
| Catch-up fees in 2023 generated from Landmark Real Estate Fund IX, L.P. (“LREF IX”) | | | (7.9) | |
| Cumulative effect of other changes | | | 2.0 | |
| Total | | | $ | 22.3 | |
The increase in effective management fee rate for the year ended December 31, 2024 compared to the year ended December 31, 2023 was primarily due to additional capital raised by APMF that has a fee rate of 1.40%.
Fee Related Performance Revenues. The years ended December 31, 2024 and 2023 reflect incentive fees recognized from APMF. The activity for the year ended December 31, 2024 includes gains recognized in connection with acquiring a sizable portfolio of limited partnership interests during the second quarter of 2024.
Compensation and Benefits. The increase in compensation and benefits for the year ended December 31, 2024 compared to the year ended December 31, 2023 was driven by higher fee related performance compensation of $2.3 million, corresponding to the increase in fee related performance revenues. For the years ended December 31, 2024 and 2023, we reduced fee related performance compensation by $9.5 million and $2.1 million, respectively, to reclaim a portion of the supplemental distribution fees paid to distribution partners. The increase in compensation and benefits was also driven by an increase in payroll-related taxes of $1.5 million, primarily due to the higher stock price associated with equity awards that vested during the first quarter of 2024.
Average headcount increased by 7% to 112 investment and investment support professionals for the year-to-date period in 2024 from 105 professionals in 2023.
General, Administrative and Other Expenses. In an effort to accelerate the growth of APMF’s assets, we entered into agreements beginning in the second quarter of 2023 to pay distribution partners fees to raise additional capital. We refer to these fees as supplemental distribution fees, and these fees are based on assets and/or sales. These fees contributed to an increase in expense of $11.4 million for the year ended December 31, 2024 compared to the prior year. Supplemental distribution fees are expected to fluctuate with sales and the growth in assets, and may reduce fee related performance compensation to the extent that fee related performance revenues are earned from APMF.
Realized Income
The following table presents the components of the Secondaries Group’s RI ($ in thousands):
| | | | | | | | | | | | | | | | | | | | | | | | | | | | | | | |
| | | | | | | | | | | | | | | |
| | | | | Year ended December 31, | | Favorable (Unfavorable) |
| | | | | | | | | 2024 | | 2023 | | $ Change | | % Change |
| Fee Related Earnings | | | | | | | | | $ | 126,172 | | | $ | 104,387 | | | $ | 21,785 | | | 21% |
| Performance income—realized | | | | | | | | | 361 | | | 5,460 | | | (5,099) | | | (93) |
| Performance related compensation—realized | | | | | | | | | 110 | | | (4,678) | | | 4,788 | | | NM |
| Realized net performance income | | | | | | | | | 471 | | | 782 | | | (311) | | | (40) |
| Investment income—realized | | | | | | | | | 2,565 | | | 4,523 | | | (1,958) | | | (43) |
| Interest income | | | | | | | | | 972 | | | 344 | | | 628 | | | 183 |
| Interest expense | | | | | | | | | (10,240) | | | (8,980) | | | (1,260) | | | (14) |
| | | | | | | | | | | | | | | |
| Realized net investment loss | | | | | | | | | (6,703) | | | (4,113) | | | (2,590) | | | (63) |
| Realized Income | | | | | | | | | $ | 119,940 | | | $ | 101,056 | | | 18,884 | | | 19 |
Realized net performance income for the year ended December 31, 2023 was primarily attributable to tax distributions from LREF VIII.
Realized net investment loss for the years ended December 31, 2024 and 2023 largely represents interest expense exceeding investment income during these periods. Interest expense, which is allocated among our segments based on the cost basis of our balance sheet investments, increased over the comparative periods primarily due to the issuance of the 2028 Senior Notes in November 2023 and 2054 Senior Notes in October 2024. The realized investment activity for the years ended December 31, 2024 and 2023 was primarily attributable to dividend income received from APMF.
Secondaries Group—Performance Income
The following table presents the accrued carried interest, also referred to as accrued performance income, and related performance compensation for the Secondaries Group. Accrued net performance income excludes net performance income that has been realized but not yet received as of the reporting date ($ in millions):
| | | | | | | | | | | | | | | | | | | | | | | | | | | | | | | | | | | | | | | | | |
| | | | | |
| As of December 31, | | | | | | |
| 2024 | | 2023 | | | | | | |
| Accrued Performance Income | | Accrued Performance Compensation | | Accrued Net Performance Income | | Accrued Performance Income | | Accrued Performance Compensation | | Accrued Net Performance Income | | | | | | |
| LEP XVI | $ | 107.9 | | | $ | 92.3 | | | $ | 15.6 | | | $ | 136.8 | | | $ | 117.0 | | | $ | 19.8 | | | | | | | |
| LREF VIII | 81.3 | | | 68.9 | | | 12.4 | | | 101.1 | | | 87.5 | | | 13.6 | | | | | | | |
| Other secondaries funds | 74.6 | | | 59.8 | | | 14.8 | | | 45.5 | | | 38.7 | | | 6.8 | | | | | | | |
| Total Secondaries Group | $ | 263.8 | | | $ | 221.0 | | | $ | 42.8 | | | $ | 283.4 | | | $ | 243.2 | | | $ | 40.2 | | | | | | | |
The following table presents the change in accrued performance income for the Secondaries Group ($ in millions):
| | | | | | | | | | | | | | | | | | | | | | | | | | | | | | | | | | | | | | |
| | | | | As of December 31, 2023 | | Activity during the period | | As of December 31, 2024 |
| | Waterfall Type | | Accrued Carried Interest | | Change in Unrealized | | Realized | | Other Adjustments | | Accrued Carried Interest |
| Accrued Carried Interest | | | | | | | | | | | | |
| LEP XVI | | European | | $ | 136.8 | | | $ | (28.9) | | | $ | — | | | $ | — | | | $ | 107.9 | |
| LREF VIII | | European | | 101.1 | | | (19.8) | | | — | | | — | | | 81.3 | |
| | | | | | | | | | | | |
| | | | | | | | | | | | |
| | | | | | | | | | | | |
| Other secondaries funds | | European | | 45.5 | | | 29.1 | | | — | | | — | | | 74.6 | |
| Total accrued carried interest | | | | 283.4 | | | (19.6) | | | — | | | — | | | 263.8 | |
| Other secondaries funds | | Incentive | | — | | | 0.4 | | | (0.4) | | | — | | | — | |
| Total Secondaries Group | | | | $ | 283.4 | | | $ | (19.2) | | | $ | (0.4) | | | $ | — | | | $ | 263.8 | |
| | | | | | | | | | | | |
Secondaries Group—Assets Under Management
The table below presents the rollforwards of AUM for the Secondaries Group ($ in millions):
| | | | | | | | | | | | | | | | | | | | | | | | | | | | | | | | | | | |
| | | | | | | | | | | |
| | | | | | | | | | | |
| | | | | | | | | | | |
| | | | | | | | | | | |
| | | | | | | | | | | |
| | | | | | | | | | | |
| | | | | | | | | | | |
| | | | | | | | | | | |
| | | | | | | | | | | |
| | | | | | | | | | | |
| | | | | | | | | | | |
| | | | | | | | | | | |
| | | | | | | | | | | |
| | | | | | | | | | | |
| | | | | | | | | | | |
| | | | | | | | | | | |
| | | | | | | | | | | |
| | | | | | | | | | | |
| | | | | | | | | | | |
| | | | | | | | | | | |
| | | | | | | | | | | |
| | | | | | | | | | | |
| | | | | | | | | | | |
| | | | | | | | | | | |
| Private Equity
Secondaries | | Real Estate
Secondaries | | Infrastructure
Secondaries | | Credit
Secondaries | | Other(1) | | Total Secondaries
Group |
| Balance at 12/31/2023 | $ | 13,174 | | | $ | 7,826 | | | $ | 2,380 | | | $ | 1,380 | | | $ | — | | | $ | 24,760 | |
| | | | | | | | | | | |
| Net new par/equity commitments | 2,489 | | | 279 | | | 1,192 | | | 493 | | | — | | | 4,453 | |
| Net new debt commitments | 625 | | | — | | | — | | | — | | | — | | | 625 | |
| | | | | | | | | | | |
| Distributions | (504) | | | (215) | | | (146) | | | (15) | | | — | | | (880) | |
| | | | | | | | | | | |
| Net allocations among investment strategies | 15 | | | — | | | — | | | 10 | | | — | | | 25 | |
| Change in fund value | 6 | | | (111) | | | 265 | | | 10 | | | — | | | 170 | |
| Balance at 12/31/2024 | $ | 15,805 | | | $ | 7,779 | | | $ | 3,691 | | | $ | 1,878 | | | $ | — | | | $ | 29,153 | |
| | | | | | | | | | | |
| Private Equity
Secondaries | | Real Estate
Secondaries | | Infrastructure
Secondaries | | Credit
Secondaries | | Other(1) | | Total Secondaries
Group |
| Balance at 12/31/2022 | $ | 12,769 | | | $ | 7,552 | | | $ | 1,640 | | | $ | — | | | $ | — | | | $ | 21,961 | |
| | | | | | | | | | | |
| Net new par/equity commitments | 567 | | | 952 | | | 721 | | | 1,358 | | | 50 | | | 3,648 | |
| | | | | | | | | | | |
| | | | | | | | | | | |
| Distributions | (477) | | | (537) | | | (102) | | | — | | | — | | | (1,116) | |
| Redemptions | (1) | | | — | | | — | | | — | | | — | | | (1) | |
| Net allocations among investment strategies | 30 | | | — | | | — | | | 25 | | | (50) | | | 5 | |
| Change in fund value | 286 | | | (141) | | | 121 | | | (3) | | | — | | | 263 | |
| Balance at 12/31/2023 | $ | 13,174 | | | $ | 7,826 | | | $ | 2,380 | | | $ | 1,380 | | | $ | — | | | $ | 24,760 | |
| | | | | | | | | | | |
| (1) Activity within Other represents equity commitments to the platform that either have not yet been allocated to an investment strategy or have been allocated in a subsequent period as commitments to an investment strategy. |
The components of our AUM for the Secondaries Group are presented below ($ in billions):
| | | | | | | | | | | | | | | | | |
| FPAUM | | AUM not yet paying fees | | Non-fee paying(1) |
(1) Includes $0.5 billion of non-fee paying AUM from our general partner and employee commitments as of December 31, 2024 and 2023.
Secondaries Group—Fee Paying AUM
The table below presents the rollforwards of fee paying AUM for the Secondaries Group ($ in millions):
| | | | | | | | | | | | | | | | | | | | | | | | | | | | | | | |
| | | | | | | | | | | |
| | | | | | | | | | | |
| | | | | | | | | | | |
| | | | | | | | | | | |
| | | | | | | | | | | |
| | | | | | | | | | | |
| | | | | | | | | | | |
| | | | | | | | | | | |
| | | | | | | | | | | |
| | | | | | | | | | | |
| | | | | | | | | | | |
| | | | | | | | | | | |
| | | | | | | | | | | |
| | | | | | | | | | | |
| | | | | | | | | | | |
| | | | | | | | | | | |
| | | | | | | | | | | |
| | | | | | | | | | | |
| | | | | | | | | | | |
| | | | | | | | | | | |
| | | | | | | | | | | |
| | | | | | | | | | | |
| | | | | | | | | | | |
| | | | | | | | | | | |
| | | | | | | | | | | |
| | | | | | | | | | | |
| Private Equity
Secondaries | | Real Estate
Secondaries | | Infrastructure
Secondaries | | Credit Secondaries | | | | Total Secondaries
Group |
| Balance at 12/31/2023 | $ | 11,204 | | | $ | 5,978 | | | $ | 1,763 | | | $ | 95 | | | | | $ | 19,040 | |
| | | | | | | | | | | |
| Commitments | 1,783 | | | 160 | | | 850 | | | — | | | | | 2,793 | |
| Deployment/subscriptions/increase in leverage | 125 | | | 231 | | | 6 | | | 33 | | | | | 395 | |
| | | | | | | | | | | |
| Distributions | (146) | | | (188) | | | (132) | | | (39) | | | | | (505) | |
| | | | | | | | | | | |
| | | | | | | | | | | |
| Change in fund value | (131) | | | 19 | | | 95 | | | 58 | | | | | 41 | |
| Change in fee basis | (47) | | | 241 | | | — | | | 443 | | | | | 637 | |
| Balance at 12/31/2024 | $ | 12,788 | | | $ | 6,441 | | | $ | 2,582 | | | $ | 590 | | | | | $ | 22,401 | |
| | | | | | | | | | | |
| Private Equity
Secondaries | | Real Estate
Secondaries | | Infrastructure
Secondaries | | Credit Secondaries | | | | Total Secondaries
Group |
| Balance at 12/31/2022 | $ | 11,062 | | | $ | 5,313 | | | $ | 1,293 | | | $ | — | | | | | $ | 17,668 | |
| | | | | | | | | | | |
| Commitments | 367 | | | 772 | | | 506 | | | — | | | | | 1,645 | |
| Deployment/subscriptions/increase in leverage | 51 | | | 317 | | | 20 | | | 85 | | | | | 473 | |
| | | | | | | | | | | |
| Distributions | (95) | | | (421) | | | (88) | | | (9) | | | | | (613) | |
| Redemptions | (1) | | | — | | | — | | | — | | | | | (1) | |
| Net allocations among investment strategies | 30 | | | — | | | — | | | — | | | | | 30 | |
| Change in fund value | (162) | | | (53) | | | 32 | | | 19 | | | | | (164) | |
| Change in fee basis | (48) | | | 50 | | | — | | | — | | | | | 2 | |
| Balance at 12/31/2023 | $ | 11,204 | | | $ | 5,978 | | | $ | 1,763 | | | $ | 95 | | | | | $ | 19,040 | |
The chart below presents FPAUM for the Secondaries Group by its fee bases ($ in billions):
| | | | | | | | | | | | | | | | | |
| Reported value(1) | | Capital commitments | | Invested capital/other |
(1)Amounts represent FPAUM from funds that primarily invest in illiquid strategies. The underlying investments held in these funds are generally subject to less market volatility than investments held in liquid strategies.
Secondaries Group—Fund Performance Metrics as of December 31, 2024
LEP XVI contributed approximately 23% of the Secondaries Group’s management fees for the year ended December 31, 2024.
The following table presents the performance data of the Secondaries Group’s significant drawdown fund as of December 31, 2024 ($ in millions):
| | | | | | | | | | | | | | | | | | | | | | | | | | | | | | | | | | | | | | | | | | | | | | | | | | | | | | | | | | | | | | | | | | | | | | | | | | |
| | Year of Inception | | AUM | | Original Capital Commitments | | Capital Invested to Date | | Realized Value(1) | | Unrealized Value(2) | | Total Value | | MoIC | | IRR(%) | | Primary Investment Strategy |
| Fund | | | | | | | | | Gross(3) | | Net(4) | | Gross(5) | | Net(6) | |
| Fund Harvesting Investments | | | | | | | | | | | | | | | | | | | | |
LEP XVI(7) | | 2016 | | $ | 4,347 | | | $ | 4,896 | | | $ | 3,945 | | | $ | 2,079 | | | $ | 2,973 | | | $ | 5,052 | | | 1.4x | | 1.3x | | 18.4 | | 11.6 | | Private Equity Secondaries |
For the funds in the Secondaries Group, returns are calculated from results of the underlying portfolio that are generally reported on a three month lag and may not include the impact of economic and market activities occurring in the current reporting period.
(1)Realized value represents the sum of all cash distributions to all limited partners and if applicable, exclude tax and incentive distributions made to the general partner.
(2)Unrealized value represents the limited partners’ share of fund’s NAV reduced by the accrued incentive allocation, if applicable. There can be no assurance that unrealized values will be realized at the valuations indicated.
(3)The gross MoIC is calculated at the fund-level and is based on the interests of all partners. If applicable, limiting the gross MoIC to exclude interests attributable to the non-fee paying limited partners and/or the general partner who does not pay management fees or carried interest would have no material impact on the result. The gross MoIC is before giving effect to management fees, carried interest, as applicable, and other expenses, but after giving effect to credit facility interest expenses, as applicable. The funds may utilize a short-term credit facility for general cash management purposes, as well as a long-term credit facility as permitted by the respective fund’s governing documentation. The gross fund-level MoIC would have generally been lower had such fund called capital from its partners instead of utilizing the credit facility.
(4)The net MoIC is calculated at the fund-level and is based on the interests of the fee-paying limited partners and if applicable, excludes those interests attributable to the non-fee paying limited partners and/or the general partner which does not pay management fees or carried interest. The net MoIC is after giving effect to management fees and other expenses, carried interest and credit facility interest expense, as applicable. The funds may utilize a short-term credit facility for general cash management purposes, as well as a long-term credit facility as permitted by the respective fund’s governing documentation. The net fund-level MoICs would generally have been lower had such fund called capital from its limited partners instead of utilizing the credit facility.
(5)The gross IRR is an annualized since inception gross internal rate of return of cash flows to and from the fund and the fund’s residual value at the end of the measurement period. Gross IRR reflects returns to all partners. If applicable, limiting the gross IRR to exclude interests attributable to the non-fee paying limited partners and/or the general partner who does not pay management fees or carried interest would have no material impact on the result. The cash flow dates used in the gross IRR calculation are based on the actual dates of the cash flows. The gross IRRs are calculated before giving effect to management fees, carried interest, as applicable, and other expenses, but after giving effect to credit facility interest expenses, as applicable. The funds may utilize a short-term credit facility for general cash management purposes, as well as a long-term credit facility as permitted by the respective fund’s governing documents. The gross fund-level IRR would generally have been lower had such fund called capital from its partners instead of utilizing the credit facility.
(6)The net IRR is an annualized since inception net internal rate of return of cash flows to and from the fund and the fund’s residual value at the end of the measurement period. Net IRRs reflect returns to the fee-paying limited partners and, if applicable, exclude interests attributable to the non-fee paying limited partners and/or the general partner who does not pay management fees or carried interest. The cash flow dates used in the net IRR calculations are based on the actual dates of the cash flows. The net IRRs are calculated after giving effect to management fees and other expenses, carried interest and credit facility interest expenses, as applicable. The funds may utilize a short-term credit facility for general cash management purposes, as well as a long-term credit facility as permitted by the respective fund’s governing documents. Net fund-level IRRs would generally have been lower had such fund called capital from its limited partners instead of utilizing the credit facility.
(7)The results of the fund are presented on a combined basis with the affiliated parallel funds or accounts, given that the investments are substantially the same.
Operations Management Group—Year Ended December 31, 2024 Compared to Year Ended December 31, 2023
Fee Related Earnings
The following table presents the components of the Operations Management Group’s FRE ($ in thousands):
| | | | | | | | | | | | | | | | | | | | | | | | | | | | | | | |
| | | | | | | | | | | | | | | |
| | | | | Year ended December 31, | | Favorable (Unfavorable) |
| | | | | | | | | 2024 | | 2023 | | $ Change | | % Change |
| Other fees | | | | | | | | | $ | 20,357 | | | $ | 23,685 | | | $ | (3,328) | | | (14)% |
| Compensation and benefits | | | | | | | | | (421,268) | | | (361,124) | | | (60,144) | | | (17) |
| General, administrative and other expenses | | | | | | | | | (220,019) | | | (200,613) | | | (19,406) | | | (10) |
| Fee Related Earnings | | | | | | | | | $ | (620,930) | | | $ | (538,052) | | | (82,878) | | | (15) |
Other Fees. The decrease in other fees for the year ended December 31, 2024 compared to the year ended December 31, 2023 was primarily driven by lower asset-based, net distribution fees of $5.2 million associated with our non-traded REITs. The decrease was partially offset by an increase in facilitation fees from the 1031 exchange program associated with our non-traded REITs of $1.3 million over the comparative periods.
Compensation and Benefits. The increase in compensation and benefits for the year ended December 31, 2024 compared to the year ended December 31, 2023 was primarily driven by: (i) the expansion of our business operations teams to support the growth of our business and other strategic initiatives; (ii) the expansion of our strategy and relationship management teams to support global fundraising; (iii) increased compensation and benefits associated with our wealth distribution channel, AWMS, resulting from higher variable compensation for sales employees associated with APMF and ASIF; and (iv) higher incentive-based compensation.
Average headcount increased by 11% to 1,660 professionals for the year-to-date period in 2024 from 1,492 professionals in 2023.
General, Administrative and Other Expenses. Certain expenses increased during the year ended December 31, 2024, including occupancy costs and information technology costs. These expenses collectively increased by $21.4 million for the year ended December 31, 2024 compared to the prior year to support our growing headcount and the expansion of our business, including costs for our new corporate headquarters that we occupied beginning in third quarter of 2024. In addition, travel and marketing costs increased by $4.8 million over the comparative periods, driven by investor events, including our firmwide AGM event.
The aforementioned increase compared to the prior year was partially offset by lower professional service fees of $8.6 million, as we have recognized efficiencies from the transition of our income tax compliance function.
Realized Income
The following table presents the components of the OMG’s RI ($ in thousands):
| | | | | | | | | | | | | | | | | | | | | | | | | | | | | | | |
| | | | | | | | | | | | | | | |
| | | | | Year ended December 31, | | Favorable (Unfavorable) |
| | | | | | | | | 2024 | | 2023 | | $ Change | | % Change |
| Fee Related Earnings | | | | | | | | | $ | (620,930) | | | $ | (538,052) | | | $ | (82,878) | | | (15)% |
| Investment loss—realized | | | | | | | | | (650) | | | (470) | | | (180) | | | (38) |
| Interest income | | | | | | | | | 1,723 | | | 1,218 | | | 505 | | | 41 |
| Interest expense | | | | | | | | | (701) | | | (156) | | | (545) | | | NM |
| | | | | | | | | | | | | | | |
| Realized net investment income | | | | | | | | | 372 | | | 592 | | | (220) | | | (37) |
| Realized Income | | | | | | | | | $ | (620,558) | | | $ | (537,460) | | | (83,098) | | | (15) |
Liquidity and Capital Resources
Management assesses liquidity in terms of our ability to generate cash to fund operating, investing and financing activities. Management believes that we are well-positioned and our liquidity will continue to be sufficient for our foreseeable working capital needs, contractual obligations, dividend payments, pending acquisitions and strategic initiatives.
Sources and Uses of Liquidity
Our sources of liquidity are: (i) cash on hand; (ii) net working capital; (iii) cash from operations, including management fees and fee related performance revenues, which are collected monthly, quarterly or semi-annually, and net realized performance income, which may be unpredictable as to amount and timing; (iv) fund distributions related to our investments that are unpredictable as to amount and timing; and (v) net borrowings from the Credit Facility. As of December 31, 2024, our cash and cash equivalents were $1,508.0 million and we have $1,400.0 million available under our Credit Facility. Our ability to draw from the Credit Facility is subject to leverage and other covenants. We remain in compliance with all covenants as of December 31, 2024. We believe that these sources of liquidity will be sufficient to fund our working capital requirements and to meet our commitments in the ordinary course of business and under the current market conditions for the foreseeable future. Cash flows from management fees may be impacted by a slowdown in deployment, declines in valuations or negatively impacted fundraising. In addition, management fees may be subject to deferral and fee related performance revenues may be subject to hold backs. Declines or delays in transaction activity may impact our fund distributions and net realized performance income, which could adversely impact our cash flows and liquidity. Market conditions may make it difficult to extend the maturity or refinance our existing indebtedness or obtain new indebtedness with similar terms.
We expect that our primary liquidity needs will continue to be to: (i) provide capital to facilitate the growth of our existing investment management businesses; (ii) fund our investment commitments; (iii) provide capital to facilitate our expansion into businesses that are complementary to our existing investment management businesses as well as other strategic growth initiatives; (iv) pay operating expenses, including cash compensation to our employees and tax payments for net settlement of equity awards; (v) fund capital expenditures; (vi) service our debt; (vii) pay income taxes and make payments under the TRA; (viii) make dividend payments to our Class A and non-voting common stockholders and our Series B mandatory convertible preferred stockholders in accordance with our dividend policies; and (ix) pay distributions to AOG unitholders.
In the normal course of business, we expect to pay dividends to our Class A and non-voting common stockholders that are aligned with our expected FRE after an allocation of current taxes paid. For the purposes of determining this amount, we allocate the current taxes paid to FRE and to realized performance and investment income in a manner that may be disproportionate to earnings generated by these metrics, and the actual taxes paid on these metrics should they be considered separately. Additionally, our methodology uses the tax benefits from certain expenses that are not included in these non-GAAP metrics, such as equity-based compensation from the vesting of equity awards and from the amortization of intangible assets, among others. We allocate the taxes by multiplying the statutory tax rate currently in effect by our net realized performance and net investment income and removing this amount from total current taxes. The remaining current tax paid is the amount that we allocate to FRE. We use this method to allocate the current provision for income taxes to approximate the amount of cash that is available to pay dividends to our stockholders. If cash flows from operations were insufficient to fund dividends over a sustained period of time, we expect that we would suspend or reduce paying such dividends. In addition, there is no assurance that dividends would continue at the current levels or at all. Unless quarterly dividends have been declared and paid (or declared and set apart for payment) on the Series B mandatory convertible preferred stock, we may not declare or pay or set apart payment for dividends on any shares of our Class A common stock during the period. Declared dividends on the Series B mandatory convertible preferred stock will be payable, at our election, in cash, shares of our Class A common stock or a combination of cash and shares of our Class A common stock. Dividends on Series B mandatory convertible preferred stock are cumulative and the Series B mandatory convertible preferred stock, unless previously converted or redeemed, will automatically convert into our Class A common stock on October 1, 2027. Although income allocated to Series B mandatory convertible preferred stock dividends may be subject to tax, dividends to our Series B preferred stockholders will not be reduced on account of any income taxes owed by us. As a result, taxes associated with income allocated to Series B mandatory convertible preferred stock dividends will be borne by Class A and non-voting common stockholders.
Our ability to obtain debt financing and complete stock offerings provides us with additional sources of liquidity. For further discussion of financing transactions occurring in the current period, see “Cash Flows” within this section and “Note 6. Debt” and “Note 13. Equity and Redeemable Interest” within our consolidated financial statements included in this Annual Report on Form 10-K.
Our consolidated financial statements reflect the cash flows of our operating businesses as well as those of our Consolidated Funds. The assets of our Consolidated Funds, on a gross basis, are significantly larger than the assets of our operating businesses and therefore have a substantial effect on the amounts reported within our consolidated statements of cash flows. The primary cash flow activities of our Consolidated Funds include: (i) raising capital from third-party investors, which is reflected as non-controlling interests of our Consolidated Funds; (ii) financing certain investments by issuing debt; (iii) purchasing and selling investment securities; (iv) generating cash through the realization of certain investments; (v) collecting interest and dividend income; and (vi) distributing cash to investors. Our Consolidated Funds are generally accounted for as investment companies under GAAP; therefore, the character and classification of all Consolidated Fund transactions are presented as cash flows from operations. Liquidity available at our Consolidated Funds is not available for corporate liquidity needs, and debt of the Consolidated Funds is non–recourse to us except to the extent of our investment in the fund.
Cash Flows
The following tables summarize our consolidated statements of cash flows by activities attributable to the Company and Consolidated Funds. For more details on the activity of the Company and Consolidated Funds, refer to “Note 15. Consolidation” within our consolidated financial statements included in this Annual Report on Form 10-K.
| | | | | | | | | | | |
| | Year ended December 31, |
| 2024 | | 2023 |
| Net cash provided by operating activities | $ | 1,404,724 | | | $ | 473,107 | |
| Net cash provided by (used in) the Consolidated Funds’ operating activities, net of eliminations | 1,386,430 | | | (706,368) | |
| Net cash provided by (used in) operating activities | 2,791,154 | | | (233,261) | |
| Net cash used in the Company’s investing activities | (159,404) | | | (111,079) | |
| Net cash used in the Company’s financing activities | (77,727) | | | (404,761) | |
| Net cash provided by (used in) the Consolidated Funds’ financing activities, net of eliminations | (1,353,867) | | | 696,887 | |
| Net cash provided by (used in) financing activities | (1,431,594) | | | 292,126 | |
| Effect of exchange rate changes | (40,454) | | | 10,501 | |
| Net change in cash and cash equivalents | $ | 1,159,702 | | | $ | (41,713) | |
The Consolidated Funds had no effect on cash flows attributable to the Company for the periods presented and are excluded from the discussion below. The following discussion focuses on cash flow by activities attributable to the Company.
Operating Activities
In the table below, cash flows from operations are summarized to present: (i) cash generated from our core operating activities, primarily consisting of profits generated principally from management fees and fee related performance revenues after covering for operating expenses and fee related performance compensation; (ii) net realized performance income; and (iii) net cash from investment related activities including purchases, sales, realized net investment income and interest expense. We generated meaningful cash flow from operations in each period presented.
| | | | | | | | | | | | | | | | | | | | | | | |
| Year ended December 31, | | Favorable (Unfavorable) |
| 2024 | | 2023 | | $ Change | | % Change |
| Core operating activities | $ | 1,095,204 | | | $ | 1,066,837 | | | $ | 28,367 | | | 3% |
| Net realized performance income | 137,950 | | | (34,737) | | | 172,687 | | | NM |
| Net cash provided by (used in) investment related activities | 171,570 | | | (558,993) | | | 730,563 | | | (131) |
| Net cash provided by operating activities | $ | 1,404,724 | | | $ | 473,107 | | | 931,617 | | | 197 |
Cash from our core operating activities increased as a result of growing fee revenues and sustained profitability and timing of cash collection of our receivables, partially offset by a decrease in cash attributable to fee related performance revenues earned from our non-traded REITs in 2022 and collected during the year ended December 31, 2023. There were no fee related performance revenues earned from our non-traded REITs in 2024 and 2023.
Net realized performance income includes: (i) carried interest distributions that may represent tax distributions or other distributions of income; and (ii) incentive fees that are realized annually at the end of the measurement period, which is typically at the end of the calendar year. Cash received from carried interest distributions and the subsequent payments to employees may not necessarily occur in the same quarter. Cash from incentive fees is generally received in the period subsequent to the measurement period. The increase in net realized performance income over the comparative periods was primarily due to timing of payments to employees for tax distributions that were both received and paid in the fourth quarter of
2024 and 2023, while tax distributions received in the fourth quarter of 2022 were paid and resulted in a use of cash in the first quarter of 2023.
Net cash provided by (used in) investment related activities for the years ended December 31, 2024 and 2023 primarily represents: (i) distributions received from our capital investments and the collection of principal and interest from loans that we have made; (ii) sales of certain capital investments to employees; (iii) the rebalancing of and associated return of our capital commitments upon admitting new limited partners; (iv) interest income from treasury-backed securities; offset by (v) purchases associated with funding capital commitments and strategic investments in our investment portfolio; and (vi) interest payments on our debt obligations. Although our capital commitments continue to increase with our growing assets under management, cash generated from our investment related activities has exceeded cash used in investment related activities for the year ended December 31, 2024. Our investment related activities may fluctuate depending on timing of capital investments and distributions of each fund from year to year. For further discussion of our capital commitments, see “Note 8. Commitments and Contingencies,” within our consolidated financial statements included in this Annual Report on Form 10-K.
Our working capital needs are generally rising to support the growth of our business, while the capital requirements needed to support fund-related activities vary based upon the specific investment activities being conducted during such period.
Investing Activities
| | | | | | | | | | | |
| Year ended December 31, |
| 2024 | | 2023 |
| Purchase of furniture, equipment and leasehold improvements, net of disposals | $ | (91,509) | | | $ | (67,183) | |
| Acquisitions, net of cash acquired | (67,895) | | | (43,896) | |
| Net cash used in investing activities | $ | (159,404) | | | $ | (111,079) | |
Net cash used in the Company’s investing activities for both periods included cash to purchase furniture, fixtures, equipment and leasehold improvements to support the growth in our staffing levels. Net cash used in the Company’s investing activities for the year ended December 31, 2024 was predominantly for the build out of our new corporate headquarters that we occupied beginning in the third quarter of 2024. In addition, net cash used in the Company’s investing activities included cash used to complete the WSM Acquisition in the current year and to complete the Crescent Point Acquisition in the prior year.
Financing Activities
| | | | | | | | | | | |
| Year ended December 31, |
| 2024 | | 2023 |
| Net proceeds from issuance of Series B mandatory convertible preferred stock | $ | 1,458,771 | | | $ | — | |
| Net proceeds from issuance of Class A common stock | 407,124 | | | — | |
| Net borrowings (repayments) of Credit Facility | (895,000) | | | 195,000 | |
| Proceeds from issuance of senior notes | 736,010 | | | 499,010 | |
| Repayment of senior notes | (250,000) | | | — | |
| Class A and non-voting common stock dividends | (783,172) | | | (599,934) | |
| AOG unitholder distributions | (527,724) | | | (430,732) | |
| | | |
| | | |
| Stock option exercises | 1,511 | | | 85,959 | |
| Taxes paid related to net share settlement of equity awards | (227,532) | | | (157,007) | |
| Other financing activities | 2,285 | | | 2,943 | |
| Net cash used in the Company’s financing activities | $ | (77,727) | | | $ | (404,761) | |
As a result of generating higher fee related earnings, we increased the level of dividends paid to a growing shareholder base of Class A and non-voting common stockholders and distributions paid to AOG unitholders, resulting in net cash used in the Company’s financing activities for the years ended December 31, 2024 and 2023.
Net cash used in the Company’s financing activities for the year ended December 31, 2024 also included the repayments of our Credit Facility and 2024 Senior Notes, partially using cash provided by the net proceeds from the Offering, the issuance of the 2054 Senior Notes and the Series B mandatory convertible preferred stock.
In connection with the vesting of equity awards that are granted to our employees under the Equity Incentive Plan, we withhold shares equal to the fair value of our employees’ tax withholding liabilities and pay the taxes on their behalf in cash and thus issue fewer net shares. Cash used in connection with these awards increased during the current year primarily as a result of our higher stock price, which resulted in employees recognizing additional compensation. For the years ended December 31,
2024 and 2023, we net settled and did not issue 1.8 million shares and 1.7 million shares, respectively. The Company’s financing activities also included cash received from stock options exercises with 0.1 million and 5.1 million options exercised for the years ended December 31, 2024 and 2023, respectively. All the remaining options were exercised during the first quarter of 2024, and we will no longer receive cash or realize any tax benefit from the exercise of stock options after the 2024 tax year.
Capital Resources
We intend to use a portion of our available liquidity to pay cash dividends to our Series B mandatory convertible preferred stockholders and Class A and non-voting common stockholders on a quarterly basis in accordance with our dividend policies. Our ability to make cash dividends is dependent on a myriad of factors, including: (i) general economic and business conditions; (ii) our strategic plans and prospects; (iii) our business and investment opportunities; (iv) timing of capital calls by our funds in support of our commitments; (v) our financial condition and operating results; (vi) working capital requirements and other anticipated cash needs; (vii) contractual restrictions and obligations; (viii) legal, tax and regulatory restrictions; (ix) restrictions on the payment of distributions by our subsidiaries to us; and (x) other relevant factors.
We are required to maintain minimum net capital balances for regulatory purposes for our broker-dealer entities. These net capital requirements are met in part by retaining cash, cash equivalents and investment securities. Additionally, certain of our subsidiaries operating outside the U.S. are also subject to capital adequacy requirements in each of the applicable jurisdictions. As a result, we may be restricted in our ability to transfer cash between different operating entities and jurisdictions. As of December 31, 2024, we were required to maintain approximately $71.6 million in net assets within these subsidiaries to meet regulatory net capital and capital adequacy requirements. We remain in compliance with these regulatory requirements.
Holders of AOG Units, subject to the terms of the exchange agreement, may exchange their AOG Units for shares of our Class A common stock on a one-for-one basis. These exchanges are expected to result in increases in the tax basis of the tangible and intangible assets of AMC that otherwise would not have been available. These increases in tax basis may increase depreciation and amortization for U.S. income tax purposes and thereby reduce the amount of tax that we would otherwise be required to pay in the future. We entered into the TRA that provides payment to the TRA recipients of 85% of the amount of actual cash savings (“Cash Tax Savings”), if any, in U.S. federal, state, local and foreign income tax or franchise tax that we actually realize as a result of these increases in tax basis and of certain other tax benefits related to entering into the TRA, including tax benefits attributable to payments under the TRA and interest accrued thereon (“Tax Benefit Payment”). Effective as of May 1, 2023, pursuant to an amendment to the TRA, to the extent Ares Owners Holdings L.P. would have been a recipient of certain Tax Benefit Payments under the TRA for taxable exchanges on or after May 1, 2023, Ares Owners Holdings L.P. will no longer be entitled to any Tax Benefit Payment for such exchanges and 100% of any Cash Tax Savings will inure to us. Future payments under the TRA in respect of subsequent exchanges are expected to be substantial. The TRA liability balance was $402.4 million and $191.3 million as of December 31, 2024 and December 31, 2023, respectively.
For a discussion of our debt obligations, including the debt obligations of our consolidated funds, see “Note 6. Debt,” within our consolidated financial statements included in this Annual Report on Form 10-K.
For a discussion of our equity, see “Note 13. Equity and Redeemable Interest,” within our consolidated financial statements included in this Annual Report on Form 10-K.
Critical Accounting Estimates
We prepare our consolidated financial statements in accordance with GAAP. In applying many of these accounting principles, we need to make assumptions, estimates or judgments that affect the reported amounts of assets, liabilities, revenues and expenses in our consolidated financial statements. We base our estimates and judgments on historical experience and other assumptions that we believe are reasonable under the circumstances. These assumptions, estimates or judgments, however, are both subjective and subject to change, and actual results may differ from our assumptions and estimates. If actual amounts are ultimately different from our estimates, the revisions are included in our results of operations for the period in which the actual amounts become known. We believe the following critical accounting policies could potentially produce materially different results if we were to change the underlying assumptions, estimates or judgments. See “—Components of Consolidated Results of Operations” and “Note 2. Summary of Significant Accounting Policies,” within our consolidated financial statements included in this Annual Report on Form 10-K for a summary of our significant accounting policies.
Principles of Consolidation
We consolidate entities based on either a variable interest model or voting interest model. As such, for entities that are determined to be variable interest entities (“VIEs”), we consolidate those entities where we have both significant economics and the power to direct the activities of the entity that impact economic performance. For limited partnerships and similar entities evaluated under the voting interest model, we do not consolidate those entities for which we act as the general partner unless we hold a majority voting interest.
The consolidation guidance requires qualitative and quantitative analysis to determine whether our involvement, through holding interests directly or indirectly in the entity or contractually through other variable interests (e.g., management fees and performance related income), would give us a controlling financial interest. This analysis requires judgment. These judgments include: (i) determining whether the equity investment at risk is sufficient to permit the entity to finance its activities without additional subordinated financial support; (ii) evaluating whether the equity holders, as a group, can make decisions that have a significant effect on the success of the entity; (iii) determining whether two or more parties’ equity interests should be aggregated; (iv) determining whether the equity investors have proportionate voting rights to their obligations to absorb losses or rights to receive returns from an entity; and (v) evaluating the nature of relationships and activities of the parties involved in determining which party within a related-party group is most closely associated with a VIE and hence would be deemed the primary beneficiary.
The creditors of the consolidated VIEs do not have recourse to us other than to the assets of the respective consolidated VIEs. The assets and liabilities of the consolidated VIEs are comprised primarily of investments and loans payable, respectively.
Fair Value Measurement
GAAP establishes a hierarchical disclosure framework prioritizing the inputs used in measuring financial instruments at fair value into three levels based on their market observability. Market price observability is affected by a number of factors, including the type of instrument and the characteristics specific to the instrument. Financial instruments with readily available quoted prices from an active market or where fair value can be measured based on actively quoted prices generally have a higher degree of market price observability and a lesser degree of judgment inherent in measuring fair value.
Financial assets and liabilities measured and reported at fair value are classified as follows:
•Level I—Quoted prices in active markets for identical instruments.
•Level II—Quoted prices for similar instruments in active markets; quoted prices for identical or similar instruments in inactive markets; and model-derived valuations with directly or indirectly observable significant inputs. Level II inputs include prices in markets with few transactions, non-current prices, prices for which little public information exists or prices that vary substantially over time or among brokered market makers. Other inputs include interest rate, yield curve, volatility, prepayment risk, loss severity, credit risk and default rate.
•Level III—Valuations that rely on one or more significant unobservable inputs. These inputs reflect the our assessment of the assumptions that market participants would use to value the instrument based on the best information available.
In some instances, an instrument may fall into multiple levels of the fair value hierarchy. In such instances, the instrument’s level within the fair value hierarchy is based on the lowest of the three levels (with Level III being the lowest) that is significant to the fair value measurement. Our assessment of the significance of an input requires judgment and considers factors specific to the instrument. See “Note 5. Fair Value,” within our consolidated financial statements included in this Annual Report on Form 10-K for a summary of our valuation of investments and other financial instruments by fair value hierarchy levels.
Acquisitions
Management’s determination of fair value of assets acquired and liabilities assumed at the acquisition date is based on the best information available in the circumstances and may incorporate management’s own assumptions and involve a significant degree of judgment. We use our best estimates and assumptions to accurately assign fair value to the tangible and identifiable intangible assets acquired and liabilities assumed at the acquisition date as well as the useful lives of those acquired intangible assets. For business combinations accounted for under the acquisition method, the purchase consideration, including the fair value of certain elements of contingent consideration as of the acquisition date, in excess of the fair value of net assets acquired is recorded as goodwill. Conversely, any excess of the fair value of the net assets acquired over the purchase consideration is recognized as a bargain purchase gain. Critical estimates in valuing certain of the intangible assets we have acquired include, but are not limited to, future expected cash inflows and outflows, future fundraising assumptions, expected useful lives, discount rates and income tax rates. Our estimates for future cash flows are based on historical data, internal estimates and external sources, and are based on assumptions that are consistent with the plans and estimates we are using to manage the underlying assets acquired. We estimate the useful lives of the intangible assets based on the expected period over which we anticipate generating economic benefit from the asset. We base our estimates on assumptions we believe to be reasonable but that are unpredictable and inherently uncertain. Unanticipated events and circumstances may occur that could affect the accuracy or validity of such assumptions, estimates or actual results.
Impairment of Intangible Assets
We evaluate intangible assets for impairment annually, or if certain events occur or circumstances change indicating that the carrying amount of the intangible asset may not be recoverable. We evaluate impairment by comparing the estimated undiscounted cash flows attributable to the intangible asset being evaluated with its carrying amount. If an impairment is determined to exist, we accelerate amortization expense so that the carrying amount represents fair value. We estimate fair value using a discounted future cash flow methodology. Inherent in such fair value determinations are certain judgments and estimates relating to future cash flows, including our strategic plans. We base our estimates on assumptions we believe to be reasonable but that are unpredictable and inherently uncertain. Additionally, future estimates may differ materially from current estimates and assumptions.
Income Taxes
We are taxed as corporation for U.S. federal and state income tax purposes. We use the liability method of accounting for deferred income taxes pursuant to GAAP. Under this method, deferred tax assets and liabilities are recognized for the future tax consequences attributable to temporary differences between the carrying value of existing assets and liabilities and their respective tax bases. Deferred tax assets and liabilities are measured using the statutory tax rates expected to be applied in the periods in which those temporary differences are settled. The effect of a change in tax rates on deferred tax assets and liabilities is recognized during the year the change is enacted. A valuation allowance is recorded on our net deferred tax assets when it is more likely than not that such assets will not be realized or when timing is unknown. When evaluating the realizability of our deferred tax assets, all evidence, both positive and negative, is evaluated. Items considered in this analysis include the ability to carry back losses, the reversal of temporary differences, tax planning strategies and expectations of future earnings.
Under GAAP, the amount of tax benefit to be recognized is the amount of benefit that is more likely than not to be sustained upon examination. We analyze our tax filing positions in all of the U.S. federal, state, local and foreign tax jurisdictions where we are required to file income tax returns, as well as for all open tax years in these jurisdictions. If, based on this analysis, we determine that uncertainties in tax positions exist, a liability is established. We recognize accrued interest and penalties related to unrecognized tax positions within interest expense and general, administrative and other expenses, respectively, within the Consolidated Statements of Operations.
Tax laws are complex and subject to different interpretations by the taxpayer and respective governmental taxing authorities. Significant judgment is required in determining tax expense and in evaluating tax positions, including evaluating uncertainties under GAAP. We review our tax positions quarterly and adjust our tax balances as new legislation is passed or new information becomes available.
Recent Accounting Pronouncements
Information regarding recent accounting pronouncements and their impact on Ares can be found in “Note 2. Summary of Significant Accounting Policies,” within our consolidated financial statements included in this Annual Report on Form 10-K.
Contractual Obligations, Commitments and Contingencies and Other Arrangements
In the normal course of business, we enter into contractual obligations that may require future cash payments. We may also engage in off-balance sheet arrangements, including guarantees, capital commitments to funds, indemnifications and potential contingent repayment obligations. The following table sets forth our contractual obligations and capital commitments of the Company and of the Consolidated Funds as of December 31, 2024 ($ in thousands):
| | | | | | | | | | | | | | | | | | | | | | | | | | | | | | | | |
| | Less than 1 year | | 1 - 3 years | | 4 - 5 years | | Thereafter | | Total |
| The Company: | | | | | | | | | | |
Operating lease obligations(1) | | $ | 57,402 | | | $ | 124,642 | | | $ | 142,187 | | | $ | 711,391 | | | $ | 1,035,622 | |
Debt obligations payable(2) | | — | | | — | | | 495,677 | | | 2,063,237 | | | 2,558,914 | |
Interest obligations on debt(3) | | 157,839 | | | 315,678 | | | 253,647 | | | 1,856,922 | | | 2,584,086 | |
Other long-term obligations(4) | | 5,934 | | | 5,209 | | | 453 | | | — | | | 11,596 | |
Capital commitments(5) | | 1,451,392 | | | — | | | — | | | — | | | 1,451,392 | |
| Subtotal | | 1,672,567 | | | 445,529 | | | 891,964 | | | 4,631,550 | | | 7,641,610 | |
| Consolidated Funds: | | | | | | | | | | |
| Debt obligations payable | | 121,000 | | | 1,286,354 | | | 685 | | | 8,861,486 | | | 10,269,525 | |
Interest obligations on debt(3) | | 572,867 | | | 1,099,802 | | | 1,059,824 | | | 1,937,703 | | | 4,670,196 | |
Capital commitments of Consolidated Funds(5) | | 1,038,225 | | | — | | | — | | | — | | | 1,038,225 | |
| | $ | 3,404,659 | | | $ | 2,831,685 | | | $ | 1,952,473 | | | $ | 15,430,739 | | | $ | 23,619,556 | |
(1)The table includes future minimum commitments for our operating leases, including leases that have been executed but have not yet commenced. The majority of our operating lease obligations represents office space agreements with expirations through June 2043. Rent expense includes only base contractual rent.
(2)Debt obligations include $2,150.0 million of senior notes and $450.0 million of subordinated notes, net of unamortized discount as of December 31, 2024.
(3)Interest obligations reflect future interest payments on outstanding debt obligations with stated interest rates for fixed rate debt and at the prevailing rate in effect as of the reporting date for floating rate debt.
(4)Represents payment obligations with respect to long-term service contracts entered into by the Company and future minimum commitments for our finance leases.
(5)Represents commitments to fund certain investments. These amounts are generally due on demand and are therefore presented as obligations payable in less than one-year.
We entered into a TRA with the TRA Recipients that requires us to pay them 85% of any cash tax savings, if any, realized by AMC from any step-up in tax basis resulting from an exchange of AOG Units for shares of our Class A common stock or, at our option, for cash. Because the timing of amounts to be paid under the TRA cannot be determined, this contractual commitment has not been presented in the table above. The cash tax savings, if any, achieved may not ensure that we have sufficient cash available to pay this liability, and we may be required to incur additional debt to satisfy this liability.
For further discussion of our capital commitments, indemnification arrangements and contingent liabilities, see “Note 8. Commitments and Contingencies,” within our consolidated financial statements included in this Annual Report on Form 10-K.
Item 7A. Quantitative and Qualitative Disclosures About Market Risk
Our primary exposure to market risk is related to our role as general partner or investment adviser to our funds and the sensitivity to movements in the fair value of their investments, including the effect on management fees, carried interest, incentive fees and investment income.
Market Risk
The market price of investments may significantly fluctuate during the period of investment. Investments may decline in value due to factors affecting securities markets generally or particular industries represented in the securities markets. The value of an investment may decline due to general market conditions, which are not specifically related to such investment, such as real or perceived adverse economic conditions, changes in the general outlook for corporate earnings, changes in interest or currency rates or adverse investor sentiment generally. It may also decline due to factors that affect a particular industry or industries, such as labor shortages or increased production costs and competitive conditions within an industry.
Our credit orientation has been a central tenet of our business across our debt and equity investment strategies. We believe the combination of high-quality proprietary information flow and a consistent, rigorous approach to managing investments across our strategies has been, and we believe will continue to be, a major driver of our strong risk-adjusted returns and the stability and predictability of our income.
Effect on Management Fees
Management fees are generally based on a defined percentage of fair value of assets, capital commitments, invested capital, NAV, net investment income, total assets or par value of the investment portfolios we manage. Management fees calculated based on fair value of assets or net investment income are affected by short-term changes in market values.
The overall impact of a short-term change in market value may be mitigated by a number of factors including, but not limited to, fee definitions that are not based on market value including invested capital and capital commitments, market value definitions that exclude the impact of realized and/or unrealized gains and losses, market value definitions based on beginning of the period values or a form of average market value including daily, monthly or quarterly averages as well monthly or quarterly payment terms.
For the year ended December 31, 2024, management fees from funds that are impacted by changes in market value and have underlying investments held in liquid strategies were approximately 2%. As such, a hypothetical 10% decrease in fair value of our managed funds’ investments as of December 31, 2024 would not have a material impact on our management fees.
Effect on Carried Interest and Incentive Fees
We earn carried interest and incentive fees from certain of our funds when such funds achieve specified performance criteria. Our carried interest and incentive fees will be impacted by changes in market risk factors. However, several major factors will influence the degree of impact, including, but not limited to, the following:
•the performance criteria for each individual fund in relation to how that fund’s results of operations are impacted by changes in market risk factors;
•whether such performance criteria are measured annually or over the life of the fund;
•to the extent applicable, the prior-period performance of each fund in relation to its performance criteria; and
•whether each funds’ performance related distributions are subject to contingent repayment.
As a result, the impact of changes in market risk factors on carried interest and incentive fees will vary widely from fund to fund. An overall increase of 10% in the general equity markets would not necessarily drive the same impact on our funds’ ability to generate income or its asset valuations, as a significant portion of our carried interest and incentive fees are from credit-based investments and are generally based on income. Additionally, as a large percentage of our carried interest and incentive fees are paid to employees as performance related compensation, the overall net impact to our income would be mitigated by lower compensation payments.
See “Note 8. Commitments and Contingencies,” within our consolidated financial statements included in this Annual Report on Form 10-K for discussion on amount of carried interest, net of tax distributions, subject to contingent repayment if we assumed all existing investments were worthless.
Effect on Investment Income
An investment gain (loss) is realized when all or a portion of our investment is returned to us. Unrealized investment gain (loss) results from changes in the fair value of the underlying investment as well as the reversal of unrealized appreciation (depreciation) at the time an investment is realized.
Changes in the fair values of our funds’ investments directly impact unrealized principal investment income and unrealized gains on investments. A hypothetical incremental 10% decrease in the fair value of our investments as of December 31, 2024 would result in declines in principal investment income and unrealized gains on investments of $120.7 million and $73.6 million, respectively.
Exchange Rate Risk
We and our funds hold cash and investments that are denominated in foreign currencies that may be affected by movements in the rate of exchange between those currencies and the U.S. dollar. Movements in the exchange rate between currencies impact the management fees, carried interest and incentive fees earned by funds with fee paying AUM denominated in foreign currencies as well as by funds with fee paying AUM denominated in U.S. dollars that hold investments denominated in foreign currencies. Additionally, movements in the exchange rate impact operating expenses for our global offices that transact in foreign currencies and the revaluation of assets and liabilities denominated in non-functional currencies, including cash balances and investments.
We manage our exposure to exchange rate risks through our regular operating activities, wherein we utilize payments received in foreign currencies to fulfill obligations in foreign currencies, and, when appropriate, through the use of derivative financial instruments to hedge: (i) the net foreign currency exposure in the funds that we advise; (ii) the balance sheet exposure for certain direct investments denominated in foreign currencies; and (iii) the cash flow exposure for foreign currencies.
A portion of our management fees, carried interest, incentive fees and investments are denominated in foreign currencies that may be affected by movements in the rate of exchange between currencies. We estimate that a hypothetical 10% decline in the rate of exchange of all foreign currencies against the U.S. dollar as of December 31, 2024 would not result in a material change to management fees, carried interest, incentive fees or investments for the year ended December 31, 2024, and would be largely offset by the currency conversions of the expenses denominated in foreign currencies.
Interest Rate Risk
Our Credit Facility provides a $1.4 billion revolving line of credit, with an accordion feature of $600.0 million (subject to obtaining commitments for any such additional borrowing capacity), with a maturity date of March 31, 2029. As of December 31, 2024, we had no borrowings outstanding under the Credit Facility. For a further discussion of our Credit Facility, see “Note 6. Debt,” within our consolidated financial statements included in this Annual Report on Form 10-K.
We estimate that in the event of a 100 basis point increase in interest rates, to the extent there is an outstanding revolver balance, we would be subject to the variable rate and would expect our interest expense to increase commensurately.
As credit-oriented investors, we are also subject to interest rate risk through the securities we hold in our Consolidated Funds. A 100 basis point increase in interest rates would be expected to negatively affect the fair value of securities that accrue interest income at fixed rates and therefore negatively impact net change in unrealized gains on our investments and on the investments of the Consolidated Funds. The actual impact is dependent on the average duration and the amount of such holdings. Conversely, securities that accrue interest at variable rates would be expected to benefit from a 100 basis points increase in interest rates because these securities would generate higher levels of current income. This would positively impact interest and dividend income but have an offsetting decrease in the fair value of the securities and negatively impact the net change in unrealized gains. In the cases where our funds pay management fees based on NAV, we would expect our management fees to experience a change in direction and magnitude corresponding to that experienced by the underlying portfolios.
Credit Risk
We are party to agreements providing for various financial services and transactions that contain an element of risk in the event that the counterparties are unable to meet the terms of such agreements. In such agreements, we depend on the counterparty to make payment or otherwise perform. We generally endeavor to minimize our risk of exposure by limiting to reputable financial institutions as the counterparties with which we enter into financial transactions. In other circumstances, availability of financing from financial institutions may be uncertain due to market events, and we may not be able to access these financing markets.
In the ordinary course of business, we may extend loans to our funds or guarantee credit facilities held by our funds and could be subject to risk of loss or repayment if our funds do not perform.
Certain of our funds’ investments include lower-rated and comparable quality unrated distressed investments and other instruments. These issuers can be more sensitive to adverse market conditions, such as a recession or increasing interest rates, as compared to higher rated issuers. We seek to minimize risk exposure by subjecting each prospective investment to our rigorous, credit-oriented investment approach.
Item 8. Financial Statements and Supplementary Data
The information required by this item is incorporated by reference to the consolidated financial statements and accompanying notes set forth in the F-pages of this Annual Report on Form 10-K.
Item 9. Changes in and Disagreements with Accountants on Accounting and Financial Disclosure
None.
Item 9A. Controls and Procedures
Evaluation of Disclosure Controls and Procedures
We maintain disclosure controls and procedures (as that term is defined in Rules 13a-15(e) and 15d-15(e) under the Exchange Act) that are designed to ensure that information required to be disclosed in our reports under the Exchange Act is recorded, processed, summarized and reported within the time periods specified in the SEC’s rules and forms, and that such information is accumulated and communicated to our management, including our principal executive officer and principal financial officer, as appropriate, to allow timely decisions regarding required disclosures. Any controls and procedures, no matter how well designed and operated, can provide only reasonable assurance of achieving the desired control objectives. Our management, with the participation of our principal executive officer and principal financial officer, has evaluated the effectiveness of the design and operation of our disclosure controls and procedures as of December 31, 2024. Based upon that evaluation and subject to the foregoing, our principal executive officer and principal financial officer concluded that, as of December 31, 2024, the design and operation of our disclosure controls and procedures were effective to accomplish their objectives at the reasonable assurance level.
Changes in Internal Control over Financial Reporting
There have been no changes in our internal control over financial reporting (as defined in Rule 13a-15(f) and 15d-15(f) under the Exchange Act) during the quarter ended December 31, 2024 that have materially affected, or that are reasonably likely to materially affect, our internal control over financial reporting.
Report of Management on Internal Control Over Financial Reporting
Our management is responsible for establishing and maintaining adequate internal control over financial reporting for the Company. Internal control over financial reporting is a process to provide reasonable assurance regarding the reliability of our financial reporting for external purposes in accordance with accounting principles generally accepted in the United States of America. Internal control over financial reporting includes maintaining records that in reasonable detail accurately and fairly reflect our transactions; providing reasonable assurance that transactions are recorded as necessary for preparation of our consolidated financial statements; providing reasonable assurance that receipts and expenditures of company assets are made in accordance with management authorization; and providing reasonable assurance that unauthorized acquisition, use or disposition of company assets that could have a material effect on our consolidated financial statements would be prevented or detected on a timely basis. Because of its inherent limitations, internal control over financial reporting is not intended to provide absolute assurance that a material misstatement of our consolidated financial statements would be prevented or detected.
Management conducted an evaluation of the effectiveness of our internal control over financial reporting based on the framework in Internal Control — Integrated Framework (2013) issued by the Committee of Sponsoring Organizations of the Treadway Commission. Based on this evaluation, management concluded that the Company’s internal control over financial reporting was effective as of December 31, 2024. The Company’s independent registered public accounting firm, Ernst & Young LLP, has issued an audit report on the effectiveness of the Company’s internal control over financial reporting. Their report follows.
Report of Independent Registered Public Accounting Firm
To the Stockholders and the Board of Directors of Ares Management Corporation
Opinion on Internal Control Over Financial Reporting
We have audited Ares Management Corporation’s internal control over financial reporting as of December 31, 2024 based on criteria established in Internal Control—Integrated Framework issued by the Committee of Sponsoring Organizations of the Treadway Commission (2013 framework) (the “COSO criteria”). In our opinion, Ares Management Corporation (the “Company”) maintained, in all material respects, effective internal control over financial reporting as of December 31, 2024, based on the COSO criteria.
We also have audited, in accordance with the standards of the Public Company Accounting Oversight Board (United States) (“PCAOB”), the consolidated statements of financial condition of the Company as of December 31, 2024 and 2023, the related consolidated statements of operations, comprehensive income, changes in equity and cash flows for each of the three years in the period ended December 31, 2024, and the related notes and our report dated February 27, 2025 expressed an unqualified opinion thereon.
Basis for Opinion
The Company’s management is responsible for maintaining effective internal control over financial reporting and for its assessment of the effectiveness of internal control over financial reporting included in the accompanying Report of Management on Internal Control Over Financial Reporting. Our responsibility is to express an opinion on the Company’s internal control over financial reporting based on our audit. We are a public accounting firm registered with the PCAOB and are required to be independent with respect to the Company in accordance with the U.S. federal securities laws and the applicable rules and regulations of the Securities and Exchange Commission and the PCAOB.
We conducted our audit in accordance with the standards of the PCAOB. Those standards require that we plan and perform the audit to obtain reasonable assurance about whether effective internal control over financial reporting was maintained in all material respects.
Our audit included obtaining an understanding of internal control over financial reporting, assessing the risk that a material weakness exists, testing and evaluating the design and operating effectiveness of internal control based on the assessed risk, and performing such other procedures as we considered necessary in the circumstances. We believe that our audit provides a reasonable basis for our opinion.
Definition and Limitations of Internal Control Over Financial Reporting
A company’s internal control over financial reporting is a process designed to provide reasonable assurance regarding the reliability of financial reporting and the preparation of financial statements for external purposes in accordance with generally accepted accounting principles. A company’s internal control over financial reporting includes those policies and procedures that (1) pertain to the maintenance of records that, in reasonable detail, accurately and fairly reflect the transactions and dispositions of the assets of the company; (2) provide reasonable assurance that transactions are recorded as necessary to permit preparation of financial statements in accordance with generally accepted accounting principles, and that receipts and expenditures of the company are being made only in accordance with authorizations of management and directors of the company; and (3) provide reasonable assurance regarding prevention or timely detection of unauthorized acquisition, use, or disposition of the company’s assets that could have a material effect on the financial statements.
Because of its inherent limitations, internal control over financial reporting may not prevent or detect misstatements. Also, projections of any evaluation of effectiveness to future periods are subject to the risk that controls may become inadequate because of changes in conditions, or that the degree of compliance with the policies or procedures may deteriorate.
/s/ Ernst & Young LLP
Los Angeles, California
February 27, 2025
Item 9B. Other Information
Rule 10b5-1 Trading Plans
During the three months ended December 31, 2024, certain of our executive officers and directors or a vehicle controlled by them (each, a “Plan Participant”) entered into Rule 10b5-1 trading plan (a “Rule 10b5-1 Trading Plan”) to sell shares of our Class A common stock, in each case, subject to any applicable volume limitations.
The table below provides certain information regarding each Plan Participant’s Rule 10b5-1 Trading Plan.
| | | | | | | | | | | | | | | | | | | | |
| Name and Title | | Plan Date | | Maximum Shares That May Be Sold Under the Plan | | Plan Expiration Date |
| Bennett Rosenthal, Director, Co-Founder and Chairman of Private Equity Group | | November 19, 2024 | | 100,000 | | August 15, 2025 |
| David Kaplan, Director and Co-Founder | | November 19, 2024 | | 100,000 | | August 15, 2025 |
| | | | | | |
| Michael Arougheti, Co-Founder & Chief Executive Officer | | December 13, 2024 | | 1,880,845 | | January 31, 2026 |
| | | | | | |
A Rule 10b5-1 Trading Plan is a written document that pre-establishes the amounts, prices and dates (or formulas for determining the amounts, prices and dates) of future purchases or sales of our common stock, including, if applicable, shares issued upon exercise of stock options or vesting of unvested awards.
Each Plan Participant’s Rule 10b5-1 Trading Plan was adopted during an authorized trading period and when such Plan Participant was not in possession of material non-public information and is intended to satisfy the affirmative defense of Rule 10b5-1(c) under the Exchange Act.
Item 9C. Disclosure Regarding Foreign Jurisdictions that Prevent Inspections
Not applicable.
PART III.
Item 10. Directors, Executive Officers and Corporate Governance
The information required by this item is incorporated by reference to our definitive Proxy Statement for the 2025 Annual Meeting of Stockholders to be filed with the Securities and Exchange Commission within 120 days of December 31, 2024.
Item 11. Executive Compensation
The information required by this item is incorporated by reference to our definitive Proxy Statement for the 2025 Annual Meeting of Stockholders to be filed with the Securities and Exchange Commission within 120 days of December 31, 2024.
Item 12. Security Ownership of Certain Beneficial Owners and Management and Related Shareholder Matters
The information required by this item is incorporated by reference to our definitive Proxy Statement for the 2025 Annual Meeting of Stockholders to be filed with the Securities and Exchange Commission within 120 days of December 31, 2024.
Item 13. Certain Relationships and Related Transactions, and Director Independence
The information required by this item is incorporated by reference to our definitive Proxy Statement for the 2025 Annual Meeting of Stockholders to be filed with the Securities and Exchange Commission within 120 days of December 31, 2024.
Item 14. Principal Accounting Fees and Services
The information required by this item is incorporated by reference to our definitive Proxy Statement for the 2025 Annual Meeting of Stockholders to be filed with the Securities and Exchange Commission within 120 days of December 31, 2024.
PART IV.
Item 15. Exhibits and Financial Statement Schedules
(a)Documents Filed with Report: | | |
| Report of Independent Registered Public Accounting Firm (PCAOB ID: 42) |
| Consolidated Statements of Financial Condition as of December 31, 2024 and 2023 |
| Consolidated Statements of Operations for the years ended December 31, 2024, 2023 and 2022 |
| Consolidated Statements of Comprehensive Income for the years ended December 31, 2024, 2023 and 2022 |
| Consolidated Statements of Changes in Equity for the years ended December 31, 2024, 2023 and 2022 |
| Consolidated Statements of Cash Flows for the years ended December 31, 2024, 2023 and 2022 |
| Notes to Consolidated Financial Statements |
(b)Exhibits.
The following is a list of all exhibits filed or furnished as part of this report.
| | | | | | | | |
Exhibit
No. | | Description |
| | Second Amended and Restated Certificate of Incorporation of Ares Management Corporation (incorporated by reference to Exhibit 3.1 to the Registrant’s Quarterly Report on Form 10-Q (File No. 001-36429) filed with the SEC on November 7, 2022). |
| | Bylaws of Ares Management Corporation (incorporated by reference to Exhibit 99.4 to the Registrant’s Current Report on Form 8-K (File No. 001-36429) filed with the SEC on November 15, 2018). |
| | Certificate of Designations of 6.75% Series B Mandatory Convertible Preferred Stock (incorporated by reference to Exhibit 3.1 to the Registrant’s Current Report on Form 8-K (File No. 001-36429) filed with the SEC on October 10, 2024). |
| | Description of Ares Management Corporation’s Securities. |
| | Indenture dated as of June 15, 2020 among Ares Finance Co. II LLC, Ares Holdings L.P., Ares Investments L.P., Ares Management LLC, Ares Investments Holdings LLC, Ares Finance Co. LLC and Ares Offshore Holdings L.P. and U.S. Bank National Association, as trustee (incorporated by reference to Exhibit 4.1 to the Registrant’s Current Report on Form 8-K (File No. 001-36429) filed with the SEC on June 15, 2020). |
| | First Supplemental Indenture dated as of June 15, 2020 among Ares Finance Co. II LLC, Ares Holdings L.P., Ares Investments L.P., Ares Management LLC, Ares Investments Holdings LLC, Ares Finance Co. LLC and Ares Offshore Holdings L.P. and U.S. Bank National Association, as trustee (incorporated by reference to Exhibit 4.2 to the Registrant’s Current Report on Form 8-K (File No. 001-36429) filed with the SEC on June 15, 2020). |
| | Form of 3.250% Senior Note due 2030 (incorporated by reference to Exhibit 4.2 to the Registrant’s Current Report on Form 8-K (File No. 001-36429) filed with the SEC on June 15, 2020). |
| | Indenture dated as of June 30, 2021 among Ares Finance Co. III LLC, Ares Holdings L.P., Ares
Investments Holdings LLC, Ares Management LLC, Ares Finance Co. LLC, Ares Finance Co. II LLC and
U.S. Bank National Association, as trustee (incorporated by reference to Exhibit 4.1 to the Registrant’s Current Report on 8-K (File No. 001-36429) filed with the SEC on July 1, 2021). |
| | Form of 4.125% Fixed Rate Resettable Subordinated Notes due 2051 incorporated by reference to Exhibit 4.1 to the Registrant’s Current Report on Form 8-K (File No. 001-36429) filed with the SEC on July 1, 2021). |
| | Indenture dated as of January 21, 2022 among Ares Finance Co. IV LLC, Ares Holdings L.P., Ares Investments Holdings LLC, Ares Management LLC, Ares Finance Co. LLC, Ares Finance Co. II LLC, Ares Finance Co. III LLC and U.S. Bank National Association, as trustee (incorporated by reference to Exhibit 4.1 to the Registrant’s Current Report on 8-K (File No. 001-36429) filed with the SEC on January 21, 2022). |
| | First Supplemental Indenture dated as of January 21, 2022 among Ares Finance Co. IV LLC, Ares Holdings L.P., Ares Investments Holdings LLC, Ares Management LLC, Ares Finance Co. LLC, Ares Finance Co. II LLC, Ares Finance Co. III LLC and U.S. Bank National Association, as trustee (incorporated by reference to Exhibit 4.2 to the Registrant’s Current Report on Form 8-K (File No. 001-36429) filed with the SEC on January 21, 2022). |
| | Form of 3.650% Senior Note due 2052 (incorporated by reference to Exhibit 4.2 to the Registrant’s Current Report on Form 8-K (File No. 001-36429) filed with the SEC on January 21, 2022). |
| | | | | | | | |
Exhibit
No. | | Description |
| | Base Indenture, dated as of November 10, 2023, by and between Ares Management Corporation and U.S. Bank Trust Company, National Association, as trustee (incorporated by reference to Exhibit 4.1 to Registrant’s Current Report on Form 8-K (File No. 001-36429) filed with the SEC on November 13, 2023). |
| | First Supplemental Indenture, dated as of November 10, 2023, by and among Ares Management Corporation, Ares Holdings L.P., Ares Management LLC, Ares Investments Holdings LLC, Ares Finance Co. LLC, Ares Finance Co. II LLC, Ares Finance Co. III LLC and Ares Finance Co. IV LLC, as the guarantors, and U.S. Bank Trust Company, National Association, as trustee (incorporated by reference to Exhibit 4.2 to Registrant’s Current Report on Form 8-K (File No. 001-36429) filed with the SEC on November 13, 2023). |
| | Form 6.375% Senior Notes due 2028 (incorporated by reference to Exhibit 4.2 to the Registrant’s Current Report on Form 8-K (File No. 001-36429) filed with the SEC on November 13, 2023). |
| | Form of 6.75% Series B Mandatory Convertible Preferred Stock (incorporated by reference to Exhibit 4.1 to the Registrant’s Current Report on Form 8-K (File No. 001-36429) filed with the SEC on October 10, 2024). |
| | Second Supplemental Indenture, dated as of October 11, 2024, by and among Ares Management Corporation, as the issuer, Ares Holdings L.P., Ares Management LLC, Ares Investments Holdings LLC, Ares Finance Co. LLC, Ares Finance Co. II LLC, Ares Finance Co. III LLC and Ares Finance Co. IV LLC, as the guarantors, and U.S. Bank Trust Company, National Association, as trustee (incorporated by reference to Exhibit 4.2 to the Registrant’s Current Report on Form 8-K (File No. 001-36429) filed with the SEC on October 11, 2024). |
| | Form of 5.600% Senior Notes due 2054 (incorporated by reference to Exhibit 4.3 to the Registrant’s
Current Report on Form 8-K (File No. 001-36429) filed with the SEC on October 11, 2024). |
| | Fifth Amended and Restated Limited Partnership Agreement of Ares Holdings L.P., dated October 10, 2024 (incorporated by reference to Exhibit 10.1 to the Registrant's Current Report on Form 8-K (File No. 001-36429) filed with the SEC on October 10, 2024). |
| | Investor Rights Agreement, dated November 26, 2018 (incorporated by reference to Exhibit 10.2 to the Registrant’s Annual Report on Form 10-K for the year ended December 31, 2021 (File No. 001-36429) filed with the SEC on February 28, 2022). |
| | Third Amended & Restated 2014 Equity Incentive Plan (incorporated by reference to Exhibit 10.3 to the Registrant’s Annual Report on Form 10-K for the year ended December 31, 2021 (File No. 001-36429) filed with the SEC on February 28, 2022). |
| | Fifth Amended and Restated Exchange Agreement, dated April 1, 2021 (incorporated by reference to Exhibit 10.4 to the Registrant’s Annual Report on Form 10-K for the year ended December 31, 2021 (File No. 001-36429) filed with the SEC on February 28, 2022). |
| | Fourth Amended and Restated Tax Receivable Agreement, dated May 1, 2023 (incorporated by reference to Exhibit 10.1 to the Registrant’s Quarterly Report on Form 10-Q (File No. 001-36429) filed with the SEC on May 8, 2023). |
| | Sixth Amended and Restated Credit Agreement, dated as of April 21, 2014, by and among Ares Holdings LLC, Ares Domestic Holdings L.P., Ares Investments LLC, Ares Real Estate Holdings L.P., the Guarantors party thereto, the Lenders party thereto and JPMorgan Chase Bank, N.A. (incorporated by reference to Exhibit 10.10 to the Registrant’s Registration Statement on Form S-1/A (File No. 333-194919) filed with the SEC on April 28, 2014). |
| | Amendment No. 1, dated as of July 15, 2014, to the Sixth Amended and Restated Senior Credit Agreement, dated as of April 21, 2014, by and among Ares Holdings L.P., Ares Domestic Holdings L.P., Ares Investments L.P., Ares Real Estate Holdings L.P., the Guarantors party thereto, the Lenders party thereto and JPMorgan Chase Bank, N.A. (incorporated by reference to Exhibit 10.1 to the Registrant’s Quarterly Report on Form 10‑Q (File No. 001-36429) filed with the SEC on November 12, 2014). |
| | Amendment No. 2, dated as of September 24, 2014, to the Sixth Amended and Restated Senior Credit Agreement, dated as of April 21, 2014, by and among Ares Holdings L.P., Ares Domestic Holdings L.P., Ares Investments L.P., Ares Real Estate Holdings L.P., the Guarantors party thereto, the Lenders party thereto and JPMorgan Chase Bank, N.A. (incorporated by reference to Exhibit 10.2 to the Registrant’s Quarterly Report on Form 10‑Q (File No. 001-36429) filed with the SEC on November 12, 2014). |
| | Amendment No. 3, dated as of July 23, 2015, to the Sixth Amended and Restated Senior Credit Agreement, dated as of April 21, 2014, by and among Ares Holdings L.P., Ares Domestic Holdings L.P., Ares Investments L.P., Ares Real Estate Holdings L.P., the Guarantors party thereto, the Lenders party thereto and JPMorgan Chase Bank, N.A. (incorporated by reference to Exhibit 10.1 to the Registrant’s Current Report on Form 8‑K (File No. 001-36429) filed with the SEC on July 28, 2015). |
| | | | | | | | |
Exhibit
No. | | Description |
| | Amendment No. 4, dated as of August 5, 2015, to the Sixth Amended and Restated Senior Credit Agreement, dated as of April 21, 2014, by and among Ares Holdings L.P., Ares Domestic Holdings L.P., Ares Investments L.P., Ares Real Estate Holdings L.P., the Guarantors party thereto, the Lenders party thereto and JPMorgan Chase Bank, N.A. (incorporated by reference to Exhibit 10.1 to the Registrant’s Current Report on Form 8‑K (File No. 001-36429) filed with the SEC on August 7, 2015). |
| | Amendment No. 5, dated as of December 16, 2015, to the Sixth Amended and Restated Senior Credit Agreement, dated as of April 21, 2014, by and among Ares Holdings L.P., Ares Domestic Holdings L.P., Ares Investments L.P., Ares Real Estate Holdings L.P., the Guarantors party thereto, the Lenders party thereto and JPMorgan Chase Bank, N.A. (incorporated by reference to Exhibit 10.1 to the Registrant’s Current Report on Form 8‑K (File No. 001-36429) filed with the SEC on December 21, 2015). |
| | Amendment No. 6, dated as of May 23, 2016, to the Sixth Amended and Restated Senior Credit Agreement, dated as of April 21, 2014, by and among Ares Holdings L.P., Ares Domestic Holdings L.P., Ares Investments L.P., Ares Real Estate Holdings L.P., the Guarantors party thereto, the Lenders party thereto and JPMorgan Chase Bank, N.A. (incorporated by reference to Exhibit 10.1 to the Registrant’s Current Report on Form 8-K (File No. 001-36429) filed with the SEC on May 26, 2016). |
| | Amendment No. 7, dated as of February 24, 2017, to the Sixth Amended and Restated Senior Credit Agreement, dated as of April 21, 2014, by and among Ares Holdings L.P., Ares Investments L.P., the Guarantors party thereto, the Lenders party thereto and JPMorgan Chase Bank, N.A. (incorporated by reference to Exhibit 10.15 to the Registrant’s Annual Report on Form 10-K for the year ended December 31, 2016 (File No. 001-36429), filed with the SEC on February 27, 2017). |
| | Amendment No. 8, dated as of March 21, 2019, to the Sixth Amended and Restated Senior Credit Agreement, dated as of April 21, 2014, by and among Ares Holdings L.P., Ares Investments L.P., the Guarantors party thereto, the Lenders party thereto and JPMorgan Chase Bank, N.A. (incorporated by reference to Exhibit 10.1 to the Registrant’s Current Report on Form 8-K (File No. 001-36429) filed with the SEC on March 26, 2019). |
| | Amendment No. 9, dated as of March 30, 2020, to the Sixth Amended and Restated Senior Credit Agreement, dated as of April 21, 2014, by and among Ares Holdings L.P., Ares Investments L.P., the Guarantors party thereto, the Lenders party thereto and JPMorgan Chase Bank, N.A. (incorporated by reference to Exhibit 10.1 to the Registrant’s Current Report on Form 8-K (File No. 001-36429) filed with the SEC on April 1, 2020). |
| | Amendment No. 10, dated as of March 31, 2021, to the Sixth Amended and Restated Senior Credit Agreement, dated as of April 21, 2014, by and among Ares Holdings L.P., Ares Investments L.P., the Guarantors party thereto, the Lenders party thereto and JPMorgan Chase Bank, N.A. (incorporated by reference to Exhibit 10.1 to the Registrant’s Current Report on Form 8-K (File No. 001-36429) filed with the SEC on April 2, 2021). |
| | Second Amended and Restated Investment Advisory and Management Agreement, dated June 6, 2019, between Ares Capital Corporation and Ares Capital Management LLC (incorporated by reference to Exhibit 10.2 to the Registrant’s Quarterly Report on Form 10-Q (File No. 001-36429) filed with the SEC on November 6, 2019). |
| | Form of Restricted Unit Agreement under the Second Amended & Restated 2014 Equity Incentive Plan (incorporated by reference to Exhibit 10.2 to the Registrant’s Registration Statement on Form S-8 POS (File No. 333-225271) filed with the SEC on November 26, 2018). |
| | Form of Option Agreement under the Second Amended & Restated 2014 Equity Incentive Plan (incorporated by reference to Exhibit 10.21 to the Registrant’s Annual Report on Form 10-K for the year ended December 31, 2021 (File No. 001-36429) filed with the SEC on February 28, 2022). |
| | Form of ARCC Incentive Fee Award (incorporated by reference to Exhibit 10.16 to the Registrant’s Registration Statement on Form S‑1/A (File No. 333-194919) filed with the SEC on April 11, 2014). |
| | Form of Amended and Restated Limited Partnership Agreement of Carry Vehicles (incorporated by reference to Exhibit 10.28 to the Registrant’s Annual Report on Form 10-K for the year ended December 31, 2015 (File No. 001-36429), filed with the SEC on February 29, 2016). |
| | Form of Supplemental Agreement for Carried Interest (incorporated by reference to Exhibit 10.29 to the Registrant’s Annual Report on Form 10-K for the year ended December 31, 2015 (File No. 001-36429), filed with the SEC on February 29, 2016). |
| | Form of Annual Incentive Fee Award Letter (incorporated by reference to Exhibit 10.24 to the Registrant’s Annual Report on Form 10-K for the year ended December 31, 2016 (File No. 001-36429), filed with the SEC on February 27, 2017). |
| | Form of Annual Incentive Fee Award Letter (incorporated by reference to Exhibit 10.26 to the Registrant’s
Annual Report on Form 10-K for the year ended December 31, 2023 (File No. 001-36429) filed with the
SEC on February 27, 2024). |
| | | | | | | | |
Exhibit
No. | | Description |
| | Form of Deferred Restricted Unit Agreement under the Second Amended & Restated 2014 Equity Incentive Plan (incorporated by reference to Exhibit 10.3 to the Registrant’s Registration Statement on Form S-8 POS (File No. 333-225271) filed with the SEC on November 26, 2018). |
| | Investor Rights Agreement, dated March 31, 2020, by and between Sumitomo Mitsui Banking Corporation and Ares Management Corporation (incorporated by reference to Exhibit 10.32 to the Registrant’s Annual Report on Form 10-K for the year ended December 31, 2021 (File No. 001-36429) filed with the SEC on February 28, 2022). |
| | Form of Executive Officer Time-Based Restricted Unit Agreement under the Second Amended & Restated 2014 Equity Incentive Plan (incorporated by reference to Exhibit 10.35 to the Registrant’s Annual Report on Form 10-K for the year ended December 31, 2020 (File No. 001-36429) filed with the SEC on February 25, 2021). |
| | Form of Indemnification Agreement (incorporated by reference to Exhibit 10.35 to the Registrant’s Annual Report on Form 10-K for the year ended December 31, 2021 (File No. 001-36429) filed with the SEC on February 28, 2022). |
| | Nomination Agreement, dated February 23, 2022, by and between Ares Management Corporation and Ares Partners Holdco LLC (incorporated by reference to Exhibit 10.37 to the Registrant’s Annual Report on Form 10-K for the year ended December 31, 2021 (File No. 001-36429) filed with the SEC on February 28, 2022). |
| | Amendment No. 11, dated as of March 31, 2022, to the Sixth Amended and Restated Senior Credit Agreement, dated as of April 21, 2014, by and among Ares Holdings L.P., the Guarantors party thereto, the Lenders party thereto and JPMorgan Chase Bank, N.A. (incorporated by reference to Exhibit 10.1 to the Registrant’s Current Report on Form 8-K (File No. 001-36429) filed with the SEC on April 6, 2022). |
| | Form of Restricted Unit Agreement under the Third Amended & Restated 2014 Equity Incentive Plan. |
| | Form of Deferred Restricted Unit Agreement under the Third Amended & Restated 2014 Equity Incentive Plan. |
| | Ares Management Corporation 2023 Equity Incentive Plan (incorporated herein by reference to Annex B
to the Registrant’s Definitive Proxy Statement (File No. 001-36429) filed with the Commission on April
28, 2023). |
| | Form of Restricted Unit Agreement under the 2023 Equity Incentive Plan (incorporated by reference to Exhibit 10.3 to the Registrant’s Registration Statement on Form S-8 (File No. 333-273232) filed with the SEC on July 13, 2023). |
| | Form of Deferred Restricted Unit Agreement under the 2023 Equity Incentive Plan (incorporated by reference to Exhibit 10.4 to the Registrant’s Registration Statement on Form S-8 (File No. 333-273232) filed with the SEC on July 13, 2023). |
| | Form of Director Restricted Unit Agreement under the 2023 Equity Incentive Plan (incorporated by reference to Exhibit 10.5 to the Registrant’s Registration Statement on Form S-8 (File No. 333-273232) filed with the SEC on July 13, 2023). |
| | Form of Executive Officer Time-Based Restricted Unit Agreement under the 2023 Equity Incentive Plan (incorporated by reference to Exhibit 10.6 to the Registrant’s Registration Statement on Form S-8 (File No. 333-273232) filed with the SEC on July 13, 2023). |
| | Form of Executive Officer Performance-Based Restricted Unit Agreement under the 2023 Equity Incentive Plan (incorporated by reference to Exhibit 10.7 to the Registrant’s Registration Statement on Form S-8 (File No. 333-273232) filed with the SEC on July 13, 2023). |
| | Form of Annual Incentive Fee Restricted Unit Agreement under the 2023 Equity Incentive Plan (incorporated by reference to Exhibit 10.47 to the Registrant’s Annual Report on Form 10-K for the year
ended December 31, 2023 (File No. 001-36429) filed with the SEC on February 27, 2024). |
| | Form of Aircraft Time Sharing Agreement (incorporated by reference to Exhibit 10.48 to the Registrant’s
Annual Report on Form 10-K for the year ended December 31, 2023 (File No. 001-36429) filed with the
SEC on February 27, 2024). |
| | Amendment No. 12, dated as of March 28, 2024, to the Sixth Amended and Restated Credit Agreement, dated as of April 21, 2014, by and among Ares Holdings L.P., the Guarantors party thereto, the Lenders party thereto and JPMorgan Chase Bank, N.A. (incorporated by reference to Exhibit 10.1 to the Registrant’s Current Report on Form 8-K (File No. 001-36429) filed with the SEC on April 3, 2024). |
| | Insider Trading Policy. |
| | Subsidiaries of Ares Management Corporation. |
| | Consent of Ernst and Young LLP, Independent Registered Public Accounting Firm. |
| | Certification of the Chief Executive Officer pursuant to Rule 13a-14(a). |
| | | | | | | | |
Exhibit
No. | | Description |
| | Certification of the Chief Financial Officer pursuant to Rule 13a-14(a). |
| | Certification of the Chief Executive Officer and Chief Financial Officer pursuant to 18 U.S.C. Section 1350. |
| | Policy Relating to Recovery of Erroneously Awarded Compensation (Clawback Policy). |
| 101.INS* | | Inline XBRL Instance Document. |
| 101.SCH* | | Inline XBRL Taxonomy Extension Schema Document. |
| 101.CAL* | | Inline XBRL Taxonomy Extension Calculation Linkbase Document. |
| 101.DEF* | | Inline XBRL Taxonomy Extension Definition Linkbase Document. |
| 101.LAB* | | Inline XBRL Taxonomy Extension Label Linkbase Document. |
| 101.PRE* | | Inline XBRL Taxonomy Extension Presentation Linkbase Document. |
| 104* | | Cover Page Interactive Data File - the cover page interactive data file does not appear in the Interactive Data File because its XBRL tags are embedded within the Inline XBRL document. |
* Filed herewith.
** These certifications are not deemed filed by the SEC and are not to be incorporated by reference in any filing we make under the Securities Act of 1933 or the Securities Exchange Act of 1934, irrespective of any general incorporation language in any filings.
# Denotes a management contract or compensation plan or arrangement.
Item 16. Form 10-K Summary
None.
SIGNATURES
Pursuant to the requirements of Section 13 or 15(d) of the Securities Exchange Act of 1934, the registrant has duly caused this report to be signed on its behalf by the undersigned, thereunto duly authorized.
| | | | | | | | | | | |
| | ARES MANAGEMENT CORPORATION |
| | | | |
| | | | |
| Dated: February 27, 2025 | | By: | /s/ Michael J Arougheti |
| | | Name: | Michael J Arougheti |
| | | Title: | Co-Founder & Chief Executive Officer
(Principal Executive Officer) |
Pursuant to the requirements of the Securities Exchange Act of 1934, this report has been signed below by the following persons on behalf of the registrant and in the capacities and on the dates indicated.
| | | | | | | | | | | | | | |
| By: | /s/ Antony P. Ressler | | |
| | Name: | Antony P. Ressler | | Dated: February 27, 2025 |
| | Title: | Executive Chairman & Co-Founder | | |
| | | | |
| By: | /s/ Michael J Arougheti | | |
| | Name: | Michael J Arougheti | | Dated: February 27, 2025 |
| | Title: | Director, Co-Founder & Chief Executive Officer
(Principal Executive Officer) | | |
| | | |
| By: | /s/ Jarrod Phillips | | |
| | Name: | Jarrod Phillips | | Dated: February 27, 2025 |
| | Title: | Chief Financial Officer
(Principal Financial & Accounting Officer) | | |
| | | | |
| By: | /s/ R. Kipp deVeer | | |
| | Name: | R. Kipp deVeer | | Dated: February 27, 2025 |
| | Title: | Director & Co-President | | |
| | | | |
| By: | /s/ David B. Kaplan | | |
| Name: | David B. Kaplan | | Dated: February 27, 2025 |
| | Title: | Director & Co-Founder | | |
| | | | |
| By: | /s/ Bennett Rosenthal | | |
| | Name: | Bennett Rosenthal | | Dated: February 27, 2025 |
| | Title: | Director, Co-Founder & Chairman of Private Equity Group | | |
| | | | |
| By: | /s/ Ashish Bhutani | | |
| Name: | Ashish Bhutani | | Dated: February 27, 2025 |
| Title: | Director | | |
| | | | |
| By: | /s/ Antoinette Bush | | |
| Name: | Antoinette Bush | | Dated: February 27, 2025 |
| Title: | Director | | |
| | | | |
| By: | /s/ Paul G. Joubert | | |
| | Name: | Paul G. Joubert | | Dated: February 27, 2025 |
| | Title: | Director | | |
| | | | |
| By: | /s/ Michael Lynton | | |
| | Name: | Michael Lynton | | Dated: February 27, 2025 |
| | Title: | Director | | |
| | | | |
| By: | /s/ Eileen Naughton | | |
| Name: | Eileen Naughton | | Dated: February 27, 2025 |
| Title: | Director | | |
| | | | |
| By: | /s/ Judy D. Olian | | |
| | Name: | Dr. Judy D. Olian | | Dated: February 27, 2025 |
| | Title: | Director | | |
INDEX TO CONSOLIDATED FINANCIAL STATEMENTS
Report of Independent Registered Public Accounting Firm
To the Stockholders and the Board of Directors of Ares Management Corporation
Opinion on the Financial Statements
We have audited the accompanying consolidated statements of financial condition of Ares Management Corporation (the “Company”) as of December 31, 2024 and 2023, the related consolidated statements of operations, comprehensive income, changes in equity and cash flows for each of the three years in the period ended December 31, 2024, and the related notes (collectively referred to as the “consolidated financial statements”). In our opinion, the consolidated financial statements present fairly, in all material respects, the financial position of the Company at December 31, 2024 and 2023, and the results of its operations and its cash flows for each of the three years in the period ended December 31, 2024, in conformity with U.S. generally accepted accounting principles.
We also have audited, in accordance with the standards of the Public Company Accounting Oversight Board (United States) (“PCAOB”), the Company's internal control over financial reporting as of December 31, 2024, based on criteria established in Internal Control—Integrated Framework issued by the Committee of Sponsoring Organizations of the Treadway Commission (2013 framework), and our report dated February 27, 2025 expressed an unqualified opinion thereon.
Basis for Opinion
These financial statements are the responsibility of the Company's management. Our responsibility is to express an opinion on the Company’s financial statements based on our audits. We are a public accounting firm registered with the PCAOB and are required to be independent with respect to the Company in accordance with the U.S. federal securities laws and the applicable rules and regulations of the Securities and Exchange Commission and the PCAOB.
We conducted our audits in accordance with the standards of the PCAOB. Those standards require that we plan and perform the audit to obtain reasonable assurance about whether the financial statements are free of material misstatement, whether due to error or fraud. Our audits included performing procedures to assess the risks of material misstatement of the financial statements, whether due to error or fraud, and performing procedures that respond to those risks. Such procedures included examining, on a test basis, evidence regarding the amounts and disclosures in the financial statements. Our audits also included evaluating the accounting principles used and significant estimates made by management, as well as evaluating the overall presentation of the financial statements. We believe that our audits provide a reasonable basis for our opinion.
Critical Audit Matter
The critical audit matter communicated below is a matter arising from the current period audit of the financial statements that was communicated or required to be communicated to the audit committee and that: (1) relates to accounts or disclosures that are material to the financial statements and (2) involved our especially challenging, subjective or complex judgments. The communication of the critical audit matter does not alter in any way our opinion on the consolidated financial statements, taken as a whole, and we are not, by communicating the critical audit matter below, providing a separate opinion on the critical audit matter or on the accounts or disclosures to which it relates.
Valuation of underlying investments of equity method investments
| | | | | |
| Description of the Matter | At December 31, 2024, the carrying value of the Company’s investments totaled $4,644.8 million, primarily consisting of equity method private investment partnership interests - principal of $536.9 million and equity method - carried interest of $3,495.1 million. Management applies valuation techniques using significant unobservable inputs to arrive at the fair value of the underlying investments held by the equity method private investment partnership (“underlying investments”). The fair value of the underlying investments, as estimated by management, impacts the Company’s equity method private investment partnership interests and equity method - carried interest. The valuation techniques applied and the significant unobservable inputs are discussed in Note 2. Summary of Significant Accounting Policies to the consolidated financial statements.
Auditing the fair value of the underlying investments that are valued using significant unobservable inputs is complex and involves a high degree of auditor subjectivity to address the higher estimation uncertainty. |
How We Addressed the Matter
in Our Audit | We obtained an understanding, evaluated the design and tested the operating effectiveness of controls over the Company’s investment valuation process for the underlying investments. This included management’s review controls over the assessment of the valuation techniques and significant unobservable inputs used to estimate the fair value of the underlying investments and management’s review of the completeness and accuracy of the data used in these estimates.
Our audit procedures included, among others, evaluating, on a sample basis, the valuation techniques and significant unobservable inputs used by the Company in valuing the underlying investments and testing, on a sample basis, the mathematical accuracy of the related valuation models.
For example, for a sample of underlying investments that were valued using the market approach, we performed procedures to evaluate the appropriateness of significant unobservable inputs such as the selected earnings before interest, taxes, depreciation and amortization multiples or revenue multiples that were derived from comparable companies. These procedures included assessing the appropriateness of management’s determination of the comparable companies, and, where applicable, comparing the selected multiples to market observed transactions of such companies. For a sample of underlying investments that were valued using the discounted cash flow valuation technique, we performed procedures to evaluate the appropriateness of significant unobservable inputs such as the selected discount rates and projections of future cash flows. These procedures included comparing the selected discount rates to market data and/or recalculating these discount rates, such as the underlying investment’s weighted average cost of capital. In addition, these procedures included comparing future projections to the current performance and the historical growth rates of the investees as well as to the growth rates of publicly traded comparable companies.
In some instances, with the involvement of our valuation specialists, we independently developed fair value estimates using market information and compared our estimates to the fair value of the underlying investments. We searched for and evaluated information that corroborated or contradicted the significant unobservable inputs. We also evaluated subsequent events and transactions and considered whether they corroborated or contradicted the year-end valuations.
|
/s/ Ernst & Young LLP
We have served as the Company’s auditor since 2011.
Los Angeles, California
February 27, 2025
Ares Management Corporation
Consolidated Statements of Financial Condition
(Amounts in Thousands, Except Share Data) | | | | | | | | | | | |
| As of December 31, |
| 2024 | | 2023 |
| |
| | | |
| | | |
| Assets | | | |
| Cash and cash equivalents | $ | 1,507,976 | | | $ | 348,274 | |
| Investments (includes accrued carried interest of $3,495,115 and $3,413,007 as of December 31, 2024 and 2023, respectively) | 4,644,775 | | | 4,624,932 | |
| Due from affiliates | 1,056,608 | | | 896,746 | |
| Other assets | 774,654 | | | 429,979 | |
| Right-of-use operating lease assets | 511,319 | | | 249,326 | |
| Intangible assets, net | 975,828 | | | 1,058,495 | |
| Goodwill | 1,162,636 | | | 1,123,976 | |
| Assets of Consolidated Funds: | | | |
| Cash and cash equivalents | 1,227,489 | | | 1,149,511 | |
| Investments held in trust account | 550,800 | | | 523,038 | |
| Investments, at fair value | 12,187,044 | | | 14,078,549 | |
| | | |
| Receivable for securities sold | 202,782 | | | 146,851 | |
| Other assets | 82,397 | | | 100,823 | |
| Total assets | $ | 24,884,308 | | | $ | 24,730,500 | |
| Liabilities | | | |
| Accounts payable, accrued expenses and other liabilities | $ | 363,872 | | | $ | 233,884 | |
| Accrued compensation | 280,894 | | | 287,259 | |
| Due to affiliates | 500,480 | | | 240,254 | |
| Performance related compensation payable | 2,537,203 | | | 2,514,610 | |
| Debt obligations | 2,558,914 | | | 2,965,480 | |
| Operating lease liabilities | 641,864 | | | 319,572 | |
| Liabilities of Consolidated Funds: | | | |
| Accounts payable, accrued expenses and other liabilities | 323,100 | | | 189,523 | |
| Due to affiliates | — | | | 3,554 | |
| Payable for securities purchased | 332,406 | | | 484,117 | |
| CLO loan obligations, at fair value | 9,672,189 | | | 12,345,657 | |
| Fund borrowings | 275,000 | | | 125,241 | |
| Total liabilities | 17,485,922 | | | 19,709,151 | |
| Commitments and contingencies (Note 8) | | | |
| Redeemable interest in Consolidated Funds | 550,700 | | | 522,938 | |
| Redeemable interest in Ares Operating Group entities | 23,496 | | | 24,098 | |
| Non-controlling interests in Consolidated Funds | 2,025,666 | | | 1,258,445 | |
| Non-controlling interests in Ares Operating Group entities | 1,254,878 | | | 1,322,469 | |
| Stockholders’ Equity | | | |
| | | |
| Series B mandatory convertible preferred stock, $0.01 par value, 1,000,000,000 shares authorized (30,000,000 shares issued and outstanding as of December 31, 2024) | 1,458,771 | | | — | |
| Class A common stock, $0.01 par value, 1,500,000,000 shares authorized (199,872,571 shares and 187,069,907 shares issued and outstanding as of December 31, 2024 and 2023, respectively) | 1,999 | | | 1,871 | |
| Non-voting common stock, $0.01 par value, 500,000,000 shares authorized (3,489,911 shares issued and outstanding as of December 31, 2024 and 2023) | 35 | | | 35 | |
| Class B common stock, $0.01 par value, 1,000 shares authorized (1,000 shares issued and outstanding as of December 31, 2024 and 2023) | — | | | — | |
| Class C common stock, $0.01 par value, 499,999,000 shares authorized (109,806,689 shares and 117,024,758 shares issued and outstanding as of December 31, 2024 and 2023, respectively) | 1,098 | | | 1,170 | |
| Additional paid-in-capital | 2,936,794 | | | 2,391,036 | |
| Accumulated deficit | (837,294) | | | (495,083) | |
| Accumulated other comprehensive loss, net of tax | (17,757) | | | (5,630) | |
| Total stockholders’ equity | 3,543,646 | | | 1,893,399 | |
| Total equity | 6,824,190 | | | 4,474,313 | |
| Total liabilities, redeemable interest, non-controlling interests and equity | $ | 24,884,308 | | | $ | 24,730,500 | |
See accompanying notes to the consolidated financial statements.
Ares Management Corporation
Consolidated Statements of Operations
(Amounts in Thousands, Except Share Data)
| | | | | | | | | | | | | | | | | | | | | |
| | | | Year ended December 31, |
| | | | | | 2024 | | 2023 | | 2022 |
| Revenues | | | | | | | | | |
| Management fees | | | | | $ | 2,942,126 | | | $ | 2,551,150 | | | $ | 2,136,433 | |
| Carried interest allocation | | | | | 390,180 | | | 618,579 | | | 458,012 | |
| Incentive fees | | | | | 344,157 | | | 276,627 | | | 301,187 | |
| Principal investment income | | | | | 45,424 | | | 36,516 | | | 12,279 | |
| Administrative, transaction and other fees | | | | | 162,894 | | | 149,012 | | | 147,532 | |
| Total revenues | | | | | 3,884,781 | | | 3,631,884 | | | 3,055,443 | |
| Expenses | | | | | | | | | |
| Compensation and benefits | | | | | 1,731,747 | | | 1,486,698 | | | 1,498,590 | |
| Performance related compensation | | | | | 449,564 | | | 607,522 | | | 518,829 | |
| General, administrative and other expenses | | | | | 736,501 | | | 660,146 | | | 695,256 | |
| | | | | | | | | |
| Expenses of Consolidated Funds | | | | | 20,879 | | | 43,492 | | | 36,410 | |
| Total expenses | | | | | 2,938,691 | | | 2,797,858 | | | 2,749,085 | |
| Other income (expense) | | | | | | | | | |
| Net realized and unrealized gains on investments | | | | | 16,570 | | | 77,573 | | | 4,732 | |
| Interest and dividend income | | | | | 43,054 | | | 19,276 | | | 9,399 | |
| Interest expense | | | | | (142,966) | | | (106,276) | | | (71,356) | |
| Other income, net | | | | | 627 | | | 4,819 | | | 13,119 | |
| Net realized and unrealized gains on investments of Consolidated Funds | | | | | 313,963 | | | 262,700 | | | 73,386 | |
| Interest and other income of Consolidated Funds | | | | | 933,349 | | | 995,545 | | | 586,529 | |
| Interest expense of Consolidated Funds | | | | | (835,335) | | | (754,600) | | | (411,361) | |
| Total other income, net | | | | | 329,262 | | | 499,037 | | | 204,448 | |
| Income before taxes | | | | | 1,275,352 | | | 1,333,063 | | | 510,806 | |
| Income tax expense | | | | | 164,617 | | | 172,971 | | | 71,891 | |
| Net income | | | | | 1,110,735 | | | 1,160,092 | | | 438,915 | |
| Less: Net income attributable to non-controlling interests in Consolidated Funds | | | | | 295,772 | | | 274,296 | | | 119,333 | |
| Net income attributable to Ares Operating Group entities | | | | | 814,963 | | | 885,796 | | | 319,582 | |
| Less: Net income (loss) attributable to redeemable interest in Ares Operating Group entities | | | | | 103 | | | 226 | | | (851) | |
| Less: Net income attributable to non-controlling interests in Ares Operating Group entities | | | | | 351,118 | | | 411,244 | | | 152,892 | |
| Net income attributable to Ares Management Corporation | | | | | 463,742 | | | 474,326 | | | 167,541 | |
| | | | | | | | | |
| | | | | | | | | |
| Less: Series B mandatory convertible preferred stock dividends declared | | | | | 22,781 | | | — | | | — | |
| | | | | | | | | |
| Net income attributable to Ares Management Corporation Class A and non-voting common stockholders | | | | | $ | 440,961 | | | $ | 474,326 | | | $ | 167,541 | |
| Net income per share of Class A and non-voting common stock: | | | | | | | | | |
| Basic | | | | | $ | 2.04 | | | $ | 2.44 | | | $ | 0.87 | |
| Diluted | | | | | $ | 2.04 | | | $ | 2.42 | | | $ | 0.87 | |
| Weighted-average shares of Class A and non-voting common stock: | | | | | | | | | |
| Basic | | | | | 198,054,451 | | | 184,523,524 | | | 175,510,798 | |
| Diluted | | | | | 198,054,451 | | | 195,773,426 | | | 175,510,798 | |
Substantially all revenue is earned from affiliated funds of the Company.
See accompanying notes to the consolidated financial statements.
Ares Management Corporation
Consolidated Statements of Comprehensive Income
(Amounts in Thousands)
| | | | | | | | | | | | | | | | | | | | | | | | |
| | | | Year ended December 31, |
| | | | | | | 2024 | | 2023 | | 2022 |
| Net income | | | | | | $ | 1,110,735 | | | $ | 1,160,092 | | | $ | 438,915 | |
| Foreign currency translation adjustments, net of tax | | | | | | (32,221) | | | 19,855 | | | (33,911) | |
| Total comprehensive income | | | | | | 1,078,514 | | | 1,179,947 | | | 405,004 | |
| Less: Comprehensive income attributable to non-controlling interests in Consolidated Funds | | | | | | 283,042 | | | 278,813 | | | 107,793 | |
| Less: Comprehensive income (loss) attributable to redeemable interest in Ares Operating Group entities | | | | | | (300) | | | 185 | | | (1,277) | |
| Less: Comprehensive income attributable to non-controlling interests in Ares Operating Group entities | | | | | | 344,157 | | | 417,267 | | | 144,078 | |
| Comprehensive income attributable to Ares Management Corporation | | | | | | $ | 451,615 | | | $ | 483,682 | | | $ | 154,410 | |
See accompanying notes to the consolidated financial statements.
Ares Management Corporation
Consolidated Statements of Changes in Equity
(Amounts in Thousands) | | | | | | | | | | | | | | | | | | | | | | | | | | | | | | | | | | | | | | | | | | | | | | | | | | | | | | | | | | | | | | | | | |
| | | | | Series B Mandatory Convertible Preferred Stock | | | | Class A Common Stock | | Non- voting
Common Stock | | Class C Common Stock | | Additional Paid-in-Capital | | Accumulated Deficit | | Accumulated
Other
Comprehensive
Income (Loss) | | Non-Controlling
Interest in
Ares Operating
Group Entities | | Non-Controlling
Interest in Consolidated
Funds | | Total
Equity |
| Balance as of December 31, 2021 | | | | | $ | — | | | | | $ | 1,684 | | | $ | 35 | | | $ | 1,186 | | | $ | 1,913,559 | | | $ | (89,382) | | | $ | (1,855) | | | $ | 1,397,747 | | | $ | 591,452 | | | $ | 3,814,426 | |
| | | | | | | | | | | | | | | | | | | | | | | | | |
| Changes in ownership interests and related tax benefits | | | | | — | | | | | 43 | | | — | | | (14) | | | (96,413) | | | — | | | — | | | (105,680) | | | 4,006 | | | (198,058) | |
| Issuances of common stock | | | | | — | | | | | 1 | | | — | | | — | | | 12,834 | | | — | | | — | | | — | | | — | | | 12,835 | |
| Capital contributions | | | | | — | | | | | — | | | — | | | — | | | — | | | — | | | — | | | 5,195 | | | 549,396 | | | 554,591 | |
| | | | | | | | | | | | | | | | | | | | | | | | | |
| Dividends/distributions | | | | | — | | | | | — | | | — | | | — | | | — | | | (447,634) | | | — | | | (386,843) | | | (178,291) | | | (1,012,768) | |
| Net income | | | | | — | | | | | — | | | — | | | — | | | — | | | 167,541 | | | — | | | 152,892 | | | 119,333 | | | 439,766 | |
| Currency translation adjustment, net of tax | | | | | — | | | | | — | | | — | | | — | | | — | | | — | | | (13,131) | | | (8,814) | | | (11,540) | | | (33,485) | |
| Equity compensation | | | | | — | | | | | — | | | — | | | — | | | 119,580 | | | — | | | — | | | 80,526 | | | — | | | 200,106 | |
| Stock option exercises | | | | | — | | | | | 11 | | | — | | | — | | | 21,194 | | | — | | | — | | | — | | | — | | | 21,205 | |
| Balance as of December 31, 2022 | | | | | — | | | | | 1,739 | | | 35 | | | 1,172 | | | 1,970,754 | | | (369,475) | | | (14,986) | | | 1,135,023 | | | 1,074,356 | | | 3,798,618 | |
| | | | | | | | | | | | | | | | | | | | | | | | | |
| Changes in ownership interests and related tax benefits | | | | | — | | | | | 59 | | | — | | | (2) | | | (60,755) | | | — | | | — | | | 93,956 | | | (313,781) | | | (280,523) | |
| Issuances of common stock | | | | | — | | | | | 26 | | | — | | | — | | | 239,519 | | | — | | | — | | | — | | | — | | | 239,545 | |
| Capital contributions | | | | | — | | | | | — | | | — | | | — | | | — | | | — | | | — | | | 3,887 | | | 320,185 | | | 324,072 | |
| Dividends/distributions | | | | | — | | | | | — | | | — | | | — | | | — | | | (599,934) | | | — | | | (427,849) | | | (101,128) | | | (1,128,911) | |
| Net income | | | | | — | | | | | — | | | — | | | — | | | — | | | 474,326 | | | — | | | 411,244 | | | 274,296 | | | 1,159,866 | |
| Currency translation adjustment, net of tax | | | | | — | | | | | — | | | — | | | — | | | — | | | — | | | 9,356 | | | 6,023 | | | 4,517 | | | 19,896 | |
| Equity compensation | | | | | — | | | | | — | | | — | | | — | | | 155,606 | | | — | | | — | | | 100,185 | | | — | | | 255,791 | |
| Stock option exercises | | | | | — | | | | | 47 | | | — | | | — | | | 85,912 | | | — | | | — | | | — | | | — | | | 85,959 | |
| Balance as of December 31, 2023 | | | | | — | | | | | 1,871 | | | 35 | | | 1,170 | | | 2,391,036 | | | (495,083) | | | (5,630) | | | 1,322,469 | | | 1,258,445 | | | 4,474,313 | |
| Changes in ownership interests and related tax benefits | | | | | — | | | | | 96 | | | — | | | (73) | | | (87,278) | | | — | | | — | | | (23,841) | | | (30,954) | | | (142,050) | |
| Issuance of Series B mandatory convertible preferred stock | | | | | 1,458,771 | | | | | — | | | — | | | — | | | — | | | — | | | — | | | — | | | — | | | 1,458,771 | |
| Issuances of common stock | | | | | — | | | | | 31 | | | — | | | 1 | | | 407,093 | | | — | | | — | | | 7,724 | | | — | | | 414,849 | |
| Capital contributions | | | | | — | | | | | — | | | — | | | — | | | — | | | — | | | — | | | 3,373 | | | 639,154 | | | 642,527 | |
| | | | | | | | | | | | | | | | | | | | | | | | | |
| Dividends/distributions | | | | | (22,781) | | | | | — | | | — | | | — | | | — | | | (783,172) | | | — | | | (527,422) | | | (124,021) | | | (1,457,396) | |
| Net income | | | | | 22,781 | | | | | — | | | — | | | — | | | — | | | 440,961 | | | — | | | 351,118 | | | 295,772 | | | 1,110,632 | |
| Currency translation adjustment, net of tax | | | | | — | | | | | — | | | — | | | — | | | — | | | — | | | (12,127) | | | (6,961) | | | (12,730) | | | (31,818) | |
| Equity compensation | | | | | — | | | | | — | | | — | | | — | | | 224,433 | | | — | | | — | | | 128,418 | | | — | | | 352,851 | |
| Stock option exercises | | | | | — | | | | | 1 | | | — | | | — | | | 1,510 | | | — | | | — | | | — | | | — | | | 1,511 | |
| Balance as of December 31, 2024 | | | | | $ | 1,458,771 | | | | | $ | 1,999 | | | $ | 35 | | | $ | 1,098 | | | $ | 2,936,794 | | | $ | (837,294) | | | $ | (17,757) | | | $ | 1,254,878 | | | $ | 2,025,666 | | | $ | 6,824,190 | |
See accompanying notes to the consolidated financial statements.
Ares Management Corporation
Consolidated Statements of Cash Flows
(Amounts in Thousands)
| | | | | | | | | | | | | | | | | |
| | Year ended December 31, |
| | 2024 | | 2023 | | 2022 |
| Cash flows from operating activities: | | | | | |
| Net income | $ | 1,110,735 | | | $ | 1,160,092 | | | $ | 438,915 | |
| Adjustments to reconcile net income to net cash provided by (used in) operating activities: | | | | | |
| Equity compensation expense | 352,851 | | | 255,965 | | | 200,391 | |
| Depreciation and amortization | 158,578 | | | 231,712 | | | 341,341 | |
| Net realized and unrealized (gains) losses on investments | (21,463) | | | (90,737) | | | 10,929 | |
| | | | | |
| Other non-cash amounts | 11,755 | | | 74 | | | — | |
| Investments purchased | (580,744) | | | (507,932) | | | (371,124) | |
| Proceeds from sale of investments | 683,638 | | | 206,163 | | | 182,493 | |
| Adjustments to reconcile net income to net cash provided by (used in) operating activities allocable to non-controlling interests in Consolidated Funds: | | | | | |
| Net realized and unrealized gains on investments | (313,963) | | | (262,700) | | | (73,386) | |
| Other non-cash amounts | (48,963) | | | (101,465) | | | (33,822) | |
| Investments purchased | (5,927,444) | | | (8,847,856) | | | (9,434,029) | |
| Proceeds from sale of investments | 7,569,165 | | | 8,149,617 | | | 8,198,812 | |
| Cash flows due to changes in operating assets and liabilities: | | | | | |
| Net carried interest and incentive fees receivable | (188,174) | | | (48,858) | | | (20,612) | |
| Due to/from affiliates | 223,498 | | | (220,421) | | | 39,073 | |
| Other assets | (252,644) | | | 21,532 | | | (105,205) | |
| Accrued compensation and benefits | (7,096) | | | 20,383 | | | 200,769 | |
| Accounts payable, accrued expenses and other liabilities | 148,384 | | | 27,864 | | | (51,685) | |
| Cash flows due to changes in operating assets and liabilities allocable to redeemable and non-controlling interest in Consolidated Funds: | | | | | |
| Change in cash and cash equivalents held at Consolidated Funds | (77,978) | | | (424,870) | | | 324,550 | |
| Net cash relinquished with deconsolidation of Consolidated Funds | (46,205) | | | (623) | | | — | |
| Change in other assets and receivables held at Consolidated Funds | (49,774) | | | (20,247) | | | 151,895 | |
| Change in other liabilities and payables held at Consolidated Funds | 46,998 | | | 219,046 | | | (733,417) | |
| Net cash provided by (used in) operating activities | 2,791,154 | | | (233,261) | | | (734,112) | |
| Cash flows from investing activities: | | | | | |
| Purchase of furniture, equipment and leasehold improvements, net of disposals | (91,509) | | | (67,183) | | | (35,796) | |
| Acquisitions, net of cash acquired | (67,895) | | | (43,896) | | | (301,583) | |
| Net cash used in investing activities | (159,404) | | | (111,079) | | | (337,379) | |
| Cash flows from financing activities: | | | | | |
| Net proceeds from issuance of Series B mandatory convertible preferred stock | 1,458,771 | | | — | | | — | |
| Net proceeds from issuance of Class A common stock | 407,124 | | | — | | | — | |
| Proceeds from Credit Facility | 1,210,000 | | | 1,410,000 | | | 1,380,000 | |
| Proceeds from issuance of senior notes | 736,010 | | | 499,010 | | | 488,915 | |
| | | | | |
| Repayments of Credit Facility | (2,105,000) | | | (1,215,000) | | | (1,095,000) | |
| Repayment of senior notes | (250,000) | | | — | | | — | |
| Dividends and distributions | (1,310,896) | | | (1,030,666) | | | (836,364) | |
| | | | | |
| | | | | |
| | | | | |
| | | | | |
| Stock option exercises | 1,511 | | | 85,959 | | | 21,205 | |
| Taxes paid related to net share settlement of equity awards | (227,532) | | | (157,007) | | | (201,311) | |
| Other financing activities | 2,285 | | | 2,943 | | | 4,055 | |
| Allocable to redeemable and non-controlling interests in Consolidated Funds: | | | | | |
| Contributions from redeemable and non-controlling interests in Consolidated Funds | 639,154 | | | 855,456 | | | 549,396 | |
| Distributions to non-controlling interests in Consolidated Funds | (124,021) | | | (101,128) | | | (178,291) | |
| Redemptions of redeemable interests in Consolidated Funds | — | | | (1,045,874) | | | — | |
| Borrowings under loan obligations by Consolidated Funds | 359,351 | | | 1,387,297 | | | 1,140,680 | |
| Repayments under loan obligations by Consolidated Funds | (2,228,351) | | | (398,864) | | | (145,222) | |
| Net cash provided by (used in) financing activities | (1,431,594) | | | 292,126 | | | 1,128,063 | |
| Effect of exchange rate changes | (40,454) | | | 10,501 | | | (10,240) | |
| Net change in cash and cash equivalents | 1,159,702 | | | (41,713) | | | 46,332 | |
| Cash and cash equivalents, beginning of period | 348,274 | | | 389,987 | | | 343,655 | |
| Cash and cash equivalents, end of period | $ | 1,507,976 | | | $ | 348,274 | | | $ | 389,987 | |
| Supplemental disclosure of non-cash financing activities: | | | | | |
| Equity issued in connection with acquisition-related activities | $ | 21,002 | | | $ | 239,545 | | | $ | 12,835 | |
| Equity issued in connection with settlement of management incentive program | $ | — | | | $ | 245,647 | | | $ | — | |
| Supplemental disclosure of cash flow information: | | | | | |
| | | | | |
| | | | | |
| | | | | |
| | | | | |
| | | | | |
| | | | | |
| | | | | |
| Cash paid during the period for interest | $ | 866,760 | | | $ | 722,643 | | | $ | 320,329 | |
| Cash paid during the period for income taxes | $ | 107,570 | | | $ | 62,007 | | | $ | 104,864 | |
See accompanying notes to the consolidated financial statements.
Ares Management Corporation
Notes to the Consolidated Financial Statements
(Dollars in Thousands, Except Share Data and As Otherwise Noted)
1. ORGANIZATION
Ares Management Corporation (the “Company”), a Delaware corporation, together with its subsidiaries, is a leading global alternative investment manager operating integrated groups across Credit, Real Assets, Private Equity and Secondaries. Information about segments should be read together with “Note 14. Segment Reporting.” Subsidiaries of the Company serve as the general partners and/or investment managers to various funds and managed accounts within each investment group (the “Ares Funds”). These subsidiaries provide investment advisory services to the Ares Funds in exchange for management fees.
The accompanying audited financial statements include the consolidated results of the Company and its subsidiaries. The Company is a holding company that operates and controls all of the businesses and affairs of and conducts all of its material business activities through Ares Holdings L.P. (“Ares Holdings”). Ares Holdings represents all the activities of the “Ares Operating Group” or “AOG” and may be referred to interchangeably. The Company, indirectly through its wholly owned subsidiary, Ares Holdco LLC, is the general partner of the Ares Operating Group entity.
The Company manages or controls certain entities that have been consolidated in the accompanying financial statements as described in “Note 2. Summary of Significant Accounting Policies.” These entities include Ares funds, co-investment vehicles, collateralized loan obligations or funds (collectively “CLOs”) and special purpose acquisition companies (“SPACs”) (collectively, the “Consolidated Funds”).
Including the results of the Consolidated Funds significantly increases the reported amounts of the assets, liabilities, revenues, expenses and cash flows within the accompanying consolidated financial statements. However, the Consolidated Funds results included herein have no direct effect on the net income attributable to Ares Management Corporation or to its stockholders’ equity, except where accounting for a redemption or liquidation preference requires the reallocation of ownership based on specific terms of a profit sharing agreement. Instead, economic ownership interests of the investors in the Consolidated Funds are reflected as redeemable and non-controlling interests in Consolidated Funds. Further, cash flows allocable to redeemable and non-controlling interest in Consolidated Funds are specifically identifiable within the Consolidated Statements of Cash Flows.
2. SUMMARY OF SIGNIFICANT ACCOUNTING POLICIES
Basis of Presentation
The accompanying consolidated financial statements are prepared in accordance with the generally accepted accounting principles in the United States (“GAAP”). The Company’s Consolidated Funds are investment companies under GAAP based on the following characteristics: the Consolidated Funds obtain funds from one or more investors and provide investment management services and the Consolidated Funds’ business purpose and substantive activities are investing funds for returns from capital appreciation and/or investment income. Therefore, investments of Consolidated Funds are recorded at fair value and the unrealized appreciation (depreciation) in an investment’s fair value is recognized on a current basis within the Consolidated Statements of Operations. Additionally, the Consolidated Funds do not consolidate their majority-owned and controlled investments in portfolio companies. In the preparation of these consolidated financial statements, the Company has retained the investment company accounting for the Consolidated Funds under GAAP.
All of the investments held and CLO loan obligations issued by the Consolidated Funds are presented at their estimated fair values within the Company’s Consolidated Statements of Financial Condition. Net income attributable to holders of subordinated notes of the CLOs is presented within net income attributable to non-controlling interests in Consolidated Funds within the Consolidated Statements of Operations.
The Company has reclassified certain prior period amounts to conform to the current year presentation.
Use of Estimates
The preparation of financial statements in conformity with GAAP requires management to make assumptions and estimates that affect the reported amounts of assets and liabilities, the disclosure of contingent assets and liabilities at the date of the financial statements and the reported amounts of revenues, expenses and other income (expense) during the reporting periods. Assumptions and estimates regarding the valuation of investments involve a high degree of judgment and complexity
Ares Management Corporation
Notes to the Consolidated Financial Statements (Continued)
(Dollars in Thousands, Except Share Data and As Otherwise Noted)
and may have a significant impact on net income. Actual results could differ from these estimates and such differences could be material to the consolidated financial statements.
Principles of Consolidation
The Company consolidates those entities in which it has a direct or indirect controlling financial interest based on either a variable interest model (“VIEs”) or voting interest model (“VOE”). As such, the Company consolidates (i) entities in which it holds a majority voting interest or has majority ownership and control over the operational, financial and investing decisions of that entity and (ii) entities that the Company concludes are variable interest entities in which the Company has more than insignificant economic interest and power to direct the activities that most significantly impact the entities, and for which the Company is deemed to be the primary beneficiary.
The Company determines whether an entity should be consolidated by first evaluating whether it holds a variable interest in the entity. Fees that are customary and commensurate with the level of services provided by the Company, and where the Company does not hold other economic interests in the entity that would absorb more than an insignificant amount of the expected losses or returns of the entity, would not be considered a variable interest. The Company factors in all economic interests, including proportionate interests through related parties, to determine if fees are considered a variable interest. As the Company’s interests in funds are primarily management fees, carried interest, incentive fees, and/or insignificant direct or indirect equity interests through related parties, the Company is not considered to have a variable interest in these entities. Entities that are not VIEs are further evaluated for consolidation under the voting interest model.
Variable Interest Model
The Company considers an entity to be a VIE if any of the following conditions exist: (i) the total equity investment at risk is not sufficient to permit the entity to finance its activities without additional subordinated financial support; (ii) the holders of equity investment at risk, as a group, lack either the direct or indirect ability through voting rights or similar rights to make decisions that have a significant effect on the success of the entity or the obligation to absorb the expected losses or right to receive the expected residual returns; or (iii) the voting rights of some equity investors are disproportionate to their obligation to absorb losses of the entity, their rights to receive returns from an entity, or both and substantially all of the entity’s activities either involve or are conducted on behalf of an investor with disproportionately few voting rights.
The Company consolidates all VIEs for which it is the primary beneficiary. The Company determines it is the primary beneficiary when it has the power to direct the activities of the VIE that most significantly impact the entity’s economic performance and the obligation to absorb losses of the entity or the right to receive benefits from the entity that could potentially be significant to the VIE.
The Company determines whether it is the primary beneficiary of a VIE at the time it becomes involved with a VIE and continuously reconsiders the conclusion. In evaluating whether the Company is the primary beneficiary, the Company evaluates its direct and indirect economic interests in the entity. The consolidation analysis is generally performed qualitatively, however, if the primary beneficiary is not readily determinable, a quantitative analysis may also be performed. This analysis requires judgment. These judgments include: (i) determining whether the equity investment at risk is sufficient to permit the entity to finance its activities without additional subordinated financial support; (ii) evaluating whether the equity holders, as a group, can make decisions that have a significant effect on the success of the entity; (iii) determining whether two or more parties’ equity interests should be aggregated; (iv) determining whether the equity investors have proportionate voting rights to their obligations to absorb losses or rights to receive returns from an entity; and (v) evaluating the nature of relationships and activities of the parties involved in determining which party within a related-party group is most closely associated with a VIE and hence would be deemed the primary beneficiary.
Consolidated CLOs
As of December 31, 2024 and 2023, the Company consolidated 27 and 28 CLOs (“Consolidated CLOs”), respectively.
The Company has determined that the fair value of the financial assets of the Consolidated CLOs, which are mostly Level II assets within the GAAP fair value hierarchy, are more observable than the fair value of the financial liabilities of its Consolidated CLOs, which are mostly Level III liabilities within the GAAP fair value hierarchy. As a result, the financial assets of Consolidated CLOs are measured at fair value and the financial liabilities of the Consolidated CLOs are measured in consolidation as: (i) the sum of the fair value of the financial assets, and the carrying value of any nonfinancial assets held
Ares Management Corporation
Notes to the Consolidated Financial Statements (Continued)
(Dollars in Thousands, Except Share Data and As Otherwise Noted)
temporarily, less (ii) the sum of the fair value of any beneficial interests retained by the Company (other than those that represent compensation for services), and the Company’s carrying value of any beneficial interests that represent compensation for services. The resulting amount is allocated to the individual financial liabilities (other than the beneficial interests retained by the Company).
The loan obligations issued by the CLOs are collateralized by diversified asset portfolios and by structured debt or equity. In exchange for managing the collateral for the CLOs, the Company typically earns a variety of management fees, including senior and subordinated management fees, and in some cases, contingent incentive fee income. Investors in the CLOs generally have no recourse against the Company for any losses sustained in the capital structure of each CLO.
Fair Value Measurements
GAAP establishes a hierarchical disclosure framework that prioritizes the inputs used in measuring financial instruments at fair value into three levels based on their market price observability. Market price observability is affected by a number of factors, including the type of instrument and the characteristics specific to the instrument. Financial instruments with readily available quoted prices from an active market or for which fair value can be measured based on actively quoted prices generally have a higher degree of market price observability and a lesser degree of judgment inherent in measuring fair value.
Financial assets and liabilities measured and reported at fair value are classified as follows:
•Level I—Quoted prices in active markets for identical instruments.
•Level II—Quoted prices for similar instruments in active markets; quoted prices for identical or similar instruments in inactive markets; and model-derived valuations with directly or indirectly observable significant inputs. Level II inputs include prices in markets with few transactions, non-current prices, prices for which little public information exists or prices that vary substantially over time or among brokered market makers. Other inputs include interest rate, yield curve, volatility, prepayment risk, loss severity, credit risk and default rate.
•Level III—Valuations that rely on one or more significant unobservable inputs. These inputs reflect the Company’s assessment of the assumptions that market participants would use to value the instrument based on the best information available.
Management's determination of fair value includes various valuation techniques. These techniques may include market approach, recent transaction price, net asset value (“NAV”) approach, discounted cash flows, and may use one or more significant unobservable inputs such as EBITDA or revenue multiples, discount rates, weighted average cost of capital, exit multiples, terminal growth rates and other unobservable inputs.
In some instances, an instrument may fall into more than one level of the fair value hierarchy. In such instances, the instrument’s level within the fair value hierarchy is based on the lowest of the three levels (with Level III being the lowest) that is significant to the fair value measurement. The Company’s assessment of the significance of an input requires judgment and considers factors specific to the instrument. The Company accounts for the transfer of assets into or out of each fair value hierarchy level as of the beginning of the reporting period (see “Note 5. Fair Value” for further detail).
Cash and Cash Equivalents
Cash and cash equivalents for the Company includes investments with maturities at purchase of less than three months, money market funds and demand deposits. Cash and cash equivalents held at Consolidated Funds represents cash that, although not legally restricted, is not available to support the general liquidity needs of the Company, as the use of such amounts is generally limited to the activities of the Consolidated Funds.
As of December 31, 2024 and 2023, the Company had cash balances with financial institutions in excess of Federal Deposit Insurance Corporation insured limits. The Company monitors the credit standing of these financial institutions.
Investments held in trust account
Investments held in trust account represents funds raised through the initial public offerings of the Company’s sponsored SPACs that are presented within Consolidated Funds. The funds raised are held in a trust account that is restricted for
Ares Management Corporation
Notes to the Consolidated Financial Statements (Continued)
(Dollars in Thousands, Except Share Data and As Otherwise Noted)
use and may only be used for purposes of completing an initial business combination or redemption of public shares as set forth in the trust agreement. The portfolio of investments for the SPACs is comprised of United States (“U.S.”) government securities or money market funds meeting certain conditions under Rule 2a-7 promulgated under the Investment Company Act that invest only in direct U.S. government treasury obligation. The U.S. Treasury securities typically have original maturities of six months or less when purchased and are recorded at fair value. Interest income received on such investments is separately presented from the overall change in fair value and is recognized within interest and other income of Consolidated Funds within the Consolidated Statements of Operations. Any remaining change in fair value of such investments, that is not recognized as interest income, is recognized within net realized and unrealized gains on investments of Consolidated Funds within the Consolidated Statements of Operations. As of December 31, 2024 and 2023, the SPACs are invested in U.S Treasury securities.
Investments
The investments of the Company are reflected within the Consolidated Statements of Financial Condition at fair value, with unrealized appreciation (depreciation) resulting from changes in fair value reflected as a component of net realized and unrealized gains on investments within the Consolidated Statements of Operations. Certain investments are denominated in foreign currency and are translated into U.S. dollars at each reporting date.
Equity Method Investments
The Company accounts for its investments in which it has or is otherwise presumed to have significant influence, including investments in unconsolidated funds, strategic investments and carried interest, using the equity method of accounting. The carrying amounts of equity method investments are reflected in investments within the Consolidated Statements of Financial Condition. The carrying value of investments accounted for using equity method accounting is determined based on amounts invested by the Company, adjusted for the equity in earnings or losses of the investee allocated based on the respective partnership agreements, less distributions received.
The Company evaluates the equity method investments for impairment whenever events or changes in circumstances indicate that the carrying amounts of such investments may not be recoverable. Except for carried interest, the Company’s share of the investee’s income and expenses for the Company’s equity method investments is presented either within principal investment income or net realized and unrealized gains on investments within the Consolidated Statements of Operations. Carried interest allocation is presented separately as a revenue line item within the Consolidated Statements of Operations, and the accrued carried interest is presented within investments within the Consolidated Statements of Financial Condition.
In addition, certain of the Company's equity method investments are reported at fair value. The fair value option has been elected to simplify the accounting for certain financial instruments. The fair value option election is irrevocable and is applied to financial instruments on an individual basis at initial recognition or at eligible remeasurement events. Changes in the fair value of such instruments with the fair value option elected are presented within net realized and unrealized gains on investments within the Consolidated Statements of Operations.
Derivative Instruments
In the normal course of business, the Company and the Consolidated Funds are exposed to certain risks relating to their ongoing operations and use various types of derivative instruments primarily to mitigate against interest rate and foreign exchange risk. The derivative instruments are not designated as hedging instruments under the accounting standards for derivatives and hedging. The Company uses various derivative instruments from time to time depending on the risks being managed and generally include foreign currency forward contracts, interest rate swaps, asset swaps and warrants.
The Company reports each of its derivative instruments at fair value within the Consolidated Statements of Financial Condition as either other assets or accounts payable, accrued expenses and other liabilities, respectively. These amounts may be offset to the extent that there is a legal right to offset and if elected by management.
Derivative instruments are marked-to-market daily based upon quotations from pricing services or by the Company and the change in value, if any, is recorded as an unrealized gain (loss). Upon settlement of the instrument, the Company records any realized gain (loss). Changes in value are reflected within net realized and unrealized gains on investments within the Consolidated Statements of Operations.
Ares Management Corporation
Notes to the Consolidated Financial Statements (Continued)
(Dollars in Thousands, Except Share Data and As Otherwise Noted)
Business Combinations
The Company accounts for business combinations using the acquisition method of accounting, under which the purchase price of the acquisition, including the fair value of certain elements of contingent consideration, is allocated to the assets acquired and liabilities assumed using the fair values determined by management as of the acquisition date. Contingent consideration obligations are recognized as of the acquisition date at fair value based on the probability that contingency will be realized. Any fair value of purchase consideration in excess of the fair value of the assets acquired less liabilities assumed is recorded as goodwill. Conversely, any excess of the fair value of the net assets acquired over the purchase consideration is recognized as a bargain purchase gain. Critical estimates in valuing certain of the intangible assets acquired include, but are not limited to, future expected cash inflows and outflows, future fundraising assumptions, expected useful life, discount rates and income tax rates. The acquisition method of accounting allows for a measurement period for up to one year after the acquisition date to make adjustments to the purchase price allocation as the Company obtains more information regarding asset valuations and liabilities assumed. Acquisition-related costs incurred in connection with a business combination are expensed as incurred.
Goodwill and Intangible Assets
Intangible Assets
The Company’s finite-lived intangible assets consists primarily of contractual rights to earn future management fees from the acquired management contracts. Finite-lived intangible assets are amortized on a straight-line basis over their estimated useful lives, ranging from approximately 1.0 to 13.5 years. The purchase price of an acquired management contract is treated as an intangible asset and is amortized over the life of the contract. Amortization is included as part of general, administrative and other expenses within the Consolidated Statements of Operations.
The Company tests finite-lived intangible assets for impairment if certain events occur or circumstances change indicating that the carrying amount of the intangible asset may not be recoverable. The Company evaluates impairment by comparing the estimated undiscounted cash flows attributable to the intangible asset being evaluated with its carrying amount. If an impairment is determined to exist by management, the Company accelerates amortization expense so that the carrying amount represents fair value. The Company estimates fair value using a discounted future cash flow methodology.
The Company tests indefinite-lived intangible assets annually for impairment. If, after assessing qualitative factors, the Company believes that it is more likely than not that the fair value of the indefinite-lived intangible asset is less than its carrying amount, the Company will evaluate impairment quantitatively to determine and record the amount of impairment as the excess of the carrying amount of the indefinite-lived intangible asset over its fair value.
The Company also tests indefinite-lived intangible assets for impairment if certain events occur or circumstances change indicating that the carrying amount of the intangible asset may not be recoverable or if these assets are subsequently determined to have a finite useful life. Inherent in such fair value determinations are certain judgments and estimates relating to future cash flows, including the Company’s strategic plans with regard to the indefinite-lived intangible assets.
Goodwill
Goodwill represents the excess of purchase price of an acquired business over the fair value of its identifiable net assets. The Company tests goodwill annually for impairment. If, after assessing qualitative factors, the Company believes that it is more likely than not that the fair value of the reporting unit is less than its carrying amount, the Company will evaluate impairment quantitatively and record the amount of goodwill impairment as the excess of the carrying amount of the reporting unit over its fair value.
The Company also tests goodwill for impairment in other periods if an event occurs or circumstances change such that it is more likely than not to reduce the fair value of the reporting unit below its carrying amount. Inherent in such fair value determinations are certain judgments and estimates relating to future cash flows, including the Company’s interpretation of current economic indicators and market valuations, and assumptions about the Company’s strategic plans with regard to its operations. Due to the uncertainties associated with such estimates, actual results could differ from such estimates.
Ares Management Corporation
Notes to the Consolidated Financial Statements (Continued)
(Dollars in Thousands, Except Share Data and As Otherwise Noted)
Fixed Assets
Fixed assets, consisting of furniture, fixtures, computer hardware, equipment, internal-use software and leasehold improvements are recorded at cost, less accumulated depreciation and amortization. Fixed assets are presented within other assets within the Company’s Consolidated Statements of Financial Condition.
Direct costs associated with developing, purchasing or otherwise acquiring software for internal use are capitalized and amortized on a straight-line basis over the expected useful life of the software, beginning when the software is ready for its intended purpose. Costs incurred for upgrades and enhancements that will not result in additional functionality are expensed as incurred.
Fixed assets are depreciated or amortized on a straight-line basis over an asset’s estimated useful life, with the corresponding depreciation and amortization expense presented within general, administrative and other expenses within the Company’s Consolidated Statements of Operations. The estimated useful life for leasehold improvements is the lesser of the lease term or the life of the asset, with a maximum of ten years, while other fixed assets and internal-use software are generally depreciated between three and seven years. Fixed assets are reviewed for impairment whenever events or changes in circumstances indicate that the carrying amount of an asset may not be recoverable.
Leases
The Company has entered into operating and finance leases for corporate offices and certain equipment and makes the determination if an arrangement constitutes a lease at inception. Operating leases are presented within right-of-use operating lease assets and operating lease liabilities within the Company’s Consolidated Statements of Financial Condition. Finance lease assets are capitalized as a component of fixed assets and finance lease liabilities are presented within accounts payable, accrued expenses and other liabilities within the Consolidated Statements of Financial Condition. Leases with an initial term of 12 months or less are expensed as incurred and not capitalized within the Consolidated Statements of Financial Condition.
Right-of-use operating lease assets represent the Company’s right to use an underlying asset for the lease term and operating lease liabilities represent the Company’s obligation to make lease payments arising from the lease. Operating lease right-of-use assets and corresponding lease liabilities are recognized at commencement date based on the present value of lease payments over the lease term. As most of the Company’s leases do not provide an implicit rate, the Company uses its incremental borrowing rate based on the information available at commencement date in determining the present value of lease payments. The Company uses the implicit rate when readily determinable. The right-of-use operating lease asset also includes any lease prepayments and excludes lease incentives. Lease terms may include options to extend or terminate the lease when it is reasonably certain that the company will exercise that option. Lease expense is primarily recognized on a straight-line basis over the lease term. The Company has lease agreements with lease and non-lease components, which are generally accounted for separately.
Non-Controlling Interests
The non-controlling interests in AOG entities represent a component of equity and net income attributable to the owners of the Ares Operating Group Units (“AOG Units”) that are not held directly or indirectly by the Company. These owners consist predominantly of Ares Owners Holdings L.P. but also include other strategic distribution partnerships with whom the Company has established joint ventures and other non-controlling strategic investors. Non-controlling interests in AOG entities are adjusted for contributions to and distributions from AOG during the reporting period and are allocated income from the AOG entities either based on their historical ownership percentage for the proportional number of days in the reporting period or based on the activity associated with certain membership interests.
The non-controlling interests in Consolidated Funds represents a component of equity and net income attributable to ownership interests that third parties hold in Consolidated Funds.
Redeemable Interest
Redeemable interest in AOG entities was established in connection with the SSG Acquisition as described in “Note 13. Equity and Redeemable Interest.” Redeemable interest in AOG entities was initially recorded at fair value on the date of acquisition within mezzanine equity within the Consolidated Statements of Financial Condition. Income (loss) is allocated based on the ownership percentage attributable to the redeemable interest. The Company determined that the redemption of the
Ares Management Corporation
Notes to the Consolidated Financial Statements (Continued)
(Dollars in Thousands, Except Share Data and As Otherwise Noted)
redeemable interest is probable as of the date of acquisition. At each balance sheet date, the carrying value of the redeemable interest is presented at the redemption amount, to the extent that the redemption amount exceeds the initial measurement on the date of acquisition. The Company recognizes changes in the redemption amount with corresponding adjustments against retained earnings, or additional paid-in-capital in the absence of retained earnings, within stockholders’ equity within the Consolidated Statements of Financial Condition.
Redeemable interest in Consolidated Funds represent the Class A ordinary shares issued by each of the Company’s sponsored SPACs, as applicable. The Class A ordinary shares issued by the SPACs (the “Class A ordinary shares”) are redeemable for cash by the public shareholders in the event that they do not complete a business combination or tender offer associated with shareholder approval provisions. The Class A ordinary shareholders have redemption rights that are considered to be outside of the SPAC’s control.
Revenue Recognition
The Company recognizes revenue in a way that depicts the transfer of promised goods or services to customers in an amount that reflects the consideration to which the Company expects to be entitled in exchange for those goods or services. The Company’s revenue is based on contracts with a determinable transaction price and distinct performance obligations with probable collectability. Revenues are not recognized until the performance obligation(s) are satisfied.
Management Fees
Management fees are generally based on a defined percentage of fair value of assets, total commitments, invested capital, NAV, NAV plus unfunded commitments, total assets or par value of the investment portfolios managed by the Company. Principally all management fees are earned from affiliated funds of the Company. The contractual terms of management fees vary by fund structure and investment strategy. Management fees are recognized as revenue in the period advisory services are rendered, subject to the Company’s assessment of collectability.
Management fees also include a quarterly fee on the net investment income (“Part I Fees”) of the following publicly-traded and perpetual wealth vehicles:
| | | | | | | | | | | | | | | | | | | | |
| Vehicle | | Annual Fee Rate | | Strategy | | Fee Base |
| | | | | | |
| Credit Group |
| ARCC Part I Fees | | 20.00% | | U.S. Direct Lending | | Net investment income (before ARCC Part I Fees and ARCC Part II Fees), subject to a fixed hurdle rate of 1.75% per quarter, or 7.00% per annum. No fees are recognized until net investment income exceeds a 1.75% hurdle rate, with a catch-up provision to ensure that the Company receives 20.00% of the net investment income from the first dollar earned |
| ASIF Part I Fees | | 12.50% | | U.S. Direct Lending | | Net investment income (before ASIF Part I Fees and ASIF Part II Fees), subject to a fixed hurdle rate of 1.25% per quarter, or 5.00% per annum. No fees are recognized until net investment income exceeds a 1.25% hurdle rate, with a catch-up provision to ensure that the Company receives 12.50% of the net investment income from the first dollar earned |
| CADC Part I Fees | | 15.00% | | U.S. Direct Lending | | Net investment income (before CADC Part I Fees), subject to a fixed hurdle rate of 1.50% per quarter, or 6.00% per annum. No fees are recognized until net investment income exceeds the hurdle rate, with a catch-up provision to ensure that the Company receives 15.00% of the net investment income from the first dollar earned |
| Open-ended European Direct Lending Fund Part I Fees | | 12.50% | | European Direct Lending | | Net investment income (before open-ended European direct lending fund Part I Fees and open-ended European direct lending fund Part II Fees), subject to a fixed hurdle rate of 1.25% per quarter, or 5.00% per annum. No fees are recognized until net investment income exceeds a 1.25% hurdle rate, with a catch-up provision to ensure that the Company receives 12.50% of the net investment income from the first dollar earned |
| Real Assets Group |
| Infrastructure Private BDC Part I Fees | | 12.50% | | Infrastructure Opportunities | | Net investment income (before infrastructure private BDC Part I Fees and infrastructure private BDC Part II Fees), subject to a fixed hurdle rate of 1.25% per quarter, or 5.00% per annum. No fees are recognized until net investment income exceeds a 1.25% hurdle rate, with a catch-up provision to ensure that the Company receives 12.50% of the net investment income from the first dollar earned |
Ares Management Corporation
Notes to the Consolidated Financial Statements (Continued)
(Dollars in Thousands, Except Share Data and As Otherwise Noted)
Carried Interest Allocation
In certain fund structures, carried interest is allocated to the Company based on cumulative fund performance to date, subject to the achievement of minimum return levels in accordance with the respective terms set out in each fund’s investment management agreement. At the end of each reporting period, a fund will allocate carried interest applicable to the Company based upon an assumed liquidation of that fund’s net assets on the reporting date, irrespective of whether such amounts have been realized. Carried interest is recorded to the extent such amounts have been allocated, and may be subject to reversal to the extent that the amount allocated exceeds the amount due to the general partner or investment manager based on a fund’s cumulative investment returns.
As the fair value of underlying assets varies between reporting periods, it is necessary to make adjustments to amounts recorded as carried interest to reflect either: (i) positive performance resulting in an increase in the carried interest allocated to the Company; or (ii) negative performance that would cause the amount due to the Company to be less than the amount previously recognized as revenue, resulting in a reversal of previously recognized carried interest allocated to the Company. Accrued carried interest as of the reporting date is recorded within investments within the Consolidated Statements of Financial Condition.
Carried interest is realized when an underlying investment is profitably disposed of, or upon the return of each limited partner’s capital plus a preferred return, and the fund’s cumulative returns are in excess of the specific hurdle rates as defined in the applicable investment management agreements or governing documents. Since carried interest is subject to reversal, the Company may need to accrue for potential repayment of previously received carried interest. This accrual represents all amounts previously distributed to the Company that would need to be repaid to the funds if the funds were to be liquidated based on the current fair value of the underlying funds’ investments as of the reporting date. The actual repayment obligations, however, generally does not become realized until the end of a fund’s life.
The Company accounts for carried interest, which represents a performance-based capital allocation from an investment fund to the Company, as earnings from financial assets within the scope of ASC 323, Investments—Equity Method and Joint Ventures. The Company recognizes carried interest allocation as a separate revenue line item in the Consolidated Statements of Operations with accrued carried interest as of the reporting date reported within investments within the Consolidated Statements of Financial Condition. Carried interest allocation is earned from affiliated funds of the Company.
Incentive Fees
Incentive fees earned on the performance of certain fund structures, typically in credit funds and certain real estate and secondaries funds, are recognized based on the fund’s performance during the period, subject to the achievement of minimum return levels in accordance with the respective terms set out in each fund’s investment management agreement. Incentive fees are realized at the end of a measurement period, typically annually. Once realized, such fees are no longer subject to reversal.
Principal Investment Income
Principal investment income consists of interest and dividend income and net realized and unrealized gain (loss) from the equity method investments that the Company manages.
Administrative, Transaction and Other Fees
The Company earns other sources of revenue that are classified as administrative, transaction or other fees. These fees are recognized as revenue in the period in which the related services are rendered. Administrative fees represent fees that the Company earns for providing administrative services to certain funds. These fees may either reflect expense reimbursements for costs incurred by certain professionals in performing services for a fund or may be based on fixed percentage of a fund’s invested capital. Transaction fees are typically earned from the arrangement and origination of loans and are generated primarily from funds within the direct lending and infrastructure debt strategies. Other fees includes sales-based and asset-based fees from the Company’s perpetual wealth vehicles and 1031 exchange programs. Other fees may also include: (i) various property-related fees earned from certain real estate funds, such as acquisition, development and property management; and (ii) capital markets transaction fees earned for participating as an underwriter and/or acting as an advisor on capital markets transactions.
Ares Management Corporation
Notes to the Consolidated Financial Statements (Continued)
(Dollars in Thousands, Except Share Data and As Otherwise Noted)
Equity-Based Compensation
The Company recognizes expense related to equity-based compensation for which it receives employee services in exchange for equity instruments of the Company. Equity-based compensation expense represents expenses associated with restricted units and restricted stock (collectively, “unvested awards”) granted under the 2023 Equity Incentive Plan (the “Equity Incentive Plan”).
Equity-based compensation expense for unvested awards is determined based on the fair value of the respective equity award on the grant date and is recognized on a straight-line basis over the requisite service period with a corresponding increase in additional paid-in-capital. The grant date fair value of these equity awards is determined by the most recent closing price of shares of the Company’s Class A common stock.
The Company recognizes share-based award forfeitures in the period they occur as a reversal of previously recognized compensation expense. The reduction in compensation expense is determined based on the specific awards forfeited during that period.
The holders of restricted units, other than awards that have not yet been issued as described in Note 12. Equity Compensation, generally have the right to receive as current compensation an amount in cash equal to: (i) the amount of any dividend paid with respect to a share of Class A common stock multiplied by (ii) the number of restricted units held at the time such dividends are declared (“Dividend Equivalent”). When units are forfeited, the cumulative amount of Dividend Equivalents previously paid is reclassified to compensation and benefits expense within the Consolidated Statements of Operations.
The Company records deferred tax assets or liabilities for equity compensation plan awards based on deductions for income tax purposes of equity-based compensation recognized at the statutory tax rate in the jurisdiction in which the Company is expected to receive a tax deduction. In addition, differences between the deferred tax assets recognized in accordance with GAAP and the actual tax deduction reported in the Company’s income tax returns are presented within income tax expense within the Consolidated Statements of Operations before taking into consideration the tax effects of the investment in AOG.
Equity-based compensation expense is presented within compensation and benefits within the Consolidated Statements of Operations.
Performance Related Compensation
The Company has agreed to pay to certain professionals a portion of the carried interest and incentive fees earned from certain funds, including income from Consolidated Funds that is eliminated in consolidation. Depending on the nature of each fund, carried interest and incentive fees may be structured as a fixed percentage subject to vesting based on continued employment or service (a period not to exceed six years) or as an annual award that is payable for the particular performance year if the recipient remains employed through the payment date. Other limitations may apply to carried interest and incentive fees as set forth in the applicable governing documents of the fund or award documentation. Performance related compensation is recognized in the same period that the related carried interest and incentive fees are recognized. Performance related compensation can be reversed during periods when there is a reversal of carried interest that was previously recognized.
Performance related compensation payable represents the amounts payable to professionals who are entitled to a proportionate share of carried interest in one or more funds and include the associated payroll-related taxes. The liability is calculated based upon the changes to realized and unrealized carried interest. Performance related compensation payable may include any unpaid allocations to charitable organizations as part of the Company’s philanthropic initiatives.
Net Realized and Unrealized Gains/(Losses) on Investments
Realized gains (losses) may occur when the Company redeems all or a portion of its investment, when the Company receives dividends or distributions, or at the end of an investment’s life. Unrealized appreciation (depreciation) results from changes in the fair value of the underlying investment as well as from the reversal of previously recognized unrealized appreciation (depreciation) at the time an investment is realized. Realized and unrealized gains (losses) are presented together as net realized and unrealized gains on investments within the Consolidated Statements of Operations. Also, the Company’s share of the investee’s income and expenses for the Company’s equity method investments that it does not manage is presented within net realized and unrealized gains on investments.
Ares Management Corporation
Notes to the Consolidated Financial Statements (Continued)
(Dollars in Thousands, Except Share Data and As Otherwise Noted)
Interest and Dividend Income
Interest, dividends and other investment income are included within interest and dividend income. Interest income is recognized on an accrual basis using the effective interest method to the extent that such amounts are expected to be collected. Dividends and other investment income are recorded when the right to receive payment is established.
Foreign Currency
The U.S. dollar is the Company’s functional currency; however, certain transactions of the Company may not be denominated in U.S. dollars. Income and expense and gain and loss transactions denominated in foreign currencies are generally translated into U.S. dollars monthly using the average exchange rates during the respective transaction period. Foreign exchange revaluation arising from these transactions is recognized within other income, net within the Consolidated Statements of Operations. For the year ended December 31, 2024, the Company recognized $0.6 million in transaction gains related to foreign currencies revaluation. For the years ended December 31, 2023 and 2022, the Company recognized $9.1 million and $13.5 million, respectively, in transaction losses related to foreign currencies revaluation.
In addition, the consolidated results include certain foreign subsidiaries that use functional currencies other than the U.S. dollar. Assets and liabilities of these foreign subsidiaries are translated to U.S. dollars at the prevailing exchange rates as of the reporting date. Translation adjustments resulting from this process are recorded to currency translation adjustment in accumulated other comprehensive income.
Income Taxes
The Company elects to be taxed as a corporation and all earnings allocated to the Company are subject to U.S. corporate income taxes. A provision for corporate level income taxes imposed on unrealized gains and income items as well as taxes imposed on certain subsidiaries’ earnings is included in the consolidated tax provision. Also included in the consolidated tax provision are entity level income taxes incurred by certain Consolidated Funds. The portion of consolidated earnings not allocated to the Company flows through to owners of the AOG entities without being taxed at the corporate level.
Income taxes are accounted for using the liability method of accounting. Under this method, deferred tax assets and liabilities are recognized for the expected future tax consequences of differences between the carrying amounts of assets and liabilities and their respective tax basis, using tax rates in effect for the year in which the differences are expected to reverse. The effect on deferred assets and liabilities of a change in tax rates is recognized as income, in the period when the change is enacted. Deferred tax assets are reduced by a valuation allowance when it is more likely than not that some portion or all of the deferred tax assets will not be realized. Current and deferred tax liabilities are reported on a net basis and the deferred tax assets, net is presented within other assets within the Consolidated Statements of Financial Condition.
The Company analyzes its tax filing positions in all U.S. federal, state, local and foreign tax jurisdictions where it is required to file income tax returns for all open tax years in these jurisdictions. The Company recognizes the tax benefit from an uncertain tax position only if it is more likely than not that the tax position will be sustained upon examination by the taxing authorities based on the technical merits of the position. The tax benefit recognized in the financial statements for a particular tax position is based on the largest benefit that is more likely than not to be realized. The amount of unrecognized tax benefits (“UTBs”) is adjusted as appropriate for changes in facts and circumstances, such as significant amendments to existing tax law, new regulations or interpretations by the taxing authorities, new information obtained during a tax examination, or resolution of an examination. Both accrued interest and penalties related to UTBs, when incurred, are presented within general, administrative and other expenses within the Consolidated Statements of Operations.
Tax laws are complex and subject to different interpretations by the taxpayer and respective governmental taxing authorities. Significant judgment is required in determining tax expense and in evaluating tax positions, including evaluating uncertainties under GAAP. The Company reviews its tax positions quarterly and adjusts its tax balances as new legislation is passed or new information becomes available.
Earnings Per Share
Basic earnings per share of Class A and non-voting common stock is computed by dividing income available to Class A and non-voting common stockholders by the weighted-average number shares of Class A and non-voting common stock outstanding during the period. Income available to Ares Management Corporation represents net income attributable to Class A
Ares Management Corporation
Notes to the Consolidated Financial Statements (Continued)
(Dollars in Thousands, Except Share Data and As Otherwise Noted)
and non-voting common stockholders after giving effect to the Series B mandatory convertible preferred stock dividends declared. Basic earnings per share of Class A and non-voting common stock is computed by using the two-class method. The two-class method is an earnings allocation method under which earnings per share is calculated for shares of Class A and non-voting common stock and participating securities considering both dividends declared (or accumulated) and participation rights in undistributed earnings as if all such earnings had been distributed during the period. Because the holders of unvested restricted units have the right to participate in dividends when declared, the unvested restricted units are considered participating securities to the extent they are expected to vest.
Diluted earnings per share of Class A and non-voting common stock is computed by dividing income available to Class A and non-voting common stockholders by the weighted-average number of shares of Class A and non-voting common stock outstanding during the period, increased to include the number of additional shares of Class A common stock that would have been outstanding if the potentially dilutive securities had been issued. Potentially dilutive securities include outstanding options to acquire shares of Class A common stock, unvested restricted units, Series B mandatory convertible preferred stock and AOG Units exchangeable for shares of Class A common stock. The effect of potentially dilutive securities is reflected in diluted earnings per share of Class A and non-voting common stock using the more dilutive result of the treasury stock and if-converted methods or the two-class method. The treasury stock method is used to determine potentially dilutive securities resulting from options and unvested restricted units granted under the Equity Incentive Plan. The if-converted method is used to determine the potentially dilutive effect resulting from the conversion of shares of the Series B mandatory convertible preferred stock to shares of Class A common stock as of the beginning of the period.
Comprehensive Income
Comprehensive income consists of net income and foreign currency translation adjustments.
Recent Accounting Pronouncements
The Company considers the applicability and impact of all accounting standard updates (“ASU”) issued by the Financial Accounting Standards Board (“FASB”). ASUs not listed below were assessed and either determined to be not applicable or expected to have minimal impact on its consolidated financial statements.
In November 2023, the FASB issued ASU 2023-07, Segment Reporting (Topic 280) Improvements to Reportable Segment Disclosures. ASU 2023-07 requires disclosure of significant segment expenses that are regularly provided to the chief operating decision maker (“CODM”) and included within each reported measure of segment profit or loss, an amount and description of its composition for other segment items to reconcile to segment profit or loss, and the title and position of the Company’s CODM. The amendments in this update also expand the interim segment disclosure requirements. ASU 2023-07 is effective for the Company’s fiscal year ending December 15, 2024 and for the Company’s interim periods beginning with the first quarter ended 2025. Early adoption is permitted and the amendments in this update are required to be applied on a retrospective basis. The Company has concluded this guidance does not have a material impact on its consolidated financial statements. Information presented within “Note 14. Segment Reporting” reflects the impact from adoption of ASU 2023-07.
In December 2023, the FASB issued ASU 2023-09, Income Taxes (Topic 740) Improvements to Income Tax Disclosures. ASU 2023-09 requires disclosure of disaggregated income taxes paid in both U.S. and foreign jurisdictions, prescribes standard categories for the components of the effective tax rate reconciliation and modifies other income tax-related disclosures. ASU 2023-09 is effective for the Company’s fiscal year ending December 31, 2025. Early adoption is permitted and the amendments in this update should be applied on a prospective basis, though retrospective adoption is permitted. The Company is currently evaluating the impact of this guidance.
In November 2024, the FASB issued ASU 2024-03, Income Statement—Reporting Comprehensive Income—Expense Disaggregation Disclosures (Subtopic 220-40): Disaggregation of Income Statement Expenses. ASU 2024-03 requires disaggregated disclosure of certain expenses in the notes to the consolidated financial statements, including purchases of inventory, employee compensation, depreciation and intangible asset amortization. The amendments in this update also require disclosure of: (i) the expense captions from the Consolidated Statements of Operations that include each of the relevant expense categories; (ii) a qualitative description of the amounts remaining in relevant expense captions that are not separately disaggregated quantitatively; and (iii) total selling expenses and a definition of such expenses. ASU 2024-03 is effective for the Company’s fiscal year ending December 31, 2027. Early adoption is permitted and the amendments in this update may be applied on a prospective or retrospective basis. The Company is currently evaluating the impact of this guidance.
Ares Management Corporation
Notes to the Consolidated Financial Statements (Continued)
(Dollars in Thousands, Except Share Data and As Otherwise Noted)
3. GOODWILL AND INTANGIBLE ASSETS
Intangible Assets, Net
The following table summarizes the carrying value, net of accumulated amortization, of the Company’s intangible assets:
| | | | | | | | | | | | | | | | | |
| Weighted Average Amortization Period (in years) as of December 31, 2024 | | As of December 31, |
| | | | |
| | 2024 | | 2023 |
| Management contracts | 4.0 | | $ | 590,675 | | | $ | 604,242 | |
| Client relationships | 7.7 | | 210,720 | | | 200,920 | |
| | | | | |
| Other | 0.0 | | 500 | | | 500 | |
| Finite-lived intangible assets | | | 801,895 | | | 805,662 | |
| Foreign currency translation | | | (789) | | | 1,126 | |
| Total finite-lived intangible assets | | | 801,106 | | | 806,788 | |
| Less: accumulated amortization | | | (393,078) | | | (316,093) | |
| Finite-lived intangible assets, net | | | 408,028 | | | 490,695 | |
| | | | | |
| | | | | |
| Indefinite-lived management contracts | | | 567,800 | | | 567,800 | |
| Intangible assets, net | | | $ | 975,828 | | | $ | 1,058,495 | |
On December 1, 2024, a subsidiary of the Company completed the acquisition of all the equity interests in Walton Street Capital Mexico S. de R.L. de C.V. and certain of its affiliates (“WSM”) (the “WSM Acquisition”). WSM is a real estate asset management platform focused primarily on the industrial real estate sector in Mexico. The results of WSM are presented within the Real Assets Group. The Company allocated $27.0 million and $9.8 million of the purchase price to the fair value of the acquired management contracts and client relationships, respectively. The acquired management contracts and client relationships had a weighted average amortization period from the date of acquisition of 6.7 years and 10.0 years, respectively.
During the year ended December 31, 2024, the Company recorded a non-cash impairment charge of $8.9 million to the fair value of management contracts of certain funds within the Credit Group, Real Assets Group and Secondaries Group. The primary indicator of impairment was the lower than expected future fee revenue generated from these funds. During the year ended December 31, 2023, the Company recorded a non-cash impairment charge of $78.7 million primarily related to the value of client relationships from the acquisition of Landmark Partners, LLC (the “Landmark Acquisition”). The primary indicator of impairment was the lower than expected fee paying assets under management in a private equity secondaries fund from existing investors as of the date of the Landmark Acquisition. During the year ended December 31, 2022, the Company recorded non-cash impairment charges of $181.6 million related to rebranding of its secondaries group as Ares Secondaries and discontinued the ongoing use of the Landmark trade name, and fair value of management contracts in connection with lower than expected fee paying assets under management.
Amortization expense associated with intangible assets, excluding the accelerated amortization described above, was $116.3 million, $126.0 million and $133.6 million for the years ended December 31, 2024, 2023 and 2022, respectively, and has been presented within general, administrative and other expenses within in the Consolidated Statements of Operations. During the year ended December 31, 2024, the Company removed $47.5 million of fully-amortized management contracts.
As of December 31, 2024, future annual amortization of finite-lived intangible assets for the years 2025 through 2029 and thereafter is estimated to be:
| | | | | |
| Year | Amortization |
| 2025 | $ | 107,317 | |
| 2026 | 81,538 | |
| 2027 | 70,153 | |
| 2028 | 46,236 | |
| 2029 | 39,859 | |
| Thereafter | 62,925 | |
| Total | $ | 408,028 | |
Ares Management Corporation
Notes to the Consolidated Financial Statements (Continued)
(Dollars in Thousands, Except Share Data and As Otherwise Noted)
Goodwill
The following table summarizes the carrying value of the Company’s goodwill:
| | | | | | | | | | | | | | | | | | | | | | | | | | | | | | | | | | | |
| Credit Group | | Real Assets Group | | Private Equity Group | | Secondaries Group | | Other | | Total |
| Balance as of December 31, 2022 | $ | 32,196 | | | $ | 277,183 | | | $ | 48,070 | | | $ | 417,620 | | | $ | 224,587 | | | $ | 999,656 | |
| Acquisitions | — | | | 22 | | | 124,392 | | | — | | | — | | | 124,414 | |
| Reallocation | 224,587 | | | — | | | — | | | — | | | (224,587) | | | — | |
| Foreign currency translation | (104) | | | — | | | — | | | 10 | | | — | | | (94) | |
| Balance as of December 31, 2023 | 256,679 | | | 277,205 | | | 172,462 | | | 417,630 | | | — | | | 1,123,976 | |
| Acquisitions | — | | | 35,091 | | | 4,605 | | | — | | | — | | | 39,696 | |
| Reallocation | 55,658 | | | — | | | (55,658) | | | — | | | — | | | — | |
| Foreign currency translation | (305) | | | (727) | | | (1) | | | (3) | | | — | | | (1,036) | |
| Balance as of December 31, 2024 | $ | 312,032 | | | $ | 311,569 | | | $ | 121,408 | | | $ | 417,627 | | | $ | — | | | $ | 1,162,636 | |
In connection with the WSM Acquisition, the Company allocated $28.4 million of the purchase price to goodwill.
In connection with the segment reorganization of the former special opportunities strategy as described in “Note 14. Segment Reporting,” the Company had an associated change in its reporting units and reallocated goodwill of $55.7 million from the Private Equity Group to the Credit Group using a relative fair value allocation approach in the first quarter of 2024.
In connection with the acquisition of the investment management business and related operating entities collectively doing business as Crescent Point Capital (“Crescent Point”) (the “Crescent Point Acquisition”) in the fourth quarter of 2023, the Company allocated $124.4 million of the purchase price to goodwill.
In connection with the SSG Buyout in the first quarter of 2023 as described in “Note 13. Equity and Redeemable Interest, the former Ares SSG reporting unit has been transferred in its entirety to the Credit Group and the total goodwill of $224.6 million has been reallocated accordingly.
There was no impairment of goodwill recorded during the years ended December 31, 2024 and 2023. The impact of foreign currency translation adjustments are reflected within the Consolidated Statements of Comprehensive Income.
4. INVESTMENTS
The following table summarizes the Company’s investments:
| | | | | | | | | | | | | | | | | | | | | | | |
| As of | | Percentage of total investments as of |
| December 31, | | December 31, |
| | | | | | | |
| 2024 | | 2023 | | 2024 | | 2023 |
| Equity method investments: | | | | | | | |
Equity method - carried interest | $ | 3,495,115 | | | $ | 3,413,007 | | | 75.2% | | 73.8% |
| Equity method private investment partnership interests - principal | 536,912 | | | 535,292 | | | 11.6 | | 11.6 |
| Equity method private investment partnership interests and other (held at fair value) | 411,417 | | | 418,778 | | | 8.9 | | 9.0 |
| Equity method private investment partnership interests and other | 55,461 | | | 44,989 | | | 1.2 | | 1.0 |
| Total equity method investments | 4,498,905 | | | 4,412,066 | | | 96.9 | | 95.4 |
| Collateralized loan obligations | 19,040 | | | 20,799 | | | 0.4 | | 0.4 |
| Fixed income securities | 22,793 | | | 105,495 | | | 0.5 | | 2.3 |
| Collateralized loan obligations and fixed income securities, at fair value | 41,833 | | | 126,294 | | | 0.9 | | 2.7 |
| Common stock, at fair value | 104,037 | | | 86,572 | | | 2.2 | | 1.9 |
| Total investments | $ | 4,644,775 | | | $ | 4,624,932 | | | | | |
Ares Management Corporation
Notes to the Consolidated Financial Statements (Continued)
(Dollars in Thousands, Except Share Data and As Otherwise Noted)
Equity Method Investments
The Company’s equity method investments include investments that are not consolidated but over which the Company exerts significant influence. The Company evaluates each of its equity method investments to determine if any were significant as defined by guidance from the SEC. As of and for the years ended December 31, 2024, 2023 and 2022, no individual equity method investment held by the Company met the significance criteria.
The following tables present summarized financial information for the Company’s equity method investments, which are primarily funds managed by the Company:
| | | | | | | | | | | | | | | | | | | | | | | | | | | | | | | | | | | |
| As of and for the Year Ended December 31, 2024 |
| Credit Group | | Real Assets Group | | Private Equity Group | | Secondaries Group | | Other | | Total |
| Statement of Financial Condition | | | | | | | | | | | |
| Investments | $ | 24,635,069 | | | $ | 19,966,560 | | | $ | 5,906,807 | | | $ | 15,191,773 | | | $ | 35,804 | | | $ | 65,736,013 | |
| Total assets | 27,987,915 | | | 21,368,342 | | | 5,897,152 | | | 15,632,653 | | | 36,519 | | | 70,922,581 | |
| Total liabilities | 6,403,988 | | | 7,535,764 | | | 151,502 | | | 4,304,893 | | | 100 | | | 18,396,247 | |
| Total equity | 21,583,927 | | | 13,832,578 | | | 5,745,650 | | | 11,327,760 | | | 36,419 | | | 52,526,334 | |
| | | | | | | | | | | |
| Statement of Operations | | | | | | | | | | | |
| Revenues | $ | 2,357,057 | | | $ | 1,018,717 | | | $ | 196,756 | | | $ | 10,508 | | | $ | — | | | $ | 3,583,038 | |
| Expenses | (893,272) | | | (564,678) | | | (67,667) | | | (507,192) | | | (1,001) | | | (2,033,810) | |
| Net realized and unrealized gains (losses) from investments | 556,170 | | | 382,681 | | | 496,096 | | | 208,947 | | | (417) | | | 1,643,477 | |
| Income tax expense | (5,884) | | | (9,341) | | | (27,554) | | | — | | | — | | | (42,779) | |
| Net income (loss) | $ | 2,014,071 | | | $ | 827,379 | | | $ | 597,631 | | | $ | (287,737) | | | $ | (1,418) | | | $ | 3,149,926 | |
| | | | | | | | | | | | | | | | | | | | | | | | | | | | | | | | | | | |
| As of and for the Year Ended December 31, 2023 |
| Credit Group | | Real Assets Group | | Private Equity Group | | Secondaries Group | | Other | | Total |
| Statement of Financial Condition | | | | | | | | | | | |
| Investments | $ | 23,032,497 | | | $ | 17,757,664 | | | $ | 5,305,566 | | | $ | 13,497,266 | | | $ | 38,212 | | | $ | 59,631,205 | |
| Total assets | 24,694,682 | | | 18,792,446 | | | 5,431,332 | | | 13,808,556 | | | 38,284 | | | 62,765,300 | |
| Total liabilities | 5,163,355 | | | 6,528,302 | | | 119,894 | | | 3,632,879 | | | 418 | | | 15,444,848 | |
| Total equity | 19,531,327 | | | 12,264,144 | | | 5,311,438 | | | 10,175,677 | | | 37,866 | | | 47,320,452 | |
| | | | | | | | | | | |
| Statement of Operations | | | | | | | | | | | |
| Revenues | $ | 2,584,262 | | | $ | 1,036,710 | | | $ | 133,749 | | | $ | 1,960 | | | $ | — | | | $ | 3,756,681 | |
| Expenses | (862,257) | | | (632,433) | | | (88,841) | | | (482,478) | | | (1,658) | | | (2,067,667) | |
| Net realized and unrealized gains (losses) from investments | 525,776 | | | (599,200) | | | 322,165 | | | 373,064 | | | (7,316) | | | 614,489 | |
| Income tax benefit (expense) | (28,334) | | | (10,197) | | | 22,587 | | | — | | | (19) | | | (15,963) | |
| Net income (loss) | $ | 2,219,447 | | | $ | (205,120) | | | $ | 389,660 | | | $ | (107,454) | | | $ | (8,993) | | | $ | 2,287,540 | |
| | | | | | | | | | | | | | | | | | | | | | | | | | | | | | | | | | | |
| As of and for the Year Ended December 31, 2022 |
| Credit Group | | Real Assets Group | | Private Equity Group | | Secondaries Group | | Other | | Total |
| | | | | | | | | | | |
| | | | | | | | | | | |
| | | | | | | | | | | |
| | | | | | | | | | | |
| | | | | | | | | | | |
| | | | | | | | | | | |
| Statement of Operations | | | | | | | | | | | |
| Revenues | $ | 1,552,306 | | | $ | 618,796 | | | $ | 60,935 | | | $ | 2,874 | | | $ | — | | | $ | 2,234,911 | |
| Expenses | (515,535) | | | (357,845) | | | (76,527) | | | (289,741) | | | (1,500) | | | (1,241,148) | |
| Net realized and unrealized gains (losses) from investments | (230,076) | | | 304,068 | | | (239,720) | | | (11,173) | | | 1,365 | | | (175,536) | |
| Income tax benefit (expense) | (5,870) | | | (36,501) | | | 1,238 | | | — | | | (10) | | | (41,143) | |
| Net income (loss) | $ | 800,825 | | | $ | 528,518 | | | $ | (254,074) | | | $ | (298,040) | | | $ | (145) | | | $ | 777,084 | |
Ares Management Corporation
Notes to the Consolidated Financial Statements (Continued)
(Dollars in Thousands, Except Share Data and As Otherwise Noted)
The following table presents the Company’s other income, net from its equity method investments, which were included within principal investment income, net realized and unrealized gains on investments, and interest and dividend income within the Consolidated Statements of Operations:
| | | | | | | | | | | | | | | | | | | | | | | | |
| | | | Year ended December 31, |
| | | | | | 2024 | | 2023 | | 2022 |
| Total other income, net related to equity method investments | | | | | | $ | 52,350 | | | $ | 86,729 | | | $ | 21,657 | |
With respect to the Company’s equity method investments, the material assets are expected to generate either long term capital appreciation and/or interest income, the material liabilities are debt instruments collateralized by, or related to, the financing of the assets and net income is materially comprised of the changes in fair value of these net assets.
The following table summarizes the changes in fair value of the Company’s equity method investments held at fair value, which are included within net realized and unrealized gains on investments within the Consolidated Statements of Operations:
| | | | | | | | | | | | | | | | | | | | | |
| | | Year ended December 31, |
| | | | | 2024 | | 2023 | | 2022 |
| Equity method private investment partnership interests and other (held at fair value) | | | | | $ | (4,762) | | | $ | 50,772 | | | $ | 5,626 | |
Investments of the Consolidated Funds
The following table summarizes investments held in the Consolidated Funds:
| | | | | | | | | | | | | | | | | | | | | | | |
| Fair Value as of | | Percentage of total investments as of |
| | | |
| December 31, | | December 31, | | December 31, | | December 31, |
| 2024 | | 2023 | | 2024 | | 2023 |
| Fixed income investments: | | | | | | | |
| Loans and securitization vehicles | $ | 7,907,449 | | | $ | 10,616,458 | | | 62.1% | | 72.7% |
| Money market funds and U.S. treasury securities | 550,800 | | | 523,038 | | | 4.3 | | 3.6 |
| Bonds | 418,069 | | | 578,949 | | | 3.3 | | 4.0 |
| Total fixed income investments | 8,876,318 | | | 11,718,445 | | | 69.7 | | 80.3 |
| Partnership interests | 2,000,380 | | | 1,642,489 | | | 15.7 | | 11.2 |
| Equity securities | 1,861,146 | | | 1,240,653 | | | 14.6 | | 8.5 |
| Total investments, at fair value | $ | 12,737,844 | | | $ | 14,601,587 | | | | | |
As of December 31, 2024 and 2023, no single issuer or investment, including derivative instruments and underlying portfolio investments of the Consolidated Funds, had a fair value that exceeded 5.0% of the Company’s total assets.
5. FAIR VALUE
Financial Instrument Valuations
The valuation techniques used by the Company to measure fair value maximize the use of observable inputs and minimize the use of unobservable inputs. The valuation techniques applied to investments held by the Company and by the Consolidated Funds vary depending on the nature of the investment.
CLOs and CLO loan obligations: The fair value of CLOs held by the Company are estimated based on either a third-party pricing service or broker quote and are classified as Level III. The Company measures its CLO loan obligations of the Consolidated Funds by first determining whether the fair values of the financial assets or financial liabilities of its Consolidated CLOs are more observable.
Contingent consideration: The Company generally determines the fair value of its contingent consideration liabilities by using a probability weighted expected return method, including the Monte Carlo simulation model. These models consider a range of assumptions including historical experience, prior period performance, current progress towards targets, probability-weighted scenarios, and management’s own assumptions. The discount rate used is determined based on the weighted average cost of capital for the Company. Once the associated targets are achieved, the contingent consideration is reported at the
Ares Management Corporation
Notes to the Consolidated Financial Statements (Continued)
(Dollars in Thousands, Except Share Data and As Otherwise Noted)
settlement amount. The fair value of the Company’s contingent consideration liabilities are classified as Level III. Liabilities recorded in connection with the Company’s contingent consideration are included within accounts payable, accrued expenses and other liabilities in the Consolidated Statements of Financial Condition and the associated changes in fair value are included within other income, net in the Consolidated Statements of Operations.
Corporate debt, bonds, bank loans, securitization vehicles and derivative instruments: The fair value of corporate debt, bonds, bank loans, securitization vehicles and derivative instruments is estimated based on quoted market prices, dealer quotations or alternative pricing sources supported by observable inputs. These investments are generally classified as Level II. The Company obtains prices from independent pricing services that generally utilize broker quotes and may use various other pricing techniques, which take into account appropriate factors such as yield, quality, coupon rate, maturity, type of issue, trading characteristics and other data. If management is only able to obtain a single broker quote, or utilizes a pricing model, such securities will generally be classified as Level III.
Equity and equity-related securities: Securities traded on a national securities exchange are stated at the last reported sales price on the day of valuation. To the extent these securities are actively traded and valuation adjustments are not applied, they are classified as Level I. Securities that trade in markets that are not considered to be active but are valued based on quoted market prices, dealer quotations or alternative pricing sources supported by observable inputs obtained by the Company from independent pricing services are classified as Level II. Securities that have market prices that are not readily available, utilize valuation models of third-party pricing service or internal models using unobservable inputs to determine the fair value are classified as Level III.
Money market funds and U.S. treasury securities: The fair value of money market funds that invest in treasury-backed securities and U.S. treasury securities is estimated using quoted market prices in active markets. These investments are classified as Level I.
Partnership interests: The Company generally values its investments using the NAV per share equivalent calculated by the investment manager as a practical expedient to determining an independent fair value or estimates based on various valuation models of third-party pricing services, as well as internal models. The Company does not categorize within the fair value hierarchy investments where fair value is measured using the net asset value per share practical expedient.
In limited circumstances, the Company may determine, based on its own due diligence and investment procedures, that NAV per share does not represent fair value. In such circumstances, the Company will estimate the fair value in good faith and in a manner that it reasonably chooses. As of December 31, 2024 and 2023, NAV per share represents the fair value of the Company’s investments in partnership interests.
The substantial majority of the Company’s private commingled funds are closed-ended, and accordingly, do not permit investors to redeem their interests other than in limited circumstances that are beyond the control of the Company, such as instances in which retaining the interest could cause the investor to violate a law, regulation or rule. The Company also has open-ended and evergreen funds where investors have the right to withdraw their capital, subject to the terms of the respective constituent documents, over periods generally ranging from one month to three years. In addition, the Company has minority investments in vehicles that may only have a single other investor that may allow such investors to terminate the fund pursuant to the terms of the applicable constituent documents of such vehicle.
Ares Management Corporation
Notes to the Consolidated Financial Statements (Continued)
(Dollars in Thousands, Except Share Data and As Otherwise Noted)
Fair Value of Financial Instruments Held by the Company and Consolidated Funds
The following tables summarize the financial assets and financial liabilities measured at fair value for the Company and the Consolidated Funds as of December 31, 2024:
| | | | | | | | | | | | | | | | | | | | | | | | | | | | | | | | |
| Financial Instruments of the Company | | Level I | | Level II | | Level III | | Investments Measured at NAV | | Total |
| Assets, at fair value | | | | | | | | | | |
| Cash equivalents: | | | | | | | | | | |
| Money market funds | | $ | 1,071,071 | | | $ | — | | | $ | — | | | $ | — | | | $ | 1,071,071 | |
| Investments: | | | | | | | | | | |
| Common stock and other equity securities | | — | | | 104,037 | | | 411,179 | | | — | | | 515,216 | |
| Collateralized loan obligations and fixed income securities | | — | | | — | | | 41,833 | | | — | | | 41,833 | |
| Partnership interests | | — | | | — | | | — | | | 238 | | | 238 | |
| Total investments, at fair value | | — | | | 104,037 | | | 453,012 | | | 238 | | | 557,287 | |
| Derivatives-foreign currency forward contracts | | — | | | 3,737 | | | — | | | — | | | 3,737 | |
| Total assets, at fair value | | $ | 1,071,071 | | | $ | 107,774 | | | $ | 453,012 | | | $ | 238 | | | $ | 1,632,095 | |
| Liabilities, at fair value | | | | | | | | | | |
| Derivatives-foreign currency forward contracts | | $ | — | | | $ | (216) | | | $ | — | | | $ | — | | | $ | (216) | |
| Contingent consideration | | — | | | — | | | (17,550) | | | — | | | (17,550) | |
| Total liabilities, at fair value | | $ | — | | | $ | (216) | | | $ | (17,550) | | | $ | — | | | $ | (17,766) | |
| | | | | | | | | | | | | | | | | | | | | | | | | | | | | | | | |
| Financial Instruments of the Consolidated Funds | | Level I | | Level II | | Level III | | Investments Measured at NAV | | Total |
| Assets, at fair value | | | | | | | | | | |
| Investments: | | | | | | | | | | |
| Fixed income investments: | | | | | | | | | | |
| Loans and securitization vehicles | | $ | — | | | $ | 7,313,632 | | | $ | 593,817 | | | $ | — | | | $ | 7,907,449 | |
| U.S. treasury securities | | 550,800 | | | — | | | — | | | — | | | 550,800 | |
| Bonds | | — | | | 418,069 | | | — | | | — | | | 418,069 | |
| | | | | | | | | | |
| Total fixed income investments | | 550,800 | | | 7,731,701 | | | 593,817 | | | — | | | 8,876,318 | |
| Partnership interests | | — | | | — | | | — | | | 2,000,380 | | | 2,000,380 | |
| Equity securities | | 28,603 | | | 2,615 | | | 1,829,928 | | | — | | | 1,861,146 | |
| Total investments, at fair value | | 579,403 | | | 7,734,316 | | | 2,423,745 | | | 2,000,380 | | | 12,737,844 | |
| | | | | | | | | | |
| Derivatives-foreign currency forward contracts | | — | | | 2,995 | | | — | | | — | | | 2,995 | |
| | | | | | | | | | |
| | | | | | | | | | |
| Total assets, at fair value | | $ | 579,403 | | | $ | 7,737,311 | | | $ | 2,423,745 | | | $ | 2,000,380 | | | $ | 12,740,839 | |
| Liabilities, at fair value | | | | | | | | | | |
| Loan obligations of CLOs | | $ | — | | | $ | (9,672,189) | | | $ | — | | | $ | — | | | $ | (9,672,189) | |
| Derivatives: | | | | | | | | | | |
| | | | | | | | | | |
| Foreign currency forward contracts | | — | | | (2,888) | | | — | | | — | | | (2,888) | |
| Asset swaps | | — | | | — | | | (1,846) | | | — | | | (1,846) | |
| | | | | | | | | | |
| | | | | | | | | | |
| Total derivative liabilities, at fair value | | — | | | (2,888) | | | (1,846) | | | — | | | (4,734) | |
| Total liabilities, at fair value | | $ | — | | | $ | (9,675,077) | | | $ | (1,846) | | | $ | — | | | $ | (9,676,923) | |
Ares Management Corporation
Notes to the Consolidated Financial Statements (Continued)
(Dollars in Thousands, Except Share Data and As Otherwise Noted)
The following tables summarize the financial assets and financial liabilities measured at fair value for the Company and the Consolidated Funds as of December 31, 2023:
| | | | | | | | | | | | | | | | | | | | | | | | | | | | | | | | |
| Financial Instruments of the Company | | Level I | | Level II | | Level III | | Investments Measured at NAV | | Total |
| Assets, at fair value | | | | | | | | | | |
| Investments: | | | | | | | | | | |
| Common stock and other equity securities | | $ | — | | | $ | 86,572 | | | $ | 412,491 | | | $ | — | | | $ | 499,063 | |
| Collateralized loan obligations and fixed income securities | | — | | | — | | | 126,294 | | | — | | | 126,294 | |
| Partnership interests | | — | | | — | | | — | | | 6,287 | | | 6,287 | |
| Total investments, at fair value | | — | | | 86,572 | | | 538,785 | | | 6,287 | | | 631,644 | |
| Derivatives-foreign currency forward contracts | | — | | | 1,129 | | | — | | | — | | | 1,129 | |
| Total assets, at fair value | | $ | — | | | $ | 87,701 | | | $ | 538,785 | | | $ | 6,287 | | | $ | 632,773 | |
| Liabilities, at fair value | | | | | | | | | | |
| Derivatives-foreign currency forward contracts | | $ | — | | | $ | (2,645) | | | $ | — | | | $ | — | | | $ | (2,645) | |
| | | | | | | | | | |
| Total liabilities, at fair value | | $ | — | | | $ | (2,645) | | | $ | — | | | $ | — | | | $ | (2,645) | |
| | | | | | | | | | | | | | | | | | | | | | | | | | | | | | | | |
| Financial Instruments of the Consolidated Funds | | Level I | | Level II | | Level III | | Investments Measured at NAV | | Total |
| Assets, at fair value | | | | | | | | | | |
| Investments: | | | | | | | | | | |
| Fixed income investments: | | | | | | | | | | |
| Loans and securitization vehicles | | $ | — | | | $ | 9,879,915 | | | $ | 736,543 | | | $ | — | | | $ | 10,616,458 | |
| Bonds | | — | | | 575,379 | | | 3,570 | | | — | | | 578,949 | |
| U.S. treasury securities | | 523,038 | | | — | | | — | | | — | | | 523,038 | |
| Total fixed income investments | | 523,038 | | | 10,455,294 | | | 740,113 | | | — | | | 11,718,445 | |
| Partnership interests | | — | | | — | | | — | | | 1,642,489 | | | 1,642,489 | |
| Equity securities | | 47,503 | | | 2,750 | | | 1,190,400 | | | — | | | 1,240,653 | |
| Total investments, at fair value | | 570,541 | | | 10,458,044 | | | 1,930,513 | | | 1,642,489 | | | 14,601,587 | |
| | | | | | | | | | |
| Derivatives-foreign currency forward contracts | | — | | | 9,126 | | | — | | | — | | | 9,126 | |
| | | | | | | | | | |
| | | | | | | | | | |
| Total assets, at fair value | | $ | 570,541 | | | $ | 10,467,170 | | | $ | 1,930,513 | | | $ | 1,642,489 | | | $ | 14,610,713 | |
| Liabilities, at fair value | | | | | | | | | | |
| Loan obligations of CLOs | | $ | — | | | $ | (12,345,657) | | | $ | — | | | $ | — | | | $ | (12,345,657) | |
| Derivatives: | | | | | | | | | | |
| | | | | | | | | | |
| Foreign currency forward contracts | | — | | | (9,491) | | | — | | | — | | | (9,491) | |
| Asset swaps | | — | | | — | | | (1,291) | | | — | | | (1,291) | |
| Total derivative liabilities, at fair value | | — | | | (9,491) | | | (1,291) | | | — | | | (10,782) | |
| Total liabilities, at fair value | | $ | — | | | $ | (12,355,148) | | | $ | (1,291) | | | $ | — | | | $ | (12,356,439) | |
The following tables set forth a summary of changes in the fair value of the Level III measurements:
| | | | | | | | | | | | | | | | | | | | | | | | | | | | | |
| Level III Assets of the Company | | Equity Securities | | Fixed Income | | | | Contingent Consideration | | Total | |
| Balance as of December 31, 2023 | | $ | 412,491 | | | $ | 126,294 | | | | | $ | — | | | $ | 538,785 | | |
| | | | | | | | | | | |
| Established in connection with acquisition (see Note 8) | | — | | | — | | | | | (17,550) | | | (17,550) | | |
Transfer in(1) | | — | | | 39,636 | | | | | — | | | 39,636 | | |
Transfer out(1) | | (872) | | | — | | | | | — | | | (872) | | |
Purchases(2) | | 1,453 | | | 436,649 | | | | | — | | | 438,102 | | |
Sales/settlements(3) | | (2,382) | | | (561,492) | | | | | — | | | (563,874) | | |
| | | | | | | | | | | |
| Realized and unrealized appreciation, net | | 489 | | | 746 | | | | | — | | | 1,235 | | |
| Balance as of December 31, 2024 | | $ | 411,179 | | | $ | 41,833 | | | | | $ | (17,550) | | | $ | 435,462 | | |
| Change in net unrealized appreciation/depreciation included in earnings related to financial assets still held at the reporting date | | $ | (904) | | | $ | 2,172 | | | | | $ | — | | | $ | 1,268 | | |
Ares Management Corporation
Notes to the Consolidated Financial Statements (Continued)
(Dollars in Thousands, Except Share Data and As Otherwise Noted)
| | | | | | | | | | | | | | | | | | | | | | | | | | | | |
| Level III Net Assets of Consolidated Funds | | Equity Securities | | Fixed Income | | | | Derivatives, Net | | Total |
| Balance as of December 31, 2023 | | $ | 1,190,400 | | | $ | 740,113 | | | | | $ | (1,291) | | | $ | 1,929,222 | |
| | | | | | | | | | |
Transfer in(1) | | — | | | 87,505 | | | | | — | | | 87,505 | |
Transfer out(1) | | (1,017) | | | (154,961) | | | | | — | | | (155,978) | |
Purchases(2) | | 518,369 | | | 877,311 | | | | | 130 | | | 1,395,810 | |
Sales/settlements(3) | | (114) | | | (960,839) | | | | | — | | | (960,953) | |
| | | | | | | | | | |
| Realized and unrealized appreciation (depreciation), net | | 122,289 | | | 4,688 | | | | | (685) | | | 126,292 | |
| Balance as of December 31, 2024 | | $ | 1,829,927 | | | $ | 593,817 | | | | | $ | (1,846) | | | $ | 2,421,898 | |
| Change in net unrealized appreciation/depreciation included in earnings related to financial assets and liabilities still held at the reporting date | | $ | 123,659 | | | $ | 2,237 | | | | | $ | (744) | | | $ | 125,152 | |
(1)Transfers in and out include changes in the observability of inputs used in valuations, and changes due to the consolidation and deconsolidation of funds.
(2)Purchases include paid-in-kind interest and securities received in connection with restructurings.
(3)Sales/settlements include distributions, principal redemptions and securities disposed of in connection with restructurings.
| | | | | | | | | | | | | | | | | | | | | | | | | | |
| | |
| Level III Assets of the Company | | Equity Securities | | Fixed Income | | | | | | | | Total |
| Balance as of December 31, 2022 | | $ | 121,785 | | | $ | 76,934 | | | | | | | | | $ | 198,719 | |
| | | | | | | | | | | | |
| | | | | | | | | | | | |
Purchases(1) | | 244,335 | | | 88,480 | | | | | | | | | 332,815 | |
Sales/settlements(2) | | (2) | | | (37,332) | | | | | | | | | (37,334) | |
| | | | | | | | | | | | |
| Realized and unrealized appreciation (depreciation), net | | 46,373 | | | (1,788) | | | | | | | | | 44,585 | |
| Balance as of December 31, 2023 | | $ | 412,491 | | | $ | 126,294 | | | | | | | | | $ | 538,785 | |
| Change in net unrealized appreciation/depreciation included in earnings related to financial assets still held at the reporting date | | $ | 46,161 | | | $ | (1,577) | | | | | | | | | $ | 44,584 | |
| | | | | | | | | | | | | | | | | | | | | | | | | | | | | | | | |
| Level III Net Assets of Consolidated Funds | | Equity Securities | | Fixed Income | | Partnership Interests | | Derivatives, Net | | Total |
| Balance as of December 31, 2022 | | $ | 730,880 | | | $ | 869,668 | | | $ | 368,655 | | | $ | (3,556) | | | $ | 1,965,647 | |
| | | | | | | | | | |
Transfer in(3) | | — | | | 247,661 | | | — | | | — | | | 247,661 | |
Transfer out(3) | | (38,757) | | | (508,600) | | | (374,049) | | | — | | | (921,406) | |
Purchases(1) | | 347,583 | | | 813,564 | | | 49,000 | | | — | | | 1,210,147 | |
Sales/settlements(2) | | (2,595) | | | (700,944) | | | (48,889) | | | (154) | | | (752,582) | |
| | | | | | | | | | |
| Realized and unrealized appreciation, net | | 153,289 | | | 18,764 | | | 5,283 | | | 2,419 | | | 179,755 | |
| Balance as of December 31, 2023 | | $ | 1,190,400 | | | $ | 740,113 | | | $ | — | | | $ | (1,291) | | | $ | 1,929,222 | |
| Change in net unrealized appreciation/depreciation included in earnings related to financial assets and liabilities still held at the reporting date | | $ | 152,336 | | | $ | (15,623) | | | $ | — | | | $ | 1,590 | | | $ | 138,303 | |
(1)Purchases include paid-in-kind interest and securities received in connection with restructurings.
(2)Sales/settlements include distributions, principal redemptions and securities disposed of in connection with restructurings.
(3)Transfers in and out include changes in the observability of inputs used in valuations, and changes due to the consolidation and deconsolidation of funds.
Transfers out of Level III were generally attributable to certain investments that experienced a more significant level of market activity during the period and thus were valued using observable inputs either from independent pricing services or multiple brokers. Transfers into Level III were generally attributable to certain investments that experienced a less significant level of market activity during the period and thus were only able to obtain one or fewer quotes from a broker or independent pricing service.
Ares Management Corporation
Notes to the Consolidated Financial Statements (Continued)
(Dollars in Thousands, Except Share Data and As Otherwise Noted)
The following tables summarize the quantitative inputs and assumptions used for the Company’s and the Consolidated Funds’ Level III measurements as of December 31, 2024:
| | | | | | | | | | | | | | | | | | | | | | | | | | | | | | | | |
| Level III Measurements of the Company | | Fair Value | | Valuation Technique(s) | | Significant Unobservable Input(s) | | Range | | Weighted Average |
| Assets | | | | | | | | | | |
| Equity securities | | | | | | | | | | |
| | $ | 168,387 | | | Transaction price(1) | | N/A | | N/A | | N/A |
| | 100,000 | | | Market approach | | Yield | | 8.0% | | 8.0% |
| | 57,659 | | | Market approach | | Multiple of book value | | 1.0x - 1.1x | | 1.0x |
| | | | Discounted cash flow | | Discount rate | | 10.0% - 14.0% | | 12.0% |
| | 56,918 | | | Market approach | | Multiple of book value | | 1.2x - 1.7x | | 1.4x |
| | 19,205 | | | Option pricing model | | Volatility | | 35.0% | | 35.0% |
| | 8,489 | | | Market approach | | Earnings multiple | | 15.4x | | 15.4x |
| | 521 | | | Discounted cash flow | | Discount rate | | 18.5% - 21.5% | | 20.0% |
| Fixed income investments | | | | | | | | | | |
| | 22,283 | | | Transaction price(1) | | N/A | | N/A | | N/A |
| | 19,040 | | | Broker quotes and/or 3rd party pricing services | | N/A | | N/A | | N/A |
| | 510 | | | Other | | N/A | | N/A | | N/A |
| Total assets | | $ | 453,012 | | | | | | | | | |
| Liabilities | | | | | | | | | | |
| Contingent consideration | | $ | (17,550) | | | Monte Carlo simulation | | Discount rate | | 6.6% - 6.9% | | 6.8% |
| | | | | | Volatility | | 11.1% | | 11.1% |
| Total liabilities | | $ | (17,550) | | | | | | | | | |
| | | | | | | | | | | | | | | | | | | | | | | | | | | | | | | | |
| Level III Measurements of the Consolidated Funds | | Fair Value | | Valuation Technique(s) | | Significant Unobservable Input(s) | | Range | | Weighted Average |
| Assets | | | | | | | | | | |
| Equity securities | | | | | | | | | | |
| | $ | 985,109 | | | Discounted cash flow | | Discount rate | | 10.0% - 20.0% | | 13.0% |
| | 835,432 | | | Market approach | | Multiple of book value | | 1.0x - 1.7x | | 1.4x |
| | 8,598 | | | Market approach | | EBITDA multiple(2) | | 5.6x - 34.6x | | 10.7x |
| | | | | | | | | | |
| | | | | | | | | | |
| | | | | | | | | | |
| | | | | | | | | | |
| | 789 | | | Other | | N/A | | N/A | | N/A |
| | | | | | | | | | |
| Fixed income investments | | | | | | | | | | |
| | 308,675 | | | Broker quotes and/or 3rd party pricing services | | N/A | | N/A | | N/A |
| | 284,950 | | | Market approach | | Yield | | 7.4% - 28.6% | | 9.9% |
| | | | | | | | | | |
| | | | | | | | | | |
| | 192 | | | Other | | N/A | | N/A | | N/A |
| | | | | | | | | | |
| Total assets | | $ | 2,423,745 | | | | | | | | | |
| Liabilities | | | | | | | | | | |
| Derivative instruments | | $ | (1,846) | | | Broker quotes and/or 3rd party pricing services | | N/A | | N/A | | N/A |
| Total liabilities | | $ | (1,846) | | | | | | | | | |
(1)Transaction price consists of securities purchased or restructured. The Company determined that there was no change to the valuation based on the underlying assumptions used at the closing of such transactions.
(2)“EBITDA” in the table above is a non-GAAP financial measure and refers to earnings before interest, tax, depreciation and amortization.
Ares Management Corporation
Notes to the Consolidated Financial Statements (Continued)
(Dollars in Thousands, Except Share Data and As Otherwise Noted)
The following tables summarize the quantitative inputs and assumptions used for the Company’s and the Consolidated Funds’ Level III measurements as of December 31, 2023:
| | | | | | | | | | | | | | | | | | | | | | | | | | | | | | | | |
| Level III Measurements of the Company | | Fair Value | | Valuation Technique(s) | | Significant Unobservable Input(s) | | Range | | Weighted Average |
| Assets | | | | | | | | | | |
| Equity securities | | | | | | | | | | |
| | $ | 154,460 | | | Discounted cash flow | | Discount rate | | 20.0% - 30.0% | | 25.0% |
| | 118,846 | | | Market approach | | Multiple of book value | | 1.3x - 1.6x | | 1.5x |
| | 131,864 | | | Transaction price(1) | | N/A | | N/A | | N/A |
| | 6,447 | | | Market approach | | Earnings multiple | | 15.4x | | 15.4x |
| | 874 | | | Other | | N/A | | N/A | | N/A |
| | | | | | | | | | |
| | | | | | | | | | |
| Fixed income investments | | | | | | | | | | |
| | 83,000 | | | Transaction price(1) | | N/A | | N/A | | N/A |
| | 20,799 | | | Broker quotes and/or 3rd party pricing services | | N/A | | N/A | | N/A |
| | 22,495 | | | Other | | N/A | | N/A | | N/A |
| Total assets | | $ | 538,785 | | | | | | | | | |
| | | | | | | | | | |
| | | | | | | | | | |
| | | | | | | | | | |
| | | | | | | | | | |
| | | | | | | | | | |
| | | | | | | | | | | | | | | | | | | | | | | | | | | | | | | | |
| Level III Measurements of the Consolidated Funds | | Fair Value | | Valuation Technique(s) | | Significant Unobservable Input(s) | | Range | | Weighted Average |
| Assets | | | | | | | | | | |
| Equity securities | | | | | | | | | | |
| | $ | 648,581 | | | Discounted cash flow | | Discount rate | | 10.0% - 16.0% | | 13.0% |
| | 537,733 | | | Market approach | | Multiple of book value | | 1.0x - 1.7x | | 1.3x |
| | | | | | | | | | |
| | 3,909 | | | Market approach | | EBITDA multiple(2) | | 4.5x - 32.4x | | 8.9x |
| | 177 | | | Other | | N/A | | N/A | | N/A |
| | | | | | | | | | |
| Fixed income investments | | | | | | | | | | |
| | 548,264 | | | Broker quotes and/or 3rd party pricing services | | N/A | | N/A | | N/A |
| | 188,322 | | | Market approach | | Yield | | 8.3% - 24.1% | | 12.2% |
| | | | | | | | | | |
| | 2,974 | | | Market approach | | EBITDA multiple(2) | | 4.5x - 32.4x | | 9.0x |
| | 104 | | | Discounted cash flow | | Discount rate | | 12.3% | | 12.3% |
| | 449 | | | Other | | N/A | | N/A | | N/A |
| | | | | | | | | | |
| Total assets | | $ | 1,930,513 | | | | | | | | | |
| Liabilities | | | | | | | | | | |
| Derivative instruments | | $ | (1,291) | | | Broker quotes and/or 3rd party pricing services | | N/A | | N/A | | N/A |
| Total liabilities | | $ | (1,291) | | | | | | | | | |
(1)Transaction price consists of securities purchased or restructured. The Company determined that there has been no change to the valuation based on the underlying assumptions used at the closing of such transactions.
(2)“EBITDA” in the table above is a non-GAAP financial measure and refers to earnings before interest, tax, depreciation and amortization.
The Consolidated Funds have limited partnership interests in private equity funds managed by the Company that are valued using NAV per share. The terms and conditions of these funds do not allow for redemptions without certain events or approvals that are outside the Company’s control.
The following table summarizes the investments held at fair value and unfunded commitments of the Consolidated Funds interests valued using NAV per share:
| | | | | | | | | | | | | | |
| | As of December 31, |
| | 2024 | | 2023 |
| | | | |
| Investments (held at fair value) | | $ | 2,000,380 | | | $ | 1,642,489 | |
| Unfunded commitments | | 932,473 | | | 738,621 | |
Ares Management Corporation
Notes to the Consolidated Financial Statements (Continued)
(Dollars in Thousands, Except Share Data and As Otherwise Noted)
6. DEBT
The following table summarizes the Company’s and its subsidiaries’ debt obligations:
| | | | | | | | | | | | | | | | | | | | | | | | | | | | | | | | | | | | | | | | | |
| | | | | | | As of December 31, 2024 | | As of December 31, 2023 |
| | | | | | | |
| | | | | | | | | |
| Debt Origination Date | | Maturity | | Original Borrowing Amount | | Carrying Value | | Interest Rate | | Carrying Value | | Interest Rate |
Credit Facility(1) | Revolving | | 3/31/2029 | | N/A | | $ | — | | | —% | | $ | 895,000 | | | 6.37% |
2024 Senior Notes(2) | 10/8/2014 | | 10/8/2024 | | $ | 250,000 | | | N/A | | N/A | | 249,427 | | | 4.21 |
2028 Senior Notes(3) | 11/10/2023 | | 11/10/2028 | | 500,000 | | | 495,677 | | | 6.42 | | 494,863 | | | 6.42 |
2030 Senior Notes(4) | 6/15/2020 | | 6/15/2030 | | 400,000 | | | 397,501 | | | 3.28 | | 397,050 | | | 3.28 |
2052 Senior Notes(5) | 1/21/2022 | | 2/1/2052 | | 500,000 | | | 484,601 | | | 3.77 | | 484,199 | | | 3.77 |
2054 Senior Notes(6) | 10/11/2024 | | 10/11/2054 | | 750,000 | | | 736,010 | | | 5.65 | | N/A | | N/A |
2051 Subordinated Notes(7) | 6/30/2021 | | 6/30/2051 | | 450,000 | | | 445,125 | | | 4.13 | | 444,941 | | | 4.13 |
| Total debt obligations | | | | | | | $ | 2,558,914 | | | | | $ | 2,965,480 | | | |
(1)On March 28, 2024, the Company amended the Credit Facility to, among other things, increase the revolver commitments from $1.325 billion to $1.400 billion, with an accordion feature of $600.0 million, and extend the maturity date from March 2027 to March 2029. Ares Holdings is the borrower under the Credit Facility. The Credit Facility has a variable interest rate based on Secured Overnight Financing Rate (“SOFR”) or a base rate plus an applicable margin, which is subject to adjustment based on the achievement of certain environmental, social and governance (“ESG”)-related targets, with an unused commitment fee paid quarterly, which is subject to change with the Company’s underlying credit agency rating. As of December 31, 2024, base rate loans bear interest calculated based on the prime rate and the SOFR loans bear interest calculated based on SOFR plus 1.00%. The unused commitment fee is 0.10% per annum. There is a base rate and SOFR floor of zero. Due to the achievement of ESG-related targets, the Company’s applicable margin and unused commitment fee have been reduced by 0.05% and 0.01%, respectively, from July 2023 through June 2025.
(2)The 2024 Senior Notes were issued in October 2014 by Ares Finance Co. LLC, an indirect subsidiary of the Company, at 98.27% of the face amount with interest paid semi-annually. On October 8, 2024 the Company repaid the 2024 Senior Notes at maturity.
(3)The 2028 Senior Notes were issued in November 2023 by the Company, at 99.80% of the face amount with interest paid semi-annually. The Company may redeem the 2028 Senior Notes prior to maturity, subject to the terms of the indenture governing the 2028 Senior Notes.
(4)The 2030 Senior Notes were issued in June 2020 by Ares Finance Co. II LLC, an indirect subsidiary of the Company, at 99.77% of the face amount with interest paid semi-annually. The Company may redeem the 2030 Senior Notes prior to maturity, subject to the terms of the indenture governing the 2030 Senior Notes.
(5)The 2052 Senior Notes were issued in January 2022 by Ares Finance Co. IV LLC, an indirect subsidiary of the Company, at 97.78% of the face amount with interest paid semi-annually. The Company may redeem the 2052 Senior Notes prior to maturity, subject to the terms of the indenture governing the 2052 Senior Notes.
(6)The 2054 Senior Notes were issued in October 2024 by the Company, at 99.24% of the face amount with interest paid semi-annually. The Company may redeem the 2054 Senior Notes prior to maturity, subject to the terms of the indenture governing the 2054 Senior Notes.
(7)The 2051 Subordinated Notes were issued in June 2021 by Ares Finance Co. III LLC, an indirect subsidiary of the Company with interest paid semi-annually at a fixed rate of 4.125%. Beginning June 30, 2026, the interest rate will reset on every fifth year based on the five-year U.S. Treasury Rate plus 3.237%. The Company may redeem the 2051 Subordinated Notes prior to maturity or defer interest payments up to five consecutive years, subject to the terms of the indenture governing the 2051 Subordinated Notes.
As of December 31, 2024, the Company and its subsidiaries were in compliance with all covenants under the debt obligations.
The Company typically incurs and pays debt issuance costs when entering into a new debt obligation or when amending an existing debt agreement. Debt issuance costs related to the various senior notes (the “Senior Notes”) and the subordinated notes (the “Subordinated Notes”) are recorded as a reduction of the corresponding debt obligation, and debt issuance costs related to the Credit Facility are included within other assets within the Consolidated Statements of Financial Condition. All debt issuance costs are amortized over the remaining term of the related obligation into interest expense within the Consolidated Statements of Operations.
Ares Management Corporation
Notes to the Consolidated Financial Statements (Continued)
(Dollars in Thousands, Except Share Data and As Otherwise Noted)
The following table presents the activity of the Company’s debt issuance costs:
| | | | | | | | | | | | | | | | | | | | | |
| Credit Facility | | Senior Notes | | Subordinated Notes | | | | |
| Unamortized debt issuance costs as of December 31, 2022 | $ | 5,510 | | | $ | 8,393 | | | $ | 5,243 | | | | | |
| Debt issuance costs incurred | — | | | 4,315 | | | — | | | | | |
| Amortization of debt issuance costs | (1,297) | | | (924) | | | (184) | | | | | |
| | | | | | | | | |
| Unamortized debt issuance costs as of December 31, 2023 | 4,213 | | | 11,784 | | | 5,059 | | | | | |
| Debt issuance costs incurred | 1,832 | | | 8,662 | | | — | | | | | |
| Amortization of debt issuance costs | (1,187) | | | (1,721) | | | (184) | | | | | |
| | | | | | | | | |
| Unamortized debt issuance costs as of December 31, 2024 | $ | 4,858 | | | $ | 18,725 | | | $ | 4,875 | | | | | |
Loan Obligations of the Consolidated CLOs
Loan obligations of the Consolidated Funds that are CLOs (“Consolidated CLOs”) represent amounts due to holders of debt securities issued by the Consolidated CLOs. The Company measures the loan obligations of the Consolidated CLOs using the fair value of the financial assets of its Consolidated CLOs.
The following loan obligations were outstanding and classified as liabilities of the Consolidated CLOs:
| | | | | | | | | | | | | | | | | | | | | | | | | | | | | | | | | | | | | | |
| | | | | | |
| | | As of December 31, |
| | | 2024 | | | 2023 |
| | | Fair Value of
Loan Obligations | | Weighted
Average
Interest Rate | | Weighted
Average
Remaining Maturity
(in years) | | | Fair Value of
Loan Obligations | | Weighted
Average
Interest Rate | | Weighted
Average
Remaining Maturity
(in years) |
| Senior secured notes | | | $ | 8,937,972 | | | 6.08% | | 8.0 | | | $ | 11,606,289 | | | 6.64% | | 8.2 |
Subordinated notes(1) | | | 734,217 | | | N/A | | 5.6 | | | 739,368 | | | N/A | | 6.9 |
| Total loan obligations of Consolidated CLOs | | | $ | 9,672,189 | | | | | | | | $ | 12,345,657 | | | | | |
(1)The notes do not have contractual interest rates; instead, holders of the notes receive a variable rate of interest amounting to the excess cash flows generated by each Consolidated CLO.
Loan obligations of the Consolidated CLOs are collateralized by the assets held by the Consolidated CLOs, consisting of cash and cash equivalents, corporate loans, corporate bonds and other securities. The assets of one Consolidated CLO may not be used to satisfy the liabilities of another Consolidated CLO. Loan obligations of the Consolidated CLOs include floating rate notes, deferrable floating rate notes, revolving lines of credit and subordinated notes. Amounts borrowed under the notes are repaid based on available cash flows subject to priority of payments under each Consolidated CLO’s governing documents. Based on the terms of these facilities, the creditors of the facilities have no recourse to the Company.
Credit Facilities of the Consolidated Funds
Certain Consolidated Funds maintain credit facilities to fund investments between capital drawdowns. These facilities generally are collateralized by the net assets of the Consolidated Funds or the unfunded capital commitments of the Consolidated Funds’ limited partners, bear an annual commitment fee based on unfunded commitments and contain various affirmative and negative covenants and reporting obligations, including restrictions on additional indebtedness, liens, margin stock, affiliate transactions, dividends and distributions, release of capital commitments and portfolio asset dispositions. The creditors of these facilities have no recourse to the Company and only have recourse to a subsidiary of the Company to the extent the debt is guaranteed by such subsidiary. As of December 31, 2024 and 2023, the Consolidated Funds were in compliance with all covenants under such credit facilities.
Ares Management Corporation
Notes to the Consolidated Financial Statements (Continued)
(Dollars in Thousands, Except Share Data and As Otherwise Noted)
The Consolidated Funds had the following revolving bank credit facilities outstanding:
| | | | | | | | | | | | | | | | | | | | | | | | | | | | | | | | | | | | | | | |
| | | | | | | | | |
| | | | | | As of December 31, |
| | | | | | 2024 | | 2023 | |
| | Maturity Date | | Total Capacity | | Outstanding Loan(1) | | Effective Rate | | Outstanding Loan(1) | | Effective Rate | |
| Credit Facilities: | | | | | | | | | | | | | |
| | 7/1/2024 | | $ | 18,000 | | (2) | N/A | | N/A | | $ | 15,241 | | | 6.88% | |
| | 9/25/2025 | | 150,000 | | | $ | 121,000 | | | 8.00% | | N/A | | N/A | |
| | 9/24/2026 | | 150,000 | | | — | | | — | | — | | | N/A | |
| | 6/26/2027 | | 200,000 | | | 154,000 | | | 7.15 | | 110,000 | | | 8.29 | |
| | 9/12/2027 | | 54,000 | | | — | | | — | | — | | | N/A | |
| Total borrowings of Consolidated Funds | | | | | | $ | 275,000 | | | | | $ | 125,241 | | | | |
(1)The fair values of the borrowings approximate the carrying value as the interest rate on the borrowings is a floating rate.
(2)Represents a credit facility of a Consolidated Fund that was repaid on maturity date. The amount represents the total capacity as of December 31, 2023.
7. OTHER ASSETS
The components of other assets were as follows:
| | | | | | | | | | | |
| | As of December 31, |
| | 2024 | | 2023 |
| Other assets of the Company: | | | |
| Accounts and interest receivable | $ | 169,007 | | | $ | 128,756 | |
| Fixed assets, net | 177,671 | | | 122,223 | |
| | | |
| | | |
| Deferred tax assets, net | 241,894 | | | 21,549 | |
| Other assets | 186,082 | | | 157,451 | |
| Total other assets of the Company | $ | 774,654 | | | $ | 429,979 | |
| Other assets of Consolidated Funds: | | | |
| Dividends and interest receivable | $ | 70,657 | | | $ | 88,196 | |
| Income tax and other receivables | 11,740 | | | 12,627 | |
| Total other assets of Consolidated Funds | $ | 82,397 | | | $ | 100,823 | |
Fixed Assets, Net
The components of fixed assets were as follows:
| | | | | | | | | | | |
| | As of December 31, |
| | 2024 | | 2023 |
| | | |
| Office and computer equipment | $ | 62,920 | | | $ | 52,681 | |
| Internal-use software | 29,119 | | | 51,226 | |
| Leasehold improvements | 166,250 | | | 134,272 | |
| Fixed assets, at cost | 258,289 | | | 238,179 | |
| Less: accumulated depreciation | (80,618) | | | (115,956) | |
| Fixed assets, net | $ | 177,671 | | | $ | 122,223 | |
For the years ended December 31, 2024, 2023 and 2022, depreciation expense was $32.2 million, $31.4 million and $26.2 million, respectively, and is included within general, administrative and other expenses within the Consolidated Statements of Operations. During the year ended December 31, 2024, the Company disposed of $71.5 million of fixed assets that were fully depreciated.
Ares Management Corporation
Notes to the Consolidated Financial Statements (Continued)
(Dollars in Thousands, Except Share Data and As Otherwise Noted)
8. COMMITMENTS AND CONTINGENCIES
Indemnification Arrangements
Consistent with standard business practices in the normal course of business, the Company enters into contracts that contain indemnities for affiliates of the Company, persons acting on behalf of the Company or such affiliates and third parties. The terms of the indemnities vary from contract to contract and the Company’s maximum exposure under these arrangements cannot be determined and has not been recorded within the Consolidated Statements of Financial Condition. As of December 31, 2024, the Company has not had prior claims or losses pursuant to these contracts and expects the risk of loss to be remote.
Commitments
As of December 31, 2024 and 2023, the Company had aggregate unfunded commitments to invest in funds it manages or to support certain strategic initiatives of $1,451.4 million and $1,030.6 million, respectively.
Guarantees
The guarantee agreements that the Company enters into with financial institutions are primarily to guarantee credit facilities held by certain funds. In the ordinary course of business, the guarantee of credit facilities held by funds may indicate control and result in consolidation of the fund. As of December 31, 2024 and 2023, the Company’s maximum exposure to losses from guarantees was $1.1 million and $122.3 million, respectively.
Contingent Liabilities
WSM Earnout and WSM MIP
In connection with the WSM Acquisition during the fourth quarter of 2024, the Company established two arrangements with the seller and certain professionals, including (i) an earnout arrangement (“WSM Earnout”) based on the achievement of revenue targets from the fundraising of a real estate equity fund; and (ii) a management incentive program (the “WSM MIP”) based on the achievement of certain revenue targets associated with growing revenue sources from new business ventures. The WSM Earnout and WSM MIP represent contingent liabilities not to exceed $40.0 million and $25.0 million, respectively.
The portion of the WSM Earnout and WSM MIP attributable to the sellers is, 59.1% and 30.0%, respectively, and represents a component of purchase consideration that will be accounted for as contingent consideration. The fair value of these contingent liabilities as of the acquisition date was $17.6 million. The contingent liabilities are subject to change over the measurement periods, which will end: (i) on the final fundraising date of the real estate equity fund for the WSM Earnout; and (ii) no later than December 31, 2027 for the WSM MIP. Changes in fair value from the acquisition date will be recorded within other income (expense), net within the Consolidated Statements of Operations. Following the measurement period end dates, the contingent liabilities will be settled in cash. As of December 31, 2024, the fair value of the contingent liabilities was $17.6 million and recorded within accrued compensation within the Consolidated Statements of Financial Condition.
The portion of the WSM Earnout and WSM MIP attributable to the professionals is, 40.9% and 70.0%, respectively, and requires continued service through the measurement periods. The Company expects to settle the contingent liabilities at the Company's discretion with a component of cash and the remaining balance in equity awards as follows: (i) no less than 60.0% cash for the WSM Earnout; and (ii) no less than 50.0% cash for the WSM MIP. The WSM Earnout and WSM MIP are remeasured each period with incremental changes in fair value for the cash and equity components of these liabilities recognized within compensation and benefits expense within the Consolidated Statements of Operations. As of December 31, 2024, the fair value of the contingent liabilities were $15.6 million. Compensation expense of $0.8 million for the year ended December 31, 2024 is presented within compensation and benefits within the Consolidated Statements of Operations with an equal offset presented within accrued compensation within the Consolidated Statements of Financial Condition. Following the measurement period end dates, the cash components will be paid and the equity awards will be granted at fair value for the balance of the liability. The unpaid liabilities at the respective measurement period end dates will be reclassified from liability to additional paid-in-capital. Any compensation expense associated with the WSM Earnout and WSM MIP that was not
Ares Management Corporation
Notes to the Consolidated Financial Statements (Continued)
(Dollars in Thousands, Except Share Data and As Otherwise Noted)
previously recorded through the final measurement period end dates will be recognized as equity-based compensation expense over the remaining service periods of four years and two years for the WSM Earnout and WSM MIP, respectively.
Crescent Point MIP
In connection with the Crescent Point Acquisition during the fourth quarter of 2023, the Company established a management incentive program (the “Crescent Point MIP”) with certain professionals. The Crescent Point MIP represents a contingent liability not to exceed $75.0 million and is based on the achievement of revenue targets from the fundraising of a future private equity fund during the measurement period, which will end on the final fundraising date for the fund.
The Company expects to settle the liability with a combination of 33.0% cash and 67.0% equity awards. Expense associated with the cash and equity components are recognized ratably over the measurement period. The Crescent Point MIP is remeasured each period with incremental changes in fair value included within compensation and benefits expense within the Consolidated Statements of Operations. Following the measurement period end date, the cash component will be paid and the equity component will be settled with shares of the Company’s Class A common stock that will be granted at fair value.
As of December 31, 2024 and 2023, the contingent liability was $75.0 million. As of December 31, 2024 and 2023, the Company has recorded $25.0 million and $5.0 million, respectively, within accrued compensation within the Consolidated Statements of Financial Condition. Compensation expense of $20.0 million and $5.0 million for the years ended December 31, 2024 and 2023, respectively, is presented within compensation and benefits within the Consolidated Statements of Operations.
Infrastructure Debt MIP
In connection with the acquisition of AMP Capital’s infrastructure debt platform (the “Infrastructure Debt Acquisition”) during the first quarter of 2022, the Company established a management incentive program (the “Infrastructure Debt MIP”) with certain professionals. The Infrastructure Debt MIP represents a contingent liability not to exceed $48.5 million and is based on the achievement of revenue targets from the fundraising of three infrastructure debt funds during the measurement periods.
The Company expects to settle each portion of the liability with a combination of 15.0% cash and 85.0% equity awards. Expense associated with the cash components are recognized ratably over the respective measurement periods, which will end on the final fundraising date for each of the infrastructure debt funds. Expense associated with the equity component is recognized ratably over the service periods, which will continue for four years beyond each of the measurement period end dates. The Infrastructure Debt MIP is remeasured each period with incremental changes in value included within compensation and benefits expense within the Consolidated Statements of Operations. Following each of the measurement period end dates, the cash component will be paid and equity awards for the portion of the Infrastructure Debt MIP award earned will be granted at fair value. The unpaid liability at the respective measurement period end dates will be reclassified from liability to additional paid-in-capital and any difference between the Infrastructure Debt MIP award achieved at the respective measurement period end date and the previously recorded compensation expense will be recognized over the remaining four year service period as equity-based compensation expense.
The revenue target was achieved for one of the infrastructure debt funds during the fourth quarter of 2022 and the associated liability for this portion of the award was settled during the first quarter of 2023. As of December 31, 2024, the maximum contingent liability associated with the Infrastructure Debt MIP for the two remaining infrastructure debt funds was $15.0 million.
During the fourth quarter of 2024, it was determined that it is not probable for one of the infrastructure debt funds to achieve its revenue target by the end of its measurement period. As a result, the Company reversed previously recorded expenses of $1.6 million associated with this fund from compensation and benefits within the Consolidated Statements of Operations.
As of December 31, 2024 and 2023, the fair value of the contingent liability associated with the remaining infrastructure debt fund was $9.0 million for both periods. As of December 31, 2024 and 2023, the Company has recorded $4.1 million and $2.8 million, respectively, within accrued compensation within the Consolidated Statements of Financial Condition. Compensation expense associated with the remaining Infrastructure Debt MIP of $1.3 million, $1.5 million and $1.3 million for the years ended December 31, 2024, 2023 and 2022, respectively, is presented within compensation and benefits within the Consolidated Statements of Operations.
Ares Management Corporation
Notes to the Consolidated Financial Statements (Continued)
(Dollars in Thousands, Except Share Data and As Otherwise Noted)
Carried Interest
Carried interest is affected by changes in the fair values of the underlying investments in the funds that are advised by the Company. Valuations, on an unrealized basis, can be significantly affected by a variety of external factors including, but not limited to, public equity market volatility, industry trading multiples and interest rates. Generally, if at the termination of a fund (and increasingly at interim points in the life of a fund), the fund has not achieved investment returns that exceed the preferred return threshold or the general partner has received net profits over the life of the fund in excess of its allocable share under the applicable partnership agreement, the Company will be obligated to repay carried interest that was received by the Company in excess of the amounts to which the Company is entitled. This contingent obligation is normally reduced by income taxes paid by the Company related to its carried interest.
Senior professionals of the Company who have received carried interest distributions are responsible for funding their proportionate share of any contingent repayment obligations. However, the governing agreements of certain of the Company’s funds provide that if a current or former professional does not fund his or her respective share for such fund, then the Company may have to fund additional amounts beyond what was received in carried interest, although the Company will generally retain the right to pursue any remedies under such governing agreements against those carried interest recipients who fail to fund their obligations.
Additionally, at the end of the life of the funds there could be a payment due to a fund by the Company if the Company has recognized more carried interest than was ultimately earned. The general partner obligation amount, if any, will depend on final realized values of investments at the end of the life of the fund.
As of December 31, 2024 and 2023, if the Company assumed all existing investments were worthless, the amount of carried interest subject to potential repayment, net of tax distributions, which may differ from the recognition of revenue, would have been approximately $59.6 million and $78.5 million, respectively, of which approximately $39.5 million and $54.5 million, respectively, is reimbursable to the Company by certain professionals who are the recipients of such carried interest. Management believes the possibility of all of the investments becoming worthless is remote. As of December 31, 2024 and 2023, if the funds were liquidated at their fair values, there would be no contingent repayment obligation or liability.
Litigation
From time to time, the Company is named as a defendant in legal actions relating to transactions conducted in the ordinary course of business. Although there can be no assurance of the outcome of such legal actions, in the opinion of management, the Company does not have a potential liability related to any current legal proceeding or claim that would individually or in the aggregate materially affect its results of operations, financial condition or cash flows.
Ares Management Corporation
Notes to the Consolidated Financial Statements (Continued)
(Dollars in Thousands, Except Share Data and As Otherwise Noted)
Leases
The Company’s leases primarily consists of operating leases for office space and certain office equipment. The Company’s leases have remaining lease terms of one to 19 years. The tables below present certain supplemental quantitative disclosures regarding the Company’s operating leases:
| | | | | | | | | | | |
| Maturity of operating lease liabilities | | | As of December 31, 2024 | | |
| 2025 | | | $ | 56,074 | | | |
| 2026 | | | 61,178 | | | |
| 2027 | | | 56,546 | | | |
| 2028 | | | 69,900 | | | |
| 2029 | | | 64,927 | | | |
| Thereafter | | | 703,955 | | | |
| Total future payments | | | 1,012,580 | | | |
| Less: interest | | | 370,716 | | | |
| Total operating lease liabilities | | | $ | 641,864 | | | |
| | | | | | | | | | | | | | | | | | | | | | | | |
| | | | Year ended December 31, |
| Classification within general, administrative and other expenses | | | | | | 2024 | | 2023 | | 2022 |
| Operating lease expense | | | | | | $ | 66,812 | | | $ | 49,531 | | | $ | 42,746 | |
| | | | | | | | | | | | | | | | | | | | |
| | |
| | Year ended December 31, |
| Supplemental information on the measurement of operating lease liabilities | | 2024 | | 2023 | | 2022 |
| Operating cash flows for operating leases | | $ | 55,439 | | | $ | 45,103 | | | $ | 46,558 | |
| | | | | | |
| | | | | | |
| | | | | | |
| Leased assets obtained in exchange for new operating lease liabilities | | 308,377 | | | 168,876 | | | 43,331 | |
| | | | | | | | | | | | | | | |
| | | | | |
| | | As of December 31, |
| Lease term and discount rate | | | 2024 | | 2023 |
| | | | | |
| Weighted-average remaining lease terms (in years) | | | 14.1 | | 8.4 |
| | | | | |
| | | | | |
| Weighted-average discount rate | | | 5.8% | | 4.3% |
| | | | | |
9. RELATED PARTY TRANSACTIONS
Substantially all of the Company’s revenue is earned from its affiliates. The related accounts receivable are included within due from affiliates within the Consolidated Statements of Financial Condition, except that accrued carried interest, which is predominantly due from affiliated funds, is presented separately within investments within the Consolidated Statements of Financial Condition.
The Company has investment management agreements with the Ares Funds that it manages. In accordance with these agreements, these Ares Funds may bear certain operating costs and expenses which are initially paid by the Company and subsequently reimbursed by the Ares Funds.
Employees and other related parties may be permitted to participate in co-investment vehicles that generally invest in Ares Funds alongside fund investors. Participation is limited by law to individuals who qualify under applicable securities laws. These co-investment vehicles generally do not require these individuals to pay management fees, carried interest or incentive fees.
Carried interest and incentive fees from the funds can be distributed to professionals or their related entities on a current basis, subject, in the case of carried interest programs, to repayment by the subsidiary of the Company that acts as general partner of the relevant fund in the event that certain specified return thresholds are not ultimately achieved. The professionals have personally guaranteed, subject to certain limitations, the obligations of these subsidiaries in respect of this general partner obligation. Such guarantees are several, and not joint, and are limited to distributions received by the relevant recipient.
Ares Management Corporation
Notes to the Consolidated Financial Statements (Continued)
(Dollars in Thousands, Except Share Data and As Otherwise Noted)
The Company considers its professionals and non-consolidated funds to be affiliates. Amounts due from and to affiliates were composed of the following:
| | | | | | | | | | | |
| | | |
| As of December 31, |
| | 2024 | | 2023 |
| Due from affiliates: | | | |
| Management fees receivable from non-consolidated funds | $ | 636,835 | | | $ | 560,629 | |
| Incentive fee receivable from non-consolidated funds | 172,235 | | | 159,098 | |
| Payments made on behalf of and amounts due from non-consolidated funds and employees | 247,538 | | | 177,019 | |
| Due from affiliates—Company | $ | 1,056,608 | | | $ | 896,746 | |
| | | |
| | | |
| Due to affiliates: | | | |
| Management fee received in advance and rebates payable to non-consolidated funds | $ | 5,767 | | | $ | 9,585 | |
| Tax receivable agreement liability | 402,359 | | | 191,299 | |
| Carried interest and incentive fees payable | 78,692 | | | 33,374 | |
| Payments made by non-consolidated funds on behalf of and payable by the Company | 13,662 | | | 5,996 | |
| Due to affiliates—Company | $ | 500,480 | | | $ | 240,254 | |
| Amounts due to portfolio companies and non-consolidated funds | $ | — | | | $ | 3,554 | |
| Due to affiliates—Consolidated Funds | $ | — | | | $ | 3,554 | |
Due from and Due to Ares Funds and Portfolio Companies
In the normal course of business, the Company pays certain expenses on behalf of Consolidated Funds and non-consolidated funds for which it is reimbursed. Conversely, Consolidated Funds and non-consolidated funds may pay certain expenses that are reimbursed by the Company. Certain expenses initially paid by the Company, primarily professional services, travel and other costs associated with particular portfolio company holdings, are subject to reimbursement by the portfolio companies.
Ares Management Corporation
Notes to the Consolidated Financial Statements (Continued)
(Dollars in Thousands, Except Share Data and As Otherwise Noted)
10. INCOME TAXES
The Company’s effective income tax rate is dependent on many factors, including the estimated nature and amounts of income and expenses allocated to the non-controlling interests without being subject to federal, state and local income taxes at the corporate level. Additionally, the Company’s effective tax rate is influenced by the amount of income tax provision recorded for any affiliated funds and co-investment vehicles that are consolidated in the Company’s consolidated financial statements.
The Company files its tax returns as prescribed by the tax laws of the jurisdictions in which it operates. In the normal course of business, the Company is subject to examination by U.S. federal, state, local and foreign tax authorities. With limited exceptions, the Company is no longer subject to income tax audits by taxing authorities for any years prior to 2021. Although the outcome of tax audits is always uncertain, the Company does not believe the outcome of any future audit will have a material adverse effect on the Company’s consolidated financial statements.
The provision for income taxes attributable to the Company and the Consolidated Funds, consisted of the following:
| | | | | | | | | | | | | | | | | | | | |
| | | Year ended December 31, |
| Provision for Income Taxes | | 2024 | | 2023 | | 2022 |
| The Company | | | | | | |
| Current: | | | | | | |
| U.S. federal income tax expense | | $ | 63,292 | | | $ | 34,051 | | | $ | 42,452 | |
| State and local income tax expense | | 14,326 | | | 13,316 | | | 7,614 | |
| Foreign income tax expense | | 24,841 | | | 24,029 | | | 14,119 | |
| | 102,459 | | | 71,396 | | | 64,185 | |
| Deferred: | | | | | | |
| U.S. federal income tax expense | | 50,182 | | | 85,610 | | | 10,660 | |
| State and local income tax expense | | 7,819 | | | 15,872 | | | 2,131 | |
| Foreign income tax benefit | | (2,917) | | | (3,730) | | | (5,416) | |
| | 55,084 | | | 97,752 | | | 7,375 | |
| Total: | | | | | | |
| U.S. federal income tax expense | | 113,474 | | | 119,661 | | | 53,112 | |
| State and local income tax expense | | 22,145 | | | 29,188 | | | 9,745 | |
| Foreign income tax expense | | 21,924 | | | 20,299 | | | 8,703 | |
| Income tax expense | | 157,543 | | | 169,148 | | | 71,560 | |
| | | | | | |
| Consolidated Funds | | | | | | |
| Current: | | | | | | |
| | | | | | |
| | | | | | |
| Foreign income tax expense (benefit) | | (1,331) | | | 3,823 | | | 331 | |
| | (1,331) | | | 3,823 | | | 331 | |
| Deferred: | | | | | | |
| U.S. federal income tax expense | | 8,405 | | | — | | | — | |
| | | | | | |
| | | | | | |
| | 8,405 | | | — | | | — | |
| Total: | | | | | | |
| U.S. federal income tax expense | | 8,405 | | | — | | | — | |
| | | | | | |
| Foreign income tax expense (benefit) | | (1,331) | | | 3,823 | | | 331 | |
| Income tax expense | | 7,074 | | | 3,823 | | | 331 | |
| | | | | | |
| Total Provision for Income Taxes | | | | | | |
| Total current income tax expense | | 101,128 | | | 75,219 | | | 64,516 | |
| Total deferred income tax expense | | 63,489 | | | 97,752 | | | 7,375 | |
| Income tax expense | | $ | 164,617 | | | $ | 172,971 | | | $ | 71,891 | |
Ares Management Corporation
Notes to the Consolidated Financial Statements (Continued)
(Dollars in Thousands, Except Share Data and As Otherwise Noted)
The effective income tax rate differed from the federal statutory rate for the following reasons:
| | | | | | | | | | | | | | | | | | | | |
| | | Year ended December 31, |
| | | 2024 | | 2023 | | 2022 |
| Income tax expense at federal statutory rate | | 21.0% | | 21.0% | | 21.0% |
| Income passed through to non-controlling interests | | (9.3) | | (9.6) | | (8.9) |
| State and local taxes, net of federal benefit | | 1.4 | | 1.7 | | 2.2 |
| Foreign taxes | | (0.7) | | (0.7) | | (1.4) |
| Permanent items | | 0.1 | | 0.2 | | 0.6 |
| Disallowed executive compensation | | 0.3 | | 0.2 | | 0.1 |
| Other, net | | 0.1 | | 0.3 | | 0.3 |
| Valuation allowance | | — | | (0.1) | | 0.2 |
| Total effective rate | | 12.9% | | 13.0% | | 14.1% |
Deferred Taxes
The income tax effects of temporary differences that give rise to significant portions of deferred tax assets and liabilities were as follows as of December 31, 2024 and 2023. Deferred tax assets, net are included within other assets within the Consolidated Statements of Financial Condition.
| | | | | | | | | | | | | | |
| | | As of December 31, |
| Deferred Tax Assets and Liabilities of the Company | | 2024 | | 2023 |
| Deferred tax assets | | | | |
| Amortizable tax basis for AOG Unit exchanges | | $ | 451,343 | | | $ | 205,627 | |
| | | | |
| Net operating losses and capital loss carryforwards | | 1,888 | | | 1,829 | |
| Other, net | | 9,793 | | | 6,511 | |
| Total gross deferred tax assets | | 463,024 | | | 213,967 | |
| Valuation allowance | | (941) | | | (942) | |
| Total net deferred tax assets | | 462,083 | | | 213,025 | |
| Deferred tax liabilities | | | | |
| Investment in partnerships | | (220,189) | | | (191,476) | |
| | | | |
| Total deferred tax liabilities | | (220,189) | | | (191,476) | |
| Deferred tax assets, net | | $ | 241,894 | | | $ | 21,549 | |
| | | | | | | | | | | | | | |
| | | As of December 31, |
| Deferred Tax Assets and Liabilities of the Consolidated Funds | | 2024 | | 2023 |
| Deferred tax assets | | | | |
| Net operating losses | | $ | 7,932 | | | $ | 2,598 | |
| | | | |
| Total gross deferred tax assets | | 7,932 | | | 2,598 | |
| Valuation allowance | | (1,229) | | | (2,598) | |
| Total net deferred tax assets | | 6,703 | | | — | |
| Deferred tax liabilities | | | | |
| Investments in partnerships | | (15,108) | | | — | |
| Total deferred tax liabilities | | (15,108) | | | — | |
| Deferred tax assets (liabilities), net | | $ | (8,405) | | | $ | — | |
| | | | |
| | | | |
| | | | |
| | | | |
In assessing the realizability of deferred tax assets, the Company considers whether it is probable that some or all of the deferred tax assets will not be realized. In determining whether the deferred taxes are realizable, the Company considers the period of expiration of the tax asset, historical and projected taxable income, and tax liabilities for the tax jurisdiction in which the tax asset is located. Valuation allowances are provided to reduce the amounts of deferred tax assets to an amount that is more likely than not to be realized based on an assessment of positive and negative evidence, including estimates of future taxable income necessary to realize future deductible amounts.
The Company’s income tax provision includes corporate income taxes and other entity level income taxes, as well as income taxes incurred by Consolidated Funds.
Ares Management Corporation
Notes to the Consolidated Financial Statements (Continued)
(Dollars in Thousands, Except Share Data and As Otherwise Noted)
As of December 31, 2024 and 2023, the valuation allowance for the Company’s deferred tax assets was $0.9 million. The deferred tax assets related to operating losses in foreign jurisdictions and certain capital loss carryforwards do not meet the more likely than not threshold and have a valuation allowance recorded for the net balance.
As of December 31, 2024 and 2023, the Company had $36.4 million and $10.6 million, respectively, of net operating loss (“NOL”) carryforwards and other tax attributes related to its Consolidated Funds available to reduce future income taxes for which a full valuation allowance has been provided. The NOL carryforwards generally have no expiry.
As of, and for the years ended December 31, 2024, 2023 and 2022, the Company had no significant uncertain tax positions.
Ares Management Corporation
Notes to the Consolidated Financial Statements (Continued)
(Dollars in Thousands, Except Share Data and As Otherwise Noted)
11. EARNINGS PER SHARE
The Company has Class A and non-voting common stock outstanding. The non-voting common stock has the same economic rights as the Class A common stock; therefore, earnings per share is presented on a combined basis. Income of the Company has been allocated on a proportionate basis to the two common stock classes.
Basic earnings per share of Class A and non-voting common stock is computed by using the two-class method. Diluted earnings per share of Class A and non-voting common stock is computed using the more dilutive method of either the two-class method or the treasury stock and if-converted methods.
For the years ended December 31, 2024 and 2022, the two-class method was the more dilutive method. For the year ended December 31, 2023, the treasury stock method was the more dilutive method.
The computation of diluted earnings per share excludes the following restricted units and AOG Units as their effect would have been anti-dilutive under the treasury stock method:
| | | | | | | | | | | | | | | | | | | | | |
| | | Year ended December 31, |
| | | | | 2024 | | 2023 | | 2022 |
| | | | | | | | | |
| Restricted units | | | | | N/A | | 2,071 | | | N/A |
| AOG Units | | | | | N/A | | 118,804,252 | | | N/A |
| | | | | | | | | |
The following table presents the computation of basic and diluted earnings per common share:
| | | | | | | | | | | | | | | | | | | | | |
| | | Year ended December 31, |
| | | | | 2024 | | 2023 | | 2022 |
| Basic earnings per share of Class A and non-voting common stock: | | | | | | | | | |
| Net income attributable to Ares Management Corporation Class A and non-voting common stockholders | | | | | $ | 440,961 | | | $ | 474,326 | | | $ | 167,541 | |
| Dividends declared and paid on Class A and non-voting common stock | | | | | (742,970) | | | (571,923) | | | (429,104) | |
| Distributions on unvested restricted units | | | | | (30,766) | | | (21,303) | | | (14,096) | |
| | | | | | | | | |
| Dividends in excess of earnings available to Class A and non-voting common stockholders | | | | | $ | (332,775) | | | $ | (118,900) | | | $ | (275,659) | |
| Basic weighted-average shares of Class A and non-voting common stock | | | | | 198,054,451 | | | 184,523,524 | | | 175,510,798 | |
| Dividends in excess of earnings per share of Class A and non-voting common stock | | | | | $ | (1.68) | | | $ | (0.64) | | | $ | (1.57) | |
| Dividend declared and paid per Class A and non-voting common stock | | | | | 3.72 | | | 3.08 | | | 2.44 | |
| Basic earnings per share of Class A and non-voting common stock | | | | | $ | 2.04 | | | $ | 2.44 | | | $ | 0.87 | |
| | | | | | | | | |
| Diluted earnings per share of Class A and non-voting common stock: | | | | | | | | | |
| Net income attributable to Ares Management Corporation Class A and non-voting common stockholders | | | | | $ | 440,961 | | | $ | 474,326 | | | $ | 167,541 | |
| Distributions on unvested restricted units | | | | | (30,766) | | | — | | | (14,096) | |
| | | | | | | | | |
| Net income available to Class A and non-voting common stockholders | | | | | $ | 410,195 | | | $ | 474,326 | | | $ | 153,445 | |
| Effect of dilutive shares: | | | | | | | | | |
| Restricted units | | | | | — | | | 9,347,318 | | | — | |
| Options | | | | | — | | | 1,902,584 | | | — | |
| | | | | | | | | |
| | | | | | | | | |
| Diluted weighted-average shares of Class A and non-voting common stock | | | | | 198,054,451 | | | 195,773,426 | | | 175,510,798 | |
| Diluted earnings per share of Class A and non-voting common stock | | | | | $ | 2.04 | | | $ | 2.42 | | | $ | 0.87 | |
Ares Management Corporation
Notes to the Consolidated Financial Statements (Continued)
(Dollars in Thousands, Except Share Data and As Otherwise Noted)
12. EQUITY COMPENSATION
Equity Incentive Plan
Equity-based compensation is granted under the Company’s Equity Incentive Plan. The total number of shares available to be issued under the Equity Incentive Plan resets based on a formula defined in the Equity Incentive Plan and may increase on January 1 of each year. On January 1, 2024, the total number of shares available for issuance under the Equity Incentive Plan reset to 69,122,318 shares and as of December 31, 2024, 62,634,307 shares remained available for issuance.
Generally, unvested awards are forfeited upon termination of employment in accordance with the Equity Incentive Plan. The Company recognizes forfeitures as a reversal of previously recognized compensation expense in the period the forfeiture occurs.
Equity-based compensation expense, net of forfeitures, recorded by the Company for unvested awards is presented in the following table:
| | | | | | | | | | | | | | | | | | | | | |
| | | Year ended December 31, |
| | | | | | 2024 | | 2023 | | 2022 |
| Unvested awards | | | | | $ | 352,851 | | | $ | 255,965 | | | $ | 200,391 | |
| | | | | | | | | |
| | | | | | | | | |
| | | | | | | | | |
Unvested Awards
Each unvested award represents either a share of the Company’s Class A common stock that is subject to restriction or a restricted unit, representing an unfunded, unsecured right of the holder to receive a share of the Company’s Class A common stock on a specific date. The unvested awards generally vest and the restrictions lapse or are settled in shares of Class A common stock, as applicable, at a rate of either: (i) one-quarter per year, beginning on the second anniversary of the grant date or the holder’s employment commencement date; or (ii) one-third per year, beginning on the first anniversary of the grant date, in each case generally subject to the holder’s continued employment as of the applicable vesting date (subject to accelerated vesting upon certain qualifying terminations of employment or retirement eligibility provisions). Compensation expense associated with unvested awards is recognized on a straight-line basis over the requisite service period of the award.
Restricted units are delivered net of the holder’s payroll-related taxes upon vesting. For the year ended December 31, 2024, 4.2 million restricted units vested and 2.3 million shares of Class A common stock were delivered to the holders. For the year ended December 31, 2023, 3.8 million restricted units vested and 2.2 million shares of Class A common stock were delivered to the holders.
The following table summarizes the Company’s dividends declared and Dividend Equivalents paid during the year ended December 31, 2024:
| | | | | | | | | | | | | | |
| Record Date | | Dividends Per Share | | Dividend Equivalents Paid |
| March 15, 2024 | | $ | 0.93 | | | $ | 16,294 | |
| June 14, 2024 | | 0.93 | | | 16,008 | |
| September 16, 2024 | | 0.93 | | | 16,242 | |
| December 17, 2024 | | 0.93 | | | 16,098 | |
During the first quarter of 2024, the Company approved the future grant of restricted units to certain senior executives in each of 2025 and 2026, subject to the holder’s continued employment and acceleration in certain instances. These restricted units vest before July 1, 2029, at a rate of either: (i) one-quarter per year, beginning on the first anniversary of the grant date; or (ii) one-third per year, beginning on the first anniversary of the grant date. Given that these future restricted units have been communicated to the recipient, the Company accounts for these awards as if they have been granted and recognizes the compensation expense on a straight-line basis over the service period. The restricted units that have been approved and communicated but not yet granted are not eligible to receive a Dividend Equivalent until the grant date.
Ares Management Corporation
Notes to the Consolidated Financial Statements (Continued)
(Dollars in Thousands, Except Share Data and As Otherwise Noted)
The following table presents unvested awards’ activity:
| | | | | | | | | | | | | |
| | Unvested Awards | | Weighted Average
Grant Date Fair
Value Per Unvested Award | | |
| Balance as of December 31, 2023 | 17,359,829 | | | $ | 59.20 | | | |
| Granted | 5,167,328 | | | 124.88 | | | |
| Vested | (4,151,900) | | | 52.27 | | | |
| Forfeited | (406,317) | | | 85.06 | | | |
| Balance as of December 31, 2024 | 17,968,940 | | | $ | 79.11 | | | |
The total compensation expense expected to be recognized in all future periods associated with unvested awards is approximately $909.7 million as of December 31, 2024 and is expected to be recognized over the remaining weighted average period of 3.5 years.
Options
Upon exercise, each option entitles the holders to purchase from the Company one share of Class A common stock at the stated exercise price.
A summary of options activity during the year ended December 31, 2024 is presented below:
| | | | | | | | | | | | | | | | | | | | | | | |
| | Options | | Weighted Average Exercise Price | | Weighted Average Remaining Life
(in years) | | Aggregate Intrinsic Value |
| Balance as of December 31, 2023 | 79,524 | | | $ | 19.00 | | | 0.3 | | $ | 7,946 | |
| | | | | | | |
| Exercised | (79,524) | | | 19.00 | | | — | | | — | |
| | | | | | | |
| | | | | | | |
| Balance as of December 31, 2024 | — | | | $ | — | | | — | | | $ | — | |
Net cash proceeds from exercises of options were $1.5 million for the year ended December 31, 2024. The Company realized tax benefits of approximately $1.4 million from the exercise of the remaining options during the first quarter of 2024.
13. EQUITY AND REDEEMABLE INTEREST
Common Stock
The Company’s common stock consists of Class A, Class B, Class C and non-voting common stock, each $0.01 par value per share. The non-voting common stock has the same economic rights as the Class A common stock. Sumitomo Mitsui Banking Corporation (“SMBC”) is the sole holder of the non-voting common stock. The Class B common stock and Class C common stock are non-economic and holders are not entitled to dividends from the Company or to receive any assets of the Company in the event of any dissolution, liquidation or winding up of the Company. Ares Management GP LLC is the sole holder of the Class B common stock and Ares Voting LLC (“Ares Voting”) is the sole holder of the Class C common stock.
Except as otherwise expressly provided in the Company’s Certificate of Incorporation (the “Certificate of Incorporation”), the Company’s common stockholders are entitled to vote on all matters on which stockholders of a corporation are generally entitled to vote under the Delaware General Corporation Law (the “DGCL”), including the election of the Company’s board of directors. Holders of shares of the Company’s Class A common stock are entitled to one vote per share of the Company’s Class A common stock. On any date on which the Ares Ownership Condition (as defined in the Certificate of Incorporation) is satisfied, holders of shares of the Company’s Class B common stock are, in the aggregate, entitled to a number of votes equal to (x) four times the aggregate number of votes attributable to the Company’s Class A common stock minus (y) the aggregate number of votes attributable to the Company’s Class C common stock. On any date on which the Ares Ownership Condition is not satisfied, holders of shares of the Company’s Class B common stock are not entitled to vote on any matter submitted to a vote of the Company’s stockholders. The holder of shares of the Company’s Class C common stock is generally entitled to a number of votes equal to the number of AOG Units (as defined in the Certificate of Incorporation) held of record by each Ares Operating Group Limited Partner (as defined in the Certificate of Incorporation) other than the Company and its
Ares Management Corporation
Notes to the Consolidated Financial Statements (Continued)
(Dollars in Thousands, Except Share Data and As Otherwise Noted)
subsidiaries. Issuances of Class C common stock correspond with increases in Ares Owners Holdings L.P.’s ownership interest in the AOG entities.
The Company has a stock repurchase program that allows for the repurchase of up to $150.0 million of shares of Class A common stock. Under the program, shares may be repurchased from time to time in open market purchases, privately negotiated transactions or otherwise, including in reliance on Rule 10b5-1 of the Securities Act. The renewal of the program is subject to authorization by the Company’s board of directors on an annual basis. As of December 31, 2024, the program was scheduled to expire in March 2025. In February 2025, the renewal of the program was authorized by the Company’s board of directors and will expire in March 2026, with an increase in size up to $750.0 million. Repurchases under the program, if any, will depend on the prevailing market conditions and other factors. During the years ended December 31, 2024, 2023 and 2022, the Company did not repurchase any shares as part of the stock repurchase program.
The Company issued and sold 3,047,500 shares of Class A common stock during the year ended December 31, 2024 (the “Offering”). The Offering resulted in net proceeds of approximately $407.2 million (after deducting underwriting discounts and offering expenses).
The following table presents the changes in each class of common stock:
| | | | | | | | | | | | | | | | | | | | | | | | | | | | | |
| Class A Common Stock | | Non-Voting Common Stock | | Class B Common Stock | | Class C Common Stock | | Total |
| Balance as of December 31, 2023 | 187,069,907 | | | 3,489,911 | | | 1,000 | | | 117,024,758 | | | 307,585,576 | |
| Issuance of common stock | 3,122,628 | | | — | | | — | | | 63,179 | | | 3,185,807 | |
| Exchanges of AOG Units | 7,281,248 | | | — | | | — | | | (7,281,248) | | | — | |
| | | | | | | | | |
| Stock option exercises, net of shares withheld for tax | 79,524 | | | — | | | — | | | — | | | 79,524 | |
| | | | | | | | | |
| Vesting of restricted unit awards, net of shares withheld for tax | 2,319,264 | | | — | | | — | | | — | | | 2,319,264 | |
| | | | | | | | | |
| Balance as of December 31, 2024 | 199,872,571 | | | 3,489,911 | | | 1,000 | | | 109,806,689 | | | 313,170,171 | |
The following table presents each partner’s AOG Units and corresponding ownership interest in each of the AOG entities, as well as its daily average ownership of AOG Units in each of the AOG entities:
| | | | | | | | | | | | | | | | | | | | | | | | | | | | | | | | | | | | | | | | | | | | | | | | | |
| | | | | | | | | | | | | Daily Average Ownership |
| | As of December 31, 2024 | | As of December 31, 2023 | | | | Year ended December 31, |
| | AOG Units | | Direct Ownership Interest | | AOG Units | | Direct Ownership Interest | | | | | | 2024 | | 2023 | | | 2022 |
| Ares Management Corporation | | 203,362,482 | | | 64.94% | | 190,559,818 | | | 61.95% | | | | | | 63.61% | | 60.83% | | | 59.76% |
| Ares Owners Holdings, L.P. | | 109,806,689 | | | 35.06 | | 117,024,758 | | | 38.05 | | | | | | 36.39 | | 39.17 | | | 40.24 |
| Total | | 313,169,171 | | | 100.00% | | 307,584,576 | | | 100.00% | | | | | | | | | | | |
The Company’s ownership percentage of the AOG Units will continue to change upon: (i) the vesting of restricted units that were granted under the Equity Incentive Plan; (ii) the exchange of AOG Units for shares of Class A common stock; (iii) the cancellation of AOG Units in connection with certain individuals’ forfeiture of AOG Units upon termination of employment; and (iv) the issuance of new AOG Units, including in connection with acquisitions, among other strategic reasons. Holders of the AOG Units, subject to any applicable transfer restrictions, may up to four times each year (subject to the terms of the exchange agreement) exchange their AOG Units for shares of Class A common stock on a one-for-one basis. Equity is reallocated among partners upon a change in ownership to ensure each partners’ capital account properly reflects their respective claim on the residual value of the Company. This change is reflected as either a reallocation of interest or as dilution within the Consolidated Statements of Changes in Equity.
Ares Management Corporation
Notes to the Consolidated Financial Statements (Continued)
(Dollars in Thousands, Except Share Data and As Otherwise Noted)
Preferred Stock
In October 2024, the Company issued 30,000,000 shares of its Series B mandatory convertible preferred stock for total proceeds of $1,462.5 million (after deducting underwriting discounts but before offering expenses).
As of December 31, 2024, the Company had 30,000,000 shares of Series B mandatory convertible preferred stock outstanding. When, as and if declared by the Company’s board of directors, dividends on the Series B mandatory convertible preferred stock are payable quarterly at a rate per annum equal to 6.75% on January 1, April 1, July 1 and October 1 of each year, beginning on January 1, 2025 and concluding on October 1, 2027. Declared dividends on the Series B mandatory convertible preferred stock will be payable, at the Company’s election, in cash, shares of its Class A common stock or a combination of cash and shares of its Class A common stock. Dividends on Series B mandatory convertible preferred stock are cumulative and the Series B mandatory convertible preferred stock, unless previously converted or redeemed, will automatically convert into the Company’s Class A common stock on October 1, 2027.
Redeemable Interest
On July 1, 2020, the Company completed its acquisition of a majority interest in SSG Capital Holdings Limited and its operating subsidiaries (“SSG” and subsequently rebranded as “Ares SSG”) (the “SSG Acquisition”). In connection with the SSG Acquisition, the former owners of SSG retained a 20% ownership interest in the operations acquired by the Company. During the year ended December 31, 2023, the Company purchased a portion of the redeemable interest in AOG entities (the “SSG Buyout”), and the Company now owns 100% of Ares SSG’s fee-generating business. The remaining redeemable interest in AOG entities represents ownership in certain investments that were not included in the 20% ownership interest buyout arrangement, and continues to be presented at the redemption amount within mezzanine equity within the Consolidated Statements of Financial Condition.
During the year ended December 31, 2023, Ares Acquisition Corporation II (NYSE: AACT) (“AAC II”), the Company’s second sponsored SPAC, consummated its initial public offering and generated gross proceeds of $500.0 million. As of December 31, 2024, the 50,000,000 AAC II Class A ordinary shares are presented at the redemption amount within mezzanine equity within the Consolidated Statements of Financial Condition.
Ares Management Corporation
Notes to the Consolidated Financial Statements (Continued)
(Dollars in Thousands, Except Share Data and As Otherwise Noted)
The following table summarizes the activities associated with the redeemable interest in AOG entities:
| | | | | |
| Total |
| Balance as of December 31, 2021 | $ | 96,008 | |
| Distributions | (1,887) | |
| Net loss | (851) | |
| Currency translation adjustment, net of tax | (426) | |
| Equity compensation | 285 | |
| Balance as of December 31, 2022 | 93,129 | |
| Changes in ownership interests and related tax benefits | (66,507) | |
| Distributions | (2,883) | |
| Net income | 226 | |
| Currency translation adjustment, net of tax | (41) | |
| Equity compensation | 174 | |
| Balance as of December 31, 2023 | 24,098 | |
| |
| Distributions | (302) | |
| Net income | 103 | |
| Currency translation adjustment, net of tax | (403) | |
| |
| Balance as of December 31, 2024 | $ | 23,496 | |
The following table summarizes the activities associated with the redeemable interest in Consolidated Funds:
| | | | | |
| Total |
| |
| |
| Balance as of December 31, 2022 | $ | 1,013,282 | |
| Gross proceeds from the initial public offering of AAC II | 500,000 | |
| Change in redemption value | 55,530 | |
| Redemptions from Class A ordinary shares of Ares Acquisition Corporation (formerly NYSE: AAC) | (1,045,874) | |
| Balance as of December 31, 2023 | 522,938 | |
| |
| Change in redemption value | 27,762 | |
| |
| Balance as of December 31, 2024 | $ | 550,700 | |
14. SEGMENT REPORTING
The Company operates through its distinct operating segments. On January 1, 2024, the Company changed its segment composition. The special opportunities strategy, historically part of the Private Equity Group, is now referred to as opportunistic credit and is presented within the Credit Group. The Company has modified historical results to conform with its current presentation. The Company operating segments are summarized below:
Credit Group: The Credit Group manages credit strategies across the liquid and illiquid spectrum, including liquid credit, alternative credit, opportunistic credit, direct lending and Asia-Pacific (“APAC”) credit.
Real Assets Group: The Real Assets Group manages comprehensive equity and debt strategies across real estate and infrastructure investments.
Private Equity Group: The Private Equity Group broadly categorizes its investment strategies as corporate private equity and APAC private equity.
Secondaries Group: The Secondaries Group invests in secondary markets across a range of alternative asset class strategies, including private equity, real estate, infrastructure and credit.
Other: Other represents a compilation of operating segments and strategic investments that seek to expand the Company’s reach and its scale in new and existing global markets but individually do not meet reporting thresholds. These results include activities from: (i) Ares Insurance Solutions (“AIS”), the Company’s insurance platform that provides solutions to insurance clients including asset management, capital solutions and corporate development; (ii) the SPACs sponsored by the Company; and (iii) a venture capital business with fund strategies that are focused on applied artificial intelligence, among others.
Ares Management Corporation
Notes to the Consolidated Financial Statements (Continued)
(Dollars in Thousands, Except Share Data and As Otherwise Noted)
The Operations Management Group (the “OMG”) consists of shared resource groups to support the Company’s operating segments by providing infrastructure and administrative support in the areas of accounting/finance, operations, information technology, legal, compliance, human resources, strategy, relationship management, and distribution, including Ares Wealth Management Solutions, LLC (“AWMS”). AWMS facilitates the product development, distribution, marketing and client management activities for investment offerings in the global wealth management channel. Additionally, the OMG provides services to certain of the Company’s managed funds and vehicles, which may reimburse the OMG for expenses either equal to the costs of services provided or as a percentage of invested capital. The OMG’s revenues and expenses are not allocated to the Company’s operating segments but the Company does consider the financial results of the OMG when evaluating its financial performance.
Segment Profit Measure: Realized income (“RI”), which includes fee related earnings (“FRE”) as a component, supplements and should be considered in addition to, and not in lieu of, the Consolidated Statements of Operations prepared in accordance with GAAP.
RI, a non-GAAP measure, is an operating metric used by management to evaluate performance of the business based on operating performance and the contribution of each of the business segments to that performance, while removing the fluctuations of unrealized income and expenses, which may or may not be eventually realized at the levels presented and whose realizations depend more on future outcomes than current business operations. RI differs from income before taxes by excluding: (i) operating results of the Consolidated Funds; (ii) depreciation and amortization expense; (iii) the effects of changes arising from corporate actions; (iv) unrealized gains and losses related to carried interest, incentive fees and investment performance; and adjusts for certain other items that the Company believes are not indicative of operating performance. Changes arising from corporate actions include equity-based compensation expenses, the amortization of intangible assets, transaction costs associated with mergers, acquisitions and capital activities, underwriting costs and expenses incurred in connection with corporate reorganization. Placement fee adjustment represents the net portion of either expense deferral or amortization of upfront fees to placement agents that is presented to match the timing of expense recognition with the period over which management fees are expected to be earned from the associated fund for segment purposes but have been expensed in advance in accordance with GAAP. For periods in which the amortization of upfront fees for segment purposes is higher than the GAAP expense, the placement fee adjustment is presented as a reduction to RI. Management believes RI is a more appropriate metric to evaluate the Company’s current business operations.
FRE, a non-GAAP measure that is a component of RI, is used to assess core operating performance by determining whether recurring revenue, primarily consisting of management fees and fee related performance revenues, is sufficient to cover operating expenses and to generate profits. FRE differs from income before taxes computed in accordance with GAAP as it excludes net performance income, investment income from Ares Funds and adjusts for certain other items that the Company believes are not indicative of its core operating performance. Fee related performance revenues, together with fee related performance compensation, is presented within FRE because it represents incentive fees from perpetual capital vehicles that is measured and eligible to be received on a recurring basis and not dependent on realization events from the underlying investments.
The Company’s CODM is its Chief Executive Officer. The CODM makes operating decisions and assesses the performance of each of the Company’s business segments based on financial and operating metrics and other data that is presented before giving effect to the consolidation of any of the Consolidated Funds. Consequently, all segment data excludes the assets, liabilities and operating results related to the Consolidated Funds and non-consolidated funds. Total assets by segments is not disclosed because such information is not used by the Company’s CODM in evaluating the segments.
Many of the Ares Funds managed by the Company have mandates that allow for investing across different geographic regions, including North America, Europe, APAC and the Middle East. The primary geographic region in which the Company invests in is North America and the majority of its revenues are generated in North America.
Ares Management Corporation
Notes to the Consolidated Financial Statements (Continued)
(Dollars in Thousands, Except Share Data and As Otherwise Noted)
The following tables present the financial results for the Company’s operating segments, as well as the OMG:
| | | | | | | | | | | | | | | | | | | | | | | | | | | | | | | | | | | | | | | | | | | | | | | |
| |
| | | | | | | | | | | | | | | |
| | | | | | | | | | | | | | | |
| | | | | | | | | | | | | | | |
| | | | | | | | | | | | | | | |
| | | | | | | | | | | | | | | |
| | | | | | | | | | | | | | | |
| | | | | | | | | | | | | | | |
| | | | | | | | | | | | | | | |
| | | | | | | | | | | | | | | |
| | | | | | | | | | | | | | | |
| | | | | | | | | | | | | | | |
| | | | | | | | | | | | | | | |
| | | | | | | | | | | | | | | |
| | | | | | | | | | | | | | | |
| | | | | | | | | | | | | | | |
| | | | | | | | | | | | | | | |
| | | | | | | | | | | | | | | |
| | | | | | | | | | | | | | | |
| | | | | | | | | | | | | | | |
| | | | | | | | | | | | | | | |
| Year ended December 31, 2024 |
| Credit Group | | Real Assets Group | | Private Equity Group | | Secondaries Group | | Other | | Total Segments | | OMG | | Total |
| Management fees | $ | 2,177,816 | | | $ | 401,968 | | | $ | 137,130 | | | $ | 197,287 | | | $ | 43,229 | | | $ | 2,957,430 | | | $ | — | | | $ | 2,957,430 | |
| Fee related performance revenues | 202,703 | | | — | | | — | | | 28,834 | | | — | | | 231,537 | | | — | | | 231,537 | |
| Other fees | 41,819 | | | 27,263 | | | 1,695 | | | 222 | | | 523 | | | 71,522 | | | 20,357 | | | 91,879 | |
| Compensation and benefits | (692,309) | | | (160,357) | | | (56,830) | | | (66,290) | | | (21,482) | | | (997,268) | | | (421,268) | | | (1,418,536) | |
| General, administrative and other expenses | (161,872) | | | (56,768) | | | (21,449) | | | (33,881) | | | (6,584) | | | (280,554) | | | (220,019) | | | (500,573) | |
| Fee related earnings | 1,568,157 | | | 212,106 | | | 60,546 | | | 126,172 | | | 15,686 | | | 1,982,667 | | | (620,930) | | | 1,361,737 | |
| Performance income—realized | 326,202 | | | 60,317 | | | 43,299 | | | 361 | | | — | | | 430,179 | | | — | | | 430,179 | |
| Performance related compensation—realized | (207,794) | | | (37,283) | | | (36,334) | | | 110 | | | — | | | (281,301) | | | — | | | (281,301) | |
| Realized net performance income | 118,408 | | | 23,034 | | | 6,965 | | | 471 | | | — | | | 148,878 | | | — | | | 148,878 | |
| Investment income (loss)—realized | 21,159 | | | 5,184 | | | 1,926 | | | 2,565 | | | 9,467 | | | 40,301 | | | (650) | | | 39,651 | |
| Interest income | 11,671 | | | 7,649 | | | 1,970 | | | 972 | | | 35,810 | | | 58,072 | | | 1,723 | | | 59,795 | |
| Interest expense | (34,578) | | | (24,131) | | | (22,632) | | | (10,240) | | | (50,659) | | | (142,240) | | | (701) | | | (142,941) | |
| | | | | | | | | | | | | | | |
| Realized net investment income (loss) | (1,748) | | | (11,298) | | | (18,736) | | | (6,703) | | | (5,382) | | | (43,867) | | | 372 | | | (43,495) | |
| Realized income | $ | 1,684,817 | | | $ | 223,842 | | | $ | 48,775 | | | $ | 119,940 | | | $ | 10,304 | | | $ | 2,087,678 | | | $ | (620,558) | | | $ | 1,467,120 | |
| | | | | | | | | | | | | | | |
| Year ended December 31, 2023 |
| Credit Group | | Real Assets Group | | Private Equity Group | | Secondaries Group | | Other | | Total Segments | | OMG | | Total |
| Management fees | $ | 1,853,326 | | | $ | 389,437 | | | $ | 126,721 | | | $ | 174,942 | | | $ | 27,087 | | | $ | 2,571,513 | | | $ | — | | | $ | 2,571,513 | |
| Fee related performance revenues | 167,333 | | | 334 | | | — | | | 12,782 | | | — | | | 180,449 | | | — | | | 180,449 | |
| Other fees | 36,640 | | | 29,695 | | | 1,693 | | | 22 | | | 374 | | | 68,424 | | | 23,685 | | | 92,109 | |
| Compensation and benefits | (624,741) | | | (153,870) | | | (58,408) | | | (62,160) | | | (15,812) | | | (914,991) | | | (361,124) | | | (1,276,115) | |
| General, administrative and other expenses | (115,546) | | | (46,789) | | | (16,949) | | | (21,199) | | | (3,119) | | | (203,602) | | | (200,613) | | | (404,215) | |
| Fee related earnings | 1,317,012 | | | 218,807 | | | 53,057 | | | 104,387 | | | 8,530 | | | 1,701,793 | | | (538,052) | | | 1,163,741 | |
| Performance income—realized | 323,733 | | | 20,990 | | | 65,716 | | | 5,460 | | | — | | | 415,899 | | | — | | | 415,899 | |
| Performance related compensation—realized | (211,976) | | | (12,768) | | | (52,984) | | | (4,678) | | | — | | | (282,406) | | | — | | | (282,406) | |
| Realized net performance income | 111,757 | | | 8,222 | | | 12,732 | | | 782 | | | — | | | 133,493 | | | — | | | 133,493 | |
| Investment income (loss)—realized | 36,490 | | | 3,392 | | | (712) | | | 4,523 | | | 2,962 | | | 46,655 | | | (470) | | | 46,185 | |
| Interest income | 9,788 | | | 3,165 | | | 38 | | | 344 | | | 13,831 | | | 27,166 | | | 1,218 | | | 28,384 | |
| Interest expense | (29,732) | | | (16,391) | | | (18,990) | | | (8,980) | | | (32,026) | | | (106,119) | | | (156) | | | (106,275) | |
| Realized net investment income (loss) | 16,546 | | | (9,834) | | | (19,664) | | | (4,113) | | | (15,233) | | | (32,298) | | | 592 | | | (31,706) | |
| Realized income | $ | 1,445,315 | | | $ | 217,195 | | | $ | 46,125 | | | $ | 101,056 | | | $ | (6,703) | | | $ | 1,802,988 | | | $ | (537,460) | | | $ | 1,265,528 | |
| | | | | | | | | | | | | | | |
| | | | | | | | | | | | | | | |
Ares Management Corporation
Notes to the Consolidated Financial Statements (Continued)
(Dollars in Thousands, Except Share Data and As Otherwise Noted)
| | | | | | | | | | | | | | | | | | | | | | | | | | | | | | | | | | | | | | | | | | | | | | | |
| Year ended December 31, 2022 |
| Credit Group | | Real Assets Group | | Private Equity Group | | Secondaries Group | | Other | | Total Segments | | OMG | | Total |
| Management fees | $ | 1,490,674 | | | $ | 347,808 | | | $ | 125,681 | | | $ | 176,694 | | | $ | 11,671 | | | $ | 2,152,528 | | | $ | — | | | $ | 2,152,528 | |
| Fee related performance revenues | 71,497 | | | 167,693 | | | — | | | 235 | | | — | | | 239,425 | | | — | | | 239,425 | |
| Other fees | 32,637 | | | 35,879 | | | 1,243 | | | — | | | 274 | | | 70,033 | | | 24,529 | | | 94,562 | |
| Compensation and benefits | (483,167) | | | (240,015) | | | (66,075) | | | (53,743) | | | (12,108) | | | (855,108) | | | (317,396) | | | (1,172,504) | |
| General, administrative and other expenses | (93,715) | | | (39,739) | | | (16,416) | | | (12,685) | | | (2,089) | | | (164,644) | | | (155,017) | | | (319,661) | |
| Fee related earnings | 1,017,926 | | | 271,626 | | | 44,433 | | | 110,501 | | | (2,252) | | | 1,442,234 | | | (447,884) | | | 994,350 | |
| Performance income—realized | 237,839 | | | 133,130 | | | 42,896 | | | 4,156 | | | — | | | 418,021 | | | — | | | 418,021 | |
| Performance related compensation—realized | (153,538) | | | (83,105) | | | (34,383) | | | (3,515) | | | — | | | (274,541) | | | — | | | (274,541) | |
| Realized net performance income | 84,301 | | | 50,025 | | | 8,513 | | | 641 | | | — | | | 143,480 | | | — | | | 143,480 | |
| Investment income (loss)—realized | 27,831 | | | 9,898 | | | 4,001 | | | 3,640 | | | 1,850 | | | 47,220 | | | (1,678) | | | 45,542 | |
| Interest income | 8,290 | | | 2,262 | | | 222 | | | 43 | | | 8,141 | | | 18,958 | | | 53 | | | 19,011 | |
| Interest expense | (18,401) | | | (11,346) | | | (13,484) | | | (5,660) | | | (21,781) | | | (70,672) | | | (684) | | | (71,356) | |
| Realized net investment income (loss) | 17,720 | | | 814 | | | (9,261) | | | (1,977) | | | (11,790) | | | (4,494) | | | (2,309) | | | (6,803) | |
| Realized income | $ | 1,119,947 | | | $ | 322,465 | | | $ | 43,685 | | | $ | 109,165 | | | $ | (14,042) | | | $ | 1,581,220 | | | $ | (450,193) | | | $ | 1,131,027 | |
The following table presents the components of the Company’s operating segments’ revenue, expenses and realized net investment income (loss):
| | | | | | | | | | | | | | | | | | | | | |
| | | Year ended December 31, |
| | | | | 2024 | | 2023 | | 2022 |
| Segment revenues | | | | | | | | | |
| Management fees | | | | | $ | 2,957,430 | | | $ | 2,571,513 | | | $ | 2,152,528 | |
| Fee related performance revenues | | | | | 231,537 | | | 180,449 | | | 239,425 | |
| Other fees | | | | | 71,522 | | | 68,424 | | | 70,033 | |
| Performance income—realized | | | | | 430,179 | | | 415,899 | | | 418,021 | |
| Total segment revenues | | | | | $ | 3,690,668 | | | $ | 3,236,285 | | | $ | 2,880,007 | |
| Segment expenses | | | | | | | | | |
| Compensation and benefits | | | | | $ | 997,268 | | | $ | 914,991 | | | $ | 855,108 | |
| General, administrative and other expenses | | | | | 280,554 | | | 203,602 | | | 164,644 | |
| Performance related compensation—realized | | | | | 281,301 | | | 282,406 | | | 274,541 | |
| Total segment expenses | | | | | $ | 1,559,123 | | | $ | 1,400,999 | | | $ | 1,294,293 | |
| Segment realized net investment income (loss) | | | | | | | | | |
| Investment income—realized | | | | | $ | 40,301 | | | $ | 46,655 | | | $ | 47,220 | |
| Interest income | | | | | 58,072 | | | 27,166 | | | 18,958 | |
| Interest expense | | | | | (142,240) | | | (106,119) | | | (70,672) | |
| | | | | | | | | |
| Total segment realized net investment loss | | | | | $ | (43,867) | | | $ | (32,298) | | | $ | (4,494) | |
Ares Management Corporation
Notes to the Consolidated Financial Statements (Continued)
(Dollars in Thousands, Except Share Data and As Otherwise Noted)
The following table reconciles the Company’s consolidated revenues to segment revenue:
| | | | | | | | | | | | | | | | | | | | | |
| | | Year ended December 31, |
| | | | | 2024 | | 2023 | | 2022 |
| Total consolidated revenue | | | | | $ | 3,884,781 | | | $ | 3,631,884 | | | $ | 3,055,443 | |
| Performance income—unrealized | | | | | (109,533) | | | (305,370) | | | (107,153) | |
| Management fees of Consolidated Funds eliminated in consolidation | | | | | 46,597 | | | 48,201 | | | 46,324 | |
| Performance income of Consolidated Funds eliminated in consolidation | | | | | 28,135 | | | 13,672 | | | 11,529 | |
| Administrative, transaction and other fees of Consolidated Funds eliminated in consolidation | | | | | 525 | | | 7,166 | | | 17,013 | |
Administrative fees(1) | | | | | (70,363) | | | (63,144) | | | (69,414) | |
| OMG revenue | | | | | (20,357) | | | (23,685) | | | (24,354) | |
| | | | | | | | | |
| | | | | | | | | |
| Principal investment income, net of eliminations | | | | | (45,424) | | | (36,516) | | | (12,278) | |
| Net revenue of non-controlling interests in consolidated subsidiaries | | | | | (23,693) | | | (35,923) | | | (37,103) | |
| Total consolidation adjustments and reconciling items | | | | | (194,113) | | | (395,599) | | | (175,436) | |
| Total segment revenue | | | | | $ | 3,690,668 | | | $ | 3,236,285 | | | $ | 2,880,007 | |
(1)Represents administrative fees from expense reimbursements that are presented within administrative, transaction and other fees within the Company’s Consolidated Statements of Operations and are netted against the respective expenses for segment reporting.
The following table reconciles the Company’s consolidated expenses to segment expenses:
| | | | | | | | | | | | | | | | | | | | | |
| | | Year ended December 31, |
| | | | | 2024 | | 2023 | | 2022 |
| Total consolidated expenses | | | | | $ | 2,938,691 | | | $ | 2,797,858 | | | $ | 2,749,085 | |
| Performance related compensation-unrealized | | | | | (36,823) | | | (206,923) | | | (88,502) | |
| Expenses of Consolidated Funds added in consolidation | | | | | (69,320) | | | (93,167) | | | (86,988) | |
| Expenses of Consolidated Funds eliminated in consolidation | | | | | 48,441 | | | 50,108 | | | 50,833 | |
Administrative fees(1) | | | | | (70,363) | | | (62,773) | | | (68,255) | |
| OMG expenses | | | | | (641,287) | | | (561,737) | | | (472,413) | |
| Acquisition and merger-related expense | | | | | (57,360) | | | (12,000) | | | (15,197) | |
| Equity compensation expense | | | | | (352,851) | | | (255,790) | | | (200,106) | |
Acquisition-related compensation expense(2) | | | | | (38,150) | | | (7,334) | | | (206,252) | |
| Placement fee adjustment | | | | | (5,715) | | | 5,819 | | | (2,088) | |
| Depreciation and amortization expense | | | | | (157,341) | | | (233,185) | | | (335,083) | |
| Expense of non-controlling interests in consolidated subsidiaries | | | | | 1,201 | | | (19,877) | | | (30,741) | |
| Total consolidation adjustments and reconciling items | | | | | (1,379,568) | | | (1,396,859) | | | (1,454,792) | |
| Total segment expenses | | | | | $ | 1,559,123 | | | $ | 1,400,999 | | | $ | 1,294,293 | |
(1)Represents administrative fees from expense reimbursements that are presented within administrative, transaction and other fees within the Company’s Consolidated Statements of Operations and are netted against the respective expenses for segment reporting.
(2)Represents bonus payments and contingent liabilities (“earnouts”) resulting from the acquisitions that are recorded as compensation expense and are presented within compensation and benefits within the Company’s Consolidated Statements of Operations. See “Note 8. Commitments and Contingencies” for a further description of the contingent liabilities related to the various acquisitions.
Ares Management Corporation
Notes to the Consolidated Financial Statements (Continued)
(Dollars in Thousands, Except Share Data and As Otherwise Noted)
The following table reconciles the Company’s consolidated other income to segment realized net investment loss:
| | | | | | | | | | | | | | | | | | | | | |
| | | Year ended December 31, |
| | | | | 2024 | | 2023 | | 2022 |
| Total consolidated other income | | | | | $ | 329,262 | | | $ | 499,037 | | | $ | 204,448 | |
| Investment income—unrealized | | | | | (5,613) | | | (178,481) | | | (12,834) | |
| | | | | | | | | |
| Other income, net from Consolidated Funds added in consolidation | | | | | (379,090) | | | (492,848) | | | (250,144) | |
| Other expense, net from Consolidated Funds eliminated in consolidation | | | | | (12,835) | | | (16,485) | | | (16,484) | |
| OMG other (income) expense | | | | | (4,413) | | | 1,074 | | | 14,419 | |
| | | | | | | | | |
| Principal investment income | | | | | 38,367 | | | 155,632 | | | 48,223 | |
| Other (income) expense, net | | | | | (12,172) | | | 976 | | | 1,873 | |
| Other (income) loss of non-controlling interests in consolidated subsidiaries | | | | | 2,627 | | | (1,203) | | | 6,005 | |
| Total consolidation adjustments and reconciling items | | | | | (373,129) | | | (531,335) | | | (208,942) | |
| Total segment realized net investment loss | | | | | $ | (43,867) | | | $ | (32,298) | | | $ | (4,494) | |
The following table presents the reconciliation of income before taxes as reported in the Consolidated Statements of Operations to segment results of RI and FRE:
| | | | | | | | | | | | | | | | | | | | | |
| | | Year ended December 31, |
| | | | | 2024 | | 2023 | | 2022 |
| Income before taxes | | | | | $ | 1,275,352 | | | $ | 1,333,063 | | | $ | 510,806 | |
| Adjustments: | | | | | | | | | |
| Depreciation and amortization expense | | | | | 157,341 | | | 233,185 | | | 335,083 | |
| Equity compensation expense | | | | | 352,851 | | | 255,419 | | | 198,948 | |
Acquisition-related compensation expense(1) | | | | | 38,150 | | | 7,334 | | | 206,252 | |
| Acquisition and merger-related expense | | | | | 57,360 | | | 12,000 | | | 15,197 | |
| Placement fee adjustment | | | | | 5,715 | | | (5,819) | | | 2,088 | |
| OMG expense, net | | | | | 616,517 | | | 539,126 | | | 462,478 | |
| Other (income) expense, net | | | | | (12,172) | | | 976 | | | 1,874 | |
| Income before taxes of non-controlling interests in consolidated subsidiaries | | | | | (22,267) | | | (17,249) | | | (357) | |
| Income before taxes of non-controlling interests in Consolidated Funds, net of eliminations | | | | | (302,846) | | | (278,119) | | | (119,664) | |
| Total performance income—unrealized | | | | | (109,533) | | | (305,370) | | | (107,153) | |
| Total performance related compensation—unrealized | | | | | 36,823 | | | 206,923 | | | 88,502 | |
| Total net investment income—unrealized | | | | | (5,613) | | | (178,481) | | | (12,834) | |
| Realized income | | | | | 2,087,678 | | | 1,802,988 | | | 1,581,220 | |
| Total performance income—realized | | | | | (430,179) | | | (415,899) | | | (418,021) | |
| Total performance related compensation—realized | | | | | 281,301 | | | 282,406 | | | 274,541 | |
| Total net investment loss—realized | | | | | 43,867 | | | 32,298 | | | 4,494 | |
| Fee related earnings | | | | | $ | 1,982,667 | | | $ | 1,701,793 | | | $ | 1,442,234 | |
(1)Represents bonus payments and earnouts resulting from the acquisitions that are recorded as compensation expense and are presented within compensation and benefits within the Company’s Consolidated Statements of Operations. See “Note 8. Commitments and Contingencies” for a further description of the contingent liabilities related to the various acquisitions.
Ares Management Corporation
Notes to the Consolidated Financial Statements (Continued)
(Dollars in Thousands, Except Share Data and As Otherwise Noted)
15. CONSOLIDATION
Deconsolidation of Funds
Certain funds that have historically been consolidated in the financial statements that are no longer consolidated because, as of the reporting period: (i) such funds have been liquidated or dissolved; or (ii) the Company is no longer deemed to be the primary beneficiary of the VIE as it no longer has a significant economic interest. During the year ended December 31, 2024, the Company deconsolidated one CLO as a result of significant change in ownership. During the year ended December 31, 2023, the Company deconsolidated one SPAC as a result of liquidation and one private fund experienced a significant change in ownership that resulted in deconsolidation of the entity. During the year ended December 31, 2022, the Company did not deconsolidate any entity.
Investments in Consolidated Variable Interest Entities
The Company consolidates entities in which the Company has a variable interest and as the general partner or investment manager, has both the power to direct the most significant activities and a potentially significant economic interest. Investments in the consolidated VIEs are reported at fair value and represent the Company’s maximum exposure to loss.
Investments in Non-Consolidated Variable Interest Entities
The Company holds interests in certain VIEs that are not consolidated as the Company is not the primary beneficiary. The Company’s interest in such entities generally is in the form of direct equity interests, fixed fee arrangements or both. The maximum exposure to loss represents the potential loss of assets by the Company relating to its direct investments in these non-consolidated entities. Investments in the non-consolidated VIEs are carried at fair value.
The Company’s interests in consolidated and non-consolidated VIEs, as presented within the Consolidated Statements of Financial Condition, its respective maximum exposure to loss relating to non-consolidated VIEs, and its net income attributable to non-controlling interests related to consolidated VIEs, as presented within the Consolidated Statements of Operations, are as follows:
| | | | | | | | | | | |
| | | |
| As of December 31, |
| 2024 | | 2023 |
| Maximum exposure to loss attributable to the Company’s investment in non-consolidated VIEs | $ | 386,927 | | | $ | 503,376 | |
| Maximum exposure to loss attributable to the Company’s investment in consolidated VIEs | 791,133 | | | 910,600 | |
| Assets of consolidated VIEs | 13,698,611 | | | 15,484,962 | |
| Liabilities of consolidated VIEs | 10,879,735 | | | 13,409,257 | |
| | | | | | | | | | | | | | | | | | | | | |
| | | Year ended December 31, |
| | | | | 2024 | | 2023 | | 2022 |
| Net income attributable to non-controlling interests related to consolidated VIEs | | | | | $ | 269,743 | | | $ | 204,571 | | | $ | 105,797 | |
Ares Management Corporation
Notes to the Consolidated Financial Statements (Continued)
(Dollars in Thousands, Except Share Data and As Otherwise Noted)
Consolidating Schedules
The following supplemental financial information illustrates the consolidating effects of the Consolidated Funds on the Company’s financial condition, results from operations and cash flows:
| | | | | | | | | | | | | | | | | | | | | | | |
| | As of December 31, 2024 |
| | Consolidated
Company Entities | | Consolidated
Funds | | Eliminations | | Consolidated |
| Assets | | | | | | | |
| Cash and cash equivalents | $ | 1,507,976 | | | $ | — | | | $ | — | | | $ | 1,507,976 | |
| Investments (includes $3,495,115 of accrued carried interest) | 5,485,012 | | | — | | | (840,237) | | | 4,644,775 | |
| Due from affiliates | 1,236,450 | | | — | | | (179,842) | | | 1,056,608 | |
| Other assets | 774,654 | | | — | | | — | | | 774,654 | |
| Right-of-use operating lease assets | 511,319 | | | — | | | — | | | 511,319 | |
| Intangible assets, net | 975,828 | | | — | | | — | | | 975,828 | |
| Goodwill | 1,162,636 | | | — | | | — | | | 1,162,636 | |
| Assets of Consolidated Funds | | | | | | | |
| Cash and cash equivalents | — | | | 1,227,489 | | | — | | | 1,227,489 | |
| Investments held in trust account | — | | | 550,800 | | | — | | | 550,800 | |
| Investments, at fair value | — | | | 12,187,044 | | | — | | | 12,187,044 | |
| | | | | | | |
| Receivable for securities sold | — | | | 202,782 | | | — | | | 202,782 | |
| Other assets | — | | | 82,397 | | | — | | | 82,397 | |
| Total assets | $ | 11,653,875 | | | $ | 14,250,512 | | | $ | (1,020,079) | | | $ | 24,884,308 | |
| Liabilities | | | | | | | |
| Accounts payable, accrued expenses and other liabilities | $ | 364,152 | | | $ | — | | | $ | (280) | | | $ | 363,872 | |
| Accrued compensation | 280,894 | | | — | | | — | | | 280,894 | |
| Due to affiliates | 500,480 | | | — | | | — | | | 500,480 | |
| Performance related compensation payable | 2,537,203 | | | — | | | — | | | 2,537,203 | |
| Debt obligations | 2,558,914 | | | — | | | — | | | 2,558,914 | |
| | | | | | | |
| Operating lease liabilities | 641,864 | | | — | | | — | | | 641,864 | |
| Liabilities of Consolidated Funds | | | | | | | |
| Accounts payable, accrued expenses and other liabilities | — | | | 323,566 | | | (466) | | | 323,100 | |
| Due to affiliates | — | | | 178,409 | | | (178,409) | | | — | |
| Payable for securities purchased | — | | | 332,406 | | | — | | | 332,406 | |
| CLO loan obligations, at fair value | — | | | 9,793,645 | | | (121,456) | | | 9,672,189 | |
| Fund borrowings | — | | | 275,000 | | | — | | | 275,000 | |
| Total liabilities | 6,883,507 | | | 10,903,026 | | | (300,611) | | | 17,485,922 | |
| Commitments and contingencies | | | | | | | |
| Redeemable interest in Consolidated Funds | — | | | 550,700 | | | — | | | 550,700 | |
| Redeemable interest in Ares Operating Group entities | 23,496 | | | — | | | — | | | 23,496 | |
| Non-controlling interest in Consolidated Funds | — | | | 2,796,786 | | | (771,120) | | | 2,025,666 | |
| Non-controlling interest in Ares Operating Group entities | 1,236,767 | | | — | | | 18,111 | | | 1,254,878 | |
| Stockholders’ Equity | | | | | | | |
| | | | | | | |
| Series B mandatory convertible preferred stock, $0.01 par value, 1,000,000,000 shares authorized (30,000,000 shares issued and outstanding) | 1,458,771 | | | — | | | — | | | 1,458,771 | |
| Class A common stock, $0.01 par value, 1,500,000,000 shares authorized (199,872,571 shares issued and outstanding) | 1,999 | | | — | | | — | | | 1,999 | |
| Non-voting common stock, $0.01 par value, 500,000,000 shares authorized (3,489,911 shares issued and outstanding) | 35 | | | — | | | — | | | 35 | |
| Class B common stock, $0.01 par value, 1,000 shares authorized (1,000 shares issued and outstanding) | — | | | — | | | — | | | — | |
| Class C common stock, $0.01 par value, 499,999,000 shares authorized (109,806,689 shares issued and outstanding) | 1,098 | | | — | | | — | | | 1,098 | |
| Additional paid-in-capital | 2,903,253 | | | — | | | 33,541 | | | 2,936,794 | |
| Accumulated deficit | (837,294) | | | — | | | — | | | (837,294) | |
| Accumulated other comprehensive loss, net of tax | (17,757) | | | — | | | — | | | (17,757) | |
| Total stockholders’ equity | 3,510,105 | | | — | | | 33,541 | | | 3,543,646 | |
| Total equity | 4,746,872 | | | 2,796,786 | | | (719,468) | | | 6,824,190 | |
| Total liabilities, redeemable interest, non-controlling interests and equity | $ | 11,653,875 | | | $ | 14,250,512 | | | $ | (1,020,079) | | | $ | 24,884,308 | |
Ares Management Corporation
Notes to the Consolidated Financial Statements (Continued)
(Dollars in Thousands, Except Share Data and As Otherwise Noted)
| | | | | | | | | | | | | | | | | | | | | | | |
| | As of December 31, 2023 |
| | Consolidated
Company Entities | | Consolidated
Funds | | Eliminations | | Consolidated |
| Assets | | | | | | | |
| Cash and cash equivalents | $ | 348,274 | | | $ | — | | | $ | — | | | $ | 348,274 | |
| Investments (includes $3,413,007 of accrued carried interest) | 5,546,209 | | | — | | | (921,277) | | | 4,624,932 | |
| Due from affiliates | 1,068,089 | | | — | | | (171,343) | | | 896,746 | |
| Other assets | 429,979 | | | — | | | — | | | 429,979 | |
| Right-of-use operating lease assets | 249,326 | | | — | | | — | | | 249,326 | |
| Intangible assets, net | 1,058,495 | | | — | | | — | | | 1,058,495 | |
| Goodwill | 1,123,976 | | | — | | | — | | | 1,123,976 | |
| Assets of Consolidated Funds | | | | | | | |
| Cash and cash equivalents | — | | | 1,149,511 | | | — | | | 1,149,511 | |
| Investments held in trust account | — | | | 523,038 | | | — | | | 523,038 | |
| Investments, at fair value | — | | | 14,078,549 | | | — | | | 14,078,549 | |
| | | | | | | |
| Receivable for securities sold | — | | | 146,851 | | | — | | 146,851 | |
| Other assets | — | | | 112,466 | | | (11,643) | | 100,823 | |
| Total assets | $ | 9,824,348 | | | $ | 16,010,415 | | | $ | (1,104,263) | | | $ | 24,730,500 | |
| Liabilities | | | | | | | |
| Accounts payable, accrued expenses and other liabilities | $ | 245,526 | | | $ | — | | | $ | (11,642) | | | $ | 233,884 | |
| Accrued compensation | 287,259 | | | — | | | — | | | 287,259 | |
| Due to affiliates | 240,254 | | | — | | | — | | | 240,254 | |
| Performance related compensation payable | 2,514,610 | | | — | | | — | | | 2,514,610 | |
| Debt obligations | 2,965,480 | | | — | | | — | | | 2,965,480 | |
| Operating lease liabilities | 319,572 | | | — | | | — | | | 319,572 | |
| Liabilities of Consolidated Funds | | | | | | | |
| Accounts payable, accrued expenses and other liabilities | — | | | 189,523 | | | — | | | 189,523 | |
| Due to affiliates | — | | | 174,897 | | | (171,343) | | | 3,554 | |
| Payable for securities purchased | — | | | 484,117 | | | — | | | 484,117 | |
| CLO loan obligations, at fair value | — | | | 12,458,266 | | | (112,609) | | | 12,345,657 | |
| Fund borrowings | — | | | 125,241 | | | — | | | 125,241 | |
| Total liabilities | 6,572,701 | | | 13,432,044 | | | (295,594) | | | 19,709,151 | |
| Commitments and contingencies | | | | | | | |
| Redeemable interest in Consolidated Funds | — | | | 522,938 | | | — | | | 522,938 | |
| Redeemable interest in Ares Operating Group entities | 24,098 | | | — | | | — | | | 24,098 | |
| Non-controlling interest in Consolidated Funds | — | | | 2,055,433 | | | (796,988) | | | 1,258,445 | |
| Non-controlling interest in Ares Operating Group entities | 1,326,913 | | | — | | | (4,444) | | | 1,322,469 | |
| Stockholders’ Equity | | | | | | | |
| | | | | | | |
| | | | | | | |
| Class A common stock, $0.01 par value, 1,500,000,000 shares authorized (187,069,907 shares issued and outstanding) | 1,871 | | | — | | | — | | | 1,871 | |
| Non-voting common stock, $0.01 par value, 500,000,000 shares authorized (3,489,911 shares issued and outstanding) | 35 | | | — | | | — | | | 35 | |
| Class B common stock, $0.01 par value, 1,000 shares authorized ($1,000 shares issued and outstanding) | — | | | — | | | — | | | — | |
| Class C common stock, $0.01 par value, 499,999,000 shares authorized (117,024,758 shares issued and outstanding) | 1,170 | | | — | | | — | | | 1,170 | |
| Additional paid-in-capital | 2,398,273 | | | — | | | (7,237) | | | 2,391,036 | |
| Accumulated deficit | (495,083) | | | — | | | — | | | (495,083) | |
| Accumulated other comprehensive loss, net of tax | (5,630) | | | — | | | — | | | (5,630) | |
| Total stockholders’ equity | 1,900,636 | | | — | | | (7,237) | | | 1,893,399 | |
| Total equity | 3,227,549 | | | 2,055,433 | | | (808,669) | | | 4,474,313 | |
| Total liabilities, redeemable interest, non-controlling interests and equity | $ | 9,824,348 | | | $ | 16,010,415 | | | $ | (1,104,263) | | | $ | 24,730,500 | |
Ares Management Corporation
Notes to the Consolidated Financial Statements (Continued)
(Dollars in Thousands, Except Share Data and As Otherwise Noted)
| | | | | | | | | | | | | | | | | | | | | | | |
| | Year ended December 31, 2024 |
| | Consolidated
Company Entities | | Consolidated
Funds | | Eliminations | | Consolidated |
| Revenues | | | | | | | |
| Management fees | $ | 2,988,723 | | | $ | — | | | $ | (46,597) | | | $ | 2,942,126 | |
| Carried interest allocation | 416,995 | | | — | | | (26,815) | | | 390,180 | |
| Incentive fees | 345,477 | | | — | | | (1,320) | | | 344,157 | |
| Principal investment income | 38,367 | | | — | | | 7,057 | | | 45,424 | |
| Administrative, transaction and other fees | 163,419 | | | — | | | (525) | | | 162,894 | |
| Total revenues | 3,952,981 | | | — | | | (68,200) | | | 3,884,781 | |
| Expenses | | | | | | | |
| Compensation and benefits | 1,731,747 | | | — | | | — | | | 1,731,747 | |
| Performance related compensation | 449,564 | | | — | | | — | | | 449,564 | |
| General, administrative and other expense | 736,501 | | | — | | | — | | | 736,501 | |
| Expenses of the Consolidated Funds | — | | | 69,320 | | | (48,441) | | | 20,879 | |
| Total expenses | 2,917,812 | | | 69,320 | | | (48,441) | | | 2,938,691 | |
| Other income (expense) | | | | | | | |
| Net realized and unrealized gains on investments | 31,214 | | | — | | | (14,644) | | | 16,570 | |
| Interest and dividend income | 48,484 | | | — | | | (5,430) | | | 43,054 | |
| Interest expense | (142,966) | | | — | | | — | | | (142,966) | |
| Other income, net | 605 | | | — | | | 22 | | | 627 | |
| Net realized and unrealized gains on investments of the Consolidated Funds | — | | | 291,534 | | | 22,429 | | | 313,963 | |
| Interest and other income of the Consolidated Funds | — | | | 933,349 | | | — | | | 933,349 | |
| Interest expense of the Consolidated Funds | — | | | (845,793) | | | 10,458 | | | (835,335) | |
| Total other income (expense), net | (62,663) | | | 379,090 | | | 12,835 | | | 329,262 | |
| Income before taxes | 972,506 | | | 309,770 | | | (6,924) | | | 1,275,352 | |
| Income tax expense | 157,543 | | | 7,074 | | | — | | | 164,617 | |
| Net income | 814,963 | | | 302,696 | | | (6,924) | | | 1,110,735 | |
| Less: Net income attributable to non-controlling interests in Consolidated Funds | — | | | 302,696 | | | (6,924) | | | 295,772 | |
| Net income attributable to Ares Operating Group entities | 814,963 | | | — | | | — | | | 814,963 | |
| Less: Net income attributable to redeemable interest in Ares Operating Group entities | 103 | | | — | | | — | | | 103 | |
| Less: Net income attributable to non-controlling interests in Ares Operating Group entities | 351,118 | | | — | | | — | | | 351,118 | |
| Net income attributable to Ares Management Corporation | 463,742 | | | — | | | — | | | 463,742 | |
| | | | | | | |
| | | | | | | |
| Less: Series B mandatory convertible preferred stock dividends declared | 22,781 | | | — | | | — | | | 22,781 | |
| | | | | | | |
| Net income attributable to Ares Management Corporation Class A and non-voting common stockholders | $ | 440,961 | | | $ | — | | | $ | — | | | $ | 440,961 | |
Ares Management Corporation
Notes to the Consolidated Financial Statements (Continued)
(Dollars in Thousands, Except Share Data and As Otherwise Noted)
| | | | | | | | | | | | | | | | | | | | | | | |
| | Year ended December 31, 2023 |
| | Consolidated
Company Entities | | Consolidated
Funds | | Eliminations | | Consolidated |
| Revenues | | | | | | | |
| Management fees | $ | 2,599,351 | | | $ | — | | | $ | (48,201) | | | $ | 2,551,150 | |
| Carried interest allocation | 631,150 | | | — | | | (12,571) | | | 618,579 | |
| Incentive fees | 277,728 | | | — | | | (1,101) | | | 276,627 | |
| Principal investment income | 155,632 | | | — | | | (119,116) | | | 36,516 | |
| Administrative, transaction and other fees | 156,178 | | | — | | | (7,166) | | | 149,012 | |
| Total revenues | 3,820,039 | | | — | | | (188,155) | | | 3,631,884 | |
| Expenses | | | | | | | |
| Compensation and benefits | 1,486,698 | | | — | | | — | | | 1,486,698 | |
| Performance related compensation | 607,522 | | | — | | | — | | | 607,522 | |
| General, administrative and other expense | 660,579 | | | — | | | (433) | | | 660,146 | |
| Expenses of the Consolidated Funds | — | | | 93,167 | | | (49,675) | | | 43,492 | |
| Total expenses | 2,754,799 | | | 93,167 | | | (50,108) | | | 2,797,858 | |
| Other income (expense) | | | | | | | |
| Net realized and unrealized gains on investments | 76,415 | | | — | | | 1,158 | | | 77,573 | |
| Interest and dividend income | 29,850 | | | — | | | (10,574) | | | 19,276 | |
| Interest expense | (106,276) | | | — | | | — | | | (106,276) | |
| Other income (expense), net | (10,285) | | | — | | | 15,104 | | | 4,819 | |
| Net realized and unrealized gains on investments of the Consolidated Funds | — | | | 239,802 | | | 22,898 | | | 262,700 | |
| Interest and other income of the Consolidated Funds | — | | | 1,010,649 | | | (15,104) | | | 995,545 | |
| Interest expense of the Consolidated Funds | — | | | (757,603) | | | 3,003 | | | (754,600) | |
| Total other income (expense), net | (10,296) | | | 492,848 | | | 16,485 | | | 499,037 | |
| Income before taxes | 1,054,944 | | | 399,681 | | | (121,562) | | | 1,333,063 | |
| Income tax expense | 169,148 | | | 3,823 | | | — | | | 172,971 | |
| Net income | 885,796 | | | 395,858 | | | (121,562) | | | 1,160,092 | |
| Less: Net income attributable to non-controlling interests in Consolidated Funds | — | | | 395,858 | | | (121,562) | | | 274,296 | |
| Net income attributable to Ares Operating Group entities | 885,796 | | | — | | | — | | | 885,796 | |
| Less: Net income attributable to redeemable interest in Ares Operating Group entities | 226 | | | — | | | — | | | 226 | |
| Less: Net income attributable to non-controlling interests in Ares Operating Group entities | 411,244 | | | — | | | — | | | 411,244 | |
| | | | | | | |
| | | | | | | |
| | | | | | | |
| | | | | | | |
| | | | | | | |
| Net income attributable to Ares Management Corporation Class A and non-voting common stockholders | $ | 474,326 | | | $ | — | | | $ | — | | | $ | 474,326 | |
Ares Management Corporation
Notes to the Consolidated Financial Statements (Continued)
(Dollars in Thousands, Except Share Data and As Otherwise Noted)
| | | | | | | | | | | | | | | | | | | | | | | |
| Year ended December 31, 2022 |
| Consolidated
Company
Entities | | Consolidated
Funds | | Eliminations | | Consolidated |
| Revenues | | | | | | | |
| Management fees | $ | 2,182,757 | | | $ | — | | | $ | (46,324) | | | $ | 2,136,433 | |
| Carried interest allocation | 465,561 | | | — | | | (7,549) | | | 458,012 | |
| Incentive fees | 305,167 | | | — | | | (3,980) | | | 301,187 | |
| Principal investment income | 48,222 | | | — | | | (35,943) | | | 12,279 | |
| Administrative, transaction and other fees | 164,545 | | | — | | | (17,013) | | | 147,532 | |
| Total revenues | 3,166,252 | | | — | | | (110,809) | | | 3,055,443 | |
| Expenses | | | | | | | |
| Compensation and benefits | 1,498,590 | | | — | | | — | | | 1,498,590 | |
| Performance related compensation | 518,829 | | | — | | | — | | | 518,829 | |
| General, administrative and other expense | 695,511 | | | — | | | (255) | | | 695,256 | |
| Expenses of the Consolidated Funds | — | | | 86,988 | | | (50,578) | | | 36,410 | |
| Total expenses | 2,712,930 | | | 86,988 | | | (50,833) | | | 2,749,085 | |
| Other income (expense) | | | | | | | |
| Net realized and unrealized gains (losses) on investments | (27,924) | | | — | | | 32,656 | | | 4,732 | |
| Interest and dividend income | 25,196 | | | — | | | (15,797) | | | 9,399 | |
| Interest expense | (71,356) | | | — | | | — | | | (71,356) | |
| Other income, net | 11,904 | | | — | | | 1,215 | | | 13,119 | |
| Net realized and unrealized gains on investments of the Consolidated Funds | — | | | 87,287 | | | (13,901) | | | 73,386 | |
| Interest and other income of the Consolidated Funds | — | | | 587,744 | | | (1,215) | | | 586,529 | |
| Interest expense of the Consolidated Funds | — | | | (424,887) | | | 13,526 | | | (411,361) | |
| Total other income (expense), net | (62,180) | | | 250,144 | | | 16,484 | | | 204,448 | |
| Income before taxes | 391,142 | | | 163,156 | | | (43,492) | | | 510,806 | |
| Income tax expense | 71,560 | | | 331 | | | — | | | 71,891 | |
| Net income | 319,582 | | | 162,825 | | | (43,492) | | | 438,915 | |
| Less: Net income attributable to non-controlling interests in Consolidated Funds | — | | | 162,825 | | | (43,492) | | | 119,333 | |
| Net income attributable to Ares Operating Group entities | 319,582 | | | — | | | — | | | 319,582 | |
| Less: Net loss attributable to redeemable interest in Ares Operating Group entities | (851) | | | — | | | — | | | (851) | |
| Less: Net income attributable to non-controlling interests in Ares Operating Group entities | 152,892 | | | — | | | — | | | 152,892 | |
| | | | | | | |
| | | | | | | |
| | | | | | | |
| | | | | | | |
| | | | | | | |
| Net income attributable to Ares Management Corporation Class A and non-voting common stockholders | $ | 167,541 | | | $ | — | | | $ | — | | | $ | 167,541 | |
Ares Management Corporation
Notes to the Consolidated Financial Statements (Continued)
(Dollars in Thousands, Except Share Data and As Otherwise Noted)
| | | | | | | | | | | | | | | | | | | | | | | |
| | Year ended December 31, 2024 |
| | Consolidated
Company Entities | | Consolidated
Funds | | Eliminations | | Consolidated |
| Cash flows from operating activities: | | | | | | | |
| Net income | $ | 814,963 | | | $ | 302,696 | | | $ | (6,924) | | | $ | 1,110,735 | |
| Adjustments to reconcile net income to net cash provided by operating activities: | | | | | | | |
| Equity compensation expense | 352,851 | | | — | | | — | | | 352,851 | |
| Depreciation and amortization | 158,578 | | | — | | | — | | | 158,578 | |
| Net realized and unrealized gains on investments | (3,399) | | | — | | | (18,064) | | | (21,463) | |
| | | | | | | |
| Other non-cash amounts | 11,755 | | | — | | | — | | | 11,755 | |
| Investments purchased | (606,536) | | | — | | | 25,792 | | | (580,744) | |
| Proceeds from sale of investments | 799,221 | | | — | | | (115,583) | | | 683,638 | |
| Adjustments to reconcile net income to net cash provided by operating activities allocable to non-controlling interests in Consolidated Funds: | | | | | | | |
| Net realized and unrealized gains on investments | — | | | (291,534) | | | (22,429) | | | (313,963) | |
| Other non-cash amounts | — | | | (48,963) | | | — | | | (48,963) | |
| Investments purchased | — | | | (5,927,444) | | | — | | | (5,927,444) | |
| Proceeds from sale of investments | — | | | 7,569,165 | | | — | | | 7,569,165 | |
| Cash flows due to changes in operating assets and liabilities: | | | | | | | |
| Net carried interest and incentive fees receivable | (214,989) | | | — | | | 26,815 | | | (188,174) | |
| Due to/from affiliates | 214,999 | | | — | | | 8,499 | | | 223,498 | |
| Other assets | (252,644) | | | — | | | — | | | (252,644) | |
| Accrued compensation and benefits | (7,096) | | | — | | | — | | | (7,096) | |
| Accounts payable, accrued expenses and other liabilities | 137,021 | | | — | | | 11,363 | | | 148,384 | |
| Cash flows due to changes in operating assets and liabilities allocable to non-controlling interest in Consolidated Funds: | | | | | | | |
| Change in cash and cash equivalents held at Consolidated Funds | — | | | — | | | (77,978) | | | (77,978) | |
| Net cash relinquished with deconsolidation of Consolidated Funds | — | | | (46,205) | | | — | | | (46,205) | |
| Change in other assets and receivables held at Consolidated Funds | — | | | (44,647) | | | (5,127) | | | (49,774) | |
| Change in other liabilities and payables held at Consolidated Funds | — | | | 47,464 | | | (466) | | | 46,998 | |
| Net cash provided by operating activities | 1,404,724 | | | 1,560,532 | | | (174,102) | | | 2,791,154 | |
| Cash flows from investing activities: | | | | | | | |
| Purchase of furniture, equipment and leasehold improvements, net of disposals | (91,509) | | | — | | | — | | | (91,509) | |
| Acquisitions, net of cash acquired | (67,895) | | | — | | | — | | | (67,895) | |
| Net cash used in investing activities | (159,404) | | | — | | | — | | | (159,404) | |
| Cash flows from financing activities: | | | | | | | |
| Net proceeds from issuance of Series B mandatory convertible preferred stock | 1,458,771 | | | — | | | — | | | 1,458,771 | |
| Net proceeds from issuance of Class A common stock | 407,124 | | | — | | | — | | | 407,124 | |
| Proceeds from Credit Facility | 1,210,000 | | | — | | | — | | | 1,210,000 | |
| Proceeds from issuance of senior notes | 736,010 | | | — | | | — | | | 736,010 | |
| Repayments of Credit Facility | (2,105,000) | | | — | | | — | | | (2,105,000) | |
| Repayment of senior notes | (250,000) | | | — | | | — | | | (250,000) | |
| | | | | | | |
| Dividends and distributions | (1,310,896) | | | — | | | — | | | (1,310,896) | |
| | | | | | | |
| | | | | | | |
| Stock option exercises | 1,511 | | | — | | | — | | | 1,511 | |
| Taxes paid related to net share settlement of equity awards | (227,532) | | | — | | | — | | | (227,532) | |
| Other financing activities | 2,285 | | | — | | | — | | | 2,285 | |
| Allocable to redeemable and non-controlling interests in Consolidated Funds: | | | | | | | |
| Contributions from redeemable and non-controlling interests in Consolidated Funds | — | | | 569,479 | | | 69,675 | | | 639,154 | |
| Distributions to non-controlling interests in Consolidated Funds | — | | | (150,470) | | | 26,449 | | | (124,021) | |
| | | | | | | |
| Borrowings under loan obligations by Consolidated Funds | — | | | 359,351 | | | — | | | 359,351 | |
| Repayments under loan obligations by Consolidated Funds | — | | | (2,228,351) | | | — | | | (2,228,351) | |
| Net cash used in financing activities | (77,727) | | | (1,449,991) | | | 96,124 | | | (1,431,594) | |
| Effect of exchange rate changes | (7,892) | | | (32,562) | | | — | | | (40,454) | |
| Net change in cash and cash equivalents | 1,159,701 | | | 77,979 | | | (77,978) | | | 1,159,702 | |
| Cash and cash equivalents, beginning of period | 348,274 | | | 1,149,511 | | | (1,149,511) | | | 348,274 | |
| Cash and cash equivalents, end of period | $ | 1,507,975 | | | $ | 1,227,490 | | | $ | (1,227,489) | | | $ | 1,507,976 | |
| Supplemental disclosure of non-cash financing activities: | | | | | | | |
| Equity issued in connection with acquisition-related activities | $ | 21,002 | | | $ | — | | | $ | — | | | $ | 21,002 | |
| | | | | | | |
| Supplemental disclosure of cash flow information: | | | | | | | |
| | | | | | | |
| Cash paid during the period for interest | $ | 132,645 | | | $ | 734,115 | | | $ | — | | | $ | 866,760 | |
| Cash paid during the period for income taxes | $ | 107,193 | | | $ | 377 | | | $ | — | | | $ | 107,570 | |
Ares Management Corporation
Notes to the Consolidated Financial Statements (Continued)
(Dollars in Thousands, Except Share Data and As Otherwise Noted)
| | | | | | | | | | | | | | | | | | | | | | | |
| | Year ended December 31, 2023 |
| Consolidated
Company Entities | | Consolidated
Funds | | Eliminations | | Consolidated |
| Cash flows from operating activities: | | | | | | | |
| Net income | $ | 885,796 | | | $ | 395,858 | | | $ | (121,562) | | | $ | 1,160,092 | |
| Adjustments to reconcile net income to net cash provided by (used in) operating activities: | | | | | | | |
| Equity compensation expense | 255,965 | | | — | | | — | | | 255,965 | |
| Depreciation and amortization | 231,712 | | | — | | | — | | | 231,712 | |
| Net realized and unrealized gains on investments | (197,874) | | | — | | | 107,137 | | | (90,737) | |
| | | | | | | |
| Other non-cash amounts | 74 | | | — | | | — | | | 74 | |
| Investments purchased | (726,051) | | | — | | | 218,119 | | | (507,932) | |
| Proceeds from sale of investments | 214,938 | | | — | | | (8,775) | | | 206,163 | |
| Adjustments to reconcile net income to net cash used in operating activities allocable to non-controlling interests in Consolidated Funds: | | | | | | | |
| | | | | | | |
| Net realized and unrealized gains on investments | — | | | (239,802) | | | (22,898) | | | (262,700) | |
| Other non-cash amounts | — | | | (101,465) | | | — | | | (101,465) | |
| Investments purchased | — | | | (8,847,856) | | | — | | | (8,847,856) | |
| Proceeds from sale of investments | — | | | 8,149,617 | | | — | | | 8,149,617 | |
| Cash flows due to changes in operating assets and liabilities: | | | | | | | |
| Net carried interest and incentive fees receivable | (61,429) | | | — | | | 12,571 | | | (48,858) | |
| Due to/from affiliates | (200,704) | | | — | | | (19,717) | | | (220,421) | |
| Other assets | 21,532 | | | — | | | — | | | 21,532 | |
| Accrued compensation and benefits | 20,383 | | | — | | | — | | | 20,383 | |
| Accounts payable, accrued expenses and other liabilities | 28,765 | | | — | | | (901) | | | 27,864 | |
| Cash flows due to changes in operating assets and liabilities allocable to non-controlling interest in Consolidated Funds: | | | | | | | |
| Change in cash and cash equivalents held at Consolidated Funds | — | | | — | | | (424,870) | | | (424,870) | |
| Net cash relinquished with deconsolidation of Consolidated Funds | — | | | (623) | | | — | | | (623) | |
| Change in other assets and receivables held at Consolidated Funds | — | | | (53,916) | | | 33,669 | | | (20,247) | |
| Change in other liabilities and payables held at Consolidated Funds | — | | | 219,046 | | | — | | | 219,046 | |
| Net cash provided by (used in) operating activities | 473,107 | | | (479,141) | | | (227,227) | | | (233,261) | |
| Cash flows from investing activities: | | | | | | | |
| Purchase of furniture, equipment and leasehold improvements, net of disposals | (67,183) | | | — | | | — | | | (67,183) | |
| Acquisitions, net of cash acquired | (43,896) | | | — | | | — | | | (43,896) | |
| Net cash used in investing activities | (111,079) | | | — | | | — | | | (111,079) | |
| Cash flows from financing activities: | | | | | | | |
| | | | | | | |
| Proceeds from Credit Facility | 1,410,000 | | | — | | | — | | | 1,410,000 | |
| Proceeds from issuance of senior notes | 499,010 | | | — | | | — | | | 499,010 | |
| | | | | | | |
| Repayments of Credit Facility | (1,215,000) | | | — | | | — | | | (1,215,000) | |
| | | | | | | |
| Dividends and distributions | (1,030,666) | | | — | | | — | | | (1,030,666) | |
| | | | | | | |
| | | | | | | |
| | | | | | | |
| | | | | | | |
| Stock option exercises | 85,959 | | | — | | | — | | | 85,959 | |
| Taxes paid related to net share settlement of equity awards | (157,007) | | | — | | | — | | | (157,007) | |
| Other financing activities | 2,943 | | | — | | | — | | | 2,943 | |
| Allocable to non-controlling interests in Consolidated Funds: | | | | | | | |
| Contributions from non-controlling interests in Consolidated Funds | — | | | 1,071,575 | | | (216,119) | | | 855,456 | |
| Distributions to non-controlling interests in Consolidated Funds | — | | | (119,604) | | | 18,476 | | | (101,128) | |
| Redemptions of redeemable interests in Consolidated Funds | — | | | (1,045,874) | | | — | | | (1,045,874) | |
| Borrowings under loan obligations by Consolidated Funds | — | | | 1,387,297 | | | — | | | 1,387,297 | |
| Repayments under loan obligations by Consolidated Funds | — | | | (398,864) | | | — | | | (398,864) | |
| Net cash provided by (used in) financing activities | (404,761) | | | 894,530 | | | (197,643) | | | 292,126 | |
| Effect of exchange rate changes | 1,020 | | | 9,481 | | | — | | | 10,501 | |
| Net change in cash and cash equivalents | (41,713) | | | 424,870 | | | (424,870) | | | (41,713) | |
| Cash and cash equivalents, beginning of period | 389,987 | | | 724,641 | | | (724,641) | | | 389,987 | |
| Cash and cash equivalents, end of period | $ | 348,274 | | | $ | 1,149,511 | | | $ | (1,149,511) | | | $ | 348,274 | |
| Supplemental disclosure of non-cash financing activities: | | | | | | | |
| Equity issued in connection with acquisition-related activities | $ | 239,545 | | | $ | — | | | $ | — | | | $ | 239,545 | |
| Equity issued in connection with settlement of management incentive program | $ | 245,647 | | | $ | — | | | $ | — | | | $ | 245,647 | |
| Supplemental disclosure of cash flow information: | | | | | | | |
| Cash paid during the period for interest | $ | 98,920 | | | $ | 623,723 | | | $ | — | | | $ | 722,643 | |
| Cash paid during the period for income taxes | $ | 61,563 | | | $ | 444 | | | $ | — | | | $ | 62,007 | |
Ares Management Corporation
Notes to the Consolidated Financial Statements (Continued)
(Dollars in Thousands, Except Share Data and As Otherwise Noted)
| | | | | | | | | | | | | | | | | | | | | | | |
| Year ended December 31, 2022 |
| Consolidated
Company
Entities | | Consolidated
Funds | | Eliminations | | Consolidated |
| Cash flows from operating activities: | | | | | | | |
| Net income | $ | 319,582 | | | $ | 162,825 | | | $ | (43,492) | | | $ | 438,915 | |
| Adjustments to reconcile net income to net cash provided by (used in) operating activities: | | | | | | | |
| Equity compensation expense | 200,391 | | | — | | | — | | | 200,391 | |
| Depreciation and amortization | 341,341 | | | — | | | — | | | 341,341 | |
| Net realized and unrealized losses on investments | 15,717 | | | — | | | (4,788) | | | 10,929 | |
| | | | | | | |
| | | | | | | |
| Investments purchased | (443,505) | | | — | | | 72,381 | | | (371,124) | |
| Proceeds from sale of investments | 303,987 | | | — | | | (121,494) | | | 182,493 | |
| Adjustments to reconcile net income to net cash used in operating activities allocable to non-controlling interests in Consolidated Funds: | | | | | | | |
| | | | | | | |
| Net realized and unrealized gains on investments | — | | | (87,287) | | | 13,901 | | | (73,386) | |
| Other non-cash amounts | — | | | (33,822) | | | — | | | (33,822) | |
| Investments purchased | — | | | (9,408,078) | | | (25,951) | | | (9,434,029) | |
| Proceeds from sale of investments | — | | | 8,198,812 | | | — | | | 8,198,812 | |
| Cash flows due to changes in operating assets and liabilities: | | | | | | | |
| Net carried interest and incentive fees receivable | (28,161) | | | — | | | 7,549 | | | (20,612) | |
| Due to/from affiliates | (125,407) | | | — | | | 164,480 | | | 39,073 | |
| Other assets | (101,275) | | | — | | | (3,930) | | | (105,205) | |
| Accrued compensation and benefits | 200,769 | | | — | | | — | | | 200,769 | |
| Accounts payable, accrued expenses and other liabilities | (50,471) | | | — | | | (1,214) | | | (51,685) | |
| Cash flows due to changes in operating assets and liabilities allocable to non-controlling interest in Consolidated Funds: | | | | | | | |
| Change in cash and cash equivalents held at Consolidated Funds | — | | | — | | | 324,550 | | | 324,550 | |
| | | | | | | |
| Change in other assets and receivables held at Consolidated Funds | — | | | 286,895 | | | (135,000) | | | 151,895 | |
| Change in other liabilities and payables held at Consolidated Funds | — | | | (733,417) | | | — | | | (733,417) | |
| Net cash provided by (used in) operating activities | 632,968 | | | (1,614,072) | | | 246,992 | | | (734,112) | |
| Cash flows from investing activities: | | | | | | | |
| Purchase of furniture, equipment and leasehold improvements, net of disposals | (35,796) | | | — | | | — | | | (35,796) | |
| Acquisitions, net of cash acquired | (301,583) | | | — | | | — | | | (301,583) | |
| Net cash used in investing activities | (337,379) | | | — | | | — | | | (337,379) | |
| Cash flows from financing activities: | | | | | | | |
| | | | | | | |
| Proceeds from Credit Facility | 1,380,000 | | | — | | | — | | | 1,380,000 | |
| | | | | | | |
| Proceeds from issuance of senior notes | 488,915 | | | — | | | — | | | 488,915 | |
| Repayments of Credit Facility | (1,095,000) | | | — | | | — | | | (1,095,000) | |
| | | | | | | |
| Dividends and distributions | (836,364) | | | — | | | — | | | (836,364) | |
| | | | | | | |
| | | | | | | |
| | | | | | | |
| | | | | | | |
| Stock option exercises | 21,205 | | | — | | | — | | | 21,205 | |
| Taxes paid related to net share settlement of equity awards | (201,311) | | | — | | | — | | | (201,311) | |
| Other financing activities | 4,055 | | | — | | | — | | | 4,055 | |
| Allocable to non-controlling interests in Consolidated Funds: | | | | | | | |
| Contributions from non-controlling interests in Consolidated Funds | — | | | 596,777 | | | (47,381) | | | 549,396 | |
| Distributions to non-controlling interests in Consolidated Funds | — | | | (303,230) | | | 124,939 | | | (178,291) | |
| Borrowings under loan obligations by Consolidated Funds | — | | | 1,140,680 | | | — | | | 1,140,680 | |
| Repayments under loan obligations by Consolidated Funds | — | | | (145,222) | | | — | | | (145,222) | |
| Net cash provided by financing activities | (238,500) | | | 1,289,005 | | | 77,558 | | | 1,128,063 | |
| Effect of exchange rate changes | (10,757) | | | 517 | | | — | | | (10,240) | |
| Net change in cash and cash equivalents | 46,332 | | | (324,550) | | | 324,550 | | | 46,332 | |
| Cash and cash equivalents, beginning of period | 343,655 | | | 1,049,191 | | | (1,049,191) | | | 343,655 | |
| Cash and cash equivalents, end of period | $ | 389,987 | | | $ | 724,641 | | | $ | (724,641) | | | $ | 389,987 | |
| Supplemental disclosure of non-cash financing activities: | | | | | | | |
| Equity issued in connection with acquisition-related activities | $ | 12,835 | | | $ | — | | | $ | — | | | $ | 12,835 | |
| Supplemental disclosure of cash flow information: | | | | | | | |
| | | | | | | |
| Cash paid during the period for interest | $ | 59,463 | | | $ | 260,866 | | | $ | — | | | $ | 320,329 | |
| Cash paid during the period for income taxes | $ | 104,544 | | | $ | 320 | | | $ | — | | | $ | 104,864 | |
Ares Management Corporation
Notes to the Consolidated Financial Statements (Continued)
(Dollars in Thousands, Except Share Data and As Otherwise Noted)
16. SUBSEQUENT EVENTS
The Company evaluated all events or transactions that occurred after December 31, 2024 through the date the consolidated financial statements were issued. During this period, the Company had the following material subsequent events that require disclosure:
In February 2025, the Company’s board of directors declared a quarterly dividend of $1.12 per share of Class A and non-voting common stock payable on March 31, 2025 to common stockholders of record at the close of business on March 17, 2025.
In February 2025, the Company’s board of directors declared a quarterly dividend of $0.84375 per share of Series B mandatory convertible preferred stock payable on April 1, 2025 to preferred stockholders of record on March 15, 2025.