UNITED STATES
SECURITIES AND EXCHANGE COMMISSION
Washington, D.C. 20549
Form N-CSR
CERTIFIED SHAREHOLDER REPORT OF REGISTERED
MANAGEMENT INVESTMENT COMPANIES
Investment Company Act File Number: 811-21142
Eaton Vance Municipal Bond Fund
(Exact Name of Registrant as Specified in Charter)
Two International Place, Boston, Massachusetts 02110
(Address of Principal Executive Offices)
Maureen A. Gemma
Two International Place, Boston, Massachusetts 02110
(Name and Address of Agent for Services)
(617) 482-8260
(Registrant’s Telephone Number)
September 30
Date of Fiscal Year End
March 31, 2017
Date of Reporting Period
Item 1. Reports to Stockholders

Eaton Vance
Municipal Bond Funds
Semiannual Report
March 31, 2017
Municipal (EIM) • California (EVM) • New York (ENX)

Commodity Futures Trading Commission Registration. Effective December 31, 2012, the Commodity Futures Trading Commission (“CFTC”) adopted certain regulatory changes that subject registered investment companies and advisers to regulation by the CFTC if a fund invests more than a prescribed level of its assets in certain CFTC-regulated instruments (including futures, certain options and swap agreements) or markets itself as providing investment exposure to such instruments. Each Fund has claimed an exclusion from the definition of the term “commodity pool operator” under the Commodity Exchange Act. Accordingly, neither the Funds nor the adviser with respect to the operation of the Funds is subject to CFTC regulation. Because of its management of other strategies, each Fund’s adviser is registered with the CFTC as a commodity pool operator and a commodity trading advisor.
Fund shares are not insured by the FDIC and are not deposits or other obligations of, or guaranteed by, any depository institution. Shares are subject to investment risks, including possible loss of principal invested.
Semiannual Report March 31, 2017
Eaton Vance
Municipal Bond Funds
Table of Contents
| | | | |
Performance and Fund Profile | | | | |
| |
| | | | |
Municipal Bond Fund | | | 2 | |
California Municipal Bond Fund | | | 3 | |
New York Municipal Bond Fund | | | 4 | |
| |
| | | | |
| |
Endnotes and Additional Disclosures | | | 5 | |
| |
Financial Statements | | | 6 | |
| |
Officers and Trustees | | | 35 | |
| |
Important Notices | | | 36 | |
Eaton Vance
Municipal Bond Fund
March 31, 2017
Performance1,2
Portfolio Manager Cynthia J. Clemson
| | | | | | | | | | | | | | | | | | | | |
| % Average Annual Total Returns | | Inception Date | | | Six Months | | | One Year | | | Five Years | | | Ten Years | |
Fund at NAV | | | 08/30/2002 | | | | –4.25 | % | | | –0.36 | % | | | 6.43 | % | | | 5.10 | % |
Fund at Market Price | | | — | | | | –5.43 | | | | –0.69 | | | | 5.26 | | | | 4.15 | |
Bloomberg Barclays Long (22+) Year Municipal Bond Index | | | — | | | | –3.29 | % | | | 0.39 | % | | | 4.51 | % | | | 4.67 | % |
| | | | | |
| | | | | | | | | | | | | | | | | | | | |
| % Premium/Discount to NAV3 | | | | | | | | | | | | | | | |
| | | | | | | | | | | | | | | | | | | –7.11 | % |
| | | | | |
| | | | | | | | | | | | | | | | | | | | |
| Distributions4 | | | | | | | | | | | | | | | |
Total Distributions per share for the period | | | | | | | | | | | | | | | | | | $ | 0.326 | |
Distribution Rate at NAV | | | | | | | | | | | | | | | | | | | 4.78 | % |
Taxable-Equivalent Distribution Rate at NAV | | | | | | | | | | | | | | | | | | | 8.45 | % |
Distribution Rate at Market Price | | | | | | | | | | | | | | | | | | | 5.14 | % |
Taxable-Equivalent Distribution Rate at Market Price | | | | | | | | | | | | | | | | | | | 9.08 | % |
| | | | | |
| | | | | | | | | | | | | | | | | | | | |
| % Total Leverage5 | | | | | | | | | | | | | | | |
Residual Interest Bond (RIB) Financing | | | | | | | | | | | | | | | | | | | 40.05 | % |
Fund Profile
Credit Quality (% of total investments)6,7
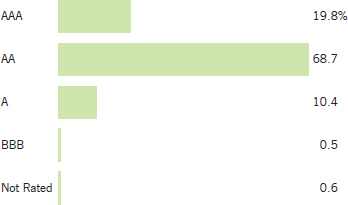
See Endnotes and Additional Disclosures in this report.
Past performance is no guarantee of future results. Returns are historical and are calculated by determining the percentage change in net asset value (NAV) or market price (as applicable) with all distributions reinvested and include management fees and other expenses. Fund performance at market price will differ from its results at NAV due to factors such as changing perceptions about the Fund, market conditions, fluctuations in supply and demand for Fund shares, or changes in Fund distributions. Investment return and principal value will fluctuate so that shares, when sold, may be worth more or less than their original cost. Performance less than or equal to one year is cumulative. Performance is for the stated time period only; due to market volatility, current Fund performance may be lower or higher than the quoted return. For performance as of the most recent month-end, please refer to eatonvance.com.
Eaton Vance
California Municipal Bond Fund
March 31, 2017
Performance1,2
Portfolio Manager Craig R. Brandon, CFA
| | | | | | | | | | | | | | | | | | | | |
| % Average Annual Total Returns | | Inception Date | | | Six Months | | | One Year | | | Five Years | | | Ten Years | |
Fund at NAV | | | 08/30/2002 | | | | –3.50 | % | | | –0.43 | % | | | 5.55 | % | | | 4.07 | % |
Fund at Market Price | | | — | | | | –14.08 | | | | –4.96 | | | | 4.66 | | | | 3.18 | |
Bloomberg Barclays Long (22+) Year Municipal Bond Index | | | — | | | | –3.29 | % | | | 0.39 | % | | | 4.51 | % | | | 4.67 | % |
| | | | | |
| | | | | | | | | | | | | | | | | | | | |
| % Premium/Discount to NAV3 | | | | | | | | | | | | | | | |
| | | | | | | | | | | | | | | | | | | –7.49 | % |
| | | | | |
| | | | | | | | | | | | | | | | | | | | |
| Distributions4 | | | | | | | | | | | | | | | |
Total Distributions per share for the period | | | | | | | | | | | | | | | | | | $ | 0.292 | |
Distribution Rate at NAV | | | | | | | | | | | | | | | | | | | 4.76 | % |
Taxable-Equivalent Distribution Rate at NAV | | | | | | | | | | | | | | | | | | | 9.70 | % |
Distribution Rate at Market Price | | | | | | | | | | | | | | | | | | | 5.14 | % |
Taxable-Equivalent Distribution Rate at Market Price | | | | | | | | | | | | | | | | | | | 10.47 | % |
| | | | | |
| | | | | | | | | | | | | | | | | | | | |
| % Total Leverage5 | | | | | | | | | | | | | | | |
RIB Financing | | | | | | | | | | | | | | | | | | | 41.83 | % |
Fund Profile
Credit Quality (% of total investments)6,7
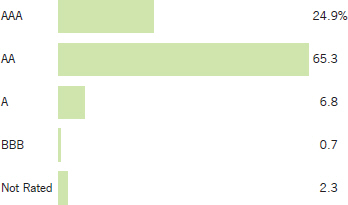
See Endnotes and Additional Disclosures in this report.
Past performance is no guarantee of future results. Returns are historical and are calculated by determining the percentage change in net asset value (NAV) or market price (as applicable) with all distributions reinvested and include management fees and other expenses. Fund performance at market price will differ from its results at NAV due to factors such as changing perceptions about the Fund, market conditions, fluctuations in supply and demand for Fund shares, or changes in Fund distributions. Investment return and principal value will fluctuate so that shares, when sold, may be worth more or less than their original cost. Performance less than or equal to one year is cumulative. Performance is for the stated time period only; due to market volatility, current Fund performance may be lower or higher than the quoted return. For performance as of the most recent month-end, please refer to eatonvance.com.
Eaton Vance
New York Municipal Bond Fund
March 31, 2017
Performance1,2
Portfolio Manager Craig R. Brandon, CFA
| | | | | | | | | | | | | | | | | | | | |
| % Average Annual Total Returns | | Inception Date | | | Six Months | | | One Year | | | Five Years | | | Ten Years | |
Fund at NAV | | | 08/30/2002 | | | | –3.67 | % | | | –1.02 | % | | | 5.12 | % | | | 4.49 | % |
Fund at Market Price | | | — | | | | –11.60 | | | | –3.43 | | | | 3.70 | | | | 3.67 | |
Bloomberg Barclays Long (22+) Year Municipal Bond Index | | | — | | | | –3.29 | % | | | 0.39 | % | | | 4.51 | % | | | 4.67 | % |
| | | | | |
| | | | | | | | | | | | | | | | | | | | |
| % Premium/Discount to NAV3 | | | | | | | | | | | | | | | |
| | | | | | | | | | | | | | | | | | | –8.04 | % |
| | | | | |
| | | | | | | | | | | | | | | | | | | | |
| Distributions4 | | | | | | | | | | | | | | | |
Total Distributions per share for the period | | | | | | | | | | | | | | | | | | $ | 0.309 | |
Distribution Rate at NAV | | | | | | | | | | | | | | | | | | | 4.60 | % |
Taxable-Equivalent Distribution Rate at NAV | | | | | | | | | | | | | | | | | | | 8.91 | % |
Distribution Rate at Market Price | | | | | | | | | | | | | | | | | | | 5.00 | % |
Taxable-Equivalent Distribution Rate at Market Price | | | | | | | | | | | | | | | | | | | 9.69 | % |
| | | | | |
| | | | | | | | | | | | | | | | | | | | |
| % Total Leverage5 | | | | | | | | | | | | | | | |
RIB Financing | | | | | | | | | | | | | | | | | | | 40.49 | % |
Fund Profile
Credit Quality (% of total investments)6,7
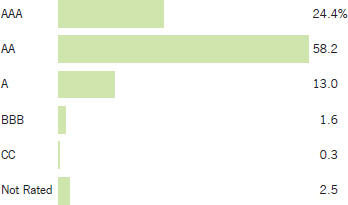
See Endnotes and Additional Disclosures in this report.
Past performance is no guarantee of future results. Returns are historical and are calculated by determining the percentage change in net asset value (NAV) or market price (as applicable) with all distributions reinvested and include management fees and other expenses. Fund performance at market price will differ from its results at NAV due to factors such as changing perceptions about the Fund, market conditions, fluctuations in supply and demand for Fund shares, or changes in Fund distributions. Investment return and principal value will fluctuate so that shares, when sold, may be worth more or less than their original cost. Performance less than or equal to one year is cumulative. Performance is for the stated time period only; due to market volatility, current Fund performance may be lower or higher than the quoted return. For performance as of the most recent month-end, please refer to eatonvance.com.
Eaton Vance
Municipal Bond Funds
March 31, 2017
Endnotes and Additional Disclosures
| 1 | Bloomberg Barclays Long (22+) Year Municipal Bond Index is an unmanaged index of municipal bonds traded in the U.S. with maturities of 22 years or more. Unless otherwise stated, index returns do not reflect the effect of any applicable sales charges, commissions, expenses, taxes or leverage, as applicable. It is not possible to invest directly in an index. |
| 2 | Performance results reflect the effects of leverage. Performance since inception for an index, if presented, is the performance since the Fund’s or oldest share class’ inception, as applicable. |
| 3 | The shares of the Fund often trade at a discount or premium from their net asset value. The discount or premium of the Fund may vary over time and may be higher or lower than what is quoted in this report. For up-to-date premium/discount information, please refer to http://eatonvance.com/closedend. |
| 4 | The Distribution Rate is based on the Fund’s last regular distribution per share in the period (annualized) divided by the Fund’s NAV or market price at the end of the period. The Fund’s distributions may be comprised of amounts characterized for federal income tax purposes as tax-exempt income, qualified and non-qualified ordinary dividends, capital gains and nondividend distributions, also known as return of capital. The Fund will determine the federal income tax character of distributions paid to a shareholder after the end of the calendar year. This is reported on the IRS form 1099-DIV and provided to the shareholder shortly after each year-end. For information about the tax character of distributions made in prior calendar years, please refer to Performance-Tax Character of Distributions on the Fund’s webpage available at eatonvance.com. The Fund’s distributions are determined by the investment adviser based on its current assessment of the Fund’s long-term return potential. Fund distributions may be affected by numerous factors including changes in Fund performance, the cost of financing for Funds that employ leverage, portfolio holdings, realized and projected returns, and other factors. As portfolio and market conditions change, the rate of distributions paid by the Fund could change. Taxable-equivalent performance is based on the highest combined federal and state income tax rates, where applicable. Lower tax rates would result in lower tax-equivalent performance. Actual tax rates will vary depending on your income, exemptions and deductions. Rates do not include local taxes. Subsequent distributions declared, but not reflected in Fund Performance, reflect a reduction of the monthly distribution for Municipal Bond Fund. |
| 5 | Fund employs RIB financing. The leverage created by RIB investments provides an opportunity for increased income but, at the same time, creates special risks (including the likelihood of greater price volatility). The cost of leverage rises and falls with changes in short-term interest rates. See “Floating Rate Notes Issued in Conjunction with Securities Held” in the notes to the financial statements for more information about RIB financing. RIB leverage represents the amount of Floating Rate Notes outstanding at period end as a percentage of Fund net assets plus Floating Rate Notes. |
| 6 | Ratings are based on Moody’s, S&P or Fitch, as applicable. If securities are rated differently by the ratings agencies, the higher rating is applied. Ratings, which are subject to change, apply to the creditworthiness of the issuers of the underlying securities and not to the Fund or its shares. Credit ratings measure the quality of a bond based on the issuer’s creditworthiness, with ratings ranging from AAA, being the highest, to D, being the lowest based on S&P’s measures. Ratings of BBB or higher by S&P or Fitch (Baa or higher by Moody’s) are considered to be investment-grade quality. Credit ratings are based largely on the ratings agency’s analysis at the time of rating. The rating assigned to any particular security is not necessarily a reflection of the issuer’s current financial condition and does not necessarily reflect its assessment of the volatility of a security’s market value or of the liquidity of an investment in the security. Holdings designated as “Not Rated” are not rated by the national ratings agencies stated above. |
| 7 | The chart includes the municipal bonds held by a trust that issues residual interest bonds, consistent with the Portfolio of Investments. |
| | Fund profile subject to change due to active management. |
Eaton Vance
Municipal Bond Fund
March 31, 2017
Portfolio of Investments (Unaudited)
| | | | | | | | |
| Tax-Exempt Investments — 165.1% | |
| | |
| | | | | | | | |
| Security | | Principal
Amount
(000’s omitted) | | | Value | |
| | | | | | | | |
|
Education — 11.6% | |
Connecticut Health and Educational Facilities Authority, (Fairfield University), 5.00%, 7/1/46 | | $ | 3,250 | | | $ | 3,578,218 | |
Houston Higher Education Finance Corp., TX, (St. John’s School),
5.25%, 9/1/33 | | | 3,985 | | | | 4,377,801 | |
Houston Higher Education Finance Corp., TX, (William Marsh Rice University), 5.00%, 5/15/35(1) | | | 15,000 | | | | 16,543,800 | |
Massachusetts Health and Educational Facilities Authority, (Boston College), 5.50%, 6/1/27 | | | 5,710 | | | | 7,245,705 | |
Massachusetts Health and Educational Facilities Authority, (Boston College), 5.50%, 6/1/30 | | | 8,325 | | | | 10,534,955 | |
New York Dormitory Authority, (Rockefeller University),
5.00%, 7/1/40(1) | | | 15,300 | | | | 16,551,081 | |
North Carolina Capital Facilities Finance Agency, (Duke University),
5.00%, 10/1/41(1) | | | 10,000 | | | | 11,450,400 | |
University of California, Prerefunded to 5/15/19, 5.25%, 5/15/39 | | | 720 | | | | 782,705 | |
University of California, Prerefunded to 5/15/19, 5.25%, 5/15/39 | | | 2,460 | | | | 2,674,241 | |
University of Massachusetts Building Authority, 5.00%, 11/1/39(1) | | | 14,175 | | | | 16,084,372 | |
University of Michigan, 5.00%, 4/1/40(1) | | | 15,000 | | | | 17,248,800 | |
| | | | | | | | | |
| | | $ | 107,072,078 | |
| | | | | | | | | |
|
Electric Utilities — 3.1% | |
Energy Northwest, WA, (Columbia Generating Station), 5.00%, 7/1/40 | | $ | 2,320 | | | $ | 2,613,758 | |
Nebraska Public Power District,
5.00%, 1/1/34 | | | 5,000 | | | | 5,690,100 | |
Pima County Industrial Development Authority, AZ, (Tucson Electric Power Co.), 5.25%, 10/1/40 | | | 10,000 | | | | 10,928,400 | |
Unified Government of Wyandotte County/Kansas City Board of Public Utilities, KS, 5.00%, 9/1/36 | | | 3,425 | | | | 3,791,441 | |
Utility Debt Securitization Authority, NY, 5.00%, 12/15/35 | | | 4,500 | | | | 5,148,585 | |
| | | | | | | | | |
| | | $ | 28,172,284 | |
| | | | | | | | | |
|
Escrowed / Prerefunded — 14.0% | |
California Department of Water Resources, (Central Valley Project), Prerefunded to 12/1/20, 5.25%, 12/1/35 | | $ | 285 | | | $ | 325,268 | |
California Department of Water Resources, Prerefunded to 12/1/20, 5.25%, 12/1/35(1) | | | 9,715 | | | | 11,087,627 | |
California Educational Facilities Authority, (University of Southern California), Prerefunded to 10/1/18, 5.25%, 10/1/38(1) | | | 9,750 | | | | 10,377,412 | |
California Health Facilities Financing Authority, (Cedars-Sinai Medical Center), Prerefunded to 8/15/19, 5.00%, 8/15/39 | | | 11,570 | | | | 12,631,547 | |
| | | | | | | | |
| Security | | Principal
Amount
(000’s omitted) | | | Value | |
| | | | | | | | |
|
Escrowed / Prerefunded (continued) | |
Charleston, SC, Waterworks and Sewer Revenue, Prerefunded to 1/1/21, 5.00%, 1/1/35 | | $ | 2,735 | | | $ | 3,090,222 | |
Connecticut Health and Educational Facilities Authority, (Wesleyan University), Prerefunded to 7/1/20, 5.00%, 7/1/39(1) | | | 14,700 | | | | 16,435,041 | |
Honolulu City and County, HI, Wastewater System, Prerefunded to 7/1/21, 5.25%, 7/1/36(1) | | | 9,750 | | | | 11,275,875 | |
King County, WA, Sewer Revenue, Prerefunded to 1/1/21,
5.00%, 1/1/34(1) | | | 6,000 | | | | 6,730,968 | |
Marco Island, FL, Utility System, Prerefunded to 10/1/20, 5.00%, 10/1/34 | | | 1,445 | | | | 1,625,495 | |
Marco Island, FL, Utility System, Prerefunded to 10/1/20, 5.00%, 10/1/40 | | | 6,325 | | | | 7,115,056 | |
Maryland Health and Higher Educational Facilities Authority, (Charlestown Community, Inc.), Prerefunded to 1/1/21, 6.125%, 1/1/30 | | | 1,175 | | | | 1,373,352 | |
North Carolina Capital Facilities Finance Agency, (Duke University), Prerefunded to 4/1/19, 5.00%, 10/1/38(1) | | | 13,500 | | | | 14,554,080 | |
Pennsylvania Turnpike Commission, Prerefunded to 12/1/20, 6.00%, 12/1/34 | | | 720 | | | | 839,966 | |
Pennsylvania Turnpike Commission, Prerefunded to 12/1/20, 6.00%, 12/1/34 | | | 760 | | | | 886,631 | |
South Carolina Public Service Authority, Prerefunded to 1/1/19, 5.50%, 1/1/38 | | | 565 | | | | 608,578 | |
Tarrant County Cultural Education Facilities Finance Corp., TX, (Scott & White Healthcare), Prerefunded to 8/15/20, 5.25%, 8/15/40 | | | 450 | | | | 507,861 | |
Tarrant County Cultural Education Facilities Finance Corp., TX, (Scott & White Healthcare), Prerefunded to 8/15/20, 5.25%, 8/15/40 | | | 5,655 | | | | 6,382,120 | |
Tennessee School Bond Authority, Prerefunded to 5/1/18, 5.50%, 5/1/38 | | | 5,000 | | | | 5,247,950 | |
Triborough Bridge and Tunnel Authority, NY, Prerefunded to 5/15/18, 5.00%, 11/15/33 | | | 5,000 | | | | 5,229,550 | |
University of California, Prerefunded to 5/15/19, 5.25%, 5/15/39 | | | 1,270 | | | | 1,380,604 | |
University of Colorado, (University Enterprise Revenue), Prerefunded to 6/1/21, 5.25%, 6/1/36(1) | | | 10,000 | | | | 11,535,200 | |
| | | | | | | | | |
| | | $ | 129,240,403 | |
| | | | | | | | | |
|
General Obligations — 16.6% | |
California, 5.00%, 10/1/33(1) | | $ | 18,800 | | | $ | 21,607,968 | |
California, 5.00%, 8/1/46(1) | | | 15,000 | | | | 17,072,100 | |
Chicago Park District, IL, (Harbor Facilities), 5.25%, 1/1/37(1) | | | 8,320 | | | | 8,936,346 | |
Delaware Valley Regional Finance Authority, PA, 5.75%, 7/1/32 | | | 3,000 | | | | 3,664,350 | |
Klein Independent School District, TX, (PSF Guaranteed), 5.00%, 2/1/36(1) | | | 2,000 | | | | 2,225,160 | |
| | | | |
| | 6 | | See Notes to Financial Statements. |
Eaton Vance
Municipal Bond Fund
March 31, 2017
Portfolio of Investments (Unaudited) — continued
| | | | | | | | |
| Security | | Principal
Amount
(000’s omitted) | | | Value | |
| | | | | | | | |
|
General Obligations (continued) | |
Mississippi, 5.00%, 10/1/30(1) | | $ | 10,000 | | | $ | 11,295,300 | |
Mississippi, 5.00%, 10/1/36(1) | | | 12,075 | | | | 13,572,542 | |
New York, NY, 5.00%, 10/1/32 | | | 10,000 | | | | 11,415,200 | |
Ocean City, NJ, 1.00%, 11/15/28 | | | 3,095 | | | | 2,445,669 | |
Oregon, 5.00%, 8/1/35(1) | | | 6,750 | | | | 7,591,590 | |
Oregon, 5.00%, 8/1/36 | | | 2,000 | | | | 2,247,600 | |
Port of Houston Authority of Harris County, TX, 5.00%, 10/1/35 | | | 7,500 | | | | 8,352,375 | |
Tacoma School District No. 10, WA, 5.00%, 12/1/39(1) | | | 10,000 | | | | 11,425,800 | |
Washington, 4.00%, 7/1/28(1) | | | 10,000 | | | | 10,733,500 | |
Washington, 5.00%, 2/1/35(1) | | | 18,250 | | | | 20,682,177 | |
| | | | | | | | | |
| | | $ | 153,267,677 | |
| | | | | | | | | |
|
Hospital — 9.9% | |
California Health Facilities Financing Authority, (Catholic Healthcare West), 5.25%, 3/1/27 | | $ | 1,000 | | | $ | 1,121,320 | |
California Health Facilities Financing Authority, (Catholic Healthcare West), 5.25%, 3/1/28 | | | 1,770 | | | | 1,984,949 | |
Hawaii Department of Budget and Finance, (Hawaii Pacific Health), 5.50%, 7/1/38 | | | 2,790 | | | | 3,147,371 | |
Massachusetts Development Finance Agency, (Partners HealthCare System), 5.00%, 7/1/41(1) | | | 10,000 | | | | 11,076,000 | |
New Jersey Health Care Facilities Financing Authority, (Robert Wood Johnson University Hospital),
5.25%, 7/1/35 | | | 4,385 | | | | 4,877,216 | |
Ohio Higher Educational Facility Commission, (Cleveland Clinic Health System), 5.00%, 1/1/32 | | | 10,950 | | | | 12,335,832 | |
Tampa, FL, (BayCare Health System), 5.00%, 11/15/46(1) | | | 12,000 | | | | 13,355,160 | |
Vermont Educational and Health Buildings Financing Agency, (University of Vermont Medical Center), 4.00%, 12/1/42 | | | 3,000 | | | | 3,025,110 | |
Vermont Educational and Health Buildings Financing Agency, (University of Vermont Medical Center), 5.00%, 12/1/33 | | | 1,600 | | | | 1,782,752 | |
West Virginia Hospital Finance Authority, (West Virginia United Health System Obligated Group), 5.375%, 6/1/38 | | | 7,605 | | | | 8,478,663 | |
Wisconsin Health and Educational Facilities Authority, (Ascension Health Alliance Senior Credit Group), 5.00%, 11/15/41(1) | | | 11,500 | | | | 12,668,055 | |
Wisconsin Health and Educational Facilities Authority, (Ascension Senior Credit Group), 4.50%, 11/15/39 | | | 16,000 | | | | 17,059,360 | |
| | | | | | | | | |
| | | $ | 90,911,788 | |
| | | | | | | | | |
|
Industrial Development Revenue — 0.5% | |
Maricopa County Pollution Control Corp., AZ, (El Paso Electric Co.),
4.50%, 8/1/42 | | $ | 4,245 | | | $ | 4,335,588 | |
| | | | | | | | | |
| | | $ | 4,335,588 | |
| | | | | | | | | |
| | | | | | | | |
| Security | | Principal
Amount
(000’s omitted) | | | Value | |
| | | | | | | | |
|
Insured – Education — 2.1% | |
Massachusetts Development Finance Agency, (College of the Holy Cross), (AMBAC), 5.25%, 9/1/32 | | $ | 15,900 | | | $ | 19,709,799 | |
| | | | | | | | | |
| | | $ | 19,709,799 | |
| | | | | | | | | |
|
Insured – Electric Utilities — 0.6% | |
Louisiana Energy and Power Authority, (AGM), 5.25%, 6/1/38 | | $ | 4,905 | | | $ | 5,457,646 | |
| | | | | | | | | |
| | | $ | 5,457,646 | |
| | | | | | | | | |
|
Insured – Escrowed / Prerefunded — 16.3% | |
American Municipal Power-Ohio, Inc., OH, (Prairie State Energy Campus), (AGC), Prerefunded to 2/15/19, 5.75%, 2/15/39 | | $ | 5,000 | | | $ | 5,434,750 | |
Arizona Health Facilities Authority, (Banner Health), (BHAC), Prerefunded to 1/1/18, 5.375%, 1/1/32 | | | 8,250 | | | | 8,529,675 | |
Bossier City, LA, Utilities Revenue, (BHAC), Prerefunded to 10/1/18, 5.25%, 10/1/26 | | | 3,185 | | | | 3,385,528 | |
Bossier City, LA, Utilities Revenue, (BHAC), Prerefunded to 10/1/18, 5.25%, 10/1/27 | | | 1,985 | | | | 2,109,976 | |
Bossier City, LA, Utilities Revenue, (BHAC), Prerefunded to 10/1/18, 5.50%, 10/1/38 | | | 3,170 | | | | 3,381,344 | |
Chicago, IL, (O’Hare International Airport), (AGM), Prerefunded to 1/1/18, 4.75%, 1/1/34(1) | | | 21,640 | | | | 22,271,021 | |
Colorado Health Facilities Authority, (Catholic Health), (AGM), Prerefunded to 4/29/18, 5.10%, 10/1/41(1) | | | 11,500 | | | | 12,018,305 | |
District of Columbia Water and Sewer Authority, (AGC), Prerefunded to 10/1/18, 5.00%, 10/1/34(1) | | | 8,500 | | | | 9,009,490 | |
Iowa Finance Authority, Health Facilities, (Iowa Health System), (AGC), Prerefunded to 8/15/19, 5.625%, 8/15/37 | | | 2,625 | | | | 2,898,945 | |
Kane, Cook and DuPage Counties School District No. 46, IL, (AMBAC), Escrowed to Maturity, 0.00%, 1/1/22 | | | 13,145 | | | | 12,072,368 | |
Maricopa County Industrial Development Authority, AZ, (Catholic Healthcare West), (BHAC), Prerefunded to 7/1/17, 5.25%, 7/1/32 | | | 1,675 | | | | 1,691,582 | |
Maryland Health and Higher Educational Facilities Authority, (AGC), Prerefunded to 7/1/17, 4.75%, 7/1/47(1) | | | 8,815 | | | | 8,882,294 | |
New Jersey Economic Development Authority, (School Facilities Construction), (AGC), Prerefunded to 12/15/18, 5.50%, 12/15/34 | | | 1,015 | | | | 1,092,302 | |
New Jersey Economic Development Authority, (School Facilities Construction), (AGC), Prerefunded to 12/15/18, 5.50%, 12/15/34 | | | 1,875 | | | | 2,017,800 | |
North Carolina Turnpike Authority, (Triangle Expressway System), (AGC), Prerefunded to 1/1/19, 5.50%, 1/1/29 | | | 1,015 | | | | 1,093,104 | |
North Carolina Turnpike Authority, (Triangle Expressway System), (AGC), Prerefunded to 1/1/19, 5.75%, 1/1/39 | | | 1,160 | | | | 1,254,273 | |
Paducah Electric Plant Board, KY, (AGC), Prerefunded to 4/1/19, 5.25%, 10/1/35 | | | 2,735 | | | | 2,957,520 | |
| | | | |
| | 7 | | See Notes to Financial Statements. |
Eaton Vance
Municipal Bond Fund
March 31, 2017
Portfolio of Investments (Unaudited) — continued
| | | | | | | | |
| Security | | Principal
Amount
(000’s omitted) | | | Value | |
| | | | | | | | |
|
Insured – Escrowed / Prerefunded (continued) | |
Palm Beach County Solid Waste Authority, FL, (BHAC), Prerefunded to 10/1/19, 5.00%, 10/1/24 | | $ | 775 | | | $ | 847,416 | |
Palm Beach County Solid Waste Authority, FL, (BHAC), Prerefunded to 10/1/19, 5.00%, 10/1/26 | | | 1,575 | | | | 1,722,168 | |
Palm Springs Unified School District, CA, (AGC), Prerefunded to 8/1/19, 5.00%, 8/1/32 | | | 8,955 | | | | 9,764,801 | |
San Diego County Water Authority, CA, Certificates of Participation, (AGM), Prerefunded to 5/1/18,
5.00%, 5/1/38(1) | | | 24,000 | | | | 25,073,520 | |
South Carolina Public Service Authority, (BHAC), Prerefunded to 1/1/19, 5.50%, 1/1/38 | | | 625 | | | | 673,206 | |
Texas Transportation Commission, (Central Texas Turnpike System), (AMBAC), Escrowed to Maturity, 0.00%, 8/15/20 | | | 5,570 | | | | 5,298,072 | |
Washington Health Care Facilities Authority, (MultiCare Health System), (AGC), Prerefunded to 8/15/19, 6.00%, 8/15/39 | | | 5,795 | | | | 6,443,229 | |
| | | | | | | | | |
| | | $ | 149,922,689 | |
| | | | | | | | | |
|
Insured – General Obligations — 6.9% | |
Chicago Park District, IL, (Limited Tax Park), (BAM), 5.00%, 1/1/39 | | $ | 35 | | | $ | 37,242 | |
Chicago Park District, IL, (Limited Tax Park), (BAM), 5.00%, 1/1/39(1) | | | 13,600 | | | | 14,471,216 | |
Cincinnati City School District, OH, (AGM), (FGIC),
5.25%, 12/1/30 | | | 3,750 | | | | 4,686,113 | |
Clark County, NV, (AMBAC), 2.50%, 11/1/36 | | | 11,845 | | | | 9,688,262 | |
Frisco Independent School District, TX, (PSF Guaranteed), (AGM),
2.75%, 8/15/39 | | | 9,530 | | | | 8,373,058 | |
Kane, Cook and DuPage Counties School District No. 46, IL, (AMBAC), 0.00%, 1/1/22 | | | 16,605 | | | | 14,690,942 | |
Port Arthur Independent School District, TX, (AGC), Prerefunded to 2/15/18, 4.75%, 2/15/38(1) | | | 10,950 | | | | 11,319,015 | |
| | | | | | | | | |
| | | $ | 63,265,848 | |
| | | | | | | | | |
|
Insured – Hospital — 7.9% | |
California Statewide Communities Development Authority, (Sutter Health), (AGM), 5.05%, 8/15/38(1) | | $ | 11,000 | | | $ | 11,412,060 | |
Illinois Finance Authority, (Children’s Memorial Hospital), (AGC),
5.25%, 8/15/47(1) | | | 15,000 | | | | 15,621,744 | |
Maryland Health and Higher Educational Facilities Authority,
(AGC), 4.75%, 7/1/47(1) | | | 8,635 | | | | 8,700,920 | |
New Jersey Health Care Facilities Financing Authority, (Virtua Health), (AGC), 5.50%, 7/1/38 | | | 13,115 | | | | 14,125,642 | |
Washington Health Care Facilities Authority, (Providence Health Care), Series C, (AGM), 5.25%, 10/1/33(1) | | | 8,700 | | | | 9,186,068 | |
Washington Health Care Facilities Authority, (Providence Health Care), Series D, (AGM), 5.25%, 10/1/33(1) | | | 12,605 | | | | 13,325,628 | |
| | | | | | | | | |
| | | $ | 72,372,062 | |
| | | | | | | | | |
| | | | | | | | |
| Security | | Principal
Amount
(000’s omitted) | | | Value | |
| | | | | | | | |
|
Insured – Industrial Development Revenue — 1.0% | |
Pennsylvania Economic Development Financing Authority, (Aqua Pennsylvania, Inc.), (BHAC),
5.00%, 10/1/39(1) | | $ | 9,000 | | | $ | 9,714,780 | |
| | | | | | | | | |
| | | $ | 9,714,780 | |
| | | | | | | | | |
|
Insured – Other Revenue — 1.6% | |
Harris County-Houston Sports Authority, TX, (AGM), (NPFG), 0.00%, 11/15/34 | | $ | 16,795 | | | $ | 7,527,183 | |
New York City Industrial Development Agency, NY, (Yankee Stadium), (AGC), 7.00%, 3/1/49 | | | 6,750 | | | | 7,471,035 | |
| | | | | | | | | |
| | | $ | 14,998,218 | |
| | | | | | | | | |
|
Insured – Solid Waste — 0.2% | |
Palm Beach County Solid Waste Authority, FL, (BHAC), 5.00%, 10/1/24 | | $ | 1,985 | | | $ | 2,168,414 | |
| | | | | | | | | |
| | | $ | 2,168,414 | |
| | | | | | | | | |
|
Insured – Special Tax Revenue — 5.7% | |
Alabama Public School and College Authority, (AGM), 2.50%, 12/1/27 | | $ | 15,975 | | | $ | 15,616,042 | |
Houston, TX, Hotel Occupancy Tax, (AMBAC), 0.00%, 9/1/24 | | | 18,035 | | | | 14,094,352 | |
Miami-Dade County, FL, Professional Sports Franchise Facilities, (AGC), 7.00%, (0.00% until 10/1/19), 10/1/39 | | | 15,000 | | | | 17,226,750 | |
Puerto Rico Sales Tax Financing Corp., (NPFG), 0.00%, 8/1/45 | | | 28,945 | | | | 5,548,467 | |
| | | | | | | | | |
| | | $ | 52,485,611 | |
| | | | | | | | | |
|
Insured – Student Loan — 0.6% | |
Maine Educational Loan Authority, (AGC), 5.625%, 12/1/27 | | $ | 4,990 | | | $ | 5,333,063 | |
| | | | | | | | | |
| | | $ | 5,333,063 | |
| | | | | | | | | |
|
Insured – Transportation — 10.7% | |
Chicago, IL, (O’Hare International Airport), (AGM), 5.00%, 1/1/28 | | $ | 2,500 | | | $ | 2,848,525 | |
Chicago, IL, (O’Hare International Airport), (AGM), 5.00%, 1/1/29 | | | 1,000 | | | | 1,137,680 | |
Chicago, IL, (O’Hare International Airport), (AGM), 5.125%, 1/1/30 | | | 1,800 | | | | 2,026,368 | |
Chicago, IL, (O’Hare International Airport), (AGM), 5.125%, 1/1/31 | | | 1,570 | | | | 1,761,226 | |
Chicago, IL, (O’Hare International Airport), (AGM), 5.25%, 1/1/32 | | | 1,015 | | | | 1,141,591 | |
Chicago, IL, (O’Hare International Airport), (AGM), 5.25%, 1/1/33 | | | 1,150 | | | | 1,291,485 | |
Clark County, NV, (Las Vegas-McCarran International Airport), (AGM),
5.25%, 7/1/39 | | | 8,080 | | | | 8,758,639 | |
| | | | |
| | 8 | | See Notes to Financial Statements. |
Eaton Vance
Municipal Bond Fund
March 31, 2017
Portfolio of Investments (Unaudited) — continued
| | | | | | | | |
| Security | | Principal
Amount
(000’s omitted) | | | Value | |
| | | | | | | | |
|
Insured – Transportation (continued) | |
E-470 Public Highway Authority, CO, (NPFG), 0.00%, 9/1/21 | | $ | 10,200 | | | $ | 9,144,402 | |
E-470 Public Highway Authority, CO, (NPFG), 0.00%, 9/1/39 | | | 25,000 | | | | 8,664,000 | |
Harris County, TX, Toll Road Revenue, (BHAC), (NPFG), 5.00%, 8/15/33(1) | | | 7,800 | | | | 7,911,228 | |
Manchester, NH, (Manchester-Boston Regional Airport), (AGM),
5.125%, 1/1/30 | | | 6,710 | | | | 6,948,138 | |
Metropolitan Washington Airports Authority, D.C., (BHAC), 5.00%, 10/1/29 | | | 1,785 | | | | 1,933,833 | |
New Jersey Transportation Trust Fund Authority, (AGC), 5.50%, 12/15/38 | | | 11,700 | | | | 12,339,171 | |
Port Palm Beach District, FL, (XLCA), 0.00%, 9/1/24 | | | 1,605 | | | | 1,122,296 | |
Port Palm Beach District, FL, (XLCA), 0.00%, 9/1/25 | | | 1,950 | | | | 1,294,741 | |
Port Palm Beach District, FL, (XLCA), 0.00%, 9/1/26 | | | 1,000 | | | | 630,520 | |
San Joaquin Hills Transportation Corridor Agency, CA, (Toll Road Bonds), (NPFG), 0.00%, 1/15/25 | | | 26,215 | | | | 19,793,636 | |
Texas Transportation Commission, (Central Texas Turnpike System), (AMBAC), 0.00%, 8/15/20 | | | 10,275 | | | | 9,651,616 | |
| | | | | | | | | |
| | | $ | 98,399,095 | |
| | | | | | | | | |
|
Insured – Water and Sewer — 5.3% | |
Chicago, IL, Wastewater Transmission Revenue, (BHAC), 5.50%, 1/1/38 | | $ | 2,060 | | | $ | 2,114,116 | |
Chicago, IL, Wastewater Transmission Revenue, (NPFG), 0.00%, 1/1/23 | | | 13,670 | | | | 11,587,649 | |
DeKalb County, GA, Water and Sewerage Revenue, (AGM), 5.25%, 10/1/32(1) | | | 10,000 | | | | 12,068,300 | |
Massachusetts Water Resources Authority, (AGM), 5.25%, 8/1/32 | | | 5,540 | | | | 6,938,241 | |
Massachusetts Water Resources Authority, (AGM), 5.25%, 8/1/38 | | | 1,070 | | | | 1,357,220 | |
Michigan Finance Authority, (Detroit Water and Sewerage Department), (AGM), 5.00%, 7/1/32 | | | 2,615 | | | | 2,937,089 | |
Michigan Finance Authority, (Detroit Water and Sewerage Department), (AGM), 5.00%, 7/1/33 | | | 2,240 | | | | 2,505,082 | |
Michigan Finance Authority, (Detroit Water and Sewerage Department), (AGM), 5.00%, 7/1/35 | | | 2,730 | | | | 3,034,395 | |
Michigan Finance Authority, (Detroit Water and Sewerage Department), (AGM), 5.00%, 7/1/37 | | | 2,240 | | | | 2,482,122 | |
San Luis Obispo County, CA, (Nacimiento Water Project), (NPFG), 4.50%, 9/1/40 | | | 3,535 | | | | 3,579,364 | |
| | | | | | | | | |
| | | $ | 48,603,578 | |
| | | | | | | | | |
|
Lease Revenue / Certificates of Participation — 3.5% | |
Hudson Yards Infrastructure Corp., NY, 5.75%, 2/15/47 | | $ | 1,980 | | | $ | 2,249,656 | |
North Carolina, Limited Obligation Bonds, 5.00%, 5/1/26 | | | 10 | | | | 11,808 | |
| | | | | | | | |
| Security | | Principal
Amount
(000’s omitted) | | | Value | |
| | | | | | | | |
|
Lease Revenue / Certificates of Participation (continued) | |
North Carolina, Limited Obligation Bonds, 5.00%, 5/1/26(1) | | $ | 16,000 | | | $ | 18,892,960 | |
North Carolina, Limited Obligation Bonds, 5.00%, 5/1/30(1) | | | 10,000 | | | | 11,222,200 | |
| | | | | | | | | |
| | | $ | 32,376,624 | |
| | | | | | | | | |
|
Other Revenue — 2.6% | |
New York City Transitional Finance Authority, NY, (Building Aid),
5.00%, 7/15/36(1) | | $ | 10,750 | | | $ | 11,980,660 | |
Oregon Department of Administrative Services, Lottery Revenue,
5.25%, 4/1/30 | | | 9,200 | | | | 10,312,924 | |
Texas Municipal Gas Acquisition and Supply Corp. III, Gas Supply Revenue, 5.00%, 12/15/30 | | | 1,700 | | | | 1,823,488 | |
| | | | | | | | | |
| | | $ | 24,117,072 | |
| | | | | | | | | |
|
Special Tax Revenue — 17.1% | |
Central Puget Sound Regional Transit Authority, WA, Sales and Use Tax Revenue, 5.00%, 11/1/30(1) | | $ | 12,575 | | | $ | 14,883,141 | |
Central Puget Sound Regional Transit Authority, WA, Sales and Use Tax Revenue, 5.00%, 11/1/41(1) | | | 10,000 | | | | 11,484,100 | |
Connecticut, Special Tax Obligation, (Transportation Infrastructure), 5.00%, 1/1/31(1) | | | 20,000 | | | | 22,627,400 | |
Los Angeles County Metropolitan Transportation Authority, CA, Sales Tax Revenue, 5.00%, 7/1/38 | | | 5,000 | | | | 5,852,500 | |
Massachusetts School Building Authority, Dedicated Sales Tax Revenue, 5.00%, 8/15/37(1) | | | 20,200 | | | | 23,042,342 | |
New York City Transitional Finance Authority, NY, Future Tax Revenue, 3.00%, 2/1/39(1) | | | 15,000 | | | | 13,472,100 | |
New York City Transitional Finance Authority, NY, Future Tax Revenue, 5.00%, 2/1/37(1) | | | 20,000 | | | | 22,475,600 | |
New York Convention Center Development Corp., Hotel Occupancy Tax, 5.00%, 11/15/45(1) | | | 13,000 | | | | 14,677,390 | |
New York Dormitory Authority, Personal Income Tax Revenue, 5.00%, 6/15/31 | | | 10,000 | | | | 11,499,100 | |
New York Dormitory Authority, Sales Tax Revenue, 5.00%, 3/15/34 | | | 3,285 | | | | 3,705,743 | |
New York Dormitory Authority, Sales Tax Revenue, 5.00%, 3/15/35 | | | 12,040 | | | | 13,567,996 | |
| | | | | | | | | |
| | | $ | 157,287,412 | |
| | | | | | | | | |
|
Transportation — 15.3% | |
Chicago, IL, (O’Hare International Airport), 5.00%, 1/1/36 | | $ | 6,000 | | | $ | 6,653,880 | |
Chicago, IL, (O’Hare International Airport), 5.00%, 1/1/38 | | | 2,105 | | | | 2,329,393 | |
Dallas and Fort Worth, TX, (Dallas/Fort Worth International Airport),
5.25%, 11/1/30 | | | 3,205 | | | | 3,720,685 | |
Dallas and Fort Worth, TX, (Dallas/Fort Worth International Airport),
5.25%, 11/1/31 | | | 4,950 | | | | 5,729,179 | |
| | | | |
| | 9 | | See Notes to Financial Statements. |
Eaton Vance
Municipal Bond Fund
March 31, 2017
Portfolio of Investments (Unaudited) — continued
| | | | | | | | |
| Security | | Principal
Amount
(000’s omitted) | | | Value | |
| | | | | | | | |
|
Transportation (continued) | |
Delaware River Port Authority of Pennsylvania and New Jersey, 5.00%, 1/1/35 | | $ | 8,275 | | | $ | 8,996,083 | |
Illinois Toll Highway Authority,
5.00%, 12/1/32(1) | | | 10,425 | | | | 11,838,213 | |
Illinois Toll Highway Authority, 5.00%, 1/1/37(1) | | | 10,000 | | | | 11,153,600 | |
Kansas Department of Transportation,
5.00%, 9/1/35(1) | | | 10,000 | | | | 11,533,900 | |
Los Angeles Department of Airports, CA, (Los Angeles International Airport), 5.25%, 5/15/28 | | | 3,285 | | | | 3,685,869 | |
Metropolitan Transportation Authority, NY, 5.25%, 11/15/32 | | | 4,380 | | | | 5,096,042 | |
Metropolitan Transportation Authority, NY, 5.25%, 11/15/38 | | | 4,640 | | | | 5,269,880 | |
Metropolitan Transportation Authority, NY, 5.25%, 11/15/40 | | | 4,735 | | | | 5,277,489 | |
Miami-Dade County, FL, (Miami International Airport), 5.00%, 10/1/41 | | | 10,825 | | | | 11,702,150 | |
Miami-Dade County, FL, Aviation Revenue, 5.00%, 10/1/37 | | | 4,615 | | | | 5,142,218 | |
New Jersey Transportation Trust Fund Authority, (Transportation System), 5.00%, 12/15/24 | | | 10,000 | | | | 10,566,000 | |
Orlando-Orange County Expressway Authority, FL, 5.00%, 7/1/35 | | | 610 | | | | 665,480 | |
Orlando-Orange County Expressway Authority, FL, 5.00%, 7/1/40 | | | 1,580 | | | | 1,722,658 | |
Orlando-Orange County Expressway Authority, FL, Prerefunded to 7/1/20, 5.00%, 7/1/35 | | | 2,305 | | | | 2,571,596 | |
Orlando-Orange County Expressway Authority, FL, Prerefunded to 7/1/20, 5.00%, 7/1/40 | | | 1,010 | | | | 1,126,817 | |
Pennsylvania Turnpike Commission, 6.00%, 12/1/34 | | | 3,520 | | | | 4,014,595 | |
Port Authority of New York and New Jersey, 5.00%, 12/1/34(1) | | | 14,360 | | | | 16,399,838 | |
Port Authority of New York and New Jersey, 5.00%, 7/15/39 | | | 5,000 | | | | 5,514,200 | |
| | | | | | | | | |
| | | $ | 140,709,765 | |
| | | | | | | | | |
|
Water and Sewer — 12.0% | |
Charleston, SC, Waterworks and Sewer Revenue, 5.00%, 1/1/45(1) | | $ | 25,000 | | | $ | 28,304,250 | |
Dallas, TX, Waterworks and Sewer System Revenue, 5.00%, 10/1/41 | | | 15,000 | | | | 17,170,350 | |
Detroit, MI, Sewage Disposal System, 5.00%, 7/1/32 | | | 1,070 | | | | 1,151,095 | |
Detroit, MI, Sewage Disposal System, 5.25%, 7/1/39 | | | 1,965 | | | | 2,119,704 | |
Detroit, MI, Water Supply System,
5.25%, 7/1/41 | | | 2,910 | | | | 3,163,228 | |
King County, WA, Sewer Revenue, 5.00%, 1/1/34(1) | | | 4,000 | | | | 4,487,312 | |
Metropolitan St. Louis Sewer District, MO, 5.00%, 5/1/35(1) | | | 8,750 | | | | 10,065,388 | |
Metropolitan St. Louis Sewer District, MO, 5.00%, 5/1/36(1) | | | 7,925 | | | | 9,097,900 | |
New York City Municipal Water Finance Authority, NY, 5.00%, 6/15/31 | | | 10,000 | | | | 11,449,200 | |
| | | | | | | | |
| Security | | Principal
Amount
(000’s omitted) | | | Value | |
| | | | | | | | |
|
Water and Sewer (continued) | |
Portland, OR, Water System,
5.00%, 5/1/36 | | $ | 5,385 | | | $ | 5,964,049 | |
Texas Water Development Board,
5.00%, 10/15/40(1) | | | 15,500 | | | | 17,669,380 | |
| | | | | | | | | |
| | | $ | 110,641,856 | |
| | | | | | | | | |
| |
Total Tax-Exempt Investments — 165.1%
(identified cost $1,427,725,413) | | | $ | 1,520,563,350 | |
| | | | | | | | | |
| |
Other Assets, Less Liabilities — (65.1)% | | | $ | (599,554,462 | ) |
| | | | | | | | | |
| |
Net Assets — 100.0% | | | $ | 921,008,888 | |
| | | | | | | | | |
The percentage shown for each investment category in the Portfolio of Investments is based on net assets.
At March 31, 2017, the concentration of the Fund’s investments in the various states and territories, determined as a percentage of total investments, is as follows:
| | | | |
| New York | | | 12.4% | |
| California | | | 10.5% | |
| Others, representing less than 10% individually | | | 77.1% | |
The Fund invests primarily in debt securities issued by municipalities. The ability of the issuers of the debt securities to meet their obligations may be affected by economic developments in a specific industry or municipality. In order to reduce the risk associated with such economic developments, at March 31, 2017, 35.7% of total investments are backed by bond insurance of various financial institutions and financial guaranty assurance agencies. The aggregate percentage insured by an individual financial institution or financial guaranty assurance agency ranged from 0.2% to 12.6% of total investments.
| (1) | Security represents the municipal bond held by a trust that issues residual interest bonds (see Note 1G). |
| | | | |
| | 10 | | See Notes to Financial Statements. |
Eaton Vance
Municipal Bond Fund
March 31, 2017
Portfolio of Investments (Unaudited) — continued
| | | | | | | | | | | | | | | | | | | | | | | | |
| Futures Contracts | |
| Description | | Contracts | | | Position | | | Expiration
Month/Year | | | Aggregate Cost | | | Value | | | Net Unrealized
Appreciation | |
| | | | | | |
Interest Rate Futures | | | | | | | | | | | | | | | | | | | | | | | | |
| U.S. Long Treasury Bond | | | 229 | | | | Short | | | | Jun-17 | | | $ | (34,796,835 | ) | | $ | (34,543,219 | ) | | $ | 253,616 | |
| | | | | | |
| | | | | | | | | | | | | | | | | | | | | | | $ | 253,616 | |
Abbreviations:
| | | | |
| AGC | | – | | Assured Guaranty Corp. |
| AGM | | – | | Assured Guaranty Municipal Corp. |
| AMBAC | | – | | AMBAC Financial Group, Inc. |
| BAM | | – | | Build America Mutual Assurance Co. |
| BHAC | | – | | Berkshire Hathaway Assurance Corp. |
| | | | |
| FGIC | | – | | Financial Guaranty Insurance Company |
| NPFG | | – | | National Public Finance Guaranty Corp. |
| PSF | | – | | Permanent School Fund |
| XLCA | | – | | XL Capital Assurance, Inc. |
| | | | |
| | 11 | | See Notes to Financial Statements. |
Eaton Vance
California Municipal Bond Fund
March 31, 2017
Portfolio of Investments (Unaudited)
| | | | | | | | |
| Tax-Exempt Investments — 173.8% | |
| | |
| | | | | | | | |
| Security | | Principal Amount (000’s omitted) | | | Value | |
| | | | | | | | |
|
Education — 6.6% | |
California Educational Facilities Authority, (Claremont McKenna College),
5.00%, 1/1/27 | | $ | 770 | | | $ | 792,476 | |
California Educational Facilities Authority, (Harvey Mudd College),
5.25%, 12/1/31 | | | 550 | | | | 622,622 | |
California Educational Facilities Authority, (Harvey Mudd College), 5.25%, 12/1/36 | | | 940 | | | | 1,064,118 | |
California Educational Facilities Authority, (Loyola Marymount University),
5.00%, 10/1/30 | | | 1,375 | | | | 1,487,007 | |
California Educational Facilities Authority, (Santa Clara University),
5.00%, 2/1/29 | | | 285 | | | | 312,297 | |
California Educational Facilities Authority, (University of San Francisco),
6.125%, 10/1/36 | | | 650 | | | | 763,692 | |
California Educational Facilities Authority, (University of the Pacific),
5.00%, 11/1/30 | | | 1,790 | | | | 1,995,331 | |
California Municipal Finance Authority, (University of San Diego),
5.00%, 10/1/31 | | | 1,175 | | | | 1,313,756 | |
California Municipal Finance Authority, (University of San Diego),
5.00%, 10/1/35 | | | 800 | | | | 895,560 | |
California Municipal Finance Authority, (University of San Diego),
5.25%, 10/1/26 | | | 2,270 | | | | 2,597,516 | |
California Municipal Finance Authority, (University of San Diego),
5.25%, 10/1/27 | | | 2,395 | | | | 2,723,929 | |
California Municipal Finance Authority, (University of San Diego),
5.25%, 10/1/28 | | | 2,520 | | | | 2,851,027 | |
| | | | | | | | | |
| | | $ | 17,419,331 | |
| | | | | | | | | |
|
Electric Utilities — 1.4% | |
Southern California Public Power Authority, (Tieton Hydropower), 5.00%, 7/1/35 | | $ | 1,890 | | | $ | 2,083,196 | |
Vernon, Electric System Revenue, 5.125%, 8/1/21 | | | 1,420 | | | | 1,528,829 | |
| | | | | | | | | |
| | | $ | 3,612,025 | |
| | | | | | | | | |
|
Escrowed / Prerefunded — 17.6% | |
California Educational Facilities Authority, (California Institute of Technology), Prerefunded to 11/1/19, 5.00%, 11/1/39(1) | | $ | 10,000 | | | $ | 10,985,000 | |
California Educational Facilities Authority, (Claremont McKenna College), Prerefunded to 1/1/18, 5.00%, 1/1/27 | | | 1,910 | | | | 1,969,840 | |
California Educational Facilities Authority, (University of Southern California), Prerefunded to 10/1/18, 5.25%, 10/1/39 | | | 6,200 | | | | 6,598,970 | |
California Health Facilities Financing Authority, (Cedars-Sinai Medical Center), Prerefunded to 8/15/19, 5.00%, 8/15/39 | | | 4,505 | | | | 4,918,334 | |
Foothill-De Anza Community College District, Prerefunded to 8/1/21, 5.00%, 8/1/36(1) | | | 10,000 | | | | 11,553,100 | |
| | | | | | | | |
| Security | | Principal Amount (000’s omitted) | | | Value | |
| | | | | | | | |
|
Escrowed / Prerefunded (continued) | |
San Diego Community College District, (Election of 2002), Prerefunded to 8/1/21, 5.00%, 8/1/32 | | $ | 1,375 | | | $ | 1,582,281 | |
San Diego Community College District, (Election of 2006), Prerefunded to 8/1/21, 5.00%, 8/1/31 | | | 2,545 | | | | 2,928,659 | |
San Francisco Bay Area Rapid Transit District, (Election of 2004), Prerefunded to 8/1/17, 5.00%, 8/1/35 | | | 5,000 | | | | 5,071,550 | |
Vernon, Electric System Revenue, Prerefunded to 8/1/19, 5.125%, 8/1/21 | | | 610 | | | | 649,741 | |
| | | | | | | | | |
| | | $ | 46,257,475 | |
| | | | | | | | | |
|
General Obligations — 49.7% | |
Berryessa Union School District, (Election of 2014), 5.00%, 8/1/40(2) | | $ | 7,480 | | | $ | 8,592,949 | |
Burbank Unified School District, (Election of 2013), 4.00%, 8/1/31(1) | | | 6,900 | | | | 7,327,800 | |
California, 5.50%, 11/1/35 | | | 4,600 | | | | 5,232,546 | |
Castro Valley Unified School District, (Election of 2016), 5.00%, 8/1/41 | | | 2,500 | | | | 2,854,000 | |
Contra Costa Community College District, (Election of 2006), 5.00%, 8/1/38 | | | 20 | | | | 22,648 | |
Contra Costa Community College District, (Election of 2006), 5.00%, 8/1/38(1) | | | 9,750 | | | | 11,040,997 | |
Desert Community College District, 5.00%, 8/1/36(1) | | | 7,500 | | | | 8,593,425 | |
Mountain View Whisman School District, (Election of 2012), 4.00%, 9/1/42(1) | | | 10,000 | | | | 10,389,800 | |
Palo Alto, (Election of 2008),
5.00%, 8/1/40(1) | | | 7,020 | | | | 7,775,914 | |
Palomar Community College District, 5.00%, 8/1/44(1) | | | 10,000 | | | | 11,291,500 | |
San Bernardino Community College District, 4.00%, 8/1/27(1) | | | 5,775 | | | | 6,328,707 | |
San Jose Unified School District,
5.00%, 8/1/32(1) | | | 7,500 | | | | 8,730,600 | |
San Jose-Evergreen Community College District, (Election of 2010), 5.00%, 8/1/37(1) | | | 4,975 | | | | 5,643,690 | |
Santa Monica Community College District, (Election of 2008),
5.00%, 8/1/44(1) | | | 7,500 | | | | 8,443,725 | |
Santa Rosa High School District, (Election of 2014), 5.00%, 8/1/41 | | | 3,495 | | | | 3,977,799 | |
Tahoe-Truckee Unified School District, (Election of 2014), 5.00%, 8/1/39 | | | 4,125 | | | | 4,701,964 | |
Tahoe-Truckee Unified School District, (Election of 2014), 5.00%, 8/1/41 | | | 1,500 | | | | 1,707,210 | |
Torrance Unified School District, (Election of 2008), 5.00%, 8/1/35 | | | 7,500 | | | | 8,441,925 | |
Ventura County Community College District, 5.00%, 8/1/30(1) | | | 8,000 | | | | 9,405,360 | |
| | | | | | | | | |
| | | $ | 130,502,559 | |
| | | | | | | | | |
| | | | |
| | 12 | | See Notes to Financial Statements. |
Eaton Vance
California Municipal Bond Fund
March 31, 2017
Portfolio of Investments (Unaudited) — continued
| | | | | | | | |
| Security | | Principal Amount (000’s omitted) | | | Value | |
| | | | | | | | |
|
Hospital — 9.0% | |
California Health Facilities Financing Authority, (Catholic Healthcare West), 5.25%, 3/1/27 | | $ | 1,750 | | | $ | 1,962,310 | |
California Health Facilities Financing Authority, (Catholic Healthcare West), 5.25%, 3/1/28 | | | 550 | | | | 616,792 | |
California Health Facilities Financing Authority, (City of Hope),
5.00%, 11/15/32 | | | 1,795 | | | | 2,002,017 | |
California Health Facilities Financing Authority, (City of Hope),
5.00%, 11/15/35 | | | 2,565 | | | | 2,842,508 | |
California Health Facilities Financing Authority, (St. Joseph Health System), 5.00%, 7/1/33 | | | 4,480 | | | | 5,046,810 | |
California Health Facilities Financing Authority, (St. Joseph Health System), 5.00%, 7/1/37 | | | 2,100 | | | | 2,345,259 | |
California Health Facilities Financing Authority, (Sutter Health),
5.25%, 8/15/31(1) | | | 5,000 | | | | 5,703,950 | |
Washington Township Health Care District, 5.00%, 7/1/32 | | | 3,165 | | | | 3,180,888 | |
| | | | | | | | | |
| | | $ | 23,700,534 | |
| | | | | | | | | |
|
Insured – Electric Utilities — 4.4% | |
Northern California Power Agency, (Hydroelectric), (AGC), 5.00%, 7/1/24 | | $ | 2,000 | | | $ | 2,095,260 | |
Puerto Rico Electric Power Authority, (NPFG), 5.25%, 7/1/34 | | | 3,840 | | | | 4,013,261 | |
Sacramento Municipal Utility District, (AGM), 5.00%, 8/15/27 | | | 615 | | | | 648,610 | |
Sacramento Municipal Utility District, (AMBAC), (BHAC), 5.25%, 7/1/24 | | | 4,000 | | | | 4,797,840 | |
| | | | | | | | | |
| | | $ | 11,554,971 | |
| | | | | | | | | |
|
Insured – Escrowed / Prerefunded — 21.0% | |
Anaheim Public Financing Authority, (Electric System District), (BHAC), (NPFG), Prerefunded to 4/1/17, 4.50%, 10/1/32(1) | | $ | 20,000 | | | $ | 19,999,998 | |
Antelope Valley Community College District, (Election of 2004), (NPFG), Prerefunded to 8/1/17, 5.25%, 8/1/39 | | | 4,175 | | | | 4,238,794 | |
California Statewide Communities Development Authority, (Sutter Health), (AMBAC), (BHAC), Prerefunded to 5/15/17, 5.00%, 11/15/38(1) | | | 2,000 | | | | 2,010,420 | |
East Bay Municipal Utility District, Water System Revenue, (AGM), (FGIC), Prerefunded to 6/1/17, 5.00%, 6/1/32 | | | 345 | | | | 347,532 | |
Glendale, Electric System Revenue, (AGC), Prerefunded to 2/1/18, 5.00%, 2/1/31 | | | 2,240 | | | | 2,317,975 | |
Palm Springs Unified School District, (Election of 2008), (AGC), Prerefunded to 8/1/19, 5.00%, 8/1/33 | | | 4,500 | | | | 4,906,935 | |
Riverside Community College District, (Election of 2004), (AGM), (NPFG), Prerefunded to 8/1/17, 5.00%, 8/1/32 | | | 5,705 | | | | 5,787,437 | |
Sacramento Municipal Utility District, (AGM), Prerefunded to 8/15/18, 5.00%, 8/15/27 | | | 385 | | | | 406,533 | |
| | | | | | | | |
| Security | | Principal Amount (000’s omitted) | | | Value | |
| | | | | | | | |
|
Insured – Escrowed / Prerefunded (continued) | |
San Diego County Water Authority, Certificates of Participation, (AGM), Prerefunded to 5/1/18, 5.00%, 5/1/38(1) | | $ | 10,000 | | | $ | 10,447,300 | |
San Luis Obispo County, (Nacimiento Water Project), (BHAC), (NPFG), Prerefunded to 9/1/17, 5.00%, 9/1/38 | | | 4,750 | | | | 4,834,978 | |
| | | | | | | | | |
| | | $ | 55,297,902 | |
| | | | | | | | | |
|
Insured – General Obligations — 12.0% | |
Burbank Unified School District, (Election of 1997), (NPFG), 0.00%, 8/1/21 | | $ | 4,135 | | | $ | 3,805,275 | |
San Diego Unified School District, (NPFG), 0.00%, 7/1/22 | | | 2,300 | | | | 2,058,454 | |
San Diego Unified School District, (NPFG), 0.00%, 7/1/23 | | | 5,000 | | | | 4,299,500 | |
San Juan Unified School District, (AGM), 0.00%, 8/1/21 | | | 5,630 | | | | 5,212,310 | |
San Mateo County Community College District, (NPFG), 0.00%, 9/1/22 | | | 4,840 | | | | 4,357,065 | |
San Mateo County Community College District, (NPFG), 0.00%, 9/1/23 | | | 4,365 | | | | 3,802,046 | |
San Mateo County Community College District, (NPFG), 0.00%, 9/1/25 | | | 3,955 | | | | 3,188,284 | |
San Mateo Union High School District, (NPFG), 0.00%, 9/1/21 | | | 5,240 | | | | 4,846,790 | |
| | | | | | | | | |
| | | $ | 31,569,724 | |
| | | | | | | | | |
|
Insured – Special Tax Revenue — 6.4% | |
Hesperia Public Financing Authority, (Redevelopment and Housing Projects), (XLCA), 5.00%, 9/1/31 | | $ | 595 | | | $ | 598,641 | |
Hesperia Public Financing Authority, (Redevelopment and Housing Projects), (XLCA), 5.00%, 9/1/37 | | | 7,240 | | | | 7,269,611 | |
Pomona Public Financing Authority, (NPFG), 5.00%, 2/1/33 | | | 5,940 | | | | 5,958,949 | |
Puerto Rico Sales Tax Financing Corp., (NPFG), 0.00%, 8/1/45 | | | 15,020 | | | | 2,879,184 | |
| | | | | | | | | |
| | | $ | 16,706,385 | |
| | | | | | | | | |
|
Insured – Transportation — 1.5% | |
San Jose, Airport Revenue, (AMBAC), 5.00%, 3/1/33 | | $ | 1,885 | | | $ | 1,887,262 | |
San Jose, Airport Revenue, (AMBAC), 5.00%, 3/1/37 | | | 2,040 | | | | 2,042,448 | |
| | | | | | | | | |
| | | $ | 3,929,710 | |
| | | | | | | | | |
|
Insured – Water and Sewer — 1.8% | |
Riverside, Water System Revenue, (AGM), 5.00%, 10/1/38 | | $ | 1,595 | | | $ | 1,686,617 | |
San Luis Obispo County, (Nacimiento Water Project), (BHAC), (NPFG), 5.00%, 9/1/38 | | | 250 | | | | 253,983 | |
San Luis Obispo County, (Nacimiento Water Project), (NPFG), 4.50%, 9/1/40 | | | 2,750 | | | | 2,784,512 | |
| | | | | | | | | |
| | | $ | 4,725,112 | |
| | | | | | | | | |
| | | | |
| | 13 | | See Notes to Financial Statements. |
Eaton Vance
California Municipal Bond Fund
March 31, 2017
Portfolio of Investments (Unaudited) — continued
| | | | | | | | |
| Security | | Principal Amount (000’s omitted) | | | Value | |
| | | | | | | | |
|
Lease Revenue / Certificates of Participation — 1.1% | |
California Public Works Board, 5.00%, 11/1/38 | | $ | 2,565 | | | $ | 2,875,852 | |
| | | | | | | | | |
| | | $ | 2,875,852 | |
| | | | | | | | | |
|
Special Tax Revenue — 12.6% | |
Jurupa Public Financing Authority,
5.00%, 9/1/30 | | $ | 625 | | | $ | 705,481 | |
Jurupa Public Financing Authority,
5.00%, 9/1/32 | | | 625 | | | | 697,863 | |
Riverside County Transportation Commission, Sales Tax Revenue, 5.25%, 6/1/39(1) | | | 6,285 | | | | 7,278,523 | |
San Bernardino County Transportation Authority, 5.25%, 3/1/40 | | | 5 | | | | 5,759 | |
San Bernardino County Transportation Authority, 5.25%, 3/1/40(1) | | | 10,375 | | | | 11,948,991 | |
San Francisco Bay Area Rapid Transportation District, Sales Tax Revenue, 5.00%, 7/1/36(1) | | | 6,250 | | | | 7,096,437 | |
Successor Agency to San Diego Redevelopment Agency, 5.00%, 9/1/32 | | | 4,720 | | | | 5,464,108 | |
| | | | | | | | | |
| | | $ | 33,197,162 | |
| | | | | | | | | |
|
Transportation — 11.6% | |
Bay Area Toll Authority, Toll Bridge Revenue, (San Francisco Bay Area), Prerefunded to 4/1/19, 5.25%, 4/1/29(1) | | $ | 6,500 | | | $ | 7,042,295 | |
Long Beach, Harbor Revenue,
5.00%, 5/15/27 | | | 1,960 | | | | 2,182,303 | |
Long Beach, Harbor Revenue,
5.00%, 5/15/42(1) | | | 7,500 | | | | 8,539,125 | |
Los Angeles Department of Airports, (Los Angeles International Airport),
5.00%, 5/15/35(1) | | | 7,500 | | | | 8,288,775 | |
San Francisco City and County Airport Commission, (San Francisco International Airport), 5.00%, 5/1/35 | | | 2,190 | | | | 2,395,816 | |
San Jose, Airport Revenue, 5.00%, 3/1/31 | | | 1,750 | | | | 1,920,153 | |
| | | | | | | | | |
| | | $ | 30,368,467 | |
| | | | | | | | | |
|
Water and Sewer — 17.1% | |
Beverly Hills Public Financing Authority, Water Revenue, 5.00%, 6/1/37(1) | | $ | 5,725 | | | $ | 6,488,715 | |
Los Angeles Department of Water and Power, Water System Revenue, 5.00%, 7/1/39(1) | | | 10,000 | | | | 11,356,800 | |
Los Angeles, Wastewater System Revenue, 5.00%, 6/1/43(1) | | | 7,500 | | | | 8,392,200 | |
Orange County Sanitation District, Wastewater Revenue, 5.00%, 2/1/35(1) | | | 10,000 | | | | 11,628,900 | |
| | | | | | | | |
| Security | | Principal Amount (000’s omitted) | | | Value | |
| | | | | | | | |
|
Water and Sewer (continued) | |
Rancho California Water District Financing Authority, 5.00%, 8/1/46 | | $ | 60 | | | $ | 68,913 | |
Rancho California Water District Financing Authority, 5.00%, 8/1/46(1) | | | 6,000 | | | | 6,891,300 | |
| | | | | | | | | |
| | | $ | 44,826,828 | |
| | | | | | | | | |
| |
Total Tax-Exempt Investments — 173.8%
(identified cost $433,866,180) | | | $ | 456,544,037 | |
| | | | | | | | | |
| |
Other Assets, Less Liabilities — (73.8)% | | | $ | (193,878,797 | ) |
| | | | | | | | | |
| |
Net Assets — 100.0% | | | $ | 262,665,240 | |
| | | | | | | | | |
The percentage shown for each investment category in the Portfolio of Investments is based on net assets.
The Fund invests primarily in debt securities issued by California municipalities. The ability of the issuers of the debt securities to meet their obligations may be affected by economic developments in a specific industry or municipality. In order to reduce the risk associated with such economic developments, at March 31, 2017, 27.1% of total investments are backed by bond insurance of various financial institutions and financial guaranty assurance agencies. The aggregate percentage insured by an individual financial institution or financial guaranty assurance agency ranged from 0.1% to 16.9% of total investments.
| (1) | Security represents the municipal bond held by a trust that issues residual interest bonds (see Note 1G). |
| | | | |
| | 14 | | See Notes to Financial Statements. |
Eaton Vance
California Municipal Bond Fund
March 31, 2017
Portfolio of Investments (Unaudited) — continued
| | | | | | | | | | | | | | | | | | | | | | | | |
| Futures Contracts | |
| Description | | Contracts | | | Position | | | Expiration
Month/Year | | | Aggregate Cost | | | Value | | | Net Unrealized
Appreciation
(Depreciation) | |
| | | | | | |
Interest Rate Futures | | | | | | | | | | | | | | | | | | | | | | | | |
| U.S. 10-Year Treasury Note | | | 100 | | | | Short | | | | Jun-17 | | | $ | (12,422,468 | ) | | $ | (12,456,250 | ) | | $ | (33,782 | ) |
| U.S. Long Treasury Bond | | | 79 | | | | Short | | | | Jun-17 | | | | (12,004,149 | ) | | | (11,916,657 | ) | | | 87,492 | |
| | | | | | |
| | | | | | | | | | | | | | | | | | | | | | | $ | 53,710 | |
Abbreviations:
| | | | |
| AGC | | – | | Assured Guaranty Corp. |
| AGM | | – | | Assured Guaranty Municipal Corp. |
| AMBAC | | – | | AMBAC Financial Group, Inc. |
| BHAC | | – | | Berkshire Hathaway Assurance Corp. |
| | | | |
| FGIC | | – | | Financial Guaranty Insurance Company |
| NPFG | | – | | National Public Finance Guaranty Corp. |
| XLCA | | – | | XL Capital Assurance, Inc. |
| | | | |
| | 15 | | See Notes to Financial Statements. |
Eaton Vance
New York Municipal Bond Fund
March 31, 2017
Portfolio of Investments (Unaudited)
| | | | | | | | |
| Tax-Exempt Investments — 166.7% | |
| | |
| | | | | | | | |
| Security | | Principal Amount (000’s omitted) | | | Value | |
| | | | | | | | |
|
Bond Bank — 9.2% | |
New York Environmental Facilities Corp., 5.00%, 10/15/39 | | $ | 3,360 | | | $ | 3,679,502 | |
New York Environmental Facilities Corp., Clean Water and Drinking Water, 4.00%, 6/15/46(1) | | | 15,000 | | | | 15,693,600 | |
| | | | | | | | | |
| | | $ | 19,373,102 | |
| | | | | | | | | |
|
Education — 29.7% | |
Geneva Development Corp., (Hobart and William Smith Colleges), 5.00%, 9/1/30 | | $ | 200 | | | $ | 224,632 | |
Geneva Development Corp., (Hobart and William Smith Colleges), 5.00%, 9/1/33 | | | 105 | | | | 116,397 | |
Geneva Development Corp., (Hobart and William Smith Colleges), 5.00%, 9/1/34 | | | 200 | | | | 220,972 | |
Geneva Development Corp., (Hobart and William Smith Colleges), Series 2012, 5.00%, 9/1/32 | | | 1,330 | | | | 1,484,586 | |
Geneva Development Corp., (Hobart and William Smith Colleges), Series 2014, 5.00%, 9/1/32 | | | 200 | | | | 222,568 | |
Hempstead Local Development Corp., (Adelphi University), 5.00%, 6/1/21 | | | 950 | | | | 1,066,802 | |
Hempstead Local Development Corp., (Adelphi University), 5.00%, 6/1/31 | | | 800 | | | | 881,400 | |
Hempstead Local Development Corp., (Adelphi University), 5.00%, 6/1/32 | | | 300 | | | | 330,525 | |
New York City Cultural Resource Trust, (The Juilliard School), 5.00%, 1/1/39 | | | 240 | | | | 255,096 | |
New York City Cultural Resource Trust, (The Juilliard School), 5.00%, 1/1/39(1) | | | 10,000 | | | | 10,629,000 | |
New York Dormitory Authority, (Columbia University), 5.00%, 10/1/41(1) | | | 10,000 | | | | 11,183,600 | |
New York Dormitory Authority, (Cornell University), 5.00%, 7/1/37(1) | | | 5,700 | | | | 6,315,087 | |
New York Dormitory Authority, (New York University), 5.00%, 7/1/39(1) | | | 10,000 | | | | 10,773,700 | |
New York Dormitory Authority, (Rochester Institute of Technology), 5.00%, 7/1/40 | | | 2,000 | | | | 2,195,800 | |
New York Dormitory Authority, (Rockefeller University), 5.00%, 7/1/40 | | | 500 | | | | 540,885 | |
New York Dormitory Authority, (Rockefeller University), 5.00%, 7/1/40(1) | | | 2,700 | | | | 2,920,779 | |
New York Dormitory Authority, (Skidmore College), 5.00%, 7/1/26 | | | 1,175 | | | | 1,322,239 | |
New York Dormitory Authority, (Skidmore College), 5.25%, 7/1/30 | | | 250 | | | | 281,690 | |
New York Dormitory Authority, (The New School), 5.00%, 7/1/46 | | | 1,660 | | | | 1,842,368 | |
| | | | | | | | |
| Security | | Principal Amount (000’s omitted) | | | Value | |
| | | | | | | | |
| | |
Education (continued) | | | | | | | | |
New York Dormitory Authority, (The New School), Prerefunded to 7/1/20, 5.50%, 7/1/40 | | $ | 5,250 | | | $ | 5,940,375 | |
Onondaga County Cultural Resources Trust, (Syracuse University), 5.00%, 12/1/38 | | | 3,305 | | | | 3,733,526 | |
| | | | | | | | | |
| | | $ | 62,482,027 | |
| | | | | | | | | |
|
Electric Utilities — 1.6% | |
Utility Debt Securitization Authority, 5.00%, 12/15/33 | | $ | 2,895 | | | $ | 3,333,361 | |
| | | | | | | | | |
| | | $ | 3,333,361 | |
| | | | | | | | | |
|
Escrowed / Prerefunded — 4.0% | |
New York Dormitory Authority, (North Shore-Long Island Jewish Obligated Group), Prerefunded to 5/1/17, 5.00%, 5/1/26 | | $ | 2,055 | | | $ | 2,062,501 | |
Triborough Bridge and Tunnel Authority, Prerefunded to 11/15/18, 5.00%, 11/15/38(1) | | | 5,955 | | | | 6,340,533 | |
| | | | | | | | | |
| | | $ | 8,403,034 | |
| | | | | | | | | |
|
General Obligations — 11.4% | |
Long Beach City School District, 4.50%, 5/1/26 | | $ | 4,715 | | | $ | 5,157,031 | |
New York, 5.00%, 2/15/34(1) | | | 7,250 | | | | 8,154,075 | |
New York City, 5.00%, 8/1/34(1) | | | 8,650 | | | | 9,725,714 | |
Peekskill, 5.00%, 6/1/35 | | | 465 | | | | 484,642 | |
Peekskill, 5.00%, 6/1/36 | | | 490 | | | | 510,697 | |
| | | | | | | | | |
| | | $ | 24,032,159 | |
| | | | | | | | | |
|
Hospital — 9.5% | |
New York Dormitory Authority, (Highland Hospital of Rochester), 5.00%, 7/1/26 | | $ | 620 | | | $ | 672,117 | |
New York Dormitory Authority, (Highland Hospital of Rochester), 5.20%, 7/1/32 | | | 820 | | | | 883,443 | |
New York Dormitory Authority, (Memorial Sloan-Kettering Cancer Center), 4.375%, 7/1/34(1) | | | 9,325 | | | | 9,785,002 | |
New York Dormitory Authority, (North Shore-Long Island Jewish Obligated Group), 5.00%, 5/1/20 | | | 1,065 | | | | 1,179,733 | |
Suffolk County Economic Development Corp., (Catholic Health Services of Long Island Obligated Group), 5.00%, 7/1/28 | | | 5,890 | | | | 6,344,296 | |
Suffolk County Economic Development Corp., (Catholic Health Services of Long Island Obligated Group), Prerefunded to 7/1/21, 5.00%, 7/1/28 | | | 1,010 | | | | 1,157,248 | |
| | | | | | | | | |
| | | $ | 20,021,839 | |
| | | | | | | | | |
|
Housing — 5.1% | |
New York City Housing Development Corp., 3.80%, 11/1/37(2) | | $ | 885 | | | $ | 886,283 | |
New York City Housing Development Corp., 4.05%, 11/1/41 | | | 2,030 | | | | 2,072,792 | |
| | | | |
| | 16 | | See Notes to Financial Statements. |
Eaton Vance
New York Municipal Bond Fund
March 31, 2017
Portfolio of Investments (Unaudited) — continued
| | | | | | | | |
| Security | | Principal Amount (000’s omitted) | | | Value | |
| | | | | | | | |
|
Housing (continued) | |
New York City Housing Development Corp., 4.95%, 11/1/39 | | $ | 2,500 | | | $ | 2,564,550 | |
New York Housing Finance Agency, (FHLMC), (FNMA), (GNMA), 3.20%, 11/1/46 | | | 3,500 | | | | 3,100,265 | |
New York Housing Finance Agency, (FNMA), 3.95%, 11/1/37 | | | 1,000 | | | | 1,018,340 | |
New York Mortgage Agency, 3.55%, 10/1/33 | | | 995 | | | | 999,249 | |
| | | | | | | | | |
| | | $ | 10,641,479 | |
| | | | | | | | | |
|
Industrial Development Revenue — 1.1% | |
New York Liberty Development Corp., (Goldman Sachs Group, Inc.), 5.25%, 10/1/35 | | $ | 490 | | | $ | 590,357 | |
New York Liberty Development Corp., (Goldman Sachs Group, Inc.), 5.50%, 10/1/37 | | | 1,440 | | | | 1,793,506 | |
| | | | | | | | | |
| | | $ | 2,383,863 | |
| | | | | | | | | |
|
Insured – Education — 9.0% | |
New York Dormitory Authority, (City University), (AMBAC), 5.50%, 7/1/35 | | $ | 925 | | | $ | 1,174,352 | |
New York Dormitory Authority, (Educational Housing Services CUNY Student Housing), (AMBAC), 5.25%, 7/1/23 | | | 1,750 | | | | 2,066,785 | |
New York Dormitory Authority, (Pratt Institute), (AGC), Prerefunded to 7/1/19, 5.00%, 7/1/34 | | | 1,555 | | | | 1,689,741 | |
New York Dormitory Authority, (Pratt Institute), (AGC), Prerefunded to 7/1/19, 5.125%, 7/1/39 | | | 2,405 | | | | 2,620,079 | |
New York Dormitory Authority, (St. John’s University), (NPFG), Prerefunded to 7/1/17, 5.25%, 7/1/37 | | | 3,750 | | | | 3,792,975 | |
Oneida County Industrial Development Agency, (Hamilton College), (NPFG), 0.00%, 7/1/34 | | | 5,555 | | | | 2,530,247 | |
Oneida County Industrial Development Agency, (Hamilton College), (NPFG), 0.00%, 7/1/36 | | | 8,455 | | | | 3,506,880 | |
Oneida County Industrial Development Agency, (Hamilton College), (NPFG), 0.00%, 7/1/37 | | | 4,000 | | | | 1,584,440 | |
| | | | | | | | | |
| | | $ | 18,965,499 | |
| | | | | | | | | |
|
Insured – Electric Utilities — 6.1% | |
Long Island Power Authority, Electric System Revenue, (BHAC), Prerefunded to 4/1/19, 5.75%, 4/1/33 | | $ | 5,000 | | | $ | 5,461,300 | |
New York Power Authority, (BHAC), (NPFG), 4.50%, 11/15/47(1) | | | 7,210 | | | | 7,349,802 | |
| | | | | | | | | |
| | | $ | 12,811,102 | |
| | | | | | | | | |
|
Insured – Escrowed / Prerefunded — 4.1% | |
Eastchester, Union Free School District, (AGM), Prerefunded to 6/15/18, 4.00%, 6/15/23 | | $ | 175 | | | $ | 181,396 | |
Freeport, (AGC), Prerefunded to 10/15/18, 5.00%, 10/15/20 | | | 185 | | | | 196,472 | |
| | | | | | | | |
| Security | | Principal Amount (000’s omitted) | | | Value | |
| | | | | | | | |
|
Insured – Escrowed / Prerefunded (continued) | |
Freeport, (AGC), Prerefunded to 10/15/18, 5.00%, 10/15/21 | | $ | 195 | | | $ | 207,092 | |
Nassau County Sewer and Storm Water Finance Authority, (BHAC), Prerefunded to 11/1/18, 5.125%, 11/1/23 | | | 300 | | | | 319,632 | |
Nassau County Sewer and Storm Water Finance Authority, (BHAC), Prerefunded to 11/1/18, 5.375%, 11/1/28 | | | 3,835 | | | | 4,100,996 | |
Wantagh Union Free School District, (AGC), Prerefunded to 11/15/17, 4.50%, 11/15/19 | | | 785 | | | | 803,110 | |
Wantagh Union Free School District, (AGC), Prerefunded to 11/15/17, 4.50%, 11/15/20 | | | 825 | | | | 844,033 | |
Wantagh Union Free School District, (AGC), Prerefunded to 11/15/17, 4.75%, 11/15/22 | | | 905 | | | | 927,453 | |
Wantagh Union Free School District, (AGC), Prerefunded to 11/15/17, 4.75%, 11/15/23 | | | 950 | | | | 973,569 | |
| | | | | | | | | |
| | | $ | 8,553,753 | |
| | | | | | | | | |
|
Insured – General Obligations — 6.5% | |
Brentwood Union Free School District, (AGC), 4.75%, 11/15/23 | | $ | 2,290 | | | $ | 2,502,329 | |
Brentwood Union Free School District, (AGC), 5.00%, 11/15/24 | | | 2,390 | | | | 2,626,992 | |
East Northport Fire District, (AGC), 4.50%, 11/1/20 | | | 200 | | | | 211,226 | |
East Northport Fire District, (AGC), 4.50%, 11/1/21 | | | 200 | | | | 210,868 | |
East Northport Fire District, (AGC), 4.50%, 11/1/22 | | | 200 | | | | 210,474 | |
East Northport Fire District, (AGC), 4.50%, 11/1/23 | | | 200 | | | | 210,108 | |
Hoosic Valley Central School District, (AGC), 4.00%, 6/15/23 | | | 1,110 | | | | 1,173,969 | |
Longwood Central School District, Suffolk County, (AGC), 4.15%, 6/1/23 | | | 820 | | | | 847,749 | |
Longwood Central School District, Suffolk County, (AGC), 4.25%, 6/1/24 | | | 860 | | | | 890,100 | |
Oyster Bay, (AGM), 4.00%, 8/1/28 | | | 4,585 | | | | 4,809,069 | |
| | | | | | | | | |
| | | $ | 13,692,884 | |
| | | | | | | | | |
|
Insured – Hospital — 2.1% | |
New York Dormitory Authority, (Hudson Valley Hospital Center), (AGM), (BHAC), 5.00%, 8/15/36 | | $ | 4,355 | | | $ | 4,416,101 | |
| | | | | | | | | |
| | | $ | 4,416,101 | |
| | | | | | | | | |
|
Insured – Lease Revenue / Certificates of Participation — 2.5% | |
Ulster County Resource Recovery Agency, Solid Waste System, (AMBAC), 0.00%, 3/1/21 | | $ | 1,490 | | | $ | 1,388,218 | |
Ulster County Resource Recovery Agency, Solid Waste System, (AMBAC), 0.00%, 3/1/23 | | | 1,090 | | | | 957,761 | |
Ulster County Resource Recovery Agency, Solid Waste System, (AMBAC), 0.00%, 3/1/25 | | | 3,635 | | | | 3,000,039 | |
| | | | | | | | | |
| | | $ | 5,346,018 | |
| | | | | | | | | |
| | | | |
| | 17 | | See Notes to Financial Statements. |
Eaton Vance
New York Municipal Bond Fund
March 31, 2017
Portfolio of Investments (Unaudited) — continued
| | | | | | | | |
| Security | | Principal Amount (000’s omitted) | | | Value | |
| | | | | | | | |
|
Insured – Other Revenue — 2.0% | |
New York City Transitional Finance Authority, (BHAC), 5.50%, 7/15/38 | | $ | 4,050 | | | $ | 4,276,395 | |
| | | | | | | | | |
| | | $ | 4,276,395 | |
| | | | | | | | | |
|
Insured – Special Tax Revenue — 2.2% | |
New York Thruway Authority, Miscellaneous Tax Revenue, (AMBAC), 5.50%, 4/1/20 | | $ | 2,175 | | | $ | 2,447,375 | |
Puerto Rico Infrastructure Financing Authority, (AMBAC), 0.00%, 7/1/36 | | | 3,000 | | | | 930,630 | |
Puerto Rico Sales Tax Financing Corp., (NPFG), 0.00%, 8/1/45 | | | 6,705 | | | | 1,285,282 | |
| | | | | | | | | |
| | | $ | 4,663,287 | |
| | | | | | | | | |
|
Other Revenue — 12.6% | |
Battery Park City Authority, 5.00%, 11/1/34 | | $ | 4,925 | | | $ | 5,391,201 | |
Brooklyn Arena Local Development Corp., (Barclays Center), 0.00%, 7/15/31 | | | 4,900 | | | | 2,753,359 | |
Brooklyn Arena Local Development Corp., (Barclays Center), 5.00%, 7/15/42 | | | 1,000 | | | | 1,088,320 | |
New York City Transitional Finance Authority, (Building Aid), 5.00%, 7/15/32(1) | | | 10,000 | | | | 11,513,100 | |
New York City Trust for Cultural Resources, (Museum of Modern Art), 4.00%, 4/1/31 | | | 875 | | | | 958,991 | |
New York Liberty Development Corp., (7 World Trade Center), 5.00%, 9/15/32 | | | 4,110 | | | | 4,678,536 | |
| | | | | | | | | |
| | | $ | 26,383,507 | |
| | | | | | | | | |
|
Special Tax Revenue — 26.0% | |
Metropolitan Transportation Authority, Dedicated Tax Fund,
5.00%, 11/15/31(1) | | $ | 10,000 | | | $ | 11,524,400 | |
New York City Transitional Finance Authority, Future Tax Revenue, 3.00%, 2/1/39(1) | | | 3,250 | | | | 2,918,955 | |
New York City Transitional Finance Authority, Future Tax Revenue, 5.00%, 2/1/35(1) | | | 10,000 | | | | 11,067,300 | |
New York City Transitional Finance Authority, Future Tax Revenue, 5.50%, 11/1/35(1) | | | 565 | | | | 642,484 | |
New York City Transitional Finance Authority, Future Tax Revenue, Prerefunded to 11/1/20, 5.50%, 11/1/35(1) | | | 435 | | | | 498,648 | |
New York Dormitory Authority, Personal Income Tax Revenue,
5.00%, 6/15/31(1) | | | 6,500 | | | | 7,474,415 | |
New York Dormitory Authority, Sales Tax Revenue, 5.00%, 3/15/34 | | | 6,600 | | | | 7,445,328 | |
New York Thruway Authority, Miscellaneous Tax Revenue, 5.00%, 4/1/26 | | | 2,370 | | | | 2,618,874 | |
Sales Tax Asset Receivables Corp., 5.00%, 10/15/30(1) | | | 8,900 | | | | 10,489,896 | |
| | | | | | | | | |
| | | $ | 54,680,300 | |
| | | | | | | | | |
| | | | | | | | |
| Security | | Principal Amount (000’s omitted) | | | Value | |
| | | | | | | | |
|
Transportation — 15.8% | |
Metropolitan Transportation Authority, 5.25%, 11/15/38 | | $ | 3,430 | | | $ | 3,895,623 | |
Nassau County Bridge Authority, 5.00%, 10/1/35 | | | 1,565 | | | | 1,694,785 | |
Nassau County Bridge Authority, 5.00%, 10/1/40 | | | 300 | | | | 323,835 | |
New York Thruway Authority, 5.00%, 1/1/37 | | | 7,280 | | | | 8,072,865 | |
Port Authority of New York and New Jersey, 5.00%, 10/15/35(1) | | | 8,000 | | | | 9,171,360 | |
Port Authority of New York and New Jersey, 5.00%, 10/15/41(1) | | | 5,000 | | | | 5,663,750 | |
Triborough Bridge and Tunnel Authority, 5.00%, 11/15/38(1) | | | 4,045 | | | | 4,286,527 | |
| | | | | | | | | |
| | | $ | 33,108,745 | |
| | | | | | | | | |
|
Water and Sewer — 5.3% | |
Albany, Municipal Water Finance Authority, 5.00%, 12/1/26 | | $ | 755 | | | $ | 853,822 | |
Albany, Municipal Water Finance Authority, 5.00%, 12/1/29 | | | 500 | | | | 566,635 | |
New York City Municipal Water Finance Authority, (Water and Sewer System),
5.00%, 6/15/44(1) | | | 8,750 | | | | 9,676,450 | |
| | | | | | | | | |
| | | $ | 11,096,907 | |
| | | | | | | | | |
|
Senior Living / Life Care — 0.9% | |
Brookhaven Local Development Corp., (Jeffersons Ferry), 5.00%, 11/1/24 | | $ | 205 | | | $ | 231,724 | |
Brookhaven Local Development Corp., (Jeffersons Ferry), 5.25%, 11/1/25 | | | 325 | | | | 374,559 | |
Brookhaven Local Development Corp., (Jeffersons Ferry), 5.25%, 11/1/26 | | | 360 | | | | 415,447 | |
Brookhaven Local Development Corp., (Jeffersons Ferry), 5.25%, 11/1/36 | | | 845 | | | | 918,549 | |
| | | | | | | | | |
| | | $ | 1,940,279 | |
| | | | | | | | | |
| |
Total Tax-Exempt Investments — 166.7%
(identified cost $333,421,368) | | | $ | 350,605,641 | |
| | | | | | | | | |
| |
Other Assets, Less Liabilities — (66.7)% | | | $ | (140,311,032 | ) |
| | | | | | | | | |
| | |
Net Assets — 100.0% | | | | | | $ | 210,294,609 | |
| | | | | | | | | |
The percentage shown for each investment category in the Portfolio of Investments is based on net assets.
The Fund invests primarily in debt securities issued by New York municipalities. The ability of the issuers of the debt securities to meet their obligations may be affected by economic developments in a specific industry or municipality. In order to reduce the risk associated with such economic developments, at March 31, 2017, 20.7% of total investments are backed by bond insurance of various financial institutions and financial guaranty assurance agencies. The aggregate percentage insured by an individual financial institution or financial guaranty assurance agency ranged from 2.7% to 7.4% of total investments.
| | | | |
| | 18 | | See Notes to Financial Statements. |
Eaton Vance
New York Municipal Bond Fund
March 31, 2017
Portfolio of Investments (Unaudited) — continued
| (1) | Security represents the municipal bond held by a trust that issues residual interest bonds (see Note 1G). |
| | | | | | | | | | | | | | | | | | | | | | | | |
| Futures Contracts | |
| Description | | Contracts | | | Position | | | Expiration
Month/Year | | | Aggregate Cost | | | Value | | | Net Unrealized
Appreciation | |
| | | | | | |
Interest Rate Futures | | | | | | | | | | | | | | | | | | | | | | | | |
| U.S. Long Treasury Bond | | | 50 | | | | Short | | | | Jun-17 | | | $ | (7,597,562 | ) | | $ | (7,542,187 | ) | | $ | 55,375 | |
| | | | | | |
| | | | | | | | | | | | | | | | | | | | | | | $ | 55,375 | |
Abbreviations:
| | | | |
| AGC | | – | | Assured Guaranty Corp. |
| AGM | | – | | Assured Guaranty Municipal Corp. |
| AMBAC | | – | | AMBAC Financial Group, Inc. |
| BHAC | | – | | Berkshire Hathaway Assurance Corp. |
| | | | |
| FHLMC | | – | | Federal Home Loan Mortgage Corp. |
| FNMA | | – | | Federal National Mortgage Association |
| GNMA | | – | | Government National Mortgage Association |
| NPFG | | – | | National Public Finance Guaranty Corp. |
| | | | |
| | 19 | | See Notes to Financial Statements. |
Eaton Vance
Municipal Bond Funds
March 31, 2017
Statements of Assets and Liabilities (Unaudited)
| | | | | | | | | | | | |
| | | March 31, 2017 | |
| Assets | | Municipal Fund | | | California Fund | | | New York Fund | |
Investments — | | | | | | | | | | | | |
Identified cost | | $ | 1,427,725,413 | | | $ | 433,866,180 | | | $ | 333,421,368 | |
Unrealized appreciation | | | 92,837,937 | | | | 22,677,857 | | | | 17,184,273 | |
Investments, at value | | $ | 1,520,563,350 | | | $ | 456,544,037 | | | $ | 350,605,641 | |
Restricted cash* | | $ | 1,007,600 | | | $ | 492,600 | | | $ | 220,000 | |
Interest receivable | | | 19,246,327 | | | | 4,820,071 | | | | 4,508,143 | |
Receivable for investments sold | | | 81,525 | | | | 9,997,074 | | | | — | |
Total assets | | $ | 1,540,898,802 | | | $ | 471,853,782 | | | $ | 355,333,784 | |
| | | |
| Liabilities | | | | | | | | | | | | |
Payable for floating rate notes issued (net of unamortized deferred debt issuance costs of $283,004, $88,384 and $19,228, respectively) | | $ | 615,056,996 | | | $ | 188,791,616 | | | $ | 143,070,772 | |
Due to broker for floating rate notes redeemed | | | — | | | | 9,800,000 | | | | — | |
Payable for when-issued securities | | | — | | | | 8,592,874 | | | | 885,000 | |
Payable for variation margin on open financial futures contracts | | | 71,563 | | | | 46,563 | | | | 15,625 | |
Due to custodian | | | 1,270,264 | | | | 1,001,558 | | | | 241,843 | |
Payable to affiliate: | | | | | | | | | | | | |
Investment adviser fee | | | 779,841 | | | | 232,648 | | | | 194,139 | |
Interest expense and fees payable | | | 2,514,683 | | | | 628,431 | | | | 548,789 | |
Accrued expenses | | | 196,567 | | | | 94,852 | | | | 83,007 | |
Total liabilities | | $ | 619,889,914 | | | $ | 209,188,542 | | | $ | 145,039,175 | |
Net Assets | | $ | 921,008,888 | | | $ | 262,665,240 | | | $ | 210,294,609 | |
| | | |
| Sources of Net Assets | | | | | | | | | | | | |
Common shares, $0.01 par value, unlimited number of shares authorized | | $ | 681,683 | | | $ | 213,943 | | | $ | 156,618 | |
Additional paid-in capital | | | 951,295,647 | | | | 302,268,737 | | | | 221,068,839 | |
Accumulated net realized loss | | | (123,930,336 | ) | | | (63,902,993 | ) | | | (29,227,837 | ) |
Accumulated undistributed (distributions in excess of) net investment income | | | (129,659 | ) | | | 1,353,986 | | | | 1,057,341 | |
Net unrealized appreciation | | | 93,091,553 | | | | 22,731,567 | | | | 17,239,648 | |
Net Assets | | $ | 921,008,888 | | | $ | 262,665,240 | | | $ | 210,294,609 | |
| | | |
| Common Shares Outstanding | | | 68,168,250 | | | | 21,394,348 | | | | 15,661,780 | |
| | | |
| Net Asset Value | | | | | | | | | | | | |
Net assets ÷ common shares issued and outstanding | | $ | 13.51 | | | $ | 12.28 | | | $ | 13.43 | |
| * | Represents restricted cash on deposit at the broker for open financial futures contracts. |
| | | | |
| | 20 | | See Notes to Financial Statements. |
Eaton Vance
Municipal Bond Funds
March 31, 2017
Statements of Operations (Unaudited)
| | | | | | | | | | | | |
| | | Six Months Ended March 31, 2017 | |
| Investment Income | | Municipal Fund | | | California Fund | | | New York Fund | |
Interest | | $ | 31,161,258 | | | $ | 9,130,576 | | | $ | 7,004,149 | |
Total investment income | | $ | 31,161,258 | | | $ | 9,130,576 | | | $ | 7,004,149 | |
| | | |
| Expenses | | | | | | | | | | | | |
Investment adviser fee | | $ | 4,628,050 | | | $ | 1,377,706 | | | $ | 1,150,368 | |
Trustees’ fees and expenses | | | 45,792 | | | | 13,814 | | | | 10,698 | |
Custodian fee | | | 161,044 | | | | 51,307 | | | | 54,227 | |
Transfer and dividend disbursing agent fees | | | 11,644 | | | | 9,524 | | | | 9,639 | |
Legal and accounting services | | | 67,825 | | | | 44,947 | | | | 43,750 | |
Printing and postage | | | 52,245 | | | | 12,362 | | | | 9,661 | |
Interest expense and fees | | | 4,049,960 | | | | 1,280,983 | | | | 933,887 | |
Miscellaneous | | | 37,874 | | | | 17,717 | | | | 16,186 | |
Total expenses | | $ | 9,054,434 | | | $ | 2,808,360 | | | $ | 2,228,416 | |
| | | |
Net investment income | | $ | 22,106,824 | | | $ | 6,322,216 | | | $ | 4,775,733 | |
| | | |
| Realized and Unrealized Gain (Loss) | | | | | | | | | | | | |
Net realized gain (loss) — | | | | | | | | | | | | |
Investment transactions | | $ | (1,111,254 | ) | | $ | (1,432,156 | ) | | $ | (110,658 | ) |
Financial futures contracts | | | 3,751,006 | | | | 1,876,857 | | | | 818,997 | |
Net realized gain | | $ | 2,639,752 | | | $ | 444,701 | | | $ | 708,339 | |
Change in unrealized appreciation (depreciation) — | | | | | | | | | | | | |
Investments | | $ | (68,122,286 | ) | | $ | (16,948,519 | ) | | $ | (14,073,551 | ) |
Financial futures contracts | | | (394,658 | ) | | | (182,242 | ) | | | (86,170 | ) |
Net change in unrealized appreciation (depreciation) | | $ | (68,516,944 | ) | | $ | (17,130,761 | ) | | $ | (14,159,721 | ) |
| | | |
Net realized and unrealized loss | | $ | (65,877,192 | ) | | $ | (16,686,060 | ) | | $ | (13,451,382 | ) |
| | | |
Net decrease in net assets from operations | | $ | (43,770,368 | ) | | $ | (10,363,844 | ) | | $ | (8,675,649 | ) |
| | | | |
| | 21 | | See Notes to Financial Statements. |
Eaton Vance
Municipal Bond Funds
March 31, 2017
Statements of Changes in Net Assets
| | | | | | | | | | | | |
| | | Six Months Ended March 31, 2017 (Unaudited) | |
| Increase (Decrease) in Net Assets | | Municipal Fund | | | California Fund | | | New York Fund | |
From operations — | | | | | | | | | | | | |
Net investment income | | $ | 22,106,824 | | | $ | 6,322,216 | | | $ | 4,775,733 | |
Net realized gain from investment transactions and financial futures contracts | | | 2,639,752 | | | | 444,701 | | | | 708,339 | |
Net change in unrealized appreciation (depreciation) from investments and financial futures contracts | | | (68,516,944 | ) | | | (17,130,761 | ) | | | (14,159,721 | ) |
Net decrease in net assets from operations | | $ | (43,770,368 | ) | | $ | (10,363,844 | ) | | $ | (8,675,649 | ) |
Distributions to common shareholders — | | | | | | | | | | | | |
From net investment income | | $ | (22,236,483 | ) | | $ | (6,251,429 | ) | | $ | (4,839,490 | ) |
Total distributions to common shareholders | | $ | (22,236,483 | ) | | $ | (6,251,429 | ) | | $ | (4,839,490 | ) |
| | | |
Net decrease in net assets | | $ | (66,006,851 | ) | | $ | (16,615,273 | ) | | $ | (13,515,139 | ) |
| | | |
| Net Assets | | | | | | | | | | | | |
At beginning of period | | $ | 987,015,739 | | | $ | 279,280,513 | | | $ | 223,809,748 | |
At end of period | | $ | 921,008,888 | | | $ | 262,665,240 | | | $ | 210,294,609 | |
| | | |
Accumulated undistributed (distributions in excess of) net investment income
included in net assets | | | | | | | | | | | | |
At end of period | | $ | (129,659 | ) | | $ | 1,353,986 | | | $ | 1,057,341 | |
| | | | |
| | 22 | | See Notes to Financial Statements. |
Eaton Vance
Municipal Bond Funds
March 31, 2017
Statements of Changes in Net Assets — continued
| | | | | | | | | | | | |
| | | Year Ended September 30, 2016 | |
| Increase (Decrease) in Net Assets | | Municipal Fund | | | California Fund | | | New York Fund | |
From operations — | | | | | | | | | | | | |
Net investment income | | $ | 48,108,394 | | | $ | 13,618,575 | | | $ | 10,421,302 | |
Net realized gain (loss) from investment transactions, extinguishment of debt and financial futures contracts | | | 13,291,690 | | | | (136,393 | ) | | | 1,580,381 | |
Net change in unrealized appreciation (depreciation) from investments and financial futures contracts | | | 29,683,765 | | | | 8,343,077 | | | | 4,723,091 | |
Net increase in net assets from operations | | $ | 91,083,849 | | | $ | 21,825,259 | | | $ | 16,724,774 | |
Distributions to common shareholders — | | | | | | | | | | | | |
From net investment income | | $ | (49,547,411 | ) | | $ | (14,631,864 | ) | | $ | (11,243,021 | ) |
Total distributions to common shareholders | | $ | (49,547,411 | ) | | $ | (14,631,864 | ) | | $ | (11,243,021 | ) |
Capital share transactions — | | | | | | | | | | | | |
Reinvestment of distributions to common shareholders | | $ | — | | | $ | 41,840 | | | $ | 46,018 | |
Net increase in net assets from capital share transactions | | $ | — | | | $ | 41,840 | | | $ | 46,018 | |
| | | |
Net increase in net assets | | $ | 41,536,438 | | | $ | 7,235,235 | | | $ | 5,527,771 | |
| | | |
| Net Assets | | | | | | | | | | | | |
At beginning of year | | $ | 945,479,301 | | | $ | 272,045,278 | | | $ | 218,281,977 | |
At end of year | | $ | 987,015,739 | | | $ | 279,280,513 | | | $ | 223,809,748 | |
| | | |
Accumulated undistributed net investment income
included in net assets | | | | | | | | | | | | |
At end of year | | $ | — | | | $ | 1,283,199 | | | $ | 1,121,098 | |
| | | | |
| | 23 | | See Notes to Financial Statements. |
Eaton Vance
Municipal Bond Funds
March 31, 2017
Statements of Cash Flows (Unaudited)
| | | | | | | | | | | | |
| | | Six Months Ended March 31, 2017 | |
| Cash Flows From Operating Activities | | Municipal Fund | | | California Fund | | | New York Fund | |
Net decrease in net assets from operations | | $ | (43,770,368 | ) | | $ | (10,363,844 | ) | | $ | (8,675,649 | ) |
Adjustments to reconcile net decrease in net assets from operations to net cash provided by (used in) operating activities: | | | | | | | | | | | | |
Investments purchased | | | (73,862,678 | ) | | | (35,097,360 | ) | | | (8,764,437 | ) |
Investments sold | | | 72,773,528 | | | | 26,515,283 | | | | 8,267,659 | |
Net amortization/accretion of premium (discount) | | | (314,842 | ) | | | 319,848 | | | | 389,216 | |
Amortization of deferred debt issuance costs | | | 13,734 | | | | 4,128 | | | | 453 | |
Increase in restricted cash | | | (79,600 | ) | | | (30,600 | ) | | | (15,000 | ) |
Decrease (increase) in interest receivable | | | 28,106 | | | | 77,557 | | | | (83,066 | ) |
Decrease in receivable for variation margin on open financial futures contracts | | | 336,344 | | | | 158,219 | | | | 73,438 | |
Decrease in receivable from the transfer agent | | | — | | | | 9,905 | | | | 20,821 | |
Increase in payable for variation margin on open financial futures contracts | | | 71,563 | | | | 46,563 | | | | 15,625 | |
Decrease in payable to affiliate for investment adviser fee | | | (11,773 | ) | | | (1,108 | ) | | | (1,817 | ) |
Increase (decrease) in interest expense and fees payable | | | 250,534 | | | | (12,525 | ) | | | 83,360 | |
Decrease in accrued expenses | | | (181,192 | ) | | | (88,702 | ) | | | (73,141 | ) |
Net change in unrealized (appreciation) depreciation from investments | | | 68,122,286 | | | | 16,948,519 | | | | 14,073,551 | |
Net realized loss from investments | | | 1,111,254 | | | | 1,432,156 | | | | 110,658 | |
Net cash provided by (used in) operating activities | | $ | 24,486,896 | | | $ | (81,961 | ) | | $ | 5,421,671 | |
| | | |
| Cash Flows From Financing Activities | | | | | | | | | | | | |
Distributions paid to common shareholders, net of reinvestments | | $ | (22,236,483 | ) | | $ | (6,251,429 | ) | | $ | (4,839,490 | ) |
Proceeds from secured borrowings | | | 28,340,000 | | | | 10,800,000 | | | | — | |
Repayment of secured borrowings | | | (29,440,000 | ) | | | (15,800,000 | ) | | | — | |
Increase (decrease) in due to custodian | | | (1,150,413 | ) | | | 1,001,558 | | | | (582,181 | ) |
Net cash used in financing activities | | $ | (24,486,896 | ) | | $ | (10,249,871 | ) | | $ | (5,421,671 | ) |
| | | |
Net decrease in cash | | $ | — | | | $ | (10,331,832 | ) | | $ | — | |
| | | |
Cash at beginning of period | | $ | — | | | $ | 10,331,832 | | | $ | — | |
| | | |
Cash at end of period | | $ | — | | | $ | — | | | $ | — | |
| | | |
| Supplemental disclosure of cash flow information: | | | | | | | | | | | | |
Cash paid for interest and fees | | $ | 3,785,692 | | | $ | 1,289,380 | | | $ | 850,074 | |
| | | | |
| | 24 | | See Notes to Financial Statements. |
Eaton Vance
Municipal Bond Funds
March 31, 2017
Financial Highlights
| | | | | | | | | | | | | | | | | | | | | | | | |
| | | Municipal Fund | |
| | | Six Months Ended
March 31, 2017
(Unaudited) | | | Year Ended September 30, | |
| | | | 2016 | | | 2015 | | | 2014 | | | 2013 | | | 2012 | |
Net asset value — Beginning of period | | $ | 14.480 | | | $ | 13.870 | | | $ | 13.940 | | | $ | 12.290 | | | $ | 14.100 | | | $ | 12.560 | |
| | | | | | |
| Income (Loss) From Operations | | | | | | | | | | | | | | | | | | | | | | | | |
Net investment income(1) | | $ | 0.324 | | | $ | 0.706 | | | $ | 0.760 | | | $ | 0.783 | | | $ | 0.768 | | | $ | 0.763 | |
Net realized and unrealized gain (loss) | | | (0.968 | ) | | | 0.631 | | | | (0.064 | ) | | | 1.633 | | | | (1.812 | ) | | | 1.584 | |
| | | | | | |
Total income (loss) from operations | | $ | (0.644 | ) | | $ | 1.337 | | | $ | 0.696 | | | $ | 2.416 | | | $ | (1.044 | ) | | $ | 2.347 | |
| | | | | | |
| Less Distributions | | | | | | | | | | | | | | | | | | | | | | | | |
From net investment income | | $ | (0.326 | ) | | $ | (0.727 | ) | | $ | (0.766 | ) | | $ | (0.766 | ) | | $ | (0.766 | ) | | $ | (0.807 | ) |
| | | | | | |
Total distributions | | $ | (0.326 | ) | | $ | (0.727 | ) | | $ | (0.766 | ) | | $ | (0.766 | ) | | $ | (0.766 | ) | | $ | (0.807 | ) |
| | | | | | |
Net asset value — End of period | | $ | 13.510 | | | $ | 14.480 | | | $ | 13.870 | | | $ | 13.940 | | | $ | 12.290 | | | $ | 14.100 | |
| | | | | | |
Market value — End of period | | $ | 12.550 | | | $ | 13.620 | | | $ | 12.510 | | | $ | 12.520 | | | $ | 11.560 | | | $ | 14.460 | |
| | | | | | |
Total Investment Return on Net Asset Value(2) | | | (4.25 | )%(3) | | | 10.19 | % | | | 5.69 | % | | | 21.00 | % | | | (7.59 | )% | | | 19.33 | % |
| | | | | | |
Total Investment Return on Market Value(2) | | | (5.43 | )%(3) | | | 14.91 | % | | | 6.14 | % | | | 15.44 | % | | | (15.17 | )% | | | 24.45 | % |
| | | | | | |
| Ratios/Supplemental Data | | | | | | | | | | | | | | | | | | | | | | | | |
Net assets, end of period (000’s omitted) | | $ | 921,009 | | | $ | 987,016 | | | $ | 945,479 | | | $ | 950,519 | | | $ | 837,447 | | | $ | 960,528 | |
Ratios (as a percentage of average daily net assets): | | | | | | | | | | | | | | | | | | | | | | | | |
Expenses excluding interest and fees(4) | | | 1.08 | %(5) | | | 1.05 | % | | | 1.05 | % | | | 1.12 | % | | | 1.15 | % | | | 1.30 | % |
Interest and fee expense(6) | | | 0.87 | %(5) | | | 0.53 | % | | | 0.38 | % | | | 0.43 | % | | | 0.47 | % | | | 0.48 | % |
Total expenses(4) | | | 1.95 | %(5) | | | 1.58 | % | | | 1.43 | % | | | 1.55 | % | | | 1.62 | % | | | 1.78 | % |
Net investment income | | | 4.77 | %(5) | | | 4.92 | % | | | 5.43 | % | | | 6.01 | % | | | 5.67 | % | | | 5.75 | % |
Portfolio Turnover | | | 5 | %(3) | | | 18 | % | | | 5 | % | | | 9 | % | | | 18 | % | | | 17 | % |
| (1) | Computed using average shares outstanding. |
| (2) | Returns are historical and are calculated by determining the percentage change in net asset value or market value with all distributions reinvested. Distributions are assumed to be reinvested at prices obtained under the Fund’s dividend reinvestment plan. |
| (4) | Excludes the effect of custody fee credits, if any, of less than 0.005%. Effective September 1, 2015, custody fee credits, which were earned on cash deposit balances, were discontinued by the custodian. |
| (6) | Interest and fee expense relates to the liability for floating rate notes issued in conjunction with residual interest bond transactions (see Note 1G). |
| | | | |
| | 25 | | See Notes to Financial Statements. |
Eaton Vance
Municipal Bond Funds
March 31, 2017
Financial Highlights — continued
| | | | | | | | | | | | | | | | | | | | | | | | |
| | | California Fund | |
| | | Six Months Ended
March 31, 2017
(Unaudited) | | | Year Ended September 30, | |
| | | | 2016 | | | 2015 | | | 2014 | | | 2013 | | | 2012 | |
Net asset value — Beginning of period | | $ | 13.050 | | | $ | 12.720 | | | $ | 12.900 | | | $ | 11.510 | | | $ | 12.980 | | | $ | 11.740 | |
| | | | | | |
| Income (Loss) From Operations | | | | | | | | | | | | | | | | | | | | | | | | |
Net investment income(1) | | $ | 0.296 | | | $ | 0.637 | | | $ | 0.688 | | | $ | 0.700 | | | $ | 0.698 | | | $ | 0.689 | |
Net realized and unrealized gain (loss) | | | (0.774 | ) | | | 0.377 | | | | (0.184 | ) | | | 1.326 | | | | (1.514 | ) | | | 1.282 | |
| | | | | | |
Total income (loss) from operations | | $ | (0.478 | ) | | $ | 1.014 | | | $ | 0.504 | | | $ | 2.026 | | | $ | (0.816 | ) | | $ | 1.971 | |
| | | | | | |
| Less Distributions | | | | | | | | | | | | | | | | | | | | | | | | |
From net investment income | | $ | (0.292 | ) | | $ | (0.684 | ) | | $ | (0.684 | ) | | $ | (0.657 | ) | | $ | (0.654 | ) | | $ | (0.731 | ) |
| | | | | | |
Total distributions | | $ | (0.292 | ) | | $ | (0.684 | ) | | $ | (0.684 | ) | | $ | (0.657 | ) | | $ | (0.654 | ) | | $ | (0.731 | ) |
| | | | | | |
Anti-dilutive effect of share repurchase program (see Note 5)(1) | | $ | — | | | $ | — | | | $ | 0.000 | (2) | | $ | 0.021 | | | $ | — | | | $ | — | |
| | | | | | |
Net asset value — End of period | | $ | 12.280 | | | $ | 13.050 | | | $ | 12.720 | | | $ | 12.900 | | | $ | 11.510 | | | $ | 12.980 | |
| | | | | | |
Market value — End of period | | $ | 11.360 | | | $ | 13.560 | | | $ | 11.630 | | | $ | 11.350 | | | $ | 10.330 | | | $ | 12.650 | |
| | | | | | |
Total Investment Return on Net Asset Value(3) | | | (3.50 | )%(4) | | | 8.22 | % | | | 4.46 | % | | | 18.96 | % | | | (6.18 | )% | | | 17.34 | % |
| | | | | | |
Total Investment Return on Market Value(3) | | | (14.08 | )%(4) | | | 22.99 | % | | | 8.55 | % | | | 16.62 | % | | | (13.60 | )% | | | 9.42 | % |
| | | | | | |
| Ratios/Supplemental Data | | | | | | | | | | | | | | | | | | | | | | | | |
Net assets, end of period (000’s omitted) | | $ | 262,665 | | | $ | 279,281 | | | $ | 272,045 | | | $ | 276,022 | | | $ | 250,407 | | | $ | 282,353 | |
Ratios (as a percentage of average daily net assets): | | | | | | | | | | | | | | | | | | | | | | | | |
Expenses excluding interest and fees(5) | | | 1.15 | %(6) | | | 1.13 | % | | | 1.11 | % | | | 1.16 | % | | | 1.22 | % | | | 1.25 | % |
Interest and fee expense(7) | | | 0.97 | %(6) | | | 0.58 | % | | | 0.40 | % | | | 0.42 | % | | | 0.46 | % | | | 0.48 | % |
Total expenses(5) | | | 2.12 | %(6) | | | 1.71 | % | | | 1.51 | % | | | 1.58 | % | | | 1.68 | % | | | 1.73 | % |
Net investment income | | | 4.78 | %(6) | | | 4.89 | % | | | 5.36 | % | | | 5.75 | % | | | 5.56 | % | | | 5.57 | % |
Portfolio Turnover | | | 8 | %(4) | | | 12 | % | | | 7 | % | | | 7 | % | | | 22 | % | | | 27 | % |
| (1) | Computed using average shares outstanding. |
| (2) | Amount is less than $0.0005. |
| (3) | Returns are historical and are calculated by determining the percentage change in net asset value or market value with all distributions reinvested. Distributions are assumed to be reinvested at prices obtained under the Fund’s dividend reinvestment plan. |
| (5) | Excludes the effect of custody fee credits, if any, of less than 0.005%. Effective September 1, 2015, custody fee credits, which were earned on cash deposit balances, were discontinued by the custodian. |
| (7) | Interest and fee expense relates to the liability for floating rate notes issued in conjunction with residual interest bond transactions (see Note 1G). |
| | | | |
| | 26 | | See Notes to Financial Statements. |
Eaton Vance
Municipal Bond Funds
March 31, 2017
Financial Highlights — continued
| | | | | | | | | | | | | | | | | | | | | | | | |
| | | New York Fund | |
| | | Six Months Ended
March 31, 2017
(Unaudited) | | | Year Ended September 30, | |
| | | | 2016 | | | 2015 | | | 2014 | | | 2013 | | | 2012 | |
Net asset value — Beginning of period | | $ | 14.290 | | | $ | 13.940 | | | $ | 14.040 | | | $ | 12.740 | | | $ | 14.460 | | | $ | 13.170 | |
| | | | | | |
| Income (Loss) From Operations | | | | | | | | | | | | | | | | | | | | | | | | |
Net investment income(1) | | $ | 0.305 | | | $ | 0.666 | | | $ | 0.716 | | | $ | 0.752 | | | $ | 0.735 | | | $ | 0.728 | |
Net realized and unrealized gain (loss) | | | (0.856 | ) | | | 0.402 | | | | (0.100 | ) | | | 1.219 | | | | (1.767 | ) | | | 1.308 | |
| | | | | | |
Total income (loss) from operations | | $ | (0.551 | ) | | $ | 1.068 | | | $ | 0.616 | | | $ | 1.971 | | | $ | (1.032 | ) | | $ | 2.036 | |
| | | | | | |
| Less Distributions | | | | | | | | | | | | | | | | | | | | | | | | |
From net investment income | | $ | (0.309 | ) | | $ | (0.718 | ) | | $ | (0.718 | ) | | $ | (0.690 | ) | | $ | (0.688 | ) | | $ | (0.746 | ) |
| | | | | | |
Total distributions | | $ | (0.309 | ) | | $ | (0.718 | ) | | $ | (0.718 | ) | | $ | (0.690 | ) | | $ | (0.688 | ) | | $ | (0.746 | ) |
| | | | | | |
Anti-dilutive effect of share repurchase program (see Note 5)(1) | | $ | — | | | $ | — | | | $ | 0.002 | | | $ | 0.019 | | | $ | — | | | $ | — | |
| | | | | | |
Net asset value — End of period | | $ | 13.430 | | | $ | 14.290 | | | $ | 13.940 | | | $ | 14.040 | | | $ | 12.740 | | | $ | 14.460 | |
| | | | | | |
Market value — End of period | | $ | 12.350 | | | $ | 14.320 | | | $ | 12.600 | | | $ | 12.330 | | | $ | 11.540 | | | $ | 14.660 | |
| | | | | | |
Total Investment Return on Net Asset Value(2) | | | (3.67 | )%(3) | | | 8.01 | % | | | 5.07 | % | | | 16.72 | % | | | (7.16 | )% | | | 15.87 | % |
| | | | | | |
Total Investment Return on Market Value(2) | | | (11.60 | )%(3) | | | 19.75 | % | | | 8.14 | % | | | 13.16 | % | | | (17.05 | )% | | | 15.03 | % |
| | | | | | |
| Ratios/Supplemental Data | | | | | | | | | | | | | | | | | | | | | | | | |
Net assets, end of period (000’s omitted) | | $ | 210,295 | | | $ | 223,810 | | | $ | 218,282 | | | $ | 220,190 | | | $ | 202,452 | | | $ | 229,792 | |
Ratios (as a percentage of average daily net assets): | | | | | | | | | | | | | | | | | | | | | | | | |
Expenses excluding interest and fees(4) | | | 1.23 | %(5) | | | 1.18 | % | | | 1.20 | % | | | 1.22 | % | | | 1.21 | % | | | 1.22 | % |
Interest and fee expense(6) | | | 0.88 | %(5) | | | 0.53 | % | | | 0.37 | % | | | 0.40 | % | | | 0.42 | % | | | 0.43 | % |
Total expenses(4) | | | 2.11 | %(5) | | | 1.71 | % | | | 1.57 | % | | | 1.62 | % | | | 1.63 | % | | | 1.65 | % |
Net investment income | | | 4.52 | %(5) | | | 4.66 | % | | | 5.11 | % | | | 5.65 | % | | | 5.29 | % | | | 5.29 | % |
Portfolio Turnover | | | 2 | %(3) | | | 11 | % | | | 5 | % | | | 7 | % | | | 12 | % | | | 17 | % |
| (1) | Computed using average shares outstanding. |
| (2) | Returns are historical and are calculated by determining the percentage change in net asset value or market value with all distributions reinvested. Distributions are assumed to be reinvested at prices obtained under the Fund’s dividend reinvestment plan. |
| (4) | Excludes the effect of custody fee credits, if any, of less than 0.005%. Effective September 1, 2015, custody fee credits, which were earned on cash deposit balances, were discontinued by the custodian. |
| (6) | Interest and fee expense relates to the liability for floating rate notes issued in conjunction with residual interest bond transactions (see Note 1G). |
| | | | |
| | 27 | | See Notes to Financial Statements. |
Eaton Vance
Municipal Bond Funds
March 31, 2017
Notes to Financial Statements (Unaudited)
1 Significant Accounting Policies
Eaton Vance Municipal Bond Fund, Eaton Vance California Municipal Bond Fund and Eaton Vance New York Municipal Bond Fund, (each individually referred to as the Fund, and collectively, the Funds), are Massachusetts business trusts registered under the Investment Company Act of 1940, as amended (the 1940 Act), as non-diversified, closed-end management investment companies. The Funds’ investment objective is to provide current income exempt from regular federal income tax, including alternative minimum tax, and, in state specific funds, taxes in its specified state.
The following is a summary of significant accounting policies of the Funds. The policies are in conformity with accounting principles generally accepted in the United States of America (U.S. GAAP). Each Fund is an investment company and follows accounting and reporting guidance in the Financial Accounting Standards Board (FASB) Accounting Standards Codification Topic 946.
A Investment Valuation — The following methodologies are used to determine the market value or fair value of investments.
Debt Obligations. Debt obligations are generally valued on the basis of valuations provided by third party pricing services, as derived from such services’ pricing models. Inputs to the models may include, but are not limited to, reported trades, executable bid and asked prices, broker/dealer quotations, prices or yields of securities with similar characteristics, interest rates, anticipated prepayments, benchmark curves or information pertaining to the issuer, as well as industry and economic events. The pricing services may use a matrix approach, which considers information regarding securities with similar characteristics to determine the valuation for a security. Short-term obligations purchased with a remaining maturity of sixty days or less for which a valuation from a third party pricing service is not readily available may be valued at amortized cost, which approximates fair value.
Derivatives. Financial futures contracts are valued at the closing settlement price established by the board of trade or exchange on which they are traded.
Fair Valuation. Investments for which valuations or market quotations are not readily available or are deemed unreliable are valued at fair value using methods determined in good faith by or at the direction of the Trustees of a Fund in a manner that fairly reflects the security’s value, or the amount that a Fund might reasonably expect to receive for the security upon its current sale in the ordinary course. Each such determination is based on a consideration of relevant factors, which are likely to vary from one pricing context to another. These factors may include, but are not limited to, the type of security, the existence of any contractual restrictions on the security’s disposition, the price and extent of public trading in similar securities of the issuer or of comparable entities, quotations or relevant information obtained from broker/dealers or other market participants, information obtained from the issuer, analysts, and/or the appropriate stock exchange (for exchange-traded securities), an analysis of the entity’s financial condition, and an evaluation of the forces that influence the issuer and the market(s) in which the security is purchased and sold.
B Investment Transactions and Related Income — Investment transactions for financial statement purposes are accounted for on a trade date basis. Realized gains and losses on investments sold are determined on the basis of identified cost. Interest income is recorded on the basis of interest accrued, adjusted for amortization of premium or accretion of discount.
C Federal Taxes — Each Fund’s policy is to comply with the provisions of the Internal Revenue Code applicable to regulated investment companies and to distribute to shareholders each year substantially all of its taxable, if any, and tax-exempt net investment income, and all or substantially all of its net realized capital gains. Accordingly, no provision for federal income or excise tax is necessary. Each Fund intends to satisfy conditions which will enable it to designate distributions from the interest income generated by its investments in non-taxable municipal securities, which are exempt from regular federal income tax when received by each Fund, as exempt-interest dividends.
As of March 31, 2017, the Funds had no uncertain tax positions that would require financial statement recognition, de-recognition, or disclosure. Each Fund files a U.S. federal income tax return annually after its fiscal year-end, which is subject to examination by the Internal Revenue Service for a period of three years from the date of filing.
D Legal Fees — Legal fees and other related expenses incurred as part of negotiations of the terms and requirement of capital infusions, or that are expected to result in the restructuring of, or a plan of reorganization for, an investment are recorded as realized losses. Ongoing expenditures to protect or enhance an investment are treated as operating expenses.
E Use of Estimates — The preparation of the financial statements in conformity with U.S. GAAP requires management to make estimates and assumptions that affect the reported amounts of assets and liabilities at the date of the financial statements and the reported amounts of income and expense during the reporting period. Actual results could differ from those estimates.
F Indemnifications — Under each Fund’s organizational documents, its officers and Trustees may be indemnified against certain liabilities and expenses arising out of the performance of their duties to each Fund. Under Massachusetts law, if certain conditions prevail, shareholders of a Massachusetts business trust (such as a Fund) could be deemed to have personal liability for the obligations of the Fund. However, each Fund’s Declaration of Trust contains an express disclaimer of liability on the part of Fund shareholders and the By-laws provide that the Fund shall assume the defense on behalf of any Fund shareholders. Moreover, the By-laws also provide for indemnification out of Fund property of any shareholder held personally liable solely by reason of being or having been a shareholder for all loss or expense arising from such liability. Additionally, in the normal course of business, each Fund enters into agreements with service providers that may contain indemnification clauses. Each Fund’s maximum exposure under these arrangements is unknown as this would involve future claims that may be made against each Fund that have not yet occurred.
Eaton Vance
Municipal Bond Funds
March 31, 2017
Notes to Financial Statements (Unaudited) — continued
G Floating Rate Notes Issued in Conjunction with Securities Held — The Funds may invest in residual interest bonds, also referred to as inverse floating rate securities, whereby a Fund may sell a variable or fixed rate bond for cash to a Special-Purpose Vehicle (the SPV), (which is generally organized as a trust), while at the same time, buying a residual interest in the assets and cash flows of the SPV. The bond is deposited into the SPV with the same CUSIP number as the bond sold to the SPV by the Fund, and which may have been, but is not required to be, the bond purchased from the Fund (the Bond). The SPV also issues floating rate notes (Floating Rate Notes) which are sold to third-parties. The residual interest bond held by a Fund gives the Fund the right (1) to cause the holders of the Floating Rate Notes to generally tender their notes at par, and (2) to have the Bond held by the SPV transferred to the Fund, thereby terminating the SPV. Should the Fund exercise such right, it would generally pay the SPV the par amount due on the Floating Rate Notes and exchange the residual interest bond for the underlying Bond. Pursuant to generally accepted accounting principles for transfers and servicing of financial assets and extinguishment of liabilities, the Funds account for the transaction described above as a secured borrowing by including the Bond in their Portfolio of Investments and the Floating Rate Notes (net of unamortized deferred debt issuance costs) as a liability under the caption “Payable for floating rate notes issued” in their Statement of Assets and Liabilities. The Floating Rate Notes have interest rates that generally reset weekly and their holders have the option to tender their notes to the SPV for redemption at par at each reset date. Accordingly, the fair value of the payable for floating rate notes issued approximates its carrying value. If measured at fair value, the payable for floating rate notes would have been considered as Level 2 in the fair value hierarchy (see Note 8) at March 31, 2017. Interest expense related to a Fund’s liability with respect to Floating Rate Notes is recorded as incurred. The SPV may be terminated by the Fund, as noted above, or by the occurrence of certain termination events as defined in the trust agreement, such as a downgrade in the credit quality of the underlying Bond, bankruptcy of or payment failure by the issuer of the underlying Bond, the inability to remarket Floating Rate Notes that have been tendered due to insufficient buyers in the market, or the failure by the SPV to obtain renewal of the liquidity agreement under which liquidity support is provided for the Floating Rate Notes up to one year. Structuring fees paid to the liquidity provider upon the creation of an SPV have been recorded as debt issuance costs and are being amortized as interest expense to the expected maturity of the related trust. Unamortized structuring fees related to a terminated SPV are recorded as a realized loss on extinguishment of debt. At March 31, 2017, the amounts of the Funds’ Floating Rate Notes and related interest rates and collateral were as follows:
| | | | | | | | | | | | |
| | | Municipal Fund | | | California Fund | | | New York Fund | |
| | | |
Floating Rate Notes Outstanding | | $ | 615,340,000 | | | $ | 188,880,000 | | | $ | 143,090,000 | |
Interest Rate or Range of Interest Rates (%) | | | 0.92 - 1.41 | | | | 0.94 - 0.95 | | | | 0.94 | |
Collateral for Floating Rate Notes Outstanding | | $ | 798,409,617 | | | $ | 250,623,347 | | | $ | 183,798,177 | |
For the six months ended March 31, 2017, the Funds’ average Floating Rate Notes outstanding and the average interest rate (annualized) including fees and amortization of deferred debt issuance costs were as follows:
| | | | | | | | | | | | |
| | | Municipal Fund | | | California Fund | | | New York Fund | |
| | | |
Average Floating Rate Notes Outstanding | | $ | 616,060,330 | | | $ | 198,309,670 | | | $ | 143,090,000 | |
Average Interest Rate | | | 1.32 | % | | | 1.30 | % | | | 1.31 | % |
In certain circumstances, the Funds may enter into shortfall and forbearance agreements with brokers by which a Fund agrees to reimburse the broker for the difference between the liquidation value of the Bond held by the SPV and the liquidation value of the Floating Rate Notes, as well as any shortfalls in interest cash flows. The Funds had no shortfalls as of March 31, 2017.
The Funds may also purchase residual interest bonds in a secondary market transaction without first owning the underlying bond. Such transactions are not required to be treated as secured borrowings. Shortfall agreements, if any, related to residual interest bonds purchased in a secondary market transaction are disclosed in the Portfolio of Investments.
The Funds’ investment policies and restrictions expressly permit investments in residual interest bonds. Such bonds typically offer the potential for yields exceeding the yields available on fixed rate bonds with comparable credit quality and maturity. These securities tend to underperform the market for fixed rate bonds in a rising long-term interest rate environment, but tend to outperform the market for fixed rate bonds when long-term interest rates decline. The value and income of residual interest bonds are generally more volatile than that of a fixed rate bond. The Funds’ investment policies do not allow the Funds to borrow money except as permitted by the 1940 Act. Management believes that the Funds’ restrictions on borrowing money and issuing senior securities (other than as specifically permitted) do not apply to Floating Rate Notes issued by the SPV and included as a liability in the Funds’ Statement of Assets and Liabilities. As secured indebtedness issued by an SPV, Floating Rate Notes are distinct from the borrowings and senior securities to which the Funds’ restrictions apply. Residual interest bonds held by the Funds are securities exempt from registration under Rule 144A of the Securities Act of 1933.
Eaton Vance
Municipal Bond Funds
March 31, 2017
Notes to Financial Statements (Unaudited) — continued
Final rules implementing section 619 of the Dodd-Frank Wall Street Reform and Consumer Protection Act (the “Volcker Rule”) prohibit banking entities from engaging in proprietary trading of certain instruments and limit such entities’ investments in, and relationships with, covered funds (such as SPVs), as defined in the rules. The compliance date for the Volcker Rule for certain covered funds was July 21, 2015 while for other covered funds the compliance date is July 21, 2017, as announced on July 7, 2016. The Volcker Rule precludes banking entities and their affiliates from (i) sponsoring residual interest bond programs and (ii) continuing relationships with or services for existing residual interest bond programs. As a result, residual interest bond trusts were restructured to comply with the Volcker Rule and all residual interest bonds held by the Funds at March 31, 2017 are Volcker Rule compliant. The effects of the Volcker Rule may make it more difficult for the Funds to maintain current or desired levels of leverage and may cause the Funds to incur additional expenses to maintain their leverage.
Legal and restructuring fees incurred in connection with the restructuring of residual interest bond trusts are recorded as interest expense.
H Financial Futures Contracts — Upon entering into a financial futures contract, a Fund is required to deposit with the broker, either in cash or securities, an amount equal to a certain percentage of the contract amount (initial margin). Subsequent payments, known as variation margin, are made or received by the Fund each business day, depending on the daily fluctuations in the value of the underlying security, and are recorded as unrealized gains or losses by the Fund. Gains (losses) are realized upon the expiration or closing of the financial futures contracts. Should market conditions change unexpectedly, the Fund may not achieve the anticipated benefits of the financial futures contracts and may realize a loss. Futures contracts have minimal counterparty risk as they are exchange traded and the clearinghouse for the exchange is substituted as the counterparty, guaranteeing counterparty performance.
I When-Issued Securities and Delayed Delivery Transactions — The Funds may purchase or sell securities on a delayed delivery or when-issued basis. Payment and delivery may take place after the customary settlement period for that security. At the time the transaction is negotiated, the price of the security that will be delivered is fixed. The Funds maintain cash and/or security positions for these commitments such that sufficient liquid assets will be available to make payments upon settlement. Securities purchased on a delayed delivery or when-issued basis are marked-to-market daily and begin earning interest on settlement date. Losses may arise due to changes in the market value of the underlying securities or if the counterparty does not perform under the contract.
J Statement of Cash Flows — The cash amount shown in the Statement of Cash Flows of a Fund is the amount included in the Fund’s Statement of Assets and Liabilities and represents the unrestricted cash on hand at its custodian and does not include any short-term investments.
K Interim Financial Statements — The interim financial statements relating to March 31, 2017 and for the six months then ended have not been audited by an independent registered public accounting firm, but in the opinion of the Funds’ management, reflect all adjustments, consisting only of normal recurring adjustments, necessary for the fair presentation of the financial statements.
L New Accounting Pronouncement — During the six months ended March 31, 2017, the Funds adopted the FASB’s Accounting Standards Update No. 2015-03, which provides guidance to simplify the presentation of debt issuance costs and became effective for fiscal years beginning after December 15, 2015 and interim periods within those fiscal years. Pursuant to the new standard, the Funds are required to present debt issuance costs in their Statement of Assets and Liabilities as a direct deduction from the carrying value of the related debt liability. Prior to the change, such costs were presented by the Funds as a deferred asset. This change in accounting had no impact on the Funds’ net assets.
2 Distributions to Shareholders and Income Tax Information
Each Fund intends to make monthly distributions of net investment income to common shareholders. In addition, at least annually, each Fund intends to distribute all or substantially all of its net realized capital gains (reduced by available capital loss carryforwards from prior years). Distributions are recorded on the ex-dividend date. Distributions to shareholders are determined in accordance with income tax regulations, which may differ from U.S. GAAP. As required by U.S. GAAP, only distributions in excess of tax basis earnings and profits are reported in the financial statements as a return of capital. Permanent differences between book and tax accounting relating to distributions are reclassified to paid-in capital. For tax purposes, distributions from short-term capital gains are considered to be from ordinary income.
At September 30, 2016, the following Funds, for federal income tax purposes, had capital loss carryforwards and deferred capital losses which would reduce the respective Fund’s taxable income arising from future net realized gains on investment transactions, if any, to the extent permitted by the Internal Revenue Code, and thus would reduce the amount of distributions to shareholders, which would otherwise be necessary to relieve the Funds of any liability for federal income or excise tax. Under tax regulations, capital losses incurred in taxable years beginning after December 2010 are considered deferred capital losses and are treated as arising on the first day of a Fund’s next taxable year, retaining the same short-term or long-term character as when originally deferred. Deferred capital losses are required to be used prior to capital loss carryforwards, which carry an expiration date. As a result of this
Eaton Vance
Municipal Bond Funds
March 31, 2017
Notes to Financial Statements (Unaudited) — continued
ordering rule, capital loss carryforwards may be more likely to expire unused. The amounts and expiration dates of the capital loss carryforwards, whose character is short-term, and the amounts of the deferred capital losses are as follows:
| | | | | | | | | | | | |
| Expiration Date | | Municipal
Fund | | | California
Fund | | | New York
Fund | |
| | | |
September 30, 2017 | | $ | 18,034,628 | | | $ | 4,562,453 | | | $ | 7,946,914 | |
September 30, 2018 | | | 56,183,712 | | | | 23,169,615 | | | | 8,909,352 | |
September 30, 2019 | | | 16,458,561 | | | | 7,665,268 | | | | 6,463,209 | |
| | | |
Total capital loss carryforwards | | $ | 90,676,901 | | | $ | 35,397,336 | | | $ | 23,319,475 | |
| | | |
Deferred capital losses: | | | | | | | | | | | | |
Short-term | | $ | 32,052,183 | | | $ | 9,728,388 | | | $ | 4,438,231 | |
Long-term | | $ | 9,034,773 | | | $ | 18,958,096 | | | $ | 2,339,765 | |
The cost and unrealized appreciation (depreciation) of investments of each Fund at March 31, 2017, as determined on a federal income tax basis, were as follows:
| | | | | | | | | | | | |
| | | Municipal Fund | | | California Fund | | | New York Fund | |
| | | |
Aggregate cost | | $ | 805,053,289 | | | $ | 244,752,071 | | | $ | 190,011,337 | |
| | | |
Gross unrealized appreciation | | $ | 106,780,903 | | | $ | 25,074,883 | | | $ | 20,766,444 | |
Gross unrealized depreciation | | | (6,610,842 | ) | | | (2,162,917 | ) | | | (3,262,140 | ) |
| | | |
Net unrealized appreciation | | $ | 100,170,061 | | | $ | 22,911,966 | | | $ | 17,504,304 | |
3 Investment Adviser Fee and Other Transactions with Affiliates
The investment adviser fee is earned by Eaton Vance Management (EVM) as compensation for investment advisory services rendered to each Fund. Pursuant to the investment advisory agreement for New York Fund, the fee is computed at an annual rate of 0.65% of its average weekly gross assets. Pursuant to the investment advisory agreement and a subsequent fee reduction agreement between each of Municipal Fund and California Fund and EVM, the fee is calculated at an annual rate of 0.60% of each Fund’s average weekly gross assets. The fee reductions cannot be terminated without the consent of a majority of Trustees and a majority of shareholders. Average weekly gross assets include the principal amount of any indebtedness for money borrowed, including debt securities issued by a Fund. Pursuant to a fee reduction agreement between each Fund and EVM, average weekly gross assets are calculated by adding to net assets the amount payable by the Fund to floating rate note holders, such adjustment being limited to the value of the Auction Preferred Shares (APS) outstanding prior to any APS redemptions by the Fund. The investment adviser fee is payable monthly. EVM also serves as the administrator of each Fund, but receives no compensation. For the six months ended March 31, 2017, the investment adviser fees were as follows:
| | | | | | | | | | | | |
| | | Municipal
Fund | | | California
Fund | | | New York
Fund | |
| | | |
Investment Adviser Fee | | $ | 4,628,050 | | | $ | 1,377,706 | | | $ | 1,150,368 | |
Trustees and officers of the Funds who are members of EVM’s organization receive remuneration for their services to the Funds out of the investment adviser fee. Trustees of the Funds who are not affiliated with the investment adviser may elect to defer receipt of all or a percentage of their annual fees in accordance with the terms of the Trustees Deferred Compensation Plan. For the six months ended March 31, 2017, no significant amounts have been deferred. Certain officers and Trustees of the Funds are officers of EVM.
Eaton Vance
Municipal Bond Funds
March 31, 2017
Notes to Financial Statements (Unaudited) — continued
4 Purchases and Sales of Investments
Purchases and sales of investments, other than short-term obligations, for the six months ended March 31, 2017 were as follows:
| | | | | | | | | | | | |
| | | Municipal Fund | | | California Fund | | | New York Fund | |
| | | |
Purchases | | $ | 73,862,678 | | | $ | 37,162,753 | | | $ | 9,649,437 | |
Sales | | $ | 72,855,053 | | | $ | 36,512,357 | | | $ | 8,267,659 | |
5 Common Shares of Beneficial Interest
The Funds may issue common shares pursuant to their dividend reinvestment plans. For the six months ended March 31, 2017, there were no common shares issued by the Funds. For the year ended September 30, 2016, the California Fund and New York Fund issued 3,162 and 3,195 common shares, respectively, pursuant to its dividend reinvestment plan and there were no common shares issued by the Municipal Fund.
On November 11, 2013, the Boards of Trustees of the Funds authorized the repurchase by each Fund of up to 10% of its then currently outstanding common shares in open-market transactions at a discount to net asset value (NAV). The repurchase program does not obligate the Funds to purchase a specific amount of shares. There were no repurchases of common shares by the Funds for the six months ended March 31, 2017 and the year ended September 30, 2016.
6 Overdraft Advances
Pursuant to the custodian agreement, State Street Bank and Trust Company (SSBT) may, in its discretion, advance funds to the Funds to make properly authorized payments. When such payments result in an overdraft, the Funds are obligated to repay SSBT at the current rate of interest charged by SSBT for secured loans (currently, the Federal Funds rate plus 2%). This obligation is payable on demand to SSBT. SSBT has a lien on a Fund’s assets to the extent of any overdraft. At March 31, 2017, the Municipal Fund, California Fund and New York Fund had a payment due to SSBT pursuant to the foregoing arrangement of $1,270,264, $1,001,558 and $241,843, respectively. Based on the short-term nature of these payments and the variable interest rate, the carrying value of the overdraft advances approximated its fair value at March 31, 2017. If measured at fair value, overdraft advances would have been considered as Level 2 in the fair value hierarchy (see Note 8) at March 31, 2017. The Funds’ average overdraft advances during the six months ended March 31, 2017 were not significant.
7 Financial Instruments
The Funds may trade in financial instruments with off-balance sheet risk in the normal course of their investing activities. These financial instruments may include financial futures contracts and may involve, to a varying degree, elements of risk in excess of the amounts recognized for financial statement purposes. The notional or contractual amounts of these instruments represent the investment a Fund has in particular classes of financial instruments and do not necessarily represent the amounts potentially subject to risk. The measurement of the risks associated with these instruments is meaningful only when all related and offsetting transactions are considered. A summary of obligations under these financial instruments at March 31, 2017 is included in the Portfolio of Investments. At March 31, 2017, the Funds had sufficient cash and/or securities to cover commitments under these contracts.
Each Fund is subject to interest rate risk in the normal course of pursuing its investment objective. Because the Funds hold fixed-rate bonds, the value of these bonds may decrease if interest rates rise. The Funds enter into U.S. Treasury futures contracts to hedge against changes in interest rates.
Eaton Vance
Municipal Bond Funds
March 31, 2017
Notes to Financial Statements (Unaudited) — continued
The fair values of open derivative instruments (not considered to be hedging instruments for accounting disclosure purposes) and whose primary underlying risk exposure is interest rate risk at March 31, 2017 were as follows:
| | | | | | | | | | | | |
| | | Municipal
Fund | | | California
Fund | | | New York
Fund | |
| | |
Asset Derivative: | | | | | | | | |
| | | |
Futures Contracts | | $ | 253,616 | (1) | | $ | 87,492 | (1) | | $ | 55,375 | (1) |
| | | |
Total | | $ | 253,616 | | | $ | 87,492 | | | $ | 55,375 | |
| | |
Liability Derivative: | | | | | | | | |
| | | |
Futures Contracts | | $ | — | | | $ | (33,782 | )(1) | | $ | — | |
| | | |
Total | | $ | — | | | $ | (33,782 | ) | | $ | — | |
| (1) | Amount represents cumulative unrealized appreciation or (depreciation) on futures contracts. Only the current day’s variation margin on open futures contracts is reported within the Statement of Assets and Liabilities as Receivable or Payable for variation margin, as applicable. |
The effect of derivative instruments (not considered to be hedging instruments for accounting disclosure purposes) on the Statement of Operations and whose primary underlying risk exposure is interest rate risk for the six months ended March 31, 2017 was as follows:
| | | | | | | | | | | | |
| | | Municipal Fund | | | California Fund | | | New York Fund | |
| | | |
Realized Gain (Loss) on Derivatives Recognized in Income | | $ | 3,751,006 | (1) | | $ | 1,876,857 | (1) | | $ | 818,997 | (1) |
Change in Unrealized Appreciation (Depreciation) on Derivatives Recognized in Income | | $ | (394,658 | )(2) | | $ | (182,242 | )(2) | | $ | (86,170 | )(2) |
| (1) | Statement of Operations location: Net realized gain (loss) – Financial futures contracts. |
| (2) | Statement of Operations location: Change in unrealized appreciation (depreciation) – Financial futures contracts. |
The average notional cost of futures contracts outstanding during the six months ended March 31, 2017, which is indicative of the volume of this derivative type, was approximately as follows:
| | | | | | | | | | | | |
| | | Municipal Fund | | | California Fund | | | New York Fund | |
| | |
Average Notional Amount: | | | | | | | | |
| | | |
Futures Contracts — Short | | $ | 36,057,000 | | | $ | 25,090,000 | | | $ | 7,873,000 | |
8 Fair Value Measurements
Under generally accepted accounting principles for fair value measurements, a three-tier hierarchy to prioritize the assumptions, referred to as inputs, is used in valuation techniques to measure fair value. The three-tier hierarchy of inputs is summarized in the three broad levels listed below.
| • | | Level 1 – quoted prices in active markets for identical investments |
| • | | Level 2 – other significant observable inputs (including quoted prices for similar investments, interest rates, prepayment speeds, credit risk, etc.) |
| • | | Level 3 – significant unobservable inputs (including a fund’s own assumptions in determining the fair value of investments) |
In cases where the inputs used to measure fair value fall in different levels of the fair value hierarchy, the level disclosed is determined based on the lowest level input that is significant to the fair value measurement in its entirety. The inputs or methodology used for valuing securities are not necessarily an indication of the risk associated with investing in those securities.
Eaton Vance
Municipal Bond Funds
March 31, 2017
Notes to Financial Statements (Unaudited) — continued
At March 31, 2017, the hierarchy of inputs used in valuing the Funds’ investments and open derivative instruments, which are carried at value, were as follows:
| | | | | | | | | | | | | | | | |
Municipal Fund | |
| Asset Description | | Level 1 | | | Level 2 | | | Level 3 | | | Total | |
| | | | |
Tax-Exempt Investments | | $ | — | | | $ | 1,520,563,350 | | | $ | — | | | $ | 1,520,563,350 | |
| | | | |
Total Investments | | $ | — | | | $ | 1,520,563,350 | | | $ | — | | | $ | 1,520,563,350 | |
| | | | |
Futures Contracts | | $ | 253,616 | | | $ | — | | | $ | — | | | $ | 253,616 | |
| | | | |
Total | | $ | 253,616 | | | $ | 1,520,563,350 | | | $ | — | | | $ | 1,520,816,966 | |
| | | | |
| | | | | | | | | | | | | | | | |
California Fund | |
| Asset Description | | Level 1 | | | Level 2 | | | Level 3 | | | Total | |
| | | | |
Tax-Exempt Investments | | $ | — | | | $ | 456,544,037 | | | $ | — | | | $ | 456,544,037 | |
| | | | |
Total Investments | | $ | — | | | $ | 456,544,037 | | | $ | — | | | $ | 456,544,037 | |
| | | | |
Futures Contracts | | $ | 87,492 | | | $ | — | | | $ | — | | | $ | 87,492 | |
| | | | |
Total | | $ | 87,492 | | | $ | 456,544,037 | | | $ | — | | | $ | 456,631,529 | |
| | | |
Liability Description | | | | | | | | | | | | |
| | | | |
Futures Contracts | | $ | (33,782 | ) | | $ | — | | | $ | — | | | $ | (33,782 | ) |
| | | | |
Total | | $ | (33,782 | ) | | $ | — | | | $ | — | | | $ | (33,782 | ) |
| | | | |
| | | | | | | | | | | | | | | | |
New York Fund | |
| Asset Description | | Level 1 | | | Level 2 | | | Level 3 | | | Total | |
| | | | |
Tax-Exempt Investments | | $ | — | | | $ | 350,605,641 | | | $ | — | | | $ | 350,605,641 | |
| | | | |
Total Investments | | $ | — | | | $ | 350,605,641 | | | $ | — | | | $ | 350,605,641 | |
| | | | |
Futures Contracts | | $ | 55,375 | | | $ | — | | | $ | — | | | $ | 55,375 | |
| | | | |
Total | | $ | 55,375 | | | $ | 350,605,641 | | | $ | — | | | $ | 350,661,016 | |
The Funds held no investments or other financial instruments as of September 30, 2016 whose fair value was determined using Level 3 inputs. At March 31, 2017, there were no investments transferred between Level 1 and Level 2 during the six months then ended.
Eaton Vance
Municipal Bond Funds
March 31, 2017
Officers and Trustees
Officers of Eaton Vance Municipal Bond Funds
Payson F. Swaffield
President
Maureen A. Gemma
Vice President, Secretary and Chief Legal Officer
James F. Kirchner
Treasurer
Paul M. O’Neil
Chief Compliance Officer
Trustees of Eaton Vance Municipal Bond Funds
William H. Park
Chairperson
Scott E. Eston
Thomas E. Faust Jr.*
Mark R. Fetting**
Cynthia E. Frost
George J. Gorman
Valerie A. Mosley
Helen Frame Peters
Susan J. Sutherland
Harriett Tee Taggart
Ralph F. Verni
Scott E. Wennerholm**
| ** | Messrs. Fetting and Wennerholm began serving as Trustees effective September 1, 2016. |
Number of Employees
Each Fund is organized as a Massachusetts business trust and is registered under the Investment Company Act of 1940, as amended, as a closed-end management investment company, and has no employees.
Number of Shareholders
As of March 31, 2017, Fund records indicate that there are 140, 24 and 37 registered shareholders for Municipal Bond Fund, California Municipal Bond Fund and New York Municipal Bond Fund, respectively, and approximately 23,347, 5,157 and 4,301 shareholders owning the Fund shares in street name, such as through brokers, banks and financial intermediaries for Municipal Bond Fund, California Municipal Bond Fund and New York Municipal Bond Fund, respectively.
If you are a street name shareholder and wish to receive Fund reports directly, which contain important information about a Fund, please write or call:
Eaton Vance Distributors, Inc.
Two International Place
Boston, MA 02110
1-800-262-1122
NYSE MKT symbols
| | |
| Municipal Bond Fund | | EIM |
| California Municipal Bond Fund | | EVM |
| New York Municipal Bond Fund | | ENX |
Eaton Vance Funds
IMPORTANT NOTICES
Privacy. The Eaton Vance organization is committed to ensuring your financial privacy. Each of the financial institutions identified below has in effect the following policy (“Privacy Policy”) with respect to nonpublic personal information about its customers:
| • | | Only such information received from you, through application forms or otherwise, and information about your Eaton Vance fund transactions will be collected. This may include information such as name, address, social security number, tax status, account balances and transactions. |
| • | | None of such information about you (or former customers) will be disclosed to anyone, except as permitted by law (which includes disclosure to employees necessary to service your account). In the normal course of servicing a customer’s account, Eaton Vance may share information with unaffiliated third parties that perform various required services such as transfer agents, custodians and broker-dealers. |
| • | | Policies and procedures (including physical, electronic and procedural safeguards) are in place that are designed to protect the confidentiality of such information. |
| • | | We reserve the right to change our Privacy Policy at any time upon proper notification to you. Customers may want to review our Privacy Policy periodically for changes by accessing the link on our homepage: www.eatonvance.com. |
Our pledge of privacy applies to the following entities within the Eaton Vance organization: the Eaton Vance Family of Funds, Eaton Vance Management, Eaton Vance Investment Counsel, Eaton Vance Distributors, Inc., Eaton Vance Trust Company, Eaton Vance Management (International) Limited, Eaton Vance Management’s Real Estate Investment Group and Boston Management and Research. In addition, our Privacy Policy applies only to those Eaton Vance customers who are individuals and who have a direct relationship with us. If a customer’s account (i.e., fund shares) is held in the name of a third-party financial advisor/broker-dealer, it is likely that only such advisor’s privacy policies apply to the customer. This notice supersedes all previously issued privacy disclosures. For more information about Eaton Vance’s Privacy Policy, please call 1-800-262-1122.
Delivery of Shareholder Documents. The Securities and Exchange Commission (SEC) permits funds to deliver only one copy of shareholder documents, including prospectuses, proxy statements and shareholder reports, to fund investors with multiple accounts at the same residential or post office box address. This practice is often called “householding” and it helps eliminate duplicate mailings to shareholders. American Stock Transfer & Trust Company, LLC (“AST”), the closed-end funds transfer agent, or your financial advisor, may household the mailing of your documents indefinitely unless you instruct AST, or your financial advisor, otherwise. If you would prefer that your Eaton Vance documents not be householded, please contact AST or your financial advisor. Your instructions that householding not apply to delivery of your Eaton Vance documents will typically be effective within 30 days of receipt by AST or your financial advisor.
Portfolio Holdings. Each Eaton Vance Fund and its underlying Portfolio(s) (if applicable) will file a schedule of portfolio holdings on Form N-Q with the SEC for the first and third quarters of each fiscal year. The Form N-Q will be available on the Eaton Vance website at www.eatonvance.com, by calling Eaton Vance at 1-800-262-1122 or in the EDGAR database on the SEC’s website at www.sec.gov. Form N-Q may also be reviewed and copied at the SEC’s public reference room in Washington, D.C. (call 1-800-732-0330 for information on the operation of the public reference room).
Proxy Voting. From time to time, funds are required to vote proxies related to the securities held by the funds. The Eaton Vance Funds or their underlying Portfolios (if applicable) vote proxies according to a set of policies and procedures approved by the Funds’ and Portfolios’ Boards. You may obtain a description of these policies and procedures and information on how the Funds or Portfolios voted proxies relating to portfolio securities during the most recent 12-month period ended June 30, without charge, upon request, by calling 1-800-262-1122 and by accessing the SEC’s website at www.sec.gov.
Share Repurchase Program. The Funds’ Boards of Trustees have approved a share repurchase program authorizing each Fund to repurchase up to 10% of its outstanding common shares as of the approved date in open-market transactions at a discount to net asset value. The repurchase program does not obligate a Fund to purchase a specific amount of shares. The Funds’ repurchase activity, including the number of shares purchased, average price and average discount to net asset value, is disclosed in the Funds’ annual and semi-annual reports to shareholders.
Additional Notice to Shareholders. If applicable, a Fund may also redeem or purchase its outstanding preferred shares in order to maintain compliance with regulatory requirements, borrowing or rating agency requirements or for other purposes as it deems appropriate or necessary.
Closed-End Fund Information. Eaton Vance closed-end funds make fund performance data and certain information about portfolio characteristics available on the Eaton Vance website shortly after the end of each month. Other information about the funds is available on the website. The funds’ net asset value per share is readily accessible on the Eaton Vance website. Portfolio holdings for the most recent month-end are also posted to the website approximately 30 days following the end of the month. This information is available at www.eatonvance.com on the fund information pages under “Individual Investors — Closed-End Funds”.
Investment Adviser and Administrator
Eaton Vance Management
Two International Place
Boston, MA 02110
Custodian
State Street Bank and Trust Company
State Street Financial Center, One Lincoln Street
Boston, MA 02111
Transfer Agent
American Stock Transfer & Trust Company, LLC
6201 15th Avenue
Brooklyn, NY 11219
Fund Offices
Two International Place
Boston, MA 02110
7727 3.31.17
Item 2. Code of Ethics
Not required in this filing.
Item 3. Audit Committee Financial Expert
Not required in this filing.
Item 4. Principal Accountant Fees and Services
Rule 2-01(c)(1)(ii)(A) of Regulation S-X (the “Loan Rule”) prohibits an accounting firm, such as the Fund’s principal accountant, Deloitte & Touche LLP (“D&T”), from having certain financial relationships with their audit clients and affiliated entities. Specifically, the Loan Rule provides, in relevant part, that an accounting firm generally would not be independent if it or a “covered person” of the accounting firm (within the meaning of applicable SEC rules relating to auditor independence) receives a loan from a lender that is a “record or beneficial owner of more than ten percent of the audit client’s equity securities.” Based on information provided
to the Audit Committee of the Board of Trustees (the “Audit Committee”) of the Eaton Vance family of funds by D&T, certain relationships between D&T and its affiliates (“Deloitte Entities”) and one or more lenders who are record owners of shares of one or more funds within the Eaton Vance family of funds (the “Funds”) implicate the Loan Rule, calling into question D&T’s independence with respect to the Funds. The Funds are providing this disclosure to explain the facts and circumstances as well as D&T’s conclusions concerning D&T’s objectivity and impartiality with respect to the audits of the Funds notwithstanding the existence of one or more breaches of the Loan Rule.
On June 20, 2016, the U.S. Securities and Exchange Commission (the “SEC”) issued no-action relief to another mutual fund complex (see Fidelity Management & Research Company et al., No-Action Letter (June 20, 2016) (the “No-Action Letter”)) related to an auditor independence issue arising under the Loan Rule. In the No-Action Letter, the SEC indicated that it would not recommend enforcement action against the fund group if the auditor is not in compliance with the Loan Rule provided that: (1) the auditor has complied with PCAOB Rule 3526(b)(1) and 3526(b)(2); (2) the auditor’s non-compliance under the Loan Rule is with respect to certain lending relationships; and (3) notwithstanding such non-compliance, the auditor has concluded that it is objective and impartial with respect to the issues encompassed within its engagement as auditor of the funds. The SEC has indicated that the no-action relief will expire 18 months from its issuance.
Based on information provided by D&T to the Audit Committee, the requirements of the No-Action Letter appear to be met with respect to D&T’s lending relationships described above. Among other things, D&T has advised the Audit Committee of its conclusion that the consequences of the breach of the Loan Rule have been satisfactorily addressed, that D&T’s objectivity and impartiality in the planning and conduct of the audits of the Fund’s financial statements has not been compromised and that, notwithstanding the breach, D&T is in a position to continue as the auditor for the Funds and D&T does not believe any actions need to be taken with respect to previously issued reports by D&T. D&T has advised the Audit Committee that these conclusions were based in part on its consideration of the No-Action Letter and other relevant information communicated to the Audit Committee.
Item 5. Audit Committee of Listed Registrants
Not required in this filing.
Item 6. Schedule of Investments
Please see schedule of investments contained in the Report to Stockholders included under Item 1 of this Form N-CSR.
Item 7. Disclosure of Proxy Voting Policies and Procedures for Closed-End Management Investment Companies
Not required in this filing.
Item 8. Portfolio Managers of Closed-End Management Investment Companies
Not required in this filing.
Item 9. Purchases of Equity Securities by Closed-End Management Investment Company and Affiliated Purchasers
No such purchases this period.
Item 10. Submission of Matters to a Vote of Security Holders
No material changes.
Item 11. Controls and Procedures
(a) It is the conclusion of the registrant’s principal executive officer and principal financial officer that the effectiveness of the registrant’s current disclosure controls and procedures (such disclosure controls and procedures having been evaluated within 90 days of the date of this filing) provide reasonable assurance that the information required to be disclosed by the registrant has been recorded, processed, summarized and reported within the time period specified in the Commission’s rules and forms and that the information required to be disclosed by the registrant has been accumulated and communicated to the registrant’s principal executive officer and principal financial officer in order to allow timely decisions regarding required disclosure.
(b) There have been no changes in the registrant’s internal controls over financial reporting during the second fiscal quarter of the period covered by this report that has materially affected, or is reasonably likely to materially affect, the registrant’s internal control over financial reporting.
Item 12. Exhibits
| | |
| (a)(1) | | Registrant’s Code of Ethics – Not applicable (please see Item 2). |
| |
| (a)(2)(i) | | Treasurer’s Section 302 certification. |
| |
| (a)(2)(ii) | | President’s Section 302 certification. |
| |
| (b) | | Combined Section 906 certification. |
Signatures
Pursuant to the requirements of the Securities Exchange Act of 1934 and the Investment Company Act of 1940, the registrant has duly caused this report to be signed on its behalf by the undersigned, thereunto duly authorized.
Eaton Vance Municipal Bond Fund
| | |
| By: | | /s/ Payson F. Swaffield |
| | Payson F. Swaffield |
| | President |
| |
| Date: | | May 23, 2017 |
Pursuant to the requirements of the Securities Exchange Act of 1934 and the Investment Company Act of 1940, this report has been signed below by the following persons on behalf of the registrant and in the capacities and on the dates indicated.
| | |
| By: | | /s/ James F. Kirchner |
| | James F. Kirchner |
| | Treasurer |
| |
| Date: | | May 23, 2017 |
| |
| By: | | /s/ Payson F. Swaffield |
| | Payson F. Swaffield |
| | President |
| |
| Date: | | May 23, 2017 |