UNITED STATES
SECURITIES AND EXCHANGE COMMISSION
Washington, D.C. 20549
FormN-CSR
CERTIFIED SHAREHOLDER REPORT OF REGISTERED
MANAGEMENT INVESTMENT COMPANIES
Investment Company Act File Number:811-21148
Eaton Vance New York Municipal Bond Fund
(Exact Name of Registrant as Specified in Charter)
Two International Place, Boston, Massachusetts 02110
(Address of Principal Executive Offices)
Maureen A. Gemma
Two International Place, Boston, Massachusetts 02110
(Name and Address of Agent for Services)
(617)482-8260
(Registrant’s Telephone Number)
September 30
Date of Fiscal Year End
March 31, 2019
Date of Reporting Period
Item 1. Reports to Stockholders

Eaton Vance
Municipal Bond Funds
Semiannual Report
March 31, 2019
Municipal (EIM) • California (EVM) • New York (ENX)
Important Note. Beginning on January 1, 2021, as permitted by regulations adopted by the Securities and Exchange Commission, paper copies of each Fund’s annual and semi-annual shareholder reports will no longer be sent by mail unless you specifically request paper copies of the reports. Instead, the reports will be made available on the Funds’ website (funds.eatonvance.com/closed-end-fund-and-term-trust-documents.php), and you will be notified by mail each time a report is posted and provided with a website address to access the report.
If you already elected to receive shareholder reports electronically, you will not be affected by this change and you need not take any action. If you hold shares at the Funds’ transfer agent, American Stock Transfer & Trust Company, LLC (“AST”), you may elect to receive shareholder reports and other communications from the Funds electronically by contacting AST. If you own your shares through a financial intermediary (such as a broker-dealer or bank), you must contact your financial intermediary to sign up.
You may elect to receive all future Fund shareholder reports in paper free of charge. If you hold shares at AST, you can inform AST that you wish to continue receiving paper copies of your shareholder reports by calling 1-866-439-6787. If you own these shares through a financial intermediary, you must contact your financial intermediary or follow instructions included with this disclosure, if applicable, to elect to continue to receive paper copies of your shareholder reports. Your election to receive reports in paper will apply to all funds held with AST or to all funds held through your financial intermediary, as applicable.

Commodity Futures Trading Commission Registration. Effective December 31, 2012, the Commodity Futures Trading Commission (“CFTC”) adopted certain regulatory changes that subject registered investment companies and advisers to regulation by the CFTC if a fund invests more than a prescribed level of its assets in certain CFTC-regulated instruments (including futures, certain options and swap agreements) or markets itself as providing investment exposure to such instruments. Each Fund has claimed an exclusion from the definition of the term “commodity pool operator” under the Commodity Exchange Act. Accordingly, neither the Funds nor the adviser with respect to the operation of the Funds is subject to CFTC regulation. Because of its management of other strategies, each Fund’s adviser is registered with the CFTC as a commodity pool operator and a commodity trading advisor.
Fund shares are not insured by the FDIC and are not deposits or other obligations of, or guaranteed by, any depository institution. Shares are subject to investment risks, including possible loss of principal invested.
Semiannual ReportMarch 31, 2019
Eaton Vance
Municipal Bond Funds
Table of Contents
| | | | |
Performance and Fund Profile | | | | |
| |
| | | | |
Municipal Bond Fund | | | 2 | |
California Municipal Bond Fund | | | 3 | |
New York Municipal Bond Fund | | | 4 | |
| |
| | | | |
| |
Endnotes and Additional Disclosures | | | 5 | |
| |
Financial Statements | | | 6 | |
| |
Officers and Trustees | | | 39 | |
| |
Important Notices | | | 40 | |
Eaton Vance
Municipal Bond Fund
March 31, 2019
Performance1,2
Portfolio ManagerCynthia J. Clemson
| | | | | | | | | | | | | | | | | | | | |
| % Average Annual Total Returns | | Inception Date | | | Six Months | | | One Year | | | Five Years | | | Ten Years | |
Fund at NAV | | | 08/30/2002 | | | | 6.13 | % | | | 6.18 | % | | | 6.23 | % | | | 9.04 | % |
Fund at Market Price | | | — | | | | 9.97 | | | | 9.89 | | | | 6.38 | | | | 7.73 | |
Bloomberg Barclays Municipal Bond Index | | | — | | | | 4.63 | % | | | 5.38 | % | | | 3.73 | % | | | 4.71 | % |
| | | | | |
| | | | | | | | | | | | | | | | | | | | |
| % Premium/Discount to NAV3 | | | | | | | | | | | | | | | |
| | | | | | | | | | | | | | | | | | | –7.67 | % |
| | | | | |
| | | | | | | | | | | | | | | | | | | | |
| Distributions4 | | | | | | | | | | | | | | | |
Total Distributions per share for the period | | | | | | | | | | | | | | | | | | $ | 0.259 | |
Distribution Rate at NAV | | | | | | | | | | | | | | | | | | | 3.83 | % |
Taxable-Equivalent Distribution Rate at NAV | | | | | | | | | | | | | | | | | | | 6.47 | % |
Distribution Rate at Market Price | | | | | | | | | | | | | | | | | | | 4.15 | % |
Taxable-Equivalent Distribution Rate at Market Price | | | | | | | | | | | | | | | | | | | 7.01 | % |
| | | | | |
| | | | | | | | | | | | | | | | | | | | |
| % Total Leverage5 | | | | | | | | | | | | | | | |
Residual Interest Bond (RIB) Financing | | | | | | | | | | | | | | | | | | | 39.22 | % |
Fund Profile
Credit Quality (% of total investments)6,7
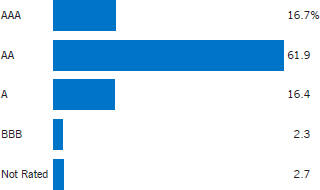
See Endnotes and Additional Disclosures in this report.
Past performance is no guarantee of future results. Returns are historical and are calculated by determining the percentage change in net asset value (NAV) or market price (as applicable) with all distributions reinvested and include management fees and other expenses. Fund performance at market price will differ from its results at NAV due to factors such as changing perceptions about the Fund, market conditions, fluctuations in supply and demand for Fund shares, or changes in Fund distributions. Investment return and principal value will fluctuate so that shares, when sold, may be worth more or less than their original cost. Performance less than or equal to one year is cumulative. Performance is for the stated time period only; due to market volatility, current Fund performance may be lower or higher than the quoted return. For performance as of the most recentmonth-end, please refer to eatonvance.com.
Eaton Vance
California Municipal Bond Fund
March 31, 2019
Performance1,2
Portfolio Manager Craig R. Brandon, CFA
| | | | | | | | | | | | | | | | | | | | |
| % Average Annual Total Returns | | Inception Date | | | Six Months | | | One Year | | | Five Years | | | Ten Years | |
Fund at NAV | | | 08/30/2002 | | | | 5.73 | % | | | 6.56 | % | | | 5.39 | % | | | 7.64 | % |
Fund at Market Price | | | — | | | | 8.40 | | | | 7.68 | | | | 4.73 | | | | 6.36 | |
Bloomberg Barclays Municipal Bond Index | | | — | | | | 4.63 | % | | | 5.38 | % | | | 3.73 | % | | | 4.71 | % |
| | | | | |
| | | | | | | | | | | | | | | | | | | | |
| % Premium/Discount to NAV3 | | | | | | | | | | | | | | | |
| | | | | | | | | | | | | | | | | | | –13.31 | % |
| | | | | |
| | | | | | | | | | | | | | | | | | | | |
| Distributions4 | | | | | | | | | | | | | | | |
Total Distributions per share for the period | | | | | | | | | | | | | | | | | | $ | 0.237 | |
Distribution Rate at NAV | | | | | | | | | | | | | | | | | | | 3.89 | % |
Taxable-Equivalent Distribution Rate at NAV | | | | | | | | | | | | | | | | | | | 7.58 | % |
Distribution Rate at Market Price | | | | | | | | | | | | | | | | | | | 4.49 | % |
Taxable-Equivalent Distribution Rate at Market Price | | | | | | | | | | | | | | | | | | | 8.75 | % |
| | | | | |
| | | | | | | | | | | | | | | | | | | | |
| % Total Leverage5 | | | | | | | | | | | | | | | |
RIB Financing | | | | | | | | | | | | | | | | | | | 42.20 | % |
Fund Profile
Credit Quality (% of total investments)6,7
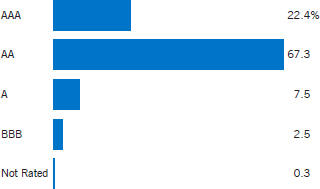
See Endnotes and Additional Disclosures in this report.
Past performance is no guarantee of future results. Returns are historical and are calculated by determining the percentage change in net asset value (NAV) or market price (as applicable) with all distributions reinvested and include management fees and other expenses. Fund performance at market price will differ from its results at NAV due to factors such as changing perceptions about the Fund, market conditions, fluctuations in supply and demand for Fund shares, or changes in Fund distributions. Investment return and principal value will fluctuate so that shares, when sold, may be worth more or less than their original cost. Performance less than or equal to one year is cumulative. Performance is for the stated time period only; due to market volatility, current Fund performance may be lower or higher than the quoted return. For performance as of the most recentmonth-end, please refer to eatonvance.com.
Eaton Vance
New York Municipal Bond Fund
March 31, 2019
Performance1,2
Portfolio ManagerCraig R. Brandon, CFA
| | | | | | | | | | | | | | | | | | | | |
| % Average Annual Total Returns | | Inception Date | | | Six Months | | | One Year | | | Five Years | | | Ten Years | |
Fund at NAV | | | 08/30/2002 | | | | 5.22 | % | | | 5.54 | % | | | 5.09 | % | | | 7.25 | % |
Fund at Market Price | | | — | | | | 8.72 | | | | 7.09 | | | | 4.85 | | | | 6.25 | |
Bloomberg Barclays Municipal Bond Index | | | — | | | | 4.63 | % | | | 5.38 | % | | | 3.73 | % | | | 4.71 | % |
| | | | | |
| | | | | | | | | | | | | | | | | | | | |
| % Premium/Discount to NAV3 | | | | | | | | | | | | | | | |
| | | | | | | | | | | | | | | | | | | –10.51 | % |
| | | | | |
| | | | | | | | | | | | | | | | | | | | |
| Distributions4 | | | | | | | | | | | | | | | |
Total Distributions per share for the period | | | | | | | | | | | | | | | | | | $ | 0.262 | |
Distribution Rate at NAV | | | | | | | | | | | | | | | | | | | 3.79 | % |
Taxable-Equivalent Distribution Rate at NAV | | | | | | | | | | | | | | | | | | | 7.02 | % |
Distribution Rate at Market Price | | | | | | | | | | | | | | | | | | | 4.24 | % |
Taxable-Equivalent Distribution Rate at Market Price | | | | | | | | | | | | | | | | | | | 7.85 | % |
| | | | | |
| | | | | | | | | | | | | | | | | | | | |
| % Total Leverage5 | | | | | | | | | | | | | | | |
RIB Financing | | | | | | | | | | | | | | | | | | | 37.84 | % |
Fund Profile
Credit Quality (% of total investments)6,7
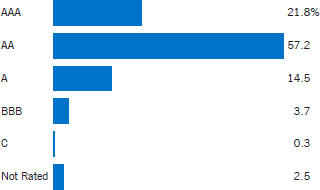
See Endnotes and Additional Disclosures in this report.
Past performance is no guarantee of future results. Returns are historical and are calculated by determining the percentage change in net asset value (NAV) or market price (as applicable) with all distributions reinvested and include management fees and other expenses. Fund performance at market price will differ from its results at NAV due to factors such as changing perceptions about the Fund, market conditions, fluctuations in supply and demand for Fund shares, or changes in Fund distributions. Investment return and principal value will fluctuate so that shares, when sold, may be worth more or less than their original cost. Performance less than or equal to one year is cumulative. Performance is for the stated time period only; due to market volatility, current Fund performance may be lower or higher than the quoted return. For performance as of the most recentmonth-end, please refer to eatonvance.com.
Eaton Vance
Municipal Bond Funds
March 31, 2019
Endnotes and Additional Disclosures
| 1 | Bloomberg Barclays Municipal Bond Index is an unmanaged index of municipal bonds traded in the U.S. Unless otherwise stated, index returns do not reflect the effect of any applicable sales charges, commissions, expenses, taxes or leverage, as applicable. It is not possible to invest directly in an index. |
| 2 | Performance results reflect the effects of leverage. Performance since inception for an index, if presented, is the performance since the Fund’s or oldest share class’ inception, as applicable. |
| 3 | The shares of the Fund often trade at a discount or premium from their net asset value. The discount or premium of the Fund may vary over time and may be higher or lower than what is quoted in this report. Forup-to-date premium/discount information, please refer to http://eatonvance.com/closedend. |
| 4 | The Distribution Rate is based on the Fund’s last regular distribution per share in the period (annualized) divided by the Fund’s NAV or market price at the end of the period. The Fund’s distributions may be comprised of amounts characterized for federal income tax purposes astax-exempt income, qualified andnon-qualified ordinary dividends, capital gains and nondividend distributions, also known as return of capital. The Fund will determine the federal income tax character of distributions paid to a shareholder after the end of the calendar year. This is reported on the IRS form1099-DIV and provided to the shareholder shortly after eachyear-end. For information about the tax character of distributions made in prior calendar years, please refer toPerformance-Tax Character of Distributions on the Fund’s webpage available at eatonvance.com. The Fund’s distributions are determined by the investment adviser based on its current assessment of the Fund’s long-term return potential. Fund distributions may be affected by numerous factors including changes in Fund performance, the cost of financing for Funds that employ leverage, portfolio holdings, realized and projected returns, and other factors. As portfolio and market conditions change, the rate of distributions paid by the Fund could change. Taxable-equivalent performance is based on the highest combined federal and state income tax rates, where applicable. Lower tax rates would result in lowertax-equivalent performance. Actual tax rates will vary depending on your income, exemptions and deductions. Rates do not include local taxes. |
| 5 | Fund employs RIB financing. The leverage created by RIB investments provides an opportunity for increased income but, at the same time, creates special risks (including the likelihood of greater price volatility). The cost of leverage rises and falls with changes in short-term interest rates. See “Floating Rate Notes Issued in Conjunction with Securities Held” in the notes to the financial statements for more information about RIB financing. RIB leverage represents the amount of Floating Rate Notes outstanding at period end as a percentage of Fund net assets plus Floating Rate Notes. |
| 6 | Ratings are based on Moody’s Investors Service, Inc. (“Moody’s”), S&P Global Ratings (“S&P”) or Fitch Ratings (“Fitch”), as applicable. If securities are rated differently by the ratings agencies, the highest rating is applied. Ratings, which are subject to change, apply to the creditworthiness of the issuers of the underlying securities and not to the Fund or its shares. Credit ratings measure the quality of a bond based on the issuer’s creditworthiness, with ratings ranging from AAA, being the highest, to D, being the lowest based on S&P’s measures. Ratings of BBB or higher by S&P or Fitch (Baa or higher by Moody’s) are considered to be investment-grade quality. Credit ratings are based largely on the ratings agency’s analysis at the time of rating. The rating assigned to any particular security is not necessarily a reflection of the issuer’s current financial condition and does not necessarily reflect its assessment of the volatility of a security’s market value or of the liquidity of an investment in the security. Holdings designated as “Not Rated” (if any) are not rated by the national ratings agencies stated above. |
| 7 | The chart includes the municipal bonds held by a trust that issues residual interest bonds, consistent with the Portfolio of Investments. |
| | Fund profiles subject to change due to active management. |
Important Notice to Shareholders
| | Effective April 24, 2019, each of Municipal Bond Fund (“EIM”), California Municipal Bond Fund (“EVM”) and New York Municipal Bond Fund (“ENX”) amended its investment objective to eliminate references to the alternative minimum tax (“AMT”) as shown below: |
| | | | |
| Fund | | Prior Objective | | Revised Objective |
| EIM | | To provide current income exempt from federal income tax, including AMT | | To provide current income exempt from federal income tax |
| | |
| EVM | | To provide current income exempt from federal income tax, including AMT, and California personal income tax | | To provide current income exempt from federal income tax and California personal income tax |
| | |
| ENX | | To provide current income exempt from federal income tax, including AMT and New York State and New York City personal income tax | | To provide current income exempt from federal income tax and New York State and New York City personal income tax |
| | Each Fund also amended its policy of investing up to 20% of its net assets in municipal obligations rated investment grade (i.e., rated Baa or higher by Moody’s or BBB or higher by S&P or Fitch) to state that each Fund may invest up to 20% of its net assets in municipal obligations rated BBB/Baa or below (or unrated obligations deemed by Eaton Vance to be of equivalent quality), provided that not more than 15% of its net assets may be invested in municipal obligations rated below B (or unrated obligations deemed by Eaton Vance to be of equivalent quality). Additionally, each Fund’s investment policy to seek at all times to avoid investments in municipal obligations on which the interest may be subject to the AMT (“AMT Bonds”) was rescinded and each Fund adopted a policy permitting investments up to 20% of its net assets in AMT Bonds. |
| | Each Fund’s policy to invest at least 80% of its net assets in municipal obligations, the interest on which is exempt from federal income tax, including AMT, and for EVM and ENX, the state and/or local taxes noted above, and that are rated A or better is unchanged. |
Eaton Vance
Municipal Bond Fund
March 31, 2019
Portfolio of Investments (Unaudited)
| | | | | | | | |
| Tax-Exempt Municipal Securities — 162.7% | |
| Security | | Principal
Amount
(000’s omitted) | | | Value | |
|
| Bond Bank — 0.6% | |
| | |
Ohio Economic Development, (Ohio Enterprise Bond Fund), 6.00%, 12/1/34 | | $ | 700 | | | $ | 751,107 | |
| | |
Rickenbacker Port Authority, OH, (OASBO Expanded Asset Pooled Financing Program), 5.375%, 1/1/32 | | | 515 | | | | 618,932 | |
| | |
Texas Water Development Board, 4.00%, 10/15/37(1) | | | 4,875 | | | | 5,347,485 | |
| | |
| | | | | | | $ | 6,717,524 | |
|
| Education — 15.5% | |
| | |
Connecticut Health and Educational Facilities Authority, (Fairfield University), 4.00%, 7/1/47 | | $ | 16,225 | | | $ | 16,693,740 | |
| | |
Connecticut Health and Educational Facilities Authority, (Fairfield University), 5.00%, 7/1/46 | | | 4,750 | | | | 5,316,248 | |
| | |
Houston Higher Education Finance Corp., TX, (St. John’s School), 5.25%, 9/1/33 | | | 4,550 | | | | 5,018,286 | |
| | |
Massachusetts Development Finance Agency, (Boston College), 5.00%, 7/1/42(1) | | | 9,525 | | | | 11,132,153 | |
| | |
Massachusetts Development Finance Agency, (Harvard University), 5.00%, 7/15/33(1) | | | 3,000 | | | | 3,595,440 | |
| | |
Massachusetts Development Finance Agency, (Milton Academy), 5.00%, 9/1/35 | | | 750 | | | | 781,575 | |
| | |
Massachusetts Development Finance Agency, (Northeastern University), 5.25%, 3/1/37 | | | 1,650 | | | | 1,881,413 | |
| | |
Massachusetts Development Finance Agency, (Williams College), 5.00%, 7/1/46(1) | | | 7,050 | | | | 8,202,886 | |
| | |
Massachusetts Health and Educational Facilities Authority, (Boston College), 5.50%, 6/1/27 | | | 5,710 | | | | 7,331,469 | |
| | |
Massachusetts Health and Educational Facilities Authority, (Boston College), 5.50%, 6/1/30 | | | 8,325 | | | | 10,940,881 | |
| | |
Massachusetts Health and Educational Facilities Authority, (Northeastern University), 5.00%, 10/1/35 | | | 870 | | | | 905,348 | |
| | |
New Jersey Educational Facilities Authority, (Montclair State University), 5.00%, 7/1/34 | | | 210 | | | | 235,897 | |
| | |
New Jersey Educational Facilities Authority, (Princeton University), 4.00%, 7/1/47(1) | | | 10,000 | | | | 10,930,700 | |
| | |
New Jersey Educational Facilities Authority, (Princeton University), 5.00%, 7/1/29(1) | | | 1,675 | | | | 2,084,303 | |
| | |
New Jersey Educational Facilities Authority, (Princeton University), 5.00%,��7/1/31(1) | | | 1,125 | | | | 1,388,835 | |
| | |
New Jersey Educational Facilities Authority, (Ramapo College), 5.00%, 7/1/37 | | | 360 | | | | 390,128 | |
| | |
New York Dormitory Authority, (Columbia University), 5.00%, 10/1/38(1) | | | 8,500 | | | | 10,285,680 | |
| | |
New York Dormitory Authority, (Rockefeller University), 5.00%, 7/1/40(1) | | | 16,800 | | | | 16,927,512 | |
| | |
North Carolina Capital Facilities Finance Agency, (Duke University),
5.00%, 10/1/41(1) | | | 10,000 | | | | 11,404,900 | |
| | | | | | | | |
| Security | | Principal
Amount
(000’s omitted) | | | Value | |
|
| Education (continued) | |
| | |
Northampton County General Purpose Authority, PA, (Moravian College), 5.00%, 10/1/24 | | $ | 95 | | | $ | 107,532 | |
| | |
Ohio Higher Educational Facility Commission, (Kenyon College), 5.00%, 7/1/44 | | | 200 | | | | 207,240 | |
| | |
Ohio Higher Educational Facility Commission, (Oberlin College), 5.00%, 10/1/33 | | | 500 | | | | 559,085 | |
| | |
Pennsylvania Higher Educational Facilities Authority, (Saint Joseph’s University), 5.00%, 11/1/40 | | | 440 | | | | 456,958 | |
| | |
Pennsylvania State University, 5.00%, 9/1/42(1) | | | 3,750 | | | | 4,417,650 | |
| | |
South Carolina Educational Facilities Authority for Private Nonprofit Institutions of Higher Learning, (Furman University), (SPA: Wells Fargo Bank, N.A.), 1.51%, 10/1/39(2) | | | 2,650 | | | | 2,650,000 | |
| | |
State Public School Building Authority, PA, (Northampton County Area Community College), 5.50%, 3/1/31 | | | 750 | | | | 797,723 | |
| | |
Swarthmore Borough Authority, PA, (Swarthmore College), 5.00%, 9/15/46(1) | | | 3,000 | | | | 3,591,630 | |
| | |
University of California, Prerefunded to 5/15/19, 5.25%, 5/15/39 | | | 720 | | | | 723,319 | |
| | |
University of California, Prerefunded to 5/15/19, 5.25%, 5/15/39 | | | 2,460 | | | | 2,471,341 | |
| | |
University of Cincinnati, OH, 5.00%, 6/1/45(1) | | | 7,500 | | | | 8,660,100 | |
| | |
University of Massachusetts Building Authority, 5.00%, 11/1/39(1) | | | 14,175 | | | | 15,551,818 | |
| | |
University of Michigan, 5.00%, 4/1/40(1) | | | 15,000 | | | | 17,313,450 | |
| | |
University of Michigan, 5.00%, 4/1/48(1) | | | 3,500 | | | | 4,153,800 | |
| | |
| | | | | | | $ | 187,109,040 | |
|
| Electric Utilities — 5.4% | |
| | |
Energy Northwest, WA, (Columbia Generating Station), 5.00%, 7/1/40 | | $ | 2,650 | | | $ | 2,970,570 | |
| | |
Los Angeles Department of Water and Power, CA, Power System Revenue,
4.00%, 7/1/46(1) | | | 3,000 | | | | 3,165,600 | |
| | |
Michigan Public Power Agency, 5.00%, 1/1/43 | | | 700 | | | | 734,447 | |
| | |
Nebraska Public Power District, 5.00%, 1/1/34 | | | 5,000 | | | | 5,803,450 | |
| | |
Ohio Air Quality Development Authority, (Buckeye Power, Inc.), 6.00%, 12/1/40 | | | 500 | | | | 534,110 | |
| | |
Omaha Public Power District, NE, 5.00%, 2/1/40 | | | 225 | | | | 253,969 | |
| | |
Omaha Public Power District, NE, 5.00%, 2/1/40(1) | | | 16,000 | | | | 18,060,000 | |
| | |
Omaha Public Power District, NE, 5.00%, 2/1/42(1) | | | 10,000 | | | | 11,737,900 | |
| | |
Pima County Industrial Development Authority, AZ, (Tucson Electric Power Co.), 5.25%, 10/1/40 | | | 11,300 | | | | 11,792,906 | |
| | |
Unified Government of Wyandotte County/Kansas City Board of Public Utilities, KS, 5.00%, 9/1/36 | | | 4,110 | | | | 4,396,097 | |
| | |
Utility Debt Securitization Authority, NY, 5.00%, 12/15/35 | | | 5,000 | | | | 5,669,150 | |
| | |
| | | | | | | $ | 65,118,199 | |
| | | | |
| | 6 | | See Notes to Financial Statements. |
Eaton Vance
Municipal Bond Fund
March 31, 2019
Portfolio of Investments (Unaudited) — continued
| | | | | | | | |
| Security | | Principal
Amount
(000’s omitted) | | | Value | |
|
| Escrowed / Prerefunded — 16.0% | |
| | |
Allegheny County Higher Education Building Authority, PA, (Duquesne University), Prerefunded to 3/1/21, 5.50%, 3/1/31 | | $ | 1,050 | | | $ | 1,127,490 | |
| | |
Apollo Career Center Joint Vocational School District, OH, Prerefunded to 12/1/21, 5.25%, 12/1/33 | | | 270 | | | | 296,487 | |
| | |
California Department of Water Resources, Prerefunded to 12/1/20, 5.25%, 12/1/35(1) | | | 9,715 | | | | 10,339,480 | |
| | |
California Health Facilities Financing Authority, (Cedars-Sinai Medical Center), Prerefunded to 8/15/19, 5.00%, 8/15/39 | | | 11,570 | | | | 11,721,798 | |
| | |
Connecticut Health and Educational Facilities Authority, (Wesleyan University), Prerefunded to 7/1/20, 5.00%, 7/1/39(1) | | | 16,900 | | | | 17,636,333 | |
| | |
Delaware River Port Authority of Pennsylvania and New Jersey, Prerefunded to 1/1/20, 5.00%, 1/1/35 | | | 10,455 | | | | 10,728,816 | |
| | |
Delaware River Port Authority of Pennsylvania and New Jersey, Prerefunded to 1/1/20, 5.00%, 1/1/40 | | | 940 | | | | 964,619 | |
| | |
Franklin County Industrial Development Authority, PA, (The Chambersburg Hospital), Prerefunded to 7/1/20, 5.375%, 7/1/42 | | | 1,000 | | | | 1,039,910 | |
| | |
Honolulu City and County, HI, Wastewater System, Prerefunded to 7/1/21, 5.25%, 7/1/36(1) | | | 9,750 | | | | 10,559,250 | |
| | |
Houston Higher Education Finance Corp., TX, (William Marsh Rice University), Prerefunded to 5/15/20, 5.00%, 5/15/35(1) | | | 15,000 | | | | 15,578,700 | |
| | |
Houston Higher Education Finance Corp., TX, (William Marsh Rice University), Prerefunded to 5/15/20, 5.00%, 5/15/35 | | | 1,000 | | | | 1,038,580 | |
| | |
Kalamazoo Hospital Finance Authority, MI, (Bronson Healthcare Group), Prerefunded to 5/15/21, 5.25%, 5/15/33 | | | 430 | | | | 462,289 | |
| | |
King County, WA, Sewer Revenue, Prerefunded to 1/1/21, 5.00%, 1/1/34(1) | | | 4,000 | | | | 4,243,320 | |
| | |
King County, WA, Sewer Revenue, Prerefunded to 1/1/21, 5.00%, 1/1/34(1) | | | 6,000 | | | | 6,354,240 | |
| | |
Marco Island, FL, Utility System, Prerefunded to 10/1/20, 5.00%, 10/1/34 | | | 1,445 | | | | 1,520,487 | |
| | |
Marco Island, FL, Utility System, Prerefunded to 10/1/20, 5.00%, 10/1/40 | | | 6,325 | | | | 6,655,418 | |
| | |
Maryland Health and Higher Educational Facilities Authority, (Charlestown Community, Inc.), Prerefunded to 1/1/21, 6.125%, 1/1/30 | | | 1,410 | | | | 1,519,204 | |
| | |
Massachusetts Health and Educational Facilities Authority, (Isabella Stewart Gardner Museum), Prerefunded to 5/1/19, 5.00%, 5/1/29 | | | 490 | | | | 491,352 | |
| | |
Massachusetts Health and Educational Facilities Authority, (Partners HealthCare System), Prerefunded to 7/1/19, 5.00%, 7/1/34 | | | 500 | | | | 504,285 | |
| | |
Massachusetts Health and Educational Facilities Authority, (Partners HealthCare System), Prerefunded to 7/1/19, 5.00%, 7/1/39 | | | 750 | | | | 756,428 | |
| | | | | | | | |
| Security | | Principal
Amount
(000’s omitted) | | | Value | |
|
| Escrowed / Prerefunded (continued) | |
| | |
Metropolitan Transportation Authority, NY, Prerefunded to 11/15/20, 5.25%, 11/15/40 | | $ | 4,735 | | | $ | 5,026,581 | |
| | |
Metropolitan Transportation Authority, NY, Prerefunded to 11/15/21, 5.25%, 11/15/38 | | | 5,505 | | | | 6,048,178 | |
| | |
Mississippi, Prerefunded to 10/1/21, 5.00%, 10/1/30(1) | | | 10,000 | | | | 10,859,900 | |
| | |
Mississippi, Prerefunded to 10/1/21, 5.00%, 10/1/36(1) | | | 13,800 | | | | 14,986,662 | |
| | |
New Jersey Health Care Facilities Financing Authority, (Palisades Medical Center), Prerefunded to 7/1/23, 5.25%, 7/1/31 | | | 615 | | | | 705,165 | |
| | |
North Carolina, Limited Obligation Bonds, Prerefunded to 5/1/21, 5.00%, 5/1/30(1) | | | 10,000 | | | | 10,718,500 | |
| | |
Ohio Higher Educational Facility Commission, (Kenyon College), Prerefunded to 7/1/20, 5.00%, 7/1/44 | | | 105 | | | | 109,442 | |
| | |
Ohio Higher Educational Facility Commission, (Summa Health System), Prerefunded to 5/15/20, 5.75%, 11/15/40 | | | 290 | | | | 303,262 | |
| | |
Ohio Turnpike Commission, Prerefunded to 2/15/20, 5.00%, 2/15/31 | | | 1,000 | | | | 1,030,460 | |
| | |
Oregon, Prerefunded to 8/2/21, 5.00%, 8/1/36 | | | 1,710 | | | | 1,843,414 | |
| | |
Oregon Department of Administrative Services, Lottery Revenue, Prerefunded to 4/1/21, 5.25%, 4/1/30 | | | 7,545 | | | | 8,081,148 | |
| | |
Pennsylvania Higher Educational Facilities Authority, (Thomas Jefferson University), Prerefunded to 3/1/20, 5.00%, 3/1/40 | | | 925 | | | | 953,323 | |
| | |
Pennsylvania Turnpike Commission, Prerefunded to 12/1/20, 5.35%, 12/1/30 | | | 135 | | | | 143,483 | |
| | |
Pennsylvania Turnpike Commission, Prerefunded to 12/1/20, 5.35%, 12/1/30 | | | 175 | | | | 185,997 | |
| | |
Pennsylvania Turnpike Commission, Prerefunded to 12/1/20, 6.00%, 12/1/34 | | | 720 | | | | 772,906 | |
| | |
Pennsylvania Turnpike Commission, Prerefunded to 12/1/20, 6.00%, 12/1/34 | | | 760 | | | | 815,845 | |
| | |
Pennsylvania Turnpike Commission, Prerefunded to 12/1/20, 6.00%, 12/1/34 | | | 3,520 | | | | 3,778,650 | |
| | |
Pennsylvania Turnpike Commission, Prerefunded to 12/1/21, 5.25%, 12/1/31 | | | 1,000 | | | | 1,098,100 | |
| | |
South Carolina Transportation Infrastructure Bank, Prerefunded to 10/1/19, 5.25%, 10/1/40 | | | 1,000 | | | | 1,018,260 | |
| | |
South Fork Municipal Authority, PA, (Conemaugh Health System), Prerefunded to 7/1/20, 5.50%, 7/1/29 | | | 250 | | | | 261,955 | |
| | |
Southcentral Pennsylvania General Authority, (York College of Pennsylvania), Prerefunded to 5/1/21, 5.50%, 11/1/31 | | | 1,500 | | | | 1,619,865 | |
| | |
Tarrant County Cultural Education Facilities Finance Corp., TX, (Scott & White Healthcare), Prerefunded to 8/15/20, 5.25%, 8/15/40 | | | 450 | | | | 472,406 | |
| | |
Tarrant County Cultural Education Facilities Finance Corp., TX, (Scott & White Healthcare), Prerefunded to 8/15/20, 5.25%, 8/15/40 | | | 5,655 | | | | 5,936,562 | |
| | | | |
| | 7 | | See Notes to Financial Statements. |
Eaton Vance
Municipal Bond Fund
March 31, 2019
Portfolio of Investments (Unaudited) — continued
| | | | | | | | |
| Security | | Principal
Amount
(000’s omitted) | | | Value | |
|
| Escrowed / Prerefunded (continued) | |
| | |
University of California, Prerefunded to 5/15/19, 5.25%, 5/15/39 | | $ | 1,270 | | | $ | 1,275,855 | |
| | |
University of Colorado, (University Enterprise Revenue), Prerefunded to 6/1/21, 5.25%, 6/1/36(1) | | | 10,000 | | | | 10,799,700 | |
| | |
Washington County Industrial Development Authority, PA, (Washington and Jefferson College), Prerefunded to 5/1/20, 5.25%, 11/1/30 | | | 575 | | | | 598,270 | |
| | |
| | | | | | | $ | 192,982,375 | |
|
| General Obligations — 24.5% | |
| | |
Allegheny County, PA, 5.00%, 11/1/43(1) | | $ | 3,800 | | | $ | 4,451,586 | |
| | |
Boston, MA, 5.00%, 5/1/38(1) | | | 2,000 | | | | 2,417,460 | |
| | |
California, 5.00%, 10/1/33(1) | | | 18,800 | | | | 21,571,496 | |
| | |
California, 5.00%, 8/1/46(1) | | | 15,000 | | | | 17,325,300 | |
| | |
Chicago, IL, 5.00%, 1/1/44(3) | | | 3,000 | | | | 3,186,150 | |
| | |
Chicago Park District, IL, (Harbor Facilities), 5.25%, 1/1/37(1) | | | 10,000 | | | | 10,355,500 | |
| | |
Clark County, NV, 5.00%, 7/1/33 | | | 500 | | | | 551,995 | |
| | |
Cleveland, OH, 5.00%, 12/1/43(1) | | | 2,225 | | | | 2,591,969 | |
| | |
Delaware Valley Regional Finance Authority, PA, 5.75%, 7/1/32 | | | 6,500 | | | | 8,589,295 | |
| | |
District of Columbia, 5.00%, 6/1/43(1) | | | 12,000 | | | | 14,224,800 | |
| | |
Forest Hills Local School District, OH, 5.00%, 12/1/46(1) | | | 2,225 | | | | 2,519,145 | |
| | |
Humble Independent School District, TX, (PSF Guaranteed), 5.00%, 2/15/43(1) | | | 20,000 | | | | 23,105,200 | |
| | |
Jackson Public Schools, MI, 5.00%, 5/1/48(1) | | | 2,150 | | | | 2,481,466 | |
| | |
Kane, Cook and DuPage Counties School District No. 46, IL, 5.00%, 1/1/33 | | | 2,000 | | | | 2,203,860 | |
| | |
Klein Independent School District, TX, (PSF Guaranteed), 5.00%, 2/1/36(1) | | | 2,000 | | | | 2,111,380 | |
| | |
Massachusetts, 5.00%, 9/1/38(1) | | | 18,500 | | | | 22,104,540 | |
| | |
Monmouth County Improvement Authority, NJ, 5.00%, 1/15/27 | | | 260 | | | | 275,314 | |
| | |
Morgan Hill Unified School District, CA, (Election of 2012), 4.00%, 8/1/47(1) | | | 10,000 | | | | 10,548,600 | |
| | |
New York, 5.00%, 2/15/34(1) | | | 2,750 | | | | 2,906,750 | |
| | |
New York, NY, 5.00%, 10/1/32 | | | 10,000 | | | | 11,024,300 | |
| | |
Ocean City, NJ, 1.00%, 11/15/28 | | | 2,295 | | | | 2,047,714 | |
| | |
Ocean County, NJ, 4.00%, 9/1/30(1) | | | 775 | | | | 889,475 | |
| | |
Ocean County, NJ, 5.00%, 9/1/28(1) | | | 700 | | | | 876,386 | |
| | |
Ocean County, NJ, 5.00%, 9/1/28 | | | 10 | | | | 12,520 | |
| | |
Ocean County, NJ, 5.00%, 9/1/29(1) | | | 725 | | | | 903,176 | |
| | |
Ocean County, NJ, 5.00%, 9/1/29 | | | 20 | | | | 24,915 | |
| | |
Ohio, 5.00%, 2/1/37(1) | | | 2,225 | | | | 2,579,487 | |
| | |
Oregon, 5.00%, 8/1/35(1) | | | 6,750 | | | | 7,226,482 | |
| | |
Oregon, 5.00%, 8/1/36 | | | 1,290 | | | | 1,380,145 | |
| | | | | | | | |
| Security | | Principal
Amount
(000’s omitted) | | | Value | |
|
| General Obligations (continued) | |
| | |
Pennsylvania, 4.00%, 4/1/29(1) | | $ | 3,000 | | | $ | 3,188,460 | |
| | |
Pennsylvania, 5.00%, 3/1/32(1) | | | 2,750 | | | | 3,260,455 | |
| | |
Peters Township School District, PA, 5.00%, 9/1/40(1) | | | 3,225 | | | | 3,777,152 | |
| | |
Port of Houston Authority of Harris County, TX, 5.00%, 10/1/35 | | | 7,500 | | | | 7,850,025 | |
| | |
Shoreline School District No. 412, WA, 4.00%, 6/1/38(1) | | | 2,800 | | | | 3,041,108 | |
| | |
State College Area School District, PA, 5.00%, 5/15/44(1) | | | 3,650 | | | | 4,299,627 | |
| | |
Tacoma School District No. 10, WA, 5.00%, 12/1/39(1) | | | 10,000 | | | | 11,476,100 | |
| | |
Trenton Public Schools, MI, 5.00%, 5/1/42(1) | | | 2,150 | | | | 2,495,226 | |
| | |
Upper Arlington City School District, OH, 5.00%, 12/1/48(1) | | | 2,225 | | | | 2,608,167 | |
| | |
Walled Lake Consolidated School District, MI, 5.00%, 5/1/34 | | | 635 | | | | 712,629 | |
| | |
Washington, 4.00%, 7/1/28(1) | | | 10,000 | | | | 10,667,900 | |
| | |
Washington, 5.00%, 2/1/35(1) | | | 23,500 | | | | 26,484,735 | |
| | |
Washington, 5.00%, 2/1/38(1) | | | 10,000 | | | | 11,904,200 | |
| | |
Wayland, MA, 5.00%, 2/1/33 | | | 340 | | | | 359,312 | |
| | |
Wayland, MA, 5.00%, 2/1/36 | | | 510 | | | | 538,019 | |
| | |
Will County, IL, 5.00%, 11/15/45(1) | | | 19,725 | | | | 21,879,562 | |
| | |
Winchester, MA, 5.00%, 4/15/36 | | | 160 | | | | 169,754 | |
| | |
| | | | | | | $ | 295,198,837 | |
|
| Hospital — 10.1% | |
| | |
Allen County, OH, (Mercy Health), 4.00%, 8/1/47(1) | | $ | 900 | | | $ | 935,091 | |
| | |
California Health Facilities Financing Authority, (Catholic Healthcare West), 5.25%, 3/1/27 | | | 1,000 | | | | 1,066,160 | |
| | |
California Health Facilities Financing Authority, (Catholic Healthcare West), 5.25%, 3/1/28 | | | 1,770 | | | | 1,887,457 | |
| | |
Camden County Improvement Authority, NJ, (Cooper Health System), 5.75%, 2/15/42 | | | 250 | | | | 273,073 | |
| | |
Franklin County, OH, (Trinity Health Credit Group), 5.00%, 12/1/47(1) | | | 2,200 | | | | 2,515,810 | |
| | |
Grand Traverse Hospital Finance Authority, MI, (Munson Healthcare Obligated Group), 5.375%, 7/1/35 | | | 750 | | | | 810,382 | |
| | |
Hamilton County, OH, (Cincinnati Children’s Hospital Medical Center), 5.00%, 5/15/34 | | | 250 | | | | 281,370 | |
| | |
Hawaii Department of Budget and Finance, (Hawaii Pacific Health), 5.50%, 7/1/38 | | | 3,150 | | | | 3,531,906 | |
| | |
Kent Hospital Finance Authority, MI, (Spectrum Health System), 5.00%, 1/15/31 | | | 750 | | | | 801,405 | |
| | |
Massachusetts Development Finance Agency, (Partners HealthCare System), 5.00%, 7/1/41(1) | | | 10,000 | | | | 11,357,200 | |
| | |
Massachusetts Development Finance Agency, (Partners HealthCare System), 5.00%, 7/1/47(1) | | | 2,375 | | | | 2,680,330 | |
| | |
Massachusetts Health and Educational Facilities Authority, (Dana-Farber Cancer Institute), 5.00%, 12/1/37 | | | 775 | | | | 781,549 | |
| | |
Massachusetts Health and Educational Facilities Authority, (Southcoast Health System), 5.00%, 7/1/29 | | | 1,000 | | | | 1,009,010 | |
| | |
Michigan Finance Authority, (Trinity Health Credit Group), 5.00%, 12/1/42(1) | | | 7,300 | | | | 8,410,330 | |
| | | | |
| | 8 | | See Notes to Financial Statements. |
Eaton Vance
Municipal Bond Fund
March 31, 2019
Portfolio of Investments (Unaudited) — continued
| | | | | | | | |
| Security | | Principal
Amount
(000’s omitted) | | | Value | |
|
| Hospital (continued) | |
| | |
Middleburg Heights, OH, (Southwest General Health Center), 5.25%, 8/1/36 | | $ | 500 | | | $ | 534,225 | |
| | |
Middleburg Heights, OH, (Southwest General Health Center), 5.25%, 8/1/41 | | | 755 | | | | 804,905 | |
| | |
Monroeville Finance Authority, PA, (UPMC Obligated Group), 5.00%, 2/15/42 | | | 500 | | | | 537,765 | |
| | |
New Jersey Health Care Facilities Financing Authority, (Barnabas Health Obligated Group), 4.25%, 7/1/44 | | | 450 | | | | 468,248 | |
| | |
New Jersey Health Care Facilities Financing Authority, (Palisades Medical Center), Prerefunded to 7/1/23, 5.25%, 7/1/31 | | | 135 | | | | 154,494 | |
| | |
New Jersey Health Care Facilities Financing Authority, (Princeton HealthCare System), 5.00%, 7/1/39(1) | | | 1,750 | | | | 2,017,067 | |
| | |
New Jersey Health Care Facilities Financing Authority, (Robert Wood Johnson University Hospital), 5.25%, 7/1/35 | | | 5,000 | | | | 5,607,600 | |
| | |
Northampton County General Purpose Authority, PA, (Saint Luke’s Hospital), 5.50%, 8/15/33 | | | 250 | | | | 261,083 | |
| | |
Ohio Higher Educational Facility Commission, (Cleveland Clinic Health System), Series 2011A, 5.00%, 1/1/32 | | | 500 | | | | 526,955 | |
| | |
Ohio Higher Educational Facility Commission, (Cleveland Clinic Health System), Series 2012A, 5.00%, 1/1/32 | | | 12,500 | | | | 13,515,250 | |
| | |
Ohio Higher Educational Facility Commission, (Summa Health System), 5.75%, 11/15/40 | | | 170 | | | | 176,474 | |
| | |
Ohio Higher Educational Facility Commission, (University Hospitals Health System, Inc.), 5.00%, 1/15/27 | | | 565 | | | | 626,280 | |
| | |
Ohio Higher Educational Facility Commission, (University Hospitals Health System, Inc.), 5.00%, 1/15/29 | | | 165 | | | | 182,071 | |
| | |
Pennsylvania Higher Educational Facilities Authority, (University of Pennsylvania Health System), 4.00%, 8/15/42(1) | | | 1,600 | | | | 1,693,728 | |
| | |
Pennsylvania Higher Educational Facilities Authority, (UPMC Health System), 5.00%, 5/15/31 | | | 675 | | | | 698,422 | |
| | |
Royal Oak Hospital Finance Authority, MI, (William Beaumont Hospital), 5.00%, 9/1/39 | | | 1,000 | | | | 1,096,420 | |
| | |
Tampa, FL, (BayCare Health System), 4.00%, 11/15/46(1) | | | 3,000 | | | | 3,125,940 | |
| | |
Tampa, FL, (BayCare Health System), 5.00%, 11/15/46(1) | | | 12,000 | | | | 13,599,960 | |
| | |
Tarrant County Cultural Education Facilities Finance Corp., TX, (Baylor Scott & White Health), 5.00%, 11/15/45(1) | | | 12,900 | | | | 14,561,907 | |
| | |
Vermont Educational and Health Buildings Financing Agency, (University of Vermont Medical Center), 4.00%, 12/1/42 | | | 2,000 | | | | 2,085,560 | |
| | |
Vermont Educational and Health Buildings Financing Agency, (University of Vermont Medical Center), 5.00%, 12/1/33 | | | 1,600 | | | | 1,855,008 | |
| | |
West Virginia Hospital Finance Authority, (West Virginia United Health System Obligated Group), 5.375%, 6/1/38 | | | 7,605 | | | | 8,454,478 | |
| | |
Wisconsin Health and Educational Facilities Authority, (Ascension Health Alliance Senior Credit Group), 5.00%, 11/15/41(1) | | | 11,500 | | | | 12,286,140 | |
| | |
| | | | | | | $ | 121,211,053 | |
| | | | | | | | |
| Security | | Principal
Amount
(000’s omitted) | | | Value | |
|
| Housing — 0.3% | |
| | |
East Hempfield Township Industrial Development Authority, PA, (Student Services, Inc.), 5.00%, 7/1/39 | | $ | 175 | | | $ | 184,384 | |
| | |
Seattle Housing Authority, WA, 3.50%, 12/1/38 | | | 2,245 | | | | 2,272,209 | |
| | |
Seattle Housing Authority, WA, 3.625%, 12/1/43 | | | 1,000 | | | | 1,009,690 | |
| | |
| | | | | | | $ | 3,466,283 | |
|
| Industrial Development Revenue — 0.4% | |
| | |
Maricopa County Pollution Control Corp., AZ, (El Paso Electric Co.), 4.50%, 8/1/42 | | $ | 4,840 | | | $ | 4,996,864 | |
| | |
| | | | | | | $ | 4,996,864 | |
|
| Insured – Bond Bank — 0.1% | |
| | |
Puerto Rico Municipal Finance Agency, (AGM), 5.00%, 8/1/27 | | $ | 700 | | | $ | 721,056 | |
| | |
| | | | | | | $ | 721,056 | |
|
| Insured – Education — 2.0% | |
| | |
Massachusetts College Building Authority, (XLCA), 5.50%, 5/1/39 | | $ | 700 | | | $ | 953,225 | |
| | |
Massachusetts Development Finance Agency, (Boston University), (XLCA), 6.00%, 5/15/59 | | | 1,105 | | | | 1,398,311 | |
| | |
Massachusetts Development Finance Agency, (College of the Holy Cross), (AMBAC), 5.25%, 9/1/32(1) | | | 750 | | | | 985,635 | |
| | |
Massachusetts Development Finance Agency, (College of the Holy Cross), (AMBAC), 5.25%, 9/1/32 | | | 15,900 | | | | 20,895,462 | |
| | |
New Jersey Educational Facilities Authority, (William Paterson University), (AGC), 4.75%, 7/1/34 | | | 85 | | | | 85,154 | |
| | |
New Jersey Educational Facilities Authority, (William Paterson University), (AGC), 5.00%, 7/1/38 | | | 20 | | | | 20,043 | |
| | |
| | | | | | | $ | 24,337,830 | |
|
| Insured – Electric Utilities — 1.9% | |
| | |
Chelan County Public Utility District No. 1, WA, (Columbia River), (NPFG), 0.00%, 6/1/23 | | $ | 6,335 | | | $ | 5,859,938 | |
| | |
Cleveland, OH, Public Power System Revenue, (NPFG), 0.00%, 11/15/27 | | | 2,750 | | | | 2,184,820 | |
| | |
Cleveland, OH, Public Power System Revenue, (NPFG), 0.00%, 11/15/38 | | | 1,000 | | | | 492,080 | |
| | |
Louisiana Energy and Power Authority, (AGM), 5.25%, 6/1/38 | | | 5,640 | | | | 6,280,704 | |
| | |
Ohio Municipal Electric Generation Agency, (NPFG), 0.00%, 2/15/27 | | | 5,000 | | | | 4,097,950 | |
| | |
Puerto Rico Electric Power Authority, (NPFG), 5.25%, 7/1/23 | | | 1,095 | | | | 1,159,277 | |
| | |
Puerto Rico Electric Power Authority, (NPFG), 5.25%, 7/1/26 | | | 1,530 | | | | 1,647,932 | |
| | |
Puerto Rico Electric Power Authority, (NPFG), 5.25%, 7/1/34 | | | 490 | | | | 524,702 | |
| | |
Puerto Rico Electric Power Authority, (NPFG), 5.25%, 7/1/35 | | | 1,085 | | | | 1,158,650 | |
| | |
| | | | | | | $ | 23,406,053 | |
| | | | |
| | 9 | | See Notes to Financial Statements. |
Eaton Vance
Municipal Bond Fund
March 31, 2019
Portfolio of Investments (Unaudited) — continued
| | | | | | | | |
| Security | | Principal
Amount
(000’s omitted) | | | Value | |
|
| Insured – Escrowed / Prerefunded — 4.5% | |
| | |
Bayonne, NJ, (AGM), Prerefunded to 7/1/19, 5.50%, 7/1/39 | | $ | 1,000 | | | $ | 1,009,800 | |
| | |
Brooklyn City School District, OH, (AGM), Prerefunded to 12/1/20, 5.00%, 12/1/38 | | | 445 | | | | 470,414 | |
| | |
Bucks County Water and Sewer Authority, PA, (AGM), Prerefunded to 12/1/20, 5.00%, 12/1/35 | | | 500 | | | | 528,980 | |
| | |
Erie Sewer Authority, PA, (AMBAC), Escrowed to Maturity, 0.00%, 12/1/25 | | | 180 | | | | 157,126 | |
| | |
Iowa Finance Authority, (Iowa Health System), (AGC), Prerefunded to 8/15/19, 5.625%, 8/15/37 | | | 2,625 | | | | 2,664,191 | |
| | |
Kane, Cook and DuPage Counties School District No. 46, IL, (AMBAC), Escrowed to Maturity, 0.00%, 1/1/22 | | | 13,145 | | | | 12,527,185 | |
| | |
Kent State University, OH, (AGC), Prerefunded to 5/1/19, 5.00%, 5/1/26 | | | 920 | | | | 922,576 | |
| | |
Massachusetts College Building Authority, (NPFG), Escrowed to Maturity, 0.00%, 5/1/26 | | | 1,600 | | | | 1,379,040 | |
| | |
Massachusetts Health and Educational Facilities Authority, (Cape Cod Healthcare), (AGC), Prerefunded to 11/15/19, 5.00%, 11/15/25 | | | 220 | | | | 224,726 | |
| | |
Michigan Hospital Finance Authority, (St. John Health System), (AMBAC), Escrowed to Maturity, 5.00%, 5/15/28 | | | 1,135 | | | | 1,210,795 | |
| | |
Michigan House of Representatives, (AMBAC), Escrowed to Maturity, 0.00%, 8/15/23 | | | 2,615 | | | | 2,409,696 | |
| | |
Palm Beach County Solid Waste Authority, FL, (BHAC), Prerefunded to 10/1/19, 5.00%, 10/1/24 | | | 210 | | | | 213,679 | |
| | |
Palm Beach County Solid Waste Authority, FL, (BHAC), Prerefunded to 10/1/19, 5.00%, 10/1/24 | | | 2,515 | | | | 2,559,063 | |
| | |
Palm Beach County Solid Waste Authority, FL, (BHAC), Prerefunded to 10/1/19, 5.00%, 10/1/26 | | | 2,000 | | | | 2,035,040 | |
| | |
Palm Springs Unified School District, CA, (Election of 2008), (AGC), Prerefunded to 8/1/19, 5.00%, 8/1/32 | | | 8,955 | | | | 9,061,654 | |
| | |
Palm Springs Unified School District, CA, (Election of 2008), (AGC), Prerefunded to 8/1/19, 5.00%, 8/1/33 | | | 2,750 | | | | 2,782,753 | |
| | |
Texas Transportation Commission, (Central Texas Turnpike System), (AMBAC), Escrowed to Maturity, 0.00%, 8/15/20 | | | 5,570 | | | | 5,447,516 | |
| | |
Washington Health Care Facilities Authority, (MultiCare Health System), (AGC), Prerefunded to 8/15/19, 6.00%, 8/15/39 | | | 7,340 | | | | 7,458,247 | |
| | |
Youngstown State University, OH, (AGC), Prerefunded to 6/15/19, 5.50%, 12/15/33 | | | 1,000 | | | | 1,008,060 | |
| | |
| | | | | | | $ | 54,070,541 | |
|
| Insured – General Obligations — 6.0% | |
| | |
Bay City Brownfield Redevelopment Authority, MI, (BAM), 5.375%, 10/1/38 | | $ | 500 | | | $ | 559,185 | |
| | |
Chicago Park District, IL, (BAM), 5.00%, 1/1/39 | | | 35 | | | | 37,896 | |
| | | | | | | | |
| Security | | Principal
Amount
(000’s omitted) | | | Value | |
|
| Insured – General Obligations (continued) | |
| | |
Chicago Park District, IL, (BAM), 5.00%, 1/1/39(1) | | $ | 13,600 | | | $ | 14,725,264 | |
| | |
Cincinnati City School District, OH, (AGM), (FGIC), 5.25%, 12/1/30 | | | 4,500 | | | | 5,910,750 | |
| | |
Clark County, NV, (AMBAC), 2.50%, 11/1/36 | | | 11,845 | | | | 10,965,509 | |
| | |
Erie School District, PA, (AMBAC), 0.00%, 9/1/30 | | | 1,000 | | | | 666,430 | |
| | |
Frisco Independent School District, TX, (PSF Guaranteed), (AGM), 2.75%, 8/15/39 | | | 9,530 | | | | 8,845,555 | |
| | |
Irvington Township, NJ, (AGM), 0.00%, 7/15/26 | | | 4,165 | | | | 3,478,983 | |
| | |
Kane, Cook and DuPage Counties School District No. 46, IL, (AMBAC), 0.00%, 1/1/22 | | | 16,605 | | | | 15,620,157 | |
| | |
Livonia Public Schools, MI, (AGM), 5.00%, 5/1/43 | | | 750 | | | | 831,465 | |
| | |
Massachusetts, (AMBAC), 5.50%, 8/1/30 | | | 1,900 | | | | 2,504,238 | |
| | |
McKeesport School District, PA, (NPFG), 0.00%, 10/1/21 | | | 2,555 | | | | 2,416,596 | |
| | |
Okemos Public Schools, MI, (NPFG), 0.00%, 5/1/19 | | | 1,330 | | | | 1,328,005 | |
| | |
Plain School District, OH, (NPFG), 0.00%, 12/1/27 | | | 2,400 | | | | 1,931,208 | |
| | |
Shaler Area School District, PA, (XLCA), 0.00%, 9/1/33 | | | 2,550 | | | | 1,646,280 | |
| | |
Westland Tax Increment Finance Authority, MI, (BAM), 5.25%, 4/1/34 | | | 500 | | | | 551,650 | |
| | |
| | | | | | | $ | 72,019,171 | |
|
| Insured – Hospital — 1.4% | |
| | |
Allegheny County Hospital Development Authority, PA, (UPMC Health System), (NPFG), 6.00%, 7/1/24 | | $ | 250 | | | $ | 299,868 | |
| | |
New Jersey Health Care Facilities Financing Authority, (Virtua Health), (AGC), 5.50%, 7/1/38 | | | 16,860 | | | | 17,010,391 | |
| | |
| | | | | | | $ | 17,310,259 | |
|
| Insured – Industrial Development Revenue — 1.0% | |
| | |
Pennsylvania Economic Development Financing Authority, (Aqua Pennsylvania, Inc.), (BHAC), 5.00%, 10/1/39(1) | | $ | 10,000 | | | $ | 10,150,200 | |
| | |
Pennsylvania Economic Development Financing Authority, (Aqua Pennsylvania, Inc.), (BHAC), 5.00%, 10/1/39 | | | 1,340 | | | | 1,360,127 | |
| | |
| | | | | | | $ | 11,510,327 | |
|
| Insured – Lease Revenue / Certificates of Participation — 0.3% | |
| | |
Commonwealth Financing Authority, PA, (AGC), 5.00%, 6/1/31 | | $ | 500 | | | $ | 502,440 | |
| | |
Essex County Improvement Authority, NJ, (NPFG), 5.50%, 10/1/30 | | | 2,000 | | | | 2,623,320 | |
| | |
New Jersey Economic Development Authority, (School Facilities Construction), (NPFG), 5.50%, 9/1/28 | | | 500 | | | | 615,955 | |
| | |
| | | | | | | $ | 3,741,715 | |
| | | | |
| | 10 | | See Notes to Financial Statements. |
Eaton Vance
Municipal Bond Fund
March 31, 2019
Portfolio of Investments (Unaudited) — continued
| | | | | | | | |
| Security | | Principal
Amount
(000’s omitted) | | | Value | |
|
| Insured – Other Revenue — 1.5% | |
| | |
Harris County-Houston Sports Authority, TX, (AGM), (NPFG), 0.00%, 11/15/34 | | $ | 19,335 | | | $ | 10,400,877 | |
| | |
New York City Industrial Development Agency, NY, (Yankee Stadium), (AGC), 7.00%, 3/1/49 | | | 7,750 | | | | 7,786,502 | |
| | |
| | | | | | | $ | 18,187,379 | |
|
| Insured – Special Tax Revenue — 6.1% | |
| | |
Alabama Public School and College Authority, (AGM), 2.50%, 12/1/27 | | $ | 15,975 | | | $ | 15,978,514 | |
| | |
Garden State Preservation Trust, NJ, (AGM), 0.00%, 11/1/21 | | | 1,000 | | | | 953,240 | |
| | |
Hamilton County, OH, Sales Tax Revenue, (AMBAC), 0.00%, 12/1/23 | | | 1,245 | | | | 1,138,266 | |
| | |
Hamilton County, OH, Sales Tax Revenue, (AMBAC), 0.00%, 12/1/24 | | | 3,665 | | | | 3,266,688 | |
| | |
Houston, TX, Hotel Occupancy Tax Revenue, (AMBAC), 0.00%, 9/1/24 | | | 18,035 | | | | 15,945,285 | |
| | |
Massachusetts, Dedicated Tax Revenue, (NPFG), 5.50%, 1/1/29 | | | 750 | | | | 976,545 | |
| | |
Miami-Dade County, FL, Professional Sports Franchise Facilities, (AGC), 7.00%, (0.00% until 10/1/19), 10/1/39 | | | 18,000 | | | | 24,219,720 | |
| | |
New Jersey Economic Development Authority, (Motor Vehicle Surcharges), (XLCA), 0.00%, 7/1/26 | | | 420 | | | | 340,591 | |
| | |
New Jersey Economic Development Authority, (Motor Vehicle Surcharges), (XLCA), 0.00%, 7/1/27 | | | 1,120 | | | | 874,966 | |
| | |
Pennsylvania Turnpike Commission, (AGM), 5.25%, 7/15/30 | | | 1,105 | | | | 1,411,416 | |
| | |
Pennsylvania Turnpike Commission, (AGM), Escrowed to Maturity, 5.25%, 7/15/30 | | | 1,435 | | | | 1,885,375 | |
| | |
Reno, NV, Capital Improvement Revenue, (AGM), 4.00%, 6/1/43 | | | 6,000 | | | | 6,253,680 | |
| | |
| | | | | | | $ | 73,244,286 | |
|
| Insured – Student Loan — 0.3% | |
| | |
Maine Educational Loan Authority, (AGC), 5.625%, 12/1/27 | | $ | 3,620 | | | $ | 3,641,322 | |
| | |
| | | | | | | $ | 3,641,322 | |
|
| Insured – Transportation — 8.5% | |
| | |
Chicago, IL, (O’Hare International Airport), (AGM), 5.00%, 1/1/28 | | $ | 2,500 | | | $ | 2,781,950 | |
| | |
Chicago, IL, (O’Hare International Airport), (AGM), 5.00%, 1/1/29 | | | 1,260 | | | | 1,398,713 | |
| | |
Chicago, IL, (O’Hare International Airport), (AGM), 5.125%, 1/1/30 | | | 2,200 | | | | 2,449,568 | |
| | |
Chicago, IL, (O’Hare International Airport), (AGM), 5.125%, 1/1/31 | | | 1,750 | | | | 1,945,177 | |
| | |
Chicago, IL, (O’Hare International Airport), (AGM), 5.25%, 1/1/32 | | | 1,115 | | | | 1,240,515 | |
| | |
Chicago, IL, (O’Hare International Airport), (AGM), 5.25%, 1/1/33 | | | 1,150 | | | | 1,277,259 | |
| | | | | | | | |
| Security | | Principal
Amount
(000’s omitted) | | | Value | |
|
| Insured – Transportation (continued) | |
| | |
Clark County, NV, (Las Vegas-McCarran International Airport), (AGM), 5.25%, 7/1/39 | | $ | 9,665 | | | $ | 9,888,455 | |
| | |
E-470 Public Highway Authority, CO, (NPFG), 0.00%, 9/1/21 | | | 10,200 | | | | 9,700,710 | |
| | |
E-470 Public Highway Authority, CO, (NPFG), 0.00%, 9/1/22 | | | 7,800 | | | | 7,245,966 | |
| | |
E-470 Public Highway Authority, CO, (NPFG), 0.00%, 9/1/39 | | | 25,000 | | | | 9,952,500 | |
| | |
Metropolitan Transportation Authority, NY, Green Bonds, (AGM), 4.00%, 11/15/46 | | | 10,000 | | | | 10,664,200 | |
| | |
Metropolitan Washington Airports Authority, D.C., (BHAC), 5.00%, 10/1/24 | | | 1,000 | | | | 1,017,930 | |
| | |
Metropolitan Washington Airports Authority, D.C., (BHAC), 5.00%, 10/1/29 | | | 2,320 | | | | 2,358,906 | |
| | |
New Jersey Turnpike Authority, (AGM), (BHAC), 5.25%, 1/1/29 | | | 1,000 | | | | 1,284,170 | |
| | |
Port Palm Beach District, FL, (XLCA), 0.00%, 9/1/24 | | | 1,605 | | | | 1,329,582 | |
| | |
Port Palm Beach District, FL, (XLCA), 0.00%, 9/1/25 | | | 1,950 | | | | 1,553,136 | |
| | |
Port Palm Beach District, FL, (XLCA), 0.00%, 9/1/26 | | | 1,000 | | | | 764,570 | |
| | |
Puerto Rico Highway and Transportation Authority, (AGC), 5.25%, 7/1/41 | | | 2,100 | | | | 2,304,708 | |
| | |
Puerto Rico Highway and Transportation Authority, (AGM), 5.00%, 7/1/32 | | | 475 | | | | 486,500 | |
| | |
San Joaquin Hills Transportation Corridor Agency, CA, (NPFG), 0.00%, 1/15/25 | | | 26,215 | | | | 22,359,036 | |
| | |
South Jersey Transportation Authority, NJ, (AGC), 5.50%, 11/1/33 | | | 180 | | | | 183,838 | |
| | |
Texas Transportation Commission, (Central Texas Turnpike System), (AMBAC), 0.00%, 8/15/20 | | | 10,275 | | | | 10,032,202 | |
| | |
| | | | | | | $ | 102,219,591 | |
|
| Insured – Water and Sewer — 4.5% | |
| | |
Chicago, IL, Wastewater Transmission Revenue, (NPFG), 0.00%, 1/1/23 | | $ | 13,670 | | | $ | 12,473,738 | |
| | |
DeKalb County, GA, Water and Sewerage Revenue, (AGM), 5.25%, 10/1/32(1) | | | 10,000 | | | | 12,123,900 | |
| | |
Erie Sewer Authority, PA, (AMBAC), 0.00%, 12/1/26 | | | 1,920 | | | | 1,499,654 | |
| | |
Massachusetts Water Resources Authority, (AGM), 5.25%, 8/1/32 | | | 5,540 | | | | 7,370,859 | |
| | |
Massachusetts Water Resources Authority, (AGM), 5.25%, 8/1/35 | | | 1,000 | | | | 1,351,470 | |
| | |
Massachusetts Water Resources Authority, (AGM), 5.25%, 8/1/38 | | | 1,070 | | | | 1,466,125 | |
| | |
Michigan Finance Authority, (Detroit Water and Sewerage Department), (AGM), 5.00%, 7/1/31 | | | 1,500 | | | | 1,688,595 | |
| | |
Michigan Finance Authority, (Detroit Water and Sewerage Department), (AGM), 5.00%, 7/1/32 | | | 2,845 | | | | 3,194,992 | |
| | |
Michigan Finance Authority, (Detroit Water and Sewerage Department), (AGM), 5.00%, 7/1/33 | | | 2,435 | | | | 2,724,789 | |
| | | | |
| | 11 | | See Notes to Financial Statements. |
Eaton Vance
Municipal Bond Fund
March 31, 2019
Portfolio of Investments (Unaudited) — continued
| | | | | | | | |
| Security | | Principal
Amount
(000’s omitted) | | | Value | |
|
| Insured – Water and Sewer (continued) | |
| | |
Michigan Finance Authority, (Detroit Water and Sewerage Department), (AGM), 5.00%, 7/1/35 | | $ | 2,970 | | | $ | 3,312,530 | |
| | |
Michigan Finance Authority, (Detroit Water and Sewerage Department), (AGM), 5.00%, 7/1/37 | | | 2,435 | | | | 2,703,264 | |
| | |
Middlesex County Improvement Authority, NJ, (Perth Amboy), (AMBAC), 0.00%, 9/1/24 | | | 2,150 | | | | 1,897,827 | |
| | |
Passaic Valley Sewerage Commissioners, NJ, (NPFG), 2.50%, 12/1/32 | | | 635 | | | | 594,614 | |
| | |
Pearland, TX, Waterworks and Sewer Systems, (NPFG), 3.50%, 9/1/31 | | | 1,220 | | | | 1,220,244 | |
| | |
Puerto Rico Aqueduct and Sewer Authority, (AGC), 5.00%, 7/1/28 | | | 890 | | | | 915,988 | |
| | |
| | | | | | | $ | 54,538,589 | |
|
| Lease Revenue / Certificates of Participation — 2.6% | |
| | |
Hudson Yards Infrastructure Corp., NY, 5.75%, 2/15/47 | | $ | 755 | | | $ | 809,564 | |
| | |
Hudson Yards Infrastructure Corp., NY, Prerefunded to 2/15/21, 5.75%, 2/15/47 | | | 1,225 | | | | 1,322,253 | |
| | |
Michigan State Building Authority, 5.00%, 10/15/51(1) | | | 2,200 | | | | 2,488,926 | |
| | |
New Jersey Health Care Facilities Financing Authority, (Hospital Asset Transformation Program), Prerefunded to 10/1/19, 5.75%, 10/1/31 | | | 2,235 | | | | 2,280,750 | |
| | |
North Carolina, Limited Obligation Bonds, 5.00%, 5/1/26(1) | | | 21,250 | | | | 24,613,450 | |
| | |
| | | | | | | $ | 31,514,943 | |
|
| Other Revenue — 2.7% | |
| | |
New York City Transitional Finance Authority, NY, (Building Aid), 5.00%, 7/15/36(1) | | $ | 10,750 | | | $ | 11,478,635 | |
| | |
New York City Transitional Finance Authority, NY, (Building Aid), 5.00%, 7/15/43 | | | 14,930 | | | | 17,103,062 | |
| | |
Oregon Department of Administrative Services, Lottery Revenue, 5.25%, 4/1/30 | | | 1,455 | | | | 1,555,671 | |
| | |
Texas Municipal Gas Acquisition and Supply Corp. III, Gas Supply Revenue, 5.00%, 12/15/30 | | | 1,960 | | | | 2,127,619 | |
| | |
| | | | | | | $ | 32,264,987 | |
|
| Senior Living / Life Care — 0.2% | |
| | |
Delaware Economic Development Authority, (ACTS Retirement-Life Communities, Inc. Obligated Group), 5.00%, 11/15/48 | | $ | 1,250 | | | $ | 1,389,587 | |
| | |
Franklin County, OH, (Friendship Village of Dublin), 5.00%, 11/15/44 | | | 525 | | | | 558,117 | |
| | |
New Jersey Economic Development Authority, (United Methodist Homes of New Jersey), 5.00%, 7/1/34 | | | 675 | | | | 700,819 | |
| | |
Warren County, OH, (Otterbein Homes Obligated Group), 5.75%, 7/1/33 | | | 220 | | | | 249,005 | |
| | |
| | | | | | | $ | 2,897,528 | |
| | | | | | | | |
| Security | | Principal
Amount
(000’s omitted) | | | Value | |
|
| Special Tax Revenue — 19.8% | |
| | |
Allegheny County Port Authority, PA, 5.75%, 3/1/29 | | $ | 1,500 | | | $ | 1,612,410 | |
| | |
Central Puget Sound Regional Transit Authority, WA, Sales and Use Tax Revenue, Green Bonds, 5.00%, 11/1/30(1) | | | 14,425 | | | | 16,981,254 | |
| | |
Central Puget Sound Regional Transit Authority, WA, Sales Tax and Motor Vehicle Excise Tax Revenue, Green Bonds, 5.00%, 11/1/41(1) | | | 10,000 | | | | 11,606,400 | |
| | |
Central Puget Sound Regional Transit Authority, WA, Sales Tax and Motor Vehicle Excise Tax Revenue, Green Bonds, 5.00%, 11/1/41 | | | 11,000 | | | | 12,767,040 | |
| | |
Cleveland, OH, Income Tax Revenue, 5.00%, 10/1/39(1) | | | 450 | | | | 527,531 | |
| | |
Cleveland, OH, Income Tax Revenue, 5.00%, 10/1/43(1) | | | 1,800 | | | | 2,089,224 | |
| | |
Connecticut, Special Tax Obligation, (Transportation Infrastructure),
5.00%, 1/1/31(1) | | | 20,000 | | | | 21,704,800 | |
| | |
Denver City and County, CO, Dedicated Tax Revenue, 5.00%, 8/1/41(1) | | | 10,000 | | | | 11,533,800 | |
| | |
Franklin County, OH, Sales Tax Revenue, 5.00%, 6/1/38(1) | | | 1,100 | | | | 1,322,134 | |
| | |
Franklin County, OH, Sales Tax Revenue, 5.00%, 6/1/43(1) | | | 1,100 | | | | 1,307,878 | |
| | |
Homewood City Board of Education, AL, 5.00%, 4/1/32 | | | 1,880 | | | | 2,017,071 | |
| | |
Massachusetts, (Rail Enhancement and Accelerated Bridge Programs),
5.00%, 6/1/47(1) | | | 2,000 | | | | 2,319,000 | |
| | |
Massachusetts Bay Transportation Authority, Sales Tax Revenue, 5.25%, 7/1/33 | | | 750 | | | | 967,890 | |
| | |
Massachusetts School Building Authority, Sales Tax Revenue, 5.00%, 8/15/37(1) | | | 20,200 | | | | 23,302,316 | |
| | |
Massachusetts School Building Authority, Sales Tax Revenue, 5.00%, 11/15/46(1) | | | 1,500 | | | | 1,740,330 | |
| | |
Metropolitan Transportation Authority, NY, Dedicated Tax Revenue, Green Bonds, 5.00%, 11/15/47 | | | 5,450 | | | | 6,359,223 | |
| | |
New York City Transitional Finance Authority, NY, Future Tax Revenue, 4.00%, 8/1/37(1) | | | 10,000 | | | | 10,759,400 | |
| | |
New York City Transitional Finance Authority, NY, Future Tax Revenue, 4.00%, 8/1/39(1) | | | 5,000 | | | | 5,353,050 | |
| | |
New York City Transitional Finance Authority, NY, Future Tax Revenue, 4.00%, 5/1/42 | | | 3,120 | | | | 3,356,246 | |
| | |
New York City Transitional Finance Authority, NY, Future Tax Revenue, 5.00%, 2/1/37(1) | | | 20,000 | | | | 21,601,200 | |
| | |
New York City Transitional Finance Authority, NY, Future Tax Revenue, 5.50%, 11/1/35(1) | | | 2,145 | | | | 2,275,137 | |
| | |
New York City Transitional Finance Authority, NY, Future Tax Revenue, Prerefunded to 11/1/20, 5.50%, 11/1/35(1) | | | 1,655 | | | | 1,759,613 | |
| | |
New York Convention Center Development Corp., Hotel Occupancy Tax, 5.00%, 11/15/45(1) | | | 13,000 | | | | 14,668,290 | |
| | |
New York Dormitory Authority, Personal Income Tax Revenue, 5.00%, 6/15/31 | | | 10,000 | | | | 11,134,200 | |
| | |
New York Dormitory Authority, Sales Tax Revenue, 4.00%, 3/15/46(1) | | | 14,000 | | | | 14,899,640 | |
| | |
New York Dormitory Authority, Sales Tax Revenue, 5.00%, 3/15/34 | | | 3,750 | | | | 4,176,225 | |
| | | | |
| | 12 | | See Notes to Financial Statements. |
Eaton Vance
Municipal Bond Fund
March 31, 2019
Portfolio of Investments (Unaudited) — continued
| | | | | | | | |
| Security | | Principal
Amount
(000’s omitted) | | | Value | |
|
| Special Tax Revenue (continued) | |
| | |
New York Dormitory Authority, Sales Tax Revenue, 5.00%, 3/15/35 | | $ | 13,750 | | | $ | 15,294,675 | |
| | |
New York Dormitory Authority, Sales Tax Revenue, 5.00%, 3/15/43(1) | | | 6,000 | | | | 7,069,860 | |
| | |
New York State Urban Development Corp., Personal Income Tax Revenue, 4.00%, 3/15/45(1) | | | 2,800 | | | | 3,001,488 | |
| | |
Pennsylvania Turnpike Commission, Oil Franchise Tax Revenue, 5.25%, 12/1/44(1) | | | 3,750 | | | | 4,496,850 | |
| | |
| | | | | | | $ | 238,004,175 | |
|
| Student Loan — 0.1% | |
| | |
New Jersey Higher Education Student Assistance Authority, 5.625%, 6/1/30 | | $ | 965 | | | $ | 971,601 | |
| | |
| | | | | | | $ | 971,601 | |
|
| Transportation — 15.4% | |
| | |
Austin, TX, Airport System Revenue, 5.00%, 11/15/41 | | $ | 2,110 | | | $ | 2,406,582 | |
| | |
Chicago, IL, (O’Hare International Airport), 5.00%, 1/1/34 | | | 1,000 | | | | 1,131,520 | |
| | |
Chicago, IL, (O’Hare International Airport), 5.00%, 1/1/36 | | | 6,000 | | | | 6,831,780 | |
| | |
Chicago, IL, (O’Hare International Airport), Series 2016C, 5.00%, 1/1/38 | | | 2,105 | | | | 2,383,470 | |
| | |
Chicago, IL, (O’Hare International Airport), Series 2018B, 5.00%, 1/1/38 | | | 1,500 | | | | 1,766,910 | |
| | |
Dallas and Fort Worth, TX, (Dallas/Fort Worth International Airport), 5.25%, 11/1/30 | | | 3,845 | | | | 4,402,448 | |
| | |
Dallas and Fort Worth, TX, (Dallas/Fort Worth International Airport), 5.25%, 11/1/31 | | | 5,940 | | | | 6,787,163 | |
| | |
Delaware River Joint Toll Bridge Commission of Pennsylvania and New Jersey, 5.00%, 7/1/37(1) | | | 1,150 | | | | 1,348,881 | |
| | |
Delaware River Joint Toll Bridge Commission of Pennsylvania and New Jersey, 5.00%, 7/1/37 | | | 20 | | | | 23,459 | |
| | |
Delaware River Joint Toll Bridge Commission of Pennsylvania and New Jersey, 5.00%, 7/1/47(1) | | | 4,575 | | | | 5,292,634 | |
| | |
Delaware River Joint Toll Bridge Commission of Pennsylvania and New Jersey, 5.00%, 7/1/47 | | | 15 | | | | 17,353 | |
| | |
Illinois Toll Highway Authority,
5.00%, 1/1/37(1) | | | 10,000 | | | | 11,417,900 | |
| | |
Illinois Toll Highway Authority,
5.00%, 1/1/41(1) | | | 12,425 | | | | 14,087,465 | |
| | |
Kansas Department of Transportation, 5.00%, 9/1/35(1) | | | 10,000 | | | | 11,505,100 | |
| | |
Los Angeles Department of Airports, CA, (Los Angeles International Airport), 5.25%, 5/15/28 | | | 3,750 | | | | 3,919,988 | |
| | |
Massachusetts Department of Transportation, (Metropolitan Highway System), 5.00%, 1/1/32 | | | 1,000 | | | | 1,023,690 | |
| | |
Massachusetts Department of Transportation, (Metropolitan Highway System), 5.00%, 1/1/37 | | | 500 | | | | 511,660 | |
| | |
Metropolitan Transportation Authority, NY, 5.25%, 11/15/32 | | | 5,000 | | | | 5,669,250 | |
| | |
Metropolitan Transportation Authority, NY, Green Bonds, 4.00%, 11/15/38 | | | 1,645 | | | | 1,752,912 | |
| | | | | | | | |
| Security | | Principal
Amount
(000’s omitted) | | | Value | |
|
| Transportation (continued) | |
| | |
Miami-Dade County, FL, Aviation Revenue, 5.00%, 10/1/37 | | $ | 4,615 | | | $ | 5,206,089 | |
| | |
Miami-Dade County, FL, (Miami International Airport), 5.00%, 10/1/41 | | | 12,920 | | | | 13,479,953 | |
| | |
New Jersey Transportation Trust Fund Authority, (Transportation Program), 5.00%, 6/15/38 | | | 130 | | | | 138,561 | |
| | |
New Jersey Transportation Trust Fund Authority, (Transportation System), 5.00%, 12/15/24 | | | 10,000 | | | | 11,290,100 | |
| | |
New Jersey Transportation Trust Fund Authority, (Transportation System), 5.25%, 12/15/23 | | | 1,000 | | | | 1,125,400 | |
| | |
New Jersey Transportation Trust Fund Authority, (Transportation System), 5.50%, 6/15/31 | | | 1,150 | | | | 1,213,549 | |
| | |
New Jersey Turnpike Authority, 4.00%, 1/1/43 | | | 2,870 | | | | 3,047,165 | |
| | |
New Jersey Turnpike Authority, 5.00%, 1/1/48(1) | | | 10,000 | | | | 11,707,700 | |
| | |
New York Liberty Development Corp., (4 World Trade Center), 5.00%, 11/15/31 | | | 1,070 | | | | 1,157,130 | |
| | |
Orlando-Orange County Expressway Authority, FL, Prerefunded to 7/1/20, 5.00%, 7/1/35 | | | 2,635 | | | | 2,746,461 | |
| | |
Orlando-Orange County Expressway Authority, FL, Prerefunded to 7/1/20, 5.00%, 7/1/35 | | | 700 | | | | 730,058 | |
| | |
Orlando-Orange County Expressway Authority, FL, Prerefunded to 7/1/20, 5.00%, 7/1/40 | | | 1,155 | | | | 1,203,857 | |
| | |
Orlando-Orange County Expressway Authority, FL, Prerefunded to 7/1/20, 5.00%, 7/1/40 | | | 1,810 | | | | 1,887,721 | |
| | |
Pennsylvania Turnpike Commission, Prerefunded to 12/1/20, 5.35%, 12/1/30 | | | 190 | | | | 201,455 | |
| | |
Port Authority of New York and New Jersey, 4.00%, 9/1/43(1) | | | 14,000 | | | | 15,125,040 | |
| | |
Port Authority of New York and New Jersey, 5.00%, 12/1/34(1) | | | 16,400 | | | | 18,591,368 | |
| | |
Port Authority of New York and New Jersey, 5.00%, 10/15/35(1) | | | 2,675 | | | | 3,127,690 | |
| | |
Port Authority of New York and New Jersey, 5.00%, 7/15/39 | | | 5,000 | | | | 5,196,450 | |
| | |
Port Authority of New York and New Jersey, 5.00%, 10/15/42(1) | | | 3,750 | | | | 4,372,162 | |
| | |
South Jersey Transportation Authority, NJ, 5.00%, 11/1/39 | | | 200 | | | | 216,242 | |
| | |
Texas Transportation Commission, (Central Texas Turnpike System), 5.00%, 8/15/37 | | | 1,500 | | | | 1,648,785 | |
| | |
Texas Transportation Commission, (Central Texas Turnpike System), 5.00%, 8/15/42 | | | 265 | | | | 289,086 | |
| | |
| | | | | | | $ | 185,982,187 | |
|
| Water and Sewer — 11.0% | |
| | |
Atlanta, GA, Water and Wastewater Revenue, 5.00%, 11/1/43(1) | | $ | 3,750 | | | $ | 4,408,613 | |
| | |
Atlanta, GA, Water and Wastewater Revenue, 5.00%, 11/1/47(1) | | | 5,900 | | | | 6,910,139 | |
| | |
Charleston, SC, Waterworks and Sewer Revenue, 5.00%, 1/1/45(1) | | | 25,000 | | | | 28,533,250 | |
| | |
Dallas, TX, Waterworks and Sewer System Revenue, 5.00%, 10/1/41(1) | | | 15,000 | | | | 17,521,500 | |
| | | | |
| | 13 | | See Notes to Financial Statements. |
Eaton Vance
Municipal Bond Fund
March 31, 2019
Portfolio of Investments (Unaudited) — continued
| | | | | | | | |
| Security | | Principal
Amount
(000’s omitted) | | | Value | |
|
| Water and Sewer (continued) | |
| | |
Detroit, MI, Sewage Disposal System, 5.00%, 7/1/32 | | $ | 2,625 | | | $ | 2,830,564 | |
| | |
Detroit, MI, Sewage Disposal System, 5.25%, 7/1/39 | | | 2,345 | | | | 2,532,694 | |
| | |
Detroit, MI, Water Supply System, 5.25%, 7/1/41 | | | 3,210 | | | | 3,416,949 | |
| | |
Grand Rapids, MI, Sanitary Sewer System Revenue, 5.00%, 1/1/43(1) | | | 2,500 | | | | 2,914,400 | |
| | |
Massachusetts Water Resources Authority, Green Bonds, 5.00%, 8/1/40(1) | | | 2,000 | | | | 2,323,420 | |
| | |
Metropolitan St. Louis Sewer District, MO, 5.00%, 5/1/35(1) | | | 8,750 | | | | 10,124,362 | |
| | |
Metropolitan St. Louis Sewer District, MO, 5.00%, 5/1/36(1) | | | 7,925 | | | | 9,151,235 | |
| | |
New York City Municipal Water Finance Authority, NY, 5.00%, 6/15/31 | | | 10,000 | | | | 10,972,300 | |
| | |
New York City Municipal Water Finance Authority, NY, (Water and Sewer System), (SPA: State Street Bank and Trust Co.), 1.51%, 6/15/49(2) | | | 1,000 | | | | 1,000,000 | |
| | |
Northeast Ohio Regional Sewer District, 4.00%, 11/15/33(1) | | | 1,000 | | | | 1,055,980 | |
| | |
Passaic County Utilities Authority, NJ, 5.00%, 3/1/37 | | | 695 | | | | 893,652 | |
| | |
Port Huron, MI, Water Supply System, 5.25%, 10/1/31 | | | 250 | | | | 269,025 | |
| | |
Portland, OR, Water System, 5.00%, 5/1/36 | | | 5,385 | | | | 5,730,340 | |
| | |
Sussex County Municipal Utilities Authority, NJ, 0.00%, 12/1/37 | | | 1,000 | | | | 554,120 | |
| | |
Texas Water Development Board, 4.00%, 10/15/47(1) | | | 2,900 | | | | 3,102,101 | |
| | |
Texas Water Development Board, 5.00%, 10/15/40(1) | | | 15,500 | | | | 17,782,065 | |
| | |
| | | | | | | $ | 132,026,709 | |
| |
Total Tax-Exempt Municipal Securities — 162.7%
(identified cost $1,838,871,061) | | | $ | 1,959,410,424 | |
|
| Trust Units — 0.0%(4) | |
| Security | | Notional Amount (000’s omitted) | | | Value | |
|
| Insured – Special Tax Revenue — 0.0%(4) | |
| | |
COFINA Series 2007A Senior Bonds Due 2045 National Custodial Trust (taxable), 8/1/45(5) | | $ | 159 | | | $ | 131,149 | |
| | |
COFINA Series 2007A Senior Bonds Due 2045 National Custodial Trust (non-taxable), 8/1/45(5) | | | 483 | | | | 424,263 | |
| |
Total Trust Units — 0.0%(4)
(identified cost $528,980) | | | $ | 555,412 | |
| |
Total Investments — 162.7%
(identified cost $1,839,400,041) | | | $ | 1,959,965,836 | |
| |
Other Assets, Less Liabilities — (62.7)% | | | $ | (755,303,091 | ) |
| |
Net Assets — 100.0% | | | $ | 1,204,662,745 | |
The percentage shown for each investment category in the Portfolio of Investments is based on net assets.
At March 31, 2019, the concentration of the Fund’s investments in the various states and territories, determined as a percentage of total investments, is as follows:
| | | | |
| |
| New York | | | 15.1% | |
| |
| Others, representing less than 10% individually | | | 84.9% | |
The Fund invests primarily in debt securities issued by municipalities. The ability of the issuers of the debt securities to meet their obligations may be affected by economic developments in a specific industry or municipality. In order to reduce the risk associated with such economic developments, at March 31, 2019, 23.4% of total investments are backed by bond insurance of various financial institutions and financial guaranty assurance agencies. The aggregate percentage insured by an individual financial institution or financial guaranty assurance agency ranged from 0.3% to 6.9% of total investments.
| (1) | Security represents the municipal bond held by a trust that issues residual interest bonds (see Note 1G). |
| (2) | Variable rate demand obligation that may be tendered at par on any day for payment the same or next business day. The stated interest rate, which generally resets daily, is determined by the remarketing agent and represents the rate in effect at March 31, 2019. |
| (3) | When-issued security. |
| (4) | Amount is less than 0.05%. |
| (5) | Security was received in connection with the restructuring of an insured zero-coupon bond issued by the Puerto Rico Sales Tax Financing Corporation (“COFINA”) (the “Original Bond”). The notional amount of the combined taxable and tax-exempt trust units reflects the accreted amount of the Original Bond from original issuance through the restructuring date. Each trust certificate represents an ownership interest in various coupon paying and zero-coupon COFINA bonds and potential insurance payments pursuant to an insurance policy with National Public Finance Guarantee Corporation. The trust units have no stated coupon interest rate but accrete income to maturity at the annual rate of approximately 5.04%, the same rate as the Original Bond. |
Abbreviations:
| | | | |
| | |
| AGC | | – | | Assured Guaranty Corp. |
| | |
| AGM | | – | | Assured Guaranty Municipal Corp. |
| | |
| AMBAC | | – | | AMBAC Financial Group, Inc. |
| | |
| BAM | | – | | Build America Mutual Assurance Co. |
| | |
| BHAC | | – | | Berkshire Hathaway Assurance Corp. |
| | |
| FGIC | | – | | Financial Guaranty Insurance Company |
| | |
| NPFG | | – | | National Public Finance Guarantee Corp. |
| | |
| PSF | | – | | Permanent School Fund |
| | |
| SPA | | – | | Standby Bond Purchase Agreement |
| | |
| XLCA | | – | | XL Capital Assurance, Inc. |
| | | | |
| | 14 | | See Notes to Financial Statements. |
Eaton Vance
California Municipal Bond Fund
March 31, 2019
Portfolio of Investments (Unaudited)
| | | | | | | | |
| Tax-Exempt Investments — 172.4% | |
| Security | | Principal
Amount
(000’s omitted) | | | Value | |
|
| Education — 18.4% | |
| | |
California Educational Facilities Authority, (Claremont McKenna College), 5.00%, 1/1/27 | | $ | 770 | | | $ | 772,002 | |
| | |
California Educational Facilities Authority, (Harvey Mudd College), 5.25%, 12/1/31 | | | 645 | | | | 707,094 | |
| | |
California Educational Facilities Authority, (Harvey Mudd College), 5.25%, 12/1/36 | | | 1,100 | | | | 1,198,659 | |
| | |
California Educational Facilities Authority, (Loyola Marymount University), 5.00%, 10/1/30 | | | 1,755 | | | | 1,783,554 | |
| | |
California Educational Facilities Authority, (Loyola Marymount University), Green Bonds, 5.00%, 10/1/43 | | | 2,105 | | | | 2,461,440 | |
| | |
California Educational Facilities Authority, (Loyola Marymount University), Green Bonds, 5.00%, 10/1/48 | | | 3,000 | | | | 3,495,480 | |
| | |
California Educational Facilities Authority, (Pepperdine University), 5.00%, 10/1/46(1) | | | 6,600 | | | | 7,589,010 | |
| | |
California Educational Facilities Authority, (University of the Pacific), 5.00%, 11/1/30 | | | 1,790 | | | | 1,945,390 | |
| | |
California Municipal Finance Authority, (University of San Diego), 5.00%, 10/1/31 | | | 1,385 | | | | 1,493,016 | |
| | |
California Municipal Finance Authority, (University of San Diego), 5.00%, 10/1/35 | | | 945 | | | | 1,015,554 | |
| | |
California Municipal Finance Authority, (University of San Diego), 5.25%, 10/1/26 | | | 2,270 | | | | 2,467,240 | |
| | |
California Municipal Finance Authority, (University of San Diego), 5.25%, 10/1/27 | | | 2,820 | | | | 3,062,125 | |
| | |
California Municipal Finance Authority, (University of San Diego), 5.25%, 10/1/28 | | | 2,970 | | | | 3,221,975 | |
| | |
California State University, 5.00%, 11/1/41(1) | | | 9,550 | | | | 11,032,064 | |
| | |
University of California, 5.00%, 5/15/46(1) | | | 12,050 | | | | 13,821,229 | |
| | |
University of California, Prerefunded to 5/15/19, 5.25%, 5/15/39 | | | 165 | | | | 165,761 | |
| | |
University of California, Prerefunded to 5/15/19, 5.25%, 5/15/39 | | | 550 | | | | 552,536 | |
| | |
| | | | | | | $ | 56,784,129 | |
|
| Electric Utilities — 1.8% | |
| | |
Los Angeles Department of Water and Power, Power System Revenue, 5.00%, 7/1/42(1) | | $ | 2,000 | | | $ | 2,343,900 | |
| | |
Southern California Public Power Authority, (Tieton Hydropower), 5.00%, 7/1/35 | | | 1,890 | | | | 1,962,500 | |
| | |
Vernon, Electric System Revenue, 5.125%, 8/1/21 | | | 1,130 | | | | 1,142,046 | |
| | |
| | | | | | | $ | 5,448,446 | |
|
| Escrowed / Prerefunded — 11.2% | |
| | |
California Educational Facilities Authority, (California Institute of Technology), Prerefunded to 11/1/19, 5.00%, 11/1/39(1) | | $ | 10,000 | | | $ | 10,209,100 | |
| | | | | | | | |
| Security | | Principal
Amount
(000’s omitted) | | | Value | |
|
| Escrowed / Prerefunded (continued) | |
| | |
California Educational Facilities Authority, (Santa Clara University), Prerefunded to 2/1/20, 5.00%, 2/1/29 | | $ | 285 | | | $ | 293,727 | |
| | |
California Educational Facilities Authority, (University of San Francisco), Prerefunded to 10/1/21, 6.125%, 10/1/36 | | | 390 | | | | 435,989 | |
| | |
California Educational Facilities Authority, (University of San Francisco), Prerefunded to 10/1/21, 6.125%, 10/1/36 | | | 375 | | | | 418,725 | |
| | |
California Health Facilities Financing Authority, (Cedars-Sinai Medical Center), Prerefunded to 8/15/19, 5.00%, 8/15/39 | | | 5,905 | | | | 5,982,473 | |
| | |
Foothill-De Anza Community College District, Prerefunded to 8/1/21, 5.00%, 8/1/36(1) | | | 10,000 | | | | 10,856,100 | |
| | |
San Diego Community College District, (Election of 2002), Prerefunded to 8/1/21, 5.00%, 8/1/32 | | | 2,095 | | | | 2,274,353 | |
| | |
San Diego Community College District, (Election of 2006), Prerefunded to 8/1/21, 5.00%, 8/1/31 | | | 3,000 | | | | 3,256,830 | |
| | |
University of California, Prerefunded to 5/15/19, 5.25%, 5/15/39 | | | 285 | | | | 286,314 | |
| | |
Vernon, Electric System Revenue, Prerefunded to 8/1/19, 5.125%, 8/1/21 | | | 520 | | | | 526,318 | |
| | |
| | | | | | | $ | 34,539,929 | |
|
| General Obligations — 58.3% | |
| | |
Alameda City Unified School District, (Election of 2014), 5.00%, 8/1/42(1) | | $ | 1,675 | | | $ | 1,973,569 | |
| | |
Berryessa Union School District, (Election of 2014), 5.00%, 8/1/40(1) | | | 7,450 | | | | 8,757,922 | |
| | |
Burbank Unified School District, (Election of 2013), 4.00%, 8/1/31(1) | | | 6,900 | | | | 7,381,620 | |
| | |
Cabrillo Unified School District, (Election of 2018), 5.00%, 8/1/48 | | | 5,000 | | | | 5,735,950 | |
| | |
California, 5.50%, 11/1/35 | | | 5,900 | | | | 6,226,506 | |
| | |
Campbell Union High School District, (Election of 2016), 5.00%, 8/1/36(1) | | | 11,250 | | | | 13,291,987 | |
| | |
Contra Costa Community College District, (Election of 2006), 5.00%, 8/1/38(1) | | | 9,750 | | | | 10,968,360 | |
| | |
Desert Community College District, 5.00%, 8/1/36(1) | | | 7,500 | | | | 8,775,525 | |
| | |
El Camino Community College District, (Election of 2012), 5.00%, 8/1/48(1) | | | 10,000 | | | | 11,933,600 | |
| | |
La Canada Unified School District, (Election of 2017), 5.00%, 8/1/47(1) | | | 3,375 | | | | 4,059,889 | |
| | |
Long Beach Unified School District, (Election of 2008), 5.00%, 8/1/41(1) | | | 1,500 | | | | 1,751,805 | |
| | |
Mt. San Antonio Community College District, (Election of 2018), 5.00%, 8/1/40(2) | | | 3,665 | | | | 4,477,127 | |
| | |
Old Adobe Union School District, (Election of 2018), 5.00%, 8/1/48 | | | 3,415 | | | | 3,912,770 | |
| | |
Oxnard Union High School District, (Election of 2018), 5.00%, 8/1/42(1) | | | 3,000 | | | | 3,487,350 | |
| | |
Palo Alto, (Election of 2008), 5.00%, 8/1/40 | | | 1,850 | | | | 1,933,602 | |
| | | | |
| | 15 | | See Notes to Financial Statements. |
Eaton Vance
California Municipal Bond Fund
March 31, 2019
Portfolio of Investments (Unaudited) — continued
| | | | | | | | |
| Security | | Principal
Amount
(000’s omitted) | | | Value | |
|
| General Obligations (continued) | |
| | |
Palo Alto, (Election of 2008), 5.00%, 8/1/40(1) | | $ | 7,020 | | | $ | 7,337,234 | |
| | |
Palomar Community College District, 5.00%, 8/1/44(1) | | | 10,000 | | | | 11,474,000 | |
| | |
Redding School District, (Election of 2018), 5.00%, 8/1/45 | | | 750 | | | | 856,830 | |
| | |
Redding School District, (Election of 2018), 5.00%, 8/1/48 | | | 2,645 | | | | 3,017,363 | |
| | |
San Bernardino Community College District, 4.00%, 8/1/27(1) | | | 5,775 | | | | 6,337,081 | |
| | |
San Bruno Park School District, (Election of 2018), 5.00%, 8/1/48 | | | 2,500 | | | | 2,857,275 | |
| | |
San Diego Unified School District, (Election of 2012), 5.00%, 7/1/47(1) | | | 4,000 | | | | 4,672,280 | |
| | |
San Jose Unified School District, (Election of 2012), 4.00%, 8/1/42(1) | | | 12,000 | | | | 12,818,760 | |
| | |
San Jose-Evergreen Community College District, (Election of 2010),
5.00%, 8/1/37(1) | | | 4,975 | | | | 5,477,027 | |
| | |
Santa Monica Community College District, (Election of 2008), 5.00%, 8/1/44(1) | | | 7,500 | | | | 8,514,300 | |
| | |
Santa Rosa High School District, (Election of 2014), 5.00%, 8/1/41 | | | 3,495 | | | | 4,081,706 | |
| | |
Torrance Unified School District, (Election of 2008), 5.00%, 8/1/35 | | | 7,500 | | | | 8,516,325 | |
| | |
Ventura County Community College District, 5.00%, 8/1/30(1) | | | 8,000 | | | | 9,495,760 | |
| | |
| | | | | | | $ | 180,123,523 | |
|
| Hospital — 16.8% | |
| | |
California Health Facilities Financing Authority, (Adventist Health System/West), 4.00%, 3/1/39 | | $ | 5,000 | | | $ | 5,218,750 | |
| | |
California Health Facilities Financing Authority, (Catholic Healthcare West), 5.25%, 3/1/27 | | | 1,750 | | | | 1,865,780 | |
| | |
California Health Facilities Financing Authority, (Catholic Healthcare West), 5.25%, 3/1/28 | | | 550 | | | | 586,498 | |
| | |
California Health Facilities Financing Authority, (City of Hope), 5.00%, 11/15/32 | | | 2,130 | | | | 2,351,499 | |
| | |
California Health Facilities Financing Authority, (City of Hope), 5.00%, 11/15/35 | | | 3,040 | | | | 3,346,067 | |
| | |
California Health Facilities Financing Authority, (St. Joseph Health System), 5.00%, 7/1/33 | | | 5,080 | | | | 5,711,952 | |
| | |
California Health Facilities Financing Authority, (St. Joseph Health System), 5.00%, 7/1/37 | | | 2,380 | | | | 2,651,368 | |
| | |
California Health Facilities Financing Authority, (Sutter Health),
5.00%, 11/15/46(1) | | | 3,000 | | | | 3,444,990 | |
| | |
California Health Facilities Financing Authority, (Sutter Health), 5.00%, 11/15/46 | | | 8,000 | | | | 9,186,640 | |
| | |
California Health Facilities Financing Authority, (Sutter Health),
5.25%, 8/15/31(1) | | | 5,000 | | | | 5,416,550 | |
| | |
California Public Finance Authority, (Sharp HealthCare), 5.00%, 8/1/47(1) | | | 1,250 | | | | 1,448,650 | |
| | |
California Public Finance Authority, (Sharp HealthCare), 5.00%, 8/1/47 | | | 8,445 | | | | 9,787,079 | |
| | | | | | | | |
| Security | | Principal
Amount
(000’s omitted) | | | Value | |
|
| Hospital (continued) | |
| | |
California Statewide Communities Development Authority, (Cottage Health System), 5.25%, 11/1/30 | | $ | 1,000 | | | $ | 1,055,010 | |
| | |
| | | | | | | $ | 52,070,833 | |
|
| Housing — 1.8% | �� |
| | |
California Statewide Communities Development Authority, (University of California, Irvine East Campus Apartments, Phase IV-A-CHF-Irvine, LLC), 5.00%, 5/15/47 | | $ | 5,000 | | | $ | 5,635,200 | |
| | |
| | | | | | | $ | 5,635,200 | |
|
| Insured – Electric Utilities — 3.2% | |
| | |
Puerto Rico Electric Power Authority, (NPFG), 5.25%, 7/1/34 | | $ | 4,875 | | | $ | 5,220,248 | |
| | |
Sacramento Municipal Utility District, (AMBAC), (BHAC), 5.25%, 7/1/24 | | | 4,000 | | | | 4,563,360 | |
| | |
| | | | | | | $ | 9,783,608 | |
|
| Insured – Escrowed / Prerefunded — 2.9% | |
| | |
Clovis Unified School District, (NPFG), Escrowed to Maturity, 0.00%, 8/1/20 | | $ | 3,130 | | | $ | 3,068,370 | |
| | |
Palm Springs Unified School District, (Election of 2008), (AGC), Prerefunded to 8/1/19, 5.00%, 8/1/33 | | | 5,750 | | | | 5,818,483 | |
| | |
| | | | | | | $ | 8,886,853 | |
|
| Insured – General Obligations — 16.7% | |
| | |
Burbank Unified School District, (Election of 1997), (NPFG), 0.00%, 8/1/21 | | $ | 4,135 | | | $ | 3,971,502 | |
| | |
Cotati-Rohnert Park Unified School District, (Election of 2016), (AGM), 5.00%, 8/1/44 | | | 3,500 | | | | 4,014,500 | |
| | |
Garvey School District, (Election of 2016), (AGM), 5.00%, 8/1/45 | | | 2,440 | | | | 2,804,975 | |
| | |
Garvey School District, (Election of 2016), (AGM), 5.00%, 8/1/48 | | | 1,610 | | | | 1,846,976 | |
| | |
Grass Valley School District, (Election of 2018), (BAM), 5.00%, 8/1/45 | | | 3,000 | | | | 3,435,870 | |
| | |
Mountain View School District, (Election of 2016), (BAM), 5.00%, 8/1/42 | | | 1,145 | | | | 1,317,781 | |
| | |
Mountain View School District, (Election of 2016), (BAM), 5.00%, 8/1/45 | | | 1,520 | | | | 1,746,267 | |
| | |
San Diego Unified School District, (NPFG), 0.00%, 7/1/22 | | | 2,300 | | | | 2,174,972 | |
| | |
San Diego Unified School District, (NPFG), 0.00%, 7/1/23 | | | 5,000 | | | | 4,628,850 | |
| | |
San Juan Unified School District, (AGM), 0.00%, 8/1/21 | | | 5,630 | | | | 5,427,433 | |
| | |
San Mateo County Community College District, (NPFG), 0.00%, 9/1/22 | | | 4,840 | | | | 4,575,639 | |
| | |
San Mateo County Community College District, (NPFG), 0.00%, 9/1/23 | | | 4,365 | | | | 4,047,053 | |
| | | | |
| | 16 | | See Notes to Financial Statements. |
Eaton Vance
California Municipal Bond Fund
March 31, 2019
Portfolio of Investments (Unaudited) — continued
| | | | | | | | |
| Security | | Principal
Amount
(000’s omitted) | | | Value | |
|
| Insured – General Obligations (continued) | |
| | |
San Mateo County Community College District, (NPFG), 0.00%, 9/1/25 | | $ | 3,955 | | | $ | 3,501,164 | |
| | |
San Mateo Union High School District, (NPFG), 0.00%, 9/1/21 | | | 5,240 | | | | 5,049,421 | |
| | |
Union Elementary School District, (Election of 1999), (NPFG), 0.00%, 9/1/22 | | | 3,200 | | | | 3,018,048 | |
| | |
| | | | | | | $ | 51,560,451 | |
|
| Insured – Transportation — 0.9% | |
| | |
San Joaquin Hills Transportation Corridor Agency, (NPFG), 0.00%, 1/15/27 | | $ | 3,520 | | | $ | 2,785,517 | |
| | |
| | | | | | | $ | 2,785,517 | |
|
| Lease Revenue / Certificates of Participation — 1.1% | |
| | |
California Public Works Board, 5.00%, 11/1/38 | | $ | 3,045 | | | $ | 3,377,453 | |
| | |
| | | | | | | $ | 3,377,453 | |
|
| Special Tax Revenue — 13.3% | |
| | |
Jurupa Public Financing Authority, 5.00%, 9/1/30 | | $ | 625 | | | $ | 714,625 | |
| | |
Jurupa Public Financing Authority, 5.00%, 9/1/32 | | | 625 | | | | 710,025 | |
| | |
Los Angeles County Metropolitan Transportation Authority, Sales Tax Revenue, Green Bonds, 5.00%, 7/1/42(1) | | | 10,250 | | | | 12,112,425 | |
| | |
Riverside County Transportation Commission, Sales Tax Revenue, Prerefunded to 6/1/23, 5.25%, 6/1/39(1) | | | 6,285 | | | | 7,271,368 | |
| | |
San Bernardino County Transportation Authority, Sales Tax Revenue, 5.25%, 3/1/40(1) | | | 10,375 | | | | 11,938,097 | |
| | |
San Francisco Bay Area Rapid Transit District, Sales Tax Revenue, 5.00%, 7/1/36(1) | | | 6,250 | | | | 6,913,625 | |
| | |
San Francisco Bay Area Rapid Transit District, Sales Tax Revenue, Prerefunded to 7/1/20, 5.00%, 7/1/28 | | | 1,300 | | | | 1,358,799 | |
| | |
| | | | | | | $ | 41,018,964 | |
|
| Transportation — 8.0% | |
| | |
Long Beach, Harbor Revenue, 5.00%, 5/15/27 | | $ | 2,500 | | | $ | 2,594,700 | |
| | |
Long Beach, Harbor Revenue,
5.00%, 5/15/42(1) | | | 7,500 | | | | 8,584,950 | |
| | |
Los Angeles Department of Airports, (Los Angeles International Airport), 5.00%, 5/15/35(1) | | | 8,560 | | | | 8,897,863 | |
| | |
San Francisco City and County Airport Commission, (San Francisco International Airport), 5.00%, 5/1/35 | | | 2,825 | | | | 2,920,626 | |
| | |
San Jose, Airport Revenue, 5.00%, 3/1/31 | | | 1,750 | | | | 1,853,145 | |
| | |
| | | | | | | $ | 24,851,284 | |
|
| Water and Sewer — 18.0% | |
| | |
Beverly Hills Public Financing Authority, Water Revenue, 5.00%, 6/1/37(1) | | $ | 5,725 | | | $ | 6,290,115 | |
| | | | | | | | |
| Security | | Principal
Amount
(000’s omitted) | | | Value | |
|
| Water and Sewer (continued) | |
| | |
Eastern Municipal Water District Financing Authority, 5.25%, 7/1/42(1) | | $ | 9,000 | | | $ | 10,846,260 | |
| | |
Los Angeles Department of Water and Power, Water System Revenue, 5.00%, 7/1/39(1) | | | 10,000 | | | | 11,353,900 | |
| | |
Los Angeles, Wastewater System Revenue, 5.00%, 6/1/43(1) | | | 7,500 | | | | 8,314,575 | |
| | |
Orange County Sanitation District, Wastewater Revenue, 5.00%, 2/1/35(1) | | | 10,000 | | | | 11,502,600 | |
| | |
Rancho California Water District Financing Authority, 5.00%, 8/1/46(1) | | | 2,500 | | | | 2,918,350 | |
| | |
San Francisco City and County Public Utilities Commission, Water Revenue, Green Bonds, 5.00%, 11/1/45(1) | | | 4,000 | | | | 4,498,400 | |
| | |
| | | | | | | $ | 55,724,200 | |
| |
Total Tax-Exempt Investments — 172.4%
(identified cost $504,942,422) | | | $ | 532,590,390 | |
| |
Other Assets, Less Liabilities — (72.4)% | | | $ | (223,606,627 | ) |
| |
Net Assets — 100.0% | | | $ | 308,983,763 | |
The percentage shown for each investment category in the Portfolio of Investments is based on net assets.
The Fund invests primarily in debt securities issued by California municipalities. The ability of the issuers of the debt securities to meet their obligations may be affected by economic developments in a specific industry or municipality. In order to reduce the risk associated with such economic developments, at March 31, 2019, 13.7% of total investments are backed by bond insurance of various financial institutions and financial guaranty assurance agencies. The aggregate percentage insured by an individual financial institution or financial guaranty assurance agency ranged from 0.9% to 7.9% of total investments.
| (1) | Security represents the municipal bond held by a trust that issues residual interest bonds (see Note 1G). |
| (2) | When-issued security. |
Abbreviations:
| | | | |
| | |
| AGC | | – | | Assured Guaranty Corp. |
| | |
| AGM | | – | | Assured Guaranty Municipal Corp. |
| | |
| AMBAC | | – | | AMBAC Financial Group, Inc. |
| | |
| BAM | | – | | Build America Mutual Assurance Co. |
| | |
| BHAC | | – | | Berkshire Hathaway Assurance Corp. |
| | |
| NPFG | | – | | National Public Finance Guarantee Corp. |
| | | | |
| | 17 | | See Notes to Financial Statements. |
Eaton Vance
New York Municipal Bond Fund
March 31, 2019
Portfolio of Investments (Unaudited)
| | | | | | | | |
| Tax-Exempt Investments — 156.6% | |
| Security | | Principal
Amount
(000’s omitted) | | | Value | |
|
| Bond Bank — 9.6% | |
| | |
New York State Environmental Facilities Corp., 5.00%, 10/15/39 | | $ | 4,110 | | | $ | 4,245,630 | |
| | |
New York State Environmental Facilities Corp., Clean Water and Drinking Water, 4.00%, 6/15/46(1) | | | 17,500 | | | | 18,641,525 | |
| | |
| | | | | | | $ | 22,887,155 | |
|
| Education — 25.7% | |
| | |
Geneva Development Corp., (Hobart and William Smith Colleges), 5.00%, 9/1/30 | | $ | 200 | | | $ | 225,972 | |
| | |
Geneva Development Corp., (Hobart and William Smith Colleges), 5.00%, 9/1/33 | | | 105 | | | | 118,485 | |
| | |
Geneva Development Corp., (Hobart and William Smith Colleges), 5.00%, 9/1/34 | | | 200 | | | | 225,000 | |
| | |
Geneva Development Corp., (Hobart and William Smith Colleges), Series 2012, 5.00%, 9/1/32 | | | 1,935 | | | | 2,119,444 | |
| | |
Geneva Development Corp., (Hobart and William Smith Colleges), Series 2014, 5.00%, 9/1/32 | | | 200 | | | | 225,568 | |
| | |
Hempstead Local Development Corp., (Adelphi University), 5.00%, 6/1/21 | | | 950 | | | | 1,014,106 | |
| | |
Hempstead Local Development Corp., (Adelphi University), 5.00%, 6/1/31 | | | 800 | | | | 849,368 | |
| | |
Hempstead Local Development Corp., (Adelphi University), 5.00%, 6/1/32 | | | 300 | | | | 318,234 | |
| | |
New York City Cultural Resources Trust, (The Juilliard School), 5.00%, 1/1/38 | | | 1,000 | | | | 1,216,820 | |
| | |
New York Dormitory Authority, (Columbia University), 5.00%, 10/1/38(1) | | | 2,000 | | | | 2,420,160 | |
| | |
New York Dormitory Authority, (Columbia University), 5.00%, 10/1/41(1) | | | 10,000 | | | | 10,622,700 | |
| | |
New York Dormitory Authority, (Columbia University), 5.00%, 10/1/41 | | | 1,275 | | | | 1,354,394 | |
| | |
New York Dormitory Authority, (Cornell University), 5.00%, 7/1/37(1) | | | 6,975 | | | | 7,245,979 | |
| | |
New York Dormitory Authority, (New York University), 5.00%, 7/1/39(1) | | | 2,000 | | | | 2,399,600 | |
| | |
New York Dormitory Authority, (New York University), Prerefunded to 7/1/19, 5.00%, 7/1/39(1) | | | 10,000 | | | | 10,087,000 | |
| | |
New York Dormitory Authority, (Rochester Institute of Technology), 5.00%, 7/1/40 | | | 2,000 | | | | 2,071,880 | |
| | |
New York Dormitory Authority, (Rockefeller University), 5.00%, 7/1/34 | | | 100 | | | | 110,017 | |
| | |
New York Dormitory Authority, (Rockefeller University), 5.00%, 7/1/40(1) | | | 2,700 | | | | 2,720,493 | |
| | |
New York Dormitory Authority, (Rockefeller University), 5.00%, 7/1/40 | | | 1,110 | | | | 1,118,425 | |
| | | | | | | | |
| Security | | Principal
Amount
(000’s omitted) | | | Value | |
|
| Education (continued) | |
| | |
New York Dormitory Authority, (Skidmore College), 5.00%, 7/1/26 | | $ | 1,175 | | | $ | 1,256,157 | |
| | |
New York Dormitory Authority, (Skidmore College), 5.00%, 7/1/28 | | | 325 | | | | 347,129 | |
| | |
New York Dormitory Authority, (Skidmore College), 5.25%, 7/1/30 | | | 250 | | | | 268,923 | |
| | |
New York Dormitory Authority, (The New School), 5.00%, 7/1/46 | | | 1,660 | | | | 1,892,002 | |
| | |
New York Dormitory Authority, (The New School), Prerefunded to 7/1/20, 5.50%, 7/1/40 | | | 6,250 | | | | 6,562,375 | |
| | |
Onondaga County Cultural Resources Trust, (Syracuse University), 5.00%, 12/1/38 | | | 3,820 | | | | 4,315,530 | |
| | |
| | | | | | | $ | 61,105,761 | |
|
| Electric Utilities — 2.9% | |
| | |
Long Island Power Authority, Electric System Revenue, 5.00%, 9/1/37 | | $ | 1,500 | | | $ | 1,782,600 | |
| | |
Utility Debt Securitization Authority, 5.00%, 12/15/33 | | | 2,895 | | | | 3,290,833 | |
| | |
Utility Debt Securitization Authority, 5.00%, 12/15/36(1) | | | 1,675 | | | | 1,951,526 | |
| | |
| | | | | | | $ | 7,024,959 | |
|
| Escrowed / Prerefunded — 4.5% | |
| | |
Long Beach City School District, Prerefunded to 5/1/20, 4.50%, 5/1/26 | | $ | 3,715 | | | $ | 3,838,449 | |
| | |
Metropolitan Transportation Authority, Prerefunded to 11/15/20, 5.00%, 11/15/34 | | | 2,000 | | | | 2,115,200 | |
| | |
Metropolitan Transportation Authority, Prerefunded to 11/15/21, 5.25%, 11/15/38 | | | 3,430 | | | | 3,768,438 | |
| | |
New York Dormitory Authority, (North Shore-Long Island Jewish Obligated Group), Escrowed to Maturity, 5.00%, 5/1/20 | | | 1,065 | | | | 1,104,320 | |
| | |
| | | | | | | $ | 10,826,407 | |
|
| General Obligations — 9.9% | |
| | |
New York, 5.00%, 2/15/34(1) | | $ | 8,250 | | | $ | 8,720,250 | |
| | |
New York City, 4.00%, 8/1/34 | | | 1,170 | | | | 1,277,722 | |
| | |
New York City, 4.00%, 12/1/41 | | | 2,110 | | | | 2,284,138 | |
| | |
New York City, 5.00%, 8/1/34(1) | | | 10,000 | | | | 11,206,800 | |
| | |
| | | | | | | $ | 23,488,910 | |
|
| Hospital — 10.6% | |
| | |
New York Dormitory Authority, (Highland Hospital of Rochester), 5.00%, 7/1/26 | | $ | 755 | | | $ | 782,520 | |
| | |
New York Dormitory Authority, (Highland Hospital of Rochester), 5.20%, 7/1/32 | | | 1,000 | | | | 1,036,390 | |
| | | | |
| | 18 | | See Notes to Financial Statements. |
Eaton Vance
New York Municipal Bond Fund
March 31, 2019
Portfolio of Investments (Unaudited) — continued
| | | | | | | | |
| Security | | Principal
Amount
(000’s omitted) | | | Value | |
|
| Hospital (continued) | |
| | |
New York Dormitory Authority, (Memorial Sloan-Kettering Cancer Center), 4.375%, 7/1/34(1) | | $ | 9,825 | | | $ | 10,394,653 | |
| | |
New York Dormitory Authority, (Memorial Sloan-Kettering Cancer Center), 5.00%, 7/1/42 | | | 1,500 | | | | 1,741,065 | |
| | |
New York Dormitory Authority, (Montefiore Obligated Group), 4.00%, 8/1/36 | | | 4,135 | | | | 4,363,914 | |
| | |
Suffolk County Economic Development Corp., (Catholic Health Services of Long Island Obligated Group), 5.00%, 7/1/28 | | | 6,380 | | | | 6,821,687 | |
| | |
| | | | | | | $ | 25,140,229 | |
|
| Housing — 7.8% | |
| | |
New York City Housing Development Corp., 3.70%, 11/1/38 | | $ | 885 | | | $ | 907,497 | |
| | |
New York City Housing Development Corp., 3.80%, 11/1/43 | | | 1,675 | | | | 1,714,312 | |
| | |
New York City Housing Development Corp., 4.05%, 11/1/41 | | | 2,030 | | | | 2,107,546 | |
| | |
New York City Housing Development Corp., 4.95%, 11/1/39 | | | 2,500 | | | | 2,507,000 | |
| | |
New York Housing Finance Agency, (FHLMC), (FNMA), (GNMA), 3.20%, 11/1/46 | | | 1,580 | | | | 1,534,275 | |
| | |
New York Housing Finance Agency, (FHLMC), (FNMA), (GNMA), 4.00%, 11/1/42 | | | 500 | | | | 517,090 | |
| | |
New York Housing Finance Agency, (FNMA), 3.95%, 11/1/37 | | | 1,000 | | | | 1,042,990 | |
| | |
New York Mortgage Agency, 3.60%, 10/1/34 | | | 2,000 | | | | 2,074,880 | |
| | |
New York Mortgage Agency, 4.10%, 10/1/38 | | | 4,300 | | | | 4,556,065 | |
| | |
Westchester County Local Development Corp., (Purchase Housing Corp. II), 5.00%, 6/1/47 | | | 1,500 | | | | 1,676,550 | |
| | |
| | | | | | | $ | 18,638,205 | |
|
| Industrial Development Revenue — 1.3% | |
| | |
New York Liberty Development Corp., (Goldman Sachs Group, Inc.), 5.25%, 10/1/35 | | $ | 895 | | | $ | 1,149,645 | |
| | |
New York Liberty Development Corp., (Goldman Sachs Group, Inc.), 5.50%, 10/1/37 | | | 1,440 | | | | 1,894,594 | |
| | |
| | | | | | | $ | 3,044,239 | |
|
| Insured – Education — 3.8% | |
| | |
New York Dormitory Authority, (Barnard College), (NPFG), 5.00%, 7/1/24 | | $ | 290 | | | $ | 290,823 | |
| | |
New York Dormitory Authority, (City University), (AMBAC), 5.25%, 7/1/30 | | | 75 | | | | 91,318 | |
| | |
New York Dormitory Authority, (City University), (AMBAC), 5.50%, 7/1/35 | | | 1,345 | | | | 1,749,267 | |
| | |
New York Dormitory Authority, (Educational Housing Services CUNY Student Housing), (AMBAC), 5.25%, 7/1/23 | | | 1,750 | | | | 1,962,660 | |
| | |
New York Dormitory Authority, (Pratt Institute), (AGC), Prerefunded to 7/1/19, 5.00%, 7/1/34 | | | 1,900 | | | | 1,916,283 | |
| | |
New York Dormitory Authority, (Pratt Institute), (AGC), Prerefunded to 7/1/19, 5.125%, 7/1/39 | | | 2,950 | | | | 2,976,196 | |
| | |
| | | | | | | $ | 8,986,547 | |
| | | | | | | | |
| Security | | Principal
Amount
(000’s omitted) | | | Value | |
|
| Insured – Electric Utilities — 3.4% | |
| | |
Long Island Power Authority, Electric System Revenue, (BHAC), Prerefunded to 5/1/19, 5.50%, 5/1/33 | | $ | 500 | | | $ | 501,620 | |
| | |
Long Island Power Authority, Electric System Revenue, (BHAC), Prerefunded to 5/1/19, 6.00%, 5/1/33 | | | 500 | | | | 501,820 | |
| | |
New York Power Authority, (BHAC), 4.50%, 11/15/47(1) | | | 7,210 | | | | 7,222,113 | |
| | |
| | | | | | | $ | 8,225,553 | |
|
| Insured – Escrowed / Prerefunded — 2.5% | |
| | |
Brentwood Union Free School District, (AGC), Prerefunded to 11/15/19, 4.75%, 11/15/23 | | $ | 2,290 | | | $ | 2,337,105 | |
| | |
Brentwood Union Free School District, (AGC), Prerefunded to 11/15/19, 5.00%, 11/15/24 | | | 2,390 | | | | 2,442,843 | |
| | |
Hoosic Valley Central School District, (AGC), Prerefunded to 6/15/19, 4.00%, 6/15/23 | | | 1,110 | | | | 1,115,706 | |
| | |
| | | | | | | $ | 5,895,654 | |
|
| Insured – General Obligations — 3.7% | |
| | |
East Northport Fire District, (AGC), 4.50%, 11/1/20 | | $ | 200 | | | $ | 200,492 | |
| | |
East Northport Fire District, (AGC), 4.50%, 11/1/21 | | | 200 | | | | 200,456 | |
| | |
East Northport Fire District, (AGC), 4.50%, 11/1/22 | | | 200 | | | | 200,456 | |
| | |
East Northport Fire District, (AGC), 4.50%, 11/1/23 | | | 200 | | | | 200,454 | |
| | |
Longwood Central School District, Suffolk County, (AGC), 4.15%, 6/1/23 | | | 1,005 | | | | 1,006,939 | |
| | |
Longwood Central School District, Suffolk County, (AGC), 4.25%, 6/1/24 | | | 1,050 | | | | 1,052,121 | |
| | |
Nassau County, (AGM), 5.00%, 7/1/42 | | | 1,000 | | | | 1,164,520 | |
| | |
Oyster Bay, (AGM), 4.00%, 8/1/28 | | | 4,585 | | | | 4,887,060 | |
| | |
| | | | | | | $ | 8,912,498 | |
|
| Insured – Hospital — 0.2% | |
| | |
New York City Health and Hospitals Corp., (AGM), 5.50%, 2/15/20 | | $ | 500 | | | $ | 501,535 | |
| | |
| | | | | | | $ | 501,535 | |
|
| Insured – Lease Revenue / Certificates of Participation — 2.4% | |
| | |
Ulster County Resource Recovery Agency, Solid Waste System, (AMBAC), 0.00%, 3/1/21 | | $ | 1,490 | | | $ | 1,440,025 | |
| | |
Ulster County Resource Recovery Agency, Solid Waste System, (AMBAC), 0.00%, 3/1/23 | | | 1,090 | | | | 1,009,405 | |
| | |
Ulster County Resource Recovery Agency, Solid Waste System, (AMBAC), 0.00%, 3/1/25 | | | 3,635 | | | | 3,200,218 | |
| | |
| | | | | | | $ | 5,649,648 | |
| | | | |
| | 19 | | See Notes to Financial Statements. |
Eaton Vance
New York Municipal Bond Fund
March 31, 2019
Portfolio of Investments (Unaudited) — continued
| | | | | | | | |
| Security | | Principal
Amount
(000’s omitted) | | | Value | |
|
| Insured – Special Tax Revenue — 1.7% | |
| | |
New York Thruway Authority, Miscellaneous Tax Revenue, (AMBAC), 5.50%, 4/1/20 | | $ | 2,685 | | | $ | 2,791,997 | |
| | |
Puerto Rico Infrastructure Financing Authority, (AMBAC), 0.00%, 7/1/36 | | | 3,000 | | | | 1,151,340 | |
| | |
| | | | | | | $ | 3,943,337 | |
|
| Insured – Transportation — 0.7% | |
| | |
Metropolitan Transportation Authority, Green Bonds, (AGM), 4.00%, 11/15/46 | | $ | 1,500 | | | $ | 1,599,630 | |
| | |
| | | | | | | $ | 1,599,630 | |
|
| Lease Revenue / Certificates of Participation — 3.9% | |
| | |
Hudson Yards Infrastructure Corp., 5.00%, 2/15/42(1) | | $ | 8,000 | | | $ | 9,263,040 | |
| | |
| | | | | | | $ | 9,263,040 | |
|
| Other Revenue — 13.1% | |
| | |
Battery Park City Authority, 5.00%, 11/1/34 | | $ | 4,625 | | | $ | 4,713,800 | |
| | |
Brooklyn Arena Local Development Corp., (Barclays Center), 0.00%, 7/15/31 | | | 6,000 | | | | 3,882,480 | |
| | |
Brooklyn Arena Local Development Corp., (Barclays Center), 5.00%, 7/15/42 | | | 1,500 | | | | 1,674,390 | |
| | |
New York City Transitional Finance Authority, (Building Aid), 5.00%, 7/15/32(1) | | | 10,000 | | | | 11,688,900 | |
| | |
New York City Transitional Finance Authority, (Building Aid), 5.00%, 7/15/37(1) | | | 2,200 | | | | 2,626,470 | |
| | |
New York Liberty Development Corp., (7 World Trade Center), 5.00%, 9/15/32 | | | 5,975 | | | | 6,529,122 | |
| | |
| | | | | | | $ | 31,115,162 | |
|
| Special Tax Revenue — 29.4% | |
| | |
Metropolitan Transportation Authority, Dedicated Tax Revenue, 5.00%, 11/15/31(1) | | $ | 10,000 | | | $ | 11,099,000 | |
| | |
New York City Transitional Finance Authority, Future Tax Revenue, 4.00%, 8/1/41 | | | 3,750 | | | | 4,046,512 | |
| | |
New York City Transitional Finance Authority, Future Tax Revenue, 4.00%, 5/1/42 | | | 5,430 | | | | 5,841,160 | |
| | |
New York City Transitional Finance Authority, Future Tax Revenue, 4.00%, 8/1/42 | | | 2,100 | | | | 2,246,454 | |
| | |
New York City Transitional Finance Authority, Future Tax Revenue, 5.00%, 2/1/35(1) | | | 10,000 | | | | 10,582,900 | |
| | |
New York City Transitional Finance Authority, Future Tax Revenue, 5.50%, 11/1/35(1) | | | 845 | | | | 896,266 | |
| | |
New York City Transitional Finance Authority, Future Tax Revenue, Prerefunded to 11/1/20, 5.50%, 11/1/35(1) | | | 655 | | | | 696,403 | |
| | |
New York Dormitory Authority, Personal Income Tax Revenue, 5.00%, 6/15/31(1) | | | 9,250 | | | | 10,299,135 | |
| | | | | | | | |
| Security | | Principal
Amount
(000’s omitted) | | | Value | |
|
| Special Tax Revenue (continued) | |
| | |
New York Dormitory Authority, Personal Income Tax Revenue, 5.00%, 3/15/33 | | $ | 650 | | | $ | 689,332 | |
| | |
New York Dormitory Authority, Sales Tax Revenue, 5.00%, 3/15/34 | | | 7,620 | | | | 8,486,089 | |
| | |
New York Dormitory Authority, Sales Tax Revenue, 5.00%, 3/15/43(1) | | | 2,000 | | | | 2,356,620 | |
| | |
New York Thruway Authority, Miscellaneous Tax Revenue, Prerefunded to 4/1/20, 5.00%, 4/1/26 | | | 2,370 | | | | 2,453,234 | |
| | |
Sales Tax Asset Receivable Corp., 5.00%, 10/15/30(1) | | | 8,900 | | | | 10,315,545 | |
| | |
| | | | | | | $ | 70,008,650 | |
|
| Transportation — 11.6% | |
| | |
Metropolitan Transportation Authority, Green Bonds, 4.00%, 11/15/38 | | $ | 2,855 | | | $ | 3,042,288 | |
| | |
Nassau County Bridge Authority, 5.00%, 10/1/35 | | | 1,915 | | | | 1,999,796 | |
| | |
Nassau County Bridge Authority, 5.00%, 10/1/40 | | | 365 | | | | 380,578 | |
| | |
New York Thruway Authority, 4.00%, 1/1/36 | | | 2,500 | | | | 2,742,350 | |
| | |
New York Thruway Authority, 5.00%, 1/1/37 | | | 7,240 | | | | 7,725,804 | |
| | |
Port Authority of New York and New Jersey, 5.00%, 12/1/34(1) | | | 820 | | | | 929,569 | |
| | |
Port Authority of New York and New Jersey, 5.00%, 10/15/35(1) | | | 8,000 | | | | 9,353,840 | |
| | |
Port Authority of New York and New Jersey, 5.00%, 10/15/36(1) | | | 1,200 | | | | 1,418,484 | |
| | |
| | | | | | | $ | 27,592,709 | |
|
| Water and Sewer — 7.1% | |
| | |
Albany Municipal Water Finance Authority, 5.00%, 12/1/26 | | $ | 755 | | | $ | 820,300 | |
| | |
Albany Municipal Water Finance Authority, 5.00%, 12/1/29 | | | 500 | | | | 542,975 | |
| | |
New York City Municipal Water Finance Authority, (Water and Sewer System), 5.00%, 6/15/46(1) | | | 2,000 | | | | 2,299,740 | |
| | |
New York City Municipal Water Finance Authority, (Water and Sewer System), Prerefunded to 6/15/21, 5.00%, 6/15/44(1) | | | 8,750 | | | | 9,430,750 | |
| | |
Suffolk County Water Authority, 4.00%, 6/1/41 | | | 1,150 | | | | 1,251,442 | |
| | |
Suffolk County Water Authority, 5.00%, 6/1/36(1) | | | 2,000 | | | | 2,448,220 | |
| | |
| | | | | | | $ | 16,793,427 | |
| | | | |
| | 20 | | See Notes to Financial Statements. |
Eaton Vance
New York Municipal Bond Fund
March 31, 2019
Portfolio of Investments (Unaudited) — continued
| | | | | | | | |
| Security | | Principal
Amount
(000’s omitted) | | | Value | |
|
| Senior Living / Life Care — 0.8% | |
| | |
Brookhaven Local Development Corp., (Jeffersons Ferry), 5.00%, 11/1/24 | | $ | 135 | | | $ | 151,301 | |
| | |
Brookhaven Local Development Corp., (Jeffersons Ferry), 5.25%, 11/1/25 | | | 325 | | | | 372,184 | |
| | |
Brookhaven Local Development Corp., (Jeffersons Ferry), 5.25%, 11/1/26 | | | 200 | | | | 232,442 | |
| | |
Brookhaven Local Development Corp., (Jeffersons Ferry), 5.25%, 11/1/36 | | | 970 | | | | 1,100,882 | |
| | |
| | | | | | | $ | 1,856,809 | |
| |
Total Tax-Exempt Investments — 156.6%
(identified cost $356,016,244) | | | $ | 372,500,064 | |
| |
Other Assets, Less Liabilities — (56.6)% | | | $ | (134,589,163 | ) |
| |
Net Assets — 100.0% | | | $ | 237,910,901 | |
The percentage shown for each investment category in the Portfolio of Investments is based on net assets.
The Fund invests primarily in debt securities issued by New York municipalities. The ability of the issuers of the debt securities to meet their obligations may be affected by economic developments in a specific industry or municipality. In order to reduce the risk associated with such economic developments, at March 31, 2019, 11.7% of total investments are backed by bond insurance of various financial institutions and financial guaranty assurance agencies. The aggregate percentage insured by an individual financial institution or financial guaranty assurance agency ranged from 0.1% to 3.7% of total investments.
| (1) | Security represents the municipal bond held by a trust that issues residual interest bonds (see Note 1G). |
Abbreviations:
| | | | |
| | |
| AGC | | – | | Assured Guaranty Corp. |
| | |
| AGM | | – | | Assured Guaranty Municipal Corp. |
| | |
| AMBAC | | – | | AMBAC Financial Group, Inc. |
| | |
| BHAC | | – | | Berkshire Hathaway Assurance Corp. |
| | |
| FHLMC | | – | | Federal Home Loan Mortgage Corp. |
| | |
| FNMA | | – | | Federal National Mortgage Association |
| | |
| GNMA | | – | | Government National Mortgage Association |
| | |
| NPFG | | – | | National Public Finance Guarantee Corp. |
| | | | |
| | 21 | | See Notes to Financial Statements. |
Eaton Vance
Municipal Bond Funds
March 31, 2019
Statements of Assets and Liabilities (Unaudited)
| | | | | | | | | | | | |
| | | March 31, 2019 | |
| Assets | | Municipal Fund | | | California Fund | | | New York Fund | |
| | | |
Investments — | | | | | | | | | | | | |
| | | |
Identified cost | | $ | 1,839,400,041 | | | $ | 504,942,422 | | | $ | 356,016,244 | |
| | | |
Unrealized appreciation | | | 120,565,795 | | | | 27,647,968 | | | | 16,483,820 | |
| | | |
Investments, at value | | $ | 1,959,965,836 | | | $ | 532,590,390 | | | $ | 372,500,064 | |
| | | |
Cash | | $ | 4,702,314 | | | $ | — | | | $ | 1,832,357 | |
| | | |
Interest receivable | | | 22,805,689 | | | | 5,543,990 | | | | 4,799,838 | |
| | | |
Receivable for investments sold | | | 17,868,006 | | | | 9,730,000 | | | | 5,000,000 | |
| | | |
Receivable from affiliate | | | 104,204 | | | | — | | | | — | |
| | | |
Total assets | | $ | 2,005,446,049 | | | $ | 547,864,380 | | | $ | 384,132,259 | |
|
| Liabilities | |
| | | |
Payable for floating rate notes issued (net of unamortized deferred debt issuance costs of $0, $0 and $17,410, respectively) | | $ | 778,721,963 | | | $ | 225,994,113 | | | $ | 144,999,557 | |
| | | |
Due to broker for floating rate notes redeemed | | | 12,600,000 | | | | 6,435,000 | | | | — | |
| | | |
Payable for when-issued securities | | | 3,140,970 | | | | 4,358,125 | | | | — | |
| | | |
Due to custodian | | | — | | | | 555,190 | | | | — | |
| | | |
Payable to affiliate: | | | | | | | | | | | | |
| | | |
Investment adviser fee | | | 1,000,806 | | | | 271,755 | | | | 193,604 | |
| | | |
Interest expense and fees payable | | | 4,807,076 | | | | 1,122,715 | | | | 900,595 | |
| | | |
Accrued expenses | | | 512,489 | | | | 143,719 | | | | 127,602 | |
| | | |
Total liabilities | | $ | 800,783,304 | | | $ | 238,880,617 | | | $ | 146,221,358 | |
| | | |
Net Assets | | $ | 1,204,662,745 | | | $ | 308,983,763 | | | $ | 237,910,901 | |
|
| Sources of Net Assets | |
| | | |
Common shares, $0.01 par value, unlimited number of shares authorized | | $ | 896,961 | | | $ | 253,819 | | | $ | 181,183 | |
| | | |
Additional paid-in capital | | | 1,148,824,697 | | | | 324,165,374 | | | | 236,361,312 | |
| | | |
Distributable earnings (accumulated loss) | | | 54,941,087 | | | | (15,435,430 | ) | | | 1,368,406 | |
| | | |
Net Assets | | $ | 1,204,662,745 | | | $ | 308,983,763 | | | $ | 237,910,901 | |
| | | |
| Common Shares Outstanding | | | 89,696,133 | | | | 25,381,879 | | | | 18,118,294 | |
|
| Net Asset Value | |
| | | |
Net assets ÷ common shares issued and outstanding | | $ | 13.43 | | | $ | 12.17 | | | $ | 13.13 | |
| | | | |
| | 22 | | See Notes to Financial Statements. |
Eaton Vance
Municipal Bond Funds
March 31, 2019
Statements of Operations (Unaudited)
| | | | | | | | | | | | |
| | | Six Months Ended March 31, 2019 | |
| Investment Income | | Municipal Fund | | | California Fund | | | New York Fund | |
| | | |
Interest | | $ | 32,046,687 | | | $ | 9,258,372 | | | $ | 6,987,579 | |
| | | |
Total investment income | | $ | 32,046,687 | | | $ | 9,258,372 | | | $ | 6,987,579 | |
|
| Expenses | |
| | | |
Investment adviser fee | | $ | 4,827,810 | | | $ | 1,479,722 | | | $ | 1,083,942 | |
| | | |
Trustees’ fees and expenses | | | 44,554 | | | | 15,144 | | | | 11,124 | |
| | | |
Custodian fee | | | 155,831 | | | | 61,794 | | | | 50,559 | |
| | | |
Transfer and dividend disbursing agent fees | | | 15,296 | | | | 13,704 | | | | 15,287 | |
| | | |
Legal and accounting services | | | 69,530 | | | | 47,799 | | | | 44,488 | |
| | | |
Printing and postage | | | 49,652 | | | | 10,215 | | | | 6,920 | |
| | | |
Interest expense and fees | | | 7,037,329 | | | | 2,304,386 | | | | 1,563,931 | |
| | | |
Miscellaneous | | | 23,976 | | | | 15,979 | | | | 11,718 | |
| | | |
Total expenses | | $ | 12,223,978 | | | $ | 3,948,743 | | | $ | 2,787,969 | |
| | | |
Net investment income | | $ | 19,822,709 | | | $ | 5,309,629 | | | $ | 4,199,610 | |
|
| Realized and Unrealized Gain (Loss) | |
| | | |
Net realized gain (loss) — | | | | | | | | | | | | |
| | | |
Investment transactions | | $ | (3,477,074 | ) | | $ | (889,632 | ) | | $ | (378,365 | ) |
| | | |
Financial futures contracts | | | (684,205 | ) | | | — | | | | — | |
| | | |
Net realized loss | | $ | (4,161,279 | ) | | $ | (889,632 | ) | | $ | (378,365 | ) |
| | | |
Change in unrealized appreciation (depreciation) — | | | | | | | | | | | | |
| | | |
Investments | | $ | 42,185,029 | | | $ | 11,313,043 | | | $ | 7,335,006 | |
| | | |
Financial futures contracts | | | (768,109 | ) | | | — | | | | — | |
| | | |
Net change in unrealized appreciation (depreciation) | | $ | 41,416,920 | | | $ | 11,313,043 | | | $ | 7,335,006 | |
| | | |
Net realized and unrealized gain | | $ | 37,255,641 | | | $ | 10,423,411 | | | $ | 6,956,641 | |
| | | |
Net increase in net assets from operations | | $ | 57,078,350 | | | $ | 15,733,040 | | | $ | 11,156,251 | |
| | | | |
| | 23 | | See Notes to Financial Statements. |
Eaton Vance
Municipal Bond Funds
March 31, 2019
Statements of Changes in Net Assets
| | | | | | | | | | | | |
| | | Six Months Ended March 31, 2019 (Unaudited) | |
| Increase (Decrease) in Net Assets | | Municipal Fund | | | California Fund | | | New York Fund | |
| | | |
From operations — | | | | | | | | | | | | |
| | | |
Net investment income | | $ | 19,822,709 | | | $ | 5,309,629 | | | $ | 4,199,610 | |
| | | |
Net realized loss | | | (4,161,279 | ) | | | (889,632 | ) | | | (378,365 | ) |
| | | |
Net change in unrealized appreciation (depreciation) | | | 41,416,920 | | | | 11,313,043 | | | | 7,335,006 | |
| | | |
Net increase in net assets from operations | | $ | 57,078,350 | | | $ | 15,733,040 | | | $ | 11,156,251 | |
| | | |
Distributions to common shareholders | | $ | (18,765,481 | ) | | $ | (5,543,011 | ) | | $ | (4,420,789 | ) |
| | | |
Capital share transactions — | | | | | | | | | | | | |
| | | |
Issued in connection with tax-free reorganizations (see Note 9) | | $ | 287,993,697 | | | $ | 46,853,792 | | | $ | 31,246,579 | |
| | | |
Cost of shares repurchased (see Note 5) | | | (3,634,136 | ) | | | — | | | | — | |
| | | |
Net increase in net assets from capital share transactions | | $ | 284,359,561 | | | $ | 46,853,792 | | | $ | 31,246,579 | |
| | | |
Net increase in net assets | | $ | 322,672,430 | | | $ | 57,043,821 | | | $ | 37,982,041 | |
|
| Net Assets | |
| | | |
At beginning of period | | $ | 881,990,315 | | | $ | 251,939,942 | | | $ | 199,928,860 | |
| | | |
At end of period | | $ | 1,204,662,745 | | | $ | 308,983,763 | | | $ | 237,910,901 | |
| | | | |
| | 24 | | See Notes to Financial Statements. |
Eaton Vance
Municipal Bond Funds
March 31, 2019
Statements of Changes in Net Assets — continued
| | | | | | | | | | | | |
| | | Year Ended September 30, 2018 | |
| Increase (Decrease) in Net Assets | | Municipal Fund | | | California Fund | | | New York Fund | |
| | | |
From operations — | | | | | | | | | | | | |
| | | |
Net investment income | | $ | 39,030,164 | | | $ | 10,305,471 | | | $ | 8,440,030 | |
| | | |
Net realized loss | | | (1,179,634 | ) | | | (1,802,114 | ) | | | (522,072 | ) |
| | | |
Net change in unrealized appreciation (depreciation) | | | (52,408,908 | ) | | | (11,981,311 | ) | | | (12,334,355 | ) |
| | | |
Net decrease in net assets from operations | | $ | (14,558,378 | ) | | $ | (3,477,954 | ) | | $ | (4,416,397 | ) |
| | | |
Distributions to common shareholders | | $ | (39,030,958 | ) | | $ | (10,928,233 | ) | | $ | (8,839,509 | ) |
| | | |
Tax return of capital to common shareholders | | $ | (1,072,424 | ) | | $ | — | | | $ | — | |
| | | |
Net decrease in net assets | | $ | (54,661,760 | ) | | $ | (14,406,187 | ) | | $ | (13,255,906 | ) |
|
| Net Assets | |
| | | |
At beginning of year | | $ | 936,652,075 | | | $ | 266,346,129 | | | $ | 213,184,766 | |
| | | |
At end of year | | $ | 881,990,315 | | | $ | 251,939,942 | | | $ | 199,928,860 | |
| | | | |
| | 25 | | See Notes to Financial Statements. |
Eaton Vance
Municipal Bond Funds
March 31, 2019
Statements of Cash Flows (Unaudited)
| | | | | | | | | | | | |
| | | Six Months Ended March 31, 2019 | |
| Cash Flows From Operating Activities | | Municipal Fund | | | California Fund | | | New York Fund | |
| | | |
Net increase in net assets from operations | | $ | 57,078,350 | | | $ | 15,733,040 | | | $ | 11,156,251 | |
| | | |
Adjustments to reconcile net increase in net assets from operations to net cash provided by operating activities: | | | | | | | | | | | | |
| | | |
Investments purchased | | | (169,181,211 | ) | | | (77,835,195 | ) | | | (36,288,918 | ) |
| | | |
Investments sold | | | 166,941,045 | | | | 77,758,260 | | | | 59,611,758 | |
| | | |
Net amortization/accretion of premium (discount) | | | 355,528 | | | | 1,035,746 | | | | 796,840 | |
| | | |
Amortization of deferred debt issuance costs | | | — | | | | — | | | | 453 | |
| | | |
Decrease (increase) in interest receivable | | | (440,377 | ) | | | 167,847 | | | | 562,978 | |
| | | |
Decrease in receivable for variation margin on open financial futures contracts | | | 35,780 | | | | — | | | | — | |
| | | |
Increase in payable to affiliate for investment adviser fee | | | 115,080 | | | | 31,785 | | | | 11,068 | |
| | | |
Increase (decrease) in interest expense and fees payable | | | 548,090 | | | | 50,929 | | | | (149,296 | ) |
| | | |
Decrease in accrued expenses | | | (100,492 | ) | | | (31,076 | ) | | | (36,850 | ) |
| | | |
Net change in unrealized (appreciation) depreciation from investments | | | (42,185,029 | ) | | | (11,313,043 | ) | | | (7,335,006 | ) |
| | | |
Net realized loss from investments | | | 3,477,074 | | | | 889,632 | | | | 378,365 | |
| | | |
Net cash provided by operating activities | | $ | 16,643,838 | | | $ | 6,487,925 | | | $ | 28,707,643 | |
|
| Cash Flows From Financing Activities | |
| | | |
Repurchase of common shares | | $ | (3,634,136 | ) | | $ | — | | | $ | — | |
| | | |
Cash distributions paid to common shareholders | | | (19,854,573 | ) | | | (5,680,588 | ) | | | (4,522,282 | ) |
| | | |
Proceeds from secured borrowings | | | 71,940,000 | | | | 14,600,000 | | | | — | |
| | | |
Repayment of secured borrowings | | | (69,295,000 | ) | | | (14,600,000 | ) | | | (22,800,000 | ) |
| | | |
Decrease in due to custodian | | | — | | | | (1,090,344 | ) | | | (251,989 | ) |
| | | |
Cash acquired in connection with tax-free reorganizations (see Note 9) | | | 8,194,491 | | | | 283,007 | | | | 698,985 | |
| | | |
Net cash used in financing activities | | $ | (12,649,218 | ) | | $ | (6,487,925 | ) | | $ | (26,875,286 | ) |
| | | |
Net increase in cash | | $ | 3,994,620 | | | $ | — | | | $ | 1,832,357 | |
| | | |
Cash and restricted cash at beginning of period | | $ | 707,694 | (1) | | $ | — | | | $ | — | |
| | | |
Cash at end of period | | $ | 4,702,314 | | | $ | — | | | $ | 1,832,357 | |
|
| Supplemental disclosure of cash flow information: | |
| | | |
Noncash operating activities not included herein consist of: | | | | | | | | | | | | |
| | | |
Acquisition of net assets in connection with tax-free reorganizations (see Note 9), less cash acquired | | $ | 279,799,206 | | | $ | 46,570,785 | | | $ | 30,547,594 | |
| | | |
Noncash financing activities not included herein consist of: | | | | | | | | | | | | |
| | | |
Issuance of Fund shares in connection with tax-free reorganizations (see Note 9) | | $ | 287,993,697 | | | $ | 46,853,792 | | | $ | 31,246,579 | |
| | | |
Cash paid for interest and fees | | $ | 6,489,239 | | | $ | 2,253,457 | | | $ | 1,712,774 | |
| (1) | Includes cash of $180,994 and deposits for derivatives collateral – financial futures contracts of $526,700. |
| | | | |
| | 26 | | See Notes to Financial Statements. |
Eaton Vance
Municipal Bond Funds
March 31, 2019
Financial Highlights
| | | | | | | | | | | | | | | | | | | | | | | | |
| | | Municipal Fund | |
| | |
| | | Six Months Ended
March 31, 2019
(Unaudited) | | | Year Ended September 30, | |
| | | 2018 | | | 2017 | | | 2016 | | | 2015 | | | 2014 | |
| | | | | | | |
Net asset value — Beginning of period | | $ | 12.940 | | | $ | 13.740 | | | $ | 14.480 | | | $ | 13.870 | | | $ | 13.940 | | | $ | 12.290 | |
| | | | | | |
| Income (Loss) From Operations | | | | | | | | | | | | | | | | | | | | | | | | |
| | | | | | |
Net investment income(1) | | $ | 0.270 | | | $ | 0.573 | | | $ | 0.640 | | | $ | 0.706 | | | $ | 0.760 | | | $ | 0.783 | |
| | | | | | |
Net realized and unrealized gain (loss) | | | 0.464 | | | | (0.785 | ) | | | (0.739 | ) | | | 0.631 | | | | (0.064 | ) | | | 1.633 | |
| | | | | | |
Total income (loss) from operations | | $ | 0.734 | | | $ | (0.212 | ) | | $ | (0.099 | ) | | $ | 1.337 | | | $ | 0.696 | | | $ | 2.416 | |
| | | | | | |
| Less Distributions | | | | | | | | | | | | | | | | | | | | | | | | |
| | | | | | |
From net investment income | | $ | (0.259 | ) | | $ | (0.572 | ) | | $ | (0.641 | ) | | $ | (0.727 | ) | | $ | (0.766 | ) | | $ | (0.766 | ) |
| | | | | | |
Tax return of capital | | | — | | | | (0.016 | ) | | | — | | | | — | | | | — | | | | — | |
| | | | | | |
Total distributions | | $ | (0.259 | ) | | $ | (0.588 | ) | | $ | (0.641 | ) | | $ | (0.727 | ) | | $ | (0.766 | ) | | $ | (0.766 | ) |
| | | | | | |
Anti-dilutive effect of share repurchase program (see Note 5)(1) | | $ | 0.015 | | | $ | — | | | $ | — | | | $ | — | | | $ | — | | | $ | — | |
| | | | | | |
Net asset value — End of period | | $ | 13.430 | | | $ | 12.940 | | | $ | 13.740 | | | $ | 14.480 | | | $ | 13.870 | | | $ | 13.940 | |
| | | | | | |
Market value — End of period | | $ | 12.400 | | | $ | 11.530 | | | $ | 12.680 | | | $ | 13.620 | | | $ | 12.510 | | | $ | 12.520 | |
| | | | | | |
Total Investment Return on Net Asset Value(2) | | | 6.13 | %(3) | | | (1.09 | )% | | | (0.19 | )% | | | 10.19 | % | | | 5.69 | % | | | 21.00 | % |
| | | | | | |
Total Investment Return on Market Value(2) | | | 9.97 | %(3) | | | (4.50 | )% | | | (2.08 | )% | | | 14.91 | % | | | 6.14 | % | | | 15.44 | % |
| | | | | | |
| Ratios/Supplemental Data | | | | | | | | | | | | | | | | | | | | | | | | |
| | | | | | |
Net assets, end of period (000’s omitted) | | $ | 1,204,663 | | | $ | 881,990 | | | $ | 936,652 | | | $ | 987,016 | | | $ | 945,479 | | | $ | 950,519 | |
| | | | | | |
Ratios (as a percentage of average daily net assets): | | | | | | | | | | | | | | | | | | | | | | | | |
| | | | | | |
Expenses excluding interest and fees(4) | | | 1.09 | %(5) | | | 1.07 | % | | | 1.07 | % | | | 1.05 | % | | | 1.05 | % | | | 1.12 | % |
| | | | | | |
Interest and fee expense(6) | | | 1.47 | %(5) | | | 1.25 | % | | | 0.93 | % | | | 0.53 | % | | | 0.38 | % | | | 0.43 | % |
| | | | | | |
Total expenses(4) | | | 2.56 | %(5) | | | 2.32 | % | | | 2.00 | % | | | 1.58 | % | | | 1.43 | % | | | 1.55 | % |
| | | | | | |
Net investment income | | | 4.15 | %(5) | | | 4.29 | % | | | 4.67 | % | | | 4.92 | % | | | 5.43 | % | | | 6.01 | % |
| | | | | | |
Portfolio Turnover | | | 10 | %(3) | | | 17 | % | | | 6 | % | | | 18 | % | | | 5 | % | | | 9 | % |
| (1) | Computed using average shares outstanding. |
| (2) | Returns are historical and are calculated by determining the percentage change in net asset value or market value with all distributions reinvested. Distributions are assumed to be reinvested at prices obtained under the Fund’s dividend reinvestment plan. |
| (4) | Excludes the effect of custody fee credits, if any, of less than 0.005%. Effective September 1, 2015, custody fee credits, which were earned on cash deposit balances, were discontinued by the custodian. |
| (6) | Interest and fee expense relates to the liability for floating rate notes issued in conjunction with residual interest bond transactions (see Note 1G). |
| | | | |
| | 27 | | See Notes to Financial Statements. |
Eaton Vance
Municipal Bond Funds
March 31, 2019
Financial Highlights — continued
| | | | | | | | | | | | | | | | | | | | | | | | |
| | | California Fund | |
| | |
| | | Six Months Ended
March 31, 2019
(Unaudited) | | | Year Ended September 30, | |
| | | 2018 | | | 2017 | | | 2016 | | | 2015 | | | 2014 | |
| | | | | | | |
Net asset value — Beginning of period | | $ | 11.780 | | | $ | 12.450 | | | $ | 13.050 | | | $ | 12.720 | | | $ | 12.900 | | | $ | 11.510 | |
| | | | | | |
| Income (Loss) From Operations | | | | | | | | | | | | | | | | | | | | | | | | |
| | | | | | |
Net investment income(1) | | $ | 0.224 | | | $ | 0.482 | | | $ | 0.566 | | | $ | 0.637 | | | $ | 0.688 | | | $ | 0.700 | |
| | | | | | |
Net realized and unrealized gain (loss) | | | 0.403 | | | | (0.641 | ) | | | (0.582 | ) | | | 0.377 | | | | (0.184 | ) | | | 1.326 | |
| | | | | | |
Total income (loss) from operations | | $ | 0.627 | | | $ | (0.159 | ) | | $ | (0.016 | ) | | $ | 1.014 | | | $ | 0.504 | | | $ | 2.026 | |
| | | | | | |
| Less Distributions | | | | | | | | | | | | | | | | | | | | | | | | |
| | | | | | |
From net investment income | | $ | (0.237 | ) | | $ | (0.511 | ) | | $ | (0.584 | ) | | $ | (0.684 | ) | | $ | (0.684 | ) | | $ | (0.657 | ) |
| | | | | | |
Total distributions | | $ | (0.237 | ) | | $ | (0.511 | ) | | $ | (0.584 | ) | | $ | (0.684 | ) | | $ | (0.684 | ) | | $ | (0.657 | ) |
| | | | | | |
Anti-dilutive effect of share repurchase program (see Note 5)(1) | | $ | — | | | $ | — | | | $ | — | | | $ | — | | | $ | 0.000 | (2) | | $ | 0.021 | |
| | | | | | |
Net asset value — End of period | | $ | 12.170 | | | $ | 11.780 | | | $ | 12.450 | | | $ | 13.050 | | | $ | 12.720 | | | $ | 12.900 | |
| | | | | | |
Market value — End of period | | $ | 10.550 | | | $ | 9.960 | | | $ | 12.040 | | | $ | 13.560 | | | $ | 11.630 | | | $ | 11.350 | |
| | | | | | |
Total Investment Return on Net Asset Value(3) | | | 5.73 | %(4) | | | (0.79 | )% | | | 0.27 | % | | | 8.22 | % | | | 4.46 | % | | | 18.96 | % |
| | | | | | |
Total Investment Return on Market Value(3) | | | 8.40 | %(4) | | | (13.26 | )% | | | (6.67 | )% | | | 22.99 | % | | | 8.55 | % | | | 16.62 | % |
| | | | | | |
| Ratios/Supplemental Data | | | | | | | | | | | | | | | | | | | | | | | | |
| | | | | | |
Net assets, end of period (000’s omitted) | | $ | 308,984 | | | $ | 251,940 | | | $ | 266,346 | | | $ | 279,281 | | | $ | 272,045 | | | $ | 276,022 | |
| | | | | | |
Ratios (as a percentage of average daily net assets): | | | | | | | | | | | | | | | | | | | | | | | | |
| | | | | | |
Expenses excluding interest and fees(5) | | | 1.17 | %(6) | | | 1.16 | % | | | 1.15 | % | | | 1.13 | % | | | 1.11 | % | | | 1.16 | % |
| | | | | | |
Interest and fee expense(7) | | | 1.65 | %(6) | | | 1.41 | % | | | 1.01 | % | | | 0.58 | % | | | 0.40 | % | | | 0.42 | % |
| | | | | | |
Total expenses(5) | | | 2.82 | %(6) | | | 2.57 | % | | | 2.16 | % | | | 1.71 | % | | | 1.51 | % | | | 1.58 | % |
| | | | | | |
Net investment income | | | 3.80 | %(6) | | | 3.99 | % | | | 4.55 | % | | | 4.89 | % | | | 5.36 | % | | | 5.75 | % |
| | | | | | |
Portfolio Turnover | | | 14 | %(4) | | | 24 | % | | | 19 | % | | | 12 | % | | | 7 | % | | | 7 | % |
| (1) | Computed using average shares outstanding. |
| (2) | Amount is less than $0.0005. |
| (3) | Returns are historical and are calculated by determining the percentage change in net asset value or market value with all distributions reinvested. Distributions are assumed to be reinvested at prices obtained under the Fund’s dividend reinvestment plan. |
| (5) | Excludes the effect of custody fee credits, if any, of less than 0.005%. Effective September 1, 2015, custody fee credits, which were earned on cash deposit balances, were discontinued by the custodian. |
| (7) | Interest and fee expense relates to the liability for floating rate notes issued in conjunction with residual interest bond transactions (see Note 1G). |
| | | | |
| | 28 | | See Notes to Financial Statements. |
Eaton Vance
Municipal Bond Funds
March 31, 2019
Financial Highlights — continued
| | | | | | | | | | | | | | | | | | | | | | | | |
| | | New York Fund | |
| | |
| | | Six Months Ended
March 31, 2019
(Unaudited) | | | Year Ended September 30, | |
| | | 2018 | | | 2017 | | | 2016 | | | 2015 | | | 2014 | |
| | | | | | | |
Net asset value — Beginning of period | | $ | 12.770 | | | $ | 13.610 | | | $ | 14.290 | | | $ | 13.940 | | | $ | 14.040 | | | $ | 12.740 | |
| | | | | | |
| Income (Loss) From Operations | | | | | | | | | | | | | | | | | | | | | | | | |
| | | | | | |
Net investment income(1) | | $ | 0.246 | | | $ | 0.539 | | | $ | 0.599 | | | $ | 0.666 | | | $ | 0.716 | | | $ | 0.752 | |
| | | | | | |
Net realized and unrealized gain (loss) | | | 0.376 | | | | (0.815 | ) | | | (0.661 | ) | | | 0.402 | | | | (0.100 | ) | | | 1.219 | |
| | | | | | |
Total income (loss) from operations | | $ | 0.622 | | | $ | (0.276 | ) | | $ | (0.062 | ) | | $ | 1.068 | | | $ | 0.616 | | | $ | 1.971 | |
| | | | | | |
| Less Distributions | | | | | | | | | | | | | | | | | | | | | | | | |
| | | | | | |
From net investment income | | $ | (0.262 | ) | | $ | (0.564 | ) | | $ | (0.618 | ) | | $ | (0.718 | ) | | $ | (0.718 | ) | | $ | (0.690 | ) |
| | | | | | |
Total distributions | | $ | (0.262 | ) | | $ | (0.564 | ) | | $ | (0.618 | ) | | $ | (0.718 | ) | | $ | (0.718 | ) | | $ | (0.690 | ) |
| | | | | | |
Anti-dilutive effect of share repurchase program (see Note 5)(1) | | $ | — | | | $ | — | | | $ | — | | | $ | — | | | $ | 0.002 | | | $ | 0.019 | |
| | | | | | |
Net asset value — End of period | | $ | 13.130 | | | $ | 12.770 | | | $ | 13.610 | | | $ | 14.290 | | | $ | 13.940 | | | $ | 14.040 | |
| | | | | | |
Market value — End of period | | $ | 11.750 | | | $ | 11.060 | | | $ | 12.930 | | | $ | 14.320 | | | $ | 12.600 | | | $ | 12.330 | |
| | | | | | |
Total Investment Return on Net Asset Value(2) | | | 5.22 | %(3) | | | (1.50 | )% | | | 0.02 | % | | | 8.01 | % | | | 5.07 | % | | | 16.72 | % |
| | | | | | |
Total Investment Return on Market Value(2) | | | 8.72 | %(3) | | | (10.20 | )% | | | (5.18 | )% | | | 19.75 | % | | | 8.14 | % | | | 13.16 | % |
| | | | | | |
| Ratios/Supplemental Data | | | | | | | | | | | | | | | | | | | | | | | | |
| | | | | | |
Net assets, end of period (000’s omitted) | | $ | 237,911 | | | $ | 199,929 | | | $ | 213,185 | | | $ | 223,810 | | | $ | 218,282 | | | $ | 220,190 | |
| | | | | | |
Ratios (as a percentage of average daily net assets): | | | | | | | | | | | | | | | | | | | | | | | | |
| | | | | | |
Expenses excluding interest and fees(4) | | | 1.13 | %(5) | | | 1.19 | % | | | 1.22 | % | | | 1.18 | % | | | 1.20 | % | | | 1.22 | % |
| | | | | | |
Interest and fee expense(6) | | | 1.43 | %(5) | | | 1.35 | % | | | 0.94 | % | | | 0.53 | % | | | 0.37 | % | | | 0.40 | % |
| | | | | | |
Total expenses(4) | | | 2.56 | %(5) | | | 2.54 | % | | | 2.16 | % | | | 1.71 | % | | | 1.57 | % | | | 1.62 | % |
| | | | | | |
Net investment income | | | 3.85 | %(5) | | | 4.10 | % | | | 4.41 | % | | | 4.66 | % | | | 5.11 | % | | | 5.65 | % |
| | | | | | |
Portfolio Turnover | | | 10 | %(3) | | | 15 | % | | | 10 | % | | | 11 | % | | | 5 | % | | | 7 | % |
| (1) | Computed using average shares outstanding. |
| (2) | Returns are historical and are calculated by determining the percentage change in net asset value or market value with all distributions reinvested. Distributions are assumed to be reinvested at prices obtained under the Fund’s dividend reinvestment plan. |
| (4) | Excludes the effect of custody fee credits, if any, of less than 0.005%. Effective September 1, 2015, custody fee credits, which were earned on cash deposit balances, were discontinued by the custodian. |
| (6) | Interest and fee expense relates to the liability for floating rate notes issued in conjunction with residual interest bond transactions (see Note 1G). |
| | | | |
| | 29 | | See Notes to Financial Statements. |
Eaton Vance
Municipal Bond Funds
March 31, 2019
Notes to Financial Statements (Unaudited)
1 Significant Accounting Policies
Eaton Vance Municipal Bond Fund (Municipal Fund), Eaton Vance California Municipal Bond Fund (California Fund) and Eaton Vance New York Municipal Bond Fund (New York Fund), (each individually referred to as the Fund, and collectively, the Funds), are Massachusetts business trusts registered under the Investment Company Act of 1940, as amended (the 1940 Act), as non-diversified, closed-end management investment companies. Prior to April 24, 2019, the Funds’ investment objective was to provide current income exempt from regular federal income tax, including alternative minimum tax (AMT), and, in state specific funds, taxes in its specified state and city (if any). Effective April 24, 2019, each Fund’s investment objective was revised to eliminate references to the AMT; however, each Fund will continue to invest at least 80% of its net assets in municipal obligations which are exempt from the AMT.
The following is a summary of significant accounting policies of the Funds. The policies are in conformity with accounting principles generally accepted in the United States of America (U.S. GAAP). Each Fund is an investment company and follows accounting and reporting guidance in the Financial Accounting Standards Board (FASB) Accounting Standards Codification Topic 946.
A Investment Valuation — The following methodologies are used to determine the market value or fair value of investments.
Debt Obligations. Debt obligations are generally valued on the basis of valuations provided by third party pricing services, as derived from such services’ pricing models. Inputs to the models may include, but are not limited to, reported trades, executable bid and ask prices, broker/dealer quotations, prices or yields of securities with similar characteristics, interest rates, anticipated prepayments, benchmark curves or information pertaining to the issuer, as well as industry and economic events. The pricing services may use a matrix approach, which considers information regarding securities with similar characteristics to determine the valuation for a security. Short-term debt obligations purchased with a remaining maturity of sixty days or less for which a valuation from a third party pricing service is not readily available may be valued at amortized cost, which approximates fair value.
Derivatives. Financial futures contracts are valued at the closing settlement price established by the board of trade or exchange on which they are traded.
Fair Valuation. Investments for which valuations or market quotations are not readily available or are deemed unreliable are valued at fair value using methods determined in good faith by or at the direction of the Trustees of a Fund in a manner that fairly reflects the security’s value, or the amount that a Fund might reasonably expect to receive for the security upon its current sale in the ordinary course. Each such determination is based on a consideration of relevant factors, which are likely to vary from one pricing context to another. These factors may include, but are not limited to, the type of security, the existence of any contractual restrictions on the security’s disposition, the price and extent of public trading in similar securities of the issuer or of comparable entities, quotations or relevant information obtained from broker/dealers or other market participants, information obtained from the issuer, analysts, and/or the appropriate stock exchange (for exchange-traded securities), an analysis of the entity’s financial condition, and an evaluation of the forces that influence the issuer and the market(s) in which the security is purchased and sold.
B Investment Transactions and Related Income — Investment transactions for financial statement purposes are accounted for on a trade date basis. Realized gains and losses on investments sold are determined on the basis of identified cost. Interest income is recorded on the basis of interest accrued, adjusted for amortization of premium or accretion of discount.
C Federal Taxes — Each Fund’s policy is to comply with the provisions of the Internal Revenue Code applicable to regulated investment companies and to distribute to shareholders each year substantially all of its taxable, if any, and tax-exempt net investment income, and all or substantially all of its net realized capital gains. Accordingly, no provision for federal income or excise tax is necessary. Each Fund intends to satisfy conditions which will enable it to designate distributions from the interest income generated by its investments in municipal obligations, which are exempt from regular federal income tax when received by each Fund, as exempt-interest dividends.
As of March 31, 2019, the Funds had no uncertain tax positions that would require financial statement recognition, de-recognition, or disclosure. Each Fund files a U.S. federal income tax return annually after its fiscal year-end, which is subject to examination by the Internal Revenue Service for a period of three years from the date of filing.
D Legal Fees — Legal fees and other related expenses incurred as part of negotiations of the terms and requirement of capital infusions, or that are expected to result in the restructuring of, or a plan of reorganization for, an investment are recorded as realized losses. Ongoing expenditures to protect or enhance an investment are treated as operating expenses.
E Use of Estimates — The preparation of the financial statements in conformity with U.S. GAAP requires management to make estimates and assumptions that affect the reported amounts of assets and liabilities at the date of the financial statements and the reported amounts of income and expense during the reporting period. Actual results could differ from those estimates.
F Indemnifications — Under each Fund’s organizational documents, its officers and Trustees may be indemnified against certain liabilities and expenses arising out of the performance of their duties to each Fund. Under Massachusetts law, if certain conditions prevail, shareholders of a Massachusetts business trust (such as a Fund) could be deemed to have personal liability for the obligations of the Fund. However, each Fund’s Declaration of Trust contains an express disclaimer of liability on the part of Fund shareholders and the By-laws provide that the Fund shall assume the defense on behalf of any Fund shareholders. Moreover, the By-laws also provide for indemnification out of Fund property of any shareholder held personally liable solely by
Eaton Vance
Municipal Bond Funds
March 31, 2019
Notes to Financial Statements (Unaudited) — continued
reason of being or having been a shareholder for all loss or expense arising from such liability. Additionally, in the normal course of business, each Fund enters into agreements with service providers that may contain indemnification clauses. Each Fund’s maximum exposure under these arrangements is unknown as this would involve future claims that may be made against each Fund that have not yet occurred.
G Floating Rate Notes Issued in Conjunction with Securities Held — The Funds may invest in residual interest bonds, also referred to as inverse floating rate securities, whereby a Fund may sell a variable or fixed rate bond for cash to a Special-Purpose Vehicle (the SPV), (which is generally organized as a trust), while at the same time, buying a residual interest in the assets and cash flows of the SPV. The bond is deposited into the SPV with the same CUSIP number as the bond sold to the SPV by the Fund, and which may have been, but is not required to be, the bond purchased from the Fund (the Bond). The SPV also issues floating rate notes (Floating Rate Notes) which are sold to third-parties. The residual interest bond held by a Fund gives the Fund the right (1) to cause the holders of the Floating Rate Notes to generally tender their notes at par, and (2) to have the Bond held by the SPV transferred to the Fund, thereby terminating the SPV. Should the Fund exercise such right, it would generally pay the SPV the par amount due on the Floating Rate Notes and exchange the residual interest bond for the underlying Bond. Pursuant to generally accepted accounting principles for transfers and servicing of financial assets and extinguishment of liabilities, the Funds account for the transaction described above as a secured borrowing by including the Bond in their Portfolio of Investments and the Floating Rate Notes (net of unamortized deferred debt issuance costs, if any) as a liability under the caption “Payable for floating rate notes issued” in their Statement of Assets and Liabilities. The Floating Rate Notes have interest rates that generally reset weekly and their holders have the option to tender their notes to the SPV for redemption at par at each reset date. Accordingly, the fair value of the payable for floating rate notes issued approximates its carrying value. If measured at fair value, the payable for floating rate notes would have been considered as Level 2 in the fair value hierarchy (see Note 8) at March 31, 2019. Interest expense related to a Fund’s liability with respect to Floating Rate Notes is recorded as incurred. The SPV may be terminated by the Fund, as noted above, or by the occurrence of certain termination events as defined in the trust agreement, such as a downgrade in the credit quality of the underlying Bond, bankruptcy of or payment failure by the issuer of the underlying Bond, the inability to remarket Floating Rate Notes that have been tendered due to insufficient buyers in the market, or the failure by the SPV to obtain renewal of the liquidity agreement under which liquidity support is provided for the Floating Rate Notes up to one year. Structuring fees paid to the liquidity provider upon the creation of an SPV are recorded as debt issuance costs and are being amortized as interest expense to the expected maturity of the related trust. Unamortized structuring fees related to a terminated SPV are recorded as a realized loss on extinguishment of debt. At March 31, 2019, the amounts of the Funds’ Floating Rate Notes and related interest rates and collateral were as follows:
| | | | | | | | | | | | |
| | | Municipal Fund | | | California
Fund | | | New York
Fund | |
| | | |
Floating Rate Notes Outstanding | | $ | 778,721,963 | | | $ | 225,994,113 | | | $ | 145,016,967 | |
| | | |
Interest Rate or Range of Interest Rates (%) | | | 1.35 - 1.90 | | | | 1.43 - 1.55 | | | | 1.50 - 1.53 | |
| | | |
Collateral for Floating Rate Notes Outstanding | | $ | 1,066,772,530 | | | $ | 316,112,190 | | | $ | 189,337,681 | |
For the six months ended March 31, 2019, the Funds’ average settled Floating Rate Notes outstanding and the average interest rate (annualized) including fees and amortization of deferred debt issuance costs were as follows:
| | | | | | | | | | | | |
| | | Municipal
Fund | | | California
Fund | | | New York
Fund | |
| | | |
Average Floating Rate Notes Outstanding | | $ | 656,709,698 | | | $ | 218,011,731 | | | $ | 142,716,099 | |
| | | |
Average Interest Rate | | | 2.15 | % | | | 2.12 | % | | | 2.20 | % |
In certain circumstances, the Funds may enter into shortfall and forbearance agreements with brokers by which a Fund agrees to reimburse the broker for the difference between the liquidation value of the Bond held by the SPV and the liquidation value of the Floating Rate Notes, as well as any shortfalls in interest cash flows. The Funds had no shortfalls as of March 31, 2019.
The Funds may also purchase residual interest bonds in a secondary market transaction without first owning the underlying bond. Such transactions are not required to be treated as secured borrowings. Shortfall agreements, if any, related to residual interest bonds purchased in a secondary market transaction are disclosed in the Portfolio of Investments.
The Funds’ investment policies and restrictions expressly permit investments in residual interest bonds. Such bonds typically offer the potential for yields exceeding the yields available on fixed rate bonds with comparable credit quality and maturity. These securities tend to underperform the market for fixed rate bonds in a rising long-term interest rate environment, but tend to outperform the market for fixed rate bonds when long-term interest rates decline. The value and income of residual interest bonds are generally more volatile than that of a fixed rate bond. The Funds’ investment policies do not allow the Funds to borrow money except as permitted by the 1940 Act. Management believes that the Funds’ restrictions on borrowing money and issuing senior securities (other than as specifically permitted) do not apply to Floating Rate Notes issued by the SPV and included as a liability in the Funds’ Statement of
Eaton Vance
Municipal Bond Funds
March 31, 2019
Notes to Financial Statements (Unaudited) — continued
Assets and Liabilities. As secured indebtedness issued by an SPV, Floating Rate Notes are distinct from the borrowings and senior securities to which the Funds’ restrictions apply. Residual interest bonds held by the Funds are securities exempt from registration under Rule 144A of the Securities Act of 1933.
H Financial Futures Contracts — Upon entering into a financial futures contract, a Fund is required to deposit with the broker, either in cash or securities, an amount equal to a certain percentage of the contract amount (initial margin). Subsequent payments, known as variation margin, are made or received by the Fund each business day, depending on the daily fluctuations in the value of the underlying security, and are recorded as unrealized gains or losses by the Fund. Gains (losses) are realized upon the expiration or closing of the financial futures contracts. Should market conditions change unexpectedly, the Fund may not achieve the anticipated benefits of the financial futures contracts and may realize a loss. Futures contracts have minimal counterparty risk as they are exchange traded and the clearinghouse for the exchange is substituted as the counterparty, guaranteeing counterparty performance.
I When-Issued Securities and Delayed Delivery Transactions — The Funds may purchase or sell securities on a delayed delivery or when-issued basis. Payment and delivery may take place after the customary settlement period for that security. At the time the transaction is negotiated, the price of the security that will be delivered is fixed. The Funds maintain cash and/or security positions for these commitments such that sufficient liquid assets will be available to make payments upon settlement. Securities purchased on a delayed delivery or when-issued basis are marked-to-market daily and begin earning interest on settlement date. Losses may arise due to changes in the market value of the underlying securities or if the counterparty does not perform under the contract.
J Interim Financial Statements — The interim financial statements relating to March 31, 2019 and for the six months then ended have not been audited by an independent registered public accounting firm, but in the opinion of the Funds’ management, reflect all adjustments, consisting only of normal recurring adjustments, necessary for the fair presentation of the financial statements.
K New Accounting Pronouncement — During the six months ended March 31, 2019, the Funds adopted the FASB’s Accounting Standards Update No. 2016-18 “Statement of Cash Flows (Topic 230), Restricted Cash, a consensus of the FASB’s Emerging Issues Task Force” (ASU 2016-18), which became effective for fiscal years beginning after December 15, 2017 and interim periods within those fiscal years. Pursuant to the new standard, the Funds are required to include amounts described as restricted cash and restricted cash equivalents with cash and cash equivalents when reconciling the beginning-of-period and end-of-period total amounts shown on their Statement of Cash Flows. Prior to the change, such amounts were disclosed separately within their Statement of Cash Flows. This change in accounting had no impact on the Funds’ net assets.
2 Distributions to Shareholders and Income Tax Information
Each Fund intends to make monthly distributions of net investment income to common shareholders. In addition, at least annually, each Fund intends to distribute all or substantially all of its net realized capital gains (reduced by available capital loss carryforwards from prior years). Distributions are recorded on the ex-dividend date. Distributions to shareholders are determined in accordance with income tax regulations, which may differ from U.S. GAAP. As required by U.S. GAAP, only distributions in excess of tax basis earnings and profits are reported in the financial statements as a return of capital. Permanent differences between book and tax accounting relating to distributions are reclassified to paid-in capital. For tax purposes, distributions from short-term capital gains are considered to be from ordinary income.
At September 30, 2018, the following Funds, for federal income tax purposes, had capital loss carryforwards and deferred capital losses which would reduce the respective Fund’s taxable income arising from future net realized gains on investment transactions, if any, to the extent permitted by the Internal Revenue Code, and thus would reduce the amount of distributions to shareholders, which would otherwise be necessary to relieve the Funds of any liability for federal income or excise tax. Under tax regulations, capital losses incurred in taxable years beginning after December 2010 are considered deferred capital losses and are treated as arising on the first day of a Fund’s next taxable year, retaining the same short-term or long-term character as when originally deferred. Deferred capital losses are required to be used prior to capital loss carryforwards, which carry an expiration date. As a result of this ordering rule, capital loss carryforwards may be more likely to expire unused. The amounts and expiration dates of the capital loss carryforwards, whose character is short-term, and the amounts of the deferred capital losses are as follows:
| | | | | | | | | | | | |
| Expiration Date | | Municipal Fund | | | California Fund | | | New York Fund | |
| | | |
September 30, 2019 | | $ | 16,458,561 | | | $ | 7,665,268 | | | $ | 6,463,209 | |
| | | |
Total capital loss carryforwards | | $ | 16,458,561 | | | $ | 7,665,268 | | | $ | 6,463,209 | |
| | | |
Deferred capital losses: | | | | | | | | | | | | |
| | | |
Short-term | | $ | 34,335,696 | | | $ | 11,334,895 | | | $ | 4,838,129 | |
| | | |
Long-term | | $ | 1,436,119 | | | $ | 18,032,458 | | | $ | 1,804,413 | |
Eaton Vance
Municipal Bond Funds
March 31, 2019
Notes to Financial Statements (Unaudited) — continued
In addition, in connection with the reorganizations described below in Note 9, Municipal Fund, California Fund and New York Fund acquired deferred capital losses of $11,174,426, $5,054,955 and $2,003,507, respectively. Utilization of these deferred capital losses may be limited in accordance with certain income tax regulations.
The cost and unrealized appreciation (depreciation) of investments of each Fund at March 31, 2019, as determined on a federal income tax basis, were as follows:
| | | | | | | | | | | | |
| | | Municipal Fund | | | California Fund | | | New York Fund | |
| | | |
Aggregate cost | | $ | 1,059,311,584 | | | $ | 279,436,287 | | | $ | 210,779,515 | |
| | | |
Gross unrealized appreciation | | $ | 121,964,159 | | | $ | 21,159,990 | | | $ | 17,805,365 | |
| | | |
Gross unrealized depreciation | | | (31,870 | ) | | | — | | | | (1,101,783 | ) |
| | | |
Net unrealized appreciation | | $ | 121,932,289 | | | $ | 21,159,990 | | | $ | 16,703,582 | |
3 Investment Adviser Fee and Other Transactions with Affiliates
The investment adviser fee is earned by Eaton Vance Management (EVM) as compensation for investment advisory services rendered to each Fund. Pursuant to the investment advisory agreement and a subsequent fee reduction agreement between each Fund and EVM, the fee is calculated at an annual rate of 0.60% of each Fund’s average weekly gross assets. The fee reductions cannot be terminated without the consent of a majority of Trustees and a majority of shareholders. Average weekly gross assets include the principal amount of any indebtedness for money borrowed, including debt securities issued by a Fund. Pursuant to a fee reduction agreement between each Fund and EVM, average weekly gross assets are calculated by adding to net assets the amount payable by the Fund to floating rate note holders, such adjustment being limited to the value of the Auction Preferred Shares (APS) outstanding prior to any APS redemptions by the Fund. The investment adviser fee is payable monthly. EVM also serves as the administrator of each Fund, but receives no compensation. For the six months ended March 31, 2019, the investment adviser fees were as follows:
| | | | | | | | | | | | |
| | | Municipal Fund | | | California Fund | | | New York Fund | |
| | | |
Investment Adviser Fee | | $ | 4,827,810 | | | $ | 1,479,722 | | | $ | 1,083,942 | |
Trustees and officers of the Funds who are members of EVM’s organization receive remuneration for their services to the Funds out of the investment adviser fee. Trustees of the Funds who are not affiliated with EVM may elect to defer receipt of all or a percentage of their annual fees in accordance with the terms of the Trustees Deferred Compensation Plan. For the six months ended March 31, 2019, no significant amounts have been deferred. Certain officers and Trustees of the Funds are officers of EVM.
4 Purchases and Sales of Investments
Purchases and sales of investments, other than short-term obligations, for the six months ended March 31, 2019 were as follows:
| | | | | | | | | | | | |
| | | Municipal Fund | | | California Fund | | | New York Fund | |
| | | |
Purchases | | $ | 172,322,181 | | | $ | 68,995,471 | | | $ | 35,735,838 | |
| | | |
Sales | | $ | 158,159,983 | | | $ | 81,288,260 | | | $ | 64,611,758 | |
5 Common Shares of Beneficial Interest
The Funds may issue common shares pursuant to their dividend reinvestment plans. There were no common shares issued by the Funds for the six months ended March 31, 2019 and year ended September 30, 2018 pursuant to such plans.
In November 2013, the Board of Trustees initially approved a share repurchase program for the Funds. Pursuant to the reauthorization of the share repurchase program by the Board of Trustees in March 2019, each Fund is authorized to repurchase up to 10% of its common shares outstanding as of
Eaton Vance
Municipal Bond Funds
March 31, 2019
Notes to Financial Statements (Unaudited) — continued
the last day of the prior calendar year at market prices when shares are trading at a discount to net asset value (NAV). The share repurchase program does not obligate a Fund to purchase a specific amount of shares. During the six months ended March 31, 2019, Municipal Fund repurchased 326,880 of its common shares under the share repurchase program at a cost, including brokerage commissions, of $3,634,136 and an average price per share of $11.12. The weighted average discount per share to NAV on these repurchases amounted to 23.67% for the six months ended March 31, 2019. There were no repurchases of common shares by the Funds for the year ended September 30, 2018.
In addition, Municipal Fund, California Fund and New York Fund issued 21,854,763 shares, 3,987,531 shares and 2,456,514 shares, respectively, in connection with the reorganizations described below in Note 9 during the six months ended March 31, 2019.
At March 31, 2019, one shareholder owned 12.5% of the outstanding shares of Municipal Fund.
6 Overdraft Advances
Pursuant to the custodian agreement, State Street Bank and Trust Company (SSBT) may, in its discretion, advance funds to the Funds to make properly authorized payments. When such payments result in an overdraft, the Funds are obligated to repay SSBT at the current rate of interest charged by SSBT for secured loans (currently, the Federal Funds rate plus 2%). This obligation is payable on demand to SSBT. SSBT has a lien on a Fund’s assets to the extent of any overdraft. At March 31, 2019, the California Fund had a payment due to SSBT pursuant to the foregoing arrangement of $555,190. Based on the short-term nature of these payments and the variable interest rate, the carrying value of the overdraft advances approximated its fair value at March 31, 2019. If measured at fair value, overdraft advances would have been considered as Level 2 in the fair value hierarchy (see Note 8) at March 31, 2019. The Funds’ average overdraft advances during the six months ended March 31, 2019 were not significant.
7 Financial Instruments
The Funds may trade in financial instruments with off-balance sheet risk in the normal course of their investing activities. These financial instruments may include financial futures contracts and may involve, to a varying degree, elements of risk in excess of the amounts recognized for financial statement purposes. The notional or contractual amounts of these instruments represent the investment a Fund has in particular classes of financial instruments and do not necessarily represent the amounts potentially subject to risk. The measurement of the risks associated with these instruments is meaningful only when all related and offsetting transactions are considered. At March 31, 2019, there were no obligations outstanding under these financial instruments.
Each Fund is subject to interest rate risk in the normal course of pursuing its investment objective. Because the Funds hold fixed-rate bonds, the value of these bonds may decrease if interest rates rise. During the six months ended March 31, 2019, Municipal Fund entered into U.S. Treasury futures contracts to hedge against changes in interest rates.
The effect of derivative instruments (not considered to be hedging instruments for accounting disclosure purposes) on the Statement of Operations and whose primary underlying risk exposure is interest rate risk for the six months ended March 31, 2019 was as follows:
| | | | |
| | | Municipal Fund | |
| |
Realized Gain (Loss) on Derivatives Recognized in Income | | $ | (684,205 | )(1) |
| |
Change in Unrealized Appreciation (Depreciation) on Derivatives Recognized in Income | | $ | (768,109 | )(2) |
| (1) | Statement of Operations location: Net realized gain (loss) – Financial futures contracts. |
| (2) | Statement of Operations location: Change in unrealized appreciation (depreciation) – Financial futures contracts. |
The average notional cost of futures contracts (short) outstanding during the six months ended March 31, 2019, which is indicative of the volume of this derivative type, was approximately $18,516,000 for Municipal Fund.
8 Fair Value Measurements
Under generally accepted accounting principles for fair value measurements, a three-tier hierarchy to prioritize the assumptions, referred to as inputs, is used in valuation techniques to measure fair value. The three-tier hierarchy of inputs is summarized in the three broad levels listed below.
| • | | Level 1 – quoted prices in active markets for identical investments |
| • | | Level 2 – other significant observable inputs (including quoted prices for similar investments, interest rates, prepayment speeds, credit risk, etc.) |
| • | | Level 3 – significant unobservable inputs (including a fund’s own assumptions in determining the fair value of investments) |
Eaton Vance
Municipal Bond Funds
March 31, 2019
Notes to Financial Statements (Unaudited) — continued
In cases where the inputs used to measure fair value fall in different levels of the fair value hierarchy, the level disclosed is determined based on the lowest level input that is significant to the fair value measurement in its entirety. The inputs or methodology used for valuing securities are not necessarily an indication of the risk associated with investing in those securities.
At March 31, 2019, the hierarchy of inputs used in valuing the Funds’ investments, which are carried at value, were as follows:
| | | | | | | | | | | | | | | | |
Municipal Fund | |
| Asset Description | | Level 1 | | | Level 2 | | | Level 3 | | | Total | |
| | | | |
Tax-Exempt Municipal Securities | | $ | — | | | $ | 1,959,410,424 | | | $ | — | | | $ | 1,959,410,424 | |
| | | | |
Trust Units | | | — | | | | 555,412 | | | | — | | | | 555,412 | |
| | | | |
Total Investments | | $ | — | | | $ | 1,959,965,836 | | | $ | — | | | $ | 1,959,965,836 | |
|
California Fund | |
| Asset Description | | Level 1 | | | Level 2 | | | Level 3 | | | Total | |
| | | | |
Tax-Exempt Investments | | $ | — | | | $ | 532,590,390 | | | $ | — | | | $ | 532,590,390 | |
| | | | |
Total Investments | | $ | — | | | $ | 532,590,390 | | | $ | — | | | $ | 532,590,390 | |
|
New York Fund | |
| Asset Description | | Level 1 | | | Level 2 | | | Level 3 | | | Total | |
| | | | |
Tax-Exempt Investments | | $ | — | | | $ | 372,500,064 | | | $ | — | | | $ | 372,500,064 | |
| | | | |
Total Investments | | $ | — | | | $ | 372,500,064 | | | $ | — | | | $ | 372,500,064 | |
9 Reorganizations
Municipal Fund
During the six months ended March 31, 2019, Municipal Fund acquired the net assets of Eaton Vance Massachusetts Municipal Bond Fund (Massachusetts Fund), Eaton Vance Michigan Municipal Bond Fund (Michigan Fund), Eaton Vance New Jersey Municipal Bond Fund (New Jersey Fund), Eaton Vance Ohio Municipal Bond Fund (Ohio Fund), Eaton Vance Pennsylvania Municipal Bond Fund (Pennsylvania Fund) and Eaton Vance Municipal Bond Fund II (Municipal Fund II), (collectively, the “Acquired Funds”), pursuant to Agreements and Plans of Reorganization (each, a “Plan”) approved by the respective shareholders of the Acquired Funds. Under the terms of each Plan, the common shares of each Acquired Fund were, in effect, exchanged for new common shares of Municipal Fund with an equal aggregate net asset value. The purpose of each reorganization was to combine two funds managed by EVM with similar investment objectives and policies. Each reorganization was structured as a tax-free reorganization under the Internal Revenue Code.
The net assets and shares outstanding of each Acquired Fund as of the close of business on the closing date of each reorganization and the number of shares issued in each reorganization by Municipal Fund were as follows:
| | | | | | | | | | | | | | | | |
| Closing Date | | Acquired Fund | | | Acquired Fund Shares Outstanding | | | Acquired Fund
Net Assets | | | Municipal Fund
Shares Issued | |
| | | | |
December 14, 2018 | | | Massachusetts Fund | | | | 1,768,514 | | | $ | 25,238,430 | | | | 1,951,416 | |
| | | | |
December 14, 2018 | | | Michigan Fund | | | | 1,500,065 | | | $ | 21,836,875 | | | | 1,688,410 | |
| | | | |
January 18, 2019 | | | New Jersey Fund | | | | 2,579,166 | | | $ | 35,868,539 | | | | 2,745,404 | |
| | | | |
January 18, 2019 | | | Ohio Fund | | | | 2,537,940 | | | $ | 33,611,079 | | | | 2,572,612 | |
| | | | |
January 18, 2019 | | | Pennsylvania Fund | | | | 2,960,040 | | | $ | 40,019,819 | | | | 3,063,142 | |
| | | | |
March 22, 2019 | | | Municipal Fund II | | | | 10,013,381 | | | $ | 131,418,955 | | | | 9,833,779 | |
Eaton Vance
Municipal Bond Funds
March 31, 2019
Notes to Financial Statements (Unaudited) — continued
The investment portfolios of the Acquired Funds were the principal assets acquired by Municipal Fund. For financial reporting purposes, assets received and shares issued by Municipal Fund were recorded at fair value; however, the identified cost of the investments received from the Acquired Funds were carried forward to align ongoing reporting of Municipal Fund’s realized and unrealized gains and losses with amounts distributable to shareholders for tax purposes.
Investments and net assets immediately before each reorganization and combined net assets were as follows:
| | | | | | | | | | | | | | | | | | | | |
| | | Acquired Fund | | | Municipal Fund | | | | |
| | | Investments,
at value | | | Investments,
at cost | | | Net Assets | | | Net Assets | | | Combined Net
Assets | |
| | | | | |
Massachusetts Fund | | $ | 38,996,775 | | | $ | 37,519,639 | | | $ | 25,238,430 | | | | | | | | | |
| | | | | |
Michigan Fund | | $ | 34,639,956 | | | $ | 33,730,348 | | | $ | 21,836,875 | | | | | | | | | |
| | | | | |
| | $ | 73,636,731 | | | $ | 71,249,987 | | | $ | 47,075,305 | | | $ | 877,422,524 | | | $ | 924,497,829 | |
| | | | | |
New Jersey Fund | | $ | 53,601,739 | | | $ | 51,263,517 | | | $ | 35,868,539 | | | | | | | | | |
| | | | | |
Ohio Fund | | $ | 52,616,041 | | | $ | 49,737,600 | | | $ | 33,611,079 | | | | | | | | | |
| | | | | |
Pennsylvania Fund | | $ | 62,673,308 | | | $ | 60,814,048 | | | $ | 40,019,819 | | | | | | | | | |
| | | | | |
| | $ | 168,891,088 | | | $ | 161,815,165 | | | $ | 109,499,437 | | | $ | 933,895,461 | | | $ | 1,043,394,898 | |
| | | | | |
Municipal Fund II | | $ | 205,943,186 | | | $ | 193,716,216 | | | $ | 131,418,955 | | | $ | 1,067,281,699 | | | $ | 1,198,700,654 | |
Included in net assets of the Acquired Funds immediately before each reorganization were accumulated net realized gain (loss) and unrealized appreciation (depreciation) as follows:
| | | | | | | | |
| | | Accumulated
Net Realized
Gain (Loss) | | | Unrealized
Appreciation
(Depreciation) | |
| | |
Massachusetts Fund | | $ | (193,263 | ) | | $ | 1,477,136 | |
| | |
Michigan Fund | | $ | 38,536 | | | $ | 909,608 | |
| | |
New Jersey Fund | | $ | (1,550 | ) | | $ | 2,338,222 | |
| | |
Ohio Fund | | $ | 107,900 | | | $ | 2,878,441 | |
| | |
Pennsylvania Fund | | $ | (1,646,291 | ) | | $ | 1,859,260 | |
| | |
Municipal Fund II | | $ | (8,689,724 | ) | | $ | 12,226,970 | |
Assuming each reorganization had been completed on October 1, 2018, the beginning of Municipal Fund’s annual reporting period, Municipal Fund’s pro forma results of operations for the six months ended March 31, 2019 are as follows:
| | | | |
| | |
Net investment income | | $ | 23,772,955 | |
| |
Net realized and unrealized gain | | $ | 52,003,440 | |
| |
Net increase in net assets from operations | | $ | 75,776,395 | |
Because the combined investment portfolios have been managed as a single integrated portfolio since the closings of the reorganizations, it is not practicable to separate the amounts of revenue and earnings of each Acquired Fund that have been included in Municipal Fund’s Statement of Operations since the time of each closing.
California Fund
At the close of business on December 14, 2018, California Fund acquired the net assets of Eaton Vance California Municipal Bond Fund II (California Fund II) pursuant to an Agreement and Plan of Reorganization (the “Plan”) approved by shareholders of California Fund II. Under the terms of the Plan, the common shares of California Fund II were, in effect, exchanged for new common shares of California Fund with an equal aggregate net asset value. The purpose of the reorganization was to combine two funds managed by EVM with substantially similar investment objectives and policies. The reorganization was structured as a tax-free reorganization under the Internal Revenue Code.
Eaton Vance
Municipal Bond Funds
March 31, 2019
Notes to Financial Statements (Unaudited) — continued
The net assets and shares outstanding of California Fund II as of the close of business on December 14, 2018 and the number of shares issued in the reorganization by California Fund were as follows:
| | | | | | | | | | |
| | | California Fund II | | | California Fund | |
| | | Shares Outstanding | | Net Assets | | | Shares Issued | |
| | | |
| | | 3,886,356 | | $ | 46,853,792 | | | | 3,987,531 | |
The investment portfolio of California Fund II, with a fair value of $79,072,648 and identified cost of $76,841,447 was the principal asset acquired by California Fund. For financial reporting purposes, assets received and shares issued by California Fund were recorded at fair value; however, the identified cost of the investments received from California Fund II was carried forward to align ongoing reporting of California Fund’s realized and unrealized gains and losses with amounts distributable to shareholders for tax purposes. The aggregate net assets of California Fund immediately before the reorganization were $251,386,702. The net assets of California Fund II at that date of $46,853,792, including $5,045,990 of accumulated net realized losses and $2,231,201 of unrealized appreciation, were combined with those of California Fund, resulting in combined net assets of $298,240,494.
Assuming the reorganization had been completed on October 1, 2018, the beginning of California Fund’s annual reporting period, California Fund’s pro forma results of operations for the six months ended March 31, 2019 are as follows:
| | | | |
| | |
Net investment income | | $ | 5,626,217 | |
| |
Net realized and unrealized gain | | $ | 10,171,392 | |
| |
Net increase in net assets from operations | | $ | 15,797,609 | |
Because the combined investment portfolios have been managed as a single integrated portfolio since the reorganization was completed, it is not practicable to separate the amounts of revenue and earnings of California Fund II that have been included in California Fund’s Statement of Operations since December 14, 2018.
New York Fund
At the close of business on December 14, 2018, New York Fund acquired the net assets of Eaton Vance New York Municipal Bond Fund II (New York Fund II) pursuant to an Agreement and Plan of Reorganization (the “Plan”) approved by shareholders of New York Fund II. Under the terms of the Plan, the common shares of New York Fund II were, in effect, exchanged for new common shares of New York Fund with an equal aggregate net asset value. The purpose of the reorganization was to combine two funds managed by EVM with substantially similar investment objectives and policies. The reorganization was structured as a tax-free reorganization under the Internal Revenue Code.
The net assets and shares outstanding of New York Fund II as of the close of business on December 14, 2018 and the number of shares issued in the reorganization by New York Fund were as follows:
| | | | | | | | | | |
| | | New York Fund II | | | New York Fund | |
| | | Shares Outstanding | | Net Assets | | | Shares Issued | |
| | | |
| | | 2,556,510 | | $ | 31,246,579 | | | | 2,456,514 | |
The investment portfolio of New York Fund II, with a fair value of $53,007,450 and identified cost of $51,991,914 was the principal asset acquired by New York Fund. For financial reporting purposes, assets received and shares issued by New York Fund were recorded at fair value; however, the identified cost of the investments received from New York Fund II was carried forward to align ongoing reporting of New York Fund’s realized and unrealized gains and losses with amounts distributable to shareholders for tax purposes. The aggregate net assets of New York Fund immediately before the reorganization were $199,216,655. The net assets of New York Fund II at that date of $31,246,579, including $1,942,265 of accumulated net realized losses and $1,015,536 of unrealized appreciation, were combined with those of New York Fund, resulting in combined net assets of $230,463,234.
Eaton Vance
Municipal Bond Funds
March 31, 2019
Notes to Financial Statements (Unaudited) — continued
Assuming the reorganization had been completed on October 1, 2018, the beginning of New York Fund’s annual reporting period, New York Fund’s pro forma results of operations for the six months ended March 31, 2019 are as follows:
| | | | |
| | |
Net investment income | | $ | 4,392,886 | |
| |
Net realized and unrealized gain | | $ | 7,029,297 | |
| |
Net increase in net assets from operations | | $ | 11,422,183 | |
Because the combined investment portfolios have been managed as a single integrated portfolio since the reorganization was completed, it is not practicable to separate the amounts of revenue and earnings of New York Fund II that have been included in New York Fund’s Statement of Operations since December 14, 2018.
10 Subsequent Event
On April 18, 2019, Municipal Fund commenced a cash tender offer for up to 10% or 8,969,613 of its outstanding common shares at a price per share equal to 98% of Municipal Fund’s net asset value per share as of the close of regular trading on the New York Stock Exchange on the date the tender offer expired. The tender offer expired at 5:00 P.M. Eastern Time on May 17, 2019.
In accordance with the terms and conditions of the tender offer, because the number of shares tendered exceeded the number of shares offered to purchase, Municipal Fund purchased shares from tendering shareholders on a pro-rata basis (disregarding fractional shares). The purchase price of the properly tendered shares was equal to $13.374 per share for an aggregate purchase price of $119,959,604. Following the purchase of the tendered shares, Municipal Fund has approximately 80,726,520 shares of common stock outstanding.
Eaton Vance
Municipal Bond Funds
March 31, 2019
Officers and Trustees
Officers of Eaton Vance Municipal Bond Funds
Payson F. Swaffield
President
Maureen A. Gemma
Vice President, Secretary and Chief Legal Officer
James F. Kirchner
Treasurer
Richard F. Froio
Chief Compliance Officer
Trustees of Eaton Vance Municipal Bond Funds
William H. Park
Chairperson
Thomas E. Faust Jr.*
Mark R. Fetting
Cynthia E. Frost
George J. Gorman
Valerie A. Mosley
Helen Frame Peters
Keith Quinton(1)
Marcus L. Smith(1)
Susan J. Sutherland
Scott E. Wennerholm
| (1) | Messrs. Quinton and Smith began serving as Trustees effective October 1, 2018. |
Eaton Vance Funds
IMPORTANT NOTICES
Privacy. The Eaton Vance organization is committed to ensuring your financial privacy. Each of the financial institutions identified below has in effect the following policy (“Privacy Policy”) with respect to nonpublic personal information about its customers:
| • | | Only such information received from you, through application forms or otherwise, and information about your Eaton Vance fund transactions will be collected. This may include information such as name, address, social security number, tax status, account balances and transactions. |
| • | | None of such information about you (or former customers) will be disclosed to anyone, except as permitted by law (which includes disclosure to employees necessary to service your account). In the normal course of servicing a customer’s account, Eaton Vance may share information with unaffiliated third parties that perform various required services such as transfer agents, custodians and broker-dealers. |
| • | | Policies and procedures (including physical, electronic and procedural safeguards) are in place that are designed to protect the confidentiality of such information. |
| • | | We reserve the right to change our Privacy Policy at any time upon proper notification to you. Customers may want to review our Privacy Policy periodically for changes by accessing the link on our homepage: www.eatonvance.com. |
Our pledge of privacy applies to the following entities within the Eaton Vance organization: the Eaton Vance Family of Funds, Eaton Vance Management, Eaton Vance Investment Counsel, Eaton Vance Distributors, Inc., Eaton Vance Trust Company, Eaton Vance Management (International) Limited, Eaton Vance Advisers International Ltd., Eaton Vance Management’s Real Estate Investment Group and Boston Management and Research. In addition, our Privacy Policy applies only to those Eaton Vance customers who are individuals and who have a direct relationship with us. If a customer’s account (i.e., fund shares) is held in the name of a third-party financial advisor/broker-dealer, it is likely that only such advisor’s privacy policies apply to the customer. This notice supersedes all previously issued privacy disclosures. For more information about Eaton Vance’s Privacy Policy, please call 1-800-262-1122.
Delivery of Shareholder Documents. The Securities and Exchange Commission (SEC) permits funds to deliver only one copy of shareholder documents, including prospectuses, proxy statements and shareholder reports, to fund investors with multiple accounts at the same residential or post office box address. This practice is often called “householding” and it helps eliminate duplicate mailings to shareholders. American Stock Transfer & Trust Company, LLC (“AST”), the closed-end funds transfer agent, or your financial advisor, may household the mailing of your documents indefinitely unless you instruct AST, or your financial advisor, otherwise. If you would prefer that your Eaton Vance documents not be householded, please contact AST or your financial advisor. Your instructions that householding not apply to delivery of your Eaton Vance documents will typically be effective within 30 days of receipt by AST or your financial advisor.
Portfolio Holdings. Each Eaton Vance Fund and its underlying Portfolio(s) (if applicable) files a schedule of portfolio holdings on Part F toForm N-PORT with the SEC for the first and third quarters of each fiscal year. The Form N-PORT will be available on the Eaton Vance website at www.eatonvance.com, by calling Eaton Vance at 1-800-262-1122 or in the EDGAR database on the SEC’s website at www.sec.gov.
Proxy Voting. From time to time, funds are required to vote proxies related to the securities held by the funds. The Eaton Vance Funds or their underlying Portfolios (if applicable) vote proxies according to a set of policies and procedures approved by the Funds’ and Portfolios’ Boards. You may obtain a description of these policies and procedures and information on how the Funds or Portfolios voted proxies relating to portfolio securities during the most recent 12-month period ended June 30, without charge, upon request, by calling 1-800-262-1122 and by accessing the SEC’s website at www.sec.gov.
Share Repurchase Program. The Funds’ Boards of Trustees have approved a share repurchase program authorizing each Fund to repurchase up to 10% of its common shares outstanding as of the last day of the prior calendar year in open-market transactions at a discount to net asset value. The repurchase program does not obligate a Fund to purchase a specific amount of shares. The Funds’ repurchase activity, including the number of shares purchased, average price and average discount to net asset value, is disclosed in the Funds’ annual and semi-annual reports to shareholders.
Additional Notice to Shareholders. If applicable, a Fund may also redeem or purchase its outstanding preferred shares in order to maintain compliance with regulatory requirements, borrowing or rating agency requirements or for other purposes as it deems appropriate or necessary.
Closed-End Fund Information. Eaton Vance closed-end funds make fund performance data and certain information about portfolio characteristics available on the Eaton Vance website shortly after the end of each month. Other information about the funds is available on the website. The funds’ net asset value per share is readily accessible on the Eaton Vance website. Portfolio holdings for the most recent month-end are also posted to the website approximately 30 days following the end of the month. This information is available at www.eatonvance.com on the fund information pages under “Individual Investors — Closed-End Funds”.
Investment Adviser and Administrator
Eaton Vance Management
Two International Place
Boston, MA 02110
Custodian
State Street Bank and Trust Company
State Street Financial Center, One Lincoln Street
Boston, MA 02111
Transfer Agent
American Stock Transfer & Trust Company, LLC
6201 15th Avenue
Brooklyn, NY 11219
Fund Offices
Two International Place
Boston, MA 02110

7727 3.31.19
Item 2. Code of Ethics
Not required in this filing.
Item 3. Audit Committee Financial Expert
Not required in this filing.
Item 4. Principal Accountant Fees and Services
Not required in this filing.
Item 5. Audit Committee of Listed Registrants
Not required in this filing.
Item 6. Schedule of Investments
Please see schedule of investments contained in the Report to Stockholders included under Item 1 of this FormN-CSR.
Item 7. Disclosure of Proxy Voting Policies and Procedures forClosed-End Management Investment Companies
Not required in this filing.
Item 8. Portfolio Managers ofClosed-End Management Investment Companies
Not required in this filing.
Item 9. Purchases of Equity Securities byClosed-End Management Investment Company and Affiliated Purchasers
No such purchases this period.
Item 10. Submission of Matters to a Vote of Security Holders
No material changes.
Item 11. Controls and Procedures
(a) It is the conclusion of the registrant’s principal executive officer and principal financial officer that the effectiveness of the registrant’s current disclosure controls and procedures (such disclosure controls and procedures having been evaluated within 90 days of the date of this filing) provide reasonable assurance that the information required to be disclosed by the registrant has been recorded, processed, summarized and reported within the time period specified in the Commission’s rules and forms and that the information required to be disclosed by the registrant has been accumulated and communicated to the registrant’s principal executive officer and principal financial officer in order to allow timely decisions regarding required disclosure.
(b) There have been no changes in the registrant’s internal controls over financial reporting during the second fiscal quarter of the period covered by this report that has materially affected, or is reasonably likely to materially affect, the registrant’s internal control over financial reporting.
Item 12. Disclosure of Securities Lending Activities forClosed-End Management Investment Companies
Not applicable.
Item 13. Exhibits
| | |
| (a)(1) | | Registrant’s Code of Ethics – Not applicable (please see Item 2). |
| |
| (a)(2)(i) | | Treasurer’s Section 302 certification. |
| |
| (a)(2)(ii) | | President’s Section 302 certification. |
| |
| (b) | | Combined Section 906 certification. |
Signatures
Pursuant to the requirements of the Securities Exchange Act of 1934 and the Investment Company Act of 1940, the registrant has duly caused this report to be signed on its behalf by the undersigned, thereunto duly authorized.
Eaton Vance New York Municipal Bond Fund
| | |
| By: | | /s/ Payson F. Swaffield |
| | Payson F. Swaffield |
| | President |
| |
| Date: | | May 24, 2019 |
Pursuant to the requirements of the Securities Exchange Act of 1934 and the Investment Company Act of 1940, this report has been signed below by the following persons on behalf of the registrant and in the capacities and on the dates indicated.
| | |
| By: | | /s/ James F. Kirchner |
| | James F. Kirchner |
| | Treasurer |
| |
| Date: | | May 24, 2019 |
| | |
| By: | | /s/ Payson F. Swaffield |
| | Payson F. Swaffield |
| | President |
| |
| Date: | | May 24, 2019 |