UNITED STATES
SECURITIES AND EXCHANGE COMMISSION
Washington, D.C. 20549
Form N-CSR
CERTIFIED SHAREHOLDER REPORT OF REGISTERED
MANAGEMENT INVESTMENT COMPANIES
Investment Company Act File Number: 811-21148
Eaton Vance New York Municipal Bond Fund
(Exact Name of Registrant as Specified in Charter)
One Post Office Square, Boston, Massachusetts 02109
(Address of Principal Executive Offices)
Deidre E. Walsh
One Post Office Square, Boston, Massachusetts 02109
(Name and Address of Agent for Services)
(617) 482-8260
(Registrant’s Telephone Number)
September 30
Date of Fiscal Year End
March 31, 2024
Date of Reporting Period
Item 1. Reports to Stockholders
Eaton Vance
Municipal Bond Funds
Semiannual Report
March 31, 2024
Municipal (EIM) • California (EVM) • New York (ENX)
Commodity Futures Trading Commission Registration. The Commodity Futures Trading Commission (“CFTC”) has adopted regulations that subject registered investment companies and advisers to regulation by the CFTC if a fund invests more than a prescribed level of its assets in certain CFTC-regulated instruments (including futures, certain options and swap agreements) or markets itself as providing investment exposure to such instruments. The investment adviser has claimed an exclusion from the definition of “commodity pool operator” under the Commodity Exchange Act with respect to its management of each Fund. Accordingly, neither the Funds nor the adviser with respect to the operation of the Funds is subject to CFTC regulation. Because of its management of other strategies, the Funds' adviser is registered with the CFTC as a commodity pool operator. The adviser is also registered as a commodity trading advisor.
Fund shares are not insured by the FDIC and are not deposits or other obligations of, or guaranteed by, any depository institution. Shares are subject to investment risks, including possible loss of principal invested.
Semiannual Report March 31, 2024
Eaton Vance
Municipal Bond Funds
Eaton Vance
Municipal Bond Fund
March 31, 2024
Performance
Portfolio Manager(s) Cynthia J. Clemson and Julie P. Callahan, CFA
| % Average Annual Total Returns1,2 | Inception Date | Six Months | One Year | Five Years | Ten Years |
| Fund at NAV | 08/30/2002 | 10.88% | 3.07% | 1.15% | 3.66% |
| Fund at Market Price | — | 18.31 | 4.10 | 0.80 | 3.55 |
|
| Bloomberg Municipal Bond Index | — | 7.48% | 3.13% | 1.59% | 2.66% |
| % Premium/Discount to NAV3 | |
| As of period end | (9.29)% |
| Distributions 4 | |
| Total Distributions per share for the period | $0.240 |
| Distribution Rate at NAV | 4.92% |
| Taxable-Equivalent Distribution Rate at NAV | 8.31 |
| Distribution Rate at Market Price | 5.43 |
| Taxable-Equivalent Distribution Rate at Market Price | 9.17 |
| % Total Leverage5 | |
| Residual Interest Bond (RIB) Financing | 29.16% |
See Endnotes and Additional Disclosures in this report.
Past performance is no guarantee of future results. Returns are historical and are calculated net of management fees and other expenses by determining the percentage change in net asset value (NAV) or market price (as applicable) with all distributions reinvested in accordance with the Fund’s Dividend Reinvestment Plan. Furthermore, returns do not reflect the deduction of taxes that shareholders may have to pay on Fund distributions or upon the sale of Fund shares. Performance at market price will differ from performance at NAV due to variations in the Fund’s market price versus NAV, which may reflect factors such as fluctuations in supply and demand for Fund shares, changes in Fund distributions, shifting market expectations for the Fund’s future returns and distribution rates, and other considerations affecting the trading prices of closed-end funds. Investment return and principal value will fluctuate so that shares, when sold, may be worth more or less than their original cost. Performance for periods less than or equal to one year is cumulative. Performance is for the stated time period only; due to market volatility, current Fund performance may be lower or higher than the quoted return. For performance as of the most recent month-end, please refer to eatonvance.com.
Eaton Vance
Municipal Bond Fund
March 31, 2024
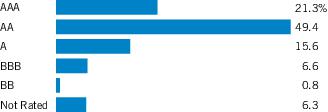
| Credit Quality (% of total investments)1,2 |
Footnotes:
| 1 | For purposes of the Fund’s rating restrictions, ratings are based on Moody’s Investors Service, Inc. (“Moody’s”), S&P Global Ratings (“S&P”) or Fitch Ratings (“Fitch”), as applicable. If securities are rated differently by the ratings agencies, the highest rating is applied. Ratings, which are subject to change, apply to the creditworthiness of the issuers of the underlying securities and not to the Fund or its shares. Credit ratings measure the quality of a bond based on the issuer’s creditworthiness, with ratings ranging from AAA, being the highest, to D, being the lowest based on S&P’s measures. Ratings of BBB or higher by S&P or Fitch (Baa or higher by Moody’s) are considered to be investment-grade quality. Credit ratings are based largely on the ratings agency’s analysis at the time of rating. The rating assigned to any particular security is not necessarily a reflection of the issuer’s current financial condition and does not necessarily reflect its assessment of the volatility of a security’s market value or of the liquidity of an investment in the security. Holdings designated as “Not Rated” (if any) are not rated by the national ratings agencies stated above. |
| 2 | The chart includes the municipal bonds held by a trust that issues residual interest bonds, consistent with the Portfolio of Investments. |
Eaton Vance
California Municipal Bond Fund
March 31, 2024
Performance
Portfolio Manager(s) Trevor G. Smith and Carl A. Thompson, CFA
| % Average Annual Total Returns1,2 | Inception Date | Six Months | One Year | Five Years | Ten Years |
| Fund at NAV | 08/30/2002 | 10.81% | 3.89% | 1.08% | 3.21% |
| Fund at Market Price | — | 19.02 | 9.36 | 2.09 | 3.40 |
|
| Bloomberg Municipal Bond Index | — | 7.48% | 3.13% | 1.59% | 2.66% |
| % Premium/Discount to NAV3 | |
| As of period end | (8.87)% |
| Distributions 4 | |
| Total Distributions per share for the period | $0.203 |
| Distribution Rate at NAV | 4.43% |
| Taxable-Equivalent Distribution Rate at NAV | 9.66 |
| Distribution Rate at Market Price | 4.86 |
| Taxable-Equivalent Distribution Rate at Market Price | 10.60 |
| % Total Leverage5 | |
| RIB Financing | 26.35% |
See Endnotes and Additional Disclosures in this report.
Past performance is no guarantee of future results. Returns are historical and are calculated net of management fees and other expenses by determining the percentage change in net asset value (NAV) or market price (as applicable) with all distributions reinvested in accordance with the Fund’s Dividend Reinvestment Plan. Furthermore, returns do not reflect the deduction of taxes that shareholders may have to pay on Fund distributions or upon the sale of Fund shares. Performance at market price will differ from performance at NAV due to variations in the Fund’s market price versus NAV, which may reflect factors such as fluctuations in supply and demand for Fund shares, changes in Fund distributions, shifting market expectations for the Fund’s future returns and distribution rates, and other considerations affecting the trading prices of closed-end funds. Investment return and principal value will fluctuate so that shares, when sold, may be worth more or less than their original cost. Performance for periods less than or equal to one year is cumulative. Performance is for the stated time period only; due to market volatility, current Fund performance may be lower or higher than the quoted return. For performance as of the most recent month-end, please refer to eatonvance.com.
Eaton Vance
California Municipal Bond Fund
March 31, 2024
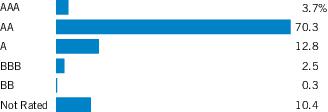
| Credit Quality (% of total investments)1,2 |
Footnotes:
| 1 | For purposes of the Fund’s rating restrictions, ratings are based on Moody’s Investors Service, Inc. (“Moody’s”), S&P Global Ratings (“S&P”) or Fitch Ratings (“Fitch”), as applicable. If securities are rated differently by the ratings agencies, the highest rating is applied. Ratings, which are subject to change, apply to the creditworthiness of the issuers of the underlying securities and not to the Fund or its shares. Credit ratings measure the quality of a bond based on the issuer’s creditworthiness, with ratings ranging from AAA, being the highest, to D, being the lowest based on S&P’s measures. Ratings of BBB or higher by S&P or Fitch (Baa or higher by Moody’s) are considered to be investment-grade quality. Credit ratings are based largely on the ratings agency’s analysis at the time of rating. The rating assigned to any particular security is not necessarily a reflection of the issuer’s current financial condition and does not necessarily reflect its assessment of the volatility of a security’s market value or of the liquidity of an investment in the security. Holdings designated as “Not Rated” (if any) are not rated by the national ratings agencies stated above. |
| 2 | The chart includes the municipal bonds held by a trust that issues residual interest bonds, consistent with the Portfolio of Investments. |
Eaton Vance
New York Municipal Bond Fund
March 31, 2024
Performance
Portfolio Manager(s) Christopher J. Eustance, CFA and Paul Metheny, CFA
| % Average Annual Total Returns1,2 | Inception Date | Six Months | One Year | Five Years | Ten Years |
| Fund at NAV | 08/30/2002 | 13.05% | 3.51% | 0.02% | 2.52% |
| Fund at Market Price | — | 19.72 | 4.08 | 0.22 | 2.51 |
|
| Bloomberg Municipal Bond Index | — | 7.48% | 3.13% | 1.59% | 2.66% |
| % Premium/Discount to NAV3 | |
| As of period end | (9.59)% |
| Distributions 4 | |
| Total Distributions per share for the period | $0.207 |
| Distribution Rate at NAV | 4.40% |
| Taxable-Equivalent Distribution Rate at NAV | 9.11 |
| Distribution Rate at Market Price | 4.87 |
| Taxable-Equivalent Distribution Rate at Market Price | 10.08 |
| % Total Leverage5 | |
| RIB Financing | 30.90% |
See Endnotes and Additional Disclosures in this report.
Past performance is no guarantee of future results. Returns are historical and are calculated net of management fees and other expenses by determining the percentage change in net asset value (NAV) or market price (as applicable) with all distributions reinvested in accordance with the Fund’s Dividend Reinvestment Plan. Furthermore, returns do not reflect the deduction of taxes that shareholders may have to pay on Fund distributions or upon the sale of Fund shares. Performance at market price will differ from performance at NAV due to variations in the Fund’s market price versus NAV, which may reflect factors such as fluctuations in supply and demand for Fund shares, changes in Fund distributions, shifting market expectations for the Fund’s future returns and distribution rates, and other considerations affecting the trading prices of closed-end funds. Investment return and principal value will fluctuate so that shares, when sold, may be worth more or less than their original cost. Performance for periods less than or equal to one year is cumulative. Performance is for the stated time period only; due to market volatility, current Fund performance may be lower or higher than the quoted return. For performance as of the most recent month-end, please refer to eatonvance.com.
Eaton Vance
New York Municipal Bond Fund
March 31, 2024
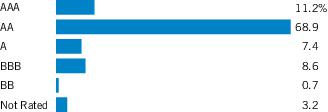
| Credit Quality (% of total investments)1,2 |
Footnotes:
| 1 | For purposes of the Fund’s rating restrictions, ratings are based on Moody’s Investors Service, Inc. (“Moody’s”), S&P Global Ratings (“S&P”) or Fitch Ratings (“Fitch”), as applicable. If securities are rated differently by the ratings agencies, the highest rating is applied. Ratings, which are subject to change, apply to the creditworthiness of the issuers of the underlying securities and not to the Fund or its shares. Credit ratings measure the quality of a bond based on the issuer’s creditworthiness, with ratings ranging from AAA, being the highest, to D, being the lowest based on S&P’s measures. Ratings of BBB or higher by S&P or Fitch (Baa or higher by Moody’s) are considered to be investment-grade quality. Credit ratings are based largely on the ratings agency’s analysis at the time of rating. The rating assigned to any particular security is not necessarily a reflection of the issuer’s current financial condition and does not necessarily reflect its assessment of the volatility of a security’s market value or of the liquidity of an investment in the security. Holdings designated as “Not Rated” (if any) are not rated by the national ratings agencies stated above. |
| 2 | The chart includes the municipal bonds held by a trust that issues residual interest bonds, consistent with the Portfolio of Investments. |
Eaton Vance
Municipal Bond Funds
March 31, 2024
Endnotes and Additional Disclosures
| 1 | Bloomberg Municipal Bond Index is an unmanaged index of municipal bonds traded in the U.S. Unless otherwise stated, index returns do not reflect the effect of any applicable sales charges, commissions, expenses, taxes or leverage, as applicable. It is not possible to invest directly in an index. |
| 2 | Performance results reflect the effects of leverage. |
| 3 | The shares of the Fund often trade at a discount or premium to their net asset value. The discount or premium may vary over time and may be higher or lower than what is quoted in this report. For up-to-date premium/discount information, please refer to https://funds.eatonvance.com/closed-end-fund-prices.php. |
| 4 | The Distribution Rate is based on the Fund’s last regular distribution per share in the period (annualized) divided by the Fund’s NAV or market price at the end of the period. The Fund’s distributions may be comprised of amounts characterized for federal income tax purposes as tax-exempt income, qualified and non-qualified ordinary dividends, capital gains and nondividend distributions, also known as return of capital. The Fund may distribute more than its net investment income and net realized capital gains and, therefore, a distribution may include a return of capital. The Fund will determine the federal income tax character of distributions paid to a shareholder after the end of the calendar year. This is reported on the IRS form 1099-DIV and provided to the shareholder shortly after each year-end. For information about the tax character of distributions made in prior calendar years, please refer to Performance-Tax Character of Distributions on the Fund’s webpage available at eatonvance.com. The Fund’s distributions are determined by the investment adviser based on its current assessment of the Fund’s long-term return potential. Fund distributions may be affected by numerous factors including changes in Fund performance, the cost of financing for Funds that employ leverage, portfolio holdings, realized and projected returns, and other factors. As portfolio and market conditions change, the rate of distributions paid by the Fund could change. Shareholders should not assume that the source of any distribution from the Fund is net income or profit, and the Fund’s distributions should not be used as a measure of performance or confused with “yield” or “income”. Taxable-equivalent performance is based on the highest combined federal and state income tax rates, where applicable. Lower tax rates would result in lower tax-equivalent performance. Actual tax rates will vary depending on your income, exemptions and deductions. Rates do not include local taxes. |
| 5 | Fund employs RIB financing. The leverage created by RIB investments provides an opportunity for increased income but, at the same time, creates special risks (including the likelihood of greater price volatility). The cost of leverage rises and falls with changes in short-term interest rates. See “Floating Rate Notes Issued in Conjunction with Securities Held” in the notes to the financial statements for more information about RIB financing. RIB leverage represents the amount of Floating Rate Notes outstanding at period end as a percentage of Fund net assets plus Floating Rate Notes. |
| | Fund profiles subject to change due to active management. |
| | Important Notice to Shareholders |
| | On January 26, 2023, the Board of Trustees of each Fund voted to exempt, on a going forward basis, all prior and, until further notice, new acquisitions of Fund shares that otherwise might be deemed “Control Share Acquisitions” under the Fund’s By-Laws from the Control Share Provisions of the Fund’s By-Laws. |
Eaton Vance
Municipal Bond Fund
March 31, 2024
Portfolio of Investments (Unaudited)
| Security | Principal
Amount
(000's omitted) | Value |
| Hospital — 1.1% |
| Montefiore Obligated Group, 4.287%, 9/1/50 | $ | 13,890 | $ 8,763,643 |
Total Corporate Bonds
(identified cost $13,890,000) | | | $ 8,763,643 |
| Tax-Exempt Mortgage-Backed Securities — 0.3% |
| Security | Principal
Amount
(000's omitted) | Value |
| Housing — 0.3% |
| California Housing Finance Agency, Municipal Certificates, Series 2021-1, Class A, 3.50%, 11/20/35 | $ | 3,022 | $ 2,834,934 |
Total Tax-Exempt Mortgage-Backed Securities
(identified cost $2,871,110) | | | $ 2,834,934 |
| Tax-Exempt Municipal Obligations — 139.5% |
| Security | Principal
Amount
(000's omitted) | Value |
| Bond Bank — 7.2% |
| Delaware Valley Regional Finance Authority, PA, 5.75%, 7/1/32 | $ | 6,500 | $ 7,687,550 |
| New York State Environmental Facilities Corp., (State Revolving Fund), Green Bonds, 5.25%, 9/15/52 | | 7,000 | 7,722,680 |
| Rickenbacker Port Authority, OH, (OASBO Expanded Asset Pooled Financing Program), 5.375%, 1/1/32 | | 300 | 339,450 |
| Texas Water Development Board: | | | |
| 4.00%, 10/15/37(1) | | 4,875 | 4,970,209 |
| 4.00%, 10/15/47(1) | | 2,900 | 2,818,800 |
| 5.00%, 10/15/47(1) | | 20,000 | 21,829,600 |
| 5.00%, 4/15/49(1) | | 10,700 | 11,227,403 |
| 5.00%, 10/15/58 | | 2,000 | 2,162,620 |
| | | | $ 58,758,312 |
| Education — 4.7% |
| District of Columbia, (KIPP DC), 4.00%, 7/1/44 | $ | 280 | $ 259,233 |
| Massachusetts Development Finance Agency, (Northeastern University), 5.25%, 3/1/37 | | 1,650 | 1,650,429 |
| Massachusetts Health and Educational Facilities Authority, (Boston College): | | | |
| 5.50%, 6/1/27 | | 5,710 | 6,170,397 |
| Security | Principal
Amount
(000's omitted) | Value |
| Education (continued) |
| Massachusetts Health and Educational Facilities Authority, (Boston College): (continued) | | | |
| 5.50%, 6/1/30 | $ | 8,225 | $ 9,456,529 |
| New Jersey Educational Facilities Authority, (Princeton University), 4.00%, 7/1/47(1) | | 10,000 | 9,941,700 |
| Tennessee State School Bond Authority, 5.00%, 11/1/52(1) | | 10,000 | 10,798,900 |
| | | | $ 38,277,188 |
| Electric Utilities — 6.4% |
| Austin, TX, Electric Utility Revenue, 5.00%, 11/15/48(1) | $ | 10,000 | $ 10,948,000 |
| Douglas County Public Utility District No. 1, WA, 3.00%, 9/1/52 | | 7,165 | 5,517,050 |
| Gainesville, FL, Utilities System Revenue, (SPA: Barclays Bank PLC), 3.95%, 10/1/42(2) | | 1,000 | 1,000,000 |
| Orlando Utilities Commission, FL, Utility System Revenue, 5.00%, 10/1/48(1) | | 10,000 | 10,921,800 |
| San Antonio, TX, Electric & Gas Systems Revenue, 5.25%, 2/1/46(1) | | 10,000 | 11,061,400 |
| Seattle, WA, Municipal Light and Power Improvement Revenue: | | | |
| 4.00%, 7/1/47 | | 2,500 | 2,444,800 |
| 5.00%, 3/1/53(1) | | 9,000 | 9,701,010 |
| | | | $ 51,594,060 |
| Escrowed/Prerefunded — 0.0%(3) |
| East Hempfield Township Industrial Development Authority, PA, (Student Services, Inc.), Prerefunded to 7/1/24, 5.00%, 7/1/39 | $ | 175 | $ 175,354 |
| | | | $ 175,354 |
| General Obligations — 28.9% |
| Aldine Independent School District, TX, (PSF Guaranteed), 4.00%, 2/15/54 | $ | 1,900 | $ 1,800,003 |
| Aledo Independent School District, TX, (PSF Guaranteed): | | | |
| 5.00%, 2/15/53 | | 255 | 273,424 |
| 5.00%, 2/15/53(1) | | 9,000 | 9,650,340 |
| Bastrop Independent School District, TX, (PSF Guaranteed), 5.00%, 2/15/53(1) | | 10,000 | 10,823,000 |
| Beaverton School District No. 48J, OR, 5.00%, 6/15/52(1) | | 10,000 | 10,725,200 |
| California, 5.25%, 9/1/53(1) | | 10,000 | 11,259,400 |
| Chicago Board of Education, IL, 5.00%, 12/1/30 | | 4,000 | 4,206,080 |
| Chicago, IL, 5.00%, 1/1/44 | | 6,880 | 7,088,808 |
| Clark County Water Reclamation District, NV, 5.00%, 7/1/49(1) | | 10,000 | 10,891,200 |
9
See Notes to Financial Statements.
Eaton Vance
Municipal Bond Fund
March 31, 2024
Portfolio of Investments (Unaudited) — continued
| Security | Principal
Amount
(000's omitted) | Value |
| General Obligations (continued) |
| Crowley Independent School District, TX, (PSF Guaranteed), 5.25%, 2/1/53 | $ | 2,000 | $ 2,194,940 |
| Dallas Independent School District, TX, (PSF Guaranteed), 4.00%, 2/15/54 | | 3,000 | 2,842,110 |
| Denton Independent School District, TX, (PSF Guaranteed), 5.00%, 8/15/53(1) | | 10,000 | 10,842,700 |
| District of Columbia, 4.00%, 2/1/46 | | 5,000 | 4,946,450 |
| Hurst-Euless-Bedford Independent School District, TX, (PSF Guaranteed), 4.00%, 8/15/50 | | 4,500 | 4,355,190 |
| Illinois: | | | |
| 4.00%, 11/1/38 | | 13,000 | 12,929,930 |
| 5.50%, 5/1/39 | | 810 | 891,761 |
| 5.50%, 3/1/47 | | 4,000 | 4,369,480 |
| 5.75%, 5/1/45 | | 830 | 908,618 |
| Jackson Public Schools, MI, 5.00%, 5/1/48(1) | | 2,150 | 2,208,394 |
| Katy Independent School District, TX, (PSF Guaranteed), 5.00%, 2/15/48(1) | | 10,000 | 10,809,800 |
| Klein Independent School District, TX, (PSF Guaranteed), 4.00%, 8/1/48 | | 5,110 | 4,974,789 |
| Lamar Consolidated Independent School District, TX, (PSF Guaranteed), 5.00%, 2/15/58(1) | | 10,000 | 10,773,100 |
| Leander Independent School District, TX, (PSF Guaranteed), 5.00%, 8/15/52(1) | | 10,000 | 10,678,600 |
| Massachusetts, 5.00%, 5/1/53(1) | | 10,000 | 10,726,300 |
| New Caney Independent School District, TX, (PSF Guaranteed), 5.00%, 2/15/53(1) | | 10,000 | 10,834,500 |
| New York, NY: | | | |
| 4.00%, 9/1/46 | | 5,000 | 4,882,250 |
| 5.25%, 5/1/41(1) | | 7,100 | 8,032,940 |
| 5.25%, 5/1/42(1) | | 3,125 | 3,510,656 |
| 5.25%, 10/1/47 | | 4,000 | 4,402,520 |
| Peters Township School District, PA, 5.00%, 9/1/40(1) | | 3,225 | 3,475,615 |
| Renton School District No. 403, WA, 4.00%, 12/1/39 | | 2,500 | 2,555,925 |
| Royse City Independent School District, TX, (PSF Guaranteed), 5.00%, 2/15/53(1) | | 9,000 | 9,747,720 |
| Spring Independent School District, TX, 5.00%, 8/15/47(1) | | 11,575 | 12,766,299 |
| Trenton Public Schools, MI, 5.00%, 5/1/42(1) | | 2,150 | 2,269,024 |
| Ysleta Independent School District, TX, (PSF Guaranteed), 5.00%, 8/15/56(1) | | 10,000 | 10,698,800 |
| | | | $ 234,345,866 |
| Hospital — 11.5% |
| Allen County, OH, (Mercy Health), 4.00%, 8/1/47(1) | $ | 900 | $ 867,987 |
| Brevard County Health Facilities Authority, FL, (Health First Obligated Group): | | | |
| 5.00%, 4/1/47 | | 7,500 | 7,857,075 |
| Security | Principal
Amount
(000's omitted) | Value |
| Hospital (continued) |
| Brevard County Health Facilities Authority, FL, (Health First Obligated Group): (continued) | | | |
| 5.00%, 4/1/52 | $ | 7,510 | $ 7,852,306 |
| Chester County Health and Education Facilities Authority, PA, (Main Line Health System), 4.00%, 9/1/50 | | 11,625 | 10,708,252 |
| Colorado Health Facilities Authority, (CommonSpirit Health), 5.25%, 11/1/52 | | 4,000 | 4,295,240 |
| Colorado Health Facilities Authority, (Intermountain Healthcare), 4.00%, 5/15/52 | | 5,000 | 4,825,200 |
| Hamilton County, OH, (Cincinnati Children's Hospital Medical Center), 5.00%, 5/15/34 | | 250 | 250,470 |
| Hamilton County, OH, (UC Health), 4.00%, 9/15/50 | | 3,175 | 2,536,349 |
| Indiana Finance Authority, (Indiana University Health), 5.00%, 10/1/53 | | 5,000 | 5,377,000 |
| Maryland Health and Higher Educational Facilities Authority, (MedStar Health), 5.00%, 8/15/42 | | 5,000 | 5,027,100 |
| Michigan Finance Authority, (Trinity Health Credit Group), 4.00%, 3/1/51 | | 7,000 | 6,512,520 |
| Missouri Health and Educational Facilities Authority, (Children's Mercy Hospital), 4.00%, 5/15/48 | | 5,000 | 4,763,600 |
| New Jersey Health Care Facilities Financing Authority, (Robert Wood Johnson University Hospital), 5.25%, 7/1/35 | | 5,000 | 5,020,150 |
| New York Dormitory Authority, (Northwell Health Obligated Group), 5.00%, 5/1/52 | | 4,050 | 4,277,893 |
| Pennsylvania Economic Development Financing Authority, (UPMC), 4.00%, 5/15/53 | | 4,115 | 3,840,283 |
| Pennsylvania Higher Educational Facilities Authority, (University of Pennsylvania Health System), 4.00%, 8/15/42 | | 1,600 | 1,556,928 |
| Tarrant County Cultural Education Facilities Finance Corp.,TX, (Baylor Scott & White Health), 5.00%, 11/15/51 | | 3,000 | 3,138,420 |
| Virginia Commonwealth University Health System Authority, 4.00%, 7/1/54(4) | | 5,000 | 4,747,400 |
| West Virginia Hospital Finance Authority, (West Virginia University Health System Obligated Group), 4.375%, 6/1/53 | | 10,150 | 10,245,004 |
| | | | $ 93,699,177 |
| Housing — 5.7% |
| Maryland Economic Development Corp., (Morgan State University), Student Housing Revenue, 4.25%, 7/1/50 | $ | 1,350 | $ 1,237,235 |
| Nebraska Investment Finance Authority, Social Bonds, (FHLMC), (FNMA), (GNMA), 4.55%, 9/1/48 | | 8,835 | 8,842,510 |
| New York City Housing Development Corp., NY: | | | |
| 4.80%, 2/1/53 | | 5,000 | 5,082,450 |
10
See Notes to Financial Statements.
Eaton Vance
Municipal Bond Fund
March 31, 2024
Portfolio of Investments (Unaudited) — continued
| Security | Principal
Amount
(000's omitted) | Value |
| Housing (continued) |
New York City Housing Development Corp., NY:
(continued) | | | |
| 4.95%, 11/1/58 | $ | 1,575 | $ 1,606,547 |
| North Carolina Housing Finance Agency, Social Bonds, (FHLMC), (FNMA), (GNMA), 4.40%, 7/1/46 | | 4,995 | 4,968,526 |
| Ohio Housing Finance Agency, Social Bonds, (FHLMC), (FNMA), (GNMA), 4.55%, 9/1/49 | | 6,350 | 6,370,510 |
| Pennsylvania Housing Finance Agency, SFMR, Social Bonds, 5.00%, 10/1/50 | | 3,665 | 3,783,819 |
| Rhode Island Housing and Mortgage Finance Corp., Social Bonds, (FHLMC), (FNMA), (GNMA), 4.65%, 10/1/53 | | 3,880 | 3,863,355 |
| Seattle Housing Authority, WA, 3.625%, 12/1/43 | | 1,000 | 893,930 |
| South Carolina Housing Finance and Development Authority: | | | |
| 4.75%, 1/1/54 | | 2,000 | 1,994,400 |
| 4.95%, 7/1/53 | | 975 | 995,329 |
| Texas Department of Housing and Community Affairs, (GNMA), 5.125%, 1/1/54(4) | | 1,810 | 1,889,441 |
| Wisconsin Housing and Economic Development Authority, Home Ownership Revenue, Social Bonds, (FHLMC), (FNMA), (GNMA), 4.75%, 9/1/50 | | 5,000 | 5,009,350 |
| | | | $ 46,537,402 |
| Industrial Development Revenue — 2.8% |
| Arkansas Development Finance Authority, (United States Steel Corp.), Green Bonds, (AMT), 5.45%, 9/1/52 | $ | 4,800 | $ 4,906,416 |
| Maricopa County Pollution Control Corp., AZ, (El Paso Electric Co.), 4.50%, 8/1/42 | | 4,840 | 4,701,866 |
| New York Transportation Development Corp., (Delta Air Lines, Inc. - LaGuardia Airport Terminals C&D Redevelopment), (AMT), 5.00%, 10/1/40 | | 12,610 | 13,084,010 |
| | | | $ 22,692,292 |
| Insured - Bond Bank — 0.1% |
| Puerto Rico Municipal Finance Agency, (AGM), 5.00%, 8/1/27 | $ | 470 | $ 472,829 |
| | | | $ 472,829 |
| Insured - Education — 2.7% |
| Massachusetts College Building Authority, (AGC), 5.50%, 5/1/39 | $ | 700 | $ 855,463 |
| Massachusetts Development Finance Agency, (Boston University), (AGC), 6.00%, 5/15/59 | | 1,105 | 1,268,441 |
| Massachusetts Development Finance Agency, (College of the Holy Cross): | | | |
| (AMBAC), 5.25%, 9/1/32 | | 15,900 | 18,787,599 |
| Security | Principal
Amount
(000's omitted) | Value |
| Insured - Education (continued) |
| Massachusetts Development Finance Agency, (College of the Holy Cross): (continued) | | | |
| (AMBAC), 5.25%, 9/1/32(1) | $ | 750 | $ 886,215 |
| | | | $ 21,797,718 |
| Insured - Electric Utilities — 3.1% |
| Cleveland, OH, Public Power System Revenue: | | | |
| (NPFG), 0.00%, 11/15/27 | $ | 2,750 | $ 2,424,400 |
| (NPFG), 0.00%, 11/15/38 | | 1,000 | 526,380 |
| Lower Colorado River Authority, TX, (LCRA Transmission Services Corp.), (AGM), 5.25%, 5/15/53(1) | | 10,000 | 10,949,900 |
| Ohio Municipal Electric Generation Agency, (NPFG), 0.00%, 2/15/27 | | 5,000 | 4,512,250 |
| Puerto Rico Electric Power Authority, (NPFG), 5.25%, 7/1/34 | | 375 | 372,330 |
| South Carolina Public Service Authority, (AGM), 5.75%, 12/1/52 | | 6,000 | 6,683,220 |
| | | | $ 25,468,480 |
| Insured - Escrowed/Prerefunded — 0.2% |
| Massachusetts College Building Authority, (NPFG), Escrowed to Maturity, 0.00%, 5/1/26 | $ | 1,600 | $ 1,490,416 |
| | | | $ 1,490,416 |
| Insured - General Obligations — 4.3% |
| Cincinnati City School District, OH, (AGM), (FGIC), 5.25%, 12/1/30 | $ | 4,500 | $ 5,159,520 |
| Erie School District, PA, (AMBAC), 0.00%, 9/1/30 | | 1,000 | 790,870 |
| Essex County Improvement Authority, NJ, (NPFG), 5.50%, 10/1/30 | | 2,000 | 2,351,000 |
| Irvington Township, NJ, (AGM), 0.00%, 7/15/26 | | 4,165 | 3,813,807 |
| Massachusetts, (AMBAC), 5.50%, 8/1/30 | | 1,900 | 2,201,302 |
| Nassau County, NY, (AGM), 5.00%, 4/1/43(1) | | 11,665 | 12,238,451 |
| Plain School District, OH, (NPFG), 0.00%, 12/1/27 | | 2,400 | 2,088,624 |
| Shaler Area School District, PA, (XLCA), 0.00%, 9/1/33 | | 2,550 | 1,801,167 |
| Waller Independent School District, TX, (BAM), 4.00%, 2/15/48 | | 4,165 | 4,052,795 |
| | | | $ 34,497,536 |
| Insured - Hospital — 1.7% |
| Allegheny County Hospital Development Authority, PA, (UPMC Health System), (NPFG), 6.00%, 7/1/24 | $ | 250 | $ 251,235 |
| California Statewide Communities Development Authority, (Enloe Medical Center), (AGM), 5.375%, 8/15/57 | | 1,500 | 1,636,785 |
| Columbia County Hospital Authority, GA, (Wellstar Health System, Inc.), (AGM), 5.00%, 4/1/53 | | 5,000 | 5,341,000 |
11
See Notes to Financial Statements.
Eaton Vance
Municipal Bond Fund
March 31, 2024
Portfolio of Investments (Unaudited) — continued
| Security | Principal
Amount
(000's omitted) | Value |
| Insured - Hospital (continued) |
| West Virginia Hospital Finance Authority, (Vandalia Health), (AGM), 5.50%, 9/1/48 | $ | 5,000 | $ 5,577,950 |
| Westchester County Local Development Corp., NY, (Westchester Medical Center Obligated Group), (AGM), 5.75%, 11/1/49 | | 1,000 | 1,159,260 |
| | | | $ 13,966,230 |
| Insured - Lease Revenue/Certificates of Participation — 0.1% |
| New Jersey Economic Development Authority, (School Facilities Construction), (NPFG), 5.50%, 9/1/28 | $ | 500 | $ 552,255 |
| | | | $ 552,255 |
| Insured - Special Tax Revenue — 7.2% |
| Hamilton County, OH, Sales Tax Revenue, (AMBAC), 0.00%, 12/1/24 | $ | 3,665 | $ 3,574,364 |
| Harris County-Houston Sports Authority, TX, (AGM), (NPFG), 0.00%, 11/15/34 | | 19,335 | 12,044,545 |
| Houston, TX, Hotel Occupancy Tax Revenue, (AMBAC), 0.00%, 9/1/24 | | 18,035 | 17,729,848 |
| Massachusetts, Dedicated Tax Revenue, (NPFG), 5.50%, 1/1/29 | | 750 | 842,640 |
| Miami-Dade County, FL, Professional Sports Franchise Facilities, (AGC), 7.00%, 10/1/39 | | 18,000 | 21,500,820 |
| New Jersey Economic Development Authority, (Motor Vehicle Surcharges): | | | |
| (AGC), 0.00%, 7/1/26 | | 420 | 385,354 |
| (AGC), 0.00%, 7/1/27 | | 1,120 | 991,861 |
| Pennsylvania Turnpike Commission, (AGM), 5.25%, 7/15/30 | | 1,105 | 1,268,805 |
| | | | $ 58,338,237 |
| Insured - Transportation — 5.4% |
| Alameda Corridor Transportation Authority, CA, (AGM), 0.00%, 10/1/53 | $ | 6,000 | $ 1,488,600 |
| E-470 Public Highway Authority, CO, (NPFG), 0.00%, 9/1/39 | | 25,000 | 11,782,000 |
| New Jersey Turnpike Authority, (AGM), (BHAC), 5.25%, 1/1/29 | | 1,000 | 1,113,870 |
| Port Palm Beach District, FL: | | | |
| (XLCA), 0.00%, 9/1/24 | | 1,605 | 1,573,366 |
| (XLCA), 0.00%, 9/1/25 | | 1,950 | 1,830,192 |
| (XLCA), 0.00%, 9/1/26 | | 1,000 | 901,840 |
| San Joaquin Hills Transportation Corridor Agency, CA, (NPFG), 0.00%, 1/15/25 | | 26,215 | 25,432,220 |
| | | | $ 44,122,088 |
| Security | Principal
Amount
(000's omitted) | Value |
| Insured - Water and Sewer — 4.7% |
| Chicago, IL, Wastewater Transmission Revenue, (AGM), 5.25%, 1/1/58 | $ | 7,000 | $ 7,548,310 |
| Chicago, IL, Water Revenue, (AGM), 5.25%, 11/1/53 | | 1,000 | 1,085,140 |
| DeKalb County, GA, Water and Sewerage Revenue, (AGM), 5.25%, 10/1/32(1) | | 10,000 | 10,532,300 |
| Erie Sewer Authority, PA, (AMBAC), 0.00%, 12/1/26 | | 1,920 | 1,739,117 |
| Lauderhill, FL, Water and Sewer Revenue, (AGM), 5.00%, 10/1/53 | | 1,520 | 1,627,099 |
| Massachusetts Water Resources Authority, (AGM), 5.25%, 8/1/35 | | 1,000 | 1,264,010 |
| Michigan Finance Authority, (Detroit Water and Sewerage Department): | | | |
| (AGM), 5.00%, 7/1/31 | | 1,500 | 1,503,360 |
| (AGM), 5.00%, 7/1/32 | | 2,845 | 2,852,312 |
| (AGM), 5.00%, 7/1/33 | | 2,435 | 2,439,554 |
| (AGM), 5.00%, 7/1/35 | | 2,970 | 2,976,296 |
| (AGM), 5.00%, 7/1/37 | | 2,435 | 2,438,774 |
| Middlesex County Improvement Authority, NJ, (Perth Amboy), (AMBAC), 0.00%, 9/1/24 | | 2,150 | 2,113,622 |
| | | | $ 38,119,894 |
| Lease Revenue/Certificates of Participation — 4.0% |
| Maryland Stadium Authority, Built to Learn Revenue, 4.00%, 6/1/52 | $ | 5,430 | $ 5,199,822 |
| New Hampshire Business Finance Authority, (Centurion BioSquare, Inc.), 5.88%, 12/15/38 | | 3,750 | 3,848,363 |
| New Jersey Economic Development Authority, (Portal North Bridge), 5.00%, 11/1/52 | | 7,000 | 7,454,230 |
| New Jersey Transportation Trust Fund Authority, (Transportation Program): | | | |
| 5.00%, 6/15/38 | | 130 | 130,198 |
| 5.00%, 6/15/44 | | 5,535 | 5,540,922 |
| New Jersey Transportation Trust Fund Authority, (Transportation System), 5.00%, 12/15/24 | | 10,000 | 10,093,000 |
| | | | $ 32,266,535 |
| Other Revenue — 3.1% |
| Buckeye Tobacco Settlement Financing Authority, OH, 5.00%, 6/1/55 | $ | 6,400 | $ 6,061,504 |
| California Community Choice Financing Authority, Clean Energy Project Revenue, Green Bonds, 5.00% to 8/1/29 (Put Date), 12/1/53 | | 2,000 | 2,113,320 |
| Main Street Natural Gas, Inc., GA, Gas Supply Revenue: | | | |
| 5.00% to 3/1/30 (Put Date), 7/1/53 | | 5,000 | 5,296,950 |
| 5.00% to 12/1/30 (Put Date), 5/1/54 | | 1,480 | 1,556,220 |
12
See Notes to Financial Statements.
Eaton Vance
Municipal Bond Fund
March 31, 2024
Portfolio of Investments (Unaudited) — continued
| Security | Principal
Amount
(000's omitted) | Value |
| Other Revenue (continued) |
| Patriots Energy Group Financing Agency, SC, Gas Supply Revenue, 5.25% to 8/1/31 (Put Date), 10/1/54 | $ | 4,520 | $ 4,842,412 |
| Tennessee Energy Acquisition Corp., 5.00% to 11/1/31 (Put Date), 5/1/52 | | 5,060 | 5,347,357 |
| | | | $ 25,217,763 |
| Senior Living/Life Care — 1.0% |
| California Public Finance Authority, (Enso Village): | | | |
| Green Bonds, 3.125%, 5/15/29(5) | $ | 410 | $ 400,021 |
| Green Bonds, 5.00%, 11/15/46(5) | | 565 | 511,709 |
| Clackamas County Hospital Facility Authority, OR, (Rose Villa), 5.25%, 11/15/50 | | 160 | 150,603 |
| Franklin County, OH, (Friendship Village of Dublin), 5.00%, 11/15/44 | | 525 | 525,509 |
| Massachusetts Development Finance Agency, (NewBridge on the Charles, Inc.), 5.00%, 10/1/57(5) | | 310 | 308,500 |
| New Hope Cultural Education Facilities Finance Corp., TX, (The Outlook at Windhaven), 6.75%, 10/1/52 | | 4,000 | 3,755,800 |
| North Carolina Medical Care Commission, (Pennybyrn at Maryfield), 5.00%, 10/1/50 | | 2,500 | 2,218,625 |
| | | | $ 7,870,767 |
| Special Tax Revenue — 18.6% |
| Dallas Area Rapid Transit, TX, Sales Tax Revenue, 4.00%, 12/1/51 | $ | 5,000 | $ 4,795,550 |
| District of Columbia, Income Tax Revenue, 5.25%, 5/1/48 | | 4,500 | 5,021,550 |
| Massachusetts Bay Transportation Authority, Sales Tax Revenue: | | | |
| 4.00%, 7/1/51 | | 4,000 | 3,903,760 |
| 5.25%, 7/1/33 | | 750 | 885,698 |
| Michigan, Trunk Line Revenue, 5.25%, 11/15/49(1) | | 10,000 | 11,249,000 |
| New York City Transitional Finance Authority, NY, Future Tax Revenue: | | | |
| 4.00%, 8/1/37(1) | | 10,000 | 10,059,700 |
| 4.00%, 8/1/39(1) | | 5,000 | 5,004,850 |
| 4.00%, 2/1/43 | | 9,000 | 9,057,870 |
| 5.00%, 11/1/46(1) | | 5,000 | 5,427,150 |
| 5.00%, 2/1/47 | | 5,000 | 5,387,900 |
| New York Convention Center Development Corp., Hotel Occupancy Tax, 5.00%, 11/15/45(1) | | 13,000 | 13,141,570 |
| New York Dormitory Authority, Personal Income Tax Revenue: | | | |
| 4.00%, 2/15/47 | | 9,100 | 8,868,314 |
| 4.00%, 3/15/47 | | 3,500 | 3,413,585 |
| New York Dormitory Authority, Sales Tax Revenue: | | | |
| 4.00%, 3/15/46 | | 14,000 | 13,716,920 |
| Security | Principal
Amount
(000's omitted) | Value |
| Special Tax Revenue (continued) |
New York Dormitory Authority, Sales Tax Revenue:
(continued) | | | |
| 5.00%, 3/15/43(1) | $ | 6,000 | $ 6,315,060 |
| New York State Urban Development Corp., Personal Income Tax Revenue: | | | |
| 4.00%, 3/15/45(1) | | 2,800 | 2,711,296 |
| 4.00%, 3/15/45 | | 2,215 | 2,150,809 |
| Green Bonds, 4.00%, 3/15/50 | | 2,980 | 2,848,850 |
| New York Thruway Authority, Personal Income Tax Revenue: | | | |
| 4.00%, 3/15/44 | | 2,000 | 1,974,860 |
| Green Bonds, 5.00%, 3/15/55(1) | | 5,000 | 5,356,550 |
| Puerto Rico Sales Tax Financing Corp., 5.00%, 7/1/58 | | 6,000 | 6,024,540 |
| Triborough Bridge and Tunnel Authority, NY, Green Bonds, 5.25%, 5/15/47(1) | | 8,850 | 9,819,606 |
| Triborough Bridge and Tunnel Authority, NY, Sales Tax Revenue, 4.00%, 5/15/48 | | 3,000 | 2,938,050 |
| Washington Metropolitan Area Transit Authority, D.C., Sustainability Bonds, 5.25%, 7/15/53(1) | | 10,000 | 11,004,800 |
| | | | $ 151,077,838 |
| Transportation — 15.6% |
| Atlanta, GA, Airport General Revenue, Green Bonds, 5.00%, 7/1/53(1) | $ | 10,000 | $ 10,849,600 |
| Charlotte, NC, (Charlotte Douglas International Airport), 5.00%, 7/1/53(1) | | 10,000 | 10,849,600 |
| Denver City and County, CO, Airport System Revenue: | | | |
| 4.00%, 11/15/43 | | 5,665 | 5,665,283 |
| (AMT), 5.00%, 11/15/53 | | 3,920 | 4,119,646 |
| Florida Department of Transportation, Turnpike System Revenue, 5.00%, 7/1/52(1) | | 16,000 | 17,071,360 |
| Illinois Toll Highway Authority, 5.00%, 1/1/44(1) | | 10,000 | 11,063,600 |
| Los Angeles Department of Airports, CA, (Los Angeles International Airport), Green Bonds, (AMT), 5.00%, 5/15/47 | | 7,145 | 7,537,832 |
| Massachusetts, (Rail Enhancement Program), Sustainablility Bonds, 5.00%, 6/1/53(1) | | 10,000 | 10,739,500 |
| Metropolitan Transportation Authority, NY, Green Bonds, 4.75%, 11/15/45 | | 730 | 752,192 |
| Metropolitan Washington Airports Authority, D.C.: | | | |
| (AMT), 4.00%, 10/1/51 | | 5,000 | 4,669,250 |
| (AMT), 5.25%, 10/1/53 | | 2,000 | 2,143,420 |
| New Jersey Turnpike Authority, 5.25%, 1/1/52 | | 2,500 | 2,739,350 |
| New York Transportation Development Corp., (John F. Kennedy International Airport), Green Bonds, (AMT), 6.00%, 6/30/54 | | 960 | 1,064,535 |
| North Texas Tollway Authority: | | | |
| 4.125%, 1/1/39 | | 6,000 | 6,175,920 |
13
See Notes to Financial Statements.
Eaton Vance
Municipal Bond Fund
March 31, 2024
Portfolio of Investments (Unaudited) — continued
| Security | Principal
Amount
(000's omitted) | Value |
| Transportation (continued) |
| North Texas Tollway Authority: (continued) | | | |
| 5.00%, 1/1/48 | $ | 7,500 | $ 7,656,600 |
| Oklahoma Turnpike Authority, 5.50%, 1/1/53 | | 8,335 | 9,224,761 |
| Pennsylvania Turnpike Commission: | | | |
| 5.00%, 12/1/53 | | 7,000 | 7,529,200 |
| 5.25%, 12/1/52 | | 2,600 | 2,846,298 |
| Texas Private Activity Bond Surface Transportation Corp., (North Tarrant Express Segment 3C), (AMT), 5.00%, 6/30/58 | | 2,500 | 2,532,000 |
| Texas Transportation Commission, (Central Texas Turnpike System), 5.00%, 8/15/42 | | 1,765 | 1,767,718 |
| | | | $ 126,997,665 |
| Water and Sewer — 0.5% |
| Jefferson County, AL, Sewer Revenue, 5.50%, 10/1/53 | $ | 820 | $ 894,308 |
| New York City Municipal Water Finance Authority, NY, (Water and Sewer System), 5.25%, 6/15/52(1) | | 3,000 | 3,294,060 |
| | | | $ 4,188,368 |
Total Tax-Exempt Municipal Obligations
(identified cost $1,102,251,442) | | | $1,132,524,270 |
| Taxable Municipal Obligations — 0.0%(3) |
| Security | Principal
Amount
(000's omitted) | Value |
| Lease Revenue/Certificates of Participation — 0.0%(3) |
| New Hampshire Business Finance Authority, (Centurion BioSquare, Inc.), 9.58%, 12/15/38 | $ | 230 | $ 228,420 |
| New Hampshire Business Finance Authority, (Centurion Foundation), 11.00%, 12/15/38 | | 120 | 119,237 |
Total Taxable Municipal Obligations
(identified cost $350,000) | | | $ 347,657 |
| Security | Notional
Amount
(000's omitted) | Value |
| Transportation — 0.1% |
| HTA TRRB 2005L-745190R75 Assured Custodial Trust, 5.25%, 7/1/41 | $ | 719 | $ 703,214 |
Total Trust Units
(identified cost $723,994) | | | $ 703,214 |
Total Investments — 141.0%
(identified cost $1,120,086,546) | | | $1,145,173,718 |
| Other Assets, Less Liabilities — (41.0)% | | | $ (333,224,991) |
| Net Assets — 100.0% | | | $ 811,948,727 |
| The percentage shown for each investment category in the Portfolio of Investments is based on net assets. |
| (1) | Security represents the municipal bond held by a trust that issues residual interest bonds (see Note 1G). |
| (2) | Variable rate demand obligation that may be tendered at par on any day for payment the same or next business day. The stated interest rate, which generally resets daily, is determined by the remarketing agent and represents the rate in effect at March 31, 2024. |
| (3) | Amount is less than 0.05%. |
| (4) | When-issued security. |
| (5) | Security exempt from registration under Rule 144A of the Securities Act of 1933, as amended. These securities may be sold in certain transactions in reliance on an exemption from registration (normally to qualified institutional buyers). At March 31, 2024, the aggregate value of these securities is $1,220,230 or 0.2% of the Fund's net assets. |
| At March 31, 2024, the concentration of the Fund’s investments in the various states and territories, determined as a percentage of total investments, is as follows: |
| Texas | 23.2% |
| New York | 15.7% |
| Others, representing less than 10% individually | 60.3% |
| The Fund invests primarily in debt securities issued by municipalities. The ability of the issuers of the debt securities to meet their obligations may be affected by economic developments in a specific industry or municipality. At March 31, 2024, 20.9% of total investments are backed by bond insurance of various financial institutions and financial guaranty assurance agencies. The aggregate percentage insured by an individual financial institution or financial guaranty assurance agency ranged from 0.1% to 9.0% of total investments. |
| Abbreviations: |
| AGC | – Assured Guaranty Corp. |
| AGM | – Assured Guaranty Municipal Corp. |
| AMBAC | – AMBAC Financial Group, Inc. |
14
See Notes to Financial Statements.
Eaton Vance
Municipal Bond Fund
March 31, 2024
Portfolio of Investments (Unaudited) — continued
| |
| AMT | – Interest earned from these securities may be considered a tax preference item for purposes of the Federal Alternative Minimum Tax. |
| BAM | – Build America Mutual Assurance Co. |
| BHAC | – Berkshire Hathaway Assurance Corp. |
| FGIC | – Financial Guaranty Insurance Company |
| FHLMC | – Federal Home Loan Mortgage Corp. |
| FNMA | – Federal National Mortgage Association |
| GNMA | – Government National Mortgage Association |
| NPFG | – National Public Finance Guarantee Corp. |
| PSF | – Permanent School Fund |
| SFMR | – Single Family Mortgage Revenue |
| SPA | – Standby Bond Purchase Agreement |
| XLCA | – XL Capital Assurance, Inc. |
15
See Notes to Financial Statements.
Eaton Vance
California Municipal Bond Fund
March 31, 2024
Portfolio of Investments (Unaudited)
| Tax-Exempt Municipal Obligations — 129.3% |
| Security | Principal
Amount
(000's omitted) | Value |
| Education — 7.8% |
| California Educational Facilities Authority, (Loyola Marymount University): | | | |
| Green Bonds, 5.00%, 10/1/43 | $ | 2,105 | $ 2,208,861 |
| Green Bonds, 5.00%, 10/1/48 | | 3,000 | 3,121,980 |
| California State University, 5.00%, 11/1/41(1) | | 2,000 | 2,069,760 |
| University of California, 5.00%, 5/15/46(1) | | 12,050 | 12,415,115 |
| | | | $ 19,815,716 |
| Electric Utilities — 4.2% |
| Los Angeles Department of Water and Power, CA, Power System Revenue, 5.00%, 7/1/42(1) | $ | 2,000 | $ 2,101,640 |
| Sacramento Municipal Utility District, CA: | | | |
| Green Bonds, 5.00%, 8/15/50(1) | | 7,000 | 7,576,800 |
| Green Bonds, 5.00%, 8/15/53 | | 1,000 | 1,106,580 |
| | | | $ 10,785,020 |
| General Obligations — 53.1% |
| ABC Unified School District, CA, (Election of 2018), 4.00%, 8/1/47 | $ | 5,000 | $ 5,038,100 |
| Alisal Union School District, CA, (Election of 2016), 4.25%, 8/1/54 | | 10,180 | 10,166,868 |
| Alum Rock Union Elementary School District, CA, (Election of 2016), 5.25%, 8/1/47 | | 1,100 | 1,231,142 |
| Brentwood Union School District, CA, (Election 2016), 5.25%, 8/1/52 | | 4,250 | 4,686,687 |
| Brisbane School District, CA, (Election of 2020), 3.00%, 8/1/49 | | 1,760 | 1,395,310 |
| California: | | | |
| 4.75%, 12/1/42 | | 3,000 | 3,155,280 |
| 5.00%, 9/1/52(1) | | 10,000 | 10,910,000 |
| 5.25%, 9/1/53(1) | | 10,000 | 11,259,400 |
| Chaffey Joint Union High School District, CA, (Election of 2012), 4.00%, 8/1/49(1) | | 11,900 | 11,911,424 |
| Fort Bragg Unified School District, CA, (Election of 2020): | | | |
| 4.00%, 8/1/42 | | 1,350 | 1,368,401 |
| 4.125%, 8/1/47 | | 1,000 | 1,007,360 |
| Jefferson Elementary School District, CA, (Election of 2022): | | | |
| 4.25%, 9/1/43 | | 1,000 | 1,037,630 |
| 5.00%, 9/1/49 | | 1,440 | 1,596,701 |
| La Canada Unified School District, CA, (Election of 2017), 5.75%, 8/1/50 | | 1,465 | 1,735,190 |
| Manteca Unified School District, CA, (Election of 2020), 5.25%, 8/1/53 | | 7,430 | 8,314,987 |
| Security | Principal
Amount
(000's omitted) | Value |
| General Obligations (continued) |
| Modesto High School District, CA, (Election of 2022), 4.00%, 8/1/52 | $ | 7,200 | $ 7,105,032 |
| Pasadena Area Community College District, CA, (Election of 2022), 4.00%, 8/1/52 | | 3,750 | 3,700,537 |
| Robla School District, CA, (Election of 2014), 3.00%, 8/1/53 | | 500 | 382,160 |
| San Bernardino Community College District, CA, (Election of 2018), 4.125%, 8/1/49 | | 1,665 | 1,676,489 |
| San Diego Unified School District, CA, (Election of 2022), Sustainablility Bonds, 5.00%, 7/1/48(1) | | 10,000 | 11,232,100 |
| San Jose, CA, 5.00%, 9/1/49(1) | | 10,000 | 10,677,600 |
| San Luis Obispo County Community College District, CA, (Election of 2014), 4.00%, 8/1/43 | | 9,450 | 9,474,664 |
| San Rafael City High School District, CA, (Election of 2022), 4.25%, 8/1/47 | | 4,000 | 4,063,880 |
| Sierra Joint Community College District, CA, (Election of 2018), 4.00%, 8/1/48 | | 1,000 | 1,014,450 |
| South Bay Union School District, CA, (Election of 2018), 4.00%, 8/1/47 | | 3,000 | 3,005,910 |
| Sweetwater Union High School District, CA, (Election of 2018), 5.00%, 8/1/52 | | 5,000 | 5,421,500 |
| Westminster School District, CA, (Election of 2016), 4.00%, 8/1/51 | | 3,220 | 3,226,054 |
| | | | $ 135,794,856 |
| Hospital — 10.6% |
| California Health Facilities Financing Authority, (Cedars-Sinai Health System), 4.00%, 8/15/48 | $ | 10,025 | $ 9,823,598 |
| California Health Facilities Financing Authority, (City of Hope): | | | |
| 5.00%, 11/15/32 | | 2,130 | 2,131,150 |
| 5.00%, 11/15/35 | | 3,040 | 3,041,611 |
| California Health Facilities Financing Authority, (Kaiser Permanente), 4.00%, 11/1/44 | | 6,900 | 6,922,149 |
| California Health Facilities Financing Authority, (Lucile Salter Packard Children's Hospital at Stanford), 4.00%, 5/15/51 | | 5,250 | 5,080,110 |
| | | | $ 26,998,618 |
| Housing — 5.1% |
| California Municipal Finance Authority, (Caritas): | | | |
| 4.00%, 8/15/51 | $ | 435 | $ 374,096 |
| Social Bonds, 5.25%, 8/15/53 | | 900 | 936,378 |
| California Statewide Communities Development Authority, (University of California, Irvine East Campus Apartments, Phase IV-A-CHF-Irvine, LLC), 5.00%, 5/15/47 | | 5,000 | 5,038,400 |
16
See Notes to Financial Statements.
Eaton Vance
California Municipal Bond Fund
March 31, 2024
Portfolio of Investments (Unaudited) — continued
| Security | Principal
Amount
(000's omitted) | Value |
| Housing (continued) |
| CSCDA Community Improvement Authority, CA, (Pasadena Portfolio), Essential Housing Revenue, Social Bonds, 3.00%, 12/1/56(2) | $ | 2,680 | $ 1,905,587 |
| Independent Cities Finance Authority, CA, (Augusta Communities Mobile Home Park Pool), 5.25%, 5/15/56 | | 4,510 | 4,751,059 |
| | | | $ 13,005,520 |
| Insured - Electric Utilities — 1.5% |
| Puerto Rico Electric Power Authority, (NPFG), 5.25%, 7/1/34 | $ | 3,740 | $ 3,713,371 |
| | | | $ 3,713,371 |
| Insured - General Obligations — 14.7% |
| Antioch Unified School District, CA, (BAM), 4.00%, 8/1/47 | $ | 3,375 | $ 3,348,844 |
| Bakersfield City School District, CA, (Election of 2016), (BAM), 3.00%, 11/1/51 | | 1,500 | 1,152,960 |
| Bellevue Union School District, CA, (Election of 2020), (AGM), 3.125%, 8/1/44 | | 400 | 331,780 |
| Center Joint Unified School District, CA, (Election of 2008), (BAM), 3.00%, 8/1/46 | | 1,000 | 819,740 |
| Coalinga-Huron Joint Unified School District, CA, (Election of 2022): | | | |
| (BAM), 5.00%, 8/1/48 | | 1,000 | 1,077,750 |
| (BAM), 5.25%, 8/1/53 | | 2,750 | 2,991,587 |
| Coalinga-Huron Recreation and Park District, CA, (Election of 2016), (BAM), 3.00%, 8/1/50 | | 750 | 567,683 |
| Duarte Unified School District, CA, (Election of 2020), (AGM), 4.25%, 8/1/48 | | 3,500 | 3,591,980 |
| Eastside Union School District, CA, (Election of 2022): | | | |
| (BAM), 5.50%, 8/1/48 | | 1,500 | 1,715,925 |
| (BAM), 5.50%, 8/1/53 | | 1,500 | 1,702,005 |
| El Monte City School District, CA, (Election of 2014), (BAM), 4.00%, 8/1/47 | | 1,000 | 1,001,260 |
| Fair Oaks Recreation and Park District, CA, (Election of 2018), (BAM), 5.75%, 8/1/51 | | 1,700 | 1,952,331 |
| McFarland Unified School District, CA, (Election of 2020): | | | |
| (BAM), 3.00%, 11/1/49 | | 750 | 570,817 |
| (BAM), 4.50%, 11/1/52 | | 4,500 | 4,585,725 |
| Oxnard School District, CA, (Election of 2022), (BAM), 4.125%, 8/1/50 | | 2,000 | 2,003,460 |
| Pittsburg Unified School District, CA, (Election of 2018), (AGM), 4.25%, 8/1/49 | | 750 | 760,762 |
| Security | Principal
Amount
(000's omitted) | Value |
| Insured - General Obligations (continued) |
| San Mateo County Community College District, CA, (Election of 2001), (NPFG), 0.00%, 9/1/25 | $ | 3,955 | $ 3,774,692 |
| Ukiah Unified School District, CA, (Election of 2020), (AGM), 5.50%, 8/1/53 | | 5,000 | 5,676,900 |
| | | | $ 37,626,201 |
| Insured - Hospital — 1.7% |
| California Health Facilities Financing Authority, (Adventist Health System), (AGM), 4.00%, 3/1/39 | $ | 4,220 | $ 4,231,015 |
| California Statewide Communities Development Authority, (Enloe Medical Center), (AGM), 5.25%, 8/15/52 | | 160 | 173,747 |
| | | | $ 4,404,762 |
| Insured - Special Tax Revenue — 1.7% |
| Successor Agency to San Francisco City and County Redevelopment Agency, CA, (Transbay Infrastructure Projects): | | | |
| (AGM), 5.00%, 8/1/43 | $ | 2,145 | $ 2,394,399 |
| (AGM), 5.25%, 8/1/53 | | 1,815 | 2,000,003 |
| | | | $ 4,394,402 |
| Insured - Transportation — 2.5% |
| Alameda Corridor Transportation Authority, CA, (AGM), 0.00%, 10/1/51 | $ | 8,065 | $ 2,228,924 |
| Long Beach, CA, (Long Beach Airport), (AGM), (AMT), 5.25%, 6/1/47 | | 1,000 | 1,081,200 |
| San Joaquin Hills Transportation Corridor Agency, CA, (NPFG), 0.00%, 1/15/27 | | 3,520 | 3,187,255 |
| | | | $ 6,497,379 |
| Insured - Water and Sewer — 0.7% |
| Mountain House Public Financing Authority, CA, Green Bonds, (BAM), 4.25%, 12/1/52 | $ | 1,750 | $ 1,768,445 |
| | | | $ 1,768,445 |
| Other Revenue — 1.1% |
| California Community Choice Financing Authority, Clean Energy Project Revenue: | | | |
| Green Bonds, 5.00% to 8/1/29 (Put Date), 12/1/53 | $ | 1,000 | $ 1,056,660 |
| Green Bonds, 5.25% to 4/1/30 (Put Date), 11/1/54 | | 1,660 | 1,786,741 |
| | | | $ 2,843,401 |
| Senior Living/Life Care — 1.3% |
| California Municipal Finance Authority, (HumanGood - California Obligated Group), 4.00%, 10/1/49 | $ | 3,105 | $ 2,918,079 |
17
See Notes to Financial Statements.
Eaton Vance
California Municipal Bond Fund
March 31, 2024
Portfolio of Investments (Unaudited) — continued
| Security | Principal
Amount
(000's omitted) | Value |
| Senior Living/Life Care (continued) |
| California Public Finance Authority, (Enso Village): | | | |
| Green Bonds, 2.375%, 11/15/28(2) | $ | 105 | $ 102,630 |
| Green Bonds, 5.00%, 11/15/46(2) | | 450 | 407,556 |
| | | | $ 3,428,265 |
| Special Tax Revenue — 1.4% |
| Puerto Rico Sales Tax Financing Corp., 5.00%, 7/1/58 | $ | 3,645 | $ 3,659,908 |
| | | | $ 3,659,908 |
| Transportation — 13.3% |
| Bay Area Toll Authority, CA, (San Francisco Bay Area): | | | |
| 4.125%, 4/1/54 | $ | 3,000 | $ 2,978,400 |
| (LOC: Barclays Bank PLC), 3.80%, 4/1/55(3) | | 1,000 | 1,000,000 |
| Los Angeles Department of Airports, CA, (Los Angeles International Airport), (AMT), 5.00%, 5/15/43(1) | | 10,000 | 10,408,500 |
| San Diego County Regional Airport Authority, CA, (San Diego International Airport), (AMT), 5.00%, 7/1/48 | | 3,750 | 3,994,575 |
| San Francisco City and County Airport Commission, CA, (San Francisco International Airport), (AMT), 5.00%, 5/1/45 | | 5,000 | 5,183,200 |
| San Francisco Municipal Transportation Agency, CA, Green Bonds, 5.00%, 3/1/51(1) | | 10,000 | 10,545,300 |
| | | | $ 34,109,975 |
| Water and Sewer — 8.6% |
| East Bay Municipal Utility District, CA, Water System Revenue, Green Bonds, 5.00%, 6/1/54(1) | $ | 12,000 | $ 13,313,520 |
| Los Angeles, CA, Wastewater System Revenue, 5.00%, 6/1/43(1) | | 7,500 | 7,511,850 |
| Santa Clara Valley Water District, CA, Green Bonds, 5.00%, 8/1/49 | | 1,100 | 1,219,570 |
| | | | $ 22,044,940 |
Total Tax-Exempt Municipal Obligations
(identified cost $325,475,835) | | | $ 330,890,779 |
| Taxable Municipal Obligations — 5.6% |
| Security | Principal
Amount
(000's omitted) | Value |
| Education — 0.5% |
| California Municipal Finance Authority, (Albert Einstein Academies), 3.75%, 8/1/31(2) | $ | 1,415 | $ 1,221,697 |
| | | | $ 1,221,697 |
| Security | Principal
Amount
(000's omitted) | Value |
| General Obligations — 1.9% |
| Monterey Peninsula Community College District, CA, (Election of 2020): | | | |
| 2.861%, 8/1/46 | $ | 1,000 | $ 697,520 |
| 2.951%, 8/1/51 | | 1,400 | 941,402 |
| Ohlone Community College District, CA, 2.443%, 8/1/35 | | 535 | 427,385 |
| Robla School District, CA, 2.602%, 8/1/40 | | 615 | 449,442 |
| Santa Maria-Bonita School District, CA, 3.071%, 8/1/39 | | 2,000 | 1,607,460 |
| Tustin Unified School District, CA, 2.649%, 8/1/42 | | 1,125 | 827,865 |
| | | | $ 4,951,074 |
| Housing — 0.3% |
| Independent Cities Finance Authority, CA, (Vista de Santa Barbara Mobilehome Park), 4.50%, 9/15/56 | $ | 980 | $ 730,894 |
| | | | $ 730,894 |
| Insured - General Obligations — 1.7% |
| Palmdale School District, CA, (AGM), 2.948%, 8/1/47 | $ | 5,000 | $ 3,539,350 |
| Sanger Unified School District, CA, (BAM), 2.834%, 8/1/44 | | 1,250 | 873,750 |
| | | | $ 4,413,100 |
| Other Revenue — 1.2% |
| Central Marin Police Authority, CA, 3.101%, 2/1/41 | $ | 1,000 | $ 768,570 |
| Corte Madera, CA, Pension Obligation Bonds, 3.257%, 6/1/45 | | 940 | 693,287 |
| National City, CA, Pension Obligation Bonds, 3.423%, 11/1/42 | | 2,000 | 1,566,300 |
| | | | $ 3,028,157 |
Total Taxable Municipal Obligations
(identified cost $19,215,288) | | | $ 14,344,922 |
18
See Notes to Financial Statements.
Eaton Vance
California Municipal Bond Fund
March 31, 2024
Portfolio of Investments (Unaudited) — continued
| Security | Notional
Amount
(000's omitted) | Value |
| Transportation — 0.3% |
| HTA TRRB 2005L-745190UR7 Assured Custodial Trust, 5.25%, 7/1/41 | $ | 822 | $ 803,682 |
Total Trust Units
(identified cost $817,039) | | | $ 803,682 |
Total Investments — 135.2%
(identified cost $345,508,162) | | | $ 346,039,383 |
| Other Assets, Less Liabilities — (35.2)% | | | $ (90,121,534) |
| Net Assets — 100.0% | | | $ 255,917,849 |
| The percentage shown for each investment category in the Portfolio of Investments is based on net assets. |
| (1) | Security represents the municipal bond held by a trust that issues residual interest bonds (see Note 1G). |
| (2) | Security exempt from registration under Rule 144A of the Securities Act of 1933, as amended. These securities may be sold in certain transactions in reliance on an exemption from registration (normally to qualified institutional buyers). At March 31, 2024, the aggregate value of these securities is $3,637,470 or 1.4% of the Fund's net assets. |
| (3) | Variable rate demand obligation that may be tendered at par on any day for payment the same or next business day. The stated interest rate, which generally resets daily, is determined by the remarketing agent and represents the rate in effect at March 31, 2024. |
| The Fund invests primarily in debt securities issued by California municipalities. The ability of the issuers of the debt securities to meet their obligations may be affected by economic developments in a specific industry or municipality. At March 31, 2024, 18.2% of total investments are backed by bond insurance of various financial institutions and financial guaranty assurance agencies. The aggregate percentage insured by an individual financial institution or financial guaranty assurance agency ranged from 3.1% to 7.6% of total investments. |
| Abbreviations: |
| AGM | – Assured Guaranty Municipal Corp. |
| AMT | – Interest earned from these securities may be considered a tax preference item for purposes of the Federal Alternative Minimum Tax. |
| BAM | – Build America Mutual Assurance Co. |
| LOC | – Letter of Credit |
| NPFG | – National Public Finance Guarantee Corp. |
19
See Notes to Financial Statements.
Eaton Vance
New York Municipal Bond Fund
March 31, 2024
Portfolio of Investments (Unaudited)
| Security | Principal
Amount
(000's omitted) | Value |
| Hospital — 0.5% |
| Montefiore Obligated Group, 4.287%, 9/1/50 | $ | 1,350 | $ 851,758 |
| | | | $ 851,758 |
| Other — 0.7% |
| YMCA of Greater New York, 2.303%, 8/1/26 | $ | 1,500 | $ 1,377,813 |
| | | | $ 1,377,813 |
Total Corporate Bonds
(identified cost $2,730,368) | | | $ 2,229,571 |
| Tax-Exempt Municipal Obligations — 139.7% |
| Security | Principal
Amount
(000's omitted) | Value |
| Bond Bank — 1.6% |
| New York State Environmental Facilities Corp., (State Revolving Fund): | | | |
| Green Bonds, 5.00%, 9/15/47 | $ | 135 | $ 147,840 |
| Green Bonds, 5.00%, 9/15/47(1) | | 2,700 | 2,956,824 |
| | | | $ 3,104,664 |
| Education — 6.6% |
| Build NYC Resource Corp., NY, (Academic Leadership Charter School), 4.00%, 6/15/36 | $ | 200 | $ 187,350 |
| Build NYC Resource Corp., NY, (East Harlem Scholars Academy Charter School), Social Bonds, 5.00%, 6/1/32(2) | | 375 | 391,744 |
| Build NYC Resource Corp., NY, (Grand Concourse Academy Charter School), 5.00%, 7/1/52 | | 700 | 701,820 |
| Monroe County Industrial Development Corp., NY, (True North Rochester Preparatory Charter School), 5.00%, 6/1/50(2) | | 1,180 | 1,174,206 |
| Monroe County Industrial Development Corp., NY, (University of Rochester): | | | |
| 4.00%, 7/1/50 | | 7,000 | 6,735,330 |
| 5.00%, 7/1/53 | | 1,235 | 1,331,947 |
| New York Dormitory Authority, (New York University), 4.00%, 7/1/39 | | 1,250 | 1,268,912 |
| Schenectady County Capital Resource Corp., NY, (Union College), 5.25%, 7/1/52 | | 375 | 410,483 |
| Yonkers Economic Development Corp., NY, (Lamartine/Warburton, LLC - Charter School of Educational Excellence): | | | |
| 5.00%, 10/15/39 | | 395 | 400,325 |
| Security | Principal
Amount
(000's omitted) | Value |
| Education (continued) |
| Yonkers Economic Development Corp., NY, (Lamartine/Warburton, LLC - Charter School of Educational Excellence): (continued) | | | |
| 5.00%, 10/15/49 | $ | 80 | $ 78,992 |
| | | | $ 12,681,109 |
| Electric Utilities — 11.8% |
| Long Island Power Authority, NY, Electric System Revenue, Green Bonds, 5.00%, 9/1/48 | $ | 7,500 | $ 8,289,900 |
| New York Power Authority, Green Bonds, 4.00%, 11/15/50(1) | | 11,500 | 11,170,870 |
| Utility Debt Securitization Authority, NY: | | | |
| Green Bonds, 5.00%, 12/15/49 | | 2,000 | 2,189,520 |
| Green Bonds, 5.00%, 12/15/50 | | 1,000 | 1,104,800 |
| | | | $ 22,755,090 |
| General Obligations — 16.8% |
| East Meadow Union Free School District, NY, 2.00%, 6/15/35 | $ | 985 | $ 790,334 |
| New York, 5.00%, 3/15/41 | | 4,065 | 4,631,336 |
| New York, NY: | | | |
| 4.00%, 4/1/50 | | 2,000 | 1,942,180 |
| 5.00%, 8/1/47(1) | | 10,000 | 10,694,900 |
| 5.00%, 8/1/51(1) | | 10,000 | 10,725,200 |
| Puerto Rico, 4.00%, 7/1/46 | | 1,000 | 920,860 |
| Washingtonville Central School District, NY: | | | |
| 0.05%, 6/15/35 | | 950 | 622,069 |
| 0.05%, 6/15/36 | | 950 | 589,655 |
| 0.05%, 6/15/37 | | 950 | 554,031 |
| 0.05%, 6/15/38 | | 950 | 516,848 |
| 0.05%, 6/15/39 | | 695 | 357,807 |
| | | | $ 32,345,220 |
| Hospital — 4.8% |
| Brookhaven Local Development Corp., NY, (Long Island Community Hospital), 3.375%, 10/1/40 | $ | 1,500 | $ 1,290,210 |
| Genesee County Funding Corp., NY, (Rochester Regional Health Obligation), 5.25%, 12/1/52 | | 1,000 | 1,042,350 |
| Jefferson County Civic Facility Development Corp., NY, (Samaritan Medical Center), 4.00%, 11/1/47 | | 2,200 | 1,604,218 |
| New York Dormitory Authority, (Maimonides Medical Center), 3.00%, 2/1/50 | | 1,975 | 1,463,949 |
20
See Notes to Financial Statements.
Eaton Vance
New York Municipal Bond Fund
March 31, 2024
Portfolio of Investments (Unaudited) — continued
| Security | Principal
Amount
(000's omitted) | Value |
| Hospital (continued) |
| New York Dormitory Authority, (Northwell Health Obligated Group), 5.00%, 5/1/52 | $ | 2,330 | $ 2,461,109 |
| New York Dormitory Authority, (NYU Langone Hospitals Obligated Group), 4.00%, 7/1/50 | | 1,500 | 1,454,865 |
| | | | $ 9,316,701 |
| Housing — 8.5% |
| New York City Housing Development Corp., NY: | | | |
| 2.75%, 5/1/51 | $ | 3,000 | $ 2,076,150 |
| 3.40%, 11/1/39 | | 1,000 | 890,960 |
| 3.55%, 11/1/44 | | 1,115 | 984,077 |
| 3.80%, 11/1/43 | | 1,675 | 1,573,579 |
| 4.05%, 11/1/41 | | 2,030 | 2,030,832 |
| 4.95%, 11/1/58 | | 1,000 | 1,020,030 |
| Sustainability Bonds, 3.70%, 11/1/38 | | 850 | 821,338 |
| Sustainability Bonds, (SPA: TD Bank, N.A.), 3.42%, 5/1/50(3) | | 2,000 | 2,000,000 |
| New York Housing Finance Agency: | | | |
| (FHLMC), (FNMA), (GNMA), 3.20%, 11/1/46 | | 1,075 | 874,889 |
| (FHLMC), (FNMA), (GNMA), 4.00%, 11/1/42 | | 500 | 490,925 |
| Green Bonds, (FNMA), 3.95%, 11/1/37 | | 1,000 | 1,001,400 |
| New York Mortgage Agency, Sustainability Bonds, 5.00%, 10/1/53 | | 2,500 | 2,565,025 |
| | | | $ 16,329,205 |
| Industrial Development Revenue — 3.9% |
| New York Liberty Development Corp., (Goldman Sachs Group, Inc.): | | | |
| 5.25%, 10/1/35 | $ | 895 | $ 1,057,523 |
| 5.50%, 10/1/37 | | 1,440 | 1,727,151 |
| New York Transportation Development Corp., (Delta Air Lines, Inc. - LaGuardia Airport Terminals C&D Redevelopment): | | | |
| (AMT), 5.00%, 1/1/36 | | 1,000 | 1,033,240 |
| (AMT), 5.00%, 10/1/40 | | 2,665 | 2,765,177 |
| (AMT), 6.00%, 4/1/35 | | 760 | 863,360 |
| | | | $ 7,446,451 |
| Insured - Education — 0.8% |
| New York Dormitory Authority, (CUNY Student Housing), (AMBAC), (BAM), 5.50%, 7/1/35 | $ | 1,345 | $ 1,619,380 |
| | | | $ 1,619,380 |
| Insured - Electric Utilities — 2.5% |
| New York Power Authority, Green Transmission Revenue: | | | |
| (AGM), 4.00%, 11/15/47 | $ | 3,750 | $ 3,681,825 |
| Security | Principal
Amount
(000's omitted) | Value |
| Insured - Electric Utilities (continued) |
| New York Power Authority, Green Transmission Revenue: (continued) | | | |
| (AGM), 5.00%, 11/15/48 | $ | 1,000 | $ 1,105,810 |
| | | | $ 4,787,635 |
| Insured - General Obligations — 5.0% |
| Nassau County, NY: | | | |
| (AGM), 4.00%, 4/1/47 | $ | 2,125 | $ 2,053,451 |
| (AGM), 5.00%, 7/1/40(1) | | 7,110 | 7,532,476 |
| | | | $ 9,585,927 |
| Insured - Hospital — 0.1% |
| Westchester County Local Development Corp., NY, (Westchester Medical Center Obligated Group), (AGM), 5.75%, 11/1/49 | $ | 250 | $ 289,815 |
| | | | $ 289,815 |
| Insured - Lease Revenue/Certificates of Participation — 1.8% |
| Ulster County Resource Recovery Agency, NY, Solid Waste System, (AMBAC), 0.00%, 3/1/25 | $ | 3,635 | $ 3,510,828 |
| | | | $ 3,510,828 |
| Insured - Other Revenue — 2.0% |
| New York City Industrial Development Agency, NY, (Queens Baseball Stadium), (AGM), 3.00%, 1/1/46 | $ | 4,785 | $ 3,855,418 |
| | | | $ 3,855,418 |
| Insured - Transportation — 3.7% |
| Metropolitan Transportation Authority, NY: | | | |
| Green Bonds, (AGM), 4.00%, 11/15/48 | $ | 6,000 | $ 5,745,600 |
| Green Bonds, (BAM), 4.00%, 11/15/48 | | 1,500 | 1,436,400 |
| | | | $ 7,182,000 |
| Other Revenue — 1.1% |
| Hudson Yards Infrastructure Corp., NY, Green Bonds, 4.00%, 2/15/41 | $ | 2,000 | $ 2,028,640 |
| | | | $ 2,028,640 |
| Senior Living/Life Care — 1.2% |
| Brookhaven Local Development Corp., NY, (Jefferson's Ferry), 5.25%, 11/1/36 | $ | 970 | $ 994,386 |
21
See Notes to Financial Statements.
Eaton Vance
New York Municipal Bond Fund
March 31, 2024
Portfolio of Investments (Unaudited) — continued
| Security | Principal
Amount
(000's omitted) | Value |
| Senior Living/Life Care (continued) |
| Southold Local Development Corp., NY, (Peconic Landing at Southold, Inc.), 4.00%, 12/1/45 | $ | 25 | $ 21,654 |
| Westchester County Local Development Corp., NY, (Miriam Osborn Memorial Home Association), 5.00%, 7/1/42 | | 1,200 | 1,233,420 |
| | | | $ 2,249,460 |
| Special Tax Revenue — 38.8% |
| New York City Transitional Finance Authority, NY, Future Tax Revenue: | | | |
| 3.00%, 11/1/47 | $ | 3,010 | $ 2,395,930 |
| 4.00%, 5/1/45 | | 1,000 | 983,770 |
| 5.00%, 2/1/47 | | 5,000 | 5,387,900 |
| 5.00%, 5/1/53(1) | | 10,000 | 10,742,000 |
| New York Dormitory Authority, Personal Income Tax Revenue, 5.00%, 3/15/46(1) | | 10,000 | 10,800,900 |
| New York Dormitory Authority, Sales Tax Revenue: | | | |
| 4.00%, 3/15/43 | | 2,000 | 1,993,760 |
| 4.00%, 3/15/49 | | 1,000 | 976,170 |
| New York State Urban Development Corp., Personal Income Tax Revenue, 5.00%, 3/15/44(1) | | 10,000 | 10,772,900 |
| New York State Urban Development Corp., Sales Tax Revenue: | | | |
| 4.00%, 3/15/39 | | 2,500 | 2,550,325 |
| 4.00%, 3/15/45 | | 4,000 | 3,933,320 |
| 5.00%, 3/15/48 | | 1,850 | 2,026,194 |
| New York Thruway Authority, Personal Income Tax Revenue, 3.00%, 3/15/49 | | 1,500 | 1,157,430 |
| Puerto Rico Sales Tax Financing Corp., 5.00%, 7/1/58 | | 3,500 | 3,514,315 |
| Triborough Bridge and Tunnel Authority, NY: | | | |
| Series 2021C, 5.00%, 5/15/51 | | 3,000 | 3,189,000 |
| Green Bonds, 5.25%, 11/15/42 | | 1,000 | 1,146,770 |
| Green Bonds, 5.25%, 5/15/47(1) | | 7,500 | 8,321,700 |
| Triborough Bridge and Tunnel Authority, NY, Sales Tax Revenue: | | | |
| 4.00%, 5/15/48 | | 2,510 | 2,458,168 |
| 4.00%, 5/15/54 | | 670 | 643,066 |
| 4.125%, 5/15/64 | | 2,000 | 1,930,600 |
| | | | $ 74,924,218 |
| Transportation — 18.2% |
| Metropolitan Transportation Authority, NY: | | | |
| 5.25%, 11/15/55 | $ | 1,650 | $ 1,666,649 |
| Green Bonds, 4.00%, 11/15/45 | | 1,000 | 960,720 |
| Green Bonds, 4.75%, 11/15/45 | | 1,205 | 1,241,632 |
| New York Thruway Authority, 4.00%, 1/1/45 | | 2,625 | 2,556,251 |
| Security | Principal
Amount
(000's omitted) | Value |
| Transportation (continued) |
| New York Transportation Development Corp., (John F. Kennedy International Airport), Green Bonds, (AMT), 6.00%, 6/30/54 | $ | 1,925 | $ 2,134,613 |
| New York Transportation Development Corp., (LaGuardia Airport Terminal B Redevelopment): | | | |
| (AMT), 4.00%, 7/1/33 | | 835 | 808,213 |
| (AMT), 5.00%, 7/1/41 | | 2,150 | 2,135,638 |
| (AMT), 5.00%, 7/1/46 | | 1,000 | 986,400 |
| (AMT), 5.25%, 1/1/50 | | 1,240 | 1,240,967 |
| New York Transportation Development Corp., (Terminal 4 John F. Kennedy International Airport): | | | |
| 4.00%, 12/1/42 | | 3,200 | 3,060,032 |
| (AMT), 4.00%, 12/1/42 | | 1,000 | 934,370 |
| Port Authority of New York and New Jersey, (AMT), 5.00%, 8/1/37 | | 1,250 | 1,373,863 |
| Triborough Bridge and Tunnel Authority, NY, 5.00%, 11/15/51(1) | | 15,000 | 16,018,500 |
| | | | $ 35,117,848 |
| Water and Sewer — 10.5% |
| New York City Municipal Water Finance Authority, NY, (Water and Sewer System): | | | |
| 4.00%, 6/15/51 | $ | 3,125 | $ 3,037,594 |
| 5.00%, 6/15/47(1) | | 4,000 | 4,352,600 |
| 5.00%, 6/15/51(1) | | 10,000 | 10,669,800 |
| 5.25%, 6/15/48 | | 2,000 | 2,234,600 |
| | | | $ 20,294,594 |
Total Tax-Exempt Municipal Obligations
(identified cost $268,489,190) | | | $ 269,424,203 |
| Taxable Municipal Obligations — 2.4% |
| Security | Principal
Amount
(000's omitted) | Value |
| Education — 0.9% |
| Build NYC Resource Corp., NY, (New World Preparatory Charter School), 4.375%, 6/15/25 | $ | 240 | $ 236,460 |
| New York Dormitory Authority, (Iona College), 4.127%, 7/1/49 | | 2,000 | 1,428,440 |
| | | | $ 1,664,900 |
| Special Tax Revenue — 1.5% |
| Metropolitan Transportation Authority, NY, Payroll Mobility Tax Revenue, 5.37%, 12/19/24 | $ | 2,000 | $ 1,999,180 |
22
See Notes to Financial Statements.
Eaton Vance
New York Municipal Bond Fund
March 31, 2024
Portfolio of Investments (Unaudited) — continued
| Security | Principal
Amount
(000's omitted) | Value |
| Special Tax Revenue (continued) |
| Oneida Indian Nation of New York, 8.00%, 9/1/40(2) | $ | 1,000 | $ 986,100 |
| | | | $ 2,985,280 |
Total Taxable Municipal Obligations
(identified cost $5,217,540) | | | $ 4,650,180 |
| Security | Notional
Amount
(000's omitted) | Value |
| Transportation — 0.4% |
| HTA TRRB 2005L-745190UR7 Assured Custodial Trust, 5.25%, 7/1/41 | $ | 822 | $ 803,682 |
Total Trust Units
(identified cost $817,039) | | | $ 803,682 |
Total Investments — 143.7%
(identified cost $277,254,137) | | | $ 277,107,636 |
| Other Assets, Less Liabilities — (43.7)% | | | $ (84,214,594) |
| Net Assets — 100.0% | | | $ 192,893,042 |
| The percentage shown for each investment category in the Portfolio of Investments is based on net assets. |
| (1) | Security represents the municipal bond held by a trust that issues residual interest bonds (see Note 1G). |
| (2) | Security exempt from registration under Rule 144A of the Securities Act of 1933, as amended. These securities may be sold in certain transactions in reliance on an exemption from registration (normally to qualified institutional buyers). At March 31, 2024, the aggregate value of these securities is $2,552,050 or 1.3% of the Fund's net assets. |
| (3) | Variable rate demand obligation that may be tendered at par on any day for payment the lesser of 5 business days or 7 calendar days. The stated interest rate, which generally resets weekly, represents the rate in effect at March 31, 2024. |
| The Fund invests primarily in debt securities issued by New York municipalities. The ability of the issuers of the debt securities to meet their obligations may be affected by economic developments in a specific industry or municipality. At March 31, 2024, 11.1% of total investments are backed by bond insurance of various financial institutions and financial guaranty assurance agencies. The aggregate percentage insured by an individual financial institution or financial guaranty assurance agency ranged from 1.1% to 8.8% of total investments. |
| Abbreviations: |
| AGM | – Assured Guaranty Municipal Corp. |
| AMBAC | – AMBAC Financial Group, Inc. |
| AMT | – Interest earned from these securities may be considered a tax preference item for purposes of the Federal Alternative Minimum Tax. |
| BAM | – Build America Mutual Assurance Co. |
| FHLMC | – Federal Home Loan Mortgage Corp. |
| FNMA | – Federal National Mortgage Association |
| GNMA | – Government National Mortgage Association |
| SPA | – Standby Bond Purchase Agreement |
23
See Notes to Financial Statements.
Eaton Vance
Municipal Bond Funds
March 31, 2024
Statements of Assets and Liabilities (Unaudited)
| | March 31, 2024 |
| | Municipal Fund | California Fund | New York Fund |
| Assets | | | |
| Investments: | | | |
| Identified cost | $ 1,120,086,546 | $ 345,508,162 | $ 277,254,137 |
| Unrealized appreciation (depreciation) | 25,087,172 | 531,221 | (146,501) |
| Investments, at value | $1,145,173,718 | $346,039,383 | $277,107,636 |
| Restricted cash | $ 2,250,000 | $ — | $ — |
| Interest receivable | 13,215,237 | 3,308,791 | 3,179,438 |
| Receivable for investments sold | 84,466 | — | 539,230 |
| Trustees' deferred compensation plan | 281,883 | 94,677 | 69,251 |
| Total assets | $1,161,005,304 | $349,442,851 | $280,895,555 |
| Liabilities | | | |
| Payable for floating rate notes issued | $ 334,370,159 | $ 91,609,411 | $ 86,414,937 |
| Payable for when-issued securities | 6,628,468 | — | — |
| Due to custodian | 3,241,995 | 862,252 | 425,073 |
| Payable to affiliates: | | | |
| Investment adviser fee | 585,776 | 182,062 | 142,881 |
| Trustees' deferred compensation plan | 281,883 | 94,677 | 69,251 |
| Interest expense and fees payable | 3,669,249 | 651,748 | 848,285 |
| Accrued expenses | 279,047 | 124,852 | 102,086 |
| Total liabilities | $ 349,056,577 | $ 93,525,002 | $ 88,002,513 |
| Net Assets | $ 811,948,727 | $255,917,849 | $192,893,042 |
| Sources of Net Assets | | | |
| Common shares, $0.01 par value, unlimited number of shares authorized | $ 711,532 | $ 246,729 | $ 179,613 |
| Additional paid-in capital | 881,899,948 | 307,340,617 | 227,918,886 |
| Accumulated loss | (70,662,753) | (51,669,497) | (35,205,457) |
| Net Assets | $ 811,948,727 | $255,917,849 | $192,893,042 |
| Common Shares Issued and Outstanding | 71,153,184 | 24,672,939 | 17,961,289 |
| Net Asset Value Per Common Share | | | |
| Net assets ÷ common shares issued and outstanding | $ 11.41 | $ 10.37 | $ 10.74 |
24
See Notes to Financial Statements.
Eaton Vance
Municipal Bond Funds
March 31, 2024
Statements of Operations (Unaudited)
| | Six Months Ended March 31, 2024 |
| | Municipal Fund | California Fund | New York Fund |
| Investment Income | | | |
| Interest income | $ 25,415,621 | $ 7,257,195 | $ 5,900,572 |
| Total investment income | $25,415,621 | $ 7,257,195 | $ 5,900,572 |
| Expenses | | | |
| Investment adviser fee | $ 3,430,707 | $ 1,062,858 | $ 824,691 |
| Trustees’ fees and expenses | 37,763 | 11,835 | 9,286 |
| Custodian fee | 95,592 | 29,902 | 24,957 |
| Transfer and dividend disbursing agent fees | 9,697 | 9,077 | 9,022 |
| Legal and accounting services | 71,565 | 62,568 | 58,132 |
| Printing and postage | 84,773 | 17,000 | 14,417 |
| Interest expense and fees | 6,984,651 | 2,005,572 | 1,734,651 |
| Miscellaneous | 48,267 | 33,277 | 28,227 |
| Total expenses | $10,763,015 | $ 3,232,089 | $ 2,703,383 |
| Net investment income | $14,652,606 | $ 4,025,106 | $ 3,197,189 |
| Realized and Unrealized Gain (Loss) | | | |
| Net realized gain (loss): | | | |
| Investment transactions | $ (825,906) | $ (1,950,531) | $ (2,410,968) |
| Net realized loss | $ (825,906) | $ (1,950,531) | $ (2,410,968) |
| Change in unrealized appreciation (depreciation): | | | |
| Investments | $ 65,302,422 | $ 22,671,551 | $ 21,421,502 |
| Net change in unrealized appreciation (depreciation) | $65,302,422 | $22,671,551 | $21,421,502 |
| Net realized and unrealized gain | $64,476,516 | $20,721,020 | $19,010,534 |
| Net increase in net assets from operations | $79,129,122 | $24,746,126 | $22,207,723 |
25
See Notes to Financial Statements.
Eaton Vance
Municipal Bond Funds
March 31, 2024
Statements of Changes in Net Assets
| | Six Months Ended March 31, 2024 (Unaudited) |
| | Municipal Fund | California Fund | New York Fund |
| Increase (Decrease) in Net Assets | | | |
| From operations: | | | |
| Net investment income | $ 14,652,606 | $ 4,025,106 | $ 3,197,189 |
| Net realized loss | (825,906) | (1,950,531) | (2,410,968) |
| Net change in unrealized appreciation (depreciation) | 65,302,422 | 22,671,551 | 21,421,502 |
| Net increase in net assets from operations | $ 79,129,122 | $ 24,746,126 | $ 22,207,723 |
| Distributions to common shareholders | $ (17,098,110)* | $ (4,996,270)* | $ (3,723,375)* |
| Net increase in net assets | $ 62,031,012 | $ 19,749,856 | $ 18,484,348 |
| Net Assets | | | |
| At beginning of period | $ 749,917,715 | $ 236,167,993 | $ 174,408,694 |
| At end of period | $811,948,727 | $255,917,849 | $192,893,042 |
| * | A portion of the distributions may be deemed a tax return of capital at year-end. See Note 2. |
26
See Notes to Financial Statements.
Eaton Vance
Municipal Bond Funds
March 31, 2024
Statements of Changes in Net Assets — continued
| | Year Ended September 30, 2023 |
| | Municipal Fund | California Fund | New York Fund |
| Increase (Decrease) in Net Assets | | | |
| From operations: | | | |
| Net investment income | $ 27,875,026 | $ 8,112,455 | $ 6,233,773 |
| Net realized loss | (23,640,552) | (5,141,517) | (6,371,605) |
| Net change in unrealized appreciation (depreciation) | 3,261,365 | 2,102,260 | 2,901,954 |
| Net increase in net assets from operations | $ 7,495,839 | $ 5,073,198 | $ 2,764,122 |
| Distributions to common shareholders | $ (27,527,620) | $ (7,743,226) | $ (6,401,404) |
| Tax return of capital to common shareholders | $ (2,411,030) | $ (1,213,051) | $ — |
| Capital share transactions: | | | |
| Cost of shares repurchased (see Note 5) | $ (8,115,776) | $ — | $ — |
| Net decrease in net assets from capital share transactions | $ (8,115,776) | $ — | $ — |
| Net decrease in net assets | $ (30,558,587) | $ (3,883,079) | $ (3,637,282) |
| Net Assets | | | |
| At beginning of year | $ 780,476,302 | $ 240,051,072 | $ 178,045,976 |
| At end of year | $749,917,715 | $236,167,993 | $174,408,694 |
27
See Notes to Financial Statements.
Eaton Vance
Municipal Bond Funds
March 31, 2024
Statements of Cash Flows (Unaudited)
| | Six Months Ended March 31, 2024 |
| | Municipal Fund | California Fund | New York Fund |
| Cash Flows From Operating Activities | | | |
| Net increase in net assets from operations | $ 79,129,122 | $ 24,746,126 | $ 22,207,723 |
| Adjustments to reconcile net increase in net assets from operations to net cash provided by operating activities: | | | |
| Investments purchased | (134,009,491) | (61,058,644) | (49,509,739) |
| Investments sold | 169,335,871 | 65,636,427 | 57,753,903 |
| Net amortization/accretion of premium (discount) | (901,500) | 552,681 | 181,578 |
| Decrease (increase) in interest receivable | (764,050) | 106,924 | (193,573) |
| Decrease in Trustees’ deferred compensation plan | 7,247 | 1,288 | 1,650 |
| Increase (decrease) in payable to affiliate for investment adviser fee | (12,236) | 4,288 | (257) |
| Increase (decrease) in interest expense and fees payable | 225,224 | (134,736) | 76,013 |
| Decrease in payable to affiliate for Trustees' deferred compensation plan | (7,247) | (1,288) | (1,650) |
| Decrease in accrued expenses | (25) | (34,326) | (36,693) |
| Net change in unrealized (appreciation) depreciation from investments | (65,302,422) | (22,671,551) | (21,421,502) |
| Net realized loss from investments | 825,906 | 1,950,531 | 2,410,968 |
| Net cash provided by operating activities | $ 48,526,399 | $ 9,097,720 | $ 11,468,421 |
| Cash Flows From Financing Activities | | | |
| Cash distributions paid to common shareholders | $ (17,098,110) | $ (4,996,270) | $ (3,723,375) |
| Proceeds from secured borrowings | 8,000,000 | 17,600,000 | — |
| Repayment of secured borrowings | (40,440,000) | (22,340,000) | (8,000,000) |
| Increase (decrease) in due to custodian | 1,011,711 | (11,450) | 254,954 |
| Net cash used in financing activities | $ (48,526,399) | $ (9,747,720) | $(11,468,421) |
| Net decrease in cash and restricted cash | $ — | $ (650,000) | $ — |
| Cash and restricted cash at beginning of period | $ 2,250,000 | $ 650,000 | $ — |
| Cash and restricted cash at end of period | $ 2,250,000 | $ — | $ — |
| Supplemental disclosure of cash flow information: | | | |
| Cash paid for interest and fees | $ 6,759,427 | $ 2,140,308 | $ 1,658,638 |
28
See Notes to Financial Statements.
Eaton Vance
Municipal Bond Funds
March 31, 2024
| | Municipal Fund |
| | Six Months Ended
March 31, 2024
(Unaudited) | Year Ended September 30, |
| | 2023 | 2022 | 2021 | 2020 | 2019 |
| Net asset value — Beginning of period | $ 10.540 | $ 10.850 | $ 13.950 | $ 14.050 | $ 13.980 | $ 12.940 |
| Income (Loss) From Operations | | | | | | |
| Net investment income(1) | $ 0.206 | $ 0.390 | $ 0.522 | $ 0.593 | $ 0.571 | $ 0.522 |
| Net realized and unrealized gain (loss) | 0.904 | (0.296) | (3.073) | (0.098) | 0.033 | 0.982 |
| Total income (loss) from operations | $ 1.110 | $ 0.094 | $ (2.551) | $ 0.495 | $ 0.604 | $ 1.504 |
| Less Distributions | | | | | | |
| From net investment income | $ (0.240)* | $ (0.385) | $ (0.549) | $ (0.595) | $ (0.563) | $ (0.517) |
| Tax return of capital | — | (0.034) | — | — | — | — |
| Total distributions | $ (0.240) | $ (0.419) | $ (0.549) | $ (0.595) | $ (0.563) | $ (0.517) |
| Anti-dilutive effect of share repurchase program (see Note 5)(1) | $ — | $ 0.015 | $ — | $ — | $ — | $ 0.022 |
| Discount on tender offer(1) | $ — | $ — | $ — | $ — | $ 0.029 | $ 0.031 |
| Net asset value — End of period | $ 11.410 | $ 10.540 | $ 10.850 | $ 13.950 | $ 14.050 | $ 13.980 |
| Market value — End of period | $ 10.350 | $ 8.960 | $ 9.680 | $ 13.380 | $ 13.170 | $ 12.960 |
| Total Investment Return on Net Asset Value(2) | 10.88% (3) | 1.30% | (18.50)% | 3.75% | 4.99% | 12.72% |
| Total Investment Return on Market Value(2) | 18.31% (3) | (3.47)% | (24.19)% | 6.16% | 6.15% | 17.28% |
| Ratios/Supplemental Data | | | | | | |
| Net assets, end of period (000’s omitted) | $811,949 | $749,918 | $780,476 | $1,003,822 | $1,011,234 | $1,114,236 |
| Ratios (as a percentage of average daily net assets): | | | | | | |
| Expenses excluding interest and fees | 0.95% (4) | 1.05% | 1.09% | 1.09% | 1.13% | 1.11% |
| Interest and fee expense(5) | 1.75% (4) | 2.12% | 0.78% | 0.41% | 1.05% | 1.51% |
| Total expenses | 2.70% (4) | 3.17% | 1.87% | 1.50% | 2.18% | 2.62% |
| Net investment income | 3.67% (4) | 3.44% | 4.12% | 4.18% | 4.09% | 3.89% |
| Portfolio Turnover | 11% (3) | 52% | 35% | 10% | 7% | 18% |
| (1) | Computed using average shares outstanding. |
| (2) | Returns are historical and are calculated by determining the percentage change in net asset value or market value with all distributions reinvested. Distributions are assumed to be reinvested at prices obtained under the Fund's dividend reinvestment plan. |
| (3) | Not annualized. |
| (4) | Annualized. |
| (5) | Interest and fee expense relates to the liability for floating rate notes issued in conjunction with residual interest bond transactions (see Note 1G). |
| * | A portion of the distributions may be deemed a tax return of capital at year-end. See Note 2. |
29
See Notes to Financial Statements.
Eaton Vance
Municipal Bond Funds
March 31, 2024
Financial Highlights — continued
| | California Fund |
| | Six Months Ended
March 31, 2024
(Unaudited) | Year Ended September 30, |
| | 2023 | 2022 | 2021 | 2020 | 2019 |
| Net asset value — Beginning of period | $ 9.570 | $ 9.730 | $ 12.470 | $ 12.660 | $ 12.570 | $ 11.780 |
| Income (Loss) From Operations | | | | | | |
| Net investment income(1) | $ 0.163 | $ 0.329 | $ 0.434 | $ 0.503 | $ 0.473 | $ 0.438 |
| Net realized and unrealized gain (loss) | 0.840 | (0.126) | (2.730) | (0.190) | 0.080 | 0.802 |
| Total income (loss) from operations | $ 1.003 | $ 0.203 | $ (2.296) | $ 0.313 | $ 0.553 | $ 1.240 |
| Less Distributions | | | | | | |
| From net investment income | $ (0.203)* | $ (0.314) | $ (0.448) | $ (0.503) | $ (0.463) | $ (0.454) |
| Tax return of capital | — | (0.049) | (0.011) | — | — | (0.020) |
| Total distributions | $ (0.203) | $ (0.363) | $ (0.459) | $ (0.503) | $ (0.463) | $ (0.474) |
| Anti-dilutive effect of share repurchase program (see Note 5)(1) | $ — | $ — | $ 0.015 | $ — | $ — | $ 0.024 |
| Net asset value — End of period | $ 10.370 | $ 9.570 | $ 9.730 | $ 12.470 | $ 12.660 | $ 12.570 |
| Market value — End of period | $ 9.450 | $ 8.120 | $ 8.510 | $ 11.940 | $ 11.360 | $ 11.330 |
| Total Investment Return on Net Asset Value(2) | 10.81% (3) | 2.50% | (18.37)% | 2.78% | 4.93% | 11.54% |
| Total Investment Return on Market Value(2) | 19.02% (3) | (0.56)% | (25.43)% | 9.67% | 4.46% | 18.91% |
| Ratios/Supplemental Data | | | | | | |
| Net assets, end of period (000’s omitted) | $255,918 | $236,168 | $240,051 | $311,635 | $316,361 | $314,277 |
| Ratios (as a percentage of average daily net assets): | | | | | | |
| Expenses excluding interest and fees | 0.98% (4) | 1.07% | 1.14% | 1.11% | 1.12% | 1.15% |
| Interest and fee expense(5) | 1.60% (4) | 1.97% | 0.85% | 0.40% | 1.00% | 1.59% |
| Total expenses | 2.58% (4) | 3.04% | 1.99% | 1.51% | 2.12% | 2.74% |
| Net investment income | 3.21% (4) | 3.22% | 3.81% | 3.96% | 3.76% | 3.61% |
| Portfolio Turnover | 13% (3) | 37% | 43% | 19% | 20% | 17% |
| (1) | Computed using average shares outstanding. |
| (2) | Returns are historical and are calculated by determining the percentage change in net asset value or market value with all distributions reinvested. Distributions are assumed to be reinvested at prices obtained under the Fund's dividend reinvestment plan. |
| (3) | Not annualized. |
| (4) | Annualized. |
| (5) | Interest and fee expense relates to the liability for floating rate notes issued in conjunction with residual interest bond transactions (see Note 1G). |
| * | A portion of the distributions may be deemed a tax return of capital at year-end. See Note 2. |
30
See Notes to Financial Statements.
Eaton Vance
Municipal Bond Funds
March 31, 2024
Financial Highlights — continued
| | New York Fund |
| | Six Months Ended
March 31, 2024
(Unaudited) | Year Ended September 30, |
| | 2023 | 2022 | 2021 | 2020 | 2019 |
| Net asset value — Beginning of period | $ 9.710 | $ 9.910 | $ 13.270 | $ 13.250 | $ 13.480 | $ 12.770 |
| Income (Loss) From Operations | | | | | | |
| Net investment income(1) | $ 0.178 | $ 0.347 | $ 0.424 | $ 0.492 | $ 0.490 | $ 0.476 |
| Net realized and unrealized gain (loss) | 1.059 | (0.191) | (3.377) | 0.037 | (0.236) | 0.745 |
| Total income (loss) from operations | $ 1.237 | $ 0.156 | $ (2.953) | $ 0.529 | $ 0.254 | $ 1.221 |
| Less Distributions | | | | | | |
| From net investment income | $ (0.207)* | $ (0.356) | $ (0.418) | $ (0.498) | $ (0.484) | $ (0.497) |
| Tax return of capital | — | — | — | (0.011) | — | (0.014) |
| Total distributions | $ (0.207) | $ (0.356) | $ (0.418) | $ (0.509) | $ (0.484) | $ (0.511) |
| Anti-dilutive effect of share repurchase program (see Note 5)(1) | $ — | $ — | $ 0.011 | $ — | $ — | $ — |
| Net asset value — End of period | $ 10.740 | $ 9.710 | $ 9.910 | $ 13.270 | $ 13.250 | $ 13.480 |
| Market value — End of period | $ 9.710 | $ 8.290 | $ 8.450 | $ 12.270 | $ 11.800 | $ 12.440 |
| Total Investment Return on Net Asset Value(2) | 13.05% (3) | 1.82% | (22.30)% | 4.34% | 2.37% | 10.25% |
| Total Investment Return on Market Value(2) | 19.72% (3) | 1.95% | (28.32)% | 8.30% | (1.21)% | 17.47% |
| Ratios/Supplemental Data | | | | | | |
| Net assets, end of period (000’s omitted) | $192,893 | $174,409 | $178,046 | $240,448 | $240,042 | $244,319 |
| Ratios (as a percentage of average daily net assets): | | | | | | |
| Expenses excluding interest and fees | 1.02% (4) | 1.11% | 1.07% | 1.06% | 1.09% | 1.10% |
| Interest and fee expense(5) | 1.84% (4) | 2.33% | 0.66% | 0.35% | 0.93% | 1.38% |
| Total expenses | 2.86% (4) | 3.44% | 1.73% | 1.41% | 2.02% | 2.48% |
| Net investment income | 3.39% (4) | 3.29% | 3.55% | 3.65% | 3.68% | 3.63% |
| Portfolio Turnover | 14% (3) | 54% | 61% | 15% | 31% | 25% |
| (1) | Computed using average shares outstanding. |
| (2) | Returns are historical and are calculated by determining the percentage change in net asset value or market value with all distributions reinvested. Distributions are assumed to be reinvested at prices obtained under the Fund's dividend reinvestment plan. |
| (3) | Not annualized. |
| (4) | Annualized. |
| (5) | Interest and fee expense relates to the liability for floating rate notes issued in conjunction with residual interest bond transactions (see Note 1G). |
| * | A portion of the distributions may be deemed a tax return of capital at year-end. See Note 2. |
31
See Notes to Financial Statements.
Eaton Vance
Municipal Bond Funds
March 31, 2024
Notes to Financial Statements (Unaudited)
1 Significant Accounting Policies
Eaton Vance Municipal Bond Fund (Municipal Fund), Eaton Vance California Municipal Bond Fund (California Fund) and Eaton Vance New York Municipal Bond Fund (New York Fund), (each individually referred to as the Fund, and collectively, the Funds), are Massachusetts business trusts registered under the Investment Company Act of 1940, as amended (the 1940 Act). New York Fund is a as non-diversified, closed-end management investment company. Municipal Fund and California Fund are diversified closed-end management investment companies. The Funds' investment objective is to provide current income exempt from regular federal income tax and, in state specific funds, taxes in their specified state and city (if any).
The following is a summary of significant accounting policies of the Funds. The policies are in conformity with accounting principles generally accepted in the United States of America (U.S. GAAP). Each Fund is an investment company and follows accounting and reporting guidance in the Financial Accounting Standards Board (FASB) Accounting Standards Codification Topic 946.
A Investment Valuation—The following methodologies are used to determine the market value or fair value of investments.
Debt Obligations. Debt obligations are generally valued on the basis of valuations provided by third party pricing services, as derived from such services’ pricing models. Inputs to the models may include, but are not limited to, reported trades, executable bid and ask prices, broker/dealer quotations, prices or yields of securities with similar characteristics, interest rates, anticipated prepayments, benchmark curves or information pertaining to the issuer, as well as industry and economic events. The pricing services may use a matrix approach, which considers information regarding securities with similar characteristics to determine the valuation for a security. Short-term debt obligations purchased with a remaining maturity of sixty days or less for which a valuation from a third party pricing service is not readily available may be valued at amortized cost, which approximates fair value.
Fair Valuation. In connection with Rule 2a-5 of the 1940 Act, the Trustees have designated a Fund’s investment adviser as its valuation designee. Investments for which valuations or market quotations are not readily available or are deemed unreliable are valued by the investment adviser, as valuation designee, at fair value using methods that most fairly reflect the security’s “fair value”, which is the amount that a Fund might reasonably expect to receive for the security upon its current sale in the ordinary course. Each such determination is based on a consideration of relevant factors, which are likely to vary from one pricing context to another. These factors may include, but are not limited to, the type of security, the existence of any contractual restrictions on the security’s disposition, the price and extent of public trading in similar securities of the issuer or of comparable companies or entities, quotations or relevant information obtained from broker/dealers or other market participants, information obtained from the issuer, analysts, and/or the appropriate stock exchange (for exchange-traded securities), an analysis of the company’s or entity’s financial statements, and an evaluation of the forces that influence the issuer and the market(s) in which the security is purchased and sold.
B Investment Transactions and Related Income—Investment transactions for financial statement purposes are accounted for on a trade date basis. Realized gains and losses on investments sold are determined on the basis of identified cost. Interest income is recorded on the basis of interest accrued, adjusted for amortization of premium or accretion of discount.
C Federal Taxes—Each Fund’s policy is to comply with the provisions of the Internal Revenue Code applicable to regulated investment companies and to distribute to shareholders each year substantially all of its taxable, if any, and tax-exempt net investment income, and all or substantially all of its net realized capital gains. Accordingly, no provision for federal income or excise tax is necessary. Each Fund intends to satisfy conditions which will enable it to designate distributions from the interest income generated by its investments in non-taxable municipal securities, which are exempt from regular federal income tax when received by each Fund, as exempt-interest dividends. The portion of such interest, if any, earned on private activity bonds issued after August 7, 1986, may be considered a tax preference item to shareholders.
As of March 31, 2024, the Funds had no uncertain tax positions that would require financial statement recognition, de-recognition, or disclosure. Each Fund files a U.S. federal income tax return annually after its fiscal year-end, which is subject to examination by the Internal Revenue Service for a period of three years from the date of filing.
D Legal Fees— Legal fees and other related expenses incurred as part of negotiations of the terms and requirement of capital infusions, or that are expected to result in the restructuring of, or a plan of reorganization for, an investment are recorded as realized losses. Ongoing expenditures to protect or enhance an investment are treated as operating expenses.
E Use of Estimates—The preparation of the financial statements in conformity with U.S. GAAP requires management to make estimates and assumptions that affect the reported amounts of assets and liabilities at the date of the financial statements and the reported amounts of income and expense during the reporting period. Actual results could differ from those estimates.
F Indemnifications—Under each Fund’s organizational documents, its officers and Trustees may be indemnified against certain liabilities and expenses arising out of the performance of their duties to each Fund. Under Massachusetts law, if certain conditions prevail, shareholders of a Massachusetts business trust (such as a Fund) could be deemed to have personal liability for the obligations of the Fund. However, each Fund’s Declaration of Trust contains an express disclaimer of liability on the part of Fund shareholders and the By-laws provide that the Fund shall assume, upon request by the shareholder, the defense on behalf of any Fund shareholders. Moreover, the By-laws also provide for indemnification out of Fund property of any shareholder held personally liable solely by reason of being or having been a shareholder for all loss or expense arising from such liability. Additionally, in
Eaton Vance
Municipal Bond Funds
March 31, 2024
Notes to Financial Statements (Unaudited) — continued
the normal course of business, each Fund enters into agreements with service providers that may contain indemnification clauses. Each Fund’s maximum exposure under these arrangements is unknown as this would involve future claims that may be made against each Fund that have not yet occurred.
G Floating Rate Notes Issued in Conjunction with Securities Held—The Funds may invest in residual interest bonds, also referred to as inverse floating rate securities, whereby a Fund may sell a variable or fixed rate bond for cash to a Special-Purpose Vehicle (the SPV), (which is generally organized as a trust), while at the same time, buying a residual interest in the assets and cash flows of the SPV. The bond is deposited into the SPV with the same CUSIP number as the bond sold to the SPV by the Fund, and which may have been, but is not required to be, the bond purchased from the Fund (the Bond). The SPV also issues floating rate notes (Floating Rate Notes) which are sold to third-parties. The residual interest bond held by a Fund gives the Fund the right (1) to cause the holders of the Floating Rate Notes to generally tender their notes at par, and (2) to have the Bond held by the SPV transferred to the Fund, thereby terminating the SPV. Should the Fund exercise such right, it would generally pay the SPV the par amount due on the Floating Rate Notes and exchange the residual interest bond for the underlying Bond. Pursuant to generally accepted accounting principles for transfers and servicing of financial assets and extinguishment of liabilities, the Funds account for the transaction described above as a secured borrowing by including the Bond in their Portfolio of Investments and the Floating Rate Notes as a liability under the caption “Payable for floating rate notes issued” in their Statement of Assets and Liabilities. The Floating Rate Notes have interest rates that generally reset weekly and their holders have the option to tender their notes to the SPV for redemption at par at each reset date. Accordingly, the fair value of the payable for floating rate notes issued approximates its carrying value. If measured at fair value, the payable for floating rate notes would have been considered as Level 2 in the fair value hierarchy (see Note 6) at March 31, 2024. Interest expense related to a Fund’s liability with respect to Floating Rate Notes is recorded as incurred. The SPV may be terminated by the Fund, as noted above, or by the occurrence of certain termination events as defined in the trust agreement, such as a downgrade in the credit quality of the underlying Bond, bankruptcy of or payment failure by the issuer of the underlying Bond, the inability to remarket Floating Rate Notes that have been tendered due to insufficient buyers in the market, or the failure by the SPV to obtain renewal of the liquidity agreement under which liquidity support is provided for the Floating Rate Notes up to one year. At March 31, 2024, the amounts of the Funds’ Floating Rate Notes and related interest rates and collateral were as follows:
| | Municipal
Fund | California
Fund | New York
Fund |
| Floating Rate Notes Outstanding | $334,370,159 | $ 91,609,411 | $ 86,414,937 |
| Interest Rate or Range of Interest Rates (%) | 3.64 - 3.94 | 3.65 - 3.72 | 3.67 - 3.84 |
| Collateral for Floating Rate Notes Outstanding | $454,374,565 | $121,933,009 | $114,758,670 |
In addition, at March 31, 2024, Municipal Fund pledged cash collateral of $2,250,000 for the benefit of a liquidity provider for certain Floating Rate Notes. Such collateral is reflected as restricted cash on the Statement of Assets and Liabilities.
For the six months ended March 31, 2024, the Funds’ average settled Floating Rate Notes outstanding and the average interest rate (annualized) including fees were as follows:
| | Municipal
Fund | California
Fund | New York
Fund |
| Average Floating Rate Notes Outstanding | $345,035,191 | $101,280,109 | $ 86,245,000 |
| Average Interest Rate | 4.05% | 3.96% | 4.02% |
In certain circumstances, the Funds may enter into shortfall and forbearance agreements with brokers by which a Fund agrees to reimburse the broker for the difference between the liquidation value of the Bond held by the SPV and the liquidation value of the Floating Rate Notes, as well as any shortfalls in interest cash flows. The Funds had no shortfalls as of March 31, 2024.
The Funds may also purchase residual interest bonds in a secondary market transaction without first owning the underlying bond. Such transactions are not required to be treated as secured borrowings. Shortfall agreements, if any, related to residual interest bonds purchased in a secondary market transaction are disclosed in the Portfolio of Investments.
The Funds' investment policies and restrictions expressly permit investments in residual interest bonds. Such bonds typically offer the potential for yields exceeding the yields available on fixed rate bonds with comparable credit quality and maturity. These securities tend to underperform the market for fixed rate bonds in a rising long-term interest rate environment, but tend to outperform the market for fixed rate bonds when long-term interest rates decline. The value and income of residual interest bonds are generally more volatile than that of a fixed rate bond. The Funds' investment policies do not allow the Funds to borrow money except as permitted by the 1940 Act. Effective August 19, 2022, the Funds began operating under Rule 18f-4 under the 1940 Act, which, among other things, governs the use of derivative investments and certain financing transactions by registered investment companies. Consistent with Rule 18f-4, the Funds may treat their investments in residual interest bonds and similar financing transactions as subject to the asset
Eaton Vance
Municipal Bond Funds
March 31, 2024
Notes to Financial Statements (Unaudited) — continued
coverage requirements of Section 18 of the 1940 Act, or as derivatives transactions subject to the Funds' value-at-risk (VaR)-based limits on leverage risk. Effective October 11, 2023, the Funds have opted to treat such investments as derivatives transactions. The Funds may change this approach at any time. Residual interest bonds held by the Funds are securities exempt from registration under Rule 144A of the Securities Act of 1933.
H When-Issued Securities and Delayed Delivery Transactions—The Funds may purchase securities on a delayed delivery or when-issued basis. Payment and delivery may take place after the customary settlement period for that security. At the time the transaction is negotiated, the price of the security that will be delivered is fixed. The Funds maintain cash and/or security positions for these commitments such that sufficient liquid assets will be available to make payments upon settlement. Securities purchased on a delayed delivery or when-issued basis are marked-to-market daily and begin earning interest on settlement date. Such security purchases are subject to the risk that when delivered they will be worth less than the agreed upon payment price. Losses may also arise if the counterparty does not perform under the contract.
I Interim Financial Statements—The interim financial statements relating to March 31, 2024 and for the six months then ended have not been audited by an independent registered public accounting firm, but in the opinion of the Funds' management, reflect all adjustments, consisting only of normal recurring adjustments, necessary for the fair presentation of the financial statements.
2 Distributions to Shareholders and Income Tax Information
Each Fund intends to make monthly distributions of net investment income to common shareholders. In addition, at least annually, each Fund intends to distribute all or substantially all of its net realized capital gains. Distributions are recorded on the ex-dividend date. Distributions to shareholders are determined in accordance with income tax regulations, which may differ from U.S. GAAP. As required by U.S. GAAP, only distributions in excess of tax basis earnings and profits are reported in the financial statements as a return of capital. Permanent differences between book and tax accounting relating to distributions are reclassified to paid-in capital. For tax purposes, distributions from short-term capital gains are considered to be from ordinary income. Distributions in any year may include a return of capital component. For the six months ended March 31, 2024, the amount of distributions estimated to be a tax return of capital were approximately $2,589,000, $987,000 and $555,000 for Municipal Fund, California Fund and New York Fund, respectively. The final determination of tax characteristics of a Fund's distributions will occur at the end of the year, at which time it will be reported to the shareholders.
At September 30, 2023, the following Funds, for federal income tax purposes, had deferred capital losses which would reduce the respective Fund’s taxable income arising from future net realized gains on investment transactions, if any, to the extent permitted by the Internal Revenue Code, and thus would reduce the amount of distributions to shareholders, which would otherwise be necessary to relieve the Funds of any liability for federal income or excise tax. The deferred capital losses are treated as arising on the first day of a Fund’s next taxable year and retain the same short-term or long-term character as when originally deferred. The amounts of the deferred capital losses are as follows:
| | Municipal
Fund | California
Fund | New York
Fund |
| Deferred capital losses: | | | |
| Short-term | $66,373,889 | $21,602,827 | $15,695,787 |
| Long-term | $30,653,215 | $27,608,665 | $17,601,991 |
The cost and unrealized appreciation (depreciation) of investments of each Fund at March 31, 2024, as determined on a federal income tax basis, were as follows:
| | Municipal
Fund | California
Fund | New York
Fund |
| Aggregate cost | $781,194,223 | $254,020,193 | $190,006,065 |
| Gross unrealized appreciation | $ 38,932,610 | $ 8,006,379 | $ 6,280,608 |
| Gross unrealized depreciation | (9,323,274) | (7,596,600) | (5,593,974) |
| Net unrealized appreciation | $ 29,609,336 | $ 409,779 | $ 686,634 |
Eaton Vance
Municipal Bond Funds
March 31, 2024
Notes to Financial Statements (Unaudited) — continued
3 Investment Adviser Fee and Other Transactions with Affiliates
The investment adviser fee is earned by Eaton Vance Management (EVM), an indirect, wholly-owned subsidiary of Morgan Stanley, as compensation for investment advisory services rendered to each Fund. The investment adviser fee is computed at an annual rate of 0.60% of each Fund’s average weekly gross assets and is payable monthly. Gross assets of a Fund are calculated by deducting accrued liabilities of the Fund except (i) the principal amount of any indebtedness for money borrowed, including debt securities issued by the Fund and the amount of floating-rate notes included as a liability in the Fund’s Statement of Assets and Liabilities of up to $801,875,000 for Municipal Fund, $228,750,000 for California Fund and $165,000,000 for New York Fund, and (ii) the amount of any outstanding preferred shares issued by the Fund. EVM also serves as the administrator of each Fund, but receives no compensation. For the six months ended March 31, 2024, the investment adviser fees were as follows:
| | Municipal
Fund | California
Fund | New York
Fund |
| Investment Adviser Fee | $3,430,707 | $1,062,858 | $824,691 |
Trustees and officers of the Funds who are members of EVM’s organization receive remuneration for their services to the Funds out of the investment adviser fee. Trustees of the Funds who are not affiliated with EVM may elect to defer receipt of all or a percentage of their annual fees in accordance with the terms of the Trustees Deferred Compensation Plan. Certain officers and Trustees of the Funds are officers of EVM.
4 Purchases and Sales of Investments
Purchases and sales of investments, other than short-term obligations, for the six months ended March 31, 2024 were as follows:
| | Municipal
Fund | California
Fund | New York
Fund |
| Purchases | $126,387,993 | $47,193,518 | $37,991,652 |
| Sales | $145,508,514 | $65,636,427 | $42,048,448 |
5 Common Shares of Beneficial Interest
The Funds may issue common shares pursuant to their dividend reinvestment plans. There were no common shares issued by the Funds for the six months ended March 31, 2024 and the year ended September 30, 2023 pursuant to such plans.
In November 2013, the Board of Trustees initially approved a share repurchase program for the Funds. Pursuant to the reauthorization of the share repurchase program by the Board of Trustees in March 2019, each Fund is authorized to repurchase up to 10% of its common shares outstanding as of the last day of the prior calendar year at market prices when shares are trading at a discount to net asset value (NAV). The share repurchase program does not obligate a Fund to purchase a specific amount of shares. There were no repurchases of common shares by the Funds for the six months ended March 31, 2024. During the year ended September 30, 2023, the number, cost (including brokerage commissions), average price per share and weighted average discount per share to NAV of common shares repurchased, were as follows:
| | Year Ended September 30, 2023 |
| | Municipal
Fund |
| Common shares repurchased | 800,000 |
| Cost, including brokerage commissions, of common shares repurchased | $8,115,776 |
| Average price per share | $ 10.14 |
| Weighted average discount per share to NAV | 11.58% |
There were no repurchases of common shares by California Fund and New York Fund for the year ended September 30, 2023.
Eaton Vance
Municipal Bond Funds
March 31, 2024
Notes to Financial Statements (Unaudited) — continued
At March 31, 2024, according to the filings made on Schedule 13D and 13G pursuant to Sections 13(d) and 13(g) of the Securities Exchange Act of 1934, as amended, one entity owned 20.0% of Municipal Fund's common shares, three affiliated entities and two affiliated entities each owned more than 10% of California Fund's common shares aggregating 23.6%, and three affiliated entities and two affiliated entities each owned more than 10% of New York Fund's common shares aggregating 27.7%.
6 Fair Value Measurements
Under generally accepted accounting principles for fair value measurements, a three-tier hierarchy to prioritize the assumptions, referred to as inputs, is used in valuation techniques to measure fair value. The three-tier hierarchy of inputs is summarized in the three broad levels listed below.
| • | Level 1 – quoted prices in active markets for identical investments |
| • | Level 2 – other significant observable inputs (including quoted prices for similar investments, interest rates, prepayment speeds, credit risk, etc.) |
| • | Level 3 – significant unobservable inputs (including a fund's own assumptions in determining the fair value of investments) |
In cases where the inputs used to measure fair value fall in different levels of the fair value hierarchy, the level disclosed is determined based on the lowest level input that is significant to the fair value measurement in its entirety. The inputs or methodology used for valuing securities are not necessarily an indication of the risk associated with investing in those securities.
At March 31, 2024, the hierarchy of inputs used in valuing the Funds' investments, which are carried at fair value, were as follows:
| Municipal Fund | | | | |
| Asset Description | Level 1 | Level 2 | Level 3 | Total |
| Corporate Bonds | $ — | $ 8,763,643 | $ — | $ 8,763,643 |
| Tax-Exempt Mortgage-Backed Securities | — | 2,834,934 | — | 2,834,934 |
| Tax-Exempt Municipal Obligations | — | 1,132,524,270 | — | 1,132,524,270 |
| Taxable Municipal Obligations | — | 347,657 | — | 347,657 |
| Trust Units | — | 703,214 | — | 703,214 |
| Total Investments | $ — | $1,145,173,718 | $ — | $1,145,173,718 |
| California Fund | | | | |
| Asset Description | Level 1 | Level 2 | Level 3 | Total |
| Tax-Exempt Municipal Obligations | $ — | $ 330,890,779 | $ — | $ 330,890,779 |
| Taxable Municipal Obligations | — | 14,344,922 | — | 14,344,922 |
| Trust Units | — | 803,682 | — | 803,682 |
| Total Investments | $ — | $ 346,039,383 | $ — | $ 346,039,383 |
| New York Fund | | | | |
| Asset Description | Level 1 | Level 2 | Level 3 | Total |
| Corporate Bonds | $ — | $ 2,229,571 | $ — | $ 2,229,571 |
| Tax-Exempt Municipal Obligations | — | 269,424,203 | — | 269,424,203 |
| Taxable Municipal Obligations | — | 4,650,180 | — | 4,650,180 |
| Trust Units | — | 803,682 | — | 803,682 |
| Total Investments | $ — | $ 277,107,636 | $ — | $ 277,107,636 |
Eaton Vance
Municipal Bond Funds
March 31, 2024
Notes to Financial Statements (Unaudited) — continued
7 Subsequent Event
On May 6, 2024, Municipal Fund announced that its Board of Trustees approved a cash tender offer for up to 20% of its outstanding common shares at a price per share equal to 98% of the Fund's net asset value per share as of the close of regular trading on the New York Stock Exchange on the date the tender offer expires. The tender offer is expected to begin on or about June 7, 2024 and expire at 5:00 P.M. Eastern Time on or about July 9, 2024, unless extended.
The Board of Trustees also authorized Municipal Fund to conduct two conditional cash tender offers, for up to 5% of Municipal Fund's outstanding common shares at the tender price as of the close of regular trading on the New York Stock Exchange on the date the tender offer expires, to follow the initial tender offer, provided certain conditions are met.
Eaton Vance
Municipal Bond Funds
March 31, 2024
| Officers |
Kenneth A. Topping
President | Nicholas S. Di Lorenzo
Secretary |
Deidre E. Walsh
Vice President and Chief Legal Officer | Laura T. Donovan
Chief Compliance Officer |
James F. Kirchner
Treasurer | |
George J. Gorman
Chairperson | |
| Alan C. Bowser | |
| Mark R. Fetting | |
| Cynthia E. Frost | |
| Valerie A. Mosley | |
| Anchal Pachnanda* | |
| Keith Quinton | |
| Marcus L. Smith | |
| Susan J. Sutherland | |
| Scott E. Wennerholm | |
| Nancy A. Wiser | |
| U.S. Customer Privacy Notice | March 2024 |
| FACTS | WHAT DOES EATON VANCE DO WITH YOUR PERSONAL INFORMATION? |
| Why? | Financial companies choose how they share your personal information. Federal law gives consumers the right to limit some but not all sharing. Federal law also requires us to tell you how we collect, share, and protect your personal information. Please read this notice carefully to understand what we do. |
| |
| What? | The types of personal information we collect and share depend on the product or service you have with us. This information can include:■ Social Security number and income
■ investment experience and risk tolerance
■ checking account information and wire transfer instructions |
| |
| How? | All financial companies need to share customers’ personal information to run their everyday business. In the section below, we list the reasons financial companies can share their customers’ personal information; the reasons Eaton Vance chooses to share; and whether you can limit this sharing. |
| Reasons we can share your personal information | Does Eaton Vance
share? | Can you limit
this sharing? |
| For our everyday business purposes — such as to process your transactions, maintain your account(s), respond to court orders and legal investigations, or report to credit bureaus | Yes | No |
| For our marketing purposes — to offer our products and services to you | Yes | No |
| For joint marketing with other financial companies | No | We don’t share |
| For our affiliates’ everyday business purposes — information about your transactions and experiences | Yes | No* |
| For our affiliates’ everyday business purposes — information about your creditworthiness | Yes | Yes* |
| For our affiliates to market to you | Yes | Yes* |
| For nonaffiliates to market to you | No | We don’t share |
To limit our
sharing | Call toll-free 1-800-262-1122 or email: EVPrivacy@eatonvance.comPlease note:If you are a new customer, we can begin sharing your information 30 days from the date we sent this notice. When you are no longer our customer, we continue to share your information as described in this notice. However, you can contact us at any time to limit our sharing. |
| Questions? | Call toll-free 1-800-262-1122 or email: EVPrivacy@eatonvance.com |
| U.S. Customer Privacy Notice — continued | March 2024 |
| Who we are |
| Who is providing this notice? | Eaton Vance Management and our investment management affiliates (“Eaton Vance”) (see Affiliates definition below.) |
| What we do |
How does Eaton Vance
protect my personal
information? | To protect your personal information from unauthorized access and use, we use security measures that comply with federal law. These measures include computer safeguards and secured files and buildings. We have policies governing the proper handling of customer information by personnel and requiring third parties that provide support to adhere to appropriate security standards with respect to such information. |
How does Eaton Vance
collect my personal
information? | We collect your personal information, for example, when you■ open an account or make deposits or withdrawals from your account
■ buy securities from us or make a wire transfer
■ give us your contact informationWe also collect your personal information from others, such as credit bureaus, affiliates, or other companies. |
| Why can’t I limit all sharing? | Federal law gives you the right to limit only■ sharing for affiliates’ everyday business purposes — information about your creditworthiness
■ affiliates from using your information to market to you
■ sharing for nonaffiliates to market to youState laws and individual companies may give you additional rights to limit sharing. (See below for more on your rights under state law.) |
What happens when I limit
sharing for an account I hold
jointly with someone else? | Your choices will apply to everyone on your account. |
| Definitions |
| Affiliates | Companies related by common ownership or control. They can be financial and nonfinancial companies.■ Our affiliates include registered investment advisers such as Eaton Vance Management, Eaton Vance Advisers International Ltd., Boston Management and Research, Calvert Research and Management, Parametric Portfolio Associates LLC, Atlanta Capital Management Company LLC, Morgan Stanley Investment Management Inc., Morgan Stanley Investment Management Co.; registered broker-dealers such as Morgan Stanley Distributors Inc. and Eaton Vance Distributors, Inc. (together, the “Investment Management Affiliates”); and companies with a Morgan Stanley name and financial companies such as Morgan Stanley Smith Barney LLC and Morgan Stanley & Co. (the “Morgan Stanley Affiliates”). |
| Nonaffiliates | Companies not related by common ownership or control. They can be financial and nonfinancial companies.■ Eaton Vance does not share with nonaffiliates so they can market to you. |
| Joint marketing | A formal agreement between nonaffiliated financial companies that together market financial products or services to you.■ Eaton Vance does not jointly market. |
| U.S. Customer Privacy Notice — continued | March 2024 |
| Other important information |
| *PLEASE NOTE: Eaton Vance does not share your creditworthiness information or your transactions and experiences information with the Morgan Stanley Affiliates, nor does Eaton Vance enable the Morgan Stanley Affiliates to market to you. Your opt outs will prevent Eaton Vance from sharing your creditworthiness information with the Investment Management Affiliates and will prevent the Investment Management Affiliates from marketing their products to you.Vermont: Except as permitted by law, we will not share personal information we collect about Vermont residents with Nonaffiliates unless you provide us with your written consent to share such information.California: Except as permitted by law, we will not share personal information we collect about California residents with Nonaffiliates and we will limit sharing such personal information with our Affiliates to comply with California privacy laws that apply to us. |
Delivery of Shareholder Documents. The Securities and Exchange Commission (SEC) permits funds to deliver only one copy of shareholder documents, including prospectuses, proxy statements and shareholder reports, to fund investors with multiple accounts at the same residential or post office box address. This practice is often called “householding” and it helps eliminate duplicate mailings to shareholders. Equiniti Trust Company, LLC ("EQ"), the closed-end funds transfer agent, or your financial intermediary, may household the mailing of your documents indefinitely unless you instruct EQ, or your financial intermediary, otherwise. If you would prefer that your Eaton Vance documents not be householded, please contact EQ or your financial intermediary. Your instructions that householding not apply to delivery of your Eaton Vance documents will typically be effective within 30 days of receipt by EQ or your financial intermediary.
Portfolio Holdings. Each Eaton Vance Fund and its underlying Portfolio(s) (if applicable) files a schedule of portfolio holdings on Part F to Form N-PORT with the SEC. Certain information filed on Form N-PORT may be viewed on the Eaton Vance website at www.eatonvance.com, by calling Eaton Vance at 1-800-262-1122 or in the EDGAR database on the SEC’s website at www.sec.gov.
Proxy Voting. From time to time, funds are required to vote proxies related to the securities held by the funds. The Eaton Vance Funds or their underlying Portfolios (if applicable) vote proxies according to a set of policies and procedures approved by the Funds’ and Portfolios’ Boards. You may obtain a description of these policies and procedures and information on how the Funds or Portfolios voted proxies relating to portfolio securities during the most recent 12-month period ended June 30, without charge, upon request, by calling 1-800-262-1122 and by accessing the SEC’s website at www.sec.gov.
Share Repurchase Program. The Funds' Boards of Trustees have approved a share repurchase program authorizing each Fund to repurchase up to 10% of its common shares outstanding as of the last day of the prior calendar year in open-market transactions at a discount to net asset value. The repurchase program does not obligate a Fund to purchase a specific amount of shares. The Funds' repurchase activity, including the number of shares purchased, average price and average discount to net asset value, is disclosed in the Funds' annual and semi-annual reports to shareholders.
Additional Notice to Shareholders. If applicable, a Fund may also redeem or purchase its outstanding preferred shares in order to maintain compliance with regulatory requirements, borrowing or rating agency requirements or for other purposes as it deems appropriate or necessary.
Closed-End Fund Information. Eaton Vance closed-end funds make fund performance data and certain information about portfolio characteristics available on the Eaton Vance website shortly after the end of each month. Other information about the funds is available on the website. The funds’ net asset value per share is readily accessible on the Eaton Vance website. Portfolio holdings for the most recent month-end are also posted to the website approximately 30 days following the end of the month. This information is available at www.eatonvance.com on the fund information pages under “Closed-End Funds & Term Trusts.”
This Page Intentionally Left Blank
This Page Intentionally Left Blank
Investment Adviser and Administrator
Eaton Vance Management
One Post Office Square
Boston, MA 02109
Custodian
State Street Bank and Trust Company
One Congress Street, Suite 1
Boston, MA 02114-2016
Transfer Agent
Equiniti Trust Company, LLC ("EQ")
P.O. Box 500
Newark, NJ 07101
Fund Offices
One Post Office Square
Boston, MA 02109
Item 2. Code of Ethics
Not required in this filing.
Item 3. Audit Committee Financial Expert
Not required in this filing.
Item 4. Principal Accountant Fees and Services
Not required in this filing.
Item 5. Audit Committee of Listed Registrants
Not required in this filing.
Item 6. Schedule of Investments
Please see schedule of investments contained in the Report to Stockholders included under Item 1 of this Form N-CSR.
Item 7. Disclosure of Proxy Voting Policies and Procedures for Closed-End Management Investment Companies
Not required in this filing.
Item 8. Portfolio Managers of Closed-End Management Investment Companies
Not required in this filing.
Item 9. Purchases of Equity Securities by Closed-End Management Investment Company and Affiliated Purchasers
No such purchases this period.
Item 10. Submission of Matters to a Vote of Security Holders
No material changes.
Item 11. Controls and Procedures
(a) It is the conclusion of the registrant’s principal executive officer and principal financial officer that the effectiveness of the registrant’s current disclosure controls and procedures (such disclosure controls and procedures having been evaluated within 90 days of the date of this filing) provide reasonable assurance that the information required to be disclosed by the registrant has been recorded, processed, summarized and reported within the time period specified in the Commission’s rules and forms and that the information required to be disclosed by the registrant has been accumulated and communicated to the registrant’s principal executive officer and principal financial officer in order to allow timely decisions regarding required disclosure.
(b) There have been no changes in the registrant’s internal controls over financial reporting during the second fiscal quarter of the period covered by this report that has materially affected, or is reasonably likely to materially affect, the registrant’s internal control over financial reporting.
Item 12. Disclosure of Securities Lending Activities for Closed-End Management Investment Companies
No activity to report for the registrant’s most recent fiscal year end.
Item 13. Exhibits
Signatures
Pursuant to the requirements of the Securities Exchange Act of 1934 and the Investment Company Act of 1940, the registrant has duly caused this report to be signed on its behalf by the undersigned, thereunto duly authorized.
Eaton Vance New York Municipal Bond Fund
| | |
| By: | | /s/ Kenneth A. Topping |
| | Kenneth A. Topping |
| | Principal Executive Officer |
Date: May 17, 2024
Pursuant to the requirements of the Securities Exchange Act of 1934 and the Investment Company Act of 1940, this report has been signed below by the following persons on behalf of the registrant and in the capacities and on the dates indicated.
| | |
| By: | | /s/ James F. Kirchner |
| | James F. Kirchner |
| | Principal Financial Officer |
Date: May 17, 2024
| | |
| By: | | /s/ Kenneth A. Topping |
| | Kenneth A. Topping |
| | Principal Executive Officer |
Date: May 17, 2024