UNITED STATES
SECURITIES AND EXCHANGE COMMISSION
Washington, D.C. 20549
FORM N-CSR
CERTIFIED SHAREHOLDER REPORT OF
REGISTERED MANAGEMENT INVESTMENT COMPANIES
Investment Company Act file number 811-21152
Nuveen Georgia Dividend Advantage Municipal Fund 2
(Exact name of registrant as specified in charter)
Nuveen Investments
333 West Wacker Drive
Chicago, IL 60606
(Address of principal executive offices) (Zip code)
Kevin J. McCarthy
Nuveen Investments
333 West Wacker Drive
Chicago, IL 60606
(Name and address of agent for service)
Registrant's telephone number, including area code: (312) 917-7700
Date of fiscal year end: May 31
Date of reporting period: May 31, 2014
Form N-CSR is to be used by management investment companies to file reports with the Commission not later than 10 days after the transmission to stockholders of any report that is required to be transmitted to stockholders under Rule 30e-1 under the Investment Company Act of 1940 (17 CFR 270.30e-1). The Commission may use the information provided on Form N-CSR in its regulatory, disclosure review, inspection, and policymaking roles.
A registrant is required to disclose the information specified by Form N-CSR, and the Commission will make this information public. A registrant is not required to respond to the collection of information contained in Form N-CSR unless the Form displays a currently valid Office of Management and Budget (“OMB”) control number. Please direct comments concerning the accuracy of the information collection burden estimate and any suggestions for reducing the burden to Secretary, Securities and Exchange Commission, 450 Fifth Street, NW, Washington, DC 20549-0609. The OMB has reviewed this collection of information under the clearance requirements of 44 U.S.C. ss. 3507.
ITEM 1. REPORTS TO STOCKHOLDERS.
Nuveen Investments to be acquired by TIAA-CREF
On April 14, 2014, TIAA-CREF announced that it had entered into an agreement to acquire Nuveen Investments, the parent company of your fund’s investment adviser, Nuveen Fund Advisors, LLC (“NFAL”) and the Nuveen affiliates that act as sub-advisers to the majority of the Nuveen Funds. TIAA-CREF is a national financial services organization with approximately $569 billion in assets under management (as of March 31, 2014) and is a leading provider of retirement services in the academic, research, medical and cultural fields. Nuveen anticipates that it will operate as a separate subsidiary within TIAA-CREF’s asset management business, and that its current leadership and key investment teams will stay in place.
Your fund investment will not change as a result of Nuveen’s change of ownership. You will still own the same fund shares and the underlying value of those shares will not change as a result of the transaction. NFAL and your fund’s sub-adviser(s) will continue to manage your fund according to the same objectives and policies as before, and we do not anticipate any significant changes to your fund’s operations. Under the securities laws, the consummation of the transaction will result in the automatic termination of the investment management agreements between the funds and NFAL and the investment sub-advisory agreements between NFAL and each fund’s sub-adviser(s). New agreements will be presented to the funds’ shareholders for approval, and, if approved, will take effect upon consummation of the transaction or such later time as shareholder approval is obtained.
The transaction, expected to be completed by year end, is subject to customary closing conditions.
Table of Contents
| Chairman’s Letter to Shareholders | 4 |
| | |
| Portfolio Managers’ Comments | 5 |
| | |
| Fund Leverage | 11 |
| | |
| Share Information | 13 |
| | |
| Risk Considerations | 15 |
| | |
| Performance Overview and Holding Summaries | 16 |
| | |
| Shareholder Meeting Report | 26 |
| | |
| Report of Independent Registered Public Accounting Firm | 28 |
| | |
| Portfolios of Investments | 29 |
| | |
| Statement of Assets and Liabilities | 66 |
| | |
| Statement of Operations | 67 |
| | |
| Statement of Changes in Net Assets | 68 |
| | |
| Statement of Cash Flows | 70 |
| | |
| Financial Highlights | 72 |
| | |
| Notes to Financial Statements | 81 |
| | |
| Additional Fund Information | 95 |
| | |
| Glossary of Terms Used in this Report | 96 |
| | |
| Reinvest Automatically, Easily and Conveniently | 98 |
| | |
| Board Members & Officers | 99 |
| | |
| Annual Investment Management Agreement Approval Process | 104 |
Chairman’s Letter to Shareholders
Dear Shareholders,
After significant growth in 2013, domestic and international equity markets have been less compelling during the first part of 2014. Concerns about deflation, political uncertainty in many places and the potential for more fragile economies to impact other countries have produced uncertainty in the markets.
Europe is beginning to emerge slowly from the recession in mid-2013, with improved GDP and employment trends in some countries. However, Japan’s deflationary headwinds have resurfaced; and China shows signs of slowing from credit distress combined with declines in manufacturing and exports. Most recently, tensions between Russia and Ukraine may continue to hold back stocks and support government bonds in the near term.
Despite these headwinds, there are some encouraging signs of forward momentum in the markets. In the U.S., the news is more positive with financial risks slowly receding, positive GDP trends, downward trending unemployment and stronger household finances and corporate spending.
It is in such changeable markets that professional investment management is most important. Investment teams who have experienced challenging markets in the past understand how their asset class can behave in rapidly changing times. Remaining committed to their investment disciplines during these times is a critical component to achieving long-term success. In fact, many strong investment track records are established during challenging periods because experienced investment teams understand that volatile markets place a premium on companies and investment ideas that can weather the short-term volatility. By maintaining appropriate time horizons, diversification and relying on practiced investment teams, we believe that investors can achieve their long-term investment objectives.
As always, I encourage you to communicate with your financial consultant if you have any questions about your investment in a Nuveen Fund. On behalf of the other members of the Nuveen Fund Board, we look forward to continuing to earn your trust in the months and years ahead.
William J. Schneider
Chairman of the Board
July 21, 2014
Portfolio Managers’ Comments
Nuveen Georgia Dividend Advantage Municipal Fund 2 (NKG)
Nuveen Maryland Premium Income Municipal Fund (NMY)
Nuveen Missouri Premium Income Municipal Fund (NOM)
Nuveen North Carolina Premium Income Municipal Fund (NNC)
Nuveen Virginia Premium Income Municipal Fund (NPV)
These Funds feature portfolio management by Nuveen Asset Management, LLC, an affiliate of Nuveen Investments, Inc. Portfolio managers Daniel J. Close, CFA, Thomas C. Spalding, CFA, and Christopher L. Drahn, CFA, discuss economic and municipal market conditions at the national and state levels, key investment strategies and the twelve-month performance of these five Nuveen Funds. Dan has managed the Nuveen Georgia and North Carolina Funds since 2007. Tom assumed portfolio management responsibility for the Maryland and Virginia Funds in 2011 and Chris has managed the Missouri Fund since 2011.
What factors affected the U.S. economy and the national municipal market during the twelve-month reporting period ended May 31, 2014?
During this reporting period, the U.S. economy continued its bumpy advance toward recovery from recession. The Federal Reserve (Fed) maintained efforts to bolster growth and promote progress toward its mandates of maximum employment and price stability by holding the benchmark fed funds rate at the record low level of zero to 0.25% that it established in December 2008. Based on its view that the underlying strength in the broader economy was enough to support ongoing improvement in the labor market, the Fed began to reduce or taper its monthly asset purchases in $10 billion increments over the course of five consecutive meetings (December 2013 through June 2014). As of July 2014 (subsequent to the close of this reporting period), the Fed’s monthly purchases comprise $15 billion in mortgage-backed securities (versus the original $40 billion per month) and $20 billion in longer-term Treasury securities (versus $45 billion). Following its June 2014 meeting (subsequent to the close of this reporting period), the Fed reiterated that it would continue to look at a wide range of factors, including labor market conditions, indicators of inflationary pressures and readings on financial developments, in determining future actions, saying that it would likely maintain the current target range for the fed funds rate for a considerable time after the asset purchase program ends, especially if projected inflation continues to run below the Fed’s 2% longer-run goal.
In the first quarter of 2014, the U.S. economy, as measured by the U.S. gross domestic product (GDP), contracted at an annualized rate of 2.9%, the economy’s weakest quarter since the recession officially ended in June 2009. The decline during this period was attributed in part to the severe weather of the past winter, which deterred consumer spending and disrupted construction, production and shipping. The Consumer Price Index (CPI) rose 2.1% year-over-year as of May 2014, the largest twelve-month increase since October 2012, while the core CPI (which excludes food and energy) increased 2.0% during the same period, in line with the Fed’s unofficial longer-term objective of 2.0% for this inflation measure. As of May 2014, the national unemployment rate was 6.3%, the lowest reading since September 2008, down from the 7.5% reported in May 2013, but still higher than levels that would
| Certain statements in this report are forward-looking statements. Discussions of specific investments are for illustration only and are not intended as recommendations of individual investments. The forward-looking statements and other views expressed herein are those of the portfolio managers as of the date of this report. Actual future results or occurrences may differ significantly from those anticipated in any forward-looking statements, and the views expressed herein are subject to change at any time, due to numerous market and other factors. The Funds disclaim any obligation to update publicly or revise any forward-looking statements or views expressed herein. |
Ratings shown are the highest rating given by one of the following national rating agencies: Standard & Poor’s (S&P), Moody’s Investors Service, Inc. (Moody’s) or Fitch, Inc. (Fitch). Credit ratings are subject to change. AAA, AA, A and BBB are investment grade ratings; BB, B, CCC, CC, C and D are below investment grade ratings. Certain bonds backed by U.S. government or agency securities are regarded as having an implied rating equal to the rating of such securities. Holdings designated N/R are not rated by these national rating agencies.
Bond insurance guarantees only the payment of principal and interest on the bond when due, and not the value of the bonds themselves, which will fluctuate with the bond market and the financial success of the issuer and the insurer. Insurance relates specifically to the bonds in the portfolio and not to the share prices of a Fund. No representation is made as to the insurers’ ability to meet their commitments.
Portfolio Managers’ Comments (continued)
provide consistent support for optimal GDP growth. The 113,000 net new jobs added in May 2014 meant that the economy finally had regained all of the 8.7 million jobs lost during the recent recession. The housing market continued to post gains, as the average home price in the S&P/Case-Shiller Index of 20 major metropolitan areas rose 10.8% for the twelve months ended April 2014 (most recent data available at the time this report was prepared). This brought the average U.S. home price back to summer 2004 levels, although prices continued to be down 18% –19% from their mid-2006 peak.
As this reporting period began, several events touched off increased volatility in the financial markets. First, in May 2013, then-Fed Chairman Ben Bernanke’s remarks about tapering the Fed’s asset purchase program triggered widespread uncertainty about the next step for the Fed’s quantitative easing program and its impact on the markets as well as the overall economy. This uncertainty was compounded by headline credit stories involving Detroit’s bankruptcy filing in July 2013, the largest municipal bankruptcy in history and the disappointing news that continued to come out of Puerto Rico, where a struggling economy and years of deficit spending and borrowing led to multiple downgrades on the commonwealth’s bonds. Meanwhile, political debate over federal spending continued, as Congress failed to reach an agreement on the federal budget for Fiscal 2014. On October 1, 2013, the start date for Fiscal 2014, the federal government shut down for 16 days until an interim appropriations bill was signed into law. (Consensus on a $1.1 trillion federal spending bill was ultimately reached in January 2014 and in February 2014, members of Congress agreed to suspend the $16.7 trillion debt ceiling until March 2015.) In the unsettled environment of the first half of this reporting period, the Treasury market traded off, the municipal market followed suit and spreads widened as investor concern grew, which prompted increased selling by bondholders across the fixed income markets.
During the second half of this reporting period, municipal bonds generally rebounded, as the Fed remained accommodative, the Treasury market rallied and municipal credit fundamentals continued to improve. Higher yields and the prospect of higher taxes sparked increased demand and improved flows into municipal bond funds, while supply continued to drop. This supply/demand dynamic served as a key driver of municipal market performance. While yields retraced 2013 gains during the first five months of 2014, municipal bonds generally produced positive total returns for the reporting period as a whole. Fundamentals on municipal bonds remained strong, as state governments overall made good progress in dealing with budget issues. Due to strong growth in personal tax and sales tax collections, year-over-year totals for state tax revenues have increased for 16 consecutive quarters, while on the expense side, many states made headway in cutting and controlling costs, with more than 40 states implementing some type of pension reform. The current level of municipal issuance reflects the more conservative approach to state budgeting. For the twelve months ended May 31, 2014, municipal bond issuance nationwide totaled $296.0 billion, down 21% from the issuance for the twelve-month period ended May 31, 2013.
What were the economic and market conditions in Georgia, Maryland, Missouri, North Carolina and Virginia during the twelve-month reporting period ended May 31, 2014?
During this period, Georgia continued its recovery from the recent recession. The state’s economy grew 1.8% in 2013, up from 1.5% in 2012 and on par with national growth of 1.8% for 2013. This ranked Georgia 25th among the states in terms of economic expansion for 2013. As of May 2014, unemployment in Georgia was 7.2%, down from 8.4% in May 2013, but still above the national rate of 6.3%. Georgia’s economy continued to be well diversified, although geographically concentrated around the Atlanta metropolitan area. Home prices in the Atlanta area, which were hard hit by the housing crisis, were up 13.7% year-over-year as of April 2014 (most recent data available at the time this report was prepared), ahead of the national average of 10.8%, according to the S&P/Case-Shiller Home Price Index. In 2013, Georgia’s population grew by only 0.8%, the weakest in almost four decades. For Fiscal 2015, Georgia adopted a $20.8 billion state budget, which included an estimated revenue increase of 3% over the amended Fiscal 2014 budget. The Fiscal 2015 budget also provided approximately $514 million in additional funds for K-12 education, the largest annual increase in K-12 funding in seven years. As of May 2014, Georgia’s general obligation debt continued to be rated Aaa, AAA, AAA with stable outlooks from Moody’s, S&P and Fitch, respectively. For the twelve months ended May 31, 2014, municipal issuance in Georgia totaled $5.1 billion, a decrease of 3.3% from the twelve months ended May 31, 2013.
In Maryland, the state’s credit profile remained relatively strong, due to sound fiscal management and a diverse economy. In 2013, Maryland’s economic growth was flat, following expansion that averaged 1.9% in 2010-2012. While the state’s economic recovery has been somewhat hampered by federal budget cuts, private sector employment has shown recent signs of expansion. Growth in the health care and professional services sectors buoyed the state’s job market and lowered statewide unemployment
to 5.6% as of May 2014, down from 6.7% in May 2013. However, employment in the manufacturing and financial services sectors continued to decline and Maryland’s proximity to Washington DC means a greater dependency on federal employment than in most states, leaving it vulnerable to federal cost-cutting. The state’s largest employer was Fort George G. Meade, with more than 56,000 workers. Maryland has one of the nation’s best educated workforces, which has facilitated the development of advanced technology and the growth of public and private research facilities. Combined with the influence of the government sector and the presence of 56 universities, this has made Maryland a center for national security and medical and biomedical research. Maryland’s Fiscal 2015 budget estimated a 5% increase in revenues and expenditures and maintenance of the state’s rainy day fund at $800 million. As of May 2014, Moody’s, S&P and Fitch rated Maryland general obligation debt at Aaa, AAA, AAA, respectively, with stable outlooks. During the twelve months ended May 31, 2014, municipal issuance in the state totaled $5.2 billion, down 29% from the twelve-month period ended May 31, 2013.
Missouri’s economic recovery continued to lag that at the national level. For 2013, national economic growth of 1.8% outpaced Missouri’s expansion rate of 0.8%, which ranked Missouri 45th among the states. Continued job losses in the government and information technology sectors were offset by employment growth in construction, leisure and hospitality, financial activities and education and health services. As of May 2014, Missouri’s unemployment rate of 6.6% remained higher than the national rate of 6.3%, but represented a slight improvement over the state’s reading of 6.7% in May 2013. Missouri’s overexposure to traditional defense-related manufacturing jobs caused a drag on its recovery, but efforts to transition part of the state economy away from these jobs to health care and financial services could position Missouri for future growth. The state’s plan to expand exports suffered a setback in 2013, with exports falling 8.5% from 2012, as increases in exports to Mexico failed to offset large decreases in exports to Canada and China. For Fiscal 2015, the proposed $26.4 billion Missouri state budget, which was introduced in January 2014, focused on increased funding for K-12 education, higher education and the renovation of Fulton State Mental Hospital. In August 2014, residents will vote on a $0.0075 ten-year sales tax increase that would provide an estimated $500 million in annual transportation revenues. Although previous budgets have reduced state payrolls, the Fiscal 2015 budget called for increased spending on employee resources. As of May 2014, Moody’s, S&P and Fitch rated Missouri general obligation debt at Aaa, AAA, AAA, respectively, with stable outlooks. For the twelve months ended May 31, 2014, municipal issuance in Missouri totaled $6.5 billion, representing a 3.5% increase from the twelve months ended May 31, 2013.
North Carolina continued the trend line of growth that started at the end of 2011. For 2013, the gross state product for North Carolina grew 2.3%, following an increase of 2.4% in 2012. This outpaced national growth of 1.8% in 2013 and ranked North Carolina 17th among the states for the year. As of May 2014, the state’s unemployment rate of 6.4% was its lowest since July 2008, down from 8.3% twelve months earlier. North Carolina has worked to transition its economy away from old-line manufacturing into sectors oriented toward research, technology and services and the combination of experience and a focus on the future resulted in Raleigh’s being selected as the site for a new federally subsidized institute for technology-based manufacturing. Once a leader in textiles, furniture and tobacco, the state’s manufacturing sector was not expected to resume its role as a major driver in the North Carolina economy, although manufacturing continued to represent 11% of the state’s jobs. The federal government remained the largest employer in the state due to the large military installments, including Fort Bragg and Camp Lejeune, which are the two largest employers in the state with more than 110,000 workers. According to the S&P/Case-Shiller Index of 20 major metropolitan areas, housing prices in Charlotte rose 4.4% during the twelve months ended April 2014 (most recent data available at the time this report was prepared), compared with a 10.8% price increase nationally. This put Charlotte home prices less than 10% from their 2006 peak. North Carolina closed Fiscal 2013 with a budget surplus of more than $440 million. Such surpluses are less likely going forward, as the state reduced personal income tax rates from a three-tiered system topping out at 7.5% to a flat 5.8% in 2014 and 5.75% in 2015, while also cutting the corporate income tax from 6.9% to 6% in 2014 and 5% in 2015. While the state eliminated sales tax exemptions in order to boost those revenues, the net result is expected to be a reduction in revenues. As of May 2014, North Carolina is one of only eight states to carry a rating of AAA by all three major rating agencies. During the twelve months ended May 31, 2014, municipal issuance in North Carolina totaled $2.6 billion, a decrease of 70% from the twelve months ended May 31, 2013.
Economic recovery in Virginia continued at a steady, though somewhat slower pace than in its peers. In 2013, Virginia’s economic growth was relatively flat, following expansion that averaged 1.6% in 2010-2012. However, economic indicators reflected an economy that was relatively healthy and improving. As of May 2014, unemployment in the commonwealth fell to 5.1%, down from
Portfolio Managers’ Comments (continued)
5.6% in May 2013 and below the national average of 6.3%. Job growth in Virginia was led by the education and health services, financial services and construction sectors. The commonwealth is a center for research and development facilities, with Richmond, Charlottesville and Northern Virginia forming a research triangle. In recent months, home prices in the region have risen, according to the S&P/Case-Shiller Index of 20 major metropolitan areas, with the Washington DC area posting a 7.0% gain for the twelve months ended April 2014 (most recent data available at the time this report was prepared). This compared with a 10.8% rise in home prices nationally. Virginia is approaching the end of the second year of its $85 billion biennium budget and progress on the budget for Fiscal 2015 is at a standstill over Medicaid expansion. Many of Virginia’s local governments and school districts base their budgets on the commonwealth’s and a delay in budget approval at the state level could result in problems for local municipalities. In 2012, Virginia passed a wide-ranging pension reform measure that required full funding of the Virginia retirement system within eight years, altered benefits and contribution rates and established a hybrid defined benefit/defined contribution plan for new employees. As of May 2014, Moody’s, S&P and Fitch rated Virginia general obligation debt at Aaa/AAA/AAA with stable outlooks. During the twelve months ended May 31, 2014, issuance in Virginia totaled $5.6 billion, a decrease of 42% from the previous twelve months.
What key strategies were used to manage these Funds during the twelve-month reporting period ended May 31, 2014?
As previously discussed, during the first part of this reporting period, uncertainty about the future of the Fed’s quantitative easing program and headline credit stories involving Detroit and Puerto Rico triggered selling by bondholders across the fixed income markets, resulting in a volatile municipal market environment. The second part of the reporting period brought greater stability and a municipal market rally driven by stronger demand and tight supply. We continued to take a bottom-up approach to discovering sectors that appeared undervalued as well as individual credits that had the potential to perform well over the long term and helped keep the Funds fully invested.
Despite the challenging environment created by market volatility and the general decrease in new issuance, especially in North Carolina, Virginia and Maryland, we continued to find opportunities to purchase bonds in both the primary and secondary markets that helped us achieve our goals for the Funds. Given our view that there had been no fundamental change in municipal market credit, we were active buyers, taking advantage of higher coupons and attractive prices resulting from the pattern of outflows, predominately from high yield funds, during the first part of the reporting period. Overall, our emphasis in these Funds was on adding attractive bonds across the credit quality spectrum that we believed had long-term potential. For the most part, our purchases were made in the intermediate and longer parts of the municipal yield curve, with more emphasis on intermediate maturities in NNC.
During this reporting period, the Funds continued to find value in diversified areas of the marketplace. In NKG, we purchased several state and local general obligation (GO) credits, water and sewer bonds, tax increment financing (TIF) district credits and a gas prepayment issue. When NKG’s holdings of bonds issued for Hartsfield–Jackson Atlanta International Airport were called, we reinvested the call proceeds in the airport’s new issue. During this reporting period, NMY added to its holdings in health care, single-family housing, GOs and higher education, including The Johns Hopkins University and the University of Maryland. In Missouri, NOM found value in credits issued by the Metropolitan St. Louis Sewer District and the health care and higher education sectors, such as CoxHealth, the University of Central Missouri and the St. Louis College of Pharmacy. Despite the significant drop in North Carolina issuance during this period, we continued to find bonds that helped accomplish our goals for NNC, adding local GOs, water and sewer and airport bonds as well as Catawba electric revenue credits. Good supply of higher education issuance also enabled us to increase NNC’s holdings in that sector, as we added bonds issued for East Carolina University, Winston-Salem State University and University of North Carolina at both Charlotte and Raleigh. In Virginia, NPV’s purchases during this reporting period focused on tollroads, higher education (Washington and Lee University) and emission control bonds issued for Virginia Electric and Power Company. With the general decline in Virginia issuance, we also added some territorial paper (Virgin Islands) to help keep our portfolio fully invested.
During this reporting period, S&P upgraded its credit rating on National Public Finance Guarantee Corp. (NPFG), the insurance subsidiary of MBIA, to a AA-rating from A-rating, citing NPFG’s strong operating performance and competitive position in the financial guarantee market. As a result, the ratings on the Funds’ holdings of bonds backed by insurance from NPFG were similarly upgraded to AA-rated as of mid-March 2014. This action produced an increase in the percentage of our portfolios held in the AA-rated credit
quality category (and a corresponding decrease in the A-rated category), improving the overall credit quality of the Funds. During this reporting period, S&P also upgraded its rating on Assured Guaranty Municipal (AGM) as well as AGM’s municipal-only insurer Municipal Assurance Corp. to AA from AA-.
Cash for new purchases was generated primarily by proceeds from called and matured bonds, which we worked to redeploy to keep the Funds fully invested and support their income streams. We also sold selected holdings to generate additional cash for purchases, including the sale of Virgin Islands electric system revenue bonds in NKG and pre-refunded bonds with short maturities in NNC. In addition, NOM took advantage of good demand for Missouri paper to sell some discount coupon bonds, which had the added benefit of generating tax loss carryforwards that can be used to offset future capital gains. NOM also reviewed its holdings to identify bonds that could qualify as potential sales candidates as better opportunities arose. As a result of this review, we sold our holdings of a Missouri appropriations bond at strong prices. All five Funds were also active sellers of Puerto Rico paper. This activity is further discussed in our comments on Puerto Rico at the end of this Portfolio Managers’ Comments section.
As of May 31, 2014, all these Funds continued to use inverse floating rate securities. We employ inverse floaters for a variety of reasons, including duration management, income enhancement and total return enhancement. For duration and cash management reasons, NNC found it advantageous to terminate several of its inverse floating rate trusts, using cash on hand in the portfolio to place the bonds involved back on the Fund’s balance sheet.
How did the Funds perform during the twelve-month reporting period ended May 31, 2014?
The tables in each Fund’s Performance Overview and Holding Summaries section of this report provide the Funds’ total returns for the one-year, five-year and ten-year periods ended May 31, 2014. Each Fund’s total returns at net asset value (NAV) are compared with the performance of corresponding market indexes and a Lipper classification average.
For the twelve months ended May 31, 2014, the total return at common share NAV for NNC exceeded the return for the S&P Municipal Bond North Carolina Index as well as the S&P Municipal Bond Index, while the other four Funds underperformed their respective state’s S&P Municipal Bond Index and the S&P Municipal Bond Index. For the same period, NNC outperformed the average return for the Lipper Other States Municipal Debt Funds Classification Average, while NKG, NMY, NOM and NPV lagged this Lipper average. Shareholders should note that the performance of the Lipper Other States classification represents the overall average of returns for funds from ten states with a wide variety of municipal market conditions, making direct comparisons less meaningful.
Key management factors that influenced the Funds’ returns during this reporting period included duration and yield curve positioning, credit exposure and sector allocation. The underperformance of the Maryland and Virginia markets relative to the national municipal market also had an impact on the returns of NMY and NPV for the reporting period. In addition, the use of regulatory leverage was an important factor affecting the performance of these Funds. Leverage is discussed in more detail later in the Fund Leverage section of this report.
As yields retraced gains made during the first part of this reporting period, municipal bonds with long intermediate and longer maturities generally outperformed those with shorter maturities as a whole. Overall, credits with maturities between seven and twenty years, especially those in the fifteen-year maturity range, outperformed the general municipal market, while bonds at the shortest end of the municipal yield curve produced the weakest results. Because these Funds generally had good weightings in the segments of the municipal curve that performed best and underweights in the underperforming short end of the curve, duration and yield curve positioning was a positive contributor to their performance, especially in NNC.
During this reporting period, lower rated bonds generally outperformed higher quality bonds, as the environment shifted from tradeoff to rally and investors became more willing to accept risk. However, relative performance results among the lower rated categories were somewhat skewed by the underperformance of Puerto Rico bonds, which were classified in the BBB-rated credit quality category for the majority of this reporting period before their downgrade to below investment grade in February 2014. All of these Funds except NNC were overweighted in BBB–rated bonds, with NPV having the heaviest allocation in this category. The impact of Puerto Rico holdings was offset to varying degrees by the Funds’ weightings in the other lower quality positions that performed well.
Portfolio Managers’ Comments (continued)
Health care and housing generally were the top performers among the municipal market sectors, with the performance of the housing sector boosted by improving property value assessments and the decline in mortgage and tax delinquencies. NMY, NOM, NNC and NPV all benefited from their heavy weightings in health care, including hospitals and continuing care retirement communities (CCRCs). Other revenue sectors that tended to outperform the general municipal market included transportation, industrial development revenue (IDR) bonds, water and sewer and education. NKG’s overweighting in IDRs helped somewhat to offset its lower allocation to health care. For the reporting period, general obligation (GO) credits generally performed in line with the market.
In contrast, pre-refunded bonds, which are often backed by U.S. Treasury securities, were among the poorest performing market segments. The underperformance of these bonds relative to the market can be attributed primarily to their shorter effective maturities and higher credit quality. All of these Funds had allocations of pre-refunded bonds, with NMY having the heaviest weighting and NKG the smallest exposure. Bonds in the utilities sector also lagged municipal market performance. These Funds tended to be underweighted in utilities relative to the index, which was generally helpful. Lower rated tobacco credits backed by the 1998 master tobacco settlement agreement also performed poorly. At the beginning of this reporting period, all of these Funds except NOM had allocations of tobacco bonds issued by The Children’s Trust Fund (Puerto Rico). In addition, NMY held tobacco credits issued by Guam and the Virgin Islands and NPV had positions in tobacco bonds issued by Guam and the Tobacco Settlement Financing Corporation of Virginia. In late 2013, NKG and NNC closed out their positions in Puerto Rico tobacco bonds.
During this reporting period, developments in Puerto Rico also had an impact on the Funds’ holdings and performance. The commonwealth’s continued economic weakening, escalating debt service obligations and long-standing inability to deliver a balanced budget have led to multiple downgrades on its debt. In another round of rating reductions in February 2014, Moody’s, S&P, and Fitch cut their ratings on Puerto Rico general obligation (GO) debt to below investment grade, at Ba2/BB+/BB, respectively, with negative outlooks. In late June 2014, Puerto Rico approved new legislation creating a judicial framework and formal process that would allow several of the commonwealth’s public corporations to restructure their public debt. As of July 2014, the Nuveen complex holds $80.6 million in bonds backed by public corporations in Puerto Rico that could be restructured under this legislation, representing less than 0.1% of our municipal assets under management. In light of the evolving economic situation in Puerto Rico, Nuveen’s credit analysis of Puerto Rico had previously considered the possibility of a default and restructuring of public corporations and we adjusted our portfolios to prepare for such an outcome, although no such default or restructuring has occurred to date. The Nuveen complex’s entire exposure to obligations of the government of Puerto Rico and other Puerto Rico issuers amounts to 0.8% of our municipal assets under management. On July 1, 2014, in response to the new legislation, Moody’s further dropped its rating on Puerto Rico GO debt by an additional three notches, to B2 from Ba2. To date, S&P and Fitch have not announced any additional rating adjustments.
For the reporting period ended May 31, 2014, Puerto Rico paper underperformed the municipal market as a whole. During this reporting period, each of these Funds had exposure to Puerto Rico bonds. The effect on performance from these holdings differed from Fund to Fund in line with the type and amount of its position, but on the whole, our Puerto Rico holdings were a major detractor from performance during this period. These territorial bonds were originally added to the Funds in order to keep assets fully invested and working for the Funds as well as to enhance diversity, duration and credit in states such as Maryland and Virginia. We found the Puerto Rico credits attractive because they offer higher yields, added diversification and triple exemption (i.e., exemption from most federal, state and local taxes). During this reporting period, the Funds took advantage of opportunities to reduce or even close out their positions in Puerto Rico paper. In addition to the sales of Puerto Rico tobacco bonds mentioned above, NKG and NNC, which began the period with exposures of 3.8% and 2.2%, respectively, sold their remaining holdings of Puerto Rico bonds, leaving the Funds with no Puerto Rico holdings at the end of the reporting period. NOM also reduced its exposure to Puerto Rico from 7.9% to 3.1% during the reporting period. NMY and NPV trimmed their positions in Puerto Rico bonds from 17.2% to 10.0% in NMY and from 15.4% to 7.8% in NPV. In addition, we should note that NMY’s holding of bonds issued by Puerto Rico Ports Authority for American Airlines made a positive contribution to its performance during this reporting period, as the Fund’s position in these bonds was converted into equity as part of the merger with US Airways. Over time, we expect to reinvest the proceeds from these shares into municipal bonds.
Fund Leverage
IMPACT OF THE FUNDS’ LEVERAGE STRATEGIES ON PERFORMANCE
One important factor impacting the returns of the Funds relative to their comparative benchmarks was the Funds’ use of leverage through their issuance of preferred shares and/or investments in inverse floating rate securities, which represent leveraged investments in underlying bonds. The Funds use leverage because our research has shown that, over time, leveraging provides opportunities for additional income, particularly in the recent market environment where short-term market rates are at or near historical lows, meaning that the short-term rates the Fund has been paying on its leveraging instruments have been much lower than the interest the Fund has been earning on its portfolio of long-term bonds that it has bought with the proceeds of that leverage. However, use of leverage also can expose the Fund to additional price volatility. When a Fund uses leverage, the Fund will experience a greater increase in its net asset value if the municipal bonds acquired through the use of leverage increase in value, but it will also experience a correspondingly larger decline in its net asset value if the bonds acquired through leverage decline in value, which will make the Fund’s net asset value more volatile, and its total return performance more variable over time. In addition, income in levered funds will typically decrease in comparison to unlevered funds when short-term interest rates increase and increase when short-term interest rates decrease. Leverage detracted from the performance of NKG, NMY and NPV during the period after accounting for the cost of leverage used. Leverage had a positive impact on performance for NOM, and a negligible impact on NNC during the period.
As of May 31, 2014, the Funds’ percentages of effective and regulatory leverage are as shown in the accompanying table.
| | | NKG | | | NMY | | | NOM | | | NNC | | | NPV | |
| Effective Leverage* | | 36.25 | % | | 34.86 | % | | 37.81 | % | | 33.65 | % | | 37.74 | % |
| Regulatory Leverage* | | 33.71 | % | | 32.11 | % | | 35.09 | % | | 33.65 | % | | 33.03 | % |
| * | Effective Leverage is a Fund’s effective economic leverage, and includes both regulatory leverage and the leverage effects of certain derivative and other investments in a Fund’s portfolio that increase the Fund’s investment exposure. Currently, the leverage effects of Tender Option Bond (TOB) inverse floater holdings are included in effective leverage values, in addition to any regulatory leverage. Regulatory leverage consists of preferred shares issued or borrowings of a Fund. Both of these are part of a Fund’s capital structure. Regulatory leverage is subject to asset coverage limits set forth in the Investment Company Act of 1940. |
Fund Leverage (continued)
THE FUNDS’ REGULATORY LEVERAGE
As of May 31, 2014, the Funds have issued and outstanding MuniFund Term Preferred (MTP) Shares, Variable Rate MuniFund Term Preferred (VMTP) Shares and Variable Rate Demand Preferred (VRDP) Shares as shown in the accompanying table.
| | | | MTP Shares | | | VMTP Shares | | | VRDP Shares | | | | |
| | | | | | | | | | | | | NYSE/ | | | | | | | | | | | | | | | | |
| | | | | | | Shares Issued at | | | Annual | | | NYSE MKT | | | | | | Shares Issued at | | | | | | Shares Issued at | | | | |
| | | | Series | | Liquidation Value | | | Interest Rate | | | Ticker | | | Series | | Liquidation Value | | | Series | | Liquidation Value | | | Total | |
| NKG | | | | | | — | | | — | | | | | | | | $ | | | | — | | | | | $ | 75,000,000 | |
| NMY | | | | | | — | | | — | | | | | | | | $ | | | | — | | | | | $ | 167,000,000 | |
| NOM | | | 2015 | | $ | 17,880,000 | | | 2.10 | % | | NOM PRC | | | — | | | — | | | — | | | — | | $ | 17,880,000 | |
| NNC | | | | | | — | | | — | | | — | | | | | $ | | | | — | | | | | $ | 125,000,000 | |
| NPV | | | | | | — | | | — | | | — | | | | | | | | | | | | | | $ | 128,000,000 | |
During the current reporting period, NKG, NMY and NNC refinanced all of their outstanding MTP Shares with the proceeds from newly issued VMTP Shares, and NPV refinanced all of its outstanding MTP Shares with the proceeds from newly issued VRDP Shares.
Refer to Notes to Financial Statements, Note 1 – General Information and Significant Accounting Policies for further details on MTP, VMTP and VRDP Shares and each Fund’s respective transactions.
Share Information
COMMON SHARE DIVIDEND INFORMATION
The following information regarding the Fund’s distributions is current as of May 31, 2014. Each Fund’s distribution levels may vary over time based on each Fund’s investment activity and portfolio investments value changes.
During the current reporting period, the Funds’ monthly dividends to common shareholders were as shown in the accompanying table.
| | | Per Common Share Amounts |
| Ex-Dividend Date | | | NKG | | | NMY | | | NOM | | | NNC | | | NPV | |
| June 2013 | | $ | 0.0535 | | $ | 0.0555 | | $ | 0.0610 | | $ | 0.0503 | | $ | 0.0595 | |
| July | | | 0.0535 | | | 0.0555 | | | 0.0610 | | | 0.0503 | | | 0.0595 | |
| August | | | 0.0535 | | | 0.0555 | | | 0.0610 | | | 0.0503 | | | 0.0595 | |
| September | | | 0.0535 | | | 0.0555 | | | 0.0610 | | | 0.0503 | | | 0.0595 | |
| October | | | 0.0535 | | | 0.0555 | | | 0.0610 | | | 0.0503 | | | 0.0595 | |
| November | | | 0.0535 | | | 0.0555 | | | 0.0610 | | | 0.0503 | | | 0.0595 | |
| December | | | 0.0535 | | | 0.0555 | | | 0.0610 | | | 0.0503 | | | 0.0595 | |
| January | | | 0.0535 | | | 0.0555 | | | 0.0610 | | | 0.0503 | | | 0.0615 | |
| February | | | 0.0535 | | | 0.0555 | | | 0.0610 | | | 0.0503 | | | 0.0615 | |
| March | | | 0.0535 | | | 0.0555 | | | 0.0610 | | | 0.0503 | | | 0.0615 | |
| April | | | 0.0535 | | | 0.0555 | | | 0.0610 | | | 0.0503 | | | 0.0615 | |
| May 2014 | | | 0.0535 | | | 0.0555 | | | 0.0610 | | | 0.0503 | | | 0.0615 | |
| | | | | | | | | | | | | | | | | |
| Long-Term Capital Gain* | | $ | — | | $ | — | | $ | — | | $ | — | | $ | 0.0078 | |
| Ordinary Income Distribution* | | $ | — | | $ | 0.0023 | | $ | — | | $ | — | | $ | 0.0005 | |
| | | | | | | | | | | | | | | | | |
| Market Yield** | | | 4.95% | | | 5.16% | | | 4.85% | | | 4.56% | | | 5.51% | |
| Taxable-Equivalent Yield** | | | 7.31% | | | 7.59% | | | 7.16% | | | 6.73% | | | 8.11% | |
| * | Distribution paid in December 2013. |
| ** | Market Yield is based on the Fund’s current annualized monthly dividend divided by the Fund’s current market price as of the end of the reporting period. Taxable-Equivalent Yield represents the yield that must be earned on a fully taxable investment in order to equal the yield of the Fund on an after-tax basis. It is based on a combined federal and state income tax rate of 32.3%, 32.0%, 32.3%, 32.2% and 32.1% for Georgia, Maryland, Missouri, North Carolina and Virginia, respectively. When comparing a Fund to investments that generate qualified dividend income, the Taxable-Equivalent Yield would be lower. |
All of the Funds in this report seek to pay stable dividends at rates that reflect each Fund’s past results and projected future performance. During certain periods, each Fund may pay dividends at a rate that may be more or less than the amount of net investment income actually earned by the Fund during the period. If a Fund has cumulatively earned more than it has paid in dividends, it holds the excess in reserve as undistributed net investment income (UNII) as part of the Fund’s NAV. Conversely, if a Fund has cumulatively paid dividends in excess of its earnings, the excess constitutes negative UNII that is likewise reflected in the Fund’s NAV. Each Fund will, over time, pay all of its net investment income as dividends to shareholders. As of May 31, 2014, all of these Funds had positive UNII balances for tax purposes. NMY, NOM and NPV had positive UNII balances, while NKG and NNC had negative UNII balances for financial reporting purposes.
Share Information (continued)
COMMON SHARE EQUITY SHELF PROGRAM
During the current reporting period, NPV was authorized to issue an additional 1,700,000 common shares through an equity shelf program. Under this program, the Fund, subject to market conditions, may raise additional capital from time to time in varying amounts and offering methods at a net price at or above the Fund’s NAV per common share. During the current reporting period NPV did not sell any common shares through its equity shelf program.
Refer to Notes to Financial Statements, Note 1 — General Information and Significant Accounting Policies for further details on the Fund’s equity shelf program.
COMMON SHARE REPURCHASES
As of May 31, 2014, and since the inception of the Funds’ repurchase programs, the Funds have cumulatively repurchased and retired common shares as shown in the accompanying table.
| | | NKG | | | NMY | | | NOM | | | NNC | | | NPV | |
| Common Shares Cumulatively Repurchased and Retired | | — | | | — | | | — | | | — | | | — | |
| Common Shares Authorized for Repurchase | | 1,055,000 | | | 2,410,000 | | | 235,000 | | | 1,655,000 | | | 1,795,000 | |
OTHER COMMON SHARE INFORMATION
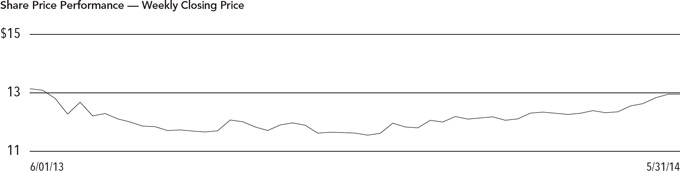
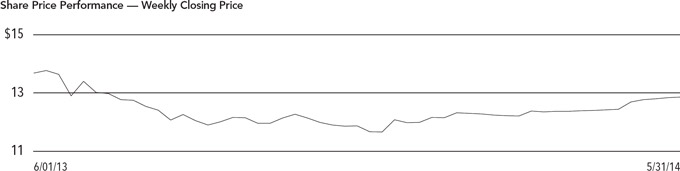
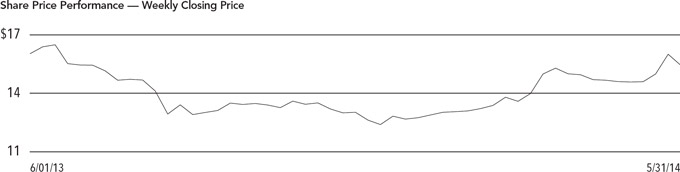
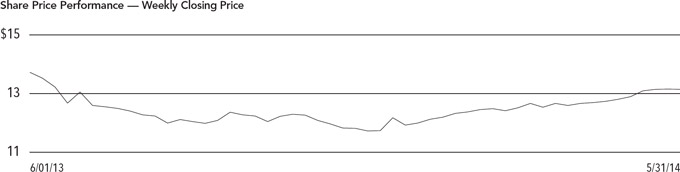
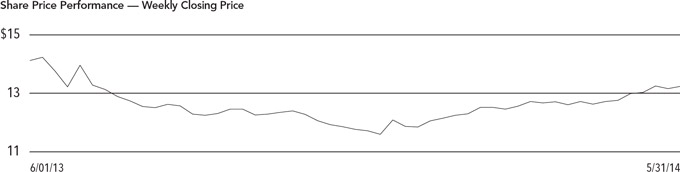
As of May 31, 2014, and during the current reporting period, the Funds’ common share prices were trading at a premium/(discount) to their common share NAVs as shown in the accompanying table.
| | | | NKG | | | NMY | | | NOM | | | NNC | | | NPV | |
| Common Share NAV | | $ | 13.98 | | $ | 14.64 | | $ | 14.19 | | $ | 14.90 | | $ | 14.47 | |
| Common Share Price | | $ | 12.98 | | $ | 12.91 | | $ | 15.08 | | $ | 13.24 | | $ | 13.39 | |
| Premium/(Discount) to NAV | | | (7.15 | )% | | (11.82 | )% | | 6.27 | % | | (11.14 | )% | | (7.46 | )% |
| 12-Month Average Premium/(Discount) to NAV | | | (9.88 | )% | | (12.76 | )% | | (4.00 | )% | | (11.42 | )% | | (8.63 | )% |
Risk Considerations
Fund shares are not guaranteed or endorsed by any bank or other insured depository institution, and are not federally insured by the Federal Deposit Insurance Corporation. Past performance is no guarantee of future results. Fund common shares are subject to a variety of risks, including:
Investment, Price and Market Risk. An investment in shares is subject to investment risk, including the possible loss of the entire principal amount that you invest. Your investment in shares represents an indirect investment in the municipal securities owned by the Fund, which generally trade in the over-the-counter markets. Shares of closed-end investment companies like these Funds frequently trade at a discount to their net asset value (NAV). Your shares at any point in time may be worth less than your original investment, even after taking into account the reinvestment of Fund dividends and distributions.
Leverage Risk. Each Fund’s use of leverage creates the possibility of higher volatility for the Fund’s per share NAV, market price, distributions and returns. There is no assurance that a Fund’s leveraging strategy will be successful. Certain aspects of the recently adopted Volcker Rule may limit the availability of tender option bonds, which are used by the Funds for leveraging and duration management purposes. The effects of this new Rule, expected to take effect in mid-2015, may make it more difficult for a Fund to maintain current or desired levels of leverage and may cause the Fund to incur additional expenses to maintain its leverage.
Tax Risk. The tax treatment of Fund distributions may be affected by new IRS interpretations of the Internal Revenue Code and future changes in tax laws and regulations.
Issuer Credit Risk. This is the risk that a security in a Fund’s portfolio will fail to make dividend or interest payments when due.
Interest Rate Risk. Fixed-income securities such as bonds, preferred, convertible and other debt securities will decline in value if market interest rates rise.
Reinvestment Risk. If market interest rates decline, income earned from a Fund’s portfolio may be reinvested at rates below that of the original bond that generated the income.
Call Risk or Prepayment Risk. Issuers may exercise their option to prepay principal earlier than scheduled, forcing a Fund to reinvest in lower-yielding securities.
Inverse Floater Risk. The Funds may invest in inverse floaters. Due to their leveraged nature, these investments can greatly increase a Fund’s exposure to interest rate risk and credit risk. In addition, investments in inverse floaters involve the risk that the Fund could lose more than its original principal investment.
| NKG | |
| | Nuveen Georgia Dividend Advantage Municipal Fund 2 |
| | Performance Overview and Holding Summaries as of May 31, 2014 |
Refer to the Glossary of Terms Used in this Report for further definition of the terms used within this section.
Average Annual Total Returns as of May 31, 2014
| | Average Annual |
| | 1-Year | 5-Year | 10-Year |
| NKG at Common Share NAV | 0.56% | 6.07% | 5.10% |
| NKG at Common Share Price | 2.17% | 7.07% | 5.03% |
| S&P Municipal Bond Georgia Index | 2.96% | 5.43% | 4.77% |
| S&P Municipal Bond Index | 2.98% | 5.91% | 5.06% |
| Lipper Other States Municipal Debt Funds Classification Average | 2.79% | 8.02% | 5.79% |
Past performance is not predictive of future results. Current performance may be higher or lower than the data shown. Returns do not reflect the deduction of taxes that shareholders may have to pay on Fund distributions or upon the sale of Fund shares. Comparative index and Lipper return information is provided for the Fund’s shares at NAV only. Indexes and Lipper averages are not available for direct investment.
This data relates to the securities held in the Fund’s portfolio of investments as of the end of the reporting period. It should not be construed as a measure of performance for the Fund itself. Holdings are subject to change.
Ratings shown are the highest rating given by one of the following national rating agencies: Standard & Poor’s Group, Moody’s Investors Service, Inc. or Fitch, Inc. Credit ratings are subject to change. AAA, AA, A and BBB are investment grade ratings; BB, B, CCC, CC, C and D are below-investment grade ratings. Certain bonds backed by U.S. Government or agency securities are regarded as having an implied rating equal to the rating of such securities. Holdings designated N/R are not rated by these national rating agencies.
| | |
| Fund Allocation | |
| (% of net assets) | |
| Municipal Bonds | 150.7% |
| Floating Rate Obligations | (2.2)% |
| VMTP Shares, at Liquidation Value | (50.8)% |
| Other Assets Less Liabilities | 2.3% |
| | |
| Portfolio Composition | |
| (% of total investments) | |
| Tax Obligation/General | 27.0% |
| Tax Obligation/Limited | 15.1% |
| Water and Sewer | 14.7% |
| Health Care | 10.3% |
| Education and Civic Organizations | 9.8% |
| Transportation | 7.4% |
| Utilities | 6.5% |
| Other Industries | 9.2% |
| | |
| Credit Quality | |
| (% of total investment exposure) | |
| AAA/U.S. Guaranteed | 16.7% |
| AA | 51.6% |
| A | 18.5% |
| BBB | 5.5% |
| BB or Lower | 2.4% |
| N/R (not rated) | 5.3% |
| NMY | |
| | Nuveen Maryland Premium Income Municipal Fund |
| | Performance Overview and Holding Summaries as of May 31, 2014 |
Refer to the Glossary of Terms Used in this Report for further definition of the terms used within this section.
Average Annual Total Returns as of May 31, 2014
| | Average Annual |
| | 1-Year | 5-Year | 10-Year |
| NMY at Common Share NAV | (1.38)% | 6.72% | 5.43% |
| NMY at Common Share Price | (1.43)% | 5.74% | 4.17% |
| S&P Municipal Bond Maryland Index | 2.73% | 5.06% | 4.62% |
| S&P Municipal Bond Index | 2.98% | 5.91% | 5.06% |
| Lipper Other States Municipal Debt Funds Classification Average | 2.79% | 8.02% | 5.79% |
Past performance is not predictive of future results. Current performance may be higher or lower than the data shown. Returns do not reflect the deduction of taxes that shareholders may have to pay on Fund distributions or upon the sale of Fund shares. Comparative index and Lipper return information is provided for the Fund’s shares at NAV only. Indexes and Lipper averages are not available for direct investment.
This data relates to the securities held in the Fund’s portfolio of investments as of the end of the reporting period. It should not be construed as a measure of performance for the Fund itself. Holdings are subject to change.
Ratings shown are the highest rating given by one of the following national rating agencies: Standard & Poor’s Group, Moody’s Investors Service, Inc. or Fitch, Inc. Credit ratings are subject to change. AAA, AA, A and BBB are investment grade ratings; BB, B, CCC, CC, C and D are below-investment grade ratings. Certain bonds backed by U.S. Government or agency securities are regarded as having an implied rating equal to the rating of such securities. Holdings designated N/R are not rated by these national rating agencies.
| | |
| Fund Allocation | |
| (% of net assets) | |
| Municipal Bonds | 150.4% |
| Common Stocks | 0.9% |
| Floating Rate Obligations | (6.2)% |
| VMTP Shares, at Liquidation Value | (47.3)% |
| Other Assets Less Liabilities | 2.2% |
| | |
| Portfolio Composition | |
| (% of total investments) | |
| Health Care | 22.9% |
| Tax Obligation/Limited | 13.8% |
| U.S. Guaranteed | 13.5% |
| Education and Civic Organizations | 8.6% |
| Tax Obligation/General | 7.6% |
| Housing/Single Family | 6.3% |
| Consumer Staples | 4.9% |
| Long-Term Care | 4.1% |
| Other Industries | 18.3% |
| | |
| Credit Quality | |
| (% of total investment exposure) | |
| AAA/U.S. Guaranteed | 23.3% |
| AA | 30.0% |
| A | 20.2% |
| BBB | 14.1% |
| BB or Lower | 8.0% |
| N/R (not rated) | 3.8% |
| N/A (not applicable) | 0.6% |
| NOM | |
| | Nuveen Missouri Premium Income Municipal Fund |
| | Performance Overview and Holding Summaries as of May 31, 2014 |
Refer to the Glossary of Terms Used in this Report for further definition of the terms used within this section.
Average Annual Total Returns as of May 31, 2014
| | Average Annual |
| | 1-Year | 5-Year | 10-Year |
| NOM at Common Share NAV | 2.52% | 8.34% | 5.54% |
| NOM at Common Share Price | (0.83)% | 8.53% | 5.23% |
| S&P Municipal Bond Missouri Index | 3.79% | 5.96% | 5.28% |
| S&P Municipal Bond Index | 2.98% | 5.91% | 5.06% |
| Lipper Other States Municipal Debt Funds Classification Average | 2.79% | 8.02% | 5.79% |
Past performance is not predictive of future results. Current performance may be higher or lower than the data shown. Returns do not reflect the deduction of taxes that shareholders may have to pay on Fund distributions or upon the sale of Fund shares. Comparative index and Lipper return information is provided for the Fund’s shares at NAV only. Indexes and Lipper averages are not available for direct investment.
This data relates to the securities held in the Fund’s portfolio of investments as of the end of the reporting period. It should not be construed as a measure of performance for the Fund itself. Holdings are subject to change.
Ratings shown are the highest rating given by one of the following national rating agencies: Standard & Poor’s Group, Moody’s Investors Service, Inc. or Fitch, Inc. Credit ratings are subject to change. AAA, AA, A and BBB are investment grade ratings; BB, B, CCC, CC, C and D are below-investment grade ratings. Certain bonds backed by U.S. Government or agency securities are regarded as having an implied rating equal to the rating of such securities. Holdings designated N/R are not rated by these national rating agencies.
| | |
| Fund Allocation | |
| (% of net assets) | |
| Municipal Bonds | 156.4% |
| Floating Rate Obligations | (6.7)% |
| MTP Shares, at Liquidation Value | (54.1)% |
| Other Assets Less Liabilities | 4.4% |
| | |
| Portfolio Composition | |
| (% of total investments) | |
| Health Care | 22.0% |
| Tax Obligation/Limited | 15.6% |
| Education and Civic Organizations | 13.1% |
| Tax Obligation/General | 9.9% |
| Utilities | 8.8% |
| Transportation | 8.3% |
| Long-Term Care | 7.5% |
| Water and Sewer | 6.0% |
| U.S. Guaranteed | 5.9% |
| Other Industries | 2.9% |
| | |
| Credit Quality | |
| (% of total investment exposure) | |
| AAA/U.S. Guaranteed | 11.8% |
| AA | 35.3% |
| A | 29.0% |
| BBB | 17.6% |
| N/R (not rated) | 6.3% |
| NNC | |
| | Nuveen North Carolina Premium Income Municipal Fund |
| | Performance Overview and Holding Summaries as of May 31, 2014 |
Refer to the Glossary of Terms Used in this Report for further definition of the terms used within this section.
Average Annual Total Returns as of May 31, 2014
| | | Average Annual | |
| | 1-Year | 5-Year | 10-Year |
| NNC at Common Share NAV | 3.54% | 6.45% | 5.31% |
| NNC at Common Share Price | 0.10% | 6.00% | 3.52% |
| S&P Municipal Bond North Carolina Index | 2.99% | 5.16% | 4.93% |
| S&P Municipal Bond Index | 2.98% | 5.91% | 5.06% |
| Lipper Other States Municipal Debt Funds Classification Average | 2.79% | 8.02% | 5.79% |
Past performance is not predictive of future results. Current performance may be higher or lower than the data shown. Returns do not reflect the deduction of taxes that shareholders may have to pay on Fund distributions or upon the sale of Fund shares. Comparative index and Lipper return information is provided for the Fund’s shares at NAV only. Indexes and Lipper averages are not available for direct investment.
This data relates to the securities held in the Fund’s portfolio of investments as of the end of the reporting period. It should not be construed as a measure of performance for the Fund itself. Holdings are subject to change.
Ratings shown are the highest rating given by one of the following national rating agencies: Standard & Poor’s Group, Moody’s Investors Service, Inc. or Fitch, Inc. Credit ratings are subject to change. AAA, AA, A and BBB are investment grade ratings; BB, B, CCC, CC, C and D are below-investment grade ratings. Certain bonds backed by U.S. Government or agency securities are regarded as having an implied rating equal to the rating of such securities. Holdings designated N/R are not rated by these national rating agencies.
| Fund Allocation | |
| (% of net assets) | |
| Municipal Bonds | 148.6% |
| VMTP Shares, at Liquidation Value | (50.7)% |
| Other Assets Less Liabilities | 2.1% |
| | |
| Portfolio Composition | |
| (% of total investments) | |
| Health Care | 20.8% |
| Water and Sewer | 18.1% |
| Education and Civic Organizations | 13.4% |
| Transportation | 11.4% |
| Tax Obligation/Limited | 10.9% |
| U.S. Guaranteed | 9.5% |
| Utilities | 6.9% |
| Other Industries | 9.0% |
| | |
| Credit Quality | |
| (% of total investment exposure) | |
| AAA/U.S. Guaranteed | 24.4% |
| AA | 49.7% |
| A | 20.9% |
| BBB | 3.7% |
| N/R (not rated) | 1.3% |
| NPV | |
| | Nuveen Virginia Premium Income Municipal Fund |
| | Performance Overview and Holding Summaries as of May 31, 2014 |
Refer to the Glossary of Terms Used in this Report for further definition of the terms used within this section.
Average Annual Total Returns as of May 31, 2014
| | | Average Annual | |
| | 1-Year | 5-Year | 10-Year |
| NPV at Common Share NAV | (0.79)% | 6.58% | 5.25% |
| NPV at Common Share Price | (0.93)% | 4.11% | 4.42% |
| S&P Municipal Bond Virginia Index | 2.88% | 5.14% | 4.70% |
| S&P Municipal Bond Index | 2.98% | 5.91% | 5.06% |
| Lipper Other States Municipal Debt Funds Classification Average | 2.79% | 8.02% | 5.79% |
Past performance is not predictive of future results. Current performance may be higher or lower than the data shown. Returns do not reflect the deduction of taxes that shareholders may have to pay on Fund distributions or upon the sale of Fund shares. Comparative index and Lipper return information is provided for the Fund’s shares at NAV only. Indexes and Lipper averages are not available for direct investment.
This data relates to the securities held in the Fund’s portfolio of investments as of the end of the reporting period. It should not be construed as a measure of performance for the Fund itself. Holdings are subject to change.
Ratings shown are the highest rating given by one of the following national rating agencies: Standard & Poor’s Group, Moody’s Investors Service, Inc. or Fitch, Inc. Credit ratings are subject to change. AAA, AA, A and BBB are investment grade ratings; BB, B, CCC, CC, C and D are below-investment grade ratings. Certain bonds backed by U.S. Government or agency securities are regarded as having an implied rating equal to the rating of such securities. Holdings designated N/R are not rated by these national rating agencies.
| Fund Allocation | |
| (% of net assets) | |
| Municipal Bonds | 150.5% |
| Floating Rate Obligations | (3.6)% |
| VRDP Shares, at Liquidation Value | (49.3)% |
| Other Assets Less Liabilities | 2.4% |
| | |
| Portfolio Composition | |
| (% of total investments) | |
| Health Care | 18.3% |
| Tax Obligation/Limited | 17.2% |
| Transportation | 15.8% |
| U.S. Guaranteed | 9.4% |
| Tax Obligation/General | 8.7% |
| Education and Civic Organizations | 6.7% |
| Long-Term Care | 6.0% |
| Water and Sewer | 5.5% |
| Other Industries | 12.4% |
| | |
| Credit Quality | |
| (% of total investment exposure) | |
| AAA/U.S. Guaranteed | 23.8% |
| AA | 39.0% |
| A | 8.6% |
| BBB | 19.4% |
| BB or Lower | 5.8% |
| N/R (not rated) | 3.4% |
Shareholder Meeting Report |
The annual meeting of shareholders was held in the offices of Nuveen Investments on November 26, 2013 for NKG, NMY, NOM, NNC and NPV; at this meeting the shareholders were asked to vote on the election of Board Members.
| | | NKG | | NMY | |
| | | | Common and | | | | | | Common and | | | | |
| | | | Preferred | | | | | | Preferred | | | | |
| | | | Shares voting | | | | | | Shares voting | | | | |
| | | | together | | | Preferred | | | together | | | Preferred | |
| | | | as a class | | | Shares | | | as a class | | | Shares | |
| Approval of the Board Members was reached as follows: | | | | | | | | | | |
| William C. Hunter | | | | | | | | | | | | | |
| For | | | — | | | 4,594,006 | | | — | | | 9,846,112 | |
| Withhold | | | — | | | 1,475,209 | | | — | | | 1,968,484 | |
| Total | | | — | | | 6,069,215 | | | — | | | 11,814,596 | |
| William J. Schneider | | | | | | | | | | | | | |
| For | | | — | | | 4,584,799 | | | — | | | 9,846,112 | |
| Withhold | | | — | | | 1,484,416 | | | — | | | 1,968,484 | |
| Total | | | — | | | 6,069,215 | | | — | | | 11,814,596 | |
| Judith M. Stockdale | | | | | | | | | | | | | |
| For | | | 12,901,420 | | | — | | | 27,843,449 | | | — | |
| Withhold | | | 1,742,930 | | | — | | | 2,863,073 | | | — | |
| Total | | | 14,644,350 | | | — | | | 30,706,522 | | | — | |
| Carole E. Stone | | | | | | | | | | | | | |
| For | | | 12,901,420 | | | — | | | 27,852,143 | | | — | |
| Withhold | | | 1,742,930 | | | — | | | 2,854,379 | | | — | |
| Total | | | 14,644,350 | | | — | | | 30,706,522 | | | — | |
| Virginia L. Stringer | | | | | | | | | | | | | |
| For | | | 12,910,627 | | | — | | | 27,852,143 | | | — | |
| Withhold | | | 1,733,723 | | | — | | | 2,854,379 | | | — | |
| Total | | | 14,644,350 | | | — | | | 30,706,522 | | | — | |
| | | NOM | | NNC | | NPV | |
| | | | Common and | | | | | | Common and | | | | | | Common and | | | | |
| | | | Preferred | | | | | | Preferred | | | | | | Preferred | | | | |
| | | | Shares voting | | | | | | Shares voting | | | | | | Shares voting | | | | |
| | | | together | | | Preferred | | | together | | | Preferred | | | together | | | Preferred | |
| | | | as a class | | | Shares | | | as a class | | | Shares | | | as a class | | | Shares | |
| Approval of the Board Members was reached as follows: | | | | | | | | | | | | | | | | |
| William C. Hunter | | | | | | | | | | | | | | | | | | | |
| For | | | — | | | 1,060,449 | | | — | | | 7,302,476 | | | — | | | 980 | |
| Withhold | | | — | | | 260,319 | | | — | | | 1,333,551 | | | — | | | 300 | |
| Total | | | — | | | 1,320,768 | | | — | | | 8,636,027 | | | — | | | 1,280 | |
| William J. Schneider | | | | | | | | | | | | | | | | | | | |
| For | | | — | | | 1,060,449 | | | — | | | 7,300,876 | | | — | | | 980 | |
| Withhold | | | — | | | 260,319 | | | — | | | 1,335,151 | | | — | | | 300 | |
| Total | | | — | | | 1,320,768 | | | — | | | 8,636,027 | | | — | | | 1,280 | |
| Judith M. Stockdale | | | | | | | | | | | | | | | | | | | |
| For | | | 2,634,713 | | | — | | | 20,116,370 | | | — | | | 13,169,112 | | | — | |
| Withhold | | | 610,593 | | | — | | | 2,478,568 | | | — | | | 532,352 | | | — | |
| Total | | | 3,245,306 | | | — | | | 22,594,938 | | | — | | | 13,701,464 | | | — | |
| Carole E. Stone | | | | | | | | | | | | | | | | | | | |
| For | | | 2,635,073 | | | — | | | 20,163,813 | | | — | | | 13,237,613 | | | — | |
| Withhold | | | 610,233 | | | — | | | 2,431,125 | | | — | | | 463,851 | | | — | |
| Total | | | 3,245,306 | | | — | | | 22,594,938 | | | — | | | 13,701,464 | | | — | |
| Virginia L. Stringer | | | | | | | | | | | | | | | | | | | |
| For | | | 2,622,911 | | | — | | | 20,162,566 | | | — | | | 13,267,723 | | | — | |
| Withhold | | | 622,395 | | | — | | | 2,432,372 | | | — | | | 433,741 | | | — | |
| Total | | | 3,245,306 | | | — | | | 22,594,938 | | | — | | | 13,701,464 | | | — | |
Report of Independent Registered Public Accounting Firm
The Board of Trustees and Shareholders
Nuveen Georgia Dividend Advantage Municipal Fund 2
Nuveen Maryland Premium Income Municipal Fund
Nuveen Missouri Premium Income Municipal Fund
Nuveen North Carolina Premium Income Municipal Fund
Nuveen Virginia Premium Income Municipal Fund
We have audited the accompanying statements of assets and liabilities, including the portfolios of investments, of Nuveen Georgia Dividend Advantage Municipal Fund 2, Nuveen Maryland Premium Income Municipal Fund, Nuveen Missouri Premium Income Municipal Fund, Nuveen North Carolina Premium Income Municipal Fund, and Nuveen Virginia Premium Income Municipal Fund (the “Funds”) as of May 31, 2014, and the related statements of operations and cash flows for the year then ended, the statements of changes in net assets for each of the two years in the period then ended, and the financial highlights for each of the five years in the period then ended. These financial statements and financial highlights are the responsibility of the Funds’ management. Our responsibility is to express an opinion on these financial statements and financial highlights based on our audits.
We conducted our audits in accordance with the standards of the Public Company Accounting Oversight Board (United States). Those standards require that we plan and perform the audits to obtain reasonable assurance about whether the financial statements and financial highlights are free of material misstatement. We were not engaged to perform an audit of the Funds’ internal control over financial reporting. Our audits included consideration of internal control over financial reporting as a basis for designing audit procedures that are appropriate in the circumstances, but not for the purpose of expressing an opinion on the effectiveness of the Funds’ internal control over financial reporting. Accordingly, we express no such opinion. An audit also includes examining, on a test basis, evidence supporting the amounts and disclosures in the financial statements and financial highlights, assessing the accounting principles used and significant estimates made by management, and evaluating the overall financial statement presentation. Our procedures included confirmation of securities owned as of May 31, 2014, by correspondence with the custodian and brokers or by other appropriate auditing procedures where replies from brokers were not received. We believe that our audits provide a reasonable basis for our opinion.
In our opinion, the financial statements and financial highlights referred to above present fairly, in all material respects, the financial positions of Nuveen Georgia Dividend Advantage Municipal Fund 2, Nuveen Maryland Premium Income Municipal Fund, Nuveen Missouri Premium Income Municipal Fund, Nuveen North Carolina Premium Income Municipal Fund, and Nuveen Virginia Premium Income Municipal Fund at May 31, 2014, and the results of their operations and their cash flows for the year then ended, the changes in their net assets for each of the two years in the period then ended, and the financial highlights for each of the five years in the period then ended, in conformity with U.S. generally accepted accounting principles.
Chicago, Illinois
July 28, 2014
| NKG | | |
| | Nuveen Georgia Dividend Advantage Municipal Fund 2 | |
| | Portfolio of Investments | May 31, 2014 |
| | Principal | | | Optional Call | | | | | |
| | Amount (000) | | Description (1) | Provisions (2) | | Ratings (3) | | Value | |
| | | | LONG-TERM INVESTMENTS – 150.7% (100.0% of Total Investments) | | | | | | |
| | | | MUNICIPAL BONDS – 150.7% (100.0% of Total Investments) | | | | | | |
| | | | Education and Civic Organizations – 14.8% (9.8% of Total Investments) | | | | | | |
| $ | 1,760 | | Athens Housing Authority, Georgia, Student Housing Lease Revenue Bonds, UGAREF East Campus Housing LLC Project, Series 2009, 5.250%, 6/15/35 | 6/19 at 100.00 | | Aa2 | $ | 1,928,872 | |
| | 5,000 | | Atlanta Development Authority, Georgia, Educational Facilities Revenue Bonds, Science Park LLC Project, Series 2007, 5.000%, 7/01/39 | 7/17 at 100.00 | | Aa3 | | 5,408,900 | |
| | 700 | | Carrollton Payroll Development Authority, Georgia, Student Housing Revenue Bonds, University of West Georgia, Series 2004A, 5.000%, 9/01/21 – SYNCORA GTY Insured | 9/14 at 100.00 | | A1 | | 708,267 | |
| | 1,340 | | Douglas County Development Authority, Georgia, Charter School Revenue Bonds, Brighten Academy Project, Series 2013B, 7.000%, 10/01/43 | 10/23 at 100.00 | | N/R | | 1,408,193 | |
| | 625 | | Fulton County Development Authority, Georgia, Revenue Bonds, Georgia Tech Foundation Technology Square Project, Refunding Series 2012A, 5.000%, 11/01/31 | 5/22 at 100.00 | | AA+ | | 712,281 | |
| | 150 | | Georgia Higher Education Facilities Authority, Revenue Bonds, USG Real Estate Foundation I LLC Project, Series 2008, 6.000%, 6/15/28 | 6/18 at 100.00 | | A2 | | 172,500 | |
| | | | Private Colleges and Universities Authority, Georgia, Revenue Bonds, Emory University, Series 2009, Trust 3404: | | | | | | |
| | 730 | | 17.876%, 3/01/17 (IF) | No Opt. Call | | AA+ | | 1,114,367 | |
| | 1,150 | | 17.906%, 3/01/17 (IF) | No Opt. Call | | AA+ | | 1,749,242 | |
| | 3,000 | | Private Colleges and Universities Authority, Georgia, Revenue Bonds, Emory University, Series 2013A, 5.000%, 10/01/43 | 10/23 at 100.00 | | AA+ | | 3,372,150 | |
| | 1,325 | | Private Colleges and Universities Authority, Georgia, Revenue Bonds, Mercer University Project, Refunding Series 2012C, 5.250%, 10/01/30 | 10/22 at 100.00 | | Baa2 | | 1,423,368 | |
| | 1,000 | | Private Colleges and Universities Authority, Georgia, Revenue Bonds, Mercer University, Series 2012A, 5.000%, 10/01/32 | 10/21 at 100.00 | | Baa2 | | 1,043,910 | |
| | 1,180 | | Savannah Economic Development Authority, Georgia, Revenue Bonds, Armstrong Atlantic State University, Compass Point LLC Project, Series 2005, 5.000%,
7/01/25 – SYNCORA GTY Insured | 7/15 at 100.00 | | A2 | | 1,237,643 | |
| | 1,490 | | Savannah Economic Development Authority, Georgia, Revenue Bonds, Armstrong Center LLC, Series 2005A, 5.000%, 12/01/34 – SYNCORA GTY Insured | 12/15 at 100.00 | | A3 | | 1,565,871 | |
| | 19,450 | | Total Education and Civic Organizations | | | | | 21,845,564 | |
| | | | Health Care – 15.5% (10.3% of Total Investments) | | | | | | |
| | | | Baldwin County Hospital Authority, Georgia, Revenue Bonds, Oconee Regional Medical Center, Series 1998: | | | | | | |
| | 205 | | 5.250%, 12/01/22 | 8/14 at 100.00 | | CCC | | 175,574 | |
| | 745 | | 5.375%, 12/01/28 | 6/14 at 100.00 | | CCC | | 594,138 | |
| | | | Coffee County Hospital Authority, Georgia, Revenue Bonds, Coffee County Regional Medical Center, Series 2004: | | | | | | |
| | 285 | | 5.000%, 12/01/19 | 12/14 at 100.00 | | BB– | | 286,263 | |
| | 2,400 | | 5.250%, 12/01/22 | 12/14 at 100.00 | | BB– | | 2,407,488 | |
| | 255 | | 5.000%, 12/01/26 | 12/14 at 100.00 | | BB– | | 255,156 | |
| | 715 | | Coweta County Development Authority, Georgia, Revenue Bonds, Piedmont Healthcare, Inc. Project, Series 2010, 5.000%, 6/15/40 | 6/20 at 100.00 | | AA– | | 752,044 | |
| | 2,500 | | Franklin County Industrial Building Authority, Georgia, Revenue Bonds, Ty Cobb Regional Medical Center Project, Series 2010, 8.000%, 12/01/40 | 12/20 at 100.00 | | N/R | | 2,063,200 | |
| | | | Gainesville and Hall County Hospital Authority, Georgia, Revenue Anticipation Certificates, Northeast Georgia Health Services Inc., Series 2010B: | | | | | | |
| | 1,000 | | 5.000%, 2/15/33 | 2/20 at 100.00 | | AA– | | 1,063,910 | |
| | 1,000 | | 5.125%, 2/15/40 | 2/20 at 100.00 | | AA– | | 1,058,160 | |
| | 3,945 | | 5.250%, 2/15/45 | 2/41 at 100.00 | | AA– | | 4,199,374 | |
| NKG | Nuveen Georgia Dividend Advantage Municipal Fund 2 | |
| | Portfolio of Investments (continued) | May 31, 2014 |
| | Principal | | | Optional Call | | | | | |
| | Amount (000) | | Description (1) | Provisions (2) | | Ratings (3) | | Value | |
| | | | Health Care (continued) | | | | | | |
| $ | 1,620 | | Greene County Development Authority, Georgia, Health System Revenue Bonds, Catholic Health East Issue, Series 2012, 5.000%, 11/15/37 | No Opt. Call | | Aa2 | $ | 1,771,114 | |
| | 2,540 | | Houston County Hospital Authority, Georgia, Revenue Bonds, Houston Healthcare Project, Series 2007, 5.250%, 10/01/35 | 10/17 at 100.00 | | A+ | | 2,648,585 | |
| | | | Macon-Bibb County Hospital Authority, Georgia, Revenue Anticipation Certificates, Medical Center of Central Georgia Inc., Series 2009: | | | | | | |
| | 425 | | 5.000%, 8/01/32 | 8/19 at 100.00 | | AA | | 461,780 | |
| | 975 | | 5.000%, 8/01/35 | 8/19 at 100.00 | | AA | | 1,051,937 | |
| | 1,470 | | Medical Center Hospital Authority, Georgia, Revenue Anticipation Certificates, Columbus Regional Healthcare System, Inc. Project, Series 2010, 5.000%, 8/01/21 – AGM Insured | No Opt. Call | | AA | | 1,670,978 | |
| | 2,300 | | Valdosta and Lowndes County Hospital Authority, Georgia, Revenue Certificates, South Georgia Medical Center, Series 2007, 5.000%, 10/01/33 | 10/17 at 100.00 | | A+ | | 2,371,760 | |
| | 22,380 | | Total Health Care | | | | | 22,831,461 | |
| | | | Housing/Multifamily – 4.9% (3.3% of Total Investments) | | | | | | |
| | 1,205 | | Atlanta Urban Residential Finance Authority, Georgia, Multifamily Housing Revenue Bonds, Testletree Village Apartments, Series 2013A, 4.500%, 11/01/35 | 11/23 at 100.00 | | A– | | 1,208,169 | |
| | 1,600 | | Cobb County Development Authority, Georgia, Revenue Bonds, KSU University II Real Estate Foundation, LLC Project, Series 2011, 5.000%, 7/15/41 – AGM Insured | 7/21 at 100.00 | | AA | | 1,712,096 | |
| | 1,375 | | Cobb County Development Authority, Georgia, Student Housing Revenue Bonds, KSU Village II Real Estate Foundation LLC Project, Series 2007A, 5.250%, 7/15/38 – AMBAC Insured | 7/17 at 100.00 | | Baa2 | | 1,398,458 | |
| | | | Savannah Economic Development Authority, Georgia, GNMA Collateralized Multifamily Housing Revenue Bonds, Snap I-II-III Apartments, Series 2002A: | | | | | | |
| | 500 | | 5.150%, 11/20/22 (Alternative Minimum Tax) | 11/14 at 100.00 | | AA+ | | 504,045 | |
| | 980 | | 5.200%, 11/20/27 (Alternative Minimum Tax) | 11/14 at 100.00 | | AA+ | | 986,203 | |
| | 1,465 | | 5.250%, 11/20/32 (Alternative Minimum Tax) | 11/14 at 100.00 | | AA+ | | 1,472,179 | |
| | 7,125 | | Total Housing/Multifamily | | | | | 7,281,150 | |
| | | | Housing/Single Family – 0.8% (0.5% of Total Investments) | | | | | | |
| | | | Georgia Housing and Finance Authority, Single Family Mortgage Bonds, Series 2006C-2: | | | | | | |
| | 1,000 | | 4.500%, 12/01/27 (Alternative Minimum Tax) | 12/15 at 100.00 | | AAA | | 1,011,720 | |
| | 170 | | 4.550%, 12/01/31 (Alternative Minimum Tax) | 12/15 at 100.00 | | AAA | | 171,117 | |
| | 1,170 | | Total Housing/Single Family | | | | | 1,182,837 | |
| | | | Industrials – 2.9% (1.9% of Total Investments) | | | | | | |
| | 2,190 | | Cobb County Development Authority, Georgia, Solid Waste Disposal Revenue Bonds, Georgia Waste Management Project, Series 2004A, 5.000%, 4/01/33 (Alternative Minimum Tax) | 4/16 at 101.00 | | A– | | 2,283,513 | |
| | 2,000 | | Fulton County Development Authority, Georgia, Local District Cooling Authority Revenue Bonds, Maxon Atlantic Station LLC, Series 2005A, 5.125%, 3/01/26 (Mandatory put 3/01/15) (Alternative Minimum Tax) | 9/15 at 100.00 | | BBB | | 2,012,140 | |
| | 4,190 | | Total Industrials | | | | | 4,295,653 | |
| | | | Materials – 2.2% (1.5% of Total Investments) | | | | | | |
| | 2,000 | | Richmond County Development Authority, Georgia, Environmental Improvement Revenue Bonds, International Paper Company, Series 2001A, 6.250%, 2/01/25 (Alternative Minimum Tax) | 8/14 at 100.00 | | BBB | | 2,001,600 | |
| | 20 | | Richmond County Development Authority, Georgia, Environmental Improvement Revenue Bonds, International Paper Company, Series 2003A, 5.750%, 11/01/27 (Alternative Minimum Tax) | 8/14 at 100.00 | | BBB | | 20,014 | |
| | 850 | | Richmond County Development Authority, Georgia, Environmental Improvement Revenue Refunding Bonds, International Paper Company, Series 2002A, 6.000%, 2/01/25 (Alternative Minimum Tax) | 8/14 at 100.00 | | BBB | | 850,689 | |
| | 390 | | Savannah Economic Development Authority, Georgia, Pollution Control Revenue Bonds, Union Camp Corporation, Series 1995, 6.150%, 3/01/17 | No Opt. Call | | Baa2 | | 421,348 | |
| | 3,260 | | Total Materials | | | | | 3,293,651 | |
| | Principal | | | Optional Call | | | | | |
| | Amount (000) | | Description (1) | Provisions (2) | | Ratings (3) | | Value | |
| | | | Tax Obligation/General – 40.8% (27.0% of Total Investments) | | | | | | |
| $ | 2,000 | | Chatham County Hospital Authority, Georgia, Seven Mill Tax Pledge Refunding and Improvement Revenue Bonds, Memorial Health University Medical Center, Inc., Series 2012A, 5.000%, 1/01/31 | 1/22 at 100.00 | | AA | $ | 2,230,020 | |
| | 1,500 | | Cherokee County Resource Recovery Development Authority, Georgia, Solid Waste Disposal Revenue Bonds, Ball Ground Recycling LLC Project, Series 2007A, 5.000%, 7/01/37– AMBAC Insured (Alternative Minimum Tax) | 7/17 at 100.00 | | AA+ | | 1,549,035 | |
| | 1,000 | | Clark County Hospital Authority, Georgia, Hospital Revenue Bonds, Athens Regional Medical Center, Series 2007, 5.000%, 1/01/27 – NPFG Insured | 1/17 at 100.00 | | Aa1 | | 1,087,780 | |
| | 600 | | Clarke County Hospital Authority, Georgia, Hospital Revenue Certificates, Athens Regional Medical Center, Series 2012, 5.000%, 1/01/32 | 1/22 at 100.00 | | Aa1 | | 654,690 | |
| | 3,315 | | Decatur, Georgia, General Obligation Bonds, Series 2007, 5.000%, 1/01/31 – AGM Insured | 1/17 at 100.00 | | AA+ | | 3,587,526 | |
| | | | East Point Building Authority, Georgia, Revenue Bonds, Water and Sewer Project Series 2006A: | | | | | | |
| | 3,000 | | 5.000%, 2/01/30 – SYNCORA GTY Insured | 2/16 at 100.00 | | N/R | | 3,029,700 | |
| | 2,000 | | 5.000%, 2/01/34 – SYNCORA GTY Insured | 2/16 at 100.00 | | N/R | | 2,017,540 | |
| | 1,090 | | Floyd County Hospital Authority, Georgia, Revenue Anticipation Certificates, Floyd Medical Center, Series 2003, 5.000%, 7/01/19 – NPFG Insured | 7/15 at 100.00 | | Aa2 | | 1,105,064 | |
| | 1,135 | | Floyd County Hospital Authority, Georgia, Revenue Anticipation Certificates, Floyd Medical Center, Series 2012B, 5.000%, 7/01/23 | No Opt. Call | | Aa2 | | 1,314,114 | |
| | 1,500 | | Forsyth County Water and Sewerage Authority, Georgia, Revenue Bonds, Series 2007, 5.000%, 4/01/37 – AGM Insured | 4/17 at 100.00 | | Aaa | | 1,638,645 | |
| | 6,400 | | Georgia Environmental Loan Acquisition Corporation, Local Government Loan Securitization Bonds, Loan Pool Series 2011, 5.125%, 3/15/31 | 3/21 at 100.00 | | Aaa | | 7,046,208 | |
| | 3,500 | | Georgia State, General Obligation Bonds, Refunding Series 2009I, 5.000%, 7/01/19 | No Opt. Call | | AAA | | 4,164,755 | |
| | 750 | | Georgia State, General Obligation Bonds, Series 1998D, 5.250%, 10/01/15 | No Opt. Call | | AAA | | 801,030 | |
| | 2,500 | | Georgia State, General Obligation Bonds, Series 2005B, 5.000%, 7/01/15 | No Opt. Call | | AAA | | 2,632,525 | |
| | 2,500 | | Georgia State, General Obligation Bonds, Series 2007E, 5.000%, 8/01/24 | 8/17 at 100.00 | | AAA | | 2,812,975 | |
| | 1,000 | | Georgia State, General Obligation Bonds, Series 2009B, 5.000%, 1/01/26 | 1/19 at 100.00 | | AAA | | 1,168,330 | |
| | 4,900 | | Gwinnett County School District, Georgia, General Obligation Bonds, Series 2008, 5.000%, 2/01/36 (UB) | 2/18 at 100.00 | | AAA | | 5,470,066 | |
| | 3,500 | | Gwinnett County School District, Georgia, General Obligation Bonds, Series 2013, 5.000%, 2/01/36 | 2/23 at 100.00 | | AAA | | 4,012,050 | |
| | | | Henry County Hospital Authority, Georgia, Revenue Certificates, Henry Medical Center, Series 2004: | | | | | | |
| | 1,560 | | 5.000%, 7/01/20 – NPFG Insured | 7/14 at 101.00 | | Aa1 | | 1,581,824 | |
| | 1,500 | | 5.000%, 7/01/34 – NPFG Insured | 7/14 at 101.00 | | Aa1 | | 1,516,920 | |
| | 445 | | La Grange-Troup County Hospital Authority, Georgia, Revenue Anticipation Certificates, Series 2008A, 5.500%, 7/01/38 | 7/18 at 100.00 | | Aa2 | | 495,752 | |
| | 1,569 | | Liberty County Industrial Authority, Georgia, Revenue Bonds, Series 2011A-1, 4.600%, 7/01/26 | No Opt. Call | | N/R | | 1,339,045 | |
| | 2,475 | | Paulding County School District, Georgia, General Obligation Bonds, Series 2007, 5.000%, 2/01/33 | 2/17 at 100.00 | | AA+ | | 2,691,711 | |
| | 2,250 | | Valdosta and Lowndes County Hospital Authority, Georgia, Revenue Certificates, South Georgia Medical Center Project, Series 2011B, 5.000%, 10/01/41 | 10/21 at 100.00 | | Aa2 | | 2,437,065 | |
| | 1,450 | | Wayne County Hospital Authority, Georgia, Hospital Revenue Bonds, Series 2006, 5.000%, 3/01/23 – SYNCORA GTY Insured | 3/16 at 100.00 | | N/R | | 1,471,881 | |
| | 2,000 | | Winder-Barrow Industrial Building Authority, Georgia, Revenue Bonds, City of Winder Project, Refunding Series 2012, 5.000%, 12/01/29 – AGM Insured | 12/21 at 100.00 | | A1 | | 2,246,240 | |
| | 55,439 | | Total Tax Obligation/General | | | | | 60,102,491 | |
| NKG | Nuveen Georgia Dividend Advantage Municipal Fund 2 | |
| | Portfolio of Investments (continued) | May 31, 2014 |
| | Principal | | | Optional Call | | | | | |
| | Amount (000) | | Description (1) | Provisions (2) | | Ratings (3) | | Value | |
| | | | Tax Obligation/Limited – 22.7% (15.1% of Total Investments) | | | | | | |
| | | | Atlanta, Georgia, Tax Allocation Bonds Atlanta Station Project, Series 2007: | | | | | | |
| $ | 110 | | 5.250%, 12/01/19 – AGC Insured | 12/17 at 100.00 | | AA | $ | 121,602 | |
| | 50 | | 5.250%, 12/01/20 – AGC Insured | 12/17 at 100.00 | | AA | | 54,401 | |
| | 80 | | 5.250%, 12/01/21 – AGC Insured | 12/17 at 100.00 | | AA | | 86,436 | |
| | 1,080 | | 5.000%, 12/01/23 – AGC Insured | 12/17 at 100.00 | | AA | | 1,145,988 | |
| | 1,500 | | Atlanta, Georgia, Tax Allocation Bonds, Beltline Project Series 2008B. Remarketed, 7.375%, 1/01/31 | 1/19 at 100.00 | | A2 | | 1,772,475 | |
| | 275 | | Atlanta, Georgia, Tax Allocation Bonds, Beltline Project Series 2008C. Remarketed, 7.500%, 1/01/31 | 1/19 at 100.00 | | A2 | | 326,411 | |
| | 395 | | Atlanta, Georgia, Tax Allocation Bonds, Eastside Project, Series 2005A, 5.625%, 1/01/16 (Alternative Minimum Tax) | 7/15 at 100.00 | | A– | | 413,119 | |
| | | | Atlanta, Georgia, Tax Allocation Bonds, Eastside Project, Series 2005B: | | | | | | |
| | 2,065 | | 5.400%, 1/01/20 | 7/15 at 100.00 | | A– | | 2,155,302 | |
| | 2,750 | | 5.600%, 1/01/30 | 7/15 at 100.00 | | A– | | 2,866,600 | |
| | 725 | | Atlanta, Georgia, Tax Allocation Bonds, Perry Bolton Project Series 2014, 5.000%, 7/01/41 | 7/23 at 100.00 | | A– | | 757,538 | |
| | 3,420 | | Atlanta, Georgia, Tax Allocation Bonds, Princeton Lakes Project, Series 2006, 5.500%, 1/01/31 | 1/16 at 100.00 | | BBB– | | 3,465,896 | |
| | 1,725 | | Cobb-Marietta Coliseum and Exhibit Hall Authority, Georgia, Revenue Bonds, Performing Arts Center, Refunding Series 2013, 5.000%, 1/01/21 | No Opt. Call | | AAA | | 2,092,011 | |
| | 405 | | Cobb-Marietta Coliseum and Exhibit Hall Authority, Georgia, Revenue Bonds, Refunding Series 2005, 5.500%, 10/01/26 – NPFG Insured | No Opt. Call | | AA– | | 481,310 | |
| | | | Cobb-Marietta Coliseum and Exhibit Hall Authority, Georgia, Revenue Refunding Bonds, Series 1993: | | | | | | |
| | 395 | | 5.500%, 10/01/18 – NPFG Insured | No Opt. Call | | AA– | | 420,711 | |
| | 5,745 | | 5.625%, 10/01/26 – NPFG Insured | 10/19 at 100.00 | | AA– | | 6,476,913 | |
| | 2,970 | | Georgia Local Governments, Certificates of Participation, Georgia Municipal Association, Series 1998A, 4.750%, 6/01/28 – NPFG Insured | No Opt. Call | | AA– | | 3,143,210 | |
| | 750 | | Georgia Municipal Association Inc., Certificates of Participation, Atlanta Court Project, Series 2002, 5.125%, 12/01/21 – AMBAC Insured | 8/14 at 100.00 | | N/R | | 751,283 | |
| | | | Georgia Municipal Association Inc., Certificates of Participation, Riverdale Public Purpose Project, Series 2009: | | | | | | |
| | 905 | | 5.375%, 5/01/32 – AGC Insured | 5/19 at 100.00 | | AA | | 984,676 | |
| | 1,165 | | 5.500%, 5/01/38 – AGC Insured | 5/19 at 100.00 | | AA | | 1,260,938 | |
| | 3,460 | | Metropolitan Atlanta Rapid Transit Authority, Georgia, Sales Tax Revenue Refunding Bonds, Series 1992P, 6.250%, 7/01/20 – AMBAC Insured | No Opt. Call | | Aa2 | | 3,827,729 | |
| | 810 | | Tift County Hospital Authority, Georgia, Revenue Anticipation Certificates Series 2012, 5.000%, 12/01/38 | No Opt. Call | | Aa2 | | 890,247 | |
| | 30,780 | | Total Tax Obligation/Limited | | | | | 33,494,796 | |
| | | | Transportation – 11.1% (7.4% of Total Investments) | | | | | | |
| | 2,000 | | Atlanta, Georgia, Airport General Revenue Bonds, Refunding Series 2011B, 5.000%, 1/01/30 | 1/21 at 100.00 | | Aa3 | | 2,173,200 | |
| | 2,000 | | Atlanta, Georgia, Airport General Revenue Bonds, Refunding Series 2012B, 5.000%, 1/01/31 | No Opt. Call | | Aa3 | | 2,242,880 | |
| | 2,810 | | Atlanta, Georgia, Airport General Revenue Bonds, Series 2012C, 5.000%, 1/01/42 (Alternative Minimum Tax) | 1/22 at 100.00 | | Aa3 | | 2,981,832 | |
| | | | Atlanta, Georgia, Airport Passenger Facilities Charge and General Revenue Bonds, Refunding Subordinate Lien Series 2014A: | | | | | | |
| | 2,575 | | 5.000%, 1/01/32 | 1/24 at 100.00 | | A+ | | 2,921,981 | |
| | 3,750 | | 5.000%, 1/01/34 | 1/24 at 100.00 | | A+ | | 4,209,488 | |
| | 1,500 | | Clayton County Development Authority, Georgia, Special Facilities Revenue Bonds, Delta Air Lines, Inc. Project, Series 2009A, 8.750%, 6/01/29 | 6/20 at 100.00 | | B+ | | 1,858,815 | |
| | 14,635 | | Total Transportation | | | | | 16,388,196 | |
| | Principal | | | Optional Call | | | | | |
| | Amount (000) | | Description (1) | Provisions (2) | | Ratings (3) | | Value | |
| | | | U.S. Guaranteed – 3.0% (2.0% of Total Investments) (4) | | | | | | |
| | | | Atlanta, Georgia, Water and Wastewater Revenue Bonds, Series 2004: | | | | | | |
| $ | 500 | | 5.250%, 11/01/15 (Pre-refunded 11/01/14) – AGM Insured | 11/14 at 100.00 | | AA (4) | $ | 510,750 | |
| | 1,225 | | 5.000%, 11/01/24 (Pre-refunded 11/01/14) – AGM Insured | 11/14 at 100.00 | | AA (4) | | 1,250,051 | |
| | 1,550 | | Bulloch County Development Authority, Georgia, Student Housing and Athletic Facility Lease Revenue Bonds, Georgia Southern University, Series 2004, 5.250%, 8/01/21 (Pre-refunded 8/01/14) – SYNCORA GTY Insured | 8/14 at 100.00 | | A1 (4) | | 1,563,470 | |
| | 1,000 | | Douglasville-Douglas County Water and Sewer Authority, Georgia, Water and Sewer Revenue Bonds, Series 2005, 5.000%, 6/01/29 (Pre-refunded 12/01/15) – NPFG Insured | 12/15 at 100.00 | | Aa2 (4) | | 1,071,860 | |
| | 10 | | Georgia Municipal Electric Authority, Senior Lien General Power Revenue Bonds, Series 1993Z, 5.500%, 1/01/20 (Pre-refunded 1/01/17) – FGIC Insured | 1/17 at 100.00 | | A+ (4) | | 10,713 | |
| | 4,285 | | Total U.S. Guaranteed | | | | | 4,406,844 | |
| | | | Utilities – 9.9% (6.5% of Total Investments) | | | | | | |
| | 525 | | Burke County Development Authority, Georgia, Pollution Control Revenue Bonds, Georgia Power Company – Vogtle Plant, First Series 2012, 1.750%, 12/01/49 (Mandatory put 6/01/17) | No Opt. Call | | A | | 533,411 | |
| | 2,000 | | Georgia Municipal Electric Authority, General Power Revenue Bonds, Project 1, Series 2007A, 5.000%, 1/01/25 – NPFG Insured | 1/17 at 100.00 | | AA– | | 2,170,240 | |
| | 3,000 | | Georgia Municipal Electric Authority, General Power Revenue Bonds, Series 2012GG, 5.000%, 1/01/43 | 1/23 at 100.00 | | A+ | | 3,262,680 | |
| | 505 | | Georgia Municipal Electric Authority, Senior Lien General Power Revenue Bonds, Series 1993Z, 5.500%, 1/01/20 – FGIC Insured | No Opt. Call | | A+ | | 549,708 | |
| | | | Main Street Natural Gas Inc., Georgia, Gas Project Revenue Bonds, Series 2006B: | | | | | | |
| | 1,055 | | 5.000%, 3/15/20 | No Opt. Call | | A | | 1,182,149 | |
| | 1,300 | | 5.000%, 3/15/21 | No Opt. Call | | A | | 1,460,329 | |
| | 1,500 | | 5.000%, 3/15/22 | No Opt. Call | | A | | 1,676,055 | |
| | | | Main Street Natural Gas Inc., Georgia, Gas Project Revenue Bonds, Series 2007A: | | | | | | |
| | 350 | | 5.125%, 9/15/17 | No Opt. Call | | A | | 386,183 | |
| | 950 | | 5.000%, 3/15/18 | No Opt. Call | | A+ | | 1,050,282 | |
| | 2,000 | | 5.000%, 3/15/22 | No Opt. Call | | A+ | | 2,286,460 | |
| | 13,185 | | Total Utilities | | | | | 14,557,497 | |
| | | | Water and Sewer – 22.1% (14.7% of Total Investments) | | | | | | |
| | | | Atlanta, Georgia, Water and Wastewater Revenue Bonds, Series 2004: | | | | | | |
| | 260 | | 5.750%, 11/01/30 – AGM Insured | No Opt. Call | | AA | | 331,266 | |
| | 700 | | 5.000%, 11/01/37 – AGM Insured | 11/14 at 100.00 | | AA | | 710,857 | |
| | 5,105 | | Cherokee County Water and Sewerage Authority, Georgia, Revenue Bonds, Series 2001, 5.000%, 8/01/35 – AGM Insured | 8/18 at 100.00 | | AA | | 5,680,180 | |
| | 500 | | Columbus, Georgia, Water and Sewerage Revenue Bonds, Refunding Series 2014A, 5.000%, 5/01/31 | 5/24 at 100.00 | | AA | | 581,275 | |
| | | | Coweta County Water and Sewer Authority, Georgia, Revenue Bonds, Series 2007: | | | | | | |
| | 1,000 | | 5.000%, 6/01/32 | 6/18 at 100.00 | | Aa2 | | 1,105,080 | |
| | 2,000 | | 5.000%, 6/01/37 | 6/18 at 100.00 | | Aa2 | | 2,192,840 | |
| | | | DeKalb County, Georgia, Water and Sewerage Revenue Bonds, Refunding Series 2006B: | | | | | | |
| | 6,000 | | 5.250%, 10/01/32 – AGM Insured | 10/26 at 100.00 | | AA | | 7,140,600 | |
| | 300 | | 5.000%, 10/01/35 – AGM Insured | No Opt. Call | | AA | | 341,685 | |
| | 5,350 | | DeKalb County, Georgia, Water and Sewerage Revenue Bonds, Second Resolution Series 2011A, 5.250%, 10/01/41 | 10/21 at 100.00 | | Aa3 | | 5,985,741 | |
| | 2,225 | | Douglasville-Douglas County Water and Sewer Authority, Georgia, Water and Sewage Revenue Bonds, Series 2007, 5.000%, 6/01/37 – NPFG Insured | 6/17 at 100.00 | | Aa2 | | 2,431,769 | |
| | 1,000 | | Fulton County, Georgia, Water and Sewerage Revenue Bonds, Refunding Series 2013, 5.000%, 1/01/33 | 1/23 at 100.00 | | AA– | | 1,131,370 | |
| | 500 | | Georgia Environmental Loan Acquisition Corporation, Local Government Loan Securitization Bonds, Cobb County-Marietta Water Authority Loans, Series 2011, 5.250%, 2/15/36 | 2/21 at 100.00 | | Aaa | | 548,285 | |
| NKG | Nuveen Georgia Dividend Advantage Municipal Fund 2 | |
| | Portfolio of Investments (continued) | May 31, 2014 |
| | Principal | | | Optional Call | | | | | |
| | Amount (000) | | Description (1) | Provisions (2) | | Ratings (3) | | Value | |
| | | | Water and Sewer (continued) | | | | | | |
| $ | 1,000 | | Midgeville, Georgia, Water and Sewerage Revenue Refunding Bonds, Series 1996, 6.000%, 12/01/21 – AGM Insured | No Opt. Call | | AA | $ | 1,185,520 | |
| | 1,000 | | Unified Government of Athens-Clarke County, Georgia, Water and Sewerage Revenue Bonds, Series 2008, 5.500%, 1/01/38 | 1/19 at 100.00 | | AA+ | | 1,140,610 | |
| | 1,975 | | Walton County Water and Sewerage Authority, Georgia, Revenue Bonds, The Oconee-Hard Creek Reservoir Project, Series 2008, 5.000%, 2/01/38 – AGM Insured | 2/18 at 100.00 | | Aa2 | | 2,140,737 | |
| | 28,915 | | Total Water and Sewer | | | | | 32,647,815 | |
| $ | 204,814 | | Total Long-Term Investments (cost $211,751,466) | | | | | 222,327,955 | |
| | | | Floating Rate Obligations – (2.2)% | | | | | (3,245,000 | ) |
| | | | Variable Rate MuniFund Term Preferred Shares, at Liquidation Value – (50.8)% (5) | | | | | (75,000,000 | ) |
| | | | Other Assets Less Liabilities – 2.3% | | | | | 3,424,388 | |
| | | | Net Assets Applicable to Common Shares – 100% | | | | $ | 147,507,343 | |
| (1) | All percentages shown in the Portfolio of Investments are based on net assets applicable to common shares unless otherwise noted. |
| (2) | Optional Call Provisions (not covered by the report of independent registered public accounting firm): Dates (month and year) and prices of the earliest optional call or redemption. There may be other call provisions at varying prices at later dates. Certain mortgage-backed securities may be subject to periodic principal paydowns. |
| (3) | Ratings (not covered by the report of independent registered public accounting firm): Using the highest of Standard & Poor’s Group (“Standard & Poor’s”), Moody’s Investors Service, Inc. (“Moody’s”) or Fitch, Inc. (“Fitch”) rating. Ratings below BBB by Standard & Poor’s, Baa by Moody’s or BBB by Fitch are considered to be below investment grade. Holdings designated N/R are not rated by any of these national rating agencies. |
| (4) | Backed by an escrow or trust containing sufficient U.S. Government or U.S. Government agency securities, which ensure the timely payment of principal and interest. Certain bonds backed by U.S. Government or agency securities are regarded as having an implied rating equal to the rating of such securities. |
| (5) | Variable Rate MuniFund Term Preferred Shares, at Liquidation Value as a percentage of Total Investments is 33.7%. |
| (IF) | Inverse floating rate investment. |
| (UB) | Underlying bond of an inverse floating rate trust reflected as a financing transaction. See Notes to Financial Statements, Note 3 – Portfolio Securities and Investments in Derivatives, Inverse Floating Rate Securities for more information. |
See accompanying notes to financial statements.
| NMY | | |
| | Nuveen Maryland Premium Income Municipal Fund | |
| | Portfolio of Investments | May 31, 2014 |
| | Principal | | | Optional Call | | | | | |
| | Amount (000) | | Description (1) | Provisions (2) | | Ratings (3) | | Value | |
| | | | LONG-TERM INVESTMENTS – 151.3% (100.0% of Total Investments) | | | | | | |
| | | | MUNICIPAL BONDS – 150.4% (99.4% of Total Investments) | | | | | | |
| | | | Consumer Discretionary – 4.7% (3.1% of Total Investments) | | | | | | |
| | | | Baltimore, Maryland, Senior Lien Convention Center Hotel Revenue Bonds, Series 2006A: | | | | | | |
| $ | 540 | | 5.000%, 9/01/16 – SYNCORA GTY Insured | No Opt. Call | | BB+ | $ | 577,471 | |
| | 400 | | 5.250%, 9/01/19 – SYNCORA GTY Insured | 9/16 at 100.00 | | BB+ | | 424,476 | |
| | 285 | | 5.250%, 9/01/25 – SYNCORA GTY Insured | 9/16 at 100.00 | | BB+ | | 294,197 | |
| | 350 | | 5.250%, 9/01/27 – SYNCORA GTY Insured | 9/16 at 100.00 | | BB+ | | 359,391 | |
| | 535 | | 4.600%, 9/01/30 – SYNCORA GTY Insured | 9/16 at 100.00 | | BB+ | | 524,166 | |
| | 100 | | 5.000%, 9/01/32 – SYNCORA GTY Insured | 9/16 at 100.00 | | BB+ | | 99,992 | |
| | 12,165 | | 5.250%, 9/01/39 – SYNCORA GTY Insured | 9/16 at 100.00 | | BB+ | | 12,199,792 | |
| | 1,000 | | Baltimore, Maryland, Subordinate Lien Convention Center Hotel Revenue Bonds, Series 2006B, 5.875%, 9/01/39 | 9/16 at 100.00 | | Ba2 | | 1,011,750 | |
| | 2,000 | | Maryland Economic Development Corporation, Revenue Bonds, Chesapeake Bay Hyatt Conference Center, Series 2006A, 5.000%, 12/01/31 (4) | 12/16 at 100.00 | | N/R | | 999,360 | |
| | 17,375 | | Total Consumer Discretionary | | | | | 16,490,595 | |
| | | | Consumer Staples – 7.3% (4.9% of Total Investments) | | | | | | |
| | 1,000 | | Buckeye Tobacco Settlement Financing Authority, Ohio, Tobacco Settlement Asset-Backed Revenue Bonds, Senior Lien, Series 2007A-2, 5.875%, 6/01/30 | 6/17 at 100.00 | | B | | 841,820 | |
| | | | Guam Economic Development & Commerce Authority, Tobacco Settlement Asset-Backed Bonds, Series 2007A: | | | | | | |
| | 2,825 | | 5.250%, 6/01/32 | 6/17 at 100.00 | | B | | 2,504,137 | |
| | 2,665 | | 5.625%, 6/01/47 | 6/17 at 100.00 | | B | | 2,118,009 | |
| | 155,700 | | Puerto Rico, The Children’s Trust Fund, Tobacco Settlement Asset-Backed Bonds, Series 2005A, 0.000%, 5/15/50 | 5/15 at 11.19 | | BB– | | 10,199,907 | |
| | | | Puerto Rico, The Children’s Trust Fund, Tobacco Settlement Asset-Backed Refunding Bonds, Series 2002: | | | | | | |
| | 6,505 | | 5.375%, 5/15/33 | 8/14 at 100.00 | | BBB+ | | 6,570,115 | |
| | 3,270 | | 5.500%, 5/15/39 | 8/14 at 100.00 | | BBB | | 2,981,128 | |
| | 800 | | Tobacco Settlement Financing Corporation, Virgin Islands, Tobacco Settlement Asset-Backed Bonds, Series 2001, 5.000%, 5/15/31 | 11/14 at 100.00 | | A3 | | 777,704 | |
| | 172,765 | | Total Consumer Staples | | | | | 25,992,820 | |
| | | | Education and Civic Organizations – 13.0% (8.6% of Total Investments) | | | | | | |
| | 2,375 | | Frederick County, Maryland, Educational Facilities Revenue Bonds, Mount Saint Mary’s University, Series 2006, 5.625%, 9/01/38 | 9/16 at 100.00 | | BB+ | | 2,291,068 | |
| | 1,750 | | Maryland Health and Higher Educational Facilities Authority, Educational Facilities Leasehold Mortgage Revenue Bonds, McLean School, Series 2001, 6.000%, 7/01/31 | 8/14 at 100.00 | | BB | | 1,749,895 | |
| | 700 | | Maryland Health and Higher Educational Facilities Authority, Revenue Bonds, Goucher College, Series 2012A, 5.000%, 7/01/34 | 7/22 at 100.00 | | A– | | 761,796 | |
| | 530 | | Maryland Health and Higher Educational Facilities Authority, Revenue Bonds, Johns Hopkins University, Series 2008A, 5.250%, 7/01/38 | No Opt. Call | | AA+ | | 593,717 | |
| | 1,250 | | Maryland Health and Higher Educational Facilities Authority, Revenue Bonds, Loyola University Maryland, Series 2012A, 5.000%, 10/01/39 | 10/22 at 100.00 | | A | | 1,351,150 | |
| | 3,500 | | Maryland Health and Higher Educational Facilities Authority, Revenue Bonds, Maryland Institute College of Art, Series 2006, 5.000%, 6/01/30 | 6/16 at 100.00 | | Baa1 | | 3,579,240 | |
| | 1,130 | | Maryland Health and Higher Educational Facilities Authority, Revenue Bonds, Maryland Institute College of Art, Series 2007, 5.000%, 6/01/36 | 6/17 at 100.00 | | Baa1 | | 1,157,018 | |
| | | | Maryland Health and Higher Educational Facilities Authority, Revenue Bonds, Maryland Institute College of Art, Series 2012: | | | | | | |
| | 1,500 | | 5.000%, 6/01/34 | No Opt. Call | | Baa1 | | 1,598,160 | |
| | 3,000 | | 5.000%, 6/01/47 | 6/22 at 100.00 | | Baa1 | | 3,168,270 | |
| NMY | Nuveen Maryland Premium Income Municipal Fund | |
| | Portfolio of Investments (continued) | May 31, 2014 |
| | Principal | | | Optional Call | | | | | |
| | Amount (000) | | Description (1) | Provisions (2) | | Ratings (3) | | Value | |
| | | | Education and Civic Organizations (continued) | | | | | | |
| $ | 745 | | Maryland Health and Higher Educational Facilities Authority, Revenue Bonds, Patterson Park Public Charter School Issue, Series 2010, 6.000%, 7/01/40 | 7/20 at 100.00 | | BBB– | $ | 768,944 | |
| | | | Maryland Health and Higher Educational Facilities Authority, Revenue Bonds, The Johns Hopkins University, Series 2012A: | | | | | | |
| | 1,145 | | 5.000%, 7/01/30 | No Opt. Call | | AA+ | | 1,317,632 | |
| | 1,050 | | 5.000%, 7/01/37 | No Opt. Call | | AA+ | | 1,176,147 | |
| | | | Maryland Health and Higher Educational Facilities Authority, Revenue Bonds, The Johns Hopkins University, Series 2013B: | | | | | | |
| | 500 | | 5.000%, 7/01/38 | 7/23 at 100.00 | | AA+ | | 563,945 | |
| | 4,375 | | 4.250%, 7/01/41 | 7/23 at 100.00 | | AA+ | | 4,598,781 | |
| | | | Montgomery County Revenue Authority, Maryland, Lease Revenue Bonds, Montgomery College Arts Center Project, Series 2005A: | | | | | | |
| | 1,300 | | 5.000%, 5/01/18 | 5/15 at 100.00 | | AA | | 1,355,302 | |
| | 1,365 | | 5.000%, 5/01/19 | 5/15 at 100.00 | | AA | | 1,422,330 | |
| | 615 | | 5.000%, 5/01/20 | 5/15 at 100.00 | | AA | | 640,307 | |
| | 625 | | Morgan State University, Maryland, Student Tuition and Fee Revenue Bonds, Academic Fees and Auxiliary Facilities, Series 2012, 5.000%, 7/01/29 | 7/22 at 100.00 | | A+ | | 702,444 | |
| | 9,445 | | Morgan State University, Maryland, Student Tuition and Fee Revenue Refunding Bonds, Academic Fees and Auxiliary Facilities, Series 1993, 6.100%, 7/01/20 – NPFG Insured | No Opt. Call | | AA– | | 11,065,290 | |
| | 300 | | University of Maryland, Auxiliary Facility and Tuition Revenue Bonds, Series 2006A, 5.000%, 10/01/14 | No Opt. Call | | AA+ | | 304,953 | |
| | 265 | | University of Puerto Rico, University System Revenue Bonds, Series 2006P, 5.000%, 6/01/23 | 6/16 at 100.00 | | BB+ | | 167,281 | |
| | 1,145 | | University of Puerto Rico, University System Revenue Bonds, Series 2006Q, 5.000%, 6/01/19 | 6/16 at 100.00 | | BB+ | | 813,477 | |
| | | | Westminster, Maryland, Educational Facilities Revenue Bonds, McDaniel College, Series 2006: | | | | | | |
| | 2,000 | | 5.000%, 11/01/31 | 11/16 at 100.00 | | BBB+ | | 2,049,560 | |
| | 2,750 | | 4.500%, 11/01/36 | 11/16 at 100.00 | | BBB+ | | 2,763,365 | |
| | 43,360 | | Total Education and Civic Organizations | | | | | 45,960,072 | |
| | | | Health Care – 34.6% (22.9% of Total Investments) | | | | | | |
| | 500 | | Fredericksburg Economic Development Authority, Virginia, Hospital Facilities Revenue Bonds, MediCorp Health System, Series 2007, 5.000%, 6/15/14 | No Opt. Call | | Baa1 | | 500,765 | |
| | 2,445 | | Maryland Health and Higher Educational Facilities Authority, Revenue Bonds Doctors Community Hospital, Refunding Series 2010, 5.750%, 7/01/38 | 7/20 at 100.00 | | Baa3 | | 2,526,492 | |
| | | | Maryland Health and Higher Educational Facilities Authority, Revenue Bonds, Adventist Healthcare, Series 2011A: | | | | | | |
| | 1,350 | | 6.250%, 1/01/31 | 1/22 at 100.00 | | Baa2 | | 1,537,542 | |
| | 375 | | 6.125%, 1/01/36 | 1/22 at 100.00 | | Baa2 | | 420,949 | |
| | 1,355 | | Maryland Health and Higher Educational Facilities Authority, Revenue Bonds, Anne Arundel Health System Issue, Series 2012, 5.000%, 7/01/24 | No Opt. Call | | A– | | 1,556,665 | |
| | 1,500 | | Maryland Health and Higher Educational Facilities Authority, Revenue Bonds, Anne Arundel Health System, Series 2009A, 6.750%, 7/01/39 | 7/19 at 100.00 | | A– | | 1,809,870 | |
| | 2,500 | | Maryland Health and Higher Educational Facilities Authority, Revenue Bonds, Anne Arundel Health System, Series 2010, 5.000%, 7/01/40 | 7/19 at 100.00 | | A– | | 2,635,125 | |
| | 2,000 | | Maryland Health and Higher Educational Facilities Authority, Revenue Bonds, Calvert Health System Issue, Series 2013, 5.000%, 7/01/38 | 7/23 at 100.00 | | A | | 2,155,780 | |
| | | | Maryland Health and Higher Educational Facilities Authority, Revenue Bonds, Carroll Hospital Center, Series 2006: | | | | | | |
| | 1,000 | | 4.500%, 7/01/26 | 7/16 at 100.00 | | A3 | | 1,026,930 | |
| | 2,550 | | 5.000%, 7/01/40 | 7/16 at 100.00 | | A3 | | 2,614,337 | |
| | | | Maryland Health and Higher Educational Facilities Authority, Revenue Bonds, Carroll Hospital Center, Series 2012A: | | | | | | |
| | 1,000 | | 4.000%, 7/01/30 | 7/22 at 100.00 | | A3 | | 1,020,070 | |
| | 1,775 | | 5.000%, 7/01/37 | 7/22 at 100.00 | | A3 | | 1,899,073 | |
| | Principal | | | Optional Call | | | | | |
| | Amount (000) | | Description (1) | Provisions (2) | | Ratings (3) | | Value | |
| | | | Health Care (continued) | | | | | | |
| $ | 4,050 | | Maryland Health and Higher Educational Facilities Authority, Revenue Bonds, Doctors Community Hospital, Series 2007A, 5.000%, 7/01/29 | 7/17 at 100.00 | | Baa3 | $ | 4,086,086 | |
| | 4,335 | | Maryland Health and Higher Educational Facilities Authority, Revenue Bonds, Frederick Memorial Hospital Issue, Series 2012A, 4.250%, 7/01/32 | No Opt. Call | | Baa1 | | 4,370,330 | |
| | | | Maryland Health and Higher Educational Facilities Authority, Revenue Bonds, Johns Hopkins Health System Obligated Group Issue, Series 2011A: | | | | | | |
| | 500 | | 5.000%, 5/15/25 | 5/21 at 100.00 | | AA– | | 574,130 | |
| | 500 | | 5.000%, 5/15/26 | 5/21 at 100.00 | | AA– | | 569,025 | |
| | 4,225 | | Maryland Health and Higher Educational Facilities Authority, Revenue Bonds, Kaiser Permanente System, Series 1998A, 5.375%, 7/01/15 | 7/14 at 100.00 | | A+ | | 4,241,604 | |
| | 2,735 | | Maryland Health and Higher Educational Facilities Authority, Revenue Bonds, LifeBridge Health System, Series 2008, 5.000%, 7/01/28 – AGC Insured | 7/17 at 100.00 | | AA | | 2,858,841 | |
| | | | Maryland Health and Higher Educational Facilities Authority, Revenue Bonds, LifeBridge Health System, Series 2011: | | | | | | |
| | 500 | | 5.750%, 7/01/31 | No Opt. Call | | A | | 564,360 | |
| | 1,000 | | 6.000%, 7/01/41 | 7/21 at 100.00 | | A | | 1,140,840 | |
| | 4,060 | | Maryland Health and Higher Educational Facilities Authority, Revenue Bonds, MedStar Health, Series 2004, 5.375%, 8/15/24 | 8/14 at 100.00 | | A2 | | 4,102,995 | |
| | 7,720 | | Maryland Health and Higher Educational Facilities Authority, Revenue Bonds, MedStar Health, Series 2007, 5.250%, 5/15/46 – BHAC Insured | 5/16 at 100.00 | | AA+ | | 8,240,482 | |
| | | | Maryland Health and Higher Educational Facilities Authority, Revenue Bonds, Mercy Medical Center Project, Series 2007A: | | | | | | |
| | 2,375 | | 5.000%, 7/01/37 | 7/17 at 100.00 | | BBB | | 2,441,833 | |
| | 2,905 | | 5.500%, 7/01/42 | 7/17 at 100.00 | | BBB | | 3,056,089 | |
| | 2,850 | | Maryland Health and Higher Educational Facilities Authority, Revenue Bonds, Mercy Medical Center, Series 2011, 5.000%, 7/01/31 | 7/22 at 100.00 | | BBB | | 3,014,873 | |
| | 3,950 | | Maryland Health and Higher Educational Facilities Authority, Revenue Bonds, Peninsula Regional Medical Center, Series 2006, 5.000%, 7/01/36 | 7/16 at 100.00 | | A | | 4,086,591 | |
| | 4,450 | | Maryland Health and Higher Educational Facilities Authority, Revenue Bonds, The Johns Hopkins Health System Obligated Group Issue, Series 2010, 5.000%, 5/15/40 | 5/20 at 100.00 | | AA– | | 4,760,432 | |
| | | | Maryland Health and Higher Educational Facilities Authority, Revenue Bonds, Union Hospital of Cecil County, Series 2005: | | | | | | |
| | 1,000 | | 5.000%, 7/01/35 | 7/15 at 100.00 | | A | | 1,012,300 | |
| | 6,620 | | 5.000%, 7/01/40 | 7/15 at 100.00 | | A | | 6,688,716 | |
| | | | Maryland Health and Higher Educational Facilities Authority, Revenue Bonds, University of Maryland Medical System Issue, Series 2013A: | | | | | | |
| | 11,500 | | 5.000%, 7/01/43 | 7/22 at 100.00 | | A2 | | 12,213,920 | |
| | 3,750 | | 4.000%, 7/01/43 | 7/22 at 100.00 | | A2 | | 3,674,025 | |
| | | | Maryland Health and Higher Educational Facilities Authority, Revenue Bonds, University of Maryland Medical System, Series 2006: | | | | | | |
| | 700 | | 5.000%, 7/01/31 | 7/16 at 100.00 | | A2 | | 717,801 | |
| | 1,325 | | 5.000%, 7/01/36 | 7/16 at 100.00 | | A2 | | 1,356,018 | |
| | 4,155 | | Maryland Health and Higher Educational Facilities Authority, Revenue Bonds, University of Maryland Medical System, Series 2010, 5.125%, 7/01/39 | 7/19 at 100.00 | | A2 | | 4,375,880 | |
| | | | Maryland Health and Higher Educational Facilities Authority, Revenue Bonds, Washington County Hospital, Series 2008: | | | | | | |
| | 135 | | 5.750%, 1/01/33 | 1/18 at 100.00 | | BBB | | 140,208 | |
| | 7,075 | | 5.750%, 1/01/38 | 1/18 at 100.00 | | BBB | | 7,317,248 | |
| | 1,950 | | 6.000%, 1/01/43 | 1/18 at 100.00 | | BBB | | 2,024,861 | |
| | | | Maryland Health and Higher Educational Facilities Authority, Revenue Bonds, Western Maryland Health, Series 2006A: | | | | | | |
| | 2,910 | | 4.500%, 1/01/22 – NPFG Insured | 7/16 at 100.00 | | AA– | | 3,102,351 | |
| | 3,190 | | 5.000%, 7/01/34 – NPFG Insured | 7/16 at 100.00 | | AA– | | 3,255,044 | |
| | 8,000 | | Montgomery County, Maryland, Revenue Bonds, Trinity Health Credit Group, Refunding Series 2011MD, 5.000%, 12/01/40 | 12/21 at 100.00 | | Aa2 | | 8,684,080 | |
| | 116,815 | | Total Health Care | | | | | 122,374,561 | |
| NMY | Nuveen Maryland Premium Income Municipal Fund | |
| | Portfolio of Investments (continued) | May 31, 2014 |
| | Principal | | | Optional Call | | | | | |
| | Amount (000) | | Description (1) | Provisions (2) | | Ratings (3) | | Value | |
| | | | Housing/Multifamily – 6.1% (4.0% of Total Investments) | | | | | | |
| $ | 2,035 | | Anne Arundel County, Maryland, FNMA Multifamily Housing Revenue Bonds, Glenview Gardens Apartments Project, Series 2009, 5.000%, 1/01/28 (Mandatory put 1/01/27) | 1/20 at 102.00 | | AA+ | $ | 2,220,511 | |
| | | | Howard County Housing Commission, Maryland, Revenue Bonds, The Verona at Oakland Mills Project, Series 2013: | | | | | | |
| | 3,000 | | 5.000%, 10/01/28 | 10/23 at 100.00 | | A+ | | 3,238,320 | |
| | 2,000 | | 4.625%, 10/01/28 | 10/23 at 100.00 | | A+ | | 2,108,860 | |
| | 2,110 | | Maryland Community Development Administration, Multifamily Housing Revenue Bonds, Princess Anne Apartments, Series 2001D, 5.450%, 12/15/33 (Alternative Minimum Tax) | 6/14 at 100.00 | | Aaa | | 2,111,962 | |
| | | | Maryland Economic Development Corporation, Senior Lien Student Housing Revenue Bonds, University of Maryland – Baltimore, Series 2003A: | | | | | | |
| | 30 | | 5.000%, 10/01/15 | 8/14 at 100.00 | | B3 | | 29,937 | |
| | 3,460 | | 5.625%, 10/01/23 | 8/14 at 100.00 | | B3 | | 3,266,863 | |
| | | | Maryland Economic Development Corporation, Student Housing Revenue Bonds, Salisbury University Project, Refunding Series 2013: | | | | | | |
| | 500 | | 5.000%, 6/01/27 | 6/23 at 100.00 | | Baa3 | | 531,385 | |
| | 500 | | 5.000%, 6/01/34 | 6/23 at 100.00 | | Baa3 | | 521,085 | |
| | 1,500 | | Maryland Economic Development Corporation, Student Housing Revenue Bonds, Sheppard Pratt University Village, Series 2012, 5.000%, 7/01/33 | No Opt. Call | | BBB– | | 1,577,295 | |
| | 5,115 | | Maryland Economic Development Corporation, Student Housing Revenue Refunding Bonds, University of Maryland College Park Projects, Series 2006, 5.000%, 6/01/33 – CIFG Insured | 6/16 at 100.00 | | AA | | 5,381,543 | |
| | 165 | | Montgomery County Housing Opportunities Commission, Maryland, GNMA/FHA-Insured Multifamily Housing Revenue Bonds, Series 1995A, 5.900%, 7/01/15 | 7/14 at 100.00 | | Aa2 | | 165,688 | |
| | 405 | | Montgomery County Housing Opportunities Commission, Maryland, Multifamily Housing Development Bonds, Series 2000B, 6.200%, 7/01/30 (Alternative Minimum Tax) | 7/14 at 100.00 | | Aaa | | 405,689 | |
| | 20,820 | | Total Housing/Multifamily | | | | | 21,559,138 | |
| | | | Housing/Single Family – 9.5% (6.3% of Total Investments) | | | | | | |
| | 3,000 | | Maryland Community Development Administration Department of Housing and Community Development, Residential Revenue Bonds, Series 2009B, 4.750%, 9/01/39 | 9/18 at 100.00 | | Aa2 | | 3,094,710 | |
| | 1,990 | | Maryland Community Development Administration Department of Housing and Community Development, Residential Revenue Bonds, Series 2010B, 5.250%, 9/01/35 | 3/20 at 100.00 | | Aa2 | | 2,107,669 | |
| | 2,365 | | Maryland Community Development Administration Department of Housing and Community Development, Residential Revenue Bonds, Series 2014A, 4.300%, 9/01/32 | 9/23 at 100.00 | | Aa2 | | 2,489,423 | |
| | 5,335 | | Maryland Community Development Administration, Department of Housing and Community Development, Residential Revenue Bonds, Series 2005E, 4.900%, 9/01/36 (Alternative Minimum Tax) (UB) (5) | 9/14 at 100.00 | | Aa2 | | 5,341,510 | |
| | 1,800 | | Maryland Community Development Administration, Department of Housing and Community Development, Residential Revenue Bonds, Series 2006B, 4.750%, 9/01/25 (Alternative Minimum Tax) (UB) (5) | 9/15 at 100.00 | | Aa2 | | 1,826,190 | |
| | 2,345 | | Maryland Community Development Administration, Department of Housing and Community Development, Residential Revenue Bonds, Series 2006F, 4.900%, 9/01/26 (Alternative Minimum Tax) (UB) (5) | 9/15 at 100.00 | | Aa2 | | 2,380,012 | |
| | 7,500 | | Maryland Community Development Administration, Department of Housing and Community Development, Residential Revenue Bonds, Series 2006I, 4.875%, 9/01/26 (Alternative Minimum Tax) (UB) (5) | 3/16 at 100.00 | | Aa2 | | 7,652,926 | |
| | 4,075 | | Maryland Community Development Administration, Department of Housing and Community Development, Residential Revenue Bonds, Series 2006L, 4.900%, 9/01/31 (Alternative Minimum Tax) (UB) (5) | 9/16 at 100.00 | | Aa2 | | 4,147,455 | |
| | 2,820 | | Maryland Community Development Administration, Department of Housing and Community Development, Residential Revenue Bonds, Series 2007D, 4.850%, 9/01/37 (Alternative Minimum Tax) (UB) (5) | 3/17 at 100.00 | | Aa2 | | 2,852,374 | |
| | 1,500 | | Maryland Community Development Administration, Department of Housing and Community Development, Residential Revenue Bonds, Series 2007H, 5.000%, 9/01/27 (Alternative Minimum Tax) (UB) (5) | 3/17 at 100.00 | | Aa2 | | 1,548,780 | |
| | 32,730 | | Total Housing/Single Family | | | | | 33,441,049 | |
| | Principal | | | Optional Call | | | | | |
| | Amount (000) | | Description (1) | Provisions (2) | | Ratings (3) | | Value | |
| | | | Industrials – 2.8% (1.8% of Total Investments) | | | | | | |
| $ | 5,895 | | Maryland Economic Development Corporation, Economic Development Revenue Bonds, Transportation Facilities Project, Series 2010A, 5.750%, 6/01/35 | 6/20 at 100.00 | | Baa3 | $ | 6,278,882 | |
| | 3,340 | | Maryland Economic Development Corporation, Solid Waste Disposal Revenue Bonds, Waste Management Inc., Series 2002, 4.600%, 4/01/16 (Alternative Minimum Tax) | No Opt. Call | | A– | | 3,528,009 | |
| | 9,235 | | Total Industrials | | | | | 9,806,891 | |
| | | | Long-Term Care – 6.2% (4.1% of Total Investments) | | | | | | |
| | 5,215 | | Baltimore County, Maryland, Revenue Bonds, Oak Crest Village, Series 2007A, 5.000%, 1/01/37 | 1/17 at 100.00 | | A– | | 5,336,614 | |
| | 2,050 | | Gaithersburg, Maryland, Economic Development Revenue Bonds, Asbury Methodist Homes Inc., Series 2009B, 6.000%, 1/01/23 | 1/20 at 100.00 | | BBB | | 2,310,699 | |
| | | | Maryland Health and Higher Educational Facilities Authority, Revenue Bonds, Charlestown Community Issue, Series 2010: | | | | | | |
| | 1,685 | | 6.125%, 1/01/30 | 1/21 at 100.00 | | A | | 1,873,973 | |
| | 5,060 | | 6.250%, 1/01/45 | 1/21 at 100.00 | | A | | 5,602,179 | |
| | 1,000 | | Maryland Health and Higher Educational Facilities Authority, Revenue Bonds, Edenwald, Series 2006A, 5.400%, 1/01/31 | 7/16 at 100.00 | | N/R | | 1,029,540 | |
| | | | Maryland Health and Higher Educational Facilities Authority, Revenue Bonds, King Farm Presbyterian Community, Series 2007A: | | | | | | |
| | 600 | | 5.000%, 1/01/17 | No Opt. Call | | N/R | | 639,036 | |
| | 1,460 | | 5.250%, 1/01/27 | 1/17 at 100.00 | | N/R | | 1,488,893 | |
| | 1,050 | | 5.300%, 1/01/37 | 1/17 at 100.00 | | N/R | | 1,059,482 | |
| | 2,480 | | Maryland Health and Higher Educational Facilities Authority, Revenue Bonds, Mercy Ridge Retirement Community, Series 2007, 4.750%, 7/01/34 | 7/17 at 100.00 | | A– | | 2,534,858 | |
| | 20,600 | | Total Long-Term Care | | | | | 21,875,274 | |
| | | | Tax Obligation/General – 11.4% (7.6% of Total Investments) | | | | | | |
| | 1,565 | | Anne Arundel County, Maryland, General Obligation Bonds, Series 2006, 5.000%, 3/01/21 | 3/16 at 100.00 | | AAA | | 1,690,607 | |
| | 685 | | Anne Arundel County, Maryland, Water and Sewer Revenue Bonds, Series 2006, 5.000%, 3/01/17 | 3/16 at 100.00 | | AAA | | 742,047 | |
| | 350 | | Baltimore County, Maryland, General Obligation Bonds, Consolidated Public Improvement Series 2009, 5.000%, 8/01/14 | No Opt. Call | | AAA | | 352,919 | |
| | | | Baltimore, Maryland, General Obligation Bonds, Consolidated Public Improvements, Series 2011A: | | | | | | |
| | 1,000 | | 5.000%, 10/15/29 | 10/21 at 100.00 | | Aa2 | | 1,145,290 | |
| | 1,200 | | 5.000%, 10/15/30 | 10/21 at 100.00 | | Aa2 | | 1,366,632 | |
| | 805 | | Charles County, Maryland, Consolidated General Obligation Public Improvement Bonds, Series 2006, 5.000%, 3/01/16 | No Opt. Call | | AA+ | | 872,250 | |
| | 2,425 | | Charles County, Maryland, Consolidated General Obligation Public Improvement Bonds, Series 2011, 5.000%, 7/15/14 | No Opt. Call | | AAA | | 2,439,914 | |
| | 1,500 | | Frederick County, Maryland, General Obligation Public Facilities Bonds, Series 2005, 5.000%, 8/01/14 | No Opt. Call | | AAA | | 1,512,450 | |
| | 2,305 | | Maryland National Capital Park Planning Commission, Prince George’s County, General Obligation Bonds, Park Acquisition and Development, Series 2004EE-2, 5.000%, 1/15/17 | 1/15 at 100.00 | | AAA | | 2,318,761 | |
| | 835 | | Maryland State, General Obligation Bonds, State and Local Facilities Loan, First Series 2014C, 5.000%, 8/01/15 | No Opt. Call | | AAA | | 882,537 | |
| | 95 | | Maryland, General Obligation Bonds, State and Local Facilities Loan, Second Series 2009B, 5.250%, 8/15/14 | No Opt. Call | | AAA | | 96,023 | |
| | 1,000 | | Maryland, General Obligation Bonds, State and Local Facilities Loan, Second Series 2010B, 5.000%, 8/01/14 | No Opt. Call | | AAA | | 1,008,340 | |
| | 2,000 | | Miami-Dade County School District, Florida, General Obligation Bonds, Series 1998 Refunding, 5.375%, 8/01/14 – AGM Insured | No Opt. Call | | AA | | 2,017,760 | |
| | 3,500 | | Montgomery County, Maryland, Consolidated General Obligation Public Improvement Bonds, Refunding Series 2010A, 5.000%, 8/01/14 | No Opt. Call | | AAA | | 3,529,190 | |
| | 3,000 | | Montgomery County, Maryland, Consolidated General Obligation Public Improvement Bonds, Refunding Series 2011A, 5.000%, 7/01/14 | No Opt. Call | | AAA | | 3,012,720 | |
| NMY | Nuveen Maryland Premium Income Municipal Fund | |
| | Portfolio of Investments (continued) | May 31, 2014 |
| | Principal | | | Optional Call | | | | | |
| | Amount (000) | | Description (1) | Provisions (2) | | Ratings (3) | | Value | |
| | | | Tax Obligation/General (continued) | | | | | | |
| $ | 5,850 | | Montgomery County, Maryland, Consolidated General Obligation Public Improvement Bonds, Series 2005A, 5.000%, 7/01/15 | No Opt. Call | | AAA | $ | 6,160,109 | |
| | 2,800 | | Montgomery County, Maryland, Consolidated General Obligation Public Improvement Bonds, Series 2006A, 5.000%, 5/01/16 | No Opt. Call | | AAA | | 3,054,604 | |
| | 1,315 | | Prince George’s County, Maryland, General Obligation Consolidated Public Improvement Bonds, Series 2004F, 5.000%, 12/01/15 | No Opt. Call | | AAA | | 1,347,310 | |
| | 2,270 | | Puerto Rico, General Obligation and Public Improvement Bonds, Series 2002A, 5.500%, 7/01/20 – NPFG Insured | No Opt. Call | | AA– | | 2,473,869 | |
| | 2,155 | | Puerto Rico, General Obligation Bonds, Public Improvement Refunding Series 2007A, 5.500%, 7/01/20 – NPFG Insured | No Opt. Call | | AA– | | 2,348,648 | |
| | 2,000 | | Washington Suburban Sanitary District, Montgomery and Prince George’s Counties, Maryland, General Obligation Bonds, Consolidated Public Improvement, Refunding Series 2013, 3.000%, 6/01/15 | No Opt. Call | | AAA | | 2,057,880 | |
| | 38,655 | | Total Tax Obligation/General | | | | | 40,429,860 | |
| | | | Tax Obligation/Limited – 20.9% (13.8% of Total Investments) | | | | | | |
| | 1,200 | | Anne Arundel County, Maryland, Consolidated Special Taxing District Revenue Bonds, Villages of Dorchester & Farmington Village Projects, Series 2013, 5.000%, 7/01/32 | 7/23 at 100.00 | | A+ | | 1,328,688 | |
| | 865 | | Anne Arundel County, Maryland, Special Obligation Bonds, National Business Park – North Project, Series 2010, 6.100%, 7/01/40 | 7/18 at 102.00 | | N/R | | 924,599 | |
| | 385 | | Baltimore County, Maryland, Certificates of Participation, Equipment Acquisition Program, Series 2012, 4.000%, 10/01/14 | No Opt. Call | | AA+ | | 389,986 | |
| | 120 | | Baltimore, Maryland, Revenue Refunding Bonds, Convention Center, Series 1998, 5.000%, 9/01/19 – NPFG Insured | 9/14 at 100.00 | | AA– | | 120,426 | |
| | 300 | | Baltimore, Maryland, Special Obligation Bonds, North Locust Point Project, Series 2005, 5.500%, 9/01/34 | 9/15 at 101.00 | | N/R | | 306,933 | |
| | | | Frederick County, Maryland, Lake Linganore Village Community Development Special Obligation Bonds, Series 2001A: | | | | | | |
| | 99 | | 5.600%, 7/01/20 – RAAI Insured | 1/15 at 100.00 | | N/R | | 99,191 | |
| | 450 | | 5.700%, 7/01/29 – RAAI Insured | 1/15 at 100.00 | | N/R | | 450,315 | |
| | | | Frederick County, Maryland, Special Obligation Bonds, Urbana Community Development Authority, Series 2010A: | | | | | | |
| | 5,350 | | 5.000%, 7/01/30 | 7/20 at 100.00 | | A– | | 5,778,696 | |
| | 2,355 | | 5.000%, 7/01/40 | 7/20 at 100.00 | | A– | | 2,484,266 | |
| | 1,780 | | Golden State Tobacco Securitization Corporation, California, Enhanced Tobacco Settlement Asset-Backed Revenue Bonds, Series 2005A, 5.000%, 6/01/45 | 6/15 at 100.00 | | A2 | | 1,806,522 | |
| | 1,000 | | Government of Guam, Business Privilege Tax Bonds, Series 2011A, 5.250%, 1/01/36 | 1/22 at 100.00 | | A | | 1,054,610 | |
| | 2,050 | | Hyattsville, Maryland, Special Obligation Bonds, University Town Center Project, Series 2004, 5.750%, 7/01/34 | 7/14 at 102.00 | | N/R | | 2,092,558 | |
| | 11,750 | | Maryland Department of Transportation, Consolidated Transportation Revenue Bonds, Series 2002, 5.500%, 2/01/16 | No Opt. Call | | AAA | | 12,782,473 | |
| | 2,380 | | Maryland Department of Transportation, Consolidated Transportation Revenue Bonds, Series 2004, 5.000%, 11/01/14 | No Opt. Call | | AAA | | 2,429,076 | |
| | 920 | | Maryland Stadium Authority, Lease Revenue Bonds, Montgomery County Conference Center, Series 2012, 4.000%, 6/15/14 | No Opt. Call | | AA+ | | 921,481 | |
| | 1,675 | | Montgomery County, Maryland, Special Obligation Bonds, West Germantown Development District, Senior Series 2002A, 5.500%, 7/01/27 – RAAI Insured | 7/14 at 100.00 | | A+ | | 1,678,032 | |
| | 3,000 | | Prince George’s County, Maryland, Certificates of Participation, Equipment Acquisition Program, Series 2012, 3.000%, 10/15/14 | No Opt. Call | | AA+ | | 3,032,610 | |
| | 740 | | Prince George’s County, Maryland, Lease Revenue Bonds, Upper Marlboro Justice Center, Series 2003A, 5.000%, 6/30/14 – NPFG Insured | No Opt. Call | | AA+ | | 742,982 | |
| | 6,650 | | Prince George’s County, Maryland, Special Obligation Bonds, National Harbor Project, Series 2005, 5.200%, 7/01/34 | 7/15 at 100.00 | | N/R | | 6,700,008 | |
| | Principal | | | Optional Call | | | | | |
| | Amount (000) | | Description (1) | Provisions (2) | | Ratings (3) | | Value | |
| | | | Tax Obligation/Limited (continued) | | | | | | |
| $ | 1,406 | | Prince George’s County, Maryland, Special Tax District Bonds, Victoria Falls Project, Series 2005, 5.250%, 7/01/35 | 1/15 at 100.00 | | N/R | $ | 1,406,787 | |
| | 1,100 | | Puerto Rico Highway and Transportation Authority, Highway Revenue Bonds, Series 2007N, 5.500%, 7/01/29 – AMBAC Insured | No Opt. Call | | Ba2 | | 1,069,211 | |
| | 1,000 | | Puerto Rico Highway and Transportation Authority, Subordinate Lien Highway Revenue Bonds, Series 2003, 5.250%, 7/01/15 – FGIC Insured | 8/14 at 100.00 | | BB+ | | 855,700 | |
| | | | Puerto Rico Infrastructure Financing Authority, Special Tax Revenue Bonds, Series 2005A: | | | | | | |
| | 2,000 | | 0.000%, 7/01/33 – FGIC Insured | No Opt. Call | | BB+ | | 311,720 | |
| | 1,530 | | 0.000%, 7/01/44 – AMBAC Insured | No Opt. Call | | BB+ | | 155,754 | |
| | 2,100 | | Puerto Rico Municipal Finance Agency, Series 2002A, 5.250%, 8/01/21 – AGM Insured | 8/14 at 100.00 | | AA | | 2,101,575 | |
| | 970 | | Puerto Rico Sales Tax Financing Corporation, Sales Tax Revenue Bonds, First Subordinate Series 2009A, 0.000%, 8/01/32 | 8/26 at 100.00 | | A+ | | 789,367 | |
| | 200 | | Puerto Rico Sales Tax Financing Corporation, Sales Tax Revenue Bonds, First Subordinate Series 2010A, 5.500%, 8/01/42 | 2/20 at 100.00 | | A+ | | 162,874 | |
| | 4,310 | | Puerto Rico Sales Tax Financing Corporation, Sales Tax Revenue Bonds, First Subordinate Series 2010C, 5.250%, 8/01/41 | 8/20 at 100.00 | | A+ | | 3,428,864 | |
| | | | Puerto Rico Sales Tax Financing Corporation, Sales Tax Revenue Bonds, Series 2007A: | | | | | | |
| | 7,000 | | 0.000%, 8/01/40 – NPFG Insured | No Opt. Call | | AA– | | 1,336,020 | |
| | 8,000 | | 0.000%, 8/01/41 – NPFG Insured | No Opt. Call | | AA– | | 1,425,760 | |
| | 210 | | 0.000%, 8/01/47 – AMBAC Insured | No Opt. Call | | AA– | | 24,763 | |
| | 12,140 | | 0.000%, 8/01/56 | No Opt. Call | | AA– | | 723,665 | |
| | | | Puerto Rico, Highway Revenue Bonds, Highway and Transportation Authority, Series 2007CC: | | | | | | |
| | 765 | | 5.500%, 7/01/28 – NPFG Insured | No Opt. Call | | AA– | | 778,487 | |
| | 2,300 | | 5.500%, 7/01/30 – AGM Insured | No Opt. Call | | AA | | 2,341,768 | |
| | 1,750 | | Rhode Island Convention Center Authority, Lease Revenue Bonds, Series 2005A, 5.000%, 5/15/21 – AGM Insured | 5/15 at 100.00 | | AA | | 1,825,723 | |
| | 2,000 | | Virgin Islands Public Finance Authority, Gross Receipts Taxes Loan Note, Series 2003, 5.000%, 10/01/26 – RAAI Insured | 10/14 at 100.00 | | BBB+ | | 2,011,420 | |
| | 2,000 | | Virgin Islands Public Finance Authority, Gross Receipts Taxes Loan Note, Series 2006, 5.000%, 10/01/27 – FGIC Insured | 10/16 at 100.00 | | AA– | | 2,070,280 | |
| | 3,500 | | Virgin Islands Public Finance Authority, Matching Fund Loan Notes Revenue Bonds, Senior Lien Series 2010A, 5.000%, 10/01/29 | 10/20 at 100.00 | | BBB | | 3,778,320 | |
| | 1,825 | | Virgin Islands Public Finance Authority, Matching Fund Loan Notes Revenue Bonds, Subordinate Lien Series 2010B, 5.250%, 10/01/29 | 10/20 at 100.00 | | Baa2 | | 1,953,042 | |
| | 99,175 | | Total Tax Obligation/Limited | | | | | 73,674,552 | |
| | | | Transportation – 5.5% (3.6% of Total Investments) | | | | | | |
| | | | Baltimore, Maryland, Revenue Refunding Bonds, Parking System Facilities, Series 1998A: | | | | | | |
| | 1,060 | | 5.250%, 7/01/17 – FGIC Insured | No Opt. Call | | AA– | | 1,143,380 | |
| | 110 | | 5.250%, 7/01/21 – FGIC Insured | No Opt. Call | | AA– | | 125,322 | |
| | 125 | | Guam International Airport Authority, Revenue Bonds, Series 2013C, 6.375%, 10/01/43 (Alternative Minimum Tax) | 10/23 at 100.00 | | BBB | | 139,864 | |
| | | | Maryland Health and Higher Educational Facilities Authority, Parking Facilities Revenue Bonds, Johns Hopkins Hospital, Series 2001: | | | | | | |
| | 1,300 | | 5.000%, 7/01/27 – AMBAC Insured | 7/14 at 100.00 | | N/R | | 1,301,313 | |
| | 1,000 | | 5.000%, 7/01/34 – AMBAC Insured | 7/14 at 100.00 | | N/R | | 1,000,550 | |
| | 750 | | Maryland Health and Higher Educational Facilities Authority, Parking Facilities Revenue Bonds, Johns Hopkins Medical Institution, Series 2004B, 5.000%, 7/01/15 – AMBAC Insured | 1/15 at 100.00 | | N/R | | 768,000 | |
| | 460 | | Maryland Health and Higher Educational Facilities Authority, Parking Revenue Bonds, Johns Hopkins Medical Institutions Parking Facilities, Series 1996, 5.500%,
7/01/26 – AMBAC Insured | 8/14 at 100.00 | | A | | 460,754 | |
| | | | Maryland Transportation Authority, Revenue Bonds, Grant Anticipation Series 2008: | | | | | | |
| | 1,000 | | 5.250%, 3/01/15 | No Opt. Call | | AAA | | 1,038,260 | |
| | 2,000 | | 5.250%, 3/01/16 | No Opt. Call | | AAA | | 2,172,500 | |
| NMY | Nuveen Maryland Premium Income Municipal Fund | |
| | Portfolio of Investments (continued) | May 31, 2014 |
| | Principal | | | Optional Call | | | | | |
| | Amount (000) | | Description (1) | Provisions (2) | | Ratings (3) | | Value | |
| | | | Transportation (continued) | | | | | | |
| $ | 10,110 | | Maryland Transportation Authority, Revenue Bonds, Transportation Facilities Projects, Series 2007, 5.000%, 7/01/30 – AGM Insured (UB) | 7/17 at 100.00 | | AA | $ | 11,081,672 | |
| | | | Port Authority of New York and New Jersey, Special Project Bonds, JFK International Air Terminal LLC, Sixth Series 1997: | | | | | | |
| | 20 | | 5.750%, 12/01/22 – NPFG Insured (Alternative Minimum Tax) | 6/14 at 100.00 | | AA– | | 20,125 | |
| | 70 | | 5.750%, 12/01/25 – NPFG Insured (Alternative Minimum Tax) | 6/14 at 100.00 | | AA– | | 70,174 | |
| | 18,005 | | Total Transportation | | | | | 19,321,914 | |
| | | | U.S. Guaranteed – 20.5% (13.5% of Total Investments) (6) | | | | | | |
| | 770 | | Baltimore County, Maryland, General Obligation Bonds, Consolidated Public Improvement, Series 2004, 5.000%, 8/01/15 (Pre-refunded 8/01/14) | 8/14 at 100.00 | | AAA | | 776,360 | |
| | 500 | | Baltimore County, Maryland, Revenue Bonds, Catholic Health Initiatives, Series 2006A, 5.000%, 9/01/36 (Pre-refunded 9/01/16) | 9/16 at 100.00 | | A+ (6) | | 552,020 | |
| | 1,540 | | Baltimore, Maryland, General Obligation Bonds, Consolidated Public Improvements, Series 2004A, 5.000%, 10/15/22 (Pre-refunded 10/15/14) – AMBAC Insured | 10/14 at 100.00 | | Aa2 (6) | | 1,568,136 | |
| | 3,120 | | Baltimore, Maryland, Revenue Refunding Bonds, Water Projects, Series 1998A, 5.000%, 7/01/28 – FGIC Insured (ETM) | No Opt. Call | | AA (6) | | 3,733,111 | |
| | 2,000 | | Baltimore, Maryland, Revenue Refunding Bonds, Water System Projects, Series 1994A, 5.000%, 7/01/24 – FGIC Insured (ETM) | No Opt. Call | | AA (6) | | 2,458,320 | |
| | 1,500 | | Baltimore, Maryland, Wastewater Project Revenue Bonds, Series 2006C, 5.000%, 7/01/31 (Pre-refunded 7/01/16) – AMBAC Insured | 7/16 at 100.00 | | AA (6) | | 1,650,645 | |
| | 1,680 | | Carroll County, Maryland, General Obligation Consolidated Public Improvement Bonds, Series 2005A, 5.000%, 12/01/16 (Pre-refunded 12/01/15) | 12/15 at 100.00 | | AAA | | 1,801,330 | |
| | 15 | | Charles County, Maryland, Consolidated General Obligation Public Improvement Bonds, Series 2006, 5.000%, 3/01/16 (ETM) | No Opt. Call | | Aa1 (6) | | 16,274 | |
| | 1,910 | | Frederick, Maryland, General Obligation Bonds, Series 2005, 5.000%, 8/01/16 (Pre-refunded 8/01/15) – NPFG Insured | 8/15 at 100.00 | | AA (6) | | 2,017,839 | |
| | 3,075 | | Maryland Health and Higher Educational Facilities Authority, Revenue Bonds, Calvert Memorial Hospital, Series 2004, 5.500%, 7/01/36 (Pre-refunded 7/01/14) | 7/14 at 100.00 | | A (6) | | 3,089,237 | |
| | 4,865 | | Maryland Health and Higher Educational Facilities Authority, Revenue Bonds, Civista Medical Center, Series 2005, 5.000%, 7/01/37 (Pre-refunded 7/01/14) – RAAI Insured | 7/14 at 100.00 | | N/R (6) | | 4,885,190 | |
| | 510 | | Maryland Health and Higher Educational Facilities Authority, Revenue Bonds, College of Notre Dame of Maryland, Series 1998, 4.600%, 10/01/14 – NPFG Insured (ETM) | No Opt. Call | | A3 (6) | | 517,599 | |
| | 2,875 | | Maryland Health and Higher Educational Facilities Authority, Revenue Bonds, Goucher College, Series 2004, 5.125%, 7/01/34 (Pre-refunded 7/01/14) | 7/14 at 100.00 | | A– (6) | | 2,887,363 | |
| | | | Maryland Health and Higher Educational Facilities Authority, Revenue Bonds, Helix Health, Series 1997: | | | | | | |
| | 970 | | 5.000%, 7/01/17 – AMBAC Insured (ETM) | No Opt. Call | | N/R (6) | | 1,039,598 | |
| | 3,240 | | 5.000%, 7/01/27 – AMBAC Insured (ETM) | No Opt. Call | | N/R (6) | | 3,930,314 | |
| | 3,125 | | Maryland Health and Higher Educational Facilities Authority, Revenue Bonds, Howard County General Hospital, Series 1993, 5.500%, 7/01/25 (ETM) | 8/14 at 100.00 | | N/R (6) | | 3,385,531 | |
| | | | Maryland Health and Higher Educational Facilities Authority, Revenue Bonds, Johns Hopkins University, Series 2004A: | | | | | | |
| | 1,000 | | 4.625%, 7/01/20 (Pre-refunded 7/01/14) | 7/14 at 100.00 | | AA+ (6) | | 1,003,870 | |
| | 10,000 | | 5.000%, 7/01/33 (Pre-refunded 7/01/14) | 7/14 at 100.00 | | AA+ (6) | | 10,042,000 | |
| | 3,875 | | Maryland Health and Higher Educational Facilities Authority, Revenue Bonds, LifeBridge Health System, Series 2004A, 5.125%, 7/01/34 (Pre-refunded 7/01/14) | 7/14 at 100.00 | | N/R (6) | | 3,889,686 | |
| | 2,100 | | Maryland Industrial Development Financing Authority, Revenue Bonds, Our Lady of Good Counsel High School, Series 2005A, 6.000%, 5/01/35 (Pre-refunded 5/01/15) | 5/15 at 100.00 | | N/R (6) | | 2,208,171 | |
| | 1,200 | | Maryland Transportation Authority, Revenue Refunding Bonds, Transportation Facilities Projects, First Series 1978, 6.800%, 7/01/16 – AMBAC Insured (ETM) | No Opt. Call | | Aaa | | 1,284,684 | |
| | 2,350 | | Maryland, General Obligation Bonds, State and Local Facilities Loan, First Series 2004, 5.000%, 8/01/15 (Pre-refunded 8/01/14) | 8/14 at 100.00 | | AAA | | 2,369,411 | |
| | Principal | | | Optional Call | | | | | |
| | Amount (000) | | Description (1) | Provisions (2) | | Ratings (3) | | Value | |
| | | | U.S. Guaranteed (6) (continued) | | | | | | |
| $ | 1,100 | | Puerto Rico Public Finance Corporation, Commonwealth Appropriation Bonds, Series 1998A, 5.125%, 6/01/24 – AMBAC Insured (ETM) | No Opt. Call | | Aaa | $ | 1,338,601 | |
| | 1,000 | | Puerto Rico, Highway Revenue Bonds, Highway and Transportation Authority, Series 1996Y, 5.500%, 7/01/36 (Pre-refunded 7/01/16) | 7/16 at 100.00 | | Aaa | | 1,109,280 | |
| | 1,610 | | Puerto Rico, Highway Revenue Bonds, Highway and Transportation Authority, Series 2003AA, 5.500%, 7/01/19 – NPFG Insured (ETM) | No Opt. Call | | A3 (6) | | 1,956,343 | |
| | 650 | | University of Maryland, Auxiliary Facility and Tuition Revenue Bonds, Series 2005A, 5.000%, 4/01/18 (Pre-refunded 4/01/15) | 4/15 at 100.00 | | Aa1 (6) | | 676,163 | |
| | 3,135 | | University of Maryland, Auxiliary Facility and Tuition Revenue Bonds, Series 2006A, 5.000%, 10/01/22 (Pre-refunded 10/01/16) | 10/16 at 100.00 | | AA+ (6) | | 3,478,502 | |
| | | | Washington Suburban Sanitary District, Montgomery and Prince George’s Counties, Maryland, Sewerage Disposal Bonds, Series 2005: | | | | | | |
| | 4,500 | | 5.000%, 6/01/16 (Pre-refunded 6/01/15) | 6/15 at 100.00 | | AAA | | 4,720,320 | |
| | 1,235 | | 5.000%, 6/01/23 (Pre-refunded 6/01/15) | 6/15 at 100.00 | | AAA | | 1,295,466 | |
| | 1,235 | | 5.000%, 6/01/24 (Pre-refunded 6/01/15) | 6/15 at 100.00 | | AAA | | 1,295,466 | |
| | 1,235 | | 5.000%, 6/01/25 (Pre-refunded 6/01/15) | 6/15 at 100.00 | | AAA | | 1,295,466 | |
| | 67,920 | | Total U.S. Guaranteed | | | | | 72,272,296 | |
| | | | Utilities – 3.3% (2.2% of Total Investments) | | | | | | |
| | 1,250 | | Guam Power Authority, Revenue Bonds, Series 2012A, 5.000%, 10/01/30 – AGM Insured | 10/22 at 100.00 | | AA | | 1,388,788 | |
| | 3,600 | | Puerto Rico Electric Power Authority, Power Revenue Bonds, Series 2004PP, 5.000%, 7/01/22 – FGIC Insured | 7/14 at 100.00 | | AA– | | 3,601,044 | |
| | 1,570 | | Puerto Rico Electric Power Authority, Power Revenue Bonds, Series 2005RR, 5.000%, 7/01/22 – FGIC Insured | 7/15 at 100.00 | | AA– | | 1,577,018 | |
| | 1,225 | | Puerto Rico Electric Power Authority, Power Revenue Refunding Bonds, Series 2002JJ, 5.250%, 7/01/15 – NPFG Insured | No Opt. Call | | AA– | | 1,254,474 | |
| | 730 | | Virgin Islands Water and Power Authority, Electric System Revenue Bonds, Refunding Series 2007A, 5.000%, 7/01/24 | 7/17 at 100.00 | | BB+ | | 699,267 | |
| | 3,000 | | Wisconsin Public Power Incorporated System, Power Supply System Revenue Bonds, Series 2005A, 5.000%, 7/01/35 – AMBAC Insured | 7/15 at 100.00 | | AA+ | | 3,119,490 | |
| | 11,375 | | Total Utilities | | | | | 11,640,081 | |
| | | | Water and Sewer – 4.6% (3.0% of Total Investments) | | | | | | |
| | 2,500 | | Baltimore, Maryland, Project and Revenue Refunding Bonds, Water Projects, Series 2013B, 5.000%, 7/01/38 | 1/24 at 100.00 | | AA | | 2,828,100 | |
| | 1,045 | | Baltimore, Maryland, Revenue Refunding Bonds, Water System Projects, Series 1994A, 5.000%, 7/01/24 – FGIC Insured | No Opt. Call | | AA | | 1,208,668 | |
| | 2,570 | | Baltimore, Maryland, Wastewater Project Revenue Bonds, Series 2006C, 5.000%, 7/01/31 – AMBAC Insured | 7/16 at 100.00 | | AA | | 2,744,709 | |
| | 3,000 | | Baltimore, Maryland, Wastewater Project Revenue Bonds, Series 2007D, 5.000%, 7/01/32 – AMBAC Insured | 7/17 at 100.00 | | AA | | 3,281,700 | |
| | 2,000 | | Baltimore, Maryland, Wastewater Project Revenue Bonds, Series 2011A, 5.000%, 7/01/41 | 7/21 at 100.00 | | AA | | 2,196,640 | |
| | 2,030 | | Guam Waterworks Authority, Water and Wastewater System Revenue Bonds, Series 2013, 5.500%, 7/01/43 | 7/23 at 100.00 | | A– | | 2,174,617 | |
| | 1,645 | | Maryland Water Quality Financing Administration, Revolving Loan Fund Revenue Bonds, Series 2005A, 5.000%, 9/01/15 | No Opt. Call | | AAA | | 1,744,818 | |
| | 14,790 | | Total Water and Sewer | | | | | 16,179,252 | |
| $ | 683,620 | | Total Municipal Bonds (cost $508,734,827) | | | | | 531,018,355 | |
| NMY | Nuveen Maryland Premium Income Municipal Fund | |
| | Portfolio of Investments (continued) | May 31, 2014 |
| | Shares | | Description (1) | | Value | |
| | | | COMMON STOCKS – 0.9% (0.6% of Total Investments) | | | |
| | | | Airlines – 0.9% (0.6% of Total Investments) | | | |
| | 79,607 | | American Airlines Group Inc., (7) | $ | 3,197,017 | |
| | | | Total Common Stocks (cost $2,473,540) | | 3,197,017 | |
| | | | Total Long-Term Investments (cost $511,208,367) | | 534,215,372 | |
| | | | Floating Rate Obligations – (6.2)% | | (21,935,000 | ) |
| | | | Variable Rate MuniFund Term Preferred Shares, at Liquidation Value – (47.3)% (8) | | (167,000,000 | ) |
| | | | Other Assets Less Liabilities – 2.2% | | 7,729,355 | |
| | | | Net Assets Applicable to Common Shares – 100% | $ | 353,009,727 | |
| (1) | All percentages shown in the Portfolio of Investments are based on net assets applicable to common shares unless otherwise noted. |
| (2) | Optional Call Provisions (not covered by the report of independent registered public accounting firm): Dates (month and year) and prices of the earliest optional call or redemption. There may be other call provisions at varying prices at later dates. Certain mortgage-backed securities may be subject to periodic principal paydowns. |
| (3) | Ratings (not covered by the report of independent registered public accounting firm): Using the highest of Standard & Poor’s Group (“Standard & Poor’s”), Moody’s Investors Service, Inc. (“Moody’s”) or Fitch, Inc. (“Fitch”) rating. Ratings below BBB by Standard & Poor’s, Baa by Moody’s or BBB by Fitch are considered to be below investment grade. Holdings designated N/R are not rated by any of these national rating agencies. |
| (4) | At or subsequent to the end of the reporting period, this security is non-income producing. Non-income producing, in the case of a fixed-income security, generally denotes that the issuer has (1) defaulted on the payment of principal or interest, (2) is under the protection of the Federal Bankruptcy Court or (3) the Fund’s Adviser has concluded that the issue is not likely to meet its future interest payment obligations and has directed the Fund’s custodian to cease accruing additional income on the Fund’s records. |
| (5) | Investment, or portion of investment, has been pledged to collateralize the net payment obligations for investments in inverse floating rate transactions. |
| (6) | Backed by an escrow or trust containing sufficient U.S. Government or U.S. Government agency securities, which ensure the timely payment of principal and interest. Certain bonds backed by U.S. Government or agency securities are regarded as having an implied rating equal to the rating of such securities. |
| (7) | On November 28, 2011, AMR Corp. (“AMR”), the parent company of American Airlines Group, Inc. (“AAL”) filed for federal bankruptcy protection. On December 9, 2013, AMR emerged from federal bankruptcy with the acceptance of its reorganization plan by the bankruptcy court. Under the settlement agreement established to meet AMR’s unsecured bond obligations, the bondholders, including the Fund, received a distribution of AAL preferred stock which was converted to AAL common stock over a 120- day period. Every 30 days, a quarter of the preferred stock was converted to AAL common stock based on the 5-day volume-weighted average price and the amount of preferred shares tendered during the optional preferred conversion period. |
| (8) | Variable Rate MuniFund Term Preferred Shares, at Liquidation Value as a percentage of Total Investments is 31.3% |
| (ETM) | Escrowed to maturity. |
| (UB) | Underlying bond of an inverse floating rate trust reflected as a financing transaction. See Notes to Financial Statements, Note 3 – Portfolio Securities and Investments in Derivatives, Inverse Floating Rate Securities for more information. |
See accompanying notes to financial statements.
| NOM | | |
| | Nuveen Missouri Premium Income Municipal Fund | |
| | Portfolio of Investments | May 31, 2014 |
| | Principal | | | Optional Call | | | | | |
| | Amount (000) | | Description (1) | Provisions (2) | | Ratings (3) | | Value | |
| | | | LONG-TERM INVESTMENTS – 156.4% (100.0% of Total Investments) | | | | | | |
| | | | MUNICIPAL BONDS – 156.4% (100.0% of Total Investments) | | | | | | |
| | | | Consumer Staples – 3.6% (2.3% of Total Investments) | | | | | | |
| $ | 1,010 | | Missouri Development Finance Board, Solid Waste Disposal Revenue Bonds, Procter and Gamble Inc., Series 1999, 5.200%, 3/15/29 (Alternative Minimum Tax) | No Opt. Call | | AA– | $ | 1,195,941 | |
| | | | Education and Civic Organizations – 20.5% (13.1% of Total Investments) | | | | | | |
| | 300 | | Curators of the University of Missouri, System Facilities Revenue Bonds, Refunding Series 2012A, 4.000%, 11/01/33 | 11/24 at 100.00 | | AA+ | | 317,703 | |
| | 250 | | Lincoln University, Missouri, Auxiliary System Revenue Bonds, Series 2007, 5.125%, 6/01/37 – AGC Insured | 6/17 at 100.00 | | AA | | 261,665 | |
| | 410 | | Missouri Health and Educational Facilities Authority, Educational Facilities Revenue Bonds, Kansas City University of Medicine and Biosciences, Series 2013A, 5.000%, 6/01/33 | 6/23 at 100.00 | | A1 | | 442,833 | |
| | 750 | | Missouri Health and Educational Facilities Authority, Educational Facilities Revenue Bonds, Saint Louis College of Pharmacy, Series 2013, 5.500%, 5/01/43 | 5/23 at 100.00 | | BBB+ | | 811,155 | |
| | 600 | | Missouri Health and Educational Facilities Authority, Educational Facilities Revenue Bonds, Southwest Baptist University Project, Series 2012, 5.000%, 10/01/33 | 10/22 at 100.00 | | BBB– | | 622,104 | |
| | 725 | | Missouri Health and Educational Facilities Authority, Educational Facilities Revenue Bonds, University of Central Missouri, Series 2013C2, 5.000%, 10/01/34 | 10/23 at 100.00 | | A | | 798,493 | |
| | 630 | | Missouri Health and Educational Facilities Authority, Revenue Bonds, A.T. Still University of Health Sciences, Series 2011, 5.250%, 10/01/41 | 10/21 at 100.00 | | A– | | 686,921 | |
| | 510 | | Missouri Health and Educational Facilities Authority, Revenue Bonds, A.T. Still University of Health Sciences, Series 2014, 5.000%, 10/01/39 | 10/23 at 100.00 | | A– | | 550,826 | |
| | 700 | | Missouri Health and Educational Facilities Authority, Revenue Bonds, Rockhurst University, Series 2011A, 6.500%, 10/01/35 | 10/18 at 103.00 | | BBB– | | 786,373 | |
| | 550 | | Missouri Health and Educational Facilities Authority, Revenue Bonds, Washington University, Series 2011B, 5.000%, 11/15/37 | 11/21 at 100.00 | | AAA | | 618,910 | |
| | 600 | | Missouri Health and Educational Facilities Authority, Revenue Bonds, Webster University, Series 2011, 5.000%, 4/01/36 | 4/21 at 100.00 | | A2 | | 648,396 | |
| | 250 | | Northwest Missouri State University, Housing System Revenue Bonds, Refunding Series 2012, 3.125%, 6/01/29 | No Opt. Call | | A3 | | 231,380 | |
| | 6,275 | | Total Education and Civic Organizations | | | | | 6,776,759 | |
| | | | Health Care – 34.5% (22.0% of Total Investments) | | | | | | |
| | 525 | | Cape Girardeau County Industrial Development Authority, Missouri, Health Facilities Revenue Bonds, Saint Francis Medical Center, Series 2009A, 5.750%, 6/01/39 | 6/19 at 100.00 | | AA– | | 570,250 | |
| | | | Cape Girardeau County Industrial Development Authority, Missouri, Health Facilities Revenue Bonds, Southeast Missouri Hospital Association, Series 2007: | | | | | | |
| | 760 | | 5.000%, 6/01/27 | 6/17 at 100.00 | | BBB+ | | 781,736 | |
| | 560 | | 5.000%, 6/01/36 | 6/17 at 100.00 | | BBB+ | | 571,883 | |
| | 930 | | Cass County, Missouri, Hospital Revenue Bonds, Series 2007, 5.625%, 5/01/38 | 11/16 at 100.00 | | BBB– | | 944,741 | |
| | 480 | | Clinton County Industrial Development Authority, Missouri, Revenue Bonds, Cameron Regional Medical Center, Series 2007, 5.000%, 12/01/37 | 12/17 at 100.00 | | N/R | | 475,090 | |
| | 750 | | Joplin Industrial Development Authority, Missouri, Health Facilities Revenue Bonds, Freeman Health System, Series 2004, 5.500%, 2/15/29 | 2/15 at 102.00 | | BBB+ | | 771,945 | |
| | 200 | | Joplin Industrial Development Authority, Missouri, Health Facilities Revenue Bonds, Freeman Health System, Series 2011, 5.500%, 2/15/31 | 2/21 at 100.00 | | BBB+ | | 215,898 | |
| | 540 | | Missouri Health and Educational Facilities Authority, Health Facilities Revenue Bonds, Capital Region Medical Center, Series 2011, 5.000%, 11/01/27 | 11/20 at 100.00 | | A3 | | 583,934 | |
| NOM | Nuveen Missouri Premium Income Municipal Fund | |
| | Portfolio of Investments (continued) | May 31, 2014 |
| | Principal | | | Optional Call | | | | | |
| | Amount (000) | | Description (1) | Provisions (2) | | Ratings (3) | | Value | |
| | | | Health Care (continued) | | | | | | |
| $ | 1,730 | | Missouri Health and Educational Facilities Authority, Health Facilities Revenue Bonds, CoxHealth, Series 2013A, 5.000%, 11/15/44 | 11/23 at 100.00 | | A2 | $ | 1,852,432 | |
| | 335 | | Missouri Health and Educational Facilities Authority, Health Facilities Revenue Bonds, Heartland Regional Medical Center, Series 2012, 5.000%, 2/15/37 | 2/22 at 100.00 | | A1 | | 358,621 | |
| | 395 | | Missouri Health and Educational Facilities Authority, Health Facilities Revenue Bonds, Mercy Health, Series 2012, 4.000%, 11/15/42 | No Opt. Call | | AA– | | 395,134 | |
| | 500 | | Missouri Health and Educational Facilities Authority, Health Facilities Revenue Bonds, Saint Luke’s Episcopal and Presbyterian Hospitals, Series 2011, 5.000%, 12/01/25 | 12/21 at 100.00 | | A+ | | 557,900 | |
| | 2,000 | | Missouri Health and Educational Facilities Authority, Health Facility Revenue Bonds, St. Luke’s Health System, Series 2010A, 5.000%, 11/15/30 | 11/20 at 100.00 | | A+ | | 2,173,240 | |
| | 720 | | Saline County Industrial Development Authority, Missouri, Health Facilities Revenue Bonds, John Fitzgibbon Memorial Hospital Inc., Series 2010, 5.600%, 12/01/28 | 12/20 at 100.00 | | BBB– | | 791,258 | |
| | 350 | | St. Louis County Industrial Development Authority, Missouri, Healthcare Facilities Revenue Bonds, Ranken-Jordan Project, Refunding Series 2007, 5.000%, 11/15/27 | 11/16 at 100.00 | | N/R | | 347,624 | |
| | 10,775 | | Total Health Care | | | | | 11,391,686 | |
| | | | Housing/Single Family – 0.9% (0.6% of Total Investments) | | | | | | |
| | 165 | | Missouri Housing Development Commission, Single Family Mortgage Revenue Bonds, Homeownership Loan Program, Series 2007A-1, 4.700%, 9/01/27 (Alternative Minimum Tax) | 9/16 at 100.00 | | AA+ | | 168,622 | |
| | 140 | | Missouri Housing Development Commission, Single Family Mortgage Revenue Bonds, Homeownership Loan Program, Series 2007C-1, 4.800%, 9/01/38 (Alternative Minimum Tax) | 3/17 at 100.00 | | AA+ | | 140,076 | |
| | 305 | | Total Housing/Single Family | | | | | 308,698 | |
| | | | Long-Term Care – 11.8% (7.5% of Total Investments) | | | | | | |
| | 250 | | Bridgeton Industrial Development Authority, Missouri, Senior Housing Revenue Bonds, The Sarah Community Project, Series 2013, 4.500%, 5/01/28 | 5/18 at 100.00 | | N/R | | 239,985 | |
| | 500 | | Joplin Industrial Development Authority, Missouri, Revenue Bonds, Christian Homes Inc., Series 2007F, 5.750%, 5/15/31 | 5/17 at 100.00 | | BBB– | | 514,610 | |
| | 475 | | Lees Summit Industrial Development Authority, Missouri, Revenue Bonds, John Knox Village Obligated Group, Series 2007A, 5.125%, 8/15/32 | 8/17 at 100.00 | | BBB– | | 482,538 | |
| | 250 | | Missouri Health and Educational Facilities Authority, Revenue Bonds, Lutheran Senior Services Projects, Series 2011, 6.000%, 2/01/41 | 2/21 at 100.00 | | BBB+ | | 274,855 | |
| | 500 | | Missouri Health and Educational Facilities Authority, Revenue Bonds, Lutheran Senior Services Projects, Series 2014A, 5.000%, 2/01/44 (WI/DD, Settling 6/05/14) | 2/24 at 100.00 | | BBB+ | | 522,990 | |
| | 100 | | St. Louis County Industrial Development Authority, Missouri, Revenue Bonds, Friendship Village of Chesterfield, Series 2012, 5.000%, 9/01/42 | No Opt. Call | | BBB– | | 100,665 | |
| | | | St. Louis County Industrial Development Authority, Missouri, Revenue Bonds, Friendship Village of Sunset Hills, Series 2012: | | | | | | |
| | 250 | | 5.000%, 9/01/32 | No Opt. Call | | A– | | 265,423 | |
| | 425 | | 5.000%, 9/01/42 | 9/22 at 100.00 | | A– | | 441,864 | |
| | 430 | | St. Louis County Industrial Development Authority, Missouri, Revenue Bonds, Friendship Village of Sunset Hills, Series 2013A, 5.875%, 9/01/43 | 9/23 at 100.00 | | A– | | 464,508 | |
| | 570 | | St. Louis County Industrial Development Authority, Missouri, Revenue Bonds, Friendship Village of West County, Series 2007A, 5.500%, 9/01/28 | 9/17 at 100.00 | | BBB– | | 587,026 | |
| | 3,750 | | Total Long-Term Care | | | | | 3,894,464 | |
| | | | Tax Obligation/General – 15.4% (9.9% of Total Investments) | | | | | | |
| | 500 | | Branson Reorganized School District R-4, Taney County, Missouri, General Obligation Bonds, School Building Series 2012, 4.375%, 3/01/32 | 3/22 at 100.00 | | A+ | | 527,895 | |
| | 1,500 | | Camdenton Reorganized School District R3, Camden County, Missouri, General Obligation Bonds, Series 2005, 5.250%, 3/01/24 – AGM Insured | 3/15 at 100.00 | | AA | | 1,555,575 | |
| | Principal | | | Optional Call | | | | | |
| | Amount (000) | | Description (1) | Provisions (2) | | Ratings (3) | | Value | |
| | | | Tax Obligation/General (continued) | | | | | | |
| $ | 1,685 | | Independence School District, Jackson County, Missouri, General Obligation Bonds, Series 2010, 5.000%, 3/01/27 | 3/20 at 100.00 | | AA+ | $ | 1,890,806 | |
| | 500 | | Jackson County Reorganized School District 4, Blue Springs, Missouri, General Obligation Bonds, School Building Series 2013A, 5.000%, 3/01/31 | 3/21 at 100.00 | | AA | | 562,810 | |
| | 500 | | Missouri School Boards Association, Lease Participation Certificates, Clay County School District 53 Liberty, Series 2007, 5.250%, 3/01/27 – AGM Insured | 3/17 at 100.00 | | AA | | 549,340 | |
| | 4,685 | | Total Tax Obligation/General | | | | | 5,086,426 | |
| | | | Tax Obligation/Limited – 24.4% (15.6% of Total Investments) | | | | | | |
| | 910 | | Bi-State Development Agency of the Missouri-Illinois Metropolitan District, Mass Transit Sales Tax Appropriation Bonds, Refunding Combined Lien Series 2013A, 5.000%, 10/01/33 | 10/22 at 100.00 | | AA+ | | 1,025,788 | |
| | 315 | | Fulton, Missouri, Tax Increment Revenue Bonds, Fulton Commons Redevelopment Project, Series 2006, 5.000%, 6/01/28 | 6/16 at 100.00 | | N/R | | 274,592 | |
| | 430 | | Government of Guam, Business Privilege Tax Bonds, Series 2012B-1, 5.000%, 1/01/42 | 1/22 at 100.00 | | A | | 446,052 | |
| | | | Howard Bend Levee District, St. Louis County, Missouri, Levee District Improvement Bonds, Series 2013B: | | | | | | |
| | 180 | | 4.875%, 3/01/33 | 3/23 at 100.00 | | BBB+ | | 184,914 | |
| | 115 | | 5.000%, 3/01/38 | 3/23 at 100.00 | | BBB+ | | 117,320 | |
| | 485 | | Jackson County, Missouri, Special Obligation Bonds, Truman Medical Center Project, Series 2011B, 4.350%, 12/01/23 | 12/21 at 100.00 | | Aa3 | | 535,377 | |
| | 300 | | Kansas City Industrial Development Authority, Missouri, Downtown Redevelopment District Revenue Bonds, Series 2011A, 5.000%, 9/01/32 | 9/21 at 100.00 | | AA– | | 320,949 | |
| | 475 | | Kansas City Tax Increment Financing Commission, Missouri, Tax Increment Revenue Bonds, Briarcliff West Project, Series 2006A, 5.400%, 6/01/24 | 6/14 at 102.00 | | N/R | | 485,042 | |
| | 325 | | Kansas City, Missouri, Special Obligation Bonds, Downtown Redevelopment District, Series 2014C, 5.000%, 9/01/33 | 9/23 at 100.00 | | AA– | | 356,363 | |
| | 360 | | Missouri Development Finance Board, Infrastructure Facilities Revenue Bonds, Branson Landing Project, Series 2005A, 5.000%, 6/01/35 | 6/15 at 100.00 | | A | | 372,319 | |
| | 245 | | Monarch-Chesterfield Levee District, St. Louis County, Missouri, Levee District Improvement Bonds, Series 1999, 5.750%, 3/01/19 – NPFG Insured | 9/14 at 100.00 | | AA– | | 246,000 | |
| | 500 | | Osage Beach, Missouri, Tax Increment Revenue Bonds, Prewitts Point Transportation Development District, Series 2006, 5.000%, 5/01/23 | 8/14 at 100.00 | | N/R | | 500,095 | |
| | 1,550 | | Puerto Rico Sales Tax Financing Corporation, Sales Tax Revenue Bonds, First Subordinate Series 2009A, 6.000%, 8/01/42 | 8/19 at 100.00 | | A+ | | 1,348,376 | |
| | 225 | | Puerto Rico Sales Tax Financing Corporation, Sales Tax Revenue Bonds, Senior Series 2011C, 0.000%, 8/01/41 | No Opt. Call | | AA– | | 32,841 | |
| | 1,500 | | Puerto Rico Sales Tax Financing Corporation, Sales Tax Revenue Bonds, Series 2007A, 0.000%, 8/01/41 – NPFG Insured | No Opt. Call | | AA– | | 267,330 | |
| | 600 | | Riverside, Missouri, L-385 Levee Redevelopment Plan Tax Increment Revenue Bonds, Series 2004, 5.250%, 5/01/20 | 5/15 at 100.00 | | A | | 616,188 | |
| | | | St. Joseph Industrial Development Authority, Missouri, Tax Increment Bonds, Shoppes at North Village Project, Series 2005A: | | | | | | |
| | 340 | | 5.375%, 11/01/24 | 11/14 at 100.00 | | N/R | | 340,129 | |
| | 400 | | 5.500%, 11/01/27 | 11/14 at 100.00 | | N/R | | 400,044 | |
| | 200 | | St. Joseph Industrial Development Authority, Missouri, Tax Increment Bonds, Shoppes at North Village Project, Series 2005B, 5.500%, 11/01/27 | 11/14 at 100.00 | | N/R | | 200,682 | |
| | 9,455 | | Total Tax Obligation/Limited | | | | | 8,070,401 | |
| NOM | Nuveen Missouri Premium Income Municipal Fund | |
| | Portfolio of Investments (continued) | May 31, 2014 |
| | Principal | | | Optional Call | | | | | |
| | Amount (000) | | Description (1) | Provisions (2) | | Ratings (3) | | Value | |
| | | | Transportation – 13.0% (8.3% of Total Investments) | | | | | | |
| $ | 335 | | Guam International Airport Authority, Revenue Bonds, Series 2013B, 5.500%,
10/01/33 – AGM Insured | 10/23 at 100.00 | | AA | $ | 372,567 | |
| | 1,000 | | St. Louis, Missouri, Airport Revenue Bonds, Lambert-St. Louis International Airport, Series 2005, 5.500%, 7/01/18 – NPFG Insured | No Opt. Call | | AA– | | 1,169,860 | |
| | 2,500 | | St. Louis, Missouri, Airport Revenue Bonds, Lambert-St. Louis International Airport, Series 2007A, 5.000%, 7/01/21 – AGM Insured | 7/17 at 100.00 | | AA | | 2,766,975 | |
| | 3,835 | | Total Transportation | | | | | 4,309,402 | |
| | | | U.S. Guaranteed – 9.2% (5.9% of Total Investments) (4) | | | | | | |
| | 600 | | Chesterfield, Missouri, Certificates of Participation, Series 2005, 5.000%, 12/01/24 (Pre-refunded 12/01/15) – FGIC Insured | 12/15 at 100.00 | | Aa1 (4) | | 642,672 | |
| | 80 | | Cottleville, Missouri, Certificates of Participation, Series 2006, 5.250%, 8/01/31 (Pre-refunded 8/01/14) | 8/14 at 100.00 | | N/R (4) | | 80,693 | |
| | 1,395 | | Springfield Public Building Corporation, Missouri, Lease Revenue Bonds, Jordan Valley Park Projects, Series 2000A, 6.125%, 6/01/21 – AMBAC Insured (ETM) | 8/14 at 100.00 | | N/R (4) | | 1,721,946 | |
| | 500 | | St. Louis County, Missouri, GNMA Collateralized Mortgage Revenue Bonds, Series 1993D, 5.650%, 7/01/20 (Alternative Minimum Tax) (ETM) | No Opt. Call | | AA+ (4) | | 604,405 | |
| | 2,575 | | Total U.S. Guaranteed | | | | | 3,049,716 | |
| | | | Utilities – 13.8% (8.8% of Total Investments) | | | | | | |
| | 2,965 | | Missouri Environmental Improvement and Energy Resources Authority, Water Facility Revenue Bonds, Missouri-American Water Company, Series 2006, 4.600%,
12/01/36 – AMBAC Insured (Alternative Minimum Tax) (UB) (5) | 12/16 at 100.00 | | AA+ | | 3,039,273 | |
| | 110 | | Missouri Joint Municipal Electric Utility Commission, Power Project Revenue Bonds, Iatan 2 Project Series 2006A, 4.125%, 1/01/21 – AMBAC Insured | 1/16 at 100.00 | | A2 | | 115,779 | |
| | | | Missouri Joint Municipal Electric Utility Commission, Power Supply System Revenue Bonds, MoPEP Facilities, Series 2012: | | | | | | |
| | 400 | | 5.000%, 1/01/32 | 1/21 at 100.00 | | A2 | | 428,808 | |
| | 425 | | 5.000%, 1/01/37 | 1/21 at 100.00 | | A2 | | 450,011 | |
| | 500 | | Missouri Joint Municipal Electric Utility Commission, Revenue Bonds, Plum Point Project, Series 2006, 5.000%, 1/01/34 – NPFG Insured | 1/16 at 100.00 | | AA– | | 523,095 | |
| | 4,400 | | Total Utilities | | | | | 4,556,966 | |
| | Principal | | | | | | | | | | |
| | Amount (000) | | Description (1) | | | Maturity | | Ratings (3) | | Value | |
| | | | Water and Sewer – 9.3% (6.0% of Total Investments) | | | | | | | | |
| $ | 600 | | Carroll County Public Water Supply District 1, Missouri, Water System Revenue Bonds, Refunding Series 2009, 6.000%, 3/01/39 | | | 3/18 at 100.00 | | A | $ | 646,266 | |
| | 200 | | Metropolitan St. Louis Sewerage District, Missouri, Wastewater System Revenue Bonds, Series 2006C, 5.000%, 5/01/36 – NPFG Insured | | | 5/17 at 100.00 | | AAA | | 218,610 | |
| | 2,000 | | Metropolitan St. Louis Sewerage District, Missouri, Wastewater System Revenue Bonds, Series 2012A, 5.000%, 5/01/42 | | | 5/22 at 100.00 | | AAA | | 2,225,616 | |
| | 2,800 | | Total Water and Sewer | | | | | | | 3,090,492 | |
| $ | 49,865 | | Total Long-Term Investments (cost $48,867,802) | | | | | | | 51,730,951 | |
| | | | Floating Rate Obligations – (6.7)% | | | | | | | (2,225,000 | ) |
| | | | MuniFund Term Preferred Shares, at Liquidation Value – (54.1)% (6) | | | | | | | (17,880,000 | ) |
| | | | Other Assets Less Liabilities – 4.4% | | | | | | | 1,445,696 | |
| | | | Net Assets Applicable to Common Shares – 100% | | | | | | $ | 33,071,647 | |
| (1) | All percentages shown in the Portfolio of Investments are based on net assets applicable to common shares unless otherwise noted. |
| (2) | Optional Call Provisions (not covered by the report of independent registered public accounting firm): Dates (month and year) and prices of the earliest optional call or redemption. There may be other call provisions at varying prices at later dates. Certain mortgage-backed securities may be subject to periodic principal paydowns. |
| (3) | Ratings (not covered by the report of independent registered public accounting firm): Using the highest of Standard & Poor’s Group (“Standard & Poor’s”), Moody’s Investors Service, Inc. (“Moody’s”) or Fitch, Inc. (“Fitch”) rating. Ratings below BBB by Standard & Poor’s, Baa by Moody’s or BBB by Fitch are considered to be below investment grade. Holdings designated N/R are not rated by any of these national rating agencies. |
| (4) | Backed by an escrow or trust containing sufficient U.S. Government or U.S. Government agency securities, which ensure the timely payment of principal and interest. Certain bonds backed by U.S. Government or agency securities are regarded as having an implied rating equal to the rating of such securities. |
| (5) | Investment, or portion of investment, has been pledged to collateralize the net payment obligations for investments in inverse floating rate transactions. |
| (6) | MuniFund Term Preferred Shares, at Liquidation Value as a percentage of Total Investments is 34.6% |
| WI/DD | Investment, or portion of investment, purchased on a when-issued or delayed delivery basis. |
| (ETM) | Escrowed to maturity. |
| (UB) | Underlying bond of an inverse floating rate trust reflected as a financing transaction. See Notes to Financial Statements, Note 3 – Portfolio Securities and Investments in Derivatives, Inverse Floating Rate Securities for more information. |
See accompanying notes to financial statements.
| NNC | | |
| | Nuveen North Carolina Premium Income Municipal Fund | |
| | Portfolio of Investments | May 31, 2014 |
| | Principal | | | Optional Call | | | | | |
| | Amount (000) | | Description (1) | Provisions (2) | | Ratings (3) | | Value | |
| | | | LONG-TERM INVESTMENTS – 148.6% (100.0% of Total Investments) | | | | | | |
| | | | MUNICIPAL BONDS – 148.6% (100.0% of Total Investments) | | | | | | |
| | | | Education and Civic Organizations – 19.9% (13.4% of Total Investments) | | | | | | |
| $ | 30 | | Appalachian State University, North Carolina, Revenue Bonds, Series 2005, 5.250%, 7/15/17 – NPFG Insured | 7/15 at 100.00 | | Aa3 | $ | 31,709 | |
| | | | Board of Governors of the University of North Carolina, Winston-Salem State University General Revenue Bonds, Series 2013: | | | | | | |
| | 2,950 | | 5.000%, 4/01/33 | 4/22 at 100.00 | | A– | | 3,211,813 | |
| | 1,000 | | 5.125%, 4/01/43 | 4/22 at 100.00 | | A– | | 1,082,330 | |
| | 5,000 | | East Carolina University, North Carolina, General Revenue Bonds, Series 2014A, 5.000%, 10/01/41 | 10/23 at 100.00 | | Aa2 | | 5,594,800 | |
| | 1,500 | | Fayetteville State University, North Carolina, Limited Obligation Revenue Bonds, Student Housing Project, Series 2011, 5.000%, 4/01/43 – AGM Insured | 4/21 at 100.00 | | AA | | 1,595,790 | |
| | | | North Carolina Capital Facilities Finance Agency, Revenue Bonds, Johnson & Wales University, Series 2013A: | | | | | | |
| | 1,560 | | 5.000%, 4/01/32 | 4/23 at 100.00 | | A2 | | 1,735,828 | |
| | 1,000 | | 5.000%, 4/01/33 | 4/23 at 100.00 | | A2 | | 1,106,310 | |
| | 2,500 | | North Carolina Capital Facilities Financing Agency, Revenue Bonds, Duke University, Series 2005A, 5.000%, 10/01/41 | 10/15 at 100.00 | | AA+ | | 2,621,500 | |
| | 4,440 | | North Carolina Capital Facilities Finance Agency, Revenue Bonds, The Methodist University, Series 2012, 5.000%, 3/01/34 | 3/22 at 100.00 | | BBB | | 4,696,765 | |
| | 2,020 | | North Carolina State University at Raleigh, General Revenue Bonds, Series 2013A, 5.000%, 10/01/42 | 10/23 at 100.00 | | Aa1 | | 2,286,095 | |
| | | | University of North Carolina System, Pooled Revenue Bonds, Series 2005A: | | | | | | |
| | 1,530 | | 5.000%, 4/01/15 – AMBAC Insured | No Opt. Call | | A | | 1,591,521 | |
| | 290 | | 5.000%, 4/01/22 – AMBAC Insured | 4/15 at 100.00 | | A | | 300,426 | |
| | | | University of North Carolina Wilmington, Certificates of Participation, Student Housing Project Revenue Bonds, Series 2006: | | | | | | |
| | 1,000 | | 5.000%, 6/01/21 – FGIC Insured | 6/16 at 100.00 | | AA– | | 1,050,200 | |
| | 1,430 | | 5.000%, 6/01/23 – FGIC Insured | 6/16 at 100.00 | | AA– | | 1,493,163 | |
| | 1,505 | | 5.000%, 6/01/24 – FGIC Insured | 6/16 at 100.00 | | AA– | | 1,566,931 | |
| | 10,200 | | University of North Carolina, Chapel Hill, System Net Revenue Bonds, Series 2007, 5.000%, 12/01/36 | 12/17 at 100.00 | | AAA | | 11,437,255 | |
| | 250 | | University of North Carolina, Charlotte, Certificates of Participation, Student Housing Project, Series 2005, 5.000%, 3/01/21 – AMBAC Insured | 3/15 at 100.00 | | A | | 258,735 | |
| | | | University of North Carolina, Charlotte, General Revenue Bonds, Series 2014: | | | | | | |
| | 2,070 | | 5.000%, 4/01/32 | 4/24 at 100.00 | | AA– | | 2,377,499 | |
| | 1,175 | | 5.000%, 4/01/33 | 4/24 at 100.00 | | AA– | | 1,342,097 | |
| | 1,385 | | 5.000%, 4/01/35 | 4/24 at 100.00 | | AA– | | 1,568,263 | |
| | | | University of North Carolina, System Pooled Revenue Bonds, Series 2009C: | | | | | | |
| | 1,000 | | 5.250%, 10/01/28 | 10/19 at 100.00 | | A3 | | 1,108,840 | |
| | 1,000 | | 5.375%, 10/01/29 | 10/19 at 100.00 | | A3 | | 1,113,390 | |
| | 44,835 | | Total Education and Civic Organizations | | | | | 49,171,260 | |
| | | | Health Care – 31.0% (20.8% of Total Investments) | | | | | | |
| | 2,750 | | Charlotte-Mecklenburg Hospital Authority, North Carolina, Health Care Revenue Bonds, DBA Carolinas HealthCare System, Refunding Series 2009A, 5.250%, 1/15/39 | 1/19 at 100.00 | | AA– | | 3,066,965 | |
| | 4,950 | | Charlotte-Mecklenburg Hospital Authority, North Carolina, Health Care Revenue Bonds, DBA Carolinas HealthCare System, Series 2008A, 5.000%, 1/15/47 | 1/18 at 100.00 | | AA– | | 5,167,503 | |
| | 2,000 | | Charlotte-Mecklenburg Hospital Authority, North Carolina, Health Care Revenue Bonds, DBA Carolinas HealthCare System, Series 2011A, 5.250%, 1/15/42 | 1/21 at 100.00 | | AA– | | 2,173,840 | |
| | Principal | | | Optional Call | | | | | |
| | Amount (000) | | Description (1) | Provisions (2) | | Ratings (3) | | Value | |
| | | | Health Care (continued) | | | | | | |
| $ | 5,250 | | Charlotte-Mecklenburg Hospital Authority, North Carolina, Health Care Revenue Bonds, DBA Carolinas HealthCare System, Refunding Series 2012A, 5.000%, 1/15/43 | 1/22 at 100.00 | | AA– | $ | 5,715,990 | |
| | 2,225 | | Johnston Memorial Hospital Authority, North Carolina, Mortgage Revenue Bonds, Johnston Memorial Hospital Project, Series 2008A, 5.250%, 10/01/36 – AGM Insured | 4/18 at 100.00 | | AA | | 2,463,565 | |
| | 3,860 | | Nash Health Care Systems, North Carolina, Health Care Facilities Revenue Bonds, Series 2012, 5.000%, 11/01/41 | 5/22 at 100.00 | | A | | 4,116,960 | |
| | 500 | | New Hanover County, North Carolina, Hospital Revenue Bonds, New Hanover Regional Medical Center, Refunding Series 2013, 5.000%, 10/01/26 | 10/23 at 100.00 | | A+ | | 565,010 | |
| | 555 | | New Hanover County, North Carolina, Hospital Revenue Bonds, New Hanover Regional Medical Center, Series 2006B, 5.125%, 10/01/31 – AGM Insured | 10/19 at 100.00 | | AA | | 601,620 | |
| | | | North Carolina Medical Care Commission Health Care Facilities Revenue Bonds Novant Health Inc., Series 2010A: | | | | | | |
| | 4,750 | | 5.250%, 11/01/40 | 11/20 at 100.00 | | AA– | | 5,124,918 | |
| | 5,000 | | 5.000%, 11/01/43 | 11/20 at 100.00 | | AA– | | 5,312,450 | |
| | 2,750 | | North Carolina Medical Care Commission, Health Care Facilities Refunding Revenue Bonds, Blue Ridge HealthCare, Series 2010A, 5.000%, 1/01/36 | 1/20 at 100.00 | | A | | 2,848,725 | |
| | | | North Carolina Medical Care Commission, Health Care Facilities Revenue and Refunding Revenue Bonds, Columbus Regional Healthcare System, Series 2013A: | | | | | | |
| | 2,000 | | 3.750%, 10/01/33 | 10/22 at 100.00 | | BBB | | 1,826,920 | |
| | 2,000 | | 4.000%, 10/01/42 | 10/22 at 100.00 | | BBB | | 1,849,700 | |
| | 2,680 | | North Carolina Medical Care Commission, Health Care Facilities Revenue Bonds, Appalachian Regional HealthCare System, Series 2011A, 6.500%, 7/01/31 | 7/21 at 100.00 | | BBB+ | | 3,086,181 | |
| | 2,000 | | North Carolina Medical Care Commission, Health Care Facilities Revenue Bonds, Duke University Health System, Series 2012A, 5.000%, 6/01/42 | 6/22 at 100.00 | | AA | | 2,196,840 | |
| | 2,335 | | North Carolina Medical Care Commission, Health Care Facilities Revenue Bonds, FirstHealth of the Carolinas Project, Refunding Series 2012A, 4.000%, 10/01/39 | 10/17 at 100.00 | | AA | | 2,336,705 | |
| | | | North Carolina Medical Care Commission, Health Care Facilities Revenue Bonds, Wake Forest Baptist Obligated Group, Series 2012A: | | | | | | |
| | 3,000 | | 5.000%, 12/01/45 | No Opt. Call | | A+ | | 3,216,660 | |
| | 9,000 | | 4.000%, 12/01/45 | 12/22 at 100.00 | | A+ | | 8,810,369 | |
| | 2,375 | | North Carolina Medical Care Commission, Health Care Facilities Revenue Refunding Bonds, Cape Fear Valley Health System, Series 2012A, 5.000%, 10/01/27 | No Opt. Call | | A– | | 2,623,306 | |
| | 2,000 | | North Carolina Medical Care Commission, Health Care Facilities Revenue Refunding Bonds, WakeMed, Series 2012A, 5.000%, 10/01/27 | 10/22 at 100.00 | | AA– | | 2,249,040 | |
| | 2,000 | | North Carolina Medical Care Commission, Healthcare Facilities Revenue Bonds, Stanly Memorial Hospital, Series 1999, 6.375%, 10/01/29 | 10/14 at 100.00 | | A+ | | 2,009,180 | |
| | 2,930 | | North Carolina Medical Care Commission, Hospital Revenue Bonds, Southeastern Regional Medical Center, Refunding Series 2012, 5.000%, 6/01/32 | 6/22 at 100.00 | | A | | 3,149,721 | |
| | 3,295 | | North Carolina Medical Care Commission, Revenue Bonds, Blue Ridge Healthcare System, Series 2005, 5.000%, 1/01/33 – FGIC Insured | 1/15 at 100.00 | | AA– | | 3,309,795 | |
| | 750 | | Northern Hospital District of Surry County, North Carolina, Health Care Facilities Revenue Bonds, Series 2008, 6.250%, 10/01/38 | 4/18 at 100.00 | | BBB | | 807,203 | |
| | 1,660 | | Onslow County Hospital Authority, North Carolina, FHA Insured Mortgage Revenue Bonds, Onslow Memorial Hospital Project, Series 2006, 5.000%, 4/01/31 – NPFG Insured | 10/16 at 100.00 | | AA– | | 1,707,791 | |
| | 72,615 | | Total Health Care | | | | | 76,336,957 | |
| | | | Housing/Multifamily – 3.3% (2.3% of Total Investments) | | | | | | |
| | 3,875 | | Durham Housing Authority, North Carolina, Multifamily Housing Revenue Bonds, JFK Towers Project, Series 2012A, 5.000%, 12/01/47 | No Opt. Call | | A– | | 4,005,394 | |
| | | | Mecklenburg County, North Carolina, FNMA Multifamily Housing Revenue Bonds, Little Rock Apartments, Series 2003: | | | | | | |
| | 850 | | 5.150%, 1/01/22 (Alternative Minimum Tax) | 7/18 at 100.00 | | AA+ | | 885,292 | |
| | 2,260 | | 5.375%, 1/01/36 (Alternative Minimum Tax) | 7/18 at 100.00 | | AA+ | | 2,312,635 | |
| NNC | Nuveen North Carolina Premium Income Municipal Fund | |
| | Portfolio of Investments (continued) | May 31, 2014 |
| | Principal | | | Optional Call | | | | | |
| | Amount (000) | | Description (1) | Provisions (2) | | Ratings (3) | | Value | |
| | | | Housing/Multifamily (continued) | | | | | | |
| $ | 1,000 | | North Carolina Capital Facilities Financing Agency, Housing Revenue Bonds, Elizabeth City State University, Series 2003A, 5.000%, 6/01/28 – AMBAC Insured | 8/14 at 100.00 | | N/R | $ | 1,000,530 | |
| | 7,985 | | Total Housing/Multifamily | | | | | 8,203,851 | |
| | | | Housing/Single Family – 2.3% (1.5% of Total Investments) | | | | | | |
| | 1,305 | | North Carolina Housing Finance Agency, Home Ownership Revenue Bonds, Series 2007-29A, 4.800%, 7/01/33 (Alternative Minimum Tax) | 1/17 at 100.00 | | AA | | 1,324,588 | |
| | 2,200 | | North Carolina Housing Finance Agency, Home Ownership Revenue Bonds, Series 2011-1, 4.500%, 1/01/28 | 1/21 at 100.00 | | AA | | 2,346,344 | |
| | 1,895 | | North Carolina Housing Finance Agency, Home Ownership Revenue Bonds, Series 25-A, 4.900%, 7/01/37 (Alternative Minimum Tax) | 7/16 at 100.00 | | AA | | 1,919,275 | |
| | 5,400 | | Total Housing/Single Family | | | | | 5,590,207 | |
| | | | Long-Term Care – 1.4% (1.0% of Total Investments) | | | | | | |
| | | | North Carolina Medical Care Commission, Healthcare Facilities Revenue Bonds, Presbyterian Homes, Series 2006: | | | | | | |
| | 700 | | 5.400%, 10/01/27 | 10/16 at 100.00 | | N/R | | 707,280 | |
| | 1,500 | | 5.500%, 10/01/31 | 10/16 at 100.00 | | N/R | | 1,509,015 | |
| | 900 | | North Carolina Medical Care Commission, Revenue Bonds, Pines at Davidson, Series 2006A, 5.000%, 1/01/36 | 1/16 at 100.00 | | A– | | 908,568 | |
| | 450 | | North Carolina Medical Care Commission, Revenue Bonds, United Methodist Retirement Homes Inc., Refunding Series 2013A, 5.000%, 10/01/33 | 10/23 at 100.00 | | N/R | | 451,035 | |
| | 3,550 | | Total Long-Term Care | | | | | 3,575,898 | |
| | | | Materials – 0.6% (0.4% of Total Investments) | | | | | | |
| | 1,400 | | Columbus County Industrial Facilities and Pollution Control Financing Authority, North Carolina, Environmental Improvement Revenue Bonds, International Paper Company Project, Series 2007A, 4.625%, 3/01/27 | 3/17 at 100.00 | | BBB | | 1,414,868 | |
| | | | Tax Obligation/General – 5.6% (3.8% of Total Investments) | | | | | | |
| | | | Catawba County, North Carolina, General Obligation Bonds, Limited Obligation Series 2014A: | | | | | | |
| | 1,000 | | 5.000%, 6/01/30 | 6/24 at 100.00 | | Aa2 | | 1,155,360 | |
| | 730 | | 5.000%, 6/01/31 | 6/24 at 100.00 | | Aa2 | | 838,690 | |
| | | | Durham, North Carolina, General Obligation Bonds, Series 2007: | | | | | | |
| | 2,820 | | 5.000%, 4/01/21 | 4/17 at 100.00 | | AAA | | 3,142,044 | |
| | 1,475 | | 5.000%, 4/01/22 | 4/17 at 100.00 | | AAA | | 1,649,168 | |
| | 1,050 | | Forsyth County, North Carolina, General Obligation Bonds, Limited Obligation Series 2009, 5.000%, 4/01/30 | 4/20 at 100.00 | | AA+ | | 1,160,733 | |
| | 5,100 | | Wake County, North Carolina, Limited Obligation Bonds, Series 2010, 5.000%, 1/01/37 | 1/20 at 100.00 | | AA+ | | 5,803,239 | |
| | 12,175 | | Total Tax Obligation/General | | | | | 13,749,234 | |
| | | | Tax Obligation/Limited – 16.2% (10.9% of Total Investments) | | | | | | |
| | | | Buncombe County, North Carolina, Limited Obligation Bonds, Series 2014A: | | | | | | |
| | 1,085 | | 5.000%, 6/01/33 | 6/24 at 100.00 | | AA+ | | 1,254,564 | |
| | 1,600 | | 5.000%, 6/01/34 | 6/24 at 100.00 | | AA+ | | 1,839,696 | |
| | 2,405 | | Charlotte, North Carolina, Certificates of Participation, Transit Projects Phase 2, Series 2008A, 5.000%, 6/01/33 | 6/18 at 100.00 | | AA+ | | 2,657,597 | |
| | 2,085 | | Dare County, North Carolina, Installment Purchase Contract, Limited Obligation Series 2012B, 5.000%, 6/01/28 | 6/22 at 100.00 | | AA– | | 2,378,922 | |
| | 850 | | Davidson County, North Carolina, Certificates of Participation, Series 2004, 5.250%, 6/01/14 – AMBAC Insured | No Opt. Call | | Aa3 | | 850,111 | |
| | 1,390 | | Durham, North Carolina, Certificates of Participation, Series 2005B, 5.000%, 6/01/25 | 6/15 at 100.00 | | AA+ | | 1,455,247 | |
| | 1,060 | | Government of Guam, Business Privilege Tax Bonds, Series 2011A, 5.125%, 1/01/42 | 1/22 at 100.00 | | A | | 1,108,029 | |
| | Principal | | | Optional Call | | | | | |
| | Amount (000) | | Description (1) | Provisions (2) | | Ratings (3) | | Value | |
| | | | Tax Obligation/Limited (continued) | | | | | | |
| | | | Harnett County, North Carolina, Certificates of Participation, Series 2009: | | | | | | |
| $ | 1,000 | | 5.000%, 6/01/28 – AGC Insured | 6/19 at 100.00 | | AA | $ | 1,090,810 | |
| | 500 | | 5.000%, 6/01/29 – AGC Insured | 6/19 at 100.00 | | AA | | 541,880 | |
| | 1,051 | | Hillsborough, North Carolina, Special Assessment Revenue Bonds, Series 2013, 7.750%, 2/01/24 | 2/23 at 100.00 | | N/R | | 1,112,200 | |
| | | | Jacksonville Public Facilities Corporation, North Carolina, Limited Obligation Bonds, Series 2012: | | | | | | |
| | 1,065 | | 5.000%, 4/01/29 | 4/22 at 100.00 | | A1 | | 1,191,021 | |
| | 1,165 | | 5.000%, 4/01/30 | 4/22 at 100.00 | | A1 | | 1,296,039 | |
| | 1,000 | | 5.000%, 4/01/31 | 4/22 at 100.00 | | A1 | | 1,107,400 | |
| | 200 | | 5.000%, 4/01/32 | 4/22 at 100.00 | | A1 | | 220,612 | |
| | 400 | | Mecklenburg County, North Carolina, Certificates of Participation, Series 2009A, 5.000%, 2/01/27 | 2/19 at 100.00 | | AA+ | | 442,500 | |
| | 8,065 | | North Carolina Turnpike Authority, Monroe Connector System State Appropriation Bonds, Series 2011, 5.000%, 7/01/41 | 7/21 at 100.00 | | AA | | 8,889,968 | |
| | 1,135 | | Raleigh, North Carolina, Certificates of Participation, Series 2007, 5.000%, 2/01/27 | 2/17 at 100.00 | | AA+ | | 1,236,844 | |
| | 1,000 | | Raleigh, North Carolina, Limited Obligation Bonds, Series 2013, 5.000%, 10/01/33 | 10/23 at 100.00 | | AA+ | | 1,147,280 | |
| | 5,000 | | Sampson County, North Carolina, Certificates of Participation, Series 2006, 5.000%, 6/01/34 – AGM Insured | 6/17 at 100.00 | | AA | | 5,435,050 | |
| | 2,450 | | Wilmington, North Carolina, Certificates of Participation, Series 2008A, 5.000%, 6/01/29 | 6/18 at 100.00 | | AA | | 2,735,695 | |
| | 1,750 | | Wilson County, North Carolina, Certificates of Participation, School Facilities Project, Series 2007, 5.000%, 4/01/25 – AMBAC Insured | 4/17 at 100.00 | | Aa3 | | 1,938,913 | |
| | 36,256 | | Total Tax Obligation/Limited | | | | | 39,930,378 | |
| | | | Transportation – 17.0% (11.4% of Total Investments) | | | | | | |
| | 5,000 | | Charlotte, North Carolina, Airport Revenue Bonds, Charlotte Douglas International Refunding Series 2010A, 5.000%, 7/01/39 | 7/20 at 100.00 | | Aa3 | | 5,355,400 | |
| | 10 | | Charlotte, North Carolina, Airport Revenue Bonds, Charlotte Douglas International Refunding Series 2010B, 5.375%, 7/01/28 (Alternative Minimum Tax) | 7/20 at 100.00 | | Aa3 | | 11,185 | |
| | 1,400 | | Charlotte, North Carolina, Airport Revenue Bonds, Charlotte Douglas International, Series 2010B, 5.000%, 7/01/36 (Alternative Minimum Tax) | 7/21 at 100.00 | | Aa3 | | 1,516,578 | |
| | 1,425 | | Charlotte, North Carolina, Airport Revenue Bonds, Refunding Series 2011A, 5.000%, 7/01/41 | No Opt. Call | | Aa3 | | 1,534,440 | |
| | | | Charlotte, North Carolina, Airport Revenue Bonds, Series 2004A: | | | | | | |
| | 600 | | 5.250%, 7/01/24 – NPFG Insured | 7/14 at 100.00 | | AA– | | 602,496 | |
| | 2,710 | | 5.000%, 7/01/29 – NPFG Insured | 7/14 at 100.00 | | AA– | | 2,720,461 | |
| | 1,935 | | 5.000%, 7/01/34 – NPFG Insured | 7/14 at 100.00 | | AA– | | 1,942,372 | |
| | 2,725 | | North Carolina State Ports Authority, Port Facilities Revenue Bonds, Senior Lien Series 2010A, 5.250%, 2/01/40 | 2/20 at 100.00 | | A3 | | 2,942,700 | |
| | 515 | | North Carolina State Ports Authority, Port Facilities Revenue Bonds, Senior Lien Series 2010B, 5.000%, 2/01/29 | 2/20 at 100.00 | | A3 | | 558,940 | |
| | | | North Carolina Turnpike Authority, Triangle Expressway System Revenue Bonds, Series 2009A: | | | | | | |
| | 140 | | 5.000%, 1/01/21 – AGC Insured | 1/19 at 100.00 | | AA | | 157,107 | |
| | 265 | | 5.375%, 1/01/26 – AGC Insured | 1/19 at 100.00 | | AA | | 294,593 | |
| | 1,640 | | 5.500%, 1/01/29 – AGC Insured | 1/19 at 100.00 | | AA | | 1,825,189 | |
| | 7,335 | | 5.750%, 1/01/39 – AGC Insured | 1/19 at 100.00 | | AA | | 8,105,322 | |
| | | | North Carolina Turnpike Authority, Triangle Expressway System Senior Lien Revenue Bonds, Series 2009B: | | | | | | |
| | 150 | | 0.000%, 1/01/31 – AGC Insured | No Opt. Call | | AA | | 74,552 | |
| | 4,355 | | 0.000%, 1/01/33 – AGC Insured | No Opt. Call | | AA | | 1,960,447 | |
| | 2,300 | | 0.000%, 1/01/34 – AGC Insured | No Opt. Call | | AA | | 991,990 | |
| | 2,345 | | 0.000%, 1/01/35 – AGC Insured | No Opt. Call | | AA | | 976,833 | |
| | 7,505 | | 0.000%, 1/01/37 – AGC Insured | No Opt. Call | | AA | | 2,802,592 | |
| | 1,325 | | 0.000%, 1/01/38 – AGC Insured | No Opt. Call | | AA | | 473,794 | |
| | 1,235 | | Piedmont Triad Airport Authority, North Carolina, Airport Revenue Bonds, Series 2005A, 5.000%, 7/01/20 – SYNCORA GTY Insured | 7/15 at 100.00 | | A– | | 1,297,540 | |
| NNC | Nuveen North Carolina Premium Income Municipal Fund | |
| | Portfolio of Investments (continued) | May 31, 2014 |
| | Principal | | | Optional Call | | | | | |
| | Amount (000) | | Description (1) | Provisions (2) | | Ratings (3) | | Value | |
| | | | Transportation (continued) | | | | | | |
| $ | 4,125 | | Raleigh Durham Airport Authority, North Carolina, Airport Revenue Bonds, Refunding Series 2010A, 5.000%, 5/01/36 | 5/20 at 100.00 | | Aa3 | $ | 4,651,556 | |
| | 1,000 | | Raleigh Durham Airport Authority, North Carolina, Airport Revenue Bonds, Series 2007, 5.000%, 5/01/37 – FGIC Insured (Alternative Minimum Tax) | 5/17 at 100.00 | | AA+ | | 1,052,190 | |
| | 50,040 | | Total Transportation | | | | | 41,848,277 | |
| | | | U.S. Guaranteed – 14.1% (9.5% of Total Investments) (4) | | | | | | |
| | | | Albemarle Hospital Authority, North Carolina, Health Care Facilities Revenue Bonds, Series 2007: | | | | | | |
| | 1,840 | | 5.250%, 10/01/27 (Pre-refunded 10/01/17) | 10/17 at 100.00 | | N/R (4) | | 2,110,296 | |
| | 1,725 | | 5.250%, 10/01/38 (Pre-refunded 10/01/17) | 10/17 at 100.00 | | N/R (4) | | 1,978,403 | |
| | 500 | | Charlotte-Mecklenburg Hospital Authority, North Carolina, Healthcare System Revenue Bonds, DBA Carolinas Healthcare System, Series 2005A, 5.000%, 1/15/45 (Pre-refunded 1/15/15) | 1/15 at 100.00 | | AA+ (4) | | 515,155 | |
| | | | Craven County, North Carolina, Certificates of Participation, Series 2007: | | | | | | |
| | 160 | | 5.000%, 6/01/23 (Pre-refunded 6/01/17) – NPFG Insured | 6/17 at 100.00 | | AA– (4) | | 180,936 | |
| | 3,000 | | 5.000%, 6/01/27 (Pre-refunded 6/01/17) – NPFG Insured | 6/17 at 100.00 | | AA– (4) | | 3,392,550 | |
| | | | Greensboro, North Carolina, Combined Enterprise System Revenue Bonds, Series 2005A: | | | | | | |
| | 500 | | 5.000%, 6/01/25 (Pre-refunded 6/01/15) | 6/15 at 100.00 | | AAA | | 524,275 | |
| | 1,295 | | 5.000%, 6/01/26 (Pre-refunded 6/01/15) | 6/15 at 100.00 | | AAA | | 1,357,872 | |
| | 1,680 | | North Carolina Medical Care Commission, Health Care Facilities Revenue Bonds, Cleveland County Healthcare System, Refunding Series 2011A, 5.750%, 1/01/35 (Pre-refunded 1/01/21) | 1/21 at 100.00 | | N/R (4) | | 2,111,155 | |
| | 2,250 | | North Carolina Medical Care Commission, Health Care Facilities Revenue Bonds, WakeMed, Series 2009A, 5.625%, 10/01/38 (Pre-refunded 10/01/14) – AGC Insured | 10/14 at 100.00 | | AA (4) | | 2,291,535 | |
| | | | North Carolina Medical Care Commission, Hospital Revenue Bonds, Wilson Medical Center, Series 2007: | | | | | | |
| | 500 | | 5.000%, 11/01/20 (Pre-refunded 11/01/17) | 11/17 at 100.00 | | N/R (4) | | 572,170 | |
| | 3,425 | | 5.000%, 11/01/27 (Pre-refunded 11/01/17) | 11/17 at 100.00 | | N/R (4) | | 3,919,365 | |
| | | | North Carolina Medical Care Commission, Revenue Bonds, Cleveland County Healthcare System, Series 2004A: | | | | | | |
| | 1,195 | | 5.250%, 7/01/20 (Pre-refunded 7/01/14) – AMBAC Insured | 7/14 at 100.00 | | N/R (4) | | 1,200,258 | |
| | 1,000 | | 5.250%, 7/01/22 (Pre-refunded 7/01/14) – AMBAC Insured | 7/14 at 100.00 | | N/R (4) | | 1,004,400 | |
| | 2,035 | | North Carolina Medical Care Commission, Revenue Bonds, Northeast Medical Center, Series 2004, 5.000%, 11/01/24 (Pre-refunded 11/01/14) | 11/14 at 100.00 | | N/R (4) | | 2,075,720 | |
| | 4,260 | | North Carolina Municipal Power Agency 1, Catawba Electric Revenue Bonds, Series 1986, 5.000%, 1/01/20 (ETM) | No Opt. Call | | Aaa | | 5,054,021 | |
| | 2,990 | | Raleigh, North Carolina, Combined Enterprise System Revenue Bonds, Series 2006A, 5.000%, 3/01/36 (Pre-refunded 3/01/16) | 3/16 at 100.00 | | N/R (4) | | 3,240,532 | |
| | 2,250 | | Rutherford County, North Carolina, Certificates of Participation, Series 2007, 5.000 %, 12/01/27 (Pre-refunded 12/01/17) – AGM Insured | 12/17 at 100.00 | | AA (4) | | 2,581,088 | |
| | | | University of North Carolina System, Pooled Revenue Bonds, Series 2005A: | | | | | | |
| | 555 | | 5.000%, 4/01/22 (Pre-refunded 4/01/15) – AMBAC Insured | 4/15 at 100.00 | | N/R (4) | | 577,483 | |
| | 155 | | 5.000%, 4/01/22 (Pre-refunded 4/01/15) – AMBAC Insured | 4/15 at 100.00 | | N/R (4) | | 161,279 | |
| | 31,315 | | Total U.S. Guaranteed | | | | | 34,848,493 | |
| | | | Utilities – 10.2% (6.9% of Total Investments) | | | | | | |
| | 5,000 | | North Carolina Capital Facilities Financing Agency, Solid Waste Disposal Revenue Bond, Duke Energy Carolinas Project, Refunding Series 2008B, 4.625%, 11/01/40 | 11/20 at 100.00 | | Aa2 | | 5,235,800 | |
| | 2,500 | | North Carolina Eastern Municipal Power Agency, Power System Revenue Bonds, Series 2005, 5.250%, 1/01/20 – AMBAC Insured | 1/16 at 100.00 | | A– | | 2,687,975 | |
| | 1,400 | | North Carolina Eastern Municipal Power Agency, Power System Revenue Bonds, Series 2009B, 5.000%, 1/01/26 | 1/19 at 100.00 | | A– | | 1,540,840 | |
| | 3,500 | | North Carolina Eastern Municipal Power Agency, Power System Revenue Bonds, Series 2012A, 5.000%, 1/01/25 | 7/22 at 100.00 | | A– | | 4,041,310 | |
| | Principal | | | Optional Call | | | | | |
| | Amount (000) | | Description (1) | Provisions (2) | | Ratings (3) | | Value | |
| | | | Utilities (continued) | | | | | | |
| | | | North Carolina Eastern Municipal Power Agency, Power System Revenue Refunding Bonds, Series 1993B: | | | | | | |
| $ | 95 | | 6.000%, 1/01/22 | No Opt. Call | | A– | $ | 118,402 | |
| | 180 | | 6.000%, 1/01/22 – FGIC Insured | No Opt. Call | | A3 | | 224,341 | |
| | 1,100 | | North Carolina Municipal Power Agency 1, Catawba Electric Revenue Bonds, Refunding Series 2009A, 5.000%, 1/01/30 | 1/19 at 100.00 | | A | | 1,225,202 | |
| | | | North Carolina Municipal Power Agency 1, Catawba Electric Revenue Bonds, Refunding Series 2012A: | | | | | | |
| | 4,000 | | 5.000%, 1/01/18 | No Opt. Call | | A | | 4,570,560 | |
| | 2,000 | | 5.000%, 1/01/19 | No Opt. Call | | A | | 2,328,880 | |
| | 1,050 | | 4.000%, 1/01/20 | No Opt. Call | | A | | 1,179,056 | |
| | 250 | | North Carolina Municipal Power Agency 1, Catawba Electric Revenue Bonds, Series 2008A, 5.250%, 1/01/20 | 1/18 at 100.00 | | A | | 281,350 | |
| | 1,535 | | North Carolina Municipal Power Agency 1, Catawba Electric Revenue Bonds, Series 2012B, 5.000%, 1/01/21 | No Opt. Call | | A | | 1,819,374 | |
| | 22,610 | | Total Utilities | | | | | 25,253,090 | |
| | | | Water and Sewer – 27.0% (18.1% of Total Investments) | | | | | | |
| | 1,605 | | Broad River Water Authority, North Carolina, Water System Revenue Bonds, Series 2005, 5.000%, 6/01/20 – SYNCORA GTY Insured | 6/15 at 100.00 | | A2 | | 1,650,630 | |
| | 3,100 | | Brunswick County, North Carolina, Enterprise System Revenue Bonds, Series 2008A, 5.000%, 4/01/31 – AGM Insured | 4/18 at 100.00 | | AA | | 3,429,313 | |
| | 1,145 | | Brunswick County, North Carolina, Enterprise Systems Revenue Refunding Bonds, Series 2012A, 5.000%, 4/01/25 | 4/22 at 100.00 | | AA– | | 1,352,451 | |
| | | | Cape Fear Public Utility Authority, North Carolina, Water & Sewer System Revenue Bonds, Series 2008: | | | | | | |
| | 425 | | 5.000%, 8/01/28 | 8/18 at 100.00 | | AA | | 481,274 | |
| | 1,005 | | 5.000%, 8/01/35 | 8/18 at 100.00 | | AA | | 1,119,078 | |
| | 2,135 | | Cape Fear Public Utility Authority, North Carolina, Water & Sewer System Revenue Bonds, Series 2011, 5.000%, 8/01/31 | 8/21 at 100.00 | | AA | | 2,403,391 | |
| | 1,000 | | Charlotte, North Carolina, Water and Sewerage System Revenue Bonds, Series 2008, 5.000%, 7/01/38 | 7/18 at 100.00 | | AAA | | 1,118,810 | |
| | | | Dare County, North Carolina, Utilities System Revenue Bonds, Series 2011: | | | | | | |
| | 3,860 | | 5.000%, 2/01/36 | 2/21 at 100.00 | | AA | | 4,234,034 | |
| | 1,250 | | 5.000%, 2/01/41 | 2/21 at 100.00 | | AA | | 1,359,450 | |
| | 8,600 | | Durham, North Carolina, Utility System Revenue Bonds, Refunding Series 2011, 5.000%, 6/01/41 | 6/21 at 100.00 | | AAA | | 9,453,893 | |
| | 1,535 | | Mooresville, North Carolina, Enterprise System Revenue Bonds, Refunding Series 2012, 5.000%, 5/01/28 | 5/22 at 100.00 | | AA– | | 1,770,009 | |
| | 1,210 | | Oak Island, North Carolina, Enterprise System Revenue Bonds, Series 2008A, 5.000%, 6/01/23 – NPFG Insured | 6/18 at 100.00 | | AA– | | 1,376,036 | |
| | | | Oak Island, North Carolina, Enterprise System Revenue Bonds, Series 2009A: | | | | | | |
| | 2,020 | | 6.000%, 6/01/34 – AGC Insured | 6/19 at 100.00 | | AA | | 2,263,208 | |
| | 1,020 | | 6.000%, 6/01/36 – AGC Insured | 6/19 at 100.00 | | AA | | 1,140,319 | |
| | | | Oak Island, North Carolina, Enterprise System Revenue Bonds, Series 2011: | | | | | | |
| | 600 | | 5.625%, 6/01/30 – AGC Insured | 6/21 at 100.00 | | AA | | 682,050 | |
| | 2,100 | | 5.750%, 6/01/36 – AGC Insured | 6/21 at 100.00 | | AA | | 2,366,532 | |
| | 1,400 | | Onslow County, North Carolina, Combined Enterprise System Revenue Bonds, Series 2004B, 5.000%, 6/01/23 – SYNCORA GTY Insured | 6/14 at 100.00 | | A+ | | 1,405,194 | |
| | | | Raleigh, North Carolina, Combined Enterprise System Revenue Bonds, Refunding Series 2012A: | | | | | | |
| | 550 | | 5.000%, 3/01/30 | 3/22 at 100.00 | | AAA | | 635,228 | |
| | 1,600 | | 5.000%, 3/01/31 | 3/22 at 100.00 | | AAA | | 1,839,504 | |
| NNC | Nuveen North Carolina Premium Income Municipal Fund | |
| | Portfolio of Investments (continued) | May 31, 2014 |
| | Principal | | | Optional Call | | | | | |
| | Amount (000) | | Description (1) | Provisions (2) | | Ratings (3) | | Value | |
| | | | Water and Sewer (continued) | | | | | | |
| | | | Raleigh, North Carolina, Combined Enterprise System Revenue Bonds, Refunding Series 2013A: | | | | | | |
| $ | 5,000 | | 5.000%, 3/01/28 | 3/23 at 100.00 | | AAA | $ | 5,922,350 | |
| | 3,785 | | 5.000%, 3/01/43 | 3/23 at 100.00 | | AAA | | 4,253,659 | |
| | 4,010 | | Raleigh, North Carolina, Combined Enterprise System Revenue Bonds, Series 2006A, 5.000%, 3/01/36 | 3/16 at 100.00 | | AAA | | 4,267,322 | |
| | 1,000 | | Wilmington, North Carolina, Water and Sewer Revenue Bonds, Series 2005, 5.000%, 6/01/25 – AGM Insured | 6/15 at 100.00 | | AA | | 1,045,220 | |
| | 9,900 | | Winston-Salem, North Carolina, Water and Sewer System Revenue Bonds, Series 2007A, 5.000%, 6/01/37 | 6/17 at 100.00 | | AAA | | 10,865,744 | |
| | 59,855 | | Total Water and Sewer | | | | | 66,434,699 | |
| $ | 348,036 | | Total Long-Term Investments (cost $346,155,913) | | | �� | | 366,357,212 | |
| | | | Variable Rate MuniFund Term Preferred Shares, at Liquidation Value – (50.7)% (5) | | | | | (125,000,000 | ) |
| | | | Other Assets Less Liabilities – 2.1% | | | | | 5,134,369 | |
| | | | Net Assets Applicable to Common Shares – 100% | | | | $ | 246,491,581 | |
| (1) | All percentages shown in the Portfolio of Investments are based on net assets applicable to common shares unless otherwise noted. |
| (2) | Optional Call Provisions (not covered by the report of independent registered public accounting firm): Dates (month and year) and prices of the earliest optional call or redemption. There may be other call provisions at varying prices at later dates. Certain mortgage-backed securities may be subject to periodic principal paydowns. |
| (3) | Ratings (not covered by the report of independent registered public accounting firm): Using the highest of Standard & Poor’s Group (“Standard & Poor’s”), Moody’s Investors Service, Inc. (“Moody’s”) or Fitch, Inc. (“Fitch”) rating. Ratings below BBB by Standard & Poor’s, Baa by Moody’s or BBB by Fitch are considered to be below investment grade. Holdings designated N/R are not rated by any of these national rating agencies. |
| (4) | Backed by an escrow or trust containing sufficient U.S. Government or U.S. Government agency securities, which ensure the timely payment of principal and interest. Certain bonds backed by U.S. Government or agency securities are regarded as having an implied rating equal to the rating of such securities. |
| (5) | Variable Rate MuniFund Term Preferred Shares, at Liquidation Value as a percentage of Total Investments is 34.1% |
| (ETM) | Escrowed to maturity. |
See accompanying notes to financial statements.
| NPV | | |
| | Nuveen Virginia Premium Income Municipal Fund | |
| | Portfolio of Investments | May 31, 2014 |
| | Principal | | | Optional Call | | | | | |
| | Amount (000) | | Description (1) | Provisions (2) | | Ratings (3) | | Value | |
| | | | LONG-TERM INVESTMENTS – 150.5% (100.0% of Total Investments) | | | | | | |
| | | | MUNICIPAL BONDS – 150.5% (100.0% of Total Investments) | | | | | | |
| | | | Consumer Staples – 7.3% (4.9% of Total Investments) | | | | | | |
| | | | Guam Economic Development & Commerce Authority, Tobacco Settlement Asset-Backed Bonds, Series 2007A: | | | | | | |
| $ | 795 | | 5.250%, 6/01/32 | 6/17 at 100.00 | | B | $ | 704,704 | |
| | 700 | | 5.625%, 6/01/47 | 6/17 at 100.00 | | B | | 556,325 | |
| | 73,500 | | Puerto Rico, The Children’s Trust Fund, Tobacco Settlement Asset-Backed Bonds, Series 2005A, 0.000%, 5/15/50 | 5/15 at 11.19 | | BB– | | 4,814,985 | |
| | | | Puerto Rico, The Children’s Trust Fund, Tobacco Settlement Asset-Backed Refunding Bonds, Series 2002: | | | | | | |
| | 2,825 | | 5.375%, 5/15/33 | 8/14 at 100.00 | | BBB+ | | 2,853,278 | |
| | 325 | | 5.500%, 5/15/39 | 8/14 at 100.00 | | BBB | | 296,290 | |
| | 11,425 | | Tobacco Settlement Financing Corporation of Virginia, Tobacco Settlement Asset Backed Bonds, Series 2007B1, 5.000%, 6/01/47 | 6/17 at 100.00 | | B– | | 8,173,902 | |
| | 2,145 | | Tobacco Settlement Financing Corporation of Virginia, Tobacco Settlement Asset-Backed Bonds, Series 2007B2, 5.200%, 6/01/46 | 6/17 at 100.00 | | B– | | 1,592,212 | |
| | 91,715 | | Total Consumer Staples | | | | | 18,991,696 | |
| | | | Education and Civic Organizations – 10.1% (6.7% of Total Investments) | | | | | | |
| | 1,615 | | Alexandria Industrial Development Authority, Virginia, Educational Facilities Revenue Bonds, Episcopal High School, Series 2012, 3.750%, 1/01/30 | No Opt. Call | | A1 | | 1,622,704 | |
| | 580 | | Amherst Industrial Development Authority, Virginia, Revenue Bonds, Sweet Briar College, Series 2006, 5.000%, 9/01/26 | 9/16 at 100.00 | | BBB | | 598,914 | |
| | 1,000 | | Lexington Industrial Development Authority, Virginia, Educational Facilities Revenue Bonds, VMI Development Board Project, Series 2006C, 5.000%, 12/01/36 | 6/19 at 100.00 | | Aa2 | | 1,112,300 | |
| | 2,000 | | Louisiana State, General Obligation Bonds, Series 2005A, 5.000%, 8/01/14 – NPFG Insured | No Opt. Call | | AA | | 2,016,080 | |
| | 1,630 | | Prince William County Industrial Development Authority, Virginia, Student Housing Revenue | 9/21 at 100.00 | | A | | 1,745,942 | |
| | | | Bonds, George Mason University Foundation Prince William Housing LLC Project, Series 2011A, 5.125%, 9/01/41 | | | | | | |
| | 1,720 | | Puerto Rico Industrial, Tourist, Educational, Medical and Environmental Control Facilities Financing Authority, Higher Education Revenue Refunding Bonds, Ana G. Mendez University System, Series 2002, 5.375%, 12/01/21 | 8/14 at 100.00 | | BBB– | | 1,719,845 | |
| | 995 | | The Rector and Visitors of the University of Virginia, General Revenue Bonds, Series 2005, 5.000%, 6/01/37 | 6/15 at 100.00 | | AAA | | 1,035,964 | |
| | 6,600 | | The Rector and Visitors of the University of Virginia, General Revenue Bonds, Series 2008, 5.000%, 6/01/40 | 6/18 at 100.00 | | AAA | | 7,341,708 | |
| | 390 | | University of Puerto Rico, University System Revenue Bonds, Series 2006P, 5.000%, 6/01/14 | No Opt. Call | | BB+ | | 389,945 | |
| | 3,570 | | Virginia College Building Authority, Educational Facilities Revenue Bonds, Public Higher Education Financing Program, Series 2009A, 5.000%, 9/01/28 | No Opt. Call | | Aa1 | | 4,034,279 | |
| | 3,000 | | Virginia College Building Authority, Educational Facilities Revenue Bonds, Washington and Lee University, Series 2001, 5.375%, 1/01/21 | No Opt. Call | | AA | | 3,497,910 | |
| | 500 | | Virginia College Building Authority, Educational Facilities Revenue Refunding Bonds, Marymount University, Series 1998, 5.100%, 7/01/18 – RAAI Insured | 7/14 at 100.00 | | N/R | | 501,325 | |
| | 500 | | Virginia Small Business Finance Authority, Educational Facilities Revenue Bonds, Roanoke College, Series 2011, 5.750%, 4/01/41 | 4/20 at 100.00 | | A– | | 555,135 | |
| | 24,100 | | Total Education and Civic Organizations | | | | | 26,172,051 | |
| NPV | Nuveen Virginia Premium Income Municipal Fund | |
| | Portfolio of Investments (continued) | May 31, 2014 |
| | Principal | | | Optional Call | | | | | |
| | Amount (000) | | Description (1) | Provisions (2) | | Ratings (3) | | Value | |
| | | | Health Care – 27.5% (18.3% of Total Investments) | | | | | | |
| $ | 5,000 | | Arlington County Industrial Development Authority, Virginia, Hospital Revenue Bonds, Virginia Hospital Center Arlington Health System, Refunding Series 2010, 5.000%, 7/01/31 | 7/20 at 100.00 | | AA– | $ | 5,548,000 | |
| | | | Charlotte County Industrial Development Authority, Virginia, Hospital Revenue Bonds, Halifax Regional Hospital Incorporated, Series 2007: | | | | | | |
| | 1,545 | | 5.000%, 9/01/27 | 9/17 at 100.00 | | A | | 1,614,618 | |
| | 250 | | 5.000%, 9/01/37 | 9/17 at 100.00 | | A | | 258,310 | |
| | 2,145 | | Chesterfield County Economic Development Authority, Virginia, Revenue Bonds, Bon Secours Health, Series 2010C-2, 5.000%, 11/01/42 – AGC Insured | 11/20 at 100.00 | | AA | | 2,297,917 | |
| | 3,375 | | Colorado Health Facilities Authority, Colorado, Revenue Bonds, Catholic Health Initiatives, Series 2013A, 5.250%, 1/01/40 | 1/23 at 100.00 | | A+ | | 3,727,958 | |
| | 1,000 | | Fairfax County Industrial Development Authority, Virginia, Healthcare Revenue Bonds, Inova Health System, Series 2012A, 5.000%, 5/15/40 | 5/22 at 100.00 | | AA+ | | 1,089,970 | |
| | 3,340 | | Fairfax County Industrial Development Authority, Virginia, Healthcare Revenue Bonds, Inova Health System, Series 2009, Trust 11733, 14.916%, 11/15/29 (IF) | 5/19 at 100.00 | | AA+ | | 4,530,075 | |
| | 4,950 | | Fairfax County Industrial Development Authority, Virginia, Hospital Revenue Refunding Bonds, Inova Health System, Series 1993A, 5.000%, 8/15/23 | No Opt. Call | | AA+ | | 5,958,266 | |
| | | | Fredericksburg Economic Development Authority, Virginia, Hospital Facilities Revenue Bonds, MediCorp Health System, Series 2007: | | | | | | |
| | 1,080 | | 5.250%, 6/15/18 | No Opt. Call | | Baa1 | | 1,205,410 | |
| | 2,500 | | 5.250%, 6/15/23 | No Opt. Call | | Baa1 | | 2,836,575 | |
| | 680 | | Hanover County Industrial Development Authority, Virginia, Hospital Revenue Bonds, Memorial Regional Medical Center, Series 1995, 6.375%, 8/15/18 – NPFG Insured | No Opt. Call | | AA– | | 739,486 | |
| | 9,265 | | Harrisonburg Industrial Development Authority, Virginia, Hospital Facilities Revenue Bonds, Rockingham Memorial Hospital, Series 2006, 5.000%, 8/15/31 – AMBAC Insured | 8/16 at 100.00 | | AA | | 9,632,450 | |
| | 1,500 | | Henrico County Industrial Development Authority, Virginia, Healthcare Revenue Bonds, Bon Secours Health System, Series 1996, 6.250%, 8/15/20 – NPFG Insured | No Opt. Call | | AA– | | 1,719,375 | |
| | 3,155 | | Prince William County Industrial Development Authority, Virginia, Health Care Facilities Revenue Refunding Bonds, Novant Health Obligated Group-Prince William Hospital, Series 2013B, 5.000%, 11/01/46 | 11/22 at 100.00 | | AA– | | 3,397,241 | |
| | | | Stafford County Economic Development Authority, Virginia, Hospital Facilities Revenue Bonds, MediCorp Health System, Series 2006: | | | | | | |
| | 2,000 | | 5.250%, 6/15/25 | 6/16 at 100.00 | | Baa1 | | 2,062,820 | |
| | 2,000 | | 5.250%, 6/15/26 | 6/16 at 100.00 | | Baa1 | | 2,056,320 | |
| | 2,025 | | 5.250%, 6/15/31 | 6/16 at 100.00 | | Baa1 | | 2,066,938 | |
| | 7,395 | | 5.250%, 6/15/37 | 6/16 at 100.00 | | Baa1 | | 7,516,278 | |
| | 2,550 | | Virginia Small Business Finance Authority, Healthcare Facilities Revenue Bonds, Sentara Healthcare, Refunding Series 2010, 5.000%, 11/01/40 | 5/20 at 100.00 | | AA | | 2,745,075 | |
| | 4,425 | | Virginia Small Business Financing Authority, Wellmont Health System Project Revenue Bonds, Series 2007A, 5.250%, 9/01/37 | 9/17 at 100.00 | | BBB+ | | 4,537,528 | |
| | 1,620 | | Winchester Industrial Development Authority, Virginia, Hospital Revenue Bonds Valley Health System Obligated Group, Series 2009E, 5.625%, 1/01/44 | 1/19 at 100.00 | | A+ | | 1,772,539 | |
| | 2,855 | | Winchester Industrial Development Authority, Virginia, Hospital Revenue Bonds, Winchester Medical Center, Series 2007, 5.125%, 1/01/31 | 1/17 at 100.00 | | A+ | | 2,992,811 | |
| | 1,020 | | Wisconsin Health and Educational Facilities Authority, Revenue Bonds, Aurora Health Care, Inc., Series 2010A, 5.625%, 4/15/39 | 4/20 at 100.00 | | A | | 1,104,303 | |
| | 65,675 | | Total Health Care | | | | | 71,410,263 | |
| | | | Housing/Multifamily – 1.3% (0.9% of Total Investments) | | | | | | |
| | 925 | | Arlington County Industrial Development Authority, Virginia, Multifamily Housing Mortgage Revenue Bonds, Arlington View Terrace Apartments, Series 2001, 5.150%, 11/01/31 (Mandatory put 11/01/19) (Alternative Minimum Tax) | 9/14 at 100.00 | | AA | | 927,239 | |
| | 400 | | Virginia Housing Development Authority, Rental Housing Bonds, Series 2010A, 5.000%, 4/01/45 | 10/19 at 100.00 | | AA+ | | 420,304 | |
| | Principal | | | Optional Call | | | | | |
| | Amount (000) | | Description (1) | Provisions (2) | | Ratings (3) | | Value | |
| | | | Housing/Multifamily (continued) | | | | | | |
| $ | 530 | | Virginia Housing Development Authority, Rental Housing Bonds, Series 2010C, 4.550%, 8/01/32 | 2/20 at 100.00 | | AA+ | $ | 558,790 | |
| | 1,425 | | Waynesboro Redevelopment and Housing Authority, Virginia, Multifamily Housing Revenue Bonds, Epworth Manor, GNMA Collateralized Series 2010, 5.000%, 10/20/51 | 4/20 at 100.00 | | AA+ | | 1,500,197 | |
| | 3,280 | | Total Housing/Multifamily | | | | | 3,406,530 | |
| | | | Housing/Single Family – 6.7% (4.5% of Total Investments) | | | | | | |
| | 2,740 | | Virginia Housing Development Authority, Commonwealth Mortgage Bonds, Series 2006, 4.800%, 7/01/29 (Alternative Minimum Tax) | 7/15 at 100.00 | | AAA | | 2,766,030 | |
| | 7,900 | | Virginia Housing Development Authority, Commonwealth Mortgage Bonds, Series 2007B, 4.750%, 7/01/32 (Alternative Minimum Tax) | 7/16 at 100.00 | | AAA | | 8,026,716 | |
| | | | Virginia Housing Development Authority, Commonwealth Mortgage Bonds, Series 2012C-5: | | | | | | |
| | 2,500 | | 4.550%, 7/01/31 | 10/22 at 100.00 | | AAA | | 2,702,350 | |
| | 2,000 | | 4.800%, 7/01/38 | 10/22 at 100.00 | | AAA | | 2,154,240 | |
| | | | Virginia Housing Development Authority, Commonwealth Mortgage Bonds, Series 2012C-8: | | | | | | |
| | 715 | | 4.400%, 10/01/31 | 10/22 at 100.00 | | AAA | | 761,947 | |
| | 1,000 | | 4.750%, 10/01/38 | 10/22 at 100.00 | | AAA | | 1,069,870 | |
| | 16,855 | | Total Housing/Single Family | | | | | 17,481,153 | |
| | | | Long-Term Care – 9.1% (6.0% of Total Investments) | | | | | | |
| | 2,000 | | Albemarle County Industrial Development Authority, Virginia, Residential Care Facilities Mortgage Revenue Bonds, Westminster-Canterbury of the Blue Ridge, Series 2007, 5.000%, 1/01/31 | 1/17 at 100.00 | | N/R | | 2,021,160 | |
| | 1,000 | | Chesterfield County Health Center Commission, Virginia, Mortgage Revenue Bonds, Lucy Corr Village, Series 2005, 5.625%, 12/01/39 | 12/15 at 100.00 | | N/R | | 700,280 | |
| | 5,585 | | Fairfax County Economic Development Authority, Virginia, Residential Care Facilities Mortgage Revenue Bonds, Goodwin House, Inc., Series 2007A, 5.125%, 10/01/37 | 10/17 at 100.00 | | BBB | | 5,779,079 | |
| | | | Fairfax County Economic Development Authority, Virginia, Retirement Center Revenue Bonds, Greenspring Village, Series 2006A: | | | | | | |
| | 1,000 | | 4.750%, 10/01/26 | 10/16 at 100.00 | | A | | 1,029,630 | |
| | 800 | | 4.875%, 10/01/36 | 10/16 at 100.00 | | A | | 817,392 | |
| | | | Henrico County Economic Development Authority, Virginia, Residential Care Facility Revenue Bonds, Westminster Canterbury of Richmond, Series 2006: | | | | | | |
| | 100 | | 5.000%, 10/01/27 | 10/17 at 100.00 | | BBB+ | | 102,088 | |
| | 4,740 | | 5.000%, 10/01/35 | 8/14 at 100.00 | | BBB+ | | 4,837,786 | |
| | 3,590 | | Industrial Development Authority of the County of Prince William, Virginia, Residential Care Facility Revenue Bonds, Westminster at Lake, First Mortgage, Series 2006, 5.125%, 1/01/26 | 1/17 at 100.00 | | N/R | | 3,306,785 | |
| | 1,000 | | Roanoke Economic Development Authority, Virginia, Residential Care Facility Mortgage Revenue Refunding Bonds, Virginia Lutheran Homes Brandon Oaks Project, Series 2012, 4.625%, 12/01/27 | 12/22 at 100.00 | | N/R | | 966,360 | |
| | 1,500 | | Roanoke Industrial Development Authority, Virginia, Residential Revenue Bonds, Virginia Lutheran Homes Incorporated, Series 2006, 5.000%, 12/01/39 | 12/16 at 100.00 | | N/R | | 1,409,535 | |
| | 1,000 | | Suffolk Industrial Development Authority, Virginia, Retirement Facilities First Mortgage Revenue Bonds, Lake Prince Center, Series 2006, 5.300%, 9/01/31 | 9/16 at 100.00 | | N/R | | 1,004,120 | |
| | 1,000 | | Virginia Beach Development Authority, Virginia, Residential Care Facility Mortgage Revenue Bonds, Westminster Canterbury on Chesapeake Bay, Series 2005, 5.000%, 11/01/22 | 11/15 at 100.00 | | N/R | | 1,013,910 | |
| | 500 | | Winchester Industrial Development Authority, Virginia, Residential Care Facility Revenue Bonds, Westminster-Canterbury of Winchester Inc., Series 2005A, 5.200%, 1/01/27 | 1/15 at 100.00 | | BBB+ | | 503,450 | |
| | 23,815 | | Total Long-Term Care | | | | | 23,491,575 | |
| | | | Tax Obligation/General – 13.2% (8.7% of Total Investments) | | | | | | |
| | 1,440 | | Bristol, Virginia, General Obligation Bonds, Refunding & Improvement Series 2010, 5.000%, 7/15/25 | 7/20 at 100.00 | | A1 | | 1,713,139 | |
| | 1,000 | | Chesterfield County, Virginia, General Obligation Bonds, Public Improvement Series 2009A, 5.000%, 1/01/16 | No Opt. Call | | AAA | | 1,076,060 | |
| NPV | Nuveen Virginia Premium Income Municipal Fund | |
| | Portfolio of Investments (continued) | May 31, 2014 |
| | Principal | | | Optional Call | | | | | |
| | Amount (000) | | Description (1) | Provisions (2) | | Ratings (3) | | Value | |
| | | | Tax Obligation/General (continued) | | | | | | |
| $ | 3,000 | | Clark County School District, Nevada, General Obligation Bonds, Refunding Series 2011A, 5.000%, 6/15/14 | No Opt. Call | | AA– | $ | 3,006,120 | |
| | 1,000 | | Loudoun County, Virginia, General Obligation Bonds, Public Improvement Series 2009A, 4.000%, 7/01/14 | No Opt. Call | | AAA | | 1,003,380 | |
| | 1,645 | | Norfolk, Virginia, General Obligation Bonds, Refunding Capital Improvement Series 2013A, 2.000%, 8/01/14 | No Opt. Call | | AA+ | | 1,650,313 | |
| | 1,070 | | Norfolk, Virginia, General Obligation Bonds, Series 2005, 5.000%, 3/01/15 – NPFG Insured | No Opt. Call | | AA+ | | 1,109,430 | |
| | 6,050 | | Portsmouth, Virginia, General Obligation Bonds, Refunding Series 2010D, 5.000%, 7/15/34 | 7/20 at 100.00 | | AA | | 6,809,094 | |
| | 1,280 | | Portsmouth, Virginia, General Obligation Bonds, Series 2005A, 5.000%, 4/01/15 – NPFG Insured | No Opt. Call | | AA | | 1,332,134 | |
| | 610 | | Puerto Rico, General Obligation and Public Improvement Bonds, Series 1998, 6.000%, 7/01/15 – NPFG Insured | No Opt. Call | | AA– | | 629,526 | |
| | 560 | | Puerto Rico, General Obligation Bonds, Series 2004A, 5.000%, 7/01/15 – AGM Insured | 7/14 at 100.00 | | AA | | 561,053 | |
| | 1,000 | | Richmond, Virginia, General Obligation Bonds, Public Improvement Series 2009A, 5.000%, 7/15/22 | 7/19 at 100.00 | | AA+ | | 1,182,400 | |
| | 1,295 | | Richmond, Virginia, General Obligation Bonds, Refunding & Improvement Series 2012B, 5.000%, 7/15/15 | No Opt. Call | | AA+ | | 1,366,031 | |
| | 1,535 | | Suffolk, Virginia, General Obligation Bonds, Series 2005, 5.000%, 12/01/15 | No Opt. Call | | AA+ | | 1,646,149 | |
| | | | Virginia Beach, Virginia, General Obligation Bonds, Series 2008: | | | | | | |
| | 4,500 | | 5.000%, 10/01/26 (UB) | 10/17 at 100.00 | | AAA | | 5,056,470 | |
| | 4,500 | | 5.000%, 10/01/27 (UB) | 10/17 at 100.00 | | AAA | | 5,009,535 | |
| | 1,000 | | Virginia State, General Obligation Bonds, Series 2004B, 5.000%, 6/01/14 | No Opt. Call | | AAA | | 1,000,140 | |
| | 31,485 | | Total Tax Obligation/General | | | | | 34,150,974 | |
| | | | Tax Obligation/Limited – 25.9% (17.2% of Total Investments) | | | | | | |
| | | | Buena Vista Public Recreational Facilities Authority, Virginia, Lease Revenue Bonds, Golf Course Project, Series 2005A: | | | | | | |
| | 630 | | 5.250%, 7/15/25 – ACA Insured | 7/15 at 100.00 | | N/R | | 539,154 | |
| | 520 | | 5.500%, 7/15/35 – ACA Insured | 7/15 at 100.00 | | N/R | | 408,174 | |
| | 1,340 | | Culpeper Industrial Development Authority, Virginia, Lease Revenue Bonds, School Facilities Project, Series 2005, 5.000%, 1/01/20 – NPFG Insured | 1/15 at 100.00 | | AA– | | 1,377,453 | |
| | 1,135 | | Cumberland County, Virginia, Certificates of Participation, Series 1997, 6.375%, 7/15/17 | No Opt. Call | | N/R | | 1,237,910 | |
| | 600 | | Dulles Town Center Community Development Authority, Loudon County, Virginia Special Assessment Refunding Bonds, Dulles Town Center Project, Series 2012, 4.250%, 3/01/26 | No Opt. Call | | N/R | | 583,716 | |
| | 4,000 | | Fairfax County Economic Development Authority, Virginia, Transportation District Improvement Revenue Bonds, Silver Line Phase 1 Project, Series 2011, 5.000%, 4/01/27 | No Opt. Call | | AA | | 4,473,520 | |
| | | | Government of Guam, Business Privilege Tax Bonds, Series 2011A: | | | | | | |
| | 1,020 | | 5.000%, 1/01/31 | 1/22 at 100.00 | | A | | 1,076,916 | |
| | 500 | | 5.250%, 1/01/36 | 1/22 at 100.00 | | A | | 527,305 | |
| | | | Greater Richmond Convention Center Authority, Virginia, Hotel Tax Revenue Bonds, Series 2005: | | | | | | |
| | 2,480 | | 5.000%, 6/15/15 – NPFG Insured | No Opt. Call | | AA– | | 2,597,056 | |
| | 5,700 | | 5.000%, 6/15/30 – NPFG Insured | 6/15 at 100.00 | | AA– | | 5,914,434 | |
| | 1,270 | | James City County Economic Development Authority, Virginia, Lease Revenue Bonds, County Government Projects, Series 2005, 5.000%, 7/15/19 | 7/15 at 100.00 | | AA+ | | 1,336,713 | |
| | 890 | | Montgomery County Industrial Development Authority, Virginia, Public Facility Lease Revenue Bonds, Public Projects Series 2008, 5.000%, 2/01/29 | 2/18 at 100.00 | | AA– | | 985,755 | |
| | 645 | | Puerto Rico Highway and Transportation Authority, Highway Revenue Bonds, Series 2007N, 5.500%, 7/01/29 – AMBAC Insured | No Opt. Call | | Ba2 | | 626,946 | |
| | | | Puerto Rico Highway and Transportation Authority, Subordinate Lien Highway Revenue Bonds, Series 2003: | | | | | | |
| | 1,000 | | 5.250%, 7/01/15 – FGIC Insured | 8/14 at 100.00 | | BB+ | | 855,700 | |
| | 1,500 | | 5.250%, 7/01/17 – FGIC Insured | 8/14 at 100.00 | | BB+ | | 1,130,145 | |
| | Principal | | | Optional Call | | | | | |
| | Amount (000) | | Description (1) | Provisions (2) | | Ratings (3) | | Value | |
| | | | Tax Obligation/Limited (continued) | | | | | | |
| | | | Puerto Rico Infrastructure Financing Authority, Special Tax Revenue Bonds, Series 2005A: | | | | | | |
| $ | 5,085 | | 0.000%, 7/01/29 – AMBAC Insured | No Opt. Call | | BB+ | $ | 1,643,167 | |
| | 5,000 | | 0.000%, 7/01/43 – AMBAC Insured | No Opt. Call | | BB+ | | 549,150 | |
| | 5,875 | | Puerto Rico Infrastructure Financing Authority, Special Tax Revenue Bonds, Series 2005C, 0.000%, 7/01/28 – AMBAC Insured | No Opt. Call | | BB+ | | 2,046,086 | |
| | 3,400 | | Puerto Rico Sales Tax Financing Corporation, Sales Tax Revenue Bonds, First Subordinate Series 2009A, 6.000%, 8/01/42 | 8/19 at 100.00 | | A+ | | 2,957,728 | |
| | 2,705 | | Puerto Rico Sales Tax Financing Corporation, Sales Tax Revenue Bonds, First Subordinate Series 2010A, 5.500%, 8/01/42 | 2/20 at 100.00 | | A+ | | 2,202,871 | |
| | 3,195 | | Puerto Rico Sales Tax Financing Corporation, Sales Tax Revenue Bonds, First Subordinate Series 2010C, 6.000%, 8/01/39 | 8/20 at 100.00 | | A+ | | 2,795,210 | |
| | 10,000 | | Puerto Rico Sales Tax Financing Corporation, Sales Tax Revenue Bonds, Series 2007A, 0.000%, 8/01/41 – NPFG Insured | No Opt. Call | | AA– | | 1,782,200 | |
| | 5 | | Puerto Rico, Highway Revenue Bonds, Highway and Transportation Authority, Series 2003AA, 5.500%, 7/01/18 – NPFG Insured | No Opt. Call | | AA– | | 5,372 | |
| | 760 | | Puerto Rico, Highway Revenue Bonds, Highway and Transportation Authority, Series 2007CC, 5.500%, 7/01/28 – NPFG Insured | No Opt. Call | | AA– | | 773,399 | |
| | 2,490 | | Stafford County and Staunton Industrial Development Authority, Virginia, Revenue Bonds, Virginia Municipal League and Virginia Association of Counties Finance Program, Series 2006A, 5.000%, 8/01/23 – NPFG Insured | 8/16 at 100.00 | | A3 | | 2,596,149 | |
| | 205 | | Stafford County and Staunton Industrial Development Authority, Virginia, Revenue Bonds, Virginia Municipal League and Virginia Association of Counties Finance Program, Series 2007C, 5.000%, 2/01/37 – SYNCORA GTY Insured | 2/17 at 100.00 | | N/R | | 208,493 | |
| | 5,000 | | Stafford County Economic Development Authority, Virginia, Lease Revenue Bonds, Public Facility Projects, Series 2008, 5.000%, 4/01/33 – AGC Insured (UB) | 4/18 at 100.00 | | AA | | 5,494,150 | |
| | 1,550 | | Virgin Islands Public Finance Authority, Gross Receipts Taxes Loan Note, Series 2003, 5.000%, 10/01/31 – ACA Insured | 10/14 at 100.00 | | BBB+ | | 1,556,045 | |
| | 3,000 | | Virgin Islands Public Finance Authority, Matching Fund Loan Notes Revenue Bonds, Senior Lien Series 2010A, 5.000%, 10/01/29 | 10/20 at 100.00 | | BBB | | 3,238,560 | |
| | 1,000 | | Virgin Islands Public Finance Authority, Matching Fund Loan Notes Revenue Bonds, Series 2009B, 5.000%, 10/01/25 | 10/19 at 100.00 | | BBB | | 1,080,860 | |
| | 1,230 | | Virgin Islands Public Finance Authority, Matching Fund Loan Notes Revenue Bonds, Series 2012A, 5.000%, 10/01/32 – AGM Insured | 10/22 at 100.00 | | AA | | 1,350,675 | |
| | 1,950 | | Virgin Islands Public Finance Authority, Matching Fund Loan Notes Revenue Bonds, Subordinate Lien Series 2010B, 5.250%, 10/01/29 | 10/20 at 100.00 | | Baa2 | | 2,086,812 | |
| | 1,200 | | Virginia College Building Authority, Educational Facilities Revenue Bonds, 21st Century College Program, Series 2011A, 4.000%, 2/01/29 | No Opt. Call | | AA+ | | 1,268,664 | |
| | 1,665 | | Virginia College Building Authority, Educational Facilities Revenue Bonds, 21st Century College Program, Series 2009, Tender Option Bond Trust 09-3B, 13.351%, 2/01/27 (IF) (4) | 2/19 at 100.00 | | AA+ | | 2,371,193 | |
| | 1,665 | | Virginia College Building Authority, Educational Facilities Revenue Bonds, 21st Century College Program, Series 2009, Tender Option Bond Trust 09-4B, 13.351%, 2/01/28 (IF) (4) | 2/19 at 100.00 | | AA+ | | 2,357,440 | |
| | 500 | | Virginia Commonwealth Transportation Board, Federal Transportation Grant Anticipation Revenue Notes, Series 2012A, 5.000%, 9/15/14 | No Opt. Call | | Aa1 | | 507,145 | |
| | 2,000 | | Virginia Public Building Authority, Public Facilities Revenue Bonds, Series 2006, 5.000%, 8/01/15 | No Opt. Call | | AA+ | | 2,113,860 | |
| | 475 | | Virginia Public Building Authority, Public Facilities Revenue Bonds, Series 2008B, 5.000%, 8/01/14 | No Opt. Call | | AA+ | | 478,947 | |
| | 1,000 | | Virginia Public School Authority, School Financing Bonds, 1997 Resolution, Series 2007B, 5.000%, 8/01/14 | No Opt. Call | | AA+ | | 1,008,310 | |
| | 95 | | Virginia Resources Authority, Infrastructure Revenue Bonds, Pre-Refunded-Pooled Loan Bond Program, Series 2002A, 5.000%, 5/01/19 | 8/14 at 100.00 | | AA | | 95,373 | |
| NPV | Nuveen Virginia Premium Income Municipal Fund | |
| | Portfolio of Investments (continued) | May 31, 2014 |
| | Principal | | | Optional Call | | | | | |
| | Amount (000) | | Description (1) | Provisions (2) | | Ratings (3) | | Value | |
| | | | Tax Obligation/Limited (continued) | | | | | | |
| $ | 1,000 | | Virginia Transportation Board, Transportation Revenue Bonds, U.S. Route 58 Corridor Development Program, Series 2006C, 5.000%, 5/15/23 | No Opt. Call | | AA+ | $ | 1,085,830 | |
| | 85,280 | | Total Tax Obligation/Limited | | | | | 67,324,586 | |
| | | | Transportation – 23.8% (15.8% of Total Investments) | | | | | | |
| | 1,000 | | Chesapeake Bay Bridge and Tunnel Commission, Virginia, General Resolution Revenue Refunding Bonds, Series 1998, 5.500%, 7/01/25 – NPFG Insured | No Opt. Call | | AA– | | 1,167,430 | |
| | | | Chesapeake, Virginia, Transportation System Senior Toll Road Revenue Bonds, Capital Appreciation Series 2012B: | | | | | | |
| | 2,000 | | 0.000%, 7/15/32 | 7/28 at 100.00 | | BBB | | 1,281,040 | |
| | 4,125 | | 0.000%, 7/15/40 | 7/28 at 100.00 | | BBB | | 2,418,983 | |
| | 1,000 | | 0.000%, 7/15/40 – AGM Insured | 7/28 at 100.00 | | AA | | 621,420 | |
| | 6,700 | | Metropolitan Washington Airports Authority, Virginia, Dulles Toll Road Second Senior Lien Revenue Bonds, Dulles Metrorail Capital Appreciation, Series 2010B, 0.000%, 10/01/44 | 10/28 at 100.00 | | BBB+ | | 6,043,668 | |
| | | | Metropolitan Washington Airports Authority, Virginia, Dulles Toll Road Second Senior Lien Revenue Bonds, Series 2009B: | | | | | | |
| | 4,000 | | 0.000%, 10/01/26 – AGC Insured | No Opt. Call | | AA | | 2,397,560 | |
| | 11,825 | | 0.000%, 10/01/34 – AGC Insured | No Opt. Call | | AA | | 4,254,872 | |
| | 1,135 | | 0.000%, 10/01/36 – AGC Insured | No Opt. Call | | AA | | 359,125 | |
| | 5,010 | | 0.000%, 10/01/39 – AGC Insured | No Opt. Call | | AA | | 1,342,179 | |
| | 750 | | Metropolitan Washington D.C. Airports Authority, Airport System Revenue Bonds, Refunding Series 2010B, 5.000%, 10/01/26 (Alternative Minimum Tax) | 10/20 at 100.00 | | AA– | | 839,153 | |
| | 300 | | Metropolitan Washington D.C. Airports Authority, Airport System Revenue Bonds, Series 2005A, 5.250%, 10/01/16 – NPFG Insured (Alternative Minimum Tax) | 10/15 at 100.00 | | AA– | | 319,596 | |
| | 1,200 | | Metropolitan Washington D.C. Airports Authority, Airport System Revenue Bonds, Series 2009C, 5.000%, 10/01/28 | 10/18 at 100.00 | | AA– | | 1,355,712 | |
| | | | Metropolitan Washington D.C. Airports Authority, Airport System Revenue Bonds, Series 2010A: | | | | | | |
| | 3,000 | | 5.000%, 10/01/30 | 10/20 at 100.00 | | AA– | | 3,388,830 | |
| | 420 | | 5.000%, 10/01/35 | 10/20 at 100.00 | | AA– | | 458,623 | |
| | 2,500 | | Metropolitan Washington D.C. Airports Authority, System Revenue Bonds, Series 2007B, 5.000%, 10/01/35 – AMBAC Insured (Alternative Minimum Tax) | 10/17 at 100.00 | | AA– | | 2,638,375 | |
| | 3,000 | | Richmond Metropolitan Authority, Virginia, Revenue Refunding Bonds, Expressway System, Series 2002, 5.250%, 7/15/22 – FGIC Insured | No Opt. Call | | AA– | | 3,424,620 | |
| | | | Route 460 Funding Corporation, Virginia, Toll Road Revenue Bonds, Series 2012A: | | | | | | |
| | 2,000 | | 5.125%, 7/01/49 | No Opt. Call | | BBB– | | 2,084,720 | |
| | 1,075 | | 5.000%, 7/01/52 | No Opt. Call | | BBB– | | 1,106,594 | |
| | | | Route 460 Funding Corporation, Virginia, Toll Road Revenue Bonds, Series 2012B: | | | | | | |
| | 1,000 | | 0.000%, 7/01/28 | No Opt. Call | | BBB– | | 496,700 | |
| | 2,000 | | 0.000%, 7/01/30 | No Opt. Call | | BBB– | | 861,540 | |
| | 6,935 | | 0.000%, 7/01/37 | No Opt. Call | | BBB– | | 1,980,775 | |
| | 15,285 | | 0.000%, 7/01/45 | No Opt. Call | | BBB– | | 2,751,759 | |
| | 3,195 | | Virginia Port Authority, Port Facilities Revenue Refunding Bonds Series 2010, 5.000%, 7/01/40 | 7/19 at 100.00 | | Aa3 | | 3,372,962 | |
| | 3,415 | | Virginia Port Authority, Revenue Bonds, Port Authority Facilities, Series 2006, 5.000%, 7/01/36 – FGIC Insured (Alternative Minimum Tax) | 8/14 at 100.00 | | AA– | | 3,417,254 | |
| | 1,500 | | Virginia Small Business Financing Authority, Senior Lien Revenue Bonds, 95 Express Lanes LLC Project, Series 2012, 5.000%, 1/01/40 (Alternative Minimum Tax) | 1/22 at 100.00 | | BBB– | | 1,544,580 | |
| | | | Virginia Small Business Financing Authority, Senior Lien Revenue Bonds, Elizabeth River Crossing, Opco LLC Project, Series 2012: | | | | | | |
| | 500 | | 5.250%, 1/01/32 (Alternative Minimum Tax) | 7/22 at 100.00 | | BBB– | | 535,520 | |
| | 5,000 | | 6.000%, 1/01/37 (Alternative Minimum Tax) | 7/22 at 100.00 | | BBB– | | 5,539,150 | |
| | 5,500 | | 5.500%, 1/01/42 (Alternative Minimum Tax) | 7/22 at 100.00 | | BBB– | | 5,869,105 | |
| | 95,370 | | Total Transportation | | | | | 61,871,845 | |
| | Principal | | | Optional Call | | | | | |
| | Amount (000) | | Description (1) | Provisions (2) | | Ratings (3) | | Value | |
| | | | U.S. Guaranteed – 14.1% (9.4% of Total Investments) (5) | | | | | | |
| $ | 1,205 | | Arlington County Industrial Development Authority, Virginia, Lease Revenue Bonds, County Capital Projects, Series 2004, 5.000%, 8/01/17 (Pre-refunded 8/01/14) | 8/14 at 100.00 | | AA+ (5) | $ | 1,214,941 | |
| | 1,750 | | Bristol, Virginia, General Obligation Utility System Revenue Bonds, Series 2002, 5.000%, 11/01/24 – AGM Insured (ETM) | No Opt. Call | | AA (5) | | 2,083,778 | |
| | 1,000 | | Bristol, Virginia, Utility System Revenue Refunding Bonds, Series 2001, 5.000%, 7/15/21 – AGM Insured (ETM) | No Opt. Call | | AA (5) | | 1,167,540 | |
| | 1,000 | | Capital Region Airport Commission, Virginia, Airport Revenue Bonds, Refunding Series 2005A, 5.000%, 7/01/18 (Pre-refunded 7/01/15) – AGM Insured | 7/15 at 100.00 | | AA (5) | | 1,052,440 | |
| | 2,300 | | Fairfax County Economic Development Authority, Virginia, Lease Revenue Bonds, Joint Public Uses Community Project, Series 2006, 5.000%, 5/15/18 (Pre-refunded 5/15/16) | 5/16 at 100.00 | | AA+ (5) | | 2,511,876 | |
| | 1,000 | | Fairfax County, Virginia, Sewerage Revenue Bonds, Series 2004, 5.000%, 7/15/27 (Pre-refunded 7/15/14) | 7/14 at 100.00 | | AAA | | 1,006,020 | |
| | 1,000 | | Loudoun County Sanitation Authority, Virginia, Water and Sewerage System Revenue Bonds, Series 2004, 5.000%, 1/01/26 (Pre-refunded 1/01/15) | 1/15 at 100.00 | | AAA | | 1,028,610 | |
| | 500 | | Loudoun County, Virginia, General Obligation Bonds, Public Improvement Series 2005B, 5.000%, 6/01/18 (Pre-refunded 6/01/15) | 6/15 at 100.00 | | AAA | | 524,430 | |
| | 1,700 | | Loudoun County, Virginia, General Obligation Bonds, Series 2006B, 5.000%, 12/01/25 (Pre-refunded 12/01/16) | 12/16 at 100.00 | | AAA | | 1,898,016 | |
| | 1,000 | | Newport News, Virginia, General Obligation Bonds, Series 2004A, 5.000%, 7/15/17 (Pre-refunded 7/15/14) | 7/14 at 101.00 | | AA+ (5) | | 1,016,020 | |
| | 3,000 | | Norfolk, Virginia, Parking System Revenue Bonds, Series 2005A, 5.000%, 2/01/23 (Pre-refunded 2/01/15) – NPFG Insured | 2/15 at 100.00 | | AA– (5) | | 3,097,170 | |
| | 580 | | Prince William County, Virginia, Certificates of Participation, County Facilities, Series 2005, 5.000%, 6/01/20 (Pre-refunded 6/01/15) – AMBAC Insured | 6/15 at 100.00 | | Aa1 (5) | | 608,217 | |
| | 145 | | Puerto Rico, Highway Revenue Bonds, Highway and Transportation Authority, Series 2003AA, 5.500%, 7/01/18 – NPFG Insured (ETM) | No Opt. Call | | A3 (5) | | 171,860 | |
| | 710 | | Puerto Rico, Highway Revenue Bonds, Highway and Transportation Authority, Series 2005BB, 5.250%, 7/01/22 – AGM Insured (ETM) | No Opt. Call | | A2 (5) | | 886,307 | |
| | 1,480 | | Richmond, Virginia, General Obligation Bonds, Series 2004A, 5.000%, 7/15/21 (Pre-refunded 7/15/14) – AGM Insured | 7/14 at 100.00 | | AA+ (5) | | 1,488,910 | |
| | 620 | | Richmond, Virginia, General Obligation Bonds, Series 2005A, 5.000%, 7/15/17 (Pre-refunded 7/15/15) – AGM Insured | 7/15 at 100.00 | | AA+ (5) | | 653,933 | |
| | 710 | | Stafford County and Staunton Industrial Development Authority, Virginia, Revenue Bonds, Virginia Municipal League and Virginia Association of Counties Finance Program, Series 2006A, 5.000%, 8/01/23 (Pre-refunded 8/01/16) – NPFG Insured | 8/16 at 100.00 | | A3 (5) | | 781,014 | |
| | | | Stafford County and Staunton Industrial Development Authority, Virginia, Revenue Bonds, Virginia Municipal League and Virginia Association of Counties Finance Program, Series 2007C: | | | | | | |
| | 105 | | 5.000%, 2/01/37 (Pre-refunded 2/01/17) – SYNCORA GTY Insured | 2/17 at 100.00 | | N/R (5) | | 117,472 | |
| | 190 | | 5.000%, 2/01/37 (Pre-refunded 2/01/17) – SYNCORA GTY Insured | 2/17 at 100.00 | | N/R (5) | | 212,084 | |
| | 2,135 | | The Rector and Visitors of the University of Virginia, General Revenue Bonds, Series 2005, 5.000%, 6/01/37 (Pre-refunded 6/01/15) | 6/15 at 100.00 | | N/R (5) | | 2,237,096 | |
| | | | Tobacco Settlement Financing Corporation of Virginia, Tobacco Settlement Asset-Backed Bonds, Series 2005: | | | | | | |
| | 3,510 | | 5.500%, 6/01/26 (Pre-refunded 6/01/15) | 6/15 at 100.00 | | Aaa | | 3,627,339 | |
| | 1,860 | | 5.625%, 6/01/37 (Pre-refunded 6/01/15) | 6/15 at 100.00 | | Aaa | | 1,961,742 | |
| | 2,295 | | Virginia Beach Development Authority, Public Facilities Revenue Bonds, Series 2005A, 5.000%, 5/01/22 (Pre-refunded 5/01/15) | 5/15 at 100.00 | | AA+ (5) | | 2,397,839 | |
| | 2,100 | | Virginia Beach, Virginia, General Obligation Bonds, Series 2005, 5.000%, 1/15/20 (Pre-refunded 1/15/16) | 1/16 at 100.00 | | AAA | | 2,260,965 | |
| | | | | | | | | | |
| NPV | Nuveen Virginia Premium Income Municipal Fund | |
| | Portfolio of Investments (continued) | May 31, 2014 |
| | Principal | | | Optional Call | | | | | |
| | Amount (000) | | Description (1) | Provisions (2) | | Ratings (3) | | Value | |
| | | | U.S. Guaranteed (5) (continued) | | | | | | |
| $ | 30 | | Virginia College Building Authority, Educational Facilities Revenue Bonds, Public Higher Education Financing Program, Series 2009A, 5.000%, 9/01/28 (Pre-refunded 9/01/18) | 9/18 at 100.00 | | N/R (5) | $ | 35,067 | |
| | 2,540 | | Virginia Public School Authority, School Financing Bonds, 1997 Resolution, Series 2005C, 5.000%, 8/01/17 (Pre-refunded 8/01/15) | 8/15 at 100.00 | | AA+ (5) | | 2,684,348 | |
| | 34,465 | | Total U.S. Guaranteed | | | | | 36,725,034 | |
| | | | Utilities – 3.2% (2.1% of Total Investments) | | | | | | |
| | 395 | | Guam Power Authority, Revenue Bonds, Series 2012A, 5.000%, 10/01/34 | 10/22 at 100.00 | | BBB | | 427,110 | |
| | 655 | | Puerto Rico Electric Power Authority, Power Revenue Bonds, Series 2007UU, 5.000%, 7/01/19 – NPFG Insured | No Opt. Call | | AA– | | 691,641 | |
| | 730 | | Virgin Islands Water and Power Authority, Electric System Revenue Bonds, Refunding Series 2007A, 5.000%, 7/01/24 | 7/17 at 100.00 | | BB+ | | 699,267 | |
| | 3,000 | | Wisconsin Public Power Incorporated System, Power Supply System Revenue Bonds, Series 2005A, 5.000%, 7/01/35 – AMBAC Insured | 7/15 at 100.00 | | AA+ | | 3,119,490 | |
| | 3,250 | | York County Economic Development Authority, Virginia, Pollution Control Revenue Bonds, Virginia Electric and Power Company Project, Refunding Series 2009A, 1.875%, 5/01/33 (Mandatory put 5/16/19) | No Opt. Call | | A2 | | 3,278,925 | |
| | 8,030 | | Total Utilities | | | | | 8,216,433 | |
| | | | Water and Sewer – 8.3% (5.5% of Total Investments) | | | | | | |
| | 810 | | Guam Waterworks Authority, Water and Wastewater System Revenue Bonds, Series 2013, 5.500%, 7/01/43 | 7/23 at 100.00 | | A– | | 867,704 | |
| | 6,500 | | Hampton Roads Sanitation District, Virginia, Wastewater Revenue Bonds, Series 2012A, 5.000%, 1/01/39 | No Opt. Call | | AAA | | 7,143,110 | |
| | | | Henry County Public Service Authority, Virginia, Water and Sewerage Revenue Refunding Bonds, Series 2001: | | | | | | |
| | 1,265 | | 5.500%, 11/15/17 – AGM Insured | No Opt. Call | | AA | | 1,419,570 | |
| | 3,000 | | 5.500%, 11/15/19 – AGM Insured | No Opt. Call | | AA | | 3,522,570 | |
| | 700 | | Upper Occoquan Sewage Authority, Virginia, Regional Sewerage System Revenue Refunding Bonds, Series 2004, 5.000%, 7/01/15 – NPFG Insured | No Opt. Call | | AAA | | 736,631 | |
| | 3,300 | | Virginia Beach, Virginia, Water and Sewer System Revenue Bonds, Series 2005, 5.000%, 10/01/30 | 10/15 at 100.00 | | AAA | | 3,487,770 | |
| | Principal | | | Optional Call | | | | | |
| | Amount (000) | | Description (1) | Provisions (2) | | Ratings (3) | | Value | |
| | | | Water and Sewer (continued) | | | | | | |
| $ | 1,000 | | Virginia Resources Authority, Water and Sewerage System Revenue Bonds, Goochland County – Tuckahoe Creek Service District Project, Series 2012, 0.000%, 11/01/34 | 11/22 at 63.13 | | AA | $ | 442,684 | |
| | 3,050 | | Virginia State Resources Authority, Clean Water Revenue Bonds, Series 2007, Trust 3036, 13.281%, 10/01/15 (IF) | No Opt. Call | | AAA | | 3,904,275 | |
| | 19,625 | | Total Water and Sewer | | | | | 21,524,314 | |
| $ | 499,695 | | Total Long-Term Investments (cost $376,522,762) | | | | | 390,766,454 | |
| | | | Floating Rate Obligations – (3.6)% | | | | | (9,250,000 | ) |
| | | | Variable Rate Demand Preferred Shares, at Liquidation Value – (49.3)% (6) | | | | | (128,000,000 | ) |
| | | | Other Assets Less Liabilities – 2.4% | | | | | 6,051,265 | |
| | | | Net Assets Applicable to Common Shares – 100% | | | | $ | 259,567,719 | |
| (1) | All percentages shown in the Portfolio of Investments are based on net assets applicable to common shares unless otherwise noted. |
| (2) | Optional Call Provisions (not covered by the report of independent registered public accounting firm): Dates (month and year) and prices of the earliest optional call or redemption. There may be other call provisions at varying prices at later dates. Certain mortgage-backed securities may be subject to periodic principal paydowns. |
| (3) | Ratings (not covered by the report of independent registered public accounting firm): Using the highest of Standard & Poor’s Group (“Standard & Poor’s”), Moody’s Investors Service, Inc. (“Moody’s”) or Fitch, Inc. (“Fitch”) rating. Ratings below BBB by Standard & Poor’s, Baa by Moody’s or BBB by Fitch are considered to be below investment grade. Holdings designated N/R are not rated by any of these national rating agencies. |
| (4) | Investment, or portion of investment, has been pledged to collateralize the net payment obligations for investments in inverse floating rate transactions. |
| (5) | Backed by an escrow or trust containing sufficient U.S. Government or U.S. Government agency securities, which ensure the timely payment of principal and interest. Certain bonds backed by U.S. Government or agency securities are regarded as having an implied rating equal to the rating of such securities. |
| (6) | Variable Rate Demand Preferred Shares, at Liquidation Value as a percentage of Total Investments is 32.8%. |
| (ETM) | Escrowed to maturity. |
| (IF) | Inverse floating rate investment. |
| (UB) | Underlying bond of an inverse floating rate trust reflected as a financing transaction. See Notes to Financial Statements, Note 3 – Portfolio Securities and Investments in Derivatives, Inverse Floating Rate Securities for more information. |
See accompanying notes to financial statements.
| Statement of | | |
| | Assets and Liabilities | May 31, 2014 |
| | | | | | | | | | | | | North | | | | |
| | | | Georgia | | | Maryland | | | Missouri | | | Carolina | | | Virginia | |
| | | | Dividend | | | Premium | | | Premium | | | Premium | | | Premium | |
| | | | Advantage 2 | | | Income | | | Income | | | Income | | | Income | |
| | | | (NKG | ) | | (NMY | ) | | (NOM | ) | | (NNC | ) | | (NPV | ) |
| Assets | | | | | | | | | | | | | | | | |
| Long-term investments, at value (cost $211,751,466, $511,208,367, $48,867,802, $346,155,913 and $376,522,762, respectively) | | $ | 222,327,955 | | $ | 534,215,372 | | $ | 51,730,951 | | $ | 366,357,212 | | $ | 390,766,454 | |
| Cash | | | 852,496 | | | — | | | — | | | — | | | 808,493 | |
| Receivable for: | | | | | | | | | | | | | | | | |
| Interest | | | 3,388,111 | | | 8,958,357 | | | 662,414 | | | 5,822,233 | | | 5,864,459 | |
| Investments sold | | | — | | | 1,144,127 | | | 1,783,153 | | | 9,816,210 | | | 2,860,367 | |
| Deferred offering costs | | | 158,269 | | | 182,998 | | | 131,585 | | | 113,688 | | | 430,148 | |
| Other assets | | | 18,522 | | | 66,002 | | | 9,034 | | | 54,951 | | | 240,721 | |
| Total assets | | | 226,745,353 | | | 544,566,856 | | | 54,317,137 | | | 382,164,294 | | | 400,970,642 | |
| Liabilities | | | | | | | | | | | | | | | | |
| Cash overdraft | | | — | | | 583,888 | | | 115,500 | | | 9,456,307 | | | — | |
| Floating rate obligations | | | 3,245,000 | | | 21,935,000 | | | 2,225,000 | | | — | | | 9,250,000 | |
| Payable for: | | | | | | | | | | | | | | | | |
| Common share dividends | | | 543,133 | | | 1,292,775 | | | 134,655 | | | 809,448 | | | 1,027,468 | |
| Interest | | | 35,814 | | | 81,275 | | | 31,290 | | | — | | | — | |
| Investments purchased | | | — | | | — | | | 790,760 | | | — | | | 2,676,921 | |
| Offering costs | | | 160,000 | | | 185,000 | | | — | | | 35,979 | | | — | |
| MuniFund Term Preferred (“MTP”) Shares, at liquidation value | | | 75,000,000 | | | 167,000,000 | | | — | | | 125,000,000 | | | — | |
| Variable Rate MuniFund Term Preferred (“VMTP”) Shares, at liquidation value | | | — | | | — | | | 17,880,000 | | | — | | | — | |
| Variable Rate Demand Preferred (“VRDP”) Shares, at liquidation value | | | — | | | — | | | — | | | — | | | 128,000,000 | |
| Accrued expenses: | | | | | | | | | | | | | | | | |
| Management fees | | | 117,867 | | | 271,727 | | | 26,503 | | | 190,788 | | | 203,942 | |
| Trustees fees | | | 2,409 | | | 12,055 | | | 549 | | | 8,728 | | | 8,942 | |
| Other | | | 133,787 | | | 195,409 | | | 41,233 | | | 171,463 | | | 235,650 | |
| Total liabilities | | | 79,238,010 | | | 191,557,129 | | | 21,245,490 | | | 135,672,713 | | | 141,402,923 | |
| Net assets applicable to common shares | | $ | 147,507,343 | | $ | 353,009,727 | | $ | 33,071,647 | | $ | 246,491,581 | | $ | 259,567,719 | |
| Common shares outstanding | | | 10,548,790 | | | 24,104,666 | | | 2,330,295 | | | 16,548,509 | | | 17,933,247 | |
| Net asset value per common share outstanding (net assets applicable to common shares, divided by common shares outstanding) | | $ | 13.98 | | $ | 14.64 | | $ | 14.19 | | $ | 14.90 | | $ | 14.47 | |
| Net assets applicable to common shares consist of: | | | | | | | | | | | | | | | | |
| Common shares, $.01 par value per share | | $ | 105,488 | | $ | 241,047 | | $ | 23,303 | | $ | 165,485 | | $ | 179,332 | |
| Paid-in surplus | | | 142,453,986 | | | 338,648,612 | | | 30,871,543 | | | 225,705,057 | | | 251,143,822 | |
| Undistributed (Over-distribution of) net investment income | | | (312,492 | ) | | 1,590,108 | | | 245,371 | | | (59,753 | ) | | 1,555,348 | |
| Accumulated net realized gain (loss) | | | (5,316,128 | ) | | (10,477,045 | ) | | (931,719 | ) | | 479,493 | | | (7,554,475 | ) |
| Net unrealized appreciation (depreciation) | | | 10,576,489 | | | 23,007,005 | | | 2,863,149 | | | 20,201,299 | | | 14,243,692 | |
| Net assets applicable to common shares | | $ | 147,507,343 | | $ | 353,009,727 | | $ | 33,071,647 | | $ | 246,491,581 | | $ | 259,567,719 | |
| Authorized shares: | | | | | | | | | | | | | | | | |
| Common | | | Unlimited | | | Unlimited | | | Unlimited | | | Unlimited | | | Unlimited | |
| Preferred | | | Unlimited | | | Unlimited | | | Unlimited | | | Unlimited | | | Unlimited | |
See accompanying notes to financial statements.
| Statement of | | |
| | Operations | Year Ended May 31, 2014 |
| | | | | | | | | | | | | North | | | | |
| | | | Georgia | | | Maryland | | | Missouri | | | Carolina | | | Virginia | |
| | | | Dividend | | | Premium | | | Premium | | | Premium | | | Premium | |
| | | | Advantage 2 | | | Income | | | Income | | | Income | | | Income | |
| | | | (NKG | ) | | (NMY | ) | | (NOM | ) | | (NNC | ) | | (NPV | ) |
| Investment Income | | $ | 10,045,431 | | $ | 24,402,022 | | $ | 2,422,878 | | $ | 15,473,675 | | $ | 18,331,637 | |
| Expenses | | | | | | | | | | | | | | | | |
| Management fees | | | 1,363,251 | | | 3,159,654 | | | 304,639 | | | 2,181,105 | | | 2,350,879 | |
| Shareholder servicing agent fees and expenses | | | 47,198 | | | 81,151 | | | 19,168 | | | 69,412 | | | 44,944 | |
| Interest expense and amortization of offering costs | | | 2,689,494 | | | 6,210,528 | | | 474,628 | | | 3,944,238 | | | 1,927,775 | |
| Liquidity fees | | | — | | | — | | | — | | | — | | | 899,539 | |
| Remarketing fees | | | — | | | — | | | — | | | — | | | 98,135 | |
| Custodian fees and expenses | | | 38,351 | | | 89,299 | | | 15,910 | | | 62,826 | | | 67,915 | |
| Trustees fees and expenses | | | 6,250 | | | 14,706 | | | 1,422 | | | 10,509 | | | 10,883 | |
| Professional fees | | | 42,282 | | | 56,346 | | | 28,639 | | | 51,786 | | | 58,401 | |
| Shareholder reporting expenses | | | 31,321 | | | 19,593 | | | 2,586 | | | 57,650 | | | 10,764 | |
| Stock exchange listing fees | | | 31,507 | | | 98,702 | | | 15,294 | | | 84,130 | | | 43,933 | |
| Investor relations expenses | | | 7,938 | | | 23,610 | | | 3,022 | | | 12,823 | | | 14,252 | |
| Other expenses | | | 41,761 | | | 84,678 | | | 33,664 | | | 56,391 | | | 53,214 | |
| Total expenses | | | 4,299,353 | | | 9,838,267 | | | 898,972 | | | 6,530,870 | | | 5,580,634 | |
| Net investment income (loss) | | | 5,746,078 | | | 14,563,755 | | | 1,523,906 | | | 8,942,805 | | | 12,751,003 | |
| Realized and Unrealized Gain (Loss) | | | | | | | | | | | | | | | | |
| Net realized gain (loss) from investments | | | (1,923,769 | ) | | (7,174,244 | ) | | (762,358 | ) | | 1,220,196 | | | (7,575,431 | ) |
| Change in net unrealized appreciation (depreciation) of investments | | | (3,375,095 | ) | | (13,432,561 | ) | | (33,876 | ) | | (2,283,539 | ) | | (8,340,683 | ) |
| Net realized and unrealized gain (loss) | | | (5,298,864 | ) | | (20,606,805 | ) | | (796,234 | ) | | (1,063,343 | ) | | (15,916,114 | ) |
| Net increase (decrease) in net assets applicable to common shares from operations | | $ | 447,214 | | $ | (6,043,050 | ) | $ | 727,672 | | $ | 7,879,462 | | $ | (3,165,111 | ) |
See accompanying notes to financial statements.
| Statement of | |
| | Changes in Net Assets |
| | | Georgia Dividend Advantage 2 (NKG) | | Maryland Premium Income (NMY) | | Missouri Premium Income (NOM) | |
| | | | Year | | | Year | | | Year | | | Year | | | Year | | | Year | |
| | | | Ended | | | Ended | | | Ended | | | Ended | | | Ended | | | Ended | |
| | | | 5/31/14 | | | 5/31/13 | | | 5/31/14 | | | 5/31/13 | | | 5/31/14 | | | 5/31/13 | |
| Operations | | | | | | | | | | | | | | | | | | | |
| Net investment income (loss) | | $ | 5,746,078 | | $ | 6,020,509 | | $ | 14,563,755 | | $ | 14,021,037 | | $ | 1,523,906 | | $ | 1,530,798 | |
| Net realized gain (loss) from investments | | | (1,923,769 | ) | | 226,296 | | | (7,174,244 | ) | | 268,979 | | | (762,358 | ) | | 14,851 | |
| Change in net unrealized appreciation (depreciation) of investments | | | (3,375,095 | ) | | (747,566 | ) | | (13,432,561 | ) | | (2,621,007 | ) | | (33,876 | ) | | 131,347 | |
| Net increase (decrease) in net assets applicable to common shares from operations | | | 447,214 | | | 5,499,239 | | | (6,043,050 | ) | | 11,669,009 | | | 727,672 | | | 1,676,996 | |
| Distributions to Common Shareholders | | | | | | | | | | | | | | | | | | | |
| From net investment income | | | (6,772,323 | ) | | (6,448,188 | ) | | (16,109,148 | ) | | (15,597,256 | ) | | (1,704,949 | ) | | (1,702,603 | ) |
| From accumulated net realized gains | | | — | | | — | | | — | | | — | | | — | | | — | |
| Decrease in net assets applicable to common shares from distributions to common shareholders | | | (6,772,323 | ) | | (6,448,188 | ) | | (16,109,148 | ) | | (15,597,256 | ) | | (1,704,949 | ) | | (1,702,603 | ) |
| Capital Share Transactions | | | | | | | | | | | | | | | | | | | |
| Common shares: | | | | | | | | | | | | | | | | | | | |
| Issued in the reorganizations | | | — | | | 87,714,734 | | | — | | | 211,807,271 | | | — | | | — | |
| Net proceeds from shares issued to shareholders due to reinvestment of distributions | | | — | | | 27,755 | | | — | | | 75,351 | | | 38,396 | | | 57,168 | |
| Net increase (decrease) in net assets applicable to common shares from capital share transactions | | | — | | | 87,742,489 | | | — | | | 211,882,622 | | | 38,396 | | | 57,168 | |
| Net increase (decrease) in net assets applicable to common shares | | | (6,325,109 | ) | | 86,793,540 | | | (22,152,198 | ) | | 207,954,375 | | | (938,881 | ) | | 31,561 | |
| Net assets applicable to common shares at the beginning of period | | | 153,832,452 | | | 67,038,912 | | | 375,161,925 | | | 167,207,550 | | | 34,010,528 | | | 33,978,967 | |
| Net assets applicable to common shares at the end of period | | $ | 147,507,343 | | $ | 153,832,452 | | $ | 353,009,727 | | $ | 375,161,925 | | $ | 33,071,647 | | $ | 34,010,528 | |
| Undistributed (Over-distribution of) net investment income at the end of period | | $ | (312,492 | ) | $ | 219,838 | | $ | 1,590,108 | | $ | 2,034,851 | | $ | 245,371 | | $ | 332,733 | |
See accompanying notes to financial statements.
| | | North Carolina Premium Income (NNC) | | Virginia Premium Income (NPV) | |
| | | | Year | | | Year | | | Year | | | Year | |
| | | | Ended | | | Ended | | | Ended | | | Ended | |
| | | | 5/31/14 | | | 5/31/13 | | | 5/31/14 | | | 5/31/13 | |
| Operations | | | | | | | | | | | | | |
| Net investment income (loss) | | $ | 8,942,805 | | $ | 9,239,191 | | $ | 12,751,003 | | $ | 10,697,104 | |
| Net realized gain (loss) from investments | | | 1,220,196 | | | 327,862 | | | (7,575,431 | ) | | 443,695 | |
| Change in net unrealized appreciation (depreciation) of investments | | | (2,283,539 | ) | | (3,568,579 | ) | | (8,340,683 | ) | | (4,173,812 | ) |
| Net increase (decrease) in net assets applicable to common shares from operations | | | 7,879,462 | | | 5,998,474 | | | (3,165,111 | ) | | 6,966,987 | |
| Distributions to Common Shareholders | | | | | | | | | | | | | |
| From net investment income | | | (9,988,679 | ) | | (10,348,434 | ) | | (12,992,638 | ) | | (11,424,132 | ) |
| From accumulated net realized gains | | | — | | | — | | | (139,879 | ) | | (302,943 | ) |
| Decrease in net assets applicable to common shares from distributions to common shareholders | | | (9,988,679 | ) | | (10,348,434 | ) | | (13,132,517 | ) | | (11,727,075 | ) |
| Capital Share Transactions | | | | | | | | | | | | | |
| Common shares: | | | | | | | | | | | | | |
| Issued in the reorganizations | | | — | | | 155,423,952 | | | — | | | 139,077,537 | |
| Net proceeds from shares issued to shareholders due to reinvestment of distributions | | | — | | | 29,851 | | | — | | | 449,003 | |
| Net increase (decrease) in net assets applicable to common shares from capital share transactions | | | — | | | 155,453,803 | | | — | | | 139,526,540 | |
| Net increase (decrease) in net assets applicable to common shares | | | (2,109,217 | ) | | 151,103,843 | | | (16,297,628 | ) | | 134,766,452 | |
Net assets applicable to common shares at the beginning of period | | | 248,600,798 | | | 97,496,955 | | | 275,865,347 | | | 141,098,895 | |
| Net assets applicable to common shares at the end of period | | $ | 246,491,581 | | $ | 248,600,798 | | $ | 259,567,719 | | $ | 275,865,347 | |
| Undistributed (Over-distribution of) net investment income at the end of period | | $ | (59,753 | ) | $ | 8,852 | | $ | 1,555,348 | | $ | 1,096,134 | |
See accompanying notes to financial statements.
| Statement of | | |
| | Cash Flows | Year Ended May 31, 2014 |
| | | Georgia | | Maryland | | Missouri | |
| | | Dividend | | Premium | | Premium | |
| | | Advantage 2 | | Income | | Income | |
| | | (NKG | ) | (NMY | ) | (NOM | ) |
| Cash Flows from Operating Activities: | | | | | | | | | | |
| Net Increase (Decrease) in Net Assets Applicable to Common Shares from Operations | | $ | 447,214 | | $ | (6,043,050 | ) | $ | 727,672 | |
| Adjustments to reconcile the net increase (decrease) in net assets applicable to common shares from operations to net cash provided by (used in) operating activities: | | | | | | | | | | |
| Purchases of investments | | | (43,852,914 | ) | | (105,974,140 | ) | | (11,081,225 | ) |
| Proceeds from sales and maturities of investments | | | 43,332,991 | | | 107,176,397 | | | 10,884,709 | |
| Amortization (Accretion) of premiums and discounts, net | | | 799,216 | | | 1,446,049 | | | 84,849 | |
| (Increase) Decrease in: | | | | | | | | | | |
| Receivable for interest | | | (137,142 | ) | | 94,790 | | | 81,852 | |
| Receivable for investments sold | | | 10,000 | | | (439,127 | ) | | (1,015,653 | ) |
| Other assets | | | 395 | | | (4,548 | ) | | 47 | |
| Increase (Decrease) in: | | | | | | | | | | |
| Payable for interest | | | (129,697 | ) | | (293,691 | ) | | — | |
| Payable for investments purchased | | | — | | | (1,100,410 | ) | | (699,498 | ) |
| Accrued management fees | | | (4,742 | ) | | (13,109 | ) | | (952 | ) |
| Accrued reorganization expenses | | | (72,523 | ) | | — | | | — | |
| Accrued Trustees fees | | | 1,591 | | | 7,085 | | | 365 | |
| Accrued other expenses | | | 50,124 | | | (51,834 | ) | | (1,663 | ) |
| Net realized (gain) loss from: | | | | | | | | | | |
| Investments | | | 1,923,769 | | | 7,174,244 | | | 762,358 | |
| Paydowns | | | (4,072 | ) | | — | | | — | |
| Change in net unrealized (appreciation) depreciation of investments | | | 3,375,095 | | | 13,432,561 | | | 33,876 | |
| Taxes paid on undistributed capital gains | | | — | | | (618 | ) | | — | |
| Net cash provided by (used in) operating activities | | | 5,739,305 | | | 15,410,599 | | | (223,263 | ) |
| Cash Flows from Financing Activities: | | | | | | | | | | |
| (Increase) Decrease in deferred offering costs | | | 499,323 | | | 1,578,212 | | | 164,124 | |
| Increase (Decrease) in: | | | | | | | | | | |
| Cash overdraft | | | — | | | (1,470,516 | ) | | 115,500 | |
| Floating rate obligations | | | — | | | (60,000 | ) | | — | |
| Payable for offering costs | | | 160,000 | | | (91,836 | ) | | (70,439 | ) |
| MTP Shares, at liquidation value | | | (74,945,000 | ) | | (166,144,000 | ) | | — | |
| VMTP Shares, at liquidation value | | | 75,000,000 | | | 167,000,000 | | | — | |
| VRDP Shares, at liquidation value | | | — | | | — | | | — | |
| Cash distributions paid to common shareholders | | | (6,776,665 | ) | | (16,222,459 | ) | | (1,665,779 | ) |
| Net cash provided by (used in) financing activities | | | (6,062,342 | ) | | (15,410,599 | ) | | (1,456,594 | ) |
| Net Increase (Decrease) in Cash | | | (323,037 | ) | | — | | | (1,679,857 | ) |
| Cash at the beginning of period | | | 1,175,533 | | | — | | | 1,679,857 | |
| Cash at the end of period | | $ | 852,496 | | $ | — | | $ | — | |
| | | | | | | | | | | |
| | | | Georgia | | | Maryland | | | Missouri | |
| | | | Dividend | | | Premium | | | Premium | |
| | | | Advantage 2 | | | Income | | | Income | |
| Supplemental Disclosure of Cash Flow Information | | | (NKG | ) | | (NMY | ) | | (NOM | ) |
| Cash paid for interest (excluding amortization of offering costs) | | $ | 2,159,868 | | $ | 5,017,844 | | $ | 380,944 | |
| Non-cash financing activities not included herein consists of reinvestments of common share distributions | | | — | | | — | | | 38,396 | |
See accompanying notes to financial statements.
| | | North | | | | |
| �� | | Carolina | | Virginia | |
| | | Premium | | Premium | |
| | | Income | | Income | |
| | | (NNC | ) | (NPV | ) |
| Cash Flows from Operating Activities: | | | | | | | |
| Net Increase (Decrease) in Net Assets Applicable to Common Shares from Operations | | $ | 7,879,462 | | $ | (3,165,111 | ) |
| Adjustments to reconcile the net increase (decrease) in net assets applicable to common shares from operations to net cash provided by (used in) operating activities: | | | | | | | |
| Purchases of investments | | | (62,721,625 | ) | | (71,956,361 | ) |
| Proceeds from sales and maturities of investments | | | 79,654,607 | | | 71,506,075 | |
| Amortization (Accretion) of premiums and discounts, net | | | 1,476,417 | | | 63,388 | |
| (Increase) Decrease in: | | | | | | | |
| Receivable for interest | | | 226,036 | | | 324,482 | |
| Receivable for investments sold | | | 9,453,953 | | | 11,852,966 | |
| Other assets | | | (2,816 | ) | | (197,708 | ) |
| Increase (Decrease) in: | | | | | | | |
| Payable for interest | | | (272,737 | ) | | (279,885 | ) |
| Payable for investments purchased | | | (13,824,593 | ) | | (5,193,574 | ) |
| Accrued management fees | | | (3,875 | ) | | (10,833 | ) |
| Accrued reorganization expenses | | | (36,350 | ) | | — | |
| Accrued Trustees fees | | | 5,191 | | | 5,213 | |
| Accrued other expenses | | | 58,178 | | | 55,480 | |
| Net realized (gain) loss from: | | | | | | | |
| Investments | | | (1,220,196 | ) | | 7,575,431 | |
| Paydowns | | | — | | | — | |
| Change in net unrealized (appreciation) depreciation of investments | | | 2,283,539 | | | 8,340,683 | |
| Taxes paid on undistributed capital gains | | | (5,489 | ) | | (13,473 | ) |
| Net cash provided by (used in) operating activities | | | 22,949,702 | | | 18,906,773 | |
| Cash Flows from Financing Activities: | | | | | | | |
| (Increase) Decrease in deferred offering costs | | | 1,156,343 | | | 478,743 | |
| Increase (Decrease) in: | | | | | | | |
| Cash overdraft | | | 9,456,307 | | | (5,982,898 | ) |
| Floating rate obligations | | | (23,715,000 | ) | | — | |
| Payable for offering costs | | | (200,225 | ) | | (84,870 | ) |
| MTP Shares, at liquidation value | | | (124,860,000 | ) | | (127,408,000 | ) |
| VMTP Shares, at liquidation value | | | 125,000,000 | | | — | |
| VRDP Shares, at liquidation value | | | — | | | 128,000,000 | |
| Cash distributions paid to common shareholders | | | (9,986,761 | ) | | (13,101,255 | ) |
| Net cash provided by (used in) financing activities | | | (23,149,336 | ) | | (18,098,280 | ) |
| Net Increase (Decrease) in Cash | | | (199,634 | ) | | 808,493 | |
| Cash at the beginning of period | | | 199,634 | | | — | |
| Cash at the end of period | | $ | — | | $ | 808,493 | |
| | | | | | | |
| | | North | | | | |
| | | Carolina | | Virginia | |
| | | Premium | | Premium | |
| | | Income | | Income | |
| Supplemental Disclosure of Cash Flow Information | | (NNC | ) | (NPV | ) |
| Cash paid for interest (excluding amortization of offering costs) | | $ | 3,171,836 | | $ | 1,376,106 | |
| Non-cash financing activities not included herein consists of reinvestments of common share distributions | | | — | | | — | |
See accompanying notes to financial statements.
Selected data for a common share outstanding throughout each period:
| | | | | Investment Operations | | Less Distributions | | | | | |
| | | Beginning Common Share NAV | | Net Investment Income (Loss) | | Net Realized/ Unrealized Gain (Loss) | | Distributions from Net Investment Income to Auction Rate Preferred Shareholders | (a) | Distributions from Accumulated Net Realized Gains to Auction Rate Preferred Shareholders | (a) | Total | | From Net Investment Income to Common Shareholders | | From Accumulated Net Realized Gains to Common Shareholders | | Total | | Ending Common Share NAV | | Ending Market Value | |
| Georgia Dividend Advantage 2 (NKG) | | | | | | | | | | | | | | | | | | | | | | | | | |
| Year Ended 5/31: | | | | | | | | | | | | | | | | | | | | | | | | | | | | |
| 2014 | | $ | 14.58 | | $ | .54 | | $ | (.50 | ) | $ | — | | $ | — | | $ | .04 | | $ | (.64 | ) | $ | — | | $ | (.64 | ) | $ | 13.98 | | $ | 12.98 | |
| 2013 | | | 14.71 | | | .60 | | | (.06 | ) | | — | | | — | | | .54 | | | (.67 | ) | | — | | | (.67 | ) | | 14.58 | | | 13.39 | |
| 2012 | | | 13.78 | | | .61 | | | 1.01 | | | — | | | — | | | 1.62 | | | (.69 | ) | | — | | | (.69 | ) | | 14.71 | | | 14.73 | |
| 2011 | | | 14.21 | | | .65 | | | (.36 | ) | | — | | | — | | | .29 | | | (.72 | ) | | — | | | (.72 | ) | | 13.78 | | | 13.92 | |
| 2010 | | | 13.27 | | | .78 | | | .87 | | | (.02 | ) | | — | | | 1.63 | | | (.69 | ) | | — | | | (.69 | ) | | 14.21 | | | 14.00 | |
| | | | | | | | | | | | | | | | | | | | | | | | | | | | | |
| Maryland Premium Income (NMY) | | | | | | | | | | | | | | | | | | | | | | | | | | | | |
| Year Ended 5/31: | | | | | | | | | | | | | | | | | | | | | | | | | | | | |
| 2014 | | | 15.56 | | | .60 | | | (.85 | ) | | — | | | — | | | (.25 | ) | | (.67 | ) | | — | | | (.67 | ) | | 14.64 | | | 12.91 | |
| 2013 | | | 15.68 | | | .58 | | | .07 | | | — | | | — | | | .65 | | | (.77 | ) | | — | | | (.77 | ) | | 15.56 | | | 13.82 | |
| 2012 | | | 14.37 | | | .68 | | | 1.40 | | | — | | | — | | | 2.08 | | | (.77 | ) | | — | | | (.77 | ) | | 15.68 | | | 15.64 | |
| 2011 | | | 14.77 | | | .80 | | | (.43 | ) | | (.01 | ) | | — | | | .36 | | | (.76 | ) | | — | | | (.76 | ) | | 14.37 | | | 14.00 | |
| 2010 | | | 13.58 | | | .84 | | | 1.10 | | | (.02 | ) | | — | | | 1.92 | | | (.73 | ) | | — | | | (.73 | ) | | 14.77 | | | 14.43 | |
| | | | | | | | | Ratios/Supplemental Data | |
| | | Total Returns | | | | | Ratios to Average Net Assets Applicable to Common Shares Before Reimbursement(c) | | Ratios to Average Net Assets Applicable to Common Shares After Reimbursement(c)(d) | | | | |
| | | Based on Common Share NAV | (b) | Based on Market Value | (b) | Ending Net Assets Applicable to Common Shares (000) | | Expenses | (e) | Net Investment Income (Loss) | | Expenses | (e) | Net Investment Income (Loss) | | Portfolio Turnover Rate | (f) |
| | | | | | | | | | | | | | | | | | | | | | | | | | |
| | | | | | | | | | | | | | | | | | | | | | | | | | |
| | | | .56 | % | | 2.17 | % | $ | 147,507 | | | 3.03 | % | | 4.04 | % | | N/A | | | N/A | | | 20 | % |
| | | | 3.68 | | | (4.83 | ) | | 153,832 | | | 2.66 | | | 4.09 | | | N/A | | | N/A | | | 18 | |
| | | | 12.04 | | | 11.12 | | | 67,039 | | | 2.95 | | | 4.30 | | | N/A | | | N/A | | | 11 | |
| | | | 2.13 | | | 4.84 | | | 62,777 | | | 2.79 | | | 4.64 | | | 2.75 | % | | 4.68 | % | | 4 | |
| | | | 12.54 | | | 24.23 | | | 64,721 | | | 1.75 | | | 5.43 | | | 1.59 | | | 5.59 | | | 3 | |
| | | | | | | | | | | | | | | | | | | | | | | | | | |
| | | | | | | | | | | | | | | | | | | | | | | | | | |
| | | | (1.38 | ) | | (1.43 | ) | | 353,010 | | | 2.87 | | | 4.25 | | | N/A | | | N/A | | | 20 | |
| | | | 4.18 | | | (7.10 | ) | | 375,162 | | | 2.58 | | | 4.12 | | | N/A | | | N/A | | | 17 | |
| | | | 14.82 | | | 17.69 | | | 167,208 | | | 2.91 | | | 4.54 | | | N/A | | | N/A | | | 7 | |
| | | | 2.53 | | | 2.32 | | | 153,082 | | | 2.10 | | | 5.48 | | | N/A | | | N/A | | | 6 | |
| | | | 14.44 | | | 19.89 | | | 157,243 | | | 1.49 | | | 5.88 | | | N/A | | | N/A | | | 2 | |
| (a) | The amounts shown are based on common share equivalents. |
| (b) | Total Return Based on Market Value is the combination of changes in the market price per share and the effect of reinvested dividend income and reinvested capital gains distributions, if any, at the average price paid per share at the time of reinvestment. The last dividend declared in the period, which is typically paid on the first business day of the following month, is assumed to be reinvested at the ending market price. The actual reinvestment for the last dividend declared in the period may take place over several days, and in some instances may not be based on the market price, so the actual reinvestment price may be different from the price used in the calculation. Total returns are not annualized. |
| | |
| | Total Return Based on Common Share NAV is the combination of changes in common share NAV, reinvested dividend income at NAV and reinvested capital gains distributions at NAV, if any. The last dividend declared in the period, which is typically paid on the first business day of the following month, is assumed to be reinvested at the ending NAV. The actual reinvest price for the last dividend declared in the period may often be based on the Fund’s market price (and not its NAV), and therefore may be different from the price used in the calculation. Total returns are not annualized. |
| (c) | Ratios do not reflect the effect of dividend payments to Auction Rate Preferred shareholders, where applicable; Net Investment Income (Loss) ratios reflect income earned and expenses incurred on assets attributable to Auction Rate Preferred Shares (“ARPS”), MTP Shares and/or VMTP Shares, where applicable. |
| (d) | After expense reimbursement from the Adviser, where applicable. As of September 30, 2010, the Adviser is no longer reimbursing Georgia Dividend Advantage 2 (NKG) for any fees and expenses. |
| (e) | The expense ratios reflect, among other things, all interest expense and other costs related to MTP Shares, VMTP Shares and/or the interest expense deemed to have been paid by the Fund on the floating rate certificates issued by the special purpose trusts for the self-deposited inverse floaters held by the Fund, where applicable, each as described in Note 1 – General Information and Significant Accounting Policies, MuniFund Term Preferred Shares and Variable Rate MuniFund Term Preferred Shares and Note 3 – Portfolio Securities and Investments in Derivatives, Inverse Floating Rate Securities, respectively, as follows: |
| Georgia Dividend Advantage 2 (NKG) | | | |
| Year Ended 5/31: | | | |
| 2014 | | 1.89 | % |
| 2013 | | 1.51 | |
| 2012 | | 1.56 | |
| 2011 | | 1.60 | |
| 2010 | | .55 | |
| | | | |
| Maryland Premium Income (NMY) | | | |
| Year Ended 5/31: | | | |
| 2014 | | 1.81 | % |
| 2013 | | 1.46 | |
| 2012 | | 1.56 | |
| 2011 | | 1.00 | |
| 2010 | | .32 | |
| (f) | Portfolio Turnover Rate is calculated based on the lesser of long-term purchases or sales (as disclosed in Note 5 – Investment Transactions) divided by the average long-term market value during the period. |
| N/A | Fund does not have, or no longer has, a contractual reimbursement agreement with the Adviser. |
See accompanying notes to financial statements.
Financial Highlights (continued)
Selected data for a common share outstanding throughout each period:
| | | | | Investment Operations | | Less Distributions | | | | | |
| | | Beginning Common Share NAV | | Net Investment Income (Loss) | | Net Realized/ Unrealized Gain (Loss) | | Distributions from Net Investment Income to Auction Rate Preferred Shareholders | (a) | Distributions from Accumulated Net Realized Gains to Auction Rate Preferred Shareholders | (a) | Total | | From Net Investment Income to Common Shareholders | | From Accumulated Net Realized Gains to Common Shareholders | | Total | | Ending Common Share NAV | | Ending Market Value | |
| Missouri Premium Income (NOM) | | | | | | | | | | | | | | | | | | | | | | | | | |
| Year Ended 5/31: | | | | | | | | | | | | | | | | | | | | | | | | | | | | | | | |
| 2014 | | $ | 14.61 | | $ | .65 | | $ | (.34 | ) | $ | — | | $ | — | | $ | .31 | | $ | (.73 | ) | $ | — | | $ | (.73 | ) | $ | 14.19 | | $ | 15.08 | |
| 2013 | | | 14.62 | | | .66 | | | .06 | | | — | | | — | | | .72 | | | (.73 | ) | | — | | | (.73 | ) | | 14.61 | | | 16.04 | |
| 2012 | | | 13.19 | | | .69 | | | 1.52 | | | — | | | — | | | 2.21 | | | (.78 | ) | | — | | | (.78 | ) | | 14.62 | | | 16.90 | |
| 2011 | | | 13.55 | | | .78 | | | (.35 | ) | | (.01 | ) | | — | | | .42 | | | (.78 | ) | | — | | | (.78 | ) | | 13.19 | | | 13.88 | |
| 2010 | | | 12.44 | | | .83 | | | .99 | | | (.03 | ) | | — | | | 1.79 | | | (.68 | ) | | — | | | (.68 | ) | | 13.55 | | | 16.50 | |
| | | | | | | | | | | | | | | | | | | | | | | | | | | | | | | | | | | |
| North Carolina Premium Income (NNC) | | | | | | | | | | | | | | | | | | | | | | | | | |
| Year Ended 5/31: | | | | | | | | | | | | | | | | | | | | | | | | | | | | | | | |
| 2014 | | | 15.02 | | | .54 | | | (.06 | ) | | — | | | — | | | .48 | | | (.60 | ) | | — | | | (.60 | ) | | 14.90 | | | 13.24 | |
| 2013 | | | 15.30 | | | .56 | | | (.17 | ) | | — | | | — | | | .39 | | | (.67 | ) | | — | | | (.67 | ) | | 15.02 | | | 13.88 | |
| 2012 | | | 14.34 | | | .57 | | | 1.10 | | | — | | | — | | | 1.67 | | | (.71 | ) | | — | | | (.71 | ) | | 15.30 | | | 15.97 | |
| 2011 | | | 14.72 | | | .69 | | | (.32 | ) | | (.01 | ) | | — | | | .36 | | | (.74 | ) | | — | | | (.74 | ) | | 14.34 | | | 14.41 | |
| 2010 | | | 13.78 | | | .81 | | | .87 | | | (.03 | ) | | — | | | 1.65 | | | (.71 | ) | | — | | | (.71 | ) | | 14.72 | | | 15.37 | |
| | | | | | | Ratios/Supplemental Data | |
| | | Total Returns | | | | Ratios to Average Net Assets Applicable to Common Shares(c) | | | |
| | | Based on Common Share NAV | (b) | Based on Market Value | (b) | Ending Net Assets Applicable to Common Shares (000) | | Expenses | (d) | Net Investment Income (Loss) | | Portfolio Turnover Rate | (e) |
| | | | | | | | | | | | | | | | | | | | |
| | | | | | | | | | | | | | | | | | | | |
| | | | 2.52 | % | | (.83 | )% | $ | 33,072 | | | 2.86 | % | | 4.85 | % | | 21 | % |
| | | | 4.98 | | | (.67 | ) | | 34,011 | | | 2.77 | | | 4.45 | | | 12 | |
| | | | 17.16 | | | 28.21 | | | 33,979 | | | 2.95 | | | 4.93 | | | 13 | |
| | | | 3.22 | | | (11.29 | ) | | 30,595 | | | 2.30 | | | 5.90 | | | 11 | |
| | | | 14.69 | | | 34.31 | | | 31,348 | | | 1.37 | | | 6.37 | | | 7 | |
| | | | | | | | | | | | | | | | | | | | |
| | | | | | | | | | | | | | | | | | | | |
| | | | 3.54 | | | .10 | | | 246,492 | | | 2.81 | | | 3.85 | | | 17 | |
| | | | 2.50 | | | (9.16 | ) | | 248,601 | | | 2.72 | | | 3.88 | | | 17 | |
| | | | 11.88 | | | 16.23 | | | 97,497 | | | 3.28 | | | 3.85 | | | 18 | |
| | | | 2.57 | | | (1.27 | ) | | 91,256 | | | 2.49 | | | 4.77 | | | 10 | |
| | | | 12.24 | | | 28.20 | | | 93,570 | | | 1.54 | | | 5.68 | | | 6 | |
| (a) | The amounts shown are based on common share equivalents. |
| (b) | Total Return Based on Market Value is the combination of changes in the market price per share and the effect of reinvested dividend income and reinvested capital gains distributions, if any, at the average price paid per share at the time of reinvestment. The last dividend declared in the period, which is typically paid on the first business day of the following month, is assumed to be reinvested at the ending market price. The actual reinvestment for the last dividend declared in the period may take place over several days, and in some instances may not be based on the market price, so the actual reinvestment price may be different from the price used in the calculation. Total returns are not annualized. |
| | |
| | Total Return Based on Common Share NAV is the combination of changes in common share NAV, reinvested dividend income at NAV and reinvested capital gains distributions at NAV, if any. The last dividend declared in the period, which is typically paid on the first business day of the following month, is assumed to be reinvested at the NAV. The actual reinvest price for the last dividend declared in the period may often be based on the Fund’s market price (and not its NAV), and therefore may be different from the price used in the calculation. Total returns are not annualized. |
| (c) | Ratios do not reflect the effect of dividend payments to Auction Rate Preferred shareholders, where applicable; Net Investment Income (Loss) ratios reflect income earned and expenses incurred on assets attributable to ARPS, MTP Shares and/or VMTP Shares, where applicable. |
| (d) | The expense ratios reflect, among other things, all interest expense and other costs related to MTP Shares, VMTP Shares and/or the interest expense deemed to have been paid by the Fund on the floating rate certificates issued by the special purpose trusts for the self-deposited inverse floaters held by the Fund, where applicable, each as described in Note 1 – General Information and Significant Accounting Policies, MuniFund Term Preferred Shares and Variable Rate MuniFund Term Preferred Shares and Note 3 – Portfolio Securities and Investments in Derivatives, Inverse Floating Rate Securities, respectively, as follows: |
| Missouri Premium Income (NOM) | | | |
| Year Ended 5/31: | | | |
| 2014 | | 1.51 | % |
| 2013 | | 1.45 | |
| 2012 | | 1.55 | |
| 2011 | | .93 | |
| 2010 | | .03 | |
| | | | |
| North Carolina Premium Income (NNC) | | | |
| Year Ended 5/31: | | | |
| 2014 | | 1.70 | % |
| 2013 | | 1.60 | |
| 2012 | | 1.71 | |
| 2011 | | 1.29 | |
| 2010 | | .34 | |
| (e) | Portfolio Turnover Rate is calculated based on the lesser of long-term purchases or sales (as disclosed in Note 5 – Investment Transactions) divided by the average long-term market value during the period. |
See accompanying notes to financial statements.
Financial Highlights (continued)
Selected data for a common share outstanding throughout each period:
| | | Investment Operations | | Less Distributions | | | | | |
| | | Beginning Common Share NAV | | Net Investment Income (Loss) | | Net Realized/ Unrealized Gain (Loss) | | Distributions from Net Investment Income to Auction Rate Preferred Shareholders | (a) | Distributions from Accumulated Net Realized Gains to Auction Rate Preferred Shareholders | (a) | Total | | From Net Investment Income to Common Shareholders | | From Accumulated Net Realized Gains to Common Shareholders | | Total | | Ending Common Share NAV | | Ending Market Value | |
| Virginia Premium Income (NPV) | | | | | | | | | | | | | | | | | | | | | | | | | |
| Year Ended 5/31: | | | | | | | | | | | | | | | | | | | | | | | | | | | | |
| 2014 | | $ | 15.38 | | $ | .71 | | $ | (.89 | ) | $ | — | | $ | — | | $ | (.18 | ) | $ | (.72 | ) | $ | (.01 | ) | $ | (.73 | ) | $ | 14.47 | | $ | 13.39 | |
| 2013 | | | 15.60 | | | .66 | | | (.10 | ) | | — | | | — | | | .56 | | | (.76 | ) | | (.02 | ) | | (.78 | ) | | 15.38 | | | 14.32 | |
| 2012 | | | 14.42 | | | .68 | | | 1.32 | | | — | | | — | | | 2.00 | | | (.80 | ) | | (.02 | ) | | (.82 | ) | | 15.60 | | | 17.05 | |
| 2011 | | | 14.73 | | | .77 | | | (.27 | ) | | (.01 | ) | | — | | | .49 | | | (.80 | ) | | — | | | (.80 | ) | | 14.42 | | | 14.92 | |
| 2010 | | | 13.76 | | | .88 | | | .93 | | | (.03 | ) | | — | | | 1.78 | | | (.81 | ) | | — | | | (.81 | ) | | 14.73 | | | 15.85 | |
| | | | | | | Ratios/Supplemental Data | |
| | | Total Returns | | | | Ratios to Average Net Assets Applicable to Common Shares(c) | | | |
| | | Based on Common Share NAV | (b) | Based on Market Value | (b) | Ending Net Assets Applicable to Common Shares (000) | | Expenses | (d) | Net Investment Income (Loss) | | Portfolio Turnover Rate | (e) |
| | | | | | | | | | | | | | | | | | | | |
| | | | | | | | | | | | | | | | | | | | |
| | | | (.79 | )% | | (.93 | )% | $ | 259,568 | | | 2.25 | % | | 5.15 | % | | 19 | % |
| | | | 3.56 | | | (11.76 | ) | | 275,865 | | | 2.57 | | | 4.19 | | | 21 | |
| | | | 14.26 | | | 20.61 | | | 141,099 | | | 2.78 | | | 4.49 | | | 12 | |
| | | | 3.48 | | | (.58 | ) | | 130,032 | | | 2.11 | | | 5.36 | | | 12 | |
| | | | 13.19 | | | 16.60 | | | 132,302 | | | 1.45 | | | 6.14 | | | 3 | |
| (a) | The amounts shown are based on common share equivalents. |
| (b) | Total Return Based on Market Value is the combination of changes in the market price per share and the effect of reinvested dividend income and reinvested capital gains distributions, if any, at the average price paid per share at the time of reinvestment. The last dividend declared in the period, which is typically paid on the first business day of the following month, is assumed to be reinvested at the ending market price. The actual reinvestment for the last dividend declared in the period may take place over several days, and in some instances may not be based on the market price, so the actual reinvestment price may be different from the price used in the calculation. Total returns are not annualized. |
| | |
| | Total Return Based on Common Share NAV is the combination of changes in common share NAV, reinvested dividend income at NAV and reinvested capital gains distributions at NAV, if any. The last dividend declared in the period, which is typically paid on the first business day of the following month, is assumed to be reinvested at the ending NAV. The actual reinvest price for the last dividend declared in the period may often be based on the Fund’s market price (and not its NAV), and therefore may be different from the price used in the calculation. Total returns are not annualized. |
| (c) | Ratios do not reflect the effect of dividend payments to Auction Rate Preferred shareholders, where applicable; Net Investment Income (Loss) ratios reflect income earned and expenses incurred on assets attributable to ARPS, MTP Shares and/or VRDP Shares, where applicable. |
| (d) | The expense ratios reflect, among other things, all interest expense and other costs related to MTP Shares, VRDP Shares and/or the interest expense deemed to have been paid by the Fund on the floating rate certificates issued by the special purpose trusts for the self-deposited inverse floaters held by the Fund, where applicable, each as described in Note 1 – General Information and Significant Accounting Policies, MuniFund Term Preferred Shares and Variable Rate Demand Preferred Shares and Note 3 –Portfolio Securities and Investments in Derivatives, Inverse Floating Rate Securities, respectively, as follows: |
| Virginia Premium Income (NPV) | | | |
| Year Ended 5/31: | | | |
| 2014 | | 1.18 | % |
| 2013 | | 1.44 | |
| 2012 | | 1.41 | |
| 2011 | | .93 | |
| 2010 | | .29 | |
| (e) | Portfolio Turnover Rate is calculated based on the lesser of long-term purchases or sales (as disclosed in Note 5 – Investment Transactions) divided by the average long-term market value during the period. |
See accompanying notes to financial statements.
Financial Highlights (continued)
| | | ARPS at the End of Period | | MTP Shares at the End of Period(a) | | VMTP Shares at the End of Period | | ARPS and MTP Shares at the End of Period | |
| | | Aggregate Amount Outstanding (000) | | Asset Coverage Per $25,000 Share | | Aggregate Amount Outstanding (000) | | Asset Coverage Per $10 Share | | Aggregate Amount Outstanding (000) | | Asset Coverages Per $100,000 Share | | Asset Coverage Per $1 Liquidation Preference | |
| Georgia Dividend Advantage 2 (NKG) | | | | | | | | | | | | | | |
| Year Ended 5/31: | | | | | | | | | | | | | | | | | | | | | | |
| 2014 | | $ | — | | $ | — | | $ | — | | $ | — | | $ | 75,000 | | $ | 296,676 | | $ | — | |
| 2013 | | | — | | | — | | | 74,945 | | | 30.53 | | | — | | | — | | | — | |
| 2012 | | | — | | | — | | | 32,265 | | | 30.78 | | | — | | | — | | | — | |
| 2011 | | | — | | | — | | | 32,265 | | | 29.46 | | | — | | | — | | | — | |
| 2010 | | | — | | | — | | | 32,265 | | | 30.06 | | | — | | | — | | | — | |
| | | | | | | | | | | | | | | | | | | | | | | |
| Maryland Premium Income (NMY) | | | | | | | | | | | | | | | | | | | | | | |
| Year Ended 5/31: | | | | | | | | | | | | | | | | | | | | | | |
| 2014 | | | — | | | — | | | — | | | — | | | 167,000 | | | 311,383 | | | — | |
| 2013 | | | — | | | — | | | 166,144 | | | 32.58 | | | — | | | — | | | — | |
| 2012 | | | — | | | — | | | 74,593 | | | 32.42 | | | — | | | — | | | — | |
| 2011 | | | — | | | — | | | 74,593 | | | 30.52 | | | — | | | — | | | — | |
| 2010 | | | 32,975 | | | 79,788 | | | 38,775 | | | 31.92 | | | — | | | — | | | 3.19 | |
| (a) | The Ending and Average Market Value Per Share for each Series of the Fund’s MTP Shares were as follows: |
| | | | 2014 | | | 2013 | | | 2012 | | | 2011 | | | 2010 | |
| Georgia Dividend Advantage 2 (NKG) | | | | | | | | | | | | | | | | |
| Series 2015 (NKG PRC) | | | | | | | | | | | | | | | | |
| Ending Market Value per Share | | $ | — | | $ | 10.08 | | $ | 10.10 | | $ | 10.06 | | $ | 9.99 | |
| Average Market Value per Share | | | 10.03 | Δ | | 10.08 | | | 10.07 | | | 10.02 | | | 9.99 | ^ |
| Series 2015-1 (NKG PRD)(b) | | | | | | | | | | | | | | | | |
| Ending Market Value per Share | | | — | | | 10.10 | | | — | | | — | | | — | |
| Average Market Value per Share | | | 10.04 | Δ | | 10.07 | Ω | | — | | | — | | | — | |
| Series 2015-2 (NKG PRE)(b) | | | | | | | | | | | | | | | | |
| Ending Market Value per Share | | | — | | | 10.12 | | | — | | | — | | | — | |
| Average Market Value per Share | | | 10.03 | Δ | | 10.07 | Ω | | — | | | — | | | — | |
| | | | | | | | | | | | | | | | | |
| Maryland Premium Income (NMY) | | | | | | | | | | | | | | | | |
| Series 2015 (NMY PRC) | | | | | | | | | | | | | | | | |
| Ending Market Value per Share | | | — | | | 10.06 | | | 10.06 | | | 10.09 | | | 10.00 | |
| Average Market Value per Share | | | 10.04 | Δ | | 10.09 | | | 10.10 | | | 10.04 | | | 10.01 | ^ |
| Series 2016 (NMY PRD) | | | | | | | | | | | | | | | | |
| Ending Market Value per Share | | | — | | | 10.16 | | | 10.11 | | | 10.10 | | | — | |
| Average Market Value per Share | | | 10.07 | Δ | | 10.17 | | | 10.14 | | | 10.04 | ^^ | | — | |
| Series 2015 (NMY PRE)(b) | | | | | | | | | | | | | | | | |
| Ending Market Value per Share | | | — | | | 10.05 | | | — | | | — | | | — | |
| Average Market Value per Share | | | 10.03 | Δ | | 10.07 | ΩΩ | | — | | | — | | | — | |
| Series 2015-1(NMY PRF)(b) | | | | | | | | | | | | | | | | |
| Ending Market Value per Share | | | — | | | 10.06 | | | — | | | — | | | — | |
| Average Market Value per Share | | | 10.03 | Δ | | 10.07 | ΩΩ | | — | | | — | | | — | |
| Series 2015-1(NMY PRG)(b) | | | | | | | | | | | | | | | | |
| Ending Market Value per Share | | | — | | | 10.05 | | | — | | | — | | | — | |
| Average Market Value per Share | | | 10.04 | Δ | | 10.08 | ΩΩ | | — | | | — | | | — | |
| Series 2016 (NMY PRH)(b) | | | | | | | | | | | | | | | | |
| Ending Market Value per Share | | | — | | | 10.13 | | | — | | | — | | | — | |
| Average Market Value per Share | | | 10.07 | Δ | | 10.14 | ΩΩ | | — | | | — | | | — | |
| (b) | MTP Shares issued in connection with the reorganizations. |
| ^ | For the period January 29, 2010 (first issuance date of shares) through May 31, 2010. |
| ^^ | For the period March 15, 2011 (first issuance date of shares) through May 31, 2011. |
| Ω | For the period July 9, 2012 (effective date of the reorganizations) through May 31, 2013. |
| ΩΩ | For the period August 6, 2012 (effective date of the reorganizations) through May 31, 2013. |
| Δ | For the period June 1, 2013 through May 30, 2014. |
See accompanying notes to financial statements.
| | | ARPS at the End of Period | | MTP Shares at the End of Period(a) | | VMTP Shares at the End of Period | | ARPS and MTP Shares at the End of Period | |
| | | Aggregate Amount Outstanding (000) | | Asset Coverage Per $25,000 Share | | Aggregate Amount Outstanding (000) | | Asset Coverage Per $10 Share | | Aggregate Amount Outstanding (000) | | Asset Coverages Per $100,000 Share | | Asset Coverage Per $1 Liquidation Preference | |
| Missouri Premium Income (NOM) | | | | | | | | | | | | | | | | | | | | | |
| Year Ended 5/31: | | | | | | | | | | | | | | | | | | | | | | |
| 2014 | | $ | — | | $ | — | | $ | 17,880 | | $ | 28.50 | | $ | — | | $ | — | | $ | — | |
| 2013 | | | — | | | — | | | 17,880 | | | 29.02 | | | — | | | — | | | — | |
| 2012 | | | — | | | — | | | 17,880 | | | 29.00 | | | — | | | — | | | — | |
| 2011 | | | — | | | — | | | 17,880 | | | 27.11 | | | — | | | — | | | — | |
| 2010 | | | 16,000 | | | 73,981 | | | — | | | — | | | — | | | — | | | — | |
| | | | | | | | | | | | | | | | | | | | | | | |
| North Carolina Premium Income (NNC) | | | | | | | | | | | | | | | | | | | | | |
| Year Ended 5/31: | | | | | | | | | | | | | | | | | | | | | | |
| 2014 | | | — | | | — | | | — | | | — | | | 125,000 | | | 297,193 | | | — | |
| 2013 | | | — | | | — | | | 124,860 | | | 29.91 | | | — | | | — | | | — | |
| 2012 | | | — | | | — | | | 49,835 | | | 29.56 | | | — | | | — | | | — | |
| 2011 | | | — | | | — | | | 49,835 | | | 28.31 | | | — | | | — | | | — | |
| 2010 | | | 21,550 | | | 76,020 | | | 24,300 | | | 30.41 | | | — | | | — | | | 3.04 | |
| (a) | The Ending and Average Market Value Per Share for each Series of the Fund’s MTP Shares were as follows: |
| | | | 2014 | | | 2013 | | | 2012 | | | 2011 | | | 2010(c) | |
| Missouri Premium Income (NOM) | | | | | | | | | | | | | | | | |
| Series 2015 (NOM PRC) | | | | | | | | | | | | | | | | |
| Ending Market Value per Share | | $ | 10.06 | | $ | 10.03 | | $ | 10.40 | | $ | 13.88 | | $ | — | |
| Average Market Value per Share | | | 10.04 | | | 10.08 | | | 9.98 | | | 15.41 | ΔΔ | | — | |
| | | | | | | | | | | | | | | | | |
| North Carolina Premium Income (NNC) | | | | | | | | | | | | | | | | |
| Series 2015 (NNC PRC) | | | | | | | | | | | | | | | | |
| Ending Market Value per Share | | | — | | | 10.07 | | | 10.11 | | | 10.04 | | | 9.99 | |
| Average Market Value per Share | | | 10.03 | ^ | | 10.10 | | | 10.09 | | | 10.04 | | | 10.01 | Δ |
| Series 2016 (NNC PRD) | | | | | | | | | | | | | | | | |
| Ending Market Value per Share | | | — | | | 10.08 | | | 10.10 | | | 10.00 | | | — | |
| Average Market Value per Share | | | 10.04 | ^ | | 10.09 | | | 10.07 | | | 9.94 | ΔΔΔ | | — | |
| Series 2015 (NNC PRE)(b) | | | | | | | | | | | | | | | | |
| Ending Market Value per Share | | | — | | | 10.06 | | | — | | | — | | | — | |
| Average Market Value per Share | | | 10.03 | ^ | | 10.07 | Ω | | — | | | — | | | — | |
| Series 2015-1 (NNC PRF)(b) | | | | | | | | | | | | | | | | |
| Ending Market Value per Share | | | — | | | 10.06 | | | — | | | — | | | — | |
| Average Market Value per Share | | | 10.03 | ^ | | 10.07 | Ω | | — | | | — | | | — | |
| Series 2015-1 (NNC PRG)(b) | | | | | | | | | | | | | | | | |
| Ending Market Value per Share | | | — | | | 10.06 | | | — | | | — | | | — | |
| Average Market Value per Share | | | 10.03 | ^ | | 10.07 | Ω | | — | | | — | | | — | |
| (b) | MTP Shares issued in connection with the reorganizations. |
| (c) | Missouri Premium Income (NOM) did not issue MTP Shares prior to the fiscal year ended May 31, 2011. |
| Δ | For the period January 21, 2010 (first issuance date of shares) through May 31, 2010. |
| ΔΔ | For the period November 9, 2010 (first issuance date of shares) through May 31, 2011. |
| ΔΔΔ | For the period December 14, 2010 (first issuance date of shares) through May 31, 2011. |
| Ω | For the period July 9, 2012 (effective date of the reorganizations) through May 31, 2013. |
| ^ | For the period June 1, 2013 through March 3, 2014. |
See accompanying notes to financial statements.
Financial Highlights (continued)
| | | ARPS at the End of Period | | MTP Shares at the End of Period(a) | | VRDP Shares at the End of Period | | ARPS and MTP Shares at the End of Period | |
| | | Aggregate Amount Outstanding (000) | | Asset Coverage Per $25,000 Share | | Aggregate Amount Outstanding (000) | | Asset Coverage Per $10 Share | | Aggregate Amount Outstanding (000) | | Asset Coverages Per $100,000 Share | | Asset Coverage Per $1 Liquidation Preference | |
| Virginia Premium Income (NPV) | | | | | | | | | | | | | | | | | | | | | |
| Year Ended 5/31: | | | | | | | | | | | | | | | | | | | | | | |
| 2014 | | $ | — | | $ | — | | $ | — | | $ | — | | $ | 128,000 | | $ | 302,787 | | $ | — | |
| 2013 | | | — | | | — | | | 127,408 | | | 31.65 | | | — | | | — | | | — | |
| 2012 | | | — | | | — | | | 61,408 | | | 32.98 | | | — | | | — | | | — | |
| 2011 | | | — | | | — | | | 61,408 | | | 31.18 | | | — | | | — | | | — | |
| 2010 | | | 25,550 | | | 82,269 | | | 32,205 | | | 32.91 | | | — | | | — | | | 3.29 | |
| (a) | The Ending and Average Market Value Per Share for each Series of the Fund’s MTP Shares were as follows: |
| | | | 2014 | | | 2013 | | | 2012 | | | 2011 | | | 2010 | |
| Virginia Premium Income (NPV) | | | | | | | | | | | | | | | | |
| Series 2014 (NPV PRA) | | | | | | | | | | | | | | | | |
| Ending Market Value per Share | | $ | — | | $ | 10.03 | | $ | 10.12 | | $ | 10.03 | | $ | — | |
| Average Market Value per Share | | | 10.01 | ^ | | 10.08 | | | 10.10 | | | 10.02 | ** | | — | |
| Series 2015 (NPV PRC) | | | | | | | | | | | | | | | | |
| Ending Market Value per Share | | | — | | | 10.09 | | | 10.13 | | | 10.01 | | | 10.00 | |
| Average Market Value per Share | | | 10.04^ | | | 10.09 | | | 10.09 | | | 10.07 | | | 10.00 | * |
| Series 2014 (NPV PRD)(b) | | | | | | | | | | | | | | | | |
| Ending Market Value per Share | | | — | | | 10.06 | | | — | | | — | | | — | |
| Average Market Value per Share | | | 10.04 | ^ | | 10.09 | Ω | | — | | | — | | | — | |
| Series 2014-1 (NPV PRE)(b) | | | | | | | | | | | | | | | | |
| Ending Market Value per Share | | | — | | | 10.09 | | | — | | | — | | | — | |
| Average Market Value per Share | | | 10.04 | ^ | | 10.09 | Ω | | — | | | — | | | — | |
| (b) | MTP Shares issued in connection with the reorganizations. |
| * | For the period January 26, 2010 (first issuance date of shares) through May 31, 2010. |
| ** | For the period March 14, 2011 (first issuance date of shares) through May 31, 2011. |
| Ω | For the period August 6, 2012 (effective date of the reorganizations) through May 31, 2013. |
| ^ | For the period June 1, 2013 through September 9, 2013. |
See accompanying notes to financial statements.
Notes to Financial Statements
1. General Information and Significant Accounting Policies
General Information
Fund Information
The state funds covered in this report and their corresponding New York Stock Exchange (“NYSE”) or NYSE MKT symbols are as follows (each a “Fund” and collectively, the “Funds”):
| | • Nuveen Georgia Dividend Advantage Municipal Fund 2 (NKG) (“Georgia Dividend Advantage 2 (NKG)”) |
| | • Nuveen Maryland Premium Income Municipal Fund (NMY) (“Maryland Premium Income (NMY)”) |
| | • Nuveen Missouri Premium Income Municipal Fund (NOM) (“Missouri Premium Income (NOM)”) |
| | • Nuveen North Carolina Premium Income Municipal Fund (NNC) (“North Carolina Premium Income (NNC)”) |
| | • Nuveen Virginia Premium Income Municipal Fund (NPV) (“Virginia Premium Income (NPV)”) |
The Funds are registered under the Investment Company Act of 1940, as amended, as diversified closed-end registered investment companies. Common shares of Georgia Dividend Advantage 2 (NKG), Maryland Premium Income (NMY) and Virginia Premium Income (NPV) are traded on the NYSE while common shares of North Carolina Premium Income (NNC) and Missouri Premium Income (NOM) are traded on the NYSE MKT. (Common shares of Georgia Dividend Advantage 2 (NKG) were formerly traded on the NYSE MKT). Georgia Dividend Advantage 2 (NKG) and Missouri Premium Income (NOM) were organized as Massachusetts business trusts on October 26, 2001 and March 29, 1993, respectively. Maryland Premium Income (NMY), North Carolina Premium Income (NNC) and Virginia Premium Income were organized as Massachusetts business trusts on January 12, 1993.
Investment Adviser
The Funds’ investment adviser is Nuveen Fund Advisors, LLC (the “Adviser”), a wholly-owned subsidiary of Nuveen Investments, Inc. (“Nuveen”). The Adviser is responsible for each Fund’s overall investment strategy and asset allocation decisions. The Adviser has entered into sub-advisory agreements with Nuveen Asset Management, LLC (the “Sub-Adviser”), a subsidiary of the Adviser, under which the Sub-Adviser manages the investment portfolios of the Funds.
Agreement and Plan of Merger
On April 14, 2014, TIAA-CREF, a national financial services organization, announced that it had entered into an agreement (the “Purchase Agreement”) to acquire Nuveen, the parent company of the Adviser. The transaction is expected to be completed by the end of the year, subject to customary closing conditions, including obtaining necessary Nuveen fund and client consents sufficient to satisfy the terms of the Purchase Agreement and obtaining customary regulatory approvals. There can be no assurance that the transaction described above will be consummated as contemplated or that necessary conditions will be satisfied.
The consummation of the transaction will be deemed to be an “assignment” (as defined in the Investment Company Act of 1940) of the investment management agreements between the Nuveen funds and the Adviser and the investment sub-advisory agreements between the Adviser and each Nuveen fund’s sub-adviser or sub-advisers, and will result in automatic termination of each agreement. It is anticipated that the Board of Directors/Trustees of the Nuveen funds will consider a new investment management agreement with the Adviser and new investment sub-advisory agreements with each sub-adviser. If approved by the Board of Directors/Trustees, the new agreements will be presented to the Nuveen funds’ shareholders for approval, and, if so approved by shareholders, will take effect upon consummation of the transaction or such later time as shareholder approval is obtained.
The transaction is not expected to result in any change in the portfolio management of the Funds or in the Funds’ investment objectives or policies.
Investment Objectives
Each Fund seeks to provide current income exempt from both regular federal and designated state income taxes by investing primarily in a portfolio of municipal obligations issued by state and local government authorities within a single state or certain U.S. territories.
Significant Accounting Policies
The following is a summary of significant accounting policies followed by the Funds in the preparation of their financial statements in accordance with U.S. generally accepted accounting principles (“U.S. GAAP”).
Notes to Financial Statements (continued)
Investment Transactions
Investment transactions are recorded on a trade date basis. Realized gains and losses from transactions are determined on the specific identification method, which is the same basis used for federal income tax purposes. Investments purchased on a when-issued/delayed delivery basis may have extended settlement periods. Any investments so purchased are subject to market fluctuation during this period. The Funds have instructed the custodian to earmark securities in the Funds’ portfolios with a current value at least equal to the amount of the when-issued/delayed delivery purchase commitments. As of May 31, 2014, outstanding when-issued/delayed delivery purchase commitments were as follows:
| | | | | | | | | | | | | North | | | | |
| | | | Georgia | | | Maryland | | | Missouri | | | Carolina | | | Virginia | |
| | | | Dividend | | | Premium | | | Premium | | | Premium | | | Premium | |
| | | | Advantage 2 | | | Income | | | Income | | | Income | | | Income | |
| | | | (NKG | ) | | (NMY | ) | | (NOM | ) | | (NNC | ) | | (NPV | ) |
| Outstanding when-issued/delayed delivery purchase commitments | | $ | — | | $ | — | | $ | 519,370 | | $ | — | | $ | — | |
Investment Income
Investment income, which reflects the amortization of premiums and includes accretion of discounts for financial reporting purposes, is recorded on an accrual basis. Investment income also reflects paydown gains and losses, if any.
Professional Fees
Professional fees presented on the Statement of Operations consist of legal fees incurred in the normal course of operations, audit fees, tax consulting fees and, in some cases, workout expenditures. Workout expenditures are incurred in an attempt to protect or enhance an investment, or to pursue other claims or legal actions on behalf of Fund shareholders. If a refund in received for workout expenditures paid in a prior reporting period, such amounts will be recognized as “Legal fee refund” on the Statements of Operations.
Dividends and Distributions to Common Shareholders
Dividends from net investment income are declared monthly. Net realized capital gains and/or market discount from investment transactions, if any, are distributed to shareholders at least annually. Furthermore, capital gains are distributed only to the extent they exceed available capital loss carryforwards.
Distributions to common shareholders of net investment income, net realized capital gains and/or market discount, if any, are recorded on the ex-dividend date. The amount and timing of distributions are determined in accordance with federal income tax regulations, which may differ from U.S. GAAP.
Auction Rate Preferred Shares
Each Fund is authorized to issue Auction Rate Preferred Shares (“ARPS”). During prior fiscal periods, the Funds redeemed all of their outstanding ARPS, at liquidation value.
MuniFund Term Preferred Shares
During the current fiscal period, the Funds had issued and outstanding MTP Shares, with a $10 stated par value per share. Each Fund’s MTP Shares were issued in one or more Series and traded on the NYSE/NYSE MKT.
Georgia Dividend Advantage (NKG) and Maryland Premium Income (NMY) redeemed all of their outstanding MTP Shares on May 30, 2014. North Carolina Premium Income (NNC) redeemed all of its outstanding MTP Shares on March 3, 2014. Virginia Premium Income (NPV) redeemed all of its outstanding Shares on September 9, 2013.
Georgia Dividend Advantage’s (NKG), Maryland Premium Income’s (NMY), and North Carolina Premium Income’s (NNC) MTP Shares were redeemed at their $10 liquidation value per share, plus dividend amounts owed, using proceeds from their issuance of Variable Rate MuniFund Term Preferred (“VMTP”) Shares (as described below in Variable Rate MuniFund Term Preferred Shares).
Virginia Premium Income’s (NPV) MTP Shares were redeemed at their $10 liquidation value per share, plus dividend amounts owed, using proceeds from its issuance of Variable Rate Demand Preferred (“VRDP”) Shares (as described below in Variable Rate Demand Preferred Shares).
As of May 31, 2014, details of Missouri Premium Income’s (NOM) MTP Shares outstanding are as follows:
| | | | | | | | | | | | | Shares | | | | |
| | | | | | | | | | | | | Outstanding | | | | |
| | | | | | | | | | Shares | | | at $10 Per Share | | | Annual | |
| Fund | | | Series | | | NYSE MKT Ticker | | | Outstanding | | Liquidation Value | | Dividend Rate | |
| Missouri Premium Income (NOM) | | | 2015 | | | NOM PRC | | | 1,780,000 | | $ | 17,800,000 | | | 2.10% | |
A Fund is obligated to redeem its MTP Shares by the date as specified in its offering document (“Term Redemption Date”), unless earlier redeemed or repurchased by the Fund. MTP Shares are subject to optional and mandatory redemption in certain circumstances. MTP Shares were subject to redemption at the option of the Fund (“Optional Redemption Date”), subject to a payment of premium for one year following the Optional Redemption Date (“Premium Expiration Date”), and at par thereafter. MTP Shares also will be subject to redemption, at the option of the Fund, at par in the event of certain changes in the credit rating of the MTP Shares. The Fund may be obligated to redeem certain of the MTP Shares if the Fund fails to maintain certain asset coverage and leverage ratio requirements and such failures are not cured by the applicable cure date. The redemption price per share is equal to the sum of the liquidation value per share plus any accumulated but unpaid dividends. The Term Redemption Date, Optional Redemption Date and Premium Expiration Date for the Fund’s series of MTP Shares are as follows:
| | | | | | | | | | Term | | | Optional | | | Premium | |
| Fund | | | Series | | | NYSE MKT Ticker | | | Redemption Date | | | Redemption Date | | | Expiration Date | |
| Missouri Premium Income (NOM) | | 2015 | | | NOM PRC | | | December 1, 2015 | | | December 1, 2011 | | | November 30, 2012 | |
The average liquidation value of MTP Shares outstanding for each Fund during the fiscal year ended May 31, 2014, was as follows:
| | | | | | | | | | | | | North | | | | |
| | | | Georgia | | | Maryland | | | Missouri | | | Carolina | | | Virginia | |
| | | | Dividend | | | Premium | | | Premium | | | Premium | | | Premium | |
| | | | Advantage 2 | | | Income | | | Income | | | Income | | | Income | |
| | | | (NKG | )* | | (NMY | )* | | (NOM | ) | | (NNC | )** | | (NPV | )*** |
| Average liquidation value of MTP Shares outstanding | | $ | 74,945,000 | | $ | 166,144,000 | | $ | 17,880,000 | | $ | 124,860,000 | | $ | 127,408,000 | |
| * | For the period June 1, 2013 through May 30, 2014. |
| ** | For the period June 1, 2013 through March 3, 2014. |
| *** | For the period June 1, 2013 through September 9, 2013. |
For financial reporting purposes, the liquidation value of MTP Shares is recorded as a liability and recognized as “MuniFund Term Preferred (“MTP”) Shares, at liquidation value” on the Statement of Assets and Liabilities. Unpaid dividends on MTP Shares are recognized as a component of “Interest payable” on the Statement of Assets and Liabilities. Dividends accrued on MTP Shares are recognized as a component of “Interest expense and amortization of offering costs” on the Statement of Operations. Costs incurred by the Funds in connection with their offerings of MTP Shares were recorded as a deferred charge, which are amortized over the life of the shares and are recognized as components of “Deferred offering costs” on the Statement of Assets and Liabilities and “Interest expense and amortization of offering costs” on the Statement of Operations. In conjunction with Georgia Dividend Advantage’s (NKG), Maryland Premium Income’s (NMY), North Carolina Premium Income’s (NNC) and Virginia Premium Income’s (NPV) redemption of MTP Shares, the remaining deferred offering costs of $287,969, $779,586, $626,799 and $661,608, respectively, were fully expensed during the current fiscal period, as the redemptions were deemed extinguishments of debt.
Variable Rate MuniFund Term Preferred Shares
The following Funds have issued and outstanding VMTP Shares, with a $100,000 liquidation value per share. VMTP Shares are issued via private placement and are not publically available.
As of May 31, 2014, VMTP Shares outstanding, at liquidation value, for each Fund was as follows:
| | | | | | | | | | Shares | |
| | | | | | | | | | Outstanding at | |
| | | | | | | Shares | | | $100,000 Per Share | |
| Fund | | | Series | | | Outstanding | | | Liquidation Value | |
| Georgia Dividend Advantage 2 (NKG) | | | 2017 | | | 750 | | $ | 75,000,000 | |
| Maryland Premium Income (NMY) | | | 2017 | | | 1,670 | | $ | 167,000,000 | |
| North Carolina Premium Income (NNC) | | | 2017 | | | 1,250 | | $ | 125,000,000 | |
During the current fiscal period, Georgia Dividend Advantage (NKG), Maryland Premium Income (NMY) and North Carolina Premium Income (NNC) issued their VMTP Shares through privately negotiated offerings.
Each Fund is obligated to redeem its VMTP Shares by the date as specified in its offering document (“Term Redemption Date”), unless earlier redeemed or repurchased by the Fund. VMTP Shares are subject to optional and mandatory redemption in certain circumstances. The VMTP Shares are subject to redemption at the option of each Fund (“Optional Redemption Date”), subject to payment of premium for one year following the date of issuance (“Premium Expiration Date”), and at par thereafter. Each Fund may be obligated to redeem certain of the VMTP Shares if the Fund fails to maintain certain asset coverage and leverage ratio requirements and such failures are not cured by the applicable cure date. The redemption price
Notes to Financial Statements (continued)
per share is equal to the sum of the liquidation value per share plus any accumulated but unpaid dividends. The Term Redemption Date, Optional Redemption Date and Premium Expiration Date for each Fund’s VMTP Shares are as follows:
| | | | | | Term | | | Optional | | | Premium | |
| Fund | | Series | | | Redemption Date | | | Redemption Date | | | Expiration Date | |
| Georgia Dividend Advantage 2 (NKG) | | 2017 | | | June 1, 2017 | | | June 1, 2015 | | | May 31, 2015 | |
| Maryland Premium Income (NMY) | | 2017 | | | June 1, 2017 | | | June 1, 2015 | | | May 31, 2015 | |
| North Carolina Premium Income (NNC) | | 2017 | | | March 1, 2017 | | | March 1, 2015 | | | April 30, 2015 | |
The average liquidation value of VMTP Shares outstanding and annualized dividend rate for each Fund during the fiscal year ended May 31, 2014, were as follows:
| | | | | | | | | | North | |
| | | | Georgia | | | Maryland | | | Carolina | |
| | | | Dividend | | | Premium | | | Premium | |
| | | | Advantage 2 | | | Income | | | Income | |
| | | | (NKG | )* | | (NMY | )* | | (NNC | )** |
| Average liquidation value of VMTP Shares outstanding | | $ | 75,000,000 | | $ | 167,000,000 | | $ | 125,000,000 | |
| Annualized dividend rate | | | 1.00 | % | | 1.02 | % | | 1.02 | % |
| * | For the period May 20, 2014 (first issuance date of shares) through May 31, 2014. |
| ** | For the period February 21, 2014 (first issuance date of shares) through May 31, 2014. |
VMTP Shares generally do not trade, and market quotations are generally not available. VMTP Shares are short-term or short/intermediate-term instruments that pay a variable dividend rate tied to a short-term index, plus an additional fixed “spread” amount established at the time of issuance. The fair value of VMTP Shares is expected to be approximately their liquidation par value so long as the fixed “spread” on the VMTP Shares remains roughly in line with the “spread” rates being demanded by investors on instruments having similar terms in the current market environment. In present market conditions, the Funds’ Adviser has determined that the fair value of VMTP Shares is their liquidation value, but their fair value could vary if market conditions change materially. For financial reporting purposes, the liquidation value of VMTP Shares is recorded as a liability and recognized as “Variable Rate MuniFund Term Preferred (“VMTP”) Shares, at liquidation value” on the Statement of Assets and Liabilities.
Dividends on the VMTP Shares (which are treated as interest payments for financial reporting purposes) are set weekly. Unpaid dividends on VMTP Shares are recognized as a component of “Interest payable” on the Statement of Assets and Liabilities, when applicable. Dividends accrued on VMTP Shares are recognized as a component of “Interest expense and amortization of offering costs” on the Statement of Operations.
Offering costs incurred by the Funds in connection with their offerings of VMTP Shares, which were recorded as a deferred charge and are being amortized over the life of the shares, are recognized as components of “Deferred offering costs” on the Statement of Assets and Liabilities and “Interest expense and amortization of offering costs” on the Statement of Operations. Georgia Dividend Advantage (NKG), Maryland Premium Income (NMY) and North Carolina Premium Income (NNC) each incurred offering costs of $160,000, $185,000 and $125,000, respectively.
Variable Rate Demand Preferred Shares
Virginia Premium Income (NPV) has issued and outstanding VRDP Shares, with a $100,000 liquidation value per share. VRDP Shares are issued via private placement and are not publicly available.
During the current fiscal period, Virginia Premium Income (NPV) issued its outstanding VRDP Shares through a private negotiated offering.
As of May 31, 2014, details for the Fund’s VRDP Shares outstanding are as follows:
| | | | | | | | | Shares Outstanding at | | | | |
| | | | | | | Shares | | | $100,000 Per Share | | | | |
| Fund | | | Series | | | Outstanding | | | Liquidation Value | | | Maturity | |
| Virginia Premium Income (NPV) | | | 1 | | | 1,280 | | $ | 128,000,000 | | | August 3, 2043 | |
VRDP Shares include a liquidity feature that allows VRDP shareholders to have their shares purchased by a liquidity provider with whom the Fund has contracted in the event that purchase orders for VRDP Shares in a remarketing are not sufficient in number to be matched with the sale orders in that remarketing. The Fund is required to redeem any VRDP Shares that are still owned by the liquidity provider after six months of continuous, unsuccessful remarketing. The Fund pays an annual remarketing fee of .10% on the aggregate principal amount of all VRDP Shares outstanding. The Fund’s VRDP Shares have successfully remarketed since issuance.
Dividends on the VRDP Shares (which are treated as interest payments for financial reporting purposes) are set weekly at a rate established by a remarketing agent; therefore, the market value of the VRDP Shares is expected to approximate its liquidation value. If remarketings for VRDP Shares
are continuously unsuccessful for six months, the maximum rate is designed to escalate according to a specified schedule in order to enhance the remarketing agent’s ability to successfully remarket the VRDP Shares.
Subject to certain conditions, VRDP Shares may be redeemed, in whole or in part, at any time at the option of the Fund. The Fund may also redeem certain of the VRDP Shares if the Fund fails to maintain certain asset coverage requirements and such failures are not cured by the applicable cure date. The redemption price per share is equal to the sum of the liquidation value per share plus any accumulated but unpaid dividends.
The average liquidation value of VRDP Shares outstanding and annualized dividend rate for the Fund during the period August 29, 2013 (first issuance of shares) through May 31, 2014, were as follows:
| | | | | |
| | | | Virginia | |
| | | | Premium | |
| | | | Income | |
| | | | (NPV | ) |
| Average liquidation value of VRDP Shares outstanding | | $ | 128,000,000 | |
| Annualized dividend rate | | | .16 | % |
For financial reporting purposes, the liquidation value of VRDP Shares is a liability and is recognized as “Variable Rate Demand Preferred (“VRDP”) Shares, at liquidation value” on the Statement of Assets and Liabilities. Unpaid dividends on VRDP Shares are recognized as a component of “Interest payable” on the Statement of Assets and Liabilities, when applicable. Dividends accrued on VRDP Shares are recognized as a component of “Interest expense and amortization of offering costs” on the Statement of Operations. Costs incurred by the Fund in connection with its offerings of VRDP Shares were recorded as a deferred charge, which are being amortized over the life of the shares and are recognized as a component of “Deferred offering costs” on the Statement of Assets and Liabilities and “Interest expense and amortization of offering costs” on the Statement of Operations. Virginia Premium Income (NPV) incurred $270,000 of offering costs in conjunction with its shares issued during the current fiscal period. In addition to interest expense, the Fund also pays a per annum liquidity fee to the liquidity provider, as well as a remarketing fee, which are recognized as “Liquidity fees” and “Remarketing fees,” respectively, on the Statement of Operations.
Common Shares Equity Shelf Programs and Offering Costs
Virginia Premium Income (NPV) has filed a registration statement with the Securities and Exchange Commission authorizing the Fund to issue 1.7 million additional common shares through an equity shelf program (“Shelf Offering”), which was declared effective during the current fiscal period.
Under this Shelf Offering, the Fund, subject to market conditions, may raise additional equity capital from time to time in varying amounts and offering methods at a net price at or above the Fund’s net asset value (“NAV”) per common share.
Authorized common shares, common shares issued and offering proceeds, net of offering costs under the Fund’s Shelf Offering during the fiscal year ended May 31, 2014 were as follows:
| | | | Virginia | |
| | | | Premium | |
| | | | Income | |
| | | | (NPV | ) |
| | | | Year Ended | |
| | | | 5/31/14 | |
| Authorized common shares | | | 1,700,000 | * |
| Common shares issued | | | — | |
| Offering proceeds, net of offering costs | | $ | — | |
| * | Shelf Offering declared effective by the SEC during the current fiscal period. |
Costs incurred by the Fund in connection with its Shelf Offering are recorded as a deferred charge and recognized as a component of “Deferred offering costs” on the Statement of Assets and Liabilities. The deferred asset is reduced during the one-year period that additional shares are sold by reducing the proceeds from such sales and is recognized as a component of “Proceeds from shelf offering, net of offering costs” on the Statement of Changes in Net Assets, when applicable. At the end of the one-year life of the Shelf Offering period, any remaining deferred charges will be expensed accordingly and recognized as a component of “Other expenses” on the Statement of Operations. Any additional costs the Fund may incur in connection with its Shelf Offering are expensed as incurred and recognized as a component of “Proceeds from shelf offering, net of offering costs” on the Statement of Changes in Net Assets, when applicable.
Indemnifications
Under the Funds’ organizational documents, their officers and trustees are indemnified against certain liabilities arising out of the performance of their duties to the Funds. In addition, in the normal course of business, the Funds enter into contracts that provide general indemnifications to other parties. The Funds’ maximum exposure under these arrangements is unknown as this would involve future claims that may be made against the Funds that have not yet occurred. However, the Funds have not had prior claims or losses pursuant to these contracts and expect the risk of loss to be remote.
Notes to Financial Statements (continued)
Netting Agreements
In the ordinary course of business, the Funds may enter into transactions subject to enforceable International Swaps and Derivative Association, Inc. (“ISDA”) master agreements or other similar arrangements (“netting agreements”). Generally, the right to offset in netting agreements allows each Fund to offset any exposure to a specific counterparty with any collateral received or delivered to that counterparty based on the terms of the agreements. Generally, a Fund manages its cash collateral and securities collateral on a counterparty basis.
As of May 31, 2014, the Funds were not invested in any portfolio securities or derivative instruments that are subject to netting agreements.
Use of Estimates
The preparation of financial statements in conformity with U.S. GAAP requires management to make estimates and assumptions that affect the reported amounts of assets and liabilities at the date of the financial statements and the reported amounts of increases and decreases in net assets applicable to common shares from operations during the reporting period. Actual results may differ from those estimates.
2. Investment Valuation and Fair Value Measurements
The fair valuation input levels as described below are for fair value measurement purposes.
Investment Valuation
Prices of fixed income securities are provided by a pricing service approved by the Nuveen funds’ Board of Directors/Trustees. The pricing service establishes a security’s fair value using methods that may include consideration of the following: yields or prices of investments of comparable quality, type of issue, coupon, maturity and rating, market quotes or indications of value from security dealers, evaluations of anticipated cash flows or collateral, general market conditions and other information and analysis, including the obligor’s credit characteristics considered relevant. These securities are generally classified as Level 2. In pricing certain securities, particularly less liquid and lower quality securities, the pricing service may consider information about a security, its issuer or market activity, provided by the Adviser. These securities are generally classified as Level 2 or Level 3 depending on the priority of the significant inputs.
Common stocks and other equity-type securities are valued at the last sales price on the securities exchange on which such securities are primarily traded and are generally classified as Level 1. Securities primarily traded on the NASDAQ National Market (“NASDAQ”) are valued, except as indicated below, at the NASDAQ Official Closing Price and are generally classified as Level 1. However, securities traded on a securities exchange or NASDAQ for which there were no transactions on a given day or securities not listed on a securities exchange or NASDAQ are valued at the quoted bid price and are generally classified as Level 2.
Certain securities may not be able to be priced by the pre-established pricing methods as described above. Such securities may be valued by the Nuveen funds’ Board of Directors/Trustees or its designee at fair value. These securities generally include, but are not limited to, restricted securities (securities which may not be publicly sold without registration under the Securities Act of 1933, as amended) for which a pricing service is unable to provide a market price; securities whose trading has been formally suspended; debt securities that have gone into default and for which there is no current market quotation; a security whose market price is not available from a pre-established pricing source; a security with respect to which an event has occurred that is likely to materially affect the value of the security after the market has closed but before the calculation of a fund’s NAV (as may be the case in non-U.S. markets on which the security is primarily traded) or make it difficult or impossible to obtain a reliable market quotation; and a security whose price, as provided by the pricing service, is not deemed to reflect the security’s fair value. As a general principle, the fair value of a security would appear to be the amount that the owner might reasonably expect to receive for it in a current sale. A variety of factors may be considered in determining the fair value of such securities, which may include consideration of the following: yields or prices of investments of comparable quality, type of issue, coupon, maturity and rating, market quotes or indications of value from security dealers, evaluations of anticipated cash flows or collateral, general market conditions and other information and analysis, including the obligor’s credit characteristics considered relevant. These securities are generally classified as Level 2 or Level 3 depending on the priority of the significant inputs. Regardless of the method employed to value a particular security, all valuations are subject to review by the Nuveen funds’ Board of Directors/Trustees or its designee.
Fair Value Measurements
Fair value is defined as the price that would be received upon selling an investment or transferring a liability in an orderly transaction to an independent buyer in the principal or most advantageous market for the investment. A three-tier hierarchy is used to maximize the use of observable market data and minimize the use of unobservable inputs and to establish classification of fair value measurements for disclosure purposes. Observable inputs reflect the assumptions market participants would use in pricing the asset or liability. Observable inputs are based on market data obtained from sources independent of the reporting entity. Unobservable inputs reflect the reporting entity’s own assumptions about the assumptions market participants would use in pricing the asset or liability. Unobservable inputs are based on the best information available in the circumstances. The following is a summary of the three-tiered hierarchy of valuation input levels.
| Level 1 – | Inputs are unadjusted and prices are determined using quoted prices in active markets for identical securities. |
| | |
| Level 2 – | Prices are determined using other significant observable inputs (including quoted prices for similar securities, interest rates, prepayment speeds, credit risk, etc.). |
| | |
| Level 3 – | Prices are determined using significant unobservable inputs (including management’s assumptions in determining the fair value of investments). |
The inputs or methodologies used for valuing securities are not an indication of the risks associated with investing in those securities. The following is a summary of each Fund’s fair value measurements as of the end of the reporting period:
| Georgia Dividend Advantage 2 (NKG) | | | Level 1 | | | Level 2 | | | Level 3 | | | Total | |
| Long-Term Investments*: | | | | | | | | | | | | | |
| Municipal Bonds | | $ | — | | $ | 222,327,955 | | $ | — | | $ | 222,327,955 | |
| Maryland Premium Income (NMY) | | | | | | | | | | | | | |
| Long-Term Investments*: | | | | | | | | | | | | | |
| Municipal Bonds | | $ | — | | $ | 531,018,355 | | $ | — | | $ | 531,018,355 | |
| Common Stocks | | | 3,197,017 | | | — | | | — | | | 3,197,017 | |
| Total | | $ | 3,197,017 | | $ | 531,018,355 | | $ | — | | $ | 534,215,372 | |
| Missouri Premium Income (NOM) | | | | | | | | | | | | | |
| Long-Term Investments*: | | | | | | | | | | | | | |
| Municipal Bonds | | $ | — | | $ | 51,730,951 | | $ | — | | $ | 51,730,951 | |
| North Carolina Premium Income (NNC) | | | | | | | | | | | | | |
| Long-Term Investments*: | | | | | | | | | | | | | |
| Municipal Bonds | | $ | — | | $ | 366,357,212 | | $ | — | | $ | 366,357,212 | |
| Virginia Premium Income (NPV) | | | | | | | | | | | | | |
| Long-Term Investments*: | | | | | | | | | | | | | |
| Municipal Bonds | | $ | — | | $ | 390,766,454 | | $ | — | | $ | 390,766,454 | |
* Refer to the Fund’s Portfolio of Investments for industry classifications.
The Nuveen funds’ Board of Directors/Trustees is responsible for the valuation process and has delegated the oversight of the daily valuation process to the Adviser’s Valuation Committee. The Valuation Committee, pursuant to the valuation policies and procedures adopted by the Board of Directors/Trustees, is responsible for making fair value determinations, evaluating the effectiveness of the funds’ pricing policies and reporting to the Board of Directors/Trustees. The Valuation Committee is aided in its efforts by the Adviser’s dedicated Securities Valuation Team, which is responsible for administering the daily valuation process and applying fair value methodologies as approved by the Valuation Committee. When determining the reliability of independent pricing services for investments owned by the funds, the Valuation Committee, among other things, conducts due diligence reviews of the pricing services and monitors the quality of security prices received through various testing reports conducted by the Securities Valuation Team.
The Valuation Committee will consider pricing methodologies it deems relevant and appropriate when making a fair value determination, based on the facts and circumstances specific to the portfolio instrument. Fair value determinations generally will be derived as follows, using public or private market information:
| | (i) | If available, fair value determinations shall be derived by extrapolating from recent transactions or quoted prices for identical or comparable securities. |
| | | |
| | (ii) | If such information is not available, an analytical valuation methodology may be used based on other available information including, but not limited to: analyst appraisals, research reports, corporate action information, issuer financial statements and shelf registration statements. Such analytical valuation methodologies may include, but are not limited to: multiple of earnings, discount from market value of a similar freely-traded security, discounted cash flow analysis, book value or a multiple thereof, risk premium/yield analysis, yield to maturity and/or fundamental investment analysis. |
The purchase price of a portfolio instrument will be used to fair value the instrument only if no other valuation methodology is available or deemed appropriate, and it is determined that the purchase price fairly reflects the instrument’s current value.
For each portfolio security that has been fair valued pursuant to the policies adopted by the Board of Directors/Trustees, the fair value price is compared against the last available and next available market quotations. The Valuation Committee reviews the results of such testing and fair valuation occurrences are reported to the Board of Directors/Trustees.
3. Portfolio Securities and Investments in Derivatives
Portfolio Securities
Inverse Floating Rate Securities
Each Fund is authorized to invest in inverse floating rate securities. An inverse floating rate security is created by depositing a municipal bond, typically with a fixed interest rate, into a special purpose trust created by a broker-dealer. In turn, this trust (a) issues floating rate certificates, in face amounts equal to some fraction of the deposited bond’s par amount or market value, that typically pay short-term tax-exempt interest rates to third parties, and (b) issues to a long-term investor (such as one of the Funds) an inverse floating rate certificate (sometimes referred to as an “inverse floater”) that represents all remaining or residual interest in the trust. The income received by the inverse floater holder varies inversely with the short-term rate paid to the floating rate certificates’ holders, and in most circumstances the inverse floater holder bears substantially all of the underlying bond’s downside
Notes to Financial Statements (continued)
investment risk and also benefits disproportionately from any potential appreciation of the underlying bond’s value. The price of an inverse floating rate security will be more volatile than that of the underlying bond because the interest rate is dependent on not only the fixed coupon rate of the underlying bond but also on the short-term interest paid on the floating rate certificates, and because the inverse floating rate security essentially bears the risk of loss of the greater face value of the underlying bond.
The inverse floater held by a Fund gives the Fund the right (a) to cause the holders of the floating rate certificates to tender their notes at par, and (b) to have the broker transfer the fixed-rate bond held by the trust to the Fund, thereby collapsing the trust.
A Fund may purchase an inverse floating rate security in a secondary market transaction without first owning the underlying bond (referred to as an “externally-deposited inverse floater”), or instead by first selling a fixed-rate bond to a broker-dealer for deposit into the special purpose trust and receiving in turn the residual interest in the trust (referred to as a “self-deposited inverse floater”).
An investment in an externally-deposited inverse floater is identified in the Portfolio of Investments as “(IF) – Inverse floating rate investment.” The Fund’s Statement of Assets and Liabilities shows only the inverse floaters and not the underlying bonds as an asset and does not reflect the short-term floating rate certificates as liabilities. Also, the Fund reflects in “Investment Income” only the net amount of earnings on its inverse floater investment (net of the interest paid to the holders of the short-term floating rate certificates and the expenses of the trust), and does not show the amount of that interest paid as an interest expense on the Statement of Operations.
An investment in a self-deposited inverse floater is accounted for as a financing transaction. In such instances, a fixed-rate bond deposited into a special purpose trust is identified in the Portfolio of Investments as “(UB) – Underlying bond of an inverse floating rate trust reflected as a financing transaction,” with the Fund accounting for the short-term floating rate certificates issued by the trust, at their liquidation value, as “Floating rate obligations” on the Statement of Assets and Liabilities. In addition, the Fund reflects in “Investment Income” the entire earnings of the underlying bond and recognizes the related interest paid to the holders of the short-term floating rate certificates as a component of “Interest expense and amortization of offering costs” on the Statement of Operations.
The average floating rate obligations outstanding and average annual interest rate and fees related to self-deposited inverse floaters during the fiscal year ended May 31, 2014, were as follows:
| | | | | | | | | | | | | North | | | | |
| | | | Georgia | | | Maryland | | | Missouri | | | Carolina | | | Virginia | |
| | | | Dividend | | | Premium | | | Premium | | | Premium | | | Premium | |
| | | | Advantage 2 | | | Income | | | Income | | | Income | | | Income | |
| | | | (NKG | ) | | (NMY | ) | | (NOM | ) | | (NNC | ) | | (NPV | ) |
| Average floating rate obligations outstanding | | $ | 3,245,000 | | $ | 21,983,658 | | $ | 2,225,000 | | $ | 14,058,205 | | $ | 9,250,000 | |
| Average annual interest rate and fees | | | .43% | | | .71% | | | .25% | | | .55% | | | .28% | |
As of May 31, 2014, the total amount of floating rate obligations issued by each Fund’s self-deposited inverse floaters and externally-deposited inverse floaters was as follows:
| | | | | | | | | | | | | North | | | | |
| | | | Georgia | | | Maryland | | | Missouri | | | Carolina | | | Virginia | |
| | | | Dividend | | | Premium | | | Premium | | | Premium | | | Premium | |
| | | | Advantage 2 | | | Income | | | Income | | | Income | | | Income | |
| | | | (NKG | ) | | (NMY | ) | | (NOM | ) | | (NNC | ) | | (NPV | ) |
| Floating rate obligations: self-deposited inverse floaters | | $ | 3,245,000 | | $ | 21,935,000 | | $ | 2,225,000 | | $ | — | | $ | 9,250,000 | |
| Floating rate obligations: externally-deposited inverse floaters | | | 5,635,000 | | | — | | | — | | | — | | | 20,070,000 | |
| Total | | $ | 8,880,000 | | $ | 21,935,000 | | $ | 2,225,000 | | $ | — | | $ | 29,320,000 | |
Each Fund may also enter into shortfall and forbearance agreements (sometimes referred to as a “recourse trust” or “credit recovery swap”) (such agreements are referred to herein as “Recourse Trusts”), with a broker-dealer by which a Fund agrees to reimburse the broker-dealer, in certain circumstances, for the difference between the liquidation value of the fixed-rate bond held by the trust and the liquidation value of the floating rate certificates issued by the trust plus any shortfalls in interest cash flows. Under these agreements, a Fund’s potential exposure to losses related to or on inverse floaters may increase beyond the value of a Fund’s inverse floater investments as a Fund may potentially be liable to fulfill all amounts owed to holders of the floating rate certificates. At period end, any such shortfall is denoted as “Unrealized depreciation on Recourse Trusts” on the Statement of Assets and Liabilities.
As of May 31, 2014, each Fund’s maximum exposure to the floating rate obligations issued by externally-deposited Recourse Trusts, was as follows:
| | | | | | | | | | | | | North | | | | |
| | | | Georgia | | | Maryland | | | Missouri | | | Carolina | | | Virginia | |
| | | | Dividend | | | Premium | | | Premium | | | Premium | | | Premium | |
| | | | Advantage 2 | | | Income | | | Income | | | Income | | | Income | |
| | | | (NKG | ) | | (NMY | ) | | (NOM | ) | | (NNC | ) | | (NPV | ) |
| Maximum exposure to Recourse Trusts | | $ | — | | $ | — | | $ | — | | $ | — | | $ | 13,330,000 | |
Zero Coupon Securities
A zero coupon security does not pay a regular interest coupon to its holders during the life of the security. Income to the holder of the security comes from accretion of the difference between the original purchase price of the security at issuance and the par value of the security at maturity and is effectively paid at maturity. The market prices of zero coupon securities generally are more volatile than the market prices of securities that pay interest periodically.
Investments in Derivatives
Each Fund is authorized to invest in certain derivative investments, such as futures, options and swap contracts. Each Fund will limit its investments in futures, options on futures and swap contracts to the extent necessary for the Adviser to claim exclusion from registration by the Commodity Futures Trading Commission as a commodity pool operator with respect to the Fund. The Funds record derivative instruments at fair value, with changes in fair value recognized on the Statement of Operations, when applicable. Even though the Funds’ investments in derivatives may represent economic hedges, they are not considered to be hedge transactions for financial reporting purposes. Although the Funds are authorized to invest in derivative instruments and may do so in the future, they did not make any such investments during the fiscal year ended May 31, 2014.
Market and Counterparty Credit Risk
In the normal course of business each Fund may invest in financial instruments and enter into financial transactions where risk of potential loss exists due to changes in the market (market risk) or failure of the other party to the transaction to perform (counterparty credit risk). The potential loss could exceed the value of the financial assets recorded on the financial statements. Financial assets, which potentially expose each Fund to counterparty credit risk, consist principally of cash due from counterparties on forward, option and swap transactions, when applicable. The extent of each Fund’s exposure to counterparty credit risk in respect to these financial assets approximates their carrying value as recorded on the Statement of Assets and Liabilities.
Each Fund helps manage counterparty credit risk by entering into agreements only with counterparties the Adviser believes have the financial resources to honor their obligations and by having the Adviser monitor the financial stability of the counterparties. Additionally, counterparties may be required to pledge collateral daily (based on the daily valuation of the financial asset) on behalf of each Fund with a value approximately equal to the amount of any unrealized gain above a pre-determined threshold. Reciprocally, when each Fund has an unrealized loss, the Funds have instructed the custodian to pledge assets of the Funds as collateral with a value approximately equal to the amount of the unrealized loss above a pre-determined threshold. Collateral pledges are monitored and subsequently adjusted if and when the valuations fluctuate, either up or down, by at least the pre-determined threshold amount.
4. Fund Shares
Common Shares
Since the inception of the Funds’ repurchase programs, the Funds have not repurchased any of their outstanding common shares.
Transactions in common shares were as follows:
| | | Georgia Dividend | | Maryland Premium | | Missouri Premium | |
| | | Advantage 2 (NKG) | | Income (NMY) | | Income (NOM) | |
| | | | Year Ended | | | Year Ended | | | Year Ended | | | Year Ended | | | Year Ended | | | Year Ended | |
| | | | 5/31/14 | | | 5/31/13 | | | 5/31/14 | | | 5/31/13 | | | 5/31/14 | | | 5/31/13 | |
| Common shares: | | | | | | | | | | | | | | | | | | | |
| Issued in the reorganizations | | | — | | | 5,990,755 | | | — | | | 13,439,122 | | | — | | | — | |
| Issued to shareholders due to reinvestment of distributions | | | — | | | 1,859 | | | — | | | 4,796 | | | 2,752 | | | 3,547 | |
| | | North Carolina | | Virginia Premium | |
| | | Premium Income (NNC) | | Income (NPV) | |
| | | | Year Ended | | | Year Ended | | | Year Ended | | | Year Ended | |
| | | | 5/31/14 | | | 5/31/13 | | | 5/31/14 | | | 5/31/13 | |
| Common shares: | | | | | | | | | | | | | |
| Issued in the reorganizations | | | — | | | 10,175,659 | | | — | | | 8,861,589 | |
| Issued to shareholders due to reinvestment of distributions | | | — | | | 1,941 | | | — | | | 28,384 | |
Notes to Financial Statements (continued)
Preferred Shares
Transactions in preferred shares for the Funds during the fiscal years ended May 31, 2014 and May 31, 2013, where applicable, are noted in the following tables.
Transactions in MTP Shares for the Funds were as follows:
| | | Year Ended May 31, 2014 | |
| | | | | | | NYSE/NYSE | | | | | | | |
| | | | Series | | | MKT Ticker | | | Shares | | | Amount | |
| Georgia Dividend Advantage 2 (NKG) | | | | | | | | | | | | | |
| MTP Shares redeemed: | | | | | | | | | | | | | |
| | | | 2015 | | | NKG PRC | | | (3,226,500 | ) | $ | (32,265,000 | ) |
| | | | 2015-1 | | | NKG PRD | | | (2,834,000 | ) | | (28,340,000 | ) |
| | | | 2015-2 | | | NKG PRE | | | (1,434,000 | ) | | (14,340,000 | ) |
| Total | | | | | | | | | (7,494,500 | ) | $ | (74,945,000 | ) |
| Maryland Premium Income (NMY) | | | | | | | | | | | | | |
| MTP Shares redeemed: | | | | | | | | | | | | | |
| | | | 2015 | | | NMY PRC | | | (3,877,500 | ) | $ | (38,775,000 | ) |
| | | | 2016 | | | NMY PRD | | | (3,581,800 | ) | | (35,818,000 | ) |
| | | | 2015 | | | NMY PRE | | | (2,648,500 | ) | | (26,485,000 | ) |
| | | | 2015-1 | | | NMY PRF | | | (2,730,000 | ) | | (27,300,000 | ) |
| | | | 2015-1 | | | NMY PRG | | | (2,070,000 | ) | | (20,700,000 | ) |
| | | | 2016 | | | NMY PRH | | | (1,706,600 | ) | | (17,066,000 | ) |
| Total | | | | | | | | | (16,614,400 | ) | $ | (166,144,000 | ) |
| North Carolina Premium Income (NNC) | | | | | | | | | | | | | |
| MTP Shares redeemed: | | | | | | | | | | | | | |
| | | | 2015 | | | NNC PRC | | | (2,430,000 | ) | $ | (24,300,000 | ) |
| | | | 2016 | | | NNC PRD | | | (2,553,500 | ) | | (25,535,000 | ) |
| | | | 2015 | | | NNC PRE | | | (1,660,000 | ) | | (16,600,000 | ) |
| | | | 2015-1 | | | NNC PRF | | | (2,970,000 | ) | | (29,700,000 | ) |
| | | | 2015-1 | | | NNC PRG | | | (2,872,500 | ) | | (28,725,000 | ) |
| Total | | | | | | | | | (12,486,000 | ) | $ | (124,860,000 | ) |
| Virginia Premium Income (NPV) | | | | | | | | | | | | | |
| MTP Shares redeemed: | | | | | | | | | | | | | |
| | | | 2014 | | | NVP PRA | | | (2,920,300 | ) | $ | (29,203,000 | ) |
| | | | 2015 | | | NVP PRC | | | (3,220,500 | ) | | (32,205,000 | ) |
| | | | 2014 | | | NPV PRD | | | (2,280,000 | ) | | (22,800,000 | ) |
| | | | 2014-1 | | | NVP PRE | | | (4,320,000 | ) | | (43,200,000 | ) |
| Total | | | | | | | | | (12,740,800 | ) | $ | (127,408,000 | ) |
| | | | | | | | | | | | | | |
| | | Year Ended May 31, 2013 | |
| | | | | | | NYSE/NYSE | | | | | | | |
| | | | Series | | | MKT Ticker | | | Shares | | | Amount | |
| Georgia Dividend Advantage 2 (NKG) | | | | | | | | | | | | | |
| MTP Shares issued in connection with the reorganizations: | | | | | | | | | | | | | |
| | | | 2015-1 | | | NKG PRD | | | 2,834,000 | | $ | 28,340,000 | |
| | | | 2015-2 | | | NKG PRE | | | 1,434,000 | | | 14,340,000 | |
| Total | | | | | | | | | 4,268,000 | | $ | 42,680,000 | |
| | | Year Ended May 31, 2013 | |
| | | | | | | NYSE/NYSE | | | | | | | |
| | | | Series | | | MKT Ticker | | | Shares | | | Amount | |
| Maryland Premium Income (NMY) | | | | | | | | | | | | | |
| MTP Shares issued in connection with the reorganizations: | | | | | | | | | | | | | |
| | | | 2015 | | | NMY PRE | | | 2,648,500 | | $ | 26,485,000 | |
| | | | 2015-1 | | | NMY PRF | | | 2,730,000 | | | 27,300,000 | |
| | | | 2015-1 | | | NMY PRG | | | 2,070,000 | | | 20,700,000 | |
| | | | 2016 | | | NMY PRH | | | 1,706,600 | | | 17,066,000 | |
| Total | | | | | | | | | 9,155,100 | | $ | 91,551,000 | |
| North Carolina Premium Income (NNC) | | | | | | | | | | | | | |
| MTP Shares issued in connection with the reorganizations: | | | | | | | | | | | | | |
| | | | 2015 | | | NNC PRE | | | 1,660,000 | | $ | 16,600,000 | |
| | | | 2015-1 | | | NNC PRF | | | 2,970,000 | | | 29,700,000 | |
| | | | 2015-1 | | | NNC PRG | | | 2,872,500 | | | 28,725,000 | |
| Total | | | | | | | | | 7,502,500 | | $ | 75,025,000 | |
| Virginia Premium Income (NPV) | | | | | | | | | | | | | |
| MTP Shares issued in connection with the reorganizations: | | | | | | | | | | | | | |
| | | | 2014 | | | NPV PRD | | | 2,280,000 | | $ | 22,800,000 | |
| | | | 2014-1 | | | NVP PRE | | | 4,320,000 | | | 43,200,000 | |
| Total | | | | | | | | | 6,600,000 | | $ | 66,000,000 | |
| | | | | | | | | | | | | | |
| Transactions in VMTP Shares for the Funds were as follows: | | | | | | | | | | | | | |
| | Year Ended May 31, 2014 |
| | Series | | Shares | | | Amount | |
| Georgia Dividend Advantage 2 (NKG) | | | | | | | |
| VMTP Shares issued | 2017 | | | 750 | | | $ | 75,000,000 | |
| | | | | | | | | | |
| Maryland Premium Income (NMY) | | | | | | | | | |
| VMTP Shares issued | 2017 | | | 1,670 | | | $ | 167,000,000 | |
| | | | | | | | | | |
| North Carolina Premium Income (NNC) | | | | | | | | | |
| VMTP Shares issued | 2017 | | | 1,250 | | | $ | 125,000,000 | |
Transactions in VRDP Shares for the Funds were as follows:
| | Year Ended May 31, 2014 | |
| | Series | | | Shares | | | Amount | |
| Virginia Premium Income (NPV) | | | | | | | | |
| VRDP Shares issued | | 1 | | | | 1,280 | | | $ | 128,000,000 | |
5. Investment Transactions
Long-term purchases and sales (including maturities) during the fiscal year ended May 31, 2014, were as follows:
| | | | | | | | | | | | | | | | | |
| | | | | | | | | | | | | North | | | | |
| | | | Georgia | | | Maryland | | | Missouri | | | Carolina | | | Virginia | |
| | | | Dividend | | | Premium | | | Premium | | | Premium | | | Premium | |
| | | | Advantage 2 | | | Income | | | Income | | | Income | | | Income | |
| | | | (NKG | ) | | (NMY | ) | | (NOM | ) | | (NNC | ) | | (NPV | ) |
| Purchases | | $ | 43,852,914 | | $ | 105,974,140 | | $ | 11,081,225 | | $ | 62,721,625 | | $ | 71,956,361 | |
| Sales and maturities | | | 43,332,991 | | | 107,176,397 | | | 10,884,709 | | | 79,654,607 | | | 71,506,075 | |
Notes to Financial Statements (continued)
6. Income Tax Information
Each Fund is a separate taxpayer for federal income tax purposes. Each Fund intends to distribute substantially all of its net investment income and net capital gains to shareholders and to otherwise comply with the requirements of Subchapter M of the Internal Revenue Code applicable to regulated investment companies. Therefore, no federal income tax provision is required. Furthermore, each Fund intends to satisfy conditions that will enable interest from municipal securities, which is exempt from regular federal and designated state income taxes, to retain such tax-exempt status when distributed to shareholders of the Funds. Net realized capital gains and ordinary income distributions paid by the Funds are subject to federal taxation.
For all open tax years and all major taxing jurisdictions, management of the Funds has concluded that there are no significant uncertain tax positions that would require recognition in the financial statements. Open tax years are those that are open for examination by taxing authorities (i.e., generally the last four tax year ends and the interim tax period since then). Furthermore, management of the Funds is also not aware of any tax positions for which it is reasonably possible that the total amounts of unrecognized tax benefits will significantly change in the next twelve months.
The following information is presented on an income tax basis. Differences between amounts for financial statement and federal income tax purposes are primarily due to timing differences in recognizing taxable market discount, timing differences in recognizing certain gains and losses on investment transactions and the treatment of investments in inverse floating rate securities reflected as financing transactions, if any. To the extent that differences arise that are permanent in nature, such amounts are reclassified within the capital accounts as detailed below. Temporary differences do not require reclassification. Temporary and permanent differences do not impact the NAVs of the Funds.
As of May 31, 2014, the cost and unrealized appreciation (depreciation) of investments, as determined on a federal income tax basis, were as follows:
| | | | | | | | | | | | | North | | | | |
| | | | Georgia | | | Maryland | | | Missouri | | | Carolina | | | Virginia | |
| | | | Dividend | | | Premium | | | Premium | | | Premium | | | Premium | |
| | | | Advantage 2 | | | Income | | | Income | | | Income | | | Income | |
| | | | (NKG | ) | | (NMY | ) | | (NOM | ) | | (NNC | ) | | (NPV | ) |
| Cost of investments | | $ | 208,404,537 | | $ | 490,486,424 | | $ | 46,578,507 | | $ | 346,017,111 | | $ | 366,810,789 | |
| Gross unrealized: | | | | | | | | | | | | | | | | |
| Appreciation | | $ | 11,836,626 | | $ | 28,616,590 | | $ | 3,299,812 | | $ | 21,432,430 | | $ | 24,211,035 | |
| Depreciation | | | (1,157,779 | ) | | (6,822,634 | ) | | (372,523 | ) | | (1,092,329 | ) | | (9,505,370 | ) |
| Net unrealized appreciation (depreciation) of investments | | $ | 10,678,847 | | $ | 21,793,956 | | $ | 2,927,289 | | $ | 20,340,101 | | $ | 14,705,665 | |
Permanent differences, primarily due to federal taxes paid, nondeductible offering costs, distribution character reclassifications, paydowns and nondeductible reorganization expenses resulted in reclassifications among the Funds’ components of common share net assets as of May 31, 2014, the Funds’ tax year end, as follows:
| | | | | | | | | | | | | North | | | | |
| | | | Georgia | | | Maryland | | | Missouri | | | Carolina | | | Virginia | |
| | | | Dividend | | | Premium | | | Premium | | | Premium | | | Premium | |
| | | | Advantage 2 | | | Income | | | Income | | | Income | | | Income | |
| | | | (NKG | ) | | (NMY | ) | | (NOM | ) | | (NNC | ) | | (NPV | ) |
| Paid-in-surplus | | $ | (577,844 | ) | $ | (1,108,688 | ) | $ | (93,684 | ) | $ | (987,565 | ) | $ | (693,179 | ) |
| Undistributed (Over-distribution of) net investment income | | | 493,915 | | | 1,100,650 | | | 93,681 | | | 977,269 | | | 700,849 | |
| Accumulated net realized gain (loss) | | | 83,929 | | | 8,038 | | | 3 | | | 10,296 | | | (7,670 | ) |
The tax components of undistributed net tax-exempt income, net ordinary income and net long-term capital gains as of May 31, 2014, the Funds’ tax year end, were as follows:
| | | | | | | | | | | | | North | | | | |
| | | | Georgia | | | Maryland | | | Missouri | | | Carolina | | | Virginia | |
| | | | Dividend | | | Premium | | | Premium | | | Premium | | | Premium | |
| | | | Advantage 2 | | | Income | | | Income | | | Income | | | Income | |
| | | | (NKG | ) | | (NMY | ) | | (NOM | ) | | (NNC | ) | | (NPV | ) |
Undistributed net tax-exempt income1 | | $ | 185,325 | | $ | 1,924,493 | | $ | 354,669 | | $ | 616,922 | | $ | 2,187,299 | |
Undistributed net ordinary income2 | | | — | | | 10,895 | | | — | | | — | | | — | |
| Undistributed net long-term capital gains | | | — | | | — | | | — | | | 496,406 | | | — | |
| 1 | Undistributed net tax-exempt income (on a tax basis) has not been reduced for the dividend declared on May 1, 2014, paid on June 2, 2014. |
| 2 | Net ordinary income consists of taxable market discount income and net short-term capital gains, if any. |
The tax character of distributions paid during the Funds’ tax years ended May 31, 2014 and May 31, 2013 was designated for purposes of the dividends paid deduction as follows:
| | | | | | | | | | | | | North | | | | |
| | | | Georgia | | | Maryland | | | Missouri | | | Carolina | | | Virginia | |
| | | | Dividend | | | Premium | | | Premium | | | Premium | | | Premium | |
| | | | Advantage 2 | | | Income | | | Income | | | Income | | | Income | |
| 2014 | | | (NKG | ) | | (NMY | ) | | (NOM | ) | | (NNC | ) | | (NPV | ) |
Distributions from net tax-exempt income3 | | $ | 8,917,503 | | $ | 21,036,311 | | $ | 2,080,261 | | $ | 13,080,537 | | $ | 14,297,444 | |
Distributions from net ordinary income2 | | | 819 | | | 55,441 | | | — | | | 3,040 | | | 9,687 | |
Distributions from net long-term capital gains4 | | | — | | | — | | | — | | | — | | | 139,974 | |
| | | | | | | | | | | | | | | | | |
| | | | | | | | | | | | | North | | | | |
| | | | Georgia | | | Maryland | | | Missouri | | | Carolina | | | Virginia | |
| | | | Dividend | | | Premium | | | Premium | | | Premium | | | Premium | |
| | | | Advantage 2 | | | Income | | | Income | | | Income | | | Income | |
| 2013 | | | (NKG | ) | | (NMY | ) | | (NOM | ) | | (NNC | ) | | (NPV | ) |
| Distributions from net tax-exempt income | | $ | 7,902,906 | | $ | 18,685,110 | | $ | 2,087,163 | | $ | 12,772,122 | | $ | 13,813,122 | |
Distributions from net ordinary income2 | | | 8,446 | | | — | | | — | | | 8,772 | | | 50,192 | |
| Distributions from net long-term capital gains | | | — | | | — | | | — | | | — | | | 274,262 | |
| 2 | Net ordinary income consists of taxable market discount income and net short-term capital gains, if any. |
| 3 | The Funds hereby designate these amounts paid during the fiscal year ended May 31, 2014, as Exempt Interest Dividends. |
| 4 | The Funds designated as a long-term capital gain dividend, pursuant to the Internal Revenue Code Section 852(b)(3), the amount necessary to reduce earnings and profits of the Funds related to net capital gain to zero for the tax year ended May 31, 2014. |
As of May 31, 2014, the Funds’ tax year end, the following Funds had unused capital loss carryforwards available for federal income tax purposes to be applied against future capital gains, if any. If not applied, the carryforwards will expire as shown in the following table. The losses not subject to expiration will be utilized first by a Fund.
| | | | Georgia | | | Maryland | | | Missouri | | | Virginia | |
| | | | Dividend | | | Premium | | | Premium | | | Premium | |
| | | | Advantage 2 | | | Income | | | Income | | | Income | |
| | | | (NKG | ) | | (NMY | )5 | | (NOM | ) | | (NPV | ) |
| Expiration: | | | | | | | | | | | | | |
| May 31, 2016 | | $ | 462,549 | | $ | 851,610 | | $ | — | | $ | — | |
| May 31, 2017 | | | 1,635,823 | | | 172,377 | | | 77,824 | | | — | |
| May 31, 2018 | | | 1,329,548 | | | — | | | 91,539 | | | — | |
| May 31, 2019 | | | 48,370 | | | — | | | — | | | — | |
| Not subject to expiration | | | 895,118 | | | 6,790,849 | | | 691,272 | | | 6,487,908 | |
| Total | | $ | 4,371,408 | | $ | 7,814,836 | | $ | 860,635 | | $ | 6,487,908 | |
| 5 | A portion of Maryland Premium Income’s (NMY) capital loss carryforward is subject to limitation under the Internal Revenue Code and related regulations. |
During the Funds’ tax year ended May 31, 2014, the following Fund utilized capital loss carryforwards as follows:
| | | | North | |
| | | | Carolina | |
| | | | Premium | |
| | | | Income | |
| | | | (NNC | ) |
| Utilized capital loss carryforwards | | $ | 734,088 | |
The Funds have elected to defer late-year losses in accordance with federal income tax rules. These losses are treated as having arisen on the first day of the following fiscal year. The following Funds have elected to defer losses as follows:
| | | | Georgia | | | Maryland | | | Missouri | | | Virginia | |
| | | | Dividend | | | Premium | | | Premium | | | Premium | |
| | | | Advantage 2 | | | Income | | | Income | | | Income | |
| | | | (NKG | ) | | (NMY | ) | | (NOM | ) | | (NPV | ) |
Post-October capital losses6 | | $ | 944,720 | | $ | 375,356 | | $ | 71,083 | | $ | 1,057,596 | |
Late-year ordinary losses7 | | | — | | | — | | | — | | | — | |
| 6 | Capital losses incurred from November 1, 2013 through May 31, 2014, the Funds’ tax year end. |
| 7 | Ordinary losses incurred from January 1, 2014 through May 31, 2014 and specified losses incurred from November 1, 2013 through May 31, 2014. |
Notes to Financial Statements (continued)
7. Management Fees and Other Transactions with Affiliates
Each Fund’s management fee compensates the Adviser for overall investment advisory and administrative services and general office facilities. The Sub-Adviser is compensated for its services to the Funds from the management fees paid to the Adviser.
Each Fund’s management fee consists of two components – a fund-level fee, based only on the amount of assets within the Fund, and a complex-level fee, based on the aggregate amount of all eligible fund assets managed by the Adviser. This pricing structure enables Fund shareholders to benefit from growth in the assets within their respective Fund as well as from growth in the amount of complex-wide assets managed by the Adviser.
The annual fund-level fee for each Fund, payable monthly, is calculated according to the following schedules:
| | Georgia Dividend Advantage 2 (NKG) |
| Average Daily Managed Assets* | Fund-Level Fee Rate |
| For the first $125 million | .4500 | % |
| For the next $125 million | .4375 | |
| For the next $250 million | .4250 | |
| For the next $500 million | .4125 | |
| For the next $1 billion | .4000 | |
| For managed assets over $2 billion | .3750 | |
| | | |
| | North Carolina Premium Income (NNC) |
| | Maryland Premium Income (NMY) |
| | Missouri Premium Income (NOM) |
| | Virginia Premium Income (NPV) |
| Average Daily Managed Assets* | Fund-Level Fee Rate |
| For the first $125 million | .4500 | % |
| For the next $125 million | .4375 | |
| For the next $250 million | .4250 | |
| For the next $500 million | .4125 | |
| For the next $1 billion | .4000 | |
| For the next $3 billion | .3875 | |
| For managed assets over $5 billion | .3750 | |
The annual complex-level fee for each Fund, payable monthly, is calculated according to the following schedule:
| Complex-Level Managed Asset Breakpoint Level* | | Effective Rate at Breakpoint Level |
| $55 billion | | .2000 | % |
| $56 billion | | .1996 | |
| $57 billion | | .1989 | |
| $60 billion | | .1961 | |
| $63 billion | | .1931 | |
| $66 billion | | .1900 | |
| $71 billion | | .1851 | |
| $76 billion | | .1806 | |
| $80 billion | | .1773 | |
| $91 billion | | .1691 | |
| $125 billion | | .1599 | |
| $200 billion | | .1505 | |
| $250 billion | | .1469 | |
| $300 billion | | .1445 | |
| * | For the fund-level and complex-level fees, managed assets include closed-end fund assets managed by the Adviser that are attributable to certain types of leverage. For these purposes, leverage includes the funds’ use of preferred stock and borrowings and certain investments in the residual interest certificates (also called inverse floating rate securities) in tender option bond (TOB) trusts, including the portion of assets held by a TOB trust that has been effectively financed by the trust’s issuance of floating rate securities, subject to an agreement by the Adviser as to certain funds to limit the amount of such assets for determining managed assets in certain circumstances. The complex-level fee is calculated based upon the aggregate daily managed assets of all Nuveen Funds that constitute “eligible assets.” Eligible assets do not include assets attributable to investments in other Nuveen Funds or assets in excess of $2 billion added to the Nuveen Fund complex in connection with the Adviser’s assumption of the management of the former First American Funds effective January 1, 2011. As of May 31, 2014, the complex-level fee rate for each of these Funds was .1657%. |
The Funds pay no compensation directly to those of its trustees who are affiliated with the Adviser or to its officers, all of whom receive remuneration for their services to the Funds from the Adviser or its affiliates. The Board of Trustees has adopted a deferred compensation plan for independent trustees that enables trustees to elect to defer receipt of all or a portion of the annual compensation they are entitled to receive from certain Nuveen-advised funds. Under the plan, deferred amounts are treated as though equal dollar amounts had been invested in shares of select Nuveen-advised funds.
| Additional Fund Information |
| Board of Trustees | | | | | |
| William Adams IV* | Robert P. Bremner | Jack B. Evans | William C. Hunter | David J. Kundert | John K. Nelson |
| William J. Schneider | Thomas S. Schreier, Jr.* | Judith M. Stockdale | Carole E. Stone | Virginia L. Stringer | Terence J. Toth |
| | | | | | |
| * Interested Board Member. | | | | | |
| | | | | | |
| Fund Manager | Custodian | Legal Counsel | Independent Registered | Transfer Agent and |
| Nuveen Fund Advisors, LLC | State Street Bank | Chapman and Cutler LLP | Public Accounting Firm | Shareholder Services |
| 333 West Wacker Drive | & Trust Company | Chicago, IL 60603 | Ernst & Young LLP | State Street Bank |
| Chicago, IL 60606 | Boston, MA 02111 | | Chicago, IL 60606 | & Trust Company |
| | | | | Nuveen Funds |
| | | | | P.O. Box 43071 |
| | | | | Providence, RI 02940-3071 |
| | | | | (800) 257-8787 |
| | | | | |
Quarterly Form N-Q Portfolio of Investments Information
Each Fund is required to file its complete schedule of portfolio holdings with the Securities and Exchange Commission (SEC) for the first and third quarters of each fiscal year on Form N-Q. You may obtain this information directly from the SEC. Visit the SEC on-line at http://www.sec.gov or in person at the SEC’s Public Reference Room in Washington, D.C. Call the SEC toll-free at (800) SEC -0330 for room hours and operation.
Nuveen Funds’ Proxy Voting Information
You may obtain (i) information regarding how each fund voted proxies relating to portfolio securities held during the most recent twelve-month period ended June 30, without charge, upon request, by calling Nuveen Investments toll-free at (800) 257-8787 or on Nuveen’s website at www.nuveen.com and (ii) a description of the policies and procedures that each fund used to determine how to vote proxies relating to portfolio securities without charge, upon request, by calling Nuveen Investments toll free at (800) 257-8787. You may also obtain this information directly from the SEC. Visit the SEC on-line at http://www.sec.gov.
CEO Certification Disclosure
Each Fund’s Chief Executive Officer (CEO) has submitted to the New York Stock Exchange (NYSE) the annual CEO certification as required by Section 303A.12(a) of the NYSE Listed Company Manual. Each Fund has filed with the SEC the certification of its CEO and Chief Financial Officer required by Section 302 of the Sarbanes-Oxley Act.
Share Information
Each Fund intends to repurchase shares of its own common stock at such times and in such amounts as is deemed advisable. During the period covered by this report, the Fund repurchased shares of its common stock as shown in the accompanying table. Any future repurchases will be reported to shareholders in the next annual or semi-annual report.
| | NKG | | | NMY | | | NOM | | | NNC | | | NPV | |
| Shares repurchased | — | | | — | | | — | | | — | | | — | |
FINRA BrokerCheck: The Financial Industry Regulatory Authority (FINRA) provides information regarding the disciplinary history of FINRA member firms and associated investment professionals. This information as well as an investor brochure describing FINRA BrokerCheck is available to the public by calling the FINRA BrokerCheck Hotline number at (800) 289-9999 or by visiting www.FINRA.org.
Glossary of TermsUsed in this Report |
| |
| ■ | Auction Rate Bond: An auction rate bond is a security whose interest payments are adjusted periodically through an auction process, which process typically also serves as a means for buying and selling the bond. Auctions that fail to attract enough buyers for all the shares offered for sale are deemed to have “failed,” with current holders receiving a formula-based interest rate until the next scheduled auction. |
| | |
| ■ | Average Annual Total Return: This is a commonly used method to express an investment’s performance over a particular, usually multi-year time period. It expresses the return that would have been necessary each year to equal the investment’s actual cumulative performance (including change in NAV or market price and reinvested dividends and capital gains distributions, if any) over the time period being considered. |
| | |
| ■ | Duration: Duration is a measure of the expected period over which a bond’s principal and interest will be paid, and consequently is a measure of the sensitivity of a bond’s or bond fund’s value to changes when market interest rates change. Generally, the longer a bond’s or fund’s duration, the more the price of the bond or Fund will change as interest rates change. |
| | |
| ■ | Effective Leverage: Effective leverage is a fund’s effective economic leverage, and includes both regulatory leverage (see Leverage) and the leverage effects of certain derivative investments in the fund’s portfolio. Currently, the leverage effects of Tender Option Bond (TOB) inverse floater holdings are included in effective leverage values, in addition to any regulatory leverage. |
| | |
| ■ | Gross Domestic Product (GDP): The total market value of all final goods and services produced in a country/region in a given year, equal to total consumer, investment and government spending, plus the value of exports, minus the value of imports. |
| | |
| ■ | Inverse Floating Rate Securities: Inverse floating rate securities, also known as inverse floaters or tender option bonds (TOBs), are created by depositing a municipal bond, typically with a fixed interest rate, into a special purpose trust created by a broker dealer. This trust, in turn, (a) issues floating rate certificates typically paying short-term tax-exempt interest rates to third parties in amounts equal to some fraction of the deposited bond’s par amount or market value, and (b) issues an inverse floating rate certificate (sometimes referred to as an “inverse floater”) to an investor (such as a Fund) interested in gaining investment exposure to a long-term municipal bond. The income received by the holder of the inverse floater varies inversely with the short term rate paid to the floating rate certificates’ holders, and in most circumstances the holder of the inverse floater bears substantially all of the underlying bond’s downside investment risk. The holder of the inverse floater typically also benefits disproportionately from any potential appreciation of the underlying bond’s value. Hence, an inverse floater essentially represents an investment in the underlying bond on a leveraged basis. |
| | |
| ■ | Leverage: Leverage is created whenever a fund has investment exposure (both reward and/or risk) equivalent to more than 100% of the investment capital. |
| | |
| ■ | Lipper Other States Municipal Debt Funds Classification Average: Calculated using the returns of all closed-end funds in this category. Lipper returns account for the effects of management fees and assume reinvestment of distributions, but do not reflect any applicable sales charges. |
| | |
| ■ | Net Asset Value (NAV) Per Share: A fund’s Net Assets is equal to its total assets (securities, cash, accrued earnings and receivables) less its total liabilities. NAV per share is equal to the fund’s Net Assets divided by its number of shares outstanding. |
| | |
| ■ | Pre-Refunding: Pre-Refunding, also known as advanced refundings or refinancings, is a procedure used by state and local governments to refinance municipal bonds to lower interest expenses. The issuer sells new bonds with a lower yield and uses the proceeds to buy U.S. Treasury securities, the interest from which is used to make payments on the higher-yielding bonds. Because of this collateral, pre-refunding generally raises a bond’s credit rating and thus its value. |
| ■ | Regulatory Leverage: Regulatory Leverage consists of preferred shares issued by or borrowings of a fund. Both of these are part of a fund’s capital structure. Regulatory leverage is subject to asset coverage limits set in the Investment Company Act of 1940. |
| | |
| ■ | S&P Municipal Bond Georgia Index: An unleveraged, market value-weighted index designed to measure the performance of the tax-exempt, investment-grade Georgia municipal bond market. Index returns assume reinvestment of distributions, but do not reflect any applicable sales charges or management fees. |
| | |
| ■ | S&P Municipal Bond Index: An unleveraged, market value-weighted index designed to measure the performance of the tax-exempt, investment-grade U.S. municipal bond market. Index returns assume reinvestment of distributions, but do not reflect any applicable sales charges or management fees. |
| | |
| ■ | S&P Municipal Bond Maryland Index: An unleveraged, market value-weighted index designed to measure the performance of the tax-exempt, investment-grade Maryland municipal bond market. Index returns assume reinvestment of distributions, but do not reflect any applicable sales charges or management fees. |
| | |
| ■ | S&P Municipal Bond Missouri Index: An unleveraged, market value-weighted index designed to measure the performance of the tax-exempt, investment-grade Missouri municipal bond market. Index returns assume reinvestment of distributions, but do not reflect any applicable sales charges or management fees. |
| | |
| ■ | S&P Municipal Bond North Carolina Index: An unleveraged, market value-weighted index designed to measure the performance of the tax-exempt, investment-grade North Carolina municipal bond market. Index returns assume reinvestment of distributions, but do not reflect any applicable sales charges or management fees. |
| | |
| ■ | S&P Municipal Bond Virginia Index: An unleveraged, market value-weighted index designed to measure the performance of the tax-exempt, investment-grade Virginia municipal bond market. Index returns assume reinvestment of distributions, but do not reflect any applicable sales charges or management fees. |
| | |
| ■ | Total Investment Exposure: Total investment exposure is a fund’s assets managed by the Adviser that are attributable to financial leverage. For these purposes, financial leverage includes a fund’s use of preferred stock and borrowings and investments in the residual interest certificates (also called inverse floating rate securities) in tender option bond (TOB) trusts, including the portion of assets held by a TOB trust that has been effectively financed by the trust’s issuance of floating rate securities. |
| | |
| ■ | Zero Coupon Bond: A zero coupon bond does not pay a regular interest coupon to its holders during the life of the bond. Tax-exempt income to the holder of the bond comes from accretion of the difference between the original purchase price of the bond at issuance and the par value of the bond at maturity and is effectively paid at maturity. The market prices of zero coupon bonds generally are more volatile than the market prices of bonds that pays interest periodically. |
Reinvest Automatically,
Easily and Conveniently
Nuveen makes reinvesting easy. A phone call is all it takes to set up your reinvestment account.
Nuveen Closed-End Funds Automatic Reinvestment Plan
Nuveen Closed-End Fund allows you to conveniently reinvest distributions in additional Fund shares. By choosing to reinvest, you’ll be able to invest money regularly and automatically, and watch your investment grow through the power of compounding. Just like distributions in cash, there may be times when income or capital gains taxes may be payable on distributions that are reinvested. It is important to note that an automatic reinvestment plan does not ensure a profit, nor does it protect you against loss in a declining market.
Easy and convenient
To make recordkeeping easy and convenient, each month you’ll receive a statement showing your total distributions, the date of investment, the shares acquired and the price per share, and the total number of shares you own.
How shares are purchased
The shares you acquire by reinvesting will either be purchased on the open market or newly issued by the Fund. If the shares are trading at or above net asset value at the time of valuation, the Fund will issue new shares at the greater of the net asset value or 95% of the then-current market price. If the shares are trading at less than net as -set value, shares for your account will be purchased on the open market. If the Plan Agent begins purchasing Fund shares on the open market while shares are trading below net asset value, but the Fund’s shares subsequently trade at or above their net asset value before the Plan Agent is able to complete its purchases, the Plan Agent may cease open-market purchases and may invest the uninvested portion of the distribution in newly-issued Fund shares at a price equal to the greater of the shares’ net asset value or 95% of the shares’ market value on the last business day imme -diately prior to the purchase date. Distributions received to purchase shares in the open market will normally be invested shortly after the distribution payment date. No interest will be paid on distributions awaiting reinvestment. Because the market price of the shares may increase before purchases are completed, the average purchase price per share may exceed the market price at the time of valuation, resulting in the acquisition of fewer shares than if the distribution had been paid in shares issued by the Fund. A pro rata portion of any applicable brokerage commissions on open market purchases will be paid by Plan participants. These commissions usually will be lower than those charged on individual transactions.
Flexible
You may change your distribution option or withdraw from the Plan at any time, should your needs or situation change. You can reinvest whether your shares are registered in your name, or in the name of a brokerage firm, bank, or other nominee. Ask your investment advisor if his or her firm will participate on your behalf. Participants whose shares are registered in the name of one firm may not be able to transfer the shares to another firm and continue to participate in the Plan. The Fund reserves the right to amend or terminate the Plan at any time. Although the Fund reserves the right to amend the Plan to include a service charge payable by the participants, there is no direct service charge to participants in the Plan at this time.
Call today to start reinvesting distributions
For more information on the Nuveen Automatic Reinvestment Plan or to enroll in or withdraw from the Plan, speak with your financial advisor or call us at (800) 257-8787.
Board Members & Officers
The management of the Funds, including general supervision of the duties performed for the Funds by the Adviser, is the responsibility of the Board of Trustees of the Funds. The number of trustees of the Funds is currently set at twelve. None of the trustees who are not “interested” persons of the Funds (referred to herein as “independent trustees”) has ever been a director or employee of, or consultant to, Nuveen or its affiliates. The names and business addresses of the trustees and officers of the Funds, their principal occupations and other affiliations during the past five years, the number of portfolios each oversees and other directorships they hold are set forth below.
| | Name, | | Position(s) Held | | Year First | | Principal | | Number |
| | Year of Birth | | with the Funds | | Elected or | | Occupation(s) | | of Portfolios |
| | & Address | | | | Appointed | | Including other | | in Fund Complex |
| | | | | | and Term(1) | | Directorships | | Overseen by |
| | | | | | | | During Past 5 Years | | Board Member |
| | | | | | | | | | |
| Independent Board Members: | | | | | | |
| | | | | | | | | | |
| ■ | WILLIAM J. SCHNEIDER 1944 333 W. Wacker Drive Chicago, IL 60606 | | | | | | Chairman of Miller-Valentine Partners, a real estate investment company; formerly, Senior Partner and Chief Operating Officer (retired (2004) of Miller-Valentine Group; an owner in several other Miller Valentine entities; Board Member of Med-America Health System, Tech Town, Inc., a not-for-profit community development company, Board Member of WDPR Public Radio station; formerly, member, Business Advisory Council, Cleveland Federal Reserve Bank and University of Dayton Business School Advisory Council. | | 201 |
| | | | | | | | | | |
| ■ | ROBERT P. BREMNER 1940 333 W. Wacker Drive Chicago, IL 60606 | | | | | | Private Investor and Management Consultant; Treasurer and Director, Humanities Council of Washington, D.C.; Board Member, Independent Directors Council affiliated with the Investment Company Institute. Company Institute. | | |
| | | | | | | | | | |
| ■ | JACK B. EVANS 1948 333 W. Wacker Drive Chicago, IL 60606 | | | | | | President, The Hall-Perrine Foundation, a private philanthropic corporation (since 1996); Chairman, United Fire Group, a publicly held company; formerly, President Pro-Tem of the Board of Regents for the State of Iowa University System; Director, Source Media Group; Life Trustee of Coe College; formerly, Director, Alliant Energy; formerly, Director, Federal Reserve Bank of Chicago; formerly, President and Chief Operating Officer, SCI Financial Group, Inc., a regional financial services firm. | | |
| | | | | | | | | | |
| ■ | WILLIAM C. HUNTER 1948 333 W. Wacker Drive Chicago, IL 60606 | | | | | | Dean Emeritus (since June 30, 2012), formerly, Dean, Tippie College of Business, University of Iowa (2006-2012); Director (since 2004) of Xerox Corporation; Director (since 2005), and President (since July 2012) Beta Gamma Sigma, Inc., The International Honor Society; Director of Wellmark, Inc. (since 2009); formerly, Dean and Distinguished Professor of Finance, School of Business at the University of Connecticut (2003-2006); previously, Senior Vice President and Director of Research at the Federal Reserve Bank of Chicago (1995-2003); formerly, Director (1997-2007), Credit Research Center at Georgetown University. | | |
| | | | | | | | | | |
| ■ | DAVID J. KUNDERT 1942 333 W. Wacker Drive Chicago, IL 60606 | | Board Member | | 2005 Class II | | Formerly, Director, Northwestern Mutual Wealth Management Company (2006-2013), retired (since 2004) as Chairman, JPMorgan Fleming Asset Management, President and CEO, Banc One Investment Advisors Corporation, and President, One Group Mutual Funds; prior thereto, Executive Vice President, Banc One Corporation and Chairman and CEO, Banc One Investment Management Group; Regent Emeritus, Member of Investment Committee, Luther College; member of the Wisconsin Bar Association; member of Board of Directors, Friends of Boerner Botanical Gardens; member of Board of Directors and Chair of Investment Committee, Greater Milwaukee Foundation; member of the Board of Directors (Milwaukee), College Possible. | | 201 |
Board Members & Officers (continued)
| | Name, | | Position(s) Held | | Year First | | Principal | | Number |
| | Year of Birth | | with the Funds | | Elected or | | Occupation(s) | | of Portfolios |
| | & Address | | | | Appointed | | Including other | | in Fund Complex |
| | | | | | and Term(1) | | Directorships | | Overseen by |
| | | | | | | | During Past 5 Years | | Board Member |
| | | | | | | | | | |
| Independent Board Members (continued): | | | | | | |
| | | | | | | | | | |
| ■ | 1962 333 West Wacker Drive Chicago, IL 60606 | | Board Member | | 2013 Class II | | Senior external advisor to the financial services practice of Deloitte Consulting LLP (since 2012); Member of Board of Directors of Core12 LLC since 2008), a private firm which develops branding, marketing and communications strategies for clients; Director of The Curran Center for Catholic American Studies (since 2009) and The President’s Council, Fordham University (since 2010); formerly, Chairman of the Board of Trustees of Marian University (2010 as trustee, 2011-2014 as Chairman); formerly, Chief Executive Officer of ABN AMRO N.V. North America, and Global Head of its Financial Markets Division (2007-2008); prior senior positions held at ABN AMRO include Corporate Executive Vice President and Head of Global Markets-the Americas (2006-2007), CEO of Wholesale Banking North America and Global Head of Foreign Exchange and Futures Markets (2001-2006), and Regional Commercial Treasurer and Senior Vice President Trading-North America (1996-2001); formerly, Trustee at St. Edmund Preparatory School in New York City. | | 201 |
| | | | | | | | | | |
| ■ | JUDITH M. STOCKDALE 1947 333 W. Wacker Drive Chicago, IL 60606 | | Board Member | | 1997 Class I | | Board Member, Land Trust Alliance (since June 2013) and U.S. Endowment for Forestry and Communities (since November 2013); formerly, Executive Director (1994-2012), Gaylord and Dorothy Donnelley Foundation (since 1994); prior thereto, Executive Director, Great Lakes Protection Fund (1990-1994). | | 201 |
| | | | | | | | | | |
| ■ | 1947 333 W. Wacker Drive Chicago, IL 60606 | | Board Member | | 2007 Class I | | Director, Chicago Board Options Exchange (since 2006); Director, C2 Options Exchange, Incorporated (since 2009); Director, CBOE Holdings, Inc. (since 2010); formerly, Commissioner, New York State Commission on Public Authority Reform (2005-2010); formerly, Chair, New York Racing Association Oversight Board (2005-2007). | | 201 |
| | | | | | | | | | |
| ■ | 1944 333 W. Wacker Drive Chicago, IL 60606 | | Board Member | | 2011 Class I | | Board Member, Mutual Fund Directors Forum; former governance consultant and non-profit board member; former Owner and President, Strategic Management Resources, Inc., a management consulting firm; former Member, Governing Board, Investment Company Institute’s Independent Directors Council; previously, held several executive positions in general management, marketing and human resources at IBM and The Pillsbury Company; Independent Director, First American Fund Complex (1987-2010) and Chair (1997-2010). | | 201 |
| | | | | | | | | | |
| ■ | 333 W. Wacker Drive Chicago, IL 60606 | | Board Member | | 2008 Class II | | Managing Partner, Promus Capital (since 2008); Director, Fulcrum IT Service LLC (since 2010), Quality Control Corporation (since 2012) and LogicMark LLC (since 2012); formerly, Director, Legal & General Investment Management America, Inc. (2008-2013); formerly, CEO and President, Northern Trust Global Investments (2004-2007); Executive Vice President, Quantitative Management & Securities Lending (2000-2004); prior thereto, various positions with Northern Trust Company (since 1994); member: Chicago Fellowship Board (since 2005), Catalyst Schools of Chicago Board (since 2008) and Chairman, and Mather Foundation Board (since 2012), and a member of its investment committee; formerly, Member, Northern Trust Mutual Funds Board (2005-2007), Northern Trust Global Investments Board (2004-2007), Northern Trust Japan Board (2004-2007), Northern Trust Securities Inc. Board (2003-2007) and Northern Trust Hong Kong Board (1997-2004). | | 201 |
| | Name, | | Position(s) Held | | Year First | | Principal | | Number |
| | Year of Birth | | with the Funds | | Elected or | | Occupation(s) | | of Portfolios |
| | & Address | | | | Appointed | | Including other | | in Fund Complex |
| | | | | | and Term(1) | | Directorships | | Overseen by |
| | | | | | | | During Past 5 Years | | Board Member |
| | | | | | | | | | |
| Interested Board Members: | | | | | | |
| | | | | | | | | | |
| ■ | 333 W. Wacker Drive Chicago, IL 60606 | | Board Member | | 2013 Class II | | Senior Executive Vice President, Global Structured Products (since 2010); formerly, Executive Vice President, U.S. Structured Products, of Nuveen Investments, Inc. (1999-2010); Co-President of Nuveen Fund Advisors, LLC (since 2011); President (since 2011), formerly, Managing Director (2010-2011) of Nuveen Commodities Asset Management, LLC; Board Member of the Chicago Symphony Orchestra and of Gilda s Club Chicago. | | 125 |
| | | | | | | | | | |
| ■ | THOMAS S. SCHREIER, JR.(2) 1962333 W. Wacker Drive Chicago, IL 60606 | Board Member | | 2013 Class III | | Vice Chairman, Wealth Management of Nuveen Investments, Inc. (since 2011); Co-President of Nuveen Fund Advisors, LLC; Chairman of Nuveen Asset Management, LLC (since 2011); Co-Chief Executive Officer of Nuveen Securities, LLC (since 2011); Member of Board of Governors and Chairman’s Council of the Investment Company Institute; formerly, Chief Executive Officer (2000-2010) and Chief Investment Officer (2007-2010) of FAF Advisors, Inc.; formerly, President of First American Funds (2001-2010). | | 125 |
| | | | | | | | | | |
| | Name, | | Position(s) Held | | Year First | | Principal | | Number |
| | Year of Birth | | with the Funds | | Elected or | | Occupation(s) | | of Portfolios |
| | & Address | | | | Appointed(3) | | During Past 5 Years | | in Fund Complex |
| | | | | | | | | | Overseen |
| | | | | | | | | | by Officer |
| | | | | | | | | | |
| Officers of the Funds: | | | | | | | | |
| | | | | | | | | | |
| ■ | 333 W. Wacker Drive Chicago, IL 60606 | | Chief Administrative Officer | | 1988 | | Managing Director (since 2002), and Assistant Secretary of Nuveen Securities, LLC; Managing Director (since 2004) and Assistant Secretary (since 1994) of Nuveen Investments, Inc.; Managing Director (since 2002), Assistant Secretary (since 1997) and Co-General Counsel (since 2011) of Nuveen Fund Advisors, LLC; Managing Director, Assistant Secretary and Associate General Counsel of Nuveen Asset Management, LLC (since 2011); Managing Director, Associate General Counsel and Assistant Secretary, of Symphony Asset Management LLC (since 2003); Vice President and Assistant Secretary of NWQ Investment Management Company, LLC (since 2002), Nuveen Investments Advisers Inc. (since 2002), Santa Barbara Asset Management, LLC (since 2006), and of Winslow Capital Management, LLC, (since 2010); Vice President and Assistant Secretary (since 2013), formerly, Chief Administrative Officer and Chief Compliance Officer (2006-2013) of Nuveen Commodities Asset Management, LLC; Chartered Financial Analyst. | | 201 |
| | | | | | | | | | |
| ■ | CEDRIC H. ANTOSIEWICZ 1962333 W. Wacker Drive Chicago, IL 60606 | | Vice President | | 2007 | | Managing Director of Nuveen Securities, LLC. | | 93 |
| | | | | | | | | | |
| ■ | MARGO L. COOK 1964 333 W. Wacker Drive Chicago, IL 60606 | | Vice President | | 2009 | | Executive Vice President (since 2008) of Nuveen Investments, Inc. and of Nuveen Fund Advisors, LLC (since 2011); Managing Director-Investment Services of Nuveen Commodities Asset Management, LLC (since August 2011), previously, Head of Institutional Asset Management (2007-2008) of Bear Stearns Asset Management; Head of Institutional Asset Management (1986-2007) of Bank of NY Mellon; Chartered Financial Analyst. | | 201 |
Board Members & Officers (continued)
| | Name, | | Position(s) Held | | Year First | | Principal | | Number |
| | Year of Birth | | with the Funds | | Elected or | | Occupation(s) | | of Portfolios |
| | & Address | | | | Appointed(3) | | During Past 5 Years | | in Fund Complex |
| | | | | | | | | | Overseen |
| | | | | | | | | | by Officer |
| | | | | | | | | | |
| Officers of the Funds (continued): | | | | | | |
| | | | | | | | | | |
| | | | | | | | | | |
| ■ | 333 W. Wacker Drive Chicago, IL 60606 | | Vice President | | 1998 | | Managing Director (since 2005) of Nuveen Fund Advisors, LLC and Nuveen Securities, LLC (since 2004). | | 201 |
| | | | | | | | | | |
| ■ | 333 W. Wacker Drive Chicago, IL 60606 | | Vice President and Controller | | 1998 | | Managing Director (since 2014), formerly, Senior Vice President (2013-2014), and Vice President of Nuveen Fund Advisors, LLC; Chief Financial Officer of Nuveen Commodities Asset Management, LLC (since 2010); Senior Vice President (2010-2011), Formerly Vice President (2005-2010) and Funds Controller of Nuveen Securities, LLC; Certified Public Accountant. | | 201 |
| | | | | | | | | | |
| ■ | 333 W. Wacker Drive Chicago, IL 60606 | | Vice President and Treasurer | | 2009 | | Managing Director, Corporate Finance & Development, Treasurer (since 2009) of Nuveen Securities, LLC; Managing Director and Treasurer (since 2009) of Nuveen Fund Advisors, LLC, Nuveen Investments Advisers, Inc., Nuveen Investments Holdings Inc. and (since 2011) Nuveen Asset Management, LLC; Vice President and Treasurer of NWQ Investment Management Company, LLC, Tradewinds Global Investors, LLC, Symphony Asset Management LLC and Winslow Capital Management, LLC.; Vice President of Santa Barbara Asset Management, LLC; formerly, Treasurer (2006-2009), Senior Vice President (2008-2009), previously, Vice President (2006-2008) of Janus Capital Group, Inc.; formerly, Senior Associate in Morgan Stanley’s Global Financial Services Group (2000-2003); Chartered Accountant Designation. | | 201 |
| | | | | | | | | | |
| ■ | 333 W. Wacker Drive Chicago, IL 60606 | | Chief Compliance Officer and Vice President | | 2003 | | Senior Vice President (since 2008) of Nuveen Investment Holdings, Inc. | | 201 |
| | | | | | | | | | |
| ■ | 333 W. Wacker Drive Chicago, IL 60606 | | Vice President | | 2002 | | Senior Vice President of Nuveen Investment Holdings, Inc. | | 201 |
| | | | | | | | | | |
| ■ | KEVIN J. MCCARTHY 1966 333 W. Wacker Drive Chicago, IL 60606 | | Vice President | | | | Managing Director and Assistant Secretary (since 2008), Nuveen Securities, LLC; Managing Director (since 2008), Assistant Secretary since 2007) and Co-General Counsel (since 2011) of Nuveen Fund Advisors, LLC; Managing Director, Assistant Secretary and Associate General Counsel (since 2011) of Nuveen Asset Management, LLC; Managing Director (since 2008), and Assistant Secretary, Nuveen Investment Holdings, Inc.; Vice President (since 2007) and Assistant Secretary of Nuveen Investments Advisers Inc., NWQ Investment Management Company, LLC, NWQ Holdings, LLC, Symphony Asset Management LLC, Santa Barbara Asset Management, LLC, and of Winslow Capital Management, LLC. (since 2010); Vice President and Secretary (since 2010) of Nuveen Commodities Asset Management, LLC. | | |
| | Name, | | Position(s) Held | | Year First | | Principal | | Number |
| | Year of Birth | | with the Funds | | Elected or | | Occupation(s) | | of Portfolios |
| | & Address | | | | Appointed(3) | | During Past 5 Years | | in Fund Complex |
| | | | | | | | | | Overseen |
| | | | | | | | | | by Officer |
| | | | | | | | | | |
| Officers of the Funds (continued): | | | | | | |
| | | | | | | | | | |
| ■ | KATHLEEN L. PRUDHOMME 1953 901 Marquette Avenue Minneapolis, MN 55402 | | Vice President and Assistant Secretary | | | | Managing Director, Assistant Secretary and Co-General Counsel (since 2011) of Nuveen Fund Advisors, LLC; Managing Director, Assistant Secretary and Associate General Counsel (since 2011) of Nuveen Asset Management, LLC; Managing Director and Assistant Secretary (since 2011) of Nuveen Securities, LLC; formerly, Deputy General Counsel, FAF Advisors, Inc. (2004-2010). | | |
| | | | | | | | | | |
| ■ | JOEL T. SLAGER | | | | | | Fund Tax Director for Nuveen Funds (since May, 2013); previously, Vice President of Morgan Stanley Investment Management, Inc., Assistant Treasurer of the Morgan Stanley Funds (from 2010 to 2013); Tax Director at PricewaterhouseCoopers LLP (from 2008 to 2010). | | |
| | 1978 333 West Wacker Drive Chicago, IL 60606 | | Vice President and Assistant Secretary | | 2013 | | | 201 |
| (1) | Board Members serve three year terms, except for two board members who are elected by the holders of Preferred Shares. The Board of Trustees is divided into three classes, Class I, Class II, and Class III, with each being elected to serve until the third succeeding annual shareholders’ meeting subsequent to its election or thereafter in each case when its respective successors are duly elected or appointed, except two board members are elected by the holders of Preferred Shares to serve until the next annual shareholders’ meeting subsequent to its election or thereafter in each case when its respective successors are duly elected or appointed. The first year elected or appointed represents the year in which the board member was first elected or appointed to any fund in the Nuveen Complex. |
| (2) | “Interested person” as defined in the 1940 Act, by reason of his position with Nuveen Investments, Inc. and certain of its subsidiaries, which are affiliates of the Nuveen Funds. |
| (3) | Officers serve one year terms through August of each year. The year first elected or appointed represents the year in which the Officer was first elected or appointed to any fund in the Nuveen Complex. |
Annual Investment Management
Agreement Approval Process (Unaudited)
I. The Approval Process
The Board of Trustees of each Fund (each, a “Board” and each Trustee, a “Board Member”), including the Board Members who are not parties to the Funds’ advisory or sub-advisory agreements or “interested persons” of any such parties (the “Independent Board Members”), is responsible for overseeing the performance of the investment adviser and the sub-adviser to the respective Fund and determining whether to approve or continue such Fund’s advisory agreement (each, an “Original Investment Management Agreement”) between the Fund and Nuveen Fund Advisors, LLC (the “Adviser”) and sub-advisory agreement (each, an “Original Sub-Advisory Agreement” and, together with the Original Investment Management Agreement, the “Original Advisory Agreements”) between the Adviser and Nuveen Asset Management, LLC (the “Sub-Adviser”). Pursuant to the Investment Company Act of 1940, as amended (the “1940 Act”), each Board is required to consider the continuation of the respective Original Advisory Agreements on an annual basis. In addition, prior to its annual review, the Board Members were advised of the potential acquisition of Nuveen Investments, Inc. (“Nuveen”) by TIAA-CREF (the “Transaction”). For purposes of this section, references to “Nuveen” herein include all affiliates of Nuveen Investments, Inc. providing advisory, sub-advisory, distribution or other services to the Funds and references to the “Board” refer to the Board of each Fund. In accordance with the 1940 Act and the terms of the Original Advisory Agreements, the completion of the Transaction would terminate each of the Original Investment Management Agreements and the Original Sub-Advisory Agreements. Accordingly, at an in-person meeting held on April 30, 2014 (the “April Meeting”), the Board, including all of the Independent Board Members, performed its annual review of the Original Advisory Agreements and approved the continuation of the Original Advisory Agreements for the Funds. Furthermore, in anticipation of the termination of the Original Advisory Agreements that would occur upon the consummation of the Transaction, the Board also approved for each Fund a new advisory agreement (each, a “New Investment Management Agreement”) between the Fund and the Adviser and a new sub-advisory agreement (each, a “New Sub-Advisory Agreement” and, together with the New Investment Management Agreement, the “New Advisory Agreements”) between the Adviser and the Sub-Adviser, each on behalf of the respective Fund to be effective following the completion of the Transaction and the receipt of the requisite shareholder approval.
Leading up to the April Meeting, the Independent Board Members had several meetings and deliberations, with and without management from Nuveen present and with the advice of legal counsel, regarding the Original Advisory Agreements, the Transaction and its impact and the New Advisory Agreements. At its meeting held on February 25-27, 2014 (the “February Meeting”), the Board Members met with a senior executive representative of TIAA-CREF to discuss the proposed Transaction. At the February Meeting, the Independent Board Members also established an ad hoc committee comprised solely of the Independent Board Members to monitor and evaluate the Transaction and to keep the Independent Board Members updated with developments regarding the Transaction. On March 20, 2014, the ad hoc committee met telephonically to discuss with management of Nuveen, and separately with independent legal counsel, the terms of the proposed Transaction and its impact on, among other things: the governance structure of Nuveen; the strategic plans for Nuveen; the operations of the Nuveen funds (which include the Funds); the quality or level of services provided to the Nuveen funds; key personnel that service the Nuveen funds and/or the Board and the compensation or incentive arrangements to retain such personnel; Nuveen’s capital structure; the regulatory requirements applicable to Nuveen or fund operations; and the Nuveen funds’ fees and expenses, including the funds’ complex-wide fee arrangement. Following the meeting of the ad hoc committee, the Board met in person (two Independent Board Members participating telephonically) in an executive session on March 26, 2014 to further discuss the proposed Transaction. At the executive session, the Board met privately with independent legal counsel to review its duties with respect to reviewing advisory agreements, particularly in the context of a change of control, and to evaluate further the Transaction and its impact on the Nuveen funds, the Adviser and the Sub-Adviser (collectively, the “Fund Advisers” and each, a “Fund Adviser”) and the services provided. Representatives of Nuveen also met with the Board to update the Board Members on developments regarding the
Transaction, to respond to questions and to discuss, among other things: the governance of the Fund Advisers following the Transaction; the background, culture (including with respect to regulatory and compliance matters) and resources of TIAA-CREF; the general plans and intentions of TIAA-CREF for Nuveen; the terms and conditions of the Transaction (including financing terms); any benefits or detriments the Transaction may impose on the Nuveen funds, TIAA-CREF or the Fund Advisers; the reaction from the Fund Advisers’ employees knowledgeable of the Transaction; the incentive and retention plans for key personnel of the Fund Advisers; the potential access to additional distribution platforms and economies of scale; and the impact of any additional regulatory schemes that may be applicable to the Nuveen funds given the banking and insurance businesses operated in the TIAA-CREF enterprise. As part of its review, the Board also held a separate meeting on April 15-16, 2014 to review the Nuveen funds’ investment performance and consider an analysis provided by the Adviser of each sub-adviser of the Nuveen funds (including the Sub-Adviser) and the Transaction and its implications to the Nuveen funds. During their review of the materials and discussions, the Independent Board Members presented the Adviser with questions and the Adviser responded. Further, the Independent Board Members met in an executive session with independent legal counsel on April 29, 2014 and April 30, 2014.
In connection with their review of the Original Advisory Agreements and the New Advisory Agreements, the Independent Board Members received extensive information regarding the Funds and the Fund Advisers including, among other things: the nature, extent and quality of services provided by each Fund Adviser; the organization and operations of any Fund Adviser; the expertise and background of relevant personnel of each Fund Adviser; a review of each Fund’s performance (including performance comparisons against the performance of peer groups and appropriate benchmarks); a comparison of Fund fees and expenses relative to peers; a description and assessment of shareholder service levels for the Funds; a summary of the performance of certain service providers; a review of fund initiatives and shareholder communications; and an analysis of the Adviser’s profitability with comparisons to peers in the managed fund business. In light of the proposed Transaction, the Independent Board Members, through their independent legal counsel, also requested in writing and received additional information regarding the proposed Transaction and its impact on the provision of services by the Fund Advisers.
The Independent Board Members received, well in advance of the April Meeting, materials which responded to the request for information regarding the Transaction and its impact on Nuveen and the Nuveen funds including, among other things: the structure and terms of the Transaction; the impact of the Transaction on Nuveen, its operations and the nature, quality and level of services provided to the Nuveen funds, including, in particular, any changes to those services that the Nuveen funds may experience following the Transaction; the strategic plan for Nuveen, including any financing arrangements following the Transaction and any cost-cutting efforts that may impact services; the organizational structure of TIAA-CREF, including the governance structure of Nuveen following the Transaction; any anticipated effect on each Nuveen fund’s expense ratios (including changes to advisory and sub-advisory fees) and economies of scale that may be expected; any benefits or conflicts of interest that TIAA-CREF, Nuveen or their affiliates can expect from the Transaction; any benefits or undue burdens or other negative implications that may be imposed on the Nuveen funds as a result of the Transaction; the impact on Nuveen or the Nuveen funds as a result of being subject to additional regulatory schemes that TIAA-CREF must comply with in operating its various businesses; and the costs associated with obtaining necessary shareholder approvals and the bearer of such costs. The Independent Board Members also received a memorandum describing the applicable laws, regulations and duties in approving advisory contracts, including in conjunction with a change of control, from their independent legal counsel.
The materials and information prepared in connection with the review of the Original Advisory Agreements and New Advisory Agreements supplemented the information and analysis provided to the Board during the year. In this regard, throughout the year, the Board, acting directly or through its committees, regularly reviewed the performance and various services provided by the Adviser and Sub-Adviser. The Board met at least quarterly as well as at other times as the need arose. At its quarterly meetings, the Board reviewed reports by the Adviser regarding, among other things, fund performance, fund expenses, premium and discount levels of closed-end funds, the performance of the investment teams and compliance, regulatory and risk management matters. In addition to regular reports, the Adviser provided special reports to the Board or a committee thereof from time to time to enhance the Board’s understanding of various topics that impact some or all the Nuveen funds (such as distribution channels, oversight of
Annual Investment Management Agreement Approval Process (Unaudited) (continued)
omnibus accounts and leverage management topics), to update the Board on regulatory developments impacting the investment company industry or to update the Board on the business plans or other matters impacting the Adviser. The Board also met with key investment personnel managing certain Nuveen fund portfolios during the year.
In addition, the Board has created several standing committees (the Executive Committee; the Dividend Committee; the Audit Committee; the Compliance, Risk Management and Regulatory Oversight Committee; the Nominating and Governance Committee; the Open-End Funds Committee; and the Closed-End Funds Committee). The Open-End Funds Committee and Closed-End Funds Committee are intended to assist the full Board in monitoring and gaining a deeper insight into the distinctive business practices of closed-end and open-end funds. These two Committees have met prior to each quarterly Board meeting, and the Adviser provided presentations to these Committees permitting them to delve further into specific matters or initiatives impacting the respective product line.
Further, the Board continued its program of seeking to have the Board Members or a subset thereof visit each sub-adviser to the Nuveen funds and meet key investment and business personnel at least once over a multiple year rotation. In this regard, the Independent Board Members made site visits to certain equity and fixed income teams of the Sub-Adviser in September 2013 and met with the Sub-Adviser’s municipal team at the August and November 2013 quarterly meetings.
The Board considered the information provided and knowledge gained at these meetings and visits during the year when performing its annual review of the Original Advisory Agreements and its review of the New Advisory Agreements. The Independent Board Members also were assisted throughout the process by independent legal counsel. During the course of the year and during their deliberations regarding the review of advisory contracts, the Independent Board Members met with independent legal counsel in executive sessions without management present. In addition, it is important to recognize that the management arrangements for the funds are the result of many years of review and discussion between the Independent Board Members and Nuveen fund management and that the Board Members’ conclusions may be based, in part, on their consideration of fee arrangements and other factors developed in previous years.
The Board considered all factors it believed relevant with respect to each Fund, including, among other things: (a) the nature, extent and quality of the services provided by the Fund Advisers, (b) the investment performance of the Fund and the Fund Advisers, (c) the advisory fees and costs of the services to be provided to the Fund and the profitability of the Fund Advisers, (d) the extent of any economies of scale, (e) any benefits derived by the Fund Advisers from the relationship with the Fund and (f) other factors. With respect to the New Advisory Agreements, the Board also considered the Transaction and its impact on the foregoing factors. Each Board Member may have accorded different weight to the various factors in reaching his or her conclusions with respect to a Fund’s Original Advisory Agreements and New Advisory Agreements. The Independent Board Members did not identify any single factor as all-important or controlling. The Independent Board Members’ considerations were instead based on a comprehensive consideration of all the information presented. The principal factors considered by the Board and its conclusions are described below.
A. Nature, Extent and Quality of Services
1. The Original Advisory Agreements
In considering renewal of each Original Advisory Agreement, the Independent Board Members considered the nature, extent and quality of the respective Fund Adviser’s services, including portfolio management services (and the resulting Fund performance) and administrative services. The Independent Board Members further considered the overall reputation and capabilities of the Adviser and its affiliates, the commitment of the Adviser to provide high quality service to the Funds, their overall confidence in the capability and integrity of the Adviser and its staff and the Adviser’s responsiveness to questions and concerns raised by them. The Independent Board Members reviewed materials outlining, among other things: each Fund Adviser’s organization and business; the types of services that each Fund Adviser or its affiliates provide to each Fund; the performance record of each Fund (as described in further detail below); and any initiatives Nuveen had taken for the closed-end fund product line.
In considering the services provided by the Fund Advisers, the Board recognized that the Adviser provides a myriad of investment management, administrative, compliance, oversight and other services for the Funds, and the Sub-Adviser generally provides the portfolio advisory services to the Funds under the oversight of the Adviser. The Board considered the wide range of services provided by the Adviser to the Nuveen funds beginning with developing the fund and monitoring and analyzing its performance to providing or overseeing the services necessary to support a fund’s daily operations. The Board recognized the Adviser, among other things, provides: (a) product management (such as analyzing ways to better position a fund in the marketplace, maintaining relationships to gain access to distribution platforms and setting dividends); (b) fund administration (such as preparing a fund’s tax returns, regulatory filings and shareholder communications; managing fund budgets and expenses; overseeing a fund’s various service providers; and supporting and analyzing new and existing funds); (c) Board administration (such as supporting the Board and its committees, in relevant part, by organizing and administering the Board and committee meetings and preparing the necessary reports to assist the Board in its duties); (d) compliance (such as monitoring adherence to a fund’s investment policies and procedures and applicable law; reviewing the compliance program periodically and developing new policies or updating existing compliance policies and procedures as considered necessary or appropriate; responding to regulatory requests; and overseeing compliance testing of sub-advisers); (e) legal support (such as preparing or reviewing fund registration statements, proxy statements and other necessary materials; interpreting regulatory requirements and compliance thereof; and maintaining applicable registrations); and (f) investment services (such as overseeing and reviewing sub-advisers and their investment teams; analyzing performance of the funds; overseeing investment and risk management; overseeing the daily valuation process for portfolio securities and developing and recommending valuation policies and methodologies and changes thereto; and participating in fund development, leverage management and the development of investment policies and parameters). With respect to closed-end funds, the Adviser also monitors asset coverage levels on leveraged funds, manages leverage, negotiates the terms of leverage, evaluates alternative forms and types of leverage, promotes an orderly secondary market for common shares and maintains an asset maintenance system for compliance with certain rating agency criteria.
In its review, the Board also considered the new services, initiatives or other changes adopted since the last advisory contract review that were designed to enhance the services and support the Adviser provides to the Nuveen funds. The Board recognized that some initiatives are a multi-year process. In reviewing the activities of 2013, the Board recognized that the year reflected the Adviser’s continued focus on fund rationalization for both closed-end and open-end funds, consolidating certain funds through mergers that were designed to improve efficiencies and economies of scale for shareholders, repositioning various funds through updates in their investment policies and guidelines with the expectation of bringing greater value to shareholders, and liquidating certain funds. As in the past, the Board recognized the Adviser’s significant investment in its technology initiatives, including the continued progress toward a central repository for fund and other Nuveen product data and implementing a data system to support the risk oversight group enabling it to provide more detailed risk analysis for the Nuveen funds. The Board noted the new data system has permitted more in-depth analysis of the investment risks of the Funds and across the complex providing additional feedback and insights to the investment teams and more comprehensive risk reporting to the Board. The Adviser also conducted several workshops for the Board regarding the new data system, including explaining the risk measures being applied and their purpose. The Board also recognized the enhancements in the valuation group within the Adviser, including centralizing the fund pricing process within the valuation group, trending to more automated and expedient reviews and continuing to expand its valuation team. The Board further considered the expansion of personnel in the compliance department enhancing the collective expertise of the group, investments in additional compliance systems and the updates of various compliance policies.
In addition to the foregoing actions, the Board also considered other initiatives related to the closed-end funds, including the continued investment of considerable resources and personnel dedicated to managing and overseeing the various forms of leverage utilized by certain funds. The Board recognized the results of these efforts included the development of less expensive forms of leverage, expansion of leverage providers, the negotiation of more favorable terms for existing leverage, the enhanced ability to respond to market and regulatory developments and the enhancements to technology systems to manage
Annual Investment Management Agreement Approval Process (Unaudited) (continued)
and track the various forms of leverage. The Board also noted Nuveen’s continued capital management services, including executing share repurchase programs, its implementation of data systems that permit more targeted solicitation strategies for fund mergers and more targeted marketing and promotional efforts and its continued focus and efforts to address the discounts of various funds. The Board further noted Nuveen’s continued commitment to supporting the secondary market for the common shares of its closed-end funds through a comprehensive communication program designed to further educate the investor and analyst about closed-end funds. Nuveen’s support services included, among other things, maintaining and enhancing a closed-end fund website, creating marketing campaigns and educational materials, communicating with financial advisers, sponsoring and participating in conferences, providing educational seminars and programs and evaluating the results of these marketing efforts.
As noted, the Adviser also oversees the Sub-Adviser who provides the portfolio advisory services to the Funds. In reviewing the portfolio advisory services provided to each Fund, the Nuveen Investment Services Oversight Team of the Adviser analyzes the performance of the Sub-Adviser and may recommend changes to the investment team or investment strategies as appropriate. In assisting the Board’s review of the Sub-Adviser, the Adviser provides a report analyzing, among other things, the Sub-Adviser’s investment team and changes thereto, organization and history, assets under management, the investment team’s philosophy and strategies in managing each Fund, developments affecting the Sub-Adviser or the Funds and their performance. In their review of the Sub-Adviser, the Independent Board Members considered, among other things, the experience and qualifications of the relevant investment personnel, their investment philosophy and strategies, the Sub-Adviser’s organization and stability, its capabilities and any initiatives taken or planned to enhance its current capabilities or support potential growth of business and, as outlined in further detail below, the performance of the Funds. The Independent Board Members also reviewed portfolio manager compensation arrangements to evaluate each Fund Adviser’s ability to attract and retain high quality investment personnel, preserve stability, and reward performance while not providing an inappropriate incentive to take undue risks.
Given the importance of compliance, the Independent Board Members also considered Nuveen’s compliance program, including the report of the chief compliance officer regarding the Nuveen funds’ compliance policies and procedures; the resources dedicated to compliance; the record of compliance with the policies and procedures; and Nuveen’s supervision of the Funds’ service providers. The Board recognized Nuveen’s commitment to compliance and strong commitment to a culture of compliance. Given the Adviser’s emphasis on monitoring investment risk, the Board has also appointed two Independent Board Members as point persons to review and keep the Board apprised of developments in this area and work with applicable Fund Adviser personnel.
Based on their review, the Independent Board Members found that, overall, the nature, extent and quality of services provided to each Fund under the respective Original Advisory Agreement were satisfactory.
2. The New Advisory Agreements
In evaluating the nature, quality and extent of the services expected to be provided by the Fund Advisers under the New Investment Management Agreements and the New Sub-Advisory Agreements, the Board Members concluded that no diminution in the nature, quality and extent of services provided to each Fund and its shareholders by the respective Fund Advisers is expected as a result of the Transaction. In making their determination, the Independent Board Members considered, among other things: the expected impact, if any, of the Transaction on the operations, facilities, organization and personnel of each Fund Adviser; the ability of each Fund Adviser to perform its duties after the Transaction, including any changes to the level or quality of services provided to the Funds; the potential implications of any additional regulatory requirements imposed on the Fund Advisers or the Nuveen funds following the Transaction; and any anticipated changes to the investment and other practices of the Nuveen funds.
The Board noted that the terms of each New Investment Management Agreement, including the fees payable thereunder, are substantially identical to those of the Original Investment Management Agreement relating to the same Fund. Similarly, the terms of each New Sub-Advisory Agreement, including fees payable thereunder, are substantially identical to those of the Original Sub-Advisory Agreement relating to the same Fund. The Board considered that the services to be provided and the standard of care
under the New Investment Management Agreements and the New Sub-Advisory Agreements are the same as the corresponding original agreements. The Board Members noted the Transaction also does not alter the allocation of responsibilities between the Adviser and the Sub-Adviser. The Sub-Adviser will continue to furnish an investment program, make investment decisions and place all orders for the purchase and sale of securities, all on behalf of each Fund and subject to oversight of the Board and the Adviser. The Board noted that TIAA-CREF did not anticipate any material changes to the advisory, sub-advisory or other services provided to the Nuveen funds as a result of the Transaction. The Independent Board Members recognized that there were not any planned “cost cutting” measures that could be expected to reduce the nature, extent or quality of services. The Independent Board Members further noted that there were currently no plans for material changes to senior personnel at Nuveen or key personnel who provide services to the Nuveen funds and the Board following the Transaction. The key personnel who have responsibility for the Nuveen funds in each area, including portfolio management, investment oversight, fund management, fund operations, product management, legal/compliance and board support functions, are expected to be the same following the Transaction, although such personnel may have additional reporting requirements to TIAA-CREF. The Board also considered the anticipated incentive plans designed to retain such key personnel. Notwithstanding the foregoing, the Board Members recognized that personnel changes may occur in the future as a result of normal business developments or personal career decisions.
The Board Members also considered Nuveen’s proposed governance structure following the Transaction and noted that Nuveen was expected to remain a stand-alone business within the TIAA-CREF enterprise and operate relatively autonomously from the other TIAA-CREF businesses, but would receive the general support and oversight from certain TIAA-CREF functional groups (such as legal, finance, internal audit, compliance, and risk management groups). The Board recognized, however, that Nuveen may be subject to additional reporting requirements as it keeps TIAA-CREF abreast of developments affecting the Nuveen business, may be required to modify certain of its reports, policies and procedures as necessary to conform to the practices followed in the TIAA-CREF enterprise and may need to collaborate with TIAA-CREF with respect to strategic planning for its business.
In considering the implications of the Transaction, the Board Members also recognized the reputation and size of TIAA-CREF and the benefits that the Transaction may bring to the Nuveen funds and Nuveen. In this regard, the Board recognized, among other things, that the increased resources and support that may be available to Nuveen from TIAA-CREF and the improved capital structure of Nuveen Investments, Inc. (the parent of the Adviser) that would result from the significant reduction in its debt level may reinforce and enhance Nuveen’s ability to provide quality services to the Nuveen funds and to invest further into its infrastructure.
Further, with the consummation of the Transaction, the Board recognized the enhanced distribution capabilities for the Nuveen funds as the funds may gain access to TIAA-CREF’s distribution network, particularly through TIAA-CREF’s retirement platform and institutional client base. The Board also considered that investors in TIAA-CREF’s retirement platform may choose to roll their investments as they exit their retirement plans into the Nuveen funds. The Independent Board Members recognized the potential cost savings to the benefit of all shareholders of the Nuveen funds from reduced expenses as assets in the Nuveen fund complex rise pursuant to the complex-wide fee arrangement described in further detail below.
Based on their review, the Independent Board Members found that the expected nature, extent and quality of services to be provided to each Fund under its New Advisory Agreements were satisfactory and supported approval of the New Advisory Agreements.
B. The Investment Performance of the Funds and Fund Advisers
1. The Original Advisory Agreements
The Board, including the Independent Board Members, considered the performance history of each Fund over various time periods. The Board reviewed reports, including an analysis of each Fund’s performance and the applicable investment team. In considering each Fund’s performance, the Board recognized that a fund’s performance can be reviewed through various measures including the fund’s absolute return, the fund’s return compared to the performance of other peer funds and the fund’s
Annual Investment Management Agreement Approval Process (Unaudited) (continued)
performance compared to its respective benchmark. Accordingly, the Board reviewed, among other things, each Fund’s historic investment performance as well as information comparing the Fund’s performance information with that of other funds (the “Performance Peer Group”) and with recognized and/or customized benchmarks (i.e., generally benchmarks derived from multiple recognized benchmarks) for the quarter, one-, three- and five-year periods ending December 31, 2013, as well as performance information reflecting the first quarter of 2014. With respect to closed-end funds, the Independent Board Members also reviewed historic premium and discount levels, including a summary of actions taken to address or discuss other developments affecting the secondary market discounts of various funds. This information supplemented the Nuveen fund performance information provided to the Board at each of its quarterly meetings.
In evaluating performance, the Board recognized several factors that may impact the performance data as well as the consideration given to particular performance data.
• The performance data reflects a snapshot in time, in this case as of the end of the most recent calendar year or quarter. A different performance period, however, could generate significantly different results.
• Long-term performance can be adversely affected by even one period of significant underperformance so that a single investment decision or theme has the ability to disproportionately affect long-term performance.
• The investment experience of a particular shareholder in a fund will vary depending on when such shareholder invests in such fund, the class held (if multiple classes offered in the fund) and the performance of the fund (or respective class) during that shareholder’s investment period.
• The usefulness of comparative performance data as a frame of reference to measure a fund’s performance may be limited because the Performance Peer Group, among other things, does not adequately reflect the objectives and strategies of the fund, has a different investable universe, or the composition of the peer set may be limited in size or number as well as other factors. In this regard, the Board noted that the Adviser classified the Performance Peer Groups of the Nuveen funds from highly relevant to less relevant. All of the Funds were classified with less relevant Performance Peer Groups. Therefore, the Board considered each Fund’s performance compared to its benchmark to help assess the Fund’s comparative performance. A fund was generally considered to have performed comparably to its benchmark if the fund’s performance was within certain thresholds compared to the performance of its benchmark and was considered to have outperformed or underperformed its benchmark if the fund’s performance was beyond these thresholds for the one- and three-year periods, subject to certain exceptions.i While the Board is cognizant of the relative performance of a fund’s peer set and/or benchmark(s), the Board evaluated fund performance in light of the respective fund’s investment objectives, investment parameters and guidelines and considered that the variations between the objectives and investment parameters or guidelines of the fund with its peers and/or benchmarks result in differences in performance results. Further, for funds that utilize leverage, the Board understands that leverage during different periods can provide both benefits and risks to a portfolio as compared to an unlevered benchmark.
With respect to any Nuveen funds for which the Board has identified performance concerns, the Board monitors such funds closely until performance improves, discusses with the Adviser the reasons for such results, considers those steps necessary or appropriate to address such issues and reviews the results of any efforts undertaken. The Board is aware, however, that shareholders chose to invest or remain invested in a fund knowing that the Adviser manages the fund and knowing the fund’s fee structure.
As indicated above, the Funds had Performance Peer Groups classified as less relevant and the Board considered each Fund’s performance compared to its respective benchmark. In considering the performance data, the Independent Board Members noted that the performance of Nuveen Maryland Premium Income Municipal Fund (the “Maryland Premium Income Fund”) and Nuveen Missouri Premium Income Municipal Fund (the “Missouri Premium Income Fund”) was satisfactory compared to the performance of their respective benchmarks. In this regard, although the Maryland Premium Income Fund underperformed its benchmark in the one-year period, it provided generally comparable performance in the three-year period and outperformed its benchmark in the five-year period. Although the Missouri Premium Income Fund underperformed its benchmark in the one-year period, it outperformed its benchmark in the three- and five-year periods.
The Board also noted that Nuveen Georgia Dividend Advantage Municipal Fund 2 (the “Georgia Dividend Advantage Fund”), Nuveen North Carolina Premium Income Municipal Fund (the “North Carolina Premium Income Fund”) and Nuveen Virginia Premium Income Municipal Fund (the “Virginia Premium Income Fund”) underperformed their respective benchmarks over the one- and three-year periods; however, these Funds outperformed their respective benchmarks in the five-year period. With respect to the Georgia Dividend Advantage Fund and the North Carolina Premium Income Fund, the Board noted that each Fund’s underperformance compared to its respective benchmark in 2013 was due to, among other things, Fund-level leverage and an overweight in longer duration bonds. Although the exposure to longer duration bonds was a contributor to each such Fund’s underperformance compared to its benchmark in the one-year period, the Board noted that longer duration bonds had been additive to performance in the three-year period. The Board considered the market conditions, the objectives of the Funds and the investment philosophy underlying the emphasis of longer duration bonds and determined that the performance of the Georgia Dividend Advantage Fund and the North Carolina Premium Income Fund over time was satisfactory. Each of these Funds also outperformed its respective benchmark in the first quarter of 2014. With respect to the Virginia Premium Income Fund, the Board observed that the Fund’s underperformance compared to its benchmark in 2013 was due to, among other things, Fund-level leverage, exposure to Puerto Rico securities and an overweight in certain lower rated bonds. The Board further recognized that the Fund’s exposure to Puerto Rico securities was reduced in 2013. The Fund also outperformed its benchmark in the first quarter of 2014.
Based on their review, the Independent Board Members determined that each Fund’s investment performance had been satisfactory.
2. The New Advisory Agreements
With respect to the performance of each Fund, the Board considered that the portfolio investment personnel responsible for the management of the respective Fund portfolios were expected to continue to manage such portfolios following the completion of the Transaction and the investment strategies of the Funds were not expected to change as a result of the Transaction. Accordingly, the findings regarding performance outlined above for the Original Advisory Agreements are applicable to the review of the New Advisory Agreements.
C. Fees, Expenses and Profitability
1. Fees and Expenses
The Board evaluated the management fees and expenses of each Fund, reviewing, among other things, such Fund’s gross management fees, net management fees and net expense ratios in absolute terms as well as compared to the fees and expenses of a comparable universe of funds provided by an independent fund data provider (the “Peer Universe”) and any expense limitations.
The Independent Board Members further reviewed the methodology regarding the construction of the applicable Peer Universe. In reviewing the comparisons of fee and expense information, the Independent Board Members took into account that in certain instances various factors such as the limited size and particular composition of the Peer Universe (including the inclusion of other Nuveen funds in the peer set); expense anomalies; changes in the funds comprising the Peer Universe from year to year; levels of reimbursement or fee waivers; the timing of information used; the differences in the type and use of leverage; and differences in the states reflected in the Peer Universe (with respect to state municipal funds) may impact the comparative data thereby limiting somewhat the ability to make a meaningful comparison with peers.
In reviewing the fee schedule for a fund, the Independent Board Members also considered the fund-level and complex-wide breakpoint schedules (described in further detail below) and any fee waivers and reimbursements provided by Nuveen. In reviewing fees and expenses (excluding leverage costs and leveraged assets for the closed-end funds), the Board considered the expenses and fees to be higher if they were over 10 basis points higher, slightly higher if they were approximately 6 to 10 basis points higher, in line if they were within approximately 5 basis points higher than the peer average and below if they were below the peer average of the Peer Universe. In reviewing the reports, the Board noted that the majority of the Nuveen funds were at,
Annual Investment Management Agreement Approval Process (Unaudited) (continued)
close to or below their peer average based on the net total expense ratio. The Independent Board Members observed that the Funds had net management fees and net expense ratios (including fee waivers and expense reimbursements) below or in line with their respective peer averages, except the Missouri Premium Income Fund, which had a net expense ratio slightly higher than its peer average but a net management fee in line with its peer average.
Based on their review of the fee and expense information provided, the Independent Board Members determined that each Fund’s management fees (as applicable) to a Fund Adviser were reasonable in light of the nature, extent and quality of services provided to the Fund.
2. Comparisons with the Fees of Other Clients
The Board recognized that all Nuveen funds have a sub-adviser, either affiliated or non-affiliated, and therefore the overall fund management fee can be divided into two components, the fee retained by the Adviser and the fee paid to the sub-adviser. In general terms, the fee to the Adviser reflects the administrative and other services it provides to support the Nuveen fund (as described above) and, while some administrative services may occur at the sub-adviser level, the fee to the sub-adviser generally reflects the portfolio management services provided by the sub-adviser. The Independent Board Members considered the fees a Fund Adviser assesses to the Funds compared to that of other clients. With respect to municipal funds, such other clients of a Fund Adviser may include: municipal separately managed accounts and passively managed exchange traded funds (ETFs) sub-advised by the Adviser.
The Independent Board Members reviewed the nature of services provided by the Adviser, including through its affiliated sub-advisers and the average fee the affiliated sub-advisers assessed such clients as well as the range of fees assessed to the different types of separately managed accounts (such as retail, institutional or wrap accounts) to the extent applicable to the respective sub-adviser. In their review, the Independent Board Members considered the differences in the product types, including, but not limited to: the services provided, the structure and operations, product distribution and costs thereof, portfolio investment policies, investor profiles, account sizes and regulatory requirements. In evaluating the comparisons of fees, the Independent Board Members noted that the fee rates charged to the Nuveen funds and other clients vary, among other things, because of the different services involved and the additional regulatory and compliance requirements associated with registered investment companies, such as the Funds. The Independent Board Members noted that, as a general matter, higher fee levels reflect higher levels of service, increased investment management complexity, greater product management requirements and higher levels of risk or a combination of the foregoing. The Independent Board Members further noted, in particular, that the range of services provided to the Funds (as discussed above) is generally much more extensive than that provided to separately managed accounts. Many of the additional administrative services provided by the Adviser are not required for institutional clients. The Independent Board Members also recognized that the management fee rates of the foreign funds advised by the Adviser may vary due to, among other things, differences in the client base, governing bodies, operational complexities and services covered by the management fee. Given the inherent differences in the various products, particularly the extensive services provided to the Funds, the Independent Board Members believe such facts justify the different levels of fees.
3. Profitability of Fund Advisers
In conjunction with their review of fees, the Independent Board Members also considered the profitability of Nuveen for its advisory activities and its financial condition. The Independent Board Members reviewed the revenues and expenses of Nuveen’s advisory activities for the last two calendar years, the allocation methodology used in preparing the profitability data, an analysis of the key drivers behind the changes in revenues and expenses that impacted profitability in 2013 and Nuveen’s consolidated financial statements for 2013. The Independent Board Members noted this information supplemented the profitability information requested and received during the year to help keep them apprised of developments affecting profitability (such as changes in fee waivers and expense reimbursement commitments). In this regard, the Independent Board Members noted that two Independent Board Members served as point persons to review the profitability analysis and methodologies employed, and any changes thereto, and to keep the Board apprised of such changes. The Independent
Board Members also considered Nuveen’s revenues for advisory activities, expenses and profit margin compared to that of various unaffiliated management firms.
In reviewing profitability, the Independent Board Members noted the Adviser’s continued investment in its business with expenditures to, among other things, upgrade its investment technology and compliance systems and provide for additional personnel and other resources. The Independent Board Members recognized the Adviser’s continued commitment to its business should enhance the Adviser’s capacity and capabilities in providing the services necessary to meet the needs of the Nuveen funds as they grow or change over time. In addition, in evaluating profitability, the Independent Board Members also noted the subjective nature of determining profitability which may be affected by numerous factors including the allocation of expenses and that various allocation methodologies may each be reasonable but yield different results. Further, the Independent Board Members recognized the difficulties in making comparisons as the profitability of other advisers generally is not publicly available, and the profitability information that is available for certain advisers or management firms may not be representative of the industry and may be affected by, among other things, an adviser’s particular business mix, capital costs, size, types of funds managed and expense allocations. Notwithstanding the foregoing, the Independent Board Members noted the Adviser’s adjusted operating margin appears to be reasonable in relation to other investment advisers and sufficient to operate as a viable investment management firm meeting its obligations to the Nuveen funds. Based on their review, the Independent Board Members concluded that the Adviser’s level of profitability for its advisory activities was reasonable in light of the services provided.
With respect to sub-advisers affiliated with Nuveen, including the Sub-Adviser, the Independent Board Members reviewed such sub-advisers’ revenues, expenses and profitability margins (pre- and post-tax) for their advisory activities and the methodology used for allocating expenses among the internal sub-advisers. Based on their review, the Independent Board Members were satisfied that the Sub-Adviser’s level of profitability was reasonable in light of the services provided.
In evaluating the reasonableness of the compensation, the Independent Board Members also considered other amounts paid to a Fund Adviser by the funds as well as indirect benefits (such as soft dollar arrangements), if any, the Fund Adviser and its affiliates receive or are expected to receive that are directly attributable to the management of a Nuveen fund. See Section E below for additional information on indirect benefits the Fund Advisers may receive as a result of its relationship with a Nuveen fund. Based on their review of the overall fee arrangements of each Fund, the Independent Board Members determined that the advisory fees and expenses of the Funds were reasonable.
4. The New Advisory Agreements
As noted above, the terms of the New Advisory Agreements are substantially identical to their corresponding Original Advisory Agreements. The fee schedule, including the breakpoint schedule and complex-wide fee schedule, in each New Advisory Agreement is identical to that under the corresponding Original Advisory Agreement. The Board Members also noted that Nuveen has committed for a period of two years from the date of closing the Transaction not to increase contractual management fee rates for any Nuveen fund. This commitment shall not limit or otherwise affect mergers or liquidations of any funds in the ordinary course. Based on the information provided, the Board Members did not believe that the overall expenses would increase as a result of the Transaction. In addition, the Board Members recognized that the Nuveen funds may gain access to the retirement platform and institutional client base of TIAA-CREF, and the investors in the retirement platforms may roll their investments into one or more Nuveen funds as they exit their retirement plans. The enhanced distribution access may result in additional sales of the Nuveen funds resulting in an increase in total assets under management in the complex and a corresponding decrease in overall management fees if additional breakpoints at the fund-level or complex-wide level are met. Based on its review, the Board determined that the management fees and expenses under each New Advisory Agreement were reasonable.
Further, other than from a potential reduction in the debt level of Nuveen Investments, Inc., the Board recognized that it is difficult to predict with any degree of certainty the impact of the Transaction on Nuveen’s profitability. Given the fee schedule was not expected to change under the New Advisory Agreements, however, the Independent Board Members concluded that each Fund Adviser’s level of profitability for its advisory activities under the respective New Advisory Agreements would continue to be reasonable in light of the services provided.
Annual Investment Management Agreement Approval Process (Unaudited) (continued)
D. Economies of Scale and Whether Fee Levels Reflect These Economies of Scale
1. The Original Advisory Agreements
With respect to economies of scale, the Independent Board Members have recognized the potential benefits resulting from the costs of a fund being spread over a larger asset base, although economies of scale are difficult to measure and predict with precision, particularly on a fund-by-fund basis. One method to help ensure the shareholders share in these benefits is to include breakpoints in the advisory fee schedule. Generally, management fees for funds in the Nuveen complex are comprised of a fund-level component and a complex-level component, subject to certain exceptions. Accordingly, the Independent Board Members reviewed and considered the applicable fund-level breakpoints in the advisory fee schedules that reduce advisory fees as asset levels increase. Further, the Independent Board Members noted that, although closed-end funds may from time-to-time make additional share offerings, the growth of their assets would occur primarily through the appreciation of such funds’ investment portfolios.
In addition to fund-level advisory fee breakpoints, the Board also considered the Nuveen funds’ complex-wide fee arrangement. Pursuant to the complex-wide fee arrangement, the fees of the funds in the Nuveen complex are reduced as the assets in the fund complex reach certain levels. The complex-wide fee arrangement seeks to provide the benefits of economies of scale to fund shareholders when total fund complex assets increase, even if assets of a particular fund are unchanged or have decreased. The approach reflects the notion that some of Nuveen’s costs are attributable to services provided to all its funds in the complex and therefore all funds benefit if these costs are spread over a larger asset base.
Based on their review, the Independent Board Members concluded that the breakpoint schedules and complex-wide fee arrangement (as applicable) were acceptable and reflect economies of scale to be shared with shareholders when assets under management increase.
2. The New Advisory Agreements
As noted, the Independent Board Members recognized that the fund-level and complex-wide schedules will not change under the New Advisory Agreements. Assets in the funds advised by TIAA-CREF or its current affiliates will not be included in the complex-wide fee calculation. Nevertheless, the Nuveen funds may have access to TIAA-CREF’s retirement platform and institutional client base. The access to this distribution network may enhance the distribution of the Nuveen funds which, in turn, may lead to reductions in management and sub-advisory fees if the Nuveen funds reach additional fund-level and complex-wide breakpoint levels. Based on their review, including the considerations in the annual review of the Original Advisory Agreements, the Independent Board Members determined that the fund-level breakpoint schedules and complex-wide fee schedule continue to be appropriate and desirable in ensuring that shareholders participate in the benefits derived from economies of scale under the New Advisory Agreements.
E. Indirect Benefits
1. The Original Advisory Agreements
In evaluating fees, the Independent Board Members received and considered information regarding potential “fall out” or ancillary benefits the respective Fund Adviser or its affiliates may receive as a result of its relationship with each Fund. In this regard, with respect to closed-end funds, the Independent Board Members considered any revenues received by affiliates of the Adviser for serving as co-manager in initial public offerings of new closed-end funds as well as revenues received in connection with secondary offerings.
In addition to the above, the Independent Board Members considered whether the Fund Advisers received any benefits from soft dollar arrangements whereby a portion of the commissions paid by a fund for brokerage may be used to acquire research that may be useful to a Fund Adviser in managing the assets of the fund and other clients. Each Fund’s portfolio transactions are allocated by the Sub-Adviser. Accordingly, the Independent Board Members considered that the Sub-Adviser may benefit from
its soft dollar arrangements pursuant to which it receives research from brokers that execute the applicable Fund’s portfolio transactions. With respect to any fixed income securities, however, the Board recognized that such securities generally trade on a principal basis that does not generate soft dollar credits. Similarly, the Board recognized that the research received pursuant to soft dollar arrangements by the Sub-Adviser may also benefit the Funds and their shareholders to the extent the research enhances the ability of the Sub-Adviser to manage the Funds. The Independent Board Members noted that the Sub-Adviser’s profitability may be somewhat lower if it did not receive the research services pursuant to the soft dollar arrangements and had to acquire such services directly.
Based on their review, the Independent Board Members concluded that any indirect benefits received by a Fund Adviser as a result of its relationship with the Funds were reasonable and within acceptable parameters.
2. The New Advisory Agreements
The Independent Board Members noted that, as the applicable policies and operations of the Fund Advisers with respect to the Nuveen funds were not anticipated to change significantly after the Transaction, such indirect benefits should remain after the Transaction. The Independent Board Members further noted the benefits the Transaction would provide to TIAA-CREF and Nuveen, including a larger-scale fund complex, certain shared services (noted above) and a broader range of investment capabilities, distribution capabilities and product line. Further, the Independent Board Members noted that Nuveen Investments, Inc. (the parent of the Adviser) would benefit from an improved capital structure through a reduction in its debt level.
F. Other Considerations for the New Advisory Agreements
In addition to the factors above, the Board Members also considered the following with respect to the Nuveen funds:
• Nuveen would rely on the provisions of Section 15(f) of the 1940 Act. In this regard, to help ensure that an unfair burden is not imposed on the Nuveen funds, Nuveen has committed for a period of two years from the date of the closing of the Transaction not to increase contractual management fee rates for any fund. This commitment shall not limit or otherwise affect mergers or liquidations of any funds in the ordinary course.
• The Nuveen funds would not incur any costs in seeking the necessary shareholder approvals for the New Investment Management Agreements or the New Sub-Advisory Agreements (except for any costs attributed to seeking shareholder approvals of fund specific matters unrelated to the Transaction, such as election of Board Members or changes to investment policies, in which case a portion of such costs will be borne by the applicable funds).
• The reputation, financial strength and resources of TIAA-CREF.
• The long-term investment philosophy of TIAA-CREF and anticipated plans to grow Nuveen’s business to the benefit of the Nuveen funds.
• The benefits to the Nuveen funds as a result of the Transaction including: (i) increased resources and support available to Nuveen as well as an improved capital structure that may reinforce and enhance the quality and level of services it provides to the funds; (ii) potential additional distribution capabilities for the funds to access new markets and customer segments through TIAA-CREF’s distribution network, including, in particular, its retirement platforms and institutional client base; and (iii) access to TIAA-CREF’s expertise and investment capabilities in additional asset classes.
G. Other Considerations
The Independent Board Members did not identify any single factor discussed previously as all-important or controlling. The Board Members, including the Independent Board Members, unanimously concluded that the terms of each Original Advisory Agreement and New Advisory Agreement are fair and reasonable, that the respective Fund Adviser’s fees are reasonable in light of the services provided to each Fund and that the Original Advisory Agreements be renewed and the New Advisory Agreements be approved.
Annual Investment Management Agreement Approval Process (Unaudited) (continued)
II. Approval of Interim Advisory Agreements
At the April Meeting, the Board Members, including the Independent Board Members, unanimously approved for each Fund an interim advisory agreement (the “Interim Investment Management Agreement”) between the respective Fund and the Adviser and an interim sub-advisory agreement (the “Interim Sub-Advisory Agreement”) between the Adviser and the Sub-Adviser. If necessary to assure continuity of advisory services, each respective Interim Investment Management Agreement and Interim Sub-Advisory Agreement will take effect upon the closing of the Transaction if shareholders have not yet approved the corresponding New Investment Management Agreement or New Sub-Advisory Agreement. The terms of each Interim Investment Management Agreement and Interim Sub-Advisory Agreement are substantially identical to those of the corresponding Original Investment Management Agreement and New Investment Management Agreement and the corresponding Original Sub-Advisory Agreement and New Sub-Advisory Agreement, respectively, except for certain term and fee escrow provisions. In light of the foregoing, the Board Members, including the Independent Board Members, unanimously determined that the scope and quality of services to be provided to the Funds under the respective Interim Investment Management Agreements and Interim Sub-Advisory Agreements are at least equivalent to the scope and quality of services provided under the applicable Original Investment Management Agreements and Original Sub-Advisory Agreements.
i The Board recognized that the Adviser considered a fund to have outperformed or underperformed its benchmark if the fund’s performance was higher or lower than the performance of the benchmark by the following thresholds: for open-end funds (+/- 100 basis points for equity funds excluding index funds; +/- 30 basis points for tax exempt fixed income funds; +/- 40 basis points for taxable fixed income funds) and for closed-end funds (assuming 30% leverage) (+/- 130 basis points for equity funds excluding index funds; +/- 39 basis points for tax exempt funds and +/- 52 basis points for taxable fixed income funds).
Notes
Notes
Notes
Nuveen Investments:
Serving Investors for Generations
Since 1898, financial advisors and their clients have relied on Nuveen Investments to provide dependable investment solutions through continued adherence to proven, long-term investing principles. Today, we offer a range of high quality equity and fixed-income solutions designed to be integral components of a well-diversified core portfolio.
Focused on meeting investor needs.
Nuveen Investments provides high-quality investment services designed to help secure the long-term goals of institutional and individual investors as well as the consultants and financial advisors who serve them. Nuveen Investments markets a wide range of specialized investment solutions which provide investors access to capabilities of its high-quality boutique investment affiliates—Nuveen Asset Management, Symphony Asset Management, NWQ Investment Management Company, Santa Barbara Asset Management, Tradewinds Global Investors, Winslow Capital Management and Gresham Investment Management. In total, Nuveen Investments managed approximately $225 billion as of March 31, 2014.
Find out how we can help you.
To learn more about how the products and services of Nuveen Investments may be able to help you meet your financial goals, talk to your financial advisor, or call us at (800) 257-8787. Please read the information provided carefully before you invest. Investors should consider the investment objective and policies, risk considerations, charges and expenses of any investment carefully. Where applicable, be sure to obtain a prospectus, which contains this and other relevant information. To obtain a prospectus, please contact your securities representative or Nuveen Investments, 333 W. Wacker Dr., Chicago, IL 60606. Please read the prospectus carefully before you invest or send money.
Learn more about Nuveen Funds at: www.nuveen.com/cef
| Distributed by Nuveen Investments, LLC | 333 West Wacker Drive | Chicago, IL 60606 | www.nuveen.com |  |
EAN-A-0514D 2100-INV-Y07/15
ITEM 2. CODE OF ETHICS.
As of the end of the period covered by this report, the registrant has adopted a code of ethics that applies to the registrant's principal executive officer, principal financial officer, principal accounting officer or controller, or persons performing similar functions. There were no amendments to or waivers from the Code during the period covered by this report. The registrant has posted the code of ethics on its website at www.nuveen.com/CEF/Shareholder/FundGovernance.aspx. (To view the code, click on Code of Conduct.)
ITEM 3. AUDIT COMMITTEE FINANCIAL EXPERT.
The registrant's Board of Directors or Trustees (“Board”) determined that the registrant has at least one “audit committee financial expert” (as defined in Item 3 of Form N-CSR) serving on its Audit Committee. The registrant's audit committee financial expert is Carole E. Stone, who is “independent” for purposes of Item 3 of Form N-CSR.
Ms. Stone served for five years as Director of the New York State Division of the Budget. As part of her role as Director, Ms. Stone was actively involved in overseeing the development of the State's operating, local assistance and capital budgets, its financial plan and related documents; overseeing the development of the State's bond-related disclosure documents and certifying that they fairly presented the State's financial position; reviewing audits of various State and local agencies and programs; and coordinating the State's system of internal audit and control. Prior to serving as Director, Ms. Stone worked as a budget analyst/examiner with increasing levels of responsibility over a 30 year period, including approximately five years as Deputy Budget Director. Ms. Stone has also served as Chair of the New York State Racing Association Oversight Board, as Chair of the Public Authorities Control Board, as a Commissioner on the New York State Commission on Public Authority Reform and as a member of the Boards of Directors of several New York State public authorities. These positions have involved overseeing operations and finances of certain entities and assessing the adequacy of project/entity financing and financial reporting. Currently, Ms. Stone is on the Board of Directors of CBOE Holdings, Inc., of the Chicago Board Options Exchange, and of C2 Options Exchange. Ms. Stone's position on the boards of these entities and as a member of both CBOE Holdings' Audit Committee and its Finance Committee has involved, among other things, the oversight of audits, audit plans and preparation of financial statements.
ITEM 4. PRINCIPAL ACCOUNTANT FEES AND SERVICES.
Nuveen Georgia Dividend Advantage Municipal Fund 2
The following tables show the amount of fees that Ernst & Young LLP, the Fund's auditor, billed to the Fund during the Fund's last two full fiscal years. For engagements with Ernst & Young LLP the Audit Committee approved in advance all audit services and non-audit services that Ernst & Young LLP provided to the Fund, except for those non-audit services that were subject to the pre-approval exception under Rule 2-01 of Regulation S-X (the “pre-approval exception”). The pre-approval exception for services provided directly to the Fund waives the pre-approval requirement for services other than audit, review or attest services if: (A) the aggregate amount of all such services provided constitutes no more than 5% of the total amount of revenues paid by the Fund to its accountant during the fiscal year in which the services are provided; (B) the Fund did not recognize the services as non-audit services at the time of the engagement; and (C) the services are promptly brought to the Audit Committee's attention, and the Committee (or its delegate) approves the services before the audit is completed.
The Audit Committee has delegated certain pre-approval responsibilities to its Chairman (or, in his absence, any other member of the Audit Committee).
SERVICES THAT THE FUND'S AUDITOR BILLED TO THE FUND
| | | Audit Fees Billed | | | Audit-Related Fees | | | Tax Fees | | | All Other Fees | |
| Fiscal Year Ended | | to Fund 1 | | | Billed to Fund 2 | | | Billed to Fund 3 | | | Billed to Fund 4 | |
| May 31, 2014 | | $ | 24,750 | | | $ | 0 | | | $ | 673 | | | $ | 0 | |
| | | | | | | | | | | | | | | | | |
| Percentage approved | | | 0 | % | | | 0 | % | | | 0 | % | | | 0 | % |
| pursuant to | | | | | | | | | | | | | | | | |
| pre-approval | | | | | | | | | | | | | | | | |
| exception | | | | | | | | | | | | | | | | |
| | | | | | | | | | | | | | | | | |
| May 31, 2013 | | $ | 22,250 | | | $ | 0 | | | $ | 0 | | | $ | 0 | |
| | | | | | | | | | | | | | | | | |
| Percentage approved | | | 0 | % | | | 0 | % | | | 0 | % | | | 0 | % |
| pursuant to | | | | | | | | | | | | | | | | |
| pre-approval | | | | | | | | | | | | | | | | |
| exception | | | | | | | | | | | | | | | | |
| | | | | | | | | | | | | | | | | |
1 "Audit Fees" are the aggregate fees billed for professional services for the audit of the Fund's annual financial statements and services provided in | |
| connection with statutory and regulatory filings or engagements. | | | | | | | | | | | | | |
| | | | | | | | | | | | | | | | | |
2 "Audit Related Fees" are the aggregate fees billed for assurance and related services reasonably related to the performance of the audit or review of | | | | | |
| financial statements that are not reported under "Audit Fees". These fees include offerings related to the Fund's common shares and leverage. | | | | | |
| | | | | | | | | | | | | | | | | |
3 "Tax Fees" are the aggregate fees billed for professional services for tax advice, tax compliance, and tax planning. These fees include: all global | | | | | |
| withholding tax services; excise and state tax reviews; capital gain, tax equalization and taxable basis calculation performed by the principal accountant. | | | | | |
| | | | | | | | | | | | | | | | | |
4 "All Other Fees" are the aggregate fees billed for products and services other than "Audit Fees", "Audit-Related Fees" and "Tax Fees". These fees | | | | | |
| represent all "Agreed-Upon Procedures" engagements pertaining to the Fund's use of leverage. | | | | | | | | | |
SERVICES THAT THE FUND'S AUDITOR BILLED TO THE ADVISER AND AFFILIATED FUND SERVICE PROVIDERS
The following tables show the amount of fees billed by Ernst & Young LLP to Nuveen Fund Advisors, LLC (formerly Nuveen Fund Advisors, Inc.) (the “Adviser”), and any entity controlling, controlled by or under common control with the Adviser that provides ongoing services to the Fund (“Affiliated Fund Service Provider”), for engagements directly related to the Fund's operations and financial reporting, during the Fund's last two full fiscal years.
The tables also show the percentage of fees subject to the pre-approval exception. The pre-approval exception for services provided to the Adviser and any Affiliated Fund Service Provider (other than audit, review or attest services) waives the pre-approval requirement if: (A) the aggregate amount of all such services provided constitutes no more than 5% of the total amount of revenues paid to Ernst & Young LLP by the Fund, the Adviser and Affiliated Fund Service Providers during the fiscal year in which the services are provided that would have to be pre-approved by the Audit Committee; (B) the Fund did not recognize the services as non-audit services at the time of the engagement; and (C) the services are promptly brought to the Audit Committee's attention, and the Committee (or its delegate) approves the services before the Fund's audit is completed.
| | Audit-Related Fees | Tax Fees Billed to | All Other Fees |
| | Billed to Adviser and | Adviser and | Billed to Adviser |
| | Affiliated Fund | Affiliated Fund | and Affiliated Fund |
| Fiscal Year Ended | Service Providers | Service Providers | Service Providers |
| May 31, 2014 | $ 0 | $ 0 | $ 0 |
| | | | |
| Percentage approved | 0% | 0% | 0% |
| pursuant to | | | |
| pre-approval | | | |
| exception | | | |
| May 31, 2013 | $ 0 | $ 0 | $ 0 |
| | | | |
| Percentage approved | 0% | 0% | 0% |
| pursuant to | | | |
| pre-approval | | | |
| exception | | | |
NON-AUDIT SERVICES
The following table shows the amount of fees that Ernst & Young LLP billed during the Fund's last two full fiscal years for non-audit services. The Audit Committee is required to pre-approve non-audit services that Ernst & Young LLP provides to the Adviser and any Affiliated Fund Services Provider, if the engagement related directly to the Fund's operations and financial reporting (except for those subject to the pre-approval exception described above). The Audit Committee requested and received information from Ernst & Young LLP about any non-audit services that Ernst & Young LLP rendered during the Fund's last fiscal year to the Adviser and any Affiliated Fund Service Provider. The Committee considered this information in evaluating Ernst & Young LLP's independence.
| | | Total Non-Audit Fees | | |
| | | billed to Adviser and | | |
| | | Affiliated Fund Service | Total Non-Audit Fees | |
| | | Providers (engagements | billed to Adviser and | |
| | | related directly to the | Affiliated Fund Service | |
| | Total Non-Audit Fees | operations and financial | Providers (all other | |
| Fiscal Year Ended | Billed to Fund | reporting of the Fund) | engagements) | Total |
| May 31, 2014 | $ 673 | $ 0 | $ 0 | $ �� 673 |
| May 31, 2013 | $ 0 | $ 0 | $ 0 | $ 0 |
| | | | | |
| | | | | |
| "Non-Audit Fees billed to Fund" for both fiscal year ends represent "Tax Fees" and "All Other Fees" billed to Fund in their respective | |
| amounts from the previous table. | | | | |
| | | | | |
| Less than 50 percent of the hours expended on the principal accountant's engagement to audit the registrant's financial statements for the most recent |
| fiscal year were attributed to work performed by persons other than the principal accountant's full-time, permanent employees. | |
Audit Committee Pre-Approval Policies and Procedures. Generally, the Audit Committee must approve (i) all non-audit services to be performed for the Fund by the Fund's independent accountants and (ii) all audit and non-audit services to be performed by the Fund's independent accountants for the Affiliated Fund Service Providers with respect to operations and financial reporting of the Fund. Regarding tax and research projects conducted by the independent accountants for the Fund and Affiliated Fund Service Providers (with respect to operations and financial reports of the Fund) such engagements will be (i) pre-approved by the Audit Committee if they are expected to be for amounts greater than $10,000; (ii) reported to the Audit Committee chairman for his verbal approval prior to engagement if they are expected to be for amounts under $10,000 but greater than $5,000; and (iii) reported to the Audit Committee at the next Audit Committee meeting if they are expected to be for an amount under $5,000.
ITEM 5. AUDIT COMMITTEE OF LISTED REGISTRANTS.
The registrant's Board has a separately designated Audit Committee established in accordance with Section 3(a)(58)(A) of the Securities Exchange Act of 1934, as amended (15 U.S.C. 78c(a)(58)(A)). The members of the audit committee are Robert P. Bremner, Terence J. Toth, Jack B. Evans, Carole E. Stone and David J. Kundert.
ITEM 6. SCHEDULE OF INVESTMENTS.
a) See Portfolio of Investments in Item 1.
b) Not applicable.
ITEM 7. DISCLOSURE OF PROXY VOTING POLICIES AND PROCEDURES FOR CLOSED-END MANAGEMENT INVESTMENT COMPANIES.
Nuveen Fund Advisors, LLC, formerly known as Nuveen Fund Advisors, Inc., is the registrant’s investment adviser (also referred to as the “Adviser”). The Adviser is responsible for the on-going monitoring of the Fund’s investment portfolio, managing the Fund’s business affairs and providing certain clerical, bookkeeping and administrative services. The Adviser has engaged Nuveen Asset Management, LLC (“Sub-Adviser”) as Sub-Adviser to provide discretionary investment advisory services. As part of these services, the Adviser has delegated to the Sub-Adviser the full responsibility for proxy voting on securities held in the registrant’s portfolio and related duties in accordance with the Sub-Adviser's policies and procedures. The Adviser periodically monitors the Sub-Adviser's voting to ensure that it is carrying out its duties. The Sub-Adviser’s proxy voting policies and procedures are attached to this filing as an exhibit and incorporated herein by reference.
ITEM 8. PORTFOLIO MANAGERS OF CLOSED-END MANAGEMENT INVESTMENT COMPANIES.
Nuveen Fund Advisors, LLC, formerly known as Nuveen Fund Advisors, Inc., is the registrant’s investment adviser (also referred to as the “Adviser”). The Adviser is responsible for the selection and on-going monitoring of the Fund’s investment portfolio, managing the Fund’s business affairs and providing certain clerical, bookkeeping and administrative services. The Adviser has engaged Nuveen Asset Management, LLC (“Nuveen Asset Management” or “Sub-Adviser”) as Sub-Adviser to provide discretionary investment advisory services. The following section provides information on the portfolio manager at the Sub-Adviser:
The Portfolio Manager
The following individual has primary responsibility for the day-to-day implementation of the registrant’s investment strategies:
| Name | Fund |
| Daniel J. Close | Nuveen Georgia Dividend Advantage Municipal Fund 2 |
Other Accounts Managed. In addition to managing the registrant, the portfolio manager is also primarily responsible for the day-to-day portfolio management of the following accounts:
| Portfolio Manager | Type of Account Managed | Number of Accounts | Assets* |
| Daniel J. Close | Registered Investment Company | 17 | $5.303 billion |
| | Other Pooled Investment Vehicles | 0 | $0 |
| | Other Accounts | 11 | $196 million |
| * | Assets are as of May 31, 2014. None of the assets in these accounts are subject to an advisory fee based on performance. |
POTENTIAL MATERIAL CONFLICTS OF INTEREST
Actual or apparent conflicts of interest may arise when a portfolio manager has day-to-day management responsibilities with respect to more than one account. More specifically, portfolio managers who manage multiple accounts are presented a number of potential conflicts, including, among others, those discussed below.
The management of multiple accounts may result in a portfolio manager devoting unequal time and attention to the management of each account. Nuveen Asset Management seeks to manage such competing interests for the time and attention of portfolio managers by having portfolio managers focus on a particular investment discipline. Most accounts managed by a portfolio manager in a particular investment strategy are managed using the same investment models.
If a portfolio manager identifies a limited investment opportunity which may be suitable for more than one account, an account may not be able to take full advantage of that opportunity due to an allocation of filled purchase or sale orders across all eligible accounts. To deal with these situations, Nuveen Asset Management has adopted procedures for allocating limited opportunities across multiple accounts.
With respect to many of its clients’ accounts, Nuveen Asset Management determines which broker to use to execute transaction orders, consistent with its duty to seek best execution of the transaction. However, with respect to certain other accounts, Nuveen Asset Management may be limited by the client with respect to the selection of brokers or may be instructed to direct trades through a particular broker. In these cases, Nuveen Asset Management may place separate, non-simultaneous, transactions for a Fund and other accounts which may temporarily affect the market price of the security or the execution of the transaction, or both, to the detriment of the Fund or the other accounts.
Some clients are subject to different regulations. As a consequence of this difference in regulatory requirements, some clients may not be permitted to engage in all the investment techniques or transactions or to engage in these transactions to the same extent as the other accounts managed by the portfolio manager. Finally, the appearance of a conflict of interest may arise where Nuveen Asset Management has an incentive, such as a performance-based management fee, which relates to the management of some accounts, with respect to which a portfolio manager has day-to-day management responsibilities.
Nuveen Asset Management has adopted certain compliance procedures which are designed to address these types of conflicts common among investment managers. However, there is no guarantee that such procedures will detect each and every situation in which a conflict arises.
Item 8(a)(3). FUND MANAGER COMPENSATION
Portfolio manager compensation consists primarily of base pay, an annual cash bonus and long term incentive payments.
Base pay. Base pay is determined based upon an analysis of the portfolio manager’s general performance, experience, and market levels of base pay for such position.
Annual cash bonus. The Fund’s portfolio managers are eligible for an annual cash bonus based on investment performance, qualitative evaluation and financial performance of Nuveen Asset Management.
A portion of each portfolio manager’s annual cash bonus is based on the Fund’s investment performance, generally measured over the past one- and three or five-year periods unless the portfolio manager’s tenure is shorter. Investment performance for the Fund generally is determined by evaluating the Fund’s performance relative to its benchmark(s) and/or Lipper industry peer group.
A portion of the cash bonus is based on a qualitative evaluation made by each portfolio manager’s supervisor taking into consideration a number of factors, including the portfolio manager’s team collaboration, expense management, support of personnel responsible for asset growth, and his or her compliance with Nuveen Asset Management’s policies and procedures.
The final factor influencing a portfolio manager’s cash bonus is the financial performance of Nuveen Asset Management based on its operating earnings.
Long-term incentive compensation. Certain key employees of Nuveen Investments and its affiliates, including certain portfolio managers, have received equity interests in the parent company of Nuveen Investments. In addition, certain key employees of Nuveen Asset Management, including certain portfolio managers, have received profits interests in Nuveen Asset Management which entitle their holders to participate in the firm’s growth over time.
There are generally no differences between the methods used to determine compensation with respect to the Fund and the Other Accounts shown in the table above.
Beneficial Ownership of Securities. As of May 31, 2014, the portfolio manager beneficially owned the following dollar range of equity securities issued by the Fund and other Nuveen Funds managed by Nuveen Asset Management’s municipal investment team.
| Name of Portfolio Manager | Fund | Dollar range of equity securities beneficially owned in Fund | Dollar range of equity securities beneficially owned in the remainder of Nuveen funds managed by Nuveen Asset Management’s municipal investment team |
| Daniel J. Close | Nuveen Georgia Dividend Advantage Municipal Fund 2 | $0 | $0 |
PORTFOLIO MANAGER BIO:
Daniel J. Close, CFA, is a Senior Vice President of Nuveen Investments. He joined Nuveen Investments in 2000 as a member of Nuveen’s product management and development team. He then served as a research analyst for Nuveen’s municipal investing team, covering corporate-backed, energy, transportation and utility credits. He received his BS in Business from Miami University and his MBA from Northwestern University’s Kellogg School of Management. Mr. Close has earned the Chartered Financial Analyst designation. Mr. Close also serves as a portfolio manager for various Nuveen Build America Bond strategies.
ITEM 9. PURCHASES OF EQUITY SECURITIES BY CLOSED-END MANAGEMENT INVESTMENT COMPANY AND AFFILIATED PURCHASERS.
Not applicable.
ITEM 10. SUBMISSION OF MATTERS TO A VOTE OF SECURITY HOLDERS.
There have been no material changes to the procedures by which shareholders may recommend nominees to the registrant's Board implemented after the registrant last provided disclosure in response to this Item.
ITEM 11. CONTROLS AND PROCEDURES.
| (a) | The registrant's principal executive and principal financial officers, or persons performing similar functions, have concluded that the registrant's disclosure controls and procedures (as defined in Rule 30a-3(c) under the Investment Company Act of 1940, as amended (the “1940 Act”) (17 CFR 270.30a-3(c))) are effective, as of a date within 90 days of the filing date of this report that includes the disclosure required by this paragraph, based on their evaluation of the controls and procedures required by Rule 30a-3(b) under the 1940 Act (17 CFR 270.30a-3(b)) and Rules 13a-15(b) or 15d-15(b) under the Securities Exchange Act of 1934, as amended (the “Exchange Act”) (17 CFR 240.13a-15(b) or 240.15d-15(b)). |
| (b) | There were no changes in the registrant's internal control over financial reporting (as defined in Rule 30a-3(d) under the 1940 Act (17 CFR 270.30a-3(d)) that occurred during the second fiscal quarter of the period covered by this report that has materially affected, or is reasonably likely to materially affect, the registrant's internal control over financial reporting. |
ITEM 12. EXHIBITS.
File the exhibits listed below as part of this Form.
| (a)(1) | Any code of ethics, or amendment thereto, that is the subject of the disclosure required by Item 2, to the extent that the registrant intends to satisfy the Item 2 requirements through filing of an exhibit: Not applicable because the code is posted on registrant's website at www.nuveen.com/CEF/Shareholder/FundGovernance.aspx and there were no amendments during the period covered by this report. (To view the code, click on Code of Conduct.) |
| (a)(2) | A separate certification for each principal executive officer and principal financial officer of the registrant as required by Rule 30a-2(a) under the 1940 Act (17 CFR 270.30a-2(a)) in the exact form set forth below: Ex-99.CERT Attached hereto. |
| (a)(3) | Any written solicitation to purchase securities under Rule 23c-1 under the 1940 Act (17 CFR 270.23c-1) sent or given during the period covered by the report by or on behalf of the registrant to 10 or more persons. Not applicable. |
| (b) | If the report is filed under Section 13(a) or 15(d) of the Exchange Act, provide the certifications required by Rule 30a-2(b) under the 1940 Act (17 CFR 270.30a-2(b)); Rule 13a-14(b) or Rule 15d-14(b) under the Exchange Act (17 CFR 240.13a-14(b) or 240.15d-14(b)), and Section 1350 of Chapter 63 of Title 18 of the United States Code (18 U.S.C. 1350) as an exhibit. A certification furnished pursuant to this paragraph will not be deemed “filed” for purposes of Section 18 of the Exchange Act (15 U.S.C. 78r), or otherwise subject to the liability of that section. Such certification will not be deemed to be incorporated by reference into any filing under the Securities Act of 1933 or the Exchange Act, except to the extent that the registrant specifically incorporates it by reference. Ex-99.906 CERT attached hereto. |
SIGNATURES
Pursuant to the requirements of the Securities Exchange Act of 1934 and the Investment Company Act of 1940, the registrant has duly caused this report to be signed on its behalf by the undersigned, thereunto duly authorized.
(Registrant) Nuveen Georgia Dividend Advantage Municipal Fund 2
By (Signature and Title) /s/ Kevin J. McCarthy
Kevin J. McCarthy
Vice President and Secretary
Date: August 7, 2014
Pursuant to the requirements of the Securities Exchange Act of 1934 and the Investment Company Act of 1940, this report has been signed below by the following persons on behalf of the registrant and in the capacities and on the dates indicated.
By (Signature and Title) /s/ Gifford R. Zimmerman
Gifford R. Zimmerman
Chief Administrative Officer
(principal executive officer)
By (Signature and Title) /s/ Stephen D. Foy
Stephen D. Foy
Vice President and Controller
(principal financial officer)