QuickLinks -- Click here to rapidly navigate through this document
As filed with the Securities and Exchange Commission on March , 2004
Registration No. 333-112991
SECURITIES AND EXCHANGE COMMISSION
Washington, D.C. 20549
AMENDMENT NO. 1
TO
FORM S-1
REGISTRATION STATEMENT
UNDER
THE SECURITIES ACT OF 1933
Noveon International, Inc.
(Exact name of registrant as specified in its charter)
| Delaware (State or other jurisdiction of incorporation or organization) | 2891 (Primary Standard Industrial Classification Code Number) | 13-4143923 (I.R.S. Employer Identification Number) |
9911 Brecksville Road
Cleveland, Ohio 44141
(216) 447-5000
(Address, including zip code, and telephone number, including
area code, of registrant's principal executive offices)
Christopher R. Clegg, Esq.
Senior Vice President, General Counsel and Secretary
Noveon International, Inc.
9911 Brecksville Road
Cleveland, Ohio 44141
(216) 447-5000
(Name, address, including zip code, and telephone number, including area code, of agent for service)
| Copies to: | ||
| Jean E. Hanson, Esq. Fried, Frank, Harris, Shriver & Jacobson LLP One New York Plaza New York, New York 10004 (212) 859-8000 | Peter M. Labonski, Esq. Latham & Watkins LLP 885 Third Avenue New York, NY 10022-4802 (212) 906-1200 | |
Approximate date of commencement of proposed sale to public:As soon as practicable after the effective date of this registration statement.
If any of the securities being registered on this Form are to be offered on a delayed or continuous basis pursuant to Rule 415 under the Securities Act, check the following box. o
If this Form is filed to register additional securities for an offering pursuant to Rule 462(b) under the Securities Act, check the following box and list the Securities Act registration statement number of the earlier effective registration statement for the same offering. o
If this Form is a post-effective amendment filed pursuant to Rule 462(c) under the Securities Act, check the following box and list the Securities Act registration statement number of the earlier effective registration statement for the same offering. o
If this Form is a post-effective amendment filed pursuant to Rule 462(d) under the Securities Act, check the following box and list the Securities Act registration statement number of the earlier effective registration statement for the same offering. o
If delivery of the prospectus is expected to be made pursuant to Rule 434, please check the following box. o
The registrant hereby amends this registration statement on such date or dates as may be necessary to delay its effective date until the registrant shall file a further amendment which specifically states that this registration statement shall thereafter become effective in accordance with Section 8(a) of the Securities Act of 1933 or until the registration statement shall become effective on such date as the Securities and Exchange Commission, acting pursuant to said Section 8(a), may determine.
The information in this prospectus is not complete and may be changed. We may not sell these securities until the registration statement filed with the Securities and Exchange Commission is effective. This prospectus is not an offer to sell these securities and it is not soliciting an offer to buy these securities in any state where the offer or sale is not permitted.
SUBJECT TO COMPLETION, DATED MARCH , 2004
Shares

Noveon International, Inc.
Common Stock
Prior to this offering there has been no public market for our common stock. The initial public offering price of the common stock is expected to be between $ and $ per share. We have applied to list our common stock on The New York Stock Exchange under the symbol "NOV."
We are selling shares of common stock and the selling stockholders are selling shares of common stock. We will not receive any of the proceeds from the shares of common stock sold by the selling stockholders.
The underwriters have an option to purchase a maximum of additional shares to cover over-allotments of shares.
Investing in our common stock involves risks. See "Risk Factors" on page 11.
| | Price to Public | Underwriting Discounts and Commissions | Proceeds to Noveon International | Proceeds to Selling Stockholders | ||||||||
|---|---|---|---|---|---|---|---|---|---|---|---|---|
| Per Share | $ | $ | $ | $ | ||||||||
| Total | $ | $ | $ | $ | ||||||||
Delivery of the shares of common stock will be made on or about , 2004.
Neither the Securities and Exchange Commission nor any state securities commission has approved or disapproved of these securities or determined if this prospectus is truthful or complete. Any representation to the contrary is a criminal offense.
| Joint Book-Running Managers | ||||
Credit Suisse First Boston | Deutsche Bank Securities | UBS Investment Bank | ||
| Goldman, Sachs & Co. | Merrill Lynch & Co. |
The date of this prospectus is , 2004.
[PICTURES AND DESCRIPTIONS TO COME]
| PROSPECTUS SUMMARY | 1 | |
| RISK FACTORS | 11 | |
| CAUTIONARY NOTE REGARDING FORWARD-LOOKING STATEMENTS | 22 | |
| USE OF PROCEEDS | 23 | |
| DIVIDEND POLICY | 23 | |
| CAPITALIZATION | 24 | |
| DILUTION | 25 | |
| SELECTED CONSOLIDATED FINANCIAL AND OTHER DATA | 27 | |
| MANAGEMENT'S DISCUSSION AND ANALYSIS OF FINANCIAL CONDITION AND RESULTS OF OPERATIONS | 32 | |
| BUSINESS | 55 | |
| MANAGEMENT | 71 | |
CERTAIN RELATIONSHIPS AND RELATED TRANSACTIONS | 84 | |
| PRINCIPAL AND SELLING STOCKHOLDERS | 87 | |
| DESCRIPTION OF OUR INDEBTEDNESS | 90 | |
| DESCRIPTION OF CAPITAL STOCK | 93 | |
| SHARES ELIGIBLE FOR FUTURE SALE | 96 | |
| CERTAIN UNITED STATES FEDERAL TAX CONSIDERATIONS FOR NON-UNITED STATES HOLDERS | 98 | |
| UNDERWRITING | 101 | |
| LEGAL MATTERS | 106 | |
| EXPERTS | 106 | |
| WHERE YOU CAN FIND MORE INFORMATION | 107 | |
| INDEX TO CONSOLIDATED FINANCIAL STATEMENTS | F-1 |
You should rely only on the information contained in this document or to which we have referred you. We have not authorized anyone to provide you with information that is different. This document may only be used where it is legal to sell these securities. The information in this document may only be accurate on the date of this document.
This prospectus includes market share and industry data and forecasts that we obtained from internal company surveys, market research, consultant surveys, publicly available information and industry publications and surveys. Industry surveys, publications, consultant surveys and forecasts generally state that the information contained therein has been obtained from sources believed to be reliable, but there can be no assurance as to the accuracy and completeness of such information. We have not independently verified any of the data from third-party sources nor have we ascertained the underlying economic assumptions relied upon therein. Similarly, internal company surveys, industry forecasts and market research, which we believe to be reliable based upon management's knowledge of the industry, have not been verified by any independent sources. In addition, we do not know what assumptions regarding general economic growth were used in preparing the forecasts we cite. Except where otherwise noted, references to North America include only the United States and Canada, and statements as to our position relative to our competitors or as to market share refer to the most recent available data.
Dealer Prospectus Delivery Obligation
Until , 2004, all dealers that effect transactions in these securities, whether or not participating in this offering, may be required to deliver a prospectus. This is in addition to the dealer's obligation to deliver a prospectus when acting as an underwriter and with respect to unsold allotments or subscriptions.
In this prospectus, "Noveon International, Inc.," "Noveon International," "Noveon," the "Company," "we," "us" or "our" refer to Noveon International, Inc. (formerly known as Noveon Holdings, Inc.) and its subsidiaries, except where the context makes clear that the reference is only to Noveon International, Inc. itself and not its subsidiaries. Any references to the "Company," "we," "us" or "our" as of a date prior to February 28, 2001, the date of the completion of our acquisition of the Performance Materials Segment from the Goodrich Corporation (formerly known as The B.F.Goodrich Company), are to the Performance Materials Segment of the Goodrich Corporation, the predecessor to Noveon, Inc. Any references to "Goodrich" are to the Goodrich Corporation. Any references to "Noveon, Inc." are to Noveon, Inc., our wholly owned operating subsidiary.
Unless otherwise indicated, the information in this prospectus does not give effect to a -for-one stock split of our common stock, which will occur immediately prior to the completion of this offering.
Our Business
We are a leading global producer and marketer of technologically advanced specialty materials and chemicals used in a broad range of consumer and industrial applications. We have a number of high growth, industry-leading product franchises marketed under some of the industry's most recognized brand names including Carbopol®, TempRite®, Estane® and Hycar®. These global brands are complemented by a diverse portfolio of historically stable, cash-generating businesses. We have a significant presence in many niche product categories, where customers value our long-standing ability to provide need-specific formulations and solutions. Our products and services enhance the value of customers' end-products by improving performance, providing essential product attributes, lowering cost, simplifying processing or making them more environmentally friendly.
Through our worldwide network of 29 strategically located manufacturing facilities, we serve more than 7,000 customers operating in over 25 industries. In 2003, we generated sales of $1,135.9 million, a net loss of $7.9 million, net cash provided by operating activities of $118.0 million and Adjusted EBITDA of $201.3 million. We derived approximately 59% of our sales from the United States, 21% of our sales from Europe and 20% of our sales from the rest of the world in 2003. Our margins, combined with our strong cash flow from operations, ongoing capital efficiency efforts and available cash, provide us with significant flexibility to capitalize on future growth opportunities.
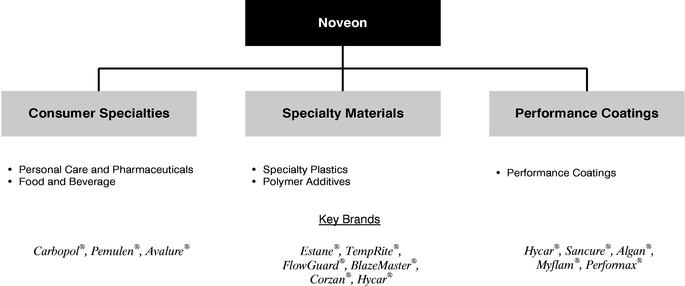
Consistent with our focus on industries and end-use applications, we have organized our business into three segments: Consumer Specialties, Specialty Materials and Performance Coatings.
1
Consumer Specialties is a global producer of specialty chemicals targeting the personal care, pharmaceutical and food and beverage industries. Key products in this segment include Carbopol® acrylic thickeners, film formers, fixatives, emollients, silicones, botanicals, active pharmaceutical ingredients and intermediates, benzoate preservatives, fragrances, synthetic food dyes and natural colorants. Primary end-uses in the personal care industry for Carbopol® acrylic thickeners include hair care, skin care and personal and oral hygiene products. In 2003, Consumer Specialties generated sales of $328.7 million, segment operating income of $47.0 million and Segment EBITDA of $73.1 million.
Specialty Materials is the largest global supplier of chlorinated polyvinyl chloride (CPVC) resins and compounds and reactive liquid polymers (RLP), sold under the respective trademarks TempRite® and Hycar®. Specialty Materials is also a leading producer of thermoplastic polyurethane (TPU) sold under the trademark Estane®. With respect to the markets in which we compete, Specialty Materials is a leading producer of cross-linked polyethylene compounds (PEX) sold under the trademark TempRite®. Applications for TempRite® resins and compounds include piping for residential and commercial plumbing and fire sprinkler systems. Applications for Estane® TPU include plastic film and sheet for various coatings processes. Applications for Hycar® RLP include engineering adhesives. Specialty Materials is also a leading North American producer of rubber and lubricant antioxidants and rubber accelerators. In 2003, Specialty Materials generated sales of $428.6 million, segment operating income of $75.8 million and Segment EBITDA of $110.6 million.
Performance Coatings is a leading global producer of high-performance polymers for specialty paper, printing and packaging, industrial and architectural specialty coatings and textile applications. Approximately 70% of Performance Coatings' sales are generated from our water-based acrylic polymers and compounds and polyurethane dispersions. We believe that we offer customized solutions to meet the specific needs of our customers sold under the trademarks Hycar®, Sancure®, Algan®, Performax® and Myflam®. In 2003, Performance Coatings generated sales of $378.6 million, segment operating income of $43.3 million and Segment EBITDA of $63.4 million.
Our Competitive Strengths
Leading Product Franchises. Approximately 65% of our 2003 EBITDA was generated by products that hold #1 or #2 global positions, including Carbopol® acrylic thickener, TempRite® CPVC, Estane® TPU and Hycar® acrylic emulsions. We have a proprietary technology position in each of these products within their respective industries, which contributed to above average industry growth rates. Carbopol® acrylic thickener volume for personal care and pharmaceuticals, measured in pounds sold, grew at a compound annual rate of approximately 8.5% per year between 1993 and 2003, while we estimate that the personal care industry grew at 3.5% during the same period. Between 1993 and 2003, volume, measured in pounds used, of our TempRite® resins and compounds grew at a compound annual rate of approximately 8.4% per year, 1.9 times the growth rate of U.S. residential construction during the same period.
Commitment to Innovation. We believe that innovation and new product development is critical to meeting our customers' needs and to fuel future growth. Our history of technological innovation includes the invention of Carbopol® acrylic thickener and the commercial development of TempRite® CPVC. Carbopol® acrylic thickener is the global leader in synthetic thickeners due to its efficient stabilizing properties and superior thickening capabilities. TempRite® CPVC is the industry standard for CPVC piping, which is a higher performance, lower cost alternative to copper and steel in household plumbing, fire sprinklers and other industrial applications. Our commitment to innovation is demonstrated by recent increases in research and development employment and spending. We have increased our research and development and technical service staff by 21%, or 64 positions, and spending has increased 21%, or $7.7 million, since 2001.
2
Customized Value-Added Products. We have developed many of our products in cooperation with our customers, often as a result of their specific needs, resulting in long-standing, loyal customer relationships. Our products generally represent a small percentage of our customers' production costs but are critical to end-product performance. In addition, many of our products are specified in our customers' formulations, resulting in significant barriers to changing suppliers. Specific examples include carbomer thickeners in personal care and pharmaceutical applications and FDA-approved polymers used in food packaging applications.
Strong Cash Flow. We generate strong cash flow from operations after capital expenditures. Since our inception in March 2001, we have generated $278.2 million in cash flow from operations after capital expenditures. Our ability to generate strong and stable cash flows is principally attributable to the diversity of our product lines, industry-leading margins, rigorous management of working capital and relatively low capital expenditures. Our strong cash flow will enable us to invest in targeted growth strategies and continue to reduce indebtedness thereby enhancing our ability to grow earnings.
Relentless Focus on Productivity Improvement. Our operating culture is based on continuing productivity improvement, maximizing operating efficiency and optimizing the use of capital resources across all production lines. Since we began operation as a stand-alone company in 2001, we have successfully implemented cost-saving initiatives that reduced our fixed manufacturing overhead by over $20 million, delayered our organization, reduced working capital, refocused our capital spending and introduced our Six Sigma productivity initiative.
Proven Management Team with Significant Equity Interest. We have a highly motivated senior management team with an average of approximately 20 years of experience in the specialty chemicals industry. Our senior management has instilled an entrepreneurial culture throughout our organization, successfully implemented leading productivity practices, reinvigorated our new product development efforts, and positioned us for strong future earnings growth and cash flow generation. As of February 29, 2004, our management and employees held outstanding shares and granted options representing approximately 9.3% of our equity.
Our Growth Strategy
Enter New Applications and End-Uses. We intend to build on our core product franchises and technology to expand our product offerings by modifying existing formulations to meet new end-use applications. For example, we pioneered the development of hand sanitizing gels by using the thickening and stabilizing properties of Carbopol® acrylic thickener to combine water and alcohol, and we broadened the use of Carbopol® acrylic thickeners into applications such as oven cleaners and alkaline batteries. We have also expanded our BlazeMaster® fire sprinkler opportunities by obtaining amendments to building codes, allowing us to participate in a broader spectrum of fire sprinkler applications, including dormitories and single and multi-family homes.
Expand Global Reach. We expect to continue to serve our existing multinational customers globally as they penetrate emerging regions and to target other customers in such regions. Our approach is to strategically add sales, marketing and research and development related personnel in selected regions and to follow with further infrastructure expansion as the markets for our customers' products develop. For example, in 2003 we acquired a controlling interest in a Thailand-based manufacturer of formulated botanical extracts used in personal care applications. This acquisition provides us with access to products that we plan to sell throughout our global distribution system. In addition, we began producing textile coating compounds and started construction of a TPU plant in China to service regional demand.
Extend Product Breadth. We expect to continue to expand our product offerings through both internal research and development and the acquisition of new formulations and products. For example,
3
in 2003, we developed and introduced Fixate™, a fixative used in hair care styling resins, allowing us to broaden our hair care application base. In addition, we acquired aliphatic TPU technologies and assets that allow us to enter high-value optical film and medical tubing applications. In 2004, we purchased Scher Chemicals, Inc., a manufacturer of emollients used in skin care, one of the largest and fastest growing applications in the personal care industry.
Continue Productivity Improvements. We expect to continue our successful cost-saving initiatives by pursuing operational efficiencies, optimizing available technologies, maintaining a lean organizational structure, reducing fixed costs, rationalizing capacity and efficiently managing capital spending. In 2002, we launched a Six Sigma initiative, which has been designed to further enhance our understanding of our customers' needs, our process capabilities and the total cost of maintaining quality. We have 21 employees trained as Six Sigma black belts throughout our Company. We are targeting an increase of 10 black belts per year. We believe this initiative is a natural extension of our productivity efforts and allows us to focus our activities on those areas expected to provide us with the highest customer impact and organizational productivity.
Actively Manage Business Portfolio. We plan to accelerate profitable growth through selected acquisitions of assets and technology that focus on high value niche applications and complement our current product offerings and capabilities. We have made 11 targeted strategic acquisitions since our inception. At the same time, we will consider selective divestitures to optimize our product portfolio and to strengthen our financial flexibility.
Other Information
We commenced operations on March 1, 2001 through the acquisition on February 28, 2001 of the Performance Materials Segment of Goodrich. The total purchase price was $1,386.5 million before fees and expenses. The textile dyes and drug delivery system businesses that were operated as part of the Performance Materials Segment of Goodrich were not part of the acquisition.
PMD Investors I LLC and PMD Investors II LLC, collectively referred to in this prospectus as PMD, are entities owned by investor groups led by AEA Investors LLC, the successor company of AEA Investors Inc., referred to in this prospectus as AEA. DLJ Merchant Banking Partners III, LP and affiliated funds are affiliates of Credit Suisse First Boston LLC. DLJ Merchant Banking Partners III, LP and its affiliated funds that hold shares of our common stock are collectively referred to as DLJ Merchant Banking in this prospectus. MidOcean Capital/PMD Investors, LLC is referred to as MidOcean in this prospectus. We have no independent operations or investments other than our investment in Noveon, Inc.
We and Noveon, Inc. were capitalized as follows:
- •
- PMD, DLJ Merchant Banking and MidOcean contributed $355.0 million of cash as equity to us, which we in turn contributed to Noveon, Inc. Of this amount, PMD contributed $155.0 million, DLJ Merchant Banking contributed $150.0 million and MidOcean contributed $50.0 million. The price paid per share of our common stock by PMD, DLJ Merchant Banking and MidOcean, after giving effect to a -for-one stock split of our common stock, that will occur immediately prior to the completion of this offering, was $ ;
- •
- We issued a $172.0 million seller note to Goodrich, which was subsequently sold by Goodrich in March 2003 to various holders in a private placement; and
- •
- Noveon, Inc. issued $275.0 million of senior subordinated notes and borrowed $635.0 million under senior credit facilities. The credit facilities are secured by substantially all of our assets, substantially all of the assets of Noveon, Inc. and its domestic subsidiaries, 100% of the capital stock of its direct and indirect restricted domestic subsidiaries and 65% of the capital stock of its first tier foreign subsidiaries. In addition, the credit facilities are guaranteed by us and each of the direct and indirect material domestic subsidiaries of Noveon, Inc.
Our principal executive offices are located at 9911 Brecksville Road, Cleveland, Ohio 44141 and our telephone number is 216-447-5000. Our website is located at www.noveoninc.com. Information contained on our website does not constitute a part of this prospectus.
4
| Common stock offered: | ||||
By us | shares ( shares if the underwriters' over-allotment option is fully exercised). | |||
By the selling stockholders | shares ( shares if the underwriters' over-allotment option is fully exercised). | |||
Total | shares ( shares if the underwriters' over-allotment option is fully exercised). | |||
Common stock outstanding after the offering | shares. | |||
Use of proceeds | We estimate that our net proceeds from the sale of the shares offered by us, after deducting estimated expenses and underwriting discounts and commissions of $ million, will be approximately $ million (approximately $ million if the underwriters' over-allotment option is fully exercised). We intend to use substantially all of the net proceeds from this offering and the proposed concurrent senior notes offering to repay approximately $ million of our debt obligations outstanding under the seller note, including call premiums and accrued interest, to repay a portion of our term loans and to make total payments of $ million in connection with the management and advisory services agreements, which are being terminated. We will not receive any proceeds from the sale of shares by the selling stockholders. See "Use of Proceeds." | |||
Proposed NYSE symbol | "NOV." | |||
Risk Factors | See "Risk Factors" beginning on page 11 of this prospectus for a discussion of factors that you should carefully consider before deciding to invest in shares of our common stock. | |||
We are contemplating the issuance of debt securities in connection with this offering. Any offering of debt securities concurrently with this offering would not be a condition to the completion of this offering.
Unless we specifically state otherwise, the information in this prospectus does not take into account the sale of up to shares of common stock, which the underwriters have the option to purchase from us and the selling stockholders to cover over-allotments, and an aggregate of shares of common stock reserved for issuance under outstanding stock options and under our Employee Stock Purchase Plan. Options to purchase shares of common stock will be outstanding upon completion of this offering, of which options to purchase shares will be exercisable upon completion of this offering at a weighted average exercise price of $ per share.
5
SUMMARY CONSOLIDATED FINANCIAL AND OTHER DATA
The following table presents summary financial data at the dates and for the periods indicated. The data for the years ended December 31, 1999 and 2000 and the two months ended February 28, 2001 are derived from the audited consolidated historical financial statements of the Performance Materials Segment of Goodrich. The data for the ten months ended December 31, 2001 and the years ended December 31, 2002 and 2003 are derived from our audited consolidated financial statements. The unaudited, as adjusted, summary financial data for the year ended December 31, 2003 include the impact of this offering and application of the net proceeds therefrom as if such transactions occurred at the beginning of the period presented. The information set forth below should be read in conjunction with the consolidated financial statements and the related notes and "Management's Discussion and Analysis of Financial Condition and Results of Operations" and other financial information included elsewhere in this prospectus.
| | Performance Materials Segment of Goodrich | Noveon International, Inc. | |||||||||||||||||
|---|---|---|---|---|---|---|---|---|---|---|---|---|---|---|---|---|---|---|---|
| | | | Two Months Ended February 28 2001 | Ten Months Ended December 31 2001 | | | |||||||||||||
| | Years Ended December 31 | Years Ended December 31 | |||||||||||||||||
| | 1999 | 2000 | 2002 | 2003 | |||||||||||||||
| | (dollars in millions) | ||||||||||||||||||
| Statement of Operations Data: | |||||||||||||||||||
| Sales | $ | 1,217.7 | $ | 1,167.7 | $ | 187.0 | $ | 876.4 | $ | 1,069.3 | $ | 1,135.9 | |||||||
| Cost of sales | 832.2 | 819.5 | 137.3 | 628.1 | 726.8 | 809.4 | |||||||||||||
| Gross profit | 385.5 | 348.2 | 49.7 | 248.3 | 342.5 | 326.5 | |||||||||||||
| Selling and administrative expenses | 218.2 | 201.1 | 35.2 | 160.5 | 202.8 | 204.8 | |||||||||||||
| Amortization expense | 24.6 | 24.4 | 4.0 | 26.5 | 13.9 | 14.7 | |||||||||||||
| Restructuring and severance costs | 37.3 | 40.5 | — | 3.1 | 6.1 | 13.2 | |||||||||||||
| Operating income | 105.4 | 82.2 | 10.5 | 58.2 | 119.7 | 93.8 | |||||||||||||
| Interest (income) expense—net | (0.5 | ) | (4.4 | ) | (0.6 | ) | 92.6 | 99.6 | 90.9 | ||||||||||
| Other expense (income)—net | 1.5 | 0.4 | 1.5 | 0.7 | (10.0 | ) | 1.1 | ||||||||||||
| Income (loss) before income taxes and cumulative effect of accounting change | 104.4 | 86.2 | 9.6 | (35.1 | ) | 30.1 | 1.8 | ||||||||||||
| Income tax expense | 42.3 | 35.9 | 4.0 | 4.6 | 6.4 | 9.2 | |||||||||||||
| Income (loss) before cumulative effect of accounting change | 62.1 | 50.3 | 5.6 | (39.7 | ) | 23.7 | (7.4 | ) | |||||||||||
| Cumulative effect of accounting change—net of tax | — | — | — | — | — | (0.5 | ) | ||||||||||||
| Net income (loss) | $ | 62.1 | $ | 50.3 | $ | 5.6 | $ | (39.7 | ) | $ | 23.7 | $ | (7.9 | ) | |||||
6
| | Year Ended December 31, 2003 | |||
|---|---|---|---|---|
| | (dollars in millions, except share information) (unaudited) | |||
| As Adjusted Data(1): | ||||
| Income (loss) before cumulative effect of accounting change | $ | |||
| Cumulative effect of accounting change—net of tax | ||||
| Net income (loss) | $ | |||
Basic earnings per share: | ||||
| Income (loss) before cumulative effect of accounting change | $ | |||
| Cumulative effect of accounting change—net of tax | ||||
| Net income (loss) | $ | |||
| Diluted earnings per share: | ||||
| Income (loss) before cumulative effect of accounting change | $ | |||
| Cumulative effect of accounting change—net of tax | ||||
| Net income (loss) | $ | |||
Weighted-average shares outstanding: | ||||
| Basic | ||||
| Diluted | ||||
| | Performance Materials Segment of Goodrich | Noveon International, Inc. | |||||||||||||||||
|---|---|---|---|---|---|---|---|---|---|---|---|---|---|---|---|---|---|---|---|
| | | | Two Months Ended February 28 2001 | Ten Months Ended December 31 2001 | | | |||||||||||||
| | Years Ended December 31 | Years Ended December 31 | |||||||||||||||||
| | 1999 | 2000 | 2002 | 2003 | |||||||||||||||
| | (dollars in millions) | ||||||||||||||||||
| Other Data: | |||||||||||||||||||
| Net cash provided (used) by operating activities | $ | 156.1 | $ | 180.9 | $ | (31.6 | ) | $ | 153.9 | $ | 143.7 | $ | 118.0 | ||||||
| Net cash (used) by investing activities | (97.3 | ) | (75.3 | ) | (7.6 | ) | (1,218.7 | ) | (79.7 | ) | (88.7 | ) | |||||||
| Net cash (used) provided by financing activities | (54.4 | ) | (100.2 | ) | 37.5 | 1,188.4 | (112.3 | ) | (1.2 | ) | |||||||||
| EBITDA(2) | 190.8 | 168.5 | 23.4 | 140.5 | 214.4 | 184.1 | |||||||||||||
| EBITDA margin(3) | 15.7 | % | 14.4 | % | 12.5 | % | 16.0 | % | 20.1 | % | 16.2 | % | |||||||
| Adjusted EBITDA(4) | $ | 228.1 | $ | 209.0 | $ | 23.4 | $ | 146.9 | $ | 211.8 | $ | 201.3 | |||||||
| Adjusted EBITDA margin(5) | 18.7 | % | 17.9 | % | 12.5 | % | 16.8 | % | 19.8 | % | 17.7 | % | |||||||
| Depreciation and amortization | $ | 86.9 | $ | 86.7 | $ | 14.4 | $ | 83.0 | $ | 84.7 | $ | 91.4 | |||||||
| Capital expenditures | 79.6 | 64.0 | 7.6 | 28.5 | 52.3 | 56.6 | |||||||||||||
7
| | Performance Materials Segment of Goodrich | Noveon International, Inc | |||||||||||||||
|---|---|---|---|---|---|---|---|---|---|---|---|---|---|---|---|---|---|
| | December 31 | December 31, 2003 | |||||||||||||||
| | 1999 | 2000 | 2001 | 2002 | Actual | As Adjusted(1) | |||||||||||
| | (dollars in millions) | ||||||||||||||||
| Balance Sheet Data: | |||||||||||||||||
| Cash and cash equivalents | $ | 10.6 | $ | 15.7 | $ | 124.0 | $ | 79.5 | $ | 116.8 | |||||||
| Goodwill | 342.1 | 307.0 | 346.9 | 367.3 | 416.0 | ||||||||||||
| Identifiable intangible assets—net | 60.9 | 58.9 | 192.0 | 182.1 | 172.9 | ||||||||||||
| Total assets | 1,430.6 | 1,359.2 | 1,664.8 | 1,634.5 | 1,757.6 | ||||||||||||
| Total debt | 42.7 | 30.0 | 1,083.9 | 992.7 | 1,030.3 | ||||||||||||
| Goodrich investment | 950.9 | 910.4 | — | — | — | ||||||||||||
| Stockholders' equity | — | — | 309.1 | 346.5 | 412.3 | ||||||||||||
- (1)
- The as adjusted balance sheet data assumes the sale by us of (i) shares in this offering at an assumed initial offering price of $ per share (the midpoint of the range) and (ii) $ million of % senior notes due 20 in a concurrent offering, and the application of the proceeds of these offerings (a) to the total payment of $ million of our debt obligations outstanding under the seller note including premiums and accrued interest, (b) to repay a portion of our term loans and (c) to the total payments of $ million to be paid in connection with the management and advisory services agreements, which are being terminated. The as adjusted statement of operations data reflect a reduction in interest expense of $ million, and a reduction of selling and administrative expenses of $4.0 million in connection with the termination of the management and advisory services agreements for the year ended December 31, 2003. The as adjusted statement of operations data and per share data do not reflect the payments of $ million to be paid in connection with the management and advisory services agreements, and the call premiums associated with the repayment of a portion of the seller note. See "Use of Proceeds" and "Certain Relationships and Related Transactions—Management and Advisory Services Agreements."
- (2)
- EBITDA is defined as net income (loss) before cumulative effect of accounting change, income tax expense, interest (income) expense, depreciation and amortization. We present EBITDA because we consider it an important supplemental measure of our performance and believe it is frequently used by securities analysts, investors and other interested parties in the evaluation of companies in our industry, many of which present EBITDA when reporting their results.
- •
- EBITDA does not reflect our cash expenditures, or future requirements, for capital expenditures or contractual commitments;
- •
- EBITDA does not reflect changes in, or cash requirements for, our working capital needs;
- •
- EBITDA does not reflect the significant interest expense or cash requirements necessary to service interest or principal payments on our debts;
- •
- Although depreciation and amortization are non-cash charges, the assets being depreciated and amortized will often have to be replaced in the future, and EBITDA does not reflect any cash requirements for such replacements; and
We also use EBITDA because our credit agreement and our indenture use EBITDA with additional adjustments to measure our compliance with covenants such as interest coverage, leverage ratio and debt incurrence and because compensation agreements with our employees use EBITDA with additional adjustments as a performance measure.
EBITDA has limitations as an analytical tool, and you should not consider it in isolation or as a substitute for analysis of our financial results prepared in accordance with generally accepted accounting principles, or GAAP. Some of these limitations are:
8
- •
- Other companies in our industry may calculate EBITDA differently than we do, limiting its usefulness as a comparative measure.
Because of these limitations, EBITDA should not be considered as a measure of discretionary cash available to us to invest in the growth of our business. We compensate for these limitations by relying primarily on our GAAP results and using EBITDA and Adjusted EBITDA only supplementally. See the Consolidated Statement of Cash Flows included in our financial statements located elsewhere in this prospectus.
- (3)
- EBITDA margin is defined as EBITDA as a percentage of sales.
- (4)
- We present Adjusted EBITDA as a further supplemental measure of our performance. Adjusted EBITDA data is an important metric used by management with respect to both the performance of our fundamental business activities as well as our ability to meet future debt service, capital expenditures and working capital needs. We prepare Adjusted EBITDA by adjusting EBITDA to eliminate the impact of the gain on the early extinguishment of debt, the payments in connection with the management and advisory services agreements, which are being terminated, and restructuring and severance costs. We consider these items to be one-time costs and gains and not indicative of our ongoing operating performance. You are encouraged to evaluate each adjustment and the reasons we consider them appropriate for supplemental analysis. As an analytical tool, Adjusted EBITDA is subject to all of the limitations applicable to EBITDA. In addition, in evaluating Adjusted EBITDA, you should be aware that in the future we may incur expenses similar to the adjustments in this presentation. Our presentation of Adjusted EBITDA should not be construed as an implication that our future results will be unaffected by unusual or non-recurring items.
Adjusted EBITDA is calculated by adding to EBITDA certain items of expense and deducting from EBITDA certain items of income that we believe are not indicative of our future performance consisting of (i) gain on early extinguishment of debt, (ii) management and advisory fees and (iii) restructuring and severance costs.
The following table reconciles net income (loss) to EBITDA and EBITDA to Adjusted EBITDA for the periods indicated:
| | Performance Materials Segment of Goodrich | Noveon International, Inc. | |||||||||||||||||
|---|---|---|---|---|---|---|---|---|---|---|---|---|---|---|---|---|---|---|---|
| | Years Ended December 31 | Two Months Ended February 28 2001 | Ten Months Ended December 31 2001 | Years Ended December 31 | |||||||||||||||
| | 1999 | 2000 | 2002 | 2003 | |||||||||||||||
| | (dollars in millions) | ||||||||||||||||||
| Net income (loss) | $ | 62.1 | $ | 50.3 | $ | 5.6 | $ | (39.7 | ) | $ | 23.7 | $ | (7.9 | ) | |||||
| Cumulative effect of accounting change—net of tax | — | — | — | — | — | 0.5 | |||||||||||||
| Income tax expense | 42.3 | 35.9 | 4.0 | 4.6 | 6.4 | 9.2 | |||||||||||||
| Interest (income) expense—net | (0.5 | ) | (4.4 | ) | (0.6 | ) | 92.6 | 99.6 | 90.9 | ||||||||||
| Depreciation and amortization | 86.9 | 86.7 | 14.4 | 83.0 | 84.7 | 91.4 | |||||||||||||
| EBITDA | 190.8 | 168.5 | 23.4 | 140.5 | 214.4 | 184.1 | |||||||||||||
| Gain on early extinguishment of debt | — | — | — | — | (12.4 | ) | — | ||||||||||||
| Management and advisory fees | — | — | — | 3.3 | 3.7 | 4.0 | |||||||||||||
| Restructuring and severance costs | 37.3 | 40.5 | — | 3.1 | 6.1 | 13.2 | |||||||||||||
| Adjusted EBITDA | $ | 228.1 | $ | 209.0 | $ | 23.4 | $ | 146.9 | $ | 211.8 | $ | 201.3 | |||||||
9
EBITDA and Adjusted EBITDA presented in this table are measures of our performance that are not required by, or presented in accordance with, GAAP. EBITDA and Adjusted EBITDA are not measurements of our financial performance under GAAP and should not be considered as alternatives to net income or any other performance measures derived in accordance with GAAP or as an alternative to net cash provided by operating activities as a measure of liquidity.
Segment EBITDA is defined as operating income of a segment plus depreciation and amortization. The following table reconciles segment operating income to Segment EBITDA:
| | Consumer Specialties | Specialty Materials | Performance Coatings | ||||||
|---|---|---|---|---|---|---|---|---|---|
| | Year Ended December 31, 2003 | ||||||||
| | (dollars in millions) | ||||||||
| Segment operating income | $ | 47.0 | $ | 75.8 | $ | 43.3 | |||
| Depreciation and amortization | 26.1 | 34.8 | 20.1 | ||||||
| Segment EBITDA | $ | 73.1 | $ | 110.6 | $ | 63.4 | |||
- (5)
- Adjusted EBITDA margin is defined as Adjusted EBITDA as a percentage of sales.
10
You should carefully consider the risks described below, as well as other information included in this prospectus, before making an investment decision. The risks described below summarize the material risks involved in investing in our common stock but are not the only ones we face. Our business, results of operations or financial condition could be materially and adversely affected by any of these risks. The value of your investment may decrease due to any of these risks.
Increases in raw material prices and reductions in availability of raw material supplies could disrupt our operations.
We use a substantial amount of a variety of specialty and commodity chemicals in our manufacturing processes. These raw materials are generally available from numerous independent suppliers. We typically purchase our major raw materials on a contract basis in order to insure that we receive minimum required volumes. Our most significant raw materials include toluene, ethyl and butyl acrylate, glacial acrylic acid, chlorine, MDI, PTMEG, aniline, acetone, PVC, styrene and ethylene glycol, although we do purchase approximately 1,500 other materials. Some of the raw materials that we use are derived from petrochemical-based feedstocks, such as crude oil and natural gas. There have been historical periods of rapid and significant movements in the prices of these feedstocks both upward and downward. Any significant variations in the cost and availability of our specialty and commodity materials may negatively impact our business, financial condition or results of operations. We typically do not enter into hedging arrangements with respect to raw materials. We selectively pass changes in the prices of raw materials to our customers from time to time. However, we cannot always do so, and any limitation on our ability to pass through any price increases could disrupt our operations.
Competition and consolidation in our industry may put downward pressure on our prices and margins.
We operate in a highly competitive and consolidating environment. We compete with a wide variety of product materials and specialty chemicals manufacturers. Some of our competitors are larger, have greater financial resources and have less debt than we do. As a result, these competitors may be better able to withstand a change in conditions within our industry, a change in the prices of raw materials or a change in the economy as a whole. In addition, we could be subject to adverse results caused by our competitors' pricing decisions. Current and future consolidation among our competitors and customers may cause loss of market share as well as put downward pressure on pricing. These competitors may also be able to maintain significantly greater operating and financial flexibility than we do. Additionally, a number of our niche product applications are customized or sold for highly specialized uses. Competitors that have greater financial, technological, manufacturing and marketing resources than we do and that do not currently market similar products may do so in the future. Increased competition could put downward pressure on our prices and margins.
Our business has cyclical exposure, which may reduce demand for our products.
A substantial portion of our sales is attributable to products and markets that historically have been cyclical and sensitive to relative changes in supply and demand and general economic conditions. The demand for our products depends, in part, upon the general economic conditions of the industries of our customers. Downward economic cycles in our customers' industries may reduce sales of our products. It is not possible to predict accurately the factors that will affect demand for our products in the future.
11
Our indebtedness, including the senior notes proposed to be issued concurrently with this offering, could restrict our operations and make us more vulnerable to adverse economic conditions.
We now have, and after this offering and the proposed concurrent senior notes offering, will continue to have, a significant amount of indebtedness. As of December 31, 2003, our total debt was $1,030.3 million. On an as adjusted basis, as if we had completed this offering and the proposed concurrent senior notes offering, and used the net proceeds therefrom as described in "Use of Proceeds," our total debt would have been $ million, on December 31, 2003. For the year ended December 31, 2003, we made cash principal and interest payments totaling $67.1 million, excluding the non-cash accretion of interest on the seller note, which we will repay with the proceeds of this offering. Holding all other variables constant, if interest rates increased or decreased by 1%, interest expense for the year ended December 31, 2003 would have increased or decreased by approximately $3.8 million. In addition, we have guaranteed Noveon, Inc.'s outstanding obligations of $594.9 million, including letters of credit, and maximum obligations of aggregate principal amount of $714.1 million, under our credit facilities. Our total debt could increase, as we have a total borrowing capacity of $125.0 million under our credit facilities, of which $119.2 million was available as of December 31, 2003, net of $5.8 million of outstanding letters of credit. Furthermore, the terms of the indentures governing Noveon, Inc.'s outstanding senior subordinated notes and our senior notes proposed to be issued concurrently with this offering allow us and our subsidiaries to incur additional amounts of indebtedness, including up to $65.0 million at any time under various baskets, and unlimited additional borrowings, so long as we satisfy a fixed charge coverage ratio after giving effect to those borrowings. Based on this fixed charge coverage ratio in the senior subordinated notes indenture, as of December 31, 2003, we could have incurred an additional $478.0 million of indebtedness.
Our current and future indebtedness could have important consequences to you. For example, it could:
- •
- impair our ability to make investments and obtain additional financing for working capital, capital expenditures, acquisitions or general corporate or other purposes;
- •
- limit our ability to use operating cash flow in other areas of our business because we must dedicate a substantial portion of these funds to make principal and interest payments on our indebtedness;
- •
- limit our ability to borrow funds that may be necessary to operate or expand our business;
- •
- put us at a competitive disadvantage to competitors that have less debt;
- •
- increase our vulnerability to interest rate increases; and
- •
- hinder our ability to adjust to rapidly changing economic and industry conditions.
Our ability to meet our debt service and other obligations may depend in significant part on the extent to which we can successfully implement our business strategy. We may not be able to implement, or realize the benefits of, our business strategy.
We may incur more indebtedness, which could exacerbate the risks described above.
We may be able to incur additional indebtedness in the future. As described above, under our credit facilities, we have additional borrowing capacity of up to $125.0 million, of which $119.2 million was available as of December 31, 2003, net of $5.8 million of outstanding letters of credit. Additionally, the terms of the indentures relating to Noveon, Inc.'s senior subordinated notes and our proposed % senior notes do not prohibit us or our subsidiaries from incurring indebtedness, although the indentures do contain limitations on additional indebtedness. If new indebtedness is added to our current levels of indebtedness, the risks described above could increase.
12
We may not be able to generate sufficient cash flow to meet our debt service obligations.
Our ability to generate sufficient cash flow from operations to make scheduled payments on our debt obligations will depend on our future financial performance, which will be affected by a range of economic, competitive and business factors, many of which are outside of our control. If we do not generate sufficient cash flow from operations to satisfy our debt obligations, including payments on Noveon, Inc.'s senior subordinated notes and our proposed % senior notes, we may have to undertake alternative financing plans, such as refinancing or restructuring our debt, selling assets, reducing or delaying capital investments or seeking to raise additional capital. We may not have sufficient availability under the restricted payments test in the indenture governing Noveon, Inc.'s senior subordinated notes to make scheduled payments on our proposed % senior notes. Our inability to generate sufficient cash flow to satisfy our debt obligations, to refinance our obligations on commercially reasonable terms, or to successfully complete alternative financing plans, could have an adverse effect on our business, financial condition, results, operations and prospects. See "Management's Discussion and Analysis of Financial Condition and Results of Operations—Liquidity and Capital Resources."
The debt agreements of our subsidiaries contain, and any future financing agreements we enter into may contain, restrictions that will limit our ability to finance operations and capital needs or engage in other business activities.
Our debt agreements contain covenants that, among other things, restrict our ability to:
- •
- incur additional indebtedness (including guarantees);
- •
- make some acquisitions;
- •
- pay dividends and make other restricted payments;
- •
- issue certain types of stock;
- •
- engage in some transactions with affiliates;
- •
- enter into sale and leaseback transactions;
- •
- make loans and investments; and
- •
- enter into new lines of business.
In addition, our credit facilities require Noveon, Inc. to comply with specified financial covenants including maintenance of net worth, limitations on capital expenditures, minimum interest coverage ratios and maximum leverage ratios.
Our ability to meet these covenants and requirements in the future may be affected by events beyond our control, including prevailing economic, financial and industry conditions. Our breach or failure to comply with any of these covenants could result in a default under our credit facilities or the indenture governing our senior subordinated notes. If we default under our credit facilities, the lenders could cease to make further extensions of credit, cause all of our outstanding debt obligations under these credit facilities to become due and payable, require us to apply all of our available cash to repay indebtedness under these credit facilities, prevent us from making debt service payments on any other indebtedness we owe and/or proceed against the collateral granted to them to secure repayment of those amounts. The credit facilities are secured by substantially all of our assets, substantially all of the assets of Noveon, Inc. and its domestic subsidiaries, 100% of the capital stock of its direct and indirect restricted domestic subsidiaries and 65% of the capital stock of its first tier foreign subsidiaries. If the indebtedness under our credit facilities or our outstanding senior subordinated notes is accelerated, we may not have sufficient assets to repay amounts due under these existing debt agreements or on other debt securities then outstanding. See "Description of Our Indebtedness."
13
Environmental regulations may cause us to incur significant costs and liabilities.
Our operations are subject to extensive environmental laws and regulations by foreign, federal, state and local authorities. These include laws and regulations pertaining to pollution, the protection of human health and the environment, air emissions, wastewater discharges, occupational safety and health, the generation, handling, treatment, remediation, use, storage and release, and exposure to hazardous substances and wastes. We have incurred, and will continue to incur, costs and capital expenditures in complying with these laws and regulations and to obtain and maintain all necessary permits. Any failure by us to comply with such laws and regulations could subject us to significant future fines, penalties and other liabilities.
A majority, but not all, of our properties have been the subject of environmental site assessments performed by outside environmental consultants and our environmental engineers to determine the level of environmental risk. However, not all potential instances of either environmental non-compliance or soil and groundwater contamination may have been identified, even at those sites where environmental site assessments have been conducted. Accordingly, we may discover previously unknown environmental conditions and the cost of remediating such conditions could be material.
Several of our facilities have environmental cleanups that are currently in process and for which Goodrich provided an indemnity. In addition to Goodrich's indemnity, there are several other indemnities provided from other third parties such as past owners of the facilities. However, if Goodrich or the third party indemnitors become unable to, or otherwise do not, comply with their respective indemnity obligations in the future, we could become subject to significant liabilities.
Estimates that are particularly sensitive to future changes include contingent liabilities recorded for environmental remediation. Estimated future environmental remediation costs are subject to change due to such factors as the unknown magnitude of cleanup costs, the unknown time and extent of such remedial actions that may be required, and the determination of our liability in proportion to that of other responsible parties.
In addition, environmental laws and regulations, and their interpretations, are constantly evolving and it is impossible to predict accurately the effect that changes in these laws and regulations, or their interpretation, may have upon our business, financial condition or results of operations. Should environmental laws and regulations, or their interpretations become more stringent, the costs of compliance could increase. If we cannot pass along future costs to our customers, any increases may have an adverse effect on our business, financial condition or results of operations. See "Management's Discussion and Analysis of Financial Condition and Results of Operations—Critical Accounting Policies and Estimates—Environmental Liabilities" and "Business—Health, Safety and Environmental Matters."
International social, political and economic conditions may adversely affect our operating performance.
Our international operations are subject to risks, including currency exchange controls, labor unrest, regional economic uncertainty, political instability, terrorism, expropriation of property, restrictions on the transfer of funds into or out of a country, trade restrictions, export duties, taxes and quotas, domestic and foreign customs and tariffs, and current and changing regulatory environments. These events could have an adverse effect on our international operations in the future by reducing the demand for our products, increasing the prices at which we can sell our products or otherwise having an adverse effect on our operating performance.
Currency translation risk and currency transaction risk may adversely affect our results of operations.
The financial condition and results of operations of each foreign operating subsidiary are reported in the relevant local currency and then translated to U.S. dollars at the applicable currency exchange rate for inclusion in our financial statements. Exchange rates between these currencies and U.S. dollars in recent years have fluctuated significantly and may do so in the future. For the year ended December 31, 2003, we generated approximately 31% of our sales in foreign currencies, and we
14
incurred approximately 28% of our total costs in foreign currencies. Significant changes in the value of the euro relative to the U.S. dollar could also have an adverse effect on our financial condition and results of operations and our ability to meet interest and principal payments on euro-denominated debt, including borrowings under our credit facilities, and U.S. dollar- denominated debt, including the senior subordinated notes and borrowings under the credit facilities. In addition to currency translation risks, we incur currency transaction risk whenever one of our operating subsidiaries enters into either a purchase or a sales transaction using a different currency from the currency in which it receives revenues. See "Management's Discussion and Analysis of Financial Condition and Results of Operations." Given the volatility of exchange rates, we may not be able to effectively manage our currency translation and/or transaction risks, and any volatility in currency exchange rates may have an adverse effect on our financial condition or results of operations.
The patents and confidentiality agreements we rely on to protect our intellectual property may be challenged or rendered unenforceable, which could result in a competitive disadvantage.
Protection of our proprietary processes, methods and compounds and other technology is important to our business. Consequently, we rely on enforcement and protection of our patents. While a presumption of validity exists with respect to patents issued to us in U.S. and non-U.S. jurisdictions, our patents may be challenged, invalidated, circumvented, infringed upon or rendered unenforceable. Furthermore, any pending patent application filed by us may not result in an issued patent, and if patents are issued to us, those patents may not provide meaningful protection against competitors or against competitive technologies.
We also rely upon unpatented proprietary manufacturing expertise, continuing technological innovation and other trade secrets, as well as trademarks, to develop and maintain our competitive position. While we generally enter into confidentiality agreements with our employees and third parties to protect our intellectual property, these agreements may be breached, may not provide meaningful protection for our trade secrets or proprietary manufacturing expertise or may not provide for adequate remedies in the event of an unauthorized use or disclosure of our trade secrets and manufacturing expertise. In addition, others may obtain knowledge of our trade secrets through independent development or other access by legal means. The failure of our patents, the failure to enforce our patents, or the failure of our confidentiality agreements to protect our processes, equipment, technology, trade secrets and proprietary manufacturing expertise, methods and compounds, or the failure to maintain and protect our trademark rights, could result in a competitive disadvantage.
In the future, we may have to rely on litigation to enforce our intellectual property rights and contractual rights. In addition, we may face claims of infringement that could interfere with our ability to use technology or other intellectual property rights that are material to our business operations. If litigation that we initiate is unsuccessful, we may not be able to protect the value of some of our intellectual property. In the event a claim of infringement against us is successful, we may be required to pay royalties or license fees to continue to use technology or other intellectual property rights that we have been using or we may be unable to obtain necessary licenses from third parties at a reasonable cost or within a reasonable time. Any litigation of this type, whether successful or unsuccessful, could result in substantial costs to us and diversions of some of our resources. Our products and services may potentially infringe on the intellectual property rights of third parties and our intellectual property rights may not have the value we believe them to have, which could result in a competitive disadvantage or adversely affect our business.
We may be unable to respond effectively to technological changes in our industry, which could put us at a competitive disadvantage.
Our future business success will depend upon our ability to maintain and enhance our technological capabilities, develop and market products and applications that meet changing customer needs and successfully anticipate or respond to technological changes on a cost-effective and timely
15
basis. Our inability to anticipate, respond to or utilize changing technologies could put us at a competitive disadvantage.
As part of our strategy to enter new applications and end users and to expand our global reach, we have acquired, and may continue to acquire, other entities. If we make acquisitions in the future, we may experience problems integrating new businesses and assets and allocating management resources.
Identifying, acquiring and integrating businesses requires substantial management, financial and other resources and may pose several risks, some or all of which could have a material adverse effect on our business, financial condition or results of operations. These risks include:
- •
- unforeseen operating difficulties and expenditures;
- •
- difficulties in assimilation of acquired personnel, operations and technologies;
- •
- the need to manage a significantly larger and more geographically dispersed business;
- •
- increased indebtedness;
- •
- diversion of management's attention from ongoing development of our business or other business concerns;
- •
- potential loss of customers;
- •
- failure to retain key personnel of the acquired business; and
- •
- the use of substantial amounts of our available cash and/or credit facilities.
Our production facilities are subject to operating risks that may adversely affect our operations.
We are dependent on the continued operation of our production facilities. These production facilities are subject to hazards associated with the manufacturing, handling, storage and transportation of chemical materials and products, including pipeline leaks and ruptures, explosions, fires, inclement weather and natural disasters, mechanical failure, unscheduled downtime, labor difficulties, transportation interruptions, remediation complications, chemical spills, discharges or releases of toxic or hazardous substances or gases, storage tank leaks and other environmental risks. These hazards can cause personal injury and loss of life, severe damage to, or destruction of, property and equipment and environmental damage, fines and liabilities and could have an adverse effect on our business, financial condition or results of operations. In addition, some of our production facilities are co-located at sites where our neighbors face the same operational risks and, in some cases, they provide critical supplies and/or services, and any disruption in those supplies and/or services could affect our operations.
Our production facilities are of the type that may attract terrorist attacks, and any attack may disrupt our operations and cause us to incur significant costs and liabilities.
Uncertainty surrounding the possibility and scope of terrorist attacks may impact our operations in unpredictable ways, including the possibility that our chemical production facilities may become direct targets, or indirect casualties, of possible terrorist attacks. While our production facilities are under a heightened level of security, this level of security may be insufficient to prevent a terrorist attack. The resulting damage would be difficult to assess, may be severe and could include loss of life and property damage. Available insurance coverage may not be sufficient to cover all of the damage incurred or may be prohibitively expensive. In addition, some of our production and other facilities are co-located at sites where our neighbors may be potential targets of terrorist attacks. The resulting collateral damage may be significant and substantial.
Certain of our employees are covered by collective bargaining agreements, and the failure to renew these agreements could result in labor disruptions and increased labor costs.
Approximately 24% of our domestic employees at seven of our U.S. sites are organized by labor unions with collective bargaining agreements that are subject to renegotiation, with five of these
16
agreements expiring in 2004 and 2005. While we believe our present labor relations to be satisfactory, our failure to renew these agreements on reasonable terms as the current agreements expire could result in labor disruptions and increased labor costs.
Present and future litigation may adversely affect our results of operations.
We are a defendant in lawsuits that result from, and are incidental to, the conduct of our business. These suits concern, and future suits may concern, issues, including product liability, contract disputes, labor-related matters, environmental proceedings, property damage, personal injury matters and patent infringement. It is not feasible to predict the outcome of all pending or future suits and claims, and the ultimate resolution of these matters could have an adverse effect upon our business, financial condition or results of operations.
We are subject to government regulation that may adversely affect our results of operations.
We are subject to regulation by many U.S. and non-U.S. supranational, national, federal, state and local governmental authorities. In some circumstances, before we may sell some of our products, these authorities must approve these products, our manufacturing processes and facilities. We are also subject to ongoing reviews of our products and manufacturing processes.
In order to obtain regulatory approval of various new products, we must, among other things, demonstrate to the relevant authority that the product is safe and effective for its intended uses and that we are capable of manufacturing the product in accordance with current regulations. The process of seeking approvals can be costly, time consuming and subject to unanticipated and significant delays, and approvals may not be granted to us on a timely basis, if at all. Any delay in obtaining, or any failure to obtain or maintain, these approvals would adversely affect our ability to introduce new products and to generate revenue from those products.
New laws and regulations may be introduced in the future that could result in additional compliance costs, seizures, confiscation, recall or monetary fines, any of which could prevent or inhibit the development, distribution and sale of our products. If we fail to comply with applicable laws and regulations, we may be subject to civil remedies, including fines, injunctions, recalls, seizures or revocation of regulatory approvals, which could have an adverse effect on our business, financial condition or results of operations.
Goodwill impairment may unpredictably affect our results of operations in the future.
In June 2001, the Financial Accounting Standards Board issued Statement of Financial Accounting Standards, or SFAS, No. 141, "Business Combinations," and SFAS No. 142, "Goodwill and Intangible Assets," effective for fiscal years beginning after December 15, 2001. Under the rules, goodwill (and intangible assets deemed to have indefinite lives) may no longer be amortized and are subject to annual impairment tests in accordance with SFAS No. 142. Other intangible assets continue to be amortized over their remaining useful lives. We adopted SFAS No. 142 in our first quarter of 2002. During the second quarter of 2002, we performed the first of the required impairment tests of goodwill as of January 1, 2002. During the fourth quarters of 2003 and 2002, we performed our annual impairment tests of goodwill. We have determined that no goodwill impairment had occurred.
Future events could cause the impairment of goodwill associated with any of our reporting units. Any resulting impairment loss may have a material adverse impact on our results of operations in any future period in which we record a charge for it. In addition, a significant impairment of goodwill may cause Noveon, Inc. to be in default under the net worth covenant of our credit facilities.
17
Risks Related to this Offering
We are controlled by PMD, DLJ Merchant Banking and MidOcean, whose interests may conflict with ours and those of our other stockholders.
Following this offering, PMD, DLJ Merchant Banking and MidOcean will own, in the aggregate, approximately % of our outstanding common stock and pursuant to a stockholders agreement among us, PMD, DLJ Merchant Banking and MidOcean, dated as of November 28, 2000, as amended from time to time, they will continue to control us. Accordingly, they will be able to:
- •
- elect our entire Board of Directors;
- •
- control our management and policies; and
- •
- determine, without the consent of our other stockholders, the outcome of any corporate transaction or other matter submitted to our stockholders for approval, including mergers, consolidations and the sale of all or substantially all of our assets.
The stockholders agreement provides PMD, DLJ Merchant Banking and MidOcean with various corporate governance rights, so long as specific stock ownership levels are maintained, including the right to designate each member of our Board of Directors.
They will also be able to prevent or cause a change in control of us and amend our certificate of incorporation and by-laws at any time. Pursuant to the stockholders agreement, we have entered into management agreements with each of AEA, DLJ Merchant Banking and MidOcean. In addition, we have entered into an advisory services agreement with Credit Suisse First Boston LLC. These management and advisory services agreements will be terminated upon completion of this offering and the obligations due thereunder will be satisfied with a portion of the proceeds from this offering.
Moreover, because we are contolled by PMD, DLJ Merchant Banking and MidOcean, we are a "controlled company" for purposes of The New York Stock Exchange. Among other things, this means that our compensation and nominating committees are not required to be independent, and that a majority of our Board of Directors is not required to be independent.
Our ability to take advantage of specific business opportunities is limited by our amended and restated certificate of incorporation, under which we renounce any interest or expectancy in certain business opportunities presented to any of PMD, DLJ Merchant Banking, MidOcean or their respective affiliates. Therefore, if any of PMD, DJL Merchant Banking, MidOcean or their respective affiliates becomes aware of a potential transaction that may be a corporate opportunity for any of them or us, they will have no duty to communicate or offer this corporate opportunity to us.
The interests of PMD, DLJ Merchant Banking and MidOcean may conflict with our interests and those of our other stockholders, including purchasers of the common stock in this offering.
There has been no active trading market for our common stock, and an active trading market may not develop.
Prior to this offering, there has been no public market for our common stock. We have applied to list our common stock on The New York Stock Exchange. We do not know if an active trading market will develop for our common stock or how the common stock will trade in the future, which may make it more difficult for you to sell your shares. Negotiations between the underwriters and us will determine the initial public offering price. You may not be able to resell your shares at or above the initial public offering price due to fluctuations in the market price of our common stock.
18
If our stock price fluctuates after the initial offering, you could lose a significant part of your investment.
The market price could be subject to wide fluctuations in response to a number of factors, most of which we cannot control, including:
- •
- changes in securities analysts' recommendations and estimates of our financial performance;
- •
- the public's reaction to our press releases, announcements and our filings with the Securities and Exchange Commission;
- •
- fluctuations in stock market prices and volumes, particularly among securities of chemical companies;
- •
- changes in market valuations of similar companies;
- •
- additions or departures of key personnel;
- •
- commencement or involvement in litigation;
- •
- announcements by us or our competitors of strategic alliances, significant contracts, new technologies, acquisitions, commercial relationships, joint ventures or capital commitments;
- •
- variations in our quarterly results of operations or cash flows or those of other chemical companies;
- •
- changes in our pricing policies or pricing policies of our competitor;
- •
- future issuances and sales of our common stock; and
- •
- changes in general conditions in the U.S. economy, financial markets or the chemical industry.
In recent years, the stock market has experienced extreme price and volume fluctuations. This volatility has had a significant effect on the market price of securities issued by many companies for reasons unrelated to the operating performance of these companies.
Additionally, because Credit Suisse First Boston LLC is considered to be our affiliate, it is unlikely that it will be permitted under the rules of The New York Stock Exchange to solicit, or make recommendations regarding, the purchase or sale of our common stock. This could affect the liquidity of, the trading markets for, or investor interest in, our common stock, which could adversely affect the price at which it trades.
An aggregate of approximately million shares of our common stock will become eligible for resale in the public market 180 days from the date of the preliminary prospectus, and future sales of our common stock may cause our stock price to decline.
Sales of substantial amounts of our common stock in the public market after the completion of this offering, or the perception that these sales could occur, could adversely affect the market price of our common stock and could materially impair our future ability to raise capital through offerings of our common stock. An aggregate of shares of our common stock will be outstanding after completion of this offering. Of these, only the shares offered by this prospectus will be freely tradable without restriction or further registration.
In connection with this offering, we and our executive officers, directors, other senior management and each of PMD, DLJ Merchant Banking and MidOcean (who together hold shares out of the shares of our common stock outstanding as of December 31, 2003), will agree not to sell or transfer any shares of our common stock (other than to us) for 180 days from the date of the preliminary prospectus without the prior written consent of each of Credit Suisse First Boston LLC, Deutsche Bank Securities Inc. and UBS Securities LLC. See "Underwriting."
19
PMD, DLJ Merchant Banking and MidOcean each have demand rights to cause us to file, at our expense, a registration statement under the Securities Act covering resales of their shares. These shares will represent approximately % of our outstanding common stock after this offering. They will agree not to exercise their demand registration right until 180 days from the date of the preliminary prospectus without the prior written consent of each of Credit Suisse First Boston LLC, Deutsche Bank Securities Inc. and UBS Securities LLC. These shares may also be sold under Rule 144 of the Securities Act, depending on their holding period and subject to significant restrictions in the case of shares held by persons deemed to be our affiliates.
We entered into a management stockholders agreement with our executive officers and other senior management who hold shares of our common stock. The agreement restricts the transfer of shares held by these executive officers except in certain circumstances. These transfer restrictions expire on the earlier of a sale of our Company or the second anniversary of this offering.
In addition, after this offering, we also intend to register shares of our common stock for issuance under our stock option plans. As of December 31, 2003, options to purchase shares of our common stock were issued and outstanding, of which options to purchase shares were vested. Assuming all option shares are exercised immediately upon eligibility, purchasers of common stock in this offering will experience dilution of $ per share.
It is uncertain what effect, if any, market sales of shares held by any stockholder or the availability of these shares for future sale will have on the market price of our common stock. See "Shares Eligible for Future Sale" and "Underwriting" for a more detailed description of the restrictions on selling shares of our common stock after this offering.
Purchasers of our common stock will experience substantial dilution in the net tangible book value per share of their investment.
The initial public offering price per share exceeds our net tangible book value per share. If you participate in this offering, you will pay a price per share that substantially exceeds the book value of our tangible assets, after subtracting our liabilities. New investors will contribute % of our total capitalization, but will own only % of the shares outstanding. You may incur additional dilution if holders of options to purchase common stock, whether currently outstanding or subsequently granted, exercise their options following this offering. See "Dilution" for more information.
We do not currently intend to pay dividends on our common stock.
Since our inception, we have not declared or paid dividends on our common stock. The payment of any future dividends will be determined by our Board of Directors and will depend upon our financial condition and requirements, future prospects, business conditions and other factors our Board of Directors deems relevant. In addition, our existing indebtedness contains provisions that restrict the payment of dividends. Consequently, investors must rely on price appreciation on sales of their common stock in order to realize any gain on their investment. There is no guarantee that the price of our common stock will increase after the offering or ever exceed the price you pay.
Other companies may have difficulty acquiring us, even if doing so would benefit our stockholders.
Provisions in our organizational documents, the stockholders agreement and Delaware law could make it more difficult for other companies to acquire us, even if doing so would benefit our stockholders.
Our organizational documents authorize our Board of Directors to create and issue preferred stock without prior stockholder approval, which could prevent another company from acquiring us.
20
Delaware law prohibits us from engaging in any business combination with any "interested stockholder," meaning generally that a stockholder who beneficially owns more than 15% of our stock cannot acquire us for a period of three years from the date this person became an interested stockholder, unless various conditions are met, such as approval of the transaction by our Board of Directors.
The stockholders agreement provides that, after the completion of this offering, a significant number of board actions, including entering into a merger or similar agreement, will require the approval of a majority of our directors, which majority must include at least one director designated by each of PMD and DLJ Merchant Banking so long as, in each case, PMD or DLJ Merchant Banking, respectively own at least 15% of our common stock. These provisions may discourage a third party from making a proposal to acquire us. Such stockholders will lose these rights upon the earlier of February 28, 2011 or the date following the completion of this offering on which these stockholders and MidOcean collectively cease to own at least 25% of our common stock. See "Certain Relationships and Related Transactions—Stockholders Agreement."
21
CAUTIONARY NOTE REGARDING FORWARD-LOOKING STATEMENTS
Certain statements in this section and elsewhere in this prospectus include forward-looking statements, including those that relate to our future plans, objectives, expectations and intentions. Statements that are predictive in nature, that depend upon or refer to future events or conditions or that include the words "expects," "anticipates," "intends," "plans," "believes," "estimates," "seeks," "thinks" and variations of these words and similar expressions are forward-looking statements. These statements involve known and unknown risks, uncertainties and other factors, including the factors described under "Risk Factors," that may cause our actual results and performance to be materially different from any future results or performance expressed or implied by these forward-looking statements. Although we believe that these statements are based upon reasonable assumptions, our goals may not be achieved. These forward-looking statements are made as of the date of this prospectus, and, except as required under the federal securities laws and the rules and regulations of the Securities and Exchange Commission, we assume no obligation to update or revise them or provide reasons why actual results may differ.
Important factors that may affect our expectations, estimates or projections include:
- •
- the effects of the substantial debt we have incurred in connection with our acquisition of the Performance Materials Segment of Goodrich and our ability to refinance or repay that debt;
- •
- changes in customer requirements in markets or industries we serve;
- •
- general economic and market conditions;
- •
- competition within our industry;
- •
- our access to capital markets and any restrictions placed on us by any current or future financing arrangements;
- •
- environmental and other governmental regulations;
- •
- the effect of risks of investing in and conducting operations in foreign countries, including political, social, economic, currency and regulatory factors;
- •
- changes in the price and supply of major raw materials; and
- •
- the effect of fluctuations in currency exchange rates on our operations.
22
We estimate that our net proceeds from the sale of shares of common stock in this offering, after deducting estimated expenses and underwriting discounts and commissions of $ million, will be approximately $ million. The following table illustrates the estimated sources and uses of funds from this offering and the proposed concurrent senior notes offering.
| Sources of Funds | | Uses of Funds | | |||||
|---|---|---|---|---|---|---|---|---|
| (dollars in millions) | ||||||||
| Common stock offering(1) | $ | Seller note(3) | $ | |||||
| % senior notes(2) | Term loans(4) | |||||||
| Management and advisory services agreements termination payments | ||||||||
| Fees and expenses(5) | ||||||||
| Total | $ | Total | $ | |||||
- (1)
- Assumes an initial offering price to the public of $ per share (the midpoint of the range). We will only receive proceeds from the offering of primary shares and will not receive any of the proceeds from the sale of shares of common stock sold by the selling stockholders. If the underwriters' over-allotment option is fully exercised, we will receive net proceeds of $ million.
- (2)
- Proposed concurrent senior notes offering of $ million of senior notes due 20 . Any offering of senior notes concurrently with this offering would not be a condition of this offering.
- (3)
- As of December 31, 2003, there was approximately $165.9 million of principal, $ million in call premiums and $7.2 million of accrued interest outstanding under the seller note. The seller note bears interest at a rate of 13% payable semi-annually in cash or additional notes at our option and matures on August 31, 2011.
- (4)
- As of December 31, 2003, there was approximately $37.9 million outstanding on Term Loan A and $551.2 million outstanding on Term Loan B. The applicable margin on Term Loan A is 2.75%, the applicable margin on the dollar-denominated portion of Term Loan B is 2.75% and the applicable margin on the euro-denominated portion of Term Loan B is 3.00%.
- (5)
- Includes approximately $ million of underwriting discounts and commissions and anticipated fees and expenses related to this offering and the proposed concurrent senior notes offering.
Since our inception, we have not declared or paid dividends on our common stock. The payment of any future dividends will be determined by our Board of Directors and will depend upon our financial condition and requirements, future prospects, business conditions and other factors our Board of Directors deems relevant. In addition, our existing indebtedness contains provisions that restrict the payment of dividends. See "Management's Discussion and Analysis of Financial Condition and Results of Operations—Liquidity and Capital Resources."
23
The following table sets forth our cash and capitalization as of December 31, 2003, on an actual basis and on an as adjusted basis. The information set forth below in conjunction with "Selected Consolidated Financial and Other Data," our consolidated historical financial statements and the related notes, "Management's Discussion and Analysis of Financial Condition and Results of Operations" and "Description of Our Indebtedness," which are included elsewhere in this prospectus.
| | As of December 31, 2003 | ||||||
|---|---|---|---|---|---|---|---|
| | Actual | As Adjusted(1) | |||||
| | (dollars in millions) | ||||||
| Cash and cash equivalents | $ | 116.8 | $ | ||||
| Debt: | |||||||
| Revolving credit facility(2) | $ | — | $ | ||||
| Term loans(3) | 589.1 | ||||||
| 11% senior subordinated notes due 2011 | 275.0 | ||||||
| Seller note(4) | 165.9 | ||||||
| % senior notes(5) | — | ||||||
| Other | 0.3 | ||||||
| Total debt (including short-term debt) | $ | 1,030.3 | $ | ||||
| Stockholders' equity: | |||||||
| Common stock, par value $.01 per share, 4,100,000 shares authorized, 3,606,133 shares outstanding, actual shares authorized, shares outstanding, as adjusted | — | ||||||
| Paid-in capital | 361.0 | ||||||
| Retained deficit | (23.9 | ) | |||||
| Accumulated other comprehensive income | 76.4 | ||||||
| Other | (1.2 | ) | |||||
| Total stockholders' equity | 412.3 | ||||||
| Total capitalization | $ | 1,442.6 | $ | ||||
- (1)
- The as adjusted column assumes the sale by us of (i) shares in this offering at an assumed initial offering price of $ per share (the midpoint of the range) and (ii) the sale by us of $ million of % senior notes due 20 in a concurrent offering, and the application of the proceeds of these offerings (a) to the total payment of $ million of our debt obligations outstanding under the seller note, including premiums and accrued interest, (b) to repay a portion of our term loans and (c) to the total payments of $ million to be paid in connection with the management and advisory services agreements, which are being terminated. See "Use of Proceeds" and "Certain Relationships and Related Transactions—Management and Advisory Services Agreements."
- (2)
- Our revolving credit facility and related subfacilities provide for total borrowing capacity of up to $125.0 million.
- (3)
- Term loans include both current and long-term portions and, as of December 31, 2003, were comprised of Term Loan A with a balance of $37.9 million and Term Loan B with a balance of $551.2 million.
- (4)
- As of December 31, 2003, the outstanding principal balance under the seller note was $165.9 million. Accrued interest under the seller note was $7.2 million. As adjusted amounts reflect repayment of $ million of the seller note plus accrued interest of $ million and call premiums of $ million. We are also contemplating the issuance of debt securities in connection with this offering, the proceeds of which would be used to repay a portion of the seller note.
- (5)
- Any offering of senior notes concurrent with this offering will not be a condition to the completion of this offering.
24
As of December 31, 2003, we had a net tangible book value of $(205.9) million or $ per share. Net tangible book value is the difference between the book value of our total tangible assets and our total liabilities. As of December 31, 2003, total assets of $1,757.6 million were reduced by total liabilities of $1,345.3 million, goodwill of $416.0 million, identifiable intangible assets of $172.9 million and debt issuance costs included in other assets of $29.3 million to derive net tangible book value. We determined the net tangible book value per share by dividing our tangible net book value by the total number of shares of common stock outstanding. After giving effect to the sale of the shares of common stock offered by us in this offering at $ per share, the mid-point of the range of the initial public offering prices set forth on the cover page of this prospectus, and after deducting estimated underwriting discounts and commissions and offering expenses payable by us, our as adjusted net tangible book value would have been approximately $ million, or $ per share of common stock. This represents an immediate increase in net tangible book value of $ per share to existing stockholders and an immediate dilution of $ per share to new investors purchasing shares of common stock in this offering. The following table illustrates this dilution on a per share basis:
| | Per Share | ||||||
|---|---|---|---|---|---|---|---|
| Assumed initial public offering price per common share | $ | ||||||
| Net tangible book value per common share as of December 31, 2003 | $ | ||||||
| Increase in adjusted net tangible book value per common share attributable to new investors | |||||||
| As adjusted net tangible book value per common share after this offering | |||||||
| Dilution per common share to new investors | $ | ||||||
The following table sets forth, on an as adjusted basis as of December 31, 2003, the number of shares of common stock owned by existing stockholders and to be owned by new investors, the total consideration paid, and the average price per share paid by our existing stockholders and to be paid by new investors in this offering at $ , the mid-point of the range of the initial public offering prices set forth on the cover page of this prospectus, and before deduction of estimated underwriting discounts and commissions:
| | Shares Purchased(1) | Total Consideration | | ||||||||||
|---|---|---|---|---|---|---|---|---|---|---|---|---|---|
| | Average Price Per Share | ||||||||||||
| | Number | Percent | Amount | Percent | |||||||||
| Existing stockholders(2) | % | $ | % | $ | |||||||||
| New investors | |||||||||||||
| Total | % | $ | % | $ | |||||||||
- (1)
- The number of shares disclosed for the existing stockholders includes shares being sold by the selling stockholders in this offering. The number of shares disclosed for the new investors does not include the shares being purchased by the new investors from the selling stockholders in this offering.
- (2)
- With respect to our executive officers, directors and greater-than-10% stockholders, and assuming the exercise of all outstanding stock options pursuant to our Amended and Restated Employee Stock Option Plan, the number of shares of common stock purchased from us, the total
25
consideration paid to us, and the average price per share paid by all of those affiliated persons, are as follows:
| | Shares Purchased(1) | Total Consideration | | |||||||||
|---|---|---|---|---|---|---|---|---|---|---|---|---|
| | Average Price Per Share | |||||||||||
| | Number | Percent | Amount | Percent | ||||||||
| Affiliated persons | % | $ | % | $ | ||||||||
As of December 31, 2003, there were 3,606,133 shares of our common stock outstanding, held by 187 stockholders. Sales by the selling stockholders in this offering will reduce the number of shares of common stock held by existing stockholders to or approximately % of the total number of shares of common stock outstanding after this offering and will increase the number of shares of common stock held by new investors to or approximately % of the total number of shares of common stock outstanding after this offering.
26
SELECTED CONSOLIDATED FINANCIAL AND OTHER DATA
The following table presents selected financial data as of the dates and for the periods indicated. The data for the years ended December 31, 1999 and 2000 and the two months ended February 28, 2001 are derived from the audited consolidated historical financial statements of the Performance Materials Segment of Goodrich. The data for the ten months ended December 31, 2001 and the years ended December 31, 2002 and 2003 are derived from our audited consolidated financial statements. The unaudited, as adjusted, selected financial data for the year ended December 31, 2003 include the impact of this offering and application of the net proceeds therefrom as if such transactions occurred at the beginning of the period presented. The information set forth below should be read in conjunction with the consolidated financial statements and the related notes and "Management's Discussion and Analysis of Financial Condition and Results of Operations" and other financial information included elsewhere in this prospectus.
| | Performance Materials Segment of Goodrich | Noveon International, Inc. | |||||||||||||||||
|---|---|---|---|---|---|---|---|---|---|---|---|---|---|---|---|---|---|---|---|
| | Years Ended December 31 | Two Months Ended February 28 2001 | Ten Months Ended December 31 2001 | Years Ended December 31 | |||||||||||||||
| | 1999 | 2000 | 2002 | 2003 | |||||||||||||||
| | (dollars in millions, except share information) | ||||||||||||||||||
| Sales | $ | 1,217.7 | $ | 1,167.7 | $ | 187.0 | $ | 876.4 | $ | 1,069.3 | $ | 1,135.9 | |||||||
| Cost of sales | 832.2 | 819.5 | 137.3 | 628.1 | 726.8 | 809.4 | |||||||||||||
| Gross profit | 385.5 | 348.2 | 49.7 | 248.3 | 342.5 | 326.5 | |||||||||||||
| Selling and administrative expenses | 218.2 | 201.1 | 35.2 | 160.5 | 202.8 | 204.8 | |||||||||||||
| Amortization expense | 24.6 | 24.4 | 4.0 | 26.5 | 13.9 | 14.7 | |||||||||||||
| Restructuring and severance costs | 37.3 | 40.5 | — | 3.1 | 6.1 | 13.2 | |||||||||||||
| Operating income | 105.4 | 82.2 | 10.5 | 58.2 | 119.7 | 93.8 | |||||||||||||
| Interest (income) expense—net | (0.5 | ) | (4.4 | ) | (0.6 | ) | 92.6 | 99.6 | 90.9 | ||||||||||
| Other expense (income)—net | 1.5 | 0.4 | 1.5 | 0.7 | (10.0 | ) | 1.1 | ||||||||||||
| Income (loss) before income taxes and cumulative effect of accounting change | 104.4 | 86.2 | 9.6 | (35.1 | ) | 30.1 | 1.8 | ||||||||||||
| Income tax expense | 42.3 | 35.9 | 4.0 | 4.6 | 6.4 | 9.2 | |||||||||||||
| Income (loss) before cumulative effect of accounting change | 62.1 | 50.3 | 5.6 | (39.7 | ) | 23.7 | (7.4 | ) | |||||||||||
| Cumulative effect of accounting change—net of tax | — | — | — | — | — | (0.5 | ) | ||||||||||||
| Net income (loss) | $ | 62.1 | $ | 50.3 | $ | 5.6 | $ | (39.7 | ) | $ | 23.7 | $ | (7.9 | ) | |||||
27
| | Noveon International, Inc. | ||||||||||
|---|---|---|---|---|---|---|---|---|---|---|---|
| | Ten Months Ended December 31 2001 | Years Ended December 31 | |||||||||
| | 2002 | 2003 | |||||||||
| | (dollars in millions, except share information) | ||||||||||
| Basic and diluted earnings per share: | |||||||||||
| Income (loss) before cumulative effect of accounting change | $ | (11.17 | ) | $ | 6.58 | $ | (2.05 | ) | |||
| Cumulative effect of accounting change—net of tax | — | — | (0.14 | ) | |||||||
| Net income (loss) | $ | (11.17 | ) | $ | 6.58 | $ | (2.19 | ) | |||
| Basic and diluted weighted-average shares outstanding: | |||||||||||
| Basic | 3,555,267 | 3,600,222 | 3,602,062 | ||||||||
| Diluted | 3,555,267 | 3,600,222 | 3,602,062 | ||||||||
| | Year Ended December 31, 2003 | |||
|---|---|---|---|---|
| | (dollars in millions, except share information) (unaudited) | |||
| As Adjusted Data(1): | ||||
| Income (loss) before cumulative effect of accounting change | $ | |||
| Cumulative effect of accounting change—net of tax | ||||
| Net income (loss) | $ | |||
Basic earnings (loss) per share: | ||||
| Income (loss) before cumulative effect of accounting change | $ | |||
| Cumulative effect of accounting change—net of tax | ||||
| Net income (loss) | $ | |||
| Diluted earnings (loss) per share: | ||||
| Income (loss) before cumulative effect of accounting change | $ | |||
| Cumulative effect of accounting change—net of tax | ||||
| Net income (loss) | $ | |||
| Weighted-average shares outstanding: | ||||
| Basic | ||||
| Diluted | ||||
28
Performance Materials Segment of Goodrich | Noveon International, Inc. | ||||||||||||||||||
|---|---|---|---|---|---|---|---|---|---|---|---|---|---|---|---|---|---|---|---|
| | Years Ended December 31 | Two Months Ended February 28 2001 | Ten Months Ended December 31 2001 | Years Ended December 31 | |||||||||||||||
| | 1999 | 2000 | 2002 | 2003 | |||||||||||||||
| | (dollars in millions) | ||||||||||||||||||
| Other Data: | |||||||||||||||||||
| Net cash provided (used) by operating activities | $ | 156.1 | $ | 180.9 | $ | (31.6 | ) | $ | 153.9 | $ | 143.7 | $ | 118.0 | ||||||
| Net cash (used) by investing activities | (97.3 | ) | (75.3 | ) | (7.6 | ) | (1,218.7 | ) | (79.7 | ) | (88.7 | ) | |||||||
| Net cash (used) provided by financing activities | (54.4 | ) | (100.2 | ) | 37.5 | 1,188.4 | (112.3 | ) | (1.2 | ) | |||||||||
| EBITDA(2) | 190.8 | 168.5 | 23.4 | 140.5 | 214.4 | 184.1 | |||||||||||||
| EBITDA margin(3) | 15.7 | % | 14.4 | % | 12.5 | % | 16.0 | % | 20.1 | % | 16.2 | % | |||||||
| Adjusted EBITDA(4) | $ | 228.1 | $ | 209.0 | $ | 23.4 | $ | 146.9 | $ | 211.8 | $ | 201.3 | |||||||
| Adjusted EBITDA margin(5) | 18.7 | % | 17.9 | % | 12.5 | % | 16.8 | % | 19.8 | % | 17.7 | % | |||||||
| Depreciation and amortization | $ | 86.9 | $ | 86.7 | $ | 14.4 | $ | 83.0 | $ | 84.7 | $ | 91.4 | |||||||
| Capital expenditures | 79.6 | 64.0 | 7.6 | 28.5 | 52.3 | 56.6 | |||||||||||||
| | Performance Materials Segment of Goodrich | Noveon International, Inc. | ||||||||||||||||
|---|---|---|---|---|---|---|---|---|---|---|---|---|---|---|---|---|---|---|
| | December 31 | December 31, 2003 | ||||||||||||||||
| | 1999 | 2000 | 2001 | 2002 | Actual | As Adjusted(1) | ||||||||||||
| | (dollars in millions) | |||||||||||||||||
| Balance Sheet Data: | ||||||||||||||||||
| Cash and cash equivalents | $ | 10.6 | $ | 15.7 | $ | 124.0 | $ | 79.5 | $ | 116.8 | $ | |||||||
| Goodwill | 342.1 | 307.0 | 346.9 | 367.3 | 416.0 | |||||||||||||
| Identifiable intangible assets—net | 60.9 | 58.9 | 192.0 | 182.1 | 172.9 | |||||||||||||
| Total assets | 1,430.6 | 1,359.2 | 1,664.8 | 1,634.5 | 1,757.6 | |||||||||||||
| Total debt | 42.7 | 30.0 | 1,083.9 | 992.7 | 1,030.3 | |||||||||||||
| Goodrich investment | 950.9 | 910.4 | — | — | — | |||||||||||||
| Stockholders' equity | — | — | 309.1 | 346.5 | 412.3 | |||||||||||||
- (1)
- The as adjusted balance sheet data assumes the sale by us of (i) shares in this offering at an assumed initial offering price of $ per share (the midpoint of the range) and (ii) $ million of % senior notes due 20 in a concurrent offering, and the application of the proceeds of these offerings (a) to the total payment of $ million of our debt obligations outstanding under the seller note, including premiums and accrued interest, (b) to repay a portion of our term loans and (c) to the total payments of $ million to be paid in connection with the management and advisory services agreements, which are being terminated. The as adjusted statement of operations data reflect a reduction in interest expense of $ million, and a reduction of selling and administrative expenses of $4.0 million in connection with the termination of the management and advisory services agreements for the year ended December 31, 2003. The as adjusted statement of operations data and per share data do not reflect the payments of $ million to be paid in connection with the management and advisory services agreements, and the call premiums associated with the repayment of a portion of the seller note. See "Use of Proceeds" and "Certain Relationships and Related Transactions—Management and Advisory Services Agreements."
- (2)
- EBITDA is defined as net income (loss) before cumulative effect of accounting change, income tax expense, interest (income) expense, depreciation and amortization. We present EBITDA because we consider it an important supplemental measure of our performance and believe it is frequently
29
used by securities analysts, investors and other interested parties in the evaluation of companies in our industry, many of which present EBITDA when reporting their results.
- •
- EBITDA does not reflect our cash expenditures, or future requirements, for capital expenditures or contractual commitments;
- •
- EBITDA does not reflect changes in, or cash requirements for, our working capital needs;
- •
- EBITDA does not reflect the significant interest expense or cash requirements necessary to service interest or principal payments on our debts;
- •
- Although depreciation and amortization are non-cash charges, the assets being depreciated and amortized will often have to be replaced in the future, and EBITDA does not reflect any cash requirements for such replacements; and
- •
- Other companies in our industry may calculate EBITDA differently than we do, limiting its usefulness as a comparative measure.
We also use EBITDA because our credit agreement and our indenture use EBITDA with additional adjustments to measure our compliance with covenants such as interest coverage, leverage ratio and debt incurrence and because compensation agreements with our employees use EBITDA with additional adjustments as a performance measure.
EBITDA has limitations as an analytical tool, and you should not consider it in isolation or as a substitute for analysis of our financial results prepared in accordance with GAAP. Some of these limitations are:
Because of these limitations, EBITDA should not be considered as a measure of discretionary cash available to us to invest in the growth of our business. We compensate for these limitations by relying primarily on our GAAP results and using EBITDA and Adjusted EBITDA only supplementally. See the Consolidated Statement of Cash Flows included in our financial statements located elsewhere in this prospectus.
- (3)
- EBITDA margin is defined as EBITDA as a percentage of sales.
- (4)
- We present Adjusted EBITDA as a further supplemental measure of our performance. Adjusted EBITDA data is an important metric used by management with respect to both the performance of our fundamental business activities as well as our ability to meet future debt service, capital expenditures and working capital needs. We prepare Adjusted EBITDA by adjusting EBITDA to eliminate the impact of gain on the early extinguishment of debt, the payments in connection with the management and advisory services agreements, which are being terminated, and restructuring and severance costs. We consider these items to be one-time costs and gains and not indicative of our ongoing operating performance. You are encouraged to evaluate each adjustment and the reasons we consider them appropriate for supplemental analysis. As an analytical tool, Adjusted EBITDA is subject to all of the limitations applicable to EBITDA. In addition, in evaluating Adjusted EBITDA, you should be aware that in the future we may incur expenses similar to the adjustments in this presentation. Our presentation of Adjusted EBITDA should not be construed as an implication that our future results will be unaffected by unusual or non-recurring items.
Adjusted EBITDA is calculated by adding to EBITDA certain items of expense and deducting from EBITDA certain items of income that we believe are not indicative of our future performance consisting of (i) gain on early extinguishment of debt, (ii) management and advisory fees and (iii) restructuring and severance costs.
30
The following table reconciles net income (loss) to EBITDA and EBITDA to Adjusted EBITDA for the periods indicated:
Performance Materials Segment of Goodrich | Noveon International, Inc. | ||||||||||||||||||
|---|---|---|---|---|---|---|---|---|---|---|---|---|---|---|---|---|---|---|---|
| | Years Ended December 31 | Two Months Ended February 28 2001 | Ten Months Ended December 31 2001 | Years Ended December 31 | |||||||||||||||
| | 1999 | 2000 | 2002 | 2003 | |||||||||||||||
| | (dollars in millions) | ||||||||||||||||||
| Net income (loss) | $ | 62.1 | $ | 50.3 | $ | 5.6 | $ | (39.7 | ) | $ | 23.7 | $ | (7.9 | ) | |||||
| Cumulative effect of accounting change—net of tax | — | — | — | — | — | 0.5 | |||||||||||||
| Income tax expense | 42.3 | 35.9 | 4.0 | 4.6 | 6.4 | 9.2 | |||||||||||||
| Interest (income) expense—net | (0.5 | ) | (4.4 | ) | (0.6 | ) | 92.6 | 99.6 | 90.9 | ||||||||||
| Depreciation and amortization | 86.9 | 86.7 | 14.4 | 83.0 | 84.7 | 91.4 | |||||||||||||
| EBITDA | 190.8 | 168.5 | 23.4 | 140.5 | 214.4 | 184.1 | |||||||||||||
| Gain on early extinguishment of debt | — | — | — | — | (12.4 | ) | — | ||||||||||||
| Management and advisory fees | — | — | — | 3.3 | 3.7 | 4.0 | |||||||||||||
| Restructuring and severance costs | 37.3 | 40.5 | — | 3.1 | 6.1 | 13.2 | |||||||||||||
| Adjusted EBITDA | $ | 228.1 | $ | 209.0 | $ | 23.4 | $ | 146.9 | $ | 211.8 | $ | 201.3 | |||||||
EBITDA and Adjusted EBITDA presented in this table are measures of our performance that are not required by, or presented in accordance with, GAAP. EBITDA and Adjusted EBITDA are not measurements of our financial performance under GAAP and should not be considered as alternatives to net income or any other performance measures derived in accordance with GAAP or as an alternative to net cash provided by operating activities as a measure of liquidity.
- (5)
- Adjusted EBITDA margin is defined as Adjusted EBITDA as a percentage of sales.
31
MANAGEMENT'S DISCUSSION AND ANALYSIS OF FINANCIAL CONDITION
AND RESULTS OF OPERATIONS
This Management's Discussion and Analysis of Financial Condition and Results of Operations contains forward-looking statements that involve risks and uncertainties. Our actual results may differ materially from those discussed in the forward-looking statements as a result of various factors, including but not limited to those described under "Risk Factors" beginning on page 11, and included in other portions of this prospectus.
Executive Overview
We are a leading global producer and marketer of technologically advanced specialty materials and chemicals. Our products and services enhance the value of customers' end-products by improving performance, providing essential product attributes, lowering cost, simplifying processing or making them more environmentally friendly. We derive our revenues from the sale of our manufactured specialty chemicals and materials, with approximately 59% of our sales from the United States, 21% of our sales from Europe and 20% of our sales from the rest of the world in 2003.
Our business serves a multitude of industries and end-use applications globally including various consumer, residential and commercial housing and industrial applications, which diversity imparts a relative degree of stability in our revenue. However, we are impacted by macroeconomic factors that include available discretionary income, housing starts, industrial production and overall levels of economic activity in the regions in which we operate. In general, our revenues do not fluctuate with raw material and other input prices.
The competitive environment for our products depends upon many factors, including industry consolidation and capacity, general economic conditions and availability of substitute materials. We have experienced pricing pressure in parts of our business as a result of consolidation among some of our competitors and customers and as some of the industries we serve have matured.
Our cost base is most affected by changes in feedstock prices, which are driven by crude oil and natural gas prices and supply and demand characteristics in our various feedstock-related markets. For the year ended December 31, 2003, our raw material costs represented 43% of sales as compared to 39% in 2002 and 42% in 2001. Our most significant raw materials include toluene, ethyl and butyl acrylate, glacial acrylic acid, chlorine, MDI, PTMEG, aniline, acetone, PVC and styrene, although we do purchase approximately 1,500 other materials. Raw materials tend to be specific to a particular product line, which can result in significant fluctuations in results from product line to product line. Other components of our costs include base manufacturing costs, selling, research and development and administrative expenses.
We focus significant efforts on productivity initiatives with the goal of lowering our overall cost structure. Productivity initiatives include automation of processes, which have led to reduced production cycle times, increased capacity and output, reductions in overall costs per pounds produced, raw material usage efficiencies and the elimination of non-value added processes. In addition, we have lowered our manufacturing and corporate headcount. Since 2001, our annual savings from these productivity initiatives have averaged between $15.0 million and $20.0 million, and we expect to continue generating similar savings in 2004 as we continue to seek potential opportunities to streamline, rationalize and consolidate our processes and operations.
We are incurring higher sales, marketing and research and development costs as we continue to add resources targeted at increasing the rate of new product development and expand the use of our existing products on a global basis.
We are also impacted by currency fluctuations. The depreciation of the U.S. dollar versus the euro benefited our results in 2003 as compared to 2002, as well as our results in 2002 as compared to 2001.
32
In 2003, we generated approximately 31% of our sales in foreign currencies and we incurred approximately 28% of our costs in foreign currencies. We have attempted to mitigate the impact of currency fluctuations by manufacturing products in the countries in which the products are sold and offsetting our asset exposure with local currency borrowings. Our hedging program is limited to protecting known future cash flows due primarily from customers and suppliers who pay or require payment in foreign currency.
Restructuring and Other Matters
In 2003, we announced the relocation of the Sancure® polyurethane dispersions line, part of our Performance Coatings segment, to our Avon Lake, Ohio facility and the closing of the Leominster, Massachusetts facility. Production is expected to be completely shifted to the Avon Lake site by the end of 2004. In conjunction with the announced closing of the Leominster facility, we performed an evaluation of the ongoing value of the long-lived assets and determined the carrying value was no longer recoverable. As a result, the long-lived assets were written down to their estimated fair value of $1.4 million, which was determined by an independent appraisal, and an impairment charge of $5.7 million was recorded. Additionally, in 2003, in order to increase efficiency and productivity and to reduce costs, we implemented a headcount reduction at various administrative and manufacturing facilities.
Through these restructuring efforts, we planned to eliminate approximately 80 positions across all segments. Approximately 50% of the affected employees have left their positions as of December 31, 2003. In conjunction with these restructuring plans, we recorded severance costs of $6.2 million pursuant to our existing severance plan. As of December 31, 2003, $2.7 million remains accrued related to these restructurings with substantially all of the remaining costs anticipated to be paid by the end of 2004.
During 2002, we consolidated our static control manufacturing facilities into our Malaysia facility and closed the Twinsburg, Ohio leased facility in order to improve the productivity of our electronics industry-related product lines. In conjunction with this consolidation, we incurred additional restructuring and severance as well as closure costs, totaling $0.2 million, related to this leased facility in 2003. In 2002, we incurred facility and severance costs of $1.3 million related to this leased facility.
In 2001, we implemented a plan to restructure and streamline our operations to increase efficiency and productivity, reduce costs and support our global growth strategy. As part of this plan, we reduced headcount throughout our global operations, restructured our colorants business in Cincinnati, Ohio and discontinued our flush pigments and colorformers products lines. Through these restructuring efforts, we eliminated approximately 440 positions. In conjunction with this restructuring plan, we recorded restructuring and severance costs of $1.1 million in 2003 consisting primarily of personnel-related costs. In 2002, we incurred costs of $4.7 million primarily relating to severance and facility closure costs. In 2001, we incurred $2.0 million of costs associated with this restructuring. As of December 31, 2003, approximately $1.6 million remains accrued for restructuring costs with substantially all of the remaining costs anticipated to be paid by 2007. As a result of these restructuring efforts, we have reduced annual employee expenses by approximately $17.0 million. These savings were partially recognized beginning in the third quarter of 2001.
Results of Operations
Historical Basis
The following table presents the major components of the statement of operations on a historical basis. Consistent with our focus on industries and end-use applications, we have organized our business into three segments: Consumer Specialties, Specialty Materials and Performance Coatings. The textile dyes business and the drug delivery systems business, which were not part of our acquisition of the
33
Performance Materials Segment of Goodrich, had sales and an operating loss of $1.1 million and $0.6 million, respectively, during the two months ended February 28, 2001. The results of the textile dyes business and the drug delivery systems business are included in the data for the two months ended February 28, 2001. We show segment sales as a percent of total sales and segment gross profit and operating income as a percentage of segment sales.
| | Performance Materials Segment of Goodrich | Noveon International, Inc. | |||||||||||||||||||
|---|---|---|---|---|---|---|---|---|---|---|---|---|---|---|---|---|---|---|---|---|---|
| | Two Months Ended February 28 | Ten Months Ended December 31 | Years Ended December 31 | ||||||||||||||||||
| | 2001 | 2001 | 2002 | 2003 | |||||||||||||||||
| | (dollars in millions) | ||||||||||||||||||||
| Sales: | |||||||||||||||||||||
| Consumer Specialties | $ | 45.2 | 24.2 | % | $ | 238.8 | 27.2 | % | $ | 290.8 | 27.2 | % | $ | 328.7 | 28.9 | % | |||||
| Specialty Materials | 73.1 | 39.1 | 324.4 | 37.0 | 402.4 | 37.6 | 428.6 | 37.7 | |||||||||||||
| Performance Coatings | 68.7 | 36.7 | 313.2 | 35.8 | 376.1 | 35.2 | 378.6 | 33.4 | |||||||||||||
| Total sales | $ | 187.0 | 100.0 | % | $ | 876.4 | 100.0 | % | $ | 1,069.3 | 100.0 | % | $ | 1,135.9 | 100.0 | % | |||||
| Gross profit: | |||||||||||||||||||||
| Consumer Specialties | $ | 10.5 | 23.2 | % | $ | 64.5 | 27.0 | % | $ | 88.9 | 30.6 | % | $ | 92.1 | 28.0 | % | |||||
| Specialty Materials | 25.6 | 35.0 | 106.5 | 32.8 | 147.6 | 36.7 | 142.1 | 33.2 | |||||||||||||
| Performance Coatings | 13.6 | 19.8 | 77.3 | 24.7 | 106.0 | 28.2 | 92.3 | 24.4 | |||||||||||||
| Total gross profit | $ | 49.7 | 26.6 | % | $ | 248.3 | 28.3 | % | $ | 342.5 | 32.0 | % | $ | 326.5 | 28.7 | % | |||||
| Operating income: | |||||||||||||||||||||
| Consumer Specialties | $ | 2.1 | 4.6 | % | $ | 30.8 | 12.9 | % | $ | 48.2 | 16.6 | % | $ | 47.0 | 14.3 | % | |||||
| Specialty Materials | 16.9 | 23.1 | 52.3 | 16.1 | 84.3 | 20.9 | 75.8 | 17.7 | |||||||||||||
| Performance Coatings | 3.2 | 4.7 | 34.5 | 11.0 | 59.4 | 15.8 | 43.3 | 11.4 | |||||||||||||
| Total segment operating income | 22.2 | 11.9 | 117.6 | 13.4 | 191.9 | 17.9 | 166.1 | 14.6 | |||||||||||||
Corporate costs | (11.7 | ) | (6.3 | ) | (56.3 | ) | (6.4 | ) | (66.1 | ) | (6.2 | ) | (59.1 | ) | (5.2 | ) | |||||
| Restructuring and severance costs | — | — | (3.1 | ) | (0.4 | ) | (6.1 | ) | (0.5 | ) | (13.2 | ) | (1.2 | ) | |||||||
| Total operating income | $ | 10.5 | 5.6 | % | $ | 58.2 | 6.6 | % | $ | 119.7 | 11.2 | % | $ | 93.8 | 8.2 | % | |||||
Pro Forma Basis
The following table presents major components of the historical and pro forma statements of operations. The major components of the pro forma consolidated statements of operations reflect the effect of the acquisition of the Performance Materials Segment of Goodrich on February 28, 2001 as if it occurred on January 1, 2001 and excludes the results of the textile dyes business and drug delivery systems business retained by Goodrich. The primary effects of the acquisition include: increased depreciation for the write-up of property, plant and equipment; increased amortization expense for goodwill and intangible assets; the impact of increased stand-alone costs; management and advisory services fees; amortization expense of debt issuance costs associated with the credit facilities; increased interest expense associated with the credit facilities; and the associated income tax impact of these items.
The components of the pro forma consolidated statements of operations for the year ended December 31, 2001 are derived from the audited consolidated financial statements of the Performance
34
Materials Segment of Goodrich for the two months ended February 28, 2001 and our audited consolidated financial statements for the ten months ended December 31, 2001.
| | Years Ended December 31 | |||||||||||||||
|---|---|---|---|---|---|---|---|---|---|---|---|---|---|---|---|---|
| | Pro Forma 2001 | Actual 2002 | Actual 2003 | |||||||||||||
| | (dollars in millions) | |||||||||||||||
| Statement of Operations: | ||||||||||||||||
| Sales | $ | 1,062.3 | 100.0 | % | $ | 1,069.3 | 100.0 | % | $ | 1,135.9 | 100.0 | % | ||||
| Cost of sales | 765.5 | 72.1 | 726.8 | 68.0 | 809.4 | 71.3 | ||||||||||
| Gross profit | 296.8 | 27.9 | 342.5 | 32.0 | 326.5 | 28.7 | ||||||||||
| Selling and administrative expenses | 195.7 | 18.4 | 202.8 | 19.0 | 204.8 | 18.0 | ||||||||||
| Amortization expense | 31.8 | 3.0 | 13.9 | 1.3 | 14.7 | 1.3 | ||||||||||
| Restructuring and severance costs | 3.1 | 0.3 | 6.1 | 0.5 | 13.2 | 1.2 | ||||||||||
| Operating income | 66.2 | 6.2 | 119.7 | 11.2 | 93.8 | 8.2 | ||||||||||
| Interest expense—net | 110.9 | 10.4 | 99.6 | 9.3 | 90.9 | 8.0 | ||||||||||
| Other expense (income)—net | 2.2 | 0.2 | (10.0 | ) | (0.9 | ) | 1.1 | 0.1 | ||||||||
| Income (loss) before income taxes and cumulative effective of accounting change | (46.9 | ) | (4.4 | ) | 30.1 | 2.8 | 1.8 | 0.1 | ||||||||
| Income tax expense | 5.5 | 0.5 | 6.4 | 0.6 | 9.2 | 0.8 | ||||||||||
| Income before cumulative effect of accounting change | (52.4 | ) | (4.9 | ) | 23.7 | 2.2 | (7.4 | ) | (0.7 | ) | ||||||
| Cumulative effect of accounting change—net of tax | — | — | — | — | (0.5 | ) | — | |||||||||
| Net income (loss) | $ | (52.4 | ) | (4.9 | )% | $ | 23.7 | 2.2 | % | $ | (7.9 | ) | (0.7 | )% | ||
| | Years Ended December 31 | |||||||||||||||
|---|---|---|---|---|---|---|---|---|---|---|---|---|---|---|---|---|
| | Pro Forma 2001 | Actual 2002 | Actual 2003 | |||||||||||||
| | (dollars in millions) | |||||||||||||||
| Sales: | ||||||||||||||||
| Consumer Specialties | $ | 284.0 | 26.7 | % | $ | 290.8 | 27.2 | % | $ | 328.7 | 28.9 | % | ||||
| Specialty Materials | 397.5 | 37.4 | 402.4 | 37.6 | 428.6 | 37.7 | ||||||||||
| Performance Coatings | 380.8 | 35.9 | 376.1 | 35.2 | 378.6 | 33.4 | ||||||||||
| Total sales | $ | 1,062.3 | 100.0 | % | $ | 1,069.3 | 100.0 | % | $ | 1,135.9 | 100.0 | % | ||||
| Gross profit: | ||||||||||||||||
| Consumer Specialties | $ | 74.7 | 26.3 | % | $ | 88.9 | 30.6 | % | $ | 92.1 | 28.0 | % | ||||
| Specialty Materials | 131.6 | 33.1 | 147.6 | 36.7 | 142.1 | 33.2 | ||||||||||
| Performance Coatings | 90.5 | 23.8 | 106.0 | 28.2 | 92.3 | 24.4 | ||||||||||
| Total gross profit | $ | 296.8 | 27.9 | % | $ | 342.5 | 32.0 | % | $ | 326.5 | 28.7 | % | ||||
| Operating income: | ||||||||||||||||
| Consumer Specialties | $ | 32.9 | 11.6 | % | $ | 48.2 | 16.6 | % | $ | 47.0 | 14.3 | % | ||||
| Specialty Materials | 66.9 | 16.8 | 84.3 | 20.9 | 75.8 | 17.7 | ||||||||||
| Performance Coatings | 37.8 | 9.9 | 59.4 | 15.8 | 43.3 | 11.4 | ||||||||||
| Total segment operating income | 137.6 | 13.0 | 191.9 | 17.9 | 166.1 | 14.6 | ||||||||||
Corporate costs | (68.3 | ) | (6.4 | ) | (66.1 | ) | (6.2 | ) | (59.1 | ) | (5.2 | ) | ||||
| Restructuring and severance costs | (3.1 | ) | (0.3 | ) | (6.1 | ) | (0.5 | ) | (13.2 | ) | (1.2 | ) | ||||
| Total operating income | $ | 66.2 | 6.2 | % | $ | 119.7 | 11.2 | % | $ | 93.8 | 8.2 | % | ||||
35
2003 Compared with 2002
Total Company Analysis
Sales. Sales increased $66.6 million, or 6.2%, to $1,135.9 million in 2003 from $1,069.3 million in 2002. The increase in sales was attributable to the strength of the euro, incremental sales of $34.8 million associated with acquisitions across all segments, and higher volumes in our personal care and Estane® TPU product lines, partially offset by lower volumes within Performance Coatings. Increased volumes and the strength of the euro were principally responsible for sales increases of $23.1 million within our personal care and pharmaceutical product lines and $19.0 million in our Estane® TPU product lines. Increased sales of $14.7 million within our food and beverage product lines were due primarily to the impact of acquisitions.
Cost of Sales. Cost of sales as a percentage of sales increased to 71.3% in 2003 from 68.0% in 2002. The increase in cost of sales as a percentage of sales was primarily attributable to substantially higher raw material and utility costs across each segment that were not passed on to customers.
Gross Profit. Gross profit decreased $16.0 million, or 4.7%, to $326.5 million in 2003 from $342.5 million in 2002. As a percentage of sales, gross profit decreased to 28.7% in 2003 from 32.0% in 2002. The decrease in gross profit and gross profit as a percentage of sales was primarily associated with higher raw material and utility costs and the impact of competitive pricing pressure, partially offset by increased sales and lower manufacturing costs related to ongoing productivity initiatives. Our productivity initiatives have focused on reduced cycle times, increased capacity and output, reductions in overall costs per pounds produced, raw material usage efficiencies, elimination of non-value added processes, and more efficient training programs. Since 2001, our annual savings from these productivity initiatives have averaged between $15.0 million and $20.0 million, and we expect to continue generating similar savings in 2004 as we continue to seek potential opportunities to streamline, rationalize and consolidate our processes and operations.
Selling and Administrative Expenses. Selling and administrative expenses increased $2.0 million, or 1.0%, to $204.8 million in 2003 from $202.8 million in 2002. The increase in selling and administrative expenses was primarily related to $7.2 million associated with higher spending in sales, marketing and research and development as we continued to add resources to these areas and the impact of the stronger euro, partially offset by approximately $6.0 million in reduced costs associated with our variable incentive plans and other cost controls. We expect to continue to add resources in sales, marketing and research and development at a similar pace in 2004 as we increase our new product development efforts and expand our existing applications on a global basis. Selling and administrative expenses as a percentage of sales declined to 18.0% in 2003 from 19.0% in 2002.
Amortization Expense. Amortization expense totaled $14.7 million in 2003 and was comparable to $13.9 million in 2002.
Restructuring and Severance Costs. Restructuring and severance costs were $13.2 million in 2003 and $6.1 million in 2002. The 2003 costs include $7.2 million of severance costs related to our continued efforts to increase efficiency and productivity and a $5.7 million asset impairment associated with plant consolidation activities within our Performance Coatings segment.
Operating Income. Operating income decreased by $25.9 million, or 21.6% to $93.8 million in 2003 from $119.7 million in 2002. The decrease in operating income was primarily attributable to substantially higher raw material and utility costs across each segment, the impact of competitive pricing pressure, lower volumes within our Performance Coatings segment and higher restructuring and severance costs. The decrease was partially offset by increased volumes within our personal care product lines, benefits from productivity initiatives and the impact of acquisitions.
36
Interest Expense—Net. Interest expense, net, was $90.9 million in 2003 and $99.6 million in 2002. The decrease in interest expense was primarily attributable to the impact of debt reductions ocurring in 2002.
Other Expense (Income)—Net. Other expense was $1.1 million in 2003 and other income was $10.0 million in 2002. Other income in 2002 resulted primarily from a $12.4 million gain recognized on the early extinguishment of debt.
Income Tax Expense. Income tax expense was $9.2 million in 2003 compared to $6.4 million in 2002. The income tax expense in 2003 and 2002 was primarily associated with our international operations. The effective tax rate in 2003 and 2002 was 511.1% and 21.3%, respectively. The increase in the effective tax rate in 2003 as compared to 2002 was principally related to a net increase in tax valuation allowances recorded in 2003 and the overall decrease in income from continuing operations.
In 2003 and to a lesser extent in 2002, the effective tax rate differed from the federal statutory rate principally due to increases in the effective tax rate as a result of tax valuation allowance amounts associated with our domestic and foreign operations, nondeductible interest and other nondeductible business operating expenses. The increase in the income tax rate was partially offset as a result of certain income tax credits and from the impact of foreign operations. In addition, in 2002, decreases in the income tax rate resulted from the early extinguishment of debt.
As of December 31, 2003, we have determined, based on our lack of prior earnings history, that it is uncertain that our future taxable income will be sufficient to recognize certain of our net deferred tax assets. In accordance with the provisions of SFAS No. 109, we intend to maintain the tax valuation allowances recorded at December 31, 2003 for certain deferred tax assets until sufficient positive evidence (for example, cumulative positive earnings and future taxable income) exists to support the reversal of the tax valuation allowances. This valuation allowance relates to net domestic deferred tax assets established in purchase accounting, acquired foreign net deferred tax assets associated with net operating losses and credits and deferred tax assets from domestic and foreign tax net operating losses and credits arising subsequent to March 1, 2001. A significant portion of the valuation allowance is associated with the deferred tax assets established in purchase accounting. Any reversal of the valuation allowance that was established in purchase accounting would reduce goodwill.
Cumulative Effect of Accounting Change-Net of Tax. The cumulative effect of accounting change resulted in a charge of $0.5 million in 2003 and related to the adoption of SFAS No. 143, "Accounting for Asset Retirement Obligations," effective January 1, 2003.
Net Income (Loss). As a result of the factors discussed above, net income (loss) decreased by $31.6 million to a net loss of $7.9 million in 2003 from net income of $23.7 million in 2002.
Segment Analysis
Consumer Specialties. Sales increased $37.9 million, or 13.0%, to $328.7 million in 2003 from $290.8 million in 2002. The increase was primarily attributable to higher sales of $23.1 million in our personal care and pharmaceutical product lines, principally due to higher global Carbopol® acrylic thickener sales, the successful launch of new products and the strength of the euro as well as higher sales of $14.7 million in our food and beverage product lines, principally driven by incremental sales associated with acquisitions.
Gross profit increased $3.2 million, or 3.6%, to $92.1 million in 2003 from $88.9 million in 2002. The increase was primarily associated with higher volumes within our personal care and food and beverage product lines and the strength of the euro, substantially offset by higher raw material and utility costs within our food and beverage product lines. As a percentage of sales, gross profit decreased to 28.0% in 2003 from 30.6% in 2002. The decrease in gross profit as a percentage of sales was due to increases in raw material and utility costs.
37
Operating income decreased $1.2 million, or 2.5%, to $47.0 million in 2003 from $48.2 million in 2002. The decrease in operating income was primarily associated with increased raw material and utility costs within our food and beverage product lines and the impact of additional sales, marketing and research and development resources, offset partially by higher volumes within our personal care and food and beverage product lines and the strength of the euro.
Specialty Materials. Sales increased by $26.2 million, or 6.5%, to $428.6 million in 2003 from $402.4 million in 2002. The increase was primarily attributable to $19.0 million in higher sales within our Estane® TPU product lines, principally related to a stronger euro and higher volumes. Volume increases across most of the segment were partially offset by competitive pricing pressure.
Gross profit decreased $5.5 million, or 3.7%, to $142.1 million in 2003 from $147.6 million in 2002. The decrease was primarily attributable to substantially higher raw material and utility costs in our TempRite® CPVC and polymer additives product lines and the impact of competitive pricing pressure across the segment. This decrease was partially offset by higher volumes and lower manufacturing spending across most of the segment. As a percentage of sales, gross profit decreased to 33.2% in 2003 from 36.7% in 2002. The decrease in gross profit as a percentage of sales was driven by increases in raw material and utility costs and the impact of competitive pricing pressure.
Operating income decreased $8.5 million, or 10.1%, to $75.8 million in 2003 from $84.3 million in 2002. The decrease was primarily attributable to substantially higher raw material and utility costs in our TempRite® CPVC and polymer additives product lines and the impact of competitive pricing pressure across most of the segment. This decrease was partially offset by higher volumes, lower manufacturing spending and lower selling and administrative expenses across most of the segment.
Performance Coatings. Sales increased $2.5 million, or 0.7%, to $378.6 million in 2003 from $376.1 million in 2002. The increase was primarily attributable to the impact of acquisitions and the strength of the euro, partially offset by lower sales volumes.
Gross profit decreased $13.7 million, or 12.9%, to $92.3 million in 2003 from $106.0 million in 2002. The decrease was primarily attributable to substantially higher raw material and utility costs and lower sales volumes, partially offset by lower manufacturing costs, higher selling prices and the impact of acquisitions. As a percentage of sales, gross profit decreased to 24.4% in 2003 from 28.2% in 2002. The decrease in gross profit as a percentage of sales was primarily due to increased raw material and utility costs.
Operating income decreased $16.1 million, or 27.1%, to $43.3 million in 2003 from $59.4 million in 2002. The decrease was primarily attributable to substantially higher raw material and utility costs and lower sales volumes, partially offset by lower manufacturing costs, higher selling prices and the impact of acquisitions.
Corporate. Corporate costs decreased $7.0 million, or 10.6%, to $59.1 million in 2003 from $66.1 million in 2002. This decrease was primarily the result of cost controls and reduced costs associated with our variable incentive plans.
2002 Compared with Pro Forma 2001
The comparison of the year ended December 31, 2002 to the pro forma year ended December 31, 2001 has been completed by using audited consolidated financial information for 2002 and unaudited pro forma consolidated financial information for 2001. This unaudited pro forma consolidated financial information is provided for informational purposes only and does not purport to be indicative of the results which would have actually been obtained had the acquisition of the Performance Materials Segment of Goodrich occurred on January 1, 2001.
38
Total Company Analysis
Sales. Sales increased $7.0 million, or 0.7%, to $1,069.3 million in 2002 from $1,062.3 million in pro forma 2001. The increase was primarily the result of higher sales within our TempRite® CPVC product lines of $17.3 million and personal care product lines of $9.8 million, principally related to increased volume. Additionally, current year acquisitions resulted in increased sales of approximately $11.4 million. These increases were offset partially by lower sales of $12.4 million in our Estane® TPU and polymer additives product lines, due primarily to lower industrial and European demand and competitive price pressure, and $4.7 million in Performance Coatings, primarily due to lower textile application volume. Furthermore, sales decreased in our food colorants business by $5.9 million, principally due to the impact of product lines discontinued in 2001.
Cost of Sales. Cost of sales as a percentage of sales decreased to 68.0% in 2002 from 72.1% in pro forma 2001. The decrease in cost of sales as a percentage of sales was primarily attributable to a decrease in raw material and utility costs across all segments and, to a lesser extent, lower manufacturing spending.
Gross Profit. Gross profit increased $45.7 million, or 15.4%, to $342.5 million in 2002, from $296.8 million in pro forma 2001. As a percentage of sales, gross profit increased to 32.0% in 2002, from 27.9% in pro forma 2001. The increase in gross profit was primarily associated with decreases in raw material and utility costs and lower manufacturing spending. The increase was partially offset by competitive pricing pressure and an unfavorable sales mix shift.
Selling and Administrative Expenses. Selling and administrative expenses increased $7.1 million, or 3.6%, to $202.8 million in 2002 from $195.7 million in pro forma 2001. The increase in selling and administrative expenses was primarily attributable to the strategic addition of sales and marketing resources, the additional costs associated with our variable incentive plans, driven by improved financial performance during 2002 and expansion of the variable incentive plans to include substantially all employees beginning in 2002 and expenses and fees in 2002 associated with our public offering initiative. The increase was partially offset by cost reductions attributable to our restructuring efforts. Selling and administrative expenses as a percentage of sales increased to 19.0% in 2002 from 18.4% in pro forma 2001.
Amortization Expense. Amortization expense decreased $17.9 million, or 56.3%, to $13.9 million in 2002 from $31.8 million in pro forma 2001. The decrease was primarily due to the elimination of $18.1 million of goodwill amortization, as required by the provisions of SFAS No. 142 beginning in 2002.
Restructuring and Severance Costs. Restructuring and severance costs increased $3.0 million to $6.1 million in 2002 from $3.1 million in pro forma 2001. The increase was related to the consolidation of the static control manufacturing facilities into Malaysia and the closing of the Twinsburg, Ohio leased facility, which occurred in the third quarter of 2002; expenses related to our effort to increase efficiency and productivity, reduce costs and support our global growth strategy; and to additional pension expenses associated with the exit of a facility in Europe.
Operating Income. Operating income increased by $53.5 million, or 80.8%, to $119.7 million in 2002 from $66.2 million in pro forma 2001. The increase in operating income was primarily attributable to decreases in raw material and utility costs, lower manufacturing spending, increased volumes within our TempRite® CPVC and personal care product lines and reduced amortization expense for goodwill and was partially offset by competitive pricing pressure and an unfavorable sales mix shift and an increase in selling and administrative expenses.
Interest Expense—Net. Interest expense decreased $11.3 million to $99.6 million in 2002 from $110.9 million in pro forma 2001. The decrease in expense was attributable to lower interest rates in 2002, debt repayment and interest income from our cash balances.
39
Other (Income) Expense—Net. Other income was $10.0 million in 2002 and other expense was $2.2 million in pro forma 2001. Other income in 2002 resulted primarily from a $12.4 million gain recognized on the early extinguishment of debt.
Income Tax Expense. Income tax expense was $6.4 million in 2002 compared to income tax expense of $5.5 million in pro forma 2001. The income tax expense in 2002 and pro forma 2001 was primarily associated with our international operations. The effective tax rate for 2002 and pro forma 2001 was 21.3% and 11.7%, respectively.
For pro forma 2001, we incurred pro forma domestic losses. These pro forma cumulative losses and a lack of prior earnings history in our new capital structure provided substantial evidence regarding our inability to realize certain deferred tax assets. As a result, under the provisions of SFAS No. 109, we established a tax valuation allowance to offset domestic income tax benefits associated with domestic losses for 2001.
For the year ended December 31, 2002, sufficient income was generated to realize certain of the deferred tax assets associated with domestic net operating losses. Therefore, under the provisions of SFAS No. 109, domestic income tax expense for 2002 has been significantly offset by the reversal of a portion of the related tax valuation allowances. Further, based on a lack of earnings history, we have provided an additional valuation allowance associated with our foreign net operating losses.
As of December 31, 2002, we still had cumulative losses and maintained tax valuation allowances for the balance of deferred tax assets until sufficient positive evidence (for example, cumulative positive domestic earnings and taxable income) exists to support the reversal of the tax valuation allowances.
Net Income (Loss). As a result of the factors discussed above, net income increased by $76.1 million to net income of $23.7 million in 2002 from a net loss of $52.4 million in pro forma 2001.
Segment Analysis
Consumer Specialties—Sales increased $6.8 million, or 2.4%, to $290.8 million in 2002 from $284.0 million in pro forma 2001. The increase was primarily attributable to the impact of higher sales of $9.8 million in our personal care product lines, principally due to higher Carbopol® acrylic thickener sales volumes and the impact of the success of new product introductions. The increase was partially offset by lower sales in our food colorants business of $5.9 million, principally the result of discontinued product lines.
Gross profit increased $14.2 million, or 19.0%, to $88.9 million in 2002 from $74.7 million in pro forma 2001. As a percentage of sales, gross profit increased to 30.6% in 2002 from 26.3% in pro forma 2001. The increase in gross profit was primarily associated with decreases in raw material and utility costs, lower manufacturing spending and higher personal care volumes.
Operating income increased $15.3 million, or 46.5%, to $48.2 million in 2002 from $32.9 million in pro forma 2001. The increase was primarily associated with decreases in raw material and utility costs, lower manufacturing spending, higher personal care volumes and $5.2 million in reduced amortization expense for goodwill.
Specialty Materials—Sales increased by $4.9 million, or 1.2%, to $402.4 million in 2002 from $397.5 million in 2001. The increase was primarily attributable to higher sales of $17.3 million in TempRite® CPVC, primarily related to volume increases, partially offset by lower sales of $12.4 million in polymer additives product lines, static control and Estane® TPU, principally resulting from competitive pricing pressure and soft industrial demand.
Gross profit increased $16.0 million, or 12.2%, to $147.6 million in 2002 from $131.6 million in pro forma 2001. As a percentage of sales, gross profit increased to 36.7% in 2002 from 33.1% in pro forma 2001. The increase in gross profit was primarily attributable to decreases in raw material and utility costs, higher TempRite® CPVC volume and lower manufacturing spending.
40
Operating income for the segment increased $17.4 million, or 26.0%, to $84.3 million in 2002 from $66.9 million in pro forma 2001. The increase was primarily attributable to decreases in raw material and utility costs, higher TempRite® CPVC volume, lower manufacturing spending and $7.6 million in reduced amortization expense for goodwill. The increase was partially offset by lower sales in Estane® TPU and polymer additives as mentioned above and increases in selling and administrative expenses, primarily related to the addition of sales and marketing resources and the additional costs associated with our variable incentive plans, driven by improved financial performance during 2002.
Performance Coatings—Sales decreased $4.7 million, or 1.2%, to $376.1 million in 2002 from $380.8 million in pro forma 2001. The decrease was primarily attributable to a decline in demand in textile applications, competitive pricing pressure and an unfavorable sales mix shift.
Gross profit increased $15.5 million, or 17.1%, to $106.0 million in 2002 from $90.5 million in pro forma 2001. As a percentage of sales, gross profit increased to 28.2% in 2002 from 23.8% in pro forma 2001. The increase in gross profit was primarily associated with decreases in raw material and utility costs. The increase was partially offset by a decline in demand in textile applications.
Operating income for the segment increased $21.6 million, or 57.1%, to $59.4 million in 2002 from $37.8 million in 2001. The increase was primarily associated with the decrease in raw material and utility costs, and $5.3 million in reduced amortization expense for goodwill. The increase was partially offset by a decline in demand in textile applications.
Corporate—Corporate costs decreased $2.2 million, or 3.2%, to $66.1 million in 2002 from $68.3 million in pro forma 2001. This decrease was primarily the result of our restructuring efforts, partially offset by additional costs associated with our variable incentive plans, driven by improved financial performance during 2002 and expansion of the variable incentive plans to include substantially all employees beginning in 2002 and expenses and fees in 2002 associated with our public offering initiative.
Short Period Discussions
Since we acquired the Performance Materials Segment of Goodrich on February 28, 2001, the Performance Materials Segment of Goodrich and Noveon International, Inc. are reported on a different basis. Accordingly, there are short reporting periods that are not comparable to other periods. Discussions follow for the short periods, including the ten months ended December 31, 2001 for Noveon International, Inc. and the two months ended February 28, 2001 for the Performance Materials Segment of Goodrich.
Ten Months Ended December 31, 2001
Total Company Analysis
For the ten months ended December 31, 2001, we generated sales of $876.4 million, with cost of sales of $628.1 million resulting in a gross profit of $248.3 million and a gross profit margin of 28.3%. Selling and administrative expenses were $160.5 million, or 18.3% of sales. Amortization was $26.5 million, restructuring and severance costs were $3.1 million and operating income was $58.2 million, or 6.6% of sales. Interest expense was $92.6 million, other expense was $0.7 million, income tax expense was $4.6 million and net loss was $39.7 million.
Segment Analysis
Consumer Specialties—For the ten months ended December 31, 2001, the Consumer Specialties segment generated sales of $238.8 million, with a gross profit of $64.5 million and a gross profit margin of 27.0%. Operating income was $30.8 million, or 12.9% of sales.
41
Specialty Materials—For the ten months ended December 31, 2001, the Specialty Materials segment generated sales of $324.4 million, with a gross profit of $106.5 million and a gross profit margin of 32.8%. Operating income was $52.3 million, or 16.1% of sales.
Performance Coatings—For the ten months ended December 31, 2001, the Performance Coatings segment generated sales of $313.2 million, with a gross profit of $77.3 million and a gross profit margin of 24.7%. Operating income was $34.5 million, or 11.0% of sales.
Corporate—For the ten months ended December 31, 2001, corporate expense was $56.3 million.
Two Months Ended February 28, 2001
Total Company Analysis
For the two months ended February 28, 2001, the Performance Materials Segment of Goodrich generated sales of $187.0 million, with cost of sales of $137.3 million, resulting in a gross profit of $49.7 million and a gross profit margin of 26.6%. Selling and administrative expenses were $35.2 million, or 18.8% of sales. Amortization expense was $4.0 million and operating income was $10.5 million, or 5.6% of sales. Interest income was $0.6 million, other expense was $1.5 million, income tax expense was $4.0 million and net income was $5.6 million, or 3.0% of sales.
Segment Analysis
Consumer Specialties—For the two months ended February 28, 2001, the Consumer Specialties segment of the Performance Materials Segment of Goodrich generated sales of $45.2 million, with a gross profit of $10.5 million and a gross profit margin of 23.2%. Operating income was $2.1 million, or 4.6% of sales.
Specialty Materials—For the two months ended February 28, 2001, the Specialty Materials segment of the Performance Materials Segment of Goodrich generated sales of $73.1 million, with a gross profit of $25.6 million and a gross profit margin of 35.0%. Operating income was $16.9 million, or 23.1% of sales.
Performance Coatings—For the two months ended February 28, 2001, the Performance Coatings segment of the Performance Materials Segment of Goodrich generated sales of $68.7 million, with a gross profit of $13.6 million and a gross profit margin of 19.8%. Operating income was $3.2 million, or 4.7% of sales.
Corporate—For the two months ended February 28, 2001, the corporate expense of the Performance Materials Segment of Goodrich was $11.7 million.
Liquidity and Capital Resources
Our primary sources of liquidity are cash provided by operations, undrawn commitments available under our credit facilities and proceeds generated from the sale of our debt and equity securities. We intend to use a portion of our net proceeds from this offering to repay approximately $ million of our debt obligations outstanding under the seller note. We are contemplating the issuance of debt securities in connection with this offering, the proceeds of which would be used to repay a portion of the seller note. Any offering of debt securities concurrently with this offering would not be a condition to consummating this offering.
Debt and Commitments
Pro Forma
To the extent we use the net proceeds from this offering to repay our debt obligations under the seller note, including call premiums and accrued interest, as described in "Use of Proceeds," we expect our total outstanding indebtedness to be $ million.
42
To the extent we issue debt securities concurrently with this offering, the proceeds of which would be used to repay a portion of the seller note, we expect our total indebtedness to be $ million.
Historical
In July 2003, Noveon, Inc. amended and refinanced the term loans within its existing credit facilities. As a result of this amendment, Noveon, Inc.'s amended credit facilities include:
- •
- a Term Loan A facility that matures on March 31, 2007;
- •
- a Term Loan B facility that matures on December 31, 2009; and
- •
- a revolving credit facility in the amount of $125.0 million that matures on March 31, 2007.
A portion of the revolving credit is available in various foreign currencies. All of Term Loan A and a portion of Term Loan B are denominated in euros. The domestic revolving credit facility provides for a letter of credit subfacility, usage under which reduces the amount available under the domestic revolving credit facility. Borrowings under the revolving credit facility may be used for working capital and for general corporate purposes. We and each of Noveon, Inc.'s direct and indirect material domestic subsidiaries guarantee Noveon, Inc.'s obligations under the credit facilities. The credit facilities are secured by substantially all of Noveon, Inc.'s assets and the assets of all of Noveon, Inc.'s domestic subsidiaries, in addition to a pledge of 65% of the stock of Noveon, Inc.'s first tier foreign subsidiaries. At December 31, 2003, there was $37.9 million outstanding on Term Loan A and $551.2 million outstanding on Term Loan B.
Additionally, as part of the amendment, the applicable margin on the U.S. dollar-denominated portion of Term Loan B was decreased by 0.75% to 2.75%, and the applicable margin on the euro-denominated Term Loan B was decreased by 0.50% to 3.00%. The applicable margin on Term Loan A is currently 2.75%. The amendment and the refinancing were not deemed to be a substantial modification of the credit facilities, and accordingly, were not accounted for as a debt extinguishment. As a result of the amended terms to Noveon, Inc.'s credit facilities, interest expense will be reduced by $3.4 million annually as compared to the interest expense that would have resulted given the terms of the credit facilities prior to the amendment.
In 2002, the credit facilities were amended to allow Noveon, Inc. to prepay $45.0 million of its outstanding term loans and dividend to us $45.0 million in cash so that we could repay a portion of the seller note based upon an agreement between us and Goodrich.
The credit facilities contain customary covenants that restrict Noveon, Inc.'s and its restricted subsidiaries' ability to:
- •
- incur liens, except specified liens, including liens incurred in the ordinary course of business, liens on property we acquire, and other liens of up to $5.0 million;
- •
- incur additional indebtedness, except specified indebtedness, including indebtedness of our foreign subsidiaries for working capital purposes of up to $25.0 million, unsecured indebtedness of up to $20.0 million, other indebtedness of up to $5.0 million, and other unsecured subordinated indebtedness;
- •
- sell assets, except specified asset sales, including asset sales in the ordinary course of business and other asset sales so long as 80% of the sales price from such asset sales is paid in cash and the total amount of such asset sales does not exceed 15% of our total assets;
- •
- enter into any business combination, except certain business combinations of our subsidiaries that do not constitute an event of default under the credit facilities;
- •
- pay dividends and make other restricted payments, except certain payments, including payments to purchase up to $7.0 million of our common stock per fiscal year from our employees whose employment has terminated and payments in an amount not to exceed 25% of Noveon, Inc.'s
43
- •
- issue stock, unless there is no event of default under the credit facilities, the administrative agent under the credit facilities consents to the issuance and the proceeds from the issuance are applied as provided in the credit facilities;
- •
- enter into sale and leaseback transactions, except sale and leaseback transactions in an aggregate amount of up to $5.0 million;
- •
- make loans and investments, except certain loans and investments, including loans and investments made in the ordinary course of business and other investments of up to $5.0 million;
- •
- enter into new lines of business;
- •
- make accounting changes, unless any change is required by generally accepted accounting principles, the change is disclosed to the lenders under the credit facilities and prior financial statements that are affected by the change are restated as required; and
- •
- engage in various transactions with affiliates, unless such transactions are on terms as favorable as could be obtained in an arm's-length transaction and in the ordinary course of business.
consolidated net income arising from and after June 30, 2003, provided the pro forma leverage ratio would be no more than 3.25 to 1.0;
In addition, the credit facilities require Noveon, Inc. to comply with specified financial covenants including maintenance of net worth, limitations on capital expenditures, minimum interest coverage ratios and maximum leverage ratios. The net worth covenant requires that Noveon, Inc.'s net worth on the last day of any fiscal quarter exceed 80% of its consolidated net worth on February 28, 2001 plus 50% of its net income since December 31, 2000. The capital expenditures covenant generally prohibits Noveon, Inc. from spending more than $75.0 million per fiscal year on capital expenditures. The capital expenditures covenant permits Noveon, Inc. to carry forward any unused capital expenditures amount from one fiscal year to the next fiscal year. The capital expenditures covenant also permits Noveon, Inc. to make additional capital expenditures in an aggregate amount of up to $20.0 million. The interest coverage ratio requires that, as of the last day of each fiscal quarter, Noveon, Inc.'s ratio of EBITDA, as defined in the credit facilities, to its interest expense, exceed 2.35 to 1.0 through December 31, 2004. The interest coverage ratio increases on June 30 of each year thereafter. The maximum leverage ratio requires that, as of the last day of each fiscal quarter, Noveon, Inc.'s ratio of its indebtedness minus its cash and cash equivalents to EBITDA, as defined in the credit facilities, not exceed 4.25 to 1.0 through December 31, 2004. The maximum leverage ratio decreases on June 30 of each year thereafter.
Noveon, Inc.'s $275.0 million senior subordinated notes mature on February 28, 2011 and interest accrues at 11% per year. Interest payments on the notes occur on March 15 and September 15 of each year. The senior subordinated notes are subordinated to Noveon, Inc.'s credit facility and other senior obligations that Noveon, Inc. may incur. The senior subordinated notes contain customary covenants and events of default typical of publicly traded high yield debt.
The senior subordinated notes contain customary covenants that restrict Noveon, Inc. and its restricted subsidiaries' ability to:
- •
- incur additional indebtedness, except specified indebtedness, including indebtedness under our credit facilities, existing indebtedness, permitted indebtedness and indebtedness incurred by a foreign subsidiary;
- •
- incur liens, except specified liens, including liens that secure obligations that are not senior to the senior subordinated notes;
- •
- enter into sale and leaseback transactions, except specified sale and leaseback transactions, including sale and leaseback transactions having a fair market value at least equal to the value of the property that is the subject of the sale and leaseback transaction;
- •
- pay dividends and make other equity distributions subject to certain baskets and provisions, including the ability to pay dividends in an amount equal to 50% of aggregate net income
44
- •
- purchase or redeem capital stock, except for the purchase of capital stock owned by Noveon, Inc. or any of its subsidiaries and the redemption of the senior subordinated notes;
- •
- make investments, except specified investments, including investments in Noveon, Inc. or any of its subsidiaries, investments in cash and cash equivalents, investments in prepaid expenses and loans made to employees in the ordinary course of business and not in excess of $5.0 million and investments in a subsidiary of Noveon, Inc.;
- •
- sell assets, except specified sales of assets, including sales of assets in which the consideration received is at least equal to the fair market value of the asset, sales in which 75% of the consideration received is in cash and sales of assets, the proceeds of which will be used to pay off certain other indebtedness;
- •
- engage in transactions with affiliates, unless those transactions are on terms as favorable as could be obtained in an arm's-length transaction and in the ordinary course of business; and
- •
- effect a consolidation or merger, unless Noveon, Inc. is the surviving entity, the surviving entity assumes the obligations of Noveon, Inc. under the senior subordinated notes or if the merger or consolidation does not result in an event of default under the indenture governing the senior subordinated notes.
earned since the date of the indenture, provided that Noveon, Inc. would be able to satisfy its debt incurrence test, except for dividends or equity distributions payable in capital stock or dividends or distributions payable to Noveon, Inc. or any of its subsidiaries;
The original $172.0 million seller note issued to Goodrich, which was sold by Goodrich to various holders in a private placement in March 2003, matures in 2011 and bears interest at an initial rate of 13% payable semi-annually in cash or additional notes at our option and increases to 15% after February 26, 2006; however, if interest is paid in cash, the interest rate remains at 13%. As of December 31, 2003, the principal amount outstanding was $165.9 million and accrued interest was $7.2 million. We intend to use substantially all of our net proceeds from this offering to repay a portion of the seller note.
The terms of the credit facilities and 11% senior subordinated notes of Noveon, Inc. contain provisions that significantly restrict the ability of Noveon, Inc. or its subsidiaries to make distributions in cash and other assets to us, including for the repayment of the seller note. At December 31, 2003, substantially all of Noveon, Inc.'s net assets were so restricted.
The terms of the seller note allowed for repayment of all or a portion of the seller note at a specified discount through March 1, 2003. In June 2002, we prepaid $6.0 million of principal at the agreed discount as well as accrued interest on the prepaid portion of the seller note. In addition, in October 2002, we repaid $56.2 million of principal at the agreed discount. As a result of these prepayments, we recorded a gain of $12.4 million in other expense (income)-net in the consolidated statement of operations.
Principal and interest payments under the credit facilities and the senior subordinated notes represent significant liquidity requirements for us. Borrowings under the credit facilities bear interest at floating rates and require periodic interest payments. Interest and principal on the credit facilities are payable periodically, but not less frequently than quarterly. The credit facilities will be repaid in periodic installments until the maturity of each of the term loans. The credit facilities contain customary representations, restrictive non-financial covenants which, among other things and with certain exceptions, restrict our ability to incur additional indebtedness, make some acquisitions, pay dividends, issue stock, enter into sale and leaseback transactions, make loans or investments, enter into new lines of business and engage in some transactions with affiliates, and restrictive financial covenants related to net worth requirements, capital expenditures, minimum interest coverage, leverage and events of default. As of December 31, 2003, Noveon, Inc. was in compliance with all of the covenants contained in its credit facilities and the senior subordinated notes.
45
The table below summarizes our significant contractual obligations and commercial commitments as of December 31, 2003:
| | Payments Due by Period | ||||||||||||||
|---|---|---|---|---|---|---|---|---|---|---|---|---|---|---|---|
| | Total | Less Than 1 Year | 1–3 Years | 4–5 Years | After 5 Years | ||||||||||
| | (dollars in millions) | ||||||||||||||
| Term Loan A | $ | 37.9 | $ | 10.3 | $ | 24.4 | $ | 3.2 | $ | — | |||||
| Term Loan B | 551.2 | 5.5 | 11.0 | 11.0 | 523.7 | ||||||||||
| 11% senior subordinated notes | 275.0 | — | — | — | 275.0 | ||||||||||
| Seller note | 165.9 | — | — | — | 165.9 | ||||||||||
| Other debt | 0.3 | — | 0.1 | 0.2 | — | ||||||||||
| Pension and postretirement benefit obligations | 10.0 | 10.0 | — | — | — | ||||||||||
| Operating leases | 16.5 | 5.4 | 6.7 | 3.3 | 1.1 | ||||||||||
| Total obligations | $ | 1,056.8 | $ | 31.2 | $ | 42.2 | $ | 17.7 | $ | 965.7 | |||||
As of December 31, 2003, we had cash and cash equivalents of $116.8 million. We had $119.2 million available for borrowing under the $125.0 million revolving credit facility, net of $5.8 million of outstanding letters of credit. We believe that our cash on hand, anticipated funds from operations, and the amounts available to us under our revolving credit facilities will be sufficient to cover our working capital needs, capital expenditures, debt service requirements, tax obligations and other commitments for the foreseeable future. Our ability to fund working capital, capital expenditures, debt service requirements, tax obligations and other commitments will be dependent upon our future financial performance and our ability to repay or refinance our debt obligations, which in turn will be subject to economic conditions and to financial, business and other factors, many of which are beyond our control.
Cash Flows
Cash flows provided by operating activities decreased $25.7 million to $118.0 million in 2003 from $143.7 million in 2002. The decrease was primarily related to a reduction in operating results due primarily to higher raw material costs, increased working capital related to sales growth and the impact of the stronger euro.
Investing activities used $88.7 million in 2003 and included payments made in connection with acquisitions of $32.1 million and purchases of property, plant and equipment of $56.6 million. Investing activities used $79.7 million of cash in 2002 and included the working capital settlement with Goodrich discussed below which totaled $14.5 million, fees associated with that settlement of $1.0 million, payments made in connection with acquisitions of $11.9 million and capital expenditures of $52.3 million.
During 2003, we purchased select assets and technology from a European extruder of electrostatic dissipative sheet; acquired a 5% equity investment in a company that produces TPU-based cushion technology; and purchased select assets of Thermedics Polymer Products, LLC, a manufacturer of aliphatic thermoplastic polyurethane, from VIASYS Healthcare, Inc., all of which are included in our Specialty Materials segment. We purchased the remaining minority shares of our joint venture company, Indiamalt Private Ltd., and acquired a controlling interest in Specialty Natural Products Co., Ltd., or SNP, a manufacturer of botanical extracts used in personal care product formulations based in Thailand, for our Consumer Specialties segment. We purchased certain water-based overprint coatings technology and manufacturing assets for our Performance Coatings segment. Final determinations of the fair value of certain assets are in process. Accordingly, the preliminary purchase price allocations are subject to revision. The aggregate purchase price of $32.1 million paid for these
46
acquisitions and investment was allocated to the assets acquired and resulted in goodwill of $13.9 million.
During 2002, we purchased certain tangible assets of a distributor of personal care and pharmaceutical products in Latin America; certain assets, technology and other intellectual property from a colors dispersions business; and certain assets, technology and other intellectual property related to aroma chemicals, all of which were added to our Consumer Specialties segment. We purchased certain tangible assets and technology of a textile coatings business for our Performance Coatings segment. We acquired the common stock of Gemoplast SA, which is a business located in Lyon, France engaged in the development, production and marketing of plastic alloys for our Specialty Materials segment. The total cash paid for these 2002 acquisitions was $11.9 million.
In January 2004, we purchased Scher Chemicals, Inc., a manufacturer of emollient and surfactant specialty chemicals used in cosmetic and other personal care formulations for our Consumer Specialties segment.
Financing activities used $1.2 million in 2003 related to debt issuance costs and repayments of short-term debt offset partially by proceeds from the issuance of common stock. Financing activities used $112.3 million in 2002, primarily related to repayments of long-term debt, which included the $45.0 million prepayment of principal on our term loans and the $49.8 million of prepayments on a portion of the seller note.
Capital Expenditures
We believe that our manufacturing facilities are generally in good condition and we do not anticipate that major capital expenditures will be needed to replace existing facilities in the near future. Our capital expenditures for 2003 were $56.6 million. These expenditures were used to maintain our production sites, implement our business strategy regarding operations and health and safety and for strategic capacity expansion in our key product lines. These capital expenditures were paid for through internally generated cash flow. Consistent with prior years, we expect capital expenditures for the years 2004 and 2005 to be between $55.0 million and $65.0 million annually.
Working Capital Adjustment
Pursuant to the purchase agreement between us and Goodrich, the purchase price for the acquisition was subject to a post-closing working capital adjustment. On June 28, 2002, we entered into an agreement with Goodrich settling the working capital adjustment in which we agreed to pay Goodrich $14.5 million. We paid that amount to Goodrich on June 28, 2002 using cash on hand. The settlement payment and the costs associated with the settlement efforts have been reflected as an adjustment to the purchase price in our financial statements and increased the goodwill associated with the acquisition.
New Accounting Standards
The Financial Accounting Standards Board, or FASB issued SFAS No. 142, "Goodwill and Other Intangible Assets," in July 2001. SFAS No. 142 addressed financial accounting and reporting for acquired goodwill and other intangible assets and supersedes Accounting Principles Board Opinion No. 17, "Intangible Assets." SFAS No. 142 applied to all goodwill and other intangible assets recognized in an entity's statement of financial position at that date, regardless of when those assets were initially recognized. Under these rules, goodwill and intangible assets deemed to have indefinite lives are no longer amortized but are subject to annual impairment tests. Other intangible assets continue to be amortized over their useful lives. We adopted SFAS No. 142 effective January 1, 2002. After giving effect to the elimination of goodwill amortization, as required by SFAS No. 142, net income (loss) for the ten months ended December 31, 2001 and the two months ended February 28,
47
2001 would have been $(24.6) million and $8.5 million, respectively. During the second quarter of 2002, we performed the first of the required impairment tests of goodwill as of January 1, 2002. During the fourth quarters of 2003 and 2002, we performed our annual impairment test of goodwill. We determined that no goodwill impairment had occurred.
In July 2001, the FASB issued SFAS No. 143, "Accounting for Asset Retirement Obligations," that requires the fair value of the liability for closure and removal costs associated with the resulting legal obligations upon retirement or removal of any tangible long-lived assets be recognized in the period in which it is incurred. The initial recognition of the liability will be capitalized as part of the asset cost and depreciated over its estimated useful life. We adopted this statement on January 1, 2003. In the first quarter of 2003 we recorded a liability for the expected present value of future asset retirement obligations costs of $1.1 million, increased net property, plant and equipment by $0.4 million and recognized a charge of $0.5 million, net of tax, related to the cumulative effect of this change in accounting principle. The pro forma effects as if we adopted SFAS No. 143 on January 1, 2001 are not material to the results of operations.
In October 2001, the FASB issued SFAS No. 144, "Accounting for the Impairment or Disposal of Long-Lived Assets," that supersedes SFAS No. 121, "Accounting for the Impairment or Disposal of Long-Lived Assets and for Long-Lived Assets to Be Disposed of." SFAS No. 144 retains the fundamental provisions of SFAS No. 121 related to the recognition and measurement of the impairment of long-lived assets to be "held and used," provides more guidance on estimating cash flows when performing a recoverability test, requires that a long-lived asset (group) to be disposed of other than by sales (i.e. abandoned) be classified as "held and used" until it is disposed of, and establishes more restrictive criteria to classify an asset (group) as "held for sale." We adopted SFAS No. 144 effective January 1, 2002. Upon adoption, this statement had no impact on our consolidated financial position or results of operations.
In April 2002, the FASB issued SFAS No. 145, "Rescission of FASB Statements No. 4, 44, and 62, Amendment of FASB Statement No. 13, and Technical Corrections." For most companies, SFAS No. 145 requires gains and losses on extinguishments of debt to be classified as income or loss from continuing operations rather than as extraordinary items as previously required under SFAS No. 4. Extraordinary treatment is required for certain extinguishments as provided in APB Opinion No. 30. SFAS No. 145 also amends certain extinguishments as provided in APB Opinion No. 30. SFAS No. 145 also amends SFAS No. 13 to require certain modifications to capital leases to be treated as a sale-leaseback and modifies the accounting for sub-leases when the original lessee remains a secondary obligor (or guarantor). We adopted SFAS No. 145 during the second quarter of 2002, which had no impact on our consolidated financial position or results of operations.
In June 2002, the FASB issued SFAS No. 146, "Accounting for Costs Associated with Exit or Disposal Activities." SFAS No. 146 requires recording costs associated with exit or disposal activities at their fair values when a liability has been incurred. Under previous guidance, certain exit costs were accrued upon management's commitment to an exit plan, which is generally before an actual liability has been incurred. The provisions of SFAS No. 146 are effective for exit or disposal activities that are initiated after December 31, 2002. We adopted this statement effective January 1, 2003. The adoption of this statement had no impact on our consolidated financial position or results of operations.
In November 2002, the Emerging Issues Task Force, or EITF, reached a consensus on Issue No. 00-21, or Issue 00-21, "Revenue Arrangements with Multiple Deliverables." Issue 00-21 provides guidance on how to account for arrangements that involve delivery or performance of multiple products, services and/or rights to use assets. The adoption of Issue 00-21 in 2003 had no impact on our consolidated financial position or results of operations.
In November 2002, the FASB issued Interpretation No. 45, "Guarantor's Accounting and Disclosure Requirements for Guarantees, Including Indirect Guarantees of Indebtedness of Others."
48
Interpretation No. 45 requires guarantors to recognize, at the inception of a guarantee, a liability for the fair value of the obligation undertaken in issuing the guarantee for those guarantees initiated or modified after December 31, 2002. However, certain guarantees, including product warranties and guarantees between parties under common control (i.e., parent and subsidiary), are not required to be recognized at fair value at inception. Interpretation No. 45 also requires additional disclosures of guarantees, including product warranties and guarantees between parties under common control, beginning with interim or annual periods ending after December 15, 2002. Guarantees initiated prior to December 31, 2002 are not recognized as a liability measured at fair value per Interpretation No. 45, but are subject to the disclosure requirements. The effect of adoption had no impact on our consolidated financial position or results of operations.
In January 2003, the FASB issued Interpretation No. 46, "Consolidation of Variable Interest Entities." Interpretation No. 46 clarifies the application of Accounting Research Bulletin, or ARB, No. 51, "Consolidated Financial Statements" for certain entities in which equity investors do not have the characteristics of a controlling financial interest or do not have sufficient equity at risk for the entity to finance its activities without additional subordinated financial support from other parties. Interpretation No. 46 requires that variable interest entities, as defined, be consolidated by the primary beneficiary, which is defined as the entity that is expected to absorb the majority of the expected losses, receive a majority of the expected residual returns, or both. We adopted this statement in 2003. The adoption had no impact on our consolidated financial position or results of operations.
In April 2003, the FASB issued SFAS No. 149, "Amendment of Statement 133 on Derivative Instruments and Hedging Activities." SFAS No. 149 amends and clarifies financial accounting and reporting for derivative instruments, including certain derivative instruments embedded in other contracts and for hedging activities under SFAS No. 133. SFAS No. 149 is effective for contracts entered into or modified after June 30, 2003 and for hedging relationships designated after June 30, 2003. The adoption of this statement had no impact on our consolidated financial position or results of operations.
In May 2003, the FASB issued SFAS No. 150, "Accounting for Certain Financial Instruments with Characteristics of both Liabilities and Equity." SFAS No. 150 establishes standards for how an issuer classifies and measures certain financial instruments with characteristics of both liabilities and equity. SFAS No. 150 also requires that an issuer classify a financial instrument that is within its scope as a liability, many of which were previously classified as equity. SFAS No. 150 was effective for financial instruments entered into or modified after May 31, 2003, and otherwise was effective July 1, 2003. The adoption of this statement had no impact on our consolidated financial statements.
Critical Accounting Policies and Estimates
The preparation of these financial statements in conformity with generally accepted accounting principles requires us to make estimates and judgments that affect the reported amounts of assets, liabilities, revenues and expenses, and related disclosure of contingent assets and liabilities. On an on-going basis, we evaluate our estimates, including those related to product returns, bad debts, inventories, investments, intangible assets, income taxes, restructuring, pensions and other postretirement benefits, and contingencies and litigation. We base our estimates on historical experience and on various other assumptions that are believed to be reasonable under the circumstances, the results of which form the basis for making judgments about the carrying values of assets and liabilities that are not readily apparent from other sources. Actual results may differ from these estimates under different assumptions or conditions. Our accounting policies are more fully described in Note C of the consolidated financial statements.
We believe the following critical accounting policies affect our significant judgments and estimates used in the preparation of our consolidated financial statements.
49
Allowances and Rebates
We recognize our allowance for doubtful accounts based on our historical experience of customer write-offs as well as specific provisions for customer receivables balances. In establishing the specific provisions, we make assumptions with respect to future collectibility based upon such factors as the customer's ability to meet and sustain their financial commitments, their current and projected financial condition and the occurrence of changes in their general business, economic or market conditions that could affect their ability to make required payments to us in the future. The allowance for doubtful accounts is reviewed monthly and changes to the allowance are updated as appropriate. Our level of reserves for our customer accounts receivable fluctuates depending upon the factors mentioned above.
Rebates, customer claims, allowances, returns and discounts are reflected as reductions from gross sales in determining net sales. In 2003, the total of rebates, customer claims, returns and allowances and discounts amounted to 3.9% of gross sales. Rebates are accrued based on contractual relationships with customers as shipments are made. Customer claims, returns and allowances and discounts are accrued based on our history of claims and sales returns and allowances.
Deferred Income Taxes
The provision for income taxes is calculated in accordance with SFAS No. 109, "Accounting for Income Taxes," which requires the recognition of deferred income taxes using the liability method. Deferred income taxes reflect the net tax effect of temporary differences between the carrying amounts of assets and liabilities for financial reporting purposes and the amounts used for income tax purposes. We provide valuation allowances against the deferred tax assets if, based on available evidence, it is more likely than not that some portion or all of the deferred tax assets will not be realized.
In determining the adequacy of the valuation allowance, which totaled $70.8 million as of December 31, 2003, management assesses our profitability by taking into account the present and anticipated amounts of domestic and international earnings or losses, as well as the anticipated taxable income as a result of the reversal of future taxable temporary differences.
During 2003, we incurred losses for our domestic operations and for certain of our foreign operations. These cumulative losses and lack of prior earnings history provide substantial evidence regarding our inability to realize certain deferred tax assets. Therefore, we intend to maintain the recorded valuation allowances until sufficient positive evidence (for example, cumulative positive earnings and future taxable income) exists to support a reversal of the tax valuation allowances.
Derivative and Hedging Activities
As required by Noveon, Inc.'s credit agreement, we have entered into interest rate swap agreements to limit our exposure to interest rate fluctuations on $180.0 million of the outstanding principal of our term loans through June 2005. In 2003, we entered into an additional interest rate swap agreement to limit our exposure to interest rate fluctuations on $25.0 million of the outstanding principle of Term Loan B. These agreements require us to pay a fixed rate of interest while receiving a variable rate. The net payments or receipts under these agreements are recognized as an adjustment to interest expense in our results of operations. For the year ended December 31, 2003, we recorded $8.0 million of interest expense as a result of these swap agreements. As of December 31, 2003, the fair value of these swap arrangements included in other non-current liabilities totaled approximately $10.2 million. The offsetting impact of this hedge transaction is included in accumulated other comprehensive loss.
We have entered into forward foreign currency exchange contracts, totaling $19.2 million as of December 31, 2003, to hedge certain firm commitments denominated in foreign currencies. The purpose of our foreign currency hedging activities is to protect us from risk that the eventual cash flows
50
from the purchase or sale of products to international customers will be adversely affected by changes in the exchange rates. The fair values of these contracts at December 31, 2003 and December 31, 2002 were not material to our consolidated results of operations, cash flow or financial position.
We have foreign denominated floating rate debt to protect the value of our investments in our foreign subsidiaries in Europe. Realized and unrealized gains and losses from these hedges are not included in the income statement, but are shown in the cumulative translation adjustment account included in other comprehensive loss. During the year ended December 31, 2003, the unrealized loss related to the impact of foreign currency fluctuation on foreign denominated debt was $17.3 million and was included in cumulative translation adjustment.
Environmental Liabilities
Our environmental engineers and consultants review and monitor environmental issues at our existing operating sites. This process includes investigation and remedial action selection and implementation, as well as negotiations with other potentially responsible parties and governmental agencies. Our estimates of environmental liabilities are based on the results of this process.
Goodrich provided us with an indemnity for various environmental liabilities. We estimate Goodrich's share of such currently identified liabilities under the indemnity, which extends to 2011, to be $8.1 million. In addition to Goodrich's indemnity, several other indemnities from third parties such as past owners relate to specific environmental liabilities. Goodrich and other third party indemnitors are currently indemnifying us for several environmental remediation projects. Goodrich's share of all of these liabilities may increase to the extent such third parties fail to honor their indemnity obligations through 2011. Our December 31, 2003 balance sheet includes liabilities, measured on an undiscounted basis, of $19.0 million to cover future environmental expenditures either payable by us or indemnifiable by Goodrich. Accordingly, the current portion of the environmental obligations of $0.8 million is recorded in accrued expenses and $1.4 million of the recovery due from Goodrich is recorded in accounts receivable. Non-current liabilities include $18.2 million and other non-current assets include $6.7 million, reflecting the recovery due from Goodrich.
We believe that our environmental accruals are adequate based on currently available information. We believe that it is reasonably possible that additional costs may be incurred beyond the amounts accrued as a result of new information, newly discovered conditions or a change in the law. Additionally, as the indemnification from Goodrich extends through 2011, changes in assumptions regarding when costs will be incurred may result in additional expenses to us. However, the additional costs, if any, cannot currently be estimated.
Goodwill
Effective January 1, 2002, we adopted SFAS No. 142, "Goodwill and Other Intangible Assets." Under SFAS No. 142, we are required to perform annual impairment tests of our goodwill and intangible assets and more frequently in certain circumstances. We have elected to test for goodwill impairment as of October 1 each year. The goodwill impairment test is a two-step process, which requires management to make judgments in determining what assumptions to use in the calculation. The first step of the process consists of estimating the fair value of each reporting unit based on a discounted cash flow model using revenue and profit forecasts and comparing those estimated fair values with the carrying values, which includes allocated goodwill. Other key assumptions used to determine the fair value of our reporting units include estimated cash flow periods, terminal values based on our anticipated growth rates and the discount rate used, which is based on our current cost of capital adjusted for the risks associated with our operations. If the estimated fair value is less than the carrying value, a second step is performed to compute the amount of the impairment by determining an "implied fair value" of goodwill, which requires us to allocate the estimated fair value of the
51
reporting unit to the assets and liabilities of the reporting unit. Any unallocated fair value represents the "implied fair value" of goodwill, which is compared to its corresponding carrying value.
We cannot predict the occurrence of certain future events that might adversely affect the reported value of goodwill. Such events include, but are not limited to, strategic decisions made in response to economic and competitive conditions, the impact of the overall economic environment on our customer base, or a material negative change in our relationships with significant customers.
Inventories
Inventories are stated at the lower of cost or market. The elements of inventory cost include raw materials and labor and manufacturing overhead costs attributed to the production process. Most domestic inventories are valued by the last-in, first-out, or LIFO, cost method. Inventories not valued by the LIFO method are valued principally by the average cost method. We provide for allowances for excess and obsolete inventory based on the age and quality of our products.
Long-Lived Assets
We review the carrying value of long-lived assets to be held and used when events or circumstances indicate that the carrying value may not be recoverable. Factors that we consider important that could trigger an impairment include current period operating or cash flow losses combined with a history of operating or cash flow losses, a projection or forecast that demonstrates continuing losses, significant adverse changes in the business climate within a particular business or current expectations that a long-lived asset will be sold or otherwise disposed of significantly before the end of its estimated useful life. To test for impairment, we compare the estimated undiscounted cash flows, expected to be generated from the use and disposal of the asset or asset group to its carrying value. If these undiscounted cash flows are less than their respective carrying values, an impairment charge would be recognized to the extent that the carrying values exceed estimated fair values. Although third party estimates of fair value are utilized when available, the estimation of undiscounted cash flows and fair value requires us to make assumptions regarding future operating results, as well as appropriate discount rates, where necessary. The results of our impairment testing are dependent on these estimates, which may be affected by the occurrence of certain events, including changes in economic and competitive conditions.
Pension and Postretirement Benefits
Our pension and postretirement costs are accrued based on an annual analysis performed by our actuary. This analysis is based on assumptions, such as an assumed discount rate and an expected rate of return on plan assets. Both the discount rate and expected rate of return on plan assets require estimates and projections and can fluctuate from period to period. Our expected rate of return on plan assets is a long-term assumption based upon our target asset mix. Our objective in selecting a discount rate is to select the best estimate of the rate at which the benefit obligations could be effectively settled. In making this estimate, we look at rates of return on high-quality fixed-income investments currently available and expected to be available during the period to maturity of the benefits. This process includes the construction of a hypothetical bond portfolio whose cash flow from coupons and maturities match the year-by-year, projected benefit cash flows from our pension and retiree health plans. The yield on such a portfolio becomes the basis for determining our best estimate of the effective settlement rate. If we increased the discount rate by one half of one percent, the net periodic benefit costs would have decreased by approximately $0.4 million. A decrease in the discount rate by one half of one percent would have increased our net periodic benefit costs by approximately $0.7 million.
52
Unrecognized actuarial gains and losses relating to changes in our assumptions and actual experiences differing from them are being recognized over a 10.3 year period, which represents the expected remaining service life of the employer group. These unrecognized losses will be systematically recognized as an increase in future net periodic benefit costs in accordance with SFAS No. 87.
The actuarial assumptions used to determine pension and other postretirement benefit plan retirement benefits may differ from actual results due to changing market and economic conditions, higher or lower withdrawal rates or longer or shorter life spans of participants. We do not believe differences in actual experience or changes in assumptions will materially affect our financial position or results of operations.
Revenue Recognition
Revenue from the sale of products is recognized at the point of passage of title, which is at the time of shipment or consumption by the customer for inventory on consignment. We require that persuasive evidence of a revenue arrangement exists, delivery of product has occurred or services have been rendered, the price to the customer is fixed and determinable and collectibility is reasonably assured before revenue is realized and earned.
Quantitative and Qualitative Disclosures about Market Risk
Foreign Currency Risk
We limit our foreign currency risk by operational means, mostly by locating our manufacturing operations in those locations where we have significant exposures to major currencies. We have entered into forward contracts to partially offset the transactional risk of foreign currency fluctuations. The fair value of these contracts at December 31, 2003 was not material to our consolidated financial position or results of operations.
We sell to customers in foreign markets through foreign operations and through export sales from plants in the United States. These transactions are often denominated in currencies other than the U.S. dollar. The primary currency exposure is the euro.
We have foreign-denominated floating rate debt to protect the value of our investments in our foreign subsidiaries in Europe. Realized and unrealized gains and losses from these hedges are not included in the income statement, but are shown in the cumulative translation adjustment account included in other comprehensive loss.
Market Risk
We are exposed to various market risk factors such as fluctuating interest rates and changes in foreign currency rates. These risk factors can impact results of operations, cash flows and financial position. We manage these risks through regular operating and financing activities and periodically use derivative financial instruments such as foreign exchange forward contracts and interest rate swaps. These derivative instruments are placed with major financial institutions and are not for speculative or trading purposes.
Interest Rate Risk
As required by Noveon, Inc.'s credit agreement, we are a party to interest rate swap agreements with notional amounts of $180.0 million and for which we pay a fixed rate of interest and receive a LIBOR-based floating rate. In 2003, we entered into an additional interest rate swap agreement with a notional amount of $25.0 million on Noveon, Inc.'s Term Loan B through 2007. Our interest rate swap agreements at December 31, 2003 did qualify for hedge accounting under SFAS No. 133 and as such the changes in the fair value of the interest rate swap agreements are recognized as a component of
53
equity. The fair value of the interest rate swap agreements increased stockholder's equity by $4.5 million in 2003 and reduced stockholder's equity by $9.0 million in 2002.
At December 31, 2003, we had $1,030.3 million of outstanding debt on our balance sheet, with $384.4 million of that total, net of $205.0 million of debt that is hedged, held at variable interest rates. Holding all other variables constant, if interest rates hypothetically increased or decreased by 10%, for the year ended December 31, 2003, interest expense would have increased or decreased by $2.6 million. In addition, if interest rates hypothetically increased or decreased by 10% on December 31, 2003, with all other variables held constant, the fair market value of our $275.0 million, 11% senior subordinated notes would decrease or increase by approximately $15.2 million. If interest rates hypothetically increased or decreased by 10% on December 31, 2003, with all other variables held constant, the fair market value of our $165.9 million seller note would decrease or increase by approximately $11.6 million.
Changes in and Disagreements with Accountants on Accounting and Financial Disclosure
We have had no changes in or disagreements with our accountants on accounting and financial disclosures.
54
Overview
We are a leading global producer and marketer of technologically advanced specialty materials and chemicals used in a broad range of consumer and industrial applications. We have a number of high growth, industry-leading product franchises marketed under some of the industry's most recognized brand names including Carbopol®, TempRite®, Estane® and Hycar®. These global brands are complemented by a diverse portfolio of historically stable, cash-generating businesses. We have a significant presence in many niche product categories, where customers value our long-standing ability to provide need-specific formulations and solutions. Our products and services enhance the value of customers' end-products by improving performance, providing essential product attributes, lowering cost, simplifying processing or making them more environmentally friendly.
Through our worldwide network of 29 strategically located manufacturing facilities, we serve more than 7,000 customers operating in over 25 industries. In 2003, we generated sales of $1,135.9 million, a net loss of $7.9 million, net cash provided by operating activities of $118.0 million and Adjusted EBITDA of $201.3 million. We derived approximately 59% of our sales from the United States, 21% of our sales from Europe and 20% of our sales from the rest of the world in 2003. Our margins, combined with our strong cash flow from operations, ongoing capital efficiency efforts and available cash, provide us with significant flexibility to capitalize on future growth opportunities.
Our Competitive Strengths
Leading Product Franchises. Approximately 65% of our 2003 EBITDA was generated by products that hold #1 or #2 global positions, including Carbopol® acrylic thickeners, TempRite® CPVC, Estane® TPU and Hycar® acrylic emulsions. We have a proprietary technology position in each of these products within their respective industries, which contributed to above average industry growth rates. Carbopol® acrylic thickener volume for personal care and pharmaceuticals, measured in pounds sold, grew at a compound annual rate of approximately 8.5% per year between 1993 and 2003, while we estimate that the personal care industry grew at 3.5% during the same period. Between 1993 and 2003, volume, measured in pounds used, of our TempRite® resins and compounds grew at a compound annual rate of approximately 8.4% per year, 1.9 times the growth rate of U.S. residential construction during the same period.
Commitment to Innovation. We believe that innovation and new product development is critical to meeting our customers' needs and to fuel future growth. Our history of technological innovation includes the invention of Carbopol® acrylic thickener and the commercial development of TempRite® CPVC. Carbopol® acrylic thickener is the global leader in synthetic thickeners due to its efficient stabilizing properties and superior thickening capabilities. TempRite® CPVC is the industry standard for CPVC piping, which is a higher performance, lower cost alternative to copper and steel in household plumbing, fire sprinklers and other industrial applications. Our commitment to innovation is demonstrated by recent increases in research and development employment and spending. We have increased our research and development and technical service staff by 21%, or 64 positions, and spending has increased 21%, or $7.7 million, since 2001.
Customized Value-Added Products. We have developed many of our products in cooperation with our customers, often as a result of their specific needs, resulting in long-standing, loyal customer relationships. Our products generally represent a small percentage of our customers' production costs but are critical to end-product performance. In addition, many of our products are specified in our customers' formulations, resulting in significant barriers to changing suppliers. Specific examples include carbomer thickeners in personal care and pharmaceutical applications and FDA-approved polymers used in food packaging applications.
55
Strong Cash Flow. We generate strong cash flow from operations after capital expenditures. Since our inception in March 2001, we have generated $278.2 million in cash flow from operations after capital expenditures. Our ability to generate strong and stable cash flow is principally attributable to the diversity of our product lines, industry-leading margins, rigorous management of working capital and relatively low capital expenditures. Our strong cash flow will enable us to invest in targeted growth strategies and continue to reduce indebtedness thereby enhancing our ability to grow earnings.
Relentless Focus on Productivity Improvement. Our operating culture is based on continuing productivity improvement, maximizing operating efficiency and optimizing the use of capital resources across all products lines. Since we began operation as a stand-alone company in 2001, we have successfully implemented cost-savings initiatives that reduced our fixed manufacturing overhead by over $20 million, delayered our organization, reduced working capital, refocused our capital spending and introduced our Six Sigma productivity initiative.
Proven Management Team with Significant Equity Interest. We have a highly motivated senior management team with an average of approximately 20 years of experience in the specialty chemicals industry. Our senior management has instilled an entrepreneurial culture throughout our organization, successfully implemented leading productivity practices, reinvigorated our new product development efforts, and positioned us for strong future earnings growth and cash flow generation. As of February 29, 2004, our management and employees held outstanding shares and granted options representing approximately 9.3% of our equity.
Our Growth Strategy
Enter New Applications and End-Uses. We intend to build on our core product franchises and technology to expand our product offerings by modifying existing formulations to meet new end-use applications. For example, we pioneered the development of hand sanitizing gels by using the thickening and stabilizing properties of Carbopol® acrylic thickener to combine water and alcohol, and we broadened the use of Carbopol® acrylic thickeners into applications such as oven cleaners and alkaline batteries. We have also expanded our BlazeMaster® fire sprinkler opportunities by obtaining amendments to building codes, allowing us to participate in a broader spectrum of fire sprinkler applications, including dormitories and single and multi-family homes.
Expand Global Reach. We expect to continue to serve our existing multinational customers globally as they penetrate emerging regions and to target other customers in such regions. Our approach is to strategically add sales, marketing and research and development related personnel in selected regions and to follow with further infrastructure expansion as the markets for our customers' products develop. For example, in 2003 we purchased a controlling interest in a Thailand-based manufacturer of formulated botanical extracts used in personal care applications. This acquisition provides us with access to products that we plan to sell throughout our global distribution system. In addition, we began producing textile coating compounds and started construction of a TPU plant in China to service regional demand.
Extend Product Breadth. We expect to continue to expand our product offerings through both internal research and development and the acquisition of new formulations and products. For example, in 2003, we developed and introduced Fixate™, a fixative used in hair care styling resins, allowing us to broaden our hair care application base. In addition, we acquired aliphatic TPU technologies and assets that allow us to enter high-value optical film and medical tubing applications. In 2004, we purchased Scher Chemicals, Inc., a manufacturer of emollients used in skin care, one of the largest and fastest growing applications in the personal care industry.
Continue Productivity Improvements. We expect to continue our successful cost-saving initiatives by pursuing operational efficiencies, optimizing available technologies, maintaining a lean organizational
56
structure, reducing fixed costs, rationalizing capacity and efficiently managing capital spending. In 2002, we launched a Six Sigma initiative, which has been designed to further enhance our understanding of our customers' needs, our process capabilities and the total cost of maintaining quality. The term "Six Sigma" refers to a measure of business capability. A company that performs at a Six Sigma level has demonstrated that its measurable processes have a defect rate of not more than 3.4 defects for every million opportunities. We have 21 employees trained as Six Sigma black belts throughout our Company. We are targeting an increase of 10 black belts per year. We believe this initiative is a natural extension of our productivity efforts and allows us to focus our activities on those areas expected to provide us with the highest customer impact and organizational productivity.
Actively Manage Business Portfolio. We plan to accelerate profitable growth through selected acquisitions of assets and technology that focus on high value niche applications and complement our current product offerings and capabilities. We have made 11 targeted strategic acquisitions since our inception. At the same time, we will consider selective divestitures to optimize our product portfolio and to strengthen our financial flexibility.
Business Segments
Consistent with our focus on industries and end-use applications, we have organized our business into three segments: Consumer Specialties, Specialty Materials and Performance Coatings.
Consumer Specialties is a global producer of specialty chemicals targeting the personal care, pharmaceutical and food and beverage industries. Key products in this segment include Carbopol® acrylic thickeners, film formers, fixatives, emollients, silicones, botanicals, active pharmaceutical ingredients and intermediates, benzoate preservatives, fragrances, synthetic food dyes and natural colorants. In 2003, Consumer Specialties generated sales of $328.7 million, segment operating income of $47.0 million and Segment EBITDA of $73.1 million.
Personal Care and Pharmaceuticals. Our products serving the personal care and pharmaceutical end-use industries impart physical and sensory properties, such as texture, stability and thickness to products, including lotions, hair gels, cosmetics and pharmaceuticals. Our products are an important component of the functionality and aesthetics of the end product, but typically represent a small portion of the customer's total product costs. Our history of technological innovation includes the invention of Carbopol® acrylic thickener, which is the global leader in synthetic thickeners due to its efficient stabilizing properties and superior thickening capabilities. Primary end-uses in the personal care industry for Carbopol® acrylic thickeners include hair care, skin care and personal and oral hygiene products. In addition to Carbopol® acrylic thickeners, our products include hair styling resins, silicones and emollients. Primary end-uses in pharmaceuticals for Carbopol® acrylic thickeners include topical and controlled-release applications. Our other pharmaceutical products include calcium polycarbophil bulk laxatives, advanced intermediates and active ingredients such as mesalazine, which is used in the treatment of Crohn's disease, an inflammatory disease of the gastrointestinal tract. Key growth drivers for Carbopol® acrylic thickeners and other personal care and pharmaceutical products include:
- •
- consumer demand for more efficient, innovative and convenient products;
- •
- an aging population that desires a youthful appearance;
- •
- population growth; and
- •
- growth in developing nations.
Carbopol® acrylic thickener volume for personal care and pharmaceuticals, measured in pounds sold, grew at a compound annual rate of approximately 8.5% per year between 1993 and 2003. We
57
continue to develop new end-use applications for Carbopol® acrylic thickeners, which we believe will continue to drive significant demand growth. We expect Carbopol® acrylic thickener growth to continue to exceed the growth of the personal care industry as its products continue to gain sales at the expense of natural and inorganic thickeners. In addition, we successfully launched new products including Carbopol® Aqua SF1 in 2002, a liquid thickener, and Fixate™ in 2003, a hair styling resin, both of which have expanded our personal care end-use applications.
In October 2003, we purchased a controlling interest in SNP, a Thailand-based manufacturer and marketer of botanical extracts used in personal care product formulations. SNP provides us with access to products that we plan to sell throughout our global distribution system. In addition, on January 2, 2004, we purchased Scher Chemicals, Inc., a manufacturer of emollient and surfactant specialty chemicals used in cosmetic and other personal care formulations. This technology will allow us to participate more fully in skin care formulations, one of the largest and fastest growing segments of the personal care industry.
Food and Beverage. Our products preserve freshness and improve the color and consistency of food and beverages, making them more appealing to consumers. We are a leading global producer of benzoate preservatives, the second largest U.S. supplier of synthetic colorants and an integrated producer of flavors, fragrances and other food additives to the food and beverage industry. Benzoates improve the shelf life of consumable goods and are the preservative of choice for manufacturers of soft drinks, bottled beverages, fruit-based products and prepared salads due to their anti-microbial properties. We believe that our Kalama, Washington benzoate facility is the largest facility of its type in North America and the second largest in the world, giving us the capability to serve large customers globally. This facility also produces a number of high-value, distinct flavor and fragrance products for use in many food, personal care and soap products as well as certain intermediate products. The intermediate products include plasticizers used in adhesives, sealants and safety glass, and phenol, a co-product, used for adhesive resins in forest-product applications.
We also sell a full line of FDA-approved food, drug and cosmetic primary dyes (including blends of primary dyes), as well as lakes and natural colors. Primary end-uses for our product line within food and beverage applications include soft drinks and processed foods, such as canned soup and pre-made meals. In addition, within the colorant operation, we produce pigment dispersions for use in architectural coatings and technical dyes used in household dyes and other applications.
The food and beverage industry is a product-focused and fragmented industry that has historically grown with gross domestic product. We expect growth to be driven by consumer demand for convenient and nutritious foods which require additives to preserve freshness and enhance taste, texture and appearance.
The following is a list of representative uses for and/or descriptions of Consumer Specialties products:
| Category | Product/Brand | Description | ||
|---|---|---|---|---|
| Personal Care and Pharmaceuticals | Carbopol® | Acrylic thickener, which imparts stability and improves aesthetics. Often used as a controlled release agent. | ||
| Pemulen® | Polymeric emulsifier reducing formulation irritancy and providing unique sensory properties. | |||
58
| Avalure® | Polymers for color cosmetics and skin care. | |||
| Specialty silicones | Polymers affecting "slip-and-feel." | |||
| Fixate™ | Resin for hair styling. | |||
| Emollients | Improve skin feel and appearance. | |||
| Colorants | Impart color in personal care products. | |||
| Polycarbophil | Active agent for bulk laxatives. | |||
| Amino acid-based actives | Active ingredients for pharmaceuticals. | |||
| Botanical extracts | Specialty additives for cosmetic and skin care formulations. | |||
| Advanced intermediates | Used in the production of active pharmaceutical ingredients. | |||
| Cassia gum | Gelling agents for human food (Japan) and pet food. | |||
| Food and Beverage | Colors | |||
| Food, drug and cosmetic dyes, lakes, natural colors and pigments | Colorants for beverages, confectionary goods, cosmetics, dry mixes/snacks, processed foods and pet food and colorants for inks, paints and paper dyes. | |||
| Benzoates | ||||
| Sodium benzoate | Improves shelf life for certain consumable goods. | |||
| Potassium benzoate | Preservative for manufacturers of soft drinks, bottled beverages, fruit-based products and prepared salads. |
| Flavors and Fragrances | ||||
| Benzaldehyde-based chemicals | Food, personal care and soap products. | |||
| Intermediates | ||||
| Phenol, benzaldehyde, benzyl alcohol and benzoic acid | Pharmaceuticals, coatings, agrochemical products, plasticizers, adhesives, sealant products and alkyd resins. |
Consumer Specialties products are sold worldwide to major manufacturers of cosmetics, personal care products, household products, pharmaceuticals, soft drinks and food products.
59
Specialty Materials is the largest global supplier of chlorinated polyvinyl chloride (CPVC) resins and compounds and reactive liquid polymers (RLP), sold under the respective trademarks TempRite® and Hycar®. Specialty Materials is also a leading producer of thermoplastic polyurethane (TPU) sold under the trademark Estane®. With respect to the markets in which we compete, Specialty Materials is a leading producer of cross-linked polyethylene compounds (PEX) sold under the trademark TempRite®. Applications for TempRite® resins and compounds include piping for residential and commercial plumbing and fire sprinkler systems. Applications for Estane® TPU include plastic film and sheet for various coatings processes. Applications for Hycar® RLP include engineering adhesives. Specialty Materials is also a leading North American producer of rubber and lubricant antioxidants and rubber accelerators. In 2003, Specialty Materials generated sales of $428.6 million, segment operating income of $75.8 million and Segment EBITDA of $110.6 million.
Specialty Plastics. Our core specialty plastics products are TempRite® CPVC, TempRite® PEX and Estane® TPU. TempRite® CPVC is a technologically advanced heat, fire and chemical resistant polymer that we commercially developed to serve technically demanding applications not well served by traditional PVC and other commodity plastics. Our TempRite® CPVC polymers are sold to customers who produce plastic piping for the following end-use applications: residential and commercial plumbing, fire sprinkler systems and industrial piping applications. TempRite® CPVC piping has inherent advantages over copper and other metals due to its heat and corrosion resistance, increased insulation properties, ease of installation and lower installed cost. We market our branded TempRite® CPVC products for specific applications: FlowGuard® and FlowGuard Gold® for residential and commercial plumbing, BlazeMaster® for fire sprinkler systems and Corzan® for industrial piping. We believe we have built strong end-user awareness of our brands by using a direct sales force that markets directly to builders, contractors, plumbers, architects, engineers and building owners.
In 2001, we purchased select assets and technology to manufacture PEX compounds, further used to produce PEX pipe. TempRite® PEX enables Specialty Materials to add a flexible piping compound to its rigid piping product offering. TempRite® PEX is a small but growing product within certain piping applications that demand flexible piping systems.
Key growth drivers for TempRite® CPVC and TempRite® PEX include:
- •
- continuing substitution of CPVC and PEX for metals, other plastics and other more costly materials in targeted applications;
- •
- increasing product awareness among builders, contractors and plumbers;
- •
- residential and commercial real estate expenditures;
- •
- housing needs in developing countries; and
- •
- additional regulatory and building code approvals.
Based on market research data from the Freedonia Group Incorporated, we estimate that in 2002, the industry demand for all piping applications in which CPVC and PEX participate was in excess of $1.0 billion. We expect the niche applications for BlazeMaster® fire sprinkler piping and Corzan® industrial piping to continue to grow at a faster rate than metals used in similar applications. We believe that, just as plastic has replaced virtually all drain, waste and vent piping systems, highly engineered plastics like CPVC and PEX approved for potable water systems will continue to take market share from copper and other metals in commercial and residential plumbing systems.
Estane® TPU, an engineered, highly versatile thermoplastic, provides a high quality, lower cost alternative to rigid plastics and flexible rubber. Performance attributes of Estane® TPU include abrasion, heat and chemical resistance, minimal fatigue from bending, ease of processing and good paintability. These performance characteristics make Estane® TPU attractive for use in a broad range
60
of end-uses, including film and sheet for various coating processes, wire and cable insulation, athletic equipment (such as footwear), medical applications, pneumatic tubing and automotive molded parts. We have recently introduced several new product families that extend the uses for Estane® TPU. This includes products that can be melt spun into elastic spandex fibers and materials that offer enhanced breathability for garments. We believe that Estane® TPU is one of the industry's leading brand names. We also market Stat-Rite® thermoplastics, which are static dissipative materials used in packaging for the electronics industry. In addition, we market fiber-reinforced TPU under the Estaloc® brand. Estaloc® reinforced engineering thermoplastics offer the functional properties of traditional TPU, yet are reinforced for higher stiffness to provide the strength, dimensional stability and impact resistance required to withstand a variety of tough applications and harsh environments. Applications include sporting goods, agricultural equipment and other mechanical components. Key growth drivers for TPU include:
- •
- demand for technical coated fabric and other materials;
- •
- recreational activities;
- •
- new application development; and
- •
- increased substitution of TPU for other plastics.
We estimate that global sales of TPU products are approximately $800 million. We expect substantial growth in TPU volumes to occur in both new and existing end-use applications. The faster growing, higher value segment of the industry is the extrusion sector, which is driven by its rapid replacement of similar materials and its use in high-growth applications. Overall sales of TPU should continue to grow through ongoing replacement of rigid plastics, flexible rubber and other materials. We believe that we are well positioned to grow faster than the overall TPU industry due to our focus on extruded applications and our commitment to develop new technology for high value applications.
In October 2003, we purchased select assets and technology of Thermedics Polymer Products, LLC, a manufacturer of aliphatic TPU, which will allow us to enter high-value optical film, medical tubing and other applications.
Polymer Additives. We are the largest global supplier of RLP and one of the leading North American producers of polymer additives including rubber and lubricant antioxidants and rubber accelerators. Our products in this category extend the life and improve the performance characteristics of rubber, lubricating oil, plastics and thermoset resin-based formulations.
RLP is a high-growth niche product for technologically challenging applications, including structural and engineered adhesives used in aerospace, transportation and electronics. RLP improves impact and crack resistance in composites and coatings and improves the toughness and long-term durability of epoxy-based structural adhesives. RLP growth is anticipated to exceed overall growth of the high-end adhesives industry, as the product is increasingly utilized for its superior performance characteristics relative to other binding agents.
Our antioxidant products are used in rubber, plastics and lubricants and are marketed under the Good-Rite® name, a leading industry brand. Antioxidants prevent oxidative degradation and are primarily utilized by rubber manufacturers and, to a lesser extent, plastic manufacturers, to impart durability and prevent the loss of functional attributes such as flexibility. In motor oil and other lubricants, antioxidants prevent thermal breakdown and extend product life. We also manufacture a line of accelerators, marketed under our brand, Cure-Rite®, which are utilized by rubber manufacturers to reduce the vulcanization/curing time, and thereby improve manufacturing productivity. Key growth drivers for our antioxidant and accelerators include:
- •
- government regulation requiring higher quality lubricating oils;
61
- •
- automobile miles driven; and
- •
- consumer and government pressure on tire manufacturers to produce higher quality tires.
The following is a list of representative uses for and/or descriptions of Specialty Materials products:
| Category | Product/Brand | Description | ||
|---|---|---|---|---|
| Specialty Plastics | CPVC | |||
| TempRite® | Residential plumbing. | |||
| FlowGuard® | Residential and commercial plumbing. | |||
| FlowGuard Gold® | Residential and commercial plumbing. | |||
| Corzan® | Industrial piping. | |||
| BlazeMaster® | Fire sprinkler piping. | |||
| PEX | ||||
| TempRite® | Flexible piping systems. | |||
| TPU | ||||
| Estane® | Aromatic grades for film and sheet, wire and cable insulation, athletic equipment, medical applications, pneumatic tubing, automotive molded parts and adhesives. | |||
| Estaloc® | Automotive trim, sporting goods, agricultural equipment and other mechanical components. | |||
| Stat-Rite® | Packaging of semiconductors, sensitive electronic components, disk drive heads and cell phone components. | |||
| Tecoflex® | Aliphatic grades for optical film, medical tubing and general industrial applications. | |||
| Polymer Additives | Reactive Liquid Polymer | |||
| Hycar® | Used as a toughener and flexibilizer in thermoset resin formulations (construction, composites, coatings and structural adhesives). | |||
| Antioxidants | ||||
| Good-Rite® | Primarily used by rubber manufacturers to prevent oxidative degradations, impart durability and prevent loss of flexibility. | |||
| Accelerators | ||||
| Cure-Rite® | Helps reduce vulcanization/curing time. |
Specialty Materials products are sold to a diverse customer base comprised of major manufacturers in the construction, automotive, telecommunications, electronics, recreation and aerospace industries.
62
Performance Coatings is a leading global producer of high-performance polymers for specialty paper, printing and packaging, industrial and architectural specialty coatings and textile applications. Approximately 70% of Performance Coatings' sales are generated from our water-based acrylic polymers and compounds and polyurethane dispersions. We believe that we offer customized solutions to meet the specific needs of our customers sold under the trademarks Hycar®, Sancure®, Algan®, Performax® and Myflam®. In 2003, Performance Coatings generated sales of $378.6 million, segment operating income of $43.3 million and Segment EBITDA of $63.4 million.
Our product offerings include a broad range of water-based polymer emulsions, resins and auxiliaries used in the production of high-end paint and coatings for wood, paper, metal, concrete, plastic, textiles and other surfaces. Our water-based polymers, which are environmentally attractive substitutes for solvent-based products, are valued for the superior gloss and durability properties they provide. In addition, our polymers are used as ink vehicles, overprint varnishes and functional coatings for specialty paper, printing and packaging applications. We supply acrylic emulsions used to improve the appearance, texture, durability and flame retardance of high-end specialty textiles sold to the home furnishings, technical fabrics and apparel industries. In addition, we believe we are the only fully integrated U.S. supplier of glyoxal and glyoxal-based resins for durable press and wrinkle-resistant textile additives.
Our business strategy is centered on our ability to formulate and compound polymer emulsions to create customized solutions to meet the specific needs of our customers. We have had success with acrylic and polyurethane water-borne technologies as global restrictions targeting the reduction of the volatile organic compounds prevalent in solvent-based products have become more stringent. We continue to develop innovative products based on these technologies to enhance our portfolio. We expect water-borne formulations to continue to grow faster than the overall industry growth rate for the niche industries in which we participate. Key growth drivers in the industry include:
- •
- environmental regulations that limit the use of solvent-based coatings;
- •
- consumer preference for aesthetically enhanced packaging;
- •
- overall industrial production; and
- •
- improved performance and ease of application use of water-based products.
According to the Chemical Economics Handbook-SRI International, or SRI, the annual global demand in 2002 for paint and coatings was approximately $60 billion, of which synthetic resins comprised approximately $10 billion. We selectively serve approximately $2.4 billion of this $10 billion portion of the industry. According to SRI, the annual global demand for chemicals used by the textile industry is greater than $6 billion.
63
The following is a list of representative uses for and/or descriptions of Performance Coatings products:
| Category | Product/Brand | Description | ||
|---|---|---|---|---|
| Performance Coatings | Industrial Coatings and Architectural Specialties | |||
| Hycar® | Water-borne acrylic emulsion for specialty wood, plastics and concrete applications. | |||
| Sancure® | Polyurethane dispersions used on wood flooring and plastic surfaces to promote toughness and durability. | |||
| Specialty Paper, Printing and Packaging | ||||
| Hycar® and Vycar® | Water-borne acrylic, nitrile and PVC emulsions used to modify physical attributes of specialty paper and nonwovens including stiffness, porosity and water repellency. Used in ink-jet printer paper and tea bag sheathing. | |||
| Carboset® | Water-borne acrylic polymers used in ink vehicles and graphic arts coatings. | |||
| Sancure® | Polyurethane dispersions used in laminating adhesives and functional coatings to promote toughness and durability. | |||
| Carbotac® | Water-borne acrylic emulsions used as pressure-sensitive adhesives and laminating adhesives on films and paper. | |||
| Algan® | Water-borne coatings used to provide gloss and protection for literature and packaging materials. | |||
| Textile Coatings | ||||
| Hycar® | Acrylic-based coatings applied to textiles to offer a pleasing texture, low-temperature flexibility and wash resistance. | |||
| Performax® | Polymer-based formulated compounds applied to textiles to promote fire retardancy, breathability, durability, softening and anti-pillowing. | |||
| Sancure® | Polyurethane dispersions used in home furnishings, technical fabrics and apparel to promote breathability and durability. | |||
| Myflam® | Polymer-based emulsions used in drapery backcoatings, upholstery coatings and other textile applications to provide flame retardancy. | |||
64
| Auxiliary Chemicals | ||||
| Glyoxal Glyoxal resins Fluorocarbon extenders Polymer-based softeners | Preparation agents used to improve manufacturing process and add attributes such as softness, durable press and anticrease agents, stain repellents and flame retardants. | |||
| Printing Chemicals | ||||
| Dye thickeners and binders Carbopol® | Thickeners used to impart viscosity to the printing paste applied to fabrics. Pigment binders used to add pigment to a printing paste and prevent deterioration by abrasion or laundering. |
Performance Coatings products are sold to major companies in the specialty paper, printing, packaging, paint and coatings, and textiles industries.
Competition
We face a variety of competitors in each of our product lines, but we believe no single company competes with us across all of our existing product lines. The specialty chemicals industry is highly fragmented, and its participants offer a broad array of product lines and categories, representing many different products designed to meet specific customer requirements. Individual products or service offerings compete on a global, regional and local level due to the nature of the businesses and products, as well as the end-use applications and customers served. The following chart sets forth our principal competitors by segment:
| Segment | End-Use/Product Category | Principal Competitors | ||
|---|---|---|---|---|
| Consumer Specialties | Personal Care and Pharmaceuticals | Cognis, Croda, Hercules, ISP, Nihon Junkayu, Rohm and Haas, Sigma/3V, Sumitomo Seika | ||
Food & Beverage | CP Kelco, DSM, FMC, Quest, Rhodia, Sensient, Symrise, Tessenderlo, Velsicol | |||
Specialty Materials | Specialty Plastics | Atofina, BASF, Bayer, Dow, Georgia Gulf, Huntsman, Kaneka, Sekisui Chemical, Victaulic | ||
Polymer Additives | Atofina, Bayer, Crompton, Flexsys, General Quimica, Great Lakes, Nippon Zeon | |||
Performance Coatings | Performance Coatings | Avecia, BASF, Bayer, Ciba, Clariant, Dow, Johnson Polymer, OMNOVA, Parachem, PolymerLatex, Reichhold, Rohm and Haas, UCB |
Sales and Marketing
We have approximately 330 sales and marketing employees worldwide. Unlike many chemical companies that organize their sales and marketing around product platforms, our sales and marketing efforts are structured around end-use applications to maximize our understanding of customer needs as well as emerging trends. Each end-use team includes representatives from sales, marketing and research and development.
65
Most of our sales and marketing staff is technically oriented and works closely with customers through globally located application development laboratories to develop products and formulations that deliver the desired product attributes. Most of our laboratories are equipped with small-scale equipment that replicates our customers' processing capabilities, which ensure our solutions are easily and efficiently implemented at our customers' facilities.
Finally, many of our sales and marketing resources are dedicated to stimulating end-use demand for our products and, in the case of our TempRite® plumbing, fire sprinkler and industrial piping applications, are focused on marketing to building contractors, plumbers, distributors and construction code officials to convince them to specify our products in their projects or building codes.
Research, Development and Technology
We have a long history as an industry innovator, creating proprietary, high-performance materials for our customers, including the invention of Carbopol® acrylic thickener and the commercial development of TempRite® CPVC. These products are derived from a broad range of technology platforms developed either internally or externally through licensing, acquisition or joint technological alliances with global suppliers and customers. Our research and development staff includes approximately 235 professionals, many of whom possess Ph.D. or equivalent degrees, and 130 technical service employees. Our research and development staff works with both our sales force and customers to utilize our wide spectrum of technology platforms and processing capabilities to produce one of the most comprehensive product offerings in the specialty chemicals industry. We have developed many of our products in cooperation with our customers, often as a result of their specific needs, resulting in long-standing loyal customer relationships.
Our successful record of technological innovation is evidenced by the more than 700 patents that we have secured worldwide during the past 20 years. Currently, we possess approximately 1,100 issued or pending foreign and domestic patents and patent applications worldwide; and over 1,200 foreign and domestic product trademarks and applications and other significant trade secrets. Many of the products represented by these patents are breakthrough innovations, such as specialty Estane® TPU for producing breathable fabric, new generation TempRite® CPVC for impact resistant pipe, water-based acrylic urethane emulsion blends for clear varnishes on wood flooring, Fixate™ resin for hair styling products and Carbopol® acrylic thickener formulations for ink-jet printing applications.
Raw Materials
We use a variety of specialty and commodity chemicals in our manufacturing processes. The majority of raw materials used in manufacturing our products are available from more than one source and are readily available on the open market. Those materials that we choose to purchase from a single source generally have long-term supply contracts as a basis to guarantee supply reliability. Our raw material base is most affected by changes in feedstock prices, which are driven by crude oil or natural gas prices and supply and demand characteristics in our various feedstock-related markets. The majority of our raw materials are derived from petrochemical-based feedstocks. Our single largest raw material
66
purchased represented less than 5% of cost of sales in 2003. Described below is a summary of the principal raw material requirements of each segment:
| Segment | Principal Raw Materials | |
|---|---|---|
| Consumer Specialties | Glacial acrylic acid | |
| Toluene | ||
| Specialty Materials | Acetone | |
| Aniline | ||
| Chlorine | ||
| Methyl diphenyl diisocyanate (MDI) | ||
| Polytetramethylene ether glycol (PTMEG) | ||
| Polyvinyl chloride (PVC) | ||
| Performance Coatings | Butyl acrylate | |
| Ethyl acrylate | ||
| Ethylene glycol | ||
| Styrene |
Employees
As of December 31, 2003, we had approximately 2,780 employees worldwide, with approximately 1,865 in the Americas, 790 in Europe and 125 in the Asia/Pacific region. Many of our employees are highly trained and our key plant managers possess an average of over 15 years of experience.
Seven of our U.S. sites are organized by labor unions with collective bargaining agreements that are subject to periodic renegotiation, with durations varying from three to five years. Approximately 24% of our domestic employees are covered by collective bargaining agreements, with five agreements expiring in 2004 and 2005. We have not experienced any significant labor strikes or work stoppages and believe that our relationship with our employees is satisfactory. We expect to enter into new agreements with these unions as the current agreements expire. Our failure to renew these agreements on reasonable terms could result in labor disruptions and increased labor costs, and a prolonged work stoppage or strike could disrupt our operations. Production employees in Europe generally fall under national master agreements for all chemical companies that are reviewed and modified by March 1 of each year. We observe local customs and legislation in labor relations (including staff councils, where required) and, where applicable, in negotiating collective bargaining agreements.
Health, Safety and Environmental Matters
Our operations, like those of other companies engaged in similar businesses, are subject to extensive environmental laws and regulations by foreign, federal, state and local authorities. These include laws and regulations pertaining to pollution, the protection of human health and the environment, air emissions, wastewater discharges, occupational safety and health, the generation, handling, treatment, disposal, remediation, use, storage and release, and exposure to hazardous substances and wastes. We have incurred, and will continue to incur, costs and capital expenditures in complying with these laws and regulations and to obtain and maintain all necessary permits. In our effort to comply with these environmental laws and regulations, we maintain a disciplined environmental and occupational safety and health compliance program. We conduct internal and external regulatory audits at our plants to identify and categorize potential environmental exposures as well as to ensure compliance with applicable environmental, health and safety laws and regulations. In addition, we are committed to the implementation of the American Chemistry Council's Responsible
67
Care® principles and to the continuous improvement of our health, safety and environmental performance.
We believe that our business, operations and facilities are being operated in compliance in all material respects with applicable environmental and health and safety laws and regulations, many of which provide for substantial fines, penalties and criminal sanctions for violations. Based on information presently known and our currently accrued environmental reserves, we do not expect environmental costs or contingencies to have a material adverse effect on us. The operation of manufacturing plants entails risks in these areas, and we may incur material costs or liabilities in the future which could adversely affect us. Material expenditures could potentially be required in the future. For example, we may be required to comply with evolving environmental and health and safety laws, regulations or requirements that may be adopted or imposed in the future or to address newly discovered contamination or other conditions or information that require a response.
Under certain environmental laws, including the Comprehensive Environmental Response, Compensation and Liability Act of 1980 (commonly known as Superfund) and similar state laws, we may be jointly and severally liable for the costs of environmental contamination at current or former facilities and at off-site locations at which we have disposed of hazardous waste. As a result, we may be subject to liability for costs to investigate and remediate contamination without regard to fault and under certain circumstances liability may be joint and several resulting in one responsible party being held responsible for the entire obligation. Liability may also include damages to natural resources. As discussed below, Goodrich has agreed to indemnify us with respect to the majority of environmental liabilities relating to these contaminated sites.
We reduced our environmental accrual by $23.7 million to $23.2 million on March 1, 2001 from $46.9 million as of February 28, 2001, because under the acquisition agreement, Goodrich retained and did not sell to us seven parcels of real property for which there was an environmental accrual. As reflected in the environmental accrual as of January 1, 2001, these sites, and various other environmental obligations retained by Goodrich, represented $24.3 million of the accrual. Under the acquisition agreement, Goodrich also has agreed to indemnify us against, or has retained, certain environmental liabilities. Our financial statements as of December 31, 2003 included liabilities, measured on an undiscounted basis, of $19.0 million to cover future environmental expenditures either payable by us or indemnifiable by Goodrich. We estimate Goodrich's share of such currently identified liabilities under the indemnity, which extends to 2011, to be approximately $8.1 million. In addition to Goodrich's indemnity, several other indemnities from third parties such as past owners relate to specific environmental liabilities. Goodrich's share of such liabilities may increase to the extent such third parties fail to honor their indemnity obligations through 2011. Accordingly, the current portion of the environmental obligations of $0.8 million is recorded in accrued expenses and $1.4 million of the recovery due from Goodrich is recorded in accounts receivable. Non-current liabilities include $18.2 million and other non-current assets include $6.7 million reflecting the recovery due from Goodrich.
Although we believe that our environmental accruals are adequate, given the uncertainties involved in estimating environmental costs, it is possible that the amount of expenses that will be required relating to remedial actions and compliance with applicable environmental laws and regulations will exceed the amounts reflected in our reserves or that Goodrich (or any of other third party indemnitors) will not fulfill its indemnity obligations. Accordingly, currently identified environmental liabilities may not be adequately covered and additional environmental liabilities may arise in the future that could have a material adverse effect on our financial position, results of operations, or cash flows.
68
Product Liability
Goodrich has agreed to indemnify us for all liabilities (including product liability claims and product recalls) arising in connection with product lines no longer manufactured or sold by us. In addition, Goodrich has agreed to indemnify us against all product liability, product warranty and product defect claims made prior to the 10th anniversary of the closing of the acquisition, relating to products manufactured, sold or delivered by Goodrich prior to the closing of the acquisition and involving damages of at least $2.0 million. However, Goodrich may not fulfill its indemnity obligations.
Manufacturing and Properties
We possess global manufacturing, sales and technical service facilities enabling us to provide customers with worldwide service and a reliable supply of products. We have 29 manufacturing sites, with two of the facilities, located at Kalama, Washington and Pohang, South Korea, certified to ISO 14001 and all but four U.S. plants, three European plants and three Asian plants certified to ISO 9002 standards. The non-certified plants are recent acquisitions or recent startups. In addition, the plants located at Calvert City, Kentucky; Chennai, India and Raubling, Germany operate to "current good manufacturing practices" standards, or cGMP, and manufacture products suitable for use in the production of pharmaceutical products. Each plant has rigorous productivity and quality assessment programs in place, with performance metrics summarized and reviewed on a monthly basis by our management.
We have met increases in global demand through internal expansion, acquisitions and joint ventures, as well as by investment in new or significantly expanded existing production facilities in the United States, Europe and Asia. Since 2001, we have made investments in a Carbopol® acrylic thickener and latex facility in Antwerp, Belgium; an Estane® TPU plant expansion in Oevel, Belgium; and benzoate, plasticizer and hexylcynamicaldehyde plant expansions in Kalama, Washington. In addition, we have completed a textile compounding facility and have broken ground for an Estane® TPU plant in China. Most recently, we have also initiated construction on a Carbopol® acrylic thickener expansion in Calvert City, Kentucky.
69
Our headquarters and primary research facility is located in Brecksville, Ohio. Our chemical manufacturing facilities are listed below.
| Location | Owned/Leased | Size (Approx.) | ||
|---|---|---|---|---|
| Henry, Illinois | Owned | 100,000 sq. ft. | ||
| Calvert City, Kentucky | Owned | 75,000 sq. ft. | ||
| Louisville, Kentucky | Owned | 232,000 sq. ft. | ||
| Lawrence, Massachusetts | Owned | 160,000 sq. ft. | ||
| Leominster, Massachusetts(1) | Owned | 59,000 sq. ft. | ||
| Wilmington, Massachusetts | Leased | 83,600 sq. ft. | ||
| Clifton, New Jersey | Owned | 18,200 sq. ft. | ||
| Pedricktown, New Jersey | Owned | 40,000 sq. ft. | ||
| Charlotte, North Carolina | Owned | 270,000 sq. ft. | ||
| Gastonia, North Carolina | Owned | 116,000 sq. ft. | ||
| Akron, Ohio | Owned | 236,000 sq. ft. | ||
| Avon Lake, Ohio | Owned | 240,000 sq. ft. | ||
| Chagrin Falls, Ohio | Owned | 49,000 sq. ft. | ||
| Cincinnati, Ohio | Leased | 450,000 sq. ft. | ||
| Kalama, Washington | Owned | 550,000 sq. ft. | ||
| Antwerp, Belgium | Owned | 81,000 sq. ft. | ||
| Oevel, Belgium | Owned | 215,000 sq. ft. | ||
| Qingpu, China | Leased | 45,000 sq. ft. | ||
| Wenzhou, China | Leased | 53,000 sq. ft. | ||
| Lyon, France | Leased | 13,500 sq. ft. | ||
| Raubling, Germany | Leased/Owned | 134,500 sq. ft. | ||
| Chennai, India | Leased | 114,000 sq. ft. | ||
| Vadadora, India | Owned | 294,000 sq. ft. | ||
| Senawang, Malaysia | Owned | 38,000 sq. ft. | ||
| Delfzijl, The Netherlands | Leased | 50,000 sq. ft. | ||
| Pohang, South Korea | Leased/Owned | 49,000 sq. ft. | ||
| Barcelona, Spain | Leased/Owned | 76,000 sq. ft. | ||
| Muang, Thailand | Jointly Owned | 15,000 sq. ft. | ||
| Barnsley, United Kingdom | Owned | 50,000 sq. ft. |
- (1)
- Operations will cease by the end of 2004.
Legal Proceedings
We are engaged in legal proceedings arising in the ordinary course of business. We believe that the ultimate outcome of these proceedings will not have a material adverse impact on our results of operations, financial position or cash flows. See "Health, Safety and Environmental Matters" for information concerning legal proceedings relating to certain environmental claims.
70
Directors and Executive Officers
The following table sets forth information with respect to each member of our Board of Directors and each of our executive officers.
| Name | Age | Position | ||
|---|---|---|---|---|
| H. William Lichtenberger | 68 | Chairman of the Board and Director | ||
| Steven J. Demetriou | 45 | Director, Chief Executive Officer and President | ||
| T.J. Dermot Dunphy | 71 | Director | ||
| John L. Garcia | 47 | Director | ||
| Brian R. Hoesterey | 36 | Director | ||
| Vincent A. Sarni | 75 | Director | ||
| Susan C. Schnabel | 42 | Director | ||
| James E. Virtue | 42 | Director | ||
| Christopher R. Clegg | 46 | Senior Vice President, General Counsel and Secretary | ||
| Michael D. Friday | 52 | Executive Vice President and Chief Financial Officer | ||
| William B. Sedlacek | 49 | Senior Vice President and General Manager, Personal Care and Pharmaceuticals Global Business Unit | ||
| Kumar Shah | 55 | Senior Vice President, Corporate and Business Development | ||
| Sean M. Stack | 37 | Vice President and Treasurer | ||
| Cornelis K. Verhaar | 50 | Senior Vice President and General Manager, Performance Coatings Global Business Unit |
H. William Lichtenberger has been our Chairman of the Board of Directors since March 2001. In November 2000, Mr. Lichtenberger retired from Praxair, Inc., which was spun off from Union Carbide Corporation in 1992. He served as Chairman of the Board of Praxair from 1992 until his retirement in 2000 and as Chief Executive Officer of Praxair from 1992 until March 2000. Mr. Lichtenberger is currently a director of Arch Chemicals, Inc. and Ingersoll-Rand Company. Mr. Lichtenberger is a former President, Chief Operating Officer and director of Union Carbide. He holds a bachelor of arts and a bachelor of science in chemical engineering from the University of Iowa. Mr. Lichtenberger holds a master's degree in business administration from the State University of New York, Buffalo.
Steven J. Demetriou has been our Chief Executive Officer since March 2001 and our President since May 2001, and has served on our Board of Directors since March 2001. Prior to joining us, Mr. Demetriou served as an Executive Vice President of IMC Global Inc. and President of IMC Crop Nutrients. Mr. Demetriou joined IMC Global Inc. in June 1999 as a Senior Vice President and President of the IMC Phosphates business unit. From December 1997 to June 1999, Mr. Demetriou served as Vice President, Global Specialty Resins and President, Cytec Asia-Pacific of Cytec Industries, Inc., a manufacturer of specialty materials. Prior to working for Cytec, Mr. Demetriou worked for Exxon Chemical Company for 16 years and held various leadership positions during that time. Mr. Demetriou serves on the Board of Directors of Commonwealth Industries, Inc. Mr. Demetriou holds a bachelor of science in chemical engineering from Tufts University.
T.J. Dermot Dunphy has served on our Board of Directors since March 2001. Mr. Dunphy has been the Chairman of Kildare Enterprises, LLC, a private equity management and investment firm since December 2001. Prior to joining Kildare, Mr. Dunphy worked for Sealed Air Corporation, a manufacturer and marketer of proprietary protective products and systems. In 1971, Mr. Dunphy was elected President and Chief Executive Officer of Sealed Air, and in 1996, he was elected Chairman and Chief Executive Officer of Sealed Air. From 1971 until he retired in 2000, Sealed Air's annual sales grew from approximately $5 million to approximately $3 billion. Mr. Dunphy was also President of
71
Custom-Made Packaging, Inc. and worked for Westinghouse Electric Corporation as Manager of Services for the corporation's air-conditioning division. Mr. Dunphy is currently a director of Sealed Air Corporation and was formerly a director of FleetBoston Financial Corporation, Public Service Enterprise Group, Rockaway Corporation and Loctite Corporation. Mr. Dunphy graduated from Oxford University and holds a master's degree in business administration from Harvard Business School.
John L. Garcia has served on our Board of Directors since March 2001. Mr. Garcia is President of AEA Investors LLC, the successor company of AEA Investors Inc., of which he has been President since September 2002. Previously, he was a Managing Director of AEA Investors Inc. from May 1999. From 1994 to 1999, Mr. Garcia was a Managing Director with Credit Suisse First Boston LLC, formerly known as Credit Suisse First Boston Corporation, where he served as Global Head of the Chemicals Investment Banking Group and Head of the European Acquisition and Leveraged Finance and Financial Sponsor Groups. His previous experience was with Wertheim Schroder in New York as an investment banker and at ARCO Chemicals, in research, strategic planning and commercial development roles. Mr. Garcia is currently a director of AEA Investors LLC, Acetex Corporation and Sovereign Specialty Chemicals, Inc. and is on the supervisory board of Symrise GmbH. Mr. Garcia is a graduate of the University of Kent in England and holds a master's degree and Ph.D. in organic chemistry from Princeton University. He also holds a master's degree in business administration from The Wharton School of the University of Pennsylvania.
Brian R. Hoesterey has served on our Board of Directors since March 2001. Mr. Hoesterey is a Managing Director of AEA Investors LLC, the successor company of AEA Investors Inc., of which he has been a Managing Director since September 2002. Prior to joining AEA in 1999, he was an Associate with BT Capital Partners, the private equity investment vehicle of Bankers Trust, from 1998 to 1999. Mr. Hoesterey worked for McKinsey & Co. as an Engagement Manager from 1995 to 1997 and the investment banking division of Morgan Stanley & Co. Incorporated in both New York and Hong Kong from 1989 to 1993. He is currently an officer of Sovereign Specialty Chemicals, Inc. Mr. Hoesterey obtained a bachelor of business administration degree from Texas Christian University and holds a master's degree in business administration from Harvard Business School.
Vincent A. Sarni has served on our Board of Directors since March 2001. Mr. Sarni retired from PPG Industries, Inc. in August 1993, concluding a 25-year career with the company, and is currently an independent consultant. He served as Chairman of the Board and Chief Executive Officer of PPG from 1984 until his retirement in 1993. Mr. Sarni is currently a director of Mueller Group, Inc. He is a former director of Amtrol, Inc., Brockway, Inc., Hershey Foods Corp., Honeywell, Inc., LTV Corporation, Mellon Bank, and PNC Financial Corp. Mr. Sarni is also a former Chairman of the Pittsburgh Pirates. Mr. Sarni holds a bachelor of science from the University of Rhode Island. He completed graduate studies in marketing at New York University Graduate School of Business and the advanced management program of Harvard Business School.
Susan C. Schnabel has served on our Board of Directors since March 2001. Ms. Schnabel has been a Managing Director in the Private Equity group of Credit Suisse First Boston since December 2000. In 1990, she joined Donaldson, Lufkin & Jenrette, Inc. and became a Managing Director in 1996. In 1997, Ms. Schnabel left DLJ to serve as Chief Financial Officer of PETsMART, a high-growth specialty retailer of pet products and supplies. She rejoined DLJ in her present capacity in 1998. Ms. Schnabel serves on the Board of Directors of DeCrane Aircraft Holdings, Inc., Environmental Systems Products Holding, Inc., Shoppers Drug Mart and Target Media Partners. Ms. Schnabel received a bachelor of science in chemical engineering from Cornell University and holds a master's degree in business administration from Harvard Business School.
James E. Virtue has served on our Board of Directors since April 2003. Mr. Virtue has been the Chief Executive Officer of MidOcean Partners and affiliated entities since February 2003. Prior to that, he was Chief Executive Officer of DB Capital Partners since June 1999 and a member of Deutsche
72
Bank's Executive Committee. From 1990 to 1999, Mr. Virtue was a Managing Director of Bankers Trust Company. Mr. Virtue is currently a director of Kinetics Holdings Corp. Mr. Virtue graduated from Middlebury College with a bachelor of arts degree.
Christopher R. Clegg is our Senior Vice President, General Counsel and Secretary and has served in that capacity since March 2001. Mr. Clegg had served as Vice President-Legal for the Performance Materials Segment of Goodrich since 1999. Before assuming that position, Mr. Clegg served as Senior Corporate Counsel for Goodrich Aerospace since May 1991. Prior to joining Goodrich, Mr. Clegg was a corporate lawyer in private practice with the law firms of Squire, Sanders & Dempsey in Cleveland, Ohio from March 1988 to May 1991 and Perkins Coie in Seattle, Washington. Mr. Clegg holds a bachelor's degree in political science from the University of California at Berkeley, a master's degree in International Studies from the Johns Hopkins University School of Advanced International Studies and a law degree from the Georgetown University Law Center.
Michael D. Friday is our Executive Vice President and Chief Financial Officer and has served in that capacity since March 2001. Mr. Friday had served as Vice President-Finance, Business Development and Information Technology of the Performance Materials Segment of Goodrich since March 1997. Prior to joining Goodrich, Mr. Friday spent three years at Rubbermaid Incorporated as Vice President of Finance for the Little Tikes Company, where he had responsibility for information technology, customer service and finance. Prior to joining Rubbermaid, Mr. Friday spent 20 years in the General Electric Company's financial organization. Mr. Friday holds a bachelor of science degree in business administration from the Rochester Institute of Technology.
William B. Sedlacek is our Senior Vice President and General Manager, Personal Care and Pharmaceuticals Global Business Unit and has served in that capacity since March 2001. Mr. Sedlacek had served as Group President of the Consumer Specialties Group for the Performance Materials Segment of Goodrich since 1998. Mr. Sedlacek joined Goodrich in 1977 as a product engineer in that company's international business unit. In 1988, Mr. Sedlacek moved to Brussels, Belgium, as business manager for the hydrophilics business in Europe. In 1992, Mr. Sedlacek returned to the United States as General Manager of the Hycar® Reactive Liquid Polymers business unit. Mr. Sedlacek was named Vice President and General Manager of the consumer specialties business unit in 1995 and promoted to Group President in 1998. Mr. Sedlacek earned a bachelor's degree in chemistry and zoology from Miami University and a master's degree in business administration from Miami University.
Kumar Shah is our Senior Vice President, Corporate and Business Development and has served in that capacity since May 2001. Prior to joining us, Mr. Shah was an independent consultant from July 2000 to May 2001. Mr. Shah served as Senior Vice President-Corporate Development of International Specialty Products Inc., a specialty chemicals firm, from March 1999 to April 2000. From 1993 to February 1999, Mr. Shah served as Vice President-Corporate Development, Investor Relations of Cytec Industries, Inc., a manufacturer of specialty materials. Mr. Shah holds a bachelor's degree in chemical engineering from the Indian Institute of Technology, a master's degree in polymer science from the Polytechnic Institute of Brooklyn and a master's degree in business administration from New York University.
Sean M. Stack is our Vice President and Treasurer and has served in that capacity since March 2001. Prior to joining us, Mr. Stack served as Vice President and Treasurer for Specialty Foods Corporation from May 1996 to December 2000. Specialty Foods filed for bankruptcy in September 2000 and emerged from bankruptcy in December 2000. Mr. Stack joined Specialty Foods as Assistant Treasurer in 1996. Prior to that he was a Vice President at ABN AMRO Bank in commercial and investment banking. Mr. Stack holds a bachelor's degree in business administration from the University of Notre Dame and a master's degree in management from Northwestern University's J.L. Kellogg Graduate School of Management.
Cornelis K. Verhaar is our Senior Vice President and General Manager, Performance Coatings Global Business Unit and has served in that capacity since August 2003. From January 2003 through
73
July 2003, Mr. Verhaar served as our Vice President and General Manager, Textiles. Prior to joining us, Mr. Verhaar served as President and Chief Operating Officer for Johnson Polymer in Wisconsin from October 1999 to June 2002. From March 1997 to September 1999, Mr. Verhaar was the European Regional Director for Johnson Polymer BV in The Netherlands. Prior to that he was Managing Director, Europe, for ICI PLC/Grow Group. Mr. Verhaar holds a bachelor's degree in economics and a doctorate degree in economics from the University of Amsterdam.
Board Committee Membership and Structure
Our Board of Directors has two standing committees: a compensation committee and an audit committee. The compensation committee is comprised of Messrs. Lichtenberger, Dunphy and Garcia. The audit committee is comprised of Messrs. Sarni, Hoesterey and Lichtenberger. Currently, Mr. Garcia is President and Mr. Hoesterey is a Managing Director of AEA. For a more detailed discussion of relationships among our stockholders, AEA, Credit Suisse First Boston LLC and us, see "Certain Relationships and Related Transactions."
We plan to replace Mr. Hoesterey on the audit committee with a director who satisfies The New York Stock Exchange and Securities and Exchange Commission requirements for independence of members of audit committees within one year from the date of this prospectus.
Once PMD, DLJ Merchant Banking and MidOcean collectively own less than 51% of our common stock, the trigger date, our directors will be divided into three classes serving staggered three-year terms. The term of the initial Class I directors will terminate on the date of the first annual meeting of stockholders following the trigger date, the term of the initial Class II directors will terminate on the date of the second annual meeting of stockholders following the trigger date, and the term of the initial Class III directors will terminate on the date of the third annual meeting of stockholders following the trigger date. Each class will consist, as nearly as possible, of one-third of the total number of directors constituting our entire board. At each annual meeting of stockholders, directors will be elected to succeed the class of directors whose terms have expired. This classification of our Board of Directors could have the effect of increasing the length of time necessary to change the composition of a majority of the Board of Directors. Following this classification of the board, in general, at least two annual meetings of stockholders will be necessary for stockholders to effect a change in a majority of the members of the Board of Directors.
Because of the voting agreement of our principal stockholders in the stockholders agreement, we are considered to be "controlled" by PMD, DLJ Merchant Banking and MidOcean under The New York Stock Exchange Corporate Governance Rules. As a result, we are eligible for exemptions from provisions of these rules requiring a majority of independent directors, nominating/corporate governance and compensation committees composed entirely of independent directors and written charters addressing specified matters. We have elected to take advantage of these exemptions. In the event that we cease to be a controlled company within the meaning of these rules, we will be required to comply with these provisions after the transition periods specified in The New York Stock Exchange Corporate Governance Rules.
Audit Committee Financial Expert
Our Board of Directors has determined that Vincent A. Sarni, Chair of the Audit Committee, is an audit committee financial expert as defined by Item 401(h) of Regulation S-K of the Securities Exchange Act of 1934, as amended, the Exchange Act, and is independent within the meaning of Item 7(d)(3)(iv) of Schedule 14A of the Exchange Act.
Conflict of Interest, Code of Ethics and Antitrust Law Policies
We have adopted policies for conflict of interest, code of ethics, and compliance with antitrust laws for all employees, including our principal executive officer, principal financial officer and controller.
74
Director Compensation
Members of our Board of Directors are reimbursed for traveling costs and other out-of-pocket expenses incurred in attending board and committee meetings. Messrs. Lichtenberger, Sarni and Dunphy each receive an annual fee of $25,000 for their services as directors. Mr. Lichtenberger also received 10,000 options to purchase shares of our common stock. Messrs. Sarni and Dunphy each also received 5,000 options to purchase shares of our common stock. Mr. Sarni received an additional 2,500 options to purchase shares of our common stock. The other members of the Board of Directors do not receive additional compensation for their services on the Board of Directors or its committees.
Compensation Committee Interlocks and Insider Participation
As of December 31, 2003, the compensation committee of our Board of Directors was comprised of Messrs. Lichtenberger, Dunphy and Garcia. Mr. Garcia, the President of AEA, is also Chairman of the Board of Directors of a wholly owned subsidiary of AEA, which is the general partner of each of the partnerships that wholly own PMD Investors I LLC and PMD Investors II LLC. Mr. Garcia is also a limited partner in each of these partnerships. PMD owns approximately 43% of our common stock and will own approximately % of our common stock after this offering ( % of our common stock after this offering if the underwriters' over-allotment option is exercised in full). For a more detailed discussion of relationships between AEA, PMD and us see "Certain Relationships and Related Transactions."
Executive Compensation
The table below summarizes compensation information for our Chief Executive Officer and our four other most highly compensated executive officers for the period of March 1, 2001 (the date we began operations) through December 31, 2003.
| | | Annual Compensation | | ||||||||||||||
|---|---|---|---|---|---|---|---|---|---|---|---|---|---|---|---|---|---|
| Name | Fiscal Year | Salary ($) | Bonus ($) | Other Annual Compensation ($) | Securities Underlying Options (#) | All Other Compensation ($) | |||||||||||
| Steven J. Demetriou Chief Executive Officer and President | 2003 2002 2001 | $ | 600,000 600,000 475,000 | (3) | $ | 311,700 600,000 500,000 | $ | 43,514 61,577 157,115 | (4) | 12,000 — 98,611 | (1) | $ | 70,525 26,241 214,400 | (2) | |||
Michael D. Friday Executive Vice President and Chief Financial Officer | 2003 2002 2001 | $ | 288,333 261,250 203,400 | (3) | $ | 107,153 225,078 71,250 | $ | 26,403 22,040 25,620 | — — 30,000 | $ | 14,460 13,306 3,476 | (5) | |||||
Cornelis K. Verhaar Senior Vice President and General Manager, Performance Coatings Global Business Unit | 2003 2002 2001 | $ | 275,000 — — | (6) | $ | 103,574 — — | — — — | 10,000 — — | (1) | $ | 75,000 — — | (7) | |||||
William B. Sedlacek Senior Vice President and General Manager, Personal Care and Pharmaceuticals Global Business Unit | 2003 2002 2001 | $ | 244,350 238,700 198,920 | (3) | $ | 236,156 170,264 78,224 | $ | 32,347 32,886 51,732 | 1,700 300 10,000 | (1) | $ | 14,038 16,352 5,555 | (8) | ||||
Christopher R. Clegg Senior Vice President, General Counsel and Secretary | 2003 2002 2001 | $ | 245,000 240,000 179,167 | (3) | $ | 75,556 172,484 62,700 | $ | 26,830 32,365 22,157 | — 300 10,000 | $ | 14,288 12,766 52,118 | (9) | |||||
- (1)
- The compensation committee of the Board of Directors approved the grant of options to purchase shares of our common stock on February 24, 2003 as follows: Mr. Demetriou, 12,000; Mr. Verhaar, 10,000; and Mr. Sedlacek, 1,700.
75
- (2)
- Reflects a reimbursement of $43,508 for expenses relating to Mr. Demetriou's relocation, a payment of $12,000 for our matching contributions under our 401(k) plan for the 2003 plan year, and premiums paid of $15,017 for excess liability and life insurance policies for Mr. Demetriou.
- (3)
- We began operations on March 1, 2001. Salary amounts reflect compensation paid for fiscal year 2001. Messrs. Friday, Clegg and Sedlacek were employed by us as of March 1, 2001. Mr. Demetriou began employment with us on March 15, 2001.
- (4)
- Includes reimbursements of $73,000 for expenses relating to Mr. Demetriou's temporary housing and living expenses associated with relocation.
- (5)
- Reflects a payment of $12,000 for our matching contributions under our 401(k) plan for the 2003 plan year and premiums paid of $2,460 for excess liability and life insurance policies for Mr. Friday.
- (6)
- Mr. Verhaar began employment with one of our subsidiaries on January 1, 2003.
- (7)
- Reflects a payment of $75,000 for expenses relating to Mr. Verhaar's relocation.
- (8)
- Reflects a payment of $8,000 for our matching contributions under our 401(k) plan for the 2003 plan year, premiums paid of $5,470 for excess liability and life insurance policies for Mr. Sedlacek, and a payment of $568 as a service award.
- (9)
- Reflects a payment of $12,000 for our matching contributions under our 401(k) plan for the 2003 plan year and premiums paid of $2,288 for excess liability and life insurance policies for Mr. Clegg.
Stock Options
The table below sets forth information concerning options to purchase shares of our common stock to the executives listed in the Summary Compensation Table as of December 31, 2003.
Option Grants in Fiscal Year 2003(1)
| | | | | | Potential Realizable Value At Assumed Annual Rates of Stock Price Appreciation For Option Term(2) | ||||||||||
|---|---|---|---|---|---|---|---|---|---|---|---|---|---|---|---|
| | Number of Securities Underlying Options Granted (#) | % of Total Options Granted to Employees in Fiscal Year(3) | | | |||||||||||
| | Exercise Price ($/Share) | Expiration Date | |||||||||||||
| Name | 5% ($) | 10% ($) | |||||||||||||
| Steven J. Demetriou | 12,000 | 25.5 | % | $ | 147.00 | 2/23/13 | $ | 1,109,370 | $ | 2,877,420 | |||||
| Michael D. Friday | — | — | — | — | — | — | |||||||||
| Cornelis K. Verhaar | 10,000 | 21.3 | % | 147.00 | 2/23/13 | 924,475 | 2,397,850 | ||||||||
| William B. Sedlacek | 1,700 | 3.6 | % | 147.00 | 2/23/13 | 157,161 | 407,635 | ||||||||
| Christopher R. Clegg | — | — | — | — | — | — | |||||||||
- (1)
- The compensation committee of our Board of Directors approved the grant of options to purchase shares of our common stock on February 24, 2003 as follows: Mr. Demetriou, 12,000; Mr. Verhaar, 10,000; and Mr. Sedlacek, 1,700.
- (2)
- Values are based on assumed rates of annual compounded appreciation of 5% and 10% from the date the option was granted over the full option term. These assumed rates of appreciation are established by the Securities and Exchange Commission and do not represent our estimate or projection of future stock price.
- (3)
- Pursuant to our Amended and Restated Stock Option Plan, an aggregate of 394,444 shares of our common stock were reserved for options to be granted to our key employees, consultants and directors. As of December 31, 2003, we had granted options to purchase 350,611 shares of our common stock, which includes 22,500 shares of common stock for options granted to certain of our directors.
Subject to continued employment with us, 20% of the shares subject to an option vest on each of the first five anniversaries of the grant date. In the event of certain change of control transactions involving us, 50% of the unvested options become fully exercisable. Any remaining unvested options become fully exercisable upon the earlier of the first anniversary of the change of control if the
76
optionee is employed by us, or the date the optionee is involuntarily terminated. Options generally expire on the tenth anniversary of the date of grant.
The following table sets forth the information concerning the value of options for shares of our common stock held by each of the executives listed in the Summary Compensation Table as of December 31, 2003. No options were exercised by these executives during 2003.
Aggregate Option Exercises and Option Values
| Name | Shares Acquired on Exercise (#) | Value Realized ($) | Number of Securities Underlying Unexercised Options Exercisable/Unexercisable | Value of Unexercised In-the-Money Options ($) Exercisable/Unexercisable(1) | ||||
|---|---|---|---|---|---|---|---|---|
| Steven J. Demetriou | 0 | 0 | 39,444/71,167 | 0/0 | ||||
| Michael D. Friday | 0 | 0 | 12,000/18,000 | 0/0 | ||||
| Cornelis K. Verhaar | 0 | 0 | 0/10,000 | 0/0 | ||||
| William B. Sedlacek | 0 | 0 | 4,060/7,940 | 0/0 | ||||
| Christopher R. Clegg | 0 | 0 | 4,060/6,240 | 0/0 |
- (1)
- There is no public trading market for shares of our common stock. Accordingly, these values of exercisable and unexercisable in-the-money options as of December 31, 2003 are based on the fair market value of our common stock at February 25, 2003 of $147.00 per share, as determined by our Board of Directors, and the $128.57 exercise price per share for options granted prior to 2003. Options granted in 2003 have a $147.00 exercise price per share.
Employment Agreement and Equity Plans
Employment Agreements
We entered into an agreement with Steven J. Demetriou providing for his employment as our Chief Executive Officer for a three-year term beginning on March 15, 2001 and which agreement has been extended through March 15, 2005. Effective March 15, 2004, Mr. Demetriou's minimum annual salary is $650,000. In 2001, he received a signing bonus of $200,000. Mr. Demetriou is eligible for an annual performance-based bonus under the Management Incentive Plan based primarily on attainment of Noveon, Inc.'s actual EBITDA with additional adjustments and working capital targets. Under this plan for 2003, Mr. Demetriou received a bonus of $311,700. Under the 2002 Management Incentive Plan, Mr. Demetriou received a bonus of $600,000. For 2001, he received a guaranteed bonus of $300,000. Mr. Demetriou also received a bonus of $200,000 for the 2001 fiscal year based upon the attainment of working capital targets and the achievement of personal management objectives agreed upon by Mr. Demetriou and our compensation committee.
In 2001, Mr. Demetriou purchased from us 10,000 shares of our common stock at a per share purchase price of $100 in exchange for a full recourse note of $1.0 million with a term of 10 years and an interest rate of 7% per annum. For a description of this note, see "Certain Relationships and Related Transactions."
If Mr. Demetriou's employment is terminated without cause, which includes any failure by us to extend the term of employment for successive one-year periods, or if Mr. Demetriou terminates his employment with good reason, we are required to pay or provide Mr. Demetriou (1) any unpaid portion of his annual salary and paid vacation earned through the date of termination, (2) an amount equal to Mr. Demetriou's annual salary at the time of termination for the remainder of the term of employment, provided that the amount is at least equal to three times Mr. Demetriou's annual salary at the time of termination, and (3) employee benefits for the remainder of the term, but in no event for less than two years.
77
If we terminate Mr. Demetriou's employment in connection with a change in control, we are required to pay or provide Mr. Demetriou (1) any unpaid portion of his annual salary and paid vacation earned through the date of termination, (2) an amount equal to Mr. Demetriou's annual salary for a period of three years, provided that Mr. Demetriou will not receive that amount if the value of his vested stock options on the date of the change in control exceeds the total value of three years of his annual salary, and (3) employee benefits for a period of two years.
Mr. Demetriou is entitled to a gross-up payment in the event he is subject to a federal excise tax resulting from payments or benefits received in connection with a change in control. Mr. Demetriou has the right to terminate his employment at any time on 30 days notice. Mr. Demetriou is subject to non-competition, non-solicitation and non-disclosure covenants. The non-competition covenant does not apply if Mr. Demetriou's employment is terminated by us without cause, by him with good reason in connection with a change in control, or if we fail to extend his term of employment.
2004 Equity Incentive Plan
The following summarizes the principal features of the 2004 Equity Incentive Plan, referred to as the Incentive Plan, which has been adopted by our Board of Directors and approved by our stockholders. A copy of the Incentive Plan are being filed as an exhibit to the registration statement of which this prospectus is a part.
General Terms
The Incentive Plan provides for the grant of incentive and non-qualified stock options, restricted stock, stock units, stock appreciation rights, performance awards, dividend equivalent rights and share awards to (i) our directors, officers and employees, (ii) individuals to whom we have extended a written offer of employment and (iii) our independent contractors.
Up to shares of our common stock may be subject to awards granted under the Incentive Plan.
If an award granted under the Incentive Plan expires, is canceled, is settled in cash (including the settlement of withholding obligations using shares) or is otherwise terminated without having been fully exercised or payment having been made in respect of the entire award, the shares allocable to the terminated portion of the award will be available for use again under the Incentive Plan. If a stock appreciation right is settled in shares, the excess of the number of shares covered by the stock appreciation right over the number of shares issued in settlement of the stock appreciation right will also be available for use again under the Incentive Plan.
The compensation committee of our Board of Directors will administer the Incentive Plan. The composition of the committee is intended to permit the awards under the Incentive Plan to qualify for exemption under Rule 16b-3 under the Securities Exchange Act.
The committee will select the individuals who are eligible for awards, determine the number of awards to be granted, establish the terms, conditions and other provisions of the grants, and construe and interpret the terms of the Incentive Plan. All decisions made by the committee will be final, binding and conclusive. No member of the committee will be liable for any action, inaction, determination or interpretation made in good faith relating to the Incentive Plan or any transaction under the Incentive Plan.
Description of Awards
As a general matter, awards granted under the Incentive Plan will be subject to the terms and conditions set forth in an agreement evidencing their grant.
- •
- Stock Options.The committee may grant incentive and non-qualified stock options to participants. Incentive stock options are options to purchase shares of our common stock that
78
are intended to qualify for special tax treatment under Section 422 of the Code. Non-qualified stock options do not qualify for such treatment. The number of shares that may be subject to incentive stock options is .
- •
- Stock Appreciation Rights.The committee may, either alone or in connection with the grant of an option, grant stock appreciation rights to participants under the Incentive Plan. Stock appreciation rights granted alone may be exercised at such times and be subject to such terms and conditions as the committee may impose. Stock appreciation rights that are granted in tandem with options may only be exercised upon the surrender of the right to purchase an equivalent number of shares of our common stock under the related options and may be exercised only with respect to the shares of common stock for which the related options are then exercisable. The term of stock appreciation rights granted under the Incentive Plan cannot exceed ten years.
The exercise price of options granted under the Incentive Plan may not be less than 100% of the fair market value of a share on the date of grant. The term of options may not exceed ten years.
- •
- Dividend Equivalent Rights.The committee may grant dividend equivalent rights either in connection with awards or as separate awards under the Incentive Plan. Amounts payable in respect of dividend equivalent rights may be payable currently or, if applicable, deferred until the lapsing of restrictions on the dividend equivalent rights or until the vesting, exercise, payment, settlement or other lapse of restrictions on the award to which the dividend equivalent rights relate.
- •
- Restricted Stock.The committee may grant awards of restricted stock under the Incentive Plan, which, unless the committee determines otherwise at the time of grant, carry full voting rights and other rights as a stockholder, including rights to receive dividends and other distributions. Unrestricted shares will be delivered when the restrictions lapse.
- •
- Stock Units.The committee may grant stock units under the Incentive Plan, which represent the right of a participant to receive payment upon vesting or on any later date specified by the committee. The amount of such payment is equal to the fair market value of a share of our common stock on the date the stock unit was granted, the vesting date, or such other date determined by the committee at the time of grant.
- •
- Share Awards.The committee may grant share awards under the Incentive Plan as additional compensation for services rendered or in lieu of cash or other compensation to which a participant is entitled.
- •
- Performance Awards.The committee may grant performance shares and performance units under the Incentive Plan, which will be earned only if performance goals established for performance periods are met. Unless the committee determines otherwise at the time of grant, performance shares carry with them full voting rights and other rights as a stockholder, including rights to receive dividends and other distributions.
A stock appreciation right entitles a participant to surrender any then exercisable portion of the stock appreciation right and, if applicable, the related option, in exchange for an amount equal to the product of (i) the excess of the fair market value of a share of our common stock on the date preceding the date of surrender over the fair market value of a share of our common stock on the date the stock appreciation right was issued, or, if the stock appreciation right is related to an option, the per share exercise price of the option, and (ii) the number of shares of our common stock subject to the stock appreciation right.
Performance shares represent the right to receive a certain number of shares of our common stock on the terms and conditions provided in an agreement. Performance units are denominated in shares of our common stock or a specified dollar amount and represent the right to receive: (i) in the case of share-denominated performance units, a payment in the
79
amount of the fair market value on the date of grant, vesting or any other date specified by the committee; (ii) in the case of dollar-denominated performance units, the specified dollar amount; or (iii) a percentage (which may exceed 100%) of the amount set forth in (i) or (ii), depending on the level of the performance goals attained.
Performance criteria may be used to measure our performance as a whole or the performance of a business unit, business segment or division, either individually, or alternatively in any combination, and measured either annually or cumulatively over a period of years, on an absolute basis or relative to a pre-established target, to previous years' results or to a designated comparison group, in each case as specified by the committee in an award. The committee may adjust performance criteria to reflect the impact of specified corporate transactions, accounting or tax law changes or other extraordinary or nonrecurring events.
Effect of Certain Changes in Capitalization and Transactions
Unless otherwise provided in an award agreement, if a transaction that constitutes our change in control, as defined in the Incentive Plan, occurs, then (i) outstanding options, stock appreciation rights, stock units and restricted stock vest and (ii) outstanding performance units and performance shares vest as if performance objectives were met at the maximum level and participants are entitled to a cash payment in respect of performance units.
In the event of a change in capitalization as defined in the Incentive Plan, adjustments and other substitutions will be made to the Incentive Plan, including adjustments to the maximum number of shares subject to the Incentive Plan, the number and class of shares subject to awards and, if applicable, the exercise price.
Other Terms of the Incentive Plan
Options and stock appreciation rights are not transferable except as provided by will or the laws of descent and distribution or a qualified domestic relations order, or as the committee may determine at or after grant. Restricted stock and performance awards are not transferable until their restrictions lapse.
Our Board of Directors has the right to terminate or amend the Incentive Plan at any time so long as doing so does not impair or adversely alter any outstanding awards or shares acquired under the Incentive Plan without the award holder's consent. Notwithstanding the foregoing, our Board of Directors may not amend the plan absent stockholder approval to the extent such approval is required by applicable law, regulation or exchange requirement. In the absence of any earlier termination, the Incentive Plan will terminate on the tenth anniversary of the date it was adopted by our Board of Directors.
Amended and Restated Stock Option Plan
The following paragraphs summarize the principal features of our stock option plan. A copy of the stock option plan is filed as an exhibit to the registration statement of which this prospectus is a part.
In 2001, we adopted our stock option plan to provide for the grant of nonqualified stock options to our key employees, consultants and directors and our subsidiaries and affiliates. The maximum number of shares of our common stock underlying the options available for award under the stock option plan is 394,444. If any options terminate or expire unexercised, the shares subject to such unexercised options are again available for grant.
The stock option plan is administered by a committee of our Board of Directors. Generally, the committee interprets and implements the stock option plan, grants options, exercises all powers, authority, and discretion of the board under the stock option plan, and determines the terms and conditions of option agreements, including vesting provisions, exercise price, and termination date of options.
80
Each option is evidenced by an agreement between an optionee and us containing such terms as the committee determines. Unless determined otherwise by the committee, 20% of the shares subject to the option vest on each of the first five anniversaries of the grant date subject to continued employment. The committee may accelerate the vesting of options at any time. Unless determined otherwise by the committee, the option price is not less than the fair market value of the underlying shares on the grant date. Generally, unless otherwise set forth in an agreement or as determined by the committee, vested options terminate 45 days after termination of employment (180 days in the event of termination by reason of death or disability).
In the event of a transaction that constitutes a change in control of us, as described in the stock option plan, unless otherwise set forth in an agreement or as determined by the committee, 50% of the unvested options held by each optionee become fully exercisable. Any remaining unvested options held by an optionee become fully exercisable upon the earlier of the first anniversary of the change in control transaction, if the optionee is then employed by us, or the date the optionee's employment is involuntarily terminated, as described in the stock option plan. In the event of specified transactions that result in holders of our common stock receiving payments or securities in respect of, or in exchange for, their common stock that do not result in a change in control of us, as described in the stock option plan, unless otherwise set forth in an option agreement or as determined by the committee, options remain subject to the terms of the stock option plan and the applicable option agreement, and thereafter, upon exercise, optionees will be entitled to receive in respect of any option the same per share consideration received by holders of our common stock in connection with the transaction.
In the event of either of the above-described transactions, we may cancel any options unexercised as of the transaction date upon substitution of equivalent options or a payment from us to the holders of options of the difference between the fair market value of the underlying stock and the option exercise price. Options will in no event entitle the holder of the option to ordinary cash dividends payable upon our common stock issuable upon exercise of the options.
The stock option plan provides that the aggregate number of shares subject to the stock option plan and any option, the purchase price to be paid upon exercise of an option and the amount to be received in connection with the exercise of any option, will be automatically adjusted to reflect any stock splits, reverse stock splits or dividends paid in the form of our common stock, and equitably adjusted as determined by the committee for any other increase or decrease in the number of issued shares of our common stock resulting from the subdivision or combination of shares or other capital adjustments, or the payment of any other stock dividend or other extraordinary dividend, or other increase or decrease in the number of such shares of our common stock or any substantial sale of our assets.
Our Board of Directors may amend, alter, or terminate the stock option plan. Any board action may not adversely alter outstanding options without the consent of the optionee. The stock option plan will terminate 10 years from its effective date, but all outstanding options will remain effective until satisfied or terminated under the terms of the stock option plan. Upon completion of this offering, we do not intend to issue any more options under this plan.
Employee Stock Purchase Plan
In February 2003, we adopted our second amended and restated employee stock purchase plan to provide certain of our employees with the right to purchase shares of our common stock at a purchase price determined by our Board of Directors. The maximum number of shares of our common stock that may be sold under this plan is 100,000 shares, of which 8,018 shares had been sold to our employees and directors as of December 31, 2003.
81
The subscription agreements pursuant to which our executive officers and certain employees purchased shares of our common stock under the employee stock purchase plan restrict transfers of shares held by these executive officers and employees except in certain circumstances. These transfer restrictions expire on the earlier of our sale or the second anniversary of this offering. The subscription agreements pursuant to which all other employees purchased shares of our common stock also restrict transfers of shares held by such employees. Following this offering, these employees will be restricted to the extent requested by us or the underwriters participating in this offering.
The compensation committee of our Board of Directors administers the employee stock purchase plan, and it may amend, alter or terminate this plan. The employee stock purchase plan will terminate on July 24, 2011 unless earlier terminated. Upon completion of this offering, we do not intend to offer any more shares of our common stock under this plan.
Pension Plan
In 2001, we adopted a tax qualified defined benefit retirement plan that will provide pension benefits to our U.S. salaried employees. The amount of an employee's pension will depend on a number of factors including final average earnings, or FAE, for the highest 48 consecutive months of an employee's earnings and years of credited service. The table below sets forth the estimated normal annual retirement benefits payable to eligible employees under the retirement plan in the specified compensation levels and with the specified years of benefit service.
The benefit formula under the retirement plan will generally provide an annual pension of 1.15% of FAE (subject to certain limitations imposed by the Internal Revenue Code) times all years of pension credit, plus 0.45% of FAE in excess of "covered compensation" times years of pension credit up to 35 years. Certain eligible employees will be given pension credit for past service with Goodrich and the benefits provided to certain employees under the retirement plan will be offset by benefits payable from Goodrich's defined benefit pension plan for salaried employees. The numbers listed below do not reflect this offset. Benefits will not be subject to any deduction for Social Security.
| | Years of Benefit Service | ||||||||||||||||||||
|---|---|---|---|---|---|---|---|---|---|---|---|---|---|---|---|---|---|---|---|---|---|
| Final Average Earnings | |||||||||||||||||||||
| 10 | 15 | 20 | 25 | 30 | 35 | 40 | |||||||||||||||
$100,000 | $ | 14,020 | $ | 21,031 | $ | 28,041 | $ | 35,051 | $ | 42,061 | $ | 49,071 | $ | 54,821 | |||||||
| $125,000 | $ | 18,020 | $ | 27,031 | $ | 36,041 | $ | 45,051 | $ | 54,061 | $ | 63,071 | $ | 70,259 | |||||||
| $150,000 | $ | 22,020 | $ | 33,031 | $ | 44,041 | $ | 55,051 | $ | 66,061 | $ | 77,071 | $ | 85,696 | |||||||
| $200,000 | $ | 30,020 | $ | 45,031 | $ | 60,041 | $ | 75,051 | $ | 90,061 | $ | 105,071 | $ | 116,571 | |||||||
| $250,000 | $ | 30,820 | $ | 46,231 | $ | 61,641 | $ | 77,051 | $ | 92,461 | $ | 107,871 | $ | 119,659 | |||||||
| $300,000 | $ | 30,820 | $ | 46,231 | $ | 61,641 | $ | 77,051 | $ | 92,461 | $ | 107,871 | $ | 119,659 | |||||||
| $350,000 | $ | 30,820 | $ | 46,231 | $ | 61,641 | $ | 77,051 | $ | 92,461 | $ | 107,871 | $ | 119,659 | |||||||
| $400,000 | $ | 30,820 | $ | 46,231 | $ | 61,641 | $ | 77,051 | $ | 92,461 | $ | 107,871 | $ | 119,659 | |||||||
| $450,000 | $ | 30,820 | $ | 46,231 | $ | 61,641 | $ | 77,051 | $ | 92,461 | $ | 107,871 | $ | 119,659 | |||||||
| $500,000 | $ | 30,820 | $ | 46,231 | $ | 61,641 | $ | 77,051 | $ | 92,461 | $ | 107,871 | $ | 119,659 | |||||||
| $600,000 | $ | 30,820 | $ | 46,231 | $ | 61,641 | $ | 77,051 | $ | 92,461 | $ | 107,871 | $ | 119,659 | |||||||
| $700,000 | $ | 30,820 | $ | 46,231 | $ | 61,641 | $ | 77,051 | $ | 92,461 | $ | 107,871 | $ | 119,659 | |||||||
| $800,000 | $ | 30,820 | $ | 46,231 | $ | 61,641 | $ | 77,051 | $ | 92,461 | $ | 107,871 | $ | 119,659 | |||||||
| $900,000 | $ | 30,820 | $ | 46,231 | $ | 61,641 | $ | 77,051 | $ | 92,461 | $ | 107,871 | $ | 119,659 | |||||||
| $1,000,000 | $ | 30,820 | $ | 46,231 | $ | 61,641 | $ | 77,051 | $ | 92,461 | $ | 107,871 | $ | 119,659 | |||||||
Earnings include salary and certain incentive payments, including annual cash bonuses, but exclude any awards under any long-term incentive plans and our matching contributions under our 401(k) plan.
The pension amounts shown above take into account an assumed Internal Revenue Code limitation on FAE under the benefit formula of $205,000 and covered compensation of $43,992. The
82
table also assumes retirement at age 65 and the benefit being paid in the form of a five-year certain and continuous annuity with no survivor benefits.
As of December 31, 2003, Mr. Demetriou had 2.8 years of credited service; Mr. Clegg had 12.6 years of credited service and his pension benefit will be subject to an estimated offset under the Goodrich Pension Plan of $24,700; Mr. Sedlacek had 26.1 years of credited service and his pension benefit will be subject to such offset, estimated to be $61,200; and Mr. Friday had 6.8 years of credited service and his pension benefit will be subject to such offset, estimated to be $10,200.
In 2003, as an employee of our Dutch subsidiary, Mr. Verhaar did not participate in the Noveon Retirement Plan. Contributions in the amount of €40,000 were made on his behalf to the Dutch subsidiary's retirement and disability plans. Because Mr. Verhaar worked for our Dutch subsidiary for one year, he would be entitled to receive under the Dutch subsidiary's retirement plan approximately €2,400 per year from age 65.
Management Incentive Plan
Noveon, Inc.'s Management Incentive Plan is administered by the compensation committee of its Board of Directors. Participants are selected and approved annually by the President and Chief Executive Officer. Incentive awards under the plan take the form of cash payments made to participants based primarily on attainment of certain actual EBITDA with additional adjustments, working capital and sales targets and are calculated based on the base salary, position and location of each participant. Any awards under the plan are entirely discretionary.
Special Deferred Compensation Plan
Noveon, Inc. adopted the 2001 Special Deferred Compensation Plan to provide a select group of senior managers of the Performance Materials Segment of Goodrich who became employees of Noveon the ability to defer the receipt of compensation for periods provided in the plan. Effective November 1, 2002, the plan was amended and restated, in part to permit additional senior managers to participate in the Noveon, Inc. Special Deferred Compensation Plan.
To participate in the plan, certain eligible employees make an election by executing assignment and election agreements. The election agreement states the amount of the compensation to be deferred and the date and manner in which it shall be paid to the participant. Noveon, Inc. has established a deferred account representing each participant's deferred compensation, which has been placed in a trust. Account balances are deemed to be invested among certain investment choices selected by each participant. The account balances are adjusted at least quarterly to reflect the actual performance of the selected investment allocation.
Director Compensation
Members of our Board of Directors are reimbursed for traveling costs and other out-of-pocket expenses incurred in attending Board of Directors and committee meetings. Messrs. Lichtenberger, Sarni and Dunphy each receive an annual fee of $25,000 for their services as directors. Mr. Lichtenberger also received 10,000 options to purchase shares of our common stock. Messrs. Sarni and Dunphy each also received 5,000 options to purchase shares of our common stock. Mr. Sarni received an additional 2,500 options to purchase shares of our common stock in 2003. The other members of the Board of Directors do not receive additional compensation for their services on the Board of Directors or its committees.
83
CERTAIN RELATIONSHIPS AND RELATED TRANSACTIONS
Stockholders Agreement
The following is a summary of the material terms of the stockholders agreement among us, PMD, DLJ Merchant Banking and MidOcean, formerly known as DB Capital/PMD Investors, LLC, dated as of November 28, 2000, as amended from time to time, and entered into with respect to the shares of our common stock. As of February 29, 2004, PMD owned approximately 43% of our common stock, DLJ Merchant Banking owned approximately 42% and MidOcean owned approximately 14%. Following the completion of this offering, PMD, DLJ Merchant Banking and MidOcean will own approximately %, % and %, respectively ( %, % and %, respectively, if the underwriters' over-allotment option is exercised in full).
The stockholders agreement provides PMD, DLJ Merchant Banking and MidOcean with various corporate governance rights so long as specific stock ownership levels are maintained. PMD and DLJ Merchant Banking each have the right to designate three members to our Board of Directors, and to jointly designate one additional director. MidOcean has the right to designate one director. The agreement also provides that our chief executive officer will serve as a director. After the completion of this offering, each of PMD and DLJ Merchant Banking have agreed that at least one director that it is entitled to designate will be independent.
After the completion of this offering, a significant number of board actions will require the approval of a majority of our directors, which majority must include at least one director designated by each of PMD and DLJ Merchant Banking so long as, in each case, PMD or DLJ Merchant Banking, respectively owns at least 15% of our common stock. Such board actions include, among other things:
- •
- amending our certificate of incorporation or by-laws;
- •
- paying any dividend;
- •
- entering into any merger or similar agreement;
- •
- selling or acquiring any assets in excess of $10 million in any individual transaction other than in the ordinary course of business;
- •
- incurring any indebtedness in excess of $50 million other than in the ordinary course of business;
- •
- issuing any securities except pursuant to an approved option or similar plan;
- •
- entering into transactions between us and any of PMD, DLJ Merchant Banking and MidOcean with limited exceptions; and
- •
- causing our liquidation, dissolution or voluntary bankruptcy.
The stockholders agreement also provides PMD, DLJ Merchant Banking and MidOcean with demand registration rights. PMD and DLJ Merchant Banking may exercise those rights, subject to certain restrictions including lock-up agreements with the underwriters, after the completion of this offering. MidOcean may exercise its demand registration rights, subject to certain restrictions, 18 months from the date of this offering.
If any of PMD, DLJ Merchant Banking or MidOcean, together with their respective affiliates (as defined in the stockholders agreement), cease to hold at least 5% of our common stock, such stockholders will lose their special voting rights and their right to designate directors. In addition, such stockholders will also lose these rights upon the earlier of February 28, 2011 or the date following the completion of this offering on which such stockholders collectively cease to own at least 25% of our common stock.
The stockholders agreement was originally entered into in connection with our acquisition of the Performance Materials Segment of Goodrich in February 2001. Pursuant to the stockholders agreement, AEA, Credit Suisse First Boston LLC, and Deutsche Bank Securities Inc., which was an affiliate of MidOcean through February 20, 2003, received advisory services fees of $8.8 million,
84
$5.5 million and $1.7 million, respectively, from Noveon, Inc. These advisory service fees were determined by agreement among us, the arrangers of our credit facilities, AEA, DLJ Merchant Banking, MidOcean, Credit Suisse First Boston LLC and Deutsche Bank Securities Inc.
Further, pursuant to the stockholders agreement, if our Board of Directors determines to retain a third party to provide certain financial or investment banking services, the Board of Directors, subject to certain restrictions, must retain Credit Suisse First Boston LLC and Deutsche Bank Securities Inc. if they offer to provide services at least as favorable as those offered by third party investment banks. Our right to retain one or more advisors is not limited by our obligation to retain Credit Suisse First Boston LLC or Deutsche Bank Securities Inc.
Management and Advisory Services Agreements
��Pursuant to the stockholders agreement, we entered into management agreements dated as of February 5, 2001, with each of AEA, DLJ Merchant Banking and MidOcean. Pursuant to these management agreements, since February 2001, AEA, DLJ Merchant Banking and MidOcean have each provided management services and advice, ongoing monitoring and management and various other advisory and consulting services. Under the management agreements, we pay AEA, DLJ Merchant Banking, an affiliate of Credit Suisse First Boston LLC, and MidOcean annual fees of $1.9 million, $1.1 million and $0.5 million, respectively, plus reasonable out-of-pocket expenses as compensation for the appointed directors, various advisory and consulting services and for monitoring and management costs, as applicable. Since March 1, 2001, we have paid a total of $5.3 million, $3.0 million and $1.4 million to AEA, DLJ Merchant Banking and MidOcean, respectively, pursuant to these management agreements. Management fees were determined by agreement among us, AEA, DLJ Merchant Banking and MidOcean. In addition, we agreed to indemnify AEA, DLJ Merchant Banking and MidOcean and their respective affiliates for liabilities arising from their actions under the management agreements. The management agreements will be terminated upon the total payments of $ million, of which $ million will be paid to AEA, $ million will be paid to DLJ Merchant Banking, and $ million will be paid to MidOcean. These payments will be paid with a portion of the proceeds from this offering. See "Use of Proceeds."
We entered into an advisory services agreement, dated as of February 5, 2001, with Credit Suisse First Boston LLC. Pursuant to this advisory services agreement, since February 2001, Credit Suisse First Boston LLC has provided financial planning advisory services including various analyses and studies of our business, operations, financial condition and prospects. Under the advisory services agreement, we pay Credit Suisse First Boston LLC an annual fee of $0.5 million plus reasonable out-of-pocket expenses as compensation for strategic and financial planning advisory services. Since we commenced operations on March 1, 2001, we have paid $1.1 million to Credit Suisse First Boston LLC pursuant to the advisory services agreement. The annual fee was determined by agreement among us, AEA, DLJ Merchant Banking, MidOcean and Credit Suisse First Boston LLC. In addition, we agreed to indemnify Credit Suisse First Boston LLC and its affiliates for liabilities arising from their actions under the advisory services agreement. The advisory services agreement will be terminated upon the payment of $ million to Credit Suisse First Boston LLC, which will be paid with a portion of the proceeds from this offering. See "Use of Proceeds."
Note Receivable
In November 2001, our Chief Executive Officer and President purchased 10,000 shares of our common stock that he paid for with the issuance of a $1.0 million full recourse note. The note carries interest at 7% per year and has a term of 10 years. The note was purchased by Noveon, Inc. in 2003 at face value and the receivable is reflected as a separate component of stockholders' equity on the consolidated balance sheet. As of December 31, 2003, the total amount outstanding on the note, including interest, was $1.2 million. The principal amount of the note, together with accrued interest, is payable upon the earliest of:
- •
- the expiration of the 10-year term of the note;
85
- •
- 30 days after Mr. Demetriou's employment is terminated for any reason, other than a termination without "cause" (as defined in his employment agreement); and
- •
- a "change in control" of our Company (as defined in his employment agreement) or the receipt of proceeds by Mr. Demetriou from the sale of shares of our common stock (provided that Mr. Demetriou will only be obligated to repay that amount of the note that is equal to the amount of proceeds received from each such sale of shares until all amounts due under the note are repaid in full), and, in either case, a termination of Mr. Demetriou's employment by us without cause or by Mr. Demetriou with good reason.
Tax Sharing Agreement
We and Noveon, Inc. are parties to a tax sharing agreement, dated February 28, 2001, pursuant to which we file a consolidated federal income tax return with Noveon, Inc. and its domestic affiliated subsidiaries, and the federal income tax liability of Noveon, Inc. and its domestic affiliated subsidiaries is included in our consolidated federal income tax liability. Under the tax sharing agreement, Noveon, Inc. and those subsidiaries will make periodic tax payments to us which generally are determined as though we and Noveon, Inc. file separate returns. Under applicable tax law, which provides that each member of a consolidated group is jointly and severally liable for the federal income tax liability of each other member of the consolidated group, we could be held liable for the taxes of Noveon, Inc. and those subsidiaries even if they fail to make the payments required under the tax sharing agreement.
Management Stockholders Agreement
We, together with AEA, DLJ Merchant Banking and MidOcean, entered into a management stockholders agreement on October 31, 2001 with our executive officers and certain employees who hold shares of our common stock. The agreement restricts the transfer of shares held by these executive officers and employees except in certain circumstances. These transfer restrictions expire on the earlier of a sale of our company or the second anniversary of this offering.
Credit Facilities
Credit Suisse First Boston, an affiliate of both DLJ Merchant Banking and Credit Suisse First Boston LLC, is joint lead arranger, joint book manager, syndication agent and lender under our credit facilities, for which it received fees customary for performing these services and will receive interest on such indebtedness.
Senior Subordinated Notes
On February 28, 2001, Credit Suisse First Boston LLC, an affiliate of DLJ Merchant Banking, and Deutsche Bank Securities Inc., which was an affiliate of MidOcean until February 20, 2003, were initial purchasers of $275.0 million aggregate principal amount of Noveon, Inc.'s senior subordinated notes, for which they received customary underwriting fees.
Registration Rights Agreement
On February 28, 2001, we entered into a registration rights agreement with Goodrich. This agreement provides the holder of over 50% of the aggregate principal amount of the seller note demand registration rights for the seller note.
86
PRINCIPAL AND SELLING STOCKHOLDERS
The following table sets forth information as of February 29, 2004, regarding the beneficial ownership of our common stock immediately prior to the consummation of this offering and as adjusted to reflect the sale of the shares of common stock pursuant to this offering. The table includes:
- •
- each person who is known by us to be the beneficial owner of more than 5% of the outstanding common stock;
- •
- each of our directors;
- •
- each executive officer named in the summary compensation table; and
- •
- all directors and executive officers as a group.
To our knowledge, based on inquiry, we believe that, other than DLJ Merchant Banking Partners III, L.P. and its related stock owners, none of the selling stockholders is an affiliate of a broker-dealer. DLJ Merchant Banking Partners III, L.P. and its related stock owners are affiliates of Credit Suisse First Boston LLC, a broker-dealer. Each of the selling stockholders has advised us that it purchased or acquired the shares in the ordinary course of business and that at the time of the purchase of the shares to be resold hereunder, it had no agreements or understandings, directly or indirectly, with any person to distribute the securities.
Except as otherwise indicated, the persons or entities listed below have sole voting and investment power with respect to all shares of common stock beneficially owned by them, except to the extent this power may be shared with a spouse. Unless indicated below, the address for each individual listed below is in the care of our company.
| | Shares Beneficially Owned Prior to this Offering(1) | Number of Shares Offered | Shares Beneficially Owned After this Offering | ||||||||
|---|---|---|---|---|---|---|---|---|---|---|---|
| Name | Number | Percent | | Number | Percent | ||||||
| PMD Investors II LLC(2) | 1,361,215 | 37.8 | % | ||||||||
| DLJ Merchant Banking Partners III, L.P. and related owners(3)(4) | 1,290,000 | 35.8 | % | ||||||||
| MidOcean Capital/PMD Investors, LLC(5)(6) | 500,000 | 13.9 | % | ||||||||
| DLJ ESC II, L.P.(7) | 210,000 | 5.8 | % | ||||||||
| PMD Investors I LLC(8) | 188,785 | 5.2 | % | ||||||||
| Steven J. Demetriou(9) | 71,567 | 1.9 | % | ||||||||
| H. William Lichtenberger(10)(11) | 9,000 | * | |||||||||
| T. J. Dermot Dunphy(12) | 12,000 | * | |||||||||
| John L. Garcia(10) | — | * | |||||||||
| Brian R. Hoesterey(10) | — | * | |||||||||
| Vincent A. Sarni(13) | 3,500 | * | |||||||||
| Susan C. Schnabel(14) | — | * | |||||||||
| James E. Virtue(15) | — | * | |||||||||
| Christopher R. Clegg | 5,120 | * | |||||||||
| Michael D. Friday | 13,250 | * | |||||||||
| William B. Sedlacek | 6,960 | * | |||||||||
| Kumar Shah | 9,500 | * | |||||||||
| Sean M. Stack | 3,100 | * | |||||||||
| Cornelis K. Verhaar | 3,000 | * | |||||||||
| All Directors and Executive Officers as a Group (14 persons) | 136,997 | 3.7 | % | ||||||||
- *
- Represents beneficial ownership of less than 1%.
87
- (1)
- As used in this table, each person or entity with the power to vote or direct the disposition of shares is deemed to be a beneficial owner. Ownership includes the following number of options that become exercisable within 60 days of February 29, 2004: Mr. Demetriou, 61,567; Mr. Lichtenberger, 4,000; Mr. Dunphy, 2,000; Mr. Sarni, 2,500; Mr. Clegg, 4,120; Mr. Friday, 12,000; Mr. Sedlacek, 4,460; Mr. Shah, 8,000; Mr. Stack, 1,800; and Mr. Verhaar, 2,000. The percentage ownerships are calculated by totaling outstanding shares of common stock and vested options that become exercisable within 60 days of February 29, 2004.
- (2)
- These shares may be deemed to be beneficially owned by AEA. The managing member of PMD Investors II, LLC is PMD Investors II LP. The general partner of PMD Investors II LP is AEA PMD Investors Inc., or "AEA PMD". John L. Garcia is a Director and Chairman of the Board of AEA PMD. Brian R. Hoesterey is a Director, President and Treasurer of AEA PMD. AEA disclaims beneficial ownership of these shares except to the extent of its pecuniary interest therein. The address for AEA and PMD Investors II LLC is c/o AEA Investors LLC, Park Avenue Tower, 65 East 55th Street, New York, New York 10022.
- (3)
- Consists of shares held by DLJ Merchant Banking Partners III, L.P.; DLJMB Funding III, Inc.; DLJ Offshore Partners III, C.V.; DLJ Offshore Partners III-1, C.V.; DLJ Offshore Partners III-2, C.V; DLJ MB PartnersIII GmbH & Co. KG and Millennium Partners II, L.P. Investment and voting decisions on behalf of the partnerships are generally controlled by DLJ Merchant Banking III, Inc. and DLJ Merchant Banking III, L.P., as general partners or adviser and managing limited partner of the partnerships. The general partner of DLJ Merchant Banking III, L.P. is DLJ Merchant Banking III, Inc., an affiliate of Credit Suisse First Boston LLC. Most major decisions regarding investments by DLJ Merchant Banking are made by an investment committee whose composition may change. No individual has authority to make any such decisions without the approval of the investment committee. Certain matters may also require the approval of an advisory committee comprised of limited partners that are not affiliated with DLJ Merchant Banking III, Inc.
- (4)
- The address for DLJ Merchant Banking Partners III, L.P. and related owners is c/o DLJ Merchant Banking, Eleven Madison Avenue, 16th Floor, New York, New York 10010.
- (5)
- Shares are held by MidOcean Capital/PMD Investors, LLC, formerly known as DB Capital/PMD Investors, LLC. MidOcean Capital Investors, L.P., MidOcean Capital Partners, L.P., Existing Fund GP, Ltd., MidOcean Partners, LP, MidOcean Associates, SPC and Ultramar Capital, Ltd. may all be deemed to be beneficial owners of the shares as a result of their direct or indirect control relationship with MidOcean Capital/PMD Investors, LLC. MidOcean Capital Investors, L.P. is the managing member of MidOcean Capital/PMD Investors, LLC. MidOcean Capital Partners, L.P. is the general partner of MidOcean Capital Investors, L.P. Existing Fund GP, Ltd. is the general partner of MidOcean Capital Partners, L.P. MidOcean Partners, LP is the sole owner of Existing Fund GP, Ltd. and a limited partner in MidOcean Capital Partners, L.P., and MidOcean Associates, SPC is the general partner of MidOcean Partners, LP. Ultramar Capital, Ltd. is the sole owner of MidOcean Associates, SPC. J. Edward Virtue may be deemed the beneficial owner of the shares because he indirectly controls the securities, but disclaims beneficial ownership except to the extent of his pecuniary interest therein.
- (6)
- The address for MidOcean Capital/PMD Investors, LLC, MidOcean Capital Investors, L.P., MidOcean Capital Partners, L.P., Existing Fund GP, Ltd., MidOcean Partners, LP, MidOcean Associates, SPC and Ultramar Capital, Ltd. is 320 Park Avenue, 17th Floor, New York, New York 10022.
- (7)
- Investment and voting decisions on behalf of DLJ ESC II, L.P. are generally controlled by DLJ Merchant Banking III, Inc. and DLJ Merchant Banking III, L.P., as general partners or adviser and managing limited partner of the partnerships. The general partner of DLJ Merchant Banking III, L.P. is DLJ Merchant Banking III, Inc., an affiliate of Credit Suisse First Boston LLC. Most major decisions regarding investments by DLJ Merchant Banking are made by an investment committee whose composition may change. No individual has authority to make any such decisions without the approval of the investment committee. Certain matters may also require the approval of an advisory committee comprised of limited partners that are not affiliated with DLJ Merchant
88
Banking III, Inc. The address for DLJ ESC II, L.P. is c/o DLJ Merchant Banking, Eleven Madison Avenue, 16th Floor, New York, New York 10010.
- (8)
- These shares may be deemed to be beneficially owned by AEA. The managing member of PMD Investors I LLC is PMD Investors I LP. The general partner of PMD Investors I LP is AEA PMD. John L. Garcia is a Director and Chairman of the Board of AEA PMD. Brian R. Hoesterey is a Director, President and Treasurer of AEA PMD. AEA disclaims beneficial ownership of these shares except to the extent of its pecuniary interest therein. The address for AEA and PMD Investors I LLC is c/o AEA Investors LLC, Park Avenue Tower, 65 East 55th Street, New York, New York 10022.
- (9)
- Pursuant to an employment agreement, Mr. Demetriou purchased 10,000 shares of our common stock.
- (10)
- Does not include shares beneficially owned by AEA, PMD Investors I LLC and PMD Investors II LLC. Mr. Lichtenberger is a limited partner in PMD Investors I LP, the partnership that owns PMD Investors I LLC. Messrs. Garcia, Hoesterey and Lichtenberger serve on our Board of Directors as designees of PMD. Messrs. Garcia and Hoesterey are limited partners in PMD Investors I LP, the partnership that owns PMD Investors I LLC and in PMD Investors II LP, the partnership that owns PMD Investors II LLC, and are officers and directors of AEA PMD, the general partner of PMD Investors I LP and PMD Investors II LP. Mr. Garcia and Mr. Hoesterey are also officers of AEA. Messrs. Garcia, Hoesterey and Lichtenberger disclaim beneficial ownership of the shares owned by AEA, PMD Investors I LLC and PMD Investors II LLC, except to the extent of their respective pecuniary interests therein.
- (11)
- Includes 5,000 shares held by H. William Lichtenberger Flint™ Trust, dated July 20, 2001, which may be deemed to be beneficially owned by Mr. Lichtenberger.
- (12)
- Mr. Dunphy serves on our Board of Directors as a designee of DLJ Merchant Banking.
- (13)
- Includes 1,000 shares held by Ms. Sandra P. Sarni, Vincent A. Sarni's wife, which may be deemed to be beneficially owned by Mr. Sarni. Mr. Sarni serves on our Board of Directors as a designee of DLJ Merchant Banking.
- (14)
- Does not include shares beneficially owned by DLJ Merchant Banking Partners III, L.P. and related owners. Ms. Schnabel is a managing director in the Private Equity group of Credit Suisse First Boston, the indirect parent of DLJ Merchant Banking Partners III, L.P. and related owners. Ms. Schnabel disclaims beneficial ownership of the shares owned by DLJ Merchant Banking Partners III, L.P., except to the extent of her pecuniary interest therein. Ms. Schnabel serves on our Board of Directors as a designee of DLJ Merchant Banking.
- (15)
- Does not include shares beneficially owned by MidOcean and its affiliates. Mr. Virtue is an officer of entities that are affiliates of MidOcean. Mr. Virtue disclaims beneficial ownership of the shares owned by MidOcean Capital/PMD Investors, LLC except to the extent of his pecuniary interest therein. The address for MidOcean Partners, LP is 320 Park Avenue, 17th Floor, New York, New York 10022. Mr. Virtue serves on our Board of Directors as a designee of MidOcean.
89
DESCRIPTION OF OUR INDEBTEDNESS
Credit Facilities
The following is a summary of some of the material terms of Noveon, Inc.'s credit facilities, as amended, with the lenders thereto. Credit Suisse First Boston, an affiliate of both DLJ Merchant Banking and Credit Suisse First Boston LLC, and Deutsche Bank Securities Inc. are joint lead arrangers and joint book managers of Noveon, Inc.'s credit facilities. Deutsche Bank Trust Company Americas is administrative agent and a lender and Credit Suisse First Boston is also syndication agent and a lender.
Structure
The credit facilities originally provided for aggregate borrowings of the dollar equivalent of $760.0 million measured as of the closing of our acquisition of the Performance Materials Segment of Goodrich.
The credit facilities, as amended, consist of the following:
| | Commitments | Outstanding Balance as of December 31, 2003 | Maturity Date | |||||
|---|---|---|---|---|---|---|---|---|
| | (in millions) | |||||||
| Revolving credit facility | $ | 125.0 | — | 3/31/07 | ||||
| Term Loan A (€) | — | €30.1 | 3/31/07 | |||||
| Term Loan B ($) | — | $ | 468.6 | 12/31/09 | ||||
| Term Loan B (€) | — | €65.6 | 12/31/09 | |||||
The domestic revolving facility provides for a letter of credit subfacility, drawings under which will reduce the amount available under the domestic revolving facility. Both Term Loan A and Term Loan B are subject to amortization of principal.
Availability and Use of Proceeds
Borrowings under the Term Loan A and Term Loan B facilities were used to finance our purchase of the Performance Materials Segment of Goodrich. Borrowings under the revolving credit facilities may be used to provide for working capital and for general corporate purposes. Availability under the revolving credit facilities is subject to various conditions precedent customary for syndicated loans.
Interest
Borrowings under the Term Loan A bear interest at a rate equal, at our option, to either:
- •
- the reserve adjusted eurocurrency rate plus an applicable borrowing margin; or
- •
- the base rate plus an applicable borrowing margin.
Borrowings under the Term Loan B bear interest at a base rate plus an applicable borrowing margin based on our average leverage ratio.
The reserve adjusted eurocurrency rate is the average of the offered quotation in the interbank eurodollar market for U.S. dollar amounts approximately equal to the outstanding principal amount of our eurocurrency rate loans. The base rate is the greater of (1) the prime rate or (2) the federal funds rate plus 50 basis points.
Interest periods for eurocurrency rate loans are one, two, three or six months, subject to availability. Interest on eurocurrency rate loans is payable at the end of the applicable interest period, except for six-month interest periods in which case interest is payable every three months. Interest on base rate loans is payable quarterly in arrears. Upon an event of default, all loans will bear an additional 2.0% of interest for as long as the event of default is continuing.
90
Mandatory and Voluntary Prepayments
Under the terms of the credit facilities, we are required to make mandatory prepayments with respect to a portion of those proceeds received in connection with asset sales, equity or debt issuances or with 75% of domestic excess cash flow in the event our ratio of total debt to EBITDA is greater than or equal to 3.25x or 50% of domestic excess cash flow in the event our ratio of total debt to EBITDA is less than 3.25x. Additionally, we may prepay the base rate loans at any time without premium or penalty. We may prepay eurocurrency rate loans without premium or penalty only at the end of the applicable interest period. If we prepay eurocurrency rate loans at any other time, we will incur breakage costs.
Fees
The credit facilities require us to pay customary commitment, letter of credit and other fees.
Security and Guarantees
Noveon, Inc.'s obligations under the credit facilities are:
- •
- secured by a first priority security interest in all of our assets, which consist solely of 100% of the capital stock of Noveon, Inc., substantially all of Noveon, Inc.'s assets and the assets of its domestic subsidiaries, as defined in the credit agreement, 100% of the capital stock of its direct and indirect restricted domestic subsidiaries and 65% of the capital stock of its first tier foreign subsidiaries; and
- •
- guaranteed by us and each of the direct and indirect material domestic subsidiaries of Noveon, Inc.
Covenants and Conditions
The credit facilities contain customary covenants that restrict Noveon, Inc.'s and its restricted subsidiaries' ability to engage in certain activities. See "Management's Discussion and Analysis of Financial Condition and Results of Operations—Liquidity and Capital Resources."
In addition, the credit facilities require Noveon, Inc. to comply with specified financial covenants including maintenance of net worth, limitations on capital expenditures, minimum interest coverage ratios and maximum leverage ratios. The net worth covenant requires that Noveon, Inc.'s net worth on the last day of any fiscal quarter exceed 80% of its consolidated net worth on February 28, 2001 plus 50% of its net income since December 31, 2000. The capital expenditures covenant generally prohibits Noveon, Inc. from spending more than $75.0 million per fiscal year on capital expenditures. The capital expenditures covenant permits Noveon, Inc. to carry forward any unused capital expenditures amount from one fiscal year to the next fiscal year. The capital expenditures covenant also permits Noveon, Inc. to make additional capital expenditures in an aggregate amount of up to $20.0 million. The interest coverage ratio requires that, as of the last day of each fiscal quarter, Noveon, Inc.'s ratio of EBITDA, as defined in the credit facilities, to its interest expense, exceed 2.35 to 1.0 through December 31, 2004. The interest coverage ratio increases on June 30 of each year thereafter. The maximum leverage ratio requires that, as of the last day of each fiscal quarter, Noveon, Inc.'s ratio of its indebtedness minus its cash and cash equivalents to EBITDA, as defined in the credit facilities, not exceed 4.25 to 1.0 through December 31, 2004. The maximum leverage ratio decreases on June 30 of each year thereafter.
Events of Default
The credit facilities contain customary events of default, including:
- •
- failure to pay principal, interest or fees;
- •
- failure to meet covenants after customary cure periods;
91
- •
- representations and warranties false in any material respect when made;
- •
- cross-default to various other indebtedness;
- •
- change of ownership or control;
- •
- ERISA matters;
- •
- actual or asserted invalidity of loan documentation or security interest;
- •
- material judgment defaults; and
- •
- bankruptcy or insolvency.
Senior Subordinated Notes
Noveon, Inc. issued $275.0 million of senior subordinated notes that mature on February 28, 2011. Interest on the senior subordinated notes accrues at 11% per year. Interest payments on the senior subordinated notes occur on March 15 and September 15 of each year. The senior subordinated notes are jointly and severally guaranteed on an unsecured, senior subordinated basis by all of Noveon, Inc.'s existing and future material domestic restricted subsidiaries, as defined in the indenture governing the senior subordinated notes. Noveon, Inc. may redeem any of the senior subordinated notes at any time on or after March 15, 2006 at redemption prices described in the indenture governing the senior subordinated notes. In addition, upon a change of control, as defined in the indenture governing the senior subordinated notes, Noveon, Inc. will have the option, at any time prior to March 15, 2006, to redeem all of the senior subordinated notes at a redemption price equal to 100% of their principal amount plus a "make-whole" price. If a change of control occurs and Noveon, Inc. does not exercise its option to redeem the senior subordinated notes, it will be required to make an offer to purchase the senior subordinated notes at 101% of the principal amount of the senior subordinated notes on the date of purchase.
The senior subordinated notes contain customary covenants that restrict Noveon, Inc. and its restricted subsidiaries' ability to engage in certain activities. See "Management's Discussion of Financial Condition and Results of Operations—Liquidity and Capital Resources."
Seller Note
In connection with our acquisition of the Performance Materials Segment of Goodrich on February 28, 2001, we issued to Goodrich a seller note in the principal amount of $172.0 million. In March 2003, Goodrich sold the seller note to various holders in a private placement. As of December 31, 2003, the outstanding principal balance under the seller note was $165.9 million. Accrued interest under the seller note was $7.2 million. The seller note bears an initial interest rate of 13% payable semi-annually in cash or additional notes at our option, and increases to 15% after February 28, 2006; however, if interest on the seller note is paid in cash after February 28, 2006, the interest rate remains 13%. The seller note matures on August 31, 2011. After March 1, 2004, the terms of the seller note allow us to repay the note at 105.4% of the principal amount of the seller note plus accrued interest. The restrictive covenants in the terms of the seller note are not more restrictive than those in the terms of our senior subordinated notes. We intend to use a portion of the net proceeds from this offering to repay approximately $ million of our debt obligations outstanding under the seller note. To the extent we issue debt securities concurrently with this offering, the proceeds from such offering will be used to repay a portion of the seller note.
The terms of the credit facilities and 11% senior subordinated notes of Noveon, Inc. contain provisions that significantly restrict the ability of Noveon, Inc. or its subsidiaries to make distributions in cash and other assets to us, including the repayment of the seller note. At December 31, 2003, substantially all of Noveon, Inc.'s net assets were so restricted.
92
Overview
We intend to amend our certificate of incorporation and by-laws prior to the completion of this offering. The forms of our certificate of incorporation and by-laws are being be filed as exhibits to the registration statement of which this prospectus is a part. The following summarizes all of the material terms and provisions of our capital stock upon the closing of this offering. The summary is not complete, and you should read the forms of our certificate of incorporation, by-laws and other agreements, copies of which are available as set forth under "Where You Can Find More Information."
Upon the closing of this offering, our authorized capital stock will consist of shares, $0.01 par value per share, of common stock. The shares of our common stock sold in this offering are fully paid and non-assessable.
Common Stock
Each share of our common stock will be identical in all respects and will entitle its holder to the same rights and privileges enjoyed by all other holders of shares of common stock and will subject them to the same qualifications, limitations and restrictions to which all other holders of common stock will be subject.
Voting Rights
Holders of our common stock will be entitled to one vote per share on all matters to be voted on by our stockholders. Holders of common stock will not have cumulative rights, so that holders of a plurality of the shares of common stock present at a meeting at which a quorum is present will be able to elect all of our directors eligible for election in a given year. The holders of a majority of the voting power of the issued and outstanding common stock will constitute a quorum.
Dividends
Holders of our common stock will be entitled to receive ratably such dividends, if any, as are declared by our Board of Directors out of funds legally available for the declaration of dividends, subject to the preferential rights of any holder of preferred stock that may from time to time be outstanding.
Liquidation
Upon our liquidation, dissolution or winding up, the holders of our common stock will be entitled to share pro rata in the distribution of all of our assets that are legally available for distribution after satisfaction of all of our liabilities and the payment of the liquidation preference of any preferred stock that may be outstanding.
Other Provisions
The holders of our common stock will have no preemptive or other subscription rights to purchase common stock, and there will be no redemptive rights or sinking fund provisions.
Preferred Stock
Upon completion of the offering, our Board of Directors will have the authority, without any further action by our stockholders, to designate and issue up to shares of preferred stock in one or more series. The Board of Directors may also designate the rights, preferences and powers of each series of preferred stock, any or all of which may be greater than the rights of the common stock. It is not possible to state the actual effect of the issuance of any shares of preferred stock upon the rights of
93
holders of the common stock until the Board of Directors determines the specific rights of the holders of the preferred stock. However, these effects might include:
- •
- delaying or preventing our change in control without further action by the stockholders;
- •
- impairing the liquidation rights of the common stock;
- •
- diluting the voting power of the common stock; and
- •
- restricting dividends on the common stock.
We have no present plans to issue any shares of preferred stock.
Limitation on Directors' Liabilities
Our amended and restated certificate of incorporation will limit the liability of and provide for the indemnification of our directors to us and our stockholders to the fullest extent permitted by Delaware law. Specifically, our directors will not be personally liable for money damages for breach of fiduciary duty as a director, except for liability:
- •
- for any breach of the director's duty of loyalty to us or our stockholders;
- •
- for acts or omissions not in good faith or which involve intentional misconduct or a knowing violation of law;
- •
- for unlawful payments of dividends, stock purchases or redemptions under Delaware law; and
- •
- for any transaction from which the director derived an improper personal benefit.
We have also entered into indemnification agreements pursuant to which we have agreed, among other things, to indemnify our directors and certain of our officers against certain liabilities.
Anti-takeover Effects of Delaware Law Provisions
Section 203 of the Delaware General Corporation Law contains provisions that may make the acquisition of control of us by means of a tender offer, open market purchase, proxy fight or otherwise, more difficult.
Section 203 of the Delaware General Corporation Law
We are subject to the provisions of Section 203 of the Delaware General Corporation Law. In general, Section 203 prohibits a publicly held Delaware corporation from engaging in a "business combination" with an "interested stockholder" for a period of three years after the date of the transaction in which the person became an interested stockholder, unless the business combination is approved in a prescribed manner.
Section 203 defines a "business combination" as a merger, asset sale or other transaction resulting in a financial benefit to the interested stockholder. Section 203 defines an "interested stockholder" as a person who, together with affiliates and associates, owns, or, in some cases, within three years prior, did own, 15% or more of the corporation's voting stock. Under Section 203, a business combination between us and an interested stockholder is prohibited unless:
- •
- our Board of Directors approved either the business combination or the transaction that resulted in the stockholder becoming an interested stockholder prior to the date the person attained the status;
- •
- upon consummation of the transaction that resulted in the stockholder becoming an interested stockholder, the interested stockholder owned at least 85% of our voting stock outstanding at the time the transaction commenced, excluding, for purposes of determining the number of shares outstanding, shares owned by persons who are directors and also officers and issued employee stock plans, under which employee participants do not have the right to determine
94
- •
- the business combination is approved by our Board of Directors on or subsequent to the date the person became an interested stockholder and authorized at an annual or special meeting of the stockholders by the affirmative vote of the holders of at least 662/3% of the outstanding voting stock that is not owned by the interested stockholder.
confidentiality whether shares held under the plan will be tendered in a tender or exchange offer; or
Transfer Agent and Registrar
The Transfer Agent and Registrar for our common stock is National City Bank.
Listing
We have applied to have our common stock listed on The New York Stock Exchange under the symbol "NOV."
95
SHARES ELIGIBLE FOR FUTURE SALE
Upon the consummation of this offering, we will have shares of common stock outstanding. Of these shares, other than shares sold in our directed share program, only the shares of common stock sold in this offering, and the shares not subject to any lock-up arrangements, will be freely tradable without registration under the Securities Act and without restriction by persons other than our "affiliates". All shares of common stock held by PMD, DLJ Merchant Banking and MidOcean, our directors and executive officers and other existing stockholders after this offering will be "restricted" securities under the meaning of Rule 144 under the Securities Act and may not be sold in the absence of registration under the Securities Act, unless an exemption from registration is available, including exemptions pursuant to Rule 144 or Rule 144A under the Securities Act.
Rule 144 Securities
In general, under Rule 144 as currently in effect, beginning 90 days after the date of this prospectus, a person who has beneficially owned shares of our common stock for at least one year would be entitled to sell within any three-month period a number of shares that does not exceed the greater of either of the following:
- •
- 1% of the number of shares of common stock then outstanding, which will equal approximately the number of shares outstanding immediately after this offering, or
- •
- the average weekly trading volume of the common stock on the NYSE during the four calendar weeks preceding the filing of a notice on Form 144 with respect to the sale.
Sales under Rule 144 are also subject to manner of sale provisions and notice requirements and to the availability of current public information about us. Rule 144 also provides that affiliates that sell shares of our common stock that are not restricted shares must comply with the same restrictions applicable to restricted shares, other than the holding requirements.
Rule 144(k)
Under Rule 144(k), a person who is not deemed to have been one of our "affiliates" at any time during the 90 days preceding a sale, and who has beneficially owned the shares proposed to be sold for at least two years, including the holding period of any prior owner other than an "affiliate," is entitled to sell its shares without complying with the manner of sale, public information, volume limitation or notice provisions of Rule 144. Therefore, unless otherwise restricted, "144(k) shares" may be sold immediately upon the completion of this offering. The sale of these shares, or the perception that sales will be made, could adversely affect the price of our common stock after this offering because a greater supply of shares would be, or would be perceived to be, available for sale in the public market.
Lock-up Arrangements
In connection with this offering, we and our executive officers, other senior management, directors and each of PMD, DLJ Merchant Banking and MidOcean will enter into lock-up agreements described in "Underwriting."
Credit Suisse First Boston LLC, Deutsche Bank Securities Inc. and UBS Securities LLC have advised us that they have no present intent or arrangement to release any shares subject to a lock-up. Credit Suisse First Boston LLC, Deutsche Bank Securities Inc. and UBS Securities LLC have further advised us that the release of any lock-up will be considered on a case-by-case basis. Upon a request to release any shares subject to a lock-up, Credit Suisse First Boston LLC, Deutsche Bank Securities Inc. and UBS Securities LLC would consider the particular circumstances surrounding the request, including but not limited to, the length of time before the lock-up expires, the number of shares
96
requested to be released, the reasons for the request, the possible impact on the market for our common stock and whether the holder of our shares requesting the release is an officer, director or other affiliate of ours. Credit Suisse First Boston LLC, Deutsche Bank Securities Inc. and UBS Securities LLC have also advised us that they would not consider their own positions, the positions of their affiliates or the positions of Goldman, Sachs & Co. or Merrill Lynch, Pierce, Fenner & Smith Incorporated or their respective affiliates in the securities as a factor.
We entered into a management stockholders agreement with our executive officers and other senior management who hold shares of our common stock. The agreement restricts the transfer of shares held by these executive officers and other senior management except in certain circumstances.
Employees who purchased shares of common stock under our employee stock purchase plan entered in subscription agreements that restrict the transfer of shares held by these employees. Following this offering, these employees will be restricted to the extent requested by us or the underwriters participating in this offering.
97
CERTAIN UNITED STATES FEDERAL TAX CONSIDERATIONS
FOR NON-UNITED STATES HOLDERS
The following is a general discussion of the principal United States federal income and estate tax consequences of the ownership and disposition of our common stock by a non-U.S. holder. As used in this discussion, the term "non-U.S. holder" means a beneficial owner of our common stock that is not, for U.S. federal income tax purposes:
- •
- an individual who is a citizen or resident of the United States;
- •
- a corporation or partnership (including any entity treated as a corporation or partnership for U.S. federal income tax purposes) created or organized in or under the laws of the United States, or of any political subdivision of the United States;
- •
- an estate whose income is subject to U.S. federal income taxation regardless of its source; or
- •
- a trust, in general, if a U.S. court is able to exercise primary supervision over the administration of the trust and one or more U.S. persons have authority to control all substantial decisions of the trust, or if it has a valid election in effect under applicable U.S. Treasury Regulations to be treated as a U.S. person.
An individual may be treated as a resident of the United States in any calendar year for U.S. federal income tax purposes, instead of a nonresident, by, among other ways, being present in the United States for at least 31 days in that calendar year and for an aggregate of at least 183 days during a three-year period ending in the current calendar year. For purposes of this calculation, you would count all of the days present in the current year, one-third of the days present in the immediately preceding year and one-sixth of the days present in the second preceding year. Residents are taxed for U.S. federal income tax purposes as if they were U.S. citizens.
This discussion does not consider:
- •
- U.S. state or local or non-U.S. tax consequences;
- •
- all aspects of U.S. federal income and estate taxes or specific facts and circumstances that may be relevant to a particular non-U.S. holder's tax position, including the fact that in the case of a non-U.S. holder that is an entity treated as a partnership for U.S. federal income tax purposes, the U.S. tax consequences of holding and disposing of our common stock may be affected by certain determinations made at the partner level;
- •
- the tax consequences for the stockholders, partners or beneficiaries of a non-U.S. holder;
- •
- special tax rules that may apply to particular non-U.S. holders, such as financial institutions, insurance companies, tax-exempt organizations, U.S. expatriates, broker-dealers, and traders in securities; or
- •
- special tax rules that may apply to a non-U.S. holder that holds our common stock as part of a "straddle," "hedge," "conversion transaction," "synthetic security" or other integrated investment.
The following discussion is based on provisions of the U.S. Internal Revenue Code of 1986, as amended, existing and proposed Treasury regulations and administrative and judicial interpretations, all as of the date of this prospectus, and all of which are subject to change, retroactively or prospectively. The following summary assumes that a non-U.S. holder holds our common stock as a capital asset. EACH NON-U.S. HOLDER SHOULD CONSULT A TAX ADVISOR REGARDING THE U.S. FEDERAL, STATE, LOCAL AND NON-U.S. INCOME AND OTHER TAX CONSEQUENCES OF ACQUIRING, HOLDING AND DISPOSING OF SHARES OF OUR COMMON STOCK.
98
Distributions on Common Stock
In the event that we make cash distributions on our common stock, these distributions generally will constitute dividends for U.S. federal income tax purposes to the extent paid from our current or accumulated earnings and profits, as determined under U.S. federal income tax principles. Dividends paid to non-U.S. holders of our common stock that are not effectively connected with the non-U.S. holder's conduct of a U.S. trade or business will be subject to U.S. withholding tax at a 30% rate, or if a tax treaty applies, a lower rate specified by the treaty. Non-U.S. holders should consult their tax advisors regarding their entitlement to benefits under a relevant income tax treaty.
Dividends that are effectively connected with a non-U.S. holder's conduct of a trade or business in the United States and, if an income tax treaty applies, are attributable to a permanent establishment in the United States, are taxed on a net income basis at the regular graduated rates and in the manner applicable to U.S. persons. In that case, we will not have to withhold U.S. federal withholding tax if the non-U.S. holder complies with applicable certification and disclosure requirements. In addition, a "branch profits tax" may be imposed at a 30% rate, or a lower rate under an applicable income tax treaty, on dividends received by a foreign corporation that are effectively connected with the conduct of a trade or business in the United States.
A non-U.S. holder who claims the benefit of an applicable income tax treaty generally will be required to satisfy applicable certification and other requirements. However,
- •
- in the case of common stock held by a foreign partnership, the certification requirement will generally be applied to the partners of the partnership and the partnership will be required to provide certain information;
- •
- in the case of common stock held by a foreign trust, the certification requirement will generally be applied to the trust or the beneficial owners of the trust depending on whether the trust is a "foreign complex trust," "foreign simple trust" or "foreign grantor trust" as defined in the U.S. Treasury regulations; and
- •
- look-through rules will apply for tiered partnerships, foreign simple trusts and foreign grantor trusts.
A non-U.S. holder that is a foreign partnership or a foreign trust is urged to consult its own tax advisor regarding its status under these U.S. Treasury regulations and the certification requirements applicable to it.
A non-U.S. holder that is eligible for a reduced rate of U.S. federal withholding tax under an income tax treaty may obtain a refund or credit of any excess amounts withheld by filing an appropriate claim for a refund with the U.S. Internal Revenue Service.
Gain on Disposition of Common Stock
A non-U.S. holder generally will not be subject to U.S. federal income tax on gain recognized on a disposition of our common stock unless:
- •
- the gain is effectively connected with the non-U.S. holder's conduct of a trade or business in the United States and, if an income tax treaty applies, is attributable to a permanent establishment maintained by the non-U.S. holder in the United States; in these cases, the gain will be taxed on a net income basis at the regular graduated rates and in the manner applicable to U.S. persons and, if the non-U.S. holder is a foreign corporation, the "branch profits tax" described above may also apply;
- •
- the non-U.S. holder is an individual who is present in the United States for 183 days or more in the taxable year of the disposition and meets other requirements; or
99
- •
- we are or have been a "United States real property holding corporation" for U.S. federal income tax purposes at any time during the shorter of the five-year period ending on the date of disposition or the period that the non-U.S. holder held our common stock.
Generally, a corporation is a "United States real property holding corporation" if the fair market value of its "United States real property interests" equals or exceeds 50% of the sum of the fair market value of its worldwide real property interests plus its other assets used or held for use in a trade or business. The tax relating to stock in a "United States real property holding corporation" generally will not apply to a non-U.S. holder whose holdings, direct and indirect, at all times during the applicable period, constituted 5% or less of our common stock, provided that our common stock was regularly traded on an established securities market. We believe that we are not currently, and we do not anticipate becoming in the future, a "United States real property holding corporation" for U.S. federal income tax purposes.
U.S. Federal Estate Tax
Common stock owned or treated as owned by an individual who is a non-U.S. holder for U.S. federal tax purposes at the time of death will be included in the individual's gross estate for U.S. federal estate tax purposes, unless an applicable estate tax or other treaty provides otherwise and, therefore, may be subject to U.S. federal estate tax.
Information Reporting and Backup Withholding Tax
Dividends paid to you may be subject to information reporting and U.S. backup withholding. If you are a non-U.S. holder you will be exempt from this backup withholding tax if you properly provide a Form W-8BEN certifying that you are a non-U.S. holder or you otherwise meet documentary evidence requirements for establishing that you are a non-U.S. holder or otherwise establish an exemption.
The gross proceeds from the disposition of our common stock may be subject to information reporting and backup withholding. If you sell your common stock outside the United States through a non-U.S. office of a non-U.S. broker and the sales proceeds are paid to you outside the United States, then the U.S. backup withholding and information reporting requirements generally will not apply to that payment. However, U.S. information reporting, but not backup withholding, will generally apply to a payment of sales proceeds, even if that payment is made outside the United States, if you sell your common stock through a non-U.S. office of a broker that:
- •
- is a U.S. person;
- •
- derives 50% or more of its gross income in specific periods from the conduct of a trade or business in the United States;
- •
- is a "controlled foreign corporation" for U.S. tax purposes; or
- •
- is a foreign partnership, if at any time during its tax year:
- •
- one or more of its partners are U.S. persons who in the aggregate hold more than 50% of the income or capital interests in the partnership; or
- •
- the foreign partnership is engaged in a U.S. trade or business,
unless the broker has documentary evidence in its files that you are a non-U.S. person and certain other conditions are met or you otherwise establish an exemption.
If you receive payments of the proceeds of a sale of our common stock to or through a U.S. office of a broker, the payment is subject to both U.S. backup withholding and information reporting unless you properly provide a Form W-8BEN certifying that you are a non-U.S. person or you otherwise establish an exemption.
You generally may obtain a refund of any amounts withheld under the backup withholding rules that exceed your U.S. federal income tax liability by timely filing a properly completed refund claim with the U.S. Internal Revenue Service.
100
Under the terms and subject to the conditions contained in an underwriting agreement dated , 2004, we and the selling stockholders have agreed to sell to the underwriters named below, for whom Credit Suisse First Boston LLC, Deutsche Bank Securities Inc. and UBS Securities LLC are acting as representatives and book-running managers, the following respective number of shares of common stock:
| Underwriter | Number of Shares | ||
|---|---|---|---|
| Credit Suisse First Boston LLC | |||
| Deutsche Bank Securities Inc. | |||
| UBS Securities LLC | |||
| Goldman, Sachs & Co. | |||
| Merrill Lynch, Pierce, Fenner & Smith Incorporated | |||
| Total | |||
The underwriting agreement provides that the underwriters are obligated to purchase all of the shares of common stock in the offering if any are purchased, other than those shares covered by the over-allotment option described below. The underwriting agreement also provides that if an underwriter defaults, the purchase commitments of the non-defaulting underwriters may be increased or this offering may be terminated. The selling stockholders may be deemed to be underwriters within the meaning of the Securities Act.
We and the selling stockholders have granted to the underwriters a 30-day option to purchase on a pro rata basis up to additional shares from us and an aggregate of additional outstanding shares from the selling stockholders at the initial public offering price less the underwriting discounts and commissions. The option may be exercised only to cover any over-allotments of common stock.
The underwriters propose to offer the shares of common stock initially at the public offering price on the cover page of this prospectus and to selling group members at that price less a selling concession of $ per share on sales to other broker/dealers. The underwriters and selling group members may allow a discount of $ per share on sales to other broker/dealers. After the initial public offering, the representatives may change the public offering price and concession and discount to broker/dealers.
The following table summarizes the compensation and estimated expenses we and the selling stockholders will pay:
| | Per Share | Total | ||||||||||
|---|---|---|---|---|---|---|---|---|---|---|---|---|
| | Without Over-allotment | With Over-allotment | Without Over-allotment | With Over-allotment | ||||||||
| Underwriting Discounts and Commissions paid by us | $ | $ | $ | $ | ||||||||
| Expenses payable by us | $ | $ | $ | $ | ||||||||
| Underwriting Discounts and Commissions paid by selling stockholders | $ | $ | $ | $ | ||||||||
| Expenses payable by selling stockholders | $ | $ | $ | $ | ||||||||
The underwriters will not confirm sales to any accounts over which they exercise discretionary authority without first receiving a written consent from those accounts.
Credit Suisse First Boston LLC, one of the underwriters, is considered to be our affiliate. This offering therefore is being conducted in accordance with the applicable provisions of Rule 2720 of the
101
National Association of Securities Dealers, Inc. Conduct Rules. Rule 2720 requires that the initial public offering price of the shares of common stock not be higher than that recommended by a "qualified independent underwriter" meeting certain standards. Accordingly, UBS Securities LLC, another underwriter of this offering, is assuming the responsibilities of acting as the qualified independent underwriter in pricing this offering, conducting due diligence and reviewing and participating in the preparation of this prospectus and the registration statement which this prospectus forms a part. The initial public offering price of the shares of common stock will be no higher than the price recommended by UBS Securities LLC. UBS Securities LLC will not receive any additional compensation for acting as the qualified independent underwriter.
We have agreed that we will not offer, sell, contract to sell, pledge or otherwise dispose of, directly or indirectly, or file with the Securities and Exchange Commission, or exercise any right with respect to the filing of a registration statement under the Securities Act of 1933 (the "Securities Act") relating to, any shares of our common stock or securities convertible into or exchangeable or exercisable for any shares of our common stock, or publicly disclose the intention to make any offer, sale, pledge disposition or filing without the prior written consent of Credit Suisse First Boston LLC, Deutsche Bank Securities Inc. and UBS Securities LLC for a period of 180 days after the date of this prospectus.
In connection with this offering, our executive officers, directors, other senior management and each of PMD, DLJ Merchant Banking and MidOcean, who together hold shares out of the shares of our common stock outstanding as of December 31, 2003, have agreed that they will not offer, sell, contract to sell, pledge or otherwise dispose of (other than to us), directly or indirectly, any shares of our common stock or securities convertible into or exchangeable or exercisable for any shares of our common stock, enter into a transaction that would have the same effect, or enter into any swap, hedge or other arrangement that transfers, in whole or in part, any of the economic consequences of ownership of our common stock, whether any of these transactions are to be settled by delivery of our common stock or other securities, in cash or otherwise, or publicly disclose the intention to make any offer, sale, pledge or disposition, or to enter into any transaction, swap, hedge or other arrangement, without, in each case, the prior written consent of Credit Suisse First Boston LLC, Deutsche Bank Securities Inc. and UBS Securities LLC for a period of 180 days after the date of the preliminary prospectus. PMD, DLJ Merchant Banking and MidOcean together hold shares of our common stock out of shares of our currently outstanding shares of common stock.
Credit Suisse First Boston LLC, Deutsche Bank Securities Inc. and UBS Securities LLC have advised us that they have no present intent or arrangement to release any shares subject to a lock-up. Credit Suisse First Boston LLC, Deutsche Bank Securities Inc. and UBS Securities LLC have further advised us that the release of any lock-up will be considered on a case-by-case basis. Upon a request to release any shares subject to a lock-up, Credit Suisse First Boston LLC, Deutsche Bank Securities Inc. and UBS Securities LLC would consider the particular circumstances surrounding the request, including but not limited to, the length of time before the lock-up expires, the number of shares requested to be released, the reasons for the request, the possible impact on the market for our common stock and whether the holder of our shares requesting the release is an officer, director or other affiliate of ours. Credit Suisse First Boston LLC, Deutsche Bank Securities Inc. and UBS Securities LLC have also advised us that they would not consider their own positions, the positions of their affiliates or the positions of Goldman, Sachs & Co. or Merrill Lynch, Pierce, Fenner & Smith Incorporated or their respective affiliates in the securities as a factor.
The underwriters have reserved for sale at the initial public offering price up to shares of the common stock for employees, directors and other persons associated with us who have expressed an interest in purchasing common stock in the offering. The number of shares available for sale to the general public offering will be reduced to the extent these persons purchase the reserved shares. Any reserved shares not so purchased will be offered by the underwriters to the general public on the same terms as the other shares. Purchasers of reserved shares are restricted from transferring their shares
102
under the rules of the National Association of Securities Dealers, Inc. for 90 days from the date of the offering.
We and the selling stockholders have agreed to indemnify the underwriters against liabilities under the Securities Act, or contribute to payments that the underwriters may be required to make in that respect.
We have applied to list the shares of common stock on The New York Stock Exchange under the symbol "NOV".
In connection with the listing of the common stock on The New York Stock Exchange, the underwriters will undertake to sell round lots of 100 shares or more to a minimum of beneficial owners.
In connection with our acquisition of the Performance Materials Segment of Goodrich, DLJMB Funding III, Inc., an affiliate of Credit Suisse First Boston LLC, contributed $150 million of cash as equity to us. DLJ Merchant Banking and related entities currently own approximately 41.6% of our shares of common stock. Following the consummation of this offering, DLJ Merchant Banking and certain related entities, all of which are affiliates of Credit Suisse First Boston LLC, will own % of our common stock ( % if the underwriters' over-allotment option is exercised in full). Pursuant to the terms of the stockholders agreement among us, PMD, DLJ Merchant Banking and MidOcean, DLJ Merchant Banking has the right to designate three members to our Board of Directors, and together with PMD, to jointly designate one additional director. After the completion of this offering, a significant number of board actions will require the approval of a majority of our directors, which majority must include at least one director designated by DLJ Merchant Banking so long as, DLJ Merchant Banking owns at least 15% of our common stock.
Subject to certain restrictions, the stockholders agreement also provides PMD, DLJ Merchant Banking and MidOcean with demand registration rights. See "Certain Relationships and Related Transactions—Stockholders Agreement."
Pursuant to the stockholders agreement, we entered into a management agreement with DLJ Merchant Banking. Under the management agreement, we pay DLJ Merchant Banking an annual fee of $1.1 million plus reasonable out-of-pocket expenses as compensation for the appointed directors, various advisory and consulting services and for monitoring and management costs, as applicable. In addition, we agreed to indemnify DLJ Merchant Banking and its affiliates for liabilities arising from its actions under the management agreement. The management agreement will be terminated upon the payment of $ million to DLJ Merchant Banking, which will be paid from a portion of the net proceeds of this offering.
Also pursuant to the stockholders agreement, we entered into an advisory services agreement with Credit Suisse First Boston LLC. Under the advisory services agreement, we pay them an annual fee of $0.5 million plus reasonable out-of-pocket expenses as compensation for strategic and financial planning advisory services. In addition, we agreed to indemnify Credit Suisse First Boston LLC and its affiliates for liabilities arising from its actions under the advisory services agreement. This advisory services agreement will be terminated upon the payment of $ million to Credit Suisse First Boston LLC, which will be paid from a portion of the net proceeds of this offering.
Affiliates of Credit Suisse First Boston LLC and Deutsche Bank Securities Inc. are lenders, joint arrangers and agents under our credit facilities and receive fees customary for performing these services and interest on such indebtedness. See "Description of Our Indebtedness." In addition, in the event that we offer debt securities concurrently with this offering, a portion of the net proceeds from this offering may be used to repay indebtedness under our credit facilities, in which case such lenders will receive their proportionate share of the net proceeds used to repay such indebtedness under our credit facilities. In the event that we offer debt securities concurrently with this offering, Credit Suisse First
103
Boston LLC, Deutsche Bank Securities Inc. and UBS Securities LLC will be initial purchasers of that offering and will receive customary fees for performing such services. Credit Suisse First Boston LLC and Deutsche Bank Securities Inc. were initial purchasers of our senior subordinated notes and received customary underwriting fees in connection therewith. Credit Suisse First Boston LLC and Deutsche Bank Securities Inc. received advisory services fees of $5.5 million and $1.75 million, respectively, from Noveon, Inc., upon consummation of our acquisition of the Performance Materials Segment of Goodrich. See "Certain Relationships and Related Transactions."
Credit Suisse First Boston LLC, Deutsche Bank Securities Inc., UBS Securities LLC, Goldman Sachs & Co. and Merrill Lynch, Pierce, Fenner & Smith Incorporated and their respective affiliates may in the future engage in financial advisory, commercial banking and investment banking services with us for which they will receive customary compensation. Further, pursuant to the stockholders agreement, if our Board of Directors determines to retain a third party to provide certain financial or investment banking services, the Board of Directors, subject to certain restrictions, must retain Credit Suisse First Boston LLC and Deutsche Bank Securities Inc. if they offer to provide services at least as favorable as those offered by third party investment banks. Our right to retain one or more advisors is not limited by our obligation to retain Credit Suisse First Boston LLC or Deutsche Bank Securities Inc.
Prior to this offering, there has been no public market for our common stock. The initial public offering price for our common stock will be determined by negotiation between us and the underwriters. The principal factors to be considered in determining the initial public offering price include the following:
- •
- the information included in this prospectus and otherwise available to the underwriters;
- •
- market conditions for initial public offerings;
- •
- the history of and prospects for our business, our past and present operations;
- •
- the history and prospects for the industry in which we compete;
- •
- our past and present earnings and current financial position;
- •
- an assessment of our management;
- •
- the market of securities of companies in businesses similar to ours; and
- •
- the general condition of the securities markets.
There can be no assurance that the initial public offering price will correspond to the price at which our common stock will trade in the public market subsequent to this offering or that an active trading market will develop and continue after this offering.
Because Credit Suisse First Boston LLC is considered to be our affiliate, they will not be permitted under the rules of The New York Stock Exchange to solicit, or make recommendations regarding, the purchase or sale of our common stock.
In connection with this offering, the underwriters may engage in stabilizing transactions, over-allotment transactions, syndicate covering transactions and penalty bids in accordance with Regulation M under the Securities Exchange Act of 1934.
- •
- Stabilizing transactions permit bids to purchase the underlying security so long as the stabilizing bids do not exceed a specified maximum.
- •
- Over-allotment involves sales by the underwriters of shares in excess of the number of shares the underwriters are obligated to purchase, which creates a syndicate short position. The short position may be either a covered short position or a naked short position. In a covered short position, the number of shares over-allotted by the underwriters is not greater than the number
104
- •
- Syndicate covering transactions involve purchases of the common stock in the open market after the distribution has been completed in order to cover syndicate short positions. In determining the source of shares to close out the short position, the underwriters will consider, among other things, the price of shares available for purchase in the open market as compared to the price at which they may purchase shares through the over-allotment option. If the underwriters sell more shares than could be covered by the over-allotment option, a naked short position, the position can only be closed out by buying shares in the open market. A naked short position is more likely to be created if the underwriters are concerned that there could be downward pressure on the price of the shares in the open market after pricing that could adversely affect investors who purchase in this offering.
- •
- Penalty bids permit the representatives to reclaim a selling concession from a syndicate member when the common stock originally sold by the syndicate member is purchased in a stabilizing or syndicate covering transaction to cover syndicate short positions.
of shares that they may purchase in the over-allotment option. In a naked short position, the number of shares involved is greater than the number of shares in the over-allotment option. The underwriters may close out any covered short position by either exercising their over-allotment option and/or purchasing shares in the open market.
These stabilizing transactions, over-allotment transactions, syndicate covering transactions and penalty bids may have the effect of raising or maintaining the market price of our common stock or preventing or retarding a decline in the market price of the common stock. As a result the price of our common stock may be higher than the price that might otherwise exist in the open market. These transactions may be effected on The New York Stock Exchange and, if commenced, may be discontinued at any time.
A prospectus in electronic format will be made available on the web sites maintained by one or more of the underwriters, or selling group members, if any, participating in this offering and one or more of the underwriters or securities dealers participating in this offering may distribute prospectuses electronically. The representatives may agree to allocate a number of shares to underwriters and selling group members for sale to their online brokerage account holders. Internet distributions will be allocated by the underwriters and selling group members that will make internet distributions on the same basis as other allocations.
Each underwriter has represented, warranted and agreed that: (i) it has not offered or sold and, prior to the expiry of a period of six months from the consummation of this offering, will not offer or sell any shares of our common stock to persons in the United Kingdom except to persons whose ordinary activities involve them in acquiring, holding, managing or disposing of investments (as principal or agent) for the purposes of their businesses or otherwise in circumstances which have not resulted and will not result in an offer to the public in the United Kingdom within the meaning of the Public Offers of Securities Regulations 1995; (ii) it has only communicated or caused to be communicated and will only communicate or cause to be communicated any invitation or inducement to engage in investment activity (within the meaning of section 21 of the Financial Services and Markets Act 2000 ("FSMA")) received by it in connection with the issue or sale of any shares of our common stock in circumstances in which section 21(1) of the FSMA does not apply to the Company; and (iii) it has complied and will comply with all applicable provisions of the FSMA with respect to anything done by it in relation to the shares of our common stock in, from or otherwise involving the United Kingdom.
The shares of our common stock may not be offered or sold, transferred or delivered, as part of their initial distribution or at any time thereafter, directly or indirectly, to any individual or legal entity in the Netherlands other than to individuals or legal entities who or which trade or invest in securities in the conduct of their profession or trade, which includes banks, securities intermediaries, insurance
105
companies, pension funds, other institutional investors and commercial enterprises which, as an ancillary activity, regularly trade or invest in securities.
The shares of our common stock may not be offered or sold by means of any document other than to persons whose ordinary business is to buy or sell shares or debentures, whether as principal or agent, or in circumstances which do not constitute an offer to the public within the meaning of the Companies Ordinance (Cap. 32) of Hong Kong, and no advertisement, invitation or document relating to the shares may be issued, whether in Hong Kong or elsewhere, which is directed at, or the contents of which are likely to be accessed or read by, the public in Hong Kong (except if permitted to do so under the securities laws of Hong Kong) other than with respect to shares which are or are intended to be disposed of only to persons outside Hong Kong or only to "professional investors" within the meaning of the Securities and Futures Ordinance (Cap. 571) of Hong Kong and any rules made thereunder.
This prospectus has not been registered as a prospectus with the Monetary Authority of Singapore. Accordingly, this prospectus and any other document or material in connection with the offer or sale, or invitation or subscription or purchase, of the shares of our common stock may not be circulated or distributed, nor may the shares of our common stock be offered or sold, or be made the subject of an invitation for subscription or purchase, whether directly or indirectly, to persons in Singapore other than under circumstances in which such offer, sale or invitation does not constitute an offer or sale, or invitation for subscription or purchase, of the shares of our common stock to the public in Singapore.
Each underwriter has acknowledged and agreed that the shares of our common stock have not been registered under the Securities and Exchange Law of Japan and are not being offered or sold and may not be offered or sold, directly or indirectly, in Japan or to or for the account of any resident of Japan, except (i) pursuant to an exemption from the registration requirements of the Securities and Exchange Law of Japan and (ii) in compliance with any other applicable requirements of Japanese law.
The validity of the shares of common stock offered by this prospectus will be passed upon for us by Fried, Frank, Harris, Shriver & Jacobson LLP, New York, New York. Latham & Watkins LLP, New York, New York will pass upon certain legal matters in connection with this offering for the underwriters. Fried, Frank, Harris, Shriver & Jacobson LLP has in the past provided, and may continue to provide, legal services to AEA Investors LLC and its affiliates. Fried, Frank, Harris, Shriver & Jacobson LLP, on behalf of its partners, is a limited partner in PMD Investors I LP, which indirectly owns an interest in our common stock. A partner of Fried, Frank, Harris, Shriver & Jacobson LLP, is a managing director and general counsel of AEA Investors LLC.
Ernst & Young LLP, independent auditors, have audited the consolidated financial statements of Noveon International, Inc. at December 31, 2003 and 2002 and for the years ended December 31, 2003 and 2002 and for the ten months ended December 31, 2001, and the consolidated financial statements of BFGoodrich Performance Materials (a segment of The Goodrich Corporation) for the two months ended February 28, 2001, as set forth in their reports. We have included these financial statements in the prospectus and elsewhere in the registration statement in reliance on Ernst & Young LLP's reports, given on their authority as experts in accounting and auditing.
106
WHERE YOU CAN FIND MORE INFORMATION
We have filed with the Securities and Exchange Commission a registration statement on Form S-1 (including the exhibits, schedules and amendments to the registration statement) under the Securities Act and the common stock offered by this prospectus. This prospectus does not contain all the information included in the registration statement. For further information with respect to us and the common stock offered by this prospectus, please refer to the registration statement. Statements contained in this prospectus as to the contents of any contracts or other document referred to in this prospectus are not necessarily complete and, where the contract or agreement or other document is an exhibit to the registration statement, each statement is qualified in all respects by the provisions of the exhibit, to which reference is now made. The registration statement can be inspected and copied at prescribed rates at the public reference facility maintained by the Securities and Exchange Commission at Room 1024, 450 Fifth Street, N.W., Washington, D.C. 20549. The public may obtain information regarding the Washington, D.C. Public Reference Room by calling the Securities and Exchange Commission at 1-800-SEC-0330. In addition, the registration statement is publicly available through the Securities and Exchange Commission's site on the Internet's World Wide Web, located at: http://www.sec.gov. Following this offering, our future public filings are expected to be available for inspection at the offices of The New York Stock Exchange, Inc., 20 Broad Street, New York, New York 10005.
Upon completion of this offering, we will be subject to the full informational requirements of the Securities Exchange Act of 1934, as amended. To comply with these requirements, we will file periodic reports, proxy statements and other information with the Securities and Exchange Commission.
We have not, and the underwriters have not, authorized anyone to provide you with information different from that contained in this prospectus. If anyone provides you with different information you should not rely on it as being authorized by us or any of the underwriters. We are offering to sell, and seeking offers to buy, shares of common stock only in jurisdictions where offers and sales are permitted. The information contained in this prospectus is accurate only as of the date of this prospectus regardless of the time of delivery of this prospectus or of any sale of common stock. Our business, financial condition, results of operations, and prospects may have changed since that date. We will amend or supplement this prospectus as required by law.
107
Noveon International, Inc.
Years Ended December 31, 2003, 2002 and
Period of Ten Months Ended December 31, 2001
and
BFGoodrich Performance Materials
(The Predecessor Company and a Segment of The BFGoodrich Company)
Period of Two Months Ended February 28, 2001
Consolidated Financial Statements
| Reports of Independent Auditors | F-2 | |
Consolidated Financial Statements | ||
| Consolidated Statement of Operations for the years ended December 31, 2003 and 2002, the ten months ended December 31, 2001 and the two months ended February 28, 2001 | F-4 | |
| Consolidated Balance Sheet as of December 31, 2003 and 2002 | F-5 | |
| Consolidated Statement of Cash Flows for the years ended December 31, 2003 and 2002, the ten months ended December 31, 2001 and the two months ended February 28, 2001 | F-6 | |
| Consolidated Statement of Stockholders' Equity for the years ended December 31, 2003 and 2002 and the ten months ended December 31, 2001 and the Consolidated Statement of BFGoodrich Investment for the two months ended February 28, 2001 | F-8 | |
| Notes to Consolidated Financial Statements | F-9 |
F-1
Report of Independent Auditors
Board of Directors of
Noveon International, Inc.
We have audited the accompanying consolidated balance sheet of Noveon International, Inc. as of December 31, 2003 and 2002, and the related consolidated statements of operations, stockholders' equity, and cash flows for the years ended December 31, 2003 and 2002 and the ten months ended December 31, 2001. These financial statements are the responsibility of the Company's management. Our responsibility is to express an opinion on these financial statements based on our audits.
We conducted our audits in accordance with auditing standards generally accepted in the United States. Those standards require that we plan and perform the audit to obtain reasonable assurance about whether the financial statements are free of material misstatement. An audit includes examining, on a test basis, evidence supporting the amounts and disclosures in the financial statements. An audit also includes assessing the accounting principles used and significant estimates made by management, as well as evaluating the overall financial statement presentation. We believe that our audits provide a reasonable basis for our opinion.
In our opinion, the financial statements referred to above present fairly, in all material respects, the consolidated financial position of Noveon International, Inc. at December 31, 2003 and 2002, and the consolidated results of their operations and their cash flows for the years ended December 31, 2003 and 2002 and the ten months ended December 31, 2001, in conformity with accounting principles generally accepted in the United States.
As explained in Note I to the consolidated financial statements, effective January 1, 2002, the Company changed its method of accounting for goodwill.
| /s/ ERNST & YOUNG LLP | ||
Cleveland, Ohio February 17, 2004 |
F-2
Report of Independent Auditors
Board of Directors of
Noveon International, Inc.
We have audited the accompanying consolidated statements of operations, BFGoodrich investment and cash flows of BFGoodrich Performance Materials (as defined in Note A) (a segment of The BFGoodrich Company) for the two months ended February 28, 2001. These financial statements are the responsibility of the management of Noveon International, Inc. Our responsibility is to express an opinion on these financial statements based on our audit.
We conducted our audit in accordance with auditing standards generally accepted in the United States. Those standards require that we plan and perform the audit to obtain reasonable assurance about whether the financial statements are free of material misstatement. An audit includes examining, on a test basis, evidence supporting the amounts and disclosures in the financial statements. An audit also includes assessing the accounting principles used and significant estimates made by management, as well as evaluating the overall financial statement presentation. We believe that our audit of the financial statements provides a reasonable basis for our opinion.
In our opinion, the financial statements referred to above present fairly, in all material respects, the consolidated results of the operations and cash flows of BFGoodrich Performance Materials for the two months ended February 28, 2001, in conformity with accounting principles generally accepted in the United States.
| /s/ ERNST & YOUNG LLP | ||
Cleveland, Ohio September 5, 2002 |
F-3
Noveon International, Inc.
and
BFGoodrich Performance Materials
(The Predecessor Company and a Segment of The BFGoodrich Company)
Consolidated Statement of Operations
(dollars in millions, except per share amounts)
| | Noveon International, Inc. | BFGoodrich Performance Materials | ||||||||||||
|---|---|---|---|---|---|---|---|---|---|---|---|---|---|---|
| | | | Ten Months Ended December 31 2001 | Two Months Ended February 28 2001 | ||||||||||
| | Years Ended December 31 | |||||||||||||
| | 2003 | 2002 | ||||||||||||
| Sales | $ | 1,135.9 | $ | 1,069.3 | $ | 876.4 | $ | 187.0 | ||||||
| Cost of sales | 809.4 | 726.8 | 628.1 | 137.3 | ||||||||||
Gross profit | 326.5 | 342.5 | 248.3 | 49.7 | ||||||||||
| Selling and administrative expenses | 204.8 | 202.8 | 160.5 | 35.2 | ||||||||||
| Amortization expense | 14.7 | 13.9 | 26.5 | 4.0 | ||||||||||
| Restructuring and severance costs | 13.2 | 6.1 | 3.1 | — | ||||||||||
Operating income | 93.8 | 119.7 | 58.2 | 10.5 | ||||||||||
| Interest expense (income)—net | 90.9 | 99.6 | 92.6 | (0.6 | ) | |||||||||
| Other expense (income)—net | 1.1 | (10.0 | ) | 0.7 | 1.5 | |||||||||
| Income (loss) before income taxes and cumulative effect of accounting change | 1.8 | 30.1 | (35.1 | ) | 9.6 | |||||||||
| Income tax expense | 9.2 | 6.4 | 4.6 | 4.0 | ||||||||||
| Income (loss) before cumulative effect of accounting change | (7.4 | ) | 23.7 | (39.7 | ) | 5.6 | ||||||||
| Cumulative effect of accounting change—net of tax | (0.5 | ) | — | — | — | |||||||||
| Net income (loss) | $ | (7.9 | ) | $ | 23.7 | $ | (39.7 | ) | $ | 5.6 | ||||
Net income (loss) per basic and diluted share: | ||||||||||||||
Income (loss) before cumulative effect of accounting change | $ | (2.05 | ) | $ | 6.58 | $ | (11.17 | ) | ||||||
| Cumulative effect of accounting change-net of tax | (0.14 | ) | — | — | ||||||||||
| Net income (loss) per basic and diluted share | $ | (2.19 | ) | $ | 6.58 | $ | (11.17 | ) | ||||||
See notes to consolidated financial statements.
F-4
Noveon International, Inc.
Consolidated Balance Sheet
(dollars in millions, except share amounts)
| | December 31 | ||||||
|---|---|---|---|---|---|---|---|
| | 2003 | 2002 | |||||
| ASSETS | |||||||
| Current assets | |||||||
| Cash and cash equivalents | $ | 116.8 | $ | 79.5 | |||
| Accounts and notes receivable, net of allowances ($7.5 and $9.0 at December 31, 2003 and 2002, respectively) | 149.8 | 135.7 | |||||
| Inventories | 161.7 | 144.1 | |||||
| Deferred income taxes | 9.5 | 5.9 | |||||
| Prepaid expenses and other current assets | 7.9 | 7.2 | |||||
| Total current assets | 445.7 | 372.4 | |||||
Property, plant and equipment—net | 682.9 | 670.7 | |||||
| Goodwill | 416.0 | 367.3 | |||||
| Technology intangible assets—net | 131.7 | 139.7 | |||||
| Other identifiable intangible assets—net | 41.2 | 42.4 | |||||
| Other assets | 40.1 | 42.0 | |||||
| Total assets | $ | 1,757.6 | $ | 1,634.5 | |||
LIABILITIES AND STOCKHOLDERS' EQUITY | |||||||
| Current liabilities | |||||||
| Short-term bank debt | $ | — | $ | 0.4 | |||
| Accounts payable | 130.1 | 111.2 | |||||
| Accrued expenses | 80.3 | 78.1 | |||||
| Income taxes payable | 6.7 | 5.3 | |||||
| Current maturities of long-term debt | 15.8 | — | |||||
| Total current liabilities | 232.9 | 195.0 | |||||
Long-term debt | 1,014.5 | 992.3 | |||||
| Postretirement benefits other than pensions | 5.7 | 5.8 | |||||
| Accrued pensions | 31.0 | 34.9 | |||||
| Deferred income taxes | 27.6 | 24.0 | |||||
| Accrued environmental | 18.2 | 18.2 | |||||
| Other non-current liabilities | 15.4 | 17.8 | |||||
Stockholders' equity | |||||||
| Common stock ($.01 par value, 4,100,000 shares authorized, 3,606,133 and 3,600,115 shares issued and outstanding at December 31, 2003 and 2002, respectively) | — | — | |||||
| Paid in capital | 361.0 | 360.0 | |||||
| Retained deficit | (23.9 | ) | (16.0 | ) | |||
| Accumulated other comprehensive income | 76.4 | 3.6 | |||||
| Other | (1.2 | ) | (1.1 | ) | |||
| Total stockholders' equity | 412.3 | 346.5 | |||||
| Total liabilities and stockholders' equity | $ | 1,757.6 | $ | 1,634.5 | |||
See notes to consolidated financial statements.
F-5
Noveon International, Inc.
and
BFGoodrich Performance Materials
(The Predecessor Company and a Segment of The BFGoodrich Company)
Consolidated Statement of Cash Flows
(dollars in millions)
| | Noveon International, Inc. | BFGoodrich Performance Materials | |||||||||||||
|---|---|---|---|---|---|---|---|---|---|---|---|---|---|---|---|
| | Years Ended December 31 | Ten Months Ended December 31 2001 | Two Months Ended February 28 2001 | ||||||||||||
| | 2003 | 2002 | |||||||||||||
| Operating activities | |||||||||||||||
| Net income (loss) | $ | (7.9 | ) | $ | 23.7 | $ | (39.7 | ) | $ | 5.6 | |||||
| Adjustments to reconcile net income (loss) to net cash provided (used) by operating activities: | |||||||||||||||
| Restructuring and severance costs: | |||||||||||||||
| Expenses | 13.2 | 6.1 | 3.1 | — | |||||||||||
| Payments | (6.0 | ) | (8.5 | ) | (11.8 | ) | (2.0 | ) | |||||||
| Depreciation and amortization | 91.4 | 84.7 | 83.0 | 14.4 | |||||||||||
| Deferred income taxes | (1.7 | ) | (2.4 | ) | 0.4 | (5.2 | ) | ||||||||
| Debt issuance cost amortization in interest expense | 5.3 | 5.6 | 6.8 | — | |||||||||||
| Gain on early extinguishments of debt | — | (12.4 | ) | — | — | ||||||||||
| Interest on seller note not paid in cash | 20.4 | 24.0 | 19.1 | — | |||||||||||
| Cumulative effect of accounting change—net of tax | 0.5 | — | — | — | |||||||||||
| Change in assets and liabilities, net of effects of acquisitions of businesses: | |||||||||||||||
| Receivables | (4.3 | ) | 2.2 | 45.9 | (7.2 | ) | |||||||||
| Inventories | (5.7 | ) | 3.4 | 35.8 | (3.1 | ) | |||||||||
| Other current assets | (0.2 | ) | (2.6 | ) | 0.9 | (0.1 | ) | ||||||||
| Accounts payable | 12.0 | 9.2 | (4.0 | ) | (16.8 | ) | |||||||||
| Accrued expenses | (0.1 | ) | (0.7 | ) | 12.4 | 5.7 | |||||||||
| Income taxes payable | 2.3 | 5.4 | — | (27.9 | ) | ||||||||||
| Other non-current assets and liabilities | (1.2 | ) | 6.0 | 2.0 | 5.0 | ||||||||||
| Net cash provided (used) by operating activities | 118.0 | 143.7 | 153.9 | (31.6 | ) | ||||||||||
Investing activities | |||||||||||||||
| Purchases of property, plant and equipment | (56.6 | ) | (52.3 | ) | (28.5 | ) | (7.6 | ) | |||||||
| Payments made in connection with acquisitions, net of cash acquired | (32.1 | ) | (27.4 | ) | (1,191.1 | ) | — | ||||||||
| Proceeds from sale of property and business | — | — | 0.9 | — | |||||||||||
| Net cash (used) by investing activities | (88.7 | ) | (79.7 | ) | (1,218.7 | ) | (7.6 | ) | |||||||
F-6
Noveon International, Inc.
and
BFGoodrich Performance Materials
(The Predecessor Company and a Segment of The BFGoodrich Company)
Consolidated Statement of Cash Flows
(dollars in millions)
| | Noveon International, Inc. | BFGoodrich Performance Materials | |||||||||||
|---|---|---|---|---|---|---|---|---|---|---|---|---|---|
| | Years Ended December 31 | Ten Months Ended December 31 2001 | Two Months Ended February 28 2001 | ||||||||||
| | 2003 | 2002 | |||||||||||
Financing activities | |||||||||||||
| Decrease in short-term debt | (0.4 | ) | (0.2 | ) | (25.8 | ) | (3.7 | ) | |||||
| Proceeds from issuance of long-term debt | — | — | 910.0 | — | |||||||||
| Repayments of long-term debt | — | (63.9 | ) | (8.5 | ) | — | |||||||
| Proceeds from sale of receivables, net | — | 2.2 | (1.9 | ) | 0.5 | ||||||||
| Debt issuance costs | (1.8 | ) | (0.6 | ) | (44.4 | ) | — | ||||||
| Equity contribution from stockholder | — | — | 355.0 | — | |||||||||
| Repayments of seller note | — | (49.8 | ) | — | — | ||||||||
| Issuance of common stock to employees | 1.2 | — | 4.0 | — | |||||||||
| Redemption of common stock | (0.2 | ) | — | — | — | ||||||||
| Transfers from (to) BFGoodrich | — | — | — | 40.7 | |||||||||
| Net cash (used) provided by financing activities | (1.2 | ) | (112.3 | ) | 1,188.4 | 37.5 | |||||||
| Effect of exchange rate changes on cash and cash equivalents | 9.2 | 3.8 | 0.4 | — | |||||||||
| Net increase (decrease) in cash and cash equivalents | 37.3 | (44.5 | ) | 124.0 | (1.7 | ) | |||||||
| Cash and cash equivalents at beginning of period | 79.5 | 124.0 | — | 15.7 | |||||||||
| Cash and cash equivalents at end of period | $ | 116.8 | $ | 79.5 | $ | 124.0 | $ | 14.0 | |||||
See notes to consolidated financial statements.
F-7
Noveon International, Inc.
and
BFGoodrich Performance Materials
(The Predecessor Company and a Segment of The BFGoodrich Company)
Consolidated Statement of Stockholders' Equity and BFGoodrich Investment
(dollars in millions)
| | Common Stock | Paid In Capital | Retained Deficit | Accumulated Comprehensive Income (Loss) | Other | Total | ||||||||||||||
|---|---|---|---|---|---|---|---|---|---|---|---|---|---|---|---|---|---|---|---|---|
| Stockholders' equity—Noveon International, Inc. | ||||||||||||||||||||
| Opening balance at March 1, 2001 | $ | — | $ | — | $ | — | $ | — | $ | — | $ | — | ||||||||
| Equity contribution from stockholders | — | 355.0 | — | — | — | 355.0 | ||||||||||||||
| Issuance of common stock to employees | — | 5.0 | — | — | (1.0 | ) | 4.0 | |||||||||||||
| Comprehensive loss: | ||||||||||||||||||||
| Net loss | — | — | (39.7 | ) | — | — | (39.7 | ) | ||||||||||||
| Net change in fair value of cash flow hedges | — | — | — | (5.7 | ) | — | (5.7 | ) | ||||||||||||
| Cumulative translation adjustment | — | — | — | (4.5 | ) | — | (4.5 | ) | ||||||||||||
Total comprehensive loss | (49.9 | ) | ||||||||||||||||||
| Balance at December 31, 2001 | — | 360.0 | (39.7 | ) | (10.2 | ) | (1.0 | ) | 309.1 | |||||||||||
| Other | — | — | — | — | (0.1 | ) | (0.1 | ) | ||||||||||||
| Comprehensive income (loss): | ||||||||||||||||||||
| Net income | — | — | 23.7 | — | — | 23.7 | ||||||||||||||
| Net change in fair value of cash flow hedges | — | — | — | (9.0 | ) | — | (9.0 | ) | ||||||||||||
| Cumulative translation adjustment | — | — | — | 22.8 | — | 22.8 | ||||||||||||||
| Total comprehensive income | 37.5 | |||||||||||||||||||
| Balance at December 31, 2002 | — | 360.0 | (16.0 | ) | 3.6 | (1.1 | ) | 346.5 | ||||||||||||
| Issuance of common stock to employees, net | — | 1.0 | — | — | — | 1.0 | ||||||||||||||
| Other | — | — | — | — | (0.1 | ) | (0.1 | ) | ||||||||||||
| Comprehensive income (loss): | ||||||||||||||||||||
| Net loss | — | — | (7.9 | ) | — | — | (7.9 | ) | ||||||||||||
| Net change in fair value of cash flow hedges | — | — | — | 4.5 | — | 4.5 | ||||||||||||||
| Cumulative translation adjustment | — | — | — | 68.3 | — | 68.3 | ||||||||||||||
| Total comprehensive income | 64.9 | |||||||||||||||||||
| Balance at December 31, 2003 | $ | — | $ | 361.0 | $ | (23.9 | ) | $ | 76.4 | $ | (1.2 | ) | $ | 412.3 | ||||||
| | BFGoodrich Performance Materials | ||
|---|---|---|---|
| | Two Months Ended February 28 2001 | ||
| BFGoodrich investment | |||
| Beginning of period | $ | 910.4 | |
| Net income | 5.6 | ||
| Cumulative translation adjustment | 2.6 | ||
| Comprehensive income | 8.2 | ||
| Net transfers from (to) BFGoodrich | 40.7 | ||
| End of period | $ | 959.3 | |
See notes to consolidated financial statements.
F-8
Noveon International, Inc.
and
BFGoodrich Performance Materials
(The Predecessor Company and a Segment of The BFGoodrich Company)
Notes to Consolidated Financial Statements
A. Organization and Acquisition
In these notes, "Noveon International, Inc.," "Noveon" or the "Company" refer to Noveon International, Inc., and its subsidiaries, except where the context makes clear that the reference is only to Noveon International, Inc. itself and not its subsidiaries. Any references to "Noveon, Inc." are to Noveon, Inc., our wholly owned operating subsidiary. Noveon International, Inc. owns 100% of Noveon, Inc. The Company and Noveon, Inc. commenced operations on March 1, 2001 through the acquisition on February 28, 2001 of certain assets and common stock of certain subsidiaries of the Performance Materials Segment (the "Predecessor Company" or "Performance Materials") of The BFGoodrich Company ("Goodrich"), now known as Goodrich Corporation (the "Acquisition").
Noveon International, Inc. was organized for the purpose of owning all of the common stock of Noveon, Inc. and was capitalized through an equity contribution of $355.0 million from PMD Investors I LLC and PMD Investors II LLC (collectively, "PMD"), DLJ Merchant Banking Partners III, LP and affiliates ("DLJ Merchant Banking") and MidOcean Capital/PMD Investors, LLC ("MidOcean"). PMD is owned by investor groups led by AEA Investors LLC ("AEA"). The Company has no independent operations or investments other than its investment in Noveon, Inc. The Company made an equity contribution of $527.0 million to Noveon, Inc. comprised of $355.0 million in cash and $172.0 million from the seller note that the Company issued to a subsidiary of Goodrich in connection with the Company's Acquisition of the Predecessor Company. The seller note, which was subsequently sold by Goodrich, bears interest at an initial rate of 13% payable semi-annually in cash or additional notes at the option of the Company and increases to a rate of 15% after 5 years. If the interest is paid in cash, the interest rate remains at 13%. The Company may be dependent on the cash flows of Noveon, Inc. to repay the seller note upon maturity in 2011. See Note K for additional discussion of the Company's indebtedness and related restrictions on distributions from Noveon, Inc. At December 31, 2003, there was $165.9 million outstanding on the seller note.
The Acquisition of the Predecessor Company was recorded under the purchase method of accounting. The purchase price before fees and expenses, totaling $21.4 million, was $1,386.5 million and consisted of cash of $1,167.1 million, assumption of debt and liabilities of $32.9 million, net of cash acquired, and a $172.0 million seller note issued to Goodrich.
Pursuant to the Agreement for Sale and Purchase of Assets between Goodrich and the Company, the purchase price was subject to a post-closing working capital adjustment. On June 28, 2002, the Company entered into an agreement with Goodrich settling the working capital adjustment pursuant to which the Company paid Goodrich $14.5 million. The settlement payment and the costs associated with the settlement efforts have been reflected as an adjustment to the purchase price in the Company's financial statements and increased the goodwill associated with the Acquisition.
The Acquisition of the Predecessor Company from Goodrich was financed through term loan borrowings under Noveon, Inc.'s credit facilities, proceeds from the offering of senior subordinated notes, and the $527.0 million equity contribution from the Company, comprised of $355.0 million in cash and $172.0 million from the seller note issued to Goodrich. The proceeds from the credit facilities included $125.0 million on the six-year Term Loan A facility and $510.0 million on the seven and one-half year Term Loan B facility. The proceeds from the 11% Senior Subordinated Notes due 2011 were $275.0 million.
F-9
The assets acquired and liabilities assumed of the Predecessor Company were recorded at fair values. The deferred income taxes provided in the purchase price allocation are attributed to the tax effects of differences between the assigned values and the tax basis of assets acquired (except for certain goodwill which is non-deductible for tax purposes) and liabilities assumed.
As of the Acquisition date, management began to assess a plan to consolidate and/or exit activities of the business and reduce the number of personnel at the Company. Management completed this assessment and finalized the components of the plan, including exiting certain non-core product lines and investments and undertaking efficiency and productivity initiatives at selected locations. The assets have been adjusted to fair values through purchase accounting. Included in the purchase price allocation was a $12.9 million accrual for termination benefits and exit costs related to the components of the plan.
The following unaudited pro forma data summarizes the results of operations for the year ended December 31, 2001 as if the Company had been acquired as of January 1, 2001. The pro forma data gives effect to actual operating results prior to the Acquisition (January 1, 2001 to February 28, 2001). Adjustments to interest expense, goodwill amortization and income taxes related to the Acquisition are reflected in the pro forma data. In addition, the results of textile dyes and drug delivery systems businesses, which were not part of the Acquisition, are excluded from the pro forma results. These pro forma amounts do not purport to be indicative of the results that would have actually been attained if the Acquisition had occurred as of the beginning of the periods presented or that may be attained in the future.
| (in millions) | 2001 | |||
|---|---|---|---|---|
| Net sales | $ | 1,062.3 | ||
| Operating income | 66.2 | |||
| Net loss | (52.4 | ) | ||
B. Basis of Presentation
The consolidated financial statements of the Predecessor Company present the consolidated results of operations and financial condition as it operated as the Performance Materials Segment of Goodrich, including certain adjustments and allocations, prior to the Acquisition.
Goodrich's investment represents Goodrich's equity investment in Performance Materials. Interest expense associated with Goodrich's general corporate debt was not charged to Performance Materials and has not been allocated to Performance Materials. Performance Materials received funding for its operations from Goodrich as deemed necessary. All transfers to and from Goodrich have been reported in the Goodrich investment account.
During the two months ended February 28, 2001, Performance Materials was allocated $0.8 million in costs from Goodrich. Certain costs, such as employee benefits, legal and executive compensation, were specifically attributed to Performance Materials. These costs amounted to $0.5 million for the two months ended February 28, 2001. Certain costs, such as the corporate aircraft, tax, accounting, and
F-10
other corporate shared services, were allocated to Performance Materials primarily based on estimates of the time spent on Performance Materials matters. These costs amounted to $0.3 million for the two months ended February 28, 2001. Performance Materials also participated in certain benefit plans of Goodrich, the cost of which was allocated to Performance Materials and is included in the accompanying financial statements but is not reflected in the amounts above. Management of the Predecessor Company believes these allocations are reasonable.
The results for the Predecessor Company are not necessarily comparable to those of the Company because of the exclusion of certain businesses from the Acquisition and changes in organizational structure, recorded asset values, cost structure and capitalization of the Company resulting from the Acquisition.
C. Significant Accounting Policies
Principles of Consolidation
The consolidated financial statements reflect the accounts of the Company and its majority-owned subsidiaries. Intercompany accounts and transactions are eliminated.
Revenue and Income Recognition
Revenue from the sale of products is recognized at the point of passage of title, which is at the time of shipment or consumption by the customer for inventory on consignment. The Company requires that persuasive evidence of a revenue arrangement exists, delivery of product has occurred, the price to the customer is fixed and determinable and collectibility is reasonably assured before revenue is realized and earned. Rebates, customer claims, allowances, returns and discounts are reflected as reductions from gross sales in determining net sales. Rebates are accrued based on contractual relationships with customers as shipments are made. Customer claims, returns and allowances and discounts are accrued based on our history of claims and sales returns and allowances. Allowances for doubtful accounts are maintained for estimated losses resulting from the inability of customers to make required payments.
Cash Equivalents
Cash equivalents consist of highly liquid investments with a maturity of three months or less at the time of purchase.
Inventories
Inventories are stated at the lower of cost or market. The elements of inventory cost include raw materials and labor and manufacturing overhead costs attributed to the production process. Most domestic inventories are valued by the last-in, first-out (LIFO) cost method. Inventories not valued by the LIFO method are valued principally by the average cost method. The Company provides for allowances for excess and obsolete inventory based on the age and quality of the Company's products.
F-11
Long-Lived Assets
Property, plant and equipment of the Predecessor Company and property, plant and equipment purchased subsequent to the Acquisition, including amounts recorded under capital leases, are recorded at cost. Appraisals of fair value were obtained for property, plant and equipment acquired in the Acquisition. Depreciation and amortization are computed principally using the straight-line method over the following estimated useful lives: buildings and improvements, 15 to 40 years; machinery and equipment, 5 to 15 years. Repairs and maintenance costs are expensed as incurred.
Identifiable intangible assets are recorded at cost, or when acquired as a part of a business combination, at estimated fair value. These assets include principally patents and other technology agreements and trademarks. Appraisals of fair value were obtained for identifiable intangibles acquired in the Acquisition. The appraised value of identifiable intangibles acquired totaled $201.8 million, and included approximately $156.9 million of identifiable intangibles for technology. They are amortized using the straight-line method over estimated useful lives of primarily 15 years.
Goodwill represents the excess of the purchase price over the fair value of the net assets of acquired businesses and was amortized by the straight-line method over 20 years through December 31, 2001. See Note I for an additional discussion of the impairment tests performed in 2003 and 2002 related to goodwill.
Impairment of long-lived assets, other than goodwill, is recognized when events or changes in circumstances indicate that the carrying amount of the asset, or related groups of assets, may not be recoverable and the estimate of undiscounted cash flows over the remaining estimated useful life of the assets are less than the carrying value of the assets. Measurement of the amount of impairment may be based on appraisal, market values of similar assets or estimated discounted future cash flows resulting from the use and ultimate disposition of the asset. See Note E for an additional discussion of the impairment test performed in 2003 related to fixed assets.
Debt Issuance Costs
Costs associated with the issuance of Noveon, Inc.'s credit facilities and senior subordinated notes have been capitalized in other assets in the consolidated balance sheet and are being amortized using the interest method over the life of the related agreements ranging in periods of six through ten years.
Freight-out Costs
The Company includes costs of shipping and handling within cost of goods sold in the statement of operations.
Financial Instruments
Financial instruments recorded on the balance sheet include cash and cash equivalents, accounts and notes receivable, accounts payable and debt. Because of their short maturity, the carrying value of cash and cash equivalents, accounts and notes receivable, accounts payable and short-term bank debt approximates fair value. Fair value of long-term debt is based on quoted market prices.
F-12
The fair value of foreign currency forward contracts and interest rate swap agreements are based on quoted market prices.
Derivative and Hedging Activities
The Company recognizes its derivative instruments as either assets or liabilities in the statement of financial position at fair value. The accounting for changes in the fair value (i.e., gains or losses) of a derivative instrument depends on whether it has been designated and qualifies as part of a hedging relationship and, further, on the type of hedging relationship. For those derivative instruments that are designated and qualify as hedging instruments, the Company designates the hedging instrument, based upon the exposure being hedged, as either a fair value hedge, cash flow hedge or a hedge of a net investment in a foreign operation.
For derivative instruments that are designated and qualify as a fair value hedge (i.e., hedging the exposure to changes in the fair value of an asset or a liability or an identified portion thereof that is attributable to a particular risk), the gain or loss on the derivative instrument as well as the offsetting loss or gain on the hedged item attributable to the hedged risk are recognized in current earnings during the period of the change in fair values. For derivative instruments that are designated and qualify as a cash flow hedge (i.e., hedging the exposure to variability in expected future cash flows that is attributable to a particular risk), the effective portion of the gain or loss on the derivative instrument is reported as a component of other comprehensive income and reclassified into earnings in the same period or periods during which the hedged transaction affects earnings. The remaining gain or loss on the derivative instrument in excess of the cumulative change in the present value of future cash flows of the hedged item, if any, is recognized in current earnings during the period of change. For derivative instruments that are designated and qualify as a hedge of a net investment in a foreign currency, the gain or loss is reported in other comprehensive income as part of the cumulative transaction adjustment to the extent it is effective. For derivative instruments not designated as hedging instruments, the gain or loss is recognized in current earnings during the period of change.
As required by the credit agreement, Noveon, Inc. has entered into interest rate swap agreements (cash flow hedges) to limit its exposure to interest rate fluctuations on $180.0 million of the outstanding principal of Noveon, Inc.'s Term Loans through 2005. In 2003, Noveon, Inc. entered into an additional interest rate swap agreement with a notional amount of $25.0 million on its Term Loan B through 2007. These agreements require Noveon, Inc. to pay a fixed rate of interest while receiving a variable rate. The net payments or receipts under these agreements are recognized as an adjustment to interest expense in the Company's results of operations. For the years ended December 31, 2003 and 2002 and the ten months ended December 31, 2001, the Company recorded $8.0 million, $6.5 million and $2.0 million, respectively, of interest expense as a result of these swap agreements. At December 31, 2003 and 2002, the fair value of these swap arrangements, included in other non-current liabilities, totaled approximately $10.2 million and $14.7 million, respectively. The offsetting impact of this hedge transaction is included in accumulated other comprehensive loss.
The Company has entered into forward foreign currency exchange contracts, totaling $19.2 million and $10.3 million at December 31, 2003 and 2002, respectively, to hedge certain firm commitments
F-13
denominated in foreign currencies. The purpose of the Company's foreign currency hedging activities is to protect the Company from risk that the eventual cash flows from the purchase or sale of products to international customers will be adversely affected by changes in the exchange rates. As of December 31, 2003 and 2002, the fair value of these forward exchange contracts was not material to the Company's consolidated financial position, results of operations or cash flow.
The Company has foreign denominated floating rate debt to protect the value of its investments in its foreign subsidiaries in Europe. Realized and unrealized gains and losses from these hedges are not included in the income statement, but are shown in the cumulative translation adjustment account included in other comprehensive loss. During the years ended December 31, 2003 and 2002, $17.3 million and $10.1 million of net losses, respectively, and net gains of $2.1 million during the ten months ended December 31, 2001 are included in the cumulative translation adjustment related to the foreign denominated floating rate debt.
Stock-Based Compensation
As more fully described in Note S, the Company has a stock option plan in which certain eligible employees of the Company participate. The Company and the Predecessor Company account for stock-based employee compensation using the intrinsic value method in accordance with the provisions of Accounting Principles Board (APB) Opinion No. 25, "Accounting for Stock Issued to Employees," and related Interpretations. No stock-based employee compensation cost is reflected in net income (loss), as all options granted under the plan had an exercise price greater than or equal to the market value of the underlying common stock on the date of grant. The following table illustrates the effect on net income (loss) if the Company had applied the fair value recognition provisions of SFAS No. 123, "Accounting for Stock-Based Compensation," to stock-based employee compensation.
| | Years Ended December 31 | Ten Months Ended December 31 2001 | ||||||||
|---|---|---|---|---|---|---|---|---|---|---|
| | 2003 | 2002 | ||||||||
| Net income (loss) as reported | $ | (7.9 | ) | $ | 23.7 | $ | (39.7 | ) | ||
| Deduct: Total stock-based employee compensation expense determined under fair value based method for all awards, net of related tax effects | (3.1 | ) | (2.6 | ) | (1.5 | ) | ||||
| Pro forma net income (loss) | $ | (11.0 | ) | $ | 21.1 | $ | (41.2 | ) | ||
The effects of applying SFAS No. 123 may not be representative of the effects on reportable net income (loss) in future years.
F-14
Earnings (Loss) Per Common Share
Basic earnings per common share ("EPS") is computed by dividing income available to common stockholders by the weighted-average number of common shares outstanding for the period. The weighted-average number of common shares outstanding for computing basic EPS was 3,602,062 shares, 3,600,222 shares and 3,555,267 shares for the years ended December 31, 2003 and 2002 and the ten months ended December 31, 2001, respectively. Diluted EPS reflects the potential dilution that could occur if securities or other contracts to issue common stock were exercised or converted into common stock. There were no dilutive securities or contracts in 2003, 2002 or 2001. No adjustments were made to reported net income (loss) in the computation of EPS. There is no applicable EPS calculation for the periods in which the Company was owned by Goodrich.
Income Taxes
The provision for income taxes is calculated in accordance with SFAS No. 109, "Accounting for Income Taxes," which requires the recognition of deferred income taxes using the liability method.
Historically, the Predecessor Company's operations have been included in the consolidated income tax returns filed by Goodrich. Income tax expense in the Predecessor Company's consolidated statement of operations is calculated on a separate tax return basis as if the Predecessor Company had operated as a stand-alone entity.
Research and Development Expense
The Company performs research and development under Company-funded programs for commercial products. Total research and development expenditures for the years ended December 31, 2003 and 2002, the ten months ended December 31, 2001 and the two months ended February 28, 2001 were $44.8 million, $37.3 million, $29.9 million and $7.2 million, respectively.
Reclassifications
Certain amounts in prior financial statements have been reclassified to conform to the current year presentation.
Use of Estimates
The preparation of financial statements in conformity with accounting principles generally accepted in the United States requires management to make estimates and assumptions that affect the amounts reported in the financial statements and accompanying notes. Actual results could differ from those estimates.
New Accounting Standards
In July 2001, the FASB issued SFAS No. 143, "Accounting for Asset Retirement Obligations," that requires the recognition of the fair value of the liability for closure and removal costs associated with
F-15
the resulting legal obligations upon retirement or removal of any tangible long-lived assets be recognized in the period in which it is incurred. The initial recognition of the liability will be capitalized as part of the asset cost and depreciated over its estimated useful life. The Company adopted this statement effective January 1, 2003. Under this standard, the Company recognizes asset retirement obligations in the period in which they are incurred if a reasonable estimate of fair value can be determined. The associated asset retirement costs are capitalized as part of the carrying amount of the long-lived asset. The cumulative effect of this change in accounting principle resulted in a charge of $0.5 million (net of income taxes of $0.2 million) in 2003. The pro forma effects as if the Company adopted SFAS No. 143 on January 1, 2001 are not material to the results of operations. The impact on the Company's consolidated financial position at December 31, 2003 was not material.
In October 2001, the FASB issued SFAS No. 144, "Accounting for the Impairment or Disposal of Long-Lived Assets," that supersedes SFAS No. 121, "Accounting for the Impairment or Disposal of Long-Lived Assets and for Long-Lived Assets to Be Disposed of." The statement retains the fundamental provisions of SFAS No. 121 related to the recognition and measurement of the impairment of long-lived assets to be "held and used," provides more guidance on estimating cash flows when performing a recoverability test, requires that a long-lived asset (group) to be disposed of other than by sale (i.e., abandoned) be classified as "held and used" until it is disposed of, and establishes more restrictive criteria to classify an asset (group) as "held for sale." The Company adopted this statement effective January 1, 2002. Upon adoption, this statement had no impact on the Company's consolidated financial position or results of operations. See Note E for a discussion of current year impairment charge.
In April 2002, the FASB issued SFAS No. 145, "Rescission of FASB Statement No. 4, 44, and 62, Amendment of FASB Statement No. 13, and Technical Corrections." In most cases, SFAS No. 145 requires gains and losses on extinguishments of debt to be classified as income or loss from continuing operations rather than as extraordinary items as previously required under SFAS No. 4. Extraordinary treatment is required for certain extinguishments as provided in APB Opinion No. 30. SFAS No. 145 also amends SFAS No. 13 to require certain modifications to capital leases be treated as a sale-leaseback and modifies the accounting for sub-leases when the original lessee remains a secondary obligor (or guarantor). The Company adopted the statement during 2002 and recorded a $12.4 million gain on early extinguishment of a portion of its seller notes within other expense (income)—net.
In June 2002, the FASB issued SFAS No. 146, "Accounting for Costs Associated with Exit or Disposal Activities." SFAS No. 146 requires recording costs associated with exit or disposal activities at their fair values when a liability has been incurred. Under previous guidance, certain exit costs were accrued upon management's commitment to an exit plan, which is generally before an actual liability has been incurred. The provisions of SFAS No. 146 are effective for exit or disposal activities that are initiated after December 31, 2002. The Company adopted this statement effective January 1, 2003. Upon adoption, this statement had no impact on the Company's consolidated financial position or results of operations.
In November 2002, the Emerging Issues Task Force ("EITF") reached a consensus on Issue No. 00-21 ("Issue 00-21"), "Revenue Arrangements with Multiple Deliverables." Issue 00-21 provides
F-16
guidance on how to account for arrangements that involve delivery or performance of multiple products, services and/or rights to use assets. The adoption of Issue 00-21 in July 2003 had no impact on the Company's consolidated financial position or results of operations.
In November 2002, the FASB issued Interpretation No. 45, "Guarantor's Accounting and Disclosure Requirements for Guarantees, Including Indirect Guarantees of Indebtedness of Others." Interpretation No. 45 requires guarantors to recognize, at the inception of a guarantee, a liability for the fair value of the obligation undertaken in issuing the guarantee for those guarantees initiated or modified after December 31, 2002. However, certain guarantees, including product warranties and guarantees between parties under common control (i.e., parent and subsidiary), are not required to be recognized at fair value at inception. Interpretation No. 45 also requires additional disclosures of guarantees, including product warranties and guarantees between parties under common control, beginning with interim or annual periods ending after December 15, 2002. Guarantees initiated prior to December 31, 2002 are not recognized as a liability measured at fair value per Interpretation No. 45, but are subject to the disclosure requirements. The effect of adoption had no impact on the Company's consolidated financial position or results of operations.
In January 2003, the FASB issued Interpretation No. 46, "Consolidation of Variable Interest Entities." Interpretation No. 46 clarifies the application of Accounting Research Bulletin ("ARB") No. 51, "Consolidated Financial Statements" for certain entities in which equity investors do not have the characteristics of a controlling financial interest or do not have sufficient equity at risk for the entity to finance its activities without additional subordinated financial support from other parties. Interpretation No. 46 requires that variable interest entities, as defined, be consolidated by the primary beneficiary, which is defined as the entity that is expected to absorb the majority of the expected losses, receive a majority of the expected residual returns, or both. The Company adopted this statement in 2003. The effect of adoption had no impact on the Company's consolidated financial position or results of operations.
In April 2003, the FASB issued SFAS No. 149, "Amendment of Statement 133 on Derivative Instruments and Hedging Activities." SFAS No. 149 amends and clarifies financial accounting and reporting for derivative instruments, including certain derivative instruments embedded in other contracts and for hedging activities under SFAS No. 133. SFAS No. 149 is effective for contracts entered into or modified after June 30, 2003 and for hedging relationships designated after June 30, 2003. The adoption of this statement had no impact on the Company's consolidated financial position or results of operations.
In May 2003, the FASB issued SFAS No. 150, "Accounting for Certain Financial Instruments with Characteristics of both Liabilities and Equity." SFAS No. 150 establishes standards for how an issuer classifies and measures certain financial instruments with characteristics of both liabilities and equity. SFAS No. 150 also requires that an issuer classify a financial instrument that is within its scope as a liability, many of which were previously classified as equity. SFAS No. 150 was effective for financial instruments entered into or modified after May 31, 2003, and otherwise was effective on July 1, 2003. The Company's adoption of this statement had no impact on its consolidated financial statements.
F-17
D. Acquisitions
The following acquisitions by the Company and Predecessor Company were recorded using the purchase method of accounting. The results of operations of these acquired businesses have been included in the Company's results since the respective dates of acquisition. The pro forma effect of these acquisitions was not material to the Company's consolidated financial position or results of operations.
During 2003, the Company purchased select assets and technology from a European extruder of electrostatic dissipative sheet; acquired a 5% equity investment in a company that produces TPU-based cushion technology; and purchased select assets of Thermedics Polymer Products, LLC, a manufacturer of aliphatic thermoplastic polyurethane, from VIASYS Healthcare, Inc., all of which are included in the Company's Specialty Materials segment. The Company purchased the remaining minority shares of its joint venture company, Indiamalt Private Ltd., and acquired a controlling interest in Specialty Natural Products Co., Ltd. ("SNP"), a manufacturer of botanical extracts used in personal care product formulations based in Thailand, for its Consumer Specialties segment. The Company purchased certain water-based overprint coatings technology and manufacturing assets for its Performance Coatings segment. Final determinations of the fair value of certain assets are in process. Accordingly, the preliminary purchase price allocations are subject to revision. The aggregate purchase price of $32.1 million paid for these acquisitions and investment was allocated to the assets acquired and liabilities assumed and resulted in goodwill of $13.9 million.
During 2002, the Company purchased certain tangible assets of a distributor of personal care and pharmaceutical products in Latin America; certain assets, technology and other intellectual property from a colors dispersions business; and certain assets, technology and other intellectual property related to aroma chemicals, all of which were added to its Consumer Specialties segment. The Company purchased certain tangible assets and technology of a textile coatings business for its Performance Coatings segment. The Company acquired the common stock of Gemoplast SA, which is a business located in Lyon, France engaged in the development, production and marketing of plastic alloys for its Specialty Materials segment. The total cash paid for these 2002 acquisitions was $11.9 million, which was allocated to the assets acquired and liabilities assumed and resulted in goodwill of $5.3 million.
During 2001, the Company acquired certain intellectual property and tangible assets related to the production of cross-linked polyethelene products as an addition to the Company's TempRite® CPVC product family within the Specialty Materials segment for $3.6 million.
E. Restructuring and Severance Costs
In 2003, the Company announced the relocation of the Sancure® polyurethane dispersions line, part of the Company's Performance Coatings segment, to its Avon Lake, Ohio facility and the closing of the Leominster, Massachusetts facility. Production is expected to be completely shifted to the Avon Lake site by the end of 2004. In conjunction with the announced closing of the Leominster facility, the Company performed an evaluation of the ongoing value of the long-lived assets at that facility. The Company determined that the long-lived assets were impaired and no longer recoverable. As a result, the long-lived asset carrying value was written down to its estimated fair value of $1.4 million, which was determined by an independent appraisal, and an impairment charge of $5.7 million was recorded.
F-18
Additionally, in 2003, in order to increase efficiency and productivity and to reduce costs, the Company reduced headcount at various administrative and manufacturing facilities.
Through these various restructuring efforts, the Company planned to eliminate approximately 80 positions across all segments. Approximately 50% of the affected employees have left their positions as of December 31, 2003. In conjunction with these restructuring plans, the Company recorded severance costs of $6.2 million pursuant to its existing severance plan.
During 2002, the Company consolidated its static control manufacturing facilities into its Malaysia facility and closed the Twinsburg, Ohio leased facility in order to improve productivity in the electronics industry-related product lines. In conjunction with this consolidation, the Company incurred personnel-related charges as well as closure costs related to this leased facility.
In June 2001, in order to increase efficiency and productivity, reduce costs and support the Company's global growth strategy, the Company reduced headcount at facilities throughout its global operations, restructured its colorants business in Cincinnati, Ohio, and discontinued its flush pigments and colorformers product lines. Through these restructuring efforts, the Company planned to eliminate approximately 440 positions. All of the affected employees have left their positions as of December 31, 2003 and the remaining personnel-related costs are anticipated to be paid by 2007. In 2003, the Company recorded $1.1 million of consolidation costs in conjunction with this restructuring plan, which consisted primarily of personnel-related costs. The Company also recorded net consolidation costs of $4.7 million in 2002 consisting of $1.2 million in personnel-related costs associated with the closing of a plant in the United Kingdom and $3.5 million of other restructuring related expenses. Also in 2002, the restructuring accrual was reduced by $1.6 million, which represents a revision of prior estimates recorded at the date of the Acquisition, with a corresponding reduction in goodwill.
The restructuring accrual is summarized below:
| | Balance January 1 2003 | Provision | Activity | Balance December 31 2003 | ||||||||
|---|---|---|---|---|---|---|---|---|---|---|---|---|
| Personnel-related costs | ||||||||||||
| 2003 Restructurings | $ | — | $ | 6.1 | $ | (3.4 | ) | $ | 2.7 | |||
| 2001 Restructurings | 2.1 | 0.7 | (1.5 | ) | 1.3 | |||||||
Relocation and restructuring expense | ||||||||||||
| 2003 Restructurings | — | 0.1 | (0.1 | ) | — | |||||||
| 2001 Restructurings | — | 0.3 | (0.3 | ) | — | |||||||
Facility closure costs | ||||||||||||
| 2002 Restructurings | 0.2 | 0.2 | (0.3 | ) | 0.1 | |||||||
| 2001 Restructurings | 0.6 | 0.1 | (0.4 | ) | 0.3 | |||||||
Asset impairment | ||||||||||||
| 2003 Restructurings | — | 5.7 | (5.7 | ) | — | |||||||
| $ | 2.9 | $ | 13.2 | $ | (11.7 | ) | $ | 4.4 | ||||
F-19
| | Balance January 1 2002 | Provision | Activity | Adjustment to Acquisiton Cost | Balance December 31 2002 | ||||||||||
|---|---|---|---|---|---|---|---|---|---|---|---|---|---|---|---|
| Personnel-related costs | |||||||||||||||
| 2002 Restructurings | $ | — | $ | 0.1 | $ | (0.1 | ) | $ | — | $ | — | ||||
| 2001 Restructurings | 6.0 | 1.2 | (3.5 | ) | (1.6 | ) | 2.1 | ||||||||
| Pre-Acquisition Restructurings | 0.2 | — | (0.2 | ) | — | — | |||||||||
Relocation and restructuring expense | |||||||||||||||
| 2002 Restructurings | — | 0.1 | (0.1 | ) | — | — | |||||||||
| 2001 Restructurings | — | 3.1 | (3.1 | ) | — | — | |||||||||
| Pre-Acquisition Restructurings | — | 0.1 | (0.1 | ) | — | — | |||||||||
Facility closure costs | |||||||||||||||
| 2002 Restructurings | — | 1.1 | (0.9 | ) | — | 0.2 | |||||||||
| 2001 Restructurings | 0.7 | 0.4 | (0.5 | ) | — | 0.6 | |||||||||
| $ | 6.9 | $ | 6.1 | $ | (8.5 | ) | $ | (1.6 | ) | $ | 2.9 | ||||
| | Balance March 1 2001 | Provision | Activity | Balance December 31 2001 | ||||||||
|---|---|---|---|---|---|---|---|---|---|---|---|---|
| Personnel-related costs | ||||||||||||
| 2001 Restructurings | $ | 11.6 | $ | — | $ | (5.6 | ) | $ | 6.0 | |||
| Pre-Acquisition Restructurings | 2.7 | (2.5 | ) | 0.2 | ||||||||
Relocation and restructuring expense | ||||||||||||
| 2001 Restructurings | — | 1.2 | (1.2 | ) | — | |||||||
| Pre-Acquisition Restructurings | — | 1.1 | (1.1 | ) | — | |||||||
Facility closure costs | ||||||||||||
| 2001 Restructurings | 1.3 | — | (0.6 | ) | 0.7 | |||||||
Asset impairment | ||||||||||||
| 2001 Restructurings | — | 0.8 | (0.8 | ) | — | |||||||
| $ | 15.6 | $ | 3.1 | $ | (11.8 | ) | $ | 6.9 | ||||
F-20
F. Accounts Receivable
The Company had an agreement to sell certain Spanish Peseta denominated trade accounts receivable without recourse, up to a maximum of approximately $5.5 million. At December 31, 2002, $2.2 million of receivables were sold under this agreement and reflected as a reduction of accounts receivable. The receivables were sold at a discount, which was included in interest expense. This agreement was discontinued in 2003.
The following table summarizes the activity in allowances for accounts receivable:
| (in millions) | Balance at Beginning of Period | Costs and Expenses | Deductions | Balance at End of Period | ||||||||
|---|---|---|---|---|---|---|---|---|---|---|---|---|
| Year ended December 31, 2003 | $ | 9.0 | $ | 20.9 | $ | 22.4 | $ | 7.5 | ||||
| Year ended December 31, 2002 | 8.7 | 21.9 | 21.6 | 9.0 | ||||||||
| Ten months ended December 31, 2001 | 6.5 | 25.0 | 22.8 | 8.7 | ||||||||
| Two months ended February 28, 2001 | 6.9 | 6.3 | 6.7 | 6.5 | ||||||||
Costs and expenses relate to allowances for returns, sales credits and provisions for bad debts. Deductions include sales credits issued and write-offs of doubtful accounts, net of recoveries. Write-offs of doubtful accounts, net of recoveries, were $0.8 million, $0.5 million, $1.2 million and $0.4 million for the years ended December 31, 2003 and 2002, the ten months ended December 31, 2001 and the two months ended February 28, 2001, respectively.
G. Inventories
Inventories consisted of the following:
| (in millions) | December 31 | |||||
|---|---|---|---|---|---|---|
| 2003 | 2002 | |||||
| Finished products | $ | 120.8 | $ | 107.4 | ||
| In process | 5.0 | 3.6 | ||||
| Raw materials | 35.9 | 33.1 | ||||
| Total | $ | 161.7 | $ | 144.1 | ||
Approximately 45% and 53% of inventory was valued by the LIFO method in 2003 and 2002, respectively. At December 31, 2003 and 2002, LIFO inventory approximated first-in, first-out (FIFO) cost.
F-21
H. Property, Plant and Equipment—Net
Property, plant and equipment—net consisted of the following:
| (in millions) | December 31 | ||||||
|---|---|---|---|---|---|---|---|
| 2003 | 2002 | ||||||
| Land | $ | 44.1 | $ | 40.5 | |||
| Buildings and improvements | 160.2 | 143.3 | |||||
| Machinery and equipment | 663.1 | 580.8 | |||||
| Construction in progress | 23.2 | 35.2 | |||||
| 890.6 | 799.8 | ||||||
| Less allowances for depreciation | (207.7 | ) | (129.1 | ) | |||
| Total | $ | 682.9 | $ | 670.7 | |||
Amounts charged to expense for depreciation were $76.7 million, $70.8 million, $56.5 million, and $10.4 million for the years ended December 31, 2003 and 2002, the ten months ended December 31, 2001 and the two months ended February 28, 2001, respectively.
I. Goodwill and Identifiable Intangible Assets
The FASB issued SFAS No. 142, "Goodwill and Other Intangible Assets," in July 2001. The statement addressed financial accounting and reporting for acquired goodwill and other intangible assets and supersedes Accounting Principles Board ("APB") Opinion No. 17, "Intangible Assets." SFAS No. 142 applied to all goodwill and other intangible assets recognized in an entity's statement of financial position at that date, regardless of when those assets were initially recognized. Under these rules, goodwill and intangible assets deemed to have indefinite lives are no longer amortized but are subject to annual impairment tests. Other intangible assets continue to be amortized over their useful lives. The Company adopted SFAS No. 142 effective January 1, 2002. During the second quarter of 2002, the Company performed the first of the required impairment tests of goodwill as of January 1, 2002. As of October 1 of 2003 and 2002, the annual impairment test of goodwill was performed. The Company determined that no goodwill impairment had occurred.
After giving effect to the elimination of goodwill amortization, as required by the provisions of SFAS No. 142, net income (loss) for the ten months ended December 31, 2001 and the two months ended February 28, 2001 would have been as follows:
| | Noveon International, Inc. | BFGoodrich Performance Materials | |||
|---|---|---|---|---|---|
| (in millions) | Ten Months Ended December 31 2001 | Two Months Ended February 28 2001 | |||
| | |||||
| Reported net income (loss) | $(39.7 | ) | $ 5.6 | ||
| Goodwill amortization | 15.1 | 3.0 | |||
| Tax effect on amortization | — | (0.1 | ) | ||
| Pro forma net income (loss) | $(24.6 | ) | $ 8.5 | ||
Net loss per basic and diluted share, as reported | $(11.17 | ) | |||
| Add amortization of goodwill, net of taxes | 4.25 | ||||
| Pro forma net loss per basic and diluted share | $(6.92 | ) | |||
F-22
The changes in the carrying amount of goodwill by reporting segment during the years ended December 31, 2003 and 2002 are as follows:
| (in millions) | Consumer Specialties | Specialty Materials | Performance Coatings | Total | ||||||||
|---|---|---|---|---|---|---|---|---|---|---|---|---|
| Goodwill balance at January 1, 2003 | $ | 111.1 | $ | 151.2 | $ | 105.0 | $ | 367.3 | ||||
| Effect of acquisitions in 2003 | 2.2 | 2.9 | 8.8 | 13.9 | ||||||||
| Impact of foreign currency and other | 8.2 | 11.7 | 14.9 | 34.8 | ||||||||
| Goodwill balance at December 31, 2003 | $ | 121.5 | $ | 165.8 | $ | 128.7 | $ | 416.0 | ||||
| (in millions) | Consumer Specialties | Specialty Materials | Performance Coatings | Total | ||||||||
|---|---|---|---|---|---|---|---|---|---|---|---|---|
| Goodwill balance at January 1, 2002 | $ | 102.3 | $ | 144.7 | $ | 99.9 | $ | 346.9 | ||||
| Finalization of purchase price allocation for acquisitions in 2001 | 7.6 | 4.4 | 3.1 | 15.1 | ||||||||
| Effect of acquisitions in 2002 | 1.2 | 2.1 | 2.0 | 5.3 | ||||||||
| Goodwill balance at December 31, 2002 | $ | 111.1 | $ | 151.2 | $ | 105.0 | $ | 367.3 | ||||
Intangible assets that continue to be subject to amortization were comprised of the following at December 31, 2003:
| (dollars in millions) | Gross Carrying Amount | Accumulated Amortization | Net Carrying Amount | Weighted Average Amortization Period | |||||||
|---|---|---|---|---|---|---|---|---|---|---|---|
| Technology | $ | 162.4 | $ | 30.7 | $ | 131.7 | 15.0 years | ||||
| Trademarks | 47.3 | 8.8 | 38.5 | 15.1 years | |||||||
| Non-compete agreements | 3.4 | 0.7 | 2.7 | 4.6 years | |||||||
| Total | $ | 213.1 | $ | 40.2 | $ | 172.9 | 15.0 years | ||||
Intangible assets that continue to be subject to amortization were comprised of the following at December 31, 2002:
| (dollars in millions) | Gross Carrying Amount | Accumulated Amortization | Net Carrying Amount | Weighted Average Amortization Period | |||||||
|---|---|---|---|---|---|---|---|---|---|---|---|
| Technology | $ | 158.9 | $ | 19.2 | $ | 139.7 | 15.0 years | ||||
| Trademarks | 47.0 | 5.8 | 41.2 | 15.1 years | |||||||
| Non-compete agreements | 1.3 | 0.1 | 1.2 | 5.0 years | |||||||
| Total | $ | 207.2 | $ | 25.1 | $ | 182.1 | 15.0 years | ||||
F-23
Amortization expense for intangible assets subject to amortization was $14.7 million, $13.9 million, $11.4 million and $1.0 million for the years ended December 31, 2003, 2002, the ten months ended December 31, 2001 and the two months ended February 28, 2001, respectively. Estimated annual amortization expense for intangible assets subject to amortization approximates $14.5 million for each of the next five years.
J. Accrued Expenses
Accrued expenses consisted of the following:
| (in millions) | December 31 | ||||||
|---|---|---|---|---|---|---|---|
| 2003 | 2002 | ||||||
| Wages, vacations, pensions and other employment costs | $ | 36.0 | $ | 31.3 | |||
| Accrued interest | 17.9 | 18.4 | |||||
| Accrued rebates | 11.7 | 9.5 | |||||
| Taxes, other than federal and foreign taxes on income | 5.0 | 7.4 | |||||
| Restructuring and severance costs | 4.4 | 2.9 | |||||
| Accrued environmental liabilities | 0.8 | 0.9 | |||||
| Other | 4.5 | 7.7 | |||||
| Total | $ | 80.3 | $ | 78.1 | |||
K. Financing Arrangements
Short-term Bank Debt
At December 31, 2003, the Company had no short-term bank debt outstanding. At December 31, 2002, the Company had $0.4 million of short-term bank debt outstanding under various foreign facilities. Weighted-average interest rates on short-term borrowings were 3.7%, 10.0% and 5.4%, for the year ended December 31, 2002, the ten months ended December 31, 2001 and the two months ended February 28, 2001, respectively.
Long-term Debt
In connection with the Acquisition, Noveon, Inc. entered into credit facilities and issued subordinated notes. In July 2003, Noveon, Inc. amended and refinanced the term loans within these credit facilities. The amendment and refinancing were not deemed to be a substantial modification of the credit facilities, and accordingly, were not accounted for as a debt extinguishment.
F-24
The credit facilities, as amended, include (1) a Term Loan A facility that matures on March 31, 2007, (2) a Term Loan B facility that matures on December 31, 2009 and (3) a revolving credit facility in the amount of $125.0 million that expires on March 31, 2007. A portion of the revolving credit facility is made available in various foreign currencies. At December 31, 2003, all of Term Loan A, or $37.9 million, and $82.6 million of Term Loan B were denominated in euros. While borrowings under Term Loans A and B were used to finance the Acquisition, borrowings under the revolving credit facility may be used for working capital and for general corporate purposes. At December 31, 2003, there was $37.9 million outstanding on Term Loan A and $551.2 million outstanding on Term Loan B.
Borrowings under the credit facilities bear interest in an amount equal, at Noveon, Inc.'s option, to either (1) the reserve adjusted eurocurrency rate plus an applicable borrowing margin or (2) the base rate plus an applicable borrowing margin. The reserve adjusted eurocurrency rate is the average of the offered quotation in the interbank eurodollar market for U.S. dollar deposits, approximately equal to the outstanding principal amount of Noveon, Inc.'s eurocurrency rate loans. The base rate is the greater of (1) the prime rate or (2) the federal funds rate plus 50 basis points. The applicable borrowing margins for eurocurrency and base rate loans are based upon the most recent leverage ratio submitted by Noveon, Inc. to the administrative agent. Applicable borrowing margins are as follows:
| | December 31 | |||||
|---|---|---|---|---|---|---|
| | 2003 | 2002 | ||||
| Eurocurrency rate loans: | ||||||
| Revolving loans | 2.75 | % | 2.75 | % | ||
| Term A dollar loans | — | 2.75 | % | |||
| Term A euro loans | 2.75 | % | 2.75 | % | ||
| Term B dollar loans | 2.75 | % | 3.50 | % | ||
| Term B euro loans | 3.00 | % | 3.50 | % | ||
Base rate loans: | ||||||
| Revolving loans | 1.75 | % | 1.75 | % | ||
| Term A dollar loans | 1.75 | % | 1.75 | % | ||
| Term B dollar loans | 2.00 | % | 2.50 | % | ||
Interest periods for eurocurrency rate loans are one, two, three or six months, subject to availability. Interest on eurocurrency rate loans is payable at the end of the applicable interest period, except for six-month interest periods in which case interest is payable every three months. Interest on base rate loans is payable quarterly in arrears. Upon an event of default, all loans will bear an additional 2.0% of interest for as long as the event of default is continuing. At December 31, 2003, the average interest rates for Term Loans A and B were 4.76% and 4.51%, respectively, exclusive of the effects of the swap agreements disclosed in Note C. At December 31, 2002, the average interest rates for Term Loans A and B were 5.53% and 5.62%, respectively, exclusive of the effects of the swap agreements disclosed in Note C. At December 31, 2003 and 2002, the average interest rate for Term Loan B was 6.03% and 6.91%, respectively, inclusive of the effects of the swap agreements.
F-25
The credit facilities are secured by a first priority security interest in substantially all of Noveon, Inc.'s assets and the assets of its domestic subsidiaries. In addition, the credit facilities are secured by Noveon, Inc.'s stock, the stock of its domestic subsidiaries and 65% of the stock of its first tier foreign subsidiaries. The credit facilities do require prepayments of portions of principal for certain asset dispositions, other equity or debt issuances and excess cash positions. The credit facilities require Noveon, Inc. to pay commitment fees of 0.5% on the unused portion of the revolving line of credit.
At December 31, 2003 and 2002, Noveon, Inc. had no amounts outstanding on the revolving credit facility and $119.2 million was available for borrowing, net of $5.8 million on outstanding letters of credit.
The credit facilities contain customary covenants that restrict Noveon, Inc.'s and its restricted subsidiaries' ability to:
- •
- incur liens, except specified liens, including liens incurred in the ordinary course of business, liens on property we acquire, and other liens of up to $5.0 million;
- •
- incur additional indebtedness, except specified indebtedness, including indebtedness of our foreign subsidiaries for working capital purposes of up to $25.0 million, unsecured indebtedness of up to $20.0 million, other indebtedness of up to $5.0 million, and other unsecured subordinated indebtedness;
- •
- sell assets, except specified asset sales, including asset sales in the ordinary course of business and other asset sales so long as 80% of the sales price from such asset sales is paid in cash and the total amount of such asset sales does not exceed 15% of our total assets;
- •
- enter into any business combination, except certain business combinations of our subsidiaries that do not constitute an event of default under the credit facilities;
- •
- pay dividends and make other restricted payments, except certain payments, including payments to purchase up to $7.0 million of our common stock per fiscal year from our employees whose employment has terminated and payments in an amount not to exceed 25% of Noveon, Inc.'s consolidated net income arising from and after June 30, 2003, provided the pro forma leverage ratio would be no more than 3.25 to 1.0;
- •
- issue stock, unless there is no event of default under the credit facilities, the administrative agent under the credit facilities consents to the issuance and the proceeds from the issuance are applied as provided in the credit facilities;
- •
- enter into sale and leaseback transactions, except sale and leaseback transactions in an aggregate amount of up to $5.0 million;
- •
- make loans and investments, except certain loans and investments, including loans and investments made in the ordinary course of business and other investments of up to $5.0 million;
- •
- enter into new lines of business;
F-26
- •
- make accounting changes, unless any change is required by generally accepted accounting principles, the change is disclosed to the lenders under the credit facilities and prior financial statements that are affected by the change are restated as required; and
- •
- engage in various transactions with affiliates, unless such transactions are on terms as favorable as could be obtained in an arm's-length transaction and in the ordinary course of business.
In addition, the credit facilities require Noveon, Inc. to comply with specified financial covenants, including maintenance of net worth, limitations on capital expenditures, minimum interest coverage ratios and maximum leverage ratios. The net worth covenant requires that Noveon, Inc.'s net worth on the last day of any fiscal quarter exceed 80% of its consolidated net worth on February 28, 2001 plus 50% of its net income since December 31, 2000. The capital expenditures covenant generally prohibits Noveon, Inc. from spending more than $75.0 million per fiscal year on capital expenditures. The capital expenditures covenant permits Noveon, Inc. to carry forward any unused capital expenditures amount from one fiscal year to the next fiscal year. The capital expenditures covenant also permits Noveon, Inc. to make additional capital expenditures in an aggregate amount of up to $20.0 million. The interest coverage ratio requires that, as of the last day of each fiscal quarter, Noveon, Inc.'s ratio of EBITDA, as defined in the credit facilities, to its interest expense, exceed 2.35 to 1.0 through December 31, 2004. The interest coverage ratio increases on June 30 of each year thereafter. The maximum leverage ratio requires that, as of the last day of each fiscal quarter, Noveon, Inc.'s ratio of its indebtedness minus its cash and cash equivalents to EBITDA, as defined in the credit facilities, not exceed 4.25 to 1.0 through December 31, 2004. The maximum leverage ratio decreases on June 30 of each year thereafter. Noveon, Inc. was in compliance with all covenants at December 31, 2003.
The $275.0 million senior subordinated notes mature on February 28, 2011 and interest accrues at 11% per year. Interest payments on the notes occur on March 15 and September 15 of each year. The notes contain customary provisions for events of default. Noveon, Inc. was in compliance with all terms and conditions of the senior subordinated notes at December 31, 2003.
The senior subordinated notes contain customary covenants that restrict Noveon, Inc. and its restricted subsidiaries' ability to:
- •
- incur additional indebtedness, except specified indebtedness, including indebtedness under our credit facilities, existing indebtedness, permitted indebtedness and indebtedness incurred by a foreign subsidiary;
- •
- incur liens, except specified liens, including liens that secure obligations that are not senior to the senior subordinated notes;
- •
- enter into sale and leaseback transactions, except specified sale and leaseback transactions, including sale and leaseback transactions having a fair market value at least equal to the value of the property that is the subject of the sale and leaseback transaction;
- •
- pay dividends and make other equity distributions subject to certain baskets and provisions, including the ability to pay dividends in an amount equal to 50% of aggregate net income earned since the date of the indenture, provided that Noveon, Inc. would be able to satisfy its
F-27
- •
- purchase or redeem capital stock, except for the purchase of capital stock owned by Noveon, Inc. or any of its subsidiaries and the redemption of the senior subordinated notes;
- •
- make investments, except specified investments, including investments in Noveon, Inc. or any of its subsidiaries, investments in cash and cash equivalents, investments in prepaid expenses and loans made to employees in the ordinary course of business and not in excess of $5.0 million and investments in a subsidiary of Noveon, Inc.;
- •
- sell assets, except specified sales of assets, including sales of assets in which the consideration received is at least equal to the fair market value of the asset, sales in which 75% of the consideration received is in cash and sales of assets, the proceeds of which will be used to pay off certain other indebtedness;
- •
- engage in transactions with affiliates, unless those transactions are on terms as favorable as could be obtained in an arm's-length transaction and in the ordinary course of business; and
- •
- effect a consolidation or merger, unless Noveon, Inc. is the surviving entity, the surviving entity assumes the obligations of Noveon, Inc. under the senior subordinated notes or if the merger or consolidation does not result in an event of default under the indenture governing the senior subordinated notes.
debt incurrence test, except for dividends or equity distributions payable in capital stock or dividends or distributions payable to Noveon, Inc. or any of its subsidiaries;
The original $172.0 million seller note issued to Goodrich matures in 2011 and bears interest at an initial rate of 13% payable semi-annually in cash or additional notes at our option and increases to 15% after February 26, 2006; however if interest is paid in cash, the interest rate remains at 13%. As of December 31, 2003, the principal amount outstanding was $165.9 million and accrued interest was $7.2 million. As of December 31, 2003, $56.2 million of accrued interest has been converted to additional notes payable in lieu of cash payments of interest.
The terms of the seller note allowed for repayment of all or a portion of the seller note at a specified discount. In 2002, the Company repaid $6.0 million of principal at the agreed discount as well as accrued interest on the prepaid portion of the seller note. In addition, the Company repaid $56.2 million of principal at the agreed discount. This resulted in a total gain of $12.4 million from the early extinguishment of debt that was recorded in other expense (income)-net in the consolidated statement of operations.
Noveon, Inc. amended its Term Loan agreements in 2002 allowing it to prepay $45.0 million of its outstanding Term Loans and dividend to the Company $45.0 million in cash so the Company could reduce the seller note based upon an agreement between the Company and Goodrich. As a result of the prepayment of the Term Loans, Noveon, Inc. had no required repayments of the Term Loans in 2003.
Terms of the credit facilities and 11% senior subordinated notes of Noveon, Inc. contain provisions that significantly restrict the ability of Noveon, Inc. or its subsidiaries to make distributions in cash and
F-28
other assets to Noveon International, Inc. At December 31, 2003 substantially all of Noveon, Inc.'s net assets are so restricted.
Maturities of these long-term financing arrangements are as follows:
| (in millions) | Term Loan A | Term Loan B | Senior Subordinated Notes | Seller Note | Other | Total | ||||||||||||
|---|---|---|---|---|---|---|---|---|---|---|---|---|---|---|---|---|---|---|
2004 | $ | 10.3 | $ | 5.5 | $ | — | $ | — | $ | — | $ | 15.8 | ||||||
| 2005 | 11.6 | 5.5 | — | — | — | 17.1 | ||||||||||||
| 2006 | 12.8 | 5.5 | — | — | 0.1 | 18.4 | ||||||||||||
| 2007 | 3.2 | 5.5 | — | — | 0.1 | 8.8 | ||||||||||||
| 2008 | — | 5.5 | — | — | 0.1 | 5.6 | ||||||||||||
| Thereafter | — | 523.7 | 275.0 | 165.9 | — | 964.6 | ||||||||||||
| $ | 37.9 | $ | 551.2 | $ | 275.0 | $ | 165.9 | $ | 0.3 | $ | 1,030.3 | |||||||
L. Lease Commitments
Future minimum lease payments, by year and in the aggregate, under noncancelable operating leases with initial or remaining noncancelable lease terms in excess of one year, consisted of the following at December 31, 2003:
| (in millions) | | ||
|---|---|---|---|
2004 | $ | 5.4 | |
| 2005 | 3.8 | ||
| 2006 | 2.9 | ||
| 2007 | 1.8 | ||
| 2008 | 1.5 | ||
| Thereafter | 1.1 | ||
| Total minimum payments | $ | 16.5 | |
Net rent expense was $10.7 million, $10.6 million, $8.2 million and $2.0 million for the years ended December 31, 2003 and 2002, the ten months ended December 31, 2001 and the two months ended February 28, 2001, respectively.
F-29
M. Pensions and Postretirement Benefits
Overview
As an operating segment of Goodrich, Performance Materials did not have its own pension and postretirement benefit plans. Employees of Performance Materials were eligible to participate in Goodrich's salary and wage pension plans, non-qualified plans and postretirement benefit plans.
As part of the terms of the Acquisition, Goodrich retained the pension benefit obligations for all retirees and the vested portion of the pension obligations for active employees for service prior to the Acquisition, as well as the plan assets of the domestic pension plans. Furthermore, Goodrich retained the postretirement benefit obligations of retirees and those eligible to retire through December 31, 2002. The Company has recorded the pension and postretirement benefit obligations for active employees covered by collective bargaining agreements that remained with the Company after the Acquisition.
Salaried employees' benefit payments are generally determined using a formula that is based on an employees' compensation and length of service. Hourly employees' benefit payments are generally determined using stated amounts for each year of service.
Employees also participate in unfunded defined benefit postretirement plans that provide certain health-care and life insurance benefits to eligible employees. The health-care plans are contributory, with retiree contributions adjusted periodically, and contain other cost-sharing features, such as deductibles and coinsurance. The life insurance plans are generally noncontributory.
The following table summarizes information regarding the Company's defined benefit pension plans and defined benefit postretirement plans as of December 31, 2003 and 2002 and the amounts recorded in the consolidated balance sheet at these dates. In describing the period changes in the table,
F-30
the period of March 1, 2001 through December 31, 2001 was used to describe the effect of activity for 2001.
| | United States Pension Benefits | European Pension Benefits | United States Other Benefits | |||||||||||||||||
|---|---|---|---|---|---|---|---|---|---|---|---|---|---|---|---|---|---|---|---|---|
| (in millions) | ||||||||||||||||||||
| 2003 | 2002 | 2003 | 2002 | 2003 | 2002 | |||||||||||||||
| Change in projected benefit obligations: | ||||||||||||||||||||
| Projected benefit obligation at beginning of period | $ | 38.8 | $ | 30.1 | $ | 17.6 | $ | 14.9 | $ | 5.1 | $ | 5.4 | ||||||||
| Service cost | 3.4 | 2.6 | 1.5 | 1.0 | 0.1 | 0.1 | ||||||||||||||
| Interest cost | 2.6 | 2.3 | 1.0 | 0.8 | 0.3 | 0.3 | ||||||||||||||
| Amendments | — | 0.1 | — | — | — | (0.8 | ) | |||||||||||||
| Actuarial losses | 4.9 | 3.8 | 0.9 | 1.7 | 0.2 | 0.2 | ||||||||||||||
| Acquisitions and other | — | — | (0.2 | ) | 1.6 | — | — | |||||||||||||
| Foreign currency impact | — | — | 3.7 | — | — | — | ||||||||||||||
| Benefits paid | (0.2 | ) | (0.1 | ) | (1.0 | ) | (0.4 | ) | — | (0.1 | ) | |||||||||
| Settlements | — | — | — | (2.0 | ) | — | — | |||||||||||||
| Projected benefit obligation at end of period | $ | 49.5 | $ | 38.8 | $ | 23.5 | $ | 17.6 | $ | 5.7 | $ | 5.1 | ||||||||
| Change in plan assets: | ||||||||||||||||||||
| Fair value of plan assets at beginning of period | $ | 5.2 | $ | 0.1 | $ | 9.1 | $ | 9.9 | $ | — | $ | — | ||||||||
| Actual return on plan assets | 0.1 | — | 1.0 | 0.3 | — | — | ||||||||||||||
| Acquisitions and other | — | — | 0.1 | 1.0 | — | — | ||||||||||||||
| Foreign currency impact | — | — | 1.9 | — | — | — | ||||||||||||||
| Company contributions | 2.5 | 5.2 | 0.9 | 0.8 | — | 0.1 | ||||||||||||||
| Settlements | — | — | — | (2.5 | ) | — | — | |||||||||||||
| Benefits paid | (0.2 | ) | (0.1 | ) | (1.0 | ) | (0.4 | ) | — | (0.1 | ) | |||||||||
| Fair value of plan assets at end of period | $ | 7.6 | $ | 5.2 | $ | 12.0 | $ | 9.1 | $ | — | $ | — | ||||||||
F-31
| | United States Pension Benefits | European Pension Benefits | United States Other Benefits | |||||||||||||||||
|---|---|---|---|---|---|---|---|---|---|---|---|---|---|---|---|---|---|---|---|---|
| (in millions) | ||||||||||||||||||||
| 2003 | 2002 | 2003 | 2002 | 2003 | 2002 | |||||||||||||||
| Funded status (underfunded): | ||||||||||||||||||||
| Funded status | $ | (41.9 | ) | $ | (33.6 | ) | $ | (11.5 | ) | $ | (8.5 | ) | $ | (5.7 | ) | $ | (5.1 | ) | ||
| Unrecognized net actuarial loss | 9.6 | 4.1 | 2.5 | 1.9 | 0.5 | 0.2 | ||||||||||||||
| Unrecognized prior service cost | 0.2 | 0.3 | — | — | (0.6 | ) | (0.9 | ) | ||||||||||||
| Fourth quarter employer contributions | 0.2 | 0.9 | — | — | — | — | ||||||||||||||
| Accrued benefit cost | $ | (31.9 | ) | $ | (28.3 | ) | $ | (9.0 | ) | $ | (6.6 | ) | $ | (5.8 | ) | $ | (5.8 | ) | ||
The accumulated benefit obligation for all defined benefit pension plans was $29.3 million and $20.2 million at December 31, 2003 and 2002, respectively.
The components of net periodic benefit cost are reflected below for the years ended December 31, 2003 and 2002 and the ten months ended December 31, 2001.
| | | | | European Pension Benefits | United States Other Benefits | ||||||||||||||||||||||||
|---|---|---|---|---|---|---|---|---|---|---|---|---|---|---|---|---|---|---|---|---|---|---|---|---|---|---|---|---|---|
| | United States Pension Benefits | ||||||||||||||||||||||||||||
| (in millions) | |||||||||||||||||||||||||||||
| 2003 | 2002 | 2001 | 2003 | 2002 | 2001 | 2003 | 2002 | 2001 | |||||||||||||||||||||
| Components of net periodic benefit cost: | |||||||||||||||||||||||||||||
| Service cost | $ | 3.4 | $ | 2.6 | $ | 2.0 | $ | 1.5 | $ | 1.0 | $ | 1.0 | $ | 0.1 | $ | 0.1 | $ | 0.2 | |||||||||||
| Interest cost | 2.6 | 2.3 | 1.7 | 1.0 | 0.8 | 0.6 | 0.3 | 0.3 | 0.3 | ||||||||||||||||||||
| Expected return on plan assets | (0.7 | ) | (0.1 | ) | — | (0.5 | ) | (0.4 | ) | (0.3 | ) | — | — | — | |||||||||||||||
| Amortization of prior service cost | 0.1 | — | — | — | — | — | (0.1 | ) | (0.1 | ) | — | ||||||||||||||||||
| Curtailment and settlement losses | — | — | — | — | 0.5 | — | — | — | — | ||||||||||||||||||||
| Other | — | — | — | — | 1.5 | — | — | — | — | ||||||||||||||||||||
| Total net periodic benefit cost | $ | 5.4 | $ | 4.8 | $ | 3.7 | $ | 2.0 | $ | 3.4 | $ | 1.3 | $ | 0.3 | $ | 0.3 | $ | 0.5 | |||||||||||
Net periodic benefit costs for pension benefits and other benefits were $0.2 million and $1.0 million, respectively, for the two months ended February 28, 2001.
Weighted Average Assumptions
Weighted-average assumptions used to determine benefit obligations are summarized as follows:
| | United States Pension Benefits | European Pension Benefits | United States Other Benefits | ||||||||||
|---|---|---|---|---|---|---|---|---|---|---|---|---|---|
| | 2003 | 2002 | 2003 | 2002 | 2003 | 2002 | |||||||
| Discount rate | 6.36 | % | 6.75 | % | 5.20 | % | 5.82 | % | 6.36 | % | 6.75 | % | |
| Rate of compensation increase | 3.75 | % | 4.00 | % | 4.58 | % | 4.45 | % | — | — | |||
F-32
Weighted-average assumptions used to determine net periodic benefit costs are summarized as follows:
| | United States Pension Benefits | European Pension Benefits | United States Other Benefits | ||||||||||||||||
|---|---|---|---|---|---|---|---|---|---|---|---|---|---|---|---|---|---|---|---|
| | 2003 | 2002 | 2001 | 2003 | 2002 | 2001 | 2003 | 2002 | 2001 | ||||||||||
| Discount rate | 6.75 | % | 7.50 | % | 7.75 | % | 5.82 | % | 6.00 | % | 6.20 | % | 6.75 | % | 7.50 | % | 7.75 | % | |
| Expected return on plan assets | 8.50 | % | 8.50 | % | 9.25 | % | 5.37 | % | 5.79 | % | 6.30 | % | — | — | — | ||||
| Rate of compensation increase | 4.00 | % | 4.00 | % | 4.00 | % | 4.45 | % | 4.29 | % | 4.29 | % | — | — | — | ||||
For measurement purposes, an 11.9% annual rate of increase in the per capita cost of covered health care benefits was assumed for 2003. The rate was assumed to decrease gradually to 5.6% for 2014 and remain at that level thereafter. For post-Medicare measurement purposes, a 12.9% annual rate of increase in the per capita cost of covered health care benefits was assumed for 2003. The rate was assumed to decrease gradually to 5.7% for 2014 and remain at that level thereafter. The table below quantifies the impact of a one percentage point change in the assumed health care cost trend rate.
(in millions) | 1 Percentage Point Increase | 1 Percentage Point Decrease | |||||
|---|---|---|---|---|---|---|---|
| Effect on total of service and interest cost components in 2003 | $ | — | $ | — | |||
| Effect on postretirement benefit obligation as of December 31, 2003 | $ | 0.4 | $ | (0.4 | ) | ||
Description of Plan Assets and Expected Long Term Rate of Return on Assets Assumption
The Company uses a September 30 measurement date for its pension and postretirement benefit plans. At both September 30, 2003 and 2002, the Company had 100% of the assets in its pension plans invested in cash. This allowed preservation of capital in early plan years when funded ratios were low and benefit payments certain. In the fourth quarter of 2003, the Company started the process of migrating plan assets towards long-term target allocations. The weighted-average asset allocations for their two U.S. pension plans at December 31, 2003 by asset category are as follows:
| | United States Pension Benefits | |||
|---|---|---|---|---|
| | 2003 | |||
| Equity securities | 60.0 | % | ||
| Debt securities | 40.0 | % | ||
| Other | — | |||
| Total | 100.0 | % | ||
To develop the expected long-term rate of return on assets assumption, the Company considered the future expectations for returns for each asset class, as well as the target asset allocation of the
F-33
pension portfolio. This resulted in the selection of the 8.50% long-term rate of return on assets assumption for 2003. This rate has been reduced to 7.50% for the year ending December 31, 2004.
Investment Policies and Strategies
The investments of the U.S. pension plans are managed with the primary focus of preservation of capital. Emphasis will be placed on participation with broad market movements during rising markets and preservation of capital during market contractions for investments in both debt and equity securities. The assets in the U.S. pension plans will be primarily invested in passively managed index funds.
The portfolio will be re-balanced at least on an annual basis. The following assets and strategies are not used: private placements, venture capital, securities not publicly traded, options, commodities, future contracts, margin or leverage. Equity investments in any one company are limited to a maximum of 5% at the time of purchase and on a cost basis for each investment advisor. No foreign securities will be allowed in the portfolio unless available in American Depository Receipts (ADR's) on a U.S. exchange. No holding will represent more than 5% of the outstanding stock of the issuing company.
Corporate bonds purchased will not be rated lower than Baa3 by Moody's or BBB- by Standard and Poor's. At no time will the lowest investment grade ratings make up more than 20% of the portfolio. No fixed income investment in any one issuer will comprise more than 3% of the total fixed income allocation at time of purchase. This limitation does not apply to U.S. Government securities or direct obligations of the U.S. Treasury. The maximum modified duration of the fixed income portfolio will not exceed 120% of the modified duration of the Lehman Intermediate Aggregate Bond Index. The following debt securities are prohibited: companion tranches or support bonds, floaters, inverse floaters, income only, principal only collateralized mortgage obligations (CMO's) and structured notes unless specifically allowed in writing.
Contributions and Estimated Future Benefit Payments
The Company expects to contribute $9.9 million to its U.S. pension plan and $0.1 million to its U.S. other benefit plans during 2004.
F-34
The following summarizes benefits expected to be paid by plan in each of the next five fiscal years, and in the aggregate for the five fiscal years thereafter:
| (in millions) | United States Pension Plan | United States Other Benefit Plans | ||||
|---|---|---|---|---|---|---|
2004 | $ | 0.2 | $ | 0.1 | ||
| 2005 | 0.3 | 0.2 | ||||
| 2006 | 0.6 | 0.2 | ||||
| 2007 | 0.9 | 0.3 | ||||
| 2008 | 1.3 | 0.3 | ||||
| 2009-2013 | 13.6 | 2.3 | ||||
The Company's employees also participate in voluntary retirement savings plans for salaried and wage employees. Under provisions of these plans, eligible employees can receive a 50% matching on contributions up to the first 6% of their eligible earnings. Expense for defined contribution plans totaled $6.3 million, $6.2 million, $4.8 million and $1.1 million for the years ended December 31, 2003 and 2002, the ten months ended December 31, 2001 and the two months ended February 28, 2001, respectively.
Medicare Prescription Drug Act
In January 2004, the FASB issued Financial Staff Position ("FSP") No. 106-1 "Accounting and Disclosure Requirements Related to the Medicare Prescription Drug, Improvement and Modernization Act 2003." FSP 106-1 addresses the accounting and disclosure implications that are expected to arise as a result of the Medicare Prescription Drug, Improvement and Modernization Act (the "Act"). The Act introduced a prescription drug benefit under Medicare (Medicare Part D) as well as a federal subsidy to sponsors of retiree health care benefit plans that provide a benefit that is at least actuarially equivalent to Medicare Part D. Under FSP No. 106-1, a plan sponsor may elect to defer recognizing the effects of the Act until authoritative guidance on the accounting for the federal subsidy is issued. The Company has not adopted the provisions of the Act and, accordingly, any measures of accumulated postretirement benefit obligation or net periodic postretirement benefit cost in the financial statements or accompanying notes do not reflect the Act. Specific authoritative guidance, when issued, could require the Company to change previously reported information.
F-35
N. Income Taxes
The provision for income taxes is calculated in accordance with SFAS No. 109, "Accounting for Income Taxes," which requires the recognition of deferred income taxes using the liability method. Tax valuation allowances were recorded in 2003, 2002 and 2001.
Income (loss) before income taxes as shown in the consolidated statement of operations consisted of the following:
| | Noveon International, Inc. | BFGoodrich Performance Materials | ||||||||||
|---|---|---|---|---|---|---|---|---|---|---|---|---|
| | Years Ended December 31 | Ten Months Ended December 31 2001 | Two Months Ended February 28 2001 | |||||||||
| (in millions) | ||||||||||||
| 2003 | 2002 | |||||||||||
| Domestic | $ | (31.5 | ) | $ | 12.3 | $ | (44.3 | ) | $ | 5.7 | ||
| Foreign | 33.3 | 17.8 | 9.2 | 3.9 | ||||||||
| Total | $ | 1.8 | $ | 30.1 | $ | (35.1 | ) | $ | 9.6 | |||
A summary of income tax expense (benefit) in the consolidated statement of operations was as follows:
| | Noveon International, Inc. | BFGoodrich Performance Materials | ||||||||||||
|---|---|---|---|---|---|---|---|---|---|---|---|---|---|---|
| | Years Ended December 31 | Ten Months Ended December 31 2001 | Two Months Ended February 28 2001 | |||||||||||
| (in millions) | ||||||||||||||
| 2003 | 2002 | |||||||||||||
| Current: | ||||||||||||||
| Federal | $ | — | $ | — | $ | — | $ | 7.4 | ||||||
| Foreign | 10.9 | 8.8 | 4.2 | 1.6 | ||||||||||
| State | — | — | — | 0.2 | ||||||||||
| 10.9 | 8.8 | 4.2 | 9.2 | |||||||||||
| Deferred: | ||||||||||||||
| Federal | — | 0.3 | — | (5.2 | ) | |||||||||
| State | — | 0.1 | — | — | ||||||||||
| Foreign | (1.7 | ) | (2.8 | ) | 0.4 | — | ||||||||
| (1.7 | ) | (2.4 | ) | 0.4 | (5.2 | ) | ||||||||
| Total | $ | 9.2 | $ | 6.4 | $ | 4.6 | $ | 4.0 | ||||||
Deferred income taxes reflect the net tax effect of temporary differences between the carrying amounts of assets and liabilities for financial reporting purposes and the amounts used for income tax purposes and certain changes in valuation allowances. During 2003, we incurred losses for our domestic operations and for certain of our foreign operations. These cumulative losses and lack of prior earnings history provide substantial evidence regarding our inability to realize certain deferred tax assets. Accordingly, tax valuation allowances of $26.3 million have been recorded in 2003.
F-36
The significant components of deferred income tax assets and liabilities at December 31, 2003 and 2002, are as follows:
| (in millions) | 2003 | 2002 | ||||||
|---|---|---|---|---|---|---|---|---|
| Deferred income tax assets: | ||||||||
| Pension accruals | $ | 11.6 | $ | 9.4 | ||||
| Accrual for postretirement benefits other than pensions | 1.8 | 2.0 | ||||||
| Other nondeductible accruals | 16.0 | 10.9 | ||||||
| Reserve for environmental liabilities | 7.2 | 7.3 | ||||||
| Inventory | 5.4 | 2.0 | ||||||
| Hedging activities | 3.9 | 5.6 | ||||||
| Net operating loss carryovers and credits | 97.9 | 68.2 | ||||||
| Interest | 19.6 | 13.3 | ||||||
| Other | 1.0 | 0.6 | ||||||
| Total deferred income tax assets | 164.4 | 119.3 | ||||||
| Less valuation allowance | (70.8 | ) | (55.4 | ) | ||||
| Net deferred income tax assets | 93.6 | 63.9 | ||||||
| Deferred income tax liabilities: | ||||||||
| Property, plant and equipment | (109.7 | ) | (81.0 | ) | ||||
| Intangible amortization | (2.0 | ) | (1.0 | ) | ||||
| Total deferred income tax liabilities | (111.7 | ) | (82.0 | ) | ||||
| Net deferred income taxes | $ | (18.1 | ) | $ | (18.1 | ) | ||
At December 31, 2003, the Company had domestic net operating loss carryforwards of $195.7 million and tax credits of $6.4 million, which expire in 2021 through 2023. These domestic net operating loss and tax credit carryforwards may be used to offset a portion of future taxable income and thereby reduce our U.S. federal income taxes otherwise payable. The Internal Revenue Code of 1986, as amended, (the "Code"), imposes significant limitations on the utilization of net operating loss and tax credit carryforwards in the event of an "ownership change," as defined in Sections 382 and 383 of the Code. Our net operating loss carryforwards may be subject to limitation by virtue of these rules should a future ownership change occur. Additionally, the Company had foreign net operating loss carryforwards of $55.6 million at December 31, 2003 of which $16.4 million expires in years 2006 through 2018, and $39.2 million that have an indefinite carryforward period.
Management has determined, based on the Company's cumulative losses and lack of prior earnings history, that it is uncertain that future taxable income of the Company will be sufficient to recognize certain of these net deferred tax assets. As a result, a valuation allowance of $70.8 million at December 31, 2003 has been recorded. This valuation allowance relates to net domestic deferred tax assets recorded in purchase accounting, acquired foreign net deferred tax assets associated with net operating losses and credits and deferred tax assets resulting from domestic and foreign tax net operating losses and credits generated subsequent to the Acquisition date. A significant portion of the
F-37
valuation allowance is associated with deferred tax assets established in purchase accounting. Any reversal of the valuation allowance that was recorded in purchase accounting would reduce goodwill. In the current year, a reduction of the valuation allowance of $9.2 million was allocated to goodwill as a result of changes in estimated deferred taxes recorded in purchase accounting.
In determining the adequacy of the $70.8 million valuation allowance, management assessed the Company's profitability taking into account the present and anticipated amounts of domestic and international earnings as well as the anticipated taxable income as a result of the reversal of future taxable temporary differences. The Company will maintain tax valuation allowances for the balance of deferred tax assets until sufficient positive evidence (for example, cumulative positive domestic earnings and future taxable income) exists to support the reversal of the tax valuation allowances.
The following table reconciles income taxes based on the statutory federal income tax rate to the Company's income tax expense:
| | Noveon International, Inc. | BFGoodrich Performance Materials | |||||||||||
|---|---|---|---|---|---|---|---|---|---|---|---|---|---|
| | Years Ended December 31 | Ten Months Ended December 31 2001 | Two Months Ended February 28 2001 | ||||||||||
| (dollars in millions) | |||||||||||||
| 2003 | 2002 | ||||||||||||
| Income tax expense based on the statutory federal income tax rate | $ | 0.6 | $ | 10.5 | $ | (12.3 | ) | $ | 3.4 | ||||
| State and local taxes, net of federal benefit | (0.9 | ) | 0.1 | (1.4 | ) | 0.1 | |||||||
| Amortization of nondeductible goodwill | — | — | 1.5 | 0.8 | |||||||||
| Tax exempt income from foreign sales | (0.3 | ) | (0.1 | ) | (0.5 | ) | (0.3 | ) | |||||
| Impact of foreign operations | (12.5 | ) | (2.5 | ) | (2.4 | ) | (0.5 | ) | |||||
| Nondeductible interest | 1.3 | 1.6 | 1.3 | — | |||||||||
| Gain on early extinguishment of debt | — | (4.4 | ) | — | — | ||||||||
| Domestic tax credits | (5.9 | ) | (0.5 | ) | (0.5 | ) | — | ||||||
| Nondeductible business operating expenses | 0.4 | 0.3 | 0.2 | 0.2 | |||||||||
| Other items | 0.2 | 0.1 | (0.4 | ) | 0.3 | ||||||||
| Valuation allowance | 26.3 | 1.3 | 19.1 | — | |||||||||
| Total income tax expense | $ | 9.2 | $ | 6.4 | $ | 4.6 | $ | 4.0 | |||||
Effective income tax rate | 511.1 | % | 21.3 | % | 13.1 | % | 41.7 | % | |||||
The Company has not provided for U.S. income and foreign withholding taxes on approximately $91.1 million of foreign subsidiaries' undistributed earnings as of December 31, 2003, because such earnings are intended to be reinvested indefinitely. Accordingly, no provision has been made for U.S. or foreign withholding taxes that may become payable if undistributed earnings of foreign subsidiaries were paid as dividends to the Company. The additional taxes that would result had such earnings actually been repatriated are not practically determinable.
F-38
O. Fair Values of Financial Instruments
The estimated fair values of the financial instruments at December 31, 2003 and 2002 are provided in the following table.
| | 2003 | 2002 | ||||||||||
|---|---|---|---|---|---|---|---|---|---|---|---|---|
| | Carrying Amount | Fair Value | Carrying Amount | Fair Value | ||||||||
| | (in millions) | |||||||||||
| Term Loan A | $ | 37.9 | $ | 38.3 | $ | 72.9 | $ | 72.9 | ||||
| Term Loan B | 551.2 | 556.7 | 498.9 | 501.4 | ||||||||
| Subordinated notes | 275.0 | 316.3 | 275.0 | 298.4 | ||||||||
| Seller note | 165.9 | 165.9 | 145.2 | 130.0 | ||||||||
| Other | 0.3 | 0.3 | 0.3 | 0.3 | ||||||||
P. Accumulated Other Comprehensive Income (Loss)
Total accumulated other comprehensive income (loss) for the years ended December 31, 2003 and 2002 consisted of the following:
| | Net Change In Cash Flow Hedges | Cumulative Translation Adjustment | Accumulated Other Comprehensive Income (Loss) | |||||||
|---|---|---|---|---|---|---|---|---|---|---|
| | (in millions) | |||||||||
| Balance at January 1, 2002 | $ | (5.7 | ) | $ | (4.5 | ) | $ | (10.2 | ) | |
| Net comprehensive income (loss) changes during the year | (9.0 | ) | 22.8 | 13.8 | ||||||
| Balance at December 31, 2002 | (14.7 | ) | 18.3 | 3.6 | ||||||
| Net comprehensive income changes during the year | 4.5 | 68.3 | 72.8 | |||||||
| Balance at December 31, 2003 | $ | (10.2 | ) | $ | 86.6 | $ | 76.4 | |||
Q. Business Segment Information
The Company's operations are classified into three reportable business segments: Consumer Specialties, Specialty Materials and Performance Coatings. The accounting policies of the segments are the same as those described in Note C.
The Consumer Specialties segment is a global producer of acrylic thickeners, film formers, fixatives, emollients, silicones, botanicals, active pharmaceutical ingredients and intermediates, benzoate preservatives, fragrances, synthetic food dyes and natural colorants. The Company markets products from the Consumer Specialties segment to the following primary end-use industries: personal care, pharmaceuticals, and food and beverage. The Consumer Specialties segment products are sold to customers worldwide. These customers include major manufacturers of cosmetics, personal care products, household products, soft drinks and food products.
F-39
The Specialty Materials segment is the largest global supplier of chlorinated polyvinyl chloride ("CPVC") resins and compounds and reactive liquid polymers ("RLP"), and is a leading North American producer of rubber and lubricant antioxidants and rubber accelerators. The Specialty Materials segment is also a leading producer of thermoplastic polyurethane ("TPU"). With respect to the markets in which we compete, Specialty Materials is a leading producer of cross-linked polyethylene compounds ("PEX"). The Company markets Specialty Materials segment products through the primary product categories of specialty plastics and polymer additives. The Specialty Materials segment products are sold to a diverse customer base comprised of major manufacturers in the construction, automotive, telecommunications, electronics, recreation and aerospace industries.
The Performance Coatings segment is a leading global producer of high-performance polymers for specialty paper, printing and packaging, industrial and architectural specialty coatings and textile applications. The Company markets the Performance Coatings segment through the primary product categories of performance polymers and coatings and textile performance chemicals. The Performance Coatings segment serves major companies in the specialty paper, printing and packaging, paint and coatings, and textile industries.
Segment operating income is total segment revenue reduced by operating expenses identifiable with that business segment. Restructuring and severance costs are presented separately and corporate costs include general corporate administrative expenses that are not specifically identifiable with just one of the reportable business segments.
The Company conducts business on a global basis with manufacturing and sales undertaken in various locations throughout the world. The Company's products are principally sold to customers in North America and Europe. Sales are attributed to geographic areas based on the country to which the product was shipped.
The following tables summarize business segment information:
| | Noveon International, Inc. | BFGoodrich Performance Materials | |||||||||||
|---|---|---|---|---|---|---|---|---|---|---|---|---|---|
| | | | Ten Months Ended December 31 2001 | Two Months Ended February 28 2001 | |||||||||
| | Years Ended December 31 | ||||||||||||
| | 2003 | 2002 | |||||||||||
| | (in millions) | ||||||||||||
| Sales: | |||||||||||||
| Consumer Specialties | $ | 328.7 | $ | 290.8 | $ | 238.8 | $ | 45.2 | |||||
| Specialty Materials | 428.6 | 402.4 | 324.4 | 73.1 | |||||||||
| Performance Coatings | 378.6 | 376.1 | 313.2 | 68.7 | |||||||||
| Total sales | $ | 1,135.9 | $ | 1,069.3 | $ | 876.4 | $ | 187.0 | |||||
F-40
| | Noveon International, Inc. | BFGoodrich Performance Materials | ||||||||||||
|---|---|---|---|---|---|---|---|---|---|---|---|---|---|---|
| | | | Ten Months Ended December 31 2001 | Two Months Ended February 28 2001 | ||||||||||
| | Years Ended December 31 | |||||||||||||
| | 2003 | 2002 | ||||||||||||
| | (in millions) | |||||||||||||
| Operating income: | ||||||||||||||
| Consumer Specialties | $ | 47.0 | $ | 48.2 | $ | 30.8 | $ | 2.1 | ||||||
| Specialty Materials | 75.8 | 84.3 | 52.3 | 16.9 | ||||||||||
| Performance Coatings | 43.3 | 59.4 | 34.5 | 3.2 | ||||||||||
| Total segment operations income | 166.1 | 191.9 | 117.6 | 22.2 | ||||||||||
| Corporate costs | (59.1 | ) | (66.1 | ) | (56.3 | ) | (11.7 | ) | ||||||
| Restructuring and severance costs | (13.2 | ) | (6.1 | ) | (3.1 | ) | — | |||||||
| Total operating income | $ | 93.8 | $ | 119.7 | $ | 58.2 | $ | 10.5 | ||||||
| Capital expenditures: | ||||||||||||||
| Consumer Specialties | $ | 24.4 | $ | 17.0 | $ | 10.9 | $ | 1.9 | ||||||
| Specialty Materials | 14.4 | 10.4 | 7.0 | 1.7 | ||||||||||
| Performance Coatings | 8.8 | 12.8 | 7.0 | 2.6 | ||||||||||
| Corporate | 9.0 | 12.1 | 3.6 | 1.4 | ||||||||||
| Total capital expenditures | $ | 56.6 | $ | 52.3 | $ | 28.5 | $ | 7.6 | ||||||
| Depreciation and amortization expense: | ||||||||||||||
| Consumer Specialties | $ | 26.1 | $ | 22.4 | $ | 21.4 | $ | 4.4 | ||||||
| Specialty Materials | 34.8 | 33.9 | 32.0 | 3.8 | ||||||||||
| Performance Coatings | 20.1 | 19.2 | 20.8 | 4.5 | ||||||||||
| Corporate | 10.4 | 9.2 | 8.8 | 1.7 | ||||||||||
| Total depreciation and amortization | $ | 91.4 | $ | 84.7 | $ | 83.0 | $ | 14.4 | ||||||
| Net sales: | ||||||||||||||
| United States | $ | 674.2 | $ | 675.2 | $ | 566.0 | $ | 122.6 | ||||||
| Europe | 231.7 | 191.0 | 158.4 | 35.7 | ||||||||||
| Other foreign | 230.0 | 203.1 | 152.0 | 28.7 | ||||||||||
| Total | $ | 1,135.9 | $ | 1,069.3 | $ | 876.4 | $ | 187.0 | ||||||
| Assets: | ||||||||||||||
| Consumer Specialties | $ | 493.7 | $ | 467.3 | ||||||||||
| Specialty Materials | 606.0 | 577.5 | ||||||||||||
| Performance Coatings | 420.9 | 397.5 | ||||||||||||
| Corporate | 237.0 | 192.2 | ||||||||||||
| Total assets | $ | 1,757.6 | $ | 1,634.5 | ||||||||||
| Property: | ||||||||||||||
| United States | $ | 483.1 | $ | 497.5 | ||||||||||
| Europe | 182.0 | 160.0 | ||||||||||||
| Other foreign | 17.8 | 13.2 | ||||||||||||
| Total | $ | 682.9 | $ | 670.7 | ||||||||||
F-41
R. Supplemental Cash Flow Information
The following table sets forth supplemental cash flow information, including information related to acquisitions accounted for under the purchase method:
| | 2003 | 2002 | 2001 | |||||||
|---|---|---|---|---|---|---|---|---|---|---|
| | (in millions) | |||||||||
| Estimated fair value of tangible assets acquired | $ | 16.8 | $ | 4.6 | $ | 1,091.8 | ||||
| Liabilities assumed | (0.7 | ) | (1.1 | ) | (294.4 | ) | ||||
| Goodwill and identifiable intangible assets acquired | 16.0 | 23.9 | 565.7 | |||||||
| Less: seller note issued by Noveon International, Inc. | — | — | (172.0 | ) | ||||||
| Net cash paid, including fees and expenses | $ | 32.1 | $ | 27.4 | $ | 1,191.1 | ||||
| Interest paid | $ | 66.7 | $ | 72.1 | $ | 57.0 | ||||
| Income taxes paid | $ | 6.2 | $ | 4.6 | $ | 4.8 | ||||
| Issuance of seller note | $ | — | $ | — | $ | 172.0 | ||||
| Issuance of notes payable for interest payable | $ | 20.8 | $ | 24.2 | $ | 11.2 | ||||
S. Stock Options
Certain eligible employees of the Company participate in the Company's Amended and Restated Stock Option Plan (the "Plan"). Options granted by the Company vest on each of the first five anniversaries of the grant date at 20% per year subject to continued employment. The term of each option cannot exceed 10 years from the date of grant. All options granted under the Plan have been granted at not less than 100% of market value, as determined by the board of directors of the Company, on the date of grant.
Pro forma information regarding net income is required by SFAS No. 123, "Accounting for Stock-Based Compensation," and has been determined as if the Company had accounted for its employee stock options under the fair value method described within that statement. The fair value for these options was estimated using the Black-Scholes pricing method with the following weighted-average assumptions:
| | 2003 | 2002 | 2001 | |||
|---|---|---|---|---|---|---|
| Risk-free rate | 3.6% | 3.9% | 5.8% | |||
| Dividend yield | 0.0% | 0.0% | 0.0% | |||
| Expected volatility percentage | 41.7% | 37.2% | 37.2% | |||
| Expected life of options | 7 years | 7 years | 7 years |
The option pricing method requires the input of highly subjective assumptions that can materially affect the fair value estimate. The weighted-average fair value of stock options granted by the Company during 2003, 2002 and 2001 were $72.02, $38.30 and $42.24, respectively.
F-42
Stock option activity relating to the Company was as follows for the years ended December 31, 2003, 2002 and 2001:
| (Options in thousands) | Options | Weighted Average Exercise Price | ||||
|---|---|---|---|---|---|---|
| Outstanding at March 1, 2001: | — | $ | — | |||
| Granted | 323.0 | 128.57 | ||||
| Forfeited | (10.0 | ) | 128.57 | |||
| Outstanding at December 31, 2001: | 313.0 | 128.57 | ||||
| Granted | 11.4 | 128.57 | ||||
| Forfeited | (7.5 | ) | 128.57 | |||
| Outstanding at December 31, 2002: | 316.9 | 128.57 | ||||
| Granted | 47.0 | 147.00 | ||||
| Forfeited | (13.3 | ) | 128.57 | |||
| Outstanding at December 31, 2003 | 350.6 | $ | 131.04 | |||
There were 119,224 options and 61,102 options exercisable at December 31, 2003 and 2002, respectively.
T. Related Party Transactions
In connection with the Acquisition, AEA, Credit Suisse First Boston LLC ("CSFB"), and Deutsche Bank Securities Inc., which was an affiliate of MidOcean through February 20, 2003, the initial purchasers of the notes, provided acquisition advisory services. At the closing, AEA, Credit Suisse First Boston LLC and a former affiliate of MidOcean received $8.8 million, $5.5 million and $1.7 million, respectively, for these services. In addition, direct expenses of $1.3 million, $0.5 million and $0.1 million, respectively, were reimbursed to them. All of these amounts have been considered in the purchase price allocation.
Credit Suisse First Boston, an affiliate of DLJ Merchant Banking, is a joint lead arranger and joint book manager under Noveon, Inc.'s credit facilities. DLJ Merchant Banking and MidOcean are stockholders of the Company. Credit Suisse First Boston LLC, an affiliate of DLJ Merchant Banking, and a former affiliate of MidOcean were each initial purchasers of the notes and received fees in connection with their initial purchase.
Total debt financing fees in connection with the Acquisition paid to an affiliate of Credit Suisse First Boston LLC and Deutsche Bank Securities Inc. were $10.4 million and $19.6 million, respectively.
The Company entered into a management agreement with each of AEA, DLJ Merchant Banking and MidOcean. Under the management agreements, the Company will pay AEA, DLJ Merchant Banking and MidOcean an annual fee of $1.9 million, $1.1 million and $0.5 million, respectively, plus reasonable out-of-pocket expenses as compensation for the appointed directors, various advisory and consulting services and for monitoring and management costs, as applicable. In addition, the Company
F-43
agreed to indemnify AEA, DLJ Merchant Banking and MidOcean and their respective affiliates for liabilities arising from their actions under the management agreements. The management agreements, will remain in effect for as long as the stockholders agreement, as amended from time to time, among the Company, AEA, DLJ Merchant Banking and MidOcean is in effect.
The Company entered into an advisory services agreement, dated as of February 5, 2001, with Credit Suisse First Boston LLC. Under the advisory services agreement, the Company pays Credit Suisse First Boston LLC an annual fee of $0.5 million plus reasonable out-of-pocket expenses as compensation for strategic and financial planning advisory services. In addition, the Company agreed to indemnify Credit Suisse First Boston LLC and its respective affiliates for liabilities arising from their actions under the advisory services agreement.
For the years ended December 31, 2003 and 2002 and the ten months ended December 31, 2001, the Company recognized management fee expense of $4.0 million, $3.7 million and $3.3 million, respectively.
The Company sponsors an employee stock purchase plan that provides for certain employees of the Company to purchase shares of the Company's common stock as a purchase price determined by the board of directors. During the ten months ended December 31, 2001, employees purchased approximately 50,000 shares for an aggregate price of $5.0 million equal to the fair value of the shares as determined by the board of directors. The Company's CEO purchased $1.0 million of common stock under the plan in exchange for a full recourse note. The note carries interest at 7% and is due on November 30, 2011. The note, amounting to $1.2 million, including accrued interest, is included as a separate component of stockholders' equity on the consolidated balance sheet at December 31, 2003. During the year ended December 31, 2003, directors and employees purchased 8,018 shares for an aggregate price of $1.2 million, which was equal to the fair value of the shares as determined by the board of directors.
U. Commitments and Contingencies
Contingencies
The Company and its subsidiaries have numerous purchase commitments for materials, supplies and energy in the ordinary course of business. The Company and its subsidiaries have numerous sales commitments for product supply contracts in the ordinary course of business.
General
There are pending or threatened against the Company or our subsidiaries various claims, lawsuits and administrative proceedings, all arising from the ordinary course of business with respect to commercial, product liability, and environmental matters, which seek remedies or damages. The Company believes that any liability that may finally be determined with respect to commercial and product liability claims should not have a material adverse effect on our consolidated financial position, results of operations or cash flows. From time to time, we are also involved in legal proceedings as a
F-44
plaintiff involving contract, patent protection, environmental and other matters. Gain contingencies, if any, are recognized when they are realized.
Environmental
The Company and its subsidiaries are generators of both hazardous and non-hazardous wastes, the treatment, storage, transportation and disposal of which are regulated by various laws and governmental regulations. Although the Company believes past operations were in substantial compliance with the then-applicable regulations, either the Company or the Performance Materials Segment of Goodrich have been designated as a potentially responsible party ("PRP") by the U.S. Environmental Protection Agency ("EPA"), or similar state agencies, in connection with several disposal sites. These laws and regulations, including the Comprehensive Environmental Response, Compensation and Liability Act of 1980 and similar state laws, generally impose liability for costs to investigate and remediate contamination without regard to fault and under certain circumstances liability may be joint and several resulting in one responsible party being held responsible for the entire obligation. Liability may also include damages to natural resources.
The Company initiates corrective and/or preventive environmental projects to ensure environmental compliance and safe and lawful activities at its current operations. The Company also conducts a compliance and management systems audit program.
The Company's environmental engineers and consultants review and monitor environmental issues at past and existing operating sites, as well as off-site disposal sites at which the Company has been identified as a PRP. This process includes investigation and remedial action selection and implementation, as well as negotiations with other PRPs and governmental agencies. Our estimates of environmental liabilities are based on the results of this process.
Goodrich provided the Company with an indemnity for various environmental liabilities. The Company estimates Goodrich's share of such currently identified liabilities under the indemnity, which extends to 2011, to be about $8.1 million. In addition to Goodrich's indemnity, several other indemnities from third parties such as past owners relate to specific environmental liabilities. Goodrich and other third party indemnitors are currently indemnifying the Company for several environmental remediation projects. Goodrich's share of all of these liabilities may increase to the extent such third parties fail to honor their indemnity obligations through 2011. The Company's December 31, 2003 balance sheet includes liabilities, measured on an undiscounted basis, of $19.0 million to cover future environmental expenditures either payable by the Company or indemnifiable by Goodrich. Accordingly, the current portion of the environmental obligations of $0.8 million is recorded in accrued expenses and $1.4 million of the recovery due from Goodrich is recorded in accounts receivable. Non-current liabilities include $18.2 million and other non-current assets include $6.7 million reflecting the recovery due from Goodrich.
F-45
The following table summarizes the activity in the environmental liability from January 1, 2002 to December 31, 2003 (dollars in millions):
| Balance at January 1, 2001 | $ | 47.6 | ||
| Payments from January 1, 2001 to February 28, 2001 | (0.7 | ) | ||
| Balance at February 28, 2001 before transfer of liabilities to Goodrich in closing | 46.9 | |||
| Environmental liabilities of sites retained by Goodrich | (23.7 | ) | ||
| Total environmental liability at March 1, 2001 | 23.2 | |||
| Payments from March 1, 2001 to December 31, 2001 | (0.2 | ) | ||
| Revisions of environmental liabilities recorded in the opening balance sheet | 0.7 | |||
| Balance at December 31, 2001 | 23.7 | |||
| Payments in 2002 | (0.2 | ) | ||
| Environmental expense in 2002 | 0.1 | |||
| Reduction in estimated indemnified liabilities | (4.5 | ) | ||
| Balance at December 31, 2002 | 19.1 | |||
| Payments in 2003 | (0.1 | ) | ||
| Balance at December 31, 2003 | $ | 19.0 | ||
The Company believes that its environmental accruals are adequate based on currently available information. The Company believes that it is reasonably possible that additional costs may be incurred beyond the amounts accrued as a result of new information, newly discovered conditions or a change in the law. Additionally, as the indemnification from Goodrich extends through 2011, changes in assumptions regarding when costs will be incurred may result in additional expenses to the Company. However, the additional costs, if any, cannot currently be estimated.
F-46
V. Parent Company Financial Statements
As disclosed in Note K, substantially all of the net assets of Noveon, Inc. are restricted from transfer, subject to certain restricted payment provisions, to Noveon International, Inc. As a result, the Company has presented the following condensed financial statements of Noveon International, Inc., the parent company, at December 31, 2003 and 2002 and the years ended December 31, 2003 and 2002 and the ten months ended December 31, 2001 are as follows:
| | | | Ten Months Ended December 31 | |||||||
|---|---|---|---|---|---|---|---|---|---|---|
| | Years Ended December 31 | |||||||||
| Income Statement Data | ||||||||||
| 2003 | 2002 | 2001 | ||||||||
| | (in millions) | |||||||||
| Selling and administrative expenses | $ | — | $ | 1.2 | $ | — | ||||
Operating loss | — | (1.2 | ) | — | ||||||
Interest expense—net | 20.4 | 24.0 | 19.1 | |||||||
| Other income—net | — | (12.4 | ) | — | ||||||
| Income (loss) before income taxes | (20.4 | ) | (12.8 | ) | (19.1 | ) | ||||
| Income tax benefit | — | (1.8 | ) | — | ||||||
| Income (loss) before equity earnings (loss) of Subsidiary | (20.4 | ) | (11.0 | ) | (19.1 | ) | ||||
| Earnings (loss) of subsidiary | 12.5 | 34.7 | (20.6 | ) | ||||||
| Net income (loss) | $ | (7.9 | ) | $ | 23.7 | $ | (39.7 | ) | ||
| Balance Sheet Data | December 31 | |||||
|---|---|---|---|---|---|---|
| 2003 | 2002 | |||||
| | (in millions) | |||||
| ASSETS | ||||||
| Current assets | ||||||
| Cash and cash equivalents | $ | 1.2 | $ | — | ||
| Total current assets | 1.2 | — | ||||
Investment in Subsidiary | 585.0 | 499.7 | ||||
| Other assets | 3.8 | 1.8 | ||||
| Total assets | $ | 590.0 | $ | 501.5 | ||
| LIABILITIES AND STOCKHOLDERS' EQUITY | ||||||
| Current liabilities | ||||||
| Accrued expenses and other current liabilities | $ | 9.2 | $ | 7.5 | ||
| Total current liabilities | 9.2 | 7.5 | ||||
Long-term debt | 165.9 | 145.2 | ||||
| Payable to Subsidiary | 2.6 | 2.3 | ||||
Total stockholders' equity | 412.3 | 346.5 | ||||
| Total liabilities and stockholders' equity | $ | 590.0 | $ | 501.5 | ||
F-47
| | | | Ten Months Ended December 31 | |||||||
|---|---|---|---|---|---|---|---|---|---|---|
| | Years Ended December 31 | |||||||||
| Cash Flow Data | ||||||||||
| 2003 | 2002 | 2001 | ||||||||
| | (in millions) | |||||||||
| Operating activities | ||||||||||
| Net cash provided by operating activities | $ | 0.2 | $ | 0.8 | $ | — | ||||
Investing activities | ||||||||||
| Payments made in connection with acquisitions, net of cash acquired | — | — | (527.0 | ) | ||||||
| Net cash (used) by investing activities | — | — | (527.0 | ) | ||||||
Financing activities | ||||||||||
| Proceeds from issuance of long-term debt | — | — | 172.0 | |||||||
| Repayments of seller note | — | (49.8 | ) | — | ||||||
| Equity contribution from stockholder | — | — | 355.0 | |||||||
| Issuance of common stock | 1.2 | — | 4.0 | |||||||
| Redemption of common stock | (0.2 | ) | — | — | ||||||
| Dividend from Subsidiary | — | 45.0 | — | |||||||
| Net cash provided (used) by financing activities | 1.0 | (4.8 | ) | 531.0 | ||||||
| Net increase (decrease) in cash and cash equivalents | 1.2 | (4.0 | ) | 4.0 | ||||||
| Cash and cash equivalents at beginning of period | — | 4.0 | — | |||||||
| Cash and cash equivalents at end of period | $ | 1.2 | $ | — | $ | 4.0 | ||||
F-48
W. Quarterly Financial Data (Unaudited)
Summary data relating to the results of operations for each quarter of the years ended December 31, 2003 and 2002 follows:
| | First Quarter | Second Quarter | Third Quarter | Fourth Quarter | |||||||||
|---|---|---|---|---|---|---|---|---|---|---|---|---|---|
| | (in millions, except per share amounts) | ||||||||||||
| 2003 | |||||||||||||
| Net sales | $ | 282.3 | $ | 294.0 | $ | 278.8 | $ | 280.8 | |||||
| Gross profit | 81.8 | 85.8 | 79.3 | 79.6 | |||||||||
| Restructuring and severance costs | 2.0 | 1.1 | 0.5 | 9.6 | |||||||||
| Operating income | 25.8 | 30.7 | 25.3 | 12.0 | |||||||||
| Income (loss) before cumulative effect of accounting change | 1.0 | 5.6 | 0.5 | (14.5 | ) | ||||||||
| Cumulative effect of accounting change—net of tax | (0.5 | ) | — | — | — | ||||||||
| Net income (loss) | 0.5 | 5.6 | 0.5 | (14.5 | ) | ||||||||
Net income (loss) per share—basic | $ | 0.14 | $ | 1.56 | $ | 0.14 | $ | (4.02 | ) | ||||
| Net income (loss) per share—diluted | $ | 0.14 | $ | 1.54 | $ | 0.14 | $ | (4.02 | ) | ||||
| | First Quarter | Second Quarter | Third Quarter | Fourth Quarter | |||||||||
|---|---|---|---|---|---|---|---|---|---|---|---|---|---|
| | (in millions, except per share amounts) | ||||||||||||
2002 | |||||||||||||
| Net sales | $ | 259.4 | $ | 280.9 | $ | 273.2 | $ | 255.8 | |||||
| Gross profit | 82.4 | 94.6 | 89.0 | 76.5 | |||||||||
| Restructuring and severance costs | 0.1 | 1.7 | 1.1 | 3.2 | |||||||||
| Operating income | 29.4 | 38.3 | 33.1 | 18.9 | |||||||||
| Other expense (income) (1) | 0.1 | (1.3 | ) | 0.1 | (8.9 | ) | |||||||
| Net income | 2.4 | 10.7 | 6.0 | 4.6 | |||||||||
Net income per share—basic | $ | 0.67 | $ | 2.97 | $ | 1.67 | $ | 1.28 | |||||
| Net income per share—diluted | $ | 0.67 | $ | 2.97 | $ | 1.67 | $ | 1.28 | |||||
- (1)
- Other expense (income) includes gains of $1.2 million and $11.2 million in the second and fourth quarters, respectively, relating to the early extinguishment of debt. See Note K.
F-49
PART II
INFORMATION NOT REQUIRED IN PROSPECTUS
ITEM 13. OTHER EXPENSES OF ISSUANCE AND DISTRIBUTION
The following table sets forth the expenses expected to be incurred in connection with the issuance and distribution of common stock registered hereby (other than underwriting discounts and compensation), all of which expenses, except for the Securities and Exchange Commission registration fee, the National Association of Securities Dealers, Inc. filing fee, and the New York Stock Exchange listing application fee, are estimated.
| Securities and Exchange Commission registration fee | $ | 43,712 | ||
| National Association of Securities Dealers, Inc. filing fee | 30,500 | |||
| The New York Stock Exchange listing application fee | * | |||
| Printing and engraving fees and expenses | * | |||
| Legal fees and expenses | * | |||
| Accounting fees and expenses | * | |||
| Blue Sky fees and expenses | * | |||
| Transfer Agent and Registrar fees and expenses | 5,000 | |||
| Miscellaneous expenses | * | |||
| Total | $ | * | ||
- *
- To be filed by amendment.
All expenses incurred in connection with the issuance and distribution of the common stock registered hereby (other than underwriting discounts and compensation), including shares of common stock of certain stockholders of the Registrant, will be borne by the Registrant.
ITEM 14. INDEMNIFICATION OF DIRECTORS AND OFFICERS
The Amended and Restated Certificate of Incorporation and Restated By-Laws of the Registrant provide that the directors and officers of the Registrant shall be indemnified by the Registrant to the fullest extent authorized by Delaware law, as it now exists or may in the future be amended, against all expenses and liabilities reasonably incurred in connection with service for or on behalf of the Registrant.
Policies of insurance are maintained by the Registrant under which its directors and officers are insured, within the limits and subject to the limitations of the policies, against certain expenses in connection with the defense of, and certain liabilities which might be imposed as a result of, actions, suits or proceedings to which they are parties by reason of being or having been such directors or officers.
The Company and Noveon, Inc. will enter into agreements with their respective directors and certain officers, which will indemnify such directors and officers against certain liabilities.
AEA, DLJ Merchant Banking and MidOcean indemnify certain of the Registrant's directors, whom they have designated to the Registrant's Board of Directors, or officers from liabilities arising in connection with each such designee's position as a director or officer of the Registrant.
The form of Underwriting Agreement filed as Exhibit 1.1 hereto provides for the indemnification of the Registrant, its controlling persons, its directors and certain of its officers by the underwriters and
II-1
the selling stockholders against certain liabilities, including liabilities under the Securities Act of 1933 (the "Securities Act").
Insofar as indemnification for liabilities arising under the Securities Act may be permitted to directors, officers or persons controlling the Registrant pursuant to the foregoing provisions, the Registrant has been informed that in the opinion of the Securities and Exchange Commission such indemnification is against public policy as expressed in the Securities Act and is therefore unenforceable.
ITEM 15. RECENT SALES OF UNREGISTERED SECURITIES
During the three years preceding the filing of this registration statement, the Registrant has not sold securities without registration under the Securities Act, except as described below.
In February 2001, in connection with the Registrant's initial capitalization, the Registrant issued 1,500,000 shares of common stock to DLJMB Funding III, Inc. for an aggregate purchase price of $150,000,000; 500,000 shares of common stock to MidOcean Capital/PMD Investors, LLC, formerly known as DB Capital/PMD Investors LLC, for an aggregate purchase price of $50,000,000; 1,361,215 shares of common stock to PMD Investors II LLC for an aggregate purchase price of $136,121,500; and 188,785 shares of common stock to PMD Investors I LLC for an aggregate purchase price of $18,878,500. These issuances were exempt from registration under the Securities Act pursuant to Section 4(2) thereof because they did not involve a public offering as the shares were offered and sold to only four entities.
In November 2001, pursuant to the Registrant's employee stock purchase plan, the Registrant sold 10,000 shares of common stock to Steven J. Demetriou in exchange for a full recourse note of $1.0 million with a term of 10 years and an interest rate of 7% per annum; 5,000 shares of common stock to the H. William Lichtenberger Flint™ Trust dated July 20, 2001 for $500,000; 7,000 shares of common stock to T. J. Dermot Dunphy for $700,000; 2,500 shares of common stock to William B. Sedlacek for 250,000; 2,000 shares of common stock to Sarah R. Coffin for $200,000; 1,500 shares of common stock to Kumar Shah for $150,000; 1,250 shares of common stock to Michael D. Friday for $125,000; 1,000 shares of common stock to Christopher R. Clegg for $100,000; 1,000 shares of common stock to Sean M. Stack for $100,000; 500 shares of common stock to Sandra P. Sarni for $50,000; and 18,615 shares of common stock at $100 per share to 106 employees of the Registrant. These issuances were exempt from registration under the Securities Act pursuant to Rule 701 thereof because the shares were offered pursuant to a compensatory benefit plan.
In July 2003, pursuant to the Registrant's employee stock purchase plan, the Registrant sold 3,000 shares of common stock to T.J. Dermot Dunphy for $441,000; 1,000 shares of common stock to Cornelis K. Verhaar for $147,000; 500 shares of common stock to Sandra P. Sarni for $73,500; 300 shares of common stock to Sean M. Stack for $44,100; and 3,218 shares of common stock at $147 per share to 63 employees of the Registrant. These issuances were exempt from registration under the Securities Act pursuant to Rule 701 thereof because the shares were offered pursuant to a compensatory benefit plan.
No other sales of our securities have taken place within the last three years.
II-2
ITEM 16. EXHIBITS AND FINANCIAL STATEMENT SCHEDULES
- (a)
- Exhibits
The following exhibits are filed with this registration statement.
| No. | Description | |
|---|---|---|
1.1 | Form of Underwriting Agreement, by and among Noveon International, Inc., the selling stockholders named therein and the underwriters named therein.** | |
| 2.1 | Agreement for Sale and Purchase of Assets, dated as of November 28, 2001, by and between The B.F.Goodrich Company and PMD Group Inc., filed as Exhibit 2.1 to Noveon, Inc.'s Registration Statement on Form S-4 filed on May 29, 2001 (Commission File No. 333-61812) ("Registration Statement No. 333-61812"), and incorporated herein by reference.+ | |
| 3.1 | Amended and Restated Certificate of Incorporation of Noveon International, Inc.** | |
| 3.2 | Restated By-Laws of Noveon International, Inc.** | |
| 4.1 | Indenture, dated February 28, 2001, by and between PMD Group Inc., the Guarantors party thereto and Wells Fargo Bank Minnesota, National Association, as trustee, filed as Exhibit 4.1 to Registration Statement No. 333-61812, and incorporated herein by reference. | |
| 4.2 | First Supplemental Indenture by and among Noveon, Inc., the Guarantors party thereto and Wells Fargo Bank, National Association, as trustee.** | |
| 4.3 | Forms of 11% Senior Subordinated Notes due 2011, Series A Notes (contained in Exhibit 4.1 as Exhibit A and B thereto, respectively), filed as Exhibit 4.2 to Registration Statement No. 333-61812, and incorporated herein by reference. | |
| 4.4 | Form of Guarantee (contained in Exhibit 4.1 as Exhibit E thereto), filed as Exhibit 4.3 to Registration Statement No. 333-61812, and incorporated herein by reference. | |
| 4.5 | Form of stock certificate of Noveon International, Inc.** | |
| 4.6 | Form of 13% Senior Subordinated Note due August 13, 2011.** | |
| 4.7 | Senior Subordinated Note Registration Rights and Cooperation Agreement, dated as of February 28, 2001, between PMD Group Holdings Inc. and The B.F.Goodrich Company.** | |
| 5.1 | Form of opinion of Fried, Frank, Harris, Shriver & Jacobson LLP.* | |
| 10.1 | Amended and Restated Management Agreement, dated June 26, 2001, between Noveon, Inc. and DLJ Merchant Banking III, Inc., filed as Exhibit 10.1 to Noveon, Inc.'s Form 10-K for the year ended December 31, 2001 (Commission File No. 333-61812), and incorporated herein by reference. | |
| 10.2 | Management Agreement, dated February 5, 2001, between PMD Group Inc. and DB Capital/PMD Investors, LLC, filed as Exhibit 10.2 to Registration Statement No. 333-61812, and incorporated herein by reference. | |
| 10.3 | Management Agreement, dated February 5, 2001, between PMD Group Inc. and AEA Investors Inc, filed as Exhibit 10.3 to Registration Statement No. 333-61812, and incorporated herein by reference. | |
| 10.4 | Advisory Services Agreement, dated as of February 5, 2001, by and between PMD Group Inc. and Credit Suisse First Boston Corporation, filed as Exhibit 10.4 to Registration Statement No. 333-61812, and incorporated herein by reference.+ | |
| 10.5 | Assignment of Management Agreements by and between Noveon International, Inc. and Noveon, Inc.** | |
II-3
| 10.6 | Termination Agreement by and between Noveon International, Inc. and DLJ Merchant Banking III, Inc., for Amended and Restated Management Agreement, dated February 5, 2001.** | |
| 10.7 | Termination Agreement by and between Noveon International, Inc. and MidOcean Capital/PMD Investors, LLC, for Management Agreement, dated February 5, 2001.** | |
| 10.8 | Termination Agreement by and between Noveon International, Inc. and AEA Investors LLC, for Management Agreement, dated February 5, 2001.** | |
| 10.9 | Termination Agreement by and between Noveon International, Inc. and Credit Suisse First Boston LLC, for Advisory Services Agreement, dated February 5, 2001.** | |
| 10.10 | Credit Agreement by and among PMD Group Inc., PMD Group Holdings Inc., Bankers Trust Company and Credit Suisse First Boston, dated as of February 28, 2001, filed as Exhibit 10.5 to Registration Statement No. 333-61812, and incorporated herein by reference.+ | |
| 10.11 | First Amendment to Credit Agreement by and among Noveon International, Inc., Noveon, Inc., Deutsche Bank Trust Company Americas, Credit Suisse First Boston and the financial institutions signatory thereto dated as of October 31, 2002, filed as Exhibit 10.6 to Noveon, Inc.'s Form 10-K for the year ended December 31, 2002 (Commission File No. 333-61812), and incorporated herein by reference. | |
| 10.12 | Second Amendment to Credit Agreement by and among Noveon International, Inc., Noveon, Inc., Deutsche Bank Trust Company Americas, Credit Suisse First Boston and the financial institutions signatory thereto dated as of July 10, 2003, filed as Exhibit 10.1 to Noveon, Inc.'s Form 10-Q/A for the quarter ended June 30, 2003 (Commission File No. 333-61812), and incorporated herein by reference. | |
| 10.13 | Tax Sharing Agreement by and between PMD Group Holdings Inc. and PMD Group Inc., dated as of February 28, 2001, filed as Exhibit 10.6 to Registration Statement No. 333-61812, and incorporated herein by reference. | |
| 10.14 | Settlement Agreement and Release between Goodrich Corporation and Noveon, Inc. dated June 28, 2002, filed as Exhibit 10.12 to Noveon, Inc.'s Form 10-Q/A for the quarter ended June 30, 2002 (Commission File No. 333-61812), and incorporated herein by reference. | |
| 10.15 | Employment Agreement, dated March 9, 2001, between PMD Group Holdings Inc., PMD Group Inc., and Steven J. Demetriou, filed as Exhibit 10.8 to Registration Statement No. 333-61812, and incorporated herein by reference.+ | |
| 10.16 | Amendment No. 1 to Employment Agreement, dated February 24, 2004, by and among Noveon International, Inc. and Steven J. Demetriou.** | |
| 10.17 | Promissory Note dated November 30, 2001 between Steven J. Demetriou as maker and Noveon Holdings, Inc. as payee, filed as Exhibit 10.13 to Noveon, Inc.'s Form 10-K for the year ended December 31, 2002 (Commission File No. 333-61812), and incorporated herein by reference. | |
| 10.18 | Security Agreement dated November 30, 2001 between Steven J. Demetriou as pledgee and Noveon Holdings, Inc. as pledgor, filed as Exhibit 10.14 to Noveon, Inc.'s Form 10-K for the year ended December 31, 2002 (Commission File No. 333-61812), and incorporated herein by reference. | |
| 10.19 | Assignment effective as of November 30, 2001 between Noveon Holdings, Inc. as assignor and Noveon, Inc. as assignee, filed as Exhibit 10.15 to Noveon, Inc.'s Form 10-K for the year ended December 31, 2002 (Commission File No. 333-61812), and incorporated herein by reference. | |
| 10.20 | Noveon International, Inc. Amended and Restated Stock Option Plan, filed as Exhibit 10.14 to Noveon, Inc.'s Form 10-K for the year ended December 31, 2003 (Commission File No. 333-61812), and incorporated herein by reference. | |
II-4
| 10.21 | Noveon, Inc. Special Deferred Compensation Plan (First Restatement effective November 1, 2002), filed as Exhibit 10.11 to Noveon, Inc.'s Form 10-K for the year ended December 31, 2002 (Commission File No. 333-61812), and incorporated herein by reference. | |
| 10.22 | Noveon, Inc. Management Incentive Plan, filed as Exhibit 10.1 to Noveon, Inc.'s Form 10-Q for the quarter ended March 31, 2003 (Commission File No. 333-61812), and incorporated herein by reference.+ | |
| 10.23 | Employment Agreement, dated January 1, 2003, between Noveon Sales Holland BV and K. Verhaar, filed as Exhibit 10.17 to Noveon, Inc.'s Form 10-K for year ended December 31, 2003 (Commission File No. 333-61812), and incorporated herein by reference. | |
| 10.24 | Amended and Restated Stockholders Agreement by and among Noveon International, Inc., PMD Investors I LLC, PMD Investors II LLC, DLJ Merchant Partners III, L.P. and MidOcean Capital/PMD Investors LLC.** | |
| 10.25 | Management Stockholders Agreement by and among Noveon Holdings, Inc., PMD Investors I LLC, PMD Investors II LLC, DLJMB Funding III, Inc., DLJ Offshore Partners III, C.V., DLJ ESC II, L.P., DLJ Merchant Banking Partners III, L.P., DB Capital/PMD Investors LLC and the Executives named therein, dated as of October 31, 2001.** | |
| 10.26 | Noveon International, Inc. Second Amended and Restated Employee Stock Purchase Plan, dated February 25, 2003.** | |
| 10.27 | Noveon International, Inc. 2004 Equity Incentive Plan.** | |
| 10.28 | Form of Indemnification Agreement for Directors and Officers.** | |
| 21.1 | Subsidiaries of the Company.*** | |
| 23.1 | Consent of Ernst & Young LLP (independent auditors).* | |
| 23.2 | Consent of Fried, Frank, Harris, Shriver and Jacobson LLP (included in Exhibit 5.1).* | |
| 24.1 | Powers of Attorney.*** |
- +
- We agree to furnish supplementary to the Commission a copy of any omitted schedule to such agreement upon the request of the Commission in accordance with Item 601(b)(2) of Regulation S-K.
- *
- Filed herewith.
- **
- To be filed by amendment.
- ***
- Previously filed.
(b) Financial Statement Schedules
All schedules not identified above have been omitted because they are not required, are not applicable or the information is included in the selected consolidated financial data or notes contained in this Registration Statement.
ITEM 17. UNDERTAKINGS
(a) The undersigned registrant hereby undertakes to provide to the underwriters at the closing specified in the underwriting agreement, certificates in such denominations and registered in such names as required by the underwriters to permit prompt delivery to each purchaser.
(b) Insofar as indemnification for liabilities arising under the Securities Act may be permitted to directors, officers and controlling persons of the registrant pursuant to the foregoing provisions, or
II-5
otherwise, the registrant has been advised that in the opinion of the Securities and Exchange Commission such indemnification is against public policy as expressed in the Securities Act and is, therefore, unenforceable. In the event that a claim for indemnification against such liabilities (other than the payment by the registrant of expenses incurred or paid by the director, officer or controlling person of the registrant in the successful defense of any action, suit or proceeding) is asserted by such director, officer or controlling person in connection with the securities being registered, the registrant will, unless in the opinion of its counsel the matter has been settled by controlling precedent, submit to a court of appropriate jurisdiction the question whether such indemnification by it is against public policy as expressed in the Securities Act and will be governed by the final adjudication of such issue.
(c) The undersigned registrant hereby undertakes that:
(1) For purposes of determining any liability under the Securities Act, the information omitted from the form of prospectus filed as part of this registration statement in reliance upon Rule 430A and contained in a form of prospectus filed by the registrant pursuant to Rule 424(b)(1) or (4) or 497(h) under the Securities Act shall be deemed to be part of this registration statement as of the time it was declared effective.
(2) For the purpose of determining any liability under the Securities Act, each post-effective amendment that contains a form of prospectus shall be deemed to be a new registration statement relating to the securities offered therein, and the offering of such securities at that time shall be deemed to be the initial bona fide offering thereof.
II-6
Pursuant to the requirements of the Securities Act of 1933, the registrant has duly caused this amendment to the registration statement to be signed on its behalf by the undersigned, thereunto duly authorized, in the City of Cleveland, State of Ohio, on the 24th day of March, 2004.
| NOVEON INTERNATIONAL, INC. | |||
By: | /s/ CHRISTOPHER R. CLEGG Christopher R. Clegg Senior Vice President, General Counsel and Secretary | ||
Pursuant to the requirements of the Securities Act of 1933, this registration statement has been signed below by the following persons in the capacities indicated.
| Signature | | Date | ||
|---|---|---|---|---|
| * Steven J. Demetriou | Director, Chief Executive Officer and President (principal executive officer) | March 24, 2004 | ||
* Michael D. Friday | Executive Vice President and Chief Financial Officer (principal financial officer) | March 24, 2004 | ||
* Scott A. McKinley | Vice President and Controller (principal accounting officer) | March 24, 2004 | ||
* Sean M. Stack | Vice President and Treasurer | March 24, 2004 | ||
* H. William Lichtenberger | Chairman of the Board | March 24, 2004 | ||
* T.J. Dermot Dunphy | Director | March 24, 2004 | ||
* John L. Garcia | Director | March 24, 2004 | ||
II-7
* Brian R. Hoesterey | Director | March 24, 2004 | ||
* Vincent A. Sarni | Director | March 24, 2004 | ||
* Susan C. Schnabel | Director | March 24, 2004 | ||
* James E. Virtue | Director | March 24, 2004 |
*By: | /s/ CHRISTOPHER R. CLEGG Christopher R. Clegg Attorney-in-fact |
II-8
| No. | Description | |
|---|---|---|
1.1 | Form of Underwriting Agreement, by and among Noveon International, Inc., the selling stockholders named therein and the underwriters named therein.** | |
| 2.1 | Agreement for Sale and Purchase of Assets, dated as of November 28, 2001, by and between The B.F.Goodrich Company and PMD Group Inc., filed as Exhibit 2.1 to Noveon, Inc.'s Registration Statement on Form S-4 filed on May 29, 2001 (Commission File No. 333-61812) ("Registration Statement No. 333-61812"), and incorporated herein by reference.+ | |
| 3.1 | Amended and Restated Certificate of Incorporation of Noveon International, Inc.** | |
| 3.2 | Restated By-Laws of Noveon International, Inc.** | |
| 4.1 | Indenture, dated February 28, 2001, by and between PMD Group Inc., the Guarantors party thereto and Wells Fargo Bank Minnesota, National Association, as trustee, filed as Exhibit 4.1 to Registration Statement No. 333-61812, and incorporated herein by reference. | |
| 4.2 | First Supplemental Indenture by and among Noveon, Inc., the Guarantors party thereto and Wells Fargo Bank, National Association, as trustee.** | |
| 4.3 | Forms of 11% Senior Subordinated Notes due 2011, Series A Notes (contained in Exhibit 4.1 as Exhibit A and B thereto, respectively), filed as Exhibit 4.2 to Registration Statement No. 333-61812, and incorporated herein by reference. | |
| 4.4 | Form of Guarantee (contained in Exhibit 4.1 as Exhibit E thereto), filed as Exhibit 4.3 to Registration Statement No. 333-61812, and incorporated herein by reference. | |
| 4.5 | Form of stock certificate of Noveon International, Inc.** | |
| 4.6 | Form of 13% Senior Subordinated Note due August 13, 2011.** | |
| 4.7 | Senior Subordinated Note Registration Rights and Cooperation Agreement, dated as of February 28, 2001, between PMD Group Holdings Inc. and The B.F.Goodrich Company.** | |
| 5.1 | Opinion of Fried, Frank, Harris, Shriver & Jacobson LLP.* | |
| 10.1 | Amended and Restated Management Agreement, dated June 26, 2001, between Noveon, Inc. and DLJ Merchant Banking III, Inc., filed as Exhibit 10.1 to Noveon, Inc.'s Form 10-K for the year ended December 31, 2001 (Commission File No. 333-61812), and incorporated herein by reference. | |
| 10.2 | Management Agreement, dated February 5, 2001, between PMD Group Inc. and DB Capital/PMD Investors, LLC, filed as Exhibit 10.2 to Registration Statement No. 333-61812, and incorporated herein by reference. | |
| 10.3 | Management Agreement, dated February 5, 2001, between PMD Group Inc. and AEA Investors Inc, filed as Exhibit 10.3 to Registration Statement No. 333-61812, and incorporated herein by reference. | |
| 10.4 | Advisory Services Agreement, dated as of February 5, 2001, by and between PMD Group Inc. and Credit Suisse First Boston Corporation, filed as Exhibit 10.4 to Registration Statement No. 333-61812, and incorporated herein by reference.+ | |
| 10.5 | Assignment of Management Agreements by and between Noveon International, Inc. and Noveon, Inc.** | |
| 10.6 | Termination Agreement by and between Noveon International, Inc. and DLJ Merchant Banking III, Inc., for Amended and Restated Management Agreement, dated February 5, 2001.** | |
| 10.7 | Termination Agreement by and between Noveon International, Inc. and MidOcean Capital/PMD Investors, LLC, for Management Agreement, dated February 5, 2001.** | |
| 10.8 | Termination Agreement by and between Noveon International, Inc. and AEA Investors LLC, for Management Agreement, dated February 5, 2001.** | |
| 10.9 | Termination Agreement by and between Noveon International, Inc. and Credit Suisse First Boston LLC, for Advisory Services Agreement, dated February 5, 2001.** | |
| 10.10 | Credit Agreement by and among PMD Group Inc., PMD Group Holdings Inc., Bankers Trust Company and Credit Suisse First Boston, dated as of February 28, 2001, filed as Exhibit 10.5 to Registration Statement No. 333-61812, and incorporated herein by reference.+ | |
| 10.11 | First Amendment to Credit Agreement by and among Noveon International, Inc., Noveon, Inc., Deutsche Bank Trust Company Americas, Credit Suisse First Boston and the financial institutions signatory thereto dated as of October 31, 2002, filed as Exhibit 10.6 to Noveon, Inc.'s Form 10-K for the year ended December 31, 2002 (Commission File No. 333-61812), and incorporated herein by reference. | |
| 10.12 | Second Amendment to Credit Agreement by and among Noveon International, Inc., Noveon, Inc., Deutsche Bank Trust Company Americas, Credit Suisse First Boston and the financial institutions signatory thereto dated as of July 10, 2003, filed as Exhibit 10.1 to Noveon, Inc.'s Form 10-Q/A for the quarter ended June 30, 2003 (Commission File No. 333-61812), and incorporated herein by reference. | |
| 10.13 | Tax Sharing Agreement by and between PMD Group Holdings Inc. and PMD Group Inc., dated as of February 28, 2001, filed as Exhibit 10.6 to Registration Statement No. 333-61812, and incorporated herein by reference. | |
| 10.14 | Settlement Agreement and Release between Goodrich Corporation and Noveon, Inc. dated June 28, 2002, filed as Exhibit 10.12 to Noveon, Inc.'s Form 10-Q/A for the quarter ended June 30, 2002 (Commission File No. 333-61812), and incorporated herein by reference. | |
| 10.15 | Employment Agreement, dated March 9, 2001, between PMD Group Holdings Inc., PMD Group Inc., and Steven J. Demetriou, filed as Exhibit 10.8 to Registration Statement No. 333-61812, and incorporated herein by reference.+ | |
| 10.16 | Amendment No. 1 to Employment Agreement, dated February 24, 2004, by and among Noveon International Inc., Noveon, Inc. and Steven J. Demetriou.** | |
| 10.17 | Promissory Note dated November 30, 2001 between Steven J. Demetriou as maker and Noveon Holdings, Inc. as payee, filed as Exhibit 10.13 to Noveon, Inc.'s Form 10-K for the year ended December 31, 2002 (Commission File No. 333-61812), and incorporated herein by reference. | |
| 10.18 | Security Agreement dated November 30, 2001 between Steven J. Demetriou as pledgee and Noveon Holdings, Inc. as pledgor, filed as Exhibit 10.14 to Noveon, Inc.'s Form 10-K for the year ended December 31, 2002 (Commission File No. 333-61812), and incorporated herein by reference. | |
| 10.19 | Assignment effective as of November 30, 2001 between Noveon Holdings, Inc. as assignor and Noveon, Inc. as assignee, filed as Exhibit 10.15 to Noveon, Inc.'s Form 10-K for the year ended December 31, 2002 (Commission File No. 333-61812), and incorporated herein by reference. | |
| 10.20 | Noveon International, Inc. Amended and Restated Stock Option Plan, filed as Exhibit 10.14 to Noveon, Inc.'s Form 10-K for the year ended December 31, 2003 (Commission File No. 333-61812), and incorporated herein by reference. | |
| 10.21 | Noveon, Inc. Special Deferred Compensation Plan (First Restatement effective November 1, 2002), filed as Exhibit 10.11 to Noveon, Inc.'s Form 10-K for the year ended December 31, 2002 (Commission File No. 333-61812), and incorporated herein by reference. | |
| 10.22 | Noveon, Inc. Management Incentive Plan, filed as Exhibit 10.1 to Noveon, Inc.'s Form 10-Q for the quarter ended March 31, 2003 (Commission File No. 333-61812), and incorporated herein by reference.+ | |
| 10.23 | Employment Agreement, dated January 1, 2003, between Noveon Sales Holland BV and K. Verhaar, filed as Exhibit 10.17 to Noveon, Inc.'s Form 10-K for year ended December 31, 2003 (Commission File No. 333-61812), and incorporated herein by reference. | |
| 10.24 | Amended and Restated Stockholders Agreement by and among Noveon International, Inc., PMD Investors I LLC, PMD Investors II LLC, DLJ Merchant Banking Partners III, L.P. and MidOcean Capital/PMD Investors LLC.** | |
| 10.25 | Management Stockholders Agreement by and among Noveon Holdings, Inc., PMD Investors I LLC, PMD Investors II LLC, DLJMB Funding III, Inc., DLJ Offshore Partners III, C.V., DLJ ESC II, L.P., DLJ Merchant Banking Partners III, L.P., DB Capital/PMD Investors LLC and the Executives named therein, dated as of October 31, 2001.** | |
| 10.26 | Noveon International, Inc. Second Amended and Restated Employee Stock Purchase Plan, dated February 25, 2002.** | |
| 10.27 | Noveon International, Inc. 2004 Equity Incentive Plan.** | |
| 10.28 | Form of Indemnification Agreement for Directors and Officers.** | |
| 21.1 | Subsidiaries of the Company.*** | |
| 23.1 | Consent of Ernst & Young LLP (independent auditors).* | |
| 23.2 | Consent of Fried, Frank, Harris, Shriver and Jacobson LLP (included in Exhibit 5.1).* | |
| 24.1 | Powers of Attorney.*** |
- +
- We agree to furnish supplementary to the Commission a copy of any omitted schedule to such agreement upon the request of the Commission in accordance with Item 601(b)(2) of Regulation S-K.
- *
- Filed herewith.
- **
- To be filed by amendment.
- ***
- Previously filed.
TABLE OF CONTENTS
Dealer Prospectus Delivery Obligation
PROSPECTUS SUMMARY
THE OFFERING
SUMMARY CONSOLIDATED FINANCIAL AND OTHER DATA
RISK FACTORS
Risks Related to Our Business
Risks Related to this Offering
CAUTIONARY NOTE REGARDING FORWARD-LOOKING STATEMENTS
USE OF PROCEEDS
DIVIDEND POLICY
CAPITALIZATION
DILUTION
SELECTED CONSOLIDATED FINANCIAL AND OTHER DATA
MANAGEMENT'S DISCUSSION AND ANALYSIS OF FINANCIAL CONDITION AND RESULTS OF OPERATIONS
BUSINESS
MANAGEMENT
Directors and Executive Officers
Summary Compensation Table
Option Grants in Fiscal Year 2003(1)
Aggregate Option Exercises and Option Values
CERTAIN RELATIONSHIPS AND RELATED TRANSACTIONS
PRINCIPAL AND SELLING STOCKHOLDERS
DESCRIPTION OF OUR INDEBTEDNESS
DESCRIPTION OF CAPITAL STOCK
SHARES ELIGIBLE FOR FUTURE SALE
CERTAIN UNITED STATES FEDERAL TAX CONSIDERATIONS FOR NON-UNITED STATES HOLDERS
UNDERWRITING
LEGAL MATTERS
EXPERTS
WHERE YOU CAN FIND MORE INFORMATION
Noveon International, Inc. Years Ended December 31, 2003, 2002 and Period of Ten Months Ended December 31, 2001 and BFGoodrich Performance Materials (The Predecessor Company and a Segment of The BFGoodrich Company) Period of Two Months Ended February 28, 2001
Consolidated Financial Statements
Index
Report of Independent Auditors
Report of Independent Auditors
Noveon International, Inc. and BFGoodrich Performance Materials (The Predecessor Company and a Segment of The BFGoodrich Company) Consolidated Statement of Operations (dollars in millions, except per share amounts)
Noveon International, Inc. Consolidated Balance Sheet (dollars in millions, except share amounts)
Noveon International, Inc. and BFGoodrich Performance Materials (The Predecessor Company and a Segment of The BFGoodrich Company) Consolidated Statement of Cash Flows (dollars in millions)
Noveon International, Inc. and BFGoodrich Performance Materials (The Predecessor Company and a Segment of The BFGoodrich Company) Consolidated Statement of Cash Flows (dollars in millions)
Noveon International, Inc. and BFGoodrich Performance Materials (The Predecessor Company and a Segment of The BFGoodrich Company) Consolidated Statement of Stockholders' Equity and BFGoodrich Investment (dollars in millions)
Noveon International, Inc. and BFGoodrich Performance Materials (The Predecessor Company and a Segment of The BFGoodrich Company) Notes to Consolidated Financial Statements
PART II INFORMATION NOT REQUIRED IN PROSPECTUS
SIGNATURES
EXHIBIT INDEX