 ALAMOS GOLD INC.
Management’s Discussion and Analysis
(in United States dollars, unless otherwise stated)
For the three and nine months ended September 30, 2020
 ALAMOS GOLD INC.
For the Three and Nine Months Ended September 30, 2020
Table of Contents
| Overview of the Business | |
| Highlight Summary | |
| Third Quarter 2020 Highlights | |
| Management's Response to the COVID-19 Pandemic | |
| Business Developments | |
| Outlook and Strategy | |
| Young-Davidson Mine ("Young-Davidson") | |
| Island Gold Mine ("Island Gold") | |
| Mulatos Mine ("Mulatos") | |
| Third Quarter 2020 Development Activities | |
| Third Quarter 2020 Exploration Activities | |
| Key External Performance Drivers | |
| Summarized Financial and Operating Results | |
| Review of Third Quarter Financial Results | |
| Review of Nine Months Financial Results | |
| Consolidated Expenses and Other | |
| Consolidated Income Tax Expense | |
| Financial Condition | |
| Liquidity and Capital Resources | |
| Outstanding Share Data | |
| Related Party Transactions | |
| Off-Balance Sheet Arrangements | |
| Financial Instruments | |
| Summary of Quarterly Financial and Operating Results | |
| Non-GAAP Measures and Additional GAAP Measures | |
| Accounting Estimates, Policies and Changes | |
| Internal Control over Financial Reporting | |
| Changes in Internal Control over Financial Reporting | |
| Disclosure Controls | |
| Limitations of Controls and Procedures | |
| Cautionary Note to United States Investors | |
| Cautionary Note Regarding Forward-Looking Statements | |
2020 Management’s Discussion and Analysis | ||
This Management’s Discussion and Analysis (“MD&A”), dated October 27, 2020, relates to the financial condition and results of the consolidated operations of Alamos Gold Inc. (“Alamos” or the “Company”), and should be read in conjunction with the Company’s consolidated financial statements for the year ended December 31, 2019 and unaudited condensed consolidated interim financial statements for the three and nine months ended September 30, 2020, and notes thereto. The financial statements have been prepared in accordance with International Financial Reporting Standards as issued by the International Accounting Standards Board (“IFRS” or “GAAP”). All results are presented in United States dollars (“US dollars” or “$”), unless otherwise stated.
Statements are subject to the risks and uncertainties identified in the Cautionary Note Regarding Forward-Looking Statements section of this document. United States investors are also advised to refer to the section entitled Cautionary Note to United States Investors on page 34.
Overview of the Business
Alamos is a Canadian-based intermediate gold producer with diversified North American production from the Young-Davidson and the Island Gold mines in northern Ontario, Canada and the Mulatos mine in Sonora State, Mexico. In addition, Alamos has a significant portfolio of development stage projects in Canada, Mexico, Turkey, and the United States. Alamos employs more than 1,700 people and is committed to the highest standards of sustainable development and ethical business practices.
The Company’s common shares are listed on the Toronto Stock Exchange (TSX: AGI) and the New York Stock Exchange (NYSE: AGI). Further information about Alamos can be found in the Company’s regulatory filings, including the Company's Annual Information Form, available on SEDAR at www.sedar.com, on EDGAR at www.sec.gov, and on the Company’s website at www.alamosgold.com.
 3
32020 Management’s Discussion and Analysis | ||
Highlight Summary
| Three Months Ended September 30, | Nine Months Ended September 30, | |||||||||||
| 2020 | 2019 | 2020 | 2019 | |||||||||
| Financial Results (in millions) | ||||||||||||
| Operating revenues | $218.4 | $172.9 | $521.5 | $497.1 | ||||||||
Cost of sales (1) | $122.6 | $127.3 | $346.2 | $385.4 | ||||||||
| Earnings from operations | $88.0 | $37.5 | $146.3 | $84.4 | ||||||||
| Earnings before income taxes | $85.9 | $37.4 | $132.4 | $85.1 | ||||||||
| Net earnings | $67.9 | $17.7 | $67.3 | $58.1 | ||||||||
Adjusted net earnings (2) | $56.9 | $23.4 | $96.2 | $51.4 | ||||||||
Earnings before interest, depreciation and amortization (2) | $130.5 | $78.4 | $248.1 | $208.0 | ||||||||
Cash provided by operations before working capital and cash taxes(2) | $130.0 | $80.2 | $256.4 | $211.4 | ||||||||
| Cash provided by operating activities | $130.8 | $67.9 | $237.0 | $182.6 | ||||||||
Capital expenditures (sustaining) (2) | $22.7 | $17.8 | $54.6 | $53.5 | ||||||||
Capital expenditures (growth) (2) (3) | $29.2 | $44.2 | $109.3 | $125.5 | ||||||||
Capital expenditures (capitalized exploration) (4) | $2.9 | $4.3 | $8.8 | $11.7 | ||||||||
| Operating Results | ||||||||||||
| Gold production (ounces) | 117,100 | 121,900 | 306,400 | 372,400 | ||||||||
| Gold sales (ounces) | 116,035 | 119,392 | 302,494 | 367,554 | ||||||||
| Per Ounce Data | ||||||||||||
| Average realized gold price | $1,882 | $1,448 | $1,724 | $1,352 | ||||||||
| Average spot gold price (London PM Fix) | $1,909 | $1,472 | $1,735 | $1,362 | ||||||||
Cost of sales per ounce of gold sold (includes amortization) (1) | $1,057 | $1,066 | $1,144 | $1,049 | ||||||||
Total cash costs per ounce of gold sold (2) | $681 | $730 | $772 | $720 | ||||||||
All-in sustaining costs per ounce of gold sold (2) | $949 | $950 | $1,052 | $944 | ||||||||
| Share Data | ||||||||||||
| Earnings per share, basic and diluted | $0.17 | $0.05 | $0.17 | $0.15 | ||||||||
Adjusted earnings per share, basic and diluted(2) | $0.15 | $0.06 | $0.25 | $0.13 | ||||||||
| Weighted average common shares outstanding (basic) (000’s) | 391,553 | 390,593 | 391,325 | 389,852 | ||||||||
Financial Position (in millions) | ||||||||||||
Cash and cash equivalents (5) | $274.1 | $182.8 | ||||||||||
Debt and financing obligations (5) | $100.0 | — | ||||||||||
(1) | Cost of sales includes mining and processing costs, royalties, and amortization expense. For the three months and nine months ended September 30, 2020, cost of sales also includes COVID-19 costs of $nil and $6.5 million, respectively |
(2) | Refer to the “Non-GAAP Measures and Additional GAAP Measures” disclosure at the end of this MD&A for a description and calculation of these measures |
(3) | Includes growth capital from operating sites and excludes the Island Gold royalty repurchase of $54.8 million completed in March 2020 |
(4) | Includes capitalized exploration at Mulatos and Island Gold |
(5) | Comparative cash and cash equivalents and debt and financing obligations balance as at December 31, 2019. The Company repaid the $100 million debt balance in October 2020 |
42020 Management’s Discussion and Analysis | ||
| Three Months Ended September 30, | Nine Months Ended September 30, | |||||||||||
| 2020 | 2019 | 2020 | 2019 | |||||||||
| Gold production (ounces) | ||||||||||||
| Young-Davidson | 36,400 | 50,000 | 88,200 | 140,000 | ||||||||
| Mulatos | 41,100 | 32,700 | 119,600 | 107,900 | ||||||||
| Island Gold | 39,600 | 36,700 | 97,800 | 111,800 | ||||||||
El Chanate (1) | — | 2,500 | 800 | 12,700 | ||||||||
| Gold sales (ounces) | ||||||||||||
| Young-Davidson | 35,548 | 48,430 | 86,893 | 137,091 | ||||||||
| Mulatos | 41,165 | 31,164 | 118,592 | 107,369 | ||||||||
| Island Gold | 39,322 | 37,209 | 97,009 | 110,094 | ||||||||
El Chanate (1) | — | 2,589 | — | 13,000 | ||||||||
Cost of sales (in millions)(2) | ||||||||||||
| Young-Davidson | $50.5 | $57.7 | $140.5 | $171.7 | ||||||||
| Mulatos | $44.0 | $33.5 | $127.5 | $103.1 | ||||||||
| Island Gold | $28.1 | $32.0 | $78.2 | $93.0 | ||||||||
El Chanate (1) | $— | $4.1 | $— | $17.6 | ||||||||
| Cost of sales per ounce of gold sold (includes amortization) | ||||||||||||
| Young-Davidson | $1,421 | $1,191 | $1,617 | $1,252 | ||||||||
| Mulatos | $1,069 | $1,075 | $1,075 | $960 | ||||||||
| Island Gold | $715 | $860 | $806 | $845 | ||||||||
El Chanate (1) | $— | $1,584 | $— | $1,354 | ||||||||
Total cash costs per ounce of gold sold (3) | ||||||||||||
| Young-Davidson | $923 | $781 | $1,145 | $813 | ||||||||
| Mulatos | $746 | $866 | $772 | $772 | ||||||||
| Island Gold | $394 | $503 | $438 | $490 | ||||||||
El Chanate (1) | $— | $1,429 | $— | $1,254 | ||||||||
Mine-site all-in sustaining costs per ounce of gold sold (3),(4) | ||||||||||||
| Young-Davidson | $1,196 | $960 | $1,370 | $1,033 | ||||||||
| Mulatos | $928 | $979 | $928 | $861 | ||||||||
| Island Gold | $575 | $693 | $653 | $658 | ||||||||
El Chanate (1) | — | $1,506 | $— | $1,277 | ||||||||
Capital expenditures (sustaining, growth and capitalized exploration) (in millions)(3) | ||||||||||||
| Young-Davidson | $25.6 | $23.9 | $82.2 | $72.9 | ||||||||
Mulatos(5) | $9.1 | $12.9 | $21.6 | $44.7 | ||||||||
Island Gold (6) | $15.9 | $13.8 | $53.9 | $44.2 | ||||||||
| Other | $4.2 | $15.7 | $15.0 | $28.9 | ||||||||
(1) | El Chanate transitioned to the reclamation phase of the mine life in the fourth quarter of 2019. Incremental production is a result of rinsing the leach pad. Gold sales from El Chanate in 2020 are not included in revenue and cost of sales. |
(2) | Cost of sales includes mining and processing costs, royalties and amortization. |
(3) | Refer to the “Non-GAAP Measures and Additional GAAP Measures” disclosure at the end of this MD&A for a description and calculation of these measures. |
(4) | For the purposes of calculating mine-site all-in sustaining costs, the Company does not include an allocation of corporate and administrative and share based compensation expenses. |
(5) | Includes capitalized exploration at Mulatos of $nil and $0.7 million for the three and nine months ended September 30, 2020 (spending of $nil for the three and nine months ended September 30, 2019). |
(6) | Includes capitalized exploration at Island Gold of $2.9 million and $8.1 million for the three and nine months ended September 30, 2020 (for the three and nine months ended September 30, 2019 - $4.3 million and $11.7 million), and excludes the royalty repurchase of $54.8 million. |
52020 Management’s Discussion and Analysis | ||
2020 Highlights
Third Quarter 2020
| • | Generated record quarterly free cash flow1 of $76.0 million driven by higher margins at all operations |
| • | Announced a 33% increase in the dividend to an annual rate of US$0.08 per share, starting with the dividend payable in December 2020. The increase is supported by the record free cash flow in the quarter and strong outlook. With the December dividend, the Company will have returned $31.0 million to shareholders in the form of dividends and share repurchases under the Company's Normal Course Issuer Bid ("NCIB") in 2020 |
| • | Produced 117,100 ounces of gold, a 49% increase from the second quarter of 2020 with production returning to budgeted levels following the temporary suspension of operations at Island Gold and Mulatos in the second quarter due to COVID-19 |
| • | Year-to-date the Company has produced 306,400 ounces of gold and remains well positioned to achieve revised full year guidance of 405,000 to 435,000 ounces of gold |
| • | Island Gold produced a record 39,600 ounces of gold and generated record mine-site free cash flow1 of $40.8 million, benefiting from higher grades mined in the quarter |
| • | Mulatos produced 41,100 ounces of gold and generated mine-site free cash flow1 of $30.9 million, driven by lower total cash costs |
| • | Following the completion of the lower mine expansion at Young-Davidson in July, underground mining rates increased to average 6,713 tonnes per day ("tpd") for the quarter and remain on track to achieve 7,500 tpd by the end of 2020 |
| • | Sold 116,035 ounces of gold at an average realized price of $1,882 per ounce for revenues of $218.4 million |
| • | Generated record cash flow from operating activities of $130.8 million ($130.0 million, or $0.33 per share, before changes in working capital1), a 62% increase from the third quarter of 2019 |
| • | Consolidated total cash costs1 of $681 per ounce and all-in sustaining costs ("AISC")1 of $949 per ounce both decreased significantly from the first half of the year and were lower than revised guidance. The Company remains on track to achieve full year cost guidance |
| • | Reported record adjusted net earnings1 of $56.9 million, or $0.15 per share1, which includes adjustments for unrealized foreign exchange gains of $10.7 million recorded within deferred taxes and foreign exchange, and other one-time gains of $0.3 million. Adjusted net earnings increased 143% compared to the third quarter of 2019 |
| • | Realized record net earnings of $67.9 million, or $0.17 per share |
| • | Ended the quarter with cash and cash equivalents of $274.1 million and equity securities of $40.0 million. Subsequent to quarter-end, the Company repaid $100.0 million outstanding on its revolving credit facility and is currently debt-free |
| • | Reported results of the Phase III Expansion Study conducted on Island Gold, which is expected to drive a 72% increase in average annual production to 236,000 ounces and a 30% decrease in mine-site AISC to $534 per ounce starting in 2025 |
| • | Announced a construction decision on the low-cost, high-return La Yaqui Grande project. The project has a 58% after-tax internal rate of return ("IRR") at a $1,750 per ounce gold price and is expected to significantly reduce Mulatos District costs with mine-site AISC expected to average $578 per ounce over the life of the project |
.(1) Refer to the “Non-GAAP Measures and Additional GAAP Measures” disclosure at the end of this MD&A for a description and calculation of these measures.
62020 Management’s Discussion and Analysis | ||
Management's Response to the COVID-19 Pandemic
The World Health Organization declared COVID-19 a pandemic on March 11, 2020. The Company responded rapidly and proactively and implemented several initiatives to help protect the health and safety of our employees, their families and the communities in which we operate.
Specifically, each of our operating mine sites has activated established crisis management plans and developed site-specific plans that enable them to meet and respond to changing conditions associated with COVID-19. The Company is adopting the advice of public health authorities and adhering to government regulations with respect to COVID-19 in the jurisdictions in which it operates.
The following measures have been instituted across the Company to prevent the potential spread of the virus:
| • | Medical screening for all personnel prior to entry to site for symptoms of COVID-19 |
| • | Testing of personnel at Mulatos and Island Gold prior to starting their rotation at the camp |
| • | Training on proper hand hygiene and social distancing |
| • | Remote work options have been implemented for eligible employees |
| • | Social distancing practices have been implemented for all meetings, huddles and transportation |
| • | Mandatory use of personal protective equipment for employees where social distancing is not practicable |
| • | Rigid camp and site hygiene protocols have been instituted and are being followed |
| • | Elimination of all non-essential business travel |
| • | Required 14-day quarantine for any employees returning from out of country travel |
| • | In addition, since the COVID-19 pandemic began the Company’s teams in Canada, Mexico, and Turkey have donated their time, medical supplies, food supplies and funds to help combat the effects and spread of the virus |
Impact on Operations
In order to protect nearby communities and align with government requirements, two of the Company's mines were temporarily suspended earlier in the year, but resumed normal operations during the second quarter. During the temporary suspensions, indirect production costs that exceeded normal operating capacity were expensed as incurred and not included in the inventory valuation. The Company identified indirect production costs of $5.4 million that were directly expensed as COVID-19 costs as incurred in the second quarter of 2020 and not included in inventory. All operating costs incurred subsequent to the mine sites, returning to planned operating levels have been included in mining and processing costs. As a result, there were no amounts classified as COVID-19 costs for the three months ended September 30, 2020.
In July 2020, the Company provided updated production and cost guidance resulting from the impact of COVID-19 on the operations. With operations at Mulatos and Island Gold having both been suspended for more than a month and the completion of the lower mine expansion at Young-Davidson delayed into July due to COVID-19, consolidated 2020 production guidance was revised to 405,000 to 435,000 ounces.
In the third quarter of 2020, both Island Gold and Mulatos continued to incur additional costs related to testing of personnel, lodging and transportation, which have been included in mining and processing costs rather than COVID-19 costs. These incremental costs have increased total cash costs at these operations by approximately $25 per ounce. These additional costs are expected to be incurred throughout the fourth quarter and into 2021.
72020 Management’s Discussion and Analysis | ||
2020 Business Developments
Dividend increased 33% starting in December 2020
On October 28, 2020, the Company announced a 33% increase in its dividend to an annual rate of US$0.08 with the next quarterly dividend to be paid in December 2020. The increase is supported by the record free cash flow of $76 million generated in the third quarter of 2020 and aligned with the Company's long-term capital allocation strategy of increasing returns to shareholders, supported by higher free cash flow. Since 2018, the Company has increased its dividend by 300% reflecting its strong free cash flow outlook.
Completion of Lower Mine Expansion at Young-Davidson
On July 8, 2020, the Company announced that it had completed the lower mine expansion at Young-Davidson with the successful commissioning of the Northgate shaft. In addition to the Northgate shaft, all related infrastructure including the underground crusher and conveyor system have been successfully commissioned. Mining rates increased to average over 6,700 tpd in the third quarter and are expected to ramp up to 7,500 tpd by the end of 2020. This is expected to drive strong free cash flow growth at Young-Davidson and company-wide.
Island Gold Phase III Expansion Study
On July 14, 2020, the Company reported results of the positive Phase III Expansion Study conducted on its Island Gold mine. Based on the results of the study, the Company is proceeding with an expansion of the operation to 2,000 tpd (“Shaft Expansion”). This follows a detailed evaluation of several scenarios which demonstrated the Shaft Expansion as the best option, having the strongest economics, being the most efficient and productive, and the best positioned to capitalize on further growth in Mineral Reserves and Resources.
Phase III Expansion Study Highlights – Shaft Expansion
| • | Average annual gold production of 236,000 ounces per year starting in 2025 upon completion of the shaft. This represents a 72% increase from the mid-point of initial 2020 production guidance |
| • | Industry low average total cash costs of $403 per ounce of gold and mine-site AISC of $534 per ounce starting in 2025, a 19% and 30% decrease from the mid-point of initial 2020 guidance, respectively |
| • | After-tax net present value (“NPV”) of $1.02 billion at a 5% discount rate and an after-tax internal rate of return (“IRR”) of 17%, using a base case gold price assumption of $1,450 per ounce and a USD/CAD foreign exchange rate of $0.75:1 |
| • | After-tax NPV of $1.45 billion and an after-tax IRR of 22%, at a 5% discount rate using a gold price assumption of $1,750 per ounce and a USD/CAD foreign exchange rate of $0.75:1 |
| • | Mine life of 16 years, double the current eight year Mineral Reserve life. This is based on a mineable Mineral Resource of 9.6 million tonnes grading 10.45 grams per tonne of gold (“g/t Au”) containing 3.2 million ounces |
| • | Lowest combined capital and operating costs of all scenarios evaluated |
Construction of La Yaqui Grande
On July 28, 2020, the Company reported results of the positive internal economic study completed on its fully permitted La Yaqui Grande project located in the Mulatos District in Sonora, Mexico. La Yaqui Grande is located approximately 7 kilometres (straight line) from the existing Mulatos operation and adjacent to the past producing La Yaqui Phase I operation. Given the project’s strong economics and its proximity to the existing Mulatos operation, the Company proceeded with construction of the project in the third quarter of 2020.
La Yaqui Grande Project Highlights:
| • | Average annual gold production of 123,000 ounces per year starting in the third quarter of 2022. This will replace higher cost production from the main Mulatos pit, keeping combined production at approximately 150,000 ounces per year |
| • | Mine-site all-in sustaining costs of $578 per ounce, significantly reducing Mulatos District all-in sustaining costs from the mid-point of previous 2020 guidance of $960 per ounce |
| • | After-tax NPV of $165 million at a 5% discount rate and an after-tax IRR of 41%, using a base case gold price assumption of $1,450 per ounce and a MXN/USD foreign exchange rate of 21:1 |
| • | After-tax NPV of $260 million and an after-tax IRR of 58% at a 5% discount rate using a gold price assumption of $1,750 per ounce and a MXN/USD foreign exchange rate of 21:1 |
| • | Mine life of five years, extending production from the Mulatos District to 2027, based on current Mineral Reserves |
| • | Initial capital of $137 million to be spent over a two year period starting in the second half of 2020. At a $1,750 per ounce gold price, Mulatos is expected to self finance the development of La Yaqui Grande following which the operation is expected to generate strong free cash flow |
82020 Management’s Discussion and Analysis | ||
Credit Facility
In 2019, the Company secured amendments to its existing undrawn revolving credit facility (the "Facility"), including an increase in the size of the Facility from $400.0 million to $500.0 million, expiring on December 17, 2023. The Facility bears interest at a rate of Libor plus 1.875% on drawn amounts and stand-by fees of 0.42% on undrawn amounts.
In the first quarter of 2020 the Company drew $100.0 million from the Facility to strengthen its cash position and enhance financial flexibility in light of COVID-19. The debt remained outstanding at September 30, 2020. Given the strong free cash flow outlook, the Company repaid the $100.0 million from existing cash in October 2020. The Company is currently debt free.
Repurchase of 3% NSR Royalty on Island Gold mine
In March 2020, the Company acquired and cancelled a 3% NSR royalty payable from certain claims at the Island Gold mine for cash consideration of $54.8 million. Transaction highlights include:
| • | Acquisition and cancellation of the royalty on all future gold production from the Goudreau Lake claims that comprise the majority of the Island Gold deposit. As of December 31, 2019, these claims contained 0.9 million ounces of Mineral Reserves, representing 71% of Island Gold’s total Mineral Reserves, and 1.1 million ounces of Inferred Mineral Resources |
| • | A $45 per ounce, or 8%, decrease in Island Gold’s 2020 total cash cost and mine-site all-in sustaining guidance based on production guidance provided in December 2019 |
| • | Increased exposure to Island Gold’s substantial exploration potential with combined Mineral Reserves and Resources having doubled to 2.0 million ounces within these claims since the end of 2016 |
| • | Reduction in effective NSR royalty rate on Island Gold’s Mineral Reserves from approximately 4.4% to 2.2% |
92020 Management’s Discussion and Analysis | ||
Outlook and Strategy
| 2020 Updated Guidance | ||||||
| Young-Davidson | Island Gold | Mulatos | Other (2) | Total | Pre COVID-19 Guidance | |
Gold production (000’s ounces) | 135 - 145 | 130 - 140 | 140 - 150 | 405 - 435 | 425 - 465 | |
Cost of sales, including amortization (in millions)(4) | $209 | $113 | $165 | — | $487 | $491 |
Cost of sales, including amortization ($ per ounce)(4) | $1,490 | $840 | $1,135 | — | $1,160 | $1,103 |
Total cash costs ($ per ounce)(1)(5) | $990 - $1,030 | $480 - $520 | $840 - $880 | — | $780 - $820 | $757 - $797 |
All-in sustaining costs ($ per ounce)(1)(5) | $1,030 - $1,070 | $1,007 - $1,047 | ||||
Mine-site all-in sustaining costs ($ per ounce)(1)(3)(5) | $1,180 - $1,220 | $740 - $780 | $940 - $980 | — | ||
Amortization costs ($ per ounce)(1) | $480 | $340 | $275 | — | $365 | $340 |
Capital expenditures (in millions) | ||||||
Sustaining capital(1) | $30 - $35 | $35 - $40 | $15 - $20 | $— | $80-$95 | $80-$95 |
Growth capital(1) | $45 - $50 | $35 - $40 | $15 - $20 | $10 | $105 - $120 | $75-$85 |
Capitalized exploration(1) | $1 | $15 | $— | $4 | $20 | $25 |
Total capital expenditures and capitalized exploration(1) | $76 - 86 | $85 - 95 | $30 - 40 | $14 | $205 - $235 | $180 - $205 |
(1) | Refer to the "Non-GAAP Measures and Additional GAAP" disclosure at the end of this MD&A for a description of these measures. |
(2) | Includes growth capital and capitalized exploration at the Company's development projects (Turkey, Lynn Lake, Esperanza and Quartz Mountain). |
(3) | For the purposes of calculating mine-site all-in sustaining costs at individual mine sites, the Company does not include an allocation of corporate and administrative and share based compensation expenses to the mine sites. |
(4) | Cost of sales includes mining and processing costs, royalties, and amortization expense, and is calculated based on the mid-point of guidance. |
(5) | On March 16, 2020, the Company updated previous total cash cost and AISC guidance to reflect the repurchase and cancellation of a royalty at Island Gold. |
The Company’s long-term strategic objective is to generate increasing returns for its shareholders through low-cost production and free cash flow growth from its portfolio of operating mines and development projects. During the third quarter, the Company delivered on several catalysts that form key parts of a transformational year for Alamos and provide the foundation for the Company's strong outlook. These include the announcement of a Phase III expansion at Island Gold, a construction decision on the La Yaqui Grande project, and the completion of the lower mine expansion at Young-Davidson. The latter marked the transition to strong free cash flow growth with all three operations contributing to record free cash flow generation of $76.0 million during the quarter.
The Company expects this strong free cash flow to continue supporting higher dividends while also reinvesting in high return internal growth projects, such as those at Island Gold and Mulatos. These projects will in turn drive free cash flow higher and support growing, sustainable returns to shareholders over the long-term.
The record financial performance in the third quarter reflected higher gold prices and a very strong operational performance with production increasing 49% from the second quarter to 117,100 ounces at significantly lower total cash costs of $681 per ounce. With fourth quarter production expected to be at similar levels, the Company is well positioned to meet 2020 production and cost guidance which had been revised in July given the impact of COVID-19 on the second quarter.
Following the temporary operational suspensions during the second quarter, all of the Company's mines are operating at normal capacity, albeit under strict health and safety protocols. These include regular testing for COVID-19 at a cost of approximately $25 per ounce. These costs are expected to continue through the fourth quarter and into 2021 with the Company's foremost priority being to protect the health and safety of its workforce, their families and communities.
Production increased significantly at Young-Davidson compared to the second quarter following the completion of the lower mine expansion and tie-in of the Northgate shaft. This marked the end of a multi year expansion at Young-Davidson and a step change for the operation. The lower mine infrastructure has been operating as designed since completion in July, with mining rates steadily increasing each month to average over 6,700 tpd for the quarter. The transition to the lower mine infrastructure drove production higher and costs lower, resulting in the operation generating mine-site free cash flow of $10.8 million in the quarter. Mining rates are expected to increase to a rate of 7,500 tpd by the end of 2020, driving strong free cash flow growth from the operation in the fourth quarter and into 2021.
After temporarily suspending operations at Island Gold on March 25, 2020 due to COVID-19, the Company began a phased restart in early May and returned to normal operating levels in June. Strong mining rates continued in the third quarter, averaging 1,200 tpd. Combined with higher grades mined, Island Gold generated record mine-site free cash flow of $40.8 million in the quarter.
102020 Management’s Discussion and Analysis | ||
The Phase III expansion of Island Gold announced in July has outlined a bigger, more profitable, long-life operation. The expansion is expected to increase throughput rates 67% to 2,000 tpd, driving production significantly higher, at industry low costs over a mine life that has doubled to 16 years. This has driven a substantial increase in value with the expanded operation having an estimated after-tax NPV of $1.02 billion at a 5% discount rate and base case gold price of $1,450 per ounce. At a gold price of $1,750 per ounce, the after-tax NPV is $1.45 billion, more than double the acquisition cost.
Exploration programs at Island Gold resumed in June following the temporary suspension, with the focus on continuing to expand mineralization and adding new near mine Mineral Resources. In the third quarter, Island Gold reported the best surface exploration hole to date, with high-grade mineralization intersected across significantly greater widths down-plunge from existing Mineral Resources in Island East (28.97 g/t Au (26.89 g/t cut) over 21.76 m (MH25-04)). The recent results continue to demonstrate the significant potential for additional growth in Mineral Reserves and Resources at the operation.
Mulatos began ramping up to full operations in the latter part of May 2020 after the suspension of mining activities in early April as mandated by the government due to COVID-19. Following the restart, operations ramped up quickly with mining and stacking rates reaching budgeted levels throughout the third quarter. In addition, the impact of the rainy season was minimal, as Mulatos produced 41,100 ounces in the third quarter at significantly lower costs than guidance, generating mine-site free cash flow of $30.9 million.
As announced in July, 2020, the Company is proceeding with development of the high-return La Yaqui Grande project located within the Mulatos District. With an after-tax IRR of 41% and after-tax NPV of $165 million (assuming a $1,450 per ounce gold price), La Yaqui Grande represents the next low-cost source of production at Mulatos. Construction activities on La Yaqui Grande commenced in the third quarter and are expected to ramp up during the fourth quarter of 2020. Construction is expected to take approximately 24 months to complete with initial production in the second half of 2022. Given its lower costs, La Yaqui Grande is expected to drive combined costs across the Mulatos District lower.
The Company submitted its Environmental Impact Statement ("EIS") for the Lynn Lake project in the second quarter and continues along the anticipated two-year permitting process. In Turkey, the Company is pursuing renewal of the mine concession for the Kirazli project.
The Company's liquidity position remains strong, ending the quarter with $274.1 million of cash and cash equivalents and $100.0 million drawn on its $500.0 million revolving facility. Given the strong free cash flow outlook, the Company repaid the $100.0 million drawn on its revolving facility in October 2020, and is currently debt-free. The Company expects strong ongoing free cash flow generation in the fourth quarter and into 2021, and remains well positioned to fund its internal growth initiatives.
112020 Management’s Discussion and Analysis | ||
Young-Davidson
The Young-Davidson mine is located near the town of Matachewan in Northern Ontario, Canada. The property consists of contiguous mineral leases and claims totaling 5,587 hectares and is situated on the site of two past producing mines that produced over one million ounces of gold between 1934 and 1957. The Young-Davidson mine declared commercial production in 2013.
Young-Davidson Financial and Operational Review
| Three Months Ended September 30, | Nine Months Ended September 30, | |||||||||||
| 2020 | 2019 | 2020 | 2019 | |||||||||
| Gold production (ounces) | 36,400 | 50,000 | 88,200 | 140,000 | ||||||||
| Gold sales (ounces) | 35,548 | 48,430 | 86,893 | 137,091 | ||||||||
| Financial Review (in millions) | ||||||||||||
| Operating Revenues | $66.7 | $70.2 | $150.1 | $186.2 | ||||||||
Cost of sales (1) | $50.5 | $57.7 | $140.5 | $171.7 | ||||||||
| Earnings from operations | $16.2 | $12.5 | $9.6 | $14.5 | ||||||||
| Cash provided by operating activities | $36.4 | $27.3 | $51.0 | $73.8 | ||||||||
Capital expenditures (sustaining) (2) | $9.6 | $8.6 | $19.3 | $29.8 | ||||||||
Capital expenditures (growth) (2) | $16.0 | $15.3 | $62.9 | $43.1 | ||||||||
Mine-site free cash flow (2) | $10.8 | $3.4 | ($31.2 | ) | $0.9 | |||||||
Cost of sales, including amortization per ounce of gold sold (1) | $1,421 | $1,191 | $1,617 | $1,252 | ||||||||
Total cash costs per ounce of gold sold (2) | $923 | $781 | $1,145 | $813 | ||||||||
Mine-site all-in sustaining costs per ounce of gold sold (2),(3) | $1,196 | $960 | $1,370 | $1,033 | ||||||||
| Underground Operations | ||||||||||||
| Tonnes of ore mined | 617,551 | 607,766 | 1,252,300 | 1,808,613 | ||||||||
| Tonnes of ore mined per day | 6,713 | 6,606 | 4,570 | 6,625 | ||||||||
Average grade of gold (4) | 2.24 | 2.62 | 2.27 | 2.53 | ||||||||
| Metres developed | 3,231 | 2,817 | 9,326 | 8,594 | ||||||||
| Mill Operations | ||||||||||||
| Tonnes of ore processed | 591,544 | 655,443 | 1,451,577 | 1,949,316 | ||||||||
| Tonnes of ore processed per day | 6,430 | 7,124 | 5,298 | 7,140 | ||||||||
Average grade of gold (4) | 2.19 | 2.48 | 2.01 | 2.40 | ||||||||
| Contained ounces milled | 41,598 | 52,233 | 93,959 | 150,409 | ||||||||
| Average recovery rate | 93 | % | 92 | % | 92 | % | 91 | % | ||||
(1) | Cost of sales includes mining and processing costs, royalties and amortization. |
(2) | Refer to the “Non-GAAP Measures and Additional GAAP Measures” disclosure at the end of this MD&A for a description and calculation of these measures. |
(3) | For the purposes of calculating mine-site all-in sustaining costs, the Company does not include an allocation of corporate and administrative and share based compensation expenses. |
(4) | Grams per tonne of gold ("g/t Au"). |
Young-Davidson produced 36,400 ounces of gold in the third quarter of 2020, a decrease from the same period in 2019 due to lower grades mined and lower tonnes processed. This reflects the planned downtime of the Northgate shaft in July to complete the tie-in of the lower mine.
Following completion of the lower mine expansion in July, underground mining rates increased through the quarter to average 6,713 tpd. In September, underground mining rates increased to average 8,000 tpd, with the operation benefiting from significant broken ore inventory built up during the shutdown. This strong performance demonstrates the expanded capacity of the lower-mine infrastructure. Underground mining rates are expected to increase to sustainable rates of 7,500 tpd by the end of 2020. The average mined grade was 2.24 g/t Au in the quarter, lower than full year guidance due to mine sequencing. Grades mined and processed are expected to increase in the fourth quarter.
Mill throughput was 6,430 tpd in the third quarter, a decrease from the same period of 2019 with low grade surface stockpiles having been depleted in the second quarter of 2020. Mining rates temporarily exceeded milling rates in the third quarter during which time excess underground ore was stockpiled. These stockpiles will be processed in the fourth quarter. Mill throughput is expected to equal underground mining rates moving forward. Mill recoveries averaged 93% in the quarter, slightly above the prior year period.
Young-Davidson is on track to meet production guidance of between 135,000 and 145,000 ounces, with higher mining rates and grades mined expected to drive a further increase in production in the fourth quarter. Combined with lower mining costs and capital spending, Young-Davidson is expected to generate substantially higher free cash flow in the fourth quarter of 2020.
122020 Management’s Discussion and Analysis | ||
Financial Review
Third quarter revenues of $66.7 million were 5% lower than the prior year quarter, reflecting a 27% decrease in ounces sold, partially offset by a higher realized gold price. Ounces sold decreased as a result of lower processing rates and lower grades mined in the quarter. Revenues for the first nine months of 2020 were also lower than the prior year period due to the temporary shutdown of the Northgate Shaft to complete the lower mine expansion, which commenced in February and was completed in July 2020.
Cost of sales (which includes mining and processing costs, royalties, and amortization expense) of $50.5 million in the third quarter were lower than the comparative quarter in 2019, due to lower processing rates and lower underground mining costs. Underground mining cost per tonne decreased to $45 CAD per tonne in the quarter, with the operation beginning to realize the efficiencies of operating from the lower mine infrastructure. Cost of sales for the nine months ended September 30, 2020 of $140.5 million were lower than the prior year period mainly due to lower underground mining rates during the tie-in period from February through July 2020.
Total cash costs of $923 per ounce in the third quarter were higher than the comparative period in 2019 due to a 15% reduction in grades mined, but substantially improved from the first half of 2020 when fewer tonnes were mined. In addition, lower grade stockpiled ore, which carries a higher cost per ounce, made up a larger proportion of mill feed compared to the prior year. Mine-site AISC of $1,196 per ounce in the third quarter were higher than the comparative quarter in 2019, reflecting the impact of higher total cash costs. Sustaining capital spending in the quarter was lower than the prior year period, with spending focused on growth projects including the completion of the lower mine expansion and the new TIA-1 tailings facility. Capital expenditures in the quarter included $9.6 million of sustaining capital and $16.0 million of growth capital.
With the transition to the new lower mine infrastructure and the associated reduction in underground mining costs and lower capital, Young-Davidson generated mine-site free cash flow of $10.8 million in the third quarter. Mining rates are anticipated to improve further in the fourth quarter, driving higher production and lower costs which is expected to result in significant free cash flow growth.
132020 Management’s Discussion and Analysis | ||
Island Gold
The Island Gold mine is a high grade, low cost underground mining operation located just east of the town of Dubreuilville, Ontario, Canada, 83km northeast of Wawa. The mine comprises of 831 tenures consisting of patented fee simple and/or patented leasehold mining rights and surface rights claims, mining licenses of occupation and unpatented cell claims covering approximately 9,511 hectares. Alamos holds 100% of all mining titles related to the Island Gold Property. The mine comprises 217 patented, leased and staked claims covering 7,926 hectares. The mine began production in October 2007.
Island Gold Financial and Operational Review
| Three Months Ended September 30, | Nine Months Ended September 30, | |||||||||||
| 2020 | 2019 | 2020 | 2019 | |||||||||
| Gold production (ounces) | 39,600 | 36,700 | 97,800 | 111,800 | ||||||||
| Gold sales (ounces) | 39,322 | 37,209 | 97,009 | 110,094 | ||||||||
| Financial Review (in millions) | ||||||||||||
| Operating Revenues | $74.1 | $54.0 | $167.4 | $149.1 | ||||||||
Cost of sales (1) | $28.1 | $32.0 | $78.2 | $93.0 | ||||||||
| Earnings from operations | $45.9 | $21.6 | $88.7 | $55.3 | ||||||||
| Cash provided by operating activities | $56.7 | $40.6 | $123.5 | $99.3 | ||||||||
Capital expenditures (sustaining) (2) | $7.0 | $7.1 | $20.7 | $18.4 | ||||||||
Capital expenditures (growth) (2) | $6.0 | $2.4 | $25.1 | $14.1 | ||||||||
Capital expenditures (capitalized exploration) (2) | $2.9 | $4.3 | $8.1 | $11.7 | ||||||||
Mine-site free cash flow (2) | $40.8 | $26.8 | $69.6 | $55.1 | ||||||||
Cost of sales, including amortization per ounce of gold sold (1) | $715 | $860 | $806 | $845 | ||||||||
Total cash costs per ounce of gold sold (2) | $394 | $503 | $438 | $490 | ||||||||
Mine-site all-in sustaining costs per ounce of gold sold (2),(3) | $575 | $693 | $653 | $658 | ||||||||
| Underground Operations | ||||||||||||
| Tonnes of ore mined | 111,263 | 89,959 | 298,629 | 277,614 | ||||||||
| Tonnes of ore mined per day ("tpd") | 1,209 | 978 | 1,090 | 1,017 | ||||||||
Average grade of gold (4) | 13.68 | 10.81 | 11.33 | 12.22 | ||||||||
| Metres developed | 1,430 | 1,211 | 4,313 | 4,200 | ||||||||
| Mill Operations | ||||||||||||
| Tonnes of ore processed | 101,447 | 102,564 | 281,082 | 307,364 | ||||||||
| Tonnes of ore processed per day | 1,103 | 1,115 | 1,026 | 1,126 | ||||||||
Average grade of gold (4) | 13.62 | 11.12 | 11.52 | 11.49 | ||||||||
| Contained ounces milled | 44,414 | 36,675 | 104,072 | 113,560 | ||||||||
| Average recovery rate | 97 | % | 97 | % | 97 | % | 97 | % | ||||
(1) | Cost of sales includes mining and processing costs, royalties, COVID-19 costs and amortization. |
(2) | Refer to the “Non-GAAP Measures and Additional GAAP Measures” disclosure at the end of this MD&A for a description and calculation of these measures. |
(3) | For the purposes of calculating mine-site all-in sustaining costs, the Company does not include an allocation of corporate and administrative and share based compensation expenses. |
(4) | Grams per tonne of gold ("g/t Au"). |
Island Gold produced a record 39,600 ounces in the third quarter, an 8% increase from the comparative period in 2019, reflecting higher grades mined and processed. The operation also generated record mine-site free cash flow of $40.8 million driven by a significant reduction in total cash costs to $394 per ounce. For the first nine months of 2020, Island Gold produced 97,800 ounces, and despite the temporary shutdown in the second quarter in response to COVID-19, is well positioned to achieve annual guidance of 130,000 to 140,000 ounces.
Underground mining rates averaged 1,209 tpd in the quarter, a 24% increase from the prior year period and in line with annual guidance of 1,200 tpd. Underground grades mined averaged 13.68 g/t Au, above full year guidance due to mine sequencing with higher grade transverse stopes mined in the quarter. Mined grades are expected to return to full year guided levels in the fourth quarter.
Mill throughput of 1,103 tpd in the third quarter was consistent with the prior year period, but lower than tonnes mined due to unplanned down time. A bearing on the primary ball mill failed prematurely in mid-September, resulting in approximately 8 days of downtime. The bearing was replaced with the mill operating at budgeted levels before the end of September. Mill recoveries of 97% were in line with the prior year quarter and budget.
142020 Management’s Discussion and Analysis | ||
Phase III Expansion Study
On July 14, the Company reported results of the positive Phase III Expansion Study conducted on its Island Gold mine. Based on the results of the study, the Company is proceeding with an expansion of the operation to 2,000 tpd. This follows a detailed evaluation of several scenarios which demonstrated the Shaft Expansion as the best option, having the strongest economics, being the most efficient and productive, and the best positioned to capitalize on further growth in Mineral Reserves and Resources. Highlights of the study include the following:
| • | Average annual gold production of 236,000 ounces per year starting in 2025 upon completion of the shaft. This represents a 72% increase from the mid-point of initial 2020 production guidance |
| • | Industry low average total cash costs of $403 per ounce of gold and mine-site all-in sustaining costs of $534 per ounce starting in 2025, a 19% and 30% decrease from the mid-point of 2020 guidance, respectively |
| • | After-tax net present value (“NPV”) of $1.02 billion at a 5% discount rate and an after-tax internal rate of return (“IRR”) of 17%, using a base case gold price assumption of $1,450 per ounce and a USD/CAD foreign exchange rate of $0.75:1 |
| • | After-tax NPV of $1.45 billion and an after-tax IRR of 22%, at a 5% discount rate using a gold price assumption of $1,750 per ounce and a USD/CAD foreign exchange rate of $0.75:1 |
| • | Mine life of 16 years, double the current eight-year Mineral Reserve life. This is based on a mineable Mineral Resource of 9.6 million tonnes grading 10.45 grams per tonne of gold (“g/t Au”) containing 3.2 million ounces of gold |
| • | Lowest combined capital and operating costs of all scenarios evaluated. Total life of mine capital of $1.07 billion including sustaining capital. Higher life-of-mine growth capital of $514 million with the Shaft Expansion is more than offset by the lowest sustaining capital and operating costs of all scenarios evaluated. |
For the remainder of 2020, the focus will be on progressing permitting and detailed engineering on the shaft and associated infrastructure. This includes the power supply upgrade and planning for the procurement of long lead time items. All of the Shaft Expansion permitting requirements are expected to be completed in 2022.
Financial Review
Island Gold generated revenues of $74.1 million in the third quarter, a 37% increase compared to the prior year period, reflecting a 6% increase in ounces sold, and a significantly higher realized gold price. For the first nine months of 2020, revenues of $167.4 million were higher than the comparative period as higher realized prices were partially offset by lower sales due to the temporary suspension of operations for part of the second quarter.
Cost of sales (includes mining and processing costs, royalties, COVID-19 costs and amortization expense) of $28.1 million in the third quarter were 12% lower than the comparative period of 2019. The decrease was driven by lower unit mining costs, and lower royalty rates following the repurchase of a third-party royalty earlier in the year. This was partially offset by the inclusion of additional expenses in the quarter related to COVID-19 testing, transportation and lodging costs, which have been included in mining and processing costs. All operating costs incurred subsequent to the mine site returning to planned operating levels have been included in mining and processing costs. As a result, there were no amounts classified as COVID-19 costs for the three months ended September 30, 2020. Cost of sales for the first nine months of 2020 of $78.2 million were lower than the prior year for similar reasons.
Total cash costs were $394 per ounce in the third quarter, a 22% decrease from the comparative quarter in 2019, driven by lower unit mining costs, significantly higher grades, and a lower royalty charge per ounce. Mine-site AISC of $575 per ounce in the third quarter were lower than the prior year period driven by the lower total cash costs.
Total capital expenditures were $15.9 million in the third quarter, including capitalized exploration. Spending was focused on lateral development, camp improvements, tailings construction, and the Phase III study. This included $7.0 million of sustaining capital and $8.9 million of growth capital, inclusive of capitalized exploration. Both capital and exploration spending were lower than planned due to the timing of spending, and are expected to increase in the fourth quarter. For the first nine months of the year, capital spending was $53.9 million including capitalized exploration, higher than the prior year period reflecting spending on tailings construction and Phase III engineering.
Earlier in 2020, the Company acquired and canceled a 3% NSR royalty payable on a majority of production from the Island Gold mine for cash consideration of $54.8 million. The royalty was applicable to all future gold production from the Goudreau Lake claims, which comprise the majority of the Island Gold deposit. As of December 31, 2019, these claims contained 0.9 million ounces of Mineral Reserves, representing 71% of Island Gold’s total Mineral Reserves, and 1.1 million ounces of Inferred Mineral Resources. The acquisition of the royalty has reduced total cash costs by $45 per ounce, and has reduced the effective NSR royalty rate on Island Gold’s Mineral Reserves from 4.4% to 2.2%.
Island Gold generated record mine-site free cash flow of $40.8 million during the third quarter and $69.6 million for the first nine months of 2020 despite over one month of downtime due to COVID-19, driven by strong operating margins. The Company expects strong free cash flow to continue in the fourth quarter, though lower than the third quarter due to planned higher capital spending.
152020 Management’s Discussion and Analysis | ||
Mulatos
The Mulatos mine is located within the Salamandra Concessions in the Sierra Madre Occidental mountain range in the State of Sonora, Mexico. The Company controls a total of 28,972 hectares of mineral concessions in proximity to the Mulatos mine. The mine achieved commercial production in 2006. Having produced its two millionth ounce of gold in March 2019, the Mulatos mine is no longer subject to a third-party royalty on production.
Mulatos Financial and Operational Review
| Three Months Ended September 30, | Nine Months Ended September 30, | |||||||||||
| 2020 | 2019 | 2020 | 2019 | |||||||||
| Gold production (ounces) | 41,100 | 32,700 | 119,600 | 107,900 | ||||||||
| Gold sales (ounces) | 41,165 | 31,164 | 118,592 | 107,369 | ||||||||
Financial Review (in millions) | ||||||||||||
| Operating Revenues | $77.6 | $45.1 | $204.0 | $144.7 | ||||||||
Cost of sales (1) | $44.0 | $33.5 | $127.5 | $103.1 | ||||||||
| Earnings from operations | $32.7 | $10.6 | $73.9 | $38.9 | ||||||||
| Cash provided by operating activities | $40.0 | $7.2 | $85.9 | $31.0 | ||||||||
Capital expenditures (sustaining) (2) | $6.1 | $2.1 | $14.6 | $5.3 | ||||||||
Capital expenditures (growth) (2) | $3.0 | $10.8 | $6.3 | $39.4 | ||||||||
Capital expenditures (capitalized exploration) (2) | $— | $— | $0.7 | $— | ||||||||
Mine-site free cash flow (2) | $30.9 | ($5.7 | ) | $64.3 | ($13.7 | ) | ||||||
Cost of sales, including amortization per ounce of gold sold (1) | $1,069 | $1,075 | $1,075 | $960 | ||||||||
Total cash costs per ounce of gold sold (2) | $746 | $866 | $772 | $772 | ||||||||
Mine site all-in sustaining costs per ounce of gold sold (2),(3) | $928 | $979 | $928 | $861 | ||||||||
| Open Pit Operations | ||||||||||||
Tonnes of ore mined - open pit (4) | 1,320,034 | 1,664,898 | 4,370,921 | 5,608,221 | ||||||||
Total waste mined - open pit (6) | 2,130,232 | 1,361,660 | 5,621,000 | 5,036,918 | ||||||||
| Total tonnes mined - open pit | 3,450,266 | 3,026,558 | 9,991,921 | 10,645,139 | ||||||||
| Waste-to-ore ratio (operating) | 0.76 | 0.63 | 0.70 | 0.66 | ||||||||
| Crushing and Heap Leach Operations | ||||||||||||
| Tonnes of ore stacked | 1,894,725 | 1,628,401 | 5,338,725 | 5,466,393 | ||||||||
Average grade of gold processed (5) | 0.91 | 0.81 | 1.17 | 0.92 | ||||||||
| Contained ounces stacked | 55,411 | 42,667 | 201,455 | 161,450 | ||||||||
| Average recovery rate | 74 | % | 77 | % | 59 | % | 67 | % | ||||
| Ore crushed per day (tonnes) - combined | 20,600 | 17,700 | 19,484 | 20,000 | ||||||||
(1) | Cost of sales includes mining and processing costs, royalties, COVID-19 costs and amortization. |
(2) | Refer to the “Non-GAAP Measures and Additional GAAP Measures” disclosure at the end of this MD&A for a description and calculation of these measures. |
(3) | For the purposes of calculating mine-site all-in sustaining costs, the Company does not include an allocation of corporate and administrative and share based compensation expenses. |
(4) | Includes ore stockpiled during the quarter. |
(5) | Grams per tonne of gold ("g/t Au"). |
(6) | Total waste mined includes operating waste and capitalized stripping. |
Mulatos produced 41,100 ounces in the third quarter, 26% higher than the prior year quarter. The increase is primarily due to the contribution of higher grade ore from Cerro Pelon which commenced operations in the fourth quarter of 2019. Production for the first nine months of 2020 was 119,600 ounces.
Total tonnes mined increased slightly compared to the third quarter of 2019, reflecting increased stripping activities at Cerro Pelon and the El Salto portion of the Mulatos pit. Pre-stripping at El Salto and the excess tonnes of waste mined above the life-of-mine waste-to-ore ratio at Cerro Pelon were capitalized in the period. Tonnes of ore mined decreased compared to the prior year period given the additional stripping requirements in the current year.
Total crusher throughput in the third quarter averaged 20,600 tpd for a total of 1,894,725 tonnes stacked at a grade of 0.91 g/t Au. Tonnes stacked in the quarter exceeded tonnes mined due to the processing of SAS stockpiles, and the minimal impact of the rainy season on crusher performance in 2020. Grades stacked were 12% higher than the comparative period of 2019, reflecting the contribution of higher-grade ore from Cerro Pelon. The recovery rate of 74% in the third quarter was in line with budget bringing year-to-date recoveries to 59%. The decrease in recoveries in the current year reflects both the timing of ore stacked on the leach pad, as well as the stacking of some lower recovery SAS ore. The Company expects full year recoveries to be in line with guidance.
162020 Management’s Discussion and Analysis | ||
Financial Review
Third quarter revenues of $77.6 million were 72% higher than the prior year quarter driven by a 32% increase in ounces sold and higher realized gold prices. For the first nine months of 2020, revenues of $204.0 million were 41% higher than the prior year.
Cost of sales (includes mining and processing costs, royalties, COVID-19 costs and amortization expense) of $44.0 million in the third quarter were $10.5 million higher than the prior year quarter. Mining and processing costs were higher due to higher inventory costs associated with an increase in ounces sold, as well as higher mining cost per tonne related to longer haulage distances. Mulatos continued to incur COVID-19 testing, transportation and lodging costs in the third quarter, which have been included in mining and processing costs. All operating costs incurred subsequent to the mine site returning to planned operating levels have been included in mining and processing costs. As a result, there were no amounts classified as COVID-19 costs for the three months ended September 30, 2020. On a per ounce basis, cost of sales decreased in the third quarter of 2020 compared to the prior year period due to higher grades processed, offset by higher depreciation related to Cerro Pelon production. Cost of sales for the first nine months of 2020 of $127.5 million were 24% higher than the prior year.
Total cash costs in the quarter and year-to-date were lower compared to the prior year as a result of higher grades stacked, driven by Cerro Pelon. Total capital spending for the quarter was $9.1 million, of which $6.1 million was sustaining capital primarily relating to capitalized stripping at El Salto and Cerro Pelon. Mine-site AISC of $928 per ounce was lower than the prior year period of $979 per ounce driven by lower total cash costs. Capital spending in 2020 was lower than the comparative period, as 2019 capital included the construction of Cerro Pelon.
Mulatos generated mine-site free cash-flow of $30.9 million in the third quarter, a significant improvement from the prior year period. The increase in cash flow was driven by increased operating margins and higher ounces sold. For the first nine months of 2020, Mulatos generated $64.3 million in free cash flow.
Third Quarter 2020 Development Activities
Mulatos District (Sonora, Mexico)
La Yaqui Grande
On July 28, 2020, the Company reported results of an internal study completed on its fully permitted La Yaqui Grande project located in the Mulatos District in Sonora, Mexico. La Yaqui Grande is located approximately 7 kilometres (straight line) from the existing Mulatos operation and adjacent to the past producing La Yaqui Phase I operation. As with La Yaqui Phase I, La Yaqui Grande will be developed with an independent heap leach pad and crushing circuit. Construction activities began ramping up during the third quarter with initial production expected in the second half of 2022.
La Yaqui Grande Project Highlights:
| • | Average annual gold production of 123,000 ounces per year starting in the third quarter of 2022. This will replace higher cost production from the main Mulatos pit, keeping combined production at approximately 150,000 ounces per year |
| • | Mine-site all-in sustaining costs of $578 per ounce, significantly reducing Mulatos District all-in sustaining costs from the mid-point of previous 2020 guidance of $960 per ounce |
| • | After-tax net present value (“NPV”) of $165 million at a 5% discount rate and an after-tax internal rate of return (“IRR”) of 41%, using a base case gold price assumption of $1,450 per ounce and a MXN/USD foreign exchange rate of 21:1 |
| • | After-tax NPV of $260 million and an after-tax IRR of 58% at a 5% discount rate using a gold price assumption of $1,750 per ounce and a MXN/USD foreign exchange rate of 21:1 |
| • | Mine life of five years, extending production from the Mulatos District to 2027, based on current Mineral Reserves |
| • | Initial capital of $137 million to be spent over a two year period starting in the second half of 2020. At a $1,750 per ounce gold price, Mulatos is expected to self finance the development of La Yaqui Grande following which the operation is expected to generate strong free cash flow |
During the third quarter, the Company incurred $2.3 million ($4.2 million for the first nine months of 2020) focused on detailed engineering, initial camp construction, and clearing and grubbing the pit area. The Company expects to spend approximately $10 million in the fourth quarter of 2020 focused on construction of haul roads and initial stripping activities.
172020 Management’s Discussion and Analysis | ||
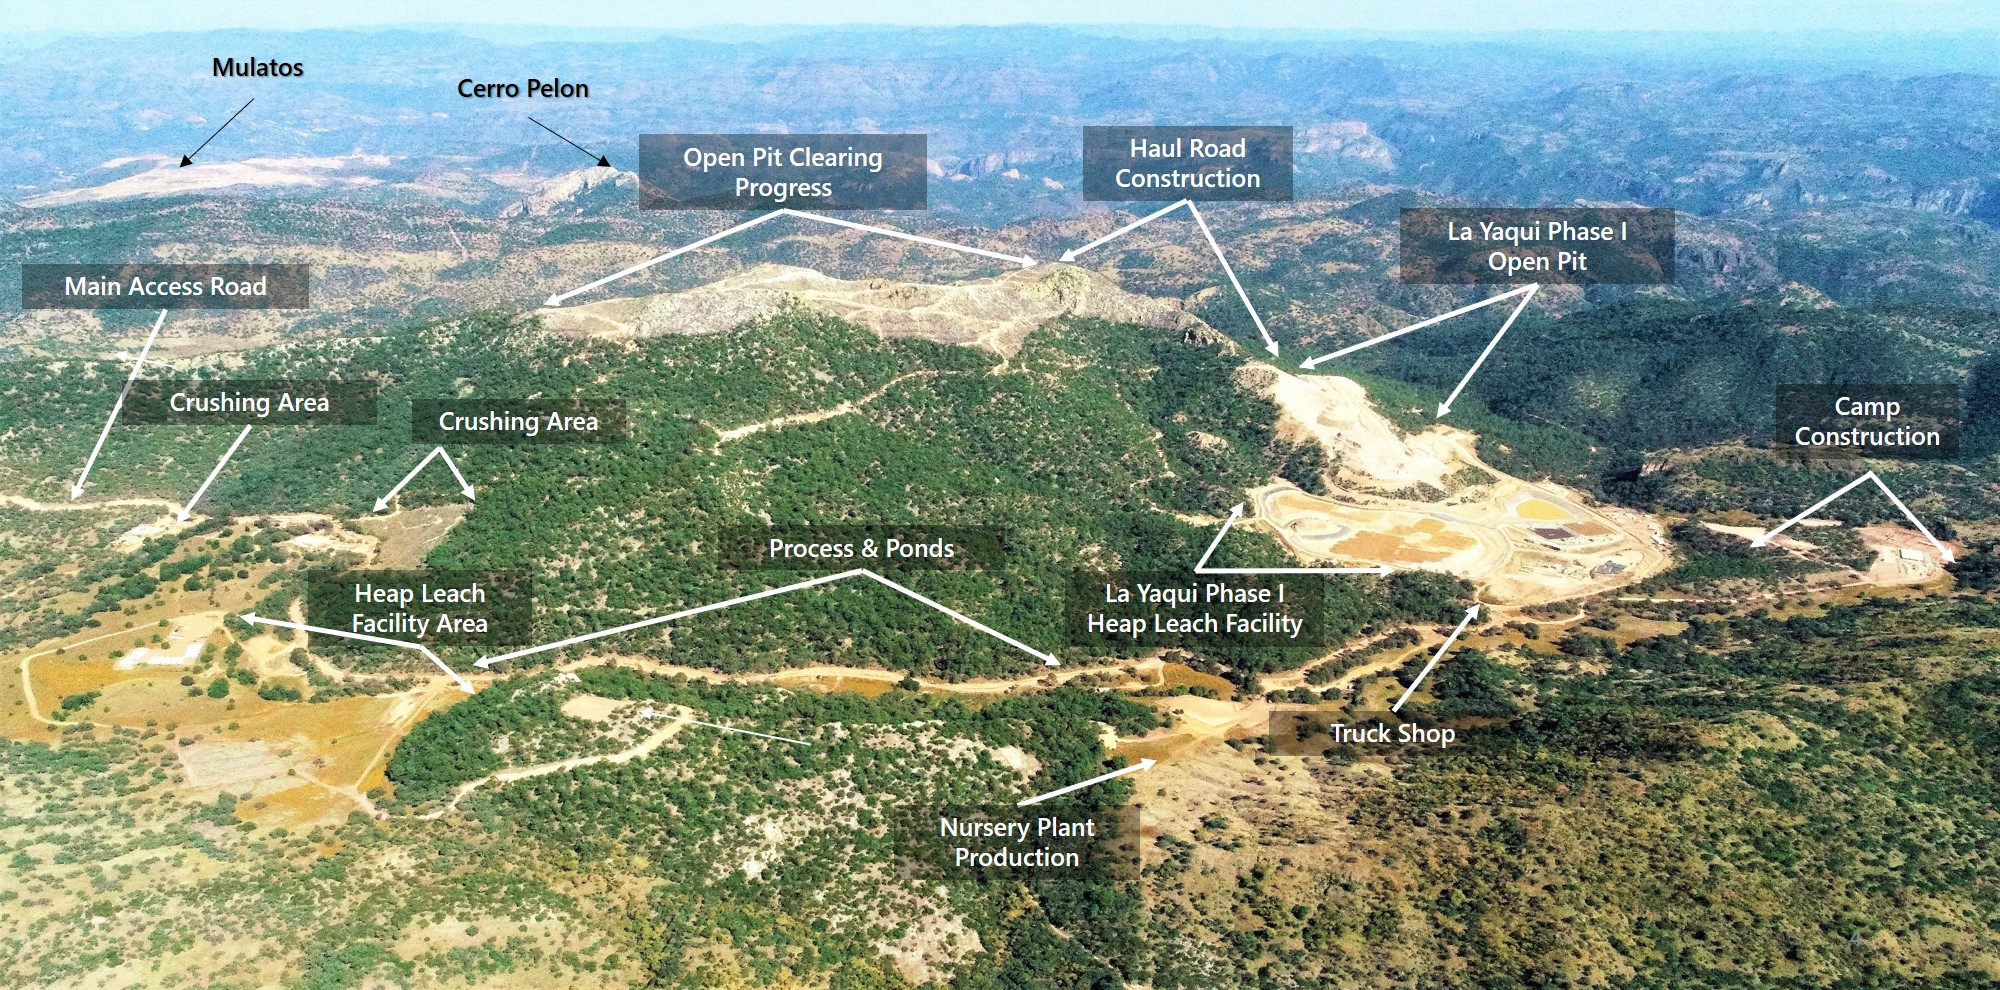
La Yaqui Grande Site Overview
Kirazlı (Çanakkale, Turkey)
On October 14, 2019, the Company suspended all construction activities on its Kirazlı project pending the renewal of its Turkish mining concessions which expired on October 13, 2019. Although the mining concessions have not been revoked and can be renewed following this expiration date, no further construction activities can be completed until the concessions have been renewed.
The Company has met all the regulatory requirements and conditions for the concessions to be renewed and reasonably expected the renewal by the expiration date. The communities local to the Kirazlı project remain supportive. As such, the Company is working with the Turkish Department of Energy and Natural Resources on securing the renewal of the mining concessions which will allow for a resumption of construction activities. The renewal is required from the same government department that granted the Operating Permit for Kirazlı in March 2019. The Company will provide updated guidance on the construction schedule and budget for Kirazlı following the receipt of the concession renewal and resumption of construction activities.
The Company spent $1.3 million at Kirazlı during the third quarter of 2020, and $4.9 million for the first nine months of 2020.
Lynn Lake (Manitoba, Canada)
The Company released a positive Feasibility Study on the Lynn Lake project in December 2017 outlining average annual production of 143,000 ounces over a 10 year mine life at average mine-site all-in sustaining costs of $745 per ounce.
The project economics based on the 2017 Feasibility Study at $1,500 per ounce gold price include an after-tax IRR of 21.5% and an after-tax NPV of $290 million (12.5% IRR at a $1,250 per ounce gold price). During the second quarter of 2020, the Company filed the Environmental Impact Statement ("EIS") with the federal government. The federal and provincial permitting process is expected to take approximately two years, with a construction decision planned for 2022.
Development spending (excluding exploration) was $0.6 million in the third quarter of 2020 and $3.4 million for the first nine months of 2020. Spending earlier in the year was primarily related to baseline work and preparation of the EIS submission.
182020 Management’s Discussion and Analysis | ||
Third Quarter 2020 Exploration Activities
Island Gold (Ontario, Canada)
The 2020 exploration drilling program is focused on continuing to expand the down-plunge and lateral extensions of the Island Gold deposit with the objective of adding new near mine Mineral Resources across the two-kilometre long Island Gold Main Zone.
Underground diamond drilling program continued through the third quarter with four drill rigs currently operating, including two focused on underground directional drilling. The surface directional diamond drilling program resumed in early June, after being suspended in April 2020 due to COVID-19, with three surface diamond drill rigs active throughout the third quarter.
An initial 4,000 m regional exploration program is also planned in the fourth quarter of 2020 focused on evaluating and advancing exploration targets outside the main Island Gold Mine area on the 9,511-hectare Island Gold Property.
Surface exploration drilling
A total of 5,539 m was completed in six holes during the third quarter as part of the surface directional drilling program. Directional drilling targeted areas peripheral to the Inferred Mineral Resource blocks below the 1,000 m level, with drill hole spacing ranging from 75 m to 100 m. The area that was targeted by the surface directional drill program extends approximately 2,000 m in strike length between the 1,000 m and 1,500 m elevation below surface.
Previously reported highlights in the third quarter from the surface drilling program in Island Lower East (E1E-Zone) include:
| • | 28.97 g/t Au (26.89 g/t cut) over 21.76 m (true width) (MH25-04); and |
| • | 15.38 g/t Au (14.19 g/t cut) over 15.02 m (true width) (MH25-03). |
Drill holes MH25-03 and MH25-04 intersected wide, high-grade gold mineralization 40 m and 100 m, respectively down-plunge from the high-grade Inferred Mineral Resource block which contained 719,800 ounces, grading 18.74 g/t Au (1.2 million tonnes) as of December 31, 2019. These intercepts have true widths approximately three to four times greater than the 5.3 m average width of this Inferred Mineral Resource block indicating the zone has widened in the area of these holes. Using the cut weighted gold grade for metal factor calculation, drill hole MH25-04 is the best surface directional hole drilled to date at Island Gold in terms of gold content for a drill hole intersect.
Underground exploration drilling
During the third quarter of 2020, a total of 8,262 m of underground exploration drilling was completed in 21 holes from the 620, 740 and 840 levels. The objective of the underground drilling is to identify new Mineral Resources close to existing Mineral Resource or Reserve blocks. A total of 34 m of underground exploration drift development was completed on the 340, 740, and 840 levels during the third quarter of 2020.
Total exploration expenditures during the third quarter were $3.0 million, of which $2.9 million was capitalized. For the first nine months of 2020, $8.6 million was spent, of which $8.1 million was capitalized.
Mulatos District (Sonora, Mexico)
The Company has a large exploration package covering 28,972 hectares with the majority of past exploration efforts focused around the Mulatos mine. Over the last three years, exploration has moved beyond the main Mulatos pit area and is focused on earlier stage prospects throughout the wider district.
Exploration activities were suspended at the beginning of the second quarter of 2020 in response to COVID-19. As a result, limited exploration activities were undertaken in the third quarter. Exploration activities restarted early in the fourth quarter of 2020, primarily at El Carricito. During the third quarter, the Company incurred $0.6 million, mainly related to administrative costs. For the first nine months of 2020, exploration expenditures were $3.3 million, of which $0.7 million was capitalized related to La Yaqui Grande project.
Lynn Lake (Manitoba, Canada)
Exploration activities at the Lynn Lake Project were restarted in mid-July after being suspended in March due to COVID-19. In the third quarter of 2020, 4,907 m of drilling was completed in 19 holes. Field work in the third quarter was focused on advancing a pipeline of prospective regional exploration targets. Exploration spending totaled $1.3 million in the third quarter and $3.5 million for the first nine months of 2020.
192020 Management’s Discussion and Analysis | ||
Key External Performance Drivers
Gold Price
The Company’s financial performance is largely dependent on the price of gold, which directly affects the Company’s profitability and cash flow. The price of gold is subject to volatile price movements and is affected by numerous factors, such as the strength of the US dollar, supply and demand, interest rates, and inflation rates, all of which are beyond the Company’s control. During the third quarter of 2020, the Company realized an average gold price of $1,882 per ounce, slightly below the average London PM Fix price of $1,909 per ounce due to losses on gold hedging contracts entered earlier in the year.
As at September 30, 2020, the Company has 22,725 ounces hedged for the remainder of 2020 which ensure a minimum average realized gold price of $1,502 per ounce and a maximum average realized gold price of $1,790 per ounce, regardless of the movement in gold prices during 2020. In addition, 31,500 ounces are hedged with contracts outstanding for the first half of 2021, which ensure a minimum average realized gold price of $1,730 per ounce and a maximum average realized gold price of $2,074 per ounce.
Foreign Exchange Rates
At the Company’s mine sites, a significant portion of operating costs and capital expenditures are denominated in foreign currencies, including Mexican pesos and Canadian dollars. Fluctuations in the value of these foreign currencies compared to the US dollar can significantly impact the Company’s costs and cash flow. In the third quarter of 2020, the Canadian dollar averaged approximately $1.33 CAD to $1 USD, compared to $1.39 CAD to $1 USD in the second quarter of 2020. The Mexican peso ("MXN") averaged 22.06 MXN to $1 USD in the third quarter of 2020 compared to 23.33 MXN to $1 USD in the second quarter of 2020.
The Company recorded a foreign exchange gain of $0.8 million in the third quarter related to translation of the Company's net monetary assets resulting from changes in period-end foreign exchange rates. The Canadian dollar strengthened 2% relative to the US dollar, ending at $1.34 CAD to $1 USD at September 30, 2020 compared to a rate of $1.37 CAD to $1 USD at June 30, 2020. Similarly, the Mexican Peso strengthened 4% to 22.26 MXN to $1 USD at September 30, 2020 compared to a rate of 23.07 MXN to $1 USD at June 30, 2020.
In addition, the movement of the CAD and MXN rates generated a non-cash foreign exchange gain of $9.9 million in the third quarter of 2020 on the revaluation of monetary tax and deferred tax balances, which is recorded within deferred tax expense.
The Company actively manages its currency exposure through a hedging program, which resulted in nominal realized foreign exchange losses during the third quarter, and a realized loss of $2.0 million on a year-to-date basis. The Company applies hedge accounting; accordingly, these realized losses have been applied against operating and capital costs at the operating mines.
202020 Management’s Discussion and Analysis | ||
Summarized Financial and Operating Results
| (in millions, except ounces, per share amounts, average realized prices, AISC and total cash costs) | ||||||||||||
| Three Months Ended September 30, | Nine Months Ended September 30, | |||||||||||
| 2020 | 2019 | 2020 | 2019 | |||||||||
| Gold production (ounces) | 117,100 | 121,900 | 306,400 | 372,400 | ||||||||
Gold sales (ounces) | 116,035 | 119,392 | 302,494 | 367,554 | ||||||||
| Operating Revenues | $218.4 | $172.9 | $521.5 | $497.1 | ||||||||
Cost of sales(1) | $122.6 | $127.3 | $346.2 | $385.4 | ||||||||
| Earnings from operations | $88.0 | $37.5 | $146.3 | $84.4 | ||||||||
| Earnings before income taxes | $85.9 | $37.4 | $132.4 | $85.1 | ||||||||
| Net earnings | $67.9 | $17.7 | $67.3 | $58.1 | ||||||||
Adjusted net earnings (2) | $56.9 | $23.4 | $96.2 | $51.4 | ||||||||
| Earnings per share, basic | $0.17 | $0.05 | $0.17 | $0.15 | ||||||||
Adjusted earnings per share (2) | $0.15 | $0.06 | $0.25 | $0.13 | ||||||||
| Total assets | $3,616.7 | $3,331.1 | ||||||||||
| Total non-current liabilities | 619.5 | 550.1 | ||||||||||
| Cash flow from operations | $130.8 | $67.9 | $237.0 | $182.6 | ||||||||
| Dividends per share, declared and paid | 0.015 | 0.01 | 0.045 | 0.03 | ||||||||
| Average realized gold price per ounce | $1,882 | $1,448 | $1,724 | $1,352 | ||||||||
Cost of sales per ounce of gold sold, including amortization (1) | $1,057 | $1,066 | $1,144 | $1,049 | ||||||||
Total cash costs per ounce of gold sold (2) | $681 | $730 | $772 | $720 | ||||||||
All-in sustaining costs per ounce of gold sold (2) | $949 | $950 | $1,052 | $944 | ||||||||
(1) Cost of sales includes mining and processing costs, royalties and amortization. For the three months and nine months ended September 30, 2020, cost of sales also includes COVID-19 costs of $nil and $6.5 million, respectively
(2) Refer to the “Non-GAAP Measures and Additional GAAP Measures” disclosure at the end of this MD&A for a description and calculation of these measures.
Review of Third Quarter Financial Results
Operating Revenue
During the third quarter of 2020, the Company sold 116,035 ounces of gold for revenue of $218.4 million, a 26% increase from the prior year period driven by higher realized gold prices. Ounces sold were consistent with the prior year period, with lower production at Young-Davidson offset by higher production at Mulatos and Island Gold. All operations successfully mitigated the impact of COVID-19 on production and sales in the third quarter.
The average realized gold price in the third quarter was $1,882 per ounce, a 30% increase compared to $1,448 per ounce realized in the prior year period. The average realized gold price was below the average London PM Fix price of $1,909 per ounce due to the impact of gold hedges entered into earlier in the year.
Cost of Sales
Cost of sales were $122.6 million in the third quarter, a 4% decrease compared to the prior year period, driven by lower mining and processing costs at Island Gold and Young-Davidson, partially offset by higher amortization costs.
Mining and Processing
Mining and processing costs were $76.2 million, 8% lower than the comparative period, driven by lower mining costs at Young-Davidson as operations commenced from the more efficient lower mine infrastructure in July, and lower mining costs at Island Gold. For the three months ended September 30, 2020, mining and processing costs included COVID-19 testing and other incremental costs, which have been included in total cash costs for the period. All operating costs incurred subsequent to the mine-sites returning to planned operating levels at the end of the second quarter have been included in mining and processing costs and have not been separately classified.
Consolidated total cash costs for the quarter were $681 per ounce, a 7% decrease compared to $730 per ounce in the prior year period, driven by record low total cash costs at Island Gold of $394 per ounce. Offsetting this was higher total cash costs per ounce at Young-Davidson as a result of lower grades mined in the quarter.
AISC were $949 per ounce in the quarter, consistent with the comparative period in 2019 as lower total cash costs were offset by higher sustaining capital, mainly attributable to stripping activities at Mulatos.
212020 Management’s Discussion and Analysis | ||
Royalties
Royalty expense was $2.8 million in the quarter, lower than the prior year period of $4.2 million due to a reduced royalty obligation at Island Gold following the repurchase of a royalty earlier this year. The repurchase reduced the effective royalty rate on Mineral Reserves from 4.4% to 2.2% at Island Gold.
Amortization
Amortization of $43.6 million in the quarter was higher than the prior year period due to higher amortization charges at Young-Davidson and Mulatos. Amortization of $375 per ounce was $39 per ounce higher than the prior year, reflecting the higher contribution of Cerro Pelon production at Mulatos which carries a higher amortization per ounce expense, and the start of amortization of the lower-mine infrastructure at Young-Davidson following completion in July 2020.
Earnings from Operations
The Company recognized earnings from operations of $88.0 million in the quarter, 135% higher than the prior year period due to improved operating margins driven by an increase in realized gold prices and a reduction in total cash costs.
Net Earnings
The Company reported net earnings of $67.9 million in the quarter, compared to net earnings of $17.7 million in the comparative period. Net earnings benefited from an increasing gold price as well as the strengthening Canadian dollar and Mexican Peso, which resulted in a $0.8 million foreign exchange gain, as well as a $9.9 million foreign exchange gain recorded within deferred tax expense. On an adjusted basis, earnings of $56.9 million or $0.15 per share were 150% higher compared to the prior year primarily driven by improved operating margins. Adjusted earnings reflect adjustments for one-time gains and losses, as well as foreign exchange movements.
Review of Nine Month Financial Results
Operating Revenue
For the first nine months of 2020, the Company sold 302,494 ounces of gold for revenue of $521.5 million, a 5% increase compared to 2019 driven by higher realized gold prices, partially offset by a lower number of ounces sold. The decrease in ounces sold is primarily a result of the temporary shutdown of the Northgate shaft at Young-Davidson to facilitate the tie in of the lower mine infrastructure which commenced in February, resulting in lower mining rates and production between February and mid-July. In addition, Island Gold and Mulatos temporarily suspended operations in the second quarter in response to COVID-19. Lower gold sales were offset by higher realized gold prices of $1,724 per ounce for the first nine months of 2020 compared to $1,352 per ounce in 2019.
Cost of Sales
Year-to-date cost of sales were $346.2 million for the nine months ended September 30, 2020, down from $385.4 million in the prior year period due to the lower mining rates at all sites, partially offset by $6.5 million of COVID-19 costs incurred at Island Gold and Mulatos in the second quarter of 2020.
Mining and Processing
Mining and processing costs decreased to $226.6 million for the first nine months of 2020 from $251.6 million in the prior year period, primarily due to lower tonnes mined and processed at Young-Davidson and Mulatos. Lower throughput levels had the impact of increasing consolidated total cash costs per ounce by 7% for the first nine months of 2020 to $772 per ounce compared to $720 per ounce in the prior year. The increase in total cash costs was primarily driven by higher cost production at Young-Davidson during the lower mine tie-in with underground ore trucked to surface and lower grade stockpiles processed.
AISC increased to $1,052 per ounce in 2020 from $944 per ounce in the prior year. The increase was primarily driven by the higher total cash costs and higher sustaining capital on a per ounce basis given lower gold sales for the period.
Royalties
Royalty expense was $6.9 million for the first nine months of 2020, a 47% decrease compared to $13.0 million in the prior year. This was primarily due to 18% fewer ounces sold, a lower royalty obligation at Mulatos with the completion of the third-party royalty commitment in the first quarter of 2019, and a lower royalty obligation at Island Gold following the repurchase of a 3% NSR royalty in the first quarter of 2020.
Amortization
Amortization of $106.2 million for the first nine months of 2020 was lower than the prior year due to fewer ounces sold. On a per ounce basis, amortization was $351 per ounce, or $22 per ounce higher than the prior year due to the start of production from Cerro Pelon in 2020 which carries a higher amortization per ounce.
222020 Management’s Discussion and Analysis | ||
Earnings from Operations
The Company recognized earnings from operations of $146.3 million for the first nine months of 2020, compared to earnings of $84.4 million in 2019. The increase in earnings from operations was driven by a 28% increase in realized gold prices.
Net Earnings
The Company reported net earnings of $67.3 million for the first nine months of 2020 compared to net earnings of $58.1 million in 2019. Net earnings were impacted by the weakening Canadian dollar and Mexican Peso, which resulted in a $4.1 million foreign exchange loss, as well as a $16.8 million foreign exchange loss recorded within deferred tax expense. In addition, the Company incurred $6.5 million in incremental costs related to COVID-19. On an adjusted basis, earnings of $96.2 million or $0.25 per share for the first nine months of 2020 were 87% higher than in the prior year, driven by higher realized gold prices. Adjusted earnings reflect adjustments for one-time gains and losses, as well as foreign exchange movements, including an unrealized foreign exchange loss of $20.9 million in 2020 recorded in deferred taxes and foreign exchange loss.
Consolidated Expenses and Other
| (in millions) | ||||||||||||
| Three Months Ended September 30, | Nine Months Ended September 30, | |||||||||||
| 2020 | 2019 | 2020 | 2019 | |||||||||
| Exploration expense | ($1.5 | ) | ($1.9 | ) | ($4.6 | ) | ($5.0 | ) | ||||
| Corporate and administrative expense | (5.0 | ) | (4.5 | ) | (15.3 | ) | (14.6 | ) | ||||
| Share-based compensation expense | (1.3 | ) | (1.7 | ) | (9.1 | ) | (7.7 | ) | ||||
| Finance expense | (1.0 | ) | (0.9 | ) | (3.0 | ) | (2.1 | ) | ||||
| Foreign exchange gain (loss) | 0.8 | — | (4.1 | ) | 0.3 | |||||||
| Other (loss) gain | (1.9 | ) | 0.8 | (6.8 | ) | 2.5 | ||||||
Exploration
Exploration expense mainly relates to expenditures on early-stage exploration projects and corporate exploration support. Expenses incurred in the third quarter and year-to-date 2020 related to activities at Mulatos and corporate support, as the majority of spending at Island Gold was capitalized.
Corporate and administrative
Corporate and administrative costs include expenses relating to the overall management of the business that are not part of direct mine operating costs. These costs are incurred at the corporate office located in Canada. Corporate and administrative costs were slightly higher in the quarter due to a higher number of personnel compared to the prior year period, partially offset by lower travel expenses incurred due to travel restrictions.
Share-based compensation
Share-based compensation expense was $1.3 million in the third quarter, consistent with the prior year period due to the impact of a decreasing share price on the mark-to-market revaluation of certain long-term incentives. The Company did not grant any options, RSUs or PSUs during the third quarter. For the first nine months of 2020, share-based compensation of $9.1 million was higher than the prior due to an increasing share price compared to the prior year period which resulted in higher share-based compensation charges on the revaluation of outstanding long-term incentives.
Finance expense
Finance expense increased slightly due to higher standby fees, as the Company increased its credit facility to $500.0 million in December 2019. Interest incurred on the $100.0 million drawn on the facility earlier in the year was capitalized to development projects.
Foreign exchange gain (loss)
A foreign exchange gain of $0.8 million was recorded in the quarter, resulting from the impact of the strengthening Canadian dollar and Mexican peso relative to the US dollar on foreign denominated net monetary assets and liabilities.
The Company applies hedge accounting to its Canadian and Mexican foreign currency option and forward contracts, which reduces the impact of unrealized foreign exchange movements on net earnings. During the third quarter, the Company realized a nominal
232020 Management’s Discussion and Analysis | ||
loss on settled foreign exchange contracts. In addition, the outstanding contracts had a mark-to-market loss of $2.6 million, net of tax, as at September 30, 2020, which is recorded within other comprehensive income.
The Company will continue to experience non-cash foreign currency gains or losses on monetary assets and liabilities, primarily as a result of fluctuations between the US dollar and both the Canadian dollar and Mexican peso.
Other (loss) gain
Other loss in the quarter includes unrealized mark-to-market losses on gold option contracts, gains on renunciation of flow-through exploration expenditures and other one-time charges.
Consolidated Income Tax Expense
The Company is subject to tax in various jurisdictions, including Mexico and Canada. There are a number of factors that can significantly impact the Company’s effective tax rate including the geographic distribution of income, varying rates in different jurisdictions, the non-recognition of tax assets, mining allowances, foreign currency exchange rate movements, changes in tax laws and the impact of specific transactions and assessments. Due to the number of factors that can potentially impact the effective tax rate and the sensitivity of the tax provision to these factors, it is expected that the Company’s effective tax rate will fluctuate in future periods.
For the first nine months of 2020, the Company recognized a current tax expense of $20.4 million and a deferred tax expense of $44.7 million, compared to a current tax expense of $18.5 million and deferred tax expense of $8.5 million in the prior year period of 2019. The current income tax expense in 2020 primarily related to income tax expense in Mexico. The deferred tax expense was primarily driven by the increased use of tax pools compared to accounting depreciation during the period as well as changes to foreign exchange rates during the period.
The Company's Mulatos mine in Mexico, as well as the Young-Davidson and Island Gold mines in Canada, pay income taxes based on their tax functional currency which is the Mexican peso and Canadian dollar, respectively. The legal entity financial statements for Mulatos, Young-Davidson and Island Gold include foreign exchange and other income items that differ from the US dollar functional currency financial statements. The total foreign exchange impact recorded within taxes in the first three quarters of 2020 was a $16.8 million expense (2019 - $4.6 million recovery).
Financial Condition
| September 30, 2020 | December 31, 2019 | ||||||
| Current assets | $511.1 | $394.3 | Current assets have increased compared to the prior year, primarily driven by an increase in cash and cash equivalents and equity securities. The increase in cash and cash equivalents is mainly attributable to a draw down of $100.0 million from the Company's credit facility during the first quarter and free cash flow generated during the year of $64.3 million, partially offset by the repurchase of a royalty at Island Gold for $54.8 million, dividend payments of $16.5 million and the repurchase and cancellation of $5.6 million of common shares. Equity securities have increased due to a mark to market increase in the investments. | ||||
| Long-term assets | 3,105.6 | 3,002.2 | The increase in long-term assets was driven by the repurchase of the 3% royalty at Island Gold for $54.8 million, and capital expenditures at Young-Davidson | ||||
| Total assets | $3,616.7 | $3,396.5 | |||||
| Current liabilities | $227.6 | $127.3 | Current liabilities are higher as the $100.0 million outstanding on the credit facility at September 30, 2020 is classified as a current liability due to the subsequent repayment on October 16, 2020. | ||||
| Non-current liabilities | 619.5 | 573.9 | Non-current liabilities are higher than the prior year as a result of an increase in the deferred income tax liability driven by foreign exchange movements | ||||
| Total liabilities | $847.1 | $701.2 | |||||
| Shareholders’ equity | $2,769.6 | $2,695.3 | Shareholders' equity increased in the period mainly as a result of net income generated during the period, as well as mark-to-market gains on equity shares recorded in AOCI, offset by dividends and share re-purchases | ||||
| Total liabilities and equity | $3,616.7 | $3,396.5 | |||||
242020 Management’s Discussion and Analysis | ||
Liquidity and Capital Resources
The Company’s strategy is based on achieving positive cash flow from operations to internally fund operating, capital and project development requirements, and generate returns for its shareholders. Material increases or decreases in the Company’s liquidity and capital resources will be substantially determined by the success or failure of the Company’s operations, exploration, and development programs, the ability to obtain equity or other sources of financing, the price of gold, and currency exchange rates.
As at September 30, 2020, the Company had cash and cash equivalents of $274.1 million, $40.0 million in equity securities, and had $100.0 million of outstanding debt drawn from the credit facility, compared to $182.8 million $22.8 million and no debt, respectively, at December 31, 2019. In addition, the Company has $400.0 million of liquidity available under its recently amended $500.0 million credit facility. In the opinion of management, the Company's liquidity position of $714.1 million at September 30, 2020 comprised of cash and cash equivalents, equity securities and availability under the credit facility, together with cash flows from operations, is sufficient to support the Company's normal operating requirements and capital commitments on an ongoing basis.
Cash Flow
| (in millions) | ||||||||||||
| Three Months Ended September 30, | Nine Months Ended September 30, | |||||||||||
| 2020 | 2019 | 2020 | 2019 | |||||||||
| Cash flow provided by operating activities | $130.8 | $67.9 | $237.0 | $182.6 | ||||||||
| Cash flow used in investing activities | (53.7 | ) | (66.8 | ) | (228.7 | ) | (192.3 | ) | ||||
| Cash flow (used in) provided by financing activities | (4.4 | ) | 1.7 | 84.2 | (11.2 | ) | ||||||
| Effect of foreign exchange rates on cash | 0.1 | (0.4 | ) | (1.2 | ) | 0.5 | ||||||
| Net increase (decrease) in cash | 72.8 | 2.4 | 91.3 | (20.4 | ) | |||||||
| Cash and cash equivalents, beginning of period | 201.3 | 183.2 | 182.8 | 206.0 | ||||||||
| Cash and cash equivalents, end of period | $274.1 | $185.6 | $274.1 | $185.6 | ||||||||
Cash flow provided by operating activities
In the third quarter of 2020, operating activities generated record cash flow of $130.8 million compared to $67.9 million in the same period in 2019, a 93% increase resulting from higher realized gold prices and operating margins, partially offset by lower production and sales from Young-Davidson. Cash flow provided by operations before working capital and taxes paid was $130.0 million in the third quarter compared to $80.2 million in the prior year period. Working capital changes reflect a decrease in accounts receivable and an increase in accounts payable balances at the Company's mine sites, offset by a higher inventory balance. For the first nine months of 2020, operating activities generated $237.0 million compared to $182.6 million in the prior year as a result of higher realized prices, partially offset by lower production resulting from temporary suspensions in the second quarter at Island Gold and Mulatos due to COVID-19 and the lower-mine tie-in at Young-Davidson.
Cash flow used in investing activities
For the third quarter of 2020, capital expenditures of $54.8 million were lower than expenditures of $66.3 million in the prior year period of 2019. Capital expenditures were higher at Young-Davidson, focused on the lower mine expansion and the new tailings facility. Changes in capital spending at Mulatos and Island Gold were mainly attributable to the timing of capital spending. For the first nine months of 2020, the Company invested $172.7 million on capital expenditures compared to $190.7 million in the prior year.
In the first quarter of 2020, the Company repurchased an existing royalty on the Island Gold mine for $54.8 million. The repurchase will benefit the mine through a significantly lower royalty expense in future periods.
Cash flow used in financing activities
During the quarter, the Company declared and paid a dividend of $0.015 per share, or $5.4 million, bringing the year to date dividends paid in cash to $16.5 million. During the first nine months of 2020, the Company also repurchased and cancelled 1,133,561 shares for $5.5 million or $4.89 per share. Offsetting these outflows, the Company received $1.1 million in proceeds on the exercise of stock options during the quarter, and $7.4 million for the first nine months of 2020.
Credit Facility
In 2019, the Company secured amendments to its existing undrawn Facility, including an increase in the size of the Facility from $400.0 million to $500.0 million, expiring on December 17, 2023. The Facility bears interest at a rate of Libor plus 1.875% on drawn amounts and stand-by fees of 0.42% on undrawn amounts.
During the first quarter of 2020, the Company drew $100.0 million from the Facility, which was outstanding as at September 30, 2020. The remaining $400.0 million available under the Facility is undrawn. The Company drew from the Facility to strengthen its
252020 Management’s Discussion and Analysis | ||
cash position and enhance financial flexibility in light of COVID-19. On October 16, 2020, the Company repaid the $100.0 million in full and has no balance outstanding on the Facility, or any other debt outstanding.
The Facility is secured against all of the material present and future assets, property and undertakings of the Company. The Facility contains various covenants customary for a loan facility of this nature, including limits on indebtedness, asset sales and liens. It contains financial covenant tests that include (a) a minimum interest coverage ratio of 3.0:1.0 and (b) a maximum net leverage ratio of 3.5:1.0, both as defined in the agreement. As at September 30, 2020, the Company was in compliance with the covenants.
Outstanding Share Data
| October 27, 2020 | ||
| Common shares | 392,697,670 | |
| Stock options | 3,506,579 | |
| Deferred share units | 860,933 | |
| Performance share units | 1,231,341 | |
| Restricted share units | 2,314,259 | |
| 400,610,782 | ||
Related party transactions
There were no related party transactions during the year other than those disclosed in the Company’s interim condensed consolidated financial statements for the three and nine months ended September 30, 2020.
Off-Balance Sheet Arrangements
The Company does not have any off-balance sheet arrangements.
Financial Instruments
The Company seeks to manage its exposure to fluctuations in commodity prices, fuel prices and foreign exchange rates by entering into derivative financial instruments from time to time.
Commodity option and forward contracts
As at September 30, 2020, the Company held option contracts to protect against the risk of a decrease in the value of the gold price on a portion of gold sales.
The following gold collar contracts are outstanding as of September 30, 2020:
| Period Covered | Contract type | Ounces subject to contract | Average purchase put option | Average sold call option |
| Q4 2020 | Collars | 22,725 | $1,502 | $1,790 |
| H1 2021 | Collars | 31,500 | $1,730 | $2,074 |
The fair value of these contracts was a liability of $3.3 million at September 30, 2020 (December 31, 2019 - liability of $0.7 million). The options mature monthly throughout the remainder of 2020 and the first half of 2021.
For the three and nine months ended September 30, 2020, the Company realized losses of $3.2 and $5.9 million related to the settlement of option contracts which are recorded in operating revenues (for the three and nine months ended September 30, 2019 - realized losses $3.1 million). The Company recorded unrealized losses of $3.3 million and $8.5 million for the three and nine months ended September 30, 2020 (for the three and nine months ended September 30, 2019 unrealized losses of $0.3 million and $3.6 million). The Company has elected to not apply hedge accounting to gold option contracts, with changes in fair value recorded in net earnings.
262020 Management’s Discussion and Analysis | ||
Foreign currency contracts
As at September 30, 2020, the Company held option contracts to protect against the risk of an increase in the value of the Canadian dollar and Mexican peso versus the US dollar. These option contracts are for the purchase of local currencies and the sale of US dollars, which settle on a monthly basis, and are summarized as follows:
Canadian dollar contracts
| Period Covered | Contract type | Contracts (CAD$ Millions) | Average minimum rate (USD/CAD) | Average maximum rate (USD/CAD) |
| Q4 2020 | Collars | 72.5 | 1.31 | 1.35 |
| 2021 | Collars | 27.0 | 1.31 | 1.39 |
Mexican Peso contracts
| Period Covered | Contract type | Contracts (MXN Millions) | Average minimum rate (MXN/USD) | Average maximum rate (MXN/USD) |
| Q4 2020 | Collars | 120.0 | 19.37 | 21.68 |
| 2021 | Collars | 885.0 | 20.94 | 25.30 |
The fair value of these contracts was a liability of $0.2 million as at September 30, 2020 (December 31, 2019 - asset of $3.3 million) recorded in accumulated other comprehensive loss. For the three and nine months ended September 30, 2020, the Company realized losses of $nil and $2.0 million on the foreign currency contracts (for the three and nine months ended September 30, 2019 - realized losses of $0.2 million and $0.9 million).
Fuel contracts
The Company enters into option contracts to hedge against the risk of an increase in the price of diesel fuel. These option contracts are for the purchase of New York Harbour Ultra Low Sulfur Diesel ("ULSD") contracts, which settle on a monthly basis, and the Company believes this is an appropriate manner of managing price risk.
As at September 30, 2020, the Company has hedged 1,008,000 gallons of diesel at a range of $1.65 to $1.86 per gallon.
For the three and nine months ended September 30, 2020, the Company recorded an unrealized gain of $0.3 million and an unrealized loss of $0.3 million, respectively, in accumulated other comprehensive loss related to the fuel hedges (for the three and nine months ended September 30, 2019, an unrealized loss of $nil and an unrealized gain of $0.5 million).
Summary of Quarterly Financial and Operating Results
| Q3 2020 | Q2 2020 | Q1 2020 | Q4 2019 | Q3 2019 | Q2 2019 | Q1 2019 | Q4 2018 | |||||||||||||||||
Gold ounces produced | 117,100 | 78,400 | 110,800 | 122,100 | 121,900 | 125,200 | 125,300 | 125,600 | ||||||||||||||||
Gold ounces sold | 116,035 | 74,605 | 111,854 | 127,148 | 119,392 | 128,457 | 119,705 | 131,161 | ||||||||||||||||
| Operating Revenues | $218.4 | $126.2 | $176.9 | $186.0 | $172.9 | $168.1 | $156.1 | $163.1 | ||||||||||||||||
| Earnings (loss) from operations | $88.0 | $12.1 | $46.2 | $41.6 | $37.5 | $28.2 | $18.7 | ($51.3 | ) | |||||||||||||||
| Net earnings (loss) | $67.9 | $11.7 | ($12.3 | ) | $38.0 | $17.7 | $23.6 | $16.8 | ($71.5 | ) | ||||||||||||||
| Earnings (loss) per share, basic | $0.17 | $0.03 | ($0.03 | ) | $0.10 | $0.05 | $0.06 | $0.04 | ($0.18 | ) | ||||||||||||||
Adjusted net earnings (1) | $56.9 | $9.8 | $29.4 | $32.1 | $23.4 | $17.7 | $10.3 | $4.3 | ||||||||||||||||
Adjusted earnings per share, basic (1) | $0.15 | $0.03 | $0.08 | $0.08 | $0.06 | $0.05 | $0.03 | $0.01 | ||||||||||||||||
Earnings before interest, taxes, depreciation and amortization (1) | $130.5 | $40.9 | $76.7 | $88.4 | $78.4 | $69.1 | $60.5 | $43.0 | ||||||||||||||||
| Cash provided by operating activities | $130.8 | $49.6 | $56.6 | $77.8 | $67.9 | $72.3 | $42.4 | $47.4 | ||||||||||||||||
| Average realized gold price | $1,882 | $1,692 | $1,582 | $1,463 | $1,448 | $1,309 | $1,304 | $1,244 | ||||||||||||||||
(1) | Refer to the “Non-GAAP Measures and Additional GAAP Measures” disclosure at the end of this MD&A for a description and calculation of these measures. |
For the past eight quarters, production and gold ounces sold have been relatively consistent, with the exception of the first and second quarters of 2020. Production was lowest in the second quarter of 2020, driven by temporary suspensions at both Island Gold and Mulatos, and lower production at Young-Davidson as the lower mine tie-in was completed. Production and sales rebounded to normal levels in the most current quarter as expected, driven by higher production at Young-Davidson following completion of the lower mine tie-in and both Island Gold and Mulatos returning to full capacity.
272020 Management’s Discussion and Analysis | ||
Earnings from operations and cash flow from operating activities have improved since Q3 2018 as a result of a higher gold price and lower operating costs, resulting in higher margins on ounces produced and positive cash flow from operations. Earnings from operations and net income in the fourth quarter of 2018 were significantly lower as it was impacted by one-time, non-cash items, including a non-cash inventory impairment charge at El Chanate.
Non-GAAP Measures and Additional GAAP Measures
The Company has included certain non-GAAP financial measures to supplement its Consolidated Financial Statements, which are presented in accordance with IFRS, including the following:
| • | adjusted net earnings and adjusted earnings per share; |
| • | cash flow from operating activities before changes in working capital and taxes received; |
| • | company-wide free cash flow; |
| • | total mine-site free cash flow; |
| • | mine-site free cash flow; |
| • | net cash; |
| • | total cash cost per ounce of gold sold; |
| • | all-in sustaining cost ("AISC") per ounce of gold sold; |
| • | mine-site all-in sustaining cost ("Mine-site AISC") per ounce of gold sold; |
| • | sustaining and non-sustaining capital expenditures; and |
| • | earnings before interest, taxes, depreciation, and amortization |
The Company believes that these measures, together with measures determined in accordance with IFRS, provide investors with an improved ability to evaluate the underlying performance of the Company. Non-GAAP financial measures do not have any standardized meaning prescribed under IFRS, and therefore they may not be comparable to similar measures employed by other companies. The data is intended to provide additional information and should not be considered in isolation or as a substitute for measures of performance prepared in accordance with IFRS. Management's determination of the components of non-GAAP and additional measures are evaluated on a periodic basis influenced by new items and transactions, a review of investor uses and new regulations as applicable. Any changes to the measures are dully noted and retrospectively applied as applicable.
Adjusted Net Earnings and Adjusted Earnings per Share
“Adjusted net earnings” and “adjusted earnings per share” are non-GAAP financial measures with no standard meaning under IFRS which exclude the following from net earnings:
| • | Foreign exchange gain (loss) |
| • | Items included in other gain (loss) |
| • | Certain non-reoccurring items |
| • | Foreign exchange gain (loss) recorded in deferred tax expense |
Net earnings have been adjusted, including the associated tax impact, for the group of costs in “Other loss” on the consolidated statement of comprehensive income. Transactions within this grouping are: the fair value changes on non-hedged derivatives; the renunciation of flow-through exploration expenditures; and loss on disposal of assets. The adjusted entries are also impacted for tax to the extent that the underlying entries are impacted for tax in the unadjusted net earnings.
The Company uses adjusted net earnings for its own internal purposes. Management’s internal budgets and forecasts and public guidance do not reflect the items which have been excluded from the determination of adjusted net earnings. Consequently, the presentation of adjusted net earnings enables shareholders to better understand the underlying operating performance of the core mining business through the eyes of management. Management periodically evaluates the components of adjusted net earnings based on an internal assessment of performance measures that are useful for evaluating the operating performance of our business and a review of the non-GAAP measures used by mining industry analysts and other mining companies.
Adjusted net earnings is intended to provide additional information only and does not have any standardized meaning under IFRS and may not be comparable to similar measures presented by other companies. It should not be considered in isolation or as a substitute for measures of performance prepared in accordance with IFRS. The measure is not necessarily indicative of operating profit or cash flows from operations as determined under IFRS. The following table reconciles this non-GAAP measure to the most directly comparable IFRS measure.
282020 Management’s Discussion and Analysis | ||
| (in millions) | ||||||||||||
| Three Months Ended September 30, | Nine Months Ended September 30, | |||||||||||
| 2020 | 2019 | 2020 | 2019 | |||||||||
| Net earnings (loss) | $67.9 | $17.7 | $67.3 | $58.1 | ||||||||
| Adjustments: | ||||||||||||
| COVID-19 costs | — | — | 6.5 | — | ||||||||
| Foreign exchange (gain) loss | (0.8 | ) | — | 4.1 | (0.3 | ) | ||||||
| Other loss (gain) | 1.9 | (0.8 | ) | 6.8 | (2.5 | ) | ||||||
| Unrealized foreign exchange (gain) loss recorded in deferred tax expense | (9.9 | ) | 6.5 | 16.8 | (4.6 | ) | ||||||
| Other income tax and mining tax adjustments | (2.2 | ) | — | (5.3 | ) | 0.7 | ||||||
| Adjusted net earnings | $56.9 | $23.4 | $96.2 | $51.4 | ||||||||
| Adjusted earnings per share - basic and diluted | $0.15 | $0.06 | $0.25 | $0.13 | ||||||||
Cash Flow from Operating Activities before Changes in Working Capital and Cash Taxes
“Cash flow from operating activities before changes in working capital and cash taxes” is a non-GAAP performance measure that could provide an indication of the Company’s ability to generate cash flows from operations, and is calculated by adding back the change in working capital and taxes received to “Cash provided by (used in) operating activities” as presented on the Company’s consolidated statements of cash flows. “Cash flow from operating activities before changes in working capital” is a non-GAAP financial measure with no standard meaning under IFRS.
The following table reconciles the non-GAAP measure to the consolidated statements of cash flows.
| (in millions) | ||||||||||||
| Three Months Ended September 30, | Nine Months Ended September 30, | |||||||||||
| 2020 | 2019 | 2020 | 2019 | |||||||||
| Cash flow from operating activities | $130.8 | $67.9 | $237.0 | $182.6 | ||||||||
| Add (less): Changes in working capital and cash taxes | (0.8 | ) | 12.3 | 19.4 | 28.8 | |||||||
| Cash flow from operating activities before changes in working capital and cash taxes | $130.0 | $80.2 | $256.4 | $211.4 | ||||||||
Company-wide Free Cash Flow
“Company-wide free cash flow" is a non-GAAP performance measure calculated from the consolidated operating cash flow, less consolidated mineral property, plant and equipment expenditures. The Company believes this to be a useful indicator of our ability to operate without reliance on additional borrowing or usage of existing cash company-wide. Company-wide free cash flow is intended to provide additional information only and does not have any standardized meaning under IFRS and may not be comparable to similar measures of performance presented by other mining companies. Company-wide free cash flow should not be considered in isolation or as a substitute for measures of performance prepared in accordance with IFRS.
| (in millions) | ||||||||||||
| Three Months Ended September 30, | Nine Months Ended September 30, | |||||||||||
| 2020 | 2019 | 2020 | 2019 | |||||||||
| Cash flow from operating activities | $130.8 | $67.9 | $237.0 | $182.6 | ||||||||
Less: mineral property, plant and equipment expenditures (1) | (54.8 | ) | (66.3 | ) | (172.7 | ) | (190.7 | ) | ||||
| Company-wide free cash flow | $76.0 | $1.6 | $64.3 | ($8.1 | ) | |||||||
292020 Management’s Discussion and Analysis | ||
Mine-site Free Cash Flow
"Mine-site free cash flow" is a non-GAAP financial performance measure calculated as cash flow from mine-site operating activities, less mineral property, plant and equipment expenditures. The Company believes this to be a useful indicator of our ability to operate without reliance on additional borrowing or usage of existing cash. Mine-site free cash flow is intended to provide additional information only and does not have any standardized meaning under IFRS and may not be comparable to similar measures of performance presented by other mining companies. Mine-site free cash flow should not be considered in isolation or as a substitute for measures of performance prepared in accordance with IFRS.
| Total Mine-Site Free Cash Flow | ||||||||||||
| Three Months Ended September 30, | Nine Months Ended September 30, | |||||||||||
| 2020 | 2019 | 2020 | 2019 | |||||||||
| (in millions) | ||||||||||||
| Cash flow from operating activities | $130.8 | $67.9 | $237.0 | $182.6 | ||||||||
| Add: operating cash flow used by non-mine site activity | 2.3 | 6.2 | 23.4 | 22.7 | ||||||||
| Cash flow from operating mine-sites | $133.1 | $74.1 | $260.4 | $205.3 | ||||||||
Mineral property, plant and equipment expenditure 1 | $54.8 | $66.3 | $172.7 | $190.7 | ||||||||
| Less: capital expenditures from development projects, and corporate | (4.2 | ) | (15.7 | ) | (15.0 | ) | (28.9 | ) | ||||
| Capital expenditure from mine-sites | $50.6 | $50.6 | $157.7 | $161.8 | ||||||||
| Total mine-site free cash flow | $82.5 | $23.5 | $102.7 | $43.5 | ||||||||
(1) | Excludes royalty repurchase of $54.8 million at Island Gold in the first quarter of 2020 |
| Young-Davidson Mine-Site Free Cash Flow | ||||||||||||
| Three Months Ended September 30, | Nine Months Ended September 30, | |||||||||||
| 2020 | 2019 | 2020 | 2019 | |||||||||
| (in millions) | ||||||||||||
| Cash flow from operating activities | $36.4 | $27.3 | $51.0 | $73.8 | ||||||||
| Mineral property, plant and equipment expenditure | (25.6 | ) | (23.9 | ) | (82.2 | ) | (72.9 | ) | ||||
| Mine-site free cash flow | $10.8 | $3.4 | ($31.2 | ) | $0.9 | |||||||
| Mulatos Mine-Site Free Cash Flow | ||||||||||||
| Three Months Ended September 30, | Nine Months Ended September 30, | |||||||||||
| 2020 | 2019 | 2020 | 2019 | |||||||||
| (in millions) | ||||||||||||
| Cash flow from operating activities | $40.0 | $7.2 | $85.9 | $31.0 | ||||||||
| Mineral property, plant and equipment expenditure | (9.1 | ) | (12.9 | ) | (21.6 | ) | (44.7 | ) | ||||
| Mine-site free cash flow | $30.9 | ($5.7 | ) | $64.3 | ($13.7 | ) | ||||||
| Island Gold Mine-Site Free Cash Flow | ||||||||||||
| Three Months Ended September 30, | Nine Months Ended September 30, | |||||||||||
| 2020 | 2019 | 2020 | 2019 | |||||||||
| (in millions) | ||||||||||||
| Cash flow from operating activities | $56.7 | $40.6 | $123.5 | $99.3 | ||||||||
Mineral property, plant and equipment expenditure 1 | (15.9 | ) | (13.8 | ) | (53.9 | ) | (44.2 | ) | ||||
| Mine-site free cash flow | $40.8 | $26.8 | $69.6 | $55.1 | ||||||||
(1) | Excludes royalty repurchase of $54.8 million at Island Gold that occurred in March 2020 |
The Company defines net cash as cash and cash equivalents less long-term debt.
302020 Management’s Discussion and Analysis | ||
Total Cash Costs per ounce
Total cash costs per ounce is a non-GAAP term typically used by gold mining companies to assess the level of gross margin available to the Company by subtracting these costs from the unit price realized during the period. This non-GAAP term is also used to assess the ability of a mining company to generate cash flow from operations. Total cash costs per ounce includes mining and processing costs plus applicable royalties, and net of by-product revenue and net realizable value adjustments. This metric excludes COVID-19 costs incurred in the period. Total cash costs per ounce is exclusive of exploration costs.
Total cash costs per ounce is intended to provide additional information only and does not have any standardized meaning under IFRS and may not be comparable to similar measures presented by other mining companies. It should not be considered in isolation or as a substitute for measures of performance prepared in accordance with IFRS. The measure is not necessarily indicative of cash flow from operations under IFRS or operating costs presented under IFRS.
All-in Sustaining Costs per ounce and Mine-site All-in Sustaining Costs
The Company adopted an “all-in sustaining costs per ounce” non-GAAP performance measure in accordance with the World Gold Council published in June 2013. The Company believes the measure more fully defines the total costs associated with producing gold; however, this performance measure has no standardized meaning. Accordingly, there may be some variation in the method of computation of “all-in sustaining costs per ounce” as determined by the Company compared with other mining companies. In this context, “all-in sustaining costs per ounce” for the consolidated Company reflects total mining and processing costs, corporate and administrative costs, share-based compensation, exploration costs, sustaining capital, and other operating costs.
For the purposes of calculating "mine-site all-in sustaining costs" at the individual mine-sites, the Company does not include an allocation of corporate and administrative costs and share-based compensation, as detailed in the reconciliations below.
Sustaining capital expenditures are expenditures that do not increase annual gold ounce production at a mine site and excludes all expenditures at the Company’s development projects as well as certain expenditures at the Company’s operating sites that are deemed expansionary in nature. For each mine-site reconciliation, corporate and administrative costs, and non-site specific costs are not included in the all-in sustaining cost per ounce calculation.
All-in sustaining costs per gold ounce is intended to provide additional information only and does not have any standardized meaning under IFRS and may not be comparable to similar measures presented by other mining companies. It should not be considered in isolation or as a substitute for measures of performance prepared in accordance with IFRS.
The measure is not necessarily indicative of cash flow from operations under IFRS or operating costs presented under IFRS.
Total Cash Costs and All-in Sustaining Costs per Ounce Reconciliation Tables
The following tables reconciles these non-GAAP measures to the most directly comparable IFRS measures on a Company-wide and individual mine-site basis.
| Total Cash Costs and AISC Reconciliation - Company-wide | ||||||||||||
| Three Months Ended September 30, | Nine Months Ended September 30, | |||||||||||
| 2020 | 2019 | 2020 | 2019 | |||||||||
| (in millions, except ounces and per ounce figures) | ||||||||||||
| Mining and processing | $76.2 | $83.0 | $226.6 | $251.6 | ||||||||
| Royalties | 2.8 | 4.2 | 6.9 | 13.0 | ||||||||
| Total cash costs | $79.0 | $87.2 | $233.5 | $264.6 | ||||||||
| Gold ounces sold | 116,035 | 119,392 | 302,494 | 367,554 | ||||||||
| Total cash costs per ounce | $681 | $730 | $772 | $720 | ||||||||
| Total cash costs | $79.0 | $87.2 | $233.5 | $264.6 | ||||||||
Corporate and administrative(1) | 5.0 | 4.5 | 15.3 | 14.6 | ||||||||
Sustaining capital expenditures(2) | 22.7 | 17.8 | 54.6 | 53.5 | ||||||||
| Share-based compensation | 1.3 | 1.7 | 9.1 | 7.7 | ||||||||
| Sustaining exploration | 1.3 | 1.4 | 3.8 | 4.2 | ||||||||
| Accretion of decommissioning liabilities | 0.8 | 0.8 | 2.0 | 2.2 | ||||||||
| Total all-in sustaining costs | $110.1 | $113.4 | $318.3 | $346.8 | ||||||||
| Gold ounces sold | 116,035 | 119,392 | 302,494 | 367,554 | ||||||||
| All-in sustaining costs per ounce | $949 | $950 | $1,052 | $944 | ||||||||
(1) | Corporate and administrative expenses exclude expenses incurred at development properties. |
(2) | Sustaining capital expenditures are defined as those expenditures which do not increase annual gold ounce production at a mine site and exclude all expenditures at growth projects and certain expenditures at operating sites which are deemed expansionary in nature. Total sustaining capital for the period is as follows: |
312020 Management’s Discussion and Analysis | ||
| Three Months Ended September 30, | Nine Months Ended September 30, | |||||||||||
| 2020 | 2019 | 2020 | 2019 | |||||||||
| (in millions) | ||||||||||||
| Capital expenditures per cash flow statement | $54.8 | $66.3 | $172.7 | $190.7 | ||||||||
| Less: non-sustaining capital expenditures at: | ||||||||||||
| Young-Davidson | (16.0 | ) | (15.3 | ) | (62.9 | ) | (43.1 | ) | ||||
| Mulatos | (3.0 | ) | (10.8 | ) | (7.0 | ) | (39.4 | ) | ||||
| Island Gold | (8.9 | ) | (6.7 | ) | (33.2 | ) | (25.8 | ) | ||||
| Corporate and other | (4.2 | ) | (15.7 | ) | (15.0 | ) | (28.9 | ) | ||||
| Sustaining capital expenditures | $22.7 | $17.8 | $54.6 | $53.5 | ||||||||
| Young-Davidson Total Cash Costs and Mine-site AISC Reconciliation | ||||||||||||
| Three Months Ended September 30, | Nine Months Ended September 30, | |||||||||||
| 2020 | 2019 | 2020 | 2019 | |||||||||
| (in millions, except ounces and per ounce figures) | ||||||||||||
| Mining and processing | $31.8 | $36.6 | $97.0 | $108.5 | ||||||||
| Royalties | 1.0 | 1.2 | 2.5 | 2.9 | ||||||||
| Total cash costs | $32.8 | $37.8 | $99.5 | $111.4 | ||||||||
| Gold ounces sold | 35,548 | 48,430 | 86,893 | 137,091 | ||||||||
| Total cash costs per ounce | $923 | $781 | $1,145 | $813 | ||||||||
| Total cash costs | $32.8 | $37.8 | $99.5 | $111.4 | ||||||||
| Sustaining capital expenditures | 9.6 | 8.6 | 19.3 | 29.8 | ||||||||
| Sustaining exploration | — | 0.1 | — | 0.3 | ||||||||
| Accretion of decommissioning liabilities | 0.1 | — | 0.2 | 0.1 | ||||||||
| Total all-in sustaining costs | $42.5 | $46.5 | $119.0 | $141.6 | ||||||||
| Gold ounces sold | 35,548 | 48,430 | 86,893 | 137,091 | ||||||||
| Mine-site all-in sustaining costs per ounce | $1,196 | $960 | $1,370 | $1,033 | ||||||||
| Mulatos Total Cash Costs and Mine-site AISC Reconciliation | ||||||||||||
| Three Months Ended September 30, | Nine Months Ended September 30, | |||||||||||
| 2020 | 2019 | 2020 | 2019 | |||||||||
| (in millions, except ounces and per ounce figures) | ||||||||||||
| Mining and processing | $30.3 | $26.7 | $90.5 | $80.0 | ||||||||
| Royalties | 0.4 | 0.3 | 1.0 | 2.9 | ||||||||
| Total cash costs | $30.7 | $27.0 | $91.5 | $82.9 | ||||||||
| Gold ounces sold | 41,165 | 31,164 | 118,592 | 107,369 | ||||||||
| Total cash costs per ounce | $746 | $866 | $772 | $772 | ||||||||
| Total cash costs | $30.7 | $27.0 | $91.5 | $82.9 | ||||||||
| Sustaining capital expenditures | 6.1 | 2.1 | 14.6 | 5.3 | ||||||||
| Sustaining exploration | 0.8 | 0.8 | 2.3 | 2.4 | ||||||||
| Accretion of decommissioning liabilities | 0.6 | 0.6 | 1.7 | 1.8 | ||||||||
| Total all-in sustaining costs | $38.2 | $30.5 | $110.1 | $92.4 | ||||||||
| Gold ounces sold | 41,165 | 31,164 | 118,592 | 107,369 | ||||||||
| Mine-site all-in sustaining costs per ounce | $928 | $979 | $928 | $861 | ||||||||
322020 Management’s Discussion and Analysis | ||
| Island Gold Total Cash Costs and Mine-site AISC Reconciliation | ||||||||||||
| Three Months Ended September 30, | Nine Months Ended September 30, | |||||||||||
| 2020 | 2019 | 2020 | 2019 | |||||||||
| (in millions, except ounces and per ounce figures) | ||||||||||||
| Mining and processing | $14.1 | $16.0 | $39.1 | $46.8 | ||||||||
| Royalties | 1.4 | 2.7 | 3.4 | 7.2 | ||||||||
| Total cash costs | $15.5 | $18.7 | $42.5 | $54.0 | ||||||||
| Gold ounces sold | 39,322 | 37,209 | 97,009 | 110,094 | ||||||||
| Total cash costs per ounce | $394 | $503 | $438 | $490 | ||||||||
| Total cash costs | $15.5 | $18.7 | $42.5 | $54.0 | ||||||||
| Sustaining capital expenditures | 7.0 | 7.1 | 20.7 | 18.4 | ||||||||
| Accretion of decommissioning liabilities | 0.1 | — | 0.1 | — | ||||||||
| Total all-in sustaining costs | $22.6 | $25.8 | $63.3 | $72.4 | ||||||||
| Gold ounces sold | 39,322 | 37,209 | 97,009 | 110,094 | ||||||||
| Mine-site all-in sustaining costs per ounce | $575 | $693 | $653 | $658 | ||||||||
EBITDA represents net earnings before interest, taxes, depreciation, and amortization. EBITDA is an indicator of the Company’s ability to generate liquidity by producing operating cash flow to fund working capital needs, service debt obligations, and fund capital expenditures.
EBITDA does not have any standardized meaning under IFRS and may not be comparable to similar measures presented by other mining companies. It should not be considered in isolation or as a substitute for measures of performance prepared in accordance with IFRS.
The following is a reconciliation of EBITDA to the consolidated financial statements:
| (in millions) | ||||||||||||
| Three Months Ended September 30, | Nine Months Ended September 30, | |||||||||||
| 2020 | 2019 | 2020 | 2019 | |||||||||
| Net earnings | $67.9 | $17.7 | $67.3 | $58.1 | ||||||||
| Add back: | ||||||||||||
| COVID-19 costs | — | — | 6.5 | — | ||||||||
| Finance expense | 1.0 | 0.9 | 3.0 | 2.1 | ||||||||
| Amortization | 43.6 | 40.1 | 106.2 | 120.8 | ||||||||
| Deferred income tax (recovery) expense | 6.4 | 15.9 | 44.7 | 8.5 | ||||||||
| Current income tax expense | 11.6 | 3.8 | 20.4 | 18.5 | ||||||||
| EBITDA | $130.5 | $78.4 | $248.1 | $208.0 | ||||||||
Additional GAAP Measures
Additional GAAP measures are presented on the face of the Company’s consolidated statements of comprehensive income (loss) and are not meant to be a substitute for other subtotals or totals presented in accordance with IFRS, but rather should be evaluated in conjunction with such IFRS measures. The following additional GAAP measures are used and are intended to provide an indication of the Company’s mine and operating performance:
| • | Earnings from operations - represents the amount of earnings before net finance income/expense, foreign exchange gain/loss, other income/loss, loss on redemption of senior secured notes and income tax expense |
Accounting Estimates, Policies and Changes
The preparation of the Company's consolidated financial statements in accordance with IFRS requires management to make estimates and judgments that affect the amounts reported in the consolidated financial statements and accompanying notes. The critical estimates and judgments applied in the preparation of the Company's condensed interim consolidated financial statements for the three and nine months ended September 30, 2020 are consistent with those used in the Company's consolidated financial statements for the year ended December 31, 2019.
332020 Management’s Discussion and Analysis | ||
Accounting Policies and Changes
The accounting policies applied in the condensed interim consolidated financial statements for the three and nine months ended September 30, 2020 are consistent with those used in the Company's consolidated financial statements for the year ended December 31, 2019, with the exceptions listed in note 2 of the condensed interim consolidated financial statements for the three and nine months ended September 30, 2020.
Internal Control over Financial Reporting
Management is responsible for the design, implementation and operating effectiveness of internal control over financial reporting. Under the supervision of the Chief Executive Officer and Chief Financial Officer, management evaluated the effectiveness of the Company’s internal control over financial reporting as of September 30, 2020. In making the assessment, management used the criteria set forth in Internal Control - Integrated Framework (2013), issued by the Committee of Sponsoring Organizations of the Treadway Commission. Based on a review of internal control procedures at the end of the period covered by this MD&A, management determined internal control over financial reporting was appropriately designed as at September 30, 2020.
Changes in Internal Control over Financial Reporting
There were no changes in the Company’s internal control over financial reporting that occurred during the quarter ended September 30, 2020 that have materially affected, or are reasonably likely to materially affect, the Company’s internal control over financial reporting.
Disclosure Controls
Management is also responsible for the design and effectiveness of disclosure controls and procedures. The Company’s Chief Executive Officer and Chief Financial Officer have each evaluated the effectiveness of the Company’s disclosure controls and procedures as at September 30, 2020 and have concluded that these disclosure controls and procedures were appropriately designed.
Limitations of Controls and Procedures
The Company’s management, including the Chief Executive Officer and Chief Financial Officer, believe that internal controls over financial reporting and disclosure controls and procedures, no matter how well designed and operated, have inherent limitations. Therefore, even those systems determined to be properly designed and effective can provide only reasonable assurance that the objectives of the control system are met.
Cautionary Note to United States Investors
Mineral Reserve and Resource Estimates: Unless otherwise indicated, all Mineral Resource and Mineral Reserve estimates included in this MD&A have been prepared in accordance with National Instrument 43-101 - Standards of Disclosure for Mineral Projects (“NI 43-101”) and the Canadian Institute of Mining, Metallurgy and Petroleum (the “CIM”) - CIM Definition Standards on Mineral Resources and Mineral Reserves, adopted by the CIM Council, as amended (the “CIM Standards”).
NI 43-101 is a rule developed by the Canadian Securities Administrators, which established standards for all public disclosure an issuer makes of scientific and technical information concerning mineral projects. The terms “Mineral Reserve”, “Proven Mineral Reserve” and “Probable Mineral Reserve” are Canadian mining terms as defined in accordance with NI 43-101 and the CIM Standards. These definitions differ materially from the definitions in SEC Industry Guide 7 (“SEC Industry Guide 7”) under the United States Securities Exchange Act of 1934, as amended. Under SEC (defined below) Industry Guide 7 standards, a “final” or “bankable” feasibility study is required to report Mineral Reserves, the three-year historical average price is used in any reserve or cash flow analysis to designate reserves and the primary environmental analysis or report must be filed with the appropriate governmental authority. In addition, the terms “Mineral Resource”, “Measured Mineral Resource”, “Indicated Mineral Resource” and “Inferred Mineral Resource” are defined in and required to be disclosed by NI 43-101 and the CIM Standards; however, these terms are not defined terms under SEC Industry Guide 7 and are normally not permitted to be used in reports and registration statements filed with the U.S. Securities and Exchange Commission (the “SEC”). Investors are cautioned not to assume that all or any part of mineral
342020 Management’s Discussion and Analysis | ||
deposits in these categories will ever be converted into Mineral Reserves. “Inferred Mineral Resources” have a great amount of uncertainty as to their existence, and great uncertainty as to their economic and legal feasibility. It cannot be assumed that all or any part of an Inferred Mineral Resource will ever be upgraded to a higher category. Under Canadian rules, estimates of Inferred Mineral Resources may not form the basis of feasibility or pre-feasibility studies, except in very limited circumstances.
Investors are cautioned not to assume that all or any part of an Inferred Mineral Resource exists or is economically or legally mineable. Disclosure of “contained ounces” in a Mineral Resource is permitted disclosure under Canadian regulations; however, the SEC normally only permits issuers to report mineralization that does not constitute “Mineral Reserves” by SEC standards as in place tonnage and grade without reference to unit measures. The SEC has adopted final rules, effective February 25, 2019, to replace SEC Industry Guide 7 with new mining disclosure rules under sub-part 1300 of Regulation S-K of the U.S. Securities Act (the “SEC Modernization Rules”). The SEC Modernization Rules replace the historical property disclosure requirements included in SEC Industry Guide 7. As a result of the adoption of the SEC Modernization Rules, the SEC now recognizes estimates of “Measured Mineral Resources”, “Indicated Mineral Resources” and “Inferred Mineral Resources”. In addition, the SEC has amended its definitions of “Proven Mineral Reserves” and “Probable Mineral Reserves” to be substantially similar to international standards. The SEC Modernization Rules will become mandatory for U.S. reporting companies beginning with the first fiscal year commencing on or after January 1, 2021.
International Financial Reporting Standards: The condensed consolidated financial statements of the Company have been prepared by management in accordance with International Accounting Standard 34, Interim Financial Reporting, as issued by the International Accounting Standards Board. These accounting principles differ in certain material respects from accounting principles generally accepted in the United States of America. The Company’s reporting currency is the United States dollar unless otherwise noted.
Cautionary Note Regarding Forward-Looking Statements
This MD&A contains or incorporates by reference “forward-looking statements” and “forward-looking information” as defined under applicable Canadian and U.S. securities legislation. All statements, other than statements of historical fact, which address events, results, outcomes or developments that the Company expects to occur are, or may be deemed, to be, forward-looking statements. Forward-looking statements are generally, but not always, identified by the use of forward-looking terminology such as "expect", "believe", "anticipate", "intend", "estimate", "forecast", "budget", “target”, “outlook”, “continue”, “plan” or variations of such words and phrases and similar expressions or statements that certain actions, events or results “may”, “could”, “would”, “might” or “will” be taken, occur or be achieved.
Such statements include information as to strategy, plans or future financial or operating performance, such as the Company’s expansion plans, project timelines, production plans and expected sustainable productivity increases, expected increases in mining activities and corresponding cost efficiencies, expected drilling targets, expected sustaining costs, expected improvements in cash flows and margins, expectations of changes in capital expenditures, forecasted cash shortfalls and the Company’s ability to fund them, cost estimates, projected exploration results, reserve and resource estimates, expected production rates and use of the stockpile inventory, expected recoveries, sufficiency of working capital for future commitments and other statements that express management’s expectations or estimates of future performance.
Alamos cautions that forward-looking statements are necessarily based upon a number of factors and assumptions that, while considered reasonable by the Company at the time of making such statements, are inherently subject to significant business, economic, legal, political and competitive uncertainties and contingencies. Known and unknown factors could cause actual results to differ materially from those projected in the forward-looking statements.
Such factors and assumptions underlying the forward-looking statements in this document include, but are not limited to: changes to current estimates of mineral reserves and resources; changes to production estimates (which assume accuracy of projected ore grade, mining rates, recovery timing and recovery rate estimates and may be impacted by unscheduled maintenance; labour and contractor availability and other operating or technical difficulties); operations may be exposed to new diseases, epidemics and pandemics, including the effects and potential effects of the global Covid-19 widespread pandemic; the impact of the COVID-19 pandemic on the broader market and the trading price of the Company's shares; provincial and federal orders or mandates (including with respect to mining operations generally or auxiliary businesses or services required for our operations) in Canada, Mexico, the United States and Turkey; the duration of regulatory responses to the COVID-19 pandemic; governments and the Company’s attempts to reduce the spread of COVID-19 which may affect many aspects of the Company's operations including the ability to transport personnel to and from site, contractor and supply availability and the ability to sell or deliver gold dore bars; fluctuations in the price of gold or certain other commodities such as, diesel fuel, natural gas, and electricity; changes in foreign exchange rates (particularly the Canadian Dollar, Mexican Peso, U.S. Dollar and Turkish Lira); the impact of inflation; changes in our credit rating; any decision to declare a quarterly dividend; employee and community relations (including maintaining social license to operate in Turkey); litigation and administrative proceedings; disruptions affecting operations; availability of and increased costs associated with mining inputs and labour; development delays at the Kirazlı project or those that may be related to future developments and expansion at the Island Gold mine; inherent risks associated with mining and mineral processing; the risk that the Company’s mines may not perform as planned; uncertainty with the Company’s ability to secure additional capital to execute its business plans; the
352020 Management’s Discussion and Analysis | ||
speculative nature of mineral exploration and development, including the risks of obtaining and maintaining necessary licenses and permits, including the necessary licenses, permits, authorizations and/or approvals from the appropriate regulatory authorities for the Company’s development stage and operating assets, including the renewal of the Company’s mining concessions in Turkey; the timely resumption of construction and development at the Kirazlı project; labour and contractor availability (and being able to secure the same on favourable terms); contests over title to properties; expropriation or nationalization of property; inherent risks and hazards associated with mining including environmental hazards, industrial accidents, unusual or unexpected formations, pressures and cave-ins; changes in national and local government legislation (including tax legislation), controls or regulations in Canada, Mexico, Turkey, the United States and other jurisdictions in which the Company does or may carry on business in the future; increased costs and risks related to the potential impact of climate change; failure to comply with environmental and health and safety laws and regulations; disruptions in the maintenance or provision of required infrastructure and information technology systems; risk of loss due to sabotage, protests and other civil disturbances; the impact of global liquidity and credit availability and the values of assets and liabilities based on projected future cash flows; risks arising from holding derivative instruments; and business opportunities that may be pursued by the Company.
Additional risk factors and details with respect to risk factors affecting the Company’s ability to achieve the expectations set forth in the forward-looking statements contained in this MD&A are set out in the Company's 40-F/Annual Information Form for the year ended December 31, 2019 under the heading “Risk Factors”, which is available on the SEDAR website at www.sedar.com or on EDGAR at www.sec.gov. The foregoing should be reviewed in conjunction with the information found in this MD&A.
The Company disclaims any intention or obligation to update or revise any forward-looking statements whether as a result of new information, future events or otherwise, except as required by applicable law.
Qualified Persons
Chris Bostwick, FAusIMM, Alamos’ Vice President, Technical Services, who is a qualified person within the meaning of National Instrument 43-101 ("Qualified Person"), has reviewed and approved the scientific and technical information contained in this MD&A.
36