 ALAMOS GOLD INC.
Management’s Discussion and Analysis
(in United States dollars, unless otherwise stated)
For the Three and Six Months Ended June 30, 2021
 ALAMOS GOLD INC.
For the Three and Six Months Ended June 30, 2021
Table of Contents
| Overview of the Business | |||||
| Highlight Summary | |||||
| Second Quarter 2021 Highlights | |||||
| Environment, Social and Governance Summary Performance | |||||
| Business Developments | |||||
| Outlook and Strategy | |||||
| Young-Davidson Mine ("Young-Davidson") | |||||
| Island Gold Mine ("Island Gold") | |||||
| Mulatos Mine ("Mulatos") | |||||
| Second Quarter 2021 Development Activities | |||||
| Second Quarter 2021 Exploration Activities | |||||
| Key External Performance Drivers | |||||
| Summarized Financial and Operating Results | |||||
| Review of Second Quarter Financial Results | |||||
| Review of Six Months Financial Results | |||||
| Consolidated Expenses and Other | |||||
| Consolidated Income Tax Expense | |||||
| Financial Condition | |||||
| Liquidity and Capital Resources | |||||
| Outstanding Share Data | |||||
| Related Party Transactions | |||||
| Off-Balance Sheet Arrangements | |||||
| Financial Instruments | |||||
| Summary of Quarterly Financial and Operating Results | |||||
| Non-GAAP Measures and Additional GAAP Measures | |||||
| Accounting Estimates, Policies and Changes | |||||
| Internal Control over Financial Reporting | |||||
| Changes in Internal Control over Financial Reporting | |||||
| Disclosure Controls | |||||
| Limitations of Controls and Procedures | |||||
| Cautionary Note to United States Investors | |||||
| Cautionary Note Regarding Forward-Looking Statements | |||||
2021 Management’s Discussion and Analysis | ||||||||
This Management’s Discussion and Analysis (“MD&A”), dated July 27, 2021, relates to the financial condition and results of the consolidated operations of Alamos Gold Inc. (“Alamos” or the “Company”), and should be read in conjunction with the Company’s consolidated financial statements for the year ended December 31, 2020 and unaudited condensed interim consolidated financial statements for the three and six months ended June 30, 2021, and notes thereto. The financial statements have been prepared in accordance with IAS 34, Interim Financial Reporting ("IAS 34") as issued by the International Accounting Standards Board (“IFRS” or “GAAP”). All results are presented in United States dollars (“US dollars” or “$”), unless otherwise stated.
Statements are subject to the risks and uncertainties identified in the Cautionary Note Regarding Forward-Looking Statements section of this document. United States investors are also advised to refer to the section entitled Cautionary Note to United States Investors on page 38.
Overview of the Business
Alamos is a Canadian-based intermediate gold producer with diversified North American production from the Young-Davidson and the Island Gold mines in northern Ontario, Canada and the Mulatos mine in Sonora State, Mexico. In addition, Alamos has a significant portfolio of development stage projects in Canada, Mexico, the United States and Turkey. Alamos employs more than 1,700 people and is committed to the highest standards of sustainable development and ethical business practices.
The Company’s common shares are listed on the Toronto Stock Exchange (TSX: AGI) and the New York Stock Exchange (NYSE: AGI). Further information about Alamos can be found in the Company’s regulatory filings, including the Company's Annual Information Form, available on SEDAR at www.sedar.com, on EDGAR at www.sec.gov, and on the Company’s website at www.alamosgold.com.
 3
32021 Management’s Discussion and Analysis | ||||||||
Highlight Summary
| Three Months Ended June 30, | Six Months Ended June 30, | |||||||||||||
| 2021 | 2020 | 2021 | 2020 | |||||||||||
| Financial Results (in millions) | ||||||||||||||
| Operating revenues | $195.1 | $126.2 | $422.5 | $303.1 | ||||||||||
Cost of sales (1) | $126.9 | $103.3 | $266.2 | $223.6 | ||||||||||
| (Loss) Earnings from operations | ($168.5) | $12.1 | ($92.2) | $58.3 | ||||||||||
| (Loss) Earnings before income taxes | ($172.7) | $6.0 | ($97.6) | $46.5 | ||||||||||
| Net (loss) earnings | ($172.5) | $11.7 | ($121.3) | ($0.6) | ||||||||||
Adjusted net earnings (2) | $38.7 | $9.8 | $87.8 | $39.2 | ||||||||||
Earnings before interest, depreciation and amortization (2) | $94.4 | $40.9 | $214.0 | $117.6 | ||||||||||
Cash provided by operations before working capital and cash taxes(2) | $97.2 | $44.7 | $216.8 | $126.4 | ||||||||||
| Cash provided by operating activities | $86.7 | $49.6 | $186.0 | $106.2 | ||||||||||
Capital expenditures (sustaining) (2) | $26.7 | $14.4 | $50.3 | $31.9 | ||||||||||
Capital expenditures (growth) (2) (3) | $50.4 | $38.8 | $93.9 | $80.1 | ||||||||||
Capital expenditures (capitalized exploration) (4) | $6.4 | $1.4 | $11.9 | $5.9 | ||||||||||
Free cash flow (2) | ($0.2) | ($5.0) | $9.7 | ($11.7) | ||||||||||
| Operating Results | ||||||||||||||
| Gold production (ounces) | 114,200 | 78,400 | 240,000 | 189,300 | ||||||||||
| Gold sales (ounces) | 107,581 | 74,605 | 234,063 | 186,459 | ||||||||||
| Per Ounce Data | ||||||||||||||
| Average realized gold price | $1,814 | $1,692 | $1,805 | $1,626 | ||||||||||
| Average spot gold price (London PM Fix) | $1,816 | $1,711 | $1,805 | $1,647 | ||||||||||
Cost of sales per ounce of gold sold (includes amortization) (1) | $1,180 | $1,385 | $1,137 | $1,199 | ||||||||||
Total cash costs per ounce of gold sold (2) | $791 | $933 | $773 | $829 | ||||||||||
All-in sustaining costs per ounce of gold sold (2) | $1,136 | $1,276 | $1,079 | $1,117 | ||||||||||
| Share Data | ||||||||||||||
| (Loss) Earnings per share, basic and diluted | ($0.44) | $0.03 | ($0.31) | $0.00 | ||||||||||
Adjusted earnings per share, basic and diluted(2) | $0.10 | $0.03 | $0.22 | $0.10 | ||||||||||
| Weighted average common shares outstanding (basic) (000’s) | 392,759 | 391,076 | 392,762 | 391,208 | ||||||||||
| Financial Position (in millions) | ||||||||||||||
Cash and cash equivalents(5) | $233.9 | $220.5 | ||||||||||||
(1)Cost of sales includes mining and processing costs, royalties, COVID-19 costs and amortization expense.
(2)Refer to the “Non-GAAP Measures and Additional GAAP Measures” disclosure at the end of this MD&A for a description and calculation of these measures.
(3)Includes growth capital from operating sites. 2020 growth capital excludes the Island Gold royalty repurchase completed in March 2020 for $54.8 million.
(4)Includes capitalized exploration at Island Gold, Young-Davidson and Mulatos.
(5)Comparative cash and cash equivalents balance as at December 31, 2020.
42021 Management’s Discussion and Analysis | ||||||||
| Three Months Ended June 30, | Six Months Ended June 30, | |||||||||||||
| 2021 | 2020 | 2021 | 2020 | |||||||||||
Gold production (ounces) (1) | ||||||||||||||
| Young-Davidson | 45,100 | 23,100 | 93,100 | 51,800 | ||||||||||
| Island Gold | 33,200 | 19,400 | 75,400 | 58,200 | ||||||||||
| Mulatos | 35,900 | 35,900 | 71,500 | 78,500 | ||||||||||
| Gold sales (ounces) | ||||||||||||||
| Young-Davidson | 45,284 | 22,440 | 93,306 | 51,345 | ||||||||||
| Island Gold | 33,632 | 18,560 | 73,514 | 57,687 | ||||||||||
| Mulatos | 28,665 | 33,605 | 67,243 | 77,427 | ||||||||||
Cost of sales (in millions)(2) | ||||||||||||||
| Young-Davidson | $61.3 | $46.2 | $123.3 | $90.0 | ||||||||||
| Island Gold | $25.6 | $19.6 | $54.7 | $50.1 | ||||||||||
| Mulatos | $40.0 | $37.5 | $88.2 | $83.5 | ||||||||||
| Cost of sales per ounce of gold sold (includes amortization) | ||||||||||||||
| Young-Davidson | $1,354 | $2,059 | $1,321 | $1,753 | ||||||||||
| Island Gold | $761 | $1,056 | $744 | $868 | ||||||||||
| Mulatos | $1,395 | $1,116 | $1,312 | $1,078 | ||||||||||
Total cash costs per ounce of gold sold (3) | ||||||||||||||
| Young-Davidson | $941 | $1,564 | $906 | $1,299 | ||||||||||
| Island Gold | $502 | $501 | $483 | $468 | ||||||||||
| Mulatos | $893 | $750 | $906 | $785 | ||||||||||
Mine-site all-in sustaining costs per ounce of gold sold (3),(4) | ||||||||||||||
| Young-Davidson | $1,157 | $1,809 | $1,115 | $1,490 | ||||||||||
| Island Gold | $830 | $781 | $777 | $706 | ||||||||||
| Mulatos | $1,144 | $890 | $1,084 | $929 | ||||||||||
Capital expenditures (sustaining, growth and capitalized exploration) (in millions)(3) | ||||||||||||||
Young-Davidson(5) | $19.6 | $29.6 | $41.5 | $56.6 | ||||||||||
Island Gold (6) | $28.5 | $15.9 | $55.9 | $38.0 | ||||||||||
Mulatos(7) | $28.9 | $5.1 | $47.7 | $12.5 | ||||||||||
| Other | $6.5 | $4.0 | $11.0 | $10.8 | ||||||||||
(1)Production for the three and six months ended June 30, 2020 included nil and 800 ounces, respectively, from El Chanate which transitioned to the reclamation phase of the mine life in 2019. There was no production from El Chanate for the three and six months ended June 30, 2021.
(2)Cost of sales includes mining and processing costs, royalties, COVID-19 costs, and amortization.
(3)Refer to the “Non-GAAP Measures and Additional GAAP Measures” disclosure at the end of this MD&A for a description and calculation of these measures.
(4)For the purposes of calculating mine-site all-in sustaining costs, the Company does not include an allocation of corporate and administrative and share based compensation expenses.
(5)Includes capitalized exploration at Young-Davidson of $1.5 million and $2.5 million for the three and six months ended June 30, 2021 ($nil for the three and six months ended June 30, 2020).
(6)Includes capitalized exploration at Island Gold of $3.9 million and $8.4 million for the three and six months ended June 30, 2021 ($1.2 million and $5.2 million for the three and six months ended June 30, 2020); Capital expenditures exclude the Island Gold royalty repurchase for $54.8 million for the six months ended June 30, 2020.
(7)Includes capitalized exploration at Mulatos of $1.0 million for the three and six months ended June 30, 2021 ($0.2 million and $0.7 million for the three and six months ended June 30, 2020).
52021 Management’s Discussion and Analysis | ||||||||
2021 Highlights
Second Quarter 2021
•Production of 114,200 ounces of gold, a 46% increase from the second quarter of 2020, primarily reflecting temporary downtime related to COVID-19 during the prior year period
•Young-Davidson produced 45,100 ounces of gold and generated mine-site free cash flow1 of $18.7 million. Mining rates of 7,504 tonnes per day ("tpd") were in-line with the targeted mining rate of 7,500 tpd, and are expected to increase to the long-term run rate of 8,000 tpd in the third quarter
•Island Gold produced 33,200 ounces of gold and generated mine-site free cash flow1 of $13.7 million, net of growth capital expenditures and capitalized exploration totaling $28.5 million
•Sold 107,581 ounces of gold at an average realized price of $1,814 per ounce for revenues of $195.1 million, a 55% increase compared to the second quarter of 2020. Ounces sold were lower than production due to the timing of shipments, with deferred ounces being sold in July
•Generated cash flow from operating activities of $86.7 million ($97.2 million, or $0.25 per share, before changes in working capital1), a 75% increase from the prior year period
•Free cash flow1 neutral in the quarter, net of $6.2 million in cash taxes paid in Mexico, higher capital spending mainly related to La Yaqui Grande, and the above noted deferred gold sales. The Company expects stronger free cash flow in the second half of 2021 reflecting higher gold production and sales
•Consolidated total cash costs1 of $791 per ounce, all-in sustaining costs ("AISC")1 of $1,136 per ounce and cost of sales of $1,180 per ounce were higher than annual guidance primarily due to the impact of the stronger than budgeted Canadian dollar, with USD/CAD foreign exchange rate averaging $0.81:1 relative to the budgeted rate of $0.75:1
•Filed an investment treaty claim against the Republic of Turkey for expropriation and unfair and inequitable treatment, among other things, with respect to its Turkish projects. As a result, the Company recorded a non-cash, after-tax impairment charge of $213.8 million in the period, representing the entire carrying value of the Turkish assets
•Realized adjusted net earnings1 of $38.7 million, or $0.10 per share1, which includes adjustments for the non-cash, after-tax impairment charge of the Turkish projects of $213.8 million, unrealized foreign exchange gains of $6.0 million recorded within deferred taxes and foreign exchange, and other losses of $3.4 million
•Recorded a net loss of $172.5 million, or $0.44 per share, inclusive of the after-tax impairment charge of $213.8 million
•Ended the quarter with cash and cash equivalents of $233.9 million and equity securities of $22.4 million. During the quarter, the Company generated $5.1 million in cash on the liquidation of certain equity securities and realized an after-tax gain of $2.7 million (recorded within equity)
•Paid a quarterly dividend of $9.8 million, or US$0.025 per share (annualized rate of US$0.10 per share), bringing total dividends distributed through the first half of 2021 to $19.6 million
•Announced the best hole drilled to-date at Island Gold, extending high-grade mineralization down-plunge from existing Mineral Resources
•Subsequent to quarter-end, provided an exploration update at Young-Davidson extending gold mineralization below existing Mineral Reserves and Resources and intersecting higher grades in the hanging wall and footwall of the deposit
•Development activities continued to ramp up at La Yaqui Grande, with pre-stripping reaching budgeted rates of over 55,000 tpd. La Yaqui Grande remains on track to achieve commercial production in the third quarter of 2022
•Published the Company’s 2020 Environmental, Social and Corporate Governance (ESG) Report
(1) Refer to the “Non-GAAP Measures and Additional GAAP Measures” disclosure at the end of this MD&A for a description and calculation of these measures.
62021 Management’s Discussion and Analysis | ||||||||
Environment, Social and Governance Summary Performance
Health and Safety
•Recordable injury frequency rate1 of 2.80 in the quarter and 2.38 year-to-date, a 6% increase from 2.25 in the first half of 2020
•Lost time injury frequency rate1 of 0.08 in the quarter and 0.17 year-to-date, a 21% increase from 0.14 in the first half of 2020
•Performed over 50,000 COVID-19 tests to-date on employees, contractors and visitors as part of an enhanced screening program
During the second quarter of 2021, the recordable injury frequency rate increased with 35 recordable injuries reported up from 21 in the first quarter of 2021. One lost time injury was reported in the quarter, down from three in the first quarter of 2021, resulting in an overall improvement to the Company’s lost time injury frequency rate. Alamos strives to maintain a safe, healthy working environment for all, with a strong safety culture where everyone is continually reminded of the importance of keeping themselves and their colleagues healthy and injury-free. Throughout the quarter, the Company continued to advance implementation of its Sustainability Performance Management Framework, which includes standards specific to safety leadership and managing higher-risk activities. The Company’s overarching commitment is to have all employees and contractors return Home Safe Every Day.
The World Health Organization declared COVID-19 a pandemic on March 11, 2020. The Company responded rapidly and proactively and implemented several initiatives to help protect the health and safety of our employees, their families and the communities in which we operate.
Specifically, each mine site activated established crisis management plans and developed site-specific plans that have enabled them to meet and respond to changing conditions associated with COVID-19. The Company has adopted the advice of public health authorities and is adhering to government regulations with respect to COVID-19 in the jurisdictions in which it operates.
The following measures have been instituted at sites to prevent the potential spread of the virus:
•Medical screening for all personnel prior to entry to site for symptoms of COVID-19
•Testing of personnel at all operating sites prior to starting their work rotation
•Vaccinations offered at Island Gold for employees
•Training on proper hand hygiene and social distancing
•Remote work options have been implemented for eligible employees
•Social distancing practices have been implemented for all meetings, huddles and transportation
•Mandatory use of personal protective equipment for employees where social distancing is not practicable
•Rigid camp and site hygiene protocols have been instituted and are being followed
•Elimination of all non-essential business travel
•In addition, since the COVID-19 pandemic began the Company’s teams in Canada, Mexico, and Turkey have donated their time, medical supplies, and funds to help combat the effects and spread of the virus
COVID 19 - Impact on Operations
Given the significant precautionary measures taken by the Company, and thanks to the dedication of its employees, contractors and stakeholders, operations remain relatively unaffected by COVID-19. All the Company's operations continue to incur additional costs related to testing of personnel, lodging and transportation, which have been included in mining and processing costs. These incremental costs have increased total cash costs globally by approximately $25 per ounce and are expected to be incurred throughout 2021.
Environment
•Zero significant environmental incidents in the second quarter and year-to-date
•Advanced permitting of the Lynn Lake Project and the Phase III expansion of Island Gold – a project that will significantly increase automation and reduce fleet diesel usage resulting in 35% lower life-of-mine greenhouse gas ("GHG") emissions
•Nearing the completion of the power line which will connect the Mulatos Mine to grid power and eliminate the need for site diesel power generation, reducing GHG emissions by 12% annually
Six minor hydrocarbon spills occurred during the second quarter, including one at each of Young-Davidson and Island Gold and four at Mulatos. All spills were immediately cleaned and remediated with no anticipated long-term effects. The Company is committed to preserving the long-term health and viability of the natural environment that surround its operations and projects.
72021 Management’s Discussion and Analysis | ||||||||
This includes investing in new initiatives to reduce our environmental footprint with the goal of minimizing the environmental impacts of our activities, and offsetting any impacts that cannot be fully mitigated or rehabilitated.
Community
•Donated time, medical supplies, food supplies and funds across select operations and projects to help combat the effects and spread of COVID-19 in local communities
•Organized several community health initiatives during the second quarter in collaboration with the Matarachi community, located near the Mulatos mine. These included a COVID-19 vaccination clinic, nutrition program, visual health program, first aid training, and a cancer screening campaign
Alamos believes that excellence in sustainability provides a net benefit to all stakeholders. The Company continues to engage with local communities to understand local challenges and priorities, and to offer support during the COVID-19 pandemic. Ongoing investments in local infrastructure, health care, education, cultural and community programs has continued through the COVID-19 pandemic, with appropriate health and safety protocols.
Governance and Disclosure
•Published the Company’s 2020 Environmental, Social and Corporate Governance (ESG) Report which is available on the Company's website: www.alamosgold.com
•Issued the Company’s 2020 Extractive Sector Transparency Measures Act (ESTMA) Report, outlining payments made to governments in Canada and abroad
•Published the Company’s 2020 ESG Summary Tables in July 2021
•Compiled data for the Carbon Disclosure Project’s 2021 Climate Change Questionnaire, which will be submitted in the third quarter of 2021
Alamos maintains the highest standards of corporate governance to ensure that corporate decision-making reflects its values, including the Company’s commitment to sustainable development. During the quarter the Company continued to advance its implementation of the Responsible Gold Mining Principles, developed by the World Gold Council as a framework that sets clear expectations as to what constitutes responsible gold mining.
(1) Frequency rate is calculated as incidents per 200,000 hours worked.
2021 Business Developments
Investment Treaty Claim Against the Republic of Turkey
On April 20, 2021, the Company announced that its Netherlands wholly-owned subsidiaries Alamos Gold Holdings Coöperatief U.A, and Alamos Gold Holdings B.V. (the “Subsidiaries”) would be filing an investment treaty claim against the Republic of Turkey for expropriation and unfair and inequitable treatment, among other things, with respect to the Kirazlı, Ağı Dağı and Çamyurt gold development projects in Turkey (the "Turkish Projects"). The claim was filed under the Netherlands-Turkey Bilateral Investment Treaty (the “Treaty”). In its effort to secure the renewal of its mining licenses, the Company has attempted to work cooperatively with the Turkish government, has raised with the Turkish government its obligations under the Treaty, has sought to resolve the dispute by good faith negotiations, and has made considerable effort to build support among stakeholders and host communities. The Turkish government has failed to provide the Company with a reason for the non-renewal or a timeline for renewal of its licenses. Alamos Gold Holdings Coöperatief U.A. and Alamos Gold Holdings B.V. had its claim against the Republic of Turkey registered on June 7, 2021 with the International Centre for Settlement of Investment Disputes (World Bank Group).
Bilateral investment treaties are agreements between countries to assist with the protection of investments. The Treaty establishes legal protections for investment between Turkey and the Netherlands. The Subsidiaries directly own and control the Company’s Turkish assets. The Subsidiaries invoking their rights pursuant to the Treaty does not mean that they relinquish their rights to the Turkish project, or otherwise cease the Turkish operations. The Company will continue to work towards a constructive resolution with the Republic of Turkey.
Alamos and the Subsidiaries are being represented by the leading Canadian law firm Torys LLP, with a team that includes John Terry and former Canadian Supreme Court Justice, the Hon. Frank Iacobucci. The Company is also being supported by its strategic advisor John Baird, former Canadian Minister of Foreign Affairs and Senior Advisor to Bennett Jones LLP.
In accordance with the Company’s accounting policy, assets are tested for impairment when events or changes in circumstances suggest that the carrying amount may not be recoverable. The continued failure by the Republic of Turkey to renew the mining licenses since their expiry, and the continued failure of discussions with the Republic of Turkey to date to resolve the situation, has resulted in the decision to proceed with a bilateral investment treaty claim. The Company has concluded that an impairment trigger for accounting purposes existed in the second quarter.
The recoverable amount relating to mineral properties has been determined as nil, based on both the Fair Value Less Cost of Disposal (“FVLCD”) and Value in Use (“VIU”) methods. The FVLCD is considered to be nil on the basis that no other market
82021 Management’s Discussion and Analysis | ||||||||
participant would likely be able to progress the Turkish Projects in the face of the Treaty claim and the current state of the Company’s mining licenses. A market approach was used in estimating the FVLCD as an income approach would not be considered to provide a reliable estimate of fair value. The VIU of the Turkish Projects is also considered to be nil due to the current probability of resolving the dispute with the Republic of Turkey, and therefore the likelihood of the Turkish Projects being developed, being now considered to be remote, and therefore no future positive cash flows can be expected to be generated.
As a result, the Company incurred an after-tax impairment charge of $213.8 million for the three and six months ended June 30, 2021. The non-cash impairment charge reflects the Company’s entire net carrying value of the Turkish mineral property, plant and equipment and certain other current assets.
2020 Year-End Mineral Reserve and Resource Update
On February 23, 2021, the Company reported its updated Mineral Reserves and Resources as of December 31, 2020. Highlights include the following:
Island Gold’s Mineral Reserves and Resources increased by a combined 1.0 million ounces, net of mining depletion, including:
•8% increase in Proven and Probable Mineral Reserves to 1.3 million ounces (4.2 million tonnes (“mt”) grading 9.71 grams per tonne of gold (“g/t Au”)), net of mining depletion
•40% increase in Inferred Mineral Resources to 3.2 million ounces (6.9 mt grading 14.43 g/t Au) with grades also increasing 9% reflecting further higher grade additions in Island East
•Combined Mineral Reserves and Resources now total 4.7 million ounces, a 27% increase from the end of 2019 and 155% increase from the 1.8 million ounces at the time of acquisition in 2017, net of 508,000 ounces of mining depletion
•Growth highlights significant upside potential to Phase III Expansion Study, with the 2020 Mineral Reserve and Resource additions expected to increase already attractive economics
Global Proven and Probable Mineral Reserves increased to 9.9 million ounces of gold (204 mt grading 1.50 g/t Au), up from 9.7 million ounces at the end of 2019 with increases at Island Gold, Young-Davidson and Lynn Lake more than offsetting 555,000 ounces of mining depletion.
Global Measured and Indicated Mineral Resources of 6.9 million ounces of gold (196 mt grading 1.09 g/t Au) were down 3%, reflecting the conversion to Mineral Reserves at Young-Davidson and Lynn Lake.
Global Inferred Mineral Resources increased 16% to 7.0 million ounces of gold (132 mt grading 1.65 g/t Au), with grades also increasing 15% driven by significantly higher grade additions at Island Gold which totaled 910,000 ounces (grading 18.59 g/t Au).
92021 Management’s Discussion and Analysis | ||||||||
Outlook and Strategy
| 2021 Guidance | |||||||||||||||||||||||||||||
| Young-Davidson | Island Gold | Mulatos | Other (2) | Total | |||||||||||||||||||||||||
Gold production (000’s ounces) | 190 - 205 | 130 - 145 | 150 - 160 | 470 - 510 | |||||||||||||||||||||||||
Cost of sales, including amortization (in millions)(4) | $255 | $108 | $177 | — | $540 | ||||||||||||||||||||||||
Cost of sales, including amortization ($ per ounce)(4) | $1,290 | $785 | $1,145 | — | $1,105 | ||||||||||||||||||||||||
Total cash costs ($ per ounce)(1) | $790 - $840 | $430 - $480 | $840 - $890 | — | $710 - $760 | ||||||||||||||||||||||||
All-in sustaining costs ($ per ounce)(1) | $1,025 - $1,075 | ||||||||||||||||||||||||||||
Mine-site all-in sustaining costs ($ per ounce)(1)(3) | $1,000 - $1,050 | $750 - $800 | $1,060 - $1,110 | — | |||||||||||||||||||||||||
Amortization costs ($ per ounce)(1) | $475 | $330 | $280 | — | $370 | ||||||||||||||||||||||||
Capital expenditures (in millions) | |||||||||||||||||||||||||||||
Sustaining capital(1) | $40 - $45 | $40 - $45 | $30 - $35 | — | $110 - $125 | ||||||||||||||||||||||||
Growth capital(1) | $25 - $30 | $80 - $85 | $95 - $100 | $10 | $210 - $225 | ||||||||||||||||||||||||
Total Sustaining and Growth Capital(1) | $65 - $75 | $120 - $130 | $125 - $135 | $10 | $320 - $350 | ||||||||||||||||||||||||
Capitalized exploration(1) | $7 | $20 | — | $7 | $34 | ||||||||||||||||||||||||
Total capital expenditures and capitalized exploration(1) | $72 - $82 | $140 - $150 | $125 - $135 | $17 | $354 - $384 | ||||||||||||||||||||||||
(1)Refer to the "Non-GAAP Measures and Additional GAAP" disclosure at the end of this MD&A for a description of these measures.
(2)Includes growth capital and capitalized exploration at the Company's development projects (Turkey, Lynn Lake, Esperanza and Quartz Mountain).
(3)For the purposes of calculating mine-site all-in sustaining costs at individual mine sites, the Company does not include an allocation of corporate and administrative and share based compensation expenses to the mine sites.
(4)Cost of sales includes mining and processing costs, royalties, and amortization expense, and is calculated based on the mid-point of guidance.
The Company’s objective is to operate a sustainable business model that can support growing returns to all stakeholders over the long-term through growing production, expanding margins, and increasing profitability. This includes a balanced approach to capital allocation focused on generating strong ongoing free cash flow while re-investing in high-return internal growth opportunities and supporting higher returns to shareholders.
The Company continues to deliver on its key objectives and remains well positioned to meet full year guidance with production totaling 240,000 ounces of gold through the first half of 2021. The strong performance was led by Young-Davidson with underground mining rates continuing to meet or exceed expectations. Total cash costs and all-in sustaining costs ("AISC") in the second quarter and first half of the year were above annual guidance reflecting the impact of the stronger than budgeted Canadian dollar. Full year cost guidance was based on a USD/CAD foreign exchange rate of $0.75:1 compared to actual USD/CAD rate of $0.81:1 in the second quarter. For the first half of 2021, the stronger Canadian dollar increased company-wide total cash costs by $30 per ounce, and AISC by $45 per ounce relative to budget. Assuming the Canadian dollar remains at $0.80:1 for the remainder of the year, the Company expects total cash costs and AISC to be impacted by similar amounts.
Additionally, the Company continues to advance its high-return organic growth initiatives. Construction of the higher grade La Yaqui Grande project remains on track for commercial production in the third quarter of 2022, while development activities on the Phase III expansion at Island Gold continue to ramp up. In parallel, larger exploration programs at Island Gold and Young-Davidson are successfully extending gold mineralization, highlighting the strong potential for Mineral Reserve and Resource growth at both operations. This included the best hole ever drilled at Island Gold with high-grade mineralization extended down-plunge from existing Mineral Resources in Island East over significantly greater widths. The Company expects to continue to generate solid free cash flow while reinvesting in these high return growth initiatives and supporting its higher dividend, which has increased nearly 70% over the past year.
Gold production in the third quarter is expected to increase to between 115,000 and 125,000 ounces, driven by higher mining rates and grades at Young-Davidson, and increased production at Mulatos. Total cash costs and AISC are expected to remain at similar levels to the second quarter, before decreasing in the fourth quarter.
Production at Young-Davidson is expected to increase by 45% in 2021 (based on the mid-point of guidance), driven by significantly higher mining rates following the completion of the lower mine expansion in July 2020. The new lower mine infrastructure continues to perform well with underground mining rates averaging 7,647 tpd for the first half of 2021, exceeding guidance of 7,500 tpd. Mining rates are expected to increase to the long-term rate of 8,000 tpd in the third quarter. With first half production of 93,100 ounces, and higher mining rates and grades expected to drive production higher and costs lower in the second half of 2021, Young-Davidson remains on track to meet full year guidance. Combined with lower capital spending, this is expected to drive record mine-site free cash flow in 2021.
102021 Management’s Discussion and Analysis | ||||||||
Island Gold remains well positioned to achieve full year guidance with first half production of 75,400 ounces. As previously guided, grades decreased in the second quarter, and are expected to remain at similar levels in the third quarter. Full year grades are expected to be approximately 10 g/t Au. A total of $25 million has been budgeted for exploration at Island Gold in 2021, a significant increase from $12.9 million spent in 2020. Ongoing exploration success continues to demonstrate the significant potential for further growth in Mineral Reserves and Resources. This included the best hole drilled to date at Island Gold as released in the second quarter with 71.21 g/t Au (39.24 g/t cut) over 21.33 m (MH25-08), further extending high-grade gold mineralization down-plunge from Mineral Resources in Island East.
The Mulatos District produced 71,500 ounces in the first half of the year. With stronger production expected in the second half of 2021, the operation remains on track to meet full year guidance of between 150,000 to 160,000 ounces. Cerro Pelon, the Mulatos pits, and surface stockpiles will supply all production in 2021. In parallel, the Company continues to advance construction of the high grade La Yaqui Grande project, which remains on track for commercial production in third quarter of 2022. La Yaqui Grande is expected to keep production in the Mulatos District at approximately 150,000 ounces per year at significantly lower costs.
The Company continues to advance permitting of the Lynn Lake project, with approval of its Environmental Impact Statement ("EIS") expected mid-2022. The 2021 capital budget for Lynn Lake is $13 million, including $6 million for development activities to support the permitting process and $7 million for exploration. The Company expects to make a construction decision following the conclusion of the EIS permitting process.
In April, the Company announced that its Netherlands wholly-owned subsidiaries would proceed with an investment treaty claim against the Republic of Turkey for expropriation and unfair and inequitable treatment, among other things, with respect to the Kirazlı, Ağı Dağı and Çamyurt gold development projects in Turkey. The claim was registered with the International Centre for Settlement of Investment Disputes (World Bank Group) under the Netherlands-Turkey Bilateral Investment Treaty on June 7, 2021, and is expected to exceed $1 billion. In its effort to secure the renewal of its mining licenses, the Company has attempted to work cooperatively with the Turkish government, has raised with the Turkish government its obligations under the Treaty, has sought to resolve the dispute by good faith negotiations, and has made considerable effort to build support among stakeholders and host communities. The Turkish government has failed to provide the Company with a reason for the non-renewal or a timeline for renewal of its licenses. As a result, Alamos and the Subsidiaries incurred an after-tax impairment charge of $213.8 million in the second quarter of 2021. The non-cash impairment charge reflects the Company’s net carrying value of the Turkish Projects.
The Company's liquidity position remains strong, ending the second quarter with $233.9 million of cash and cash equivalents, $22.4 million in equity securities, and no debt. Additionally, the Company has a $500.0 million undrawn credit facility, providing $756.3 million of liquidity. The Company expects to generate ongoing free cash flow in 2021 while continuing to fund its high-return internal growth initiatives.
112021 Management’s Discussion and Analysis | ||||||||
Young-Davidson
The Young-Davidson mine is located near the town of Matachewan in Northern Ontario, Canada. The property consists of contiguous mineral leases and claims totaling 5,587 ha and is situated on the site of two past producing mines that produced over one million ounces of gold between 1934 and 1957. The Young-Davidson mine declared commercial production in 2013.
Young-Davidson Financial and Operational Review
| Three Months Ended June 30, | Six Months Ended June 30, | |||||||||||||
| 2021 | 2020 | 2021 | 2020 | |||||||||||
| Gold production (ounces) | 45,100 | 23,100 | 93,100 | 51,800 | ||||||||||
| Gold sales (ounces) | 45,284 | 22,440 | 93,306 | 51,345 | ||||||||||
| Financial Review (in millions) | ||||||||||||||
| Operating Revenues | $82.1 | $37.7 | $168.2 | $83.4 | ||||||||||
Cost of sales (1) | $61.3 | $46.2 | $123.3 | $90.0 | ||||||||||
| Earnings (loss) from operations | $20.8 | ($8.5) | $44.9 | ($6.6) | ||||||||||
| Cash provided by operating activities | $38.3 | $6.5 | $82.5 | $14.6 | ||||||||||
Capital expenditures (sustaining) (2) | $9.8 | $5.5 | $19.3 | $9.7 | ||||||||||
Capital expenditures (growth) (2) | $8.3 | $24.1 | $19.7 | $46.9 | ||||||||||
Capital expenditures (capitalized exploration) (2) | $1.5 | $— | $2.5 | $— | ||||||||||
Mine-site free cash flow (2) | $18.7 | ($23.1) | $41.0 | ($42.0) | ||||||||||
Cost of sales, including amortization per ounce of gold sold (1) | $1,354 | $2,059 | $1,321 | $1,753 | ||||||||||
Total cash costs per ounce of gold sold (2) | $941 | $1,564 | $906 | $1,299 | ||||||||||
Mine-site all-in sustaining costs per ounce of gold sold (2),(3) | $1,157 | $1,809 | $1,115 | $1,490 | ||||||||||
| Underground Operations | ||||||||||||||
| Tonnes of ore mined | 682,857 | 244,382 | 1,384,019 | 634,749 | ||||||||||
| Tonnes of ore mined per day | 7,504 | 2,686 | 7,647 | 3,488 | ||||||||||
Average grade of gold (4) | 2.22 | 2.50 | 2.23 | 2.30 | ||||||||||
| Metres developed | 2,868 | 2,894 | 6,220 | 6,095 | ||||||||||
| Mill Operations | ||||||||||||||
| Tonnes of ore processed | 688,127 | 395,289 | 1,421,348 | 860,033 | ||||||||||
| Tonnes of ore processed per day | 7,562 | 4,344 | 7,853 | 4,725 | ||||||||||
Average grade of gold (4) | 2.22 | 1.85 | 2.22 | 1.89 | ||||||||||
| Contained ounces milled | 49,134 | 23,511 | 101,670 | 52,361 | ||||||||||
| Average recovery rate | 92 | % | 93 | % | 92 | % | 92 | % | ||||||
(1)Cost of sales includes mining and processing costs, royalties and amortization.
(2)Refer to the “Non-GAAP Measures and Additional GAAP Measures” disclosure at the end of this MD&A for a description and calculation of these measures.
(3)For the purposes of calculating mine-site all-in sustaining costs, the Company does not include an allocation of corporate and administrative and share based compensation expenses.
(4)Grams per tonne of gold ("g/t Au").
Young-Davidson produced 45,100 ounces of gold in the second quarter of 2021, a significant increase from the prior year period due to the shutdown of the Northgate shaft to complete the lower mine expansion in the second quarter of 2020. First half production of 93,100 ounces was also significantly higher than the comparable period in the prior year for similar reasons.
Underground mining rates have met or exceeded targeted rates since the completion of the lower mine expansion in July 2020. Mining rates averaged 7,504 tpd in the second quarter and 7,647 tpd for the first half of 2021, meeting and exceeding the first half target of 7,500 tpd, respectively. With an additional mining horizon being added, underground mining rates are expected to increase to the long-term rate of 8,000 tpd during the third quarter.
Average mined grades of 2.22 g/t Au in the quarter were at the lower end of the range for full year guidance due to mine sequencing. Grades mined are expected to increase through the remainder of the year with the highest grades being in the fourth quarter. Full year grades are expected to average close to Young-Davidson's Mineral Reserve grade. Mill throughput averaged 7,562 tpd in the second quarter, consistent with tonnes mined. Mill recoveries averaged 92% in the quarter, in line with guidance.
Young-Davidson remains well positioned to achieve full year guidance with higher mining rates and grades expected to drive production higher and costs lower in the second half of 2021. This is expected to contribute stronger mine-site free cash flow for the remainder of 2021 assuming an $1,800 per ounce gold price.
122021 Management’s Discussion and Analysis | ||||||||
Financial Review
Second quarter revenues of $82.1 million were consistent with the first quarter of 2021, and 118% higher than the prior year period, reflecting the temporary shutdown of the Northgate shaft to complete the lower mine expansion in 2020. This also drove higher revenues for the first half of 2021 compared to 2020.
Cost of sales (which includes mining and processing costs, royalties, and amortization expense) of $61.3 million in the second quarter were consistent with the first quarter, though higher than the prior year period, due to lower mining rates during the temporary shutdown of the Northgate shaft in the prior year. Similarly, cost of sales for the first half of 2021 were higher than the prior year given lower mining rates during the shutdown period. Underground unit mining costs were CAD $49 per tonne in the quarter, consistent with the first quarter of 2021 but significantly lower than the comparative period of 2020, driven by productivity improvements following the transition to the lower mine infrastructure in July 2020. Underground mining costs are expected to trend lower in the second half of the year towards a longer term rate of approximately CAD $45 per tonne as mining rates increase to 8,000 tpd.
Total cash costs of $941 per ounce and mine-site AISC of $1,157 per ounce in the second quarter were 40% and 36% lower, respectively, than the comparative period in 2020, driven by higher throughput, lower mining and processing costs per tonne, and higher grades processed. Total cash costs in the quarter were above annual guidance reflecting the impact of the stronger Canadian dollar compared with budget, as well as the sequencing of grades mined which were planned to be lower in the first half of 2021. Total cash costs and mine-site AISC are expected to decrease in the second half of the year due to higher mining rates and grades mined.
Capital expenditures in the quarter included $9.8 million of sustaining capital and $8.3 million of growth capital. In addition, $1.5 million was invested in capitalized exploration as part of the first significant exploration program at the operation since 2011. Capital expenditures totaled $41.5 million in the first half of 2021, a 27% decrease from the prior year reflecting the completion of the lower mine expansion.
Young-Davidson has consistently met or exceeded expectations since transitioning to the new lower mine infrastructure, driving strong free cash flow growth. This included mine-site free cash flow of $18.7 million in the second quarter of 2021, and $41.0 million in the first half of 2021. Higher mining rates and grades mined are expected to drive production higher and costs lower in the second half of the year, supporting strong ongoing free cash flow generation for the remainder of 2021 and beyond.
132021 Management’s Discussion and Analysis | ||||||||
Island Gold
The Island Gold mine is a high grade, low cost underground mining operation located just east of the town of Dubreuilville, Ontario, Canada, 83km northeast of Wawa. Alamos holds 100% of all mining titles related to the Island Gold property, which comprises approximately 15,000 ha. The mine began production in October 2007.
Island Gold Financial and Operational Review
| Three Months Ended June 30, | Six Months Ended June 30, | |||||||||||||
| 2021 | 2020 | 2021 | 2020 | |||||||||||
| Gold production (ounces) | 33,200 | 19,400 | 75,400 | 58,200 | ||||||||||
| Gold sales (ounces) | 33,632 | 18,560 | 73,514 | 57,687 | ||||||||||
| Financial Review (in millions) | ||||||||||||||
| Operating Revenues | $61.1 | $31.4 | $132.6 | $93.3 | ||||||||||
Cost of sales (1) | $25.6 | $19.6 | $54.7 | $50.1 | ||||||||||
| Earnings from operations | $33.7 | $11.6 | $75.5 | $42.8 | ||||||||||
| Cash provided by operating activities | $42.9 | $25.1 | $98.4 | $66.8 | ||||||||||
Capital expenditures (sustaining) (2) | $11.0 | $5.2 | $21.6 | $13.7 | ||||||||||
Capital expenditures (growth) (2) | $13.6 | $9.5 | $25.9 | $19.1 | ||||||||||
Capital expenditures (capitalized exploration) (2) | $3.9 | $1.2 | $8.4 | $5.2 | ||||||||||
| Capital advances | $0.7 | $— | $2.8 | $— | ||||||||||
Mine-site free cash flow (2) | $13.7 | $9.2 | $39.7 | $28.8 | ||||||||||
Cost of sales, including amortization per ounce of gold sold (1) | $761 | $1,056 | $744 | $868 | ||||||||||
Total cash costs per ounce of gold sold (2) | $502 | $501 | $483 | $468 | ||||||||||
Mine-site all-in sustaining costs per ounce of gold sold (2),(3) | $830 | $781 | $777 | $706 | ||||||||||
| Underground Operations | ||||||||||||||
| Tonnes of ore mined | 117,673 | 74,485 | 220,950 | 187,366 | ||||||||||
| Tonnes of ore mined per day ("tpd") | 1,293 | 819 | 1,221 | 1,029 | ||||||||||
Average grade of gold (4) | 8.52 | 7.28 | 10.75 | 9.93 | ||||||||||
| Metres developed | 1,907 | 931 | 3,858 | 2,883 | ||||||||||
| Mill Operations | ||||||||||||||
| Tonnes of ore processed | 111,898 | 73,708 | 221,183 | 179,635 | ||||||||||
| Tonnes of ore processed per day | 1,230 | 810 | 1,222 | 987 | ||||||||||
Average grade of gold (4) | 8.85 | 8.32 | 10.91 | 10.33 | ||||||||||
| Contained ounces milled | 31,835 | 19,714 | 77,619 | 59,659 | ||||||||||
| Average recovery rate | 97 | % | 96 | % | 97 | % | 97 | % | ||||||
(1)Cost of sales includes mining and processing costs, royalties, and amortization.
(2)Refer to the “Non-GAAP Measures and Additional GAAP Measures” disclosure at the end of this MD&A for a description and calculation of these measures.
(3)For the purposes of calculating mine-site all-in sustaining costs, the Company does not include an allocation of corporate and administrative and share based compensation expenses.
(4)Grams per tonne of gold ("g/t Au").
Island Gold produced 33,200 ounces in the second quarter of 2021, a 71% increase from the comparative period, with operations temporarily shutdown during the second quarter of 2020 due to COVID-19. Through the first half of 2021, Island Gold produced 75,400 ounces, and remains well positioned to meet full year production guidance.
Underground mining rates averaged a record 1,293 tpd in the second quarter, a 58% increase from the prior year period and a 13% increase from the first quarter of 2021. Mining rates through the first half of the year averaged 1,221 tpd, consistent with the 1,200 tpd average expected in the second half of 2021. As previously guided, underground grades decreased in the second quarter and averaged 8.52 g/t Au. Grades mined are expected to remain at similar levels in the third quarter, before increasing slightly in the fourth quarter. Full year grades are expected to average approximately 10 g/t Au, consistent with Island Gold's Mineral Reserve grade.
Mill throughput averaged a record 1,230 tpd in the second quarter, and 1,222 tpd during first half of the year, both in line with full year guidance and current permitted levels. Excess ore mined during the period was stockpiled for future processing. Mill recoveries averaged 97% in the quarter, in line with annual guidance and the prior year period.
142021 Management’s Discussion and Analysis | ||||||||
Financial Review
Island Gold generated revenues of $61.1 million in the second quarter, a 95% increase compared to the prior year period, reflecting the temporary suspension of operations due to COVID-19 in 2020. For the first half of the year, revenues were $132.6 million, a 42% increase from prior year, primarily due to the higher realized gold price and more ounces sold in the current year.
Cost of sales (includes mining and processing costs, royalties and amortization expense) of $25.6 million in the second quarter and $54.7 million during the first half of 2021 were higher than the prior year comparative periods due to the temporary COVID-19 related suspension of operations in 2020. Cost of sales in the second quarter were lower than the first quarter of 2021 due to less ounces sold in the period.
Total cash costs of $502 per ounce in the second quarter were consistent with the prior year period, though higher than the first quarter of 2021, due to lower grades mined and the impact of the stronger Canadian dollar on mining and milling costs. Mine-site AISC of $830 per ounce were 6% higher than in the prior year given higher sustaining capital spending. On a year to date basis, total cash costs and mine-site AISC are in line with 2021 guidance, despite the impact of the stronger than budgeted Canadian dollar on costs.
Total capital expenditures were $28.5 million in the second quarter, including $3.9 million of capitalized exploration. Spending was focused on lateral development, engineering for the Phase III project, and surface infrastructure including completion of the tailings facility expansion. For the first half of the year, capital spending was $55.9 million inclusive of capitalized exploration of $8.4 million, an increase from prior year. In addition, Island Gold advanced $2.8 million for long lead time items supporting the Phase III expansion in the first half of 2021. Capital spending is expected to increase in the second half of the year as spending on the Phase III expansion ramps up.
Island Gold generated mine-site free cash flow of $13.7 million in the second quarter and $39.7 million in the first half of 2021, driven by strong ongoing operating margins. With capital spending expected to ramp up in the second half of the year, mine-site free cash flow is expected to be neutral for the remainder of the year.
152021 Management’s Discussion and Analysis | ||||||||
Mulatos
The Mulatos mine is located within the Salamandra Concessions in the Sierra Madre Occidental mountain range in the State of Sonora, Mexico. The Company controls a total of 28,972 hectares of mineral concessions in proximity to the Mulatos mine. The mine achieved commercial production in 2006.
Mulatos Financial and Operational Review
| Three Months Ended June 30, | Six Months Ended June 30, | |||||||||||||
| 2021 | 2020 | 2021 | 2020 | |||||||||||
| Gold production (ounces) | 35,900 | 35,900 | 71,500 | 78,500 | ||||||||||
| Gold sales (ounces) | 28,665 | 33,605 | 67,243 | 77,427 | ||||||||||
Financial Review (in millions) | ||||||||||||||
| Operating Revenues | $51.9 | $57.1 | $121.7 | $126.4 | ||||||||||
Cost of sales (1) | $40.0 | $37.5 | $88.2 | $83.5 | ||||||||||
| Earnings from operations | $10.4 | $19.2 | $30.2 | $41.2 | ||||||||||
| Cash provided by operating activities | $19.3 | $24.4 | $29.2 | $45.9 | ||||||||||
Capital expenditures (sustaining) (2) | $5.9 | $3.7 | $9.4 | $8.5 | ||||||||||
Capital expenditures (growth) (2) | $22.0 | $1.2 | $37.3 | $3.3 | ||||||||||
Capital expenditures (capitalized exploration) (2) | $1.0 | $0.2 | $1.0 | $0.7 | ||||||||||
| Capital advances | $2.7 | $— | $17.4 | $— | ||||||||||
Mine-site free cash flow (2) | ($12.3) | $19.3 | ($35.9) | $33.4 | ||||||||||
Cost of sales, including amortization per ounce of gold sold (1) | $1,395 | $1,116 | $1,312 | $1,078 | ||||||||||
Total cash costs per ounce of gold sold (2) | $893 | $750 | $906 | $785 | ||||||||||
Mine site all-in sustaining costs per ounce of gold sold (2),(3) | $1,144 | $890 | $1,084 | $929 | ||||||||||
| Open Pit Operations | ||||||||||||||
Tonnes of ore mined - open pit (4) | 800,137 | 1,132,423 | 1,711,090 | 3,050,887 | ||||||||||
Total waste mined - open pit (6) | 2,426,047 | 1,151,851 | 4,887,970 | 3,490,768 | ||||||||||
| Total tonnes mined - open pit | 3,226,184 | 2,284,275 | 6,599,060 | 6,541,655 | ||||||||||
| Waste-to-ore ratio (operating) | 2.03 | 0.81 | 1.53 | 0.67 | ||||||||||
| Crushing and Heap Leach Operations | ||||||||||||||
| Tonnes of ore stacked | 1,899,338 | 1,410,888 | 3,733,124 | 3,444,000 | ||||||||||
Average grade of gold processed (5) | 1.11 | 1.41 | 1.02 | 1.32 | ||||||||||
| Contained ounces stacked | 67,697 | 64,111 | 122,420 | 146,044 | ||||||||||
| Average recovery rate | 53 | % | 56 | % | 58 | % | 54 | % | ||||||
| Ore crushed per day (tonnes) - combined | 20,900 | 15,500 | 20,600 | 18,923 | ||||||||||
(1)Cost of sales includes mining and processing costs, royalties, and amortization.
(2)Refer to the “Non-GAAP Measures and Additional GAAP Measures” disclosure at the end of this MD&A for a description and calculation of these measures.
(3)For the purposes of calculating mine-site all-in sustaining costs, the Company does not include an allocation of corporate and administrative and share based compensation expenses.
(4)Includes ore stockpiled during the quarter.
(5)Grams per tonne of gold ("g/t Au").
(6)Total waste mined includes operating waste and capitalized stripping, but excludes tonnes mined at La Yaqui Grande.
Mulatos produced 35,900 ounces in the second quarter, in line with the prior year quarter, reflecting higher tonnes stacked on the leach pad, offset by lower grades mined and stacked. For the first half of 2021, Mulatos produced 71,500 ounces, a 9% decrease driven by lower grades mined primarily from Cerro Pelon. With stronger production expected in the second half of 2021, Mulatos is on track to meet annual production guidance.
Tonnes of ore mined in the second quarter decreased compared to the prior year period, with mining activities within the main Mulatos pit focused on pre-stripping the El Salto portion of the pit and increased mining rates within the Cerro Pelon pit. Total tonnes mined is exclusive of pre-stripping activities at La Yaqui Grande, where an additional 5.1 million tonnes of waste was mined in the quarter.
Total crusher throughput in the second quarter averaged 20,900 tpd for a total of 1,899,338 tonnes stacked at a grade of 1.11 g/t Au, both consistent with annual guidance. Tonnes stacked in the quarter exceeded tonnes mined due to the processing of lower recovery surface stockpiles, which were mined in previous years. Grades stacked were 21% lower than in the prior year period which had benefited from higher grade ore from the Cerro Pelon pit. The recovery rate of 53% in the quarter reflected the higher proportion of surface stockpiles processed in the period. The average recovery rate through the first half of 2021 was 58%, consistent with annual guidance.
162021 Management’s Discussion and Analysis | ||||||||
Financial Review
Revenues of $51.9 million in the second quarter were lower than the prior year period driven by fewer ounces sold. The number of ounces sold were lower than production due to the timing of shipments. These ounces were sold subsequent to quarter end and will be realized in the third quarter. For the first six months, revenues of $121.7 million were consistent with the prior year, as fewer ounces sold were offset by a higher realized gold price.
Cost of sales (includes mining and processing costs, royalties and amortization expense) of $40.0 million in the second quarter were higher than in the comparative period, primarily due to higher processing costs related to surface stockpiles and higher amortization charges in the period. Amortization per ounce was higher in the quarter given the proportion of ore coming from Cerro Pelon which carries a higher amortization charge, as well as the impact of straight line depreciation on lower sales in the quarter. Total cash costs of $893 per ounce were higher than in the prior year period as a result of lower grades stacked, and an increasing proportion of surface stockpiles processed which carry a higher cost per ounce. The surface stockpiles include historical inventory costs of approximately $150 per ounce, which were incurred in previous years as these tonnes were mined. Mine-site AISC of $1,144 per ounce in the quarter was higher than in the prior year period, consistent with the increase in total cash costs.
Capital spending totaled $28.9 million in the second quarter, of which $5.9 million was sustaining capital primarily related to capitalized stripping at El Salto. Growth capital of $22.0 million was primarily related to pre-stripping and construction activities at La Yaqui Grande. An additional $2.7 million of capital advances were made to vendors for equipment. During the first half of 2021, Mulatos incurred $47.7 million of capital spending primarily on capitalized stripping at El Salto and project advancement of La Yaqui Grande.
Mulatos generated mine-site free cash flow of $12.4 million, before spending of $24.7 million of growth capital and capital advances related to La Yaqui Grande. Including all capital spending, mine-site free cash flow was negative $12.3 million reflecting the ramp up of construction activities and the timing of cash tax payments. Mulatos paid $6.2 million in taxes in the quarter related to 2021 installment payments, and $24.4 million in the first half of the year related to 2020 year end income and mining taxes and 2021 installment payments. The Company does not anticipate additional cash taxes in the second half of 2021.
Second Quarter 2021 Development Activities
Island Gold (Ontario, Canada)
Phase III Expansion Study
On July 14, 2020 the Company reported results of the positive Phase III expansion study conducted on its Island Gold mine. Based on the results of the study, the Company is proceeding with an expansion of the operation to 2,000 tpd. This follows a detailed evaluation of several scenarios which demonstrated the shaft expansion as the best option, having the strongest economics, being the most efficient and productive, and the best positioned to capitalize on further growth in Mineral Reserves and Resources. The Phase III expansion is expected to drive average annual gold production to 236,000 ounces per year starting in 2025 upon completion of the shaft, representing a 70% increase from 2020 production. This will also reduce total cash costs to an average of $403 per ounce and mine-site all-in sustaining costs to $534 per ounce to starting in 2025.
The Phase III expansion study was based on Mineral Reserves and Resources at Island Gold as of December 31, 2019 and does not include the significant growth over the past year as outlined in the 2020 year end Mineral Reserve and Resource statement. Incorporating this growth is expected to improve already attractive economics. This growth included an 8% increase in Mineral Reserves to 1.3 million ounces of gold (4.2 mt grading 9.71 g/t Au) and a 0.9 million ounce, or 40%, increase in Inferred Mineral Resources to 3.2 million ounces with grades also increasing 9% to 14.43 g/t Au (6.9 mt).
The Company is currently focused on permitting and detailed engineering of the shaft and associated infrastructure, including the hoisting plant and surface civil works. Project tendering and contract awarding remains ongoing, with procurement of long lead time items underway. Phase III permitting is anticipated to be completed in 2022 with the pre-sink for the shaft expected to begin in mid-2022.
During the second quarter of 2021, the Company spent $13.6 million on surface infrastructure, including completing an expansion of the tailings facility, as well as advancing capitalized development, and detailed engineering and permitting activities. Growth capital spending through the first half of the year totaled $25.9 million. Capital spending is expected to increase through the remainder of the year, consistent with full year growth capital guidance of between $80 to $85 million.
172021 Management’s Discussion and Analysis | ||||||||
Mulatos District (Sonora, Mexico)
La Yaqui Grande
On July 28, 2020, the Company reported results of an internal study completed on its fully permitted La Yaqui Grande project located in the Mulatos District in Sonora, Mexico. La Yaqui Grande is located approximately 7 kilometres (straight line) from the existing Mulatos operation and adjacent to the past producing La Yaqui Phase I operation. As with La Yaqui Phase I, La Yaqui Grande is being developed with an independent heap leach pad and crushing circuit.
La Yaqui Grande is expected to produce an average of 123,000 ounces of gold per year starting in the third quarter of 2022 at mine-site all-in sustaining costs of $578 per ounce, significantly reducing the Mulatos District all-in sustaining costs from the mid-point of 2021 guidance of $1,085 per ounce. This will replace higher cost production from the main Mulatos pit, keeping combined production at approximately 150,000 ounces per year. Initial capital is expected to be $137 million to be spent over a two year period.
Construction activities continued to ramp up in the second quarter of 2021 with the project on track to achieve commercial production in the third quarter of 2022. Capital spending increased to $21.0 million in the quarter bringing total capital spent since the start of construction to $48.0 million. In addition, the Company advanced $17.4 million in the first half of 2021 to contractors.
Second quarter highlights at La Yaqui Grande included:
•Safely advanced construction activities with approximately 800 employees and contractors on rotation and more than 1,000,000 hours worked in the first half of 2021 with no lost time injuries
•Over five million tonnes of waste mined with mining rates increasing to average over 56,000 tpd in the quarter. Mining rates are expected to increase to over 60,000 tpd in the second half of 2021
•Crusher area concrete poured and all major crushing equipment has been received at site
•Leach pad construction over 60% complete, access road from the pit to the leach pad area complete facilitating waste to be used in construction of the pad
•Installation of liners in the pregnant and barren solution ponds underway
•Initiated procurement on long lead items for the water treatment plant
La Yaqui Grande Heap Leach Facility
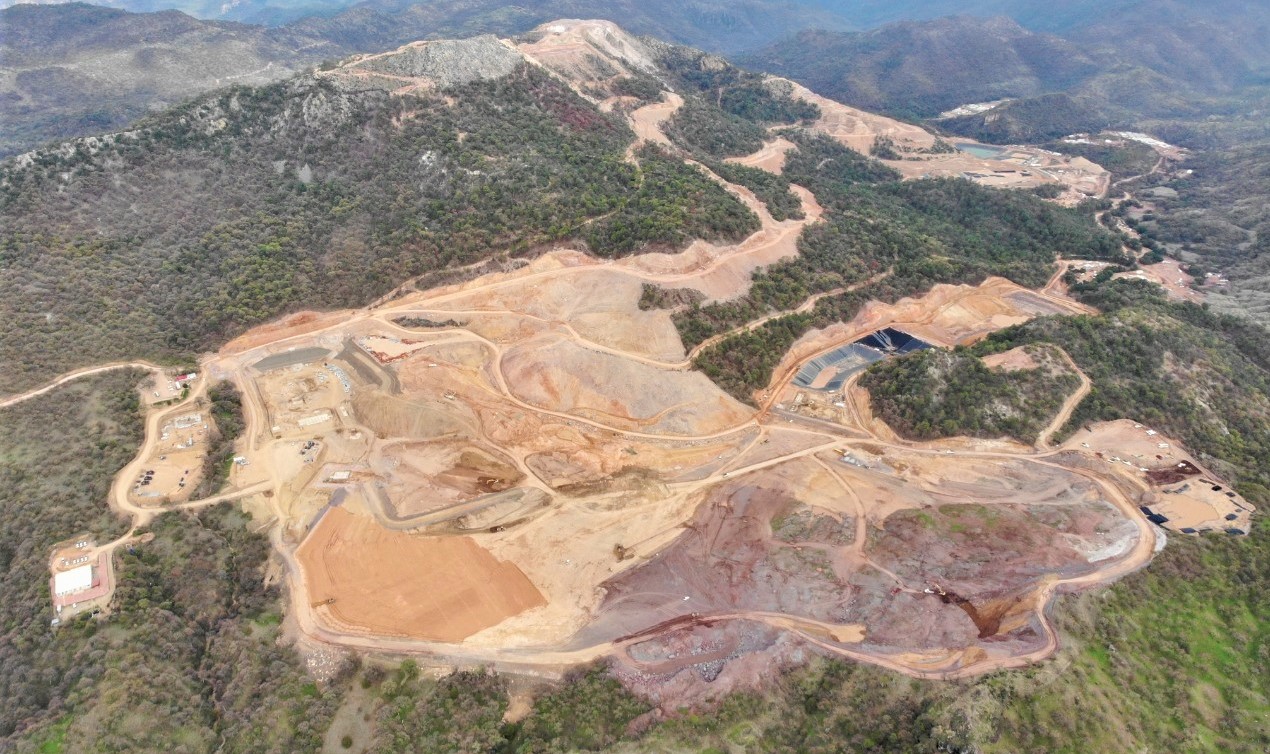 18
182021 Management’s Discussion and Analysis | ||||||||
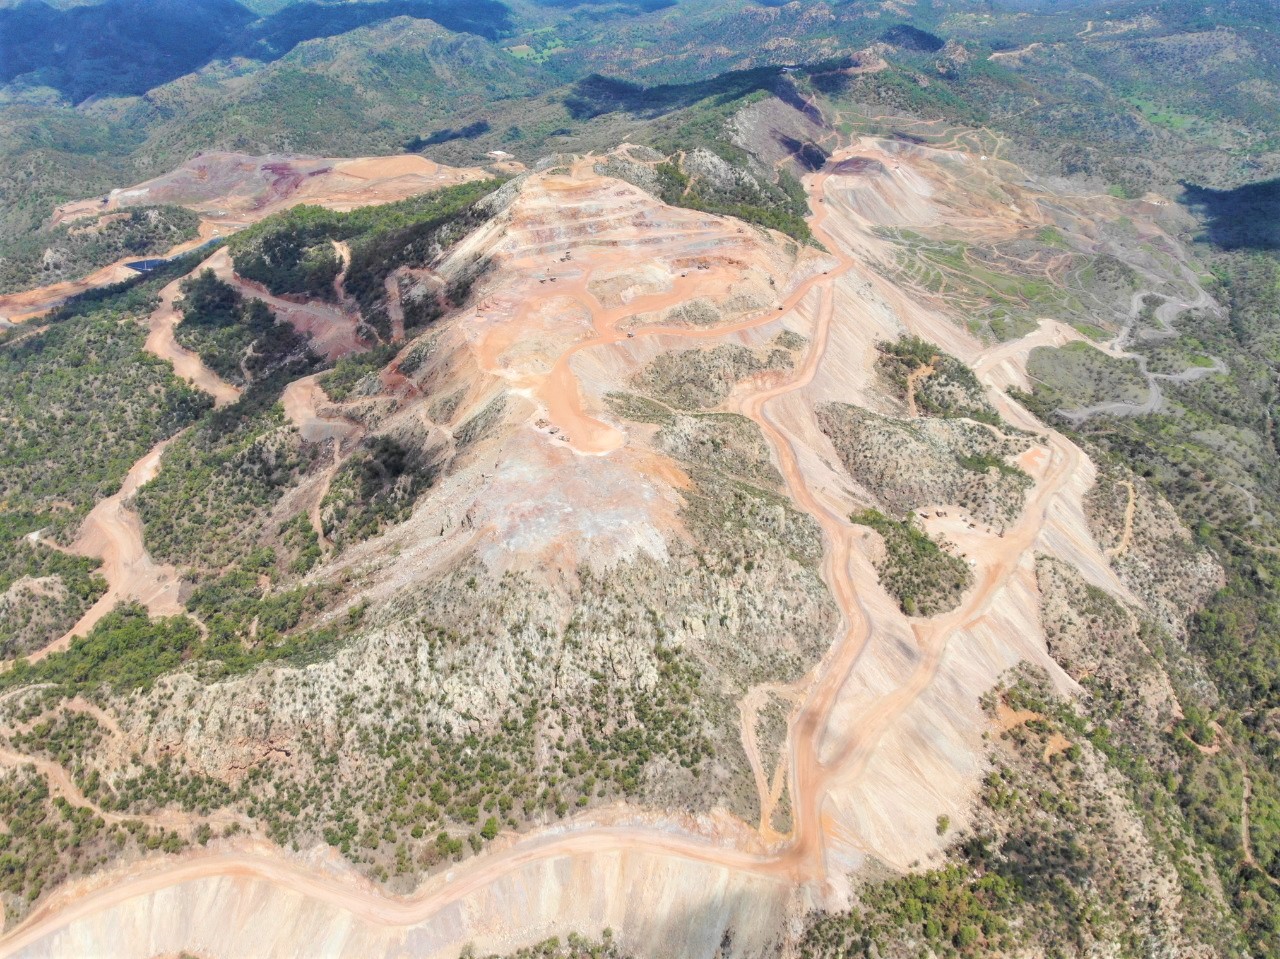
La Yaqui Grande - Open Pit Pre-stripping
Lynn Lake (Manitoba, Canada)
The Company released a positive Feasibility Study on the Lynn Lake project in December 2017 outlining average annual production of 143,000 ounces over a 10 year mine life at average mine-site all-in sustaining costs of $745 per ounce.
The project economics based on the 2017 Feasibility Study at a $1,500 per ounce gold price include an after-tax IRR of 21.5% and an after-tax NPV of $290 million (12.5% IRR at a $1,250 per ounce gold price). During the second quarter of 2020, the Company filed the Environmental Impact Statement ("EIS") with the federal government. The federal and provincial permitting process is expected to take approximately two years, with a construction decision planned for 2022.
Development spending (excluding exploration) was $0.8 million in the second quarter of 2021 to support the ongoing permitting process and engineering.
Kirazlı (Çanakkale, Turkey)
On October 14, 2019, the Company suspended all construction activities on its Kirazlı project following the Turkish government's failure to grant a routine renewal of the Company’s mining licenses, despite the Company having met all legal and regulatory requirements for their renewal. In October 2020, the Turkish government refused the renewal of the Company’s Forestry Permit. The Company had been granted approval of all permits required to construct Kirazlı including the Environmental Impact Assessment approval, Forestry Permit, and GSM (Business Opening and Operation) permit, and certain key permits for the nearby Ağı Dağı and Çamyurt Gold Mines. These permits were granted by the Turkish government after the project earned the support of the local communities and passed an extensive multi-year environmental review and community consultation process.
192021 Management’s Discussion and Analysis | ||||||||
On April 20, 2021, the Company announced that its Netherlands wholly-owned subsidiaries Alamos Gold Holdings Coöperatief U.A, and Alamos Gold Holdings B.V. (the “Subsidiaries”) would be filing an investment treaty claim against the Republic of Turkey for expropriation and unfair and inequitable treatment, among other things, with respect to the Kirazlı, Ağı Dağı and Çamyurt gold development projects in Turkey. The claim was filed under the Netherlands-Turkey Bilateral Investment Treaty (the “Treaty”). Alamos Gold Holdings Coöperatief U.A. and Alamos Gold Holdings B.V. had its claim against the Republic of Turkey registered on June 7, 2021 with the International Centre for Settlement of Investment Disputes (World Bank Group).
In its effort to secure the renewal of its mining licenses, the Company has attempted to work cooperatively with the Turkish government, has raised with the Turkish government its obligations under the Treaty, has sought to resolve the dispute by good faith negotiations, and has made considerable effort to build support among stakeholders and host communities. The Turkish government has failed to provide the Company with a reason for the non-renewal or a timeline for renewal of its licenses.
Alamos has had an active presence in Turkey since 2010. Over that time frame, the Company’s Turkish operations have met all legal and regulatory requirements, complied with best practices relating to sustainable development including meeting the highest environmental and social management standards, created hundreds of jobs, and developed trusting relationships with the local communities. Alamos and the Subsidiaries have invested over $250 million in Turkey, unlocked over a billion dollars worth of project value, and contributed over $20 million in royalties, taxes and forestry fees to the Turkish government. Over the life of the project, government revenues alone are expected to total $551 million. Additionally, Alamos and the Subsidiaries have invested $25 million to date towards various community and social initiatives.
Bilateral investment treaties are agreements between countries to assist with the protection of investments. The Treaty establishes legal protections for investment between Turkey and the Netherlands. The Subsidiaries directly own and control the Company’s Turkish assets. The Subsidiaries invoking their rights pursuant to the Treaty does not mean that they relinquish their rights to the Turkish project, or otherwise cease the Turkish operations. The Company will continue to work towards a constructive resolution with the Republic of Turkey.
Alamos and the Subsidiaries are being represented by the leading Canadian law firm Torys LLP, with a team that includes John Terry and former Canadian Supreme Court Justice, the Hon. Frank Iacobucci. The Company is also being supported by its strategic advisor John Baird, former Canadian Minister of Foreign Affairs and Senior Advisor to Bennett Jones LLP.
As a result, the Company incurred an after-tax impairment charge of $213.8 million for the three and six months ended June 30, 2021. The non-cash impairment charge reflects the Company’s entire net carrying value of the Turkish mineral property, plant and equipment and certain other current assets.
In addition, the Company incurred approximately $1.4 million in the period for severances, legal costs, and ongoing holding costs which have been expensed. Going forward, the Company expects holding costs will be approximately $1.0 to $2.0 million per year during the Treaty claim process.
202021 Management’s Discussion and Analysis | ||||||||
Second Quarter 2021 Exploration Activities
Island Gold (Ontario, Canada)
The 2021 exploration drilling program is focused on expanding high-grade mineralization in the down-plunge and lateral extensions of the Island Gold deposit with the objective of adding new near-mine Mineral Resources across the two kilometre long Island Gold deposit. The Company continued its strong track record of exploration success and Mineral Reserve and Resource growth in 2020, with an 8% increase in Mineral Reserves to 1.3 million ounces of gold (4.2 mt grading 9.71 g/t Au) and a 0.9 million ounce, or 40% increase in Inferred Mineral Resources to 3.2 million ounces with grades also increasing 9% to 14.43 g/t Au (6.9 mt).
Surface diamond drilling programs continued with four drill rigs operating in the second quarter. This included three surface directional rigs focused on mine exploration, and one focused on testing regional exploration targets. One underground exploration diamond drill operated at the beginning of the quarter and two additional drill rigs were added in May to focus on underground directional drilling. A total of 4,654 m of surface directional drilling, 4,132 m of surface regular drilling, 2,656 m of underground directional drilling and 2,610 m of standard underground exploration drilling was completed in the second quarter of 2021.
Surface exploration drilling
A total of 4,654 m of surface directional drilling was completed in seven holes during the second quarter as part of the surface directional drilling program. Directional drilling targeted areas peripheral to the Inferred Mineral Resource blocks below the 1,000 m level, with drill hole spacing ranging from 75 m to 100 m. The area that was targeted by the surface directional drill program extends approximately 2,000 m in strike length between the 1,000 m and 1,500 m elevation below surface. A total of 4,132 m of regional diamond drilling program was completed in seven holes within the quarter. The drill rig was transferred to the surface directional program in June. Drilling for the regional program will resume in the third quarter.
Previously reported (June 15, 2021) highlights from the second quarter surface exploration drilling program in Island East (E1E-Zone) include:
•71.21 g/t Au (39.24 g/t cut) over 21.33 m (MH25-08); and
•34.87 g/t Au (34.87 g/t cut) over 5.98 m (MH25-07).
Drillhole MH25-08 (71.21 g/t Au (39.24 g/t cut) over 21.33 m) intersected significantly wider, high-grade mineralization 45 m and 80 m from previously reported drillholes MH25-04 (28.97 g/t Au (27.96 g/t cut) over 21.76 m) and MH25-05 (54.18 g/t Au (33.12 g/t cut) over 6.54 m), respectively.
In addition, drillhole MH25-08 extended high-grade mineralization 20 m east of the existing Inferred Mineral Resource block which contained 1,309,700 ounces, grading 18.26 g/t Au (2.23 million tonnes) as of December 31, 2020. Using the cut weighted gold grade for metal factor calculation, drillhole MH25-08 (71.21 g/t Au (39.24 g/t cut) over 21.33 m) is the best hole drilled to date at Island Gold in terms of gold content for a drill hole intersect. Drillhole MH25-07 (34.87 g/t Au (34.87 g/t cut) over 5.98 m) also further extended high-grade mineralization at Island East, intersecting high-grade mineralization 60 m above MH25-04, and 40 m from the nearest Inferred Mineral Resource block.
Underground exploration drilling
During the second quarter of 2021, 2,656 m of underground directional drilling was completed in six holes from the 620 and 740 levels. A total of 2,610 m of standard underground exploration drilling was completed in 15 holes from the 620, 740 and 840 levels. The objective of the underground drilling is to identify new Mineral Resources close to existing Mineral Resource or Reserve blocks. A total of 103 m of underground exploration drift development was completed on the 400, 490 and 790 levels during the second quarter of 2021.
Previously reported (June 15, 2021) highlights from the second quarter underground exploration drilling program in Island East and West (E1E-Zone) include:
Island East:
•8.88 g/t Au (8.88 g/t cut) over 8.45 m (840-584-03); and
•16.75 g/t Au (16.75 g/t cut) over 2.64 m (840-590-10).
Island West:
•31.58 g/t Au (28.74 g/t cut) over 2.43 m (740-471-41).
212021 Management’s Discussion and Analysis | ||||||||
Total exploration expenditures during the second quarter were $5.7 million, of which $3.9 million was capitalized. For the first half of 2021, $10.8 million of exploration expenditures were incurred, with $8.4 million capitalized.
Young-Davidson (Ontario, Canada)
A total of $7.0 million has been budgeted for Young-Davidson for 2021, representing the first significant exploration program since 2011, with the focus of the last several years being on the completion of the lower mine expansion. Underground exploration drilling during the second quarter was focused on two targets with 3,816 m completed in eight holes. Drilling from the 8960-level exploration drill bay established in the lower mine infrastructure is continuing to target to the west and down-plunge of existing Mineral Reserves and Resources. Drilling is targeting syenite-hosted mineralization and is also continuing to test mineralization in the footwall sediments and in the hanging wall mafic-ultramafic stratigraphy. A second underground drill is also testing exploration targets in the eastern extent of the mine from the 9590-level drill bay.
Since commencing underground exploration drilling in 2020, the program has been successful in extending syenite-hosted gold mineralization 220 m below the previous Mineral Resource (year-end 2019), contributing to an increase in Inferred Mineral Resources to 0.2 million ounces in the year-end 2020 Mineral Reserve and Resource update. Exploration drilling in 2021 has further extended syenite-hosted gold mineralization another 150 m below existing Mineral Resources and Reserves (YMEX21-8960-021).
High-grade gold mineralization was also intersected in structures both within the hanging wall ultramafic-mafic stratigraphy, and within the footwall sediments. Further drilling will be completed to evaluate the geometry and continuity of the mineralized structures. These initial exploration results outside of the Young-Davidson syenite highlight the significant near-mine exploration potential at Young-Davidson.
Previously reported (July 12, 2021) highlights from the 2020 and 2021 underground exploration drilling program at Young-Davidson include:
•5.32 g/t Au (3.35 g/t cut) over 39.20 m (34.57 m true width) including 21.96 g/t Au (9.78 g/t cut) over 6.20 m (5.47 m true width) (YMEX20-8960-008)1;
•5.42 g/t Au over 12.75 m (11.25 m true width) including 32.30 g/t Au over 0.65 m (0.57 m true width) (YMEX21-8960-016);
•4.36 g/t Au over 9.00 m (YMEX21-8960-021);
•5.79 g/t Au over 13.70 m including 24.14 g/t Au over 1.85m (YMEX20-8960-014); and
•8.32 g/t Au over 6.30 m (3.84 m true width) including 22.50 g/t Au over 1.20 m (0.73 m true width) (YMEX20-8960-011)1.
1 Drillhole completed in 2020 and included in year-end 2020 Mineral Reserves and Mineral Resources for Young-Davidson.
Drillhole YMEX20-8960-008 intersected 5.32 g/t Au (3.35 g/t cut) over 39.20 m (34.57 m true width) including 21.96 g/t Au (9.78 g/t cut) over 6.20 m (5.47 m true width) within syenite. The syenite remains open to the northwest and southeast, as well as down-dip, and within the 90 m gap above this intersection and below the Mineral Reserve and Mineral Resource above.
Drillhole YMEX20-8960-014 intersected a high-grade structure 200 m south of hanging wall contact of the syenite within ultramafic-mafic lithologies beyond the limits of any previous drilling. This structure returned 5.79 g/t over 13.70 m including 24.14 g/t Au over 1.85m.
Drillhole YMEX21-8960-016 intersected 5.42 g/t Au over 12.75 m (11.25 m true width) including 32.30 g/t Au over 0.65m (0.57 m true width) within syenite. Mineralization within the syenite remains open in this area to the southeast and down-dip.
Drillhole YMEX20-8960-011 intersected 8.32 g/t Au over 6.30 m (3.84 m true width), including 22.5 g/t over 1.20 m (0.73 m true width) in a shear zone developed within the footwall sediments, 100 m from the contact with the syenite.
Exploration spending totaled $1.5 million in the second quarter and $2.5 million in the first half of 2021, all of which was capitalized.
Mulatos District (Sonora, Mexico)
The Company has a large exploration package covering 28,972 hectares with the majority of past exploration efforts focused around the Mulatos mine. Exploration has moved beyond the main Mulatos pit area and is focused on earlier stage prospects throughout the wider district.
During the second quarter of 2021, exploration activities were focused on the near-mine, Puerto del Aire trend with 2,640 m of drilling completed in eleven drill holes. Regional targets at Carricito and Los Ciegos were also tested with nine holes completed totaling 2,428 m. Exploration activities continued on the Los Venados property, pursuant to an option agreement with Aloro Mining, with sixteen drill holes completed in the quarter for a total of 1,822 m, and surface mapping and sampling is ongoing. A
222021 Management’s Discussion and Analysis | ||||||||
restart of drilling in the El Halcon area completed six drillholes for 966 m. During the second quarter, the Company incurred $2.5 million of exploration spending, of which $1.0 million was capitalized. For the first half of 2021, $4.3 million was incurred, with $1.0 million capitalized.
Lynn Lake (Manitoba, Canada)
In the second quarter of 2021, 9,396 m of drilling was completed in forty-four holes at MacLellan, Gordon, Burnt Timber, and on two regional targets. The 2021 summer field season also commenced, with the focus on continuing to advance a pipeline of prospective regional exploration targets. Exploration spending totaled $3.0 million in the second quarter, and $4.2 million year-to-date which was capitalized.
Key External Performance Drivers
Gold Price
The Company’s financial performance is largely dependent on the price of gold, which directly affects the Company’s profitability and cash flow. The price of gold is subject to volatile price movements and is affected by numerous factors, such as the strength of the US dollar, supply and demand, interest rates, and inflation rates, all of which are beyond the Company’s control. During the second quarter of 2021, the Company realized an average gold price of $1,814 per ounce, in line with the average London PM Fix price of $1,816 per ounce.
As at June 30, 2021, the Company had 30,000 ounces hedged for the second half of 2021 which ensure a minimum average realized gold price of $1,700 per ounce and a maximum average realized gold price of $1,948 per ounce, regardless of the movement in gold prices during the period. In addition, the Company has hedged 4,500 ounces of Q1 2022 production which ensure a minimum average realized gold price of $1,725 per ounce and a maximum average realized gold price of $2,030 per ounce.
Foreign Exchange Rates
At the Company’s mine sites, a significant portion of operating costs and capital expenditures are denominated in foreign currencies, including Mexican pesos and Canadian dollars. Fluctuations in the value of these foreign currencies compared to the US dollar can significantly impact the Company’s costs and cash flow. In the second quarter of 2021, the Canadian dollar averaged approximately $1.23 CAD to $1 USD, compared to $1.27 CAD to $1 USD in the first quarter of 2021. The Mexican peso ("MXN") averaged 20.02 MXN to $1 USD in the second quarter of 2021 compared to 20.34 MXN to $1 USD in the first quarter of 2021.
The Company recorded a foreign exchange gain of $0.5 million in the second quarter related to the translation of the Company's net monetary assets resulting from changes in period-end foreign exchange rates. The Canadian Dollar strengthened 2% relative to the US dollar, ending at $1.24 CAD to $1 USD at June 30, 2021 compared to a rate of $1.26 CAD to $1 USD at March 31, 2021. The Mexican peso strengthened 3% to 19.86 MXN to $1 USD at June 30, 2021 compared to a rate of 20.51 MXN to $1 USD at March 31, 2021.
In addition, the movement of the CAD and MXN rates generated a non-cash foreign exchange gain of $5.5 million in the second quarter of 2021 and $8.0 million for the first half of 2021, on the revaluation of monetary tax and deferred tax balances, which is recorded within deferred tax expense.
The Company actively manages its currency exposure through a hedging program, which resulted in a realized foreign exchange gain of $1.6 million during the second quarter. The Company applies hedge accounting; accordingly, these realized gains and losses have been applied against operating and capital costs at the operating mines.
232021 Management’s Discussion and Analysis | ||||||||
Summarized Financial and Operating Results
| (in millions, except ounces, per share amounts, average realized prices, AISC and total cash costs) | |||||||||||||||||
| Three Months Ended June 30, | Six Months Ended June 30, | ||||||||||||||||
| 2021 | 2020 | 2021 | 2020 | ||||||||||||||
| Gold production (ounces) | 114,200 | 78,400 | 240,000 | 189,300 | |||||||||||||
Gold sales (ounces) | 107,581 | 74,605 | 234,063 | 186,459 | |||||||||||||
| Operating Revenues | $195.1 | $126.2 | $422.5 | $303.1 | |||||||||||||
Cost of sales(1) | $126.9 | $103.3 | $266.2 | $223.6 | |||||||||||||
| (Loss) earnings from operations | ($168.5) | $12.1 | ($92.2) | $58.3 | |||||||||||||
| (Loss) earnings before income taxes | ($172.7) | $6.0 | ($97.6) | $46.5 | |||||||||||||
| Net (loss) earnings | ($172.5) | $11.7 | ($121.3) | ($0.6) | |||||||||||||
Adjusted net earnings (2) | $38.7 | $9.8 | $87.8 | $39.2 | |||||||||||||
| (Loss) earnings per share, basic | ($0.44) | $0.03 | ($0.31) | $0.00 | |||||||||||||
Adjusted earnings per share (2) | $0.10 | $0.03 | $0.22 | $0.10 | |||||||||||||
| Total assets | $3,513.9 | $3,504.7 | |||||||||||||||
| Total non-current liabilities | 653.1 | 711.2 | |||||||||||||||
| Cash flow from operations | $86.7 | $49.6 | $186.0 | $106.2 | |||||||||||||
| Dividends per share, declared and paid | 0.025 | 0.015 | 0.05 | 0.03 | |||||||||||||
| Average realized gold price per ounce | $1,814 | $1,692 | $1,805 | $1,626 | |||||||||||||
Cost of sales per ounce of gold sold, including amortization (1) | $1,180 | $1,385 | $1,137 | $1,199 | |||||||||||||
Total cash costs per ounce of gold sold (2) | $791 | $933 | $773 | $829 | |||||||||||||
All-in sustaining costs per ounce of gold sold (2) | $1,136 | $1,276 | $1,079 | $1,117 | |||||||||||||
(1) Cost of sales includes mining and processing costs, royalties and amortization. For the three and six months ended June 30, 2020, cost of sales also includes COVID-19 costs of $6.5 million.
(2) Refer to the “Non-GAAP Measures and Additional GAAP Measures” disclosure at the end of this MD&A for a description and calculation of these measures.
Review of Second Quarter Financial Results
Operating Revenue
During the second quarter of 2021, the Company sold 107,581 ounces of gold for revenue of $195.1 million, a 55% increase from the prior year period driven by higher realized gold prices and more ounces sold. Ounces sold were lower than production in the current period due to timing of shipments at the Mulatos mine, which were sold in the third quarter. Sales were lower in the second quarter of 2020 due to the temporary shutdown of the Northgate shaft at Young-Davidson to facilitate the tie in of the lower mine infrastructure, as well as temporary suspensions of both Island Gold and Mulatos due to the COVID-19 pandemic.
The average realized gold price in the second quarter was $1,814 per ounce, a 7% increase compared to $1,692 per ounce realized in the prior year period. The average realized gold price was in line with the average London PM Fix price of $1,816 per ounce.
Cost of Sales
Cost of sales were $126.9 million in the second quarter, 23% higher than the prior year period.
Mining and Processing
Mining and processing costs were $82.1 million, 21% higher than the comparative period. The increase in mining costs was the result of reduced mining activity at Island Gold and Mulatos in the prior year quarter due to the impact of COVID-19, and at Young Davidson due to the shutdown of the Northgate shaft to complete the lower mine construction. Further, additional costs have been incurred in 2021 related to COVID-19 preventative measures, and the impact of a stronger Canadian dollar on reported costs. This has been partially offset by lower mining and processing costs per tonne at Young-Davidson and Island Gold as a result of operational efficiencies.
Consolidated total cash costs of $791 per ounce and AISC of $1,136 per ounce in the quarter were both substantial decreases compared to the prior year period as prior year costs were impacted negatively by the temporary suspension of operations. This has been partially offset by the impact of the stronger Canadian dollar on reported total cash costs and AISC in 2021.
242021 Management’s Discussion and Analysis | ||||||||
Royalties
Royalty expense was $3.0 million in the quarter, higher than the prior year period of $1.7 million due to higher ounces sold in the period.
Amortization
Amortization of $41.8 million in the quarter was higher than the prior year period due to higher amortization charges at all three operations given the increase in production in the quarter. Amortization of $389 per ounce was 7% higher than the prior year reflecting higher amortization per ounce at Mulatos, driven by Cerro Pelon production which carries a higher amortization charge per ounce. In addition, amortization increased following the completion of the lower-mine tie-in at Young-Davidson in mid 2020, which resulted in commencing amortization of the new lower-mine infrastructure.
Impairment charge
In accordance with the Company’s accounting policy, assets are tested for impairment when events or changes in circumstances suggest that the carrying amount may not be recoverable. The continued failure by the Republic of Turkey to renew the mining licenses since their expiry, and the continued failure of discussions with the Republic of Turkey to date to resolve the situation, has resulted in the decision to proceed with a bilateral investment treaty claim. The Company has concluded that an impairment trigger for accounting purposes existed in the second quarter.
The recoverable amount relating to mineral properties has been determined as nil, based on both the FVLCD and VIU methods. The FVLCD is considered to be nil on the basis that no other market participant would likely be able to progress the Project in the face of the Treaty claim and the current state of the Company’s mining licenses. A market approach was used in estimating the FVLCD as an income approach would not be considered to provide a reliable estimate of fair value. The VIU of the Project is also considered to be nil due to the current probability of resolving the dispute with the Republic of Turkey, and therefore the likelihood of the Project being developed, being now considered to be remote, and therefore no future positive cash flows can be expected to be generated.
As a result, the Company incurred an impairment charge of $224.3 million ($213.8 million after tax) for the three and six months ended June 30, 2021. The non-cash impairment charge reflects the Company’s entire net carrying value of the Turkish mineral property, plant and equipment and certain other current assets. Refer to note 9 of the Company's unaudited condensed interim consolidated financial statements for the three and six months ended June 30, 2021 for further details.
(Loss) Earnings from Operations
The Company recognized a loss from operations of $168.5 million in the quarter, a significant increase from the prior year driven by the impairment of the Turkish Projects.
Net (Loss) Earnings
The Company reported a net loss of $172.5 million in the quarter, compared to net earnings of $11.7 million in the comparative period. The decrease in net earnings from the prior year quarter is due to the non-cash impairment charge of $224.3 million related to the Turkish Projects, partially offset by higher operating revenue and margins realized. On an adjusted basis, earnings of $38.7 million, or $0.10 per share, were higher compared to the prior year quarter primarily driven by improved operating margins. Adjusted earnings reflect adjustments for the Turkey impairment charge and other one-time gains and losses, as well as foreign exchange movements.
Review of Six Months Financial Results
Operating Revenue
For the first half of 2021, the Company sold 234,063 ounces of gold for revenues of $422.5 million, a 39% increase from the prior year period driven by higher realized gold prices and more ounces sold. The 26% increase in ounces sold was primarily due to the temporary shutdown of the Northgate shaft at Young-Davidson to facilitate the tie in of the lower mine infrastructure in the first quarter of 2020 as well as the temporary shut down at both Island Gold and Mulatos in the second quarter of 2020 in response to COVID-19. In addition, the average realized gold price in the first half of the year of $1,805 per ounce was 11% higher than $1,626 per ounce realized in the prior year period.
Cost of Sales
Year-to-date cost of sales were $266.2 million, an increase from $223.6 million in the prior year period.
Mining and Processing
Mining and processing costs increased to $174.8 million from $150.4 million in the prior year period. The increase in mining costs was driven by significantly higher mining rates at Young-Davidson in 2021. In addition, the stronger Canadian dollar and Mexican
252021 Management’s Discussion and Analysis | ||||||||
peso, as well as costs related to COVID-19 preventative measures at all three operations have increased cost of sales compared to the prior year.
Consolidated total cash costs in the first half of the year were $773 per ounce compared to $829 per ounce in the prior year period. The decrease in total cash costs was primarily driven by lower unit mining costs at Young-Davidson, as well as higher grades mined at Island Gold in the first half of the year, partially offset by the impact of foreign exchange and COVID-19 preventative costs.
AISC of $1,079 per ounce was in line with the prior year period, with lower total cash costs offset by higher sustaining capital expenditures and the impact of foreign exchange.
Royalties
Royalty expense was $6.1 million, a 49% increase compared to $4.1 million in the prior year period, due to more ounces sold and a higher realized gold price.
Amortization
Amortization of $85.3 million for the first half of 2021 was higher than in the prior year due to more ounces sold. On a per ounce basis, amortization was $364 per ounce, a 9% increase compared to the first half of 2020 due to higher amortization charges at Mulatos.
Impairment charges
Impairment charges of $224.3 million recorded in the second quarter of 2021 reflects the Company’s entire net carrying value of the Turkish Projects.
(Loss) Earnings from Operations
The Company recognized a loss from operations of $92.2 million, compared to earnings of $58.3 million in the prior year period. The decrease in earnings from operations was mainly due to the impairment charge of $224.3 million related to the Turkish Projects, offset by a 39% increase in revenues and stronger operating margins.
Net (Loss) Earnings
The Company reported a net loss of $121.3 million in the first half of 2021 compared to a net loss of $0.6 million in the prior year period. The higher net loss in the current period was due to the impairment charge related to the Turkish Projects, partially offset by higher earnings from operations and a lower effective tax rate. In the prior year period, the significant volatility in the Canadian dollar and Mexican peso resulted in a $26.7 million foreign exchange loss recorded in deferred tax expense, which increased the effective tax rate and negatively impacted net earnings. In 2021, the impact was a $8.0 million foreign exchange gain. On an adjusted basis, earnings of $87.8 million or $0.22 per share for the first half of 2021 were 124% higher than in the prior year, driven by more ounces sold and higher operating margins. Adjusted earnings reflect adjustments for the Turkish impairment charge, other one-time gains and losses, as well as foreign exchange movements recorded in deferred taxes and foreign exchange loss.
Consolidated Expenses and Other
| (in millions) | ||||||||||||||
| Three Months Ended June 30, | Six Months Ended June 30, | |||||||||||||
| 2021 | 2020 | 2021 | 2020 | |||||||||||
| Exploration expense | ($3.8) | ($1.1) | ($6.7) | ($3.1) | ||||||||||
| Corporate and administrative expense | (6.3) | (4.1) | (12.4) | (10.3) | ||||||||||
| Share-based compensation expense | (2.3) | (5.6) | (5.1) | (7.8) | ||||||||||
| Finance expense | (1.0) | (1.2) | (2.0) | (2.0) | ||||||||||
| Foreign exchange gain (loss) | 0.5 | 0.2 | 0.3 | (4.9) | ||||||||||
| Other loss | (3.7) | (5.1) | (3.7) | (4.9) | ||||||||||
Exploration
Exploration expense mainly relates to expenditures on early-stage exploration projects and corporate exploration support. Expenses incurred in the second quarter and the first half of 2021 mainly related to activities at Mulatos and corporate support, as the majority of spending at Island Gold and Young-Davidson was capitalized.
262021 Management’s Discussion and Analysis | ||||||||
Corporate and administrative
Corporate and administrative costs include expenses relating to the overall management of the business that are not part of direct mine operating costs. These costs are incurred at the corporate office located in Canada. Corporate and administrative costs were higher than the year period due to a higher personnel costs, a stronger Canadian dollar, and the impact of the pandemic on the prior year corporate costs.
Share-based compensation
Share-based compensation expense of $2.3 million in the second quarter, and $5.1 million for the first half of 2021 were both lower compared to the prior year periods due to the impact of a lower share price on the revaluation of outstanding cash-based long-term incentives.
Finance expense
Finance expense was consistent with the prior year period and primarily relates to standby fees on the credit facility and accretion of the decommissioning liability.
Foreign exchange loss
A foreign exchange gain of $0.5 million was recorded in the second quarter, higher than the prior year quarter due to the impact of the strengthening Canadian dollar in the current period. In the prior year periods, both the Canadian dollar and Mexican peso weakened significantly against the US dollar during the period.
The Company applies hedge accounting to its Canadian and Mexican foreign currency option and forward contracts, which reduces the impact of unrealized foreign exchange movements on net earnings. During the second quarter, the Company realized a gain of $1.6 million on settled foreign exchange contracts. In addition, the outstanding contracts had a mark-to-market loss of $1.0 million, net of tax, which is recorded within other comprehensive income.
The Company will continue to experience non-cash foreign currency gains or losses on monetary assets and liabilities, primarily as a result of fluctuations between the US dollar and both the Canadian dollar and Mexican peso.
Other loss
Other losses in the second quarter of 2021 include an unrealized mark-to-market loss of $1.2 million on gold option contracts, charges related to the Turkey BIT claim and related severances, and other one-time charges.
Consolidated Income Tax Expense
The Company is subject to tax in various jurisdictions, including Mexico and Canada. There are a number of factors that can significantly impact the Company’s effective tax rate including the geographic distribution of income, varying rates in different jurisdictions, the non-recognition of tax assets, mining allowances, foreign currency exchange rate movements, changes in tax laws and the impact of specific transactions and assessments. Due to the number of factors that can potentially impact the effective tax rate and the sensitivity of the tax provision to these factors, it is expected that the Company’s effective tax rate will fluctuate in future periods.
In the first half of 2021, the Company recognized a current tax expense of $8.6 million and a deferred tax expense of $15.1 million, compared to a current tax expense of $8.8 million and deferred tax expense of $38.3 million in the same period of 2020. The current income tax expense in 2021 primarily related to income tax expense in Mexico and is consistent with the prior year. The deferred tax expense was primarily driven by the increased use of tax pools compared to accounting depreciation, offset by the deferred tax adjustment due to the Turkey impairment and changes to foreign exchange rates during the period.
The Company's Mulatos mine in Mexico, as well as the Young-Davidson and Island Gold mines in Canada, pay income taxes based on their tax functional currency which is the Mexican peso and Canadian dollar, respectively. The legal entity financial statements for Mulatos, Young-Davidson and Island Gold include foreign exchange and other income items that differ from the US dollar functional currency financial statements. The total foreign exchange impact recorded within taxes in the first half of 2021 was a $8.0 million recovery (2020 - $26.7 million expense).
272021 Management’s Discussion and Analysis | ||||||||
Financial Condition
| June 30, 2021 | December 31, 2020 | |||||||||||||
| Current assets | $494.0 | $473.4 | Current assets increased compared to the prior year, primarily driven by an increase in cash and cash equivalents and other current assets. The increase in cash and cash equivalents is mainly attributable to free cash flow generated at the mine-sites during the first half of the year, and proceeds of $25.8 million from the sale of equity securities. In addition, other assets have increased due to capital advances to contractors related to La Yaqui Grande in Mexico and the Phase III expansion at Island Gold. | |||||||||||
| Long-term assets | 3,019.9 | 3,163.1 | The decrease in long-term assets was driven by the impairment of the Turkish Projects in the second quarter of 2021, which reduced mineral property, plant, and equipment by $218.8 million, partially offset by capital expenditures in the year. | |||||||||||
| Total assets | $3,513.9 | $3,636.5 | ||||||||||||
| Current liabilities | $149.8 | $146.9 | Current liabilities are slightly higher due to higher trade payables offset by a reduction in income tax payables due to payments made in the first half of the year in Mexico. | |||||||||||
| Non-current liabilities | 653.1 | 638.1 | Non-current liabilities are higher than the prior year as a result of an increase in the deferred income tax liability driven by a significant increase in earnings before income taxes, offset by the reversal of deferred tax liabilities related to the Turkish Projects. | |||||||||||
| Total liabilities | $802.9 | $785.0 | ||||||||||||
| Shareholders’ equity | $2,711.0 | $2,851.5 | The decrease in Shareholders' equity was driven by the net loss generated during the first half due to the impairment charge on the Turkish Projects. In addition, dividends issued and shares repurchased under the NCIB reduced shareholder's equity. | |||||||||||
| Total liabilities and equity | $3,513.9 | $3,636.5 | ||||||||||||
Liquidity and Capital Resources
The Company’s strategy is based on achieving positive cash flow from operations to internally fund operating, capital and project development requirements, generate returns for its shareholders, and bolster the balance sheet. Material increases or decreases in the Company’s liquidity and capital resources will be substantially determined by the success or failure of the Company’s operations, exploration, and development programs, the ability to obtain equity or other sources of financing, the price of gold, and currency exchange rates.
As at June 30, 2021, the Company had cash and cash equivalents of $233.9 million and $22.4 million in equity securities, compared to $220.5 million and $43.7 million, respectively, at December 31, 2020. In addition, the Company has access to $500.0 million of liquidity available under its credit facility. In the opinion of management, the Company's liquidity position of $756.3 million at June 30, 2021 comprised of cash and cash equivalents, equity securities and availability under the credit facility, together with cash flows from operations, is sufficient to support the Company's normal operating requirements and capital commitments on an ongoing basis.
Cash Flow
| (in millions) | ||||||||||||||
| Three Months Ended June 30, | Six Months Ended June 30, | |||||||||||||
| 2021 | 2020 | 2021 | 2020 | |||||||||||
| Cash flow provided by operating activities | $86.7 | $49.6 | $186.0 | $106.2 | ||||||||||
| Cash flow used in investing activities | (83.0) | (56.9) | (154.8) | (175.0) | ||||||||||
| Cash flow used in financing activities | (8.5) | (6.6) | (18.6) | 88.6 | ||||||||||
| Effect of foreign exchange rates on cash | 0.5 | 0.5 | 0.8 | (1.3) | ||||||||||
| Net (decrease) increase in cash | (4.3) | (13.4) | 13.4 | 18.5 | ||||||||||
| Cash and cash equivalents, beginning of period | 238.2 | 214.7 | 220.5 | 182.8 | ||||||||||
| Cash and cash equivalents, end of period | $233.9 | $201.3 | $233.9 | $201.3 | ||||||||||
282021 Management’s Discussion and Analysis | ||||||||
Cash flow provided by operating activities
In the second quarter of 2021, operating activities generated cash flow of $86.7 million compared to $49.6 million in the same period in 2020, a 75% increase driven by more ounces sold and higher operating margins. Cash flow from operations decreased from the first quarter of 2021 given lower sales in the period. Cash flow from operating activities in the first half of 2021 included cash tax payments in Mexico of $24.4 million relating to 2020 income and mining taxes as well as 2021 tax installments.
Cash flow provided by operations before working capital and taxes paid was $97.2 million in the second quarter compared to $44.7 million in the prior year period. Working capital changes in the quarter mainly reflected cash tax installment payments in Mexico and inventory movements. The Company does not anticipate significant additional cash taxes in the second half of 2021.
For the first half of 2021, operating activities generated $186.0 million, compared to $106.2 million in the prior year, mainly due to more ounces sold as the prior year operating and financial results were impacted by downtime caused by COVID-19.
Cash flow used in investing activities
In the second quarter of 2021, capital expenditures of $83.5 million were higher than expenditures of $54.6 million in the second quarter of 2020. The increase was driven by the ramp up of construction activities at La Yaqui Grande and higher capital spending at Island Gold, partially offset by lower spending at Young-Davidson, as the lower mine expansion was completed in the third quarter of 2020. For the first half of the year, the Company invested $156.1 million on capital expenditures compared to $117.9 million in the prior year period. In addition, investing activities in the first half of 2021 included $20.2 million in capital advances related to La Yaqui Grande and the Island Gold Phase III project.
Other significant investing activities included the disposition of various equity securities held, generating proceeds of $5.1 million and in the quarter $25.8 million in the first half of the year. In addition, the Company purchased $1.2 million in shares in other public companies during the quarter and $4.3 million in the first half of the year.
Cash flow used in financing activities
During the quarter, the Company declared a dividend of $0.025 per share, consistent with the first quarter dividend, bringing the year-to-date dividends paid to $19.6 million. Of this amount, $17.2 million was paid in cash and the remainder was issued in shares pursuant to the Company's dividend reinvestment plan. In addition, the Company also repurchased and cancelled 200,262 shares in the first half of the year for $1.5 million or $7.35 per share.
Credit Facility
The Company has access to an undrawn credit facility (the "Facility") of $500.0 million. The Facility bears interest at a rate of Libor plus 1.875% on drawn amounts and stand-by fees of 0.42% on undrawn amounts. The Facility expires in December 2023.
The Facility is secured against all of the material present and future assets, property and undertakings of the Company. The Facility contains various covenants customary for a loan facility of this nature, including limits on indebtedness, asset sales and liens. It contains financial covenant tests that include (a) a minimum interest coverage ratio of 3.0:1.0 and (b) a maximum net leverage ratio of 3.5:1.0, both as defined in the agreement. As at June 30, 2021, the Company is in compliance with the covenants.
Outstanding Share Data
| July 27, 2021 | |||||
| Common shares | 392,944,199 | ||||
| Stock options | 4,601,726 | ||||
| Deferred share units | 1,017,720 | ||||
| Performance share units | 1,319,202 | ||||
| Restricted share units | 2,525,538 | ||||
| 402,408,385 | |||||
Related party transactions
There were no related party transactions during the year other than those disclosed in the Company’s condensed interim consolidated financial statements for the three and six months ended June 30, 2021.
292021 Management’s Discussion and Analysis | ||||||||
Off-Balance Sheet Arrangements
The Company does not have any off-balance sheet arrangements.
Financial Instruments
The Company seeks to manage its exposure to fluctuations in commodity prices, fuel prices and foreign exchange rates by entering into derivative financial instruments from time to time.
Commodity option and forward contracts
As at June 30, 2021, the Company held option contracts to protect against the risk of a decrease in the value of the gold price on a portion of gold sales.
The following gold collar contracts are outstanding as of June 30, 2021:
| Period Covered | Contract type | Ounces subject to contract | Average purchase put option | Average sold call option | ||||||||||
| H2 2021 | Collars | 30,000 | $1,700 | $1,948 | ||||||||||
| Q1 2022 | Collars | 4,500 | $1,725 | $2,030 | ||||||||||
The fair value of these contracts was an asset of $0.2 million as at June 30, 2021 (December 31, 2020 - nil). For the three and six months ended June 30, 2021, the Company realized a gain of $0.2 million and $0.5 million related to the settlement of option contracts which is recorded in operating revenues (for the three and six months ended June 30, 2020 - realized losses of $2.6 million and $0.1 million). The Company recorded an unrealized loss of $1.2 million and gain $0.1 million for the three and six months ended June 30, 2021 (for the three and six months ended June 30, 2020 recorded an unrealized loss of $5.0 million and $5.3 million). The Company has elected to not apply hedge accounting to gold option contracts, with changes in fair value recorded in net earnings.
Foreign currency contracts
As at June 30, 2021, the Company held option contracts to protect against the risk of an increase in the value of the Canadian dollar and Mexican peso versus the US dollar. These option contracts are for the purchase of local currencies and the sale of US dollars, which settle on a monthly basis, and are summarized as follows:
Canadian dollar contracts
| Period Covered | Contract type | Contracts (CAD$ Millions) | Average minimum rate (USD/CAD) | Average maximum rate (USD/CAD) | |||||||||||||
| H2 2021 | Collars | 75.0 | 1.24 | 1.29 | |||||||||||||
Mexican Peso contracts
| Period Covered | Contract type | Contracts (MXN Millions) | Average minimum rate (MXN/USD) | Average maximum rate (MXN/USD) | |||||||||||||
| H2 2021 | Collars | 1,080.0 | 20.62 | 23.76 | |||||||||||||
| H1 2022 | Collars | 105.0 | 20.50 | 23.15 | |||||||||||||
The fair value of these contracts was an asset of $2.6 million at June 30, 2021 (December 31, 2020 - asset of $4.3 million). For the three and six months ended June 30, 2021, the Company realized gains of $1.6 million and $2.6 million on the foreign currency contracts (for the three and six months ended June 30, 2020 - realized loss of $1.5 million and $2.0 million) which has been applied against operating and capital costs.
Fuel contracts
The Company enters into option contracts to hedge against the risk of an increase in the price of diesel fuel. These option contracts are for the purchase of New York Harbour Ultra Low Sulfur Diesel ("ULSD") contracts, which settle on a monthly basis, and the Company believes this is an appropriate manner of managing price risk.
302021 Management’s Discussion and Analysis | ||||||||
As at June 30, 2021, the Company has hedged 756,000 gallons of diesel at a range of $1.25 to $1.65 per gallon for the remainder of 2021 and 252,000 gallons of diesel at a range of $1.75 to $1.95 per gallon for 2022.
For the three and six months ended June 30, 2021, the Company recorded an unrealized gain of $0.2 million and $0.4 million in accumulated other comprehensive income related to the fuel hedges (for the three and six months ended June 30, 2020, the Company recorded an unrealized gain of $0.3 million and an unrealized loss of $0.5 million).
Summary of Quarterly Financial and Operating Results
| Q2 2021 | Q1 2021 | Q4 2020 | Q3 2020 | Q2 2020 | Q1 2020 | Q4 2019 | Q3 2019 | |||||||||||||||||||
Gold ounces produced | 114,200 | 125,800 | 120,400 | 117,100 | 78,400 | 110,800 | 122,100 | 121,900 | ||||||||||||||||||
Gold ounces sold | 107,581 | 126,482 | 121,831 | 116,035 | 74,605 | 111,854 | 127,148 | 119,392 | ||||||||||||||||||
| Operating Revenues | $195.1 | $227.4 | $226.6 | $218.4 | $126.2 | $176.9 | $186.0 | $172.9 | ||||||||||||||||||
| (Loss) earnings from operations | ($168.5) | $76.3 | $81.3 | $88.0 | $12.1 | $46.2 | $41.6 | $37.5 | ||||||||||||||||||
| Net (loss) earnings | ($172.5) | $51.2 | $76.9 | $67.9 | $11.7 | ($12.3) | $38.0 | $17.7 | ||||||||||||||||||
| (Loss) earnings per share, basic | ($0.44) | $0.13 | $0.20 | $0.17 | $0.03 | ($0.03) | $0.10 | $0.05 | ||||||||||||||||||
Adjusted net earnings (1) | $38.7 | $49.1 | $58.2 | $56.9 | $9.8 | $29.4 | $32.1 | $23.4 | ||||||||||||||||||
Adjusted earnings per share, basic (1) | $0.10 | $0.13 | $0.15 | $0.14 | $0.03 | $0.08 | $0.08 | $0.06 | ||||||||||||||||||
Earnings before interest, taxes, depreciation and amortization (1) | $94.4 | $119.6 | $133.6 | $130.5 | $40.9 | $76.7 | $88.4 | $78.4 | ||||||||||||||||||
| Cash provided by operating activities | $86.7 | $99.3 | $131.4 | $130.8 | $49.6 | $56.6 | $77.8 | $67.9 | ||||||||||||||||||
| Average realized gold price | $1,814 | $1,798 | $1,860 | $1,882 | $1,692 | $1,582 | $1,463 | $1,448 | ||||||||||||||||||
(1)Refer to the “Non-GAAP Measures and Additional GAAP Measures” disclosure at the end of this MD&A for a description and calculation of these measures.
For the past eight quarters, production and gold ounces sold have been relatively consistent, with the exception of the second quarter of 2020. Production was lowest in the second quarter of 2020, driven by temporary suspensions at both Island Gold and Mulatos due to COVID-19, and lower production at Young-Davidson as the lower mine tie-in was completed. Operations returned to full capacity in the third and fourth quarters of 2020, leading to higher production at Young-Davidson following completion of the lower mine tie-in during the first half of 2021. Ounces sold in the second quarter of 2021 were lower due to the timing of shipments at one of the operations.
(Loss) earnings from operations and cash flow from operating activities have continuously improved since the third quarter of 2019, apart from the second quarter of 2021 as a result of a higher gold price and lower operating costs, resulting in higher margins on ounces produced and positive cash flow from operations. The loss from operations in the second quarter of 2021 was driven by a one-time non-cash impairment charge of $224.3 million, representing the entire carrying value of the Turkish Projects. The fourth quarter of 2020 represented record adjusted net earnings, cash flow from operations and earnings before interest, taxes, depreciation and amortization.
Non-GAAP Measures and Additional GAAP Measures
The Company has included certain non-GAAP financial measures to supplement its Consolidated Financial Statements, which are presented in accordance with IFRS, including the following:
•adjusted net earnings and adjusted earnings per share;
•cash flow from operating activities before changes in working capital and taxes received;
•company-wide free cash flow;
•total mine-site free cash flow;
•mine-site free cash flow;
•net cash;
•total cash cost per ounce of gold sold;
•all-in sustaining cost ("AISC") per ounce of gold sold;
•mine-site all-in sustaining cost ("Mine-site AISC") per ounce of gold sold;
•sustaining and non-sustaining capital expenditures; and
312021 Management’s Discussion and Analysis | ||||||||
•earnings before interest, taxes, depreciation, and amortization
The Company believes that these measures, together with measures determined in accordance with IFRS, provide investors with an improved ability to evaluate the underlying performance of the Company. Non-GAAP financial measures do not have any standardized meaning prescribed under IFRS, and therefore they may not be comparable to similar measures employed by other companies. The data is intended to provide additional information and should not be considered in isolation or as a substitute for measures of performance prepared in accordance with IFRS. Management's determination of the components of non-GAAP and additional measures are evaluated on a periodic basis influenced by new items and transactions, a review of investor uses and new regulations as applicable. Any changes to the measures are dully noted and retrospectively applied as applicable.
Adjusted Net Earnings and Adjusted Earnings per Share
“Adjusted net earnings” and “adjusted earnings per share” are non-GAAP financial measures with no standard meaning under IFRS which exclude the following from net earnings:
•Foreign exchange gain (loss)
•Items included in other gain (loss)
•Certain non-reoccurring items
•Foreign exchange gain (loss) recorded in deferred tax expense
•The income and mining tax impact of items included in other gain (loss)
Net earnings have been adjusted, including the associated tax impact, for the group of costs in “other loss” on the consolidated statement of comprehensive income. Transactions within this grouping are: the fair value changes on non-hedged derivatives; the renunciation of flow-through exploration expenditures; loss on disposal of assets; severance costs related to Turkish projects; and Turkish projects holding costs and arbitration costs. The adjusted entries are also impacted for tax to the extent that the underlying entries are impacted for tax in the unadjusted net earnings.
The Company uses adjusted net earnings for its own internal purposes. Management’s internal budgets and forecasts and public guidance do not reflect the items which have been excluded from the determination of adjusted net earnings. Consequently, the presentation of adjusted net earnings enables shareholders to better understand the underlying operating performance of the core mining business through the eyes of management. Management periodically evaluates the components of adjusted net earnings based on an internal assessment of performance measures that are useful for evaluating the operating performance of our business and a review of the non-GAAP measures used by mining industry analysts and other mining companies.
Adjusted net earnings is intended to provide additional information only and does not have any standardized meaning under IFRS and may not be comparable to similar measures presented by other companies. It should not be considered in isolation or as a substitute for measures of performance prepared in accordance with IFRS. The measure is not necessarily indicative of operating profit or cash flows from operations as determined under IFRS. The following table reconciles this non-GAAP measure to the most directly comparable IFRS measure.
| (in millions) | |||||||||||||||||
| Three Months Ended June 30, | Six Months Ended June 30, | ||||||||||||||||
| 2021 | 2020 | 2021 | 2020 | ||||||||||||||
| Net (loss) earnings | ($172.5) | $11.7 | ($121.3) | ($0.6) | |||||||||||||
| Adjustments: | |||||||||||||||||
| Impairment charge, net of taxes | 213.8 | — | 213.8 | — | |||||||||||||
| COVID-19 costs | — | 6.5 | — | 6.5 | |||||||||||||
| Foreign exchange (gain) loss | (0.5) | (0.2) | (0.3) | 4.9 | |||||||||||||
| Other loss | 3.7 | 5.1 | 3.7 | 4.9 | |||||||||||||
| Unrealized foreign exchange (gain) loss recorded in deferred tax expense | (5.5) | (10.1) | (8.0) | 26.7 | |||||||||||||
| Other income tax and mining tax adjustments | (0.3) | (3.2) | (0.1) | (3.2) | |||||||||||||
| Adjusted net earnings | $38.7 | $9.8 | $87.8 | $39.2 | |||||||||||||
| Adjusted earnings per share - basic and diluted | $0.10 | $0.03 | $0.22 | $0.10 | |||||||||||||
Cash Flow from Operating Activities before Changes in Working Capital and Cash Taxes
“Cash flow from operating activities before changes in working capital and cash taxes” is a non-GAAP performance measure that could provide an indication of the Company’s ability to generate cash flows from operations, and is calculated by adding back the change in working capital and taxes received to “Cash provided by (used in) operating activities” as presented on the Company’s
322021 Management’s Discussion and Analysis | ||||||||
consolidated statements of cash flows. “Cash flow from operating activities before changes in working capital” is a non-GAAP financial measure with no standard meaning under IFRS.
The following table reconciles the non-GAAP measure to the consolidated statements of cash flows.
| (in millions) | ||||||||||||||
| Three Months Ended June 30, | Six Months Ended June 30, | |||||||||||||
| 2021 | 2020 | 2021 | 2020 | |||||||||||
| Cash flow from operating activities | $86.7 | $49.6 | $186.0 | $106.2 | ||||||||||
| Add: Changes in working capital and cash taxes | 10.5 | (4.9) | 30.8 | 20.2 | ||||||||||
| Cash flow from operating activities before changes in working capital and cash taxes | $97.2 | $44.7 | $216.8 | $126.4 | ||||||||||
Company-wide Free Cash Flow
“Company-wide free cash flow" is a non-GAAP performance measure calculated from the consolidated operating cash flow, less consolidated mineral property, plant and equipment expenditures. The Company believes this to be a useful indicator of our ability to operate without reliance on additional borrowing or usage of existing cash company-wide. Company-wide free cash flow is intended to provide additional information only and does not have any standardized meaning under IFRS and may not be comparable to similar measures of performance presented by other mining companies. Company-wide free cash flow should not be considered in isolation or as a substitute for measures of performance prepared in accordance with IFRS.
| (in millions) | ||||||||||||||
| Three Months Ended June 30, | Six Months Ended June 30, | |||||||||||||
| 2021 | 2020 | 2021 | 2020 | |||||||||||
| Cash flow from operating activities | $86.7 | $49.6 | $186.0 | $106.2 | ||||||||||
Less: mineral property, plant and equipment expenditures (1) | (83.5) | (54.6) | (156.1) | (117.9) | ||||||||||
| Less: capital advances | (3.4) | — | (20.2) | — | ||||||||||
| Company-wide free cash flow | ($0.2) | ($5.0) | $9.7 | ($11.7) | ||||||||||
Mine-site Free Cash Flow
"Mine-site free cash flow" is a non-GAAP financial performance measure calculated as cash flow from mine-site operating activities, less mineral property, plant and equipment expenditures. The Company believes this to be a useful indicator of our ability to operate without reliance on additional borrowing or usage of existing cash. Mine-site free cash flow is intended to provide additional information only and does not have any standardized meaning under IFRS and may not be comparable to similar measures of performance presented by other mining companies. Mine-site free cash flow should not be considered in isolation or as a substitute for measures of performance prepared in accordance with IFRS.
| Total Mine-Site Free Cash Flow | ||||||||||||||
| Three Months Ended June 30, | Six Months Ended June 30, | |||||||||||||
| 2021 | 2020 | 2021 | 2020 | |||||||||||
| (in millions) | ||||||||||||||
| Cash flow from operating activities | $86.7 | $49.6 | $186.0 | $106.2 | ||||||||||
| Add: operating cash flow used by non-mine site activity | 13.8 | 6.4 | 24.1 | 21.1 | ||||||||||
| Cash flow from operating mine-sites | $100.5 | $56.0 | $210.1 | $127.3 | ||||||||||
Mineral property, plant and equipment expenditure 1 | $83.5 | $54.6 | $156.1 | $117.9 | ||||||||||
| Capital advances | 3.4 | — | 20.2 | — | ||||||||||
| Less: capital expenditures from development projects, and corporate | (6.5) | ($4.0) | (11.0) | (10.8) | ||||||||||
| Capital expenditure and capital advances from mine-sites | $80.4 | $50.6 | $165.3 | $107.1 | ||||||||||
| Total mine-site free cash flow | $20.1 | $5.4 | $44.8 | $20.2 | ||||||||||
(1)Excludes a royalty repurchase of $54.8 million at Island Gold in the first quarter of 2020
332021 Management’s Discussion and Analysis | ||||||||
| Young-Davidson Mine-Site Free Cash Flow | ||||||||||||||
| Three Months Ended June 30, | Six Months Ended June 30, | |||||||||||||
| 2021 | 2020 | 2021 | 2020 | |||||||||||
| (in millions) | ||||||||||||||
| Cash flow from operating activities | $38.3 | $6.5 | $82.5 | $14.6 | ||||||||||
| Mineral property, plant and equipment expenditure | (19.6) | (29.6) | (41.5) | (56.6) | ||||||||||
| Mine-site free cash flow | $18.7 | ($23.1) | $41.0 | ($42.0) | ||||||||||
| Island Gold Mine-Site Free Cash Flow | ||||||||||||||
| Three Months Ended June 30, | Six Months Ended June 30, | |||||||||||||
| 2021 | 2020 | 2021 | 2020 | |||||||||||
| (in millions) | ||||||||||||||
| Cash flow from operating activities | $42.9 | $25.1 | $98.4 | $66.8 | ||||||||||
Mineral property, plant and equipment expenditure 1 | (28.5) | (15.9) | (55.9) | (38.0) | ||||||||||
| Capital advances | (0.7) | — | (2.8) | — | ||||||||||
| Mine-site free cash flow | $13.7 | $9.2 | $39.7 | $28.8 | ||||||||||
(1)Excludes a royalty repurchase of $54.8 million at Island Gold in the first quarter of 2020
| Mulatos Mine-Site Free Cash Flow | ||||||||||||||
| Three Months Ended June 30, | Six Months Ended June 30, | |||||||||||||
| 2021 | 2020 | 2021 | 2020 | |||||||||||
| (in millions) | ||||||||||||||
| Cash flow from operating activities | $19.3 | $24.4 | $29.2 | $45.9 | ||||||||||
| Mineral property, plant and equipment expenditure | (28.9) | (5.1) | (47.7) | (12.5) | ||||||||||
| Capital advances | (2.7) | — | (17.4) | — | ||||||||||
| Mine-site free cash flow | ($12.3) | $19.3 | ($35.9) | $33.4 | ||||||||||
Net Cash
The Company defines net cash as cash and cash equivalents less long-term debt.
Total Cash Costs per ounce
Total cash costs per ounce is a non-GAAP term typically used by gold mining companies to assess the level of gross margin available to the Company by subtracting these costs from the unit price realized during the period. This non-GAAP term is also used to assess the ability of a mining company to generate cash flow from operations. Total cash costs per ounce includes mining and processing costs plus applicable royalties, and net of by-product revenue and net realizable value adjustments. This metric excludes COVID-19 costs incurred in the period. Total cash costs per ounce is exclusive of exploration costs.
Total cash costs per ounce is intended to provide additional information only and does not have any standardized meaning under IFRS and may not be comparable to similar measures presented by other mining companies. It should not be considered in isolation or as a substitute for measures of performance prepared in accordance with IFRS. The measure is not necessarily indicative of cash flow from operations under IFRS or operating costs presented under IFRS.
All-in Sustaining Costs per ounce and Mine-site All-in Sustaining Costs
The Company adopted an “all-in sustaining costs per ounce” non-GAAP performance measure in accordance with the World Gold Council published in June 2013. The Company believes the measure more fully defines the total costs associated with producing gold; however, this performance measure has no standardized meaning. Accordingly, there may be some variation in the method of computation of “all-in sustaining costs per ounce” as determined by the Company compared with other mining companies. In this context, “all-in sustaining costs per ounce” for the consolidated Company reflects total mining and processing costs, corporate and administrative costs, share-based compensation, exploration costs, sustaining capital, and other operating costs.
For the purposes of calculating "mine-site all-in sustaining costs" at the individual mine-sites, the Company does not include an allocation of corporate and administrative costs and share-based compensation, as detailed in the reconciliations below.
Sustaining capital expenditures are expenditures that do not increase annual gold ounce production at a mine site and excludes all expenditures at the Company’s development projects as well as certain expenditures at the Company’s operating sites that
342021 Management’s Discussion and Analysis | ||||||||
are deemed expansionary in nature. For each mine-site reconciliation, corporate and administrative costs, and non-site specific costs are not included in the all-in sustaining cost per ounce calculation.
All-in sustaining costs per gold ounce is intended to provide additional information only and does not have any standardized meaning under IFRS and may not be comparable to similar measures presented by other mining companies. It should not be considered in isolation or as a substitute for measures of performance prepared in accordance with IFRS.
The measure is not necessarily indicative of cash flow from operations under IFRS or operating costs presented under IFRS.
Total Cash Costs and All-in Sustaining Costs per Ounce Reconciliation Tables
The following tables reconciles these non-GAAP measures to the most directly comparable IFRS measures on a Company-wide and individual mine-site basis.
| Total Cash Costs and AISC Reconciliation - Company-wide | |||||||||||||||||
| Three Months Ended June 30, | Six Months Ended June 30, | ||||||||||||||||
| 2021 | 2020 | 2021 | 2020 | ||||||||||||||
| (in millions, except ounces and per ounce figures) | |||||||||||||||||
| Mining and processing | $82.1 | $67.9 | $174.8 | $150.4�� | |||||||||||||
| Royalties | 3.0 | 1.7 | 6.1 | 4.1 | |||||||||||||
| Total cash costs | 85.1 | 69.6 | 180.9 | 154.5 | |||||||||||||
| Gold ounces sold | 107,581 | 74,605 | 234,063 | 186,459 | |||||||||||||
| Total cash costs per ounce | $791 | $933 | $773 | $829 | |||||||||||||
| Total cash costs | $85.1 | $69.6 | $180.9 | $154.5 | |||||||||||||
Corporate and administrative(1) | 6.3 | 4.1 | 12.4 | 10.3 | |||||||||||||
Sustaining capital expenditures(2) | 26.7 | 14.4 | 50.3 | 31.9 | |||||||||||||
| Share-based compensation | 2.3 | 5.6 | 5.1 | 7.8 | |||||||||||||
| Sustaining exploration | 1.2 | 1.0 | 2.5 | 2.5 | |||||||||||||
| Accretion of decommissioning liabilities | 0.6 | 0.5 | 1.3 | 1.2 | |||||||||||||
| Total all-in sustaining costs | $122.2 | $95.2 | $252.5 | $208.2 | |||||||||||||
| Gold ounces sold | 107,581 | 74,605 | 234,063 | 186,459 | |||||||||||||
| All-in sustaining costs per ounce | $1,136 | $1,276 | $1,079 | $1,117 | |||||||||||||
(1)Corporate and administrative expenses exclude expenses incurred at development properties.
(2)Sustaining capital expenditures are defined as those expenditures which do not increase annual gold ounce production at a mine site and exclude all expenditures at growth projects and certain expenditures at operating sites which are deemed expansionary in nature. Total sustaining capital for the period is as follows:
| Three Months Ended June 30, | Six Months Ended June 30, | ||||||||||||||||
| 2021 | 2020 | 2021 | 2020 | ||||||||||||||
| (in millions) | |||||||||||||||||
| Capital expenditures per cash flow statement | $83.5 | $54.6 | $156.1 | $117.9 | |||||||||||||
| Less: non-sustaining capital expenditures at: | |||||||||||||||||
| Young-Davidson | (9.8) | (24.1) | (22.2) | (46.9) | |||||||||||||
| Island Gold | (17.5) | (10.7) | (34.3) | (24.3) | |||||||||||||
| Mulatos | (23.0) | (1.4) | (38.3) | (4.0) | |||||||||||||
| Corporate and other | (6.5) | (4.0) | (11.0) | (10.8) | |||||||||||||
| Sustaining capital expenditures | $26.7 | $14.4 | $50.3 | $31.9 | |||||||||||||
352021 Management’s Discussion and Analysis | ||||||||
| Young-Davidson Total Cash Costs and Mine-site AISC Reconciliation | ||||||||||||||
| Three Months Ended June 30, | Six Months Ended June 30, | |||||||||||||
| 2021 | 2020 | 2021 | 2020 | |||||||||||
| (in millions, except ounces and per ounce figures) | ||||||||||||||
| Mining and processing | $41.1 | $34.4 | $81.7 | $65.2 | ||||||||||
| Royalties | 1.5 | 0.7 | 2.8 | 1.5 | ||||||||||
| Total cash costs | $42.6 | $35.1 | $84.5 | $66.7 | ||||||||||
| Gold ounces sold | 45,284 | 22,440 | 93,306 | 51,345 | ||||||||||
| Total cash costs per ounce | $941 | $1,564 | $906 | $1,299 | ||||||||||
| Total cash costs | $42.6 | $35.1 | $84.5 | $66.7 | ||||||||||
| Sustaining capital expenditures | 9.8 | 5.5 | 19.3 | 9.7 | ||||||||||
| Accretion of decommissioning liabilities | — | — | 0.2 | 0.1 | ||||||||||
| Total all-in sustaining costs | $52.4 | $40.6 | $104.0 | $76.5 | ||||||||||
| Gold ounces sold | 45,284 | 22,440 | 93,306 | 51,345 | ||||||||||
| Mine-site all-in sustaining costs per ounce | $1,157 | $1,809 | $1,115 | $1,490 | ||||||||||
| Island Gold Total Cash Costs and Mine-site AISC Reconciliation | ||||||||||||||
| Three Months Ended June 30, | Six Months Ended June 30, | |||||||||||||
| 2021 | 2020 | 2021 | 2020 | |||||||||||
| (in millions, except ounces and per ounce figures) | ||||||||||||||
| Mining and processing | $15.6 | $8.6 | $32.8 | $25.0 | ||||||||||
| Royalties | 1.3 | 0.7 | 2.7 | 2.0 | ||||||||||
| Total cash costs | $16.9 | $9.3 | $35.5 | $27.0 | ||||||||||
| Gold ounces sold | 33,632 | 18,560 | 73,514 | 57,687 | ||||||||||
| Total cash costs per ounce | $502 | $501 | $483 | $468 | ||||||||||
| Total cash costs | $16.9 | $9.3 | $35.5 | $27.0 | ||||||||||
| Sustaining capital expenditures | 11.0 | 5.2 | 21.6 | 13.7 | ||||||||||
| Total all-in sustaining costs | $27.9 | $14.5 | $57.1 | $40.7 | ||||||||||
| Gold ounces sold | 33,632 | 18,560 | 73,514 | 57,687 | ||||||||||
| Mine-site all-in sustaining costs per ounce | $830 | $781 | $777 | $706 | ||||||||||
| Mulatos Total Cash Costs and Mine-site AISC Reconciliation | ||||||||||||||
| Three Months Ended June 30, | Six Months Ended June 30, | |||||||||||||
| 2021 | 2020 | 2021 | 2020 | |||||||||||
| (in millions, except ounces and per ounce figures) | ||||||||||||||
| Mining and processing | $25.4 | $24.9 | $60.3 | $60.2 | ||||||||||
| Royalties | 0.2 | 0.3 | 0.6 | 0.6 | ||||||||||
| Total cash costs | $25.6 | $25.2 | $60.9 | $60.8 | ||||||||||
| Gold ounces sold | 28,665 | 33,605 | 67,243 | 77,427 | ||||||||||
| Total cash costs per ounce | $893 | $750 | $906 | $785 | ||||||||||
| Total cash costs | $25.6 | $25.2 | $60.9 | $60.8 | ||||||||||
| Sustaining capital expenditures | 5.9 | 3.7 | 9.4 | 8.5 | ||||||||||
| Sustaining exploration | 0.7 | 0.5 | 1.5 | 1.5 | ||||||||||
| Accretion of decommissioning liabilities | 0.6 | 0.5 | 1.1 | 1.1 | ||||||||||
| Total all-in sustaining costs | $32.8 | $29.9 | $72.9 | $71.9 | ||||||||||
| Gold ounces sold | 28,665 | 33,605 | 67,243 | 77,427 | ||||||||||
| Mine-site all-in sustaining costs per ounce | $1,144 | $890 | $1,084 | $929 | ||||||||||
362021 Management’s Discussion and Analysis | ||||||||
Earnings Before Interest, Taxes, Depreciation, and Amortization (“EBITDA”)
EBITDA represents net earnings before impairment charges, interest, taxes, depreciation, and amortization. EBITDA is an indicator of the Company’s ability to generate liquidity by producing operating cash flow to fund working capital needs, service debt obligations, and fund capital expenditures.
EBITDA does not have any standardized meaning under IFRS and may not be comparable to similar measures presented by other mining companies. It should not be considered in isolation or as a substitute for measures of performance prepared in accordance with IFRS.
The following is a reconciliation of EBITDA to the consolidated financial statements:
| (in millions) | ||||||||||||||
| Three Months Ended June 30, | Six Months Ended June 30, | |||||||||||||
| 2021 | 2020 | 2021 | 2020 | |||||||||||
| Net (loss) earnings | ($172.5) | $11.7 | ($121.3) | ($0.6) | ||||||||||
| Add back: | ||||||||||||||
| Impairment charge | 224.3 | — | 224.3 | — | ||||||||||
| COVID-19 costs | — | 6.5 | — | 6.5 | ||||||||||
| Finance expense | 1.0 | 1.2 | 2.0 | 2.0 | ||||||||||
| Amortization | 41.8 | 27.2 | 85.3 | 62.6 | ||||||||||
| Deferred income tax (recovery) expense | (2.9) | (14.8) | 15.1 | 38.3 | ||||||||||
| Current income tax expense | 2.7 | 9.1 | 8.6 | 8.8 | ||||||||||
| EBITDA | $94.4 | $40.9 | $214.0 | $117.6 | ||||||||||
Additional GAAP Measures
Additional GAAP measures are presented on the face of the Company’s consolidated statements of comprehensive income (loss) and are not meant to be a substitute for other subtotals or totals presented in accordance with IFRS, but rather should be evaluated in conjunction with such IFRS measures. The following additional GAAP measures are used and are intended to provide an indication of the Company’s mine and operating performance:
•Earnings from operations - represents the amount of earnings before net finance income/expense, foreign exchange gain/loss, other income/loss, loss on redemption of senior secured notes and income tax expense
Accounting Estimates, Policies and Changes
The preparation of the Company's consolidated financial statements in accordance with IFRS requires management to make estimates and judgments that affect the amounts reported in the consolidated financial statements and accompanying notes. The
critical estimates and judgments applied in the preparation of the Company's condensed interim consolidated financial statements for the three and six months ended June 30, 2021 are consistent with those used in the Company's consolidated financial statements for the year ended December 31, 2020.
Accounting Policies and Changes
The accounting policies applied in the condensed interim consolidated financial statements for the three and six months ended June 30, 2021 are consistent with those used in the Company's consolidated financial statements for the year ended December 31, 2020, with the exception of those listed in note 2 of the condensed interim consolidated financial statements for the three and six months ended June 30, 2021.
Internal Control over Financial Reporting
Management is responsible for the design, implementation and operating effectiveness of internal control over financial reporting. Under the supervision of the Chief Executive Officer and Chief Financial Officer, management evaluated the effectiveness of the Company’s internal control over financial reporting as of June 30, 2021. In making the assessment, management used the criteria set forth in Internal Control - Integrated Framework (2013), issued by the Committee of Sponsoring Organizations of the Treadway Commission. Based on a review of internal control procedures at the end of the period covered by this MD&A, management determined internal control over financial reporting was appropriately designed as at June 30, 2021.
372021 Management’s Discussion and Analysis | ||||||||
Changes in Internal Control over Financial Reporting
There were no changes in the Company’s internal control over financial reporting that occurred during the three months ended June 30, 2021 that have materially affected, or are reasonably likely to materially affect, the Company’s internal control over financial reporting.
Disclosure Controls
Management is also responsible for the design and effectiveness of disclosure controls and procedures. The Company’s Chief Executive Officer and Chief Financial Officer have each evaluated the effectiveness of the Company’s disclosure controls and procedures as at June 30, 2021 and have concluded that these disclosure controls and procedures were appropriately designed.
Limitations of Controls and Procedures
The Company’s management, including the Chief Executive Officer and Chief Financial Officer, believe that internal controls over financial reporting and disclosure controls and procedures, no matter how well designed and operated, have inherent limitations. Therefore, even those systems determined to be properly designed and effective can provide only reasonable assurance that the objectives of the control system are met.
Cautionary Note to United States Investors
Measured, Indicated and Inferred Resources: All resource and reserve estimates included in this MD&A or documents referenced in this MD&A have been prepared in accordance with Canadian National Instrument 43-101 - Standards of Disclosure for Mineral Projects ("NI 43-101") and the Canadian Institute of Mining, Metallurgy and Petroleum (the "CIM") - CIM Definition Standards on Mineral Resources and Mineral Reserves, adopted by the CIM Council, as amended (the "CIM Standards"). NI 43-101 is a rule developed by the Canadian Securities Administrators, which established standards for all public disclosure an issuer makes of scientific and technical information concerning mineral projects. The terms "Mineral Reserve", "Proven Mineral Reserve" and "Probable Mineral Reserve" are Canadian mining terms as defined in accordance with NI 43-101 and the CIM Standards. Investors are cautioned not to assume that all or any part of mineral deposits in these categories will ever be converted into reserves. "Inferred Mineral Resources" have a great amount of uncertainty as to their existence, and great uncertainty as to their economic and legal feasibility. It cannot be assumed that all or any part of an Inferred Mineral Resource will ever be upgraded to a higher category. Under Canadian rules, estimates of Inferred Mineral Resources may not form the basis of feasibility or pre-feasibility studies, except in very limited circumstances. Investors are cautioned not to assume that all or any part of an Inferred Mineral Resource exists or is economically or legally mineable. Disclosure of "contained ounces" in a resource is permitted disclosure under Canadian regulations.
International Financial Reporting Standards: The condensed consolidated financial statements of the Company have been prepared by management in accordance with International Financial Reporting Standard 34, Interim Financial Reporting, as issued by the International Accounting Standards Board. These accounting principles differ in certain material respects from accounting principles generally accepted in the United States of America. The Company’s reporting currency is the United States dollar unless otherwise noted.
Cautionary Note Regarding Forward-Looking Statements
This MD&A contains or incorporates by reference “forward-looking statements” and “forward-looking information” as defined under applicable Canadian and U.S. securities legislation. All statements, other than statements of historical fact, which address events, results, outcomes or developments that the Company expects to occur are, or may be deemed, to be, forward-looking statements. Forward-looking statements are generally, but not always, identified by the use of forward-looking terminology such as "expect", "believe", "anticipate", "intend", "estimate", "forecast", "budget", “target”, “outlook”, “continue”, “plan” or variations of such words and phrases and similar expressions or statements that certain actions, events or results “may”, “could”, “would”, “might” or “will” be taken, occur or be achieved or the negative connotation of such terms.
Such statements include information as to strategy, plans or future financial or operating performance, such as the Company’s expansion plans, project timelines, production plans and expected sustainable productivity increases, expected increases in mining activities and corresponding cost efficiencies, expected drilling targets, expected sustaining costs, expected improvements in cash flows and margins, expectations of changes in capital expenditures, forecasted cash shortfalls and the
382021 Management’s Discussion and Analysis | ||||||||
Company’s ability to fund them, cost estimates, projected exploration results, reserve and resource estimates, expected production rates and use of the stockpile inventory, expected recoveries, sufficiency of working capital for future commitments and other statements that express management’s expectations or estimates of future plans and performance.
Alamos cautions that forward-looking statements are necessarily based upon a number of factors and assumptions that, while considered reasonable by the Company at the time of making such statements, are inherently subject to significant business, economic, legal, political and competitive uncertainties and contingencies. Known and unknown factors could cause actual results to differ materially from those projected in the forward-looking statements.
Such factors and assumptions underlying the forward-looking statements in this document include, but are not limited to: changes to current estimates of mineral reserves and resources; changes to production estimates (which assume accuracy of projected ore grade, mining rates, recovery timing and recovery rate estimates which may be impacted by unscheduled maintenance; labour and contractor availability and other operating or technical difficulties); operations may be exposed to new diseases, epidemics and pandemics, including the effects and potential effects of the global COVID-19 widespread pandemic; the impact of the COVID-19 pandemic on the broader market and the trading price of the Company's shares; provincial and federal orders or mandates (including with respect to mining operations generally or auxiliary businesses or services required for our operations) in Canada, Mexico, the United States and Turkey; the duration of regulatory responses to the COVID-19 pandemic; governments and the Company’s attempts to reduce the spread of COVID-19 which may affect many aspects of the Company's operations including the ability to transport personnel to and from site, contractor and supply availability and the ability to sell or deliver gold dore bars; fluctuations in the price of gold or certain other commodities such as, diesel fuel, natural gas, and electricity; changes in foreign exchange rates (particularly the Canadian Dollar, Mexican Peso, U.S. Dollar and Turkish Lira); the impact of inflation; changes in the Company's credit rating; any decision to declare a quarterly dividend; employee and community relations; litigation and administrative proceedings (including but not limited to the investment treaty claim announced on April 20, 2021 against the Republic of Turkey by the Company’s wholly-owned Netherlands subsidiaries, Alamos Gold Holdings Coöperatief U.A, and Alamos Gold Holdings B.V.); disruptions affecting operations; availability of and increased costs associated with mining inputs and labour; expansion delays with the Phase III Expansion Project at the Island Gold mine; construction delays at the La Yaqui Grande project; inherent risks associated with mining and mineral processing; the risk that the Company’s mines may not perform as planned; uncertainty with the Company’s ability to secure additional capital to execute its business plans; the speculative nature of mineral exploration and development, including the risks of obtaining and maintaining necessary licenses and permits, including the necessary licenses, permits, authorizations and/or approvals from the appropriate regulatory authorities for the Company’s development stage and operating assets; labour and contractor availability (and being able to secure the same on favourable terms); contests over title to properties; expropriation or nationalization of property; inherent risks and hazards associated with mining including environmental hazards, industrial hazards, industrial accidents, unusual or unexpected formations, pressures and cave-ins; changes in national and local government legislation (including tax and employment legislation), controls or regulations in Canada, Mexico, Turkey, the United States and other jurisdictions in which the Company does or may carry on business in the future; increased costs and risks related to the potential impact of climate change; failure to comply with environmental and health and safety laws and regulations; disruptions in the maintenance or provision of required infrastructure and information technology systems; risk of loss due to sabotage, protests and other civil disturbances; the impact of global liquidity and credit availability and the values of assets and liabilities based on projected future cash flows; risks arising from holding derivative instruments; and business opportunities that may be pursued by the Company. The litigation against the Republic of Turkey, described above, results from the actions of the Turkish government in respect of the Company’s projects in the Republic of Turkey. Such litigation is a mitigation effort and may not be effective or successful. If unsuccessful, the Company’s projects in Turkey may be subject to resource nationalism and further expropriation; the Company may lose any remaining value of its assets and gold mining projects in Turkey and its ability to operate in Turkey. Even if successful, there is no certainty as to the quantum of any damages award or recovery of all, or any, legal costs. Any resumption of activities in Turkey, including renewal of the requisite operating licenses or permits, or even retaining control of its assets and gold mining projects in Turkey can only result from agreement with the Turkish government. The litigation described in this MD&A may have an impact on foreign direct investment in the Republic of Turkey which may result in changes to the Turkish economy, including but not limited to high rates of inflation and fluctuation of the Turkish Lira which may also affect the Company’s relationship with the Turkish government, the Company’s ability to effectively operate in Turkey, and which may have a negative effect on overall anticipated project values.
Additional risk factors and details with respect to risk factors affecting the Company’s ability to achieve the expectations set forth in the forward-looking statements contained in this MD&A are set out in the Company's 40-F/Annual Information Form for the year ended December 31, 2020 under the heading “Risk Factors”, which is available on the SEDAR website at www.sedar.com or on EDGAR at www.sec.gov. The foregoing should be reviewed in conjunction with the information found in this MD&A.
The Company disclaims any intention or obligation to update or revise any forward-looking statements whether as a result of new information, future events or otherwise, except as required by applicable law.
Qualified Persons
Chris Bostwick, FAusIMM, Alamos’ Vice President, Technical Services, who is a qualified person within the meaning of National Instrument 43-101 ("Qualified Person"), has reviewed and approved the scientific and technical information contained in this MD&A.
39