QuickLinks -- Click here to rapidly navigate through this document

DragonWave Inc.
Management's Discussion and Analysis
For the three months and year ended February 28, 2010
Tables are expressed in Canadian $000's except share and per share amounts
The following provides management's discussion and analysis ("MD&A") of DragonWave Inc.'s consolidated results of operations and financial condition for year ended February 28, 2010. This MD&A is dated May 6, 2010 and should be read in conjunction with our audited consolidated annual financial statements for the year ended February 28, 2010. For additional information and details, readers are referred to the audited annual consolidated financial statements for fiscal 2010, together with our audited annual consolidated financial statements and MD&A for fiscal 2009, and our Annual Information Form dated May 6, 2010 (the "AIF"), all of which are filed separately and are available atwww.sedar.com or www.sec.gov/edgar.
The financial statements have been prepared in accordance with Canadian generally accepted accounting principles (GAAP) and are reported in Canadian dollars. The information contained herein is dated as of May 6, 2010 and is current to that date, unless otherwise stated. Our fiscal year commences March 1 of each year and ends on the last day of February of the following year.
In this document, "we", "us", "our", "Company" and "DragonWave" all refer to DragonWave Inc. collectively with its subsidiaries, DragonWave Corp. and 4472314 Canada Inc. The content of this MD&A has been approved by our Board of Directors, on the recommendation of its Audit Committee.
Unless otherwise indicated, all currency amounts referenced in this MD&A are denominated in Canadian dollars.
Forward-Looking Statements
This MD&A contains "forward-looking information" and "forward-looking statements" within the meaning of applicable Canadian and U.S. securities laws. All statements in this MD&A other than statements that are reporting results or statements of historical fact are forward-looking statements which involve assumptions and describe our future plans, strategies and expectations. Forward-looking statements are generally identifiable by use of the words "may", "will", "should", "continue", "expect", "anticipate", "estimate", "believe", "intend", "plan" or "project" or the negative of these words or other variations on these words or comparable terminology. Forward-looking statements include, without limitation, statements regarding our strategic plans and objectives, growth strategy, customer diversification and expansion initiatives, and the expected use of proceeds from financing activities. There can be no assurance that forward-looking statements will prove to be accurate and actual results or outcomes could differ materially from those expressed or implied in such statements. Important factors that could cause actual results or outcomes to differ materially from those discussed in the forward-looking statements are discussed in this MD&A under the heading "Risks and Uncertainties". Forward-looking statements are provided to assist external stakeholders in understanding management's expectations and plans relating to the future as of the date of this MD&A and may not be appropriate for other purposes. Readers are cautioned not to place undue reliance on forward-looking statements. Forward-looking statements are made as of the date of this MD&A and the Company does not undertake to publicly update or revise any forward-looking statements, whether as a result of new information, future events or otherwise, except to the extent expressly required by law.
Risks and Uncertainties
Our financial performance, achievements and results may be impacted by risks and uncertainties related to our business. These risks and uncertainties include, but are not limited to the following:
- •
- dependence on the development and growth of the market for high-capacity wireless communications services;
1
DragonWave Inc.
Management's Discussion and Analysis
For the three months and year ended February 28, 2010
Tables are expressed in Canadian $000's except share and per share amounts
- •
- reliance on a small number of customers for a large percentage of revenue;
- •
- intense competition from several competitors;
- •
- competition from indirect competitors;
- •
- dependence on the ability to develop new products and enhance existing products;
- •
- a history of losses;
- •
- our ability to successfully manage growth;
- •
- quarterly revenue and operating results which are difficult to predict and can fluctuate substantially;
- •
- the impact of the general economic downturn on our customers;
- •
- disruption resulting from economic and geopolitical uncertainty;
- •
- ability to successfully effect acquisitions of products or businesses and other risks associated with acquisitions;
- •
- currency fluctuations;
- •
- exposure to credit risk for accounts receivable;
- •
- pressure on our pricing models;
- •
- the allocation of radio spectrum and regulatory approvals for our products;
- •
- our customers' ability to secure a license for applicable radio spectrum;
- •
- changes in government regulation or industry standards that may limit the potential market for our products;
- •
- dependence on establishing and maintaining relationships with channel partners;
- •
- reliance on outsourced manufacturing;
- •
- reliance on suppliers of components;
- •
- our ability to protect our own intellectual property and potential harm to our business if we infringe the intellectual property rights of others;
- •
- risks associated with software licensed by us;
- •
- a lengthy and variable sales cycle;
- •
- dependence on our ability to recruit and retain management and other qualified personnel;
- •
- exposure to risks resulting from international sales and operations, including the requirement to comply with export control and economic sanctions laws;
- •
- product defects, product liability claims, or health and safety risks relating to wireless products;
- •
- risks associated with possible loss of our foreign private issuer status;
- •
- risks and expenses associated with being a public company in the U.S.
Readers are also referred to "Risk Factors" in the Corporation's Annual Information Form dated May 6, 2010, which is available atwww.sedar.com andwww.sec.gov./edgar. Although we have attempted to identify important factors that could cause our actual results to differ materially from our expectations, intentions, estimates or forecasts, there may be other factors that could cause our results to differ from what we currently anticipate, estimate or intend. Recent unprecedented events in global financial and credit markets have resulted in high market price volatility and contraction in credit markets. These on-going events could impact our business, financial condition and operating results in an unpredictable and possibly detrimental manner.
2
DragonWave Inc.
Management's Discussion and Analysis
For the three months and year ended February 28, 2010
Tables are expressed in Canadian $000's except share and per share amounts
SELECTED FINANCIAL INFORMATION:
| | | | | | | | | | | | | | |
| | Three months ended
February 28 | | Twelve months ended
February 28 | |
|---|
| | 2010 | | 2009 | | 2010 | | 2009 | |
|---|
REVENUE | | | 63,826 | | | 11,333 | | | 171,104 | | | 43,334 | |
| | Cost of sales | | | 36,437 | | | 8,394 | | | 99,327 | | | 28,683 | |
| | | | | | | | | | |
Gross profit | | | 27,389 | | | 2,939 | | | 71,777 | | | 14,651 | |
| | | | | | | | | | |
EXPENSES | | | | | | | | | | | | | |
| | Research and development | | | 5,126 | | | 2,476 | | | 16,224 | | | 10,628 | |
| | Selling and marketing | | | 4,691 | | | 2,453 | | | 15,252 | | | 10,649 | |
| | General and administrative | | | 2,804 | | | 1,051 | | | 8,109 | | | 4,079 | |
| | Investment tax credits | | | 180 | | | — | | | — | | | (82 | ) |
| | Restructuring charges | | | — | | | 17 | | | — | | | 501 | |
| | | | | | | | | | |
| | | 12,801 | | | 5,997 | | | 39,585 | | | 25,775 | |
| | | | | | | | | | |
Income (Loss) from operations | | | 14,588 | | | (3,058 | ) | | 32,192 | | | (11,124 | ) |
| | Interest income | | |
64 | | |
83 | | |
128 | | |
693 | |
| | Interest expense | | | (1 | ) | | (10 | ) | | (29 | ) | | (35 | ) |
| | Gain on sale of property, equipment and intangible assets | | | — | | | — | | | 279 | | | — | |
| | Foreign exchange gain (loss) | | | (1,037 | ) | | 850 | | | (2,799 | ) | | 4,514 | |
| | | | | | | | | | |
Income (Loss) before income taxes | | | 13,614 | | | (2,135 | ) | | 29,771 | | | (5,952 | ) |
| | Income tax expense | | |
212 | | |
15 | | |
359 | | |
37 | |
| | | | | | | | | | |
Net and Comprehensive Income (Loss) | | | 13,402 | | | (2,150 | ) | | 29,412 | | | (5,989 | ) |
Deficit, beginning of period | | |
(61,850 |
) | |
(75,710 |
) | |
(77,860 |
) | |
(71,871 |
) |
| | | | | | | | | | |
Deficit, end of period | | | (48,448 | ) | | (77,860 | ) | | (48,448 | ) | | (77,860 | ) |
| | | | | | | | | | |
Income (Loss) per share | | | | | | | | | | | | | |
| | Basic | | | 0.37 | | | (0.08 | ) | | 0.93 | | | (0.21 | ) |
| | Diluted | | | 0.35 | | | (0.08 | ) | | 0.90 | | | (0.21 | ) |
Weighted Average Shares Outstanding | | | | | | | | | | | | | |
| | Basic | | | 36,461,643 | | | 28,536,447 | | | 31,523,226 | | | 28,537,202 | |
| | Diluted | | | 37,914,614 | | | 28,536,447 | | | 32,635,342 | | | 28,537,202 | |
| | | | | | | |
| | As at
February 28,
2010 | | As at
February 28,
2009 | |
|---|
Consolidated Balance Sheet Data: | | | | | | | |
Cash and cash equivalents | | | 110,805 | | | 8,504 | |
Short Term Investments | | | 8,498 | | | 14,994 | |
Total Assets | | | 186,032 | | | 51,828 | |
Line of credit | | | — | | | 641 | |
Total liabilities | | | 39,893 | | | 8,533 | |
Total shareholder's equity | | | 146,139 | | | 43,295 | |
3
DragonWave Inc.
Management's Discussion and Analysis
For the three months and year ended February 28, 2010
Tables are expressed in Canadian $000's except share and per share amounts
SELECTED CONSOLIDATED QUARTERLY FINANCIAL INFORMATION
The following table sets out selected financial information for each of our most recent eight fiscal quarters. In the opinion of management, this information has been prepared on the same basis as DragonWave's audited consolidated financial statements, and all necessary adjustments have been included in the amounts stated below to present fairly the unaudited quarterly results when read in conjunction with DragonWave's consolidated financial statements and related notes thereto.
| | | | | | | | | | | | | | | | | | | | | | | | | | |
| | FY 09 | | FY10 | |
|---|
| | May 31
2008 | | Aug 31
2008 | | Nov 28
2008 | | Feb 28
2009 | | May 31
2009 | | Aug 31
2009 | | Nov 30
2009 | | Feb 28
2010 | |
|---|
Revenue | | | 10,725 | | | 10,572 | | | 10,704 | | | 11,333 | | | 15,950 | | | 35,509 | | | 55,819 | | | 63,826 | |
Gross Profit | | | 4,381 | | | 3,627 | | | 3,704 | | | 2,939 | | | 5,510 | | | 14,925 | | | 23,953 | | | 27,389 | |
| | Gross Profit % | | | 41% | | | 34% | | | 35% | | | 26% | | | 35% | | | 42% | | | 43% | | | 43% | |
Operating Expenses | | |
6,835 | | |
6,460 | | |
6,483 | | |
5,997 | | |
6,734 | | |
8,870 | | |
11,180 | | |
12,801 | |
Income from operations | | | (2,454 | ) | | (2,833 | ) | | (2,779 | ) | | (3,058 | ) | | (1,224 | ) | | 6,054 | | | 12,774 | | | 14,588 | |
Net income (loss) for the period | | |
(1,941 |
) | |
(1,677 |
) | |
(221 |
) | |
(2,150 |
) | |
(2,883 |
) | |
6,291 | | |
12,602 | | |
13,614 | |
Net income (loss) per share | | | | | | | | | | | | | | | | | | | | | | | | | |
| | Basic | | | (0.07 | ) | | (0.06 | ) | | (0.01 | ) | | (0.08 | ) | | (0.10 | ) | | 0.22 | | | 0.39 | | | 0.37 | |
| | Diluted | | | (0.07 | ) | | (0.06 | ) | | (0.01 | ) | | (0.08 | ) | | (0.10 | ) | | 0.21 | | | 0.37 | | | 0.35 | |
Weighted average number of
shares outstanding | | | | | | | | | | | | | | | | | | | | | | | | | |
| | Basic | | | 28,480,522 | | | 28,555,335 | | | 28,555,716 | | | 28,536,427 | | | 28,569,238 | | | 28,620,162 | | | 32,604,077 | | | 36,461,643 | |
| | Diluted | | | 28,480,522 | | | 28,555,335 | | | 28,555,716 | | | 28,536,427 | | | 28,569,238 | | | 29,675,696 | | | 34,085,934 | | | 37,914,614 | |
Total Assets | | |
54,988 | | |
55,371 | | |
56,102 | | |
51,828 | | |
49,818 | | |
69,816 | | |
159,632 | | |
186,032 | |
Historically, our operating results have fluctuated on a quarterly basis and we expect that quarterly financial results will continue to fluctuate in the future. The results of operations for interim periods should not be relied upon as an indication of the results to be expected or achieved in any future period or any fiscal year as a whole. Fluctuations in results relate to the growth in our revenue, and the project nature of the network installations of our end-customers. In addition, results may fluctuate as a result of the timing of staffing, infrastructure additions required to support growth, and material costs required to support design initiatives. Operating results may not follow past trends for other reasons, including strategic decisions by us such as acquisition of complementary products or businesses.
Overview
DragonWave is a leading provider of high-capacity Ethernet microwave solutions that drive next-generation IP networks. Our carrier-grade point-to-point Ethernet microwave systems transmit broadband voice, video and data, enabling service providers, government agencies, enterprises and other organizations to meet their increasing bandwidth requirements rapidly and affordably. The principal application of our products is wireless network backhaul.
In the fourth quarter of fiscal 2010, DragonWave recognized revenue of $63.8 million, a sales level that is 47% higher than the revenue recognized in the entire previous fiscal year. This quarter's revenue represents a 14% increase from the third quarter of fiscal 2010 and a 463% increase from fiscal 2009. For the twelve months ended February 28, 2010 DragonWave recorded $171.1 million in revenue. This represented a 295% increase over the previous $43.3 million sales figure recorded in fiscal 2009. Gross margin reached 42.9% for the three
4
DragonWave Inc.
Management's Discussion and Analysis
For the three months and year ended February 28, 2010
Tables are expressed in Canadian $000's except share and per share amounts
months ended February 28, 2010, which represents a 17% increase over the same period in the previous fiscal year. Year to date, the gross margin is 41.9% (gross margin for fiscal year 2009: 33.8%). Record high sales levels combined with a strong margin have resulted in our fourth quarter income from operations of $14.6 million (23% of sales), compared to a loss of $3.1 million for the same period in the previous year. Income from operations for fiscal 2010 is $32.2 million (19% of sales) compared to a loss of $11.1 million in fiscal 2009. Net and comprehensive income for the fourth quarter of fiscal 2010 improved by $15.6 million from the same period in the previous year and by $35.4 million for the year ended February 28, 2010 when compared to fiscal 2009. (Net income: fourth quarter; $13.4 million — year to date; $29.4 million).
We were pleased to have been chosen as the backhaul provider for the first 4G mover in North America. Sales to this national carrier increased by $125.8 million dollars between fiscal 2009 and fiscal 2010. We believe that our ability to increase our output to meet this customer's demand increase demonstrates the scalability of our product design, the flexibility of our contract manufacturers and the agility of our organization. With the magnitude of this increase, the proportion of sales to this customer as a percentage of our total sales increased this year and accounted for 86.6% of our revenue for the three months ended February 28, 2010, and 79.8% of revenue for the year ended February 28, 2010 (three months and year ended February 28, 2009 — 27.4% and 19.3% respectively).
Expanding and diversifying our customer base is an important focus for us. We continue to successfully penetrate new customer accounts and new regions. In the quarter ended February 28, 2010 the Company shipped to 14 new customers, in 9 different countries. On a year to date basis, we attracted 46 new customers, which helped bring the total number of customers shipped to this year to 139. Our products have proven to be marketable in a broad spectrum of geographies. For the first time we shipped to customers in Jordan, Macedonia, the Philippines and Bahrain. We have now shipped to customers in 59 different countries.
The suite of packet microwave backhaul solutions that we have developed have provided us with a competitive advantage in attracting new customers. The cost effective Horizon Compact and Horizon Quantum deliver high capacity, ultra-low latency and carrier-class reliability which customers find compelling. Examples of new customers who announced in the fourth quarter that they have decided to rely on DragonWave's solutions include Videotron, a wholly owned subsidiary of Quebecor Media Inc., and Cosmoline who have selected DragonWave as its exclusive backhaul provider for a national 4G mobile WiMAX network across Greece. Earlier this year, Connecteo in Africa, Unwired Australia, IBW in Costa Rica and Yota in Russia also announced that they intended to use DragonWave's technology in their networks. In July, 2009 we announced that Globalive Wireless Management Corp. ("Globalive") had selected us to provide Ethernet microwave backhaul equipment for its multi-million dollar 3G+ (HSPA) cellular network in Canada.
One of our strategies for diversification is to attract customers who are leveraging U.S. government stimulus funding for network expansion. The recent announcement by the Navajo Tribal Utility Authority (NTUA), represents a step in this direction. NTUA is pursuing a $46 million grant, and agreed to a commercial field test using DragonWave's Horizon Quantum radio product.
Another element of our growth strategy involves developing alliances with other companies to expand our customer reach. In February, 2010 we announced that we had signed an original equipment manufacturer (OEM) agreement with a world leader in mobile communications. We expect that DragonWave's microwave
5
DragonWave Inc.
Management's Discussion and Analysis
For the three months and year ended February 28, 2010
Tables are expressed in Canadian $000's except share and per share amounts
radio system will be included in end-to-end mobile backhaul solutions in North America and Japan under this agreement. We were also pleased earlier in fiscal 2010 to announce that we had joined the Cisco Technology Developer Program and that our Horizon Compact successfully completed interoperability testing with Cisco BWX 8300 and Cisco Aironet.
To support our customer diversification efforts we may also engage in selective acquisitions of products or businesses that we believe are complementary to our products or business. We have no present agreements or commitments with respect to any particular transaction, although we do evaluate potential acquisition and investment opportunities on an ongoing basis.
Our Company has grown substantially in the past year and we continue to expand the business in areas considered a priority to meet the changing requirements. In fiscal 2010 we opened a branch in Singapore to take advantage of customer opportunities in Asia Pacific and announced a plan to open a location in Australia in early fiscal 2011. In addition, we recently appointed a Vice President of Sales for the Caribbean and Latin America. Following our successful listing on the NASDAQ stock exchange in October, we hired a Vice President of Investor Relations, and introduced a new Board member with significant public company expertise to the team. All departments within the Company have seen controlled growth as a necessary step to meet the demands of the growing business.
While we have dedicated significant efforts to revenue growth, we also concentrated on the costs of our product to ensure the strength of our gross margin. There are a number of key elements to the Company's strategy. First, achieving a critical sales volume level has enabled the Company to access volume discounts on materials. Second, continuing to control fixed operating costs is helping the Company to achieve more favourable margins as the volume has increased. The third and most important element in the margin strategy has been the continuation of the plan to leverage the lower manufacturing costs in Malaysia. Going forward, the migration of more products into lower cost contract manufacturing locations will continue, while our design team remains focused on developing products which simultaneously offer leading capacity and performance metrics with low cost manufacturing characteristics.
We continue to invest in the research and development required for us to remain a leader in backhaul technology. "Horizon Quantum" is DragonWave's product solution launched in North America in September, 2009 and in Europe in February, 2010. Horizon Quantum is designed to provide significantly increased bandwidth capacity of up to 4 Gbps per link in a half-rack-unit device incorporating a bandwidth accelerator feature that enables superior spectral efficiency by up to a factor of 2.5 times as compared to conventional systems. Market interest in the Horizon Quantum has been extremely positive to date.
Steps were also taken this year to strengthen our balance sheet, to ensure that we had the flexibility we required to continue our path of expansion. DragonWave announced on October 15, 2009 that it had commenced trading on the NASDAQ Global Market under the symbol "DRWI". Our common shares are now dual listed on the Toronto Stock Exchange and the NASDAQ Global Market. The public offering (the
6
DragonWave Inc.
Management's Discussion and Analysis
For the three months and year ended February 28, 2010
Tables are expressed in Canadian $000's except share and per share amounts
"Offering") consisted of a treasury and secondary offering of an aggregate of 12,972,300 common shares at a public offering price of US$10.00 per share (CAD$10.29 per share) for aggregate gross proceeds of US$129.7 million. The Company issued and sold 7,493,562 common shares and certain selling shareholders sold 5,518,738 common shares under the Offering. In connection with the Offering, DragonWave entered into an underwriting agreement with a syndicate of underwriters led by Canaccord Adams and Piper Jaffray & Co. The total gross proceeds to the Company amounted to $77.1 million. After deducting commissions and listing expenses, the Company realized net proceeds of $70.5 million.
Revenue and Expenses
We target customers principally in the global wireless communications service providers market and in particular, service providers offering high-capacity wireless communication services. We also target enterprise and municipal/government customers that own or operate private networks requiring point-to-point applications. We distribute our products and services through a combination of direct and indirect sales channels. In the service provider market, our direct sales efforts target customers worldwide implementing or planning networks, and include marketing to prospective customers where spectrum is being sold in anticipation of a network build. The sales cycle to this class of customer typically involves a trial (or trials), and generally requires nine to twelve months from first contact before orders are received. Once the order stage is reached, a supply agreement is usually established and multiple orders are processed under one master supply arrangement. We distribute our products and services to the remainder of the market through a network of distributors, Value Added Resellers ("VARs") and Original Equipment Manufacturers ("OEMs"), leveraging the market specific expertise of these channel partners.
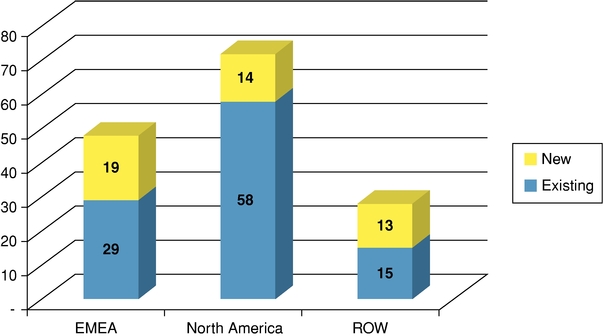
We evaluate revenue performance over three main geographic regions. These regions are North America; Europe, the Middle East and Africa ("EMEA"); and Rest of World ("ROW"). The following table sets out the portion of new customers and existing customers we shipped to in fiscal 2010.
Number of Customers Shipped to in the Year Ended February 28, 2010
7
DragonWave Inc.
Management's Discussion and Analysis
For the three months and year ended February 28, 2010
Tables are expressed in Canadian $000's except share and per share amounts
Number of Customers Shipped to in the Quarter Ended February 28, 2010
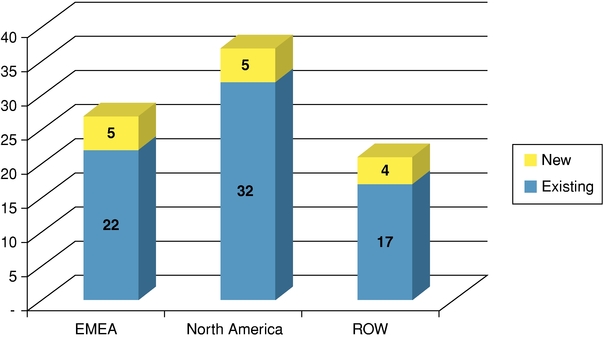
The Company's ability to attract new customers in multiple geographies is evident from the chart above. We believe that our growth strategy hinges, in part, on new customer acquisition and on our ability to penetrate markets both inside and outside of North America wherever the wireless backhaul market is expanding. We now have sales and support resources located in North America, Europe, the Middle East, and the Far East. Shortly, we will have dedicated staff in Australia as well as staff focused on the Caribbean and Latin America.
The table below breaks down the revenue earned by region for both the three months year ended February 28, 2010 and compares these figures to the same periods in the prior fiscal year. As previously indicated, the pace of growth in North America is driving the surge in sales for the Company.
| | | | | | | | | | | | | | | | | | | | | | | | | |
| | Three months ended | | Year ended | |
|---|
| | Feb 28, 2010 | | Feb 28, 2009 | | Feb 28, 2010 | | Feb 28, 2009 | |
|---|
| | $
| | %
| | $
| | %
| | $
| | %
| | $
| | %
| |
|---|
Revenue | | | | | | | | | | | | | | | | | | | | | | | | | |
North America | | | 60,924 | | | 95 | % | | 7,579 | | | 67 | % | | 158,330 | | | 93 | % | | 29,641 | | | 68 | % |
Europe, Middle East and Africa | | | 2,187 | | | 3 | % | | 2,141 | | | 19 | % | | 10,633 | | | 6 | % | | 11,334 | | | 26 | % |
Rest of World | | | 715 | | | 1 | % | | 1,613 | | | 14 | % | | 2,141 | | | 1 | % | | 2,359 | | | 5 | % |
| | | | | | | | | | | | | | | | | | | | | | |
| | | 63,826 | | | | | | 11,333 | | | | | | 171,104 | | | | | | 43,334 | | | | |
Our manufacturing strategy continues to centre on the utilization of outsourced manufacturing to meet the increasing demand for our products worldwide. As such, a large component of our cost of sales is the cost of product purchased from outsourced manufacturers. In addition to the cost of product payable to outsourced manufacturers, we incur expenses associated with final configuration, testing, logistics and warranty activities.
8
DragonWave Inc.
Management's Discussion and Analysis
For the three months and year ended February 28, 2010
Tables are expressed in Canadian $000's except share and per share amounts
Final test and assembly for the links sold by us is carried on our premises and that of our contract manufacturers'. We use primarily the services of two outsourced manufacturers with locations in North America and Malaysia. One of those manufacturers is BreconRidge Corporation ("BreconRidge"). BreconRidge is a related party because Terence Matthews, one of our directors, holds a significant equity interest. Management believes that the commercial terms of our arrangement with BreconRidge reflect fair market terms and payment provisions.
Subsequent to our year end it was announced that Sanmina-SCI Corporation had entered a definitive agreement to acquire Breconridge Corporation. The acquisition is expected to close by May 27, 2010. DragonWave does not expect that the acquisition will cause any interruption to our manufacturing services.
Research and development costs relate mainly to the compensation of our engineering group and the material consumption associated with prototyping activities.
Selling and marketing expenses include the remuneration of sales staff, travel and trade show activities and customer support services.
General and administrative expenses relate to the remuneration of related personnel, professional fees associated with tax, accounting and legal advice, and insurance costs.
Occupancy and information systems costs are related to our leasing costs and communications networks and are accumulated and allocated, based on headcount, to all functional areas in our business. Our facilities are leased from a related party that is controlled by one of our directors and shareholders. Our management believes the terms of the lease reflect fair market terms and payment provisions.
As a consequence of being a publicly traded company the federal portion of Investment Tax Credits ("ITCs") earned by us are no longer refundable but are still available to us to reduce future cash taxes payable.
We conduct the majority of our business transactions in two currencies, U.S. dollars ("USD") and Canadian dollars ("CAD"). Most of our sales and cost of sales are denominated in U.S. dollars. Since our headquarters are located in Canada, the majority of our operating expenses (including salaries and rental costs are denominated in CAD. The Company received a portion of the proceeds from its public offerings in CAD. This supply of Canadian currency has significantly reduced the requirement for us to purchase CAD to pay Canadian based expenses. The foreign exchange gain or loss on the consolidated statement of operations is driven largely by the requirement to translate U.S. based cash deposits and trade receivables into CAD.
Comparison of the three months and year ended February 28, 2010 and February 28, 2009
Revenue
| | | | | | | | | | | |
Three months ended
February 28 | | Year ended
February 28 | |
|---|
| 2010 | | 2009 | | 2010 | | 2009 | |
|---|
| $ | 63,826 | | $ | 11,333 | | $ | 171,104 | | $ | 43,334 | |
Revenue for the three month period ended February 28, 2010 increased by $52.5 million compared with the three month period ended February 28, 2009 and on a fiscal year basis increased by $127.8 million over the same year period in the previous year.
9
DragonWave Inc.
Management's Discussion and Analysis
For the three months and year ended February 28, 2010
Tables are expressed in Canadian $000's except share and per share amounts
The primary drivers for the increases are as follows:
Changes to Revenue: Three months ended February 28, 2010 vs Three months ended February 28, 2009
| | | | |
North American national carrier | | | 52.3 | |
Canadian national carrier | | | 2.0 | |
Regional Carriers and Distributors in North America | | | (1.8 | ) |
Regional Carriers and Distributors in Other | | | (0.9 | ) |
New Customers | | | 0.2 | |
Regional Carriers and Distributors in EMEA | | | 0.1 | |
Engineering Services | | | 0.1 | |
Other | | | 0.5 | |
| | | | |
Total | | | 52.5 | |
| | | | |
Changes to Revenue: Year ended February 28, 2010 vs Year ended February 28, 2009
| | | | |
North American national carrier | | | 125.8 | |
Canadian national carrier | | | 5.3 | |
Regional Carriers and Distributors in North America | | | (4.3 | ) |
New Customers | | | 3.3 | |
Regional Carriers and Distributors in Other | | | (2.2 | ) |
Regional Carriers and Distributors in EMEA | | | (1.9 | ) |
Engineering Services | | | (0.5 | ) |
Other | | | 2.3 | |
| | | | |
Total | | | 127.8 | |
| | | | |
Gross Profit
| | | | | | |
Three months ended
February 28 | | Year ended
February 28 |
|---|
| 2010 | | 2009 | | 2010 | | 2009 |
|---|
| $27,389 | | $2,939 | | $71,777 | | $14,651 |
| 42.9% | | 25.9% | | 42.0% | | 33.8% |
Our gross margin climbed to 42.9% and 42.0% for the three month period and year ended February 28, 2010 respectively. This represents a 17%, and 8.2% increase respectively over the same periods in the previous fiscal year. We have been working toward reducing the costs of supply for several quarters by moving some of our more labour intensive activities to a contract manufacturing facility in Malaysia. The cost reduction benefits associated with this decision began to be realized in the second quarter of fiscal 2010. Volume discounts made available as demand has increased are also having a favourable impact on our margin performance. While the sales volume has continued to increase quarter over quarter, labour and manufacturing costs incurred have not increased as significantly and this has benefited the gross margin in fiscal 2010. Looking forward, we continue to invest in design changes to reduce manufacturing costs and to pursue the best suppliers globally that meet our quality and cost objectives, as we continue to face downward pricing pressure globally.
10
DragonWave Inc.
Management's Discussion and Analysis
For the three months and year ended February 28, 2010
Tables are expressed in Canadian $000's except share and per share amounts
Research and Development
| | | | | | |
Three months ended
February 28 | | Year ended
February 28 |
|---|
| 2010 | | 2009 | | 2010 | | 2009 |
|---|
| $5,126 | | $2,476 | | $16,224 | | $10,628 |
Research and development ("R&D") expenses increased by $2.7 million for the three month period ended February 28, 2010 and $5.6 million for the year ended February 28, 2010, when compared with the same periods in the prior fiscal year.
A number of factors have contributed to the increased spending in R&D. First, compensation related spending, in particular variable compensation increased year over year (fourth quarter increase: $1.9 million; year-to-date increase: $ 3.5 million). Second, material spending for prototype builds and consumable materials increased year over year (fourth quarter increase: $0.7 million; year-to-date increase: $ 1.1 million). Third, infrastructure costs including depreciation in support of R&D have increased (fourth quarter increase: $0.1 million; year-to-date increase: $ 0.1 million). A final contributor to the change relates to the reduction in externally funded R&D contracts. When staff work on an externally funded project the costs are reflected in Cost of Sales rather than R&D, if the same resource is working on an internally funded project the costs stay in R&D (fourth quarter increase: $0.02 million; year-to-date increase: $ 0.9 million).
Selling and Marketing
| | | | | | |
Three months ended
February 28 | | Year ended
February 28 |
|---|
| 2010 | | 2009 | | 2010 | | 2009 |
|---|
| $4,691 | | $2,453 | | $15,252 | | $10,649 |
Sales and marketing expenses increased $2.2 million in the three months ended February 28, 2010 relative to the same three month period in the previous fiscal year, and $4.6 million for the year ended February 28, 2010 compared to the same period in the previous fiscal year.
Higher variable compensation spending associated with revenue performance accounted for the majority of the increase (fourth quarter increase: $1.2 million; year to date increase: $3.1 million). We have actively recruited sales and customer support staff internationally and salary and benefits costs are the second largest contributor to the increases in period over period spending (fourth quarter increase: $0.7 million; year to date increase: $1.3 million). Other costs incurred by us include travel, materials for customer support and marketing expenses, as we expand our customer base and global reach these costs are also increasing (fourth quarter increase: $0.3 million; year to date increase: $0.2 million).
General and Administrative
| | | | | | |
| Three months ended February 28 | | Year ended February 28 |
|---|
| 2010 | | 2009 | | 2010 | | 2009 |
|---|
| $2,804 | | $1,051 | | $8,109 | | $4,079 |
11
DragonWave Inc.
Management's Discussion and Analysis
For the three months and year ended February 28, 2010
Tables are expressed in Canadian $000's except share and per share amounts
General and administrative expenses increased by $1.8 million for the three months ended February 28, 2010 when compared to the same three month period in the previous fiscal year, and increased by $4.0 million for the year ended February 28, 2010 when compared to the same period in the prior fiscal year.
The increase in spending in the fiscal year can be primarily attributed to higher variable compensation costs and compensation spending related to an increase in headcount resources (fourth quarter of FY10 higher by $1.3 million; year-to-date fiscal 2010 higher by $2.8 million). Business taxes, insurance and other head office expenses differences accounted for a portion of the increase in spending as well (fourth quarter of FY10 higher by $0.4 million; year-to-date fiscal 2010 higher by $1.0 million). Finally, accounting and legal fees also increased (fourth quarter of fiscal 2010 higher by $0.1 million; year-to-date fiscal 2010 higher by $0.2 million).
Investment Tax Credits
| | | | | | |
Three months ended
February 28 | | Year ended
February 28 |
|---|
| 2010 | | 2009 | | 2010 | | 2009 |
|---|
| $180 | | $— | | $— | | $(82) |
In prior years we were able to claim benefits under the Ontario Innovation Tax Credit program. During the last quarter of Fiscal 2010, it was determined that the higher revenue and asset levels of the consolidated company would eliminate the entitlement to claim any benefit in Canada.
Restructuring Charges
| | | | | | |
Three months ended
February 28 | | Year ended
February 28 |
|---|
| 2010 | | 2009 | | 2010 | | 2009 |
|---|
| $— | | $17 | | $— | | $501 |
During the third fiscal quarter of the year ending February 29, 2009, we implemented a restructuring plan aimed at reducing our operating expenses due to the uncertainty in some of our markets arising from the global financial conditions prevalent at that time. Restructuring charges related to severance costs and other cost reduction measures. Other costs included both legal and contract termination costs.
Interest Income (Net)
| | | | | | |
Three months ended
February 28 | | Year ended
February 28 |
|---|
| 2010 | | 2009 | | 2010 | | 2009 |
|---|
| $63 | | $73 | | $99 | | $658 |
During fiscal 2010 DragonWave repaid the remaining outstanding balance of its revolving line of credit. The proceeds from the Offering were invested in highly liquid short term investments in the month of November 2009. The average balance of interest bearing investments was lower over the course of fiscal 2010 than in was for the previous fiscal year and the available interest rates were lower; consequently interest income in fiscal 2010 dropped significantly.
12
DragonWave Inc.
Management's Discussion and Analysis
For the three months and year ended February 28, 2010
Tables are expressed in Canadian $000's except share and per share amounts
Gain on Sale of Property and Equipment
| | | | | | |
Three months ended
February 28 | | Year ended
February 28 |
|---|
| 2010 | | 2009 | | 2010 | | 2009 |
|---|
| $— | | $— | | $279 | | $— |
We triggered small gains on the sale of test equipment when the equipment was exchanged during the purchase of new test assets.
Foreign Exchange Gain (Loss)
| | | | | | |
Three months ended
February 28 | | Year ended
February 28 |
|---|
| 2010 | | 2009 | | 2010 | | 2009 |
|---|
| $(1,037) | | $850 | | $(2,799) | | $4,514 |
The foreign exchange loss recognized in the fourth quarter and in fiscal year ended February 28, 2010 reflected the change in the Canadian dollar relative to the U.S. dollar over the three and twelve month periods respectively. The losses arise from translation of U.S. denominated monetary assets into CAD at the balance sheet date.
Income Taxes
| | | | | | | | | | | | | |
| | Three months ended
February 28 | | Year ended
February 28 | |
|---|
| | 2010 | | 2009 | | 2010 | | 2009 | |
|---|
| Income tax expense | | $ | 212 | | $ | 15 | | $ | 359 | | $ | 37 | |
The income tax expense recorded for the year ended February 28, 2010 relates primarily to DragonWave's wholly owned U.S. subsidiary. Given its recent history of positive net income, it was determined that the benefit of the tax losses available to the U.S. subsidiary should be recorded. This recovery was recognized in the second quarter of fiscal 2009. An accrual for the estimated taxes payable associated with the taxable income in excess of available tax losses for the U.S. subsidiary, in addition to an amount related to the utilization of the tax asset, was recorded for the year ended February 28, 2010.
We have a number of tax deduction pools (including loss carryforwards and scientific research and experimental development expenses), primarily in Canada, available to us to reduce future taxable income. At the end of fiscal 2010, the total of these deductions was $51,677 (February 28, 2009—$66,989) for use in fiscal 2011 and future years. Except for the benefit recorded in respect of U.S. operating losses, income tax benefits relating to these deductions have not been recognized in the consolidated financial statements as recognition requirements under the liability method of accounting for income taxes were not met.
We also have $8,142 of investment tax credits which, together with various provincial tax credits, can be used by DragonWave to reduce actual cash taxes in Canada. Depending on the year in which the credits are used our tax credit balances will eliminate tax on an additional $20 million to $24 million of taxable income. In total, we have tax deductions and credits which will eliminate tax on future taxable income of between $72 million and $76 million.
13
DragonWave Inc.
Management's Discussion and Analysis
For the three months and year ended February 28, 2010
Tables are expressed in Canadian $000's except share and per share amounts
Liquidity and Capital Resources
As at February 28, 2010, we had a credit line in place with a major U.S.-based bank which allows borrowing to support working capital requirements of up to $10.0 million USD and capital expenditure requirements of up to $3 million USD.
The table below outlines selected balance sheet accounts and key ratios:
| | | | | | | | |
| | As at
February 28, 2010 | | As at
February 28, 2009 | |
|---|
Key Balance Sheet Amounts and Ratios: | | | | | | | |
| | Cash and Cash Equivalents | | | 110,805 | | | 8,504 | |
| | Short Term Investments | | | 8,498 | | | 14,994 | |
| | Working Capital | | | 140,347 | | | 40,619 | |
| | Long Term Assets | | | 8,004 | | | 2,676 | |
| | Long Term Liabilities | | | — | | | — | |
| | Working Capital Ratio | | | 4.7 : 1 | | | 5.8 : 1 | |
| | Days Sales Outstanding in accounts receivable | | | 47 days | | | 76 days | |
| | Inventory Turnover | | | 5.7 times | | | 2.3 times | |
Cash and Cash Equivalents, and Short Term Investments
As at February 28, 2010, we had $119.3 million in cash and cash equivalents plus short term investments ("Cash") representing a $95.8 million increase from the Cash balance at February 28, 2009 (Balance at February 28, 2009: $23.5 million). In addition to the $70.5 million proceeds from the Offering, DragonWave generated approximately $30.2 million of Cash from net income (adjusted for non-cash items) and $1.9 million in options proceeds. The growth in non-cash working capital reduced the Cash resources by $0.9 million. In addition, Cash was used to invest in capital equipment needed to meet evolving R&D needs and growing capacity requirements (acquisitions paid for in fiscal 2010 = $5.9 million).
14
DragonWave Inc.
Management's Discussion and Analysis
For the three months and year ended February 28, 2010
Tables are expressed in Canadian $000's except share and per share amounts
Working Capital
| | | | |
Changes in working capital | | February 28, 2009
to
February 28, 2010 | |
|---|
Beginning Working Capital Balance (current assets — current liabilities) | | | 40,619 | |
Cash and cash equivalents & short term investments | | | 95,805 | |
Trade Receivables | | | 19,922 | |
Other receivables | | | 1,176 | |
Inventory | | | 10,928 | |
Prepaid Expenses | | | 586 | |
Current Income Tax Asset | | | 459 | |
Line of Credit | | | 641 | |
Accounts Payable and accrued liabilities | | | (30,092 | ) |
Taxes Payable | | | (842 | ) |
Deferred Revenue | | | 1,145 | |
| | | | |
Net Change in Working Capital | | | 99,728 | |
| | | | |
Ending Working Capital Balance | | | 140,347 | |
| | | | |
Working capital is calculated as the difference between current assets and current liabilities. Our working capital balance increased to $140.4 million between February 28, 2009 and February 28, 2010. The most significant impact related to the increase in Cash. The increase in trade receivables was also a significant factor however, it was offset by the increase in accounts payable and accrued liabilities.
The days sales outstanding in trade receivables, ("DSO"), as at February 28, 2010 was 47 days. This calculation was 29 days lower than the DSO of 76 days at February 28, 2009. We evaluate DSO by determining the number of days of sales in the ending trade receivables balance with reference to the most recent monthly sales, rather than average yearly or quarterly values. Our favourable DSO performance relates to strong collection efforts and timely receipt of payments.
Inventory turnover for February 28, 2010 was 5.7 times for the year then ended, an improvement to that experienced at February 28, 2009. Turnover is calculated with reference to the most recent monthly standard cost of goods sold and is based on the period ending inventory balance of production related inventory (net of labour and overhead allocations).
15
DragonWave Inc.
Management's Discussion and Analysis
For the three months and year ended February 28, 2010
Tables are expressed in Canadian $000's except share and per share amounts
Cash Inflows and Outflows:
| | | | | | | | | | | | | | | | | | | | | | |
| | Quarter Ended | | Year Ended | |
|---|
| | Feb 28
2009 | | May 31
2009 | | Aug 31
2009 | | Nov 30
2010 | | Feb 28
2010 | | Feb 28
2009 | | Feb 28
2010 | |
|---|
Beginning Cash (incl Short Term Investments) | | | 25,220 | | | 23,498 | | | 21,975 | | | 21,349 | | | 104,003 | | | 33,459 | | | 23,498 | |
Normal Operations | | | | | | | | | | | | | | | | | | | | | | |
Net Income (Loss) | | | (2,150 | ) | | (2,883 | ) | | 6,291 | | | 12,602 | | | 13,402 | | | (5,989 | ) | | 29,412 | |
Changes in Non-Cash Working Capital | | | 79 | | | 1,475 | | | (5,380 | ) | | 2,514 | | | 1,003 | | | (4,997 | ) | | (388 | ) |
Capital Asset Purchases | | | (117 | ) | | (592 | ) | | (1,501 | ) | | (2,628 | ) | | (1,172 | ) | | (923 | ) | | (5,893 | ) |
Line of Credit/Option proceeds & other | | | 15 | | | (44 | ) | | 36 | | | (463 | ) | | 1,773 | | | 252 | | | 1,302 | |
Non Cash items included in Net Income | | | 451 | | | 521 | | | (72 | ) | | 149 | | | 294 | | | 1,696 | | | 892 | |
| | | | | | | | | | | | | | | | |
Total Cash (Used) / Generated | | | (1,722 | ) | | (1,523 | ) | | (626 | ) | | 12,174 | | | 15,300 | | | (9,961 | ) | | 25,325 | |
NASDAQ IPO | | |
— | | |
— | | |
— | | |
70,480 | | |
— | | |
— | | |
70,480 | |
| | | | | | | | | | | | | | | | |
Ending Cash (incl Short Term Investments) | | | 23,498 | | | 21,975 | | | 21,349 | | | 104,003 | | | 119,303 | | | 23,498 | | | 119,303 | |
Cash Generated by Operating Activities
The positive impact to cash of net income in the year ended February 28, 2010 was not significantly reduced by changes in non-cash working capital items, in part because of the favourable collection performance and improved inventory turnover metrics for DragonWave.
Investing Activities (Purchase of Capital Assets)
We are continuing to invest in capital equipment to support engineering programs as well as the capacity requirements associated with the increase in sales demand. In the quarter, we invested $1.2 million of cash in additional capital to bring the total year investment to $7.0 million. Approximately $1.1 million of the total capital purchased in the year remained in accounts payable at year end. As a result the cash impact of the capital investment was $5.9 million.
Financing Activities
In Q3 of fiscal 2010, DragonWave sold 7,493,562 common shares for $10.29 CAD (US$10.00) resulted in gross proceeds of $77.1 million. After deducting commissions and listing expenses, we realized net proceeds of $70.5 million. All equity proceeds in Q4 of fiscal 2010 were the result of the exercise of stock options.
16
DragonWave Inc.
Management's Discussion and Analysis
For the three months and year ended February 28, 2010
Tables are expressed in Canadian $000's except share and per share amounts
We disclosed our expectations regarding the use of net proceeds ($70.5 million) of the Offering in our supplemented short form PREP prospectus dated October 14, 2009. The following table summarizes progress to the end of FY2010 against the use of net proceeds disclosed in the prospectus, other than proceeds which were described as being allocated to working capital:
| | | | | |
Description of Expected Use of Proceeds | | Amount of
Net Proceeds | | Status as at February 28, 2010 |
|---|
| Strengthen our balance sheet | | $ | 28.2 million | | As at February 28, 2010, the Company had $119.3 million in Cash on its balance sheet, consisting of net proceeds of the Offering that have not yet been allocated as well as cash flow from operations. |
| Fund efforts to increase sales penetration in regions outside of North America | |
$ |
14.1 million | |
Between October 14, 2009 and February 28, 2009, the Company expended approximately $1.9 million to fund efforts to increase sales penetration outside of North America. |
| Provide source of funding for potential future acquisitions | |
$ |
7.05 million | |
To date, the Company has not made any acquisitions. |
In addition to cash raised through financing activities, we generate substantial cash flow from operations which is also allocated to the foregoing uses, as described in the table, as well as to fund operations and other initiatives. As disclosed in the Offering prospectus, management has broad discretion in how it uses the net proceeds received from financing activities. We may re-allocate the net proceeds of the Offering from time to time having consideration to our strategy relative to the market and other conditions in effect at the time, including those factors discussed above under the heading "Risks and Uncertainties". As discussed in "Outlook", our current focus is on diversifying our customer base through a strategy that includes product innovation, expansion of our geographic markets, OEM arrangements and mergers and acquisitions, and we expect that our available funds will be used to support these and related initiatives as well as other elements of our growth strategy.
Liquidity and Capital Resource Requirements
Based on our recent performance, current revenue expectations, and funds raised through the financing activities of the previous year, our management believes cash resources will be available to satisfy working capital needs for at least the next 12 months.
17
DragonWave Inc.
Management's Discussion and Analysis
For the three months and year ended February 28, 2010
Tables are expressed in Canadian $000's except share and per share amounts
Commitments as at February 28, 2010
Future minimum operating lease payments as at February 28, 2010 per fiscal year are as follows:
| | | | |
Fiscal Year | | $(000's) | |
|---|
2011 | | | 1,277 | |
2012 | | | 834 | |
2013 | | | 97 | |
2014 | | | 15 | |
Thereafter | | | — | |
| | | | |
Total | | | 2,223 | |
| | | | |
In addition to the above, on December 1, 2008, we issued a letter of credit to support a guarantee with a European bank. The guarantee expires on April 30, 2010 and has an amount of up to 860,000 Euros. We are selling equipment to an integrator who will resell the equipment to a service provider. We will be required to fulfill our obligations under the guarantee in the event that the service provider defaults on its obligations to the bank. We have recourse against the integrator in the event that the guarantee is exercised.
In the normal course of its business activities, DragonWave is subject to claims and legal actions. We recognize a provision for estimated loss contingencies when it is probable that a liability has been incurred and the amount of the loss can be reasonably estimated. In management's opinion, adequate provisions have been made for all current and future claims.
Outstanding Share Data
The common shares of the Corporation are listed on the Toronto Stock Exchange ("TSX") under the symbol DWI and on the NASDAQ under the symbol DRWI.
| | | | | | | | | |
| | Outstanding | | Exercise Price
Range | | Weighted Avg
Exercise Price | |
|---|
Common shares | | | 36,934,917 | | n/a | | | n/a | |
DWI on TSX on Feb. 28, 2010 | | $ | 12.91 | | | | | | |
Market Capitalization | | $ | 476,829,778 | | | | | | |
Stock option — common shares | | |
1,603,052 | |
$1.34 — $13.74 | |
$ |
3.35 | |
Warrants — common share | | | 87,490 | | $3.56 — $9.10 | | $ | 6.12 | |
The information presented is at February 28, 2010. There were no material transactions between February 28, 2010 and the date of this MD&A that would materially affect the number of common shares outstanding. However, on March 15, 2010 DragonWave announced that we had authorized, subject to regulatory approval, the purchase of common shares of the company equal to up to 10% of the public float by way of a normal course issuer bid on the Toronto Stock Exchange and/or the NASDAQ Global Market. On April 9, 2010 DragonWave made an announcement that the TSX had accepted DragonWave's notice of intention to make a normal course issuer bid.
The normal course issuer bid will be subject to the rules of the TSX and applicable securities laws, including the rules pertaining to the maximum number of shares that may be purchased in any one day. DragonWave will
18
DragonWave Inc.
Management's Discussion and Analysis
For the three months and year ended February 28, 2010
Tables are expressed in Canadian $000's except share and per share amounts
pay the market price at the time of acquisition of common shares purchased through the facilities of the NASDAQ Global Market and/or the TSX. All common shares acquired by DragonWave under the normal course issuer bid will be cancelled.
We are initiating the normal course issuer bid because we believe that, at certain times, the market price of its common shares may not reflect the underlying value of its business and its future prospects. The objective of the normal course issuer bid is to provide capital appreciation and market stability for the benefit of DragonWave's shareholders. We have not previously engaged in a normal course issuer bid.
Off-Balance Sheet Arrangements
We lease space for our headquarters in Ottawa, Ontario, Canada. Our R&D, services and support, and general and administrative groups operate from our headquarters. We also lease warehouse space in Ottawa, Ontario, Canada. Both leases expire in November 2011. We lease additional warehouse space on a month by month basis. Our rental costs including operating expenses total $ 90.0 thousand per month. In April, 2008 we signed a lease agreement in England. The lease expires in April, 2013 and rental costs including operating costs total $7.8 thousand per month. In December 2009 we signed a lease agreement in Singapore. The lease expires in May 2010 and rental costs including operating costs total $1.7 thousand per month. In December 2009 we signed a lease agreement in Dubai. The lease expires in November 2010 and rental costs including operating costs total $3.7 thousand per month.
We use an outsourced manufacturing model whereby most of the component acquisition and assembly of our products is executed by third parties. Generally, we provide the supplier with a purchase order 90 days in advance of expected delivery. We are responsible for the financial impact of any changes to the product requirements within this period. We have purchase orders in place currently for raw materials and manufactured products in addition to capital expenses and services. All purchase orders reflect our current view on revenue and cash flow.
Financial Instruments
Under Canadian generally accepted accounting principles, financial instruments are classified into one of the following categories: held for trading, held-to-maturity, available-for-sale, loans and receivables, or other liabilities.
Fair Value
The following table summarizes the carrying values of the Company's financial instruments:
| | | | | | | |
| | February 28,
2010 | | February 28,
2009 | |
|---|
Held-for-trading (1) | | | 119,303 | | | 23,498 | |
Loans and receivables (2) | | | 30,512 | | | 11,243 | |
Other financial liabilities (3) | | | 32,911 | | | 5,934 | |
- (1)
- Includes cash, cash equivalents, and short term investments
- (2)
- Includes trade receivables and other receivables
- (3)
- Includes line of credit, accounts payable and accrued liabilities which are financial in nature
19
DragonWave Inc.
Management's Discussion and Analysis
For the three months and year ended February 28, 2010
Tables are expressed in Canadian $000's except share and per share amounts
Cash and cash equivalents, short term investments, trade receivables, other receivables, line of credit, accounts payable and accrued liabilities are short term financial instruments whose fair value approximates the carrying amount given that they will mature shortly. As at the balance sheet date, there are no significant differences between the carrying value of these items and their estimated fair values.
Transactions with Related Parties
We lease premises from a real estate company controlled by a member of the Board of Directors. During the year ended February 28, 2010, DragonWave paid $1.1 million [twelve months ended February 28, 2009 — $0.8 million], relating to the rent, operating costs, and leasehold improvements associated with this real estate, and the value owing for net purchases at February 28, 2010 was $74.0 thousand [February 28, 2009 — nil] and is included in accounts payable and accrued liabilities. These amounts have been allocated amongst various expense accounts.
We also purchased products and services from a company controlled or significantly influenced by a Board member. Total net product and services purchased for the year ended February 28, 2010 was $13.4 million [twelve months ended February 28, 2009 — $14.3 million], and the value owing for net purchases at February 28, 2010 was $0.3 million [February 28, 2009 — $1.4 million] and is included in accounts payable and accrued liabilities. The majority of the purchases have been recorded in inventory and ultimately in cost of sales.
Details of related party transaction amounts included in income statement captions are as follows:
| | | | | | | |
| | Year ended February 28 | |
|---|
| | 2010 | | 2009 | |
|---|
Cost of Sales | | | 13,619 | | | 14,103 | |
Research and Development | | | 586 | | | 437 | |
General and administrative | | | 183 | | | 280 | |
Sales and Marketing | | | 98 | | | 333 | |
| | | | | | |
Total | | | 14,486 | | | 15,153 | |
All transactions are in the normal course of business and have been recorded at the exchange amount.
Description of Credit Facilities
Bank Line of Credit
As at February 28, 2010, we had drawn nil [February 28, 2009 — $0.6 million] on an operating credit facility with a limit of $10.0 million USD [February 28, 2009 — $5.0 million CAD]. Interest is calculated at the bank's prime rate of interest plus 1.75% [February 28, 2009 — 1%] and resulted in a weighted average effective rate of 4.36% [February 28, 2009 — 5.44%] during the 12 months ended February 28, 2010. The draw on the line of credit is denominated in both Canadian and US currencies. An additional $1.5 million USD has been reserved against the operating line of credit to secure letters of credit to support performance guarantees. We have provided a general security agreement on trade receivables. We were in compliance with the financial covenants included in the lending agreement at all periods mentioned above.
DragonWave also holds a capital expenditure facility with a limit of $3.0 million USD [February 28, 2009 — nil].
20
DragonWave Inc.
Management's Discussion and Analysis
For the three months and year ended February 28, 2010
Tables are expressed in Canadian $000's except share and per share amounts
Controls and Procedures
In compliance with the Canadian Securities Administrators' National Instrument 52-109 ("NI 52-109"), we have filed certificates signed by the Chief Executive Officer ("CEO") and the Chief Financial Officer ("CFO") that, among other things, report on the design and effectiveness of disclosure controls and procedures and the design and effectiveness of internal controls over financial reporting.
Disclosure controls and procedures
The CEO and the CFO have designed disclosure controls and procedures, or have caused them to be designed under their supervision, in order to provide reasonable assurance that within the time periods specified in securities legislation:
- •
- material information relating to the Corporation has been made known to them; and
- •
- information required to be disclosed in the Corporation's filings is recorded, processed, summarized and reported
An evaluation was carried out, under the supervision of the CEO and the CFO, of the effectiveness of our disclosure controls and procedures. Based on this evaluation, the CEO and the CFO concluded that the disclosure controls and procedures were effective as of February 28, 2010.
Internal controls over financial reporting
The CEO and the CFO have also designed internal controls over financial reporting, or have caused them to be designed under their supervision, in order to provide reasonable assurance regarding the reliability of financial reporting and the preparation of financial statements for external purposes in accordance with Canadian GAAP.
An evaluation was carried out, under the supervision of the CEO and the CFO, of the design and effectiveness of our internal controls over financial reporting. Based on this evaluation, the CEO and the CFO concluded that the internal controls over financial reporting were effective as of February 28, 2010.
Changes in internal controls over financial reporting
No changes were made to our internal controls over financial reporting that occurred during the fourth quarter of fiscal year 2010 that have materially affected, or are reasonably likely to materially affect, our internal controls over financial reporting.
Commencing with our fiscal year ended February 28, 2011, we will be required to satisfy the requirements of Section 404 of the Sarbanes-Oxley Act ("SOX"). SOX requires an annual assessment by management of the effectiveness of our internal control over financial reporting and an attestation report by our independent auditors addressing this assessment.
21
DragonWave Inc.
Management's Discussion and Analysis
For the three months and year ended February 28, 2010
Tables are expressed in Canadian $000's except share and per share amounts
Critical Accounting Policies and Estimates
Inventory
We value inventory at the lower of cost and market. We calculate the cost of raw materials on a standard cost basis, which approximates average cost. Market is determined as net realizable value for finished goods, raw materials and work in progress. Indirect manufacturing costs and direct labour expenses are allocated systematically to the total production inventory.
Revenue recognition
We derive revenue from the sale of our broadband wireless backhaul equipment which includes embedded software and a license to use said software and extended product warranties. We consider software to be incidental to the product. Services range from installation and training to basic consulting. We recognize revenue when persuasive evidence of an arrangement exists, delivery has occurred and there are no significant remaining vendor obligations, collection of receivables is reasonably assured and the fee is fixed and determinable. Where final acceptance of the product is specified by the customer, revenue is deferred until acceptance criteria have been met. Additionally, our business agreements may contain multiple elements. Accordingly, we are required to determine the appropriate accounting, including whether the deliverables specified in a multiple element arrangement should be treated as separate units of accounting for revenue recognition purposes, the fair value of these separate units of accounting and when to recognize revenue for each element. For arrangements involving multiple elements, we allocate revenue to each component of the arrangement using the residual value method, based on vendor-specific objective evidence of the fair value of the undelivered elements. These elements may include one or more of the following: advanced replacement, extended warranties, training, and installation. We allocate the arrangement fee, in a multiple-element transaction, to the undelivered elements based on the total fair value of those undelivered elements, as indicated by vendor-specific objective evidence. This portion of the arrangement fee is deferred. The difference between the total arrangement fee and the amount deferred for the undelivered elements is recognized as revenue related to the delivered elements. In some instances, a group of contracts or agreements with the same customer may be so closely related that they are, in effect, part of a single multiple element arrangement and, therefore, we would allocate the corresponding revenue among the various components, as described above.
We generate revenue through direct sales and sales to distributors. Revenue on stocking orders sold to distributors is not recognized until the end-user is identified.
We evaluate arrangements that include services such as training and installation to determine whether those services are essential to the functionality of other elements of the arrangement. When services are considered essential, revenue allocable to the other elements is deferred until the services have been performed. When services are not considered essential, the revenue allocable to the services is recognized as the services are performed.
We recognize revenue associated with extended warranty and advanced replacement rateably over the life of the contract.
We recognize revenue from engineering services or development agreements according to the specific terms and acceptance criteria as services are rendered.
22
DragonWave Inc.
Management's Discussion and Analysis
For the three months and year ended February 28, 2010
Tables are expressed in Canadian $000's except share and per share amounts
We accrue estimated potential product liability as warranty costs when revenue on the sale of equipment is recognized. We calculate warranty costs on a percentage of revenue per month based on current actual warranty costs and return experience.
We record shipping and handling costs borne by us in costs of sales. Shipping and handling costs charged to customers are recorded as revenue, if billed at the time of shipment. Costs charged to customers after delivery are recorded in cost of sales.
Research and development
Our research costs are expensed as incurred. Our development costs other than property and equipment are expensed as incurred unless they meet generally accepted accounting criteria for deferral and amortization. Development costs incurred prior to establishment of technological feasibility do not meet these criteria, and are expensed as incurred. Government assistance and investment tax credits relating to ongoing R&D costs are recorded as a recovery of the related R&D expenses, where such assistance is reasonably assured.
Foreign currency translation
Our U.S. subsidiary, DragonWave Corp., is considered financially and operationally integrated and is translated into CAD using the temporal method of translation: monetary assets and liabilities are translated at the period end exchange rate, non-monetary assets are translated at the historical exchange rate, and revenue and expense items are translated at the average exchange rate. Gains or losses resulting from the translation adjustments are included in our income.
Income taxes
Income taxes are accounted for using the liability method of accounting for income taxes. Under this method, future tax assets and liabilities are determined based on differences between the tax and accounting basis of assets and liabilities as well as for the benefit of losses available to be carried forward to future years for tax purposes that are more likely than not to be realized. Future tax assets and liabilities are measured using substantively enacted tax rates that apply to taxable income in the years in which temporary differences are expected to be recovered or settled. Future tax assets are recognized only to the extent, in the opinion of management, it is more likely than not that the future tax assets will be realized in the future.
We periodically review our provisions for income taxes and the valuation allowance to determine whether the overall tax estimates are reasonable. When we perform our quarterly assessments of the provision and valuation allowance, it may be determined that an adjustment is required. This adjustment may have a material impact on our financial position and results of operations.
Future Accounting Changes
In 2006, Canada's Accounting Standards Board ratified a strategic plan that will result in Canadian GAAP, as used by public companies, being evolved and converged with International Financial Reporting Standards ("IFRS") over a transitional period to be complete by 2011 (first quarter of fiscal 2012). We will be required to report using the converged standards effective for interim and annual financial statements relating to fiscal years beginning on or after January 1, 2011. Canadian GAAP will be converged with IFRS through a combination of two methods: as current joint-convergence projects of the United States' Financial Accounting Standards Board and the International Accounting Standards Board are agreed upon, they will be adopted by Canada's
23
DragonWave Inc.
Management's Discussion and Analysis
For the three months and year ended February 28, 2010
Tables are expressed in Canadian $000's except share and per share amounts
Accounting Standards Board and may be introduced in Canada before the complete changeover to IFRS; and standards not subject to a joint-convergence project will be exposed in an omnibus manner for introduction at the time of the complete changeover to IFRS. The International Accounting Standards Board currently has projects underway that should result in new pronouncements that continue to evolve IFRS.
Transition to IFRS
We will be required to report consolidated year end financial statements under IFRS for the first time on February 28, 2012 and the interim financial statements starting March 1, 2011. We are aware of the magnitude of the effort involved to succeed in such a transition and have begun the process to prepare for this eventuality.
We started on the conversion plan in the first half of our 2010 fiscal year with the help of an external advisor. The project consists of three phases to be completed in order to change over to IFRS: diagnostic, development and implementation.
The first phase includes the identification of significant differences between the current Canadian GAAP standards and IFRS that are relevant to us and a review of the alternatives available upon adoption. We performed a diagnostic review and established the most significant differences applicable to us. Canadian GAAP and IFRS differ in the following areas: share based payments, revenue recognition, property and equipment, leases, provisions, reporting currency, accounting for income taxes and presentation and additional disclosure requirements under IFRS. Additional differences might be identified in the future as changes to IFRS standards are released.
Results of Development Stage:
| | | | |
| | Financial Impact | | Disclosure Impact |
|---|
Share Based Payments | | ü | | ü |
Revenue | | | | ü |
Property, Plant & Equipment | | | | ü |
Leases | | | | ü |
Provisions | | ü | | ü |
Reporting Currency | | | | ü |
Income Tax | | ü | | ü |
Financial Statement Presentation | | | | ü |
The second phase, which will begin in the first fiscal quarter of 2011, includes identification, evaluation and selection of accounting policies necessary for us to change over to IFRS as well as potential first-time adoption exemptions. During this phase, we will assess the impact of the transition on our ERP system and internal controls over financial reporting. We will take steps to appropriately document new policies and begin to pull together the information that we need for the additional disclosure required under IFRS. We intend to produce financial results for the first quarter of fiscal 2011 in both Canadian GAAP (for public disclosure) and IFRS (retained internally). The IFRS compliant statements will be required in Q1 FY2012 as comparatives to our statements released at that time. During this phase of the project we will also be addressing the training requirements for our finance team.
The implementation phase will integrate all the solutions into our financial system and processes that are necessary for us to convert to IFRS and will begin in the second half of fiscal 2011.
24
DragonWave Inc.
Management's Discussion and Analysis
For the three months and year ended February 28, 2010
Tables are expressed in Canadian $000's except share and per share amounts
Change in Functional and Reporting Currency
Effective March 1, 2010 ("conversion date"), we adopted the U.S. dollar ("USD") as our functional and reporting currency. This was a result of the continuing shift in the proportion of our revenue, expenses, assets and liabilities denominated in USD. Prior to the conversion date, DragonWave's operations were measured and expressed in Canadian dollars ("CAD").
A significant portion of DragonWave's business is now conducted in USD: The following metrics illustrate the proportion of activity currently conducted in USD.
- •
- Revenue: In fiscal 2010 98% of our sales were invoiced in USD (Fiscal Year 2009 — 94%).
- •
- Cost of Sales: In fiscal 2010 94% of the cost of inventory, including parts costs, overhead and labour and freight was incurred in USD (Fiscal Year 2009 — 94%).
- •
- Expenses: In fiscal 2010 approximately 70% of expenses were paid inCAD; 30% were paid other currencies including GBP, EUR and USD. (Fiscal Year 2009 — 80% CAD). At February 28, 2010, 95% of DragonWave's staff is located in Canada. Spending in other currencies includes payment for engineering materials commonly paid in USD.
- •
- Equity Financing: In October, 2009, DragonWave announced that its shares commenced trading on the NASDAQ Global Market. After deducting commissions and listing expenses, the Company realized net proceeds of $70.5 million (CAD) from that offering; 65% of the proceeds were received in USD.
- •
- Cash: As at February 28, 2010, DragonWave had $97.0 million USD in USD Cash and $16.3 million USD in other Cash denominated in other currencies. (February 28, 2009: $4.8 million USD in USD Cash and $13.7 million USD in other currencies).
- •
- Trade receivables: As at February 28, 2010 98.6% of the trade receivables balance was denominated in USD (February 28, 2009 — 90.4%).
- •
- Accounts Payable: As at February 28, 2010 the company held accounts payable balances of $15.7 million USD in USD and $4.2 million USD in other currencies (February 28, 2009 — $1.9 million USD in USD and $0.6 million USD in other currencies).
Until the current fiscal year, our fixed costs (such as salaries) paid largely in CAD and our variable costs (material costs) paid predominantly in USD were roughly equal. In fiscal 2010, as revenue increased by 295%, cash paid out in USD began to significantly outpace CAD dollar spending.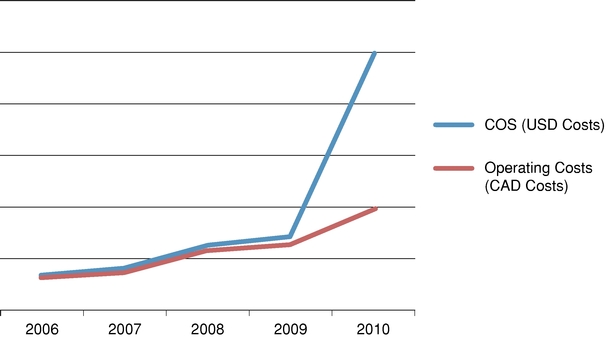
25
DragonWave Inc.
Management's Discussion and Analysis
For the three months and year ended February 28, 2010
Tables are expressed in Canadian $000's except share and per share amounts
The Company followed the recommendations of the Emerging Issues Committee (EIC) of the CICA, set out in EIC-130, "TRANSLATION METHOD WHEN THE REPORTING CURRENCY DIFFERS FROM THE MEASUREMENT CURRENCY OR THERE IS A CHANGE IN THE REPORTING CURRENCY". In accordance with EIC-130, using the current rate method, assets and liabilities as at March 1, 2010, were translated into USD using the exchange rate in effect on that date; as the change took place on the first day of the fiscal year, there was no income statement or cash flow translation required; equity transactions were translated at historical rates. Management believes that this treatment is consistent with the US GAAP methodology found in FASB Accounting Standard 830.
As supplemental disclosure, we used the current rate method to restate fiscal years 2010 and 2009. Under this method, assets and liabilities are translated at the closing rate in effect at the end of the periods, revenues, expenses and cash flows are translated at the average rates in effect throughout the period; and equity transactions are translated at historical rates. Any exchange differences resulting from the translation are included in Accumulated Other Comprehensive Income (AOCI) presented in shareholders' equity (deficiency).
We used a weighted average foreign exchange rate based on revenue activity during the relative fiscal periods to translate the income statement amount.The supplementary information in USD is presented only for the convenience of some readers and thus has limited usefulness. This translation should not be viewed as a representation that such Canadian dollar amounts actually represent such USD amounts or could be or would have been converted into USD at the rate used to translate.
26
DragonWave Inc.
Management's Discussion and Analysis
For the three months and year ended February 28, 2010
Tables are expressed in Canadian $000's except share and per share amounts
CONSOLIDATED BALANCE SHEETS
Expressed in USD $000's
unaudited
| | | | | | | | |
| | As at
February 28
2010 | | As at
February 28
2009 | |
|---|
Assets | | | | | | | |
Current Assets | | | | | | | |
| | Cash and cash equivalents | | | 105,276 | | | 6,693 | |
| | Short term investments | | | 8,074 | | | 11,800 | |
| | Accounts receivable | | | 28,926 | | | 8,282 | |
| | Other receivables | | | 1,801 | | | 567 | |
| | Inventory | | | 23,910 | | | 11,205 | |
| | Prepaid expenses | | | 721 | | | 136 | |
| | Future income tax asset | | | 436 | | | — | |
| | | | | | |
| | | 169,144 | | | 38,683 | |
Long Term Assets | | | | | | | |
| | Property, equipment and intangible assets | | | 7,546 | | | 2,106 | |
| | Future income tax asset | | | 59 | | | — | |
| | | | | | |
| | | 7,605 | | | 2,106 | |
Total Assets | | |
176,749 | | |
40,789 | |
| | | | | | |
Liabilities | | | | | | | |
Current Liabilities | | | | | | | |
| | Line of credit | | | — | | | 504 | |
| | Accounts payable and accrued liabilities | | | 33,949 | | | 4,468 | |
| | Taxes payable | | | 835 | | | | |
| | Deferred revenue | | | 1,017 | | | 1,743 | |
| | | | | | |
| | | 35,801 | | | 6,715 | |
Long Term Liabilities | | | | | | | |
| | Deferred revenue | | | 2,102 | | | | |
Shareholders' equity | | | | | | | |
| | Capital stock | | | 179,174 | | | 108,153 | |
| | Contributed surplus | | | 1,375 | | | 1,156 | |
| | Deficit | | | (32,085 | ) | | (59,930 | ) |
| | Accumulated other comprehensive income | | | (9,617 | ) | | (15,305 | ) |
| | | | | | |
| | | 138,847 | | | 34,074 | |
Total Liabilities and Shareholders' Equity | | |
176,749 | | |
40,789 | |
| | | | | | |
Shares issued & outstanding | | | 36,934,917 | | | 28,559,297 | |
27
DragonWave Inc.
Management's Discussion and Analysis
For the three months and year ended February 28, 2010
Tables are expressed in Canadian $000's except share and per share amounts
CONSOLIDATED STATEMENTS OF OPERATIONS,
COMPREHENSIVE INCOME AND DEFICIT
Expressed in USD $000's except share and per share amounts
unaudited
| | | | | | | | | | | | | | | | | | | | |
| | Three Months Ended | | Year Ended | |
|---|
| | May 31,
2009 | | Aug 31,
2009 | | Nov 30,
2009 | | Feb 28,
2010 | | Feb 28,
2010 | | Feb 28,
2009 | |
|---|
REVENUE | | | 12,999 | | | 32,423 | | | 51,594 | | | 60,973 | | | 157,989 | | | 39,749 | |
| | Cost of sales | | | 8,509 | | | 18,795 | | | 29,453 | | | 34,808 | | | 91,565 | | | 26,311 | |
| | | | | | | | | | | | | | |
Gross profit | | | 4,490 | | | 13,628 | | | 22,141 | | | 26,165 | | | 66,424 | | | 13,439 | |
| | | | | | | | | | | | | | |
| | | 34.5% | | | 42.0% | | | 42.9% | | | 42.9% | | | 42.0% | | | 33.8% | |
EXPENSES | | | | | | | | | | | | | | | | | | | |
| | Research and development | | | 2,465 | | | 3,236 | | | 4,187 | | | 4,897 | | | 14,785 | | | 9,749 | |
| | Selling and marketing | | | 2,069 | | | 3,257 | | | 4,118 | | | 4,481 | | | 13,925 | | | 9,768 | |
| | General and administrative | | | 1,003 | | | 1,661 | | | 2,084 | | | 2,679 | | | 7,427 | | | 3,742 | |
| | Investment tax credits | | | (49 | ) | | (55 | ) | | (55 | ) | | 172 | | | 13 | | | (75 | ) |
| | Restructuring charges | | | — | | | — | | | — | | | — | | | — | | | 460 | |
| | | | | | | | | | | | | | |
| | | 5,488 | | | 8,099 | | | 10,334 | | | 12,229 | | | 36,150 | | | 23,643 | |
| | | | | | | | | | | | | | |
Income (Loss) from operations | | | (998 | ) | | 5,529 | | | 11,807 | | | 13,936 | | | 30,274 | | | (10,204 | ) |
| | Interest income | | | 28 | | | 9 | | | 18 | | | 61 | | | 116 | | | 636 | |
| | Interest expense | | | (6 | ) | | (14 | ) | | (6 | ) | | (1 | ) | | (27 | ) | | (32 | ) |
| | Gain on sale of property, equipment and intangible assets | | | — | | | 32 | | | 226 | | | — | | | 258 | | | — | |
| | Foreign exchange gain (loss) | | | (1,374 | ) | | 64 | | | (135 | ) | | (991 | ) | | (2,436 | ) | | 4,141 | |
| | | | | | | | | | | | | | |
Income (Loss) before income taxes | | | (2,350 | ) | | 5,620 | | | 11,910 | | | 13,005 | | | 28,185 | | | (5,460 | ) |
| | Income tax expense (recovery) | | | — | | | (125 | ) | | 263 | | | 203 | | | 341 | | | 34 | |
| | | | | | | | | | | | | | |
Net Income (Loss) | | | (2,350 | ) | | 5,745 | | | 11,647 | | | 12,802 | | | 27,844 | | | (5,494 | ) |
| | Foreign exchange adjustment | | | 5,141 | | | (39 | ) | | 50 | | | 536 | | | 5,688 | | | (10,674 | ) |
| | | | | | | | | | | | | | |
Comprehensive Income (Loss) | | | 2,791 | | | 5,706 | | | 11,697 | | | 13,338 | | | 33,532 | | | (16,168 | ) |
Deficit, beginning of period | | | (59,930 | ) | | (62,280 | ) | | (56,535 | ) | | (44,888 | ) | | (59,930 | ) | | (54,436 | ) |
| | | | | | | | | | | | | | |
Deficit, end of period | | | (62,280 | ) | | (56,535 | ) | | (44,888 | ) | | (32,086 | ) | | (32,086 | ) | | (59,930 | ) |
Income (Loss) per share | | | | | | | | | | | | | | | | | | | |
| | Basic | | | (0.08 | ) | | 0.20 | | | 0.36 | | | 0.35 | | | 0.88 | | | (0.19 | ) |
| | Diluted | | | (0.08 | ) | | 0.19 | | | 0.34 | | | 0.34 | | | 0.85 | | | (0.19 | ) |
Weighted Average Shares Outstanding | | | | | | | | | | | | | | | | | | | |
| | Basic | | | 28,569,238 | | | 28,620,162 | | | 32,604,077 | | | 36,461,643 | | | 31,523,226 | | | 28,537,202 | |
| | Diluted | | | 28,569,238 | | | 29,675,696 | | | 34,085,934 | | | 37,914,614 | | | 32,635,342 | | | 28,537,202 | |
28
DragonWave Inc.
Management's Discussion and Analysis
For the three months and year ended February 28, 2010
Tables are expressed in Canadian $000's except share and per share amounts
CONSOLIDATED STATEMENTS OF CASH FLOWS
Expressed in USD $000's
unaudited
| | | | | | | | | | | | | | | | | | | |
| | Three Months Ended | | Year Ended | |
|---|
| | May 31,
2009 | | Aug 31,
2009 | | Nov 30,
2009 | | Feb 28,
2010 | | Feb 28,
2010 | | Feb 28,
2009 | |
|---|
Operating Activities | | | | | | | | | | | | | | | | | | | |
Net loss | | | (2,350 | ) | | 5,745 | | | 11,647 | | | 12,802 | | | 27,844 | | | (5,494 | ) |
Items not affecting cash | | | 1,266 | | | 264 | | | (479 | ) | | 1,710 | | | 2,761 | | | 577 | |
Changes in non-cash working capital items | | | 3,923 | | | (4,926 | ) | | 1,852 | | | 1,251 | | | 2,100 | | | (10,815 | ) |
| | | | | | | | | | | | | | |
Total Operating Activities | | | 2,839 | | | 1,083 | | | 13,020 | | | 15,763 | | | 32,705 | | | (15,732 | ) |
Investing Activities | | | 11,318 | | | (1,368 | ) | | (15,570 | ) | | 3,655 | | | (1,965 | ) | | 19,918 | |
Financing Activities | | | 39 | | | 33 | | | 68,072 | | | 1,694 | | | 69,838 | | | 91 | |
Effect of foreign exchange on cash and cash equivalents | | | (841 | ) | | (328 | ) | | 617 | | | (1,443 | ) | | (1,995 | ) | | 832 | |
Net increase in cash and cash equivalents | | | 13,355 | | | (580 | ) | | 66,139 | | | 19,669 | | | 98,583 | | | 5,109 | |
Cash and cash equivalents at beginning of period | | | 6,693 | | | 20,048 | | | 19,468 | | | 85,607 | | | 6,693 | | | 1,584 | |
| | | | | | | | | | | | | | |
Cash and cash equivalents at end of period | | | 20,048 | | | 19,468 | | | 85,607 | | | 105,276 | | | 105,276 | | | 6,693 | |
| | | | | | | | | | | | | | |
Cash paid during the year for: | | | | | | | | | | | | | | | | | | | |
Interest | | | 6 | | | 13 | | | 6 | | | 1 | | | 26 | | | 32 | |
| | | | | | | | | | | | | | |
29
DragonWave Inc.
Management's Discussion and Analysis
For the three months and year ended February 28, 2010
Tables are expressed in Canadian $000's except share and per share amounts
Revenue and Gross Margin
| | | | | | | | | | | | | |
| | FY 2010 | | FY 2009 | |
|---|
| | USD | | CAD | | USD | | CAD | |
|---|
Revenue | | | 157,989 | | | 171,104 | | | 39,749 | | | 43,334 | |
Cost of Sales | | | 91,565 | | | 99,282 | | | 26,311 | | | 28,683 | |
| | | | | | | | | | |
Gross Margin | | | 66,424 | | | 71,822 | | | 13,438 | | | 14,651 | |
| | | 42.0% | | | 42.0% | | | 33.8% | | | 33.8% | |
Other Metrics
The Company's management believes the following metrics are useful to users of the statements and have therefore prepared the USD equivalent schedules to accompany the Canadian dollar metrics found elsewhere in this MD&A. The following schedules have been prepared using the translated Financial Statements.
| | | | | | | | |
| | As at
February 28, 2010 | | As at
February 28, 2009 | |
|---|
Key Balance Sheet Amounts and Ratios: | | | USD | | | USD | |
| | Cash and Cash Equivalents | | | 105,276 | | | 6,693 | |
| | Short Term Investments | | | 8,074 | | | 11,800 | |
| | Working Capital | | | 133,343 | | | 31,967 | |
| | Long Term Assets | | | 2,102 | | | | |
| | Working Capital Ratio | | | 4.7 : 1 | | | 5.8 : 1 | |
Change in Working Capital
| | | | |
| | February 28, 2009
to
February 28, 2010 | |
|---|
| | USD
| |
|---|
Beginning Working Capital Balance (current assets — current liabilities) | | | 31,968 | |
Cash and cash equivalents & short term investments | | | 94,857 | |
Accounts Receivable | | | 20,644 | |
Other receivables | | | 1,234 | |
Inventory | | | 12,705 | |
Prepaid Expenses | | | 585 | |
Current Income Tax Asset | | | 436 | |
Line of Credit | | | 504 | |
Accounts Payable and accrued liabilities | | | (29,481 | ) |
Taxes Payable | | | (835 | ) |
Deferred Revenue | | | 726 | |
| | | | |
Net Change in Working Capital | | | 101,375 | |
| | | | |
Ending Working Capital Balance | | | 133,343 | |
| | | | |
30
DragonWave Inc.
Management's Discussion and Analysis
For the three months and year ended February 28, 2010
Tables are expressed in Canadian $000's except share and per share amounts
Foreign exchange risk
With the Canadian dollar as our functional currency, if the Canadian dollar had appreciated 1 percent against all foreign currencies at February 28, 2010, with all other variables held constant, the impact of this foreign currency change on the Company's foreign denominated financial instruments would have resulted in a reduction of after-tax net income of CAD $1,114 for the year ended February 28, 2010 [year ended February 28, 2009 — CAD $211], with an equal and opposite effect if the Canadian dollar had depreciated 1 percent against all foreign currencies at February 28, 2010.
With the change in Functional currency to USD, if the USD had appreciated 1 percent against all foreign currencies at February 28, 2010, with all other variables held constant, the impact of this foreign currency change on the Company's foreign denominated financial instruments would have resulted in a increase of after-tax net income of $65 USD for the year ended February 28, 2010 [year ended February 28, 2009 — $128 USD], with an equal and opposite effect if the USD had depreciated 1 percent against all foreign currencies at February 28, 2010.
31
QuickLinks
Number of Customers Shipped to in the Year Ended February 28, 2010Number of Customers Shipped to in the Quarter Ended February 28, 2010CONSOLIDATED BALANCE SHEETS Expressed in USD $000's unauditedDragonWave Inc. Management's Discussion and Analysis For the three months and year ended February 28, 2010 Tables are expressed in Canadian $000's except share and per share amountsCONSOLIDATED STATEMENTS OF OPERATIONS, COMPREHENSIVE INCOME AND DEFICIT Expressed in USD $000's except share and per share amounts unaudited