QuickLinks -- Click here to rapidly navigate through this document

![]()
DragonWave Inc.
Management's Discussion and Analysis
For the three and nine months ended November 30, 2010
Tables are expressed in USD $000's except share and per share amounts
The following provides management's discussion and analysis ("MD&A") of DragonWave Inc.'s consolidated results of operations and financial condition for the three and nine months ended November 30, 2010. This MD&A is dated January 12, 2011 and should be read in conjunction with our unaudited consolidated interim financial statements for the three and nine months ended November 30, 2010, including the notes thereto. For additional information and details, readers are referred to our audited annual consolidated financial statements, and corresponding notes, our MD&A for fiscal 2010, our Annual Information Form dated May 6, 2010 (the "AIF"), all of which are filed separately and are available atwww.sedar.com orhttp://www.sec.gov/edgar/searchedgar/companysearch.html.
The financial statements have been prepared in accordance with Canadian generally accepted accounting principles (GAAP) and are reported in US dollars. The information contained herein is dated as of January 12, 2011 and is current to that date, unless otherwise stated. Our fiscal year commences March 1 of each year and ends on the last day of February of the following year.
In this document, "we", "us", "our", "Company" and "DragonWave" all refer to DragonWave Inc. collectively with its subsidiaries. The content of this MD&A has been approved by our Board of Directors, on the recommendation of its Audit Committee.
Unless otherwise indicated, all currency amounts referenced in this MD&A are denominated in US dollars.
Forward-Looking Statements
This MD&A contains "forward-looking information" and "forward-looking statements" within the meaning of applicable Canadian and U.S. securities laws. All statements in this MD&A other than statements that are reporting results or statements of historical fact are forward-looking statements which involve assumptions and describe our future plans, strategies and expectations. Forward-looking statements are generally identifiable by use of the words "may", "will", "should", "continue", "expect", "anticipate", "estimate", "believe", "intend", "plan" or "project" or the negative of these words or other variations on these words or comparable terminology. Forward-looking statements include, without limitation, statements regarding our strategic plans and objectives, growth strategy, customer diversification and expansion initiatives, and the expected use of proceeds from financing activities. There can be no assurance that forward-looking statements will prove to be accurate and actual results or outcomes could differ materially from those expressed or implied in such statements. Important factors that could cause actual results or outcomes to differ materially from those discussed in the forward-looking statements are discussed in this MD&A under the heading "Risks and Uncertainties". Forward-looking statements are provided to assist external stakeholders in understanding management's expectations and plans relating to the future as of the date of this MD&A and may not be appropriate for other purposes. Readers are cautioned not to place undue reliance on forward-looking statements. Forward-looking statements are made as of the date of this MD&A and the Company does not undertake to publicly update or revise any forward-looking statements, whether as a result of new information, future events or otherwise, except to the extent expressly required by law.
2
![]()
DragonWave Inc.
Management's Discussion and Analysis
For the three and nine months ended November 30, 2010
Tables are expressed in USD $000's except share and per share amounts
Risks and Uncertainties
Our financial performance, achievements and results may be impacted by risks and uncertainties related to our business. These risks and uncertainties include, but are not limited to the following:
- •
- dependence on the development and growth of the market for high-capacity wireless communications services;
- •
- reliance on a small number of customers for a large percentage of revenue;
- •
- intense competition from several competitors;
- •
- competition from indirect competitors;
- •
- ability to successfully effect acquisitions of products or businesses and other risks associated with acquisitions;
- •
- dependence on the ability to develop new products and enhance existing products;
- •
- a history of losses;
- •
- our ability to successfully manage growth;
- •
- quarterly revenue and operating results which are difficult to predict and can fluctuate substantially;
- •
- the impact of the general economic downturn on our customers;
- •
- disruption resulting from economic and geopolitical uncertainty;
- •
- currency fluctuations;
- •
- exposure to credit risk for accounts receivable;
- •
- pressure on our pricing models;
- •
- the allocation of radio spectrum and regulatory approvals for our products;
- •
- our customers' ability to secure a license for applicable radio spectrum;
- •
- changes in government regulation or industry standards that may limit the potential market for our products;
- •
- dependence on establishing and maintaining relationships with channel partners;
- •
- reliance on outsourced manufacturing;
- •
- reliance on suppliers of components;
- •
- our ability to protect our own intellectual property and potential harm to our business if we infringe the intellectual property rights of others;
- •
- risks associated with software licensed by us;
- •
- a lengthy and variable sales cycle;
- •
- dependence on our ability to recruit and retain management and other qualified personnel;
- •
- exposure to risks resulting from international sales and operations, including the requirement to comply with export control and economic sanctions laws;
- •
- post-acquisition integration risks, including customer acceptance of the combined entities' products;
- •
- product defects, product liability claims, or health and safety risks relating to wireless products;
- •
- risks associated with possible loss of our foreign private issuer status, and
- •
- risks and expenses associated with being a public company in the U.S.
Readers are also referred to "Risk Factors" in the Company's AIF, which is available atwww.sedar.com andhttp://www.sec.gov/edgar/searchedgar/companysearch.html. Although we have attempted to identify important factors that could cause our actual results to differ materially from our expectations, intentions, estimates or forecasts, there may be other factors that could cause our results to differ from what we currently anticipate, estimate or intend. Recent unprecedented events in global
3
![]()
DragonWave Inc.
Management's Discussion and Analysis
For the three and nine months ended November 30, 2010
Tables are expressed in USD $000's except share and per share amounts
financial and credit markets have resulted in high market price volatility and contraction in credit markets. These on-going events could impact our business, financial condition and operating results in an unpredictable and possibly detrimental manner.
Change in Functional and Reporting Currency
Effective March 1, 2010, the Company adopted the US dollar (USD) as its functional and reporting currency, as a significant portion of its revenue, expenses, assets, liabilities and financing are denominated in USD. Prior to that date, the Company's operations were measured in Canadian dollars (CAD) and the consolidated financial statements were expressed in CAD. The Company followed the recommendations of the Emerging Issues Committee (EIC) of the Canadian Institute of Chartered Accountants (CICA), set out in EIC-130, "Translation method when the reporting currency differs from the measurement currency or there is a change in the reporting currency". In accordance with EIC-130, assets and liabilities as at March 1, 2010, were translated into USD using the exchange rate in effect on that date and equity transactions were translated at historical rates. As the change took place on the first day of the fiscal year, there was no income statement or cash flow translation required. For comparative purposes, historical financial statements have been restated in USD using the current rate method. Under this method, assets and liabilities are translated at the closing rate in effect at the end of these periods, revenues, expenses and cash flows are translated at the average rates in effect for these periods and equity transactions are translated at historical rates. Any exchange differences resulting from the translation are included in accumulated other comprehensive income presented in shareholders' equity.
4
![]()
DragonWave Inc.
Management's Discussion and Analysis
For the three and nine months ended November 30, 2010
Tables are expressed in USD $000's except share and per share amounts
SELECTED FINANCIAL INFORMATION:
| | Three Months Ended | Nine Months Ended | ||||||||||||
|---|---|---|---|---|---|---|---|---|---|---|---|---|---|---|
| | November 30, 2010 | November 30, 2009 | November 30, 2010 | November 30, 2009 | ||||||||||
REVENUE | 27,008 | 51,594 | 102,905 | 97,016 | ||||||||||
Cost of sales | 14,049 | 29,453 | 56,763 | 56,757 | ||||||||||
Gross profit | 12,959 | 22,141 | 46,142 | 40,259 | ||||||||||
| 48.0% | 42.9% | 44.8% | 41.5% | |||||||||||
EXPENSES | ||||||||||||||
Research and development | 4,817 | 4,139 | 13,104 | 9,743 | ||||||||||
Selling and marketing | 4,785 | 4,118 | 13,339 | 9,444 | ||||||||||
General and administrative | 3,294 | 2,084 | 8,477 | 4,748 | ||||||||||
Government assistance | (246 | ) | (55 | ) | (246 | ) | (159 | ) | ||||||
| 12,600 | 10,286 | 34,674 | 23,776 | |||||||||||
Income (Loss) from Operations | 359 | 11,855 | 11,468 | 16,483 | ||||||||||
Amortization of intangible assets | (277 | ) | (48 | ) | (421 | ) | (145 | ) | ||||||
Accretion expense | (122 | ) | — | (122 | ) | — | ||||||||
Interest income | 88 | 12 | 196 | 29 | ||||||||||
Investment gain | 155 | — | 168 | — | ||||||||||
Gain on sale of property and equipment | — | 226 | — | 258 | ||||||||||
Foreign exchange gain (loss) | (44 | ) | (135 | ) | 142 | (1,445 | ) | |||||||
Net Income (Loss) | 159 | 11,910 | 11,431 | 15,180 | ||||||||||
Income tax expense | 209 | 263 | 566 | 138 | ||||||||||
Net and Comprehensive Income (Loss) | (50 | ) | 11,647 | 10,865 | 15,042 | |||||||||
Basic income (loss) per share | (0.00 | ) | 0.36 | 0.30 | 0.50 | |||||||||
Diluted income (loss) per share | (0.00 | ) | 0.34 | 0.29 | 0.48 | |||||||||
Basic weighted average shares outstanding | 35,125,724 | 32,604,077 | 36,010,148 | 29,911,913 | ||||||||||
Diluted weighted average shares outstanding | 36,170,040 | 34,085,934 | 36,957,219 | 31,229,492 | ||||||||||
5
![]()
DragonWave Inc.
Management's Discussion and Analysis
For the three and nine months ended November 30, 2010
Tables are expressed in USD $000's except share and per share amounts
| | As at November 30, 2010 | As at February 28, 2010 | |||||
|---|---|---|---|---|---|---|---|
Consolidated Balance Sheet Data: | |||||||
Cash and cash equivalents | 47,879 | 105,276 | |||||
Restricted cash | 387 | — | |||||
Short Term Investments | 47,099 | 8,074 | |||||
Total Assets | 178,553 | 176,749 | |||||
Total liabilities | 38,257 | 37,903 | |||||
Total shareholder's equity | 140,296 | 138,846 | |||||
SELECTED CONSOLIDATED QUARTERLY FINANCIAL INFORMATION
The following table sets out selected financial information for each of our most recent eight fiscal quarters. In the opinion of management, this information has been prepared on the same basis as DragonWave's audited consolidated financial statements, and all necessary adjustments have been included in the amounts stated below to present fairly the unaudited quarterly results when read in conjunction with DragonWave's consolidated financial statements and related notes thereto.
| FY09 | FY10 | FY11 | ||||||||||||||||||||||||
Feb 28 2009 | May 31 2009 | Aug 31 2009 | Nov 30 2009 | Feb 28 2010 | May 31 2010 | Aug 31 2010 | Nov 30 2010 | |||||||||||||||||||
|---|---|---|---|---|---|---|---|---|---|---|---|---|---|---|---|---|---|---|---|---|---|---|---|---|---|---|
Revenue | 10,395 | 12,999 | 32,423 | 51,594 | 60,973 | 48,726 | 27,171 | 27,008 | ||||||||||||||||||
Gross Profit | 2,696 | 8,509 | 18,795 | 29,453 | 34,808 | 21,231 | 11,952 | 12,959 | ||||||||||||||||||
Gross Profit % | 26% | 35% | 42% | 43% | 43% | 44% | 44% | 48% | ||||||||||||||||||
Operating Expenses | 5,501 | 5,488 | 8,099 | 10,334 | 12,229 | 11,410 | 10,808 | 12,600 | ||||||||||||||||||
Income (loss) from operations | (2,805 | ) | (988 | ) | 5,529 | 11,807 | 13,936 | 9,821 | 1,144 | 359 | ||||||||||||||||
Net income (loss) for the period | (1,972 | ) | (2,350 | ) | 5,745 | 11,647 | 12,802 | 9,690 | 1,225 | (50 | ) | |||||||||||||||
Net income (loss) per share | ||||||||||||||||||||||||||
Basic | (0.07 | ) | (0.08 | ) | 0.20 | 0.36 | 0.35 | 0.26 | 0.03 | (0.00 | ) | |||||||||||||||
Diluted | (0.07 | ) | (0.08 | ) | 0.19 | 0.34 | 0.34 | 0.26 | 0.03 | (0.00 | ) | |||||||||||||||
Weighted average number of shares outstanding | ||||||||||||||||||||||||||
Basic | 28,536,427 | 28,569,238 | 28,620,162 | 32,604,077 | 36,461,643 | 36,916,893 | 35,978,213 | 35,125,724 | ||||||||||||||||||
Diluted | 28,536,427 | 28,569,238 | 29,675,696 | 34,085,934 | 37,914,614 | 37,930,704 | 36,690,926 | 36,170,040 | ||||||||||||||||||
Total Assets | 40,789 | 45,449 | 63,103 | 150,288 | 176,749 | 172,840 | 158,338 | 178,553 | ||||||||||||||||||
Historically, our operating results have fluctuated on a quarterly basis and we expect that quarterly financial results will continue to fluctuate in the future. The results of operations for interim periods should not be relied upon as an indication of the results to be expected or achieved in any future period or any fiscal year as a whole. Fluctuations in results relate to the growth in our revenue, and the project nature of the network installations of our end-customers. In addition, results may fluctuate as a result of the timing of staffing, infrastructure additions required to support growth, and material costs required to support design initiatives. Operating results may not follow past trends for other reasons, including strategic decisions by us such as acquisitions of complementary products or businesses.
6
![]()
DragonWave Inc.
Management's Discussion and Analysis
For the three and nine months ended November 30, 2010
Tables are expressed in USD $000's except share and per share amounts
Overview
DragonWave is a leading provider of high-capacity Ethernet microwave solutions that drive next-generation IP networks. Our carrier-grade point-to-point Ethernet microwave systems transmit broadband voice, video and data, enabling service providers, government agencies, enterprises and other organizations to meet their increasing bandwidth requirements rapidly and affordably. The principal application of our products is wireless network backhaul.
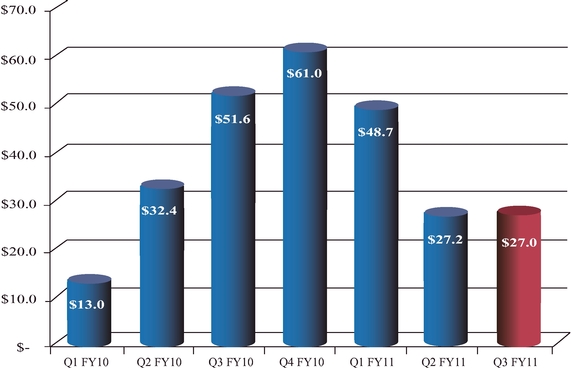
In the third quarter of fiscal 2011, DragonWave recognized revenue of $27.0 million. This is consistent with DragonWave's press release dated November 8, 2011 available at www.sedar.com, in which DragonWave issued revised revenue guidance for the third quarter of fiscal 2010 of $27.0 million. This quarter's revenue represents a 47.7% decrease over the third quarter of fiscal 2010 and a 0.6% decrease from the second quarter of fiscal 2011. Gross margin reached 48.0% for the three months ended November 30, 2010, which represents a 5.1% increase over the same period in the previous fiscal year, and a 4.0% increase over the second quarter of fiscal 2011. The gross profit of $13.0 million offset the third quarter's operating expenses of $12.6 million and as a result the Company generated income from operations of $0.4 million in the quarter, compared to income from operations of $11.9 million for the same period in the previous fiscal year. After consideration of other expenses, including income taxes, the Company generated a net and comprehensive loss of $0.05 million, this result compared to a net and comprehensive income amount of $11.6 million from the same period in the previous year.
During the third quarter of fiscal 2011 we focused our efforts on three key objectives: pursuing our market and customer diversification agenda, satisfying and working closely with our largest customers, and balancing the need for investment to address the growing global market with responsible income and cash management.
Customer and Product Diversification through Acquisition
On October 14, 2010 DragonWave Inc. announced the acquisition of Axerra Networks, Inc. ("Axerra"). Axerra, a leader in pseudowire technology, has a product portfolio that allows carriers to address the increasing need to carry legacy TDM traffic over a packet based network. This acquisition furthers the Company's objective of diversifying our business through new customer acquisitions and product portfolio expansion. After ten years in the market, Axerra has developed a strong customer base, in a variety of geographic regions. We believe there is a significant opportunity to introduce DragonWave's microwave products into this customer set. Similarly, we believe Axerra's pseudowire solutions will be attractive to current DragonWave customers.
DragonWave Inc. acquired all of the outstanding shares of Axerra. The total potential purchase price is $25.0 million which includes $9.5 million paid in cash on October 13, 2010, and a potential earn-out of $15.5 million based on sales performance over a 16 month period. The earn-out can be paid in either cash or shares, at DragonWave's option.
Customer Diversification through Strategic Partnerships
We believe that significant opportunity exists in the Indian market for wireless backhaul sales following the recent completion of India's 3G and BWA radio-access spectrum auctions. To address this
7
![]()
DragonWave Inc.
Management's Discussion and Analysis
For the three and nine months ended November 30, 2010
Tables are expressed in USD $000's except share and per share amounts
market, we announced the formation of a Joint Venture with one of India's leading telecommunication equipment manufacturers and turnkey service providers, Himachal Futuristic Communications Ltd. ("HFCL"). DragonWave will own 50.1% of the equity in the Joint Venture and the balance of the equity will be owned by HFCL. The Joint Venture, based in Delhi, will utilize HFCL's local market knowledge and expertise to sell and market DragonWave products in India. HFCL will provide the Joint Venture with local manufacturing of DragonWave products from its state-of-the-art telecommunication equipment manufacturing facility at Solan, Himachal Pradesh.
As previously reported, another element of our growth strategy involves developing alliances with other companies to expand our customer reach. In February, 2010 we announced that we had signed an original equipment manufacturer (OEM) agreement with a world leader in mobile communications. In the third quarter of fiscal 2011 we made shipments into Asia and Europe through this OEM. Globally we continue to seek out and negotiate arrangements with partners as a strategy to address market opportunities in a wide variety of regions.
Customer Diversification through Bid Activity and Customer Wins
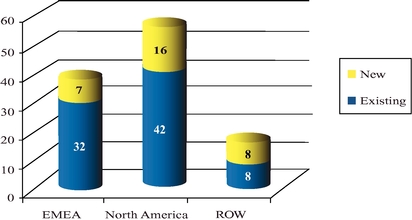
Internationally the level of bid activity remains high compared to past levels. The demand for cost effective solutions to address expanding bandwidth requirements globally continues to drive significant request for quote (RFQ) submissions all over the world. In the third quarter of fiscal 2011 we announced wins in a variety of geographies. New customer wins included: The Blue Zone(TM), a fixed wireless provider in the Middle East and North America, Atlantic Tele-Network, Inc. (NASDAQ: ATNI), a company that provides wireless and other telecommunications services in the United States, and the Caribbean and Choice Communications, LLC in the U.S. Virgin Islands (USVI). The marketability of our backhaul and pseudowire solutions continues to be evidenced not only by the customer announcements we make, but from the number of new customer wins we achieve each quarter. In the third quarter of fiscal 2011, DragonWave shipped products to thirty one new customers, eight of which were Axerra customers prior to the acquisition. Half of those thirty one new customer shipments were for network builds outside of North America.
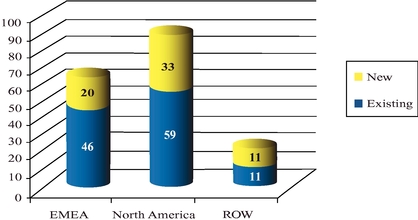
We evaluate revenue performance over three main geographic regions. These regions are North America; Europe, the Middle East and Africa ("EMEA"); and Rest of World ("ROW"). The following tables show the number of new customer shipments in the three and nine month periods ended November 30, 2010.
8
![]()
DragonWave Inc.
Management's Discussion and Analysis
For the three and nine months ended November 30, 2010
Tables are expressed in USD $000's except share and per share amounts
Number of Customers Shipped to in the Quarter Ended November 30, 2010
Number of Customers Shipped to in the Nine Months Ended November 30, 2010
Satisfying and Working Closely with Our Largest Customers
The Company continues to focus on meeting all of the requirements of our existing customer base. We continued to feel the impact of our largest customer slowing its purchasing activity while completing its 2010 network plans in the third quarter of fiscal 2011. This North American carrier accounted for 52.0% of our sales in the third quarter of fiscal 2011. As a result of the acquisition of Axerra, we had a second customer in the three months ended November 30, 2010, which accounted for more than 10% of revenue. We are excited about the opportunity this customer represents, both for our leading pseudowire technology which it currently purchases, and for our wireless backhaul solutions. Barrett Xplore Inc. has been an important DragonWave customer for several years, and we were pleased to announce that we have signed a multi-million dollar contract to provide Horizon Compact and Horizon Quantum wireless backhaul technology for its 4G rollout for Canada's rural population.
9
![]()
DragonWave Inc.
Management's Discussion and Analysis
For the three and nine months ended November 30, 2010
Tables are expressed in USD $000's except share and per share amounts
Total Consolidated Revenue
Q1 FY2010 to Q3 FY2011
(USD millions)
10
![]()
DragonWave Inc.
Management's Discussion and Analysis
For the three and nine months ended November 30, 2010
Tables are expressed in USD $000's except share and per share amounts
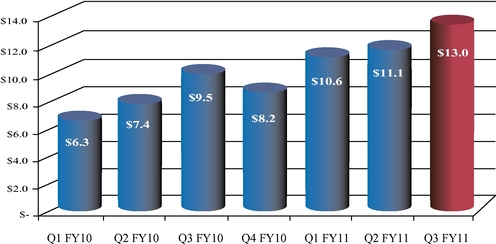
Revenue from Customers Excluding the Largest Customer
Q1 FY2010 to Q3 FY2011
(USD millions)
Continued Focus on Cost Reduction and Product Innovation
In an environment where our largest customer has slowed down the pace of its demand, we are extremely cognizant of the need to restrain spending, while continuing to invest in both cost reduction programs, and our mandate of customer and product diversification. Our latest Horizon product offering, Quantum, has been designed as a cost effective solution and is helping to contribute to the quarter's healthy margin performance. We continue to invest in R&D programs which will expand the applicability of our products into new markets. Our manufacturing strategy for the entire Horizon product line centres around the increasing use of contract manufacturers, not only for product assembly, but for final test as well; functions historically performed at DragonWave. In the third quarter of fiscal 2011 we continued this emphasis with the implementation of our training and qualification program to manufacture both Compact and Quantum in Malaysia.
Share Repurchase
On April 9, 2010, the Toronto Stock Exchange (the "TSX") accepted the Company's notice of intention to repurchase up to 3,508,121 common shares (10 percent of the Company's issued and outstanding common shares) through a normal course issuer bid ("NCIB"). The NCIB was effective April 13, 2010 and will expire April 12, 2011. Daily purchases over the facilities of the NASDAQ are limited to 25% of the average daily trading volume of the common shares on NASDAQ other than pursuant to block purchase exemptions. Daily purchases over the facilities of the TSX are limited to 25% of the average daily trading volume of the common shares on TSX other than pursuant to block purchase exemptions. Except in the case of an exempt purchase, the prices that the Company will pay for the common shares purchased will be the market price of the shares at the time of acquisition.
11
![]()
DragonWave Inc.
Management's Discussion and Analysis
For the three and nine months ended November 30, 2010
Tables are expressed in USD $000's except share and per share amounts
During the nine months ended November 30, 2010, the Company has acquired 1,865,549 common shares pursuant to the NCIB at prevailing market prices. These shares were purchased for cancellation at an aggregate cost of $10.7 million of which $9.0 million was charged to share capital, based on the historical weighted per share value at the date of purchase, and the balance of $1.7 million was charged to deficit. The Company did not acquire any common shares under the NCIB during the three months ended November 30, 2010.
Revenue and Expenses
Revenue
The Company considers that we have one reportable segment, namely, broadband wireless backhaul equipment. The vast majority of our sales come from the shipment of equipment either through direct sales, through sales to distributors, or through OEMs. Approximately 95% of our sales relate to the shipment of wireless backhaul equipment, including pseudowire solutions. Other sources of revenue including; extended warranty, advanced replacement, basic consulting and capacity upgrades, contribute to our success with our customers but comprise a small percentage of our total revenues, generally 2% to 5% of our total revenue in any quarter.
As mentioned previously, we evaluate the revenue performance of this segment over three main geographic regions. The table below breaks down the revenue earned by region for the three and nine month periods ending November 30, 2010 and compares these figures to the same periods in the prior fiscal year. The table clearly shows that sales into Europe, the Middle East and Africa continue to grow.
| | Three Months Ended | Nine Months Ended | |||||||||||||||||||||||
|---|---|---|---|---|---|---|---|---|---|---|---|---|---|---|---|---|---|---|---|---|---|---|---|---|---|
| | November 30, 2010 | November 30, 2009 | November 30, 2010 | November 30, 2009 | |||||||||||||||||||||
| | $'s | % | $'s | % | $'s | % | $'s | % | |||||||||||||||||
North America | 22,810 | 85% | 48,697 | 95% | 86,025 | 83% | 88,270 | 91% | |||||||||||||||||
Europe, Middle East, and Africa | 3,295 | 12% | 2,268 | 4% | 15,163 | 15% | 7,443 | 8% | |||||||||||||||||
Other | 903 | 3% | 629 | 1% | 1,717 | 2% | 1,303 | 1% | |||||||||||||||||
Total Revenue | 27,008 | 100% | 51,594 | 100% | 102,905 | 100% | 97,016 | 100% | |||||||||||||||||
Cost of Sales and Expenses
A large component of our cost of sales is the cost of product purchased from outsourced manufacturers. In addition to the cost of product payable to outsourced manufacturers, we incur expenses associated with final configuration, testing, logistics and warranty activities. Final test and assembly for the links sold by us is carried on both at our premises and that of our contract manufacturers'. We use primarily the services of two outsourced contract manufacturers with locations in North America and Malaysia.
Research and development costs relate mainly to the compensation of our engineering group and the material consumption associated with prototyping activities.
12
![]()
DragonWave Inc.
Management's Discussion and Analysis
For the three and nine months ended November 30, 2010
Tables are expressed in USD $000's except share and per share amounts
Selling and marketing expenses include the remuneration of sales staff, travel and trade show activities and customer support services.
General and administrative expenses relate to the remuneration of related personnel, professional fees associated with tax, accounting and legal advice, and insurance costs.
Occupancy and information systems costs are related to our leasing costs and communications networks and are accumulated and allocated, based on headcount, to all functional areas in our business. Our Ottawa based facilities are leased from a related party that is controlled by one of our directors and shareholders. Our management believes the terms of the lease reflect fair market terms and payment provisions.
Comparison of the three and nine months ended November 30, 2010 and November 30, 2009
Revenue
| Three months ended November 30 | Nine months ended November 30 | ||||||||||
|---|---|---|---|---|---|---|---|---|---|---|---|
| 2010 | 2009 | 2010 | 2009 | ||||||||
| $ | 27,008 | $ | 51,594 | $ | 102,905 | $ | 97,016 | ||||
Revenue for the third quarter of fiscal 2011 decreased by $24.6 million compared with the three month period ended November 30, 2009. On a year to date basis, revenue is $5.9 million higher, when compared with the nine month period ended November 30, 2009.
Included in the $27.0 million revenue for the third quarter of fiscal 2011 is Axerra revenue from the date of acquisition until November 30, 2010 (48 days) amounting to $3.7 million.
The primary drivers for the changes are as follows:
Changes to Revenue: Three months ended November 30, 2010 vs Three months ended November 30, 2009
National Carriers—North America | (29.8 | ) | ||
New Customers—North American Multiple System Operator (MSO) | 3.4 | |||
New Customers—Other (all regions) | 1.1 | |||
Regional Carriers and Distributors—EMEA | 0.7 | |||
Regional Carriers and Distributors—ROW | (0.6 | ) | ||
Regional Carriers and Distributors—North America | 0.6 | |||
Total | (24.6 | ) | ||
13
![]()
DragonWave Inc.
Management's Discussion and Analysis
For the three and nine months ended November 30, 2010
Tables are expressed in USD $000's except share and per share amounts
Changes to Revenue: Nine months ended November 30, 2010 vs Nine months ended November 30, 2009
New Customers—EMEA | 7.8 | |||
New Customers—North America | 4.6 | |||
New Customers—ROW | 0.7 | |||
Regional Carriers and Distributors—EMEA | (0.9 | ) | ||
Regional Carriers and Distributors—North America | 0.9 | |||
Regional Carriers and Distributors—ROW | 0.3 | |||
National Carriers—North America | (7.5 | ) | ||
Total | 5.9 | |||
Gross Profit
| Three months ended November 30 | Nine months ended November 30 | ||||||||||
|---|---|---|---|---|---|---|---|---|---|---|---|
| 2010 | 2009 | 2010 | 2009 | ||||||||
| $ | 12,959 | $ | 22,141 | $ | 46,142 | $ | 40,259 | ||||
| 48.0% | 42.9% | 44.8% | 41.5% | ||||||||
Our gross profit climbed to 48.0% for the three month period ended November 30, 2010. This represents a 5.1% increase over the same period in the previous fiscal year. The margin improved as well over the second quarter by 4.0%. On a year to date basis the margin improved by 3.3%, rising to 44.8% for the nine month period ended November 30, 2010. While costs including overhead and labour, freight charges and warranty expenses have remained fairly consistent year over year, the material costs of our products have continued to decline. The significant improvement in margins between the third quarter of fiscal 2011 and the third quarter of fiscal 2010, can also be attributed to the product mix which can change each quarter. The Company believes that the gross margin is at the high end of the achievable level based on current technology, manufacturing strategies and pricing pressures. Axerra contributed gross profit dollars of $1.8 million from the date of acquisition to November 30, 2010.
Total Operating Expenses
| Three months ended | ||||||||||||||
|---|---|---|---|---|---|---|---|---|---|---|---|---|---|---|
| Nov 30 2009 | Feb 28 2010 | May 31 2010 | Aug 31 2010 | Nov 30 2010 | ||||||||||
| 10,334 | 12,229 | 11,410 | 10,808 | 12,600 | ||||||||||
14
![]()
DragonWave Inc.
Management's Discussion and Analysis
For the three and nine months ended November 30, 2010
Tables are expressed in USD $000's except share and per share amounts
The increase in operating expense levels between the second quarter of fiscal 2011 and the third quarter of the same fiscal year was driven by a number of factors.
| | USD $M | |||
|---|---|---|---|---|
Operating Expenses in Q2, FY2011 | 10.8 | |||
Axerra spending (48 days of spending) | 1.2 | |||
Legal, accounting and other costs related to the Axerra acquisition and JV creation in India | 0.6 | |||
Material Spending on R&D programs, and test development | 0.4 | |||
Other: including compensation related spending and travel | (0.4 | ) | ||
Operating Expenses in Q3, FY2011 | 12.6 | |||
Research and Development
| Three months ended November 30 | Nine months ended November 30 | ||||||||||
|---|---|---|---|---|---|---|---|---|---|---|---|
| 2010 | 2009 | 2010 | 2009 | ||||||||
| $ | 4,817 | $ | 4,139 | $ | 13,104 | $ | 9,743 | ||||
Research and development ("R&D") expenses increased by $0.7 million for the three month period ended November 30, 2010 when compared with the same period in the prior fiscal year. On a year to date basis, R&D spending increased by $3.4 million when compared to the nine month period ended November 30, 2009.
A number of factors have contributed to the increased spending in R&D. First, the Company expanded its R&D organization which resulted in compensation and other headcount associated spending increasing year over year (Third quarter increase—$ 0.5 million; year to date increase—$1.9 million). Variable compensation spending, however decreased (Third quarter decrease—$(1.1) million; year to date decrease—$(1.7) million). As well, material spending associated with prototype builds for products still in the design phase, and depreciation on R&D equipment used in the design process increased (Third quarter increase—$ 0.4 million; year to date increase—$1.9 million). Travel and other miscellaneous costs have risen as well (Third quarter increase—$ 0.1 million; year to date increase—$0.5 million). Spending on Axerra R&D amounted to $0.8 million from October 14, 2010 to November 30, 2010.
Selling and Marketing
| Three months ended November 30 | Nine months ended November 30 | ||||||||||
|---|---|---|---|---|---|---|---|---|---|---|---|
| 2010 | 2009 | 2010 | 2009 | ||||||||
| $ | 4,735 | $ | 4,118 | $ | 13,339 | $ | 9,444 | ||||
Sales and marketing expenses increased $0.6 million in the three months ended November 30, 2010 relative to the same three month period in the previous fiscal year. Expenses increased by $3.9 million when comparing the nine month period ended November 30, 2010 to the same period in fiscal 2010.
15
![]()
DragonWave Inc.
Management's Discussion and Analysis
For the three and nine months ended November 30, 2010
Tables are expressed in USD $000's except share and per share amounts
In focusing our efforts on expanding our customer base, and in taking the necessary steps to properly support our existing customers globally, our marketing and customer support organizations have grown over the past year. Compensation costs connected with this headcount growth resulted in higher spending (Third quarter increase—$0.4 million; year to date increase—$1.8 million). Variable compensation associated with revenue performance decreased and offset other compensation costs (Third quarter decrease—$(1.0) million; year to date decrease—$(0.7) million). Spending on contractors in foreign jurisdictions who support near term sales opportunities when they arise and specific network builds also contributed to higher spending (Third quarter increase—$0.8 million; year to date increase—$1.8 million). Travel costs and marketing expenses accounted for a portion of the difference on a year to date basis (Third quarter increase—$nil; year to date increase—$0.6 million). Finally, Axerra spending on sales and marketing activities accounted for $0.4 million of the increase. This represents spending for the 48 days from the date of acquisition to November 30, 2010.
General and Administrative
| Three months ended November 30 | Nine months ended November 30 | ||||||||||
|---|---|---|---|---|---|---|---|---|---|---|---|
| 2010 | 2009 | 2010 | 2009 | ||||||||
| $ | 3,294 | $ | 2,084 | $ | 8,477 | $ | 4,748 | ||||
General and administrative expenses increased by $1.2 million for the three months ended November 30, 2010 when compared to the same three month period in the previous fiscal year. On a year to date basis, spending increased by $3.7 million compared to same nine month period in the prior fiscal year.
The increase in spending in the quarter can be primarily attributed to higher compensation costs related to an increase in resources in a variety of areas, offset by a decrease in variable compensation spending (Third quarter decrease—$(0.5) million; year to date increase—$0.3 million). We are now listed on both the NASDAQ and the TSX, a change from the first eight months of fiscal 2010. In addition to the costs associated with this change, the acquisition activity combined with the creation of the joint venture in India contributed to higher professional fees (Third quarter increase—$1.4 million; year to date increase—$2.2 million). As well, insurance, business taxes and miscellaneous other costs have differed between fiscal 2011 and fiscal 2010 (Third quarter increase—$nil; year to date increase—$0.9 million). Axerra's general and administrative expenses amounted to $0.3 million for the 48 days from the date of acquisition to the end of the quarter.
Government Assistance
| Three months ended November 30 | Nine months ended November 30 | ||||||||||
|---|---|---|---|---|---|---|---|---|---|---|---|
| 2010 | 2009 | 2010 | 2009 | ||||||||
| $ | (246 | ) | $ | (55 | ) | $ | (246 | ) | $ | (159 | ) |
16
![]()
DragonWave Inc.
Management's Discussion and Analysis
For the three and nine months ended November 30, 2010
Tables are expressed in USD $000's except share and per share amounts
In prior years, DragonWave was able to claim benefits under the Ontario Innovation Tax Credit program. During the fourth quarter of fiscal 2010, it was determined that the higher revenue and asset levels of the consolidated company would eliminate the entitlement to claim any benefit in Canada. The $0.2 million amount in the third quarter of fiscal 2011 reflects research and development funding received through the Office of the Chief Scientist ("OCS") in Israel. Under these agreements, DragonWave will be required to pay royalties at the rate of 3%-3.5% of sales of products developed with funds provided by the OCS, up to an amount equal to 100% of the OCS grants, bearing interest at the rate of LIBOR. The obligation to pay these royalties is contingent on actual sales of the products and in the absence of such sales, no payment is required.
Amortization of Intangible Assets
| Three months ended November 30 | Nine months ended November 30 | ||||||||||
|---|---|---|---|---|---|---|---|---|---|---|---|
| 2010 | 2009 | 2010 | 2009 | ||||||||
| $ | (277 | ) | $ | (48 | ) | $ | (421 | ) | $ | (145 | ) |
In fiscal 2010 the amortization of intangible assets reflects only the amortization on computer software. In fiscal 2011, the amount reflects both the amortization of computer software, and the amortization of the intangible assets acquired with the purchase of Axerra.
Accretion Expense
| Three months ended November 30 | Nine months ended November 30 | ||||||||||
|---|---|---|---|---|---|---|---|---|---|---|---|
| 2010 | 2009 | 2010 | 2009 | ||||||||
| $ | (122 | ) | $ | — | $ | (122 | ) | $ | — | ||
As part of the acquisition of Axerra, DragonWave agreed to pay a potential earn-out of $15.5 million based on sales performance over a sixteen month period. The potential liability that this reflects has been recorded on the balance sheet at its fair value using a discount rate equal to the risk free rate of return adjusted for a risk premium. The present value of this potential future payment was calculated to be $14.3 million. The value of the liability on the balance sheet will increase each month in equal portions $(0.1 million per month) until the sixteen month earn-out period is finished and the amount equals $15.5 million. The accretion expense for the third quarter of fiscal 2011 reflects the increase in the fair value of the liability for the 48 days from the date of acquisition to November 30, 2010.
Interest Income (Net)
| Three months ended November 30 | Nine months ended November 30 | ||||||||||
|---|---|---|---|---|---|---|---|---|---|---|---|
| 2010 | 2009 | 2010 | 2009 | ||||||||
| $ | 88 | $ | 12 | $ | 196 | $ | 29 | ||||
17
![]()
DragonWave Inc.
Management's Discussion and Analysis
For the three and nine months ended November 30, 2010
Tables are expressed in USD $000's except share and per share amounts
Interest rates on investments are extremely low at present. As a result, despite the Company's healthy cash position, interest income earned by the Company in the three and nine month periods ended November 30, 2010 was relatively low.
Investment Gain
| Three months ended November 30 | Nine months ended November 30 | ||||||||||
|---|---|---|---|---|---|---|---|---|---|---|---|
| 2010 | 2009 | 2010 | 2009 | ||||||||
| $ | 155 | $ | — | $ | 168 | $ | — | ||||
In the first nine months of fiscal 2011 we made short term investments which carried a fixed yield and term to maturity. Because these investments are reflected on the balance sheet at their fair value, and the market interest rates for similar instruments decreased between the date they were purchased and November 30, 2010, an unrealized investment gain was booked to reflect the increase in the fair value of the investments.
A portion of the Company's available cash resources have been invested in low risk investment vehicles with a variety of maturity dates to maximize our returns while ensuring our cash is easily accessed for the Company's business priorities and that our risk is kept at a minimum.
Gain on Sale of Property and Equipment
| Three months ended November 30 | Nine months ended November 30 | ||||||||||
|---|---|---|---|---|---|---|---|---|---|---|---|
| 2010 | 2009 | 2010 | 2009 | ||||||||
| $ | — | $ | 226 | $ | — | $ | 258 | ||||
In the prior fiscal year, DragonWave traded-in certain test assets when purchasing upgraded test equipment. The transaction resulted in immaterial gains on the equipment that was sold back to the manufacturer.
Foreign Exchange Gain (Loss)
| Three months ended November 30 | Nine months ended November 30 | ||||||||||
|---|---|---|---|---|---|---|---|---|---|---|---|
| 2010 | 2009 | 2010 | 2009 | ||||||||
| $ | (44 | ) | $ | (135 | ) | $ | 142 | $ | (1,445 | ) | |
The small foreign exchange loss recognized in the third quarter of fiscal 2011 resulted from the translation of monetary accounts denominated in currencies other than the USD at November 30, 2010 in an environment where the USD was becoming relatively weaker. When comparing the gain and loss between the two years it is important to bear in mind that on March 1, 2010 the Company began to report in USD. Prior to that date all USD financial assets were re-valued to reflect the fair value in CAD. As at
18
![]()
DragonWave Inc.
Management's Discussion and Analysis
For the three and nine months ended November 30, 2010
Tables are expressed in USD $000's except share and per share amounts
November 30, 2010 only 5% of our cash, 17% of our trade receivables, and 39% of our financial liabilities are held in currencies other than the USD. As a result the foreign exchange gain (loss) resulting from such revaluations has been minimized.
Income Taxes Expense (Recovery)
| Three months ended November 30 | Nine months ended November 30 | ||||||||||
|---|---|---|---|---|---|---|---|---|---|---|---|
| 2010 | 2009 | 2010 | 2009 | ||||||||
| $ | 209 | $ | 263 | $ | 566 | $ | 138 | ||||
Income tax expense relates primarily to DragonWave's wholly owned U.S. subsidiary, where available net operating losses are not sufficient to offset taxable income. In Canada, DragonWave has utilized its tax carry-forward balances to eliminate current taxes.
We have a number of tax carry-forward pools (including loss carry-forwards and scientific research and experimental development expenses), primarily in Canada and Israel, available to us to reduce future taxable income. At the end of fiscal 2010, the total of these carry-forwards was approximately $50 million in Canada and $40 million in Israel for use in fiscal 2011 and future years. Except for benefits recorded in respect of U.S. operating losses and timing differences, income tax benefits relating to these carry forwards have not been recognized in the consolidated financial statements as recognition requirements under the liability method of accounting for income taxes were not met.
Liquidity and Capital Resources
As at November 30, 2010, we had a credit line in place with a major U.S.-based bank which allows borrowing to support working capital requirements of up to $17.0 million and capital expenditure requirements of up to $3.0 million.
19
![]()
DragonWave Inc.
Management's Discussion and Analysis
For the three and nine months ended November 30, 2010
Tables are expressed in USD $000's except share and per share amounts
The table below outlines selected balance sheet accounts and key ratios:
| | As at November 30, 2010 | As at February 28, 2010 | ||||||
|---|---|---|---|---|---|---|---|---|
Key Balance Sheet Amounts and Ratios: | ||||||||
Cash and Cash Equivalents | 47,879 | 105,276 | ||||||
Restricted cash | 387 | — | ||||||
Short Term Investments | 47,099 | 8,074 | ||||||
Working Capital | 123,878 | 133,343 | ||||||
Long Term Assets | 36,034 | 7,605 | ||||||
Long Term Liabilities | 19,616 | 2,102 | ||||||
Working Capital Ratio | 7.6 : 1 | 4.7 : 1 | ||||||
Days Sales Outstanding in accounts receivable | 62 days | 47 days | ||||||
Inventory Turnover | 1.9 times | 5.7 times | ||||||
Cash and Cash Equivalents, and Short Term Investments
As at November 30, 2010, the Company had $95.4 million in cash and cash equivalents, restricted cash, and short term investments ("Cash") representing a $18.0 million decrease from the Cash balance at February 28, 2010. There were four primary drivers for the decrease; the repurchase of shares which reduced cash by $10.7 million, the purchase of Axerra, which reduced cash by $8.3 million and the purchase of capital assets of $3.7 million. These increases were partially offset by the generation of cash from operations of $4.7 million.
Working Capital
Changes in working capital | February 28, 2010 to November 30, 2010 | |||
|---|---|---|---|---|
Beginning working capital balance(current assets—current liabilities) | 133,343 | |||
Cash and cash equivalents, restricted cash, and short term investments | (17,985 | ) | ||
Trade receivables | (13,902 | ) | ||
Other receivables | 712 | |||
Inventory | 3,040 | |||
Prepaid expenses | 1,403 | |||
Current income tax asset | 107 | |||
Accounts payable and accrued liabilities | 17,662 | |||
Income taxes payable | 623 | |||
Deferred revenue | (336 | ) | ||
Contingent royalty | (789 | ) | ||
Net change in working capital | (9,465 | ) | ||
Ending working capital balance | 123,878 | |||
20
![]()
DragonWave Inc.
Management's Discussion and Analysis
For the three and nine months ended November 30, 2010
Tables are expressed in USD $000's except share and per share amounts
Working capital is calculated as the difference between our current assets and current liabilities. Our working capital balance decreased to $123.9 million between February 28, 2010 and November 30, 2010. One of the most significant impacts related to the decrease in accounts payable (which benefits working capital). This was offset by a decrease in accounts receivable, and a decrease in cash (both of which reduce working capital).
Included in the $123.9 million working capital balance is the impact of Axerra's working capital of $(0.2) million as at November 30, 2010.
The days sales outstanding in accounts receivable, ("DSO"), as at November 30, 2010 was 62 days. This was 15 days higher than the DSO of 47 days at February 28, 2010. We evaluate DSO by determining the number of days of sales in the ending accounts receivable balance with reference to the most recent monthly sales, rather than average yearly or quarterly values. Axerra's terms with its customers reflect industry standard and are not unusual in nature.
Inventory turnover for November 30, 2010 was 1.9 times for the three month period then ended, a decrease from the number of turns calculated at February 28, 2010. Turnover is calculated with reference to the most recent monthly standard cost of goods sold and is based on the period ending inventory balance of production related inventory (net of labour and overhead allocations).
Cash Inflows and Outflows:
| Quarter Ended | ||||||||||||||||
Nov 30 2009 | Feb 28 2010 | May 31 2010 | Aug 31 2010 | Nov 30 2010 | ||||||||||||
|---|---|---|---|---|---|---|---|---|---|---|---|---|---|---|---|---|
Beginning Cash (incl Short Term Investments) | 19,466 | 98,356 | 113,350 | 115,825 | 98,477 | |||||||||||
Normal Operations | ||||||||||||||||
Net Income (Loss) | 11,647 | 12,802 | 9,690 | 1,225 | (50 | ) | ||||||||||
Changes in Non-Cash Working Capital | 1,183 | 710 | (5,034 | ) | (10,290 | ) | 3,997 | |||||||||
Capital & Intangible Asset Purchases | (2,820 | ) | (1,120 | ) | (2,225 | ) | (917 | ) | (602 | ) | ||||||
Line of Credit/Option proceeds & other | (543 | ) | 1,694 | 147 | 64 | 142 | ||||||||||
Non Cash items included in Net Income | 808 | 908 | 951 | 1,839 | 2,129 | |||||||||||
Total Cash (Used)/Generated | 10,275 | 14,994 | 3,529 | (8,079 | ) | 5,616 | ||||||||||
NASDAQ IPO | 68,615 | — | — | — | — | |||||||||||
Share Repurchase | — | — | (1,054 | ) | (9,269 | ) | (415 | ) | ||||||||
Acquisition of Axerra Networks* | — | — | — | — | (8,313 | )* | ||||||||||
Ending Cash (incl Short Term Investments) | 98,356 | 113,350 | 115,825 | 98,477 | 95,365 | |||||||||||
- *
- Amount net of cash and restricted cash acquired
21
![]()
DragonWave Inc.
Management's Discussion and Analysis
For the three and nine months ended November 30, 2010
Tables are expressed in USD $000's except share and per share amounts
Cash Used in Operating Activities
The impact to cash of the $0.05 million net loss (positive impact of $2.1 million when adjusted for non-cash items) for the three months ended November 30, 2010 was further augmented by the decrease in non-cash working capital of $4.0 million as well as the proceeds of $0.1 million from options and other equity offerings.
Investing Activities
During the three months ended November 30, 2010, DragonWave purchased Axerra, for $9.5 million ($8.3 million net of cash and restricted cash acquired), and purchased new hardware and software valued at $0.6 million.
Financing Activities
During the three months ended November 30, 2010 we paid $0.4 million for shares repurchased in the prior quarter.
We disclosed our expectations regarding the use of net proceeds ($70.5 million CAD) of the offering of our common shares which was completed on October 20, 2009 (the "Offering") in our supplemented short form PREP prospectus dated October 14, 2009. The following table summarizes progress to the end of the third quarter of fiscal 2011 against the use of net proceeds disclosed in the prospectus, other than proceeds which were described as being allocated to working capital:
Description of Expected Use of Proceeds | Amount of Net Proceeds | Status as at November 30, 2010 | |||
|---|---|---|---|---|---|
Strengthen our balance sheet | $ | 27.4 million | As of November 30, 2010 the Company had $95.4 million in Cash on its balance sheet, consisting of net proceeds of the Offering that have not yet been allocated as well as cash flow from operations. | ||
Fund efforts to increase sales penetration | $ | 13.7 million | Between October 14, 2009 and November 30, 2010 the Company expended approximately $3.6 million to fund efforts to increase sales penetration outside of North America. | ||
Provide source of funding for potential | $ | 6.8 million | The acquisition of Axerra required the outlay of $9.5 million with a future potential earn-out additional liability of $15.5 million, payable either in cash or in DragonWave shares at DragonWave's discretion. | ||
22
![]()
DragonWave Inc.
Management's Discussion and Analysis
For the three and nine months ended November 30, 2010
Tables are expressed in USD $000's except share and per share amounts
In addition to cash raised through financing activities, we have generated substantial cash flows from operations which are also allocated to the foregoing uses, as described in the table, as well as to fund operations and other initiatives. As disclosed in the Offering prospectus, management has broad discretion in how it uses the net proceeds received from financing activities. We may re-allocate the net proceeds of the Offering from time to time having consideration to our strategy relative to the market and other conditions in effect at the time, including those factors discussed above under the heading "Risks and Uncertainties". As discussed our current focus is on diversifying our customer base through a strategy that includes product innovation, expansion of our geographic markets, OEM arrangements and mergers and acquisitions, and we expect that our available funds will be used to support these and related initiatives as well as other elements of our growth strategy.
Liquidity and Capital Resource Requirements
Based on our recent performance, current revenue expectations, and funds raised through the financing activities of the previous year, our management believes cash resources will be available to satisfy working capital needs for at least the next 12 months.
Commitments as at November 30, 2010
Future minimum operating lease payments as at November 30, 2010 per fiscal year are as follows:
2011 | $ | 504 | ||
2012 | $ | 1,646 | ||
2013 | $ | 725 | ||
2014 | $ | 589 | ||
Thereafter | $ | 844 | ||
| $ | 4,308 | |||
In the normal course of its business activities, the Company is subject to claims and legal actions. We recognize a provision for estimated loss contingencies when it is probable that a liability has been incurred and the amount of the loss can be reasonably estimated. In management's opinion, adequate provisions have been made for all current and future claims.
Royalty Commitments
Under the research and development agreements between Axerra Networks Ltd. and OCS, DragonWave is required to pay royalties at the rate of 3% – 3.5% of sales of products developed with funds provided by the OCS, up to an amount equal to 100% of the OCS grants, bearing interest at the rate of LIBOR. The obligation to pay these royalties is contingent on actual sales of the products and in the absence of such sales, no payment is required.
Upon acquisition of Axerra Networks Inc., we recognized $4,138 on to the Balance Sheet which represented the fair value of the obligation as at the acquisition date. The fair value represents the
23
![]()
DragonWave Inc.
Management's Discussion and Analysis
For the three and nine months ended November 30, 2010
Tables are expressed in USD $000's except share and per share amounts
discounted, most probable obligation to the Company. After consideration of the liability recognized in the consolidated balance sheet, we have a maximum potential obligation of an additional $10,597.
Outstanding Share Data
The common shares of the Company are listed on the TSX under the symbol DWI and on the NASDAQ under the symbol DRWI.
| | Outstanding | Exercise Price Range | Weighted Avg Exercise Price | ||||||
|---|---|---|---|---|---|---|---|---|---|
Common shares | 35,146,435 | n/a | n/a | ||||||
DWI on NASDAQ on November 30, 2010 | $7.56 | ||||||||
Market Capitalization | $265,707,049 | ||||||||
Stock option—common shares | 2,022,913 | CAD 1.34 – CAD 13.74 | CAD 4.72 | ||||||
Warrants—common share | 72,894 | $3.47 – $8.87 | $6.36 | ||||||
The information presented is at November 30, 2010.
Off-Balance Sheet Arrangements
We lease space for our headquarters in Ottawa, Ontario, Canada. Our R&D, services and support, and general and administrative groups operate from our headquarters. We also lease warehouse space in Ottawa, Ontario, Canada. Both leases expire in November 2011. We lease additional warehouse space on a month by month basis. Our rental costs including operating expenses total $102 thousand per month. In April, 2008 we signed a lease agreement in England. The lease expires in April, 2013 and rental costs including operating costs total $8 thousand per month. In December, 2010 we signed a lease agreement in Atlanta, Georgia, in the United States. Rental costs, including operating costs total $9 thousand per month. In December, 2010 we signed a lease agreement in Singapore. The lease expires in December, 2011 and rental costs including operating costs total $2 thousand per month.
Our indirect subsidiary, Axerra Networks Ltd., leases space for its headquarters in Tel Aviv, Israel. Axerra's R&D, services and support, and general and administrative groups operate from their headquarters. This lease was renewed in December 2010 for a period of 60 months. Rental costs, including operating expenses, total $37 thousand per month.
We use an outsourced manufacturing model whereby most of the component acquisition and assembly of our products is executed by third parties. Generally, we provide the supplier with a purchase order 90 days in advance of expected delivery. We are responsible for the financial impact of any changes to the product requirements within this period. We have purchase orders in place currently for raw materials and manufactured products in addition to capital expenses and services. All purchase orders reflect our current view on revenue and cash flow.
24
![]()
DragonWave Inc.
Management's Discussion and Analysis
For the three and nine months ended November 30, 2010
Tables are expressed in USD $000's except share and per share amounts
Financial Instruments
Under Canadian generally accepted accounting principles, financial instruments are classified into one of the following categories: held for trading, held-to-maturity, available-for-sale, loans and receivables, or other liabilities.
Fair Value
The following table summarizes the carrying values of the Company's financial instruments:
| | November 30, 2010 | February 28, 2010 | |||||
|---|---|---|---|---|---|---|---|
Held-for-trading(1) | 95,365 | 113,350 | |||||
Loans and receivables(2) | 15,784 | 28,990 | |||||
Other financial liabilities(3) | 14,938 | 31,269 | |||||
- (1)
- Includes cash, cash equivalents, restricted cash, and short term investments
- (2)
- Includes trade receivables and other receivables which are financial in nature
- (3)
- Includes accounts payable and accrued liabilities which are financial in nature
Cash and cash equivalents, restricted cash, short term investments, trade receivables, other receivables, accounts payable and accrued liabilities are short term financial instruments whose fair value approximates the carrying amount given that they will mature shortly. As at the balance sheet date, there are no significant differences between the carrying value of these items and their estimated fair values.
Interest rate risk
Cash and cash equivalents with variable interest rates expose us to interest rate risk on these financial instruments. We pay interest on our line of credit at the bank's prime rate of interest plus 1%, and has interest rate risk exposure due to changes in the bank's prime rate. The line of credit was not utilized as at November 30, 2010.
Credit risk
In addition to trade receivables and other receivables, we are exposed to credit risk on our cash and cash equivalents, restricted cash, and short term investments in the event that our counterparties do not meet their obligations. We do not use credit derivatives or similar instruments to mitigate this risk and, as such, the maximum exposure is the full carrying value or face value of the financial instrument. We minimize our credit risk on cash and cash equivalents and short term investments by transacting with only reputable financial institutions.
25
![]()
DragonWave Inc.
Management's Discussion and Analysis
For the three and nine months ended November 30, 2010
Tables are expressed in USD $000's except share and per share amounts
Foreign exchange risk
The following table summarizes the currency distribution of our financial instruments in US dollars, as at November 30, 2010:
| | November 30, 2010 | February 28, 2010 | |||||||||||||||||
|---|---|---|---|---|---|---|---|---|---|---|---|---|---|---|---|---|---|---|---|
| | US Dollars | CDN Dollars | Other Currency | US Dollars | CDN Dollars | Other Currency | |||||||||||||
Held-for-trading | 95% | 4% | 1% | 86% | 13% | 1% | |||||||||||||
Loans and receivables | 83% | 11% | 6% | 93% | 6% | 1% | |||||||||||||
Other financial liabilities | 64% | 24% | 12% | 65% | 35% | 0% | |||||||||||||
Foreign exchange risk arises because of fluctuations in exchange rates. We do not currently use derivative financial instruments to mitigate this risk.
If the US dollar had appreciated 1% against all foreign currencies at November 30, 2010, with all other variables held constant, the impact of this foreign currency change on our foreign denominated financial instruments would have resulted in an increase in after-tax net income of $39 thousand for the three and nine month periods ended November 30, 2010 (three and nine month periods ended November 30, 2009—$129 thousand), with an equal and opposite effect if the US dollar had depreciated 1% against all foreign currencies at November 30, 2010.
Liquidity risk
A risk exists that we will not be able to meet our financial obligations as they become due. Based on the our recent performance, current revenue expectations and strong current ratio, management believes that liquidity risk is low.
Transactions with Related Parties
We lease premises from a real estate company controlled by a member of the Board of Directors. During the three and nine months ended November 30, 2010, we paid $0.3 million and $1.1 million respectively (three and nine months ended November 30, 2009—$0.3 million and $0.7 million respectively), relating to the rent, operating costs, and leasehold improvements associated with this real estate, and the value owing for net purchases at November 30, 2010 was $7 thousand (February 28, 2010—$70 thousand). These amounts have been allocated amongst various expense accounts, except for leasehold improvements which have been allocated to property and equipment.
We also purchased products and services from a company controlled or significantly influenced by a Board member. Total net product and services purchased for the three and nine month periods ended November 30, 2010 was nil and $2.7 million respectively (three and nine months ended November 30, 2009—$4.8 million and $11.4 million respectively). The majority of the purchases have been recorded in inventory and ultimately in cost of sales. This company ceased to be a related party on May 28, 2010.
All transactions are in the normal course of business and have been recorded at the exchange amount.
26
![]()
DragonWave Inc.
Management's Discussion and Analysis
For the three and nine months ended November 30, 2010
Tables are expressed in USD $000's except share and per share amounts
Description of Credit Facilities
Bank Line of Credit
As at November 30, 2010, we had drawn $nil (February 28, 2010—$nil), on an operating credit facility with a limit of $17.0 million (February 28, 2010—$10.0 million). Interest is calculated at the bank's prime rate of interest plus 1% (February 28, 2010—1.75%) and resulted in a weighted average effective rate of nil for the three and nine months ended November 30, 2010 (three and nine months ended November 30, 2009—4.59% and 4.25% respectively). An amount of $0.3 million has been reserved against the operating line of credit to secure letters of credit to support performance guarantees. We have provided a general security agreement on trade receivables. We were in compliance with the financial covenants included in the lending agreement as at November 30, 2010.
We have drawn nil (February 28, 2010—$nil) on a capital expenditure facility with a limit of $3.0 million (February 28, 2010—$3.0 million).
Controls and Procedures
In compliance with the Canadian Securities Administrators' National Instrument 52-109—Certification of Disclosure in Issuers' Annual and Interim Filings, we have filed certificates signed by our Chief Executive Officer ("CEO") and Chief Financial Officer ("CFO") that, among other things, report on the design and effectiveness of disclosure controls and procedures and the design and effectiveness of internal controls over financial reporting. These reports were filed for the three months ended November 30, 2010 and the twelve months ended February 28, 2010. During the three month and nine month periods ending November 30, 2010 no significant changes in internal controls occurred.
Commencing with our fiscal year ended February 28, 2011, we will be required to satisfy the requirements of Section 404 of the Sarbanes-Oxley Act ("SOX"). SOX requires an annual assessment by management of the effectiveness of our internal control over financial reporting and an attestation report by our independent auditors addressing this assessment.
Critical Accounting Policies and Estimates
Business Combinations
In January 2009, the Canadian Accounting Standards Board issued a new standard for business combinations, CICA 1582, "Business Combinations," which is substantially converged with IFRS. The revised Canadian standard is effective for years beginning on or after January 1, 2011, with earlier adoption permitted. An entity adopting this section for a fiscal year beginning before January 1, 2011 shall disclose that fact and also is required to adopt CICA 1601, "Consolidated Financial Statements" and CICA 1602, "Non-Controlling Interests" effective at the same time. We have adopted CICA Handbook Sections 1582, "Business Combinations," 1601, "Consolidated Financial Statements" and 1602, "Non-Controlling Interests" with effect from March 1, 2010.
27
![]()
DragonWave Inc.
Management's Discussion and Analysis
For the three and nine months ended November 30, 2010
Tables are expressed in USD $000's except share and per share amounts
Inventory
We value inventory at the lower of cost and market. We calculate the cost of raw materials on a standard cost basis, which approximates average cost. Market is determined as net realizable value for finished goods, raw materials and work in progress. Indirect manufacturing costs and direct labour expenses are allocated systematically to the total production inventory.
Revenue recognition
We derive revenue from the sale of our broadband wireless backhaul equipment which includes embedded software and a license to use said software and extended product warranties. We consider software to be incidental to the product. Services range from installation and training to basic consulting. We recognize revenue when persuasive evidence of an arrangement exists, delivery has occurred and there are no significant remaining vendor obligations, collection of receivables is reasonably assured and the fee is fixed and determinable. Where final acceptance of the product is specified by the customer, revenue is deferred until acceptance criteria have been met. Additionally, our business agreements may contain multiple elements. Accordingly, we are required to determine the appropriate accounting, including whether the deliverables specified in a multiple element arrangement should be treated as separate units of accounting for revenue recognition purposes, the fair value of these separate units of accounting and when to recognize revenue for each element. For arrangements involving multiple elements, we allocate revenue to each component of the arrangement using the residual value method, based on vendor-specific objective evidence of the fair value of the undelivered elements. These elements may include one or more of the following: advanced replacement, extended warranties, training, and installation. We allocate the arrangement fee, in a multiple-element transaction, to the undelivered elements based on the total fair value of those undelivered elements, as indicated by vendor-specific objective evidence. This portion of the arrangement fee is deferred. The difference between the total arrangement fee and the amount deferred for the undelivered elements is recognized as revenue related to the delivered elements. In some instances, a group of contracts or agreements with the same customer may be so closely related that they are, in effect, part of a single multiple element arrangement and, therefore, we would allocate the corresponding revenue among the various components, as described above.
We generate revenue through direct sales and sales to distributors. Revenue on stocking orders sold to distributors is not recognized until the end-user is identified.
We evaluate arrangements that include services such as training and installation to determine whether those services are essential to the functionality of other elements of the arrangement. When services are considered essential, revenue allocable to the other elements is deferred until the services have been performed. When services are not considered essential, the revenue allocable to the services is recognized as the services are performed.
We recognize revenue associated with extended warranty and advanced replacement rateably over the life of the contract.
We recognize revenue from engineering services or development agreements according to the specific terms and acceptance criteria as services are rendered.
28
![]()
DragonWave Inc.
Management's Discussion and Analysis
For the three and nine months ended November 30, 2010
Tables are expressed in USD $000's except share and per share amounts
We accrue estimated potential product liability as warranty costs when revenue on the sale of equipment is recognized. We calculate warranty costs on a percentage of revenue per month based on current actual warranty costs and return experience.
We record shipping and handling costs borne by us in costs of sales. Shipping and handling costs charged to customers are recorded as revenue, if billed at the time of shipment. Costs charged to customers after delivery are recorded in cost of sales.
Research and development
Our research costs are expensed as incurred. Our development costs other than property and equipment are expensed as incurred unless they meet generally accepted accounting criteria for deferral and amortization. Development costs incurred prior to establishment of technological feasibility do not meet these criteria, and are expensed as incurred. Government assistance and investment tax credits relating to ongoing R&D costs are recorded as a recovery of the related R&D expenses, where such assistance is reasonably assured.
Income taxes
Income taxes are accounted for using the liability method of accounting for income taxes. Under this method, future tax assets and liabilities are determined based on differences between the tax and accounting basis of assets and liabilities as well as for the benefit of losses available to be carried forward to future years for tax purposes that are more likely than not to be realized. Future tax assets and liabilities are measured using substantively enacted tax rates that apply to taxable income in the years in which temporary differences are expected to be recovered or settled. Future tax assets are recognized only to the extent, in the opinion of management, it is more likely than not that the future tax assets will be realized in the future.
We periodically review our provisions for income taxes and the valuation allowance to determine whether the overall tax estimates are reasonable. When we perform our quarterly assessments of the provision and valuation allowance, it may be determined that an adjustment is required. This adjustment may have a material impact on our financial position and results of operations.
Future Accounting Changes
In 2006, Canada's Accounting Standards Board ratified a strategic plan that will result in Canadian GAAP, as used by public companies, being evolved and converged with International Financial Reporting Standards ("IFRS") over a transitional period to be complete by 2011 (third quarter of fiscal 2012). We will be required to report using the converged standards effective for interim and annual financial statements relating to fiscal years beginning on or after January 1, 2011. Canadian GAAP will be converged with IFRS through a combination of two methods: as current joint-convergence projects of the United States' Financial Accounting Standards Board and the International Accounting Standards Board are agreed upon, they will be adopted by Canada's Accounting Standards Board and may be introduced in Canada before the complete changeover to IFRS; and standards not subject to a joint-convergence project will be exposed in an omnibus manner for introduction at the time of the complete changeover to IFRS.
29
![]()
DragonWave Inc.
Management's Discussion and Analysis
For the three and nine months ended November 30, 2010
Tables are expressed in USD $000's except share and per share amounts
The International Accounting Standards Board currently has projects underway that should result in new pronouncements that continue to evolve IFRS.
Transition to US GAAP vs. IFRS
On October 1, 2010, the Canadian Securities Administrators approved National Instrument ("NI") 52-107Acceptable Accounting Principles and Auditing Standards. The policy comes into force on January 1, 2011. NI 52-107 permits Canadian public companies which are also SEC registrants the option to prepare their financial statements under US GAAP. Under this policy there will be no requirement to provide a reconciliation of the US GAAP financial statements to IFRS. DragonWave has carefully considered the implications of conversion to IFRS compared to US GAAP. We have determined that it is in the best interests of the Company and the readers of our financial information to begin to provide US GAAP, rather than IFRS compliant financial statements in fiscal 2012. DragonWave already provides a US GAAP reconciliation to Canadian GAAP, and the differences are considered to be minor. Differences relate to the calculation of stock based compensation, and are fully explained in note 16 to the unaudited financial statements for the three and nine months ended November 30, 2010. We will continue to assess the relative merits of providing IFRS compliant financial statements in the future.
30