EXHIBIT 99.1
Exhibit 99.1
2004 ANNUAL MEETING
JUNE 23, 2004
Paul M. Pantozzi
Chairman of the Board, Chief Executive Officer and President
Forward Looking Statements
This presentation contains forward-looking statements within the meaning of the Private Securities Litigation Reform Act of 1995. These forward-looking statements include, but are not limited to, statements about (i) the benefits of the merger between Provident Financial Services (“Provident” or “PFS”) and First Sentinel Bancorp, Inc. (“First Sentinel” or “FSLA”), including future financial and operating results, cost savings and accretion to reported earnings that may be realized from the merger; (ii) Provident’s and First Sentinel’s plans, objectives, expectations and intentions and other statements contained in this presentation that are not historical facts; and (iii) other statements identified by words such as “expects,” “anticipates,” “intends,” “plans,” “believes,” “seeks,” “estimates” or words of similar meaning. These forward-looking statements are based upon the current beliefs and expectations of Provident’s and First Sentinel’s management and are inherently subject to significant business, economic and competitive uncertainties and contingencies, many of which are beyond our control. In addition, these forward-looking statements are subject to assumptions with respect to future business strategies and decisions that are subject to change. Actual results may differ materially from the anticipated results discussed in these forward-looking statements.
The following factors, among others, could cause actual results to differ materially from the anticipated results or other expectations expressed in the forward-looking statements: (1) the businesses of Provident and First Sentinel may not be combined successfully, or such combination may take longer to accomplish than expected; (2) the cost savings from the merger may not be fully realized or may take longer to realize than expected; (3) operating costs, customer loss and business disruption following the merger, including adverse effects on relationships with employees, may be greater than expected; (4) governmental approvals of the merger may not be obtained, or adverse regulatory conditions may be imposed in connection with governmental approvals of the merger; (5) the stockholders of First Sentinel or Provident may fail to approve the merger; (6) adverse governmental or regulatory policies may be enacted; (7) the interest rate environment may further compress margins and adversely affect net interest income; (8) the risks associated with continued diversification of assets and adverse changes to credit quality; (9) difficulties associated with achieving expected future financial results; (10) competition from other financial services companies in Provident’s and First Sentinel’s markets; (11) the risk of an economic slowdown that would adversely affect credit quality and loan originations. Additional factors that could cause actual results to differ materially from those expressed in the forward-looking statements are discussed in Provident’s and First Sentinel’s reports (such as Annual Reports on Form 10-K, Quarterly Reports on Form 10-Q and Current Reports on Form 8-K) filed with the Securities and Exchange Commission and available at the SEC’s Internet site (http://www.sec.gov). All subsequent written and oral forward-looking statements concerning the proposed transaction or other matters attributable to Provident or First Sentinel or any person acting on their behalf are expressly qualified in their entirety by the cautionary statements above. Except as required by law, Provident and First Sentinel do not undertake any obligation to update any forward-looking statement to reflect circumstances or events that occur after the date the forward-looking statement is made.
Our Mission
To consistently provide superior value
to our stockholders by achieving strong financial performance
to our customers by delivering high quality financial solutions that help improve and enrich their lives
to our employees by maintaining a challenging and rewarding work environment
to our communities by committing our personal energies and financial resources and by exemplifying outstanding leadership.
As we accomplish our mission, we will hold ourselves to the highest standards of personal and professional integrity.
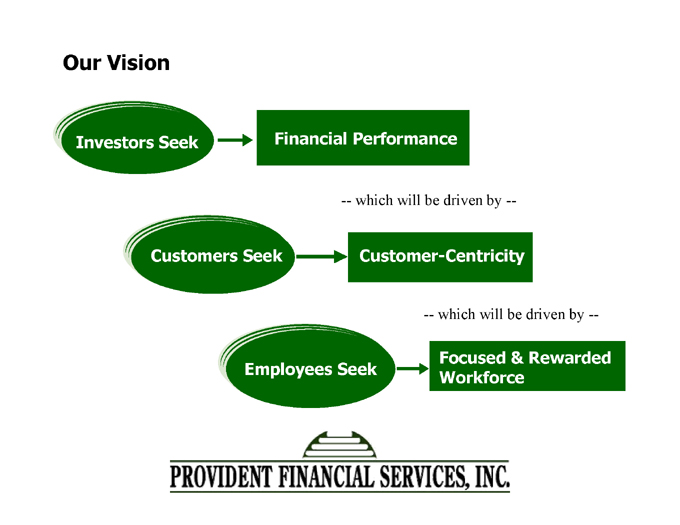
Our Vision
Investors Seek Financial Performance
— which will be driven by —
Customers Seek Customer-Centricity
— which will be driven by —
Focused & Rewarded Employees Seek Workforce
Our Ongoing Strategic Initiatives
• Align our Company around our Customers
• Maximize Earnings Per Share
• Maintain a diversified Loan Portfolio
• Emphasize Core Deposits
• Remain devoted to Asset Quality
• Actively manage risk
• Improve Efficiency Ratio
• Prudently deploy Capital
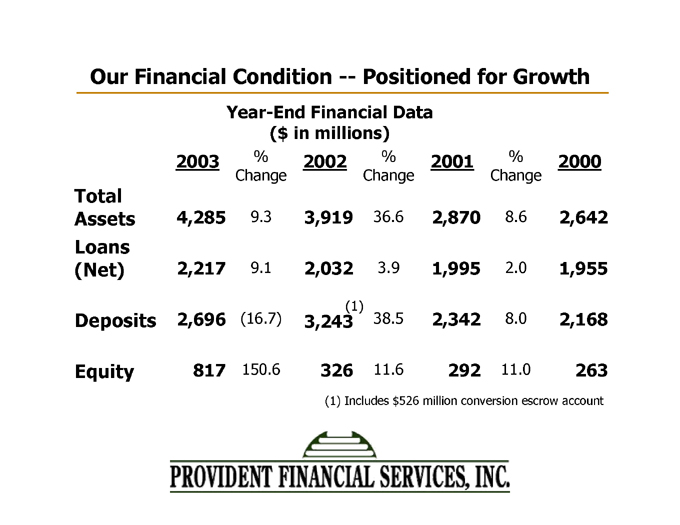
Our Financial Condition — Positioned for Growth
Year-End Financial Data
($in millions)
2003 % 2002 % % 2000
Change Change 2001 Change
Total
Assets 4,285 9.3 3,919 36.6 2,870 8.6 2,642
Loans
(Net) 2,217 9.1 2,032(1) 3.9 1,995 2.0 1,955
Deposits 2,696 (16.7) 3,243 38.5 2,342 8.0 2,168
Equity 817 150.6 326 11.6 292 11.0 263
(1) Includes $526 million conversion escrow account
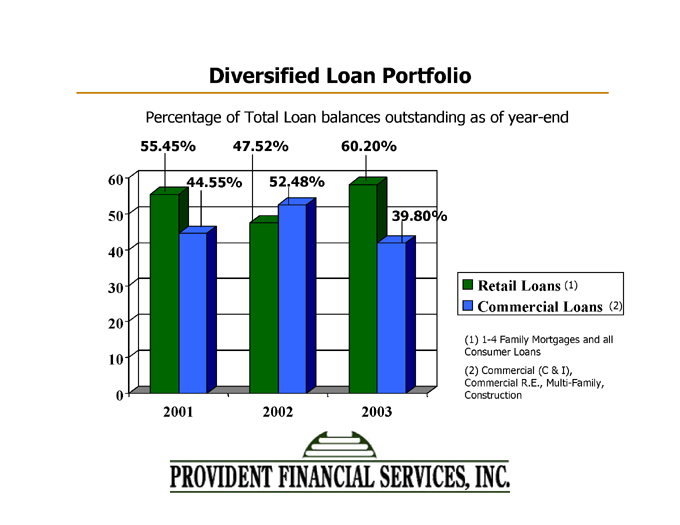
Diversified Loan Portfolio
Percentage of Total Loan balances outstanding as of year-end
Retail Loans (1) 55.45% 47.52% 60.20%
Commercial Loans (2) 44.55% 52.48% 39.80%
(1) 1-4 Family Mortgages and all Consumer Loans
(2) Commercial (C & I), Commercial R.E., Multi-Family, Construction
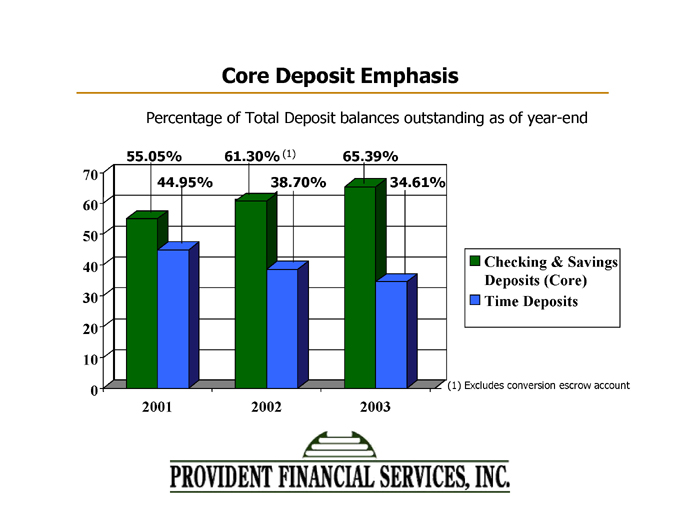
Core Deposit Emphasis
Percentage of Total Deposit balances outstanding as of year-end
Checking & Savings Deposits (Core) Time 55.05% 61.30% (1) 65.39%
Deposits 44.95% 38.70% 34.61%
(1) Excludes conversion escrow account
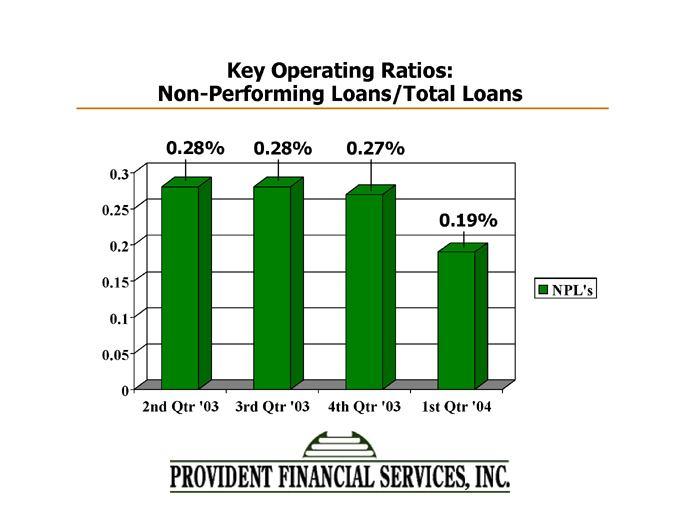
Key Operating Ratios: Non-Performing Loans/Total Loans
NPL’s 0.28% 0.28% 0.27% 0.19%
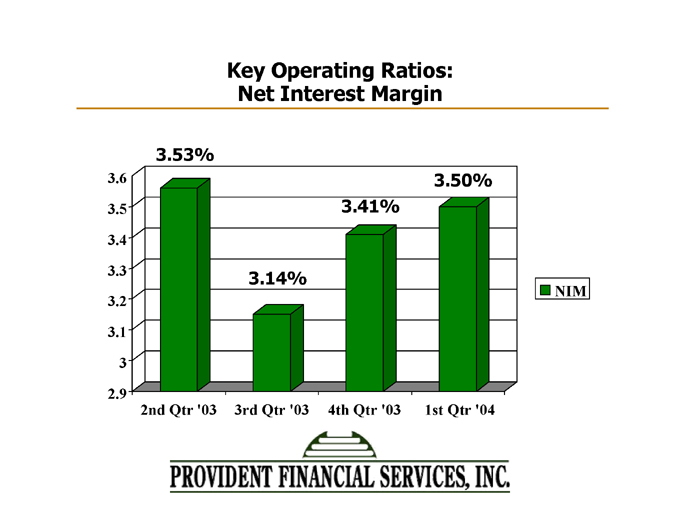
Key Operating Ratios: Net Interest Margin
NIM 3.53% 3.14% 3.41% 3.50%
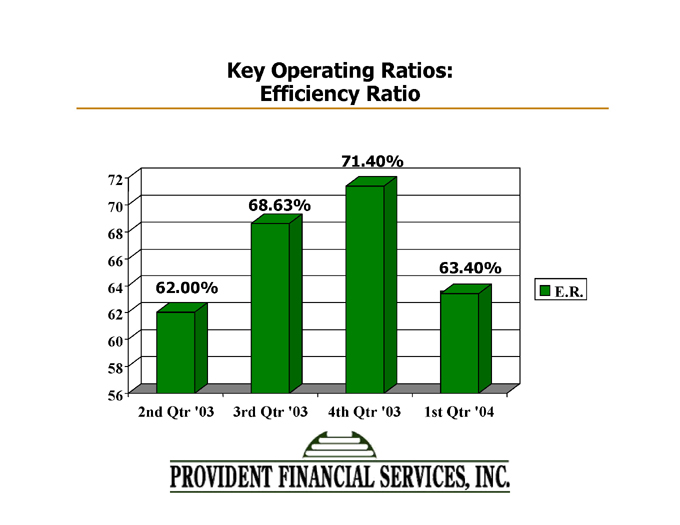
Key Operating Ratios: Efficiency Ratio
E.R. 62.00% 68.63% 71.40% 63.40%
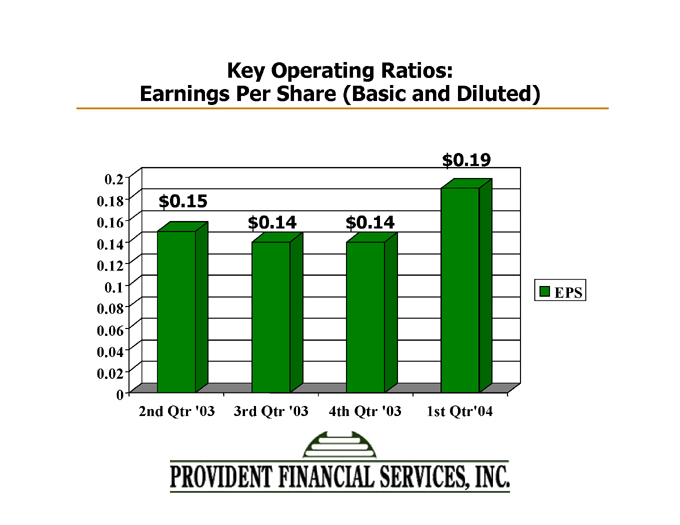
Key Operating Ratios: Earnings Per Share (Basic and Diluted)
EPS $0.15 $0.14 $0.14 $0.19
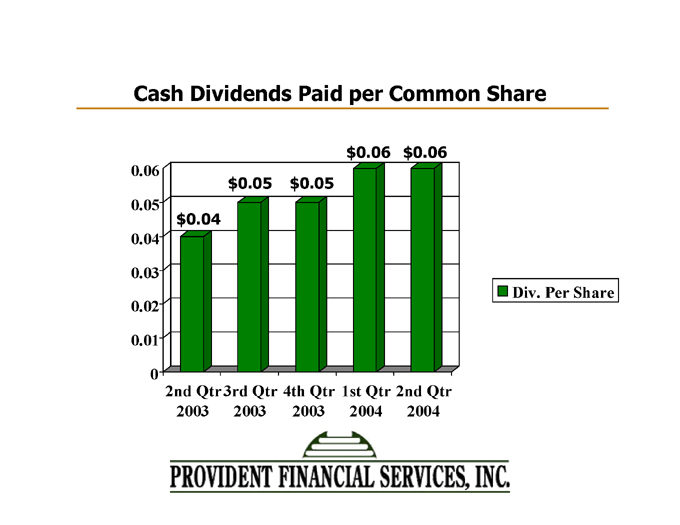
Cash Dividends Paid per Common Share
Div. Per Share $0.04 $0.05 $0.05 $0.06 $0.06

Strategic Growth in New Jersey’s Most Attractive Markets
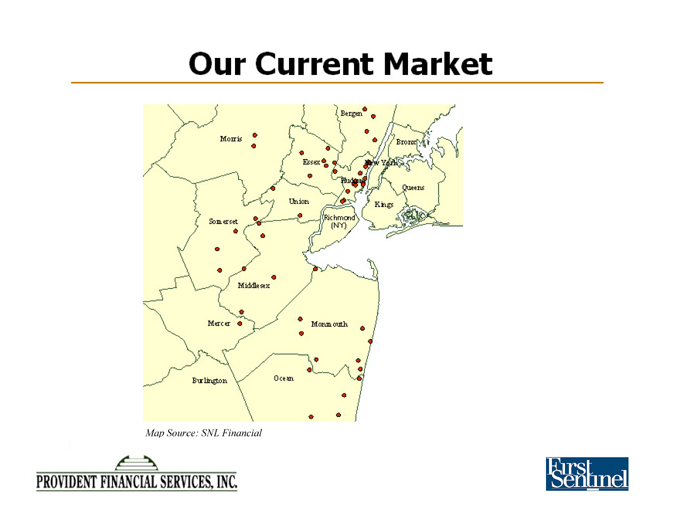
OUR CURRENT MARKET
Map Source: SNL Financial
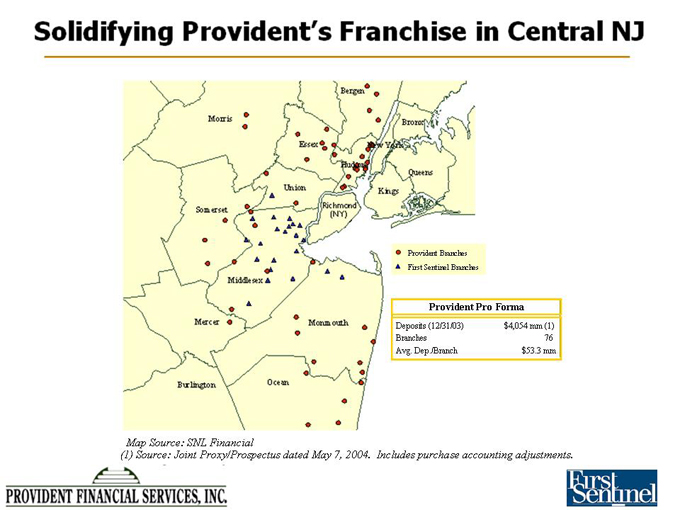
Solidifying Provident’s Franchise in Central NJ
Provident Pro Forma
Deposits (12/31/03) $4,054 mm (1)
Branches 76
Avg. Dep./Branch $53.3 mm
Map Source: SNL Financial
(1) Source: Joint Proxy/Prospectus dated May 7, 2004. Includes purchase accounting adjustments.
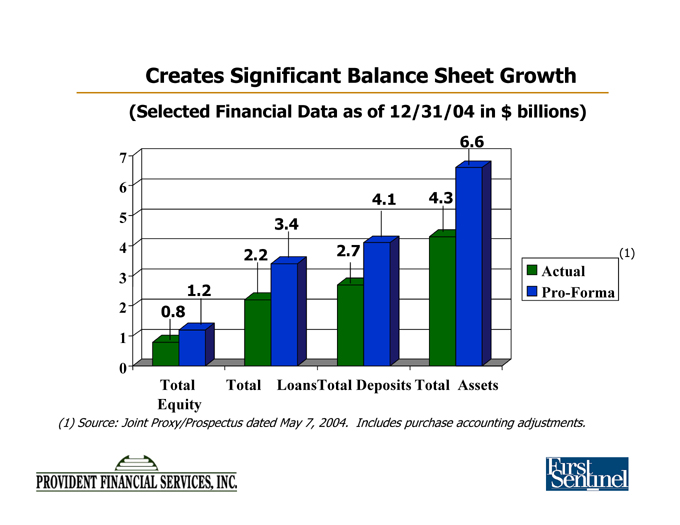
Creates Significant Balance Sheet Growth
(Selected Financial Data as of 12/31/04 in $ billions)
Actual 0.8 2.2 2.7 4.3
Pro-Forma 1.2 3.4 4.1 6.6
(1) Source: Joint Proxy/Prospectus dated May 7, 2004. Includes purchase accounting adjustments.
Poised for Successful Integration
• Straight-forward transparent operations with similar cultures and business models
• No immediate branch closures anticipated
– Minimize customer disruption
– Substantially all employees with customer interaction remain in place
• Conservative cost savings assumptions
• Revenue and market penetration opportunities identified
– Retail banking
– Commercial lending
– Wealth Management/ Trust
Summary: A Compelling Combination
• Adds highly attractive franchise in one of New Jersey’s best banking markets
• Anticipated accretion to EPS with solid internal rate of return
• In-market transaction with conservative cost savings assumptions
• First Sentinel possesses strong fundamentals
• Management additive
• Effective deployment of conversion proceeds
• Consistent with Provident’s expansion strategy

LOGO