Exhibit 99.1
Exhibit 99.1
Ryan, Beck & Co.
Financial Institutions Investor Conference
Wednesday, October 27, 2004
Driving Revenue by Building Commercial Lending Capability 1
Forward Looking Statements
Certain statements contained herein are “forward-looking statements” within the meaning of Section 27A of the Securities Act of 1933 and Section 21E of the Securities Exchange Act of 1934. Such forward-looking statements may be identified by reference to a future period or periods, or by the use of forward-looking terminology, such as “may,” “will,” “believe,” “expect,” “estimate,” “anticipate,” “continue,” or similar terms or variations on those terms, or the negative of those terms. Forward-looking statements are subject to numerous risks and uncertainties, including, but not limited to, those related to the economic environment, particularly in the market areas in which the Company operates, competitive products and pricing, fiscal and monetary policies of the U.S. Government, changes in government regulations affecting financial institutions, including regulatory fees and capital requirements, changes in prevailing interest rates, acquisitions and the integration of acquired businesses, credit risk management, asset-liability management, the financial and securities markets and the availability of and costs associated with sources of liquidity.
The Company wishes to caution readers not to place undue reliance on any such forward-looking statements, which speak only as of the date made. The Company wishes to advise readers that the factors listed above could affect the Company’s financial performance and could cause the Company’s actual results for future periods to differ materially from any opinions or statements expressed with respect to future periods in any current statements. The Company does not undertake and specifically declines any obligation to publicly release the result of any revisions which may be made to any forward-looking statements to reflect events or circumstances after the date of such statements or to reflect the occurrence of anticipated or unanticipated events. 2
Strategic Business Drivers
Long-range Strategic Goal: Achieve and sustain 50-50 Mix of Commercial and Retail Loans
Concentrated emphasis on building market share in middle-market C & I lending (ideal borrower size: $20 million in sales)
Emphasis on multi-family and single-family Construction lending
Realization that permanent Commercial Mortgage market is highly competitive 3
Competing in the Commercial Lending Arena: A Continual Building Process
Continued Building of Lending Team & Talent
Market Penetration and Expansion
Constant Focus on Credit Standards and Asset Quality
Steady Portfolio Growth
Dedicated to Building Total Relationships with Commercial Customers 4
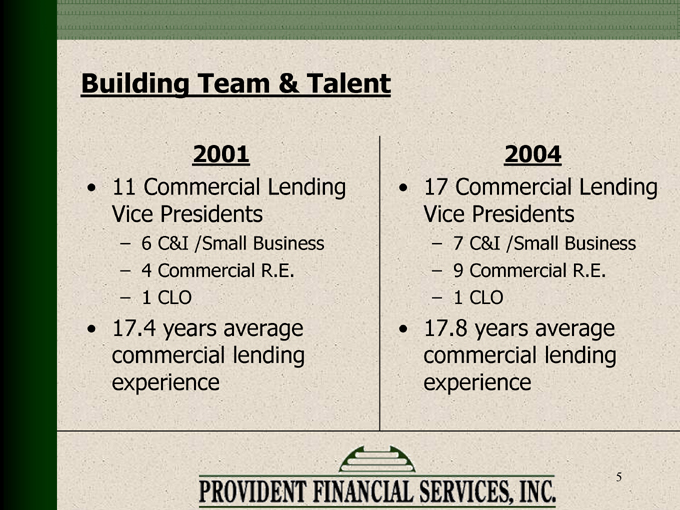
Building Team & Talent
2001
11 Commercial Lending Vice Presidents
6 C&I /Small Business
4 Commercial R.E.
1 CLO
17.4 years average commercial lending experience
2004
17 Commercial Lending Vice Presidents
7 C&I /Small Business
9 Commercial R.E.
1 CLO
17.8 years average commercial lending experience 5

Building Market Recognition & Market Reach
Lending Area = entire State of New Jersey
We have achieved State-wide reputation as a Commercial Real estate lender
Continually building reputation as a C & I lender
Large borrowers think of us as a resource as rapidly as they do much larger institutions
Acquisition of FSLA has added:
New facility in center of our market area where all lending operations are consolidated
22 new branches for:
generation of leads
enhanced brand recognition
more facilities for commercial customers to do all of their banking
Recognition
Reach 6
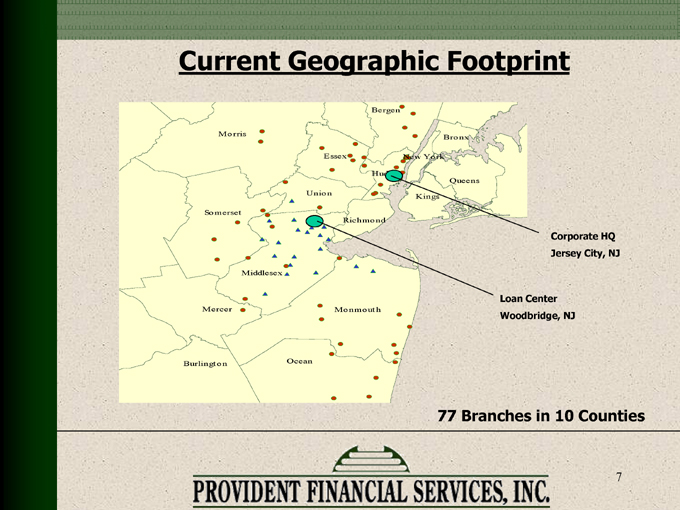
Current Geographic Footprint
Loan Center
Woodbridge, NJ
Corporate HQ
Jersey City, NJ
77 Branches in 10 Counties
7
Origination Standards— Commercial & Industrial Loans
Majority of loans are floating rate
Some fixed interest for 5 years or less
Less than $100,000—use Fair Isaac credit score system
Largest credit = $35 million participation in $400 million syndicated line of credit 8
Origination Standards— Construction Loans
Terms of 3 years or less
Outside engineering firm reviews plans & costs and construction advances
Conditions of advances:
For rental property, require significant pre-leasing
For single-family or condo projects, significant percent of units must be under contract 9
Origination Standards— Commercial R.E. & Multi-family
75% maximum LTV
1.2X minimum debt service coverage
Rate adjusted after 5 years
Property inspection every 18 months for loans $1 million +
Largest single loan: $25 million secured by hotel ($5 million recently participated out) 10
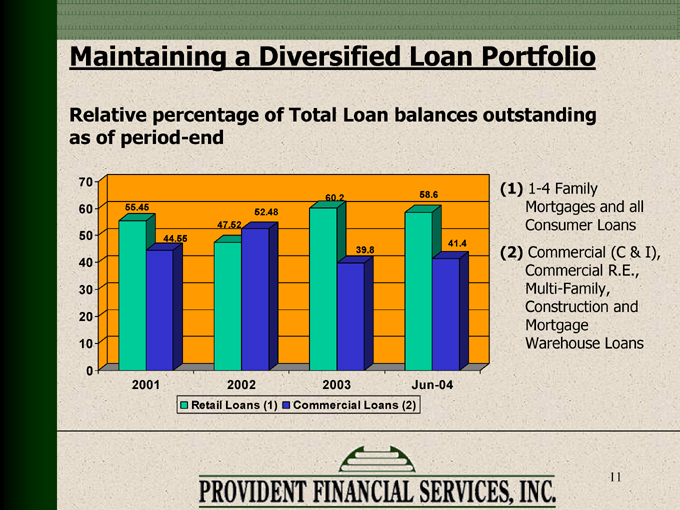
(1) 1-4 Family Mortgages and all Consumer Loans
(2) Commercial (C & I), Commercial R.E., Multi-Family, Construction and Mortgage Warehouse Loans
Maintaining a Diversified Loan Portfolio
Relative percentage of Total Loan balances outstanding as of period-end
55.45 44.55 47.52 52.48 60.2 39.8 58.6 41.4 0 10 20 30 40 50 60 70
2001
2002
2003
Jun-04
Retail Loans (1)
Commercial Loans (2)
11
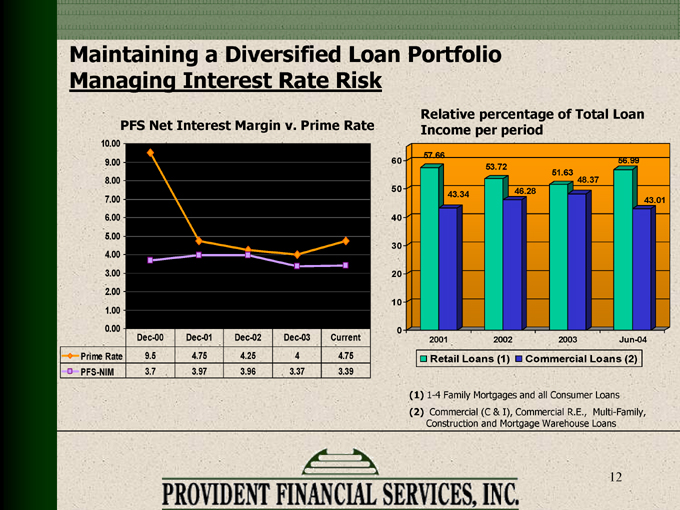
Maintaining a Diversified Loan Portfolio Managing Interest Rate Risk
PFS Net Interest Margin v. Prime Rate
10.00 9.00 8.00 7.00 6.00 5.00 4.00 3.00 2.00 1.00 0.00
Dec-00 Dec-01 Dec-02 Dec-03 Current
Prime Rate 9.5 4.75 4.25 4 4.75
PFS-NIM 3.7 3.97 3.96 3.37 3.39
Relative percentage of Total Loan Income per period
(1) 1-4 Family Mortgages and all Consumer Loans
(2) Commercial (C & I), Commercial R.E., Multi-Family, Construction and Mortgage Warehouse Loans
57.66 43.34 53.72 46.28 51.63 48.37 56.99 43.01
0 10 20 30 40 50 60
2001
2002
2003
Jun-04
Retail Loans (1)
Commercial Loans (2)
12
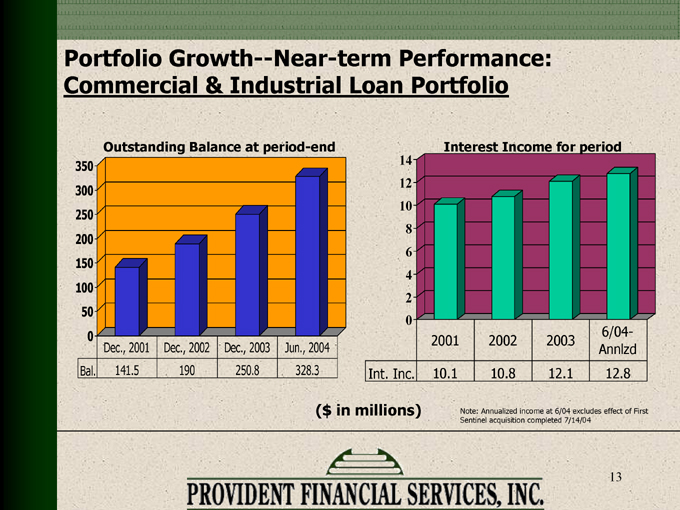
Portfolio Growth—Near-term Performance: Commercial & Industrial Loan Portfolio
($ in millions)
Outstanding Balance at period-end
Interest Income for period
Note: Annualized income at 6/04 excludes effect of First Sentinel acquisition completed 7/14/04
0 50 100 150 200 250 300 350
Bal.
141.5 190 250.8 328.3
Dec., 2001
Dec., 2002
Dec., 2003
Jun., 2004
13
14 12 10 8 6 4 2
Int. Inc.
10.1 10.8 12.1 12.8
2001 2002 2003 6/04-Annlzd
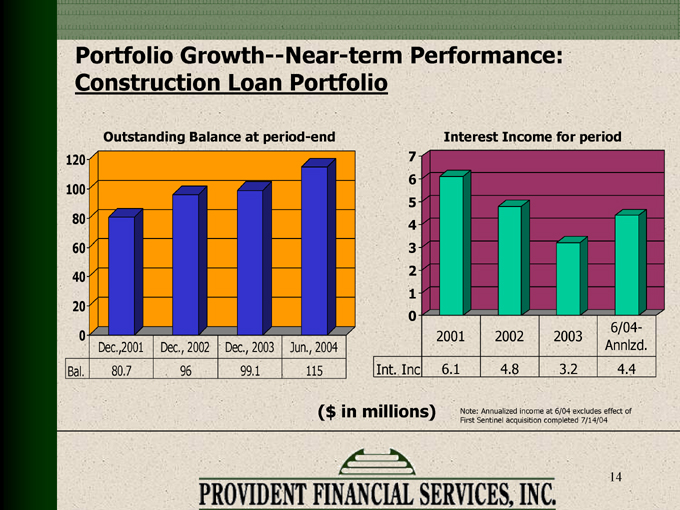
Portfolio Growth—Near-term Performance: Construction Loan Portfolio
($ in millions)
Outstanding Balance at period-end
Interest Income for period
Note: Annualized income at 6/04 excludes effect of First Sentinel acquisition completed 7/14/04
0 20 40 60 80 100 120
Bal.
80.7 96 99.1 115
Dec.,2001
Dec., 2002
Dec., 2003
Jun., 2004
14
7 6 5 4 3 2 1 0
Int. Inc 6.1 4.8 3.2 4.4
2001 2002 2003 6/04-Annlzd.
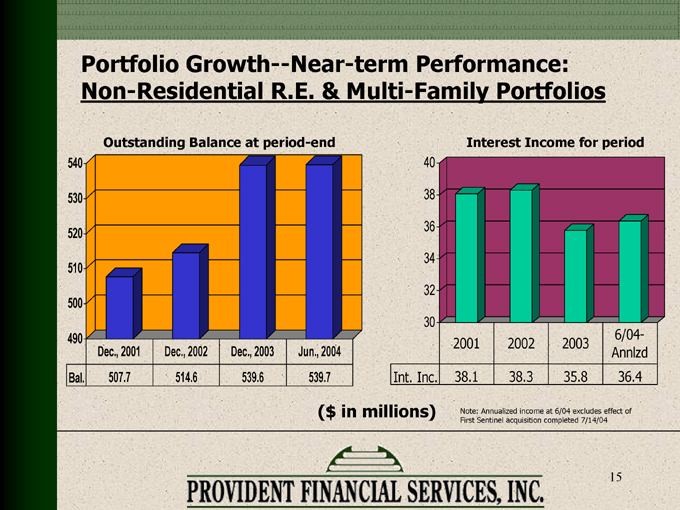
Portfolio Growth—Near-term Performance: Non-Residential R.E. & Multi-Family Portfolios
($ in millions)
Outstanding Balance at period-end
Interest Income for period
40 38 36 34 32 30
2001 2002 2003 6/04-Annlzd
Int. Inc. 38.1 38.3 35.8 36.4
Note: Annualized income at 6/04 excludes effect of First Sentinel acquisition completed 7/14/04
490 500 510 520 530 540
Bal.
507.7 514.6 539.6 539.7
Dec., 2001
Dec., 2002
Dec., 2003
Jun., 2004
15
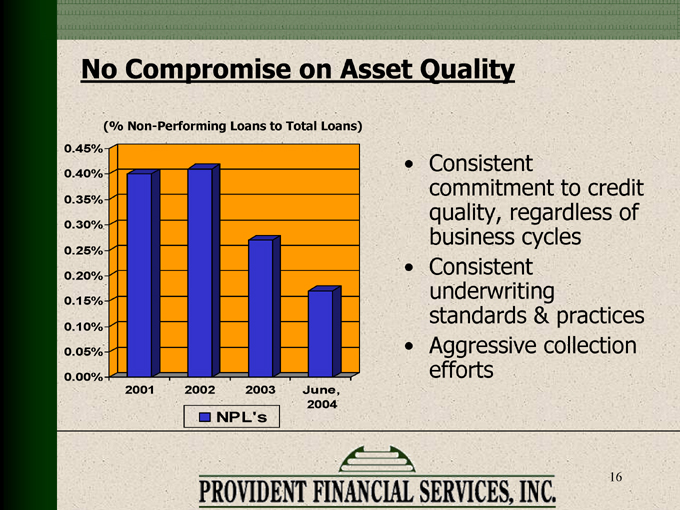
No Compromise on Asset Quality
Consistent commitment to credit quality, regardless of business cycles
Consistent underwriting standards & practices
Aggressive collection efforts
(% Non-Performing Loans to Total Loans)
0.00% 0.05% 0.10% 0.15% 0.20% 0.25% 0.30% 0.35% 0.40% 0.45%
2001
2002
2003
June,
2004
NPL’s
16
Building Relationships
Our goal is to obtain a true relationship with the borrower, i.e., maximum share of wallet
Loan officers routinely market every product: corporate deposits, personal business, cash management & other services based on customer’s need
Commercial clients develop rapport not only with their Relationship Manager but also with their Corporate Cash Management Representative and local branch manager
Commercial clients also have ready access to Executive Management
17
COMPETITIVE ADVANTAGES
Responsiveness
Flexibility in structure and price
Local decision-making
No regional bank bureaucracy
Exceptional customer service
Loyal customer base
18

19