 1 2006 Annual Meeting of Stockholders April 26, 2006 April 26, 2006 EXHIBIT 99.1 |
 2 2006 Annual Meeting of Stockholders Paul M. Pantozzi Paul M. Pantozzi Chairman of the Board & Chairman of the Board & Chief Executive Officer Chief Executive Officer |
 3 Certain statements contained herein are "forward-looking statements" within the meaning of Section 27A of the Securities Act of 1933 and Section 21E of the Securities Exchange Act of 1934. Such forward-looking statements may be identified by reference to a future period or periods, or by the use of forward-looking terminology, such as "may," "will," "believe," "expect," "estimate," "anticipate," "continue," or similar terms or variations on those terms, or the negative of those terms. Forward-looking statements are subject to numerous risks and uncertainties, including, but not limited to, those related to the economic environment, particularly in the market areas in which Provident Financial Services, Inc. (the “Company”) operates, competitive products and pricing, fiscal and monetary policies of the U.S. Government, changes in government regulations affecting financial institutions, including regulatory fees and capital requirements, changes in prevailing interest rates, acquisitions and the integration of acquired businesses, credit risk management, asset-liability management, the financial and securities markets and the availability of and costs associated with sources of liquidity. The Company wishes to caution readers not to place undue reliance on any such forward- looking statements, which speak only as of the date made. The Company wishes to advise readers that the factors listed above could affect the Company's financial performance and could cause the Company's actual results for future periods to differ materially from any opinions or statements expressed with respect to future periods in any current statements. The Company does not undertake and specifically declines any obligation to publicly release the result of any revisions which may be made to any forward-looking statements to reflect events or circumstances after the date of such statements or to reflect the occurrence of anticipated or unanticipated events. Forward Looking Statements |
 4 Corporate Profile • A $6 billion community bank • 76 retail offices serving 10 counties in northern and central New Jersey • Established: February, 1839 • Full conversion IPO: January, 2003 • Shares traded on NYSE: ticker symbol PFS • Market capitalization: $1.25 billion (at 3/31/06) |
 5 Ongoing Strategies for Earnings-per-Share Growth • • Enterprise Management Enterprise Management – Disciplined Resource Management – Balance Sheet Management and Positioning – Preserving/Enhancing Franchise Value – Asset Quality Maintenance • • Capital Management Capital Management – Share Repurchase Programs – Stockholder Cash Dividends – Disciplined Market Expansion/Management |
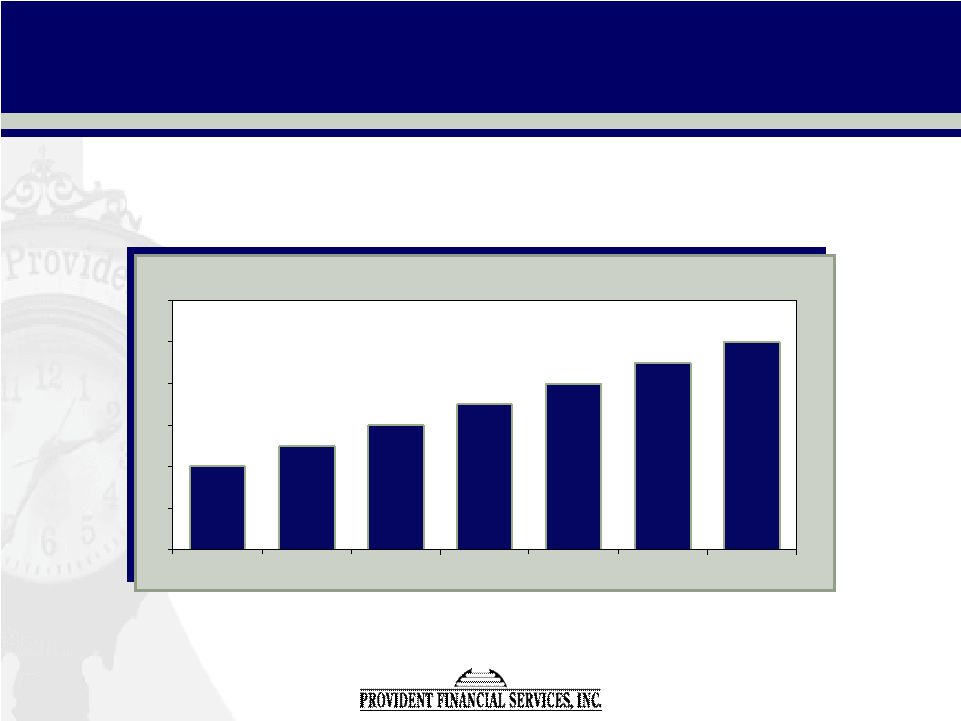
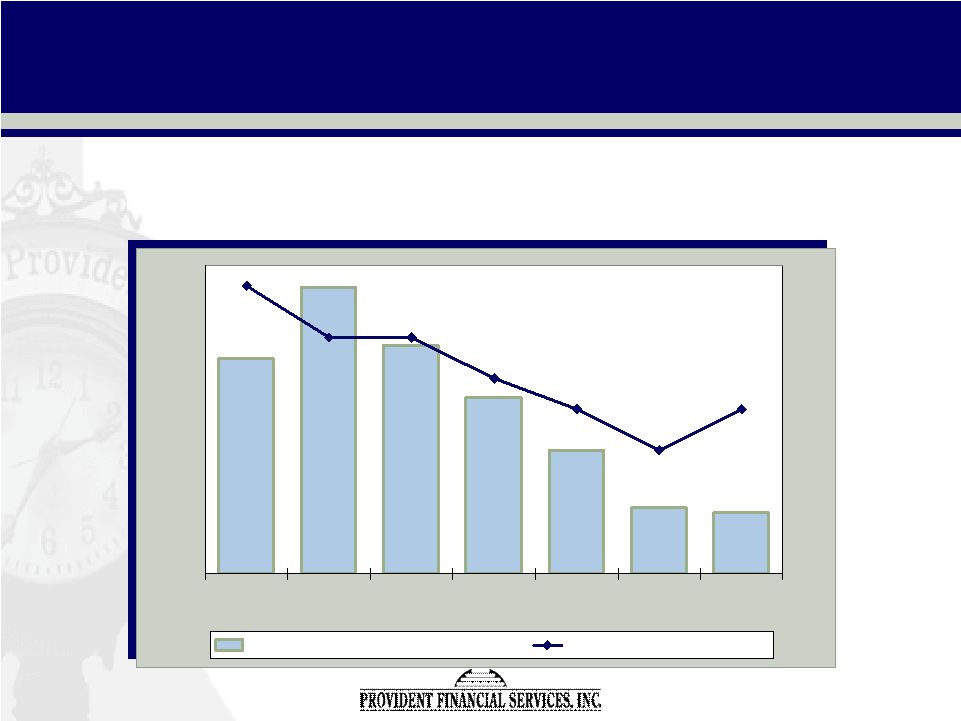 6 Resource Management $43.4 $43.5 $44.8 $46.0 $47.2 $48.5 $46.9 3.34% 3.31% 3.31% 3.27% 3.43% 3.38% 3.38% 3Q04 4Q04 1Q05 2Q05 3Q05 4Q05 1Q06 Net Interest Income (in millions) Net Interest Margin (%) Core Revenue Driver is Net Interest Income Core Revenue Driver is Net Interest Income – – Near term Strategy: Preserve Net Interest Margin Near term Strategy: Preserve Net Interest Margin |
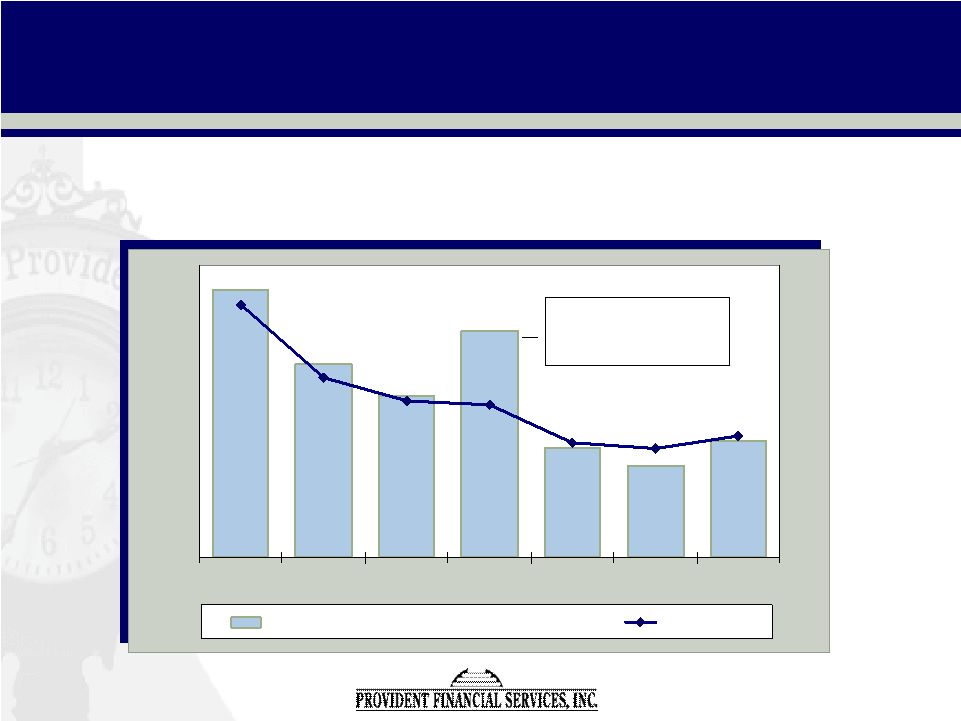 7 Resource Management $30.2 $29.5 $30.0 $33.2 $31.4 $32.3 $34.3 961 926 915 913 898 892 895 3Q04 4Q04 1Q05 2Q05 3Q05 4Q05 1Q06 Non-Interest Expense (in millions) # of FTEs Diligently Managing Overhead Costs Diligently Managing Overhead Costs – – Optimize Workforce Productivity Optimize Workforce Productivity Includes $1.4 million voluntary resignation initiative |
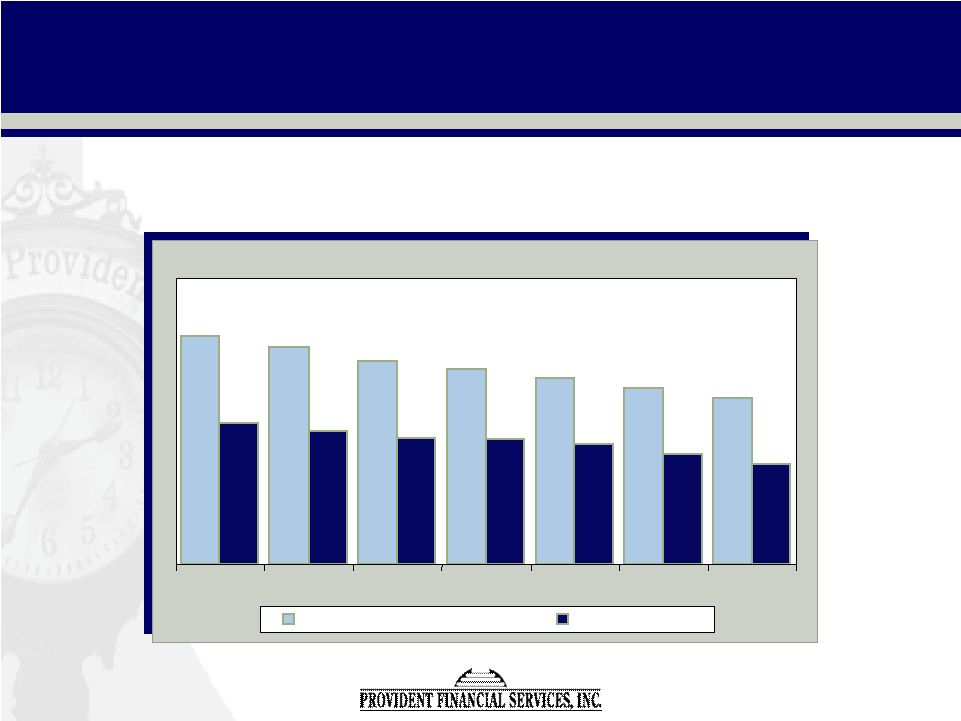 8 Balance Sheet Management Decreasing Dependence on Investment Decreasing Dependence on Investment Securities and Wholesale Borrowings* Securities and Wholesale Borrowings* * Excludes Subordinated Debentures ($ in millions) $1,997 $1,900 $1,782 $1,708 $1,635 $1,538 $1,451 $1,239 $1,166 $1,109 $1,100 $1,048 $970 $875 3Q04 4Q04 1Q05 2Q05 3Q05 4Q05 1Q06 Investment Securities Borrowings* |
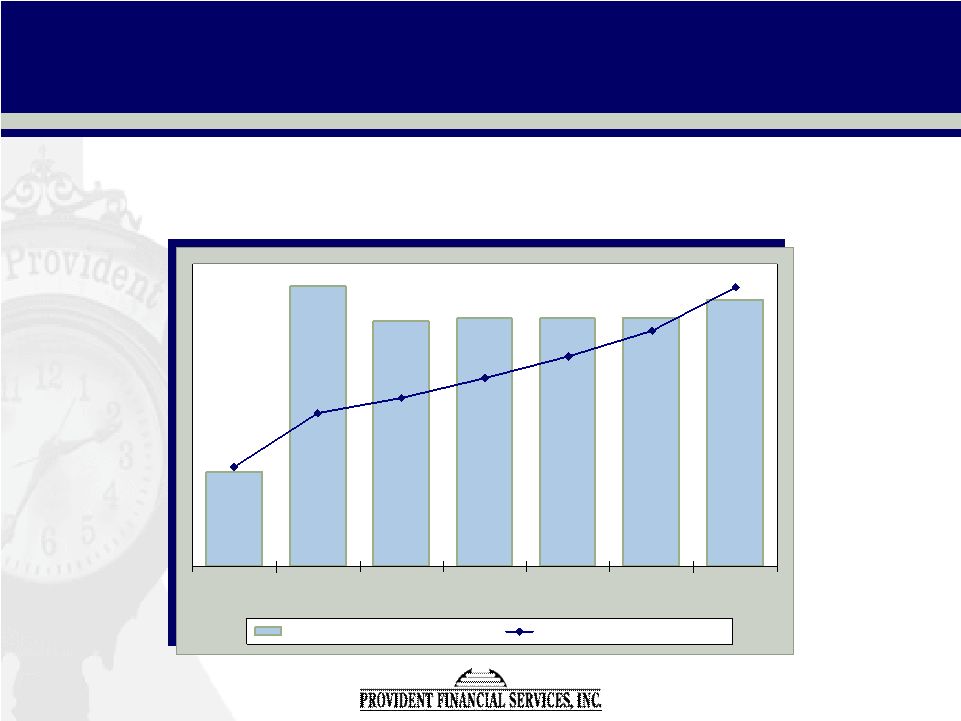 9 Balance Sheet Management Maximizing Loans to Drive Revenue Maximizing Loans to Drive Revenue $3,406 $3,690 $3,661 $3,660 $3,660 $3,655 $3,712 62.6% 68.9% 67.7% 66.7% 65.8% 65.1% 70.9% 3Q04 4Q04 1Q05 2Q05 3Q05 4Q05 1Q06 Aver. Net Loans (in millions) % of Aver. Earning Assets |
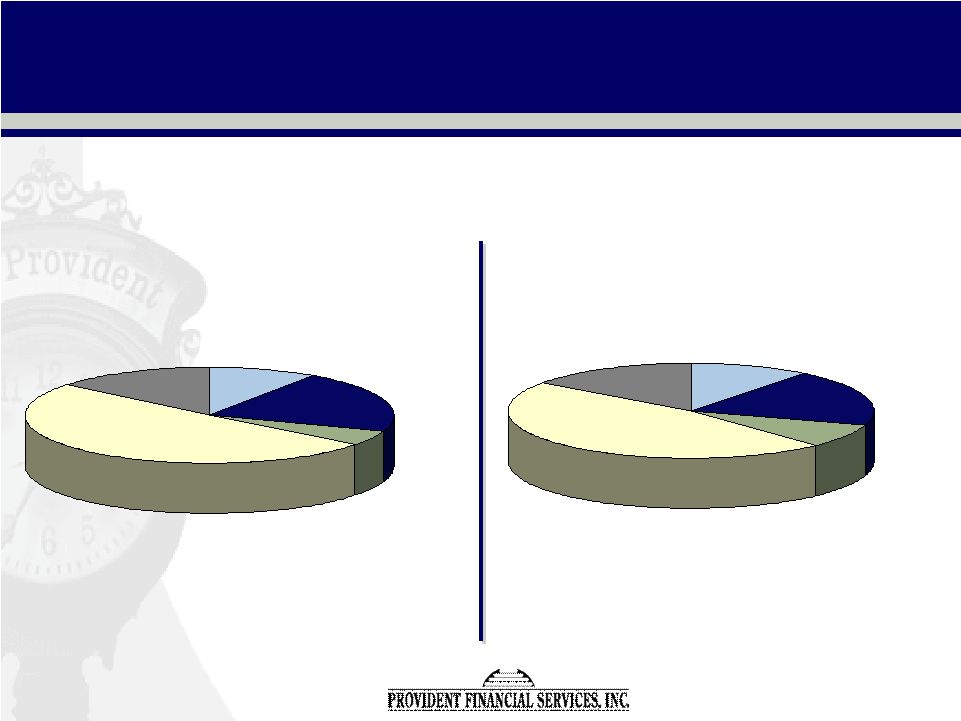 10 Balance Sheet Management 3/31/06 Residential Mortgage 47% Consumer 15% Construction 8% Commercial R.E. 20% Commercial & Industrial 10% Loan Portfolio Mix: Continuing Emphasis on Loan Portfolio Mix: Continuing Emphasis on Commercial Loans Commercial Loans 12/31/04 Residential Mortgage 50% Consumer 14% Construction 5% Commercial R.E. 21% Commercial & Industrial 10% |
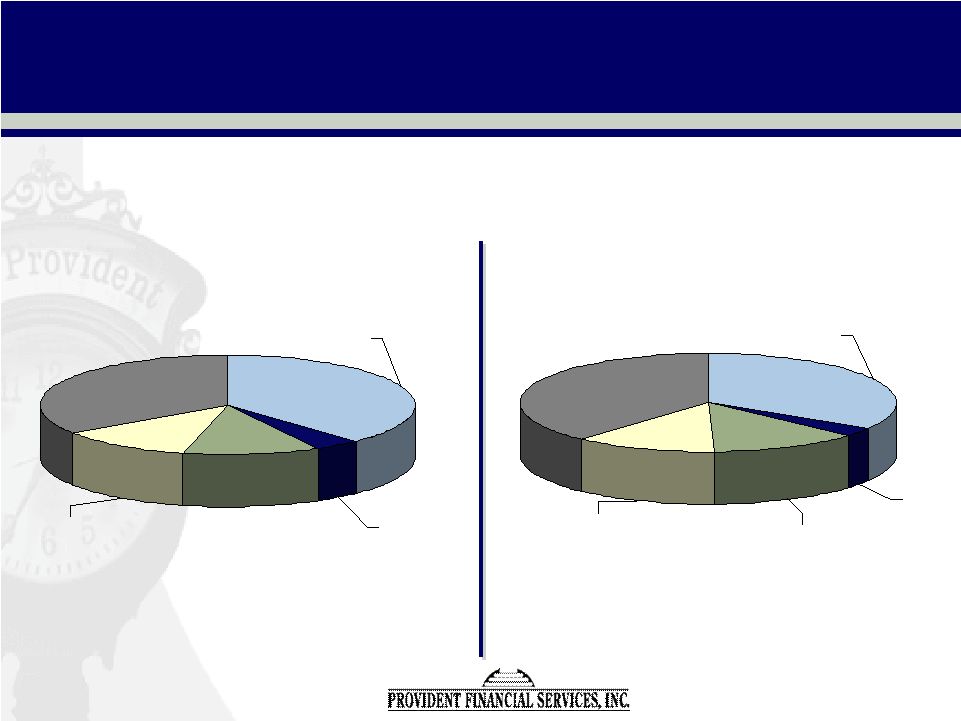 11 Balance Sheet Management 12/31/04 Non-Interest DDA 12% Time Deposits 34% MMA 4% Savings 38% NOW 12% Deposit Mix: Safeguarding Core Customer Relationships Deposit Mix: Safeguarding Core Customer Relationships 3/31/06 Non-Interest DDA 12% Time Deposits 38% MMA 3% Savings 34% NOW 13% |
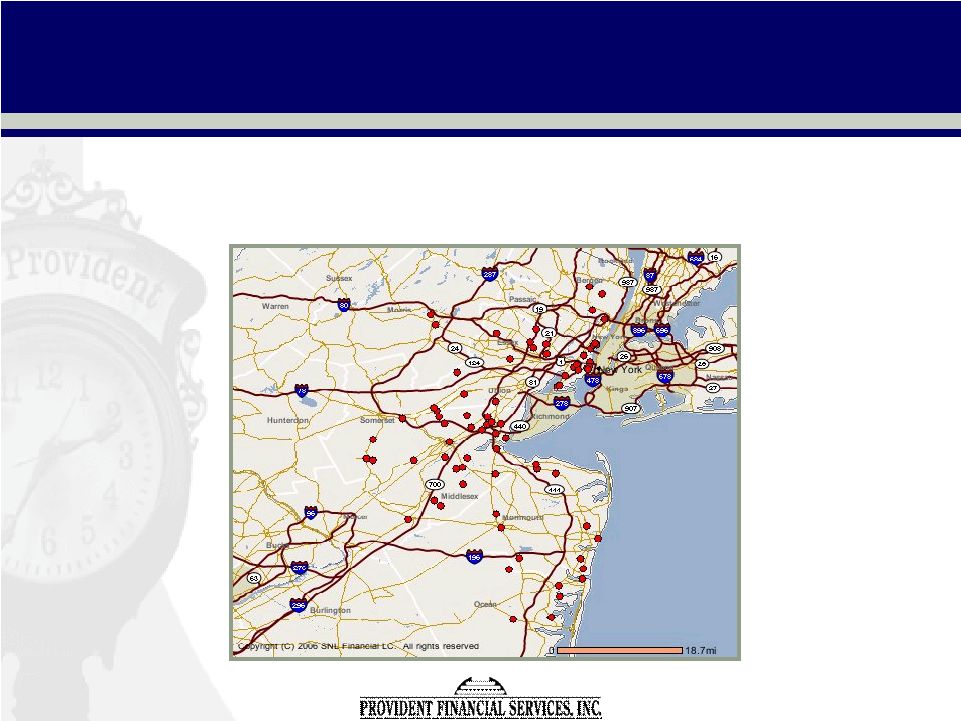 12 76 Branch Offices Serving 10 Counties in Northern 76 Branch Offices Serving 10 Counties in Northern and Central New Jersey and Central New Jersey Preserving Franchise Value |
 13 Significant Presence in Great Markets • • 81% of our deposits are in 4 counties with strong 81% of our deposits are in 4 counties with strong and growing demographics and growing demographics – Middlesex – Hudson – Essex – Monmouth • • Together they comprise one-third of all Together they comprise one-third of all households in New Jersey* households in New Jersey* • • Provident is in Top-10 deposit market share rank Provident is in Top-10 deposit market share rank for each county* for each county* * Source: SNL Financial * Source: SNL Financial |
 14 Deposit Market Share and Growth Potential * Source: SNL Financial/ESRI Source: SNL Financial as per FDIC/SOD at 6/30/05. Data is pro-forma for pending mergers and excludes brokerage/institutional deposits. 2005 Median Household Income ($)* Projected Growth 2005 - 2010 (%)* Middlesex 69,256 13.68 Hudson 45,460 13.16 Essex 51,622 16.65 Monmouth 74,867 15.84 NJ State Median 59,545 14.29 U.S. National Median 49,747 17.36 Middlesex Hudson Essex Monmouth New Jersey Provident Deposit Market Share Rank* # 10 of 149 Institutions # 5 of 45 Institutions # 3 of 31 Institutions # 10 of 32 Institutions # 10 of 30 Institutions |
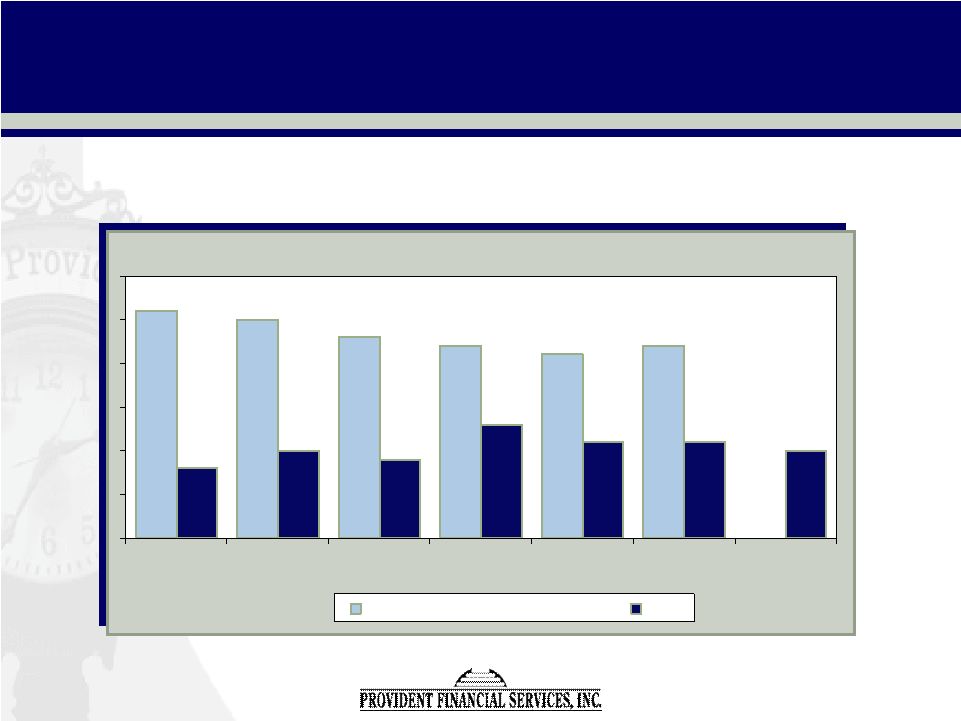 15 Industry-leading Performance Industry-leading Performance Non-performing Assets as a % of Total Assets 0.26% 0.25% 0.23% 0.22% 0.21% 0.22% 0.10% 0.11% 0.11% 0.13% 0.09% 0.10% 0.08% 3Q04 4Q04 1Q05 2Q05 3Q05 4Q05 1Q06 Mid-Atlantic Banks & Thrifts PFS Asset Quality Maintenance |
 16 • • Completed first program 4th Quarter 2004: Completed first program 4th Quarter 2004: – approximately 4.0 million shares repurchased • • Completed second program 3rd Quarter 2005: Completed second program 3rd Quarter 2005: – approximately 3.7 million shares repurchased • • Third program authorized July, 2005: Third program authorized July, 2005: – approximately 3.6 million shares authorized for repurchase – approximately 1.1 million shares left for repurchase as of March 31, 2006 • • Fourth program authorized April, 2006: Fourth program authorized April, 2006: – approximately 3.4 million shares authorized for repurchase • • 12.8% of issued and outstanding shares 12.8% of issued and outstanding shares repurchased since IPO repurchased since IPO Capital Management --Share Repurchase |
 17 Stockholder Value via steady Cash Dividend Increases Stockholder Value via steady Cash Dividend Increases Cash Dividend Declared $0.04 $0.05 $0.06 $0.07 $0.08 $0.09 $0.10 Apr-03 July-03 Jan-04 Jan-05 Apr-05 Oct-05 Apr-06 Current Dividend Yield = 2.22% (based on 4/21/06 share price of $18.01) Capital Management --Cash Dividends |
 18 • • New branch openings curtailed during 2005 New branch openings curtailed during 2005 – few in-market opportunities with favorable pricing – First Sentinel acquisition, completed July, 2004, added 22 branches to our network – efforts concentrated on optimizing those opportunities – consolidated 2 underperforming branches in September, 2005 – Ongoing review of substandard branches • • Continue to seek out acquisition opportunities Continue to seek out acquisition opportunities – focus on existing footprint and contiguous markets – remain rational in evaluating potential transactions – must add long-term stockholder value Disciplined Approach to Market Expansion |
 19 Financial Highlights Financial Highlights 1 1 st Quarter 2006 Quarter 2006 Linda A. Niro Linda A. Niro Senior Vice President & Senior Vice President & Chief Financial Officer Chief Financial Officer |
 20 Financial Highlights (Dollars in thousands) INCOME STATEMENT: 3/31/06 3/31/05 Net income $13,802 $15,022 Diluted earnings per share $0.22 $0.22 Return on equity 5.22% 5.41% Return on assets 0.94% 0.96% Net interest margin 3.31% 3.38% Efficiency ratio 59.56% 58.83% |
 21 (Dollars in thousands) BALANCE SHEET: 3/31/06 12/31/05 Total assets $5,948,254 $6,052,374 Total loans $3,731,348 $3,739,122 Total deposits $3,924,735 $3,921,458 Total investments $1,450,687 $1,537,665 Total borrowings $901,560 $996,552 Total stockholders' equity $1,066,927 $1,076,295 Financial Highlights |
 22 Comparative Yield Curve 4.89% 4.88% 4.90% 5.00% 5.08% 4.90% 4.74% 4.75% 1.00% 4.51% 3.62% 2.77% 2.32% 1.15% 0.96% 5.28% 0.00% 1.00% 2.00% 3.00% 4.00% 5.00% 6.00% FF 3 mo 6 mo 2 yr. 3 yr. 5 yr. 10 yr. 30 yr. Current Yield Curve Yield Curve @ 4/30/04 |
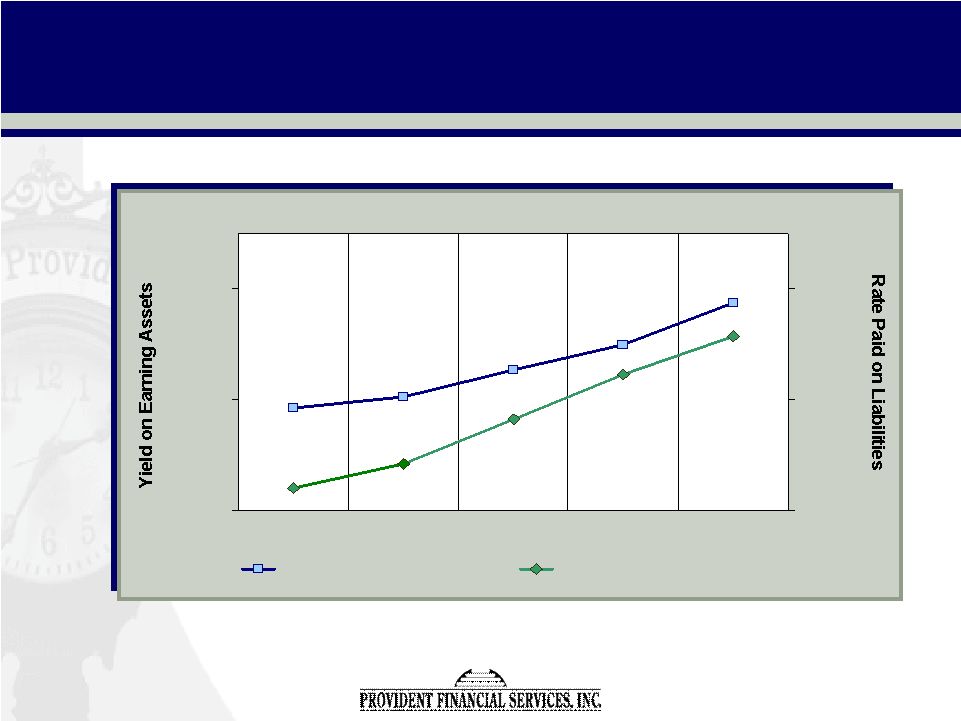 23 Net Interest Rate Spread 4.60% 5.00% 5.40% Mar-05 Jun-05 Sep-05 Dec-05 Mar-06 1.80% 2.20% 2.60% Yield on Earning Assets Rate Paid on Liabilities Spread 3.09% Spread 2.92% Spread 3.04% Spread 2.98% Spread 2.91% |
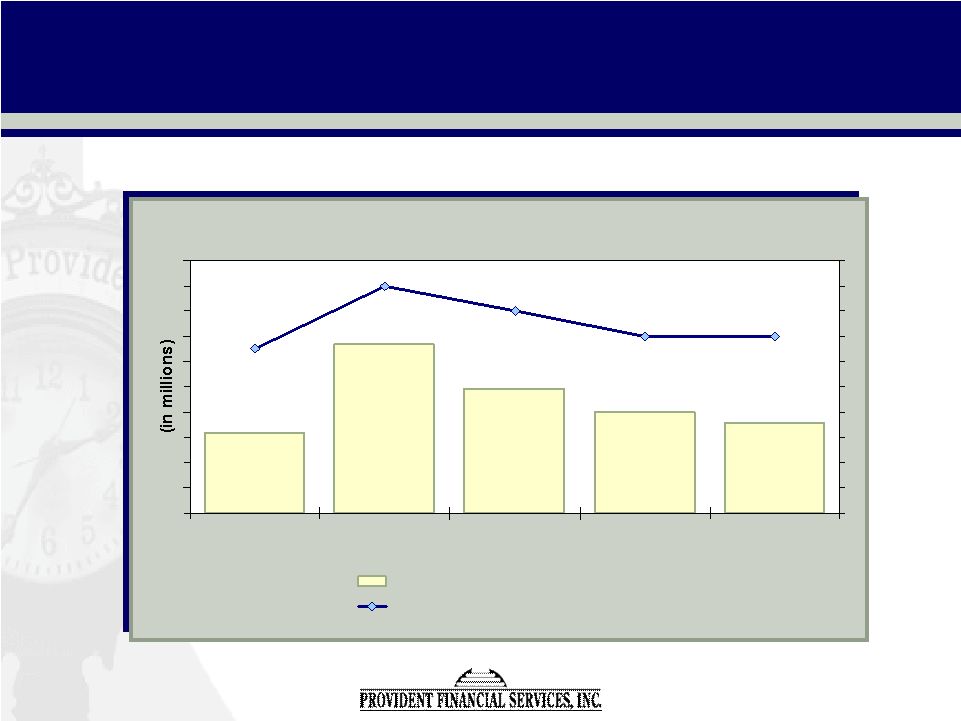
 24 Net Interest Rate Margin 3.31% 3.27% 3.31% 3.34% 3.38% 3.20% 3.25% 3.30% 3.35% 3.40% 3.45% 3.50% Mar-05 Jun-05 Sep-05 Dec-05 Mar-06 $40 $41 $42 $43 $44 $45 $46 $47 $48 $49 $50 Net Interest Income Net Interest Rate Margin Net Int. Rate Margin Net Int. Income |
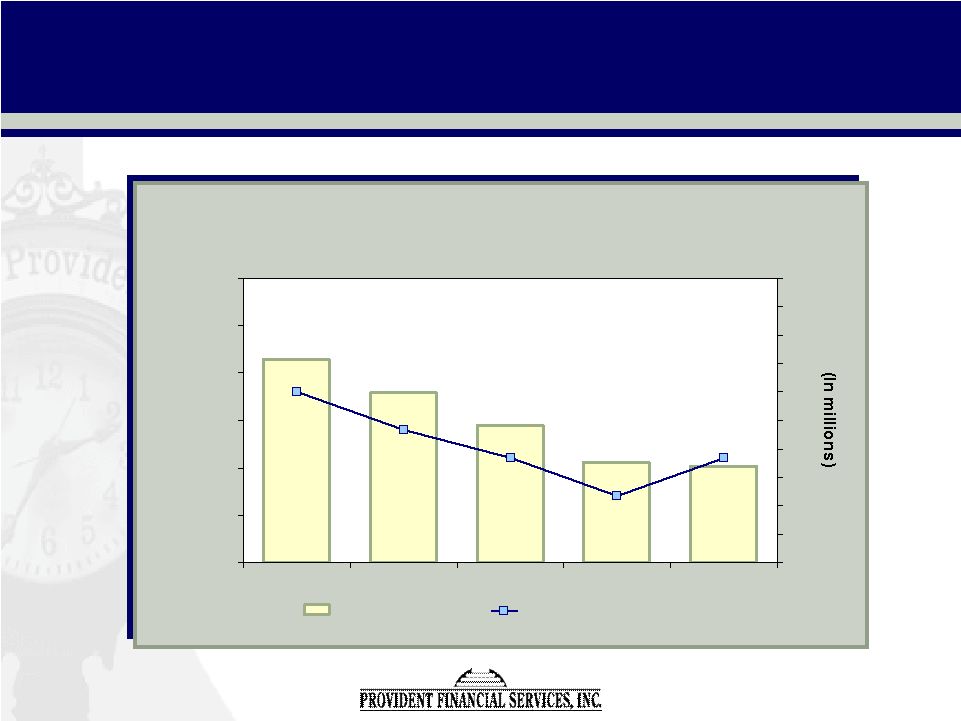
 25 $5,790 $6,005 $7,345 $5,590 $6,465 0.16% 0.16% 0.18% 0.20% 0.15% Mar-05 Jun-05 Sep-05 Dec-05 Mar-06 Non-Performing Loans Non-Performing Loans/Total Loans Asset Quality |
 26 • Positioned to take advantage of return to normalized yield curve • Anticipate increased new branch activity in conjunction with branch rationalization • Redoubling efforts to expand small-business customer relationships • Ongoing expense management • Ongoing asset quality maintenance Looking Ahead |
 27 OUR MISSION Our mission is to consistently provide superior value to our stockholders by achieving strong financial performance to our customers by delivering high quality financial solutions that help improve and enrich their lives to our employees by maintaining a challenging and rewarding work environment to our communities by committing our personal energies and financial resources and by exemplifying outstanding leadership. We will achieve this while holding ourselves to the highest standards of personal and professional integrity. |