 October 16, 2006 Strategic Expansion into Highly Attractive Morris County Exhibit 99.2 |
 2 Forward Looking Statements This presentation contains forward-looking statements within the meaning of the Private Securities Litigation Reform Act of 1995. These forward-looking statements include, but are not limited to, statements about (i) the benefits of the merger between Provident Financial Services, Inc. ("Provident" or “PFS”) and First Morris Bank & Trust (“First Morris” or “FMJE”), including future financial and operating results, cost savings and accretion to reported earnings that may be realized from the merger; (ii) Provident’s and First Morris' plans, objectives, expectations and intentions and other statements contained in this presentation that are not historical facts; and (iii) other statements identified by words such as “expects,” “anticipates,” “intends,” “plans,” “believes,” “seeks,” “estimates” or words of similar meaning. These forward-looking statements are based upon the current beliefs and expectations of Provident’s and First Morris' management and are inherently subject to significant business, economic and competitive uncertainties and contingencies, many of which are beyond our control. In addition, these forward-looking statements are subject to assumptions with respect to future business strategies and decisions that are subject to change. Actual results may differ materially from the anticipated results discussed in these forward-looking statements. The following factors, among others, could cause actual results to differ materially from the anticipated results or other expectations expressed in the forward-looking statements: (1) the businesses of Provident and First Morris may not be combined successfully, or such combination may take longer to accomplish than expected; (2) the cost savings from the merger may not be fully realized or may take longer to realize than expected; (3) operating costs, customer loss and business disruption following the merger, including adverse effects on relationships with employees, may be greater than expected; (4) governmental approvals of the merger may not be obtained, or adverse regulatory conditions may be imposed in connection with governmental approvals of the merger; (5) the stockholders of First Morris may fail to approve the merger; (6) adverse governmental or regulatory policies may be enacted; (7) the interest rate environment may further compress margins and adversely affect net interest income; (8) the risks associated with continued diversification of assets and adverse changes to credit quality; (9) difficulties associated with achieving expected future financial results; (10) competition from other financial services companies in Provident’s and First Morris' markets; (11) the risk of an economic slowdown that would adversely affect credit quality and loan originations. Additional factors that could cause actual results to differ materially from those expressed in the forward-looking statements are discussed in Provident’s reports (such as the Annual Report on Form 10-K, Quarterly Reports on Form 10-Q and Current Reports on Form 8-K) filed with the Securities and Exchange Commission and available at the SEC’s Internet site (http://www.sec.gov). All subsequent written and oral forward-looking statements concerning the proposed transaction or other matters attributable to Provident or First Morris or any person acting on their behalf are expressly qualified in their entirety by the cautionary statements above. Except as required by law, Provident and First Morris do not undertake any obligation to update any forward-looking statement to reflect circumstances or events that occur after the date the forward-looking statement is made. |
 3 Additional Information Provident will file with the Securities and Exchange Commission (SEC) a registration statement, a prospectus that will also serve as the proxy statement for the vote of the stockholders of First Morris, and other relevant documents concerning the proposed transaction. Stockholders of First Morris are urged to read the registration statement and the prospectus when it becomes available and any other relevant documents filed with the SEC, as well as any amendments or supplements to those documents, because they will contain important information. You will be able to obtain a free copy of the prospectus, as well as other filings containing information about Provident at the SEC’s Internet site (http://www.sec.gov). Copies of the prospectus and the SEC filings that will be incorporated by reference in the prospectus can be obtained, without charge, by directing a request to John F. Kuntz, General Counsel, Provident Financial Services, Inc., 830 Bergen Avenue, Jersey City, NJ 07306, tel: (201) 333-1000. |
 4 Summary of Significant Terms Complete Due Diligence: FMJE’s 60.2% loan to deposit ratio provides opportunity to substitute higher yielding loans for lower yielding securities Potential Revenue From Incremental Lending Synergies: Fixed at 2.1337 Provident shares for each FMJE share Exchange Ratio: $4 million (3.2% of aggregate transaction value) Termination Fee: Tax-free exchange with election mechanism Transaction Structure: Limited price-based walk-away subject to top-up right Walk-Away: 39% of FMJE’s expenses Estimated Cost Savings: $124.1 million Transaction Value: 50% stock / 50% cash Consideration: $39.75 Purchase Price per Share: |
 5 Summary of Significant Terms (Continued) 1 Quarter 2007 Expected Close: Provident to form an advisory board to include all current FMJE directors Provident has agreed to add one member of FMJE’s current board to its board in 2007 Director Matters: FMJE shareholders Customary regulatory approvals Required Approvals: All FMJE directors (representing 34% of outstanding stock) have entered into voting agreements to vote their shares in favor of the transaction Director Lock-Up: st |
 6 Source: Implied multiples based on FMJE financial data per FMJE management, as adjusted per PFS management. Cost savings / synergies estimates per PFS management. Implied premiums for selected transactions based on closing price on trading day prior to deal announcement. (a) Transactions announced since 1/1/2004 in which seller was a New Jersey depository and deal value was between $50 million and $250 million. (b) Assumes FMJE loans / deposits reaches PFS’s current level of 95.9% by 2009. Fully phased-in income impact assumed. (c) Assumes 39% cost savings / synergies (tax effected at 35.0%) based on FMJE’s projected 2007 operating expenses of $14.3 million; fully phased-in impact assumed. (d) Core deposits defined as total deposits less CDs > $100,000. Transaction Pricing and Comparables TRANSACTION MULTIPLES SUMMARY Implied Per Share Value of Consideration $39.75 Aggregate Transaction Value $124.1 million Premium to Market on 10/13/06 20.9% 31.2% Price / 2007 Projected EPS 30.3 25.2 Price / 2007 Projected EPS + Asset Substitution Synergy (b) 20.5 -- Price / 2007 Projected EPS + Cost Savings (c) 16.2 -- Price / 2007 Projected EPS + Asset Substitution Synergy (b) + Cost Savings (c) 12.9 -- Price / Book Value 3.25 3.09 Price / Tangible Book Value 3.27 3.09 Premium to Core Deposits (d) 18.7% 20.0% Selected Transactions (a) PFS - FMJE |
 7 Accretive to both GAAP and Cash EPS without assumed asset substitution Double digit internal rate of return without assumed asset substitution FMJE present efficiency ratio of 76.1% Estimated cost savings of 39% of FMJE’s annualized core operating expenses FMJE’s low loan to deposit ratio (60.2%) provides opportunity to leverage excess deposits – $2 million in potential additional earnings from future asset substitution Significantly expands Provident’s presence in demographically attractive Morris County Market Moves Provident from 26 to 8 position with a 4.5% market share in one of New Jersey’s best banking markets Enhances Provident’s organic growth profile Commercial / CRE orientation of loan portfolio continues Provident’s transition to a more commercial-like balance sheet Opportunity for Significant Cost Savings / Synergies Compelling Transaction Economics Franchise Enhancing Transaction Rationale th th |
 8 Cash portion of consideration to be funded from cash and low-yielding short- term securities Strong pro forma tangible common equity ratio of 9.6% will support continued share repurchases, de novo expansion and accretive franchise- enhancing acquisitions FMJE’s assets equate to less than 10% of the pro forma Company’s asset base Straightforward transparent operations No branch closings anticipated – Minimizes customer disruption – Substantially all employees with customer interaction remain in place FMJE has exceptionally strong asset quality – Net chargeoffs have been negligible since 2000 Effective Deployment of Conversion Proceeds Manageable Execution Risk Transaction Rationale |
 9 NPAs / Assets: 0.0%; Reserves / Loans: 0.98%; YTD NCOs / Average Loans: 0.04% Recently restructured securities portfolio and selective expense savings initiatives – $1.1 million one-time charge in the first half of 2006 – Marketing budget to be reduced to more normalized run rate – Increased infrastructure costs to decline in 2007 – Net interest margin and earnings are expected to improve as a result of recent restructuring and expense reduction initiatives – Baseline projections assume only a 0.72% ROA in 2007 for FMJE vs. 0.86% for its peers (a) FMJE ranks #9 in deposit market share in Morris County with a 4.3% share FMJE is the largest independent community bank in the market $571 million in assets $312 million in loans, 74% commercial RE, C&I and consumer $518 million in deposits, 69% non-CDs 60.2% loans / deposits ratio 9 branches in Morris County Market Position Attractive Community Banking Branches FMJE At-a-Glance FMJE’s operations are an excellent strategic fit with Provident Improving Profitability Pristine Asset Quality Note: Deposit data as of 6/30/2005. (a) Peer group consists of select public banks in New Jersey with assets between $300 million and $1.1 billion. |
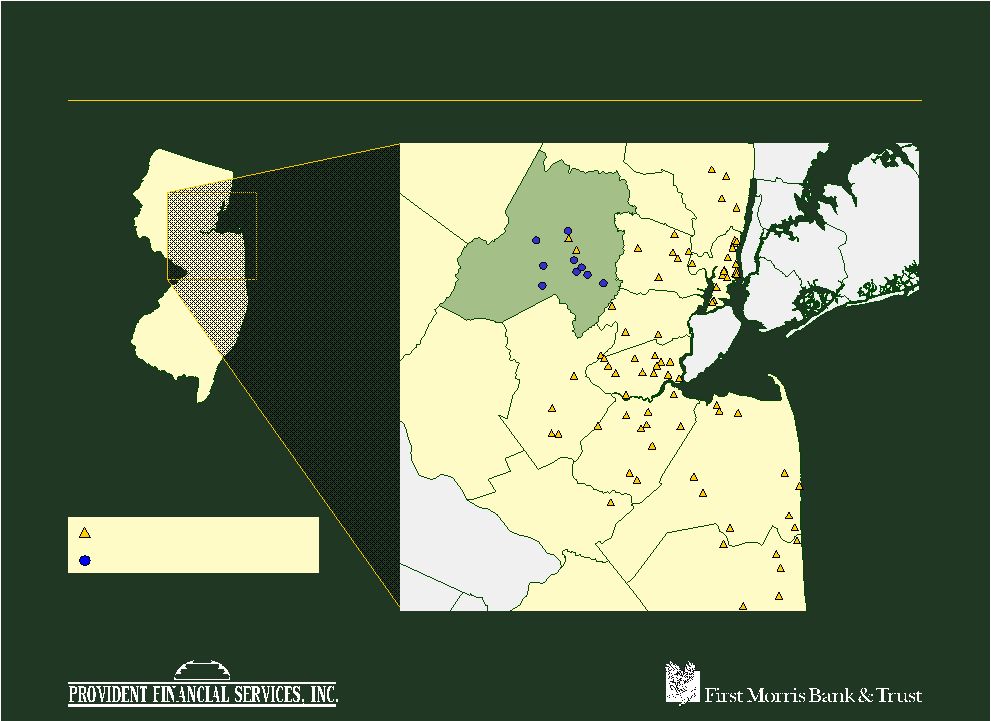   10 Strong Mature Franchise in Affluent Morris County Source: SNL Financial. Overview First Morris Bank & Trust Provident Financial Services Richmond Westchester New York Warren Sussex Montgomery Philadelphia Bucks Burlington Passaic Morris Bergen Somerset Middlesex Monmouth Ocean Essex Hudson Hunterdon Mercer Union Bronx Kings Nassau Queens |
 11 Overview Morris County, NJ – Deposit Market Share Source: SNL Financial. Note: Deposit data as of 6/30/2005. ($ in millions) Total Total Percent of Total Total Percent of Branch Deposits Market Parent Branch Deposits Market Parent Rank Institution Count in Market Share Deposits Rank Institution Count in Market Share Deposits 1 JPMorgan Chase & Co. (NY) 27 $1,692 14.4% 0.4% 18 Columbia Savings Bank M.H.C. (NJ) 2 $140 1.2% 6.1% 2 Bank of America Corp. (NC) 27 1,419 12.0 0.2 19 Kearny Financial Corp (MHC) (NJ) 2 87 0.7 5.7 3 Hudson City Bancorp Inc. (NJ) 9 1,381 11.7 10.4 20 Somerset Hills Bancorp (NJ) 2 67 0.6 36.5 4 Wachovia Corp. (NC) 19 1,163 9.9 0.3 21 Lincoln Park Bancorp (MHC) (NJ) 1 56 0.5 100.0 5 PNC Financial Services Group (PA) 22 1,009 8.6 1.8 22 NJ Manufacturers Ins Co. (NJ) 1 48 0.4 19.6 6 Commerce Bancorp Inc. (NJ) 13 895 7.6 2.9 23 TD Banknorth Inc. (ME) 3 41 0.4 0.2 7 Valley National Bancorp (NJ) 19 760 6.5 8.8 24 Boiling Springs MHC (NJ) 1 38 0.3 4.0 PRO FORMA COMPANY 11 535 4.5 11.9 25 Stewardship Financial Corp. (NJ) 2 37 0.3 9.3 8 Sovereign Bancorp Inc. (PA) 11 527 4.5 1.1 26 Provident Financial Services, Inc. (NJ) 2 34 0.3 0.8 9 First Morris Bank & Trust (NJ) 9 501 4.3 100.0 27 Gibraltar Savings Bank FSB (NJ) 2 31 0.3 59.5 10 Lakeland Bancorp (NJ) 10 444 3.8 26.5 28 Greater Community Bancorp (NJ) 2 25 0.2 3.5 11 Peapack-Gladstone Financial (NJ) 7 314 2.7 31.4 29 Charles Schwab Corp. (CA) 1 17 0.1 0.1 12 Investors Bancorp Inc. (MHC) (NJ) 7 261 2.2 8.0 30 Hilltop Community Bancorp Inc. (NJ) 1 10 0.1 6.9 13 Fulton Financial Corp. (PA) 5 169 1.4 1.7 31 Bank of New York Co. (NY) 1 5 0.1 0.0 14 Washington Mutual Inc. (WA) 6 164 1.4 0.1 32 GSL Savings Bank (NJ) 1 5 0.0 5.5 15 Capital One Financial Corp. (VA) 6 154 1.3 0.2 33 Synergy Finl Group Inc. (NJ) 1 4 0.0 0.7 16 Center Bancorp Inc. (NJ) 4 152 1.3 20.5 34 Heritage Community Bk (NJ) 1 0 0.0 0.0 17 MSB Financial, MHC (NJ) 1 142 1.2 71.7 34 HSBC Holdings plc 2 0 0.0 0.0 Totals 228 11,793 100.0 |
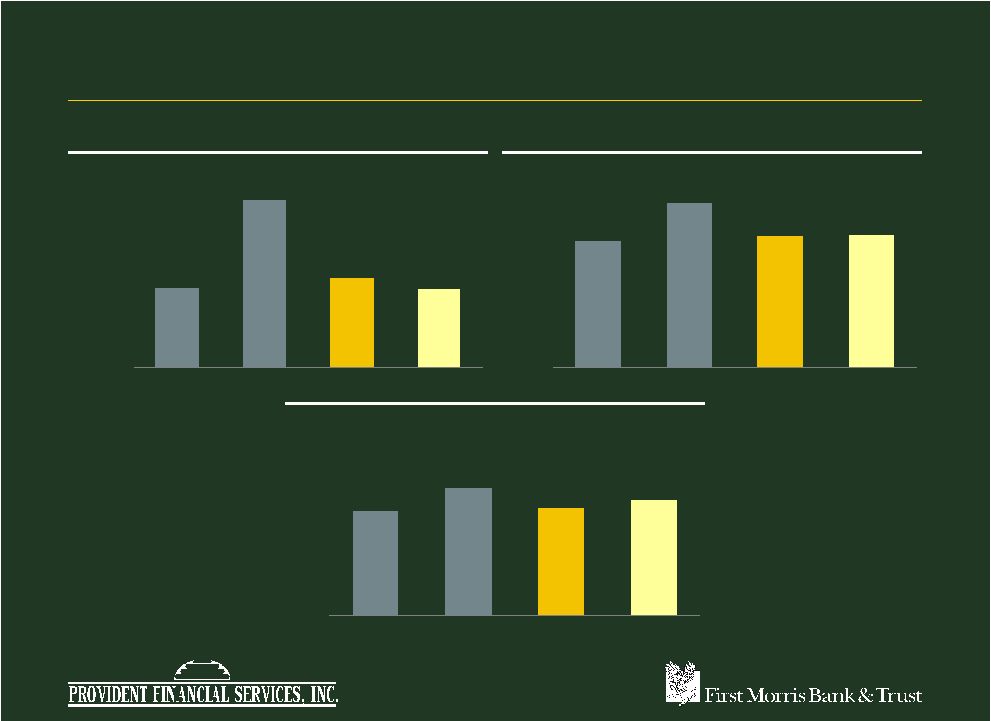 12 MEDIAN HOUSEHOLD INCOME (2006) PROJECTED HOUSEHOLD INCOME GROWTH (2006 – 2011) PROJECTED POPULATION GROWTH (2006 – 2011) Demographics Profile Source: SNL Financial. $66,945 $96,965 $70,268 $66,848 40,000 60,000 80,000 $100,000 Provident First Morris Pro Forma NJ 16.7% 19.2% 16.9% 17.1% 8.0 12.0 16.0 20.0% Provident First Morris Pro Forma NJ 3.6% 4.3% 3.7% 3.9% 0.0 2.0 4.0 6.0% Provident First Morris Pro Forma NJ Overview |
 13 Realistic and Achievable Cost Savings ($ in millions) Projected Fully Sources of Cost Savings Phased-In (%) Salaries, Benefits and Personnel $3.3 60% Occupancy & Equipment $0.3 6% Insurance, Legal & Regulatory $0.4 8% Other $1.4 26% Total Cost Savings (Pre-tax) $5.5 100% Total Cost Savings (After-tax) $3.6 Percent of FMJE's 2007 Expense Base 39% |
 14 FMJE’s low loan to deposit ratio (60.2%) produces the potential to leverage excess deposits Ability to significantly increase earnings through asset substitution – Potential incremental lending opportunity based on Provident’s 95% loan to deposit ratio • Approximately $200 million in loans may be substituted for lower yielding assets – Total spread between Provident’s yield on loans and FMJE’s yield on securities adjusted for incremental loan loss equates to 1.5% – Three-year ramp up, approximately $650,000 after-tax per year at the margin, $2.0 million fully phased in Potential Revenue from Asset Substitution |
 15 Anticipated Integration / Restructuring Costs ($ in millions) Pre-Tax Integration Charges ($) (%) Professional fees $2.2 21% Employee-related expenses $3.9 36% Systems integration $3.9 37% Customer communications / Marketing expense $0.7 6% Total Pre-Tax Integration Charges $10.8 100% Total after-tax cost of $7.8 million, $6.9 million capitalized and $0.8 million expensed Includes significant termination fee related to recently renewed FISERV core processing contract ($2.4 million) |
 16 Pro Forma Impact – Assumptions FMJE earnings based on FMJE projections as adjusted by Provident, grown at 10% per annum thereafter Provident earnings based on IBES median 2007 estimate, grown at 10% per annum thereafter Assumes estimated cost savings equivalent to 39% of FMJE expense base. Cost savings are phased in 56% in 2007 and 100% thereafter Assumes a 5% pre-tax opportunity cost of cash Core deposit intangibles equal to 3% of FMJE non-CDs amortized over 10 years (sum of the year digits) Reflects charge of $7.8 million after-tax, $6.9 million capitalized and $0.8 million expensed in the first year Case has been run with and without estimated impact of asset substitution. No other revenue enhancements have been assumed Assumes no incremental share repurchases Closing on March 31, 2007 |
 17 Pro Forma Financial Impact Breakeven to GAAP EPS in 2007 and accretive to GAAP EPS in 2008 while being accretive to Cash EPS in both years without the benefit of incremental lending revenue from potential asset substitution Double-digit internal rate of return without the benefit of incremental lending revenue from potential asset substitution Estimated pro forma capital ratio of 9.6% |
 18 Summary Adds highly attractive franchise in one of New Jersey’s best banking markets Opportunity for significant cost savings Potential for significant revenue from incremental lending to better leverage FMJE’s deposit base Accretive to GAAP and Cash EPS with solid internal rate of return Continued effective deployment of conversion proceeds Consistent with Provident’s expansion strategy |
 Strategic Expansion into Highly Attractive Morris County |