     2007 Annual Meeting 2007 Annual Meeting of Stockholders of Stockholders April 25, 2007 April 25, 2007 Focused on Long-term Stockholder Value Focused on Long-term Stockholder Value 1 Exhibit 99.1 |
     2 Certain statements contained herein are "forward-looking statements" within the meaning of Section 27A of the Securities Act of 1933 and Section 21E of the Securities Exchange Act of 1934. Such forward-looking statements may be identified by reference to a future period or periods, or by the use of forward- looking terminology, such as "may," "will," "believe," "expect," "estimate," "anticipate," "continue," or similar terms or variations on those terms, or the negative of those terms. Forward-looking statements are subject to numerous risks and uncertainties, including, but not limited to, those related to the economic environment, particularly in the market areas in which Provident Financial Services, Inc. (the “Company”) operates, competitive products and pricing, fiscal and monetary policies of the U.S. Government, changes in government regulations affecting financial institutions, including regulatory fees and capital requirements, changes in prevailing interest rates, acquisitions and the integration of acquired businesses, credit risk management, asset-liability management, the financial and securities markets and the availability of and costs associated with sources of liquidity. The Company wishes to caution readers not to place undue reliance on any such forward-looking statements, which speak only as of the date made. The Company wishes to advise readers that the factors listed above could affect the Company's financial performance and could cause the Company's actual results for future periods to differ materially from any opinions or statements expressed with respect to future periods in any current statements. The Company does not undertake and specifically declines any obligation to publicly release the result of any revisions which may be made to any forward-looking statements to reflect events or circumstances after the date of such statements or to reflect the occurrence of anticipated or unanticipated events. Forward Looking Statements Forward Looking Statements Focused on Long-term Stockholder Value Focused on Long-term Stockholder Value |
     3 Company Profile (as of 3/31/07) NYSE Symbol: PFS Assets: $5.7 billion Market Capitalization: $1.1 billion Market Presence Market Presence: 4 th Largest Bank Headquartered in New Jersey * Primary Market Area: Northern and Central Region Focused on Long-term Stockholder Value Focused on Long-term Stockholder Value *Source: SNL Financial as per FDIC/SOD at 6/30/06 |
     4 Financial Highlights Focused on Long-term Stockholder Value Focused on Long-term Stockholder Value (Dollars in thousands) INCOME STATEMENT: 3/31/07 3/31/06 Net income $10,808 $13,802 Diluted earnings per share $0.18 $0.22 Return on equity (annualized) 4.32% 5.22% Return on assets (annualized) 0.77% 0.94% Net interest margin 3.02% 3.31% Efficiency ratio 65.18% 59.56% |
     5 Financial Highlights Focused on Long-term Stockholder Value Focused on Long-term Stockholder Value (Dollars in thousands) BALANCE SHEET: 3/31/07 12/31/06 Total assets $5,696,033 $5,742,964 Total loans (gross) $3,765,204 $3,783,664 Total deposits $3,810,565 $3,826,463 Total investments $1,146,717 $1,215,885 Total borrowings $815,083 $840,990 Total stockholders' equity $1,015,449 $1,019,156 |
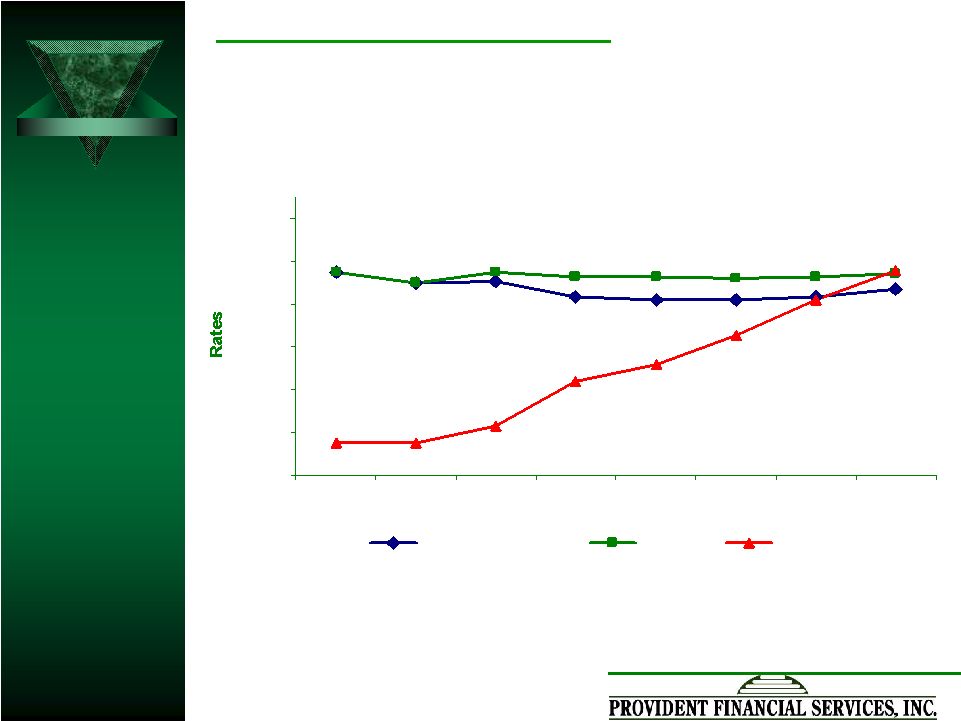     6 Comparative Yield Curve A Challenging Interest-Rate Environment A Challenging Interest-Rate Environment 5.25% 4.98% 5.04% 4.65% 4.59% 4.59% 4.67% 4.83% 5.14% 5.09% 5.12% 5.15% 5.23% 5.25% 4.98% 5.19% 3.77% 3.07% 2.68% 1.64% 1.26% 1.25% 4.58% 5.29% 0.50% 1.50% 2.50% 3.50% 4.50% 5.50% 6.50% FF 3 mo 6 mo 2 yr. 3 yr. 5 yr. 10 yr. 30 yr. Current 4/18/07 6/30/06 6/30/04 |
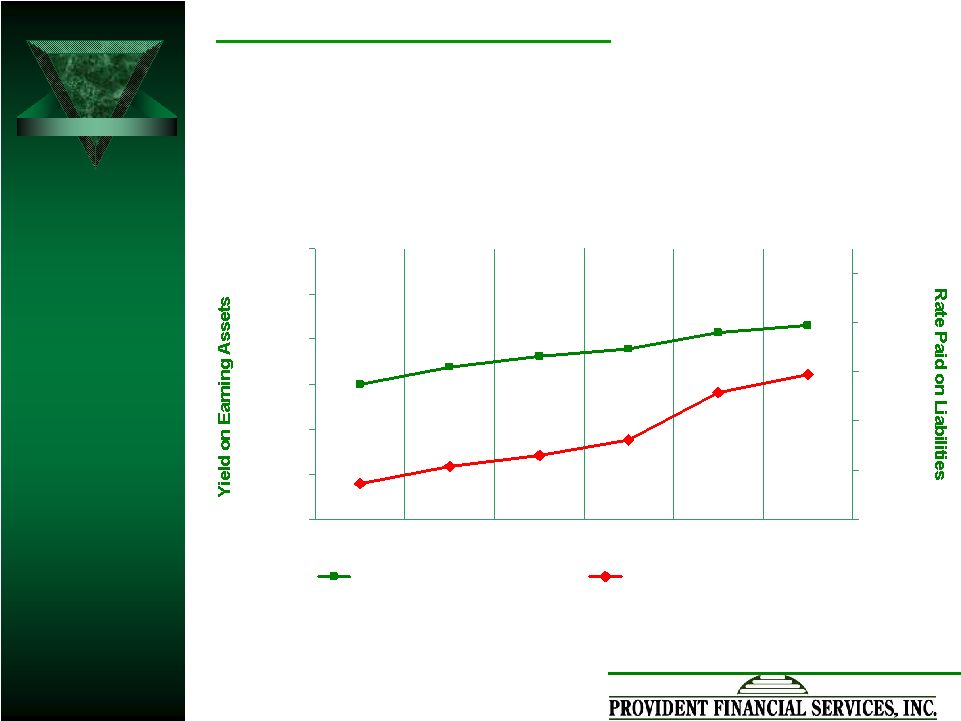     7 Net Interest Rate Spread 4.00% 4.40% 4.80% 5.20% 5.60% 6.00% 6.40% Dec-05 Mar-06 Jun-06 Sep-06 Dec-06 Mar-07 2.00% 2.40% 2.80% 3.20% 3.60% 4.00% Yield on Earning Assets Rate Paid on Liabilities Spread 2.92% Spread 2.91% Spread 2.93% Spread 2.87% Spread 2.63% Spread 2.54% A Challenging Interest-Rate Environment A Challenging Interest-Rate Environment Liability Costs have risen faster than Asset Yields |
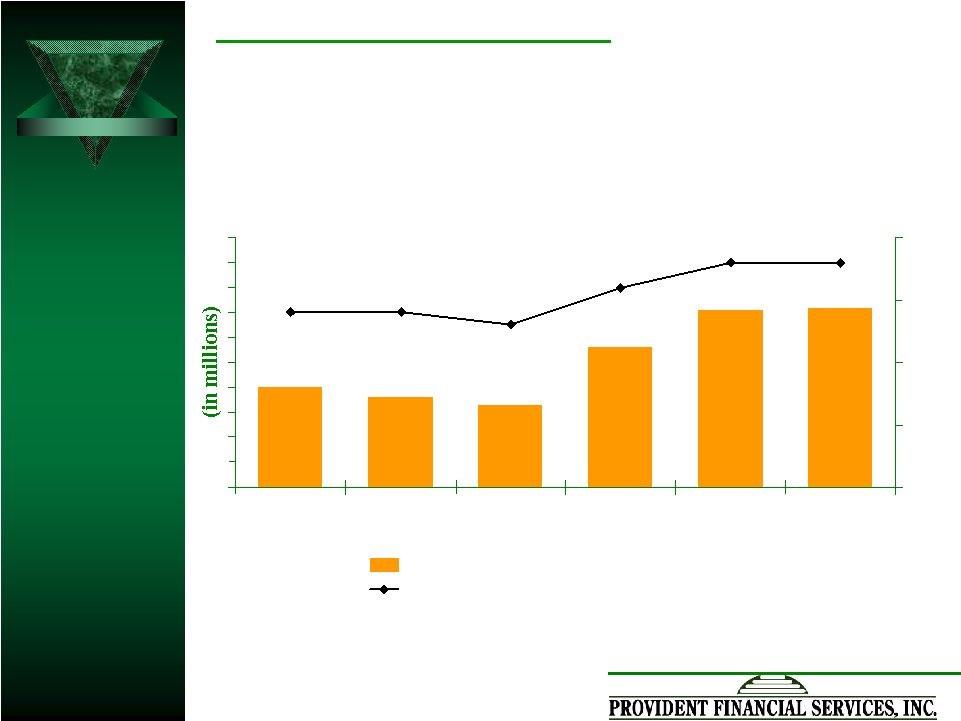
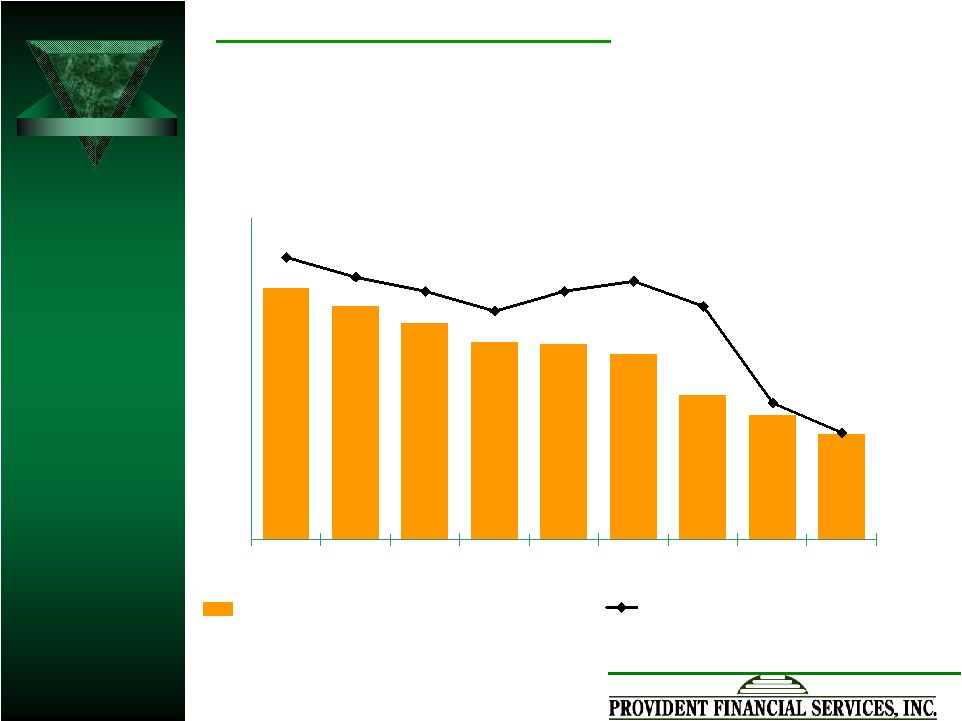     8 Net Interest Margin $37.3 $38.5 $47.2 $46.0 $44.8 $43.5 $43.4 $42.7 $39.9 3.02% 3.08% 3.34% 3.31% 3.38% 3.33% 3.28% 3.31% 3.27% 1Q05 2Q05 3Q05 4Q05 1Q06 2Q06 3Q06 4Q06 1Q07 Net Interest Income (in millions) Net Interest Margin (%) Strategic decision in late 2006 to preserve deposit market share via competitive rate offerings A Challenging Interest-Rate Environment A Challenging Interest-Rate Environment |
     9 Strategic Priorities Concentrate on the fundamentals of our business Core revenue drivers Balance sheet management Expense management Asset quality Capital management Build superior products, services and delivery channels for commercial, small-business and retail customers Expand the franchise in demographically attractive markets Focused on Clear Strategy and Effective Execution |
     10 Loan Portfolio Composition 12/31/04 Commercial Loans 35.6% Retail Loans 64.4% 3/31/07 Retail Loans 58.5% Commercial Loans 41.5% Building Commercial Loans as Key Interest- Earning Assets Focused on Fundamentals __________ Core Revenue Drivers 12/31/05 Commercial Loans 37.5% Retail Loans 62.5% |
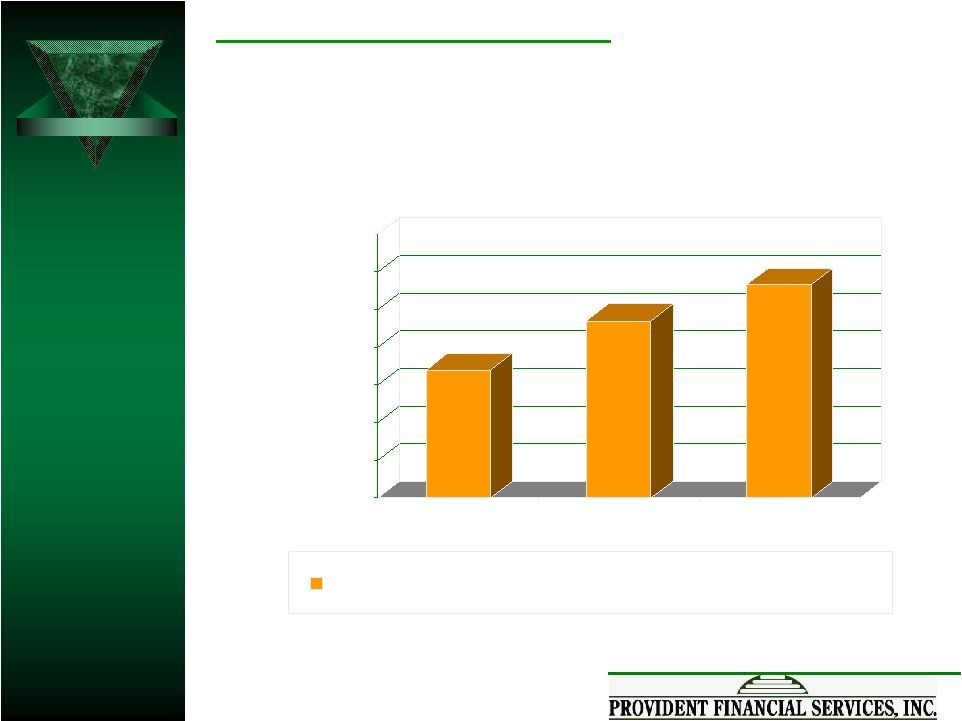
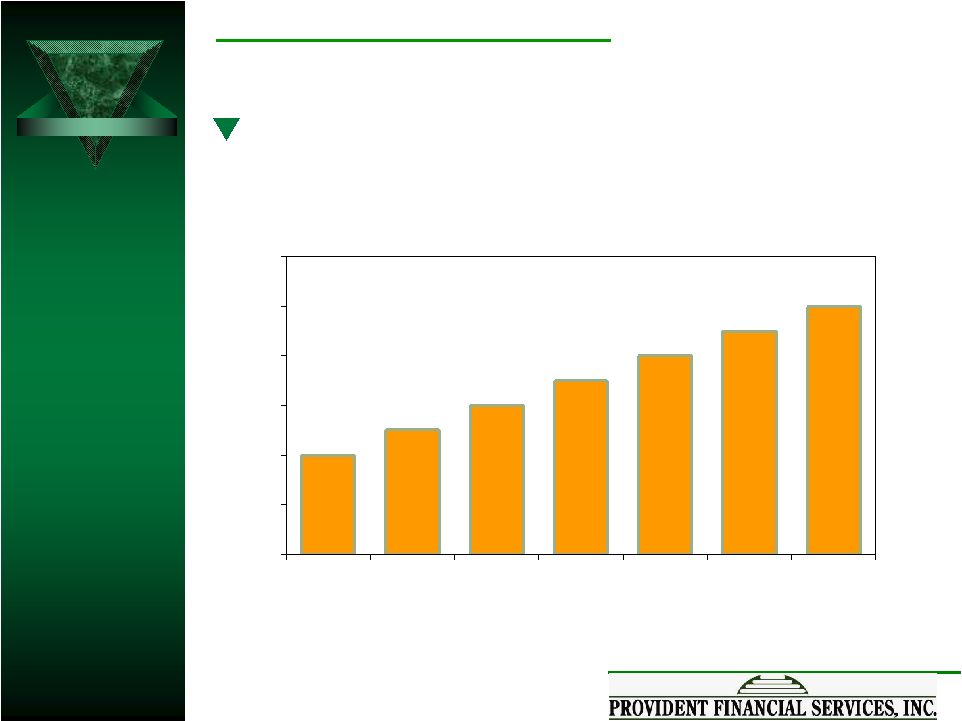
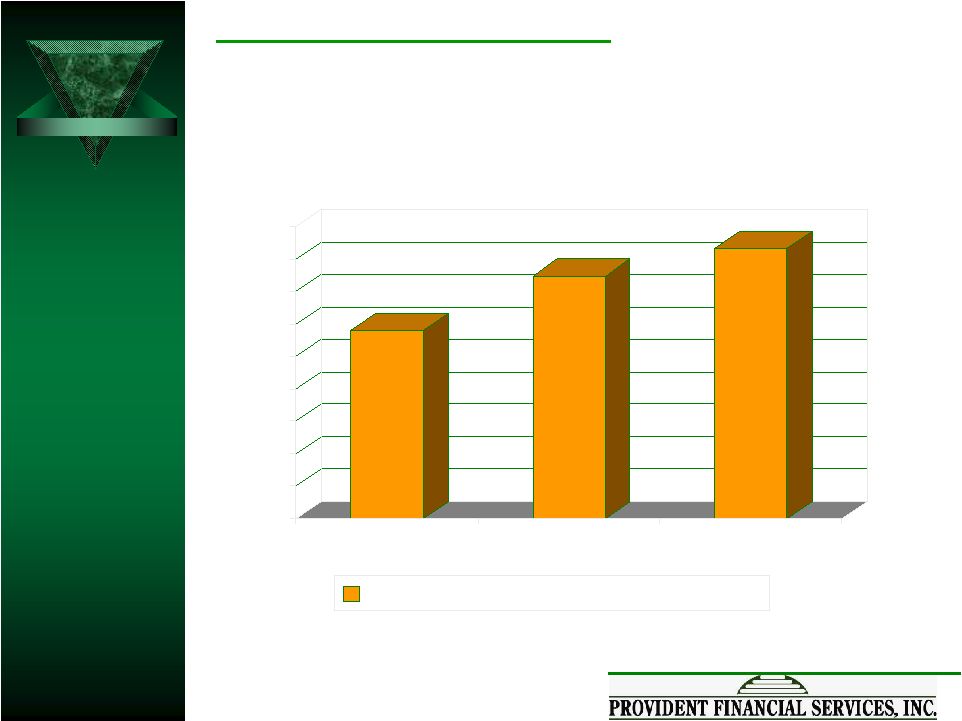     11 Focused on Fundamentals __________ Core Revenue Drivers $581.4 $748.3 $831.5 0 100 200 300 400 500 600 700 800 900 2004 2005 2006 Commercial Loan Originations Increasing Commercial Loan Originations $ in millions |
     12 Focused on Fundamentals __________ Core Revenue Drivers 12/31/04 Time Deposits 34.4% Savings, DDA, MMA 65.6% 3/31/07 Time Deposits 41.0% Savings, DDA, MMA 59.0% Deposit Mix Striving to Maintain Core Deposit Emphasis in a Challenging Environment 12/31/05 Savings, DDA, MMA 63.1% Time Deposits 37.9% |
     13 Focused on Fundamentals __________ Core Revenue Drivers 15.4% 16.7% 17.7% 12.0% 13.0% 14.0% 15.0% 16.0% 17.0% 18.0% 19.0% 3/31/05 3/31/06 3/31/07 Commercial & Municipal Deposits/Total Core Deposits Increasing Proportion of Core Commercial Deposits and Municipal Deposits |
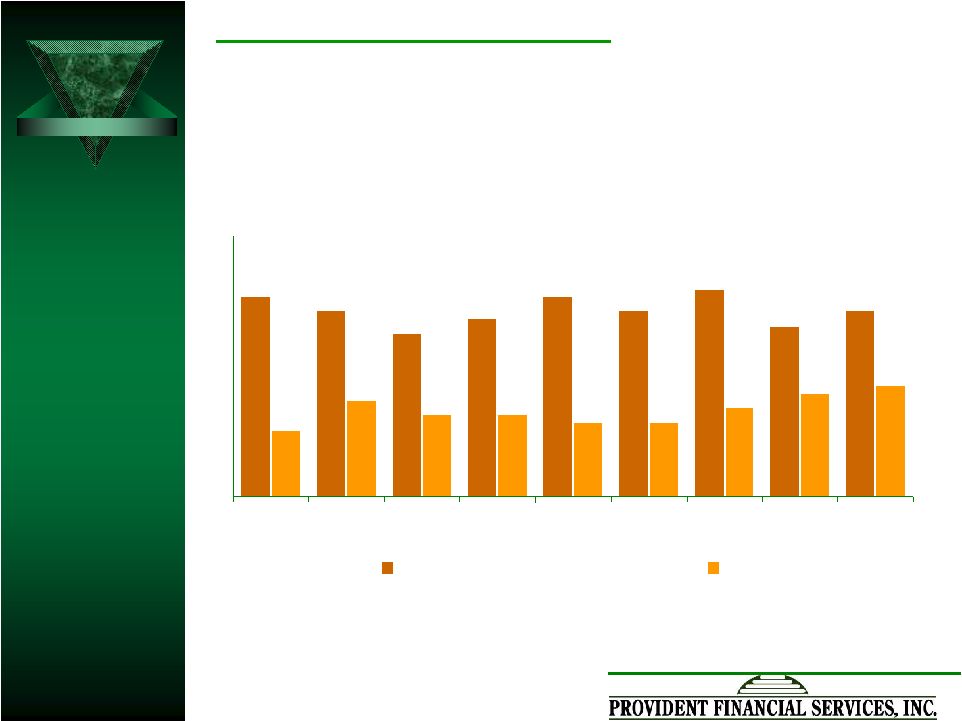
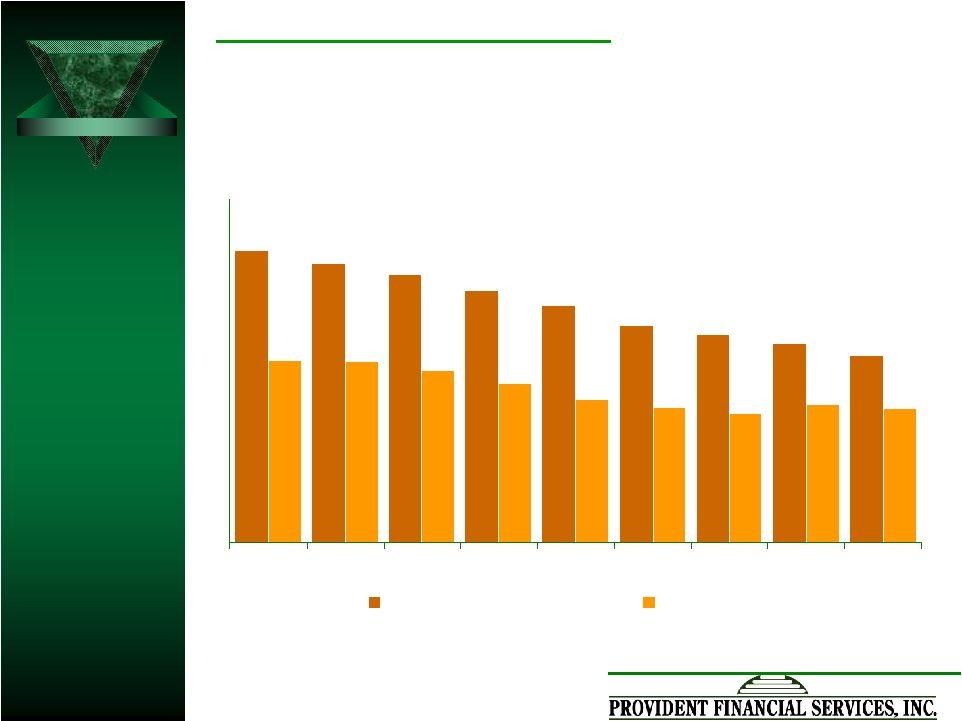     14 Continued Reduction in Investment Securities and Wholesale Borrowings to Manage Interest Rate Risk * Excludes Subordinated Debentures ($ in millions) $1,708 $1,635 $1,538 $1,451 $1,327 $1,270 $1,216 $1,147 $1,109 $1,100 $1,048 $970 $822 $784 $841 $1,782 $815 $875 1Q05 2Q05 3Q05 4Q05 1Q06 2Q06 3Q06 4Q06 1Q07 Investment Securities Borrowings* Focused on Fundamentals __________ Core Revenue Drivers |
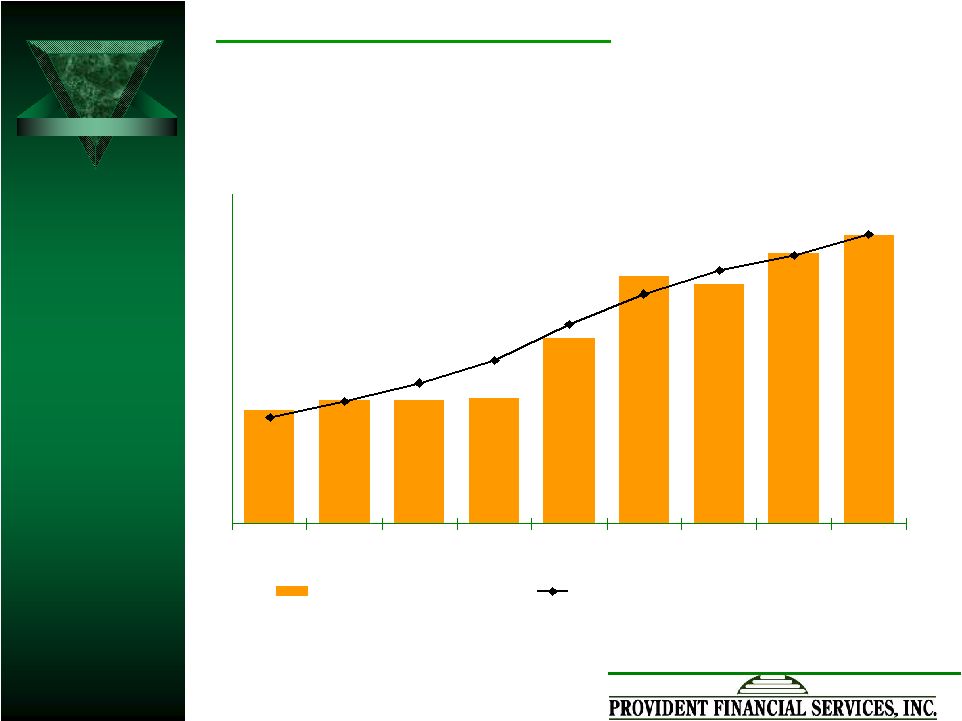     15 Focused on Fundamentals __________ Core Revenue Drivers Focus on Loan Growth to Drive Revenue $3,660 $3,660 $3,661 $3,690 $3,720 $3,716 $3,655 $3,732 $3,740 73.9% 66.7% 67.7% 68.9% 70.9% 72.6% 65.8% 74.7% 75.8% 1Q05 2Q05 3Q05 4Q05 1Q06 2Q06 3Q06 4Q06 1Q07 Avg Net Loans (in millions) Loans as a % of Avg Earning Assets |
     16 $31.4 $33.2 $30.0 $29.5 $30.2 $29.9 $30.1 $29.3 $28.0 898 893 874 892 895 913 915 877 881 1Q05 2Q05 3Q05 4Q05 1Q06 2Q06 3Q06 4Q06 1Q07 Non-Interest Expense (in millions) # of FTEs Includes $1.4 million voluntary resignation initiative Managing Overhead Costs to Drive Efficiency Focused on Fundamentals __________ Expense Management |
     17 Maintaining Efficiency Ratio in Line with Industry Peer Trends Focused on Fundamentals __________ Expense Management *Source: SNL Financial. Note: Mid-Atlantic Bank & Thrift data for 1Q07 is preliminary based on companies reporting as of 4/20/07. 63.7% 63.2% 64.1% 65.2% 65.8% 64.1% 63.8% 63.7% 64.1% 65.2% 59.0% 62.4% 59.9% 59.6% 57.7% 57.1% 62.1% 58.8% 56% 59% 62% 65% 68% 71% 74% 77% 1Q05 2Q05 3Q05 4Q05 1Q06 2Q06 3Q06 4Q06 1Q07 Mid-Atlantic Banks & Thrifts* PFS |
     18 $7,595 $5,662 $6,005 $5,790 $6,802 $7,549 0.20% 0.16% 0.16% 0.15% 0.18% 0.20% Dec-05 Mar-06 Jun-06 Sep-06 Dec-06 Mar-07 Non-Performing Loans Non-Performing Loans/Total Loans Continuing Adherence to Sound Credit Underwriting Standards Focused on Fundamentals __________ Asset Quality |
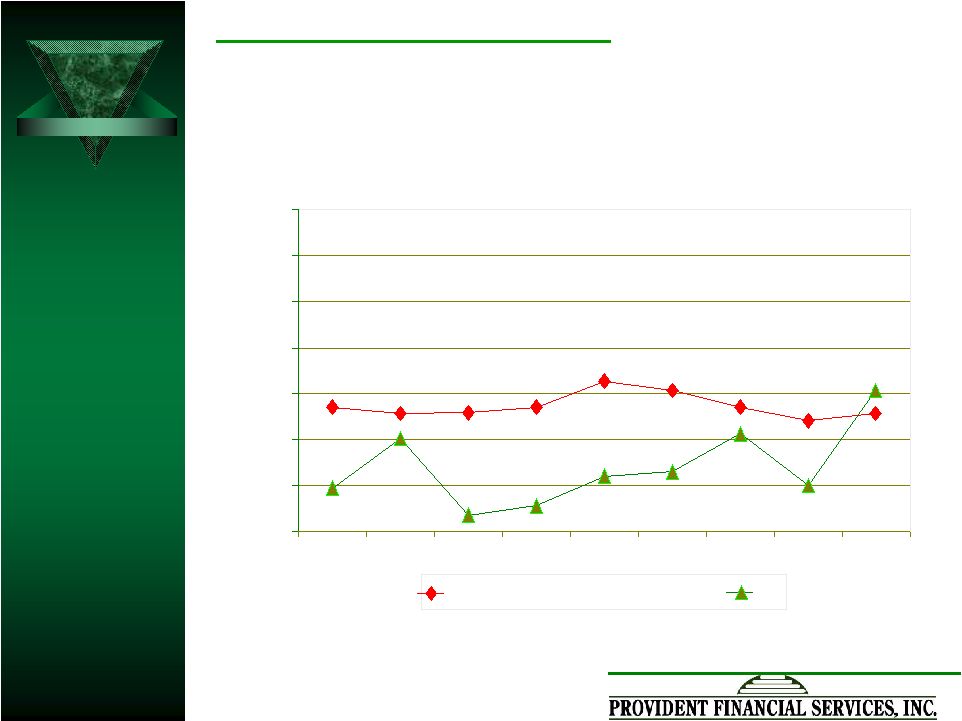
     19 Non-performing Assets as a % of Total Assets 0.27% 0.25% 0.22% 0.24% 0.27% 0.25% 0.28% 0.23% 0.25% 0.15% 0.14% 0.12% 0.10% 0.10% 0.11% 0.11% 0.13% 0.09% 1Q05 2Q05 3Q05 4Q05 1Q06 2Q06 3Q06 4Q06 1Q07 Mid-Atlantic Banks & Thrifts PFS Continuing Asset Quality Trend Ahead of Industry Peers *Source: SNL Financial. Note: Mid-Atlantic Bank & Thrift data for 1Q07 is preliminary based on companies reporting as of 4/20/07. Focused on Fundamentals __________ Asset Quality |
     20 Focused on Fundamentals __________ Capital Management Share Repurchases 5 th Board-Authorized Repurchase Program – July 2006 Approximately 3.3 million shares authorized for repurchase Approximately 2.5 million shares left for repurchase as of March 31, 2007 Approximately 5.5 million shares repurchased in 2006 Approximately 682 thousand shares repurchased 1stQ 2007 Approximately 15.5 million shares repurchased since IPO January 2003 |
     21 Quarterly Cash Dividends Current Dividend Yield = 2.27% (based on $17.59) share price as of 4/20/07 Focused on Fundamentals __________ Capital Management History of Cash Dividend Increases To-Date $0.04 $0.05 $0.06 $0.07 $0.08 $0.09 $0.10 $0.00 $0.02 $0.04 $0.06 $0.08 $0.10 $0.12 Apr-03 July-03 Jan-04 Jan-05 Apr-05 Oct-05 Apr-06 |
     22 Building superior products, services and delivery channels for commercial and small-business customers Remote deposit capture Dedicated cash management support group Automated wire transfers Enhanced escrow account products Ongoing enhancements to government account products Focused on Fundamentals __________ Competitive Business Services |
     23 Building superior products, services and delivery channels for retail customers Platinum level service Rewards points loyalty program Integrated deposit origination platform Allpoint ATM network 32,000+ surcharge-free ATM’s nationwide Focused on Fundamentals __________ Competitive Retail Services |
     24 Continuing Emphasis on Franchise Expansion in Attractive Markets Source: SNL Financial as per FDIC/SOD at 6/30/06. Data is pro-forma for pending mergers and excludes brokerage/institutional deposits. * Source: SNL Financial/ESRI Focused on Profitable Franchise Expansion 2006 Median Household Income * Projected Growth 2006 - 2011 (%)* Middlesex $75,672 16.62 Monmouth $78,682 19.07 Morris $96,695 19.53 NJ State Median $66,848 17.05 U.S. National Median $51,546 17.77 Middlesex Monmouth Morris New Jersey Provident Deposit Market Share Rank* # 9 of 155 Institutions # 5 of 45 Institutions # 11 of 32 Institutions # 8 of 34 Institutions (Pro-Forma) |
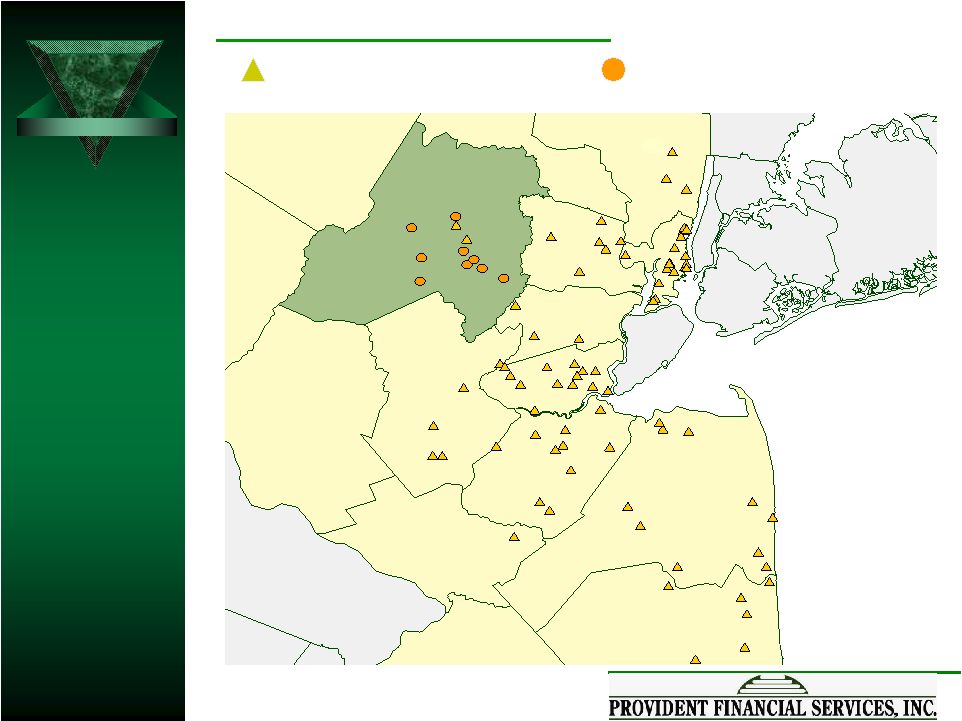     25 Richmond Westchester New York Warren Sussex Montgomery Philadelphia Bucks Burlington Passaic Morris Bergen Somerset Middlesex Monmouth Ocean Essex Hudson Hunterdon Mercer Union Bronx Kings Nassau Queens Provident Branches at 3/31/07 Former First Morris Branches Enhanced Presence in Attractive Morris County Market Focused on Profitable Franchise Expansion |
     26 Looking Ahead Positioned to take advantage of return to normalized yield curve Anticipate increased new branch activity in conjunction with branch rationalization Redoubling efforts to expand small-business customer relationships Ongoing adherence to Strategic Priorities Continuous process improvements to wring out additional efficiencies and enable expansion of revenue producers Focused on Clear Strategy and Effective Execution |
     27 Looking Ahead Continue to Seek Out Accretive Acquisition Opportunities Focus on existing footprint and contiguous markets Potential transactions must be additive to franchise and earnings Must add long-term stockholder value Focused on Clear Strategy and Effective Execution |
     2007 Annual Meeting 2007 Annual Meeting of Stockholders of Stockholders April 25, 2007 April 25, 2007 Focused on Long-term Stockholder Value Focused on Focused on Long-term Long-term Stockholder Stockholder Value Value 28 |