
Q3 2020 INVESTOR PRESENTATION
Forward Looking Statements Certain statements contained herein are “forward-looking statements” within the meaning of Section 27A of the Securities Act of 1933 and Section 21E of the Securities Exchange Act of 1934. Such forward-looking statements may be identified by reference to a future period or periods, or by the use of forward-looking terminology, such as “may,” “will,” “believe,” “expect,” “estimate,” "project," "intend," “anticipate,” “continue,” or similar terms or variations on those terms, or the negative of those terms. Forward-looking statements are subject to numerous risks and uncertainties, including, but not limited to, those set forth in Item 1A of the Company's Annual Report on Form 10-K, as supplemented by its Quarterly Report on Form 10-Q for the quarter ended September 30, 2020, and those related to the economic environment, particularly in the market areas in which the Company operates, competitive products and pricing, fiscal and monetary policies of the U.S. Government, changes in accounting policies and practices that may be adopted by the regulatory agencies and the accounting standards setters, changes in government regulations affecting financial institutions, including regulatory fees and capital requirements, changes in prevailing interest rates, acquisitions and the integration of acquired businesses, credit risk management, asset-liability management, the financial and securities markets and the availability of and costs associated with sources of liquidity. In addition, the COVID-19 pandemic is having an adverse impact on the Company, its customers and the communities it serves. Given its ongoing and dynamic nature, it is difficult to predict the full impact of the COVID-19 outbreak on the Company’s business financial condition and results of operations. The extent of such impact will depend on future developments, which are highly uncertain, including when the coronavirus can be controlled and abated and the extent to which economy can remain open. As the result of the COVID-19 pandemic and the related adverse local and national economic consequences, the Company could be subject to any of the following risks, any of which could have a material, adverse effect on our business, financial condition, liquidity, and results of operations: the demand for our products and services may decline, making it difficult to grow assets and income; if the economy is unable to remain substantially open, and high levels of unemployment continue for an extended period of time, loan delinquencies, problem assets, and foreclosures may increase, resulting in increased charges and reduced income; collateral for loans, especially real estate, may decline in value, which could cause loan losses to increase; our allowance for loan losses may increase if borrowers experience financial difficulties, which will adversely affect our net income; the net worth and liquidity of loan guarantors may decline, impairing their ability to honor commitments to us; as the result of the decline in the Federal Reserve Board’s target federal funds rate to near 0%, the yield on our assets may decline to a greater extent than the decline in our cost of interest-bearing liabilities, reducing our net interest margin and spread and reducing net income; our wealth management revenues may decline with continuing market turmoil; we may face the risk of a goodwill write- down due to stock price decline; and our cyber security risks are increased as a result of an increase in the number of employees working remotely. The Company cautions readers not to place undue reliance on any such forward-looking statements which speak only as of the date made. The Company advises readers that the factors listed above could affect the Company's financial performance and could cause the Company's actual results for future periods to differ materially from any opinions or statements expressed with respect to future periods in any current statements. The Company does not have any obligation to update any forward-looking statements to reflect events or circumstances after the date of this statement. NYSE: PFS 2
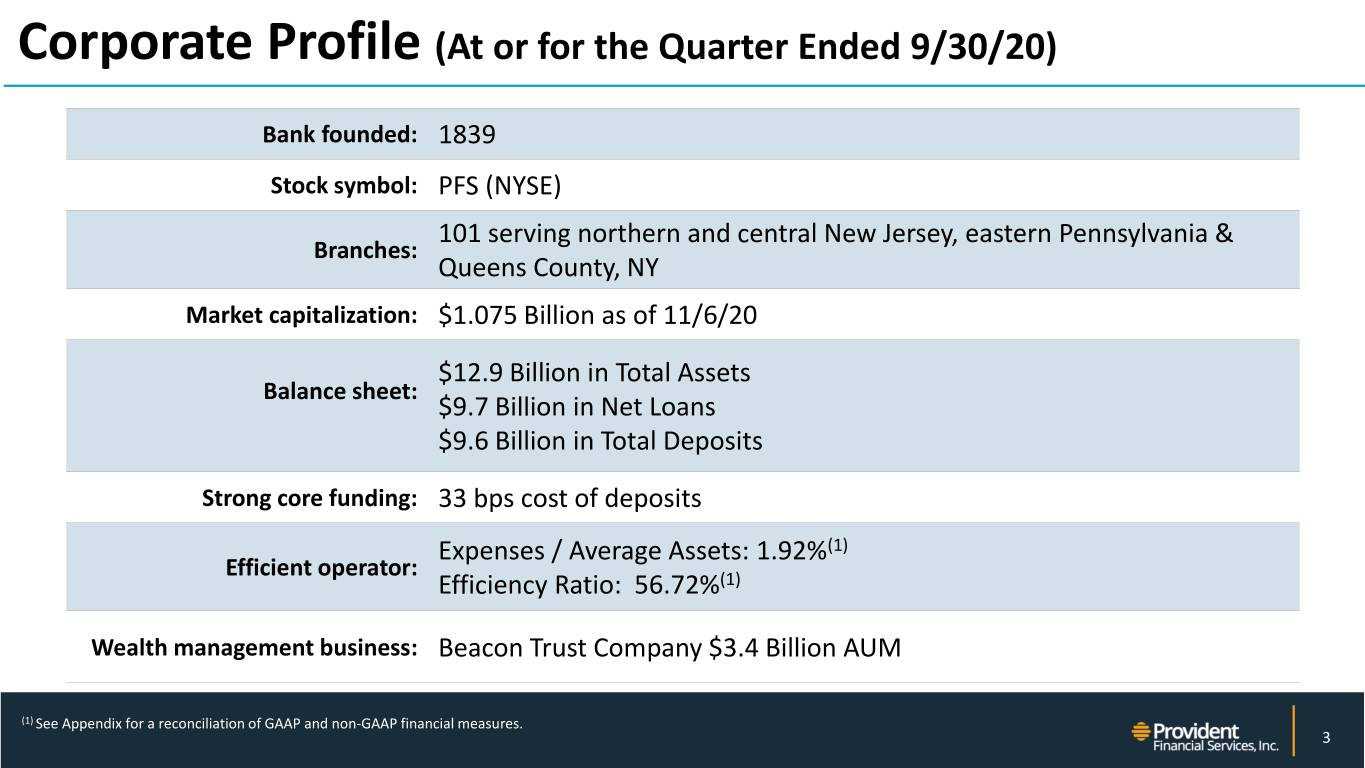
Corporate Profile (At or for the Quarter Ended 9/30/20) Bank founded: 1839 Stock symbol: PFS (NYSE) 101 serving northern and central New Jersey, eastern Pennsylvania & Branches: Queens County, NY Market capitalization: $1.075 Billion as of 11/6/20 $12.9 Billion in Total Assets Balance sheet: $9.7 Billion in Net Loans $9.6 Billion in Total Deposits Strong core funding: 33 bps cost of deposits Expenses / Average Assets: 1.92%(1) Efficient operator: Efficiency Ratio: 56.72%(1) Wealth management business: Beacon Trust Company $3.4 Billion AUM NYSE: PFS (1) See Appendix for a reconciliation of GAAP and non-GAAP financial measures. 3
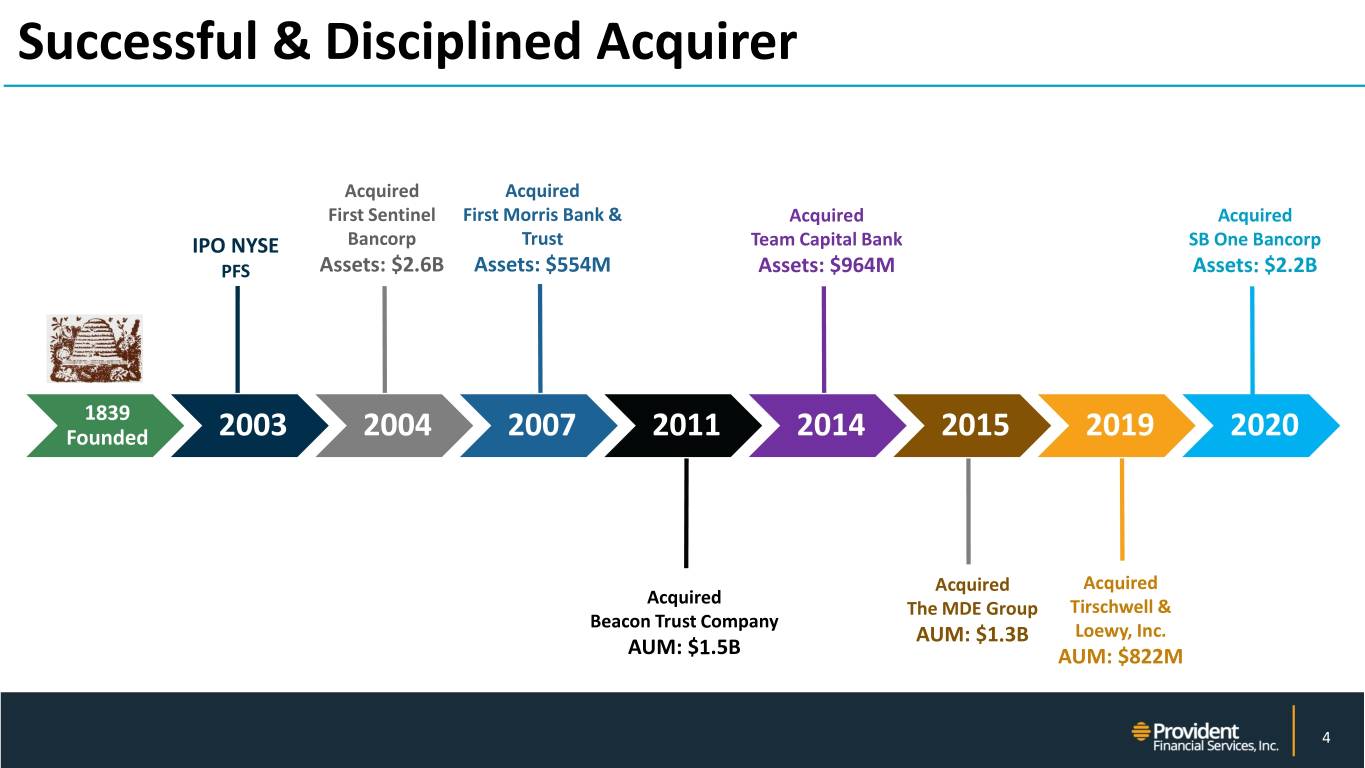
Successful & Disciplined Acquirer Acquired Acquired First Sentinel First Morris Bank & Acquired Acquired IPO NYSE Bancorp Trust Team Capital Bank SB One Bancorp PFS Assets: $2.6B Assets: $554M Assets: $964M Assets: $2.2B 1839 Founded 2003 2004 2007 2011 2014 2015 2019 2020 Acquired Acquired Acquired The MDE Group Tirschwell & Beacon Trust Company AUM: $1.3B Loewy, Inc. AUM: $1.5B AUM: $822M NYSE: PFS 4
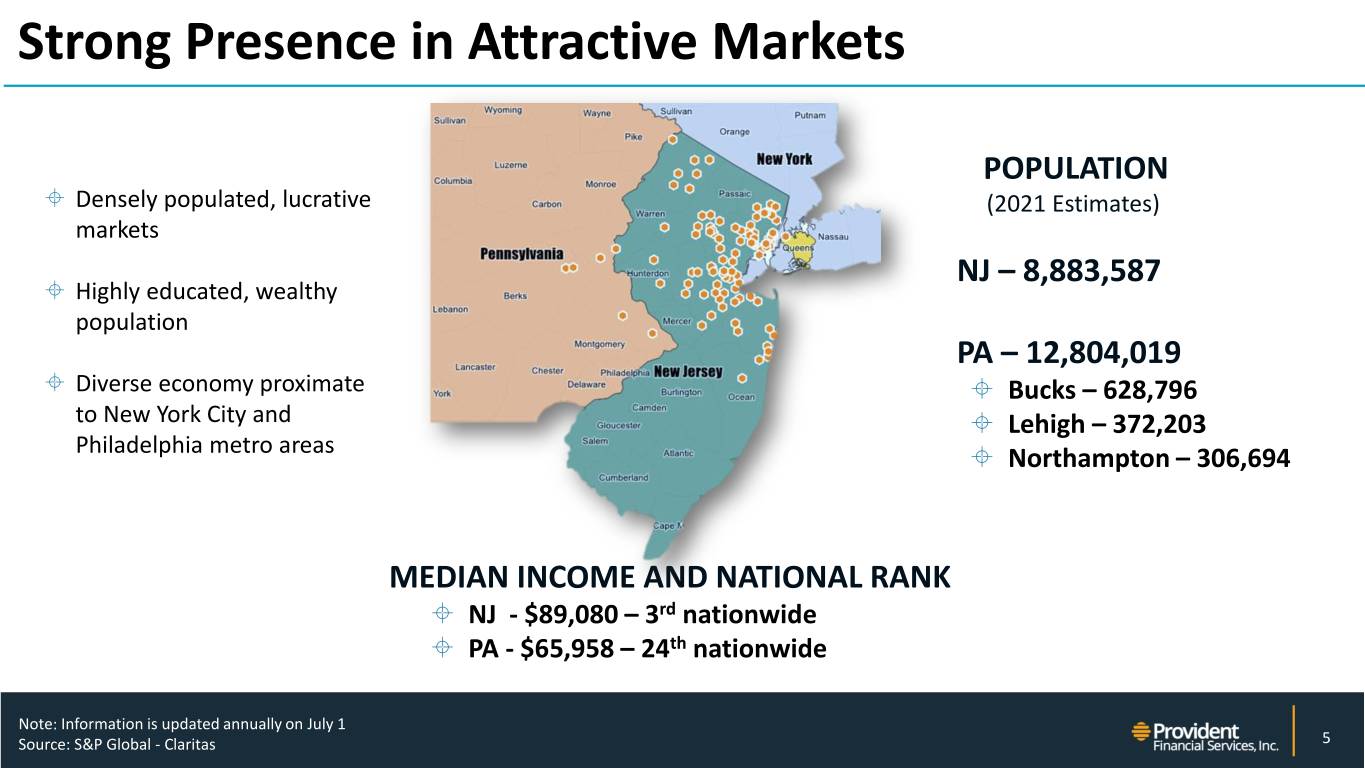
Strong Presence in Attractive Markets POPULATION Densely populated, lucrative (2021 Estimates) markets NJ – 8,883,587 Highly educated, wealthy population PA – 12,804,019 Diverse economy proximate Bucks – 628,796 to New York City and Lehigh – 372,203 Philadelphia metro areas Northampton – 306,694 MEDIAN INCOME AND NATIONAL RANK NJ - $89,080 – 3rd nationwide PA - $65,958 – 24th nationwide NYSE: PFS Note: Information is updated annually on July 1 Source: S&P Global - Claritas 5
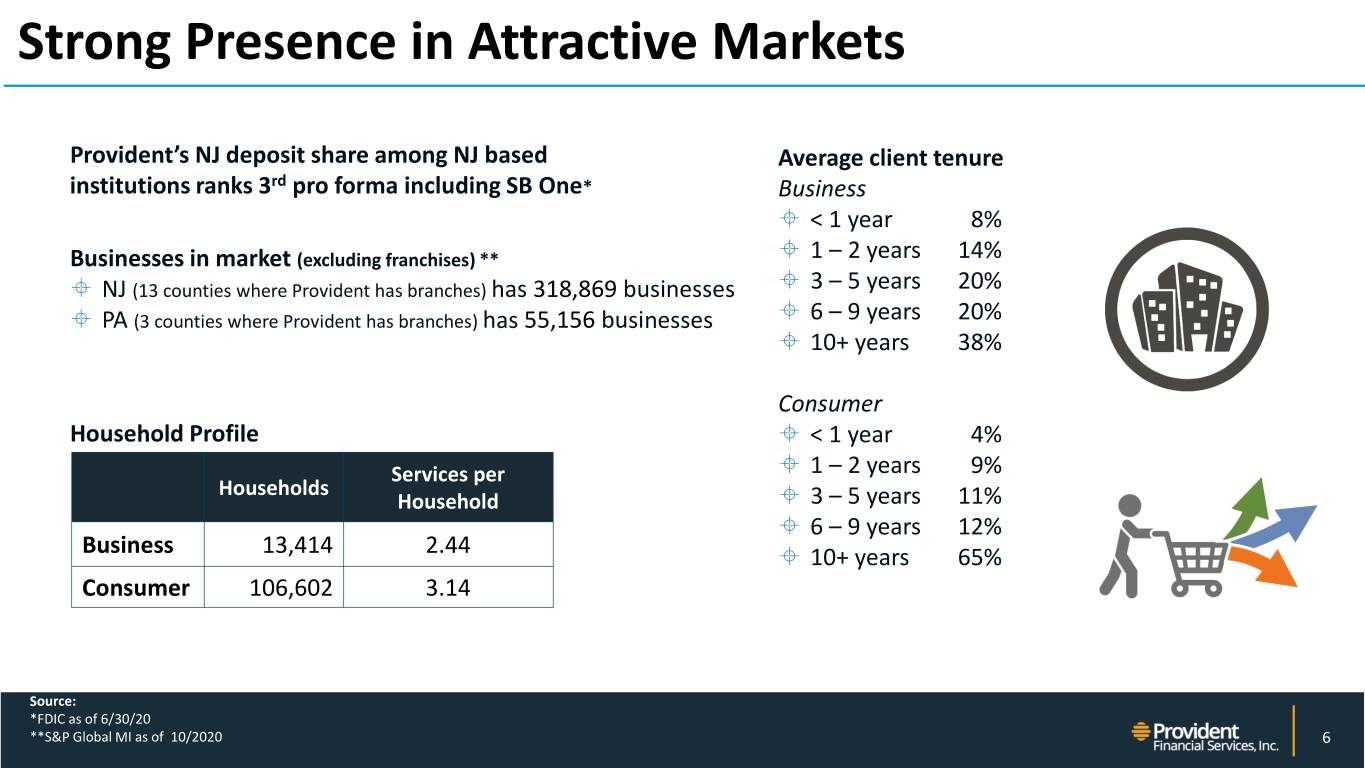
Strong Presence in Attractive Markets Provident’s NJ deposit share among NJ based Average client tenure institutions ranks 3rd pro forma including SB One* Business < 1 year 8% Businesses in market (excluding franchises) ** 1 – 2 years 14% NJ (13 counties where Provident has branches) has 318,869 businesses 3 – 5 years 20% PA (3 counties where Provident has branches) has 55,156 businesses 6 – 9 years 20% 10+ years 38% Consumer Household Profile < 1 year 4% Services per 1 – 2 years 9% Households Household 3 – 5 years 11% 6 – 9 years 12% Business 13,414 2.44 10+ years 65% Consumer 106,602 3.14 NYSE: PFS Source: *FDIC as of 6/30/20 **S&P Global MI as of 10/2020 6
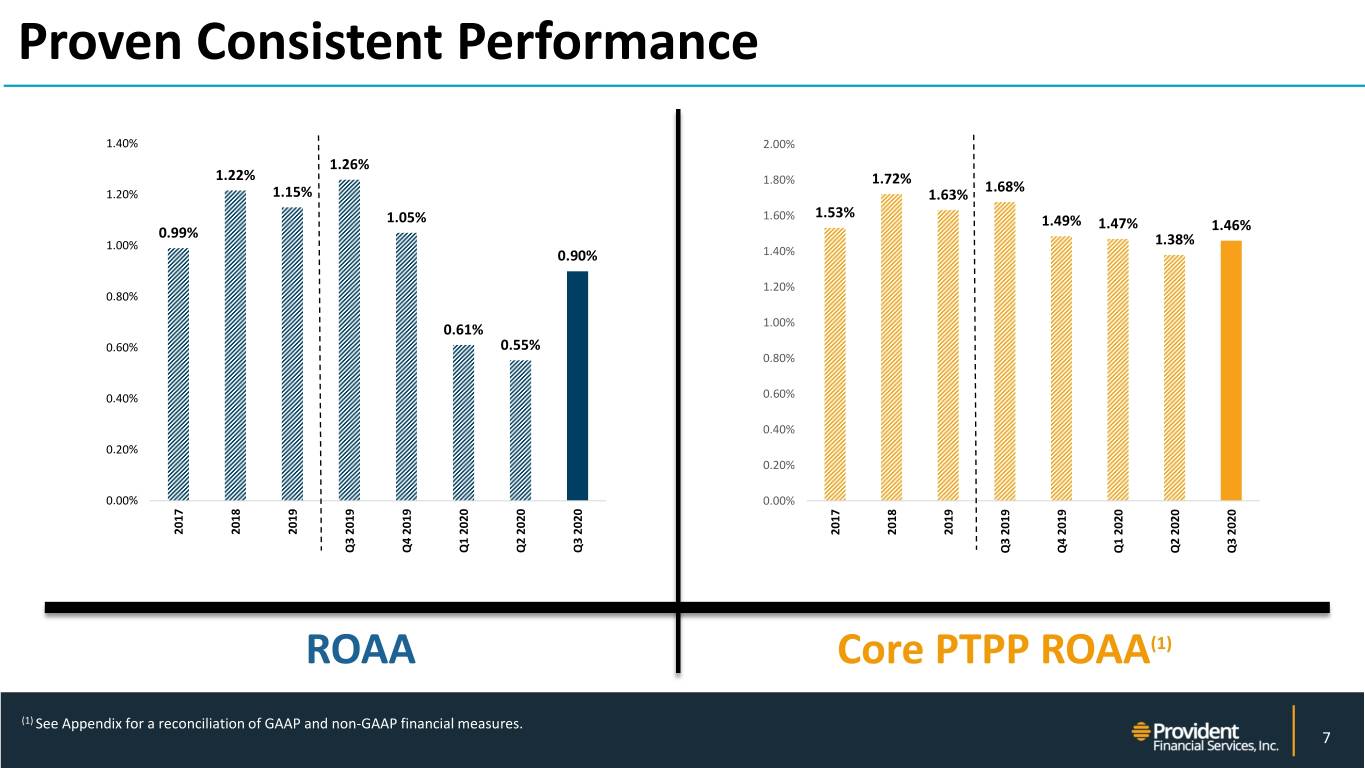
Proven Consistent Performance 1.40% 2.00% 1.26% 1.22% 1.80% 1.72% 1.68% 1.20% 1.15% 1.63% 1.60% 1.53% 1.05% 1.49% 1.47% 0.99% 1.46% 1.00% 1.38% 0.90% 1.40% 1.20% 0.80% 0.61% 1.00% 0.60% 0.55% 0.80% 0.40% 0.60% 0.40% 0.20% 0.20% 0.00% 0.00% 2017 2018 2019 2017 2018 2019 Q3 2019 Q3 2019 Q4 2020 Q1 2020 Q2 2020 Q3 Q3 2019 Q3 2019 Q4 2020 Q1 2020 Q2 2020 Q3 ROAA Core PTPP ROAA(1) NYSE: PFS (1) See Appendix for a reconciliation of GAAP and non-GAAP financial measures. 7
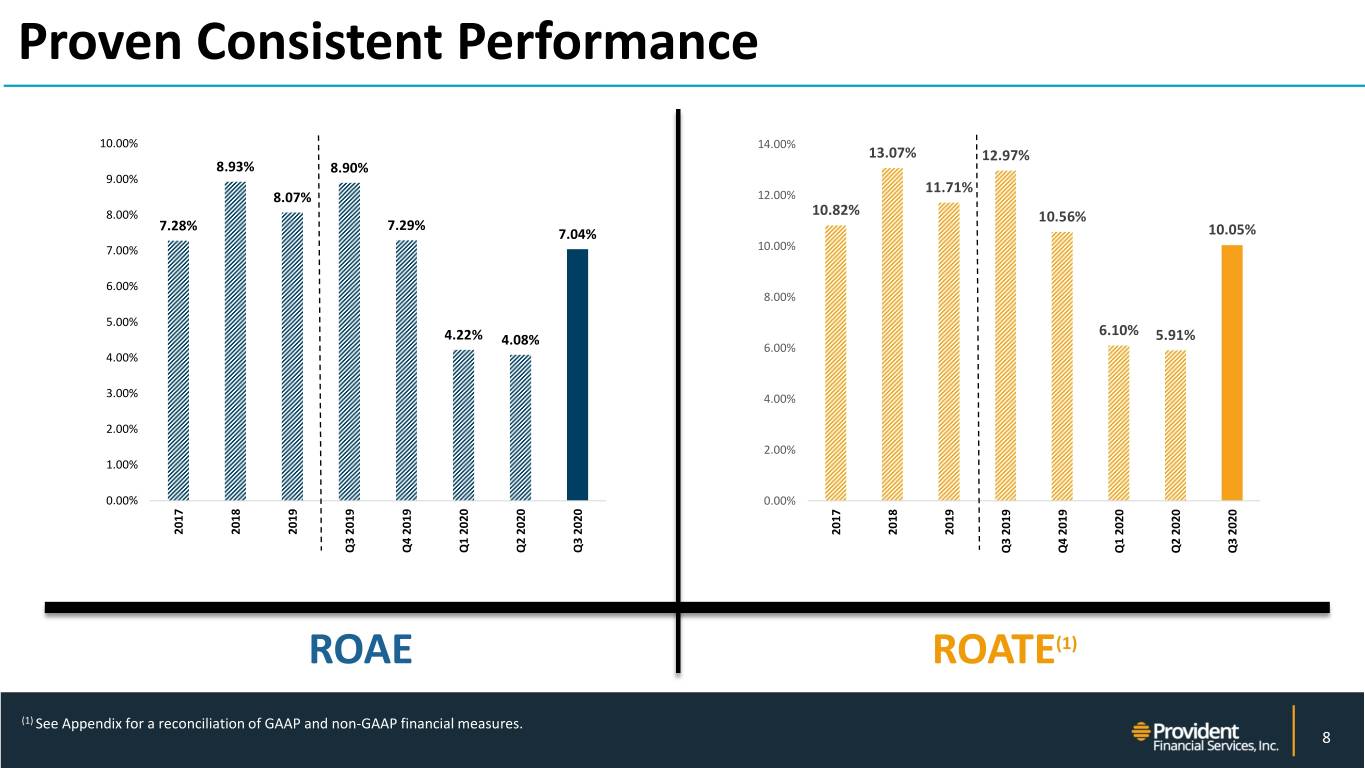
Proven Consistent Performance 10.00% 14.00% 13.07% 12.97% 8.93% 8.90% 9.00% 11.71% 8.07% 12.00% 8.00% 10.82% 10.56% 7.28% 7.29% 7.04% 10.05% 7.00% 10.00% 6.00% 8.00% 5.00% 6.10% 4.22% 4.08% 5.91% 6.00% 4.00% 3.00% 4.00% 2.00% 2.00% 1.00% 0.00% 0.00% 2017 2018 2019 2017 2018 2019 Q3 2019 Q3 2019 Q4 2020 Q1 2020 Q2 2020 Q3 Q3 2019 Q3 2019 Q4 2020 Q1 2020 Q2 2020 Q3 ROAE ROATE(1) NYSE: PFS (1) See Appendix for a reconciliation of GAAP and non-GAAP financial measures. 8
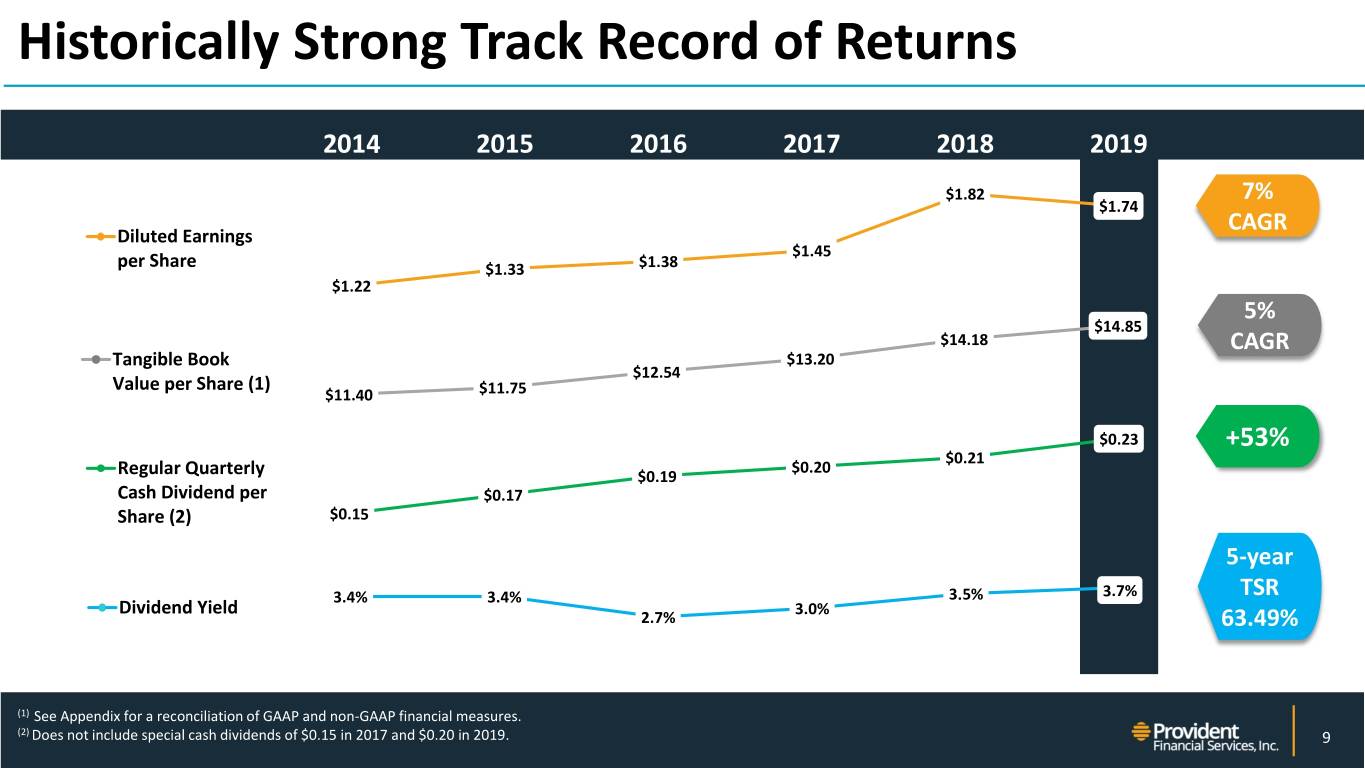
Historically Strong Track Record of Returns 2014 2015 2016 2017 2018 2019 $1.82 7% $1.74 CAGR Diluted Earnings $1.45 per Share $1.33 $1.38 $1.22 5% $14.85 $14.18 CAGR Tangible Book $13.20 $12.54 Value per Share (1) $11.40 $11.75 $0.23 +53% $0.21 $0.20 Regular Quarterly $0.19 Cash Dividend per $0.17 Share (2) $0.15 5-year 3.4% 3.4% 3.5% 3.7% TSR Dividend Yield 3.0% 2.7% 63.49% NYSE: PFS (1) See Appendix for a reconciliation of GAAP and non-GAAP financial measures. (2) Does not include special cash dividends of $0.15 in 2017 and $0.20 in 2019. 9
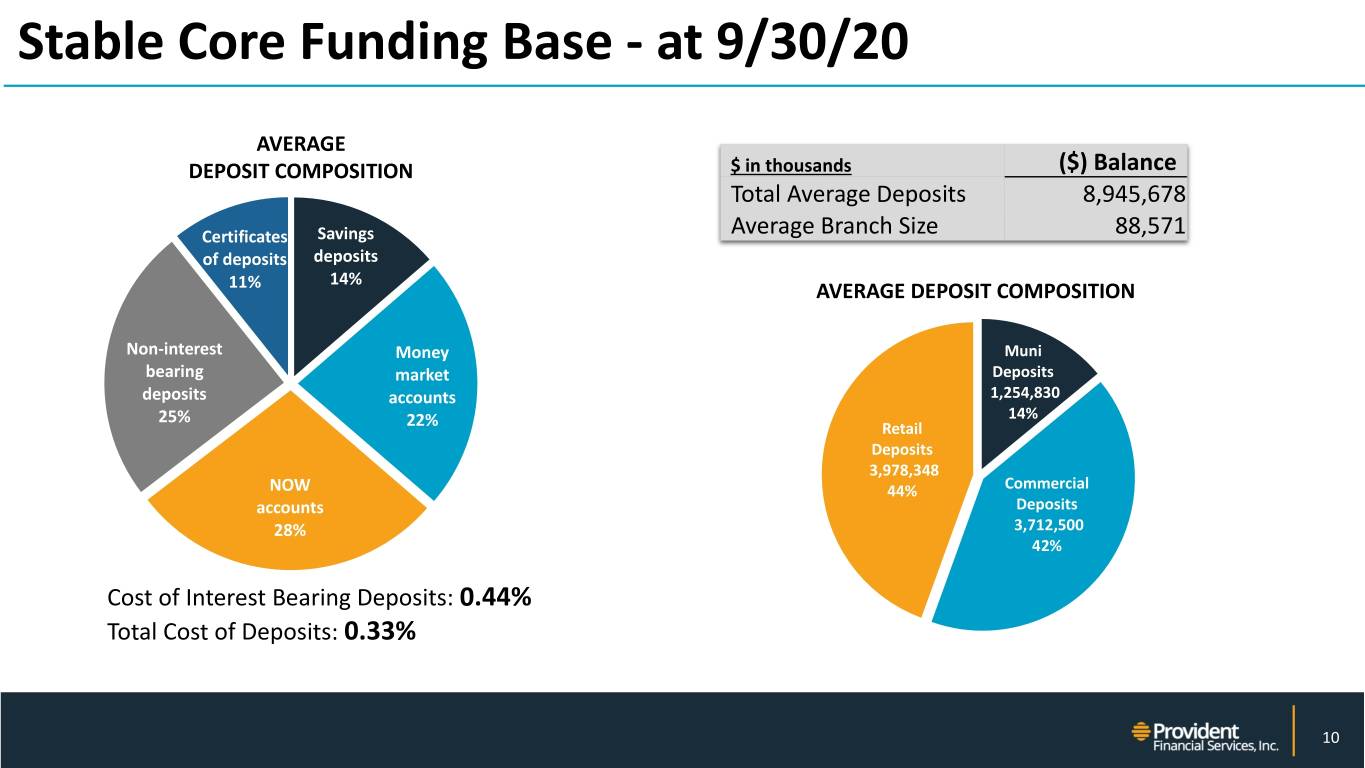
Stable Core Funding Base - at 9/30/20 AVERAGE DEPOSIT COMPOSITION $ in thousands ($) Balance Total Average Deposits 8,945,678 Certificates Savings Average Branch Size 88,571 of deposits deposits 14% 11% AVERAGE DEPOSIT COMPOSITION Non-interest Money Muni bearing market Deposits deposits accounts 1,254,830 25% 14% 22% Retail Deposits 3,978,348 NOW 44% Commercial accounts Deposits 28% 3,712,500 42% Cost of Interest Bearing Deposits: 0.44% Total Cost of Deposits: 0.33% NYSE: PFS 10
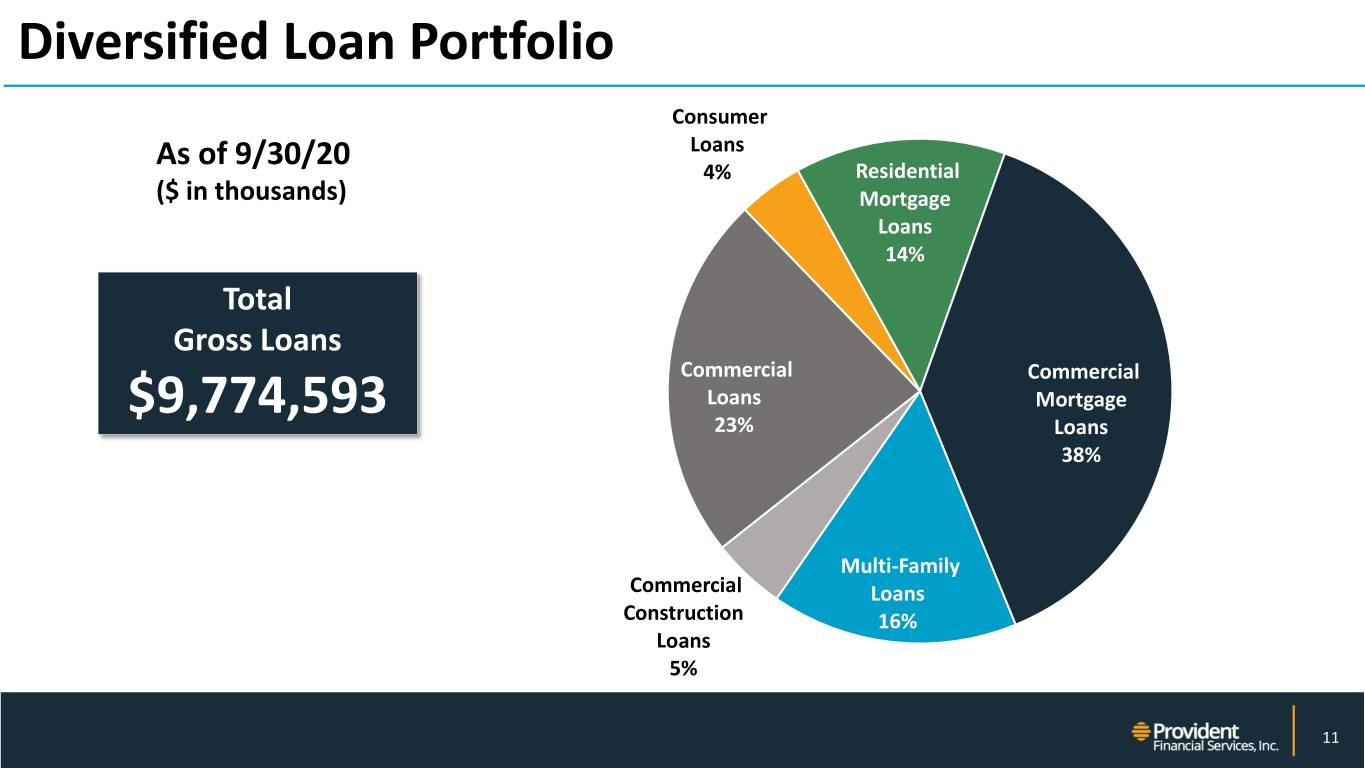
Diversified Loan Portfolio Consumer As of 9/30/20 Loans 4% Residential ($ in thousands) Mortgage Loans 14% Total Gross Loans Commercial Commercial $9,774,593 Loans Mortgage 23% Loans 38% Multi-Family Commercial Loans Construction 16% Loans 5% NYSE: PFS 11

Solid Credit Posture 2017 2018 2019 Q1 20 Q2 20 Q3 20 1.17% 1.16% 1.02% Total allowance to total loans 0.82% (excludes PPP) 0.77% 0.76% 0.57% 0.58% Non-performing assets to loans + REO 0.54% 0.50% 0.55% 0.38% 0.55% 0.50% 0.48% 0.48% 0.46% Non-performing loans to total loans 0.35% 0.44% 0.42% 0.39% 0.42% Non-performing assets to total assets 0.37% 0.28% 0.39% 0.18% 0.16% Annualized Net charge-off ratio 0.10% -0.01% 0.00% 12
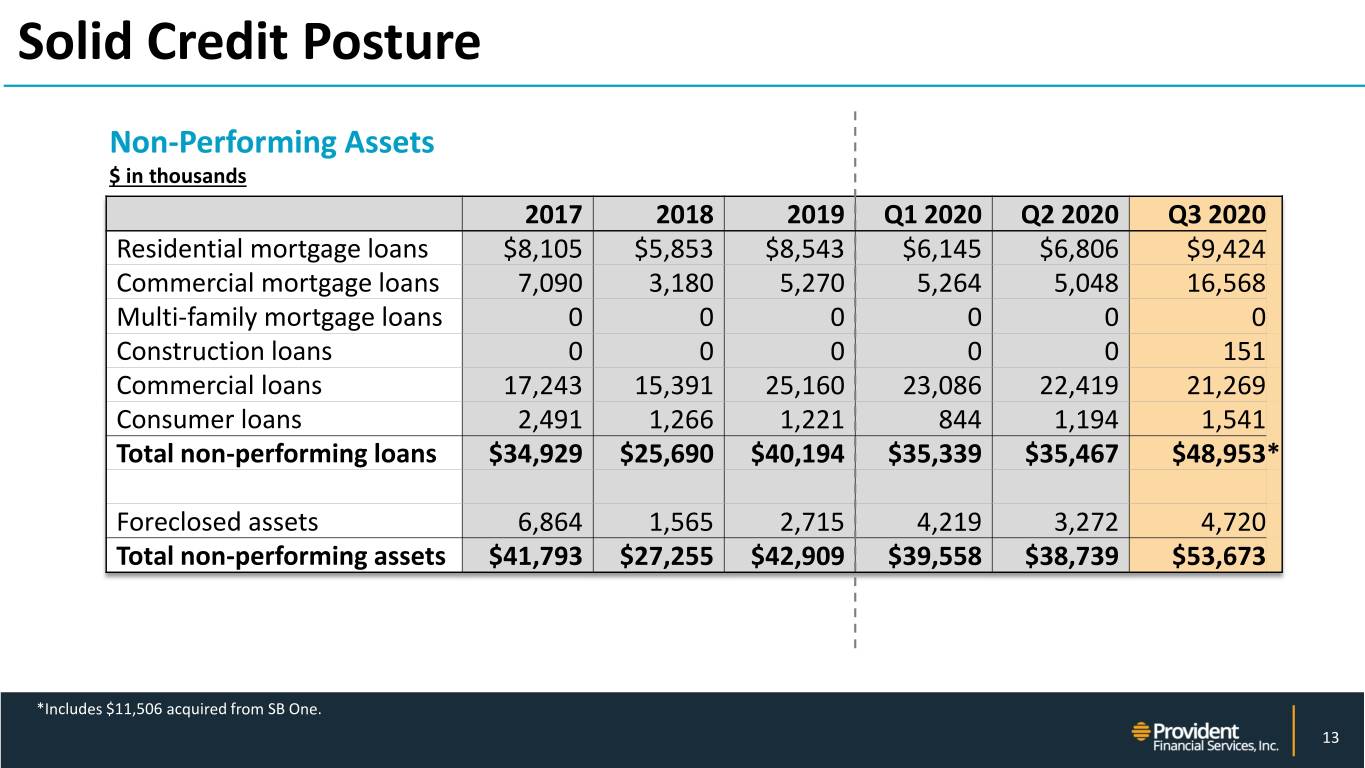
Solid Credit Posture Non-Performing Assets $ in thousands 2017 2018 2019 Q1 2020 Q2 2020 Q3 2020 Residential mortgage loans $8,105 $5,853 $8,543 $6,145 $6,806 $9,424 Commercial mortgage loans 7,090 3,180 5,270 5,264 5,048 16,568 Multi-family mortgage loans 0 0 0 0 0 0 Construction loans 0 0 0 0 0 151 Commercial loans 17,243 15,391 25,160 23,086 22,419 21,269 Consumer loans 2,491 1,266 1,221 844 1,194 1,541 Total non-performing loans $34,929 $25,690 $40,194 $35,339 $35,467 $48,953* Foreclosed assets 6,864 1,565 2,715 4,219 3,272 4,720 Total non-performing assets $41,793 $27,255 $42,909 $39,558 $38,739 $53,673 NYSE: PFS *Includes $11,506 acquired from SB One. 13

COVID-19 Loan Payment Deferrals Composition by Segment ($ in Millions) $311M or 3.2% of loans $ in Deferral % of Portfolio Q3 20 Hotels $92 0.9% Retail 44 0.5% Peak levels $1.3B or Restaurants 31 0.3% 16.8% of loans Q2 20 Office 15 0.2% Other C&I & CRE 86 0.9% Approximately 67% Residential 43 0.4% making interest TOTAL $311 3.2% payments NYSE: PFS 14
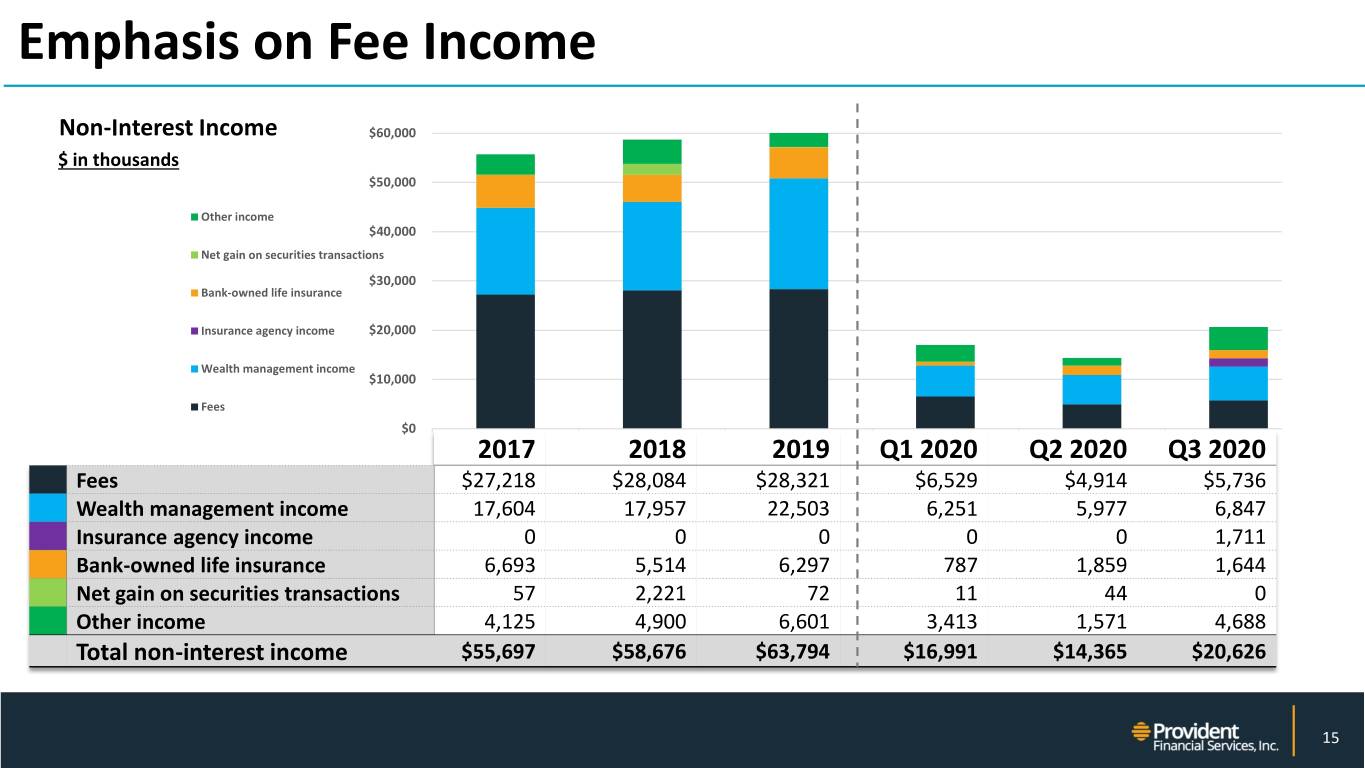
Emphasis on Fee Income Non-Interest Income $60,000 $ in thousands $50,000 Other income $40,000 Net gain on securities transactions $30,000 Bank-owned life insurance Insurance agency income $20,000 Wealth management income $10,000 Fees $0 20172017 20182018 20192019 Q1 2020Q1 2020 Q2 2020Q2 2020 Q3 2020Q3 2020 Fees $27,218 $28,084 $28,321 $6,529 $4,914 $5,736 Wealth management income 17,604 17,957 22,503 6,251 5,977 6,847 Insurance agency income 0 0 0 0 0 1,711 Bank-owned life insurance 6,693 5,514 6,297 787 1,859 1,644 Net gain on securities transactions 57 2,221 72 11 44 0 Other income 4,125 4,900 6,601 3,413 1,571 4,688 Total non-interest income $55,697 $58,676 $63,794 $16,991 $14,365 $20,626 NYSE: PFS 15
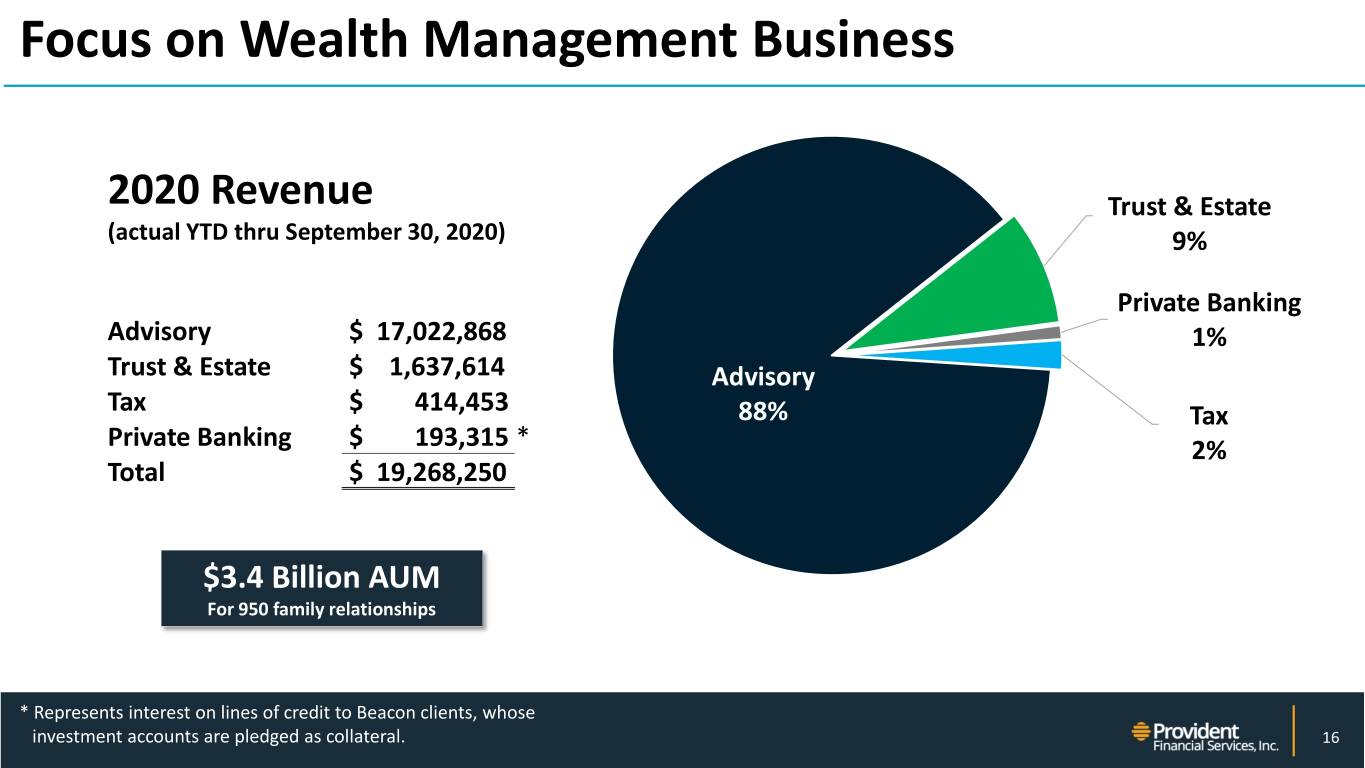
Focus on Wealth Management Business 2020 Revenue Trust & Estate (actual YTD thru September 30, 2020) 9% Private Banking Advisory $ 17,022,868 1% Trust & Estate $ 1,637,614 Advisory Tax $ 414,453 88% Tax Private Banking $ 193,315 * 2% Total $ 19,268,250 $3.4 Billion AUM For 950 family relationships NYSE: PFS * Represents interest on lines of credit to Beacon clients, whose investment accounts are pledged as collateral. 16
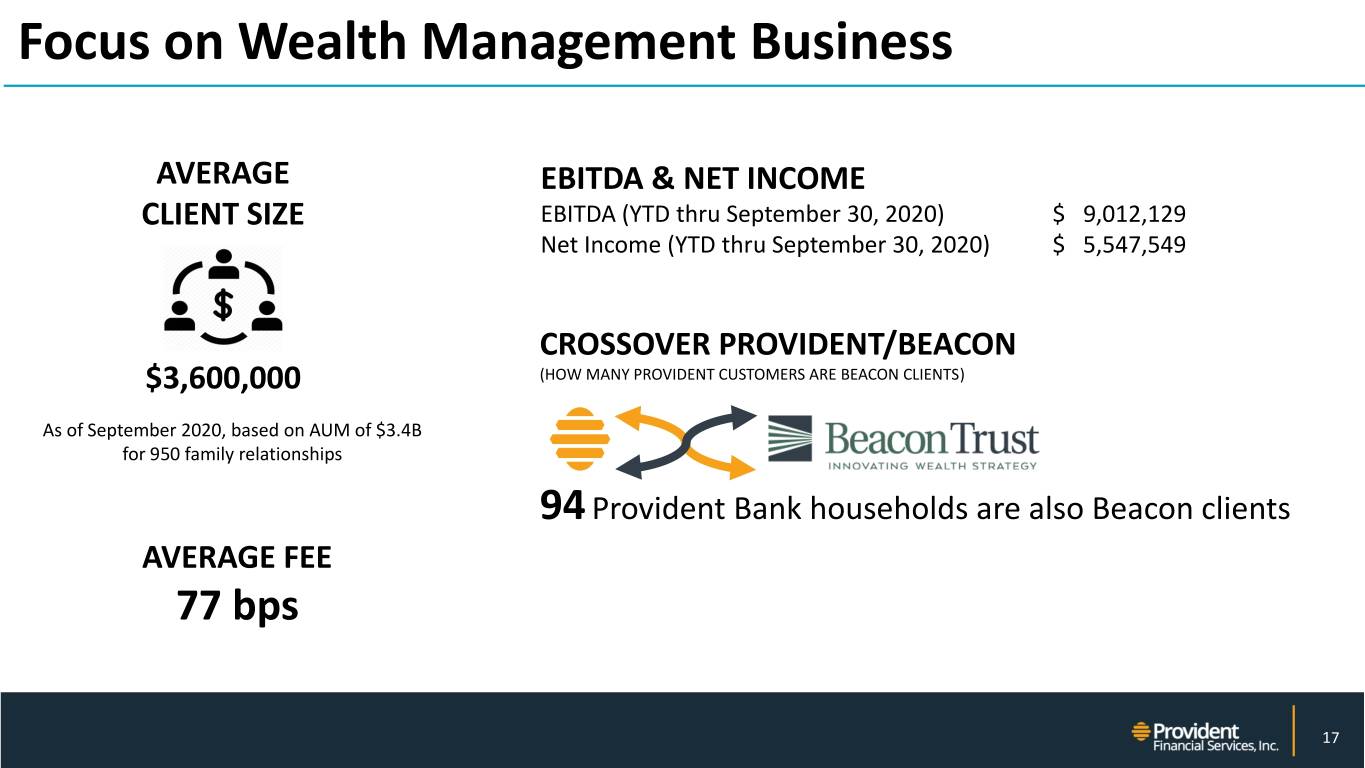
Focus on Wealth Management Business AVERAGE EBITDA & NET INCOME CLIENT SIZE EBITDA (YTD thru September 30, 2020) $ 9,012,129 Net Income (YTD thru September 30, 2020) $ 5,547,549 CROSSOVER PROVIDENT/BEACON $3,600,000 (HOW MANY PROVIDENT CUSTOMERS ARE BEACON CLIENTS) As of September 2020, based on AUM of $3.4B for 950 family relationships 94 Provident Bank households are also Beacon clients AVERAGE FEE 77 bps NYSE: PFS 17
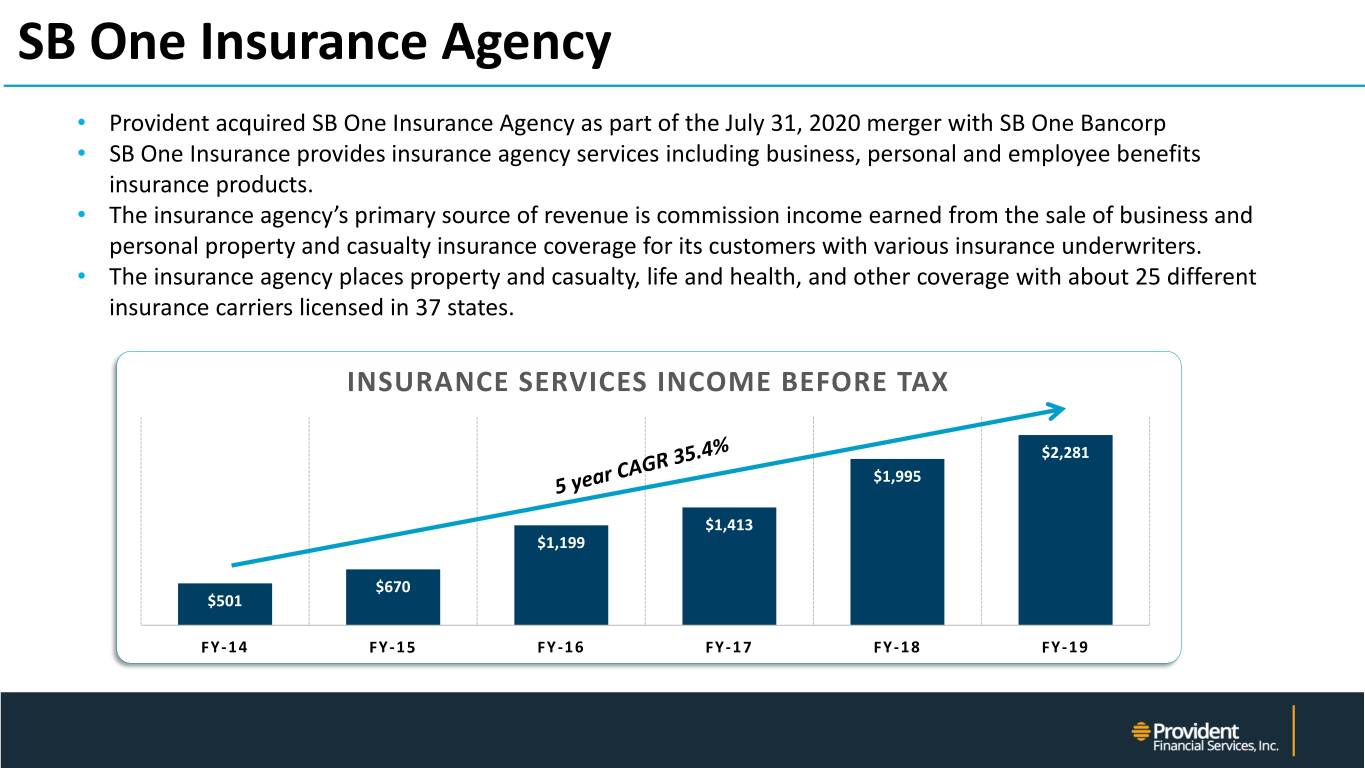
SB One Insurance Agency • Provident acquired SB One Insurance Agency as part of the July 31, 2020 merger with SB One Bancorp • SB One Insurance provides insurance agency services including business, personal and employee benefits insurance products. • The insurance agency’s primary source of revenue is commission income earned from the sale of business and personal property and casualty insurance coverage for its customers with various insurance underwriters. • The insurance agency places property and casualty, life and health, and other coverage with about 25 different insurance carriers licensed in 37 states. INSURANCE SERVICES INCOME BEFORE TAX $2,281 $1,995 $1,413 $1,199 $670 $501 FY-14 FY-15 FY-16 FY-17 FY-18 FY-19 NYSE: PFS
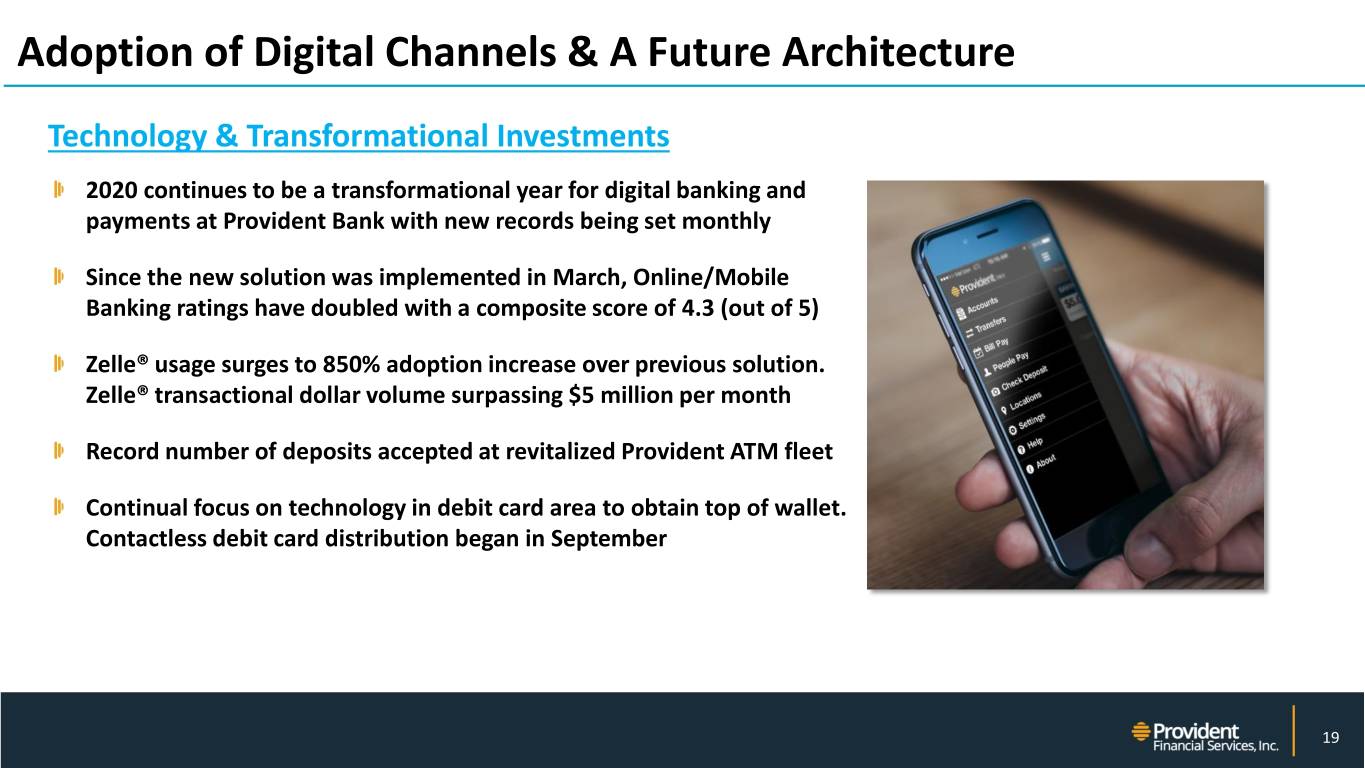
Adoption of Digital Channels & A Future Architecture Technology & Transformational Investments 2020 continues to be a transformational year for digital banking and payments at Provident Bank with new records being set monthly Since the new solution was implemented in March, Online/Mobile Banking ratings have doubled with a composite score of 4.3 (out of 5) Zelle® usage surges to 850% adoption increase over previous solution. Zelle® transactional dollar volume surpassing $5 million per month Record number of deposits accepted at revitalized Provident ATM fleet Continual focus on technology in debit card area to obtain top of wallet. Contactless debit card distribution began in September NYSE: PFS 19
APPENDIX
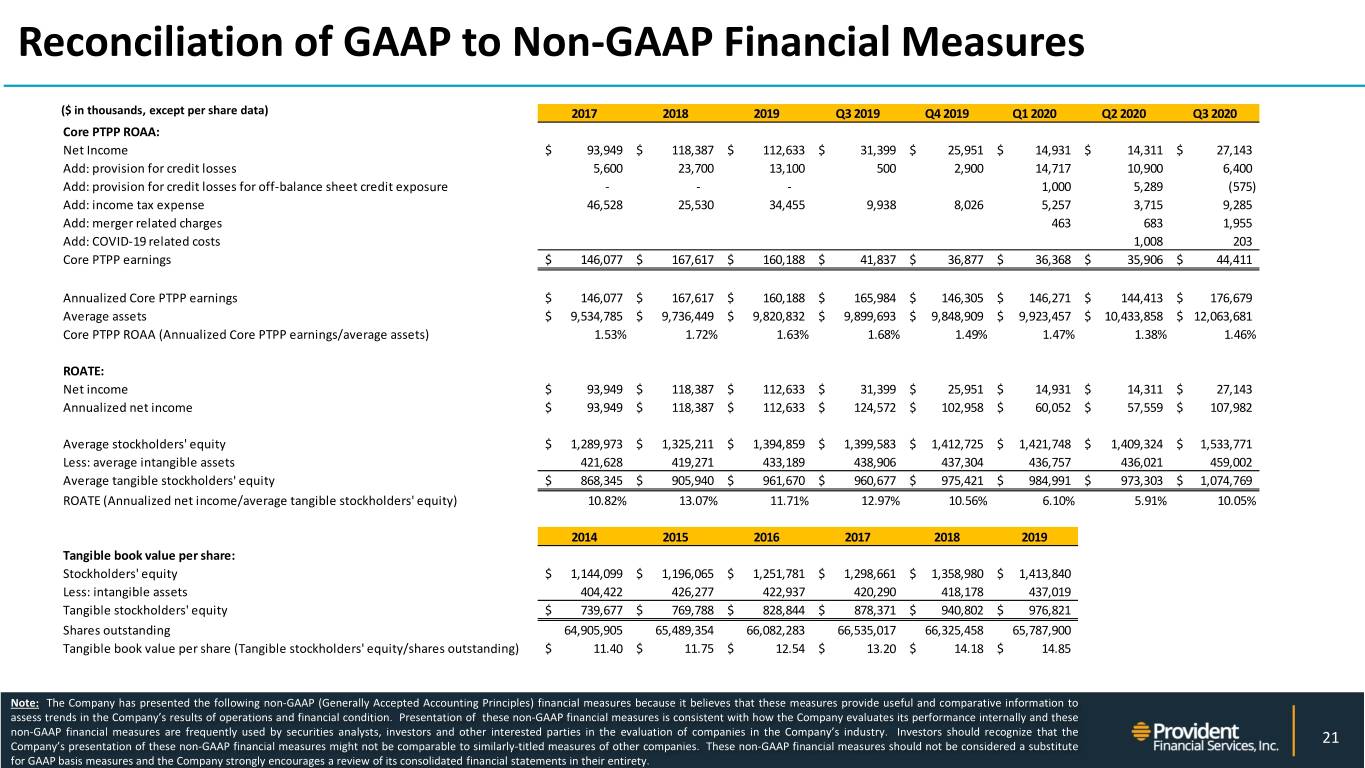
Reconciliation of GAAP to Non-GAAP Financial Measures ($ in thousands, except per share data) 2017 2018 2019 Q3 2019 Q4 2019 Q1 2020 Q2 2020 Q3 2020 Core PTPP ROAA: Net Income $ 93,949 $ 118,387 $ 112,633 $ 31,399 $ 25,951 $ 14,931 $ 14,311 $ 27,143 Add: provision for credit losses 5,600 23,700 13,100 500 2,900 14,717 10,900 6,400 Add: provision for credit losses for off-balance sheet credit exposure - - - 1,000 5,289 (575) Add: income tax expense 46,528 25,530 34,455 9,938 8,026 5,257 3,715 9,285 Add: merger related charges 463 683 1,955 Add: COVID-19 related costs 1,008 203 Core PTPP earnings $ 146,077 $ 167,617 $ 160,188 $ 41,837 $ 36,877 $ 36,368 $ 35,906 $ 44,411 Annualized Core PTPP earnings $ 146,077 $ 167,617 $ 160,188 $ 165,984 $ 146,305 $ 146,271 $ 144,413 $ 176,679 Average assets $ 9,534,785 $ 9,736,449 $ 9,820,832 $ 9,899,693 $ 9,848,909 $ 9,923,457 $ 10,433,858 $ 12,063,681 Core PTPP ROAA (Annualized Core PTPP earnings/average assets) 1.53% 1.72% 1.63% 1.68% 1.49% 1.47% 1.38% 1.46% ROATE: Net income $ 93,949 $ 118,387 $ 112,633 $ 31,399 $ 25,951 $ 14,931 $ 14,311 $ 27,143 Annualized net income $ 93,949 $ 118,387 $ 112,633 $ 124,572 $ 102,958 $ 60,052 $ 57,559 $ 107,982 Average stockholders' equity $ 1,289,973 $ 1,325,211 $ 1,394,859 $ 1,399,583 $ 1,412,725 $ 1,421,748 $ 1,409,324 $ 1,533,771 Less: average intangible assets 421,628 419,271 433,189 438,906 437,304 436,757 436,021 459,002 Average tangible stockholders' equity $ 868,345 $ 905,940 $ 961,670 $ 960,677 $ 975,421 $ 984,991 $ 973,303 $ 1,074,769 ROATE (Annualized net income/average tangible stockholders' equity) 10.82% 13.07% 11.71% 12.97% 10.56% 6.10% 5.91% 10.05% 2014 2015 2016 2017 2018 2019 Tangible book value per share: Stockholders' equity $ 1,144,099 $ 1,196,065 $ 1,251,781 $ 1,298,661 $ 1,358,980 $ 1,413,840 Less: intangible assets 404,422 426,277 422,937 420,290 418,178 437,019 Tangible stockholders' equity $ 739,677 $ 769,788 $ 828,844 $ 878,371 $ 940,802 $ 976,821 Shares outstanding 64,905,905 65,489,354 66,082,283 66,535,017 66,325,458 65,787,900 Tangible book value per share (Tangible stockholders' equity/shares outstanding) $ 11.40 $ 11.75 $ 12.54 $ 13.20 $ 14.18 $ 14.85 NYSE: PFS Note: The Company has presented the following non-GAAP (Generally Accepted Accounting Principles) financial measures because it believes that these measures provide useful and comparative information to assess trends in the Company’s results of operations and financial condition. Presentation of these non-GAAP financial measures is consistent with how the Company evaluates its performance internally and these non-GAAP financial measures are frequently used by securities analysts, investors and other interested parties in the evaluation of companies in the Company’s industry. Investors should recognize that the 21 Company’s presentation of these non-GAAP financial measures might not be comparable to similarly-titled measures of other companies. These non-GAAP financial measures should not be considered a substitute for GAAP basis measures and the Company strongly encourages a review of its consolidated financial statements in their entirety.
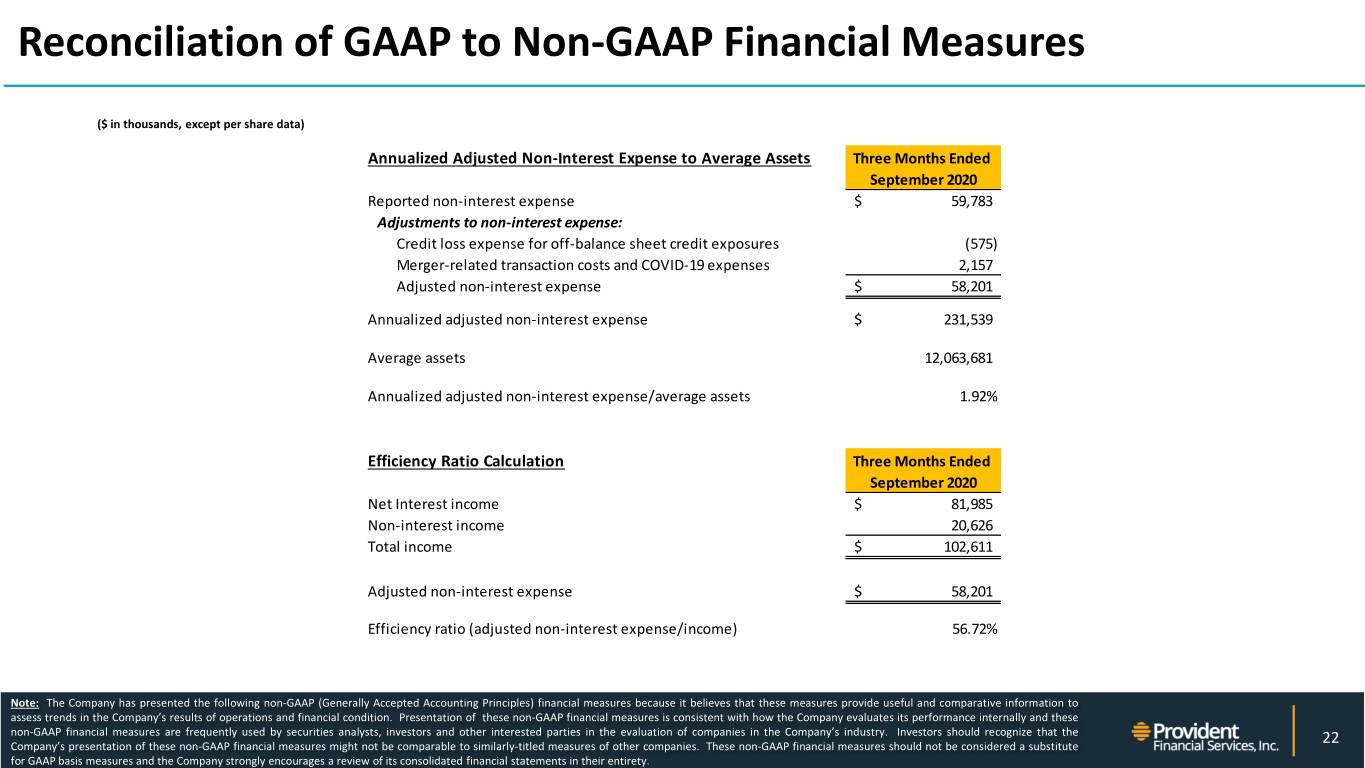
Reconciliation of GAAP to Non-GAAP Financial Measures ($ in thousands, except per share data) Annualized Adjusted Non-Interest Expense to Average Assets Three Months Ended September 2020 Reported non-interest expense $ 59,783 Adjustments to non-interest expense: Credit loss expense for off-balance sheet credit exposures (575) Merger-related transaction costs and COVID-19 expenses 2,157 Adjusted non-interest expense $ 58,201 Annualized adjusted non-interest expense $ 231,539 Average assets 12,063,681 Annualized adjusted non-interest expense/average assets 1.92% Efficiency Ratio Calculation Three Months Ended September 2020 Net Interest income $ 81,985 Non-interest income 20,626 Total income $ 102,611 Adjusted non-interest expense $ 58,201 Efficiency ratio (adjusted non-interest expense/income) 56.72% NYSE: PFS Note: The Company has presented the following non-GAAP (Generally Accepted Accounting Principles) financial measures because it believes that these measures provide useful and comparative information to assess trends in the Company’s results of operations and financial condition. Presentation of these non-GAAP financial measures is consistent with how the Company evaluates its performance internally and these non-GAAP financial measures are frequently used by securities analysts, investors and other interested parties in the evaluation of companies in the Company’s industry. Investors should recognize that the 22 Company’s presentation of these non-GAAP financial measures might not be comparable to similarly-titled measures of other companies. These non-GAAP financial measures should not be considered a substitute for GAAP basis measures and the Company strongly encourages a review of its consolidated financial statements in their entirety.

Loans by NAICS Sector – 9/30/20 C & I – (Includes owner occupied) NAICS Sector Loan Count Exposure Balance Real Estate and Rental and Leasing 732 726,636,300 656,685,284 Health Care and Social Assistance 539 422,928,608 367,580,551 Construction 434 347,214,241 162,753,527 Manufacturing 303 290,691,554 225,486,875 Wholesale Trade 302 243,510,828 183,338,102 Accommodation and Food Services 309 200,880,605 173,969,031 Retail Trade 316 183,833,472 148,046,936 Professional, Scientific, and Technical Services 406 177,871,739 116,419,895 Educational Services 88 140,257,539 122,372,786 Other Services (except Public Administration) 324 124,787,407 101,598,041 Finance and Insurance 80 109,338,433 58,367,027 Arts, Entertainment, and Recreation 129 108,385,538 98,054,213 Administrative and Support and Waste Management and Remediation Services 204 96,698,806 67,734,535 Transportation and Warehousing 178 60,994,693 51,038,618 Utilities 36 47,084,383 27,075,718 Information 16 21,204,248 17,991,602 Management of Companies and Enterprises 11 5,761,211 4,681,973 Agriculture, Forestry, Fishing and Hunting 7 3,450,827 2,797,926 Public Administration 30 3,109,896 2,159,646 Mining, Quarrying, and Oil and Gas Extraction 3 537,059 537,059 SBA Protection Payroll Program 181 56,436,732 56,436,732 Commercial ODs/ACH ODs 67 1,843,000 417,026 Summary 4,695 3,373,457,120 2,645,543,104 NYSE: PFS 23
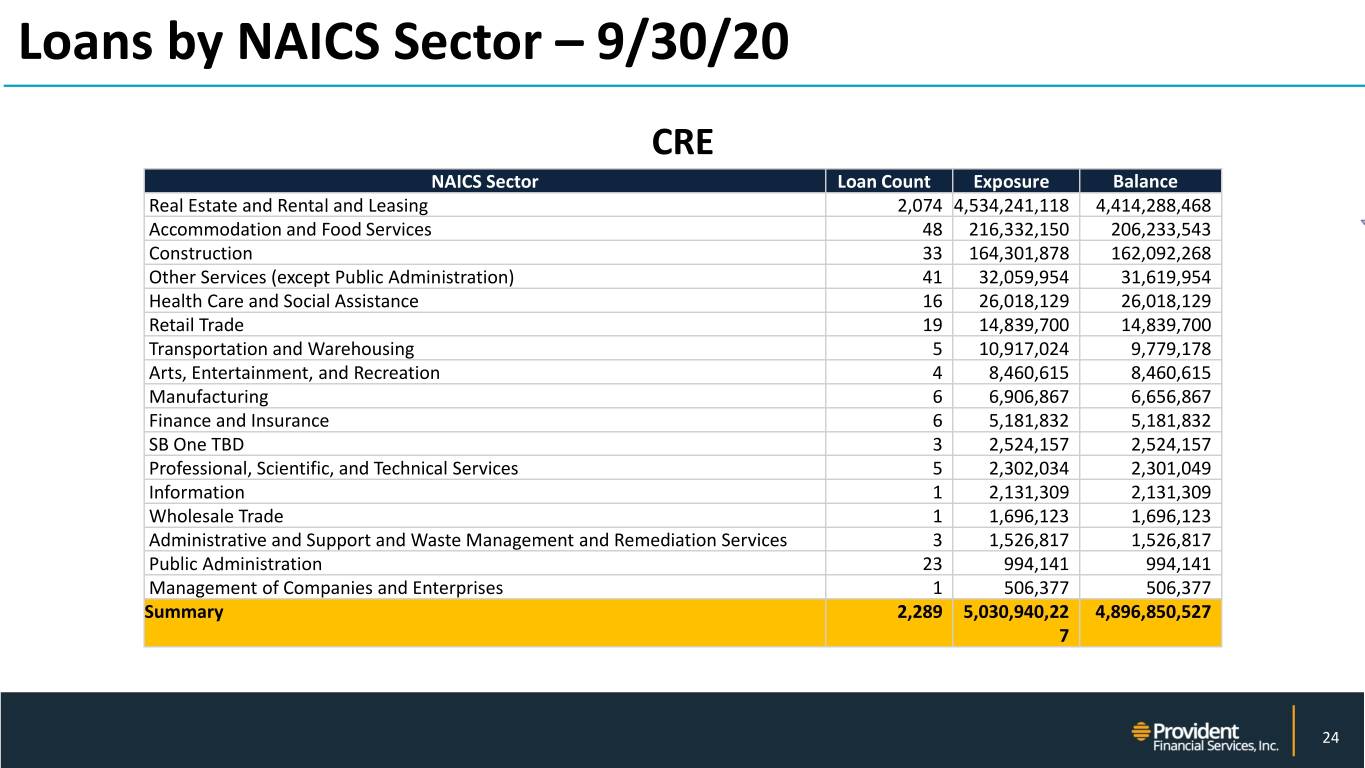
Loans by NAICS Sector – 9/30/20 CRE NAICS Sector Loan Count Exposure Balance Real Estate and Rental and Leasing 2,074 4,534,241,118 4,414,288,468 Accommodation and Food Services 48 216,332,150 206,233,543 Construction 33 164,301,878 162,092,268 Other Services (except Public Administration) 41 32,059,954 31,619,954 Health Care and Social Assistance 16 26,018,129 26,018,129 Retail Trade 19 14,839,700 14,839,700 Transportation and Warehousing 5 10,917,024 9,779,178 Arts, Entertainment, and Recreation 4 8,460,615 8,460,615 Manufacturing 6 6,906,867 6,656,867 Finance and Insurance 6 5,181,832 5,181,832 SB One TBD 3 2,524,157 2,524,157 Professional, Scientific, and Technical Services 5 2,302,034 2,301,049 Information 1 2,131,309 2,131,309 Wholesale Trade 1 1,696,123 1,696,123 Administrative and Support and Waste Management and Remediation Services 3 1,526,817 1,526,817 Public Administration 23 994,141 994,141 Management of Companies and Enterprises 1 506,377 506,377 Summary 2,289 5,030,940,22 4,896,850,527 7 NYSE: PFS 24
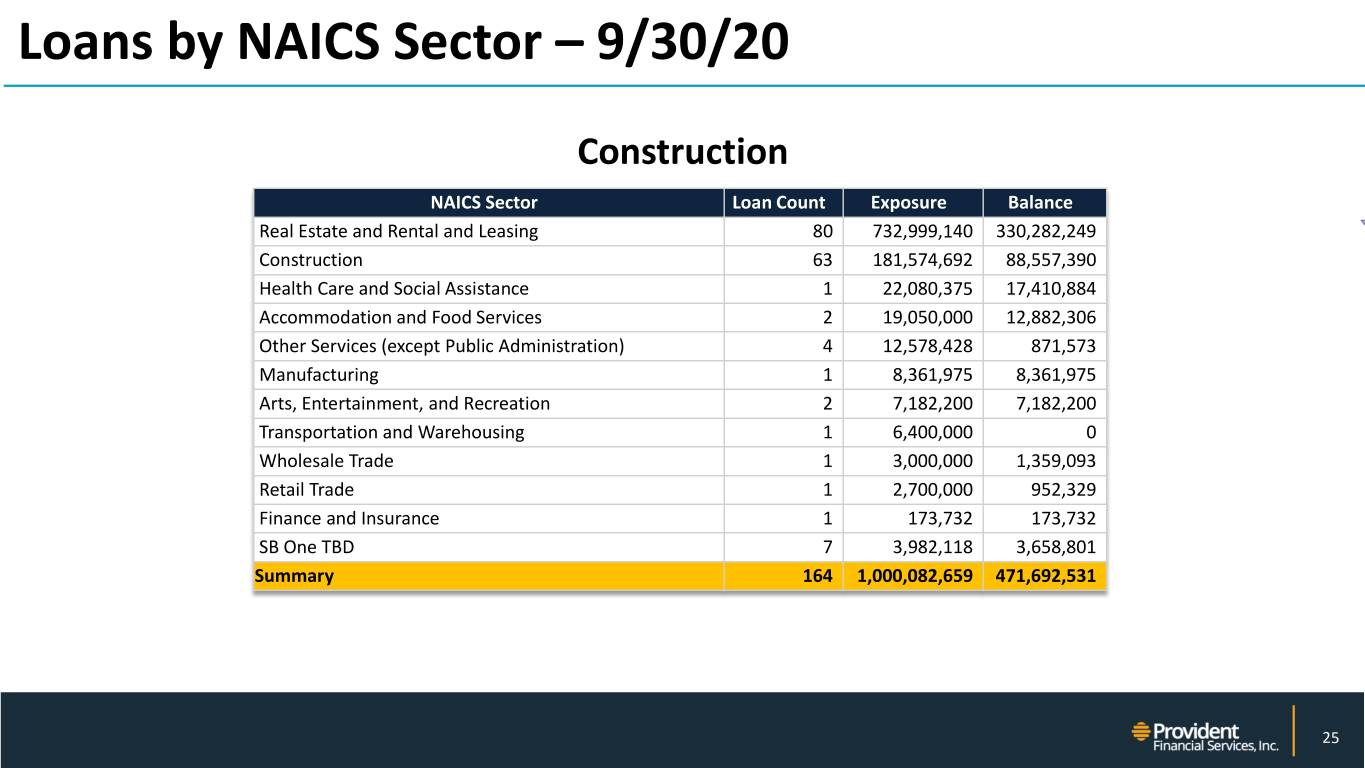
Loans by NAICS Sector – 9/30/20 Construction NAICS Sector Loan Count Exposure Balance Real Estate and Rental and Leasing 80 732,999,140 330,282,249 Construction 63 181,574,692 88,557,390 Health Care and Social Assistance 1 22,080,375 17,410,884 Accommodation and Food Services 2 19,050,000 12,882,306 Other Services (except Public Administration) 4 12,578,428 871,573 Manufacturing 1 8,361,975 8,361,975 Arts, Entertainment, and Recreation 2 7,182,200 7,182,200 Transportation and Warehousing 1 6,400,000 0 Wholesale Trade 1 3,000,000 1,359,093 Retail Trade 1 2,700,000 952,329 Finance and Insurance 1 173,732 173,732 SB One TBD 7 3,982,118 3,658,801 Summary 164 1,000,082,659 471,692,531 NYSE: PFS 25

CRE Investment By Property Type As of 9/30/20 (In thousands) PROPERTY TYPE Count $ Outstanding % Outstanding WARR WALTV Multi-Family 514 1,573,067 32.24% 3.08 59.52% Retail 441 1,164,011 23.86% 3.44 52.83% Industrial 200 595,062 12.20% 3.19 57.50% Office 255 542,979 11.13% 3.66 49.28% Mixed 235 302,024 6.19% 3.19 75.12% Hotel 34 199,033 4.08% 4.89 33.45% Other 212 187,680 3.85% 3.34 85.01% Special Use Property 60 140,390 2.88% 3.46 51.49% Residential 261 109,816 2.25% 3.68 82.17% Land 19 64,952 1.33% 4.28 22.42% TOTAL PORTFOLIO 2,231 4,879,015 100% 3.38 54.84% NYSE: PFS 26

CRE To Total Risk-Based Capital Guideline is 300% of Regulatory Capital 500% 451.5% 452.4% 454.9% 438.6% 438.8% 450% 430.0% 438.3% 432.6% 428.6% 430.6% 436.9% 422.2% 418.4% 425.9% 400% 350% 300% 250% 200% 150% 100% 50% 0% 12/31/15 12/31/16 12/31/17 03/31/18 06/30/18 09/30/18 12/31/18 03/31/19 06/30/19 09/30/19 12/31/19 03/31/20 06/30/20 09/30/20 NYSE: PFS 27
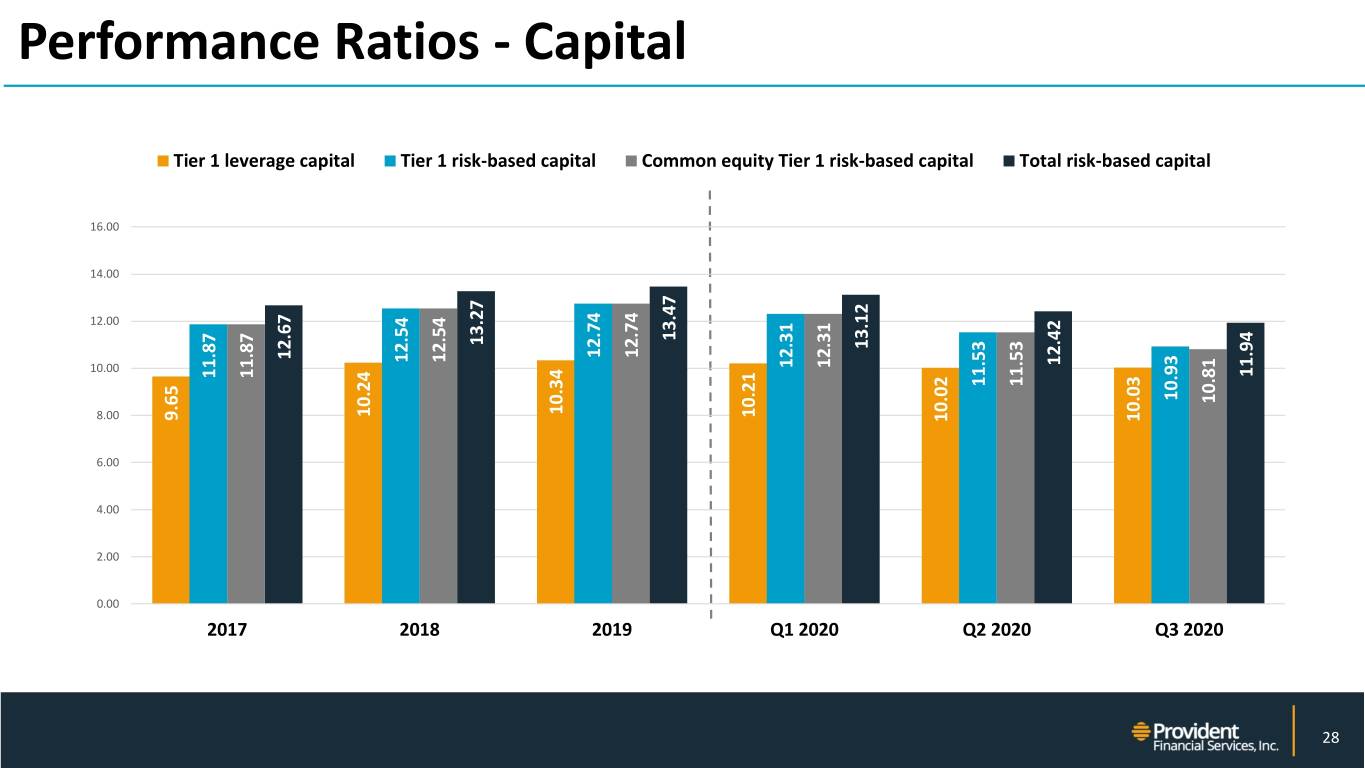
Performance Ratios - Capital Tier 1 leverage capital Tier 1 risk-based capital Common equity Tier 1 risk-based capital Total risk-based capital 16.00 14.00 12.00 13.47 13.27 13.12 12.74 12.74 12.67 12.54 12.54 12.42 12.31 10.00 12.31 11.94 11.87 11.87 11.53 11.53 10.93 10.81 10.34 10.24 10.21 9.65 10.03 8.00 10.02 6.00 4.00 2.00 0.00 2017 2018 2019 Q1 2020 Q2 2020 Q3 2020 NYSE: PFS 28

Q3 2020 INVESTOR PRESENTATION


