UNITED STATES
SECURITIES AND EXCHANGE COMMISSION
Washington, D.C. 20549
FORM 10-K | | | | | |
| ☒ | Annual Report Pursuant to Section 13 or 15(d) of the Securities Exchange Act of 1934 |
For the Fiscal Year Ended December 31, 2024
OR | | | | | |
| ☐ | Transition Report Pursuant to Section 13 or 15(d) of the Securities Exchange Act of 1934 |
For the transition period from to
Commission File No. 1-31566
PROVIDENT FINANCIAL SERVICES, INC.
(Exact Name of Registrant as Specified in its Charter) | | | | | | | | | | | |
| Delaware | | | 42-1547151 |
| (State or Other Jurisdiction of Incorporation or Organization) | | | (I.R.S. Employer Identification No.) |
| | |
| 239 Washington Street | Jersey City | New Jersey | 07302 |
| (Address of Principal Executive Offices) | (City) | (State) | (Zip Code) |
(732) 590-9200
(Registrant’s Telephone Number)
Securities Registered Pursuant to Section 12(b) of the Act: | | | | | | | | | | | | | | |
| Title of each class | | Trading Symbol (s)
| | Name of each exchange on which registered |
| Common | | PFS | | New York Stock Exchange |
Indicate by check mark if the Registrant is a well-known seasoned issuer, as defined in Rule 405 of the Securities Act. Yes ☒ No ☐
Indicate by check mark if the Registrant is not required to file reports pursuant to Section 13 or Section 15(d) of the Securities Act. Yes ☐ No ☒
Indicate by check mark whether the Registrant: (1) has filed all reports required to be filed by Section 13 or 15(d) of the Securities Exchange Act of 1934 during the preceding twelve months (or for such shorter period that the Registrant was required to file such reports); and (2) has been subject to such filing requirements for the past 90 days. Yes ☒ No ☐
Indicate by check mark whether the registrant has submitted electronically and every Interactive Data File required to be submitted pursuant to Rule 405 of Regulation S-T (§ 232.405 of this chapter) during the preceding 12 months (or for such shorter period that the registrant was required to submit and post such files). Yes ☒ No ☐
Indicate by check mark whether the Registrant is a large accelerated filer, an accelerated filer, a non-accelerated filer, a smaller reporting company, or an emerging growth company. See definitions of “large accelerated filer,” “accelerated filer,” “smaller reporting company,” and "emerging growth company" in Rule 12b-2 of the Exchange Act. | | | | | | | | | | | | | | | | | | | | |
| Large accelerated filer | | ☒ | | Accelerated Filer | | ☐ |
| Non-Accelerated Filer | | ☐ | | Smaller Reporting Company | | ☐ |
| | | | Emerging Growth Company | | ☐ |
If an emerging growth company, indicate by check mark if the Registrant has elected not to use the extended transition period for complying with any new or revised financial accounting standards provided pursuant to Section 13(a) of the Exchange Act. ☐
Indicate by check mark whether the registrant has filed a report on and attestation to its management’s assessment of the effectiveness of its internal control over financial reporting under Section 404(b) of the Sarbanes-Oxley Act (15 U.S.C. 7262(b)) by the registered public accounting firm that prepared or issued its audit report ☒
If securities are registered pursuant to Section 12(b) of the Act, indicate by check mark whether the financial statements of the registrant included in the filing reflect the correction of an error to previously issued financial statements Yes ☐ No ☐
Indicate by check mark whether any of those error corrections are restatements that required a recovery analysis of incentive-based compensation received by any of the registrant's executive officers during the relevant recovery period pursuant to § 240.10D-1(b). ☐
Indicate by check mark whether the Registrant is a shell company (as defined in Rule 12b-2 of the Exchange Act). Yes ☐ No ☒
As of February 3, 2025, there were 137,565,966 issued and 130,489,493 outstanding shares of the Registrant’s Common Stock. The aggregate value of the voting and non-voting common equity held by non-affiliates of the Registrant, based on the closing price of the Common Stock as of June 30, 2024, as quoted by the NYSE, was approximately $1.73 billion.
| | | | | | | | | | | | | | |
| Auditor Name: KPMG LLP | | Auditor Location: New York, New York | | Auditor Firm ID: 185 |
DOCUMENTS INCORPORATED BY REFERENCE
1.Proxy Statement for the 2025 Annual Meeting of Stockholders of the Registrant (Part III).
PROVIDENT FINANCIAL SERVICES, INC.
INDEX TO FORM 10-K
| | | | | | | | |
| Item Number | | Page Number |
| PART I |
| 1. | | |
| 1A. | | |
| 1B. | | |
| 1C. | | |
| 2. | | |
| 3. | | |
| 4. | | |
|
| PART II |
| 5. | | |
| 6. | | |
| 7. | | |
| 7A. | | |
| 8. | | |
| 9. | | |
| 9A. | | |
| 9B. | | |
| 9C. | | |
|
| PART III |
| 10. | | |
| 11. | | |
| 12. | | |
| 13. | | |
| 14. | | |
|
| PART IV |
| 15. | | |
| 16. | | |
| | |
| | |
Forward Looking Statements
Certain statements contained herein are “forward-looking statements” within the meaning of the Private Securities Litigation Reform Act of 1995, Section 27A of the Securities Act of 1933, as amended, and Section 21E of the Securities Exchange Act of 1934, as amended. Such forward-looking statements may be identified by reference to a future period or periods, or by the use of forward-looking terminology, such as “may,” “will,” “believe,” “expect,” “estimate,” "project," "intend," “anticipate,” “continue,” or similar terms or variations on those terms, or the negative of those terms. Forward-looking statements are subject to numerous risks and uncertainties, including, but not limited to, those set forth in Item 1A of the Company's Annual Report on Form 10-K, as supplemented by its Quarterly Reports on Form 10-Q, and those related to the economic environment, particularly in the market areas in which the Company operates, inflation and unemployment, competitive products and pricing, real estate values, fiscal and monetary policies of the U.S. Government, the effects of the recent turmoil in the banking industry, changes in accounting policies and practices that may be adopted by the regulatory agencies and the accounting standards setters, changes in government regulations affecting financial institutions, including regulatory fees and capital requirements, inflation or changes in prevailing interest rates, potential goodwill impairment, acquisitions and the integration of acquired businesses, credit risk management, asset-liability management, the financial and securities markets, the availability of and costs associated with sources of liquidity, any failure to realize the anticipated benefits of the merger transaction when expected or at all; the possibility that the transaction may be more expensive to complete than anticipated, including as a result of unexpected conditions, factors or events, potential adverse reactions or changes to business, employee, customer and/or counterparty relationships, including those resulting from the completion of the merger and integration of the companies; major catastrophes such as earthquakes, floods or other natural or human disasters and infectious disease outbreaks and the related disruption to local, regional and global economic activity and financial markets, the imposition of tariffs or other domestic or international governmental policies impacting the value of the products of our borrowers, the impact of any military conflict, terrorist act or other geopolitical acts, and system failures or cyber-security breaches of our information technology infrastructure and those of our third-party service providers, and the impact of a potential shutdown of the federal government.
The Company cautions readers not to place undue reliance on any such forward-looking statements which speak only as of the date they are made. The Company advises readers that the factors listed above could affect the Company's financial performance and could cause the Company's actual results for future periods to differ materially from any opinions or statements expressed with respect to future periods in any current statements. The Company does not assume any duty, and does not undertake, to update any forward-looking statements to reflect events or circumstances after the date of this statement.
PART I
Item 1. Business
Provident Financial Services, Inc.
The Company is a Delaware corporation which became the holding company for Provident Bank (the “Bank”) on January 15, 2003, following the completion of the Bank's conversion to a New Jersey-chartered capital stock savings bank. On January 15, 2003, the Company issued an aggregate of 59,618,300 shares of its common stock, par value $0.01 per share in a subscription offering, and contributed $4.8 million in cash and 1,920,000 shares of its common stock, which amounted to $24.0 million in aggregate, to The Provident Bank Foundation, a charitable foundation established by the Bank. The Company recognized an expense, net of income tax benefit, equal to the cash and fair value of the stock during 2003. Conversion costs were deferred and deducted from the proceeds of the shares sold in the offering. As a result of the conversion and related stock offering, the Company raised $567.2 million in net proceeds, of which $293.2 million was utilized to acquire all of the outstanding common stock of the Bank. The Company owns all of the outstanding common stock of the Bank, and as such, is a bank holding company subject to regulation by the Board of Governors of the Federal Reserve System ("Federal Reserve Board" or "Federal Reserve").
On May 16, 2024, the Company completed its merger with Lakeland Bancorp, Inc. ("Lakeland"), which added $10.59 billion to total assets, $7.91 billion to total loans, $8.62 billion to total deposits and 68 full-service banking offices in New Jersey and New York. The Company closed 13 of the acquired Lakeland banking offices and nine legacy Bank branches in the third quarter of 2024 due to geographic overlap.
Under the merger agreement, each share of Lakeland common stock was converted into the right to receive 0.8319 shares of the Company's common stock, a total of 54,356,954 shares converted, plus cash in lieu of fractional shares. The total consideration paid for the acquisition of Lakeland was $876.8 million. In connection with the acquisition, Lakeland Bank, a wholly owned subsidiary of Lakeland, was merged with and into the Bank.
The acquisition was accounted for under the acquisition method of accounting. Under this method of accounting, the purchase price has been allocated to the respective assets acquired and liabilities assumed based upon their estimated fair values, net of tax. The excess of consideration paid over the estimated fair value of the net assets acquired initially totaled $190.9 million and was recorded as goodwill. ASC 805 provides for a period of time during which the acquirer may adjust provisional amounts recognized at the acquisition date to their subsequently determined acquisition-date fair values, referred to as the "measurement period." Adjustments during the measurement period are not limited to just those relating to assets acquired and liabilities assumed but apply to all aspects of business combination accounting (e.g., the consideration transferred). Measurement-period adjustments are calculated as if they were known at the acquisition date, but are recognized in the reporting period in which they are determined. Prior period information is not revised, including the effect on earnings of any amounts they would have recorded in previous periods if the accounting had been completed at the acquisition date. In accordance with ASC 805, the Company recorded a measurement period adjustment and decreased goodwill by $10.5 million to $180.4 million, related to finalizing the valuation.
Capital Management. During 2024, the Company paid cash dividends totaling $101.0 million and repurchased 89,569 shares of its common stock at an average cost of $14.90 per share, which totaled $1.3 million, all of which were made in connection with withholding to cover income taxes on the vesting of stock-based compensation. As of December 31, 2024, 3.1 million shares remained eligible for repurchase under the board-approved stock repurchase program. The Company and the Bank were “well capitalized” as of December 31, 2024 under current regulatory standards.
Available Information. The Company is a public company, and files interim, quarterly and annual reports with the Securities and Exchange Commission (“SEC”). The SEC maintains an Internet site (http://www.sec.gov) that contains reports, proxy and information statements, and other information regarding issuers that file electronically with the SEC, including the Company. All SEC reports and amendments to these reports are available on the SEC's website and are made available as soon as practical after they have been filed or furnished to the SEC and are available on the Bank’s website, www.provident.bank, at the “Investor Relations” page, without charge from the Company. Information on our website should not be considered a part of this Annual Report on Form 10-K.
Provident Bank
Established in 1839, the Bank is a New Jersey-chartered capital stock savings bank operating full-service branch offices throughout New Jersey, Bucks, Lehigh and Northampton counties in Pennsylvania, as well as Orange, Queens and Nassau Counties in New York. As a community- and customer-oriented institution, the Bank emphasizes personal service and customer convenience in serving the financial needs of the individuals, families and businesses residing in its primary market areas. The Bank attracts deposits from the general public and businesses primarily in the areas surrounding its banking offices and uses those funds, together with funds generated from operations and borrowings, to originate commercial real estate loans, commercial business loans, residential mortgage loans, and consumer loans. The Bank invests in mortgage-backed securities and other permissible investments. The Bank also provides fiduciary and wealth management services through its wholly owned subsidiary, Beacon Trust Company and insurance brokerage services through its wholly owned subsidiary, Provident Protection Plus, Inc.
The following are highlights of the Bank’s operations:
Diversified Loan Portfolio. To improve asset yields and manage its exposure to interest rate risk, the Bank continues to emphasize the origination of commercial real estate loans, multi-family loans and commercial business loans. These loans generally have adjustable rates or shorter fixed terms and interest rates that are higher than the rates applicable to one-to four-family residential mortgage loans. However, these loans generally have a higher risk of loss than one- to four-family residential mortgage loans.
Asset Quality. As of December 31, 2024, non-performing assets were $81.5 million or 0.34% of total assets, compared to $61.3 million or 0.43% of total assets as of December 31, 2023. The Bank continues to focus on conservative underwriting criteria and on active and timely collection efforts.
Emphasis on Relationship Banking and Core Deposits. The Bank emphasizes the acquisition and retention of core deposit accounts, consisting of savings and demand deposit accounts, and expanding customer relationships. Core deposit accounts totaled $15.46 billion as of December 31, 2024, representing 83.0% of total deposits, compared with $9.20 billion, or 89.4% of total deposits as of December 31, 2023. The Bank also focuses on increasing the number of households and businesses served and the number of banking products per customer.
Non-Interest Income. The Bank’s focus on transaction accounts and expanded products and services has enabled it to generate significant non-interest income. In addition to traditional depository and lending fees, the Bank generates non-interest
income from investment, insurance, wealth and asset management services it offers to generate non-interest income. Total non-interest income was $94.1 million for the year ended December 31, 2024, compared with $79.8 million for the year ended December 31, 2023, of which wealth management income, fee income and insurance agency income were $30.5 million, $34.1 million and $16.2 million, respectively, for the year ended December 31, 2024, compared with $27.7 million, $24.4 million and $13.9 million, respectively, for the year ended December 31, 2023.
Managing Interest Rate Risk. The Bank manages its exposure to interest rate risk through the origination and retention of adjustable rate and shorter-term loans, and its investments in securities. In addition, the Bank uses interest rate swaps as part of its interest rate risk management strategy. Interest rate swaps designated as cash flow hedges involve the receipt of variable amounts from a counterparty in exchange for the Bank making fixed-rate payments over the life of the agreements without exchange of the underlying notional amount. These interest rate swaps are used to hedge the variable cash outflows associated with Federal Home Loan Bank of New York ("FHLBNY") borrowings and brokered demand deposits. As of December 31, 2024, 57.73% of the Bank’s loan portfolio had a term to maturity of one year or less, or had adjustable interest rates. As of December 31, 2024, the Bank’s held to maturity and available for sale securities portfolio totaled $3.21 billion and had an expected average life of 5.32 years.
MARKET AREA
The Company and the Bank are headquartered in Jersey City, New Jersey, and each maintain administrative offices in Iselin, New Jersey. As of December 31, 2024, the Bank operated a network of 140 full-service banking offices throughout fourteen counties in New Jersey, as well as three counties in Pennsylvania and three counties in New York. The Bank maintains satellite loan production offices throughout New Jersey, as well as in Bethlehem, Philadelphia and Plymouth Meeting, Pennsylvania and Nassau and Orange County, New York. The Bank’s lending activities, though concentrated in the communities surrounding its offices, extend predominantly throughout New Jersey, eastern Pennsylvania and Nassau, Orange and Queens County, New York.
The Bank’s primary market area includes a mix of urban and suburban communities, and has a diversified mix of industries including pharmaceutical, manufacturing, network communications, insurance and financial services, healthcare, and retail. According to the U.S. Census Bureau’s most recent population data, the Bank’s New Jersey market area has a population of approximately 7.4 million, which was 79.6% of the state’s total population. The Bank’s Pennsylvania market area has a population of approximately 1.3 million, which was 10.4% of that state’s total population. The Bank's New York market area has a population of approximately 4.0 million, which was 20.6% of the state's total population. Because of the diversity of industries within the Bank’s market area and, to a lesser extent, its proximity to the New York City financial markets, the area’s economy can be significantly affected by changes in national and international economies. According to the U.S. Bureau of Labor Statistics, the preliminary unemployment rate in New Jersey was 4.6% as of December 31, 2024, a decrease from 4.8% as of December 31, 2023. The preliminary unemployment rate in Pennsylvania was 3.6% as of December 31, 2024, an increase from 3.4% as of December 31, 2023. The preliminary unemployment rate in New York was 4.4% as of December 31, 2024, a decrease from 4.6% as of December 31, 2023.
Within its primary market areas in New Jersey, Pennsylvania and New York, the Bank had an approximate 4.71%, 0.64% and 0.20% share of bank deposits as of June 30, 2024, respectively, the latest date for which statistics are available.
COMPETITION
The Bank faces significant competition in originating and retaining loans and attracting deposits as its market areas have a high concentration of financial institutions, including large money center and regional banks, community banks, credit unions, investment brokerage firms and insurance companies. The Bank faces direct competition for loans from each of these institutions as well as from mortgage companies, online lenders and other loan origination firms operating in its market area. The Bank’s most direct competition for deposits comes from several commercial banks and savings banks in its market area. Certain of these banks have substantially greater financial resources than the Bank. The Bank also faces significant competition for deposits from the mutual fund and investment advisory industries and from investors’ direct purchases of short-term money market securities and other corporate and government securities.
The Bank competes in this environment by maintaining a diversified product line, including mutual funds, annuities and other investment services made available through its investment subsidiaries. Relationships with customers are built and maintained through the Bank’s branch network, its deployment of branch ATMs, and its mobile, digital and telephone services.
LENDING ACTIVITIES
The Bank originates commercial real estate loans, commercial business loans, fixed-rate and adjustable-rate mortgage loans collateralized by one- to four-family residential real estate and other consumer loans, for borrowers generally located within its primary market area.
The Bank originates commercial real estate loans that are secured by income-producing properties such as multi-family apartment buildings, industrial and retail properties and office buildings. Generally, these loans have maturities of either 5 or 10 years.
The Bank has historically provided construction loans for commercial projects, including residential rental and industrial projects, that will be retained as investments by the borrowers and to a lesser extent single family and condominium projects intended for sale. The Bank underwrites most construction loans for a term of three years or less. The majority of these loans are underwritten on a floating rate basis. The Bank recognizes that there is higher risk in construction lending than permanent lending. As such, the Bank takes certain precautions to mitigate this risk, including the retention of an outside engineering firm to perform plan and cost reviews, and to review all construction advances made against work in place, and a limitation on how and when loan proceeds are advanced.
Commercial loans are made to businesses of varying size and type within the Bank’s market. The Bank lends to established businesses, and the loans are generally secured by business assets such as equipment, receivables, inventory, real estate or marketable securities. On a limited basis, the Bank makes unsecured commercial loans. Most commercial lines of credit are made on a floating interest rate basis and most term loans are made on a fixed interest rate basis, usually with terms of five years or less. Provident also has an asset-based lending department which specializes in utilizing particular assets to fund the working capital needs of borrowers. Additionally, the Bank provides warehouse lines of credit used by mortgage bankers to originate one-to-four family residential mortgage loans that are pre-sold into the secondary mortgage market, which includes state and national banks, national mortgage banking firms, insurance companies and government-sponsored enterprises, including the Federal National Mortgage Association, the Federal Home Loan Mortgage Corporation and others.
Residential mortgage loans are primarily underwritten to standards that allow the sale of the loans to the secondary markets, primarily to the Federal Home Loan Mortgage Corporation (“FHLMC” or “Freddie Mac”). To manage interest rate risk, the Bank has the option to sell fixed-rate residential mortgages that it originates with terms greater than 15 years. However, the Bank commonly retains biweekly payment fixed-rate residential mortgage loans with a maturity of 30 years or less and most of the originated adjustable-rate mortgages for its portfolio.
The Bank originates consumer loans that are secured, in most cases, by a borrower’s assets. Home equity loans and home equity lines of credit that are secured by a first or second mortgage lien on the borrower’s residence comprise the largest category of the Bank’s consumer loan portfolio.
Loans Held for Investment Portfolio Composition. Set forth below is selected information concerning the composition of the loans held for investment portfolio by type (after deductions for deferred fees and costs, unearned discounts and premiums and allowances for credit losses) at the dates indicated.
| | | | | | | | | | | | | | | | | | | | | | | | | | | | | | | | | | | | | | | | | | | | | | | | | | | | | | | | | | | |
| | As of December 31, |
| | 2024 | | 2023 | | 2022 | | 2021 | | 2020 |
| | Amount | | Percent | | Amount | | Percent | | Amount | | Percent | | Amount | | Percent | | Amount | | Percent |
| | (Dollars in thousands) |
| Commercial mortgage loans | $ | 7,228,078 | | | 39.14 | % | | $ | 4,512,411 | | | 41.91 | % | | $ | 4,316,185 | | | 42.48 | % | | $ | 3,827,370 | | | 40.28 | % | | $ | 3,458,666 | | | 35.58 | % |
| Multi-family mortgage loans | 3,382,933 | | | 18.32 | | | 1,812,500 | | | 16.83 | | | 1,513,818 | | | 14.90 | | | 1,364,397 | | | 14.36 | | | 1,484,515 | | | 15.27 | |
| Construction loans | 823,503 | | | 4.46 | | | 653,246 | | | 6.07 | | | 715,494 | | | 7.04 | | | 683,166 | | | 7.19 | | | 541,939 | | | 5.57 | |
| Residential mortgage loans | 2,010,637 | | | 10.89 | | | 1,164,956 | | | 10.82 | | | 1,177,698 | | | 11.59 | | | 1,202,638 | | | 12.66 | | | 1,294,702 | | | 13.32 | |
| Total mortgage loans | 13,445,151 | | | 72.81 | | | 8,143,113 | | | 75.63 | | | 7,723,195 | | | 76.01 | | | 7,077,571 | | | 74.49 | | | 6,779,822 | | | 69.74 | |
| Commercial loans | 4,608,600 | | | 24.96 | | | 2,442,406 | | | 22.69 | | | 2,233,670 | | | 21.98 | | | 2,188,866 | | | 23.04 | | | 2,567,470 | | | 26.41 | |
| Consumer loans | 613,819 | | | 3.32 | | | 299,164 | | | 2.78 | | | 304,780 | | | 3.00 | | | 327,442 | | | 3.45 | | | 492,566 | | | 5.07 | |
| Total gross loans held for investment | 18,667,570 | | | 101.09 | | | 10,884,683 | | | 101.10 | | | 10,261,645 | | | 100.99 | | | 9,593,879 | | | 100.98 | | | 9,839,858 | | | 101.22 | |
| Premiums on purchased loans | 1,338 | | | 0.01 | | | 1,474 | | | 0.01 | | | 1,380 | | | 0.01 | | | 1,451 | | | 0.02 | | | 1,566 | | | 0.02 | |
| Net deferred fees | (9,538) | | | (0.06) | | | (12,456) | | | (0.12) | | | (14,142) | | | (0.14) | | | (13,706) | | | (0.15) | | | (18,534) | | | (0.20) | |
| Total loans | 18,659,370 | | | 101.04 | | | 10,873,701 | | | 100.99 | | | 10,248,883 | | | 100.86 | | | 9,581,624 | | | 100.85 | | | 9,822,890 | | | 101.04 | |
| Allowance for credit losses | (193,432) | | | (1.04) | | | (107,200) | | | (0.99) | | | (88,023) | | | (0.86) | | | (80,740) | | | (0.85) | | | (101,466) | | | (1.04) | |
| Total loans, net | $ | 18,465,938 | | | 100.00 | % | | $ | 10,766,501 | | | 100.00 | % | | $ | 10,160,860 | | | 100.00 | % | | $ | 9,500,884 | | | 100.00 | % | | $ | 9,721,424 | | | 100.00 | % |
Loan Held for Investment Maturity Schedule. The table sets forth certain information as of December 31, 2024, regarding the maturities of loans in the loans held for investment portfolio. Demand loans having no stated schedule of repayment and no stated maturity, and overdrafts are reported as due within one year.
| | | | | | | | | | | | | | | | | | | | | | | | | | | | | | | | | | | |
| Within One Year | | One Through Five Years | | Five Through Fifteen Years | | Greater than Fifteen Years | | Purchase Accounting Adjustments ("PAA") | | Total |
| | (In thousands) |
| Commercial mortgage loans | $ | 722,115 | | | $ | 3,215,717 | | | $ | 3,166,647 | | | $ | 227,891 | | | $ | (103,289) | | | $ | 7,228,078 | |
| Multi-family mortgage loans | 250,983 | | | 1,260,295 | | | 1,833,110 | | | 86,855 | | | (104,292) | | | 3,382,933 | |
| Construction loans | 504,200 | | | 275,346 | | | 45,171 | | | 2,073 | | | (48,310) | | | 823,503 | |
| Residential mortgage loans | 3,600 | | | 32,072 | | | 390,296 | | | 1,687,958 | | | (3,287) | | | 2,010,637 | |
| Total mortgage loans | 1,480,898 | | | 4,783,430 | | | 5,435,224 | | | 2,004,777 | | | (259,178) | | | 13,445,151 | |
| Commercial loans | 873,103 | | | 1,308,108 | | | 2,276,672 | | | 219,008 | | | (68,291) | | | 4,608,600 | |
| Consumer loans | 4,788 | | | 43,809 | | | 194,044 | | | 387,882 | | | (16,704) | | | 613,819 | |
| Total gross loans | $ | 2,358,789 | | | $ | 6,135,347 | | | $ | 7,905,940 | | | $ | 2,611,667 | | | $ | (344,173) | | | $ | 18,667,570 | |
Fixed- and Adjustable-Rate Loan Schedule. The following table sets forth as of December 31, 2024 the amount of all fixed-rate and adjustable-rate loans due after December 31, 2025.
| | | | | | | | | | | | | | | | | |
| | Due After December 31, 2025 |
| | Fixed | | Adjustable | | Total |
| | (In thousands) |
| Commercial mortgage loans | $ | 3,007,304 | | | $ | 3,498,659 | | | $ | 6,505,963 | |
| Multi-family mortgage loans | 1,449,622 | | | 1,682,328 | | | 3,131,950 | |
| Construction loans | 40,896 | | | 278,407 | | | 319,303 | |
| Residential mortgage loans | 1,543,386 | | | 463,651 | | | 2,007,037 | |
| Total mortgage loans | 6,041,208 | | | 5,923,045 | | | 11,964,253 | |
| Commercial loans | 1,346,409 | | | 2,389,088 | | | 3,735,497 | |
| Consumer loans | 271,911 | | | 337,120 | | | 609,031 | |
| Total loans | $ | 7,659,528 | | | $ | 8,649,253 | | | $ | 16,308,781 | |
Commercial Real Estate Loans. The Bank originates loans secured by mortgages on various commercial income producing properties, including industrial and retail properties and office buildings. Commercial real estate loans were 39.1% of the total loan portfolio as of December 31, 2024. A substantial majority of the Bank’s commercial real estate loans are secured by properties located in New Jersey, New York and Pennsylvania.
The Bank originates commercial real estate loans with adjustable rates and with fixed interest rates for a period that is generally five to ten years or less, which may adjust after the initial period. Typically these loans are written for maturities of ten years or less and generally have an amortization schedule of 25 or 30 years. As a result, the typical amortization schedule will result in a substantial principal payment upon maturity. The Bank generally underwrites commercial real estate loans to a maximum 75% advance against either the appraised value of the property, or its purchase price (for loans to fund the acquisition of real estate), whichever is less. The Bank generally requires minimum debt service coverage of 1.20 times. There is a potential risk that the borrower may be unable to pay off or refinance the outstanding balance at the loan maturity date. The Bank typically lends to experienced owners or developers who have knowledge and expertise in the commercial real estate market.
Among the reasons for the Bank’s continued emphasis on commercial real estate lending is the desire to invest in assets bearing interest rates that are generally higher than interest rates on residential mortgage loans and more sensitive to changes in market interest rates. Commercial real estate loans, however, entail significant additional credit risk as compared to one- to four-family residential mortgage loans, as they typically involve larger loan balances concentrated with single borrowers or groups of related borrowers. In addition, the payment experience on commercial real estate loans secured by income-producing properties is typically dependent on the successful operation of the related real estate project, and thus may be more significantly impacted by adverse conditions in the real estate market or in the economy generally.
The Bank performs extensive due diligence in underwriting commercial real estate loans due to the larger loan amounts and the riskier nature of such loans. The Bank assesses and mitigates the risk in several ways, including inspection of all such properties and the review of the overall financial condition of the borrower and guarantors, which may include, for example, the review of the rent rolls and the verification of income. If applicable, a tenant analysis and market analysis are part of the underwriting. Generally, for commercial real estate secured loans in excess of $1.0 million and for all other commercial real estate loans where it is deemed appropriate, the Bank requires environmental professionals to inspect the property and ascertain any potential environmental risks.
In accordance with regulatory guidelines, the Bank requires a full independent appraisal for commercial real estate properties. The appraiser must be selected from the Bank’s approved list, or otherwise approved by the Chief Credit Officer in instances such as an out-of-state or special use property. The Bank also employs an independent review appraiser to ensure that the appraisal meets the Bank’s standards. Financial statements are also required annually for review. The Bank’s policy also requires that a property inspection of commercial mortgages over $2.5 million be completed at least every 18 months, or more frequently when warranted.
The Bank’s largest commercial mortgage loan as of December 31, 2024 was a $42.2 million loan secured by a first leasehold mortgage lien on a retail property totaling 96 thousand square feet located in New York, New York. The property is 100% leased to four retail tenants, two of which are considered investment grade and occupy 61% of the leasable space. The LTV is 58% and is personally guaranteed by three very strong owners. The loan has a risk rating of “3” or of “average quality” and was performing in accordance with its terms and conditions as of December 31, 2024. (For the Bank’s largest group borrower exposure —see discussion on “Loans to One Borrower”).
Multi-family Loans. The Bank underwrites loans secured by multi-family properties that have five or more units. The Bank considers multi-family lending a component of the commercial real estate lending portfolio. Multi-family loans were 18.3% of the total loan portfolio as of December 31, 2024. The underwriting standards and procedures that are used to underwrite commercial real estate loans are used to underwrite multi-family loans, except the loan-to-value ratio generally should not exceed 80% of the appraised value of the property, the debt-service coverage should be a minimum of 1.15 times and an amortization period of up to 30 years may be used.
The Bank’s largest multi-family loan as of December 31, 2024 was a $56.2 million loan secured by a first mortgage lien on a five-story apartment building totaling 275 units plus parking and amenity space, located in Willow Grove, Pennsylvania. The project sponsor has over 35 years of investment and management experience in multi-family real estate in the Northeastern USA. The loan has a risk rating of “4” or of “acceptable quality” and was performing in accordance with its terms and conditions as of December 31, 2024. (For the Bank’s largest group borrower exposure —see discussion on “Loans to One Borrower”).
Construction Loans. The Bank originates commercial construction loans. Commercial construction lending includes both new construction of residential and commercial real estate projects and the rehabilitation of existing structures.
The Bank’s commercial construction financing includes projects constructed for investment purposes (rental property), owner-occupied business properties and to a lesser extent, projects for sale (single family/condominiums). To mitigate the speculative nature of construction loans, the Bank may require significant pre-leasing on rental properties; requires that a percentage of the for-sale single-family residences or condominiums be under contract to support construction loan advances; requires other covenants on residential for rental projects depending on whether the project is vertical or horizontal construction; and requires meaningful guarantees from financially strong sponsors. In most cases, for the single family and condominium projects, the Bank limits its exposure against houses or units that are not under contract. Similarly, commercial construction loans usually have commitments for significant pre-leasing, or funds are held back until the leases are finalized. As of December 31, 2024, the Bank's construction and land development portfolio balance to total risk-based capital ratio was approximately 36%. Given the current economic environment, this ratio is being closely managed and has been reducing moderately over time. Funding requirements and loan structure for residential rental projects vary depending on whether such projects are vertical or horizontal construction.
The Bank generally underwrites construction loans for a term of three years or less. The majority of the Bank’s construction loans are floating-rate loans with a maximum 75% loan-to-value ratio for the completed project. The Bank employs professional engineering firms to assist in the review of construction cost estimates and make site inspections to determine if the work has been completed prior to the advance of funds for the project.
Construction lending generally involves a greater degree of risk than commercial real estate or multi-family lending. Repayment of a construction loan is, to a great degree, dependent upon the successful and timely completion of the construction of the subject project and the successful marketing of the sale or lease of the project. Construction delays, slower than anticipated absorption or the financial impairment of the builder may negatively affect the borrower’s ability to repay the loan.
For all construction loans, the Bank requires an independent appraisal, which includes information on market rents and/or comparable sales for competing projects. The Bank also obtains personal guarantees, where appropriate, and conducts environmental due diligence as appropriate.
The Bank also employs other means to mitigate the risk of the construction lending process. On commercial construction projects that the developer maintains for rent, the Bank typically holds back funds for tenant improvements until a lease is executed. For single family and condominium financing, the Bank generally requires payment for the release of a unit that exceeds the amount of the loan advance attributable to such unit.
The Bank’s largest construction loan as of December 31, 2024 was a $45.0 million commitment secured by a first mortgage lien on property and improvements related to the construction of a 334-unit, multi-family apartment complex in Linden, New Jersey. The loan had an outstanding balance of $2.5 million as of December 31, 2024. The total loan amount is $90.0 million, 50% of which is co-led with another bank. This loan closed in 2024 with construction completion expected in mid-2026 and lease-up through 2027. The project sponsor has over 35 years of multi-family development, investment and management experience in New Jersey and Pennsylvania and is located in New Jersey. The loan has a risk rating of “4” or of “acceptable quality” and was performing in accordance with its terms and conditions as of December 31, 2024.
Residential Mortgage Loans. The Bank originates residential mortgage loans secured by first mortgages on one- to four-family residences, generally located in the states of New Jersey, New York and the eastern part of Pennsylvania. The Bank originates residential mortgages primarily through commissioned mortgage representatives. The Bank originates both fixed-rate and adjustable-rate mortgages. As of December 31, 2024, $2.01 billion or 10.9% of the total loan portfolio consisted of
residential real estate loans. Of the one- to four-family loans at that date, 76.9% were fixed-rate and 23.1% were adjustable-rate loans.
The Bank originates fixed-rate fully amortizing residential mortgage loans with principal and interest payments due each month, that typically have maturities ranging from 10 to 30 years. The Bank also originates fixed-rate residential mortgage loans with maturities of 10, 15, 20 and 30 years that require the payment of principal and interest on a biweekly basis. Fixed-rate jumbo residential mortgage loans (loans over the maximum that one of the government-sponsored agencies will purchase) are originated with maturities of up to 30 years. The Bank currently offers adjustable-rate mortgage loans with a fixed-rate period of 5, 7 or 10 years prior to the first annual interest rate adjustment. The standard adjustment formula is the one-year constant maturity Treasury rate plus 2.75%, adjusting annually after its first re-set period, with a 2% maximum annual adjustment and a 6% maximum adjustment over the life of the loan.
Residential mortgage loans are primarily underwritten to Freddie Mac standards. The Bank’s standard maximum loan to value ratio is 80%. However, working through mortgage insurance companies, the Bank underwrites loans for sale to Freddie Mac programs that will finance up to 97% of the value of the residence. Generally all fixed-rate loans with terms of 20 years or more are sold into the secondary market with servicing rights retained. Fixed-rate residential mortgage loans retained in the Bank’s portfolio generally include loans with a term of 15 years or less and biweekly payment residential mortgage loans with a term of 30 years or less. The Bank retains the majority of originated adjustable-rate mortgages for its portfolio.
Loans are sold without recourse, generally with servicing rights retained by the Bank. The percentage of loans sold into the secondary market will vary depending upon interest rates and the Bank’s strategies for managing exposure to interest rate risk. In 2024, residential real estate loans originated that were sold into the secondary market totaled $48.3 million.
The retention of adjustable-rate mortgages, as opposed to longer-term, fixed-rate residential mortgage loans, helps reduce the Bank’s exposure to interest rate risk. However, adjustable-rate mortgages generally pose credit risks different from the credit risks inherent in fixed-rate loans primarily because as interest rates rise, the underlying debt service payments of the borrowers rise, thereby increasing the potential for default. The Bank believes that these credit risks, which have not had a material adverse effect on the Bank to date, generally are less onerous than the interest rate risk associated with holding 20- and 30-year fixed-rate loans in its loan portfolio.
For many years, the Bank has offered discounted rates on residential mortgage loans to low- and moderate-income individuals. Loans originated in this category over the last five years have totaled $117.2 million. The Bank also offers a special rate program for first-time homebuyers under which originations have totaled over $135.8 million for the past five years. The Bank does not originate or purchase sub-prime or option ARM loans.
Commercial Loans. The Bank underwrites commercial loans to corporations, partnerships and other businesses. Commercial loans represented 25.0% of the total loan portfolio as of December 31, 2024. The Bank primarily offers commercial loans for equipment purchases, lines of credit for working capital purposes, letters of credit and real estate loans where the borrower is the primary occupant of the property. Most commercial loans are originated on a floating-rate basis and the majority of fixed-rate commercial term loans are fully amortized over a five-year period. Owner-occupied commercial real estate loans are generally underwritten to terms consistent with those utilized for commercial real estate; however, the maximum loan-to-value ratio for owner-occupied commercial real estate loans is generally 80%.
The Bank also underwrites Small Business Administration (“SBA”) guaranteed loans and guaranteed or assisted loans through various state, county and municipal programs. These governmental guarantees are typically used in cases where the borrower requires additional credit support. The Bank has “Preferred Lender” status with the SBA, allowing a more streamlined application and approval process.
The underwriting of a commercial loan is based upon a review of the financial statements of the prospective borrower and guarantors. In most cases, the Bank obtains a general lien on accounts receivable and inventory, along with the specific collateral such as real estate or equipment, as appropriate.
Commercial loans generally bear higher interest rates than mortgage loans, but they also involve a higher risk of default and a higher loss given default since their repayment is generally dependent on the cash flow of the borrower’s business. As a result, the availability of funds for the repayment of commercial loans may be substantially dependent on the success of the business itself and the general economic environment.
The Bank’s largest commercial loan commitment as of December 31, 2024 was a $67.5 million fully amortizing term loan to a large New Jersey-based specialty pharmaceutical company. The loan to this long-standing client, which was originated in late 2024, has a seven-year term and is secured by substantially all the assets of the company. This loan in conjunction with new subordinated debt and cash-on-hand was used to refinance higher cost 3rd party debt and is classified as a
highly leveraged transaction (HLT) per Bank Policy. It is expected that this borrower will de-leverage rapidly over the next 2 years. The loan has a risk rating of “4” or of “acceptable quality”. (For the Bank’s largest group borrower exposure —see discussion on “Loans to One Borrower”).
The Bank also has a dedicated asset-based lending group (ABL Group) as part of the Lakeland merger which is staffed by highly experienced ABL lenders. The ABL Group had loan commitments totaling $175.4 million with loans outstanding of $125.6 million as of December 31, 2024. ABL is a specialized type of formula-based secured lending against the verified value of a company’s assets. The ABL Group primarily provides lines of credit against a discounted value of eligible accounts receivable and inventory and term loans against a discounted appraised value of fixed assets. Commercial mortgages against a company’s appraised owner-occupied real estate may also be provided in conjunction with the overall relationship. Thorough due diligence is conducted on the company and the assets being financed which typically includes a field examination of its books and records and working assets and 3rd party appraisals of its fixed assets and owner-occupied real estate when applicable. Loan monitoring is also enhanced and can be daily if necessary and includes detailed reporting on the company’s performance and lendable assets, periodic field examinations and appraisals when applicable. The loans and underlying collateral are also continuously tracked using a specialized asset-based lending loan and collateral system to ensure that the loan remains within its lendable collateral value.
Consumer Loans. The Bank offers a variety of consumer loans on a direct basis to individuals. Consumer loans represented 3.3% of the total loan portfolio as of December 31, 2024. Home equity loans and home equity lines of credit constituted 74.2% of the consumer loan portfolio and secured personal lines of credit originated through Beacon Trust Company constitute 0.1% of the consumer loan portfolio as of December 31, 2024. The remaining 25.7% of the consumer loan portfolio includes personal loans and unsecured lines of credit, direct auto loans and recreational and marine vehicle loans.
Interest rates on home equity loans are fixed for a term not to exceed 20 years, with the maximum loan amount being $1.0 million, which is dependent on lien position and credit score. A portion of the home equity loan portfolio includes “first-lien product loans,” under which the Bank has offered special rates to borrowers who refinance first mortgage loans on a home equity (first-lien) basis. As of December 31, 2024, first-lien home equity loans outstanding totaled $175.8 million. The Bank’s home equity lines of credit are made at floating interest rates and the Bank provides lines of credit of up to $1.0 million, dependent on lien position and credit score. The approved home equity lines and utilization amounts as of December 31, 2024 were $965.4 million and $317.2 million, respectively, representing a utilization rate of 32.9%.
Consumer loans generally entail greater credit risk than residential mortgage loans, particularly in the case of home equity loans and lines of credit secured by second lien positions, consumer loans that are unsecured or that are secured by assets that tend to depreciate, such as automobiles, boats and recreational vehicles. Collateral repossessed by the Bank from a defaulted consumer loan may not provide an adequate source of repayment of the outstanding loan balance, and the remaining deficiency may warrant further substantial collection efforts against the borrower. In addition, consumer loan collections are dependent upon the borrower’s continued financial stability, which is more likely to be adversely affected by job loss, divorce, illness or personal bankruptcy. Furthermore, the application of various federal and state laws, including bankruptcy and insolvency laws, may limit the amount the Bank can recover on such loans.
Loan Originations, Purchases, and Repayments. The following table sets forth the Bank’s loan origination, purchase and repayment activities for the periods indicated.
| | | | | | | | | | | | | | | | | |
| | Year Ended December 31, |
| | 2024 | | 2023 | | 2022 |
| | (In thousands) |
Originations: | | | | | |
| Commercial mortgage | $ | 338,604 | | | $ | 544,244 | | | $ | 1,100,698 | |
| Multi-family mortgage | 251,125 | | | 302,629 | | | 148,979 | |
| Construction | 428,867 | | | 436,818 | | | 536,414 | |
| Residential mortgage | 158,819 | | | 88,165 | | | 128,417 | |
| Commercial | 3,489,736 | | | 1,846,323 | | | 1,922,693 | |
| Consumer | 149,714 | | | 112,418 | | | 106,883 | |
| Subtotal of loans originated | 4,816,865 | | | 3,330,597 | | | 3,944,084 | |
| Loans purchased | — | | | 9,263 | | | 6,971 | |
| Total loans originated and purchased | $ | 4,816,865 | | | $ | 3,339,860 | | | $ | 3,951,055 | |
| | | | | |
| Loans acquired at fair value in acquisition | 7,907,820 | | | — | | | — | |
| | | | | |
| Loans sold | 60,658 | | | 23,867 | | | 44,006 | |
| | | | | |
Repayments: | | | | | |
| Commercial mortgage | 612,492 | | | 470,957 | | | 591,904 | |
| Multi-family mortgage | 274,010 | | | 106,196 | | | 120,549 | |
| Construction | 328,916 | | | 235,811 | | | 370,721 | |
| Residential mortgage | 146,609 | | | 111,070 | | | 159,292 | |
| Commercial | 3,352,385 | | | 1,638,201 | | | 1,866,390 | |
| Consumer | 163,224 | | | 117,914 | | | 128,981 | |
| Total repayments | $ | 4,877,636 | | | $ | 2,680,149 | | | $ | 3,237,837 | |
| Total reductions | 4,938,294 | | | 2,704,016 | | | 3,281,843 | |
Other items, net(1) | 161,731 | | | (11,026) | | | (1,953) | |
| Net increase (decrease) | $ | 7,948,122 | | | $ | 624,818 | | | $ | 667,259 | |
(1) Other items include loans transferred to held for sale, accretion of purchase accounting marks, charge-offs, deferred fees and expenses, discounts and premiums.
Loan Approval Procedures and Authority. The Bank’s board of directors approves the Lending Policy on at least an annual basis and on an interim basis as modifications are warranted. The Lending Policy sets the Bank’s lending authority for each type of loan. The Bank’s lending officers are assigned dollar authority limits based upon their experience and expertise. All commercial loan approvals require dual signature authority.
The largest individual lending authority is $20.0 million for commercial business loans and $30.0 million for commercial real estate loans, which is only available to the Chief Lending Officer and the Chief Credit Officer. Loans in excess of these limits, or which when combined with existing credits of the borrower or related borrowers exceed these limits, are presented to the management Credit Committee for approval. The Credit Committee currently consists of ten senior officers including the Chief Executive Officer, the Chief Lending Officer, the Chief Financial Officer, the Chief Credit Officer (Chair), the Senior Credit Officer, the Director of Credit Risk Management and the Director of Commercial Underwriting.
While the Bank discourages loan policy exceptions, based upon reasonable business considerations, exceptions to the policy may be warranted. The business reason and mitigants for the exception must be noted on the loan approval document. The policy exception requires the approval of the Chief Lending Officer, Chief Credit Officer, Credit Officer or the Department Manager of the lending department responsible for the underlying loan, if it is within their approval authority limit. All other policy exceptions must be approved by the Credit Committee. The Credit Administration Department reports the type and frequency of loan policy exceptions to the Risk Committee of the board of directors on a quarterly basis, or more frequently if necessary.
The Bank has adopted a risk rating system as part of the credit risk assessment of its loan portfolio. The Bank’s commercial real estate and commercial lending officers are required to maintain an appropriate risk rating for each loan in their portfolio. When the lender learns of important financial developments, the risk rating is reviewed accordingly. Risk ratings are
subject to review by the Credit Department during the underwriting, lending review and loan review processes. Loan review examinations are performed by an independent third party which validates the risk ratings on a sample basis. In addition, a risk rating can be adjusted at the weekly Credit Committee meeting and quarterly at management’s Credit Risk Management Committee, which meets to review loans rated a “Pass/Watch” ("5") or worse. The Bank requires an annual review be performed for commercial and commercial real estate loans above certain dollar thresholds, depending on loan type, to help determine the appropriate risk ratings. The risk ratings play an important role in the establishment of the loan loss provision and to confirm the adequacy of the allowance for credit losses.
Loans to One Borrower. The regulatory limit on total loans to any borrower or attributed to any one borrower is 15% of the Bank’s unimpaired capital and surplus. As of December 31, 2024, the regulatory lending limit was $369.2 million. The Bank’s current internal policy limit on total loans to a borrower or related borrowers that constitute a group exposure is up to 80% of regulatory lending limit for commercial real estate loans and 50% of regulatory lending limit for commercial and industrial loans. The Bank reviews these group exposures on a quarterly basis. The Bank also sets additional limits on size of loans by loan type.
As of December 31, 2024, the Bank’s largest group exposure with an individual borrower and its related entities was $206.1 million. This group exposure consisted of three multi-family commercial real estate loans totaling $107.0 million, secured by three properties in New Jersey and Pennsylvania, three industrial construction loans totaling $71.7 million, secured by three properties in Pennsylvania and Delaware, an office secured commercial real estate loan totaling $3.8 million located in Pennsylvania, two industrial secured commercial real estate loans totaling $3.0 million located in Pennsylvania, an unsecured line of credit totaling $10.4 million, swap exposure totaling $7.9 million on two multi-family loans, letter of credit exposure totaling $2.1 million, and ACH exposure totaling $0.2 million. The loans have an average risk rating of “4 – Acceptable Quality”. The borrower, headquartered in New Jersey, is an experienced Northeast focused real estate owner and developer primarily of multi-family and industrial properties. As of December 31, 2024, all loans in this lending relationship were performing in accordance with their respective terms and conditions.
As of December 31, 2024, the Bank had $3.31 billion or 17.7% in loans outstanding to its 50 largest borrowers and their related entities.
ASSET QUALITY
General. One of the Bank’s key objectives continues to be maintaining a high level of asset quality. In addition to maintaining sound credit standards for new loan originations, the Bank employs proactive collection and workout processes in dealing with delinquent or problem loans. The Bank actively markets properties that it acquires through foreclosure or otherwise in the loan collection process.
Collection Procedures. The collection procedures for commercial real estate and commercial loans include sending periodic late notices and letters to a borrower once a loan is past due. The Bank attempts to make direct contact with a borrower once a loan is 16 days past due, usually by telephone. The Chief Lending Officer and Chief Credit Officer review all commercial real estate and commercial loan delinquencies on a weekly basis. Generally, delinquent commercial real estate and commercial loans are transferred to the Asset Recovery Department for further action if the delinquency is not cured within a reasonable period of time, typically 90 days. The Chief Lending Officer and Chief Credit Officer have the authority to transfer performing commercial real estate or commercial loans to the Asset Recovery Department if, in their opinion, a credit problem exists or is likely to occur.
In the case of residential mortgage and consumer loans, collection activities begin on the sixteenth day of delinquency. Collection efforts include automated notices of delinquency, telephone calls, letters and other notices to delinquent borrowers. Foreclosure proceedings and other appropriate collection activities such as repossession of collateral are commenced within at least 90 to 120 days after a loan is delinquent provided a plan of repayment to cure the delinquency or other loss mitigation arrangement cannot be reached with the borrower. Periodic inspections of real estate and other collateral are conducted throughout the collection process. The Bank’s collection procedures for Federal Housing Association and Veterans Administration one- to four-family mortgage loans follow the collection and loss mitigation guidelines outlined by those agencies.
Real estate and other assets acquired through foreclosure or in connection with a loan workout are held as foreclosed assets. The Bank carries other real estate owned and other foreclosed assets at the lower of their cost or their fair value less estimated selling costs. The Bank attempts to sell the property at foreclosure sale or as soon as practical after the foreclosure sale through a proactive marketing effort.
Loans deemed uncollectible are proposed for charge-off on a monthly basis. Any charge-off recommendation of $500,000 or greater is submitted to executive management.
Delinquent Loans and Non-performing Loans and Assets. Bank policy requires that the Chief Credit Officer continuously monitor the status of the loan portfolios and report to the board of directors on at least a quarterly basis. These reports include information on impaired loans, delinquent loans, criticized and classified assets, and foreclosed assets. An impaired loan is defined as a non-homogeneous loan greater than $1.0 million for which it is probable, based on current information, that the Bank will not collect all amounts due under the contractual terms of the loan agreement. Smaller balance homogeneous loans including residential mortgages and other consumer loans are evaluated collectively for impairment and are excluded from the definition of impaired loans. Impaired loans are individually identified and reviewed to determine that each loan’s carrying value is not in excess of the fair value of the related collateral or the present value of the expected future cash flows. As of December 31, 2024, impaired loans totaled $55.4 million with related specific reserves of $7.5 million.
Loan modifications to borrowers experiencing financial difficulty may include interest rate reductions, principal or interest forgiveness, forbearance, term extensions, and other actions intended to minimize economic loss and to avoid foreclosure or repossession of collateral. In addition, management attempts to obtain additional collateral or guarantor support when modifying such loans. If the borrower has demonstrated performance under the previous terms and our underwriting process shows the borrower has the capacity to continue to perform under the restructured terms, the loan will continue to accrue interest. Non-accruing restructured loans may be returned to accrual status when there has been a sustained period of repayment performance (generally six consecutive months of payments) and both principal and interest are deemed collectible.
The following illustrates the most common loan modifications by loan classes offered by the Company that are required to be disclosed pursuant to the requirements of Accounting Standards Update ("ASU") 2022-02:
| | | | | | | | |
| Loan Classes | | Modification types |
| Commercial | | Term extension, interest rate reductions, payment delay, or combination thereof. These modifications extend the term of the loan, lower the payment amount, or otherwise delay payments during a defined period for the purpose of providing borrowers additional time to return to compliance with the original loan term. |
| | |
| Residential Mortgage/ Home Equity | | Forbearance period greater than six months. These modifications require reduced or no payments during the forbearance period for the purpose of providing borrowers additional time to return to compliance with the original loan term, as well as term extension and rate adjustment. These modifications extend the term of the loan and provides for an adjustment to the interest rate, which reduces the monthly payment requirement. |
| | |
| Direct Installment | | Term extension greater than three months. These modifications extend the term of the loan, which reduces the monthly payment requirement. |
| | |
Effective January 1, 2023, the Company adopted ASU 2022-02, “Financial Instruments - Credit Losses (Topic 326): Troubled Debt Restructurings and Vintage Disclosures” (“ASU 2022-02”), which eliminated the accounting guidance for troubled debt restructurings (“TDRs”) while enhancing disclosure requirements for certain loan refinancing and restructurings by creditors when a borrower is experiencing financial difficulty. This guidance was applied on a modified retrospective basis. Upon adoption of this guidance, the Company no longer establishes a specific reserve for loan modifications to borrowers experiencing financial difficulty. Instead, these loan modifications are included in their respective pool and a projected loss rate is applied to the current loan balance to arrive at the quantitative and qualitative baseline portion of the allowance for credit losses.
Interest income stops accruing on loans when interest or principal payments are 90 days in arrears or earlier when the timely collectability of such interest or principal is doubtful. When the accrual of interest on a loan is stopped, the loan is designated as a non-accrual loan and the outstanding unpaid interest previously credited is reversed. A non-accrual loan is returned to accrual status when factors indicating doubtful collection no longer exist, the loan has been brought current and the borrower demonstrates some period (generally six months) of timely contractual payments.
Federal and state regulations as well as the Bank’s policy require the Bank to utilize an internal risk rating system as a means of reporting problem and potential problem assets. Under this system, the Bank classifies problem and potential problem assets as “substandard,” “doubtful” or “loss” assets. An asset is considered “substandard” if it is inadequately protected by the current net worth and paying capacity of the obligor or of the collateral pledged, if any. “Substandard” assets include those characterized by the “distinct possibility” that the Bank will sustain “some loss” if the deficiencies are not corrected. Assets classified as “doubtful” have all of the weaknesses inherent in those classified “substandard” with the added characteristic that the weaknesses present make “collection or liquidation in full,” on the basis of currently existing facts, conditions, and values, “highly questionable and improbable.” Assets classified as “loss” are those considered “uncollectible” and of such little value that their continuance as assets without the establishment of a specific loss reserve is not warranted. Assets which do not
currently expose the Bank to sufficient risk to warrant classification in one of the aforementioned categories, but possess potential weaknesses, are designated “special mention.” When the Bank classifies one or more assets, or portions thereof, as “loss,” the Bank is required either to establish a specific allowance for losses equal to 100% of the amount of the asset so classified or to charge-off such amount.
Management performs a quarterly evaluation of the adequacy of the allowance for credit losses. The analysis of the allowance for credit losses has two elements: loans collectively evaluated for impairment and loans individually evaluated for impairment. As part of its evaluation of the adequacy of the allowance for credit losses, each quarter management prepares an analysis that segments the entire loan portfolio by loan type into groups of loans that share common attributes and risk characteristics. The allowance for credit losses collectively evaluated for impairment consists of a quantitative loss factor and a qualitative adjustment component. Management estimates the quantitative component by segmenting the loan portfolio and employing a discounted cash flow ("DCF") model framework to estimate the allowance for credit losses on the loan portfolio. The CECL estimate incorporates life-of-loan aspects through this DCF approach. For each segment, this approach compares each loan’s amortized cost to the present value of its contractual cash flows adjusted for projected credit losses, prepayments and curtailments to determine the appropriate reserve for that loan. Quantitative loss factors are evaluated at least annually. Management completed its most recent development and evaluation of its quantitative loss factors in the fourth quarter of 2024. Qualitative adjustments give consideration to factors such as trends in industry conditions, effects of changes in credit concentrations, changes in the Company’s loan review process, changes in the Company's loan policies and procedures, economic forecast uncertainty and model imprecision. The Company considers qualitative adjustments to credit loss estimates for information not already captured in the quantitative component of the loss estimation process. Qualitative adjustments are recalibrated at least annually and evaluated quarterly. The reserves resulting from the application of both of these sets of loss factors are combined to arrive at the allowance for credit losses on loans collectively evaluated for impairment.
Management's determination as to the classification of assets and the amount of the valuation allowances is subject to review by the Federal Deposit Insurance Corporation ("FDIC") and the New Jersey Department of Banking and Insurance, each of which can require the establishment of additional general or specific loss allowances. The FDIC, in conjunction with the other federal banking agencies, issued an interagency policy statement on the allowance for credit losses. The policy statement provides guidance for financial institutions on both the responsibilities of the board of directors and management for the maintenance of adequate allowances, and guidance for banking agency examiners to use in determining the adequacy of the allowances. Generally, the policy statement reaffirms that institutions should have effective loan review systems and controls to identify, monitor and address asset quality problems; that loans deemed uncollectible are promptly charged off; and that the institution’s process for determining an adequate level for its valuation allowance is based on a comprehensive, adequately documented, and consistently applied analysis of the institution’s loan and lease portfolio. While management believes that on the basis of information currently available to it, the allowance for credit losses is adequate as of December 31, 2024, actual losses are dependent upon future events and, as such, further additions to the level of allowances for credit losses may become necessary.
Loans are classified in accordance with the risk rating system described previously. As of December 31, 2024, $293.2 million of loans were classified as “substandard,” which consisted of $180.0 million in commercial loans, $107.3 million in commercial mortgage, construction and multi-family mortgage loans, $4.5 million in residential loans and $1.4 million in consumer loans. Within the substandard classification, $97.4 million were purchased credit deteriorated ("PCD") loans. As of December 31, 2024, $208.9 million of loans were designated “special mention.” Within the special mention classification, $62.1 million were PCD loans.
The following table sets forth delinquencies in the loan portfolio as of the dates indicated.
| | | | | | | | | | | | | | | | | | | | | | | | | | | | | | | | | | | | | | | | | | | | | | | | | | | | | | | | | | | | | | | | | | | | | | | |
| | As of December 31, 2024 | | As of December 31, 2023 | | As of December 31, 2022 |
| | 60-89 Days | | 90 Days or More | | 60-89 Days | | 90 Days or More | | 60-89 Days | | 90 Days or More |
| | Number of Loans | | Principal Balance of Loans | | Number of Loans | | Principal Balance of Loans | | Number of Loans | | Principal Balance of Loans | | Number of Loans | | Principal Balance of Loans | | Number of Loans | | Principal Balance of Loans | | Number of Loans | | Principal Balance of Loans |
| | (Dollars in thousands) |
| Commercial mortgage loans | 4 | | | $ | 3,954 | | | 10 | | | $ | 8,714 | | | — | | | $ | — | | | 5 | | | $ | 4,707 | | | 2 | | | $ | 412 | | | 5 | | | $ | 4,068 | |
| Multi-family mortgage loans | — | | | — | | | 5 | | | 6,455 | | | 1 | | | 1,635 | | | 1 | | | 744 | | | — | | | — | | | — | | | — | |
| Construction loans | — | | | — | | | 2 | | | 13,246 | | | — | | | — | | | 1 | | | 771 | | | 1 | | | 1,097 | | | 2 | | | 1,878 | |
| Residential mortgage loans | 17 | | | 5,049 | | | 17 | | | 3,134 | | | 8 | | | 1,208 | | | 7 | | | 853 | | | 9 | | | 1,114 | | | 14 | | | 1,928 | |
| Total mortgage loans | 21 | | | 9,003 | | | 34 | | | 31,549 | | | 9 | | | 2,843 | | | 14 | | | 7,075 | | | 12 | | | 2,623 | | | 21 | | | 7,874 | |
| Commercial loans | 9 | | | 2,377 | | | 49 | | | 14,515 | | | 3 | | | 198 | | | 12 | | | 18,698 | | | 5 | | | 1,014 | | | 19 | | | 7,057 | |
| Consumer loans | 15 | | | 856 | | | 16 | | | 1,376 | | | 5 | | | 275 | | | 9 | | | 632 | | | 4 | | | 147 | | | 9 | | | 653 | |
| Total loans | 45 | | | $ | 12,236 | | | 99 | | | $ | 47,440 | | | 17 | | | $ | 3,316 | | | 35 | | | $ | 26,405 | | | 21 | | | $ | 3,784 | | | 49 | | | $ | 15,584 | |
Non-Accrual Loans and Non-Performing Assets. The following table sets forth information regarding non-accrual loans and other non-performing assets. Loans are generally placed on non-accrual status when they become 90 days or more past due or if they have been identified as presenting uncertainty with respect to the collectability of interest or principal.
| | | | | | | | | | | | | | | | | | | | | | | | | | | | | |
| | As of December 31, |
| | 2024 | | 2023 | | 2022 | | 2021 | | 2020 |
| | (Dollars in thousands) |
| Non-accruing loans: | | | | | | | | | |
| Commercial mortgage loans | $ | 20,883 | | | $ | 5,151 | | | $ | 28,212 | | | $ | 16,887 | | | $ | 31,982 | |
| Multi-family mortgage loans | 7,498 | | | 744 | | | 1,565 | | | 439 | | | — | |
| Construction loans | 13,246 | | | 771 | | | 1,878 | | | 2,365 | | | 1,392 | |
| Residential mortgage loans | 4,535 | | | 853 | | | 1,928 | | | 6,072 | | | 9,315 | |
| Commercial loans | 24,243 | | | 41,487 | | | 24,188 | | | 20,582 | | | 42,118 | |
| Consumer loans | 1,656 | | | 633 | | | 738 | | | 1,682 | | | 2,283 | |
| Total non-accruing loans | 72,061 | | | 49,639 | | | 58,509 | | | 48,027 | | | 87,090 | |
| Accruing loans - 90 days or more delinquent | — | | | — | | | — | | | — | | | — | |
| Total non-performing loans | 72,061 | | | 49,639 | | | 58,509 | | | 48,027 | | | 87,090 | |
| Foreclosed assets | 9,473 | | | 11,651 | | | 2,124 | | | 8,731 | | | 4,475 | |
| Total non-performing assets | $ | 81,534 | | | $ | 61,290 | | | $ | 60,633 | | | $ | 56,758 | | | $ | 91,565 | |
| Total non-performing assets as a percentage of total assets | 0.34 | % | | 0.43 | % | | 0.44 | % | | 0.41 | % | | 0.71 | % |
| Total non-performing loans to total loans | 0.39 | % | | 0.46 | % | | 0.57 | % | | 0.50 | % | | 0.89 | % |
Non-performing (i.e., non-accruing) commercial mortgage loans increased $15.7 million to $20.9 million as of December 31, 2024, from $5.2 million as of December 31, 2023. Non-performing commercial mortgage loans consisted of 17 loans as of December 31, 2024. Of these 17 loans, nine loans totaling $5.9 million were PCD loans. The largest non-performing commercial mortgage loan was a $7.3 million loan secured by a first mortgage on a retail shopping center located in Atlantic City, New Jersey.
Non-performing commercial loans decreased $17.2 million, to $24.2 million as of December 31, 2024, from $41.5 million as of December 31, 2023. Non-performing commercial loans as of December 31, 2024 consisted of 65 loans, of which 16 loans were under 90 days past-due. Of these non-performing commercial loans, 37 were PCD loans totaling $4.9 million. The largest non-performing commercial loan relationship consisted of three loans with aggregate outstanding balances of $4.1 million as of December 31, 2024. These loans are secured by all business assets.
Non-performing construction loans increased $12.5 million to $13.2 million as of December 31, 2024, from $771,000 as of December 31, 2023. Non-performing construction loans as of December 31, 2024 consisted of two loans, of which one was
a PCD loan. There were two non-performing construction loans in 2023. The largest non-performing construction loan was a $12.3 million loan residential development project in Jackson, New Jersey secured by a first mortgage on the land and completed and to-be completed housing units.
Non-performing multi-family mortgage loans consisted of six loans totaling $7.5 million as of December 31, 2024, compared to one non-performing multi-family mortgage loan totaling $744,000 as of December 31, 2023. Of these six loans, four loans totaling $2.1 million were PCD loans. The largest non-performing multi-family mortgage loan was a $3.7 million loan secured by a first mortgage on residential condominium units in Brooklyn, New York.
As of December 31, 2024, the Company held $9.5 million of foreclosed assets, compared with $11.7 million as of December 31, 2023. Foreclosed assets as of December 31, 2024 are carried at fair value based on recent appraisals and valuation estimates, less estimated selling costs. During the year ended December 31, 2024, there were four properties sold with an aggregate carrying value of $861,000 and one write-down of a foreclosed commercial property of $1.3 million. Foreclosed assets at December 31, 2024 consisted primarily of commercial real estate.
Non-performing assets totaled $81.5 million, or 0.34% of total assets as of December 31, 2024, compared to $61.3 million, or 0.43% of total assets as of December 31, 2023. If the non-accrual loans had performed in accordance with their original terms, interest income would have increased by $2.8 million during the year ended December 31, 2024. The amount of cash basis interest income that was recognized on impaired loans during the year ended December 31, 2024 was not material.
Allowance for Credit Losses. On January 1, 2020, the Company adopted ASU 2016-13, "Measurement of Credit Losses on Financial Instruments,” which replaces the incurred loss methodology with the CECL methodology. It also applies to off-balance sheet credit exposures, including loan commitments and lines of credit. The adoption of the new standard resulted in the Company recording a $7.9 million increase to the allowance for credit losses and a $3.2 million liability for off-balance sheet credit exposures. The adoption of the standard did not result in a change to the Company's results of operations upon adoption as it was recorded as an $8.3 million cumulative effect adjustment, net of income taxes, to retained earnings.
The allowance for credit losses is a valuation account that reflects management’s evaluation of the current expected credit losses in the loan portfolio. The Company maintains the allowance for credit losses through provisions for credit losses that are charged to income. Charge-offs against the allowance for credit losses are taken on loans where management determines that the collection of loan principal and interest is unlikely. Recoveries made on loans that have been charged-off are credited to the allowance for credit losses.
The calculation of the allowance for credit losses is a critical accounting policy of the Company. Management estimates the allowance balance using relevant available information, from internal and external sources, related to past events, current conditions, and a reasonable and supportable forecast. Historical credit loss experience for both the Company and peers provides the basis for the estimation of expected credit losses, where observed credit losses are converted to probability of default rate (“PDR”) curves through the use of segment-specific loss given default (“LGD”) risk factors that convert default rates to loss severity based on industry-level, observed relationships between the two variables for each segment, primarily due to the nature of the underlying collateral. These risk factors were assessed for reasonableness against the Company’s own loss experience and adjusted in certain cases when the relationship between the Company’s historical default and loss severity deviate from that of the wider industry. The historical PDR curves, together with corresponding economic conditions, establish a quantitative relationship between economic conditions and loan performance through an economic cycle.
Using the historical relationship between economic conditions and loan performance, management’s expectation of future loan performance is incorporated using an externally developed economic forecast. This forecast is applied over a period that management has determined to be reasonable and supportable. Beyond the period over which management can develop or source a reasonable and supportable forecast, the model will revert to long-term average economic conditions using a straight-line, time-based methodology. The Company's current forecast period is six quarters, with a four-quarter reversion period to historical average macroeconomic factors. The Company's economic forecast is approved by the Company's ACL Committee.
The allowance for credit losses is measured on a collective (pool) basis, with both a quantitative and qualitative analysis that is applied on a quarterly basis, when similar risk characteristics exist. The respective quantitative allowance for each loan segment is measured using an econometric, discounted PDR/LGD modeling methodology in which distinct, segment-specific multi-variate regression models are applied to an external economic forecast. Under the discounted cash flows methodology, expected credit losses are estimated over the effective life of the loans by measuring the difference between the net present value of modeled cash flows and amortized cost basis. Contractual cash flows over the contractual life of the loans are the basis for modeled cash flows, adjusted for modeled defaults and expected prepayments and discounted at the loan-level effective interest rate. The contractual term excludes expected extensions, renewals and modifications unless either of the following applies at the reporting date: management has a reasonable expectation that a modification will be executed with an individual borrower; or when an extension or renewal option is included in the original contract and is not unconditionally cancellable by
the Company. Management will assess the likelihood of the option being exercised by the borrower and appropriately extend the maturity for modeling purposes.
The Company considers qualitative adjustments to credit loss estimates for information not already captured in the quantitative component of the loss estimation process. Qualitative factors are based on portfolio concentration levels, model imprecision, changes in industry conditions, changes in the Company’s loan review process, changes in the Company’s loan policies and procedures, and economic forecast uncertainty.
One of the most significant judgments involved in estimating the Company’s allowance for credit losses on loans relates to the macroeconomic forecasts used to estimate expected credit losses over the forecast period. As of December 31, 2024, the model incorporated Moody’s baseline economic forecast, as adjusted for qualitative factors, as well as an extensive review of classified loans and loans that were classified as impaired with a specific reserve assigned to those loans. The allowance estimation process resulted in a total provision of $83.6 million for the year ended December 31, 2024, and an overall coverage ratio of 104 basis points. Of the $83.6 million provision for the year, $60.1 million was recorded as part of the Lakeland merger in accordance with GAAP requirements for accounting for business combinations. Management believes the allowance for credit losses accurately represents the estimated inherent losses, factoring in the qualitative adjustment and other assumptions, including the selection of the baseline forecast within the model. If the Company used a more severe outlook, the provision would have risen by approximately $16.0 million, leading to an overall coverage ratio of approximately 112 basis points.
Portfolio segment is defined as the level at which an entity develops and documents a systematic methodology to determine its allowance for credit losses. Management developed segments for estimating loss based on type of borrower and collateral which is generally based upon federal call report segmentation. The segments have been combined or sub-segmented as needed to ensure loans of similar risk profiles are appropriately pooled. As of December 31, 2024, the portfolio and class segments for the Company’s loan portfolio were:
•Mortgage Loans – Residential, Commercial Real Estate, Multi-Family and Construction
•Commercial Loans – Commercial Owner Occupied and Commercial Non-Owner Occupied
•Consumer Loans – First Lien Home Equity and Other Consumer
The allowance for credit losses on loans individually evaluated for impairment is based upon loans that have been identified through the Company’s normal loan monitoring process. This process includes the review of delinquent and problem loans at the Company’s Credit, Credit Risk Management and Allowance Committees; or which may be identified through the Company’s loan review process. Generally, the Company only evaluates loans individually for impairment if the loan is non-accrual, non-homogeneous and the balance is greater than $1.0 million.
For all classes of loans deemed collateral-dependent, the Company estimates expected credit losses based on the fair value of the collateral less any selling costs. If the loan is not collateral dependent, the allowance for credit losses related to individually assessed loans is based on discounted expected cash flows using the loan’s initial effective interest rate.
Loans acquired that have experienced more-than-insignificant deterioration in credit quality since their origination are considered PCD loans. The Company evaluates acquired loans for deterioration in credit quality based on any of, but not limited to, the following: (1) non-accrual status; (2) modification designation; (3) risk ratings of special mention, substandard or doubtful; (4) watchlist credits; and (5) delinquency status, including loans that are current on acquisition date, but had been previously delinquent. At the acquisition date, an estimate of expected credit losses is made for groups of PCD loans with similar risk characteristics and individual PCD loans without similar risk characteristics. Subsequent to the acquisition date, the initial allowance for credit losses on PCD loans will increase or decrease based on future evaluations, with changes recognized in the provision for credit losses.
Management believes the primary risks inherent in the portfolio are a general decline in the economy, a decline in real estate market values, rising unemployment or a protracted period of elevated unemployment, increasing vacancy rates in commercial investment properties and possible increases in interest rates in the absence of economic improvement. Any one or a combination of these events may adversely affect borrowers’ ability to repay the loans, resulting in increased delinquencies, credit losses and higher levels of provisions. Management considers it important to maintain the ratio of the allowance for credit losses to total loans at an acceptable level given current and forecasted economic conditions, interest rates and the composition of the portfolio.
The CECL approach to calculate the allowance for credit losses on loans is significantly influenced by the composition, characteristics and quality of the Company’s loan portfolio, as well as the prevailing economic conditions and forecast utilized. Although management believes that the Company has established and maintained the allowance for credit losses at appropriate
levels, additions may be necessary if future economic and other conditions differ substantially from the current operating environment and economic forecast. Management evaluates its estimates and assumptions on an ongoing basis giving consideration to forecasted economic factors, historical loss experience and other factors. The model includes both quantitative and qualitative components. Such estimates and assumptions are adjusted when facts and circumstances dictate. As future events and their effects cannot be determined with precision, actual results could differ significantly from these estimates. Changes in estimates resulting from continuing changes in the economic environment will be reflected in the financial statements in future periods, and to the extent actual losses are higher than management estimates, additional provision for credit losses on loans could be required and could adversely affect our earnings or financial position in future periods. In addition, various regulatory agencies periodically review the adequacy of the Company’s allowance for credit losses as an integral part of their examination process. Such agencies may require the Company to recognize additions to the allowance or additional write-downs based on their judgments about information available to them at the time of their examination. Although management uses the best information available, the level of the allowance for credit losses remains an estimate that is subject to significant judgment and short-term volatility.
Material changes to these and other relevant factors creates greater volatility to the allowance for credit losses, and therefore, greater volatility to the Company’s reported earnings. See Note 5 to the Consolidated Financial Statements for more information on the allowance for credit losses on loans.
Analysis of the Allowance for Credit Losses on Loans. The following table sets forth the analysis of the allowance for credit losses for the periods indicated.
| | | | | | | | | | | | | | | | | | | | | | | | | | | | | | |
| | Years Ended December 31, |
| | 2024 | | 2023 | | 2022 | | 2021 | | 2020 | |
| | (Dollars in thousands) |
| Balance at beginning of period | $ | 107,200 | | | $ | 88,023 | | | $ | 80,740 | | | $ | 101,466 | | | $ | 55,525 | | |
Adjustments as a result of adopted ASUs (1) | — | | | (594) | | | — | | | — | | | 7,920 | | |
| Charge offs: | | | | | | | | | | |
| Commercial mortgage loans | 801 | | | 1,700 | | | 5,471 | | | 3,234 | | | 2,647 | | |
| Multi-family mortgage loans | — | | | — | | | 66 | | | 34 | | | — | | |
| Construction loans | — | | | — | | | — | | | — | | | — | | |
| Residential mortgage loans | 7 | | | 24 | | | 21 | | | 74 | | | 69 | | |
| Commercial loans | 16,535 | | | 8,363 | | | 633 | | | 1,597 | | | 4,763 | | |
| Consumer loans | 480 | | | 334 | | | 357 | | | 517 | | | 434 | | |
| Total | 17,823 | | | 10,421 | | | 6,548 | | | 5,456 | | | 7,913 | | |
| Recoveries: | | | | | | | | | | |
| Commercial mortgage loans | 69 | | | 412 | | | 198 | | | 378 | | | 177 | | |
| Multi-family mortgage loans | — | | | — | | | — | | | 4 | | | — | | |
| Construction loans | — | | | — | | | — | | | 20 | | | 110 | | |
| Residential mortgage loans | 17 | | | 134 | | | 386 | | | 457 | | | 109 | | |
| Commercial loans | 2,621 | | | 1,309 | | | 4,193 | | | 7,169 | | | 1,776 | | |
| Consumer loans | 556 | | | 437 | | | 654 | | | 1,002 | | | 465 | | |
| Total | 3,263 | | | 2,292 | | | 5,431 | | | 9,030 | | | 2,637 | | |
| Net charge-offs (recoveries) | 14,560 | | | 8,129 | | | 1,117 | | | (3,574) | | | 5,276 | | |
Provision charge (benefit) to operations (2) | 83,604 | | | 27,900 | | | 8,400 | | | (24,300) | | | 29,711 | | |
| Initial allowance related to PCD loans | 17,188 | | | — | | | — | | | — | | | 13,586 | | |
| | | | | | | | | | |
| Balance at end of period | $ | 193,432 | | | $ | 107,200 | | | $ | 88,023 | | | $ | 80,740 | | | $ | 101,466 | | |
| Ratio of net charge-offs (recoveries) to average loans outstanding during the period | 0.09 | % | | 0.08 | % | | 0.01 | % | | (0.04) | % | | 0.06 | % | |
| Allowance for credit losses to total loans | 1.04 | % | | 0.99 | % | | 0.86 | % | | 0.84 | % | | 1.03 | % | |
| Allowance for credit losses to non-performing loans | 268.43 | % | | 215.96 | % | | 150.44 | % | | 168.11 | % | | 116.51 | % | |
(1) On January 1, 2020, the Company adopted ASU 2016-13, "Measurement of Credit Losses on Financial Instruments,” which replaced the incurred loss methodology with the CECL methodology. The adoption of the new standard resulted in the Company recording a $7.9 million increase to the allowance for credit losses. Additionally, in 2020, for PCD loans, an allowance for credit losses was calculated using management's best estimate of projected losses over the remaining life of the loans in accordance with Accounting Standards Codification (“ASC”) 326-20. This represents the portion of the loan balances that has been deemed uncollectible based on the Company’s expectations of future cash flows for each respective PCD loan pool, given the outlook and forecasts inclusive of the impact of the COVID-19 pandemic and related fiscal and regulatory interventions. A $13.6 million allowance for credit losses was recorded on PCD loans.
On January 1, 2023, the Company adopted ASU 2022-02, "Financial Instruments-Credit Losses (Topic 326): Troubled Debt Restructurings and Vintage Disclosures," which addresses areas identified by the Financial Accounting Standards Board ("FASB") as part of its post-implementation review of the credit losses standard (ASU 2016-13) that introduced the CECL model. As a result, the Company recorded a $594,000 reduction to the allowance for credit losses.
(2) An initial CECL provision for credit losses on loans of $60.1 million was recorded as part of the Lakeland merger in accordance with GAAP requirements for accounting for business combinations.
Allowance for Credit Losses on Loans by Loan Category. The following table sets forth the allowance for credit losses by loan category for the periods indicated. The following allocation of the allowance for credit losses is based on management’s assessment as of a given point in time. This is neither indicative of the specific amounts or the loan categories in which future charge-offs may be taken, nor is it an indicator of future loss trends. The allowance allocated to each category does not restrict the use of the allowance to absorb losses in any category.
| | | | | | | | | | | | | | | | | | | | | | | | | | | | | | | | | | | | | | | | | | | | | | | | | | | | | | | | | | | |
| | As of December 31, |
| | 2024 | | 2023 | | 2022 | | 2021 | | 2020 |
| | Amount of Allowance for Loan Losses | | Percent of Loans in Each Category to Total Loans | | Amount of Allowance for Loan Losses | | Percent of Loans in Each Category to Total Loans | | Amount of Allowance for Loan Losses | | Percent of Loans in Each Category to Total Loans | | Amount of Allowance for Loan Losses | | Percent of Loans in Each Category to Total Loans | | Amount of Allowance for Loan Losses | | Percent of Loans in Each Category to Total Loans |
| | (Dollars in thousands) |
| Commercial mortgage loans | $ | 83,011 | | | 38.72 | % | | $ | 53,147 | | | 41.46 | % | | $ | 39,848 | | | 42.06 | % | | $ | 34,912 | | | 39.89 | % | | $ | 42,014 | | | 35.15 | % |
| Multi-family mortgage loans | 24,710 | | | 18.12 | | | 12,669 | | | 16.65 | | | 10,208 | | | 14.75 | | | 9,339 | | | 14.22 | | | 15,262 | | | 15.09 | |
| Construction loans | 18,502 | | | 4.41 | | | 1,192 | | | 6.00 | | | 2,368 | | | 6.97 | | | 2,633 | | | 7.12 | | | 3,890 | | | 5.51 | |
| Residential mortgage loans | 18,371 | | | 10.77 | | | 6,396 | | | 10.70 | | | 5,794 | | | 11.48 | | | 5,221 | | | 12.54 | | | 7,142 | | | 13.16 | |
| Commercial loans | 43,645 | | | 24.69 | | | 31,476 | | | 22.44 | | | 27,414 | | | 21.77 | | | 26,343 | | | 22.82 | | | 27,083 | | | 26.08 | |
| Consumer loans | 5,203 | | | 3.29 | | | 2,320 | | | 2.75 | | | 2,391 | | | 2.97 | | | 2,292 | | | 3.41 | | | 6,075 | | | 5.01 | |
| | | | | | | | | | | | | | | | | | | |
| Total | $ | 193,432 | | | 100.00 | % | | $ | 107,200 | | | 100.00 | % | | $ | 88,023 | | | 100.00 | % | | $ | 80,740 | | | 100.00 | % | | $ | 101,466 | | | 100.00 | % |
INVESTMENT ACTIVITIES
General. The board of directors annually approves the Investment Policy for the Bank and the Company. The Chief Financial Officer and the Treasurer are authorized by the Board to implement the Investment Policy and establish investment strategies. Each of the Chief Executive Officer, Chief Financial Officer, Treasurer and Assistant Treasurer is authorized to make investment decisions consistent with the Investment Policy. Investment transactions for the Bank are reported to the board of directors of the Bank on a monthly basis.
The Investment Policy is designed to generate a favorable rate of return, consistent with established guidelines for liquidity, safety, duration and diversification, and to complement the lending activities of the Bank. Investment decisions are made in accordance with the policy and are based on credit quality, interest rate risk, balance sheet composition, market expectations, liquidity, income and collateral needs.
The Investment Policy does not currently permit the purchase of any securities that are below investment grade.
The investment strategy is to maximize the return on the investment portfolio consistent with the Investment Policy. The investment strategy considers the Bank’s and the Company’s interest rate risk position as well as liquidity, loan demand and other factors. Acceptable investment securities include U.S. Treasury and Agency obligations, collateralized mortgage obligations (“CMOs”), corporate debt obligations, municipal bonds, mortgage-backed securities, commercial paper, mutual funds, bankers’ acceptances and Federal funds.
Securities in the investment portfolio are classified as held to maturity debt securities, available for sale debt securities, equity securities, or held for trading. Securities that are classified as held to maturity debt securities are securities that the Bank or the Company has the intent and ability to hold until their contractual maturity date and are reported at cost. Securities that are classified as available for sale debt securities are reported at fair value. Available for sale debt securities include U.S. Treasury and Agency obligations, U.S. Agency and privately-issued CMOs and corporate debt obligations. Sales of securities may occur from time to time in response to changes in market rates and liquidity needs and to facilitate balance sheet reallocation to effectively manage interest rate risk. Equity securities are traded in active markets with readily accessible quoted market prices, carried at fair value. At the present time, there are no securities that are classified as held for trading.
On January 1, 2020, the Company adopted CECL which replaces the incurred loss methodology with an expected loss methodology. Management measures expected credit losses on held to maturity debt securities on a collective basis by security type. Management classifies the held to maturity debt securities portfolio into the following security types:
•Government-agency obligations;
•Mortgage-backed securities;
•State and municipal obligations; and
•Corporate obligations.
All of the agency obligations held by the Bank are issued by U.S. government entities and agencies. These securities are either explicitly or implicitly guaranteed by the U.S. government, are highly rated by major rating agencies and have a long history of no credit losses. The majority of the state and municipal and corporate obligations carry credit ratings from the rating agencies as of December 31, 2024 that were no lower than an A rating and the Company had no securities rated BBB or worse by Moody’s Ratings ("Moody's").
CMOs are a type of debt security issued by a special-purpose entity that aggregates pools of mortgages and mortgage-related securities and creates different classes of CMO securities with varying maturities and amortization schedules as well as a residual interest with each class possessing different risk characteristics. In contrast to pass-through mortgage-backed securities from which cash flow is received (and prepayment risk is shared) pro rata by all securities holders, the cash flow from the mortgages or mortgage-related securities underlying CMOs is paid in accordance with predetermined priority to investors holding various tranches of such securities or obligations. A particular tranche of CMOs may therefore carry prepayment risk that differs from that of both the underlying collateral and other tranches. Accordingly, CMOs attempt to moderate risks associated with conventional mortgage-related securities resulting from unexpected prepayment activity. In declining interest rate environments, the Bank attempts to purchase CMOs with principal lock-out periods, reducing prepayment risk in the investment portfolio. During rising interest rate periods, the Bank’s strategy is to purchase CMOs that are receiving principal payments that can be reinvested at higher current yields. Investments in CMOs involve a risk that actual prepayments will differ from those estimated in pricing the security, which may result in adjustments to the net yield on such securities. Additionally, the fair value of such securities may be adversely affected by changes in market interest rates. Management believes these securities may represent attractive alternatives relative to other investments due to the wide variety of maturity, repayment and interest rate options available.
As of December 31, 2024, the Bank held $88.0 million in privately issued securities in the investment portfolio. The Bank and the Company do not invest in collateralized debt obligations, mortgage-related securities secured by sub-prime loans, or any preferred equity securities.
Amortized Cost and Fair Value of Securities. The following table sets forth certain information regarding the amortized cost and fair values of the Company’s securities as of the dates indicated.
| | | | | | | | | | | | | | | | | | | | | | | | | | | | | | | | | | | |
| | As of December 31, |
| | 2024 | | 2023 | | 2022 |
| | Amortized Cost(2) | | Fair
Value | | Amortized Cost(2) | | Fair
Value | | Amortized
Cost | | Fair
Value |
| | (Dollars in thousands) |
| Held to Maturity Debt Securities: | |
| | | | | | | | | | | |
| FHLB-sponsored obligations | $ | 2,399 | | | $ | 2,307 | | | $ | 2,399 | | | $ | 2,225 | | | $ | 2,398 | | | $ | 2,127 | |
| FHLMC-sponsored obligations | 3,600 | | | 3,499 | | | 3,600 | | | 3,367 | | | 3,600 | | | 3,224 | |
| FNMA-sponsored obligations | 1,000 | | | 979 | | | 2,060 | | | 2,003 | | | 1,000 | | | 906 | |
| FFCB-sponsored obligations | 3,000 | | | 2,923 | | | 2,999 | | | 2,811 | | | 2,999 | | | 2,707 | |
| State and municipal obligations | 311,106 | | | 297,662 | | | 339,816 | | | 330,360 | | | 366,164 | | | 353,417 | |
| Corporate obligations | 6,518 | | | 6,351 | | | 7,091 | | | 6,688 | | | 11,789 | | | 11,087 | |
| Total held-to-maturity debt securities | $ | 327,623 | | | $ | 313,721 | | | $ | 363,111 | | | $ | 352,601 | | | $ | 387,950 | | | $ | 373,468 | |
| Available for Sale Debt Securities: | | | | | | | | | | | |
| U.S Treasury obligations | $ | 348,621 | | | $ | 330,598 | | | $ | 276,618 | | | $ | 253,878 | | | $ | 275,620 | | | $ | 245,816 | |
| Mortgage-backed securities | 2,243,725 | | | 2,062,159 | | | 1,462,159 | | | 1,285,609 | | | 1,636,913 | | | 1,427,138 | |
| | | | | | | | | | | |
| | | | | | | | | | | |
| | | | | | | | | | | |
| | | | | | | | | | | |
| Agency guaranteed obligations | 46,447 | | | 47,620 | | | 26,310 | | | 27,498 | | | — | | | — | |
| Asset-backed securities | 47,203 | | | 47,563 | | | 31,809 | | | 32,235 | | | 37,707 | | | 37,621 | |
| State and municipal obligations | 126,765 | | | 116,916 | | | 64,454 | | | 56,584 | | | 67,706 | | | 56,864 | |
| Corporate obligations | 103,417 | | | 104,445 | | | 40,448 | | | 34,308 | | | 40,541 | | | 36,109 | |
| Total available for sale debt securities | $ | 2,975,695 | | | $ | 2,768,915 | | | $ | 1,901,798 | | | $ | 1,690,112 | | | $ | 2,058,487 | | | $ | 1,803,548 | |
| Equity securities | $ | 19,110 | | | $ | 19,110 | | | $ | 1,270 | | | $ | 1,270 | | | $ | 1,147 | | | $ | 1,147 | |
| | | | | | | | | | | |
Average expected life of securities(1) | 5.32 years | | | | 5.48 years | | | | 5.82 years | | |
(1) Average expected life is based on prepayment assumptions utilizing prevailing interest rates as of the reporting dates and excludes equity securities.
(2) As of December 31, 2024 and 2023, excludes allowance for credit losses on held to maturity debt securities of $14,000 and $31,000, respectively.
The following table sets forth certain information regarding the carrying value, weighted average yields and contractual maturities of the Company’s debt securities portfolio as of December 31, 2024. No tax equivalent adjustments were made to the weighted average yields. Amounts are shown at amortized cost for held to maturity debt securities and at fair value for available for sale debt securities.
| | | | | | | | | | | | | | | | | | | | | | | | | | | | | | | | | | | | | | | | | | | | | | | | | | | | | | | | | | | |
| | As of December 31, 2024 |
| | One Year or Less | | More Than One Year to Five Years | | More Than Five Years to Ten Years | | After Ten Years | | Total |
| | Carrying Value | | Weighted Average Yield (1) | | Carrying Value | | Weighted Average Yield (1) | | Carrying Value | | Weighted Average Yield (1) | | Carrying Value | | Weighted Average Yield (1) | | Carrying Value | | Weighted Average Yield(1) |
| | (Dollars in thousands) |
| Held to Maturity Debt Securities: | |
| | | | | | | | | | | | | | | | | | | |
| Agency-sponsored obligations | $ | 6,600 | | | 0.68 | % | | $ | 3,399 | | | 0.68 | % | | $ | — | | | — | % | | $ | — | | | — | % | | $ | 9,999 | | | 0.68 | % |
| Corporate obligations | 4,348 | | | 1.29 | | | 2,170 | | | 0.93 | | | — | | | — | | | — | | | — | | | 6,518 | | | 1.17 | |
| State and municipal obligations | 33,913 | | | 2.90 | | | 162,989 | | | 2.81 | | | 96,148 | | | 2.63 | | | 18,056 | | | 1.48 | | | 311,106 | | | 2.69 | |
Total held to maturity debt securities(2) | $ | 44,861 | | | 2.42 | % | | $ | 168,558 | | | 2.74 | % | | $ | 96,148 | | | 2.63 | % | | $ | 18,068 | | | 1.48 | % | | $ | 327,623 | | | 2.60 | % |
| Available for Sale Debt Securities: | | | | | | | | | | | | | | | | | | | |
| Asset-backed securities | $ | 75,143 | | | 3.77 | % | | $ | 255,455 | | | 1.70 | % | | $ | — | | | — | % | | $ | — | | | — | % | | $ | 330,598 | | | 2.17 | % |
| State and municipal obligations | 6,559 | | | 3.94 | | | 9,023 | | | 3.62 | | | 36283 | | | 3.51 | | | 65,051 | | | 3.33 | | | 116,916 | | | 3.44 | |
| Mortgage-backed securities | 39,347 | | | 4.11 | | | 99,529 | | | 3.00 | | | 124,242 | | | 2.18 | | | 1,799,041 | | | 3.89 | | | 2,062,159 | | | 3.75 | |
| Agency guaranteed obligations | 59,614 | | | 5.34 | | | 898 | | | 7.15 | | | 22,296 | | | 7.34 | | | 24426 | | | 5.06 | | | 107,234 | | | 5.71 | |
| Corporate obligations | — | | | — | | | 25,734 | | | 6.84 | | | 78,711 | | | 8.30 | | | — | | | — | | | 104,445 | | | 7.94 | |
Total available for sale debt securities(3) | $ | 180,663 | | | 4.37 | % | | $ | 390,639 | | | 2.42 | % | | $ | 262,526 | | | 4.65 | % | | $ | 1,935,087 | | | 3.92 | % | | $ | 2,768,915 | | | 3.81 | % |
(1) Yields are not tax equivalent.
(2) As of December 31, 2024, excludes $14,000 allowance for credit losses on held to maturity debt securities.
(3) Totals exclude $19.1 million equity securities, at fair value.
SOURCES OF FUNDS
General. Primary sources of funds consist of principal and interest cash flows received from loans and mortgage-backed securities, contractual maturities on investments, deposits, FHLBNY advances and proceeds from sales of loans and investments. These sources of funds are used for lending, investing and general corporate purposes, including acquisitions and common stock repurchases.
Deposits. The Bank offers a variety of deposits for retail and business accounts. Deposit products include savings accounts, checking accounts, interest-bearing checking accounts, money market deposit accounts and certificate of deposit accounts at varying interest rates and terms. The Bank also offers investment, insurance and IRA products. Business customers are offered several checking account and savings plans, cash management services, remote deposit capture services, payroll origination services, escrow account management and business credit cards. The Bank focuses on relationship banking for retail and business customers to enhance the customer experience. Deposit activity is influenced by state and local economic conditions, changes in interest rates, internal pricing decisions and competition. Deposits are primarily obtained from the areas surrounding the Bank’s branch locations. To attract and retain deposits, the Bank offers competitive rates, quality customer service and a wide variety of products and services that meet customers’ needs, including online and mobile banking.
Deposit pricing strategy is monitored monthly by the management Asset/Liability Committee and Pricing Committee. Deposit pricing is set weekly by the Bank’s Treasury Department. When setting deposit pricing, the Bank considers competitive market rates, FHLBNY advance rates and rates on other sources of funds. Savings accounts, interest and non-interest bearing checking accounts and money market deposit accounts, represented 83.0% of total deposits as of December 31, 2024 and 89.4% of total deposits as of December 31, 2023. As of December 31, 2024 and 2023, time deposits maturing in less than one year amounted to $3.05 billion and $1.02 billion, respectively. Our estimated uninsured and uncollateralized deposits at December 31, 2024 totaled $4.42 billion, or 23.7% of deposits. Our total estimated uninsured deposits, including
collateralized deposits as of December 31, 2024 was $9.87 billion. Within time deposits, $637.2 million or 20.1% was uninsured as of December 31, 2024.
The following table indicates the amount of certificates of deposit as of December 31, 2024 by time remaining to maturity. | | | | | | | | | | | | | | | | | | | | | | | | | | | | | |
| | Maturity | | Total |
| | 3 Months or Less | | Over 3 to 6 Months | | Over 6 to 12 Months | | Over 12 Months | |
| | (In thousands) |
| Certificates of deposit of $250,000 or more | $ | 297,702 | | | $ | 265,052 | | | $ | 209,746 | | | $ | 16,842 | | | $ | 789,342 | |
| Certificates of deposit less than $250,000 | 922,596 | | | 745,062 | | | 605,697 | | | 105,458 | | | 2,378,813 | |
| Total certificates of deposit | $ | 1,220,298 | | | $ | 1,010,114 | | | $ | 815,443 | | | $ | 122,300 | | | $ | 3,168,155 | |
Certificates of Deposit Maturities. The following table sets forth certain information regarding certificates of deposit.
| | | | | | | | | | | | | | | | | | | | | | | | | | | | | | | | | | | | | | | | | | | | | | | | | | | | | |
| | Period to Maturity from December 31, 2024 | | As of December 31, |
| | Less Than One Year | | One to Two Years | | Two to Three Years | | Three to Four Years | | Four to Five Years | | Five Years or More | | 2024 | | 2023 | | 2022 |
| | (In thousands) |
| Rate: | | | | | | | | | | | | | | | | | |
| 0.00 to 0.99% | $ | 318,514 | | | $ | 25,236 | | | $ | 8,348 | | | $ | 3,975 | | | $ | 6,188 | | | $ | — | | | $ | 362,261 | | | $ | 331,999 | | | $ | 327,655 | |
| 1.00 to 2.00% | 18,288 | | | 10,334 | | | 1,563 | | | 1,052 | | | 244 | | | 3 | | | 31,484 | | | 24,908 | | | 73,932 | |
| 2.01 to 3.00% | 21,424 | | | 325 | | | 280 | | | 149 | | | — | | | — | | | 22,178 | | | 12,462 | | | 145,254 | |
| 3.01 to 4.00% | 140,329 | | | 44,982 | | | 1,121 | | | — | | | — | | | — | | | 186,432 | | | 117,632 | | | 94,524 | |
| 4.01 to 5.00% | 2,547,304 | | | 18,261 | | | 235 | | | — | | | — | | | — | | | 2,565,800 | | | 608,941 | | | 110,071 | |
| | | | | | | | | | | | | | | | | |
| | | | | | | | | | | | | | | | | |
| | | | | | | | | | | | | | | | | |
| Total | $ | 3,045,859 | | | $ | 99,138 | | | $ | 11,547 | | | $ | 5,176 | | | $ | 6,432 | | | $ | 3 | | | $ | 3,168,155 | | | $ | 1,095,942 | | | $ | 751,436 | |
Borrowed Funds. As of December 31, 2024, the Bank had $2.02 billion of borrowed funds. Borrowed funds consist primarily of FHLBNY advances and repurchase agreements. Repurchase agreements are contracts for the sale of securities owned or borrowed by the Bank, with an agreement to repurchase those securities at an agreed-upon price and date. The Bank uses wholesale repurchase agreements, as well as retail repurchase agreements as an investment vehicle for its commercial sweep checking product. Bank policies limit the use of repurchase agreements to collateral consisting of U.S. Treasury obligations, U.S. government agency obligations or mortgage-related securities.
As a member of the FHLBNY, the Bank is eligible to obtain advances upon the security of the FHLBNY common stock owned and certain residential mortgage loans, provided certain standards related to creditworthiness have been met. FHLBNY advances are available pursuant to several credit programs, each of which has its own interest rate and range of maturities.
The following table sets forth the maximum month-end balance and average balance of FHLBNY advances, FED BTFP borrowings and securities sold under agreements to repurchase for the periods indicated.
| | | | | | | | | | | | | | | | | |
| | Years Ended December 31, |
| | 2024 | | 2023 | | 2022 |
| | (Dollars in thousands) |
| Maximum Balance: | | | | | |
| FHLBNY advances | $ | 1,518,497 | | | $ | 1,592,277 | | | $ | 753,370 | |
| FHLBNY line of credit | 567,000 | | | 500,000 | | | 486,000 | |
| Securities sold under agreements to repurchase | 117,323 | | | 99,669 | | | 125,506 | |
| FED BTFP Borrowing | 550,000 | | | 450,000 | | | — | |
| Average Balance: | | | | | |
| FHLBNY advances | $ | 1,290,836 | | | $ | 1,282,124 | | | $ | 503,713 | |
| FHLBNY line of credit | 115,902 | | | 262,289 | | | 139,012 | |
| Securities sold under agreements to repurchase | 102,043 | | | 87,227 | | | 113,550 | |
| FED BTFP Borrowing | 472,077 | | | 4,932 | | | — | |
| Weighted Average Interest Rate: | | | | | |
| FHLBNY advances | 3.41 | % | | 3.18 | % | | 0.85 | % |
| FHLBNY line of credit | 5.45 | | | 5.34 | | | 3.32 | |
| Securities sold under agreements to repurchase | 2.03 | | | 1.69 | | | 0.38 | |
| FED BTFP Borrowing | 4.78 | | | 4.83 | | | N/A |
The following table sets forth certain information as to borrowings, excluding purchase accounting adjustments, at the dates indicated.
| | | | | | | | | | | | | | | | | |
| | As of December 31, |
| 2024 | | 2023 | | 2022 |
| | (Dollars in thousands) |
| | | | | |
| FHLBNY advances | $ | 1,518,497 | | | $ | 1,299,836 | | | $ | 753,228 | |
| FHLBNY line of credit | 385,000 | | | 148,000 | | | 486,000 | |
| Securities sold under repurchase agreements | 113,224 | | | 72,161 | | | 98,000 | |
| FED BTFP Borrowing | — | | | 450,000 | | | — | |
| Purchase accounting adjustment on borrowed funds | 3,714 | | | 36 | | | 142 | |
| Total borrowed funds | $ | 2,020,435 | | | $ | 1,970,033 | | | $ | 1,337,370 | |
| | | | | |
| Weighted average interest rate of FHLBNY advances | 4.28 | % | | 3.07 | % | | 2.24 | % |
| Weighted average interest rate of FHLBNY line of credit | 4.67 | % | | 5.61 | % | | 4.61 | % |
| Weighted average interest rate of securities sold under agreements to repurchase | 2.11 | % | | 2.01 | % | | 0.59 | % |
| Weighted average interest rate of FED BTFP Borrowing | N/A | | 4.83 | % | | N/A |
Subordinated Debentures. On May 9, 2024, the Company issued $225.0 million of 9.00% Fixed-to-Floating Rate subordinated notes (the "Notes") due 2034, resulting in net proceeds of $221.2 million. The Notes bear interest at an initial rate of 9.00% per annum, payable semi-annually in arrears on May 15 and November 15 of each year, commencing on November 15, 2024. The last interest payment date for the fixed rate period will be May 15, 2029. From and including May 15, 2029 to, but excluding May 15, 2034 or the date of earlier redemption, the Notes will bear interest at a floating rate per annum equal to the Benchmark rate (which is expected to be three-month term Secured Overnight Financing Rate ("SOFR")), each as defined in and subject to the provisions of the Indenture, plus 476.5 basis points, payable quarterly in arrears on February 15, May 15, August 15, and November 15 of each year, commencing on August 15, 2029. The debt is included in Tier 2 capital for the Company. Debt issuance costs totaled $3.8 million and are being amortized to maturity. Amortization expense on these costs for the year ended December 31, 2024 amounted to $490,000, respectively.
On May 16, 2024, the Company assumed Lakeland’s obligations with respect to $150.0 million aggregate principal amount of fixed-to-floating rate subordinated notes due September 15, 2031. The Notes bear interest at a rate of 2.875% until September
15, 2026, and will then reset quarterly to the then-current Benchmark rate, which is expected to be the three-month term SOFR plus a spread of 220 basis points. The debt is included in Tier 2 capital for the Company.
1st Constitution Capital Trust II, a non-consolidated subsidiary of the Company acquired as part of the Lakeland acquisition and a Delaware statutory business trust established on June 15, 2006, issued $18.0 million of variable rate capital trust pass-through securities to investors. In accordance with FASB ASC 810, Consolidation, 1st Constitution Capital Trust II is not included in our consolidated financial statements. The debt is included in Tier 2 capital for the Company.
Lakeland Bancorp Capital Trust II, a non-consolidated subsidiary of the Company acquired as part of the Lakeland acquisition and a Delaware statutory business trust established in June 2003, issued $20.0 million of variable rate capital trust pass-through securities to investors. In accordance with FASB ASC 810, Consolidation, Lakeland Bancorp Capital Trust II is not included in our consolidated financial statements. The debt is included in Tier 2 capital for the Company.
Lakeland Bancorp Capital Trust IV, a non-consolidated subsidiary of the Company acquired as part of the Lakeland acquisition and a Delaware statutory business trust established in May 2007, issued $20.0 million of variable rate capital trust pass-through securities to investors. In accordance with FASB ASC 810, Consolidation, Lakeland Bancorp Capital Trust IV is not included in our consolidated financial statements. On August 3, 2015, Lakeland acquired and extinguished $10.0 million of Lakeland Bancorp Capital Trust IV debentures. The debt is included in Tier 2 capital for the Company.
Sussex Capital Trust II, a non-consolidated subsidiary of the Company acquired as part of the SB One acquisition and a Delaware statutory business trust established on June 28, 2007, issued $12.5 million of variable rate capital trust pass-through securities to investors. In accordance with FASB ASC 810, Consolidation, Sussex Capital Trust II is not included in our consolidated financial statements. The debt is included in Tier 2 capital for the Company.
Subordinated debentures as of December 31, 2024 and 2023 totaled $401.6 million and $10.7 million, respectively.
WEALTH MANAGEMENT SERVICES
As part of the Company’s strategy to increase fee related income, the Bank’s wholly owned subsidiary, Beacon Trust Company, and its registered investment advisor subsidiary, Beacon Investment Advisory Services, Inc., (“Beacon”) are engaged in providing wealth management services. These services include investment management, trust and estate administration, financial planning and tax compliance and planning. In addition to sourcing clients through Beacon's existing clients and other referrals, services are offered to existing customers through the Bank’s extensive branch, lending and insurance networks.
Beacon focuses on delivering personalized solutions based on the needs and objectives for each client. The majority of the fee income generated by Beacon is based on total assets under management. For the year ended December 31, 2024, asset management fees constituted 82.4% of total wealth management income.
INSURANCE AGENCY OPERATIONS
Provident Protection Plus, Inc., formerly SB One Insurance Agency, Inc., is a retail insurance broker operating in the State of New Jersey. The insurance agency’s primary source of revenue is commission income, which is earned by placing insurance coverage for its customers with various insurance underwriters. The insurance agency places property and casualty, life and health coverage with about twenty different insurance carriers.
SUBSIDIARY ACTIVITIES
PFS Insurance Services, Inc., formerly Provident Investment Services, Inc., is a wholly owned subsidiary of the Bank, and a New Jersey licensed insurance producer that sells insurance and investment products, including annuities to customers through a third-party networking arrangement.
Dudley Investment Corporation is a wholly owned subsidiary of the Bank which operates as a New Jersey Investment Company.
Beacon Trust Company, a New Jersey limited purpose trust company, is a wholly owned subsidiary of the Bank.
Beacon Investment Advisory Services, Inc. is a wholly owned subsidiary of Beacon Trust Company, incorporated under Delaware law and is a registered investment advisor.
Provident Protection Plus, Inc. (formerly SB One Insurance Company, Inc.), a full service insurance agency offering both commercial and personal lines of insurance, is a wholly owned subsidiary of the Bank.
Sussex Capital Trust II is a Delaware statutory business trust and a non-consolidated subsidiary of the Company.
1st Constitution Capital Trust II is a Delaware statutory business trust and a non-consolidated subsidiary of the Company.
Lakeland Bancorp Capital Trust II is a Delaware statutory business trust and a non-consolidated subsidiary of the Company.
Lakeland Bancorp Capital Trust IV is a Delaware statutory business trust and a non-consolidated subsidiary of the Company.
The Bank has the following active subsidiaries formed to manage and sell real estate acquired through foreclosure:
•Bergen Avenue Realty, LLC, a New Jersey limited liability company;
•Bergen Avenue Realty II, LLC, a New Jersey limited liability company;
•Bergen Avenue Realty PA, LLC, a Pennsylvania limited liability company; and
•490 Boulevard Realty Corp, a New Jersey corporation.
Human Capital Resources
As of December 31, 2024, the Company had 1,753 full-time and 48 part-time employees. None of the Company’s employees are represented by a collective bargaining group.
The Company provides several programs and benefits designed to enhance the employee experience. In addition to our robust health and wellness benefits that include annual employer contributions to health savings accounts, we promote physical and emotional well-being through our Discover Wellness program. Discover Wellness focuses on engagement and awareness-based programs, combining both educational seminars and physical activities to promote healthy behaviors. In recognition of our on-going commitment to creating a healthier workplace for our employees, our Discover Wellness program was again recognized as a gold award winner in Aetna’s Workplace Well-being program. Employees can also engage with the Company-sponsored Employee Assistance Program for mental health and legal assistance, using both telephonic and chat options.
We believe that employees should share in the financial success of the Company. One way we accomplish this is through Company support of retirement preparation. All employees are eligible for a cash 401(k) profit-sharing contribution, while employees hired prior to December 31, 2023 were eligible to participate in the Employee Stock Ownership Plan, which enables employees to accumulate PFS, Inc. shares. The profit-sharing and ESOP contributions are 100% funded by the Company. In addition, to further assist employees with retirement planning, in 2025, we increased our 401(k) plan company match to 50% on the first 8% of eligible compensation deferred from 25% on the first 6% for 2024..
The Company also provides full-time employees with life insurance coverage at one times salary to provide financial security for their families.
We believe pursuit of secondary education is a means for employees to build their financial futures. Provident EDYOU assists employees with tuition and student loan repayments after three months of employment. Employees may also be eligible to receive continuing education assistance and, for certain functions, the potential increase to their base salary after the completion of professional certification programs.
Consistent with our commitment to assisting the communities we serve through monetary assistance provided by the Bank and The Provident Bank Foundation, we encourage our employees to engage in community service. We offer our employees paid time off to assist in their chosen charitable and community-based endeavors.
Our Company is committed to fostering an inspiring working environment that is free from harassment or discrimination of any kind. We are proud of our diverse workforce, including women holding 64% of managerial positions. We promote programs such as Provident Women, which provides opportunities for networking events and volunteer opportunities. We support our military veterans and their families through Provident Salutes, and programs such as Bring Home a Hero. To develop the next generation of financial talent in our communities, we sponsor a summer intern program for over 30 students in our region.
Overall, the Company is committed to creating a working environment that promotes a positive employee experience, professional development and recognition for living by our guiding principles. The Company believes its working relationship with its employees is good.
REGULATION AND SUPERVISION
General
As a bank holding company controlling the Bank, the Company is subject to the Bank Holding Company Act of 1956 (“BHCA”), as amended, and the rules and regulations of the Federal Reserve Board under the BHCA. The Company is also subject to the provisions of the New Jersey Banking Act of 1948 (the “New Jersey Banking Act”) and the accompanying regulations of the Commissioner of the New Jersey Department of Banking and Insurance (“Commissioner”) applicable to bank holding companies. The Company and the Bank are required to file reports with, and otherwise comply with, the rules and regulations of the Federal Reserve Board and the Commissioner. The Federal Reserve Board and the Commissioner conduct periodic examinations to assess the Company’s compliance with various regulatory requirements. The company filed an election to qualify as a financial holding company under federal regulations on January 31, 2014, which was deemed effective by the Federal Reserve Board on March 5, 2015. Additionally, the Company files certain reports with, and otherwise complies with, the rules and regulations of the SEC under the federal securities laws and the listing requirements of the New York Stock Exchange.
The Bank is a New Jersey chartered savings bank, and its deposit accounts are insured up to applicable limits by the FDIC. The Bank is subject to extensive regulation, examination and supervision by the Commissioner as the issuer of its charter and by the FDIC as its deposit insurer and primary federal prudential regulator. The Bank files reports with the Commissioner and the FDIC concerning its activities and financial condition, and it must obtain regulatory approval prior to entering into certain transactions, such as mergers with, or acquisitions of, other depository institutions, and opening or acquiring branch offices. The Commissioner and the FDIC conduct periodic examinations to assess the Bank’s compliance with various regulatory requirements. This regulation and supervision establish a comprehensive framework of activities in which a savings bank can engage and is intended primarily for the protection of the Deposit Insurance Fund ("DIF") and depositors. This framework also gives the regulatory authorities extensive discretion in connection with their supervisory and enforcement authority, including the ability to set policies with respect to the classification of assets and the establishment of adequate credit loss reserves for regulatory purposes.
As of December 31, 2024, the Bank had consolidated assets of $24.05 billion. The Company exceeded $10 billion in total consolidated assets in 2020, which subjects the Company to increased supervision and regulation. In particular, the Company is subject to the direct supervision of the Consumer Financial Protection Bureau (“CFPB”) with respect to federal consumer laws and regulations. Additionally, under existing federal laws and regulations, the Company now (1) receives less debit card fee income; (2) is subject to more stringent compliance requirements under the “Volcker Rule,” (i.e., a provision of the Dodd-Frank Wall Street Reform and Consumer Protection Act of 2010 (“Dodd-Frank Act”) which prohibits banking entities from engaging in proprietary trading or investing in or sponsoring hedge funds or private equity funds); and (3) generally is subject to higher FDIC assessment rates. Certain enhanced prudential standards are also now applicable such as additional risk management requirements, both from a framework and corporate governance perspective. These and other supervisory and regulatory implications of crossing the $10 billion threshold have and will likely continue to result in increased regulatory costs.
The material laws and regulations applicable to the Company and the Bank are summarized below and elsewhere in this Annual Report on Form 10-K.
New Jersey Banking Regulation
Activity Powers. The Bank derives its lending, investment and other activity powers primarily from the applicable provisions of the New Jersey Banking Act and its related regulations. Under these laws and regulations, savings banks, including the Bank, generally may, subject to certain limits, invest in:
(1) Real estate mortgages;
(2) Consumer and commercial loans;
(3) Specific types of debt securities, including certain corporate debt securities and obligations of federal, state and local governments and agencies;
(4) Certain types of corporate equity securities; and
(5) Certain other assets.
A savings bank may also invest pursuant to a “leeway” power that permits investments not otherwise permitted by the New Jersey Banking Act, subject to certain restrictions imposed by the FDIC. “Leeway” investments must comply with a number of limitations on the individual and aggregate amounts of such investments. A savings bank may also exercise trust powers upon the approval of the Commissioner. New Jersey savings banks may exercise those powers, rights, benefits or
privileges authorized for national banks or out-of-state banks or for federal or out-of-state savings banks or savings associations, provided that before exercising any such power, right, benefit or privilege, prior approval by the Commissioner by regulation or by specific authorization is required. The exercise of these lending, investment and activity powers is limited by federal law and related regulations. See “Federal Banking Regulation” below.
Loans-to-One-Borrower Limitations. With certain specified exceptions, a New Jersey chartered savings bank may not make loans or extend credit to a single borrower and to entities related to the borrower in an aggregate amount that would exceed 15% of the bank’s capital funds. A New Jersey chartered savings bank may lend an additional 10% of the bank’s capital funds if secured by collateral meeting the requirements of the New Jersey Banking Act. The Bank currently complies with applicable loans-to-one-borrower limitations.
Dividends. Under the New Jersey Banking Act, a stock savings bank may declare and pay a dividend on its capital stock only to the extent that the payment of the dividend would not impair the capital stock of the savings bank. In addition, a stock savings bank may not pay a dividend unless the savings bank would, after the payment of the dividend, have a surplus of not less than 50% of its capital stock. Federal law may also limit the amount of dividends that may be paid by the Bank.
Minimum Capital Requirements. Regulations of the Commissioner impose on New Jersey chartered depository institutions, including the Bank, minimum capital requirements similar to those imposed by the FDIC on insured state banks. As of December 31, 2024, the Bank was considered “well capitalized” under FDIC guidelines.
Loans to a Bank’s Insiders. Provisions of the New Jersey Banking Act also impose conditions and limitations on the liabilities owed to a savings bank by its directors and executive officers and by corporations and partnerships controlled by such persons that are comparable in many respects to the conditions and limitations imposed on the loans and extensions of credit to insiders and their related interests under Regulation O, as discussed below. The New Jersey Banking Act also provides that a savings bank that is in compliance with Regulation O is deemed to be in compliance with such provisions of the New Jersey Banking Act.
Examination and Enforcement. The New Jersey Department of Banking and Insurance may examine the Company and the Bank whenever it deems an examination advisable and it examines the Bank at least every two years. The Commissioner may order any savings bank to discontinue any violation of law or unsafe or unsound business practice and may direct any director, officer, attorney or employee of a savings bank engaged in an objectionable activity, after the Commissioner has ordered the activity to be terminated, to show cause at a hearing before the Commissioner why such person should not be removed.
Federal Banking Regulation
Capital Requirements. Federal regulations require federally insured depository institutions ("IDIs") to meet several minimum capital standards: a common equity Tier 1 capital to risk-based assets ratio of 4.5%, a Tier 1 capital to risk-based assets ratio of 6.0%, a total capital to risk-based assets ratio of 8.0%, and a Tier 1 capital to total assets leverage ratio of 4.0%.
In determining the amount of risk-weighted assets for purposes of calculating risk-based capital ratios, all assets, including certain off-balance sheet assets (e.g., recourse obligations, direct credit substitutes, residual interests) are multiplied by a risk weight factor assigned by the regulations based on the risks believed inherent in the type of asset. Higher levels of capital are required for asset categories believed to present greater risk. Common equity Tier 1 capital is generally defined as common stockholders’ equity and retained earnings. Tier 1 capital is generally defined as common equity Tier 1 and additional Tier 1 capital. Additional Tier 1 capital includes certain noncumulative perpetual preferred stock and related surplus and minority interests in equity accounts of consolidated subsidiaries. Total capital includes Tier 1 capital (common equity Tier 1 capital plus additional Tier 1 capital) and Tier 2 capital. Tier 2 capital is comprised of capital instruments and related surplus, meeting specified requirements, and may include cumulative preferred stock and long-term perpetual preferred stock, mandatory convertible securities, intermediate preferred stock and subordinated debt. Also included in Tier 2 capital is the allowance for credit losses limited to a maximum of 1.25% of risk-weighted assets and, for institutions that have exercised an opt-out election regarding the treatment of Accumulated Other Comprehensive Income, up to 45% of net unrealized gains on available-for-sale equity securities with readily determinable fair market values. The Company elected to opt-out of this election. Calculation of all types of regulatory capital is subject to deductions and adjustments specified in the regulations. In assessing an institution’s capital adequacy, the FDIC takes into consideration, not only these numeric factors, but qualitative factors as well, and has the authority to establish higher capital requirements for individual institutions where deemed necessary.
In addition to establishing the minimum regulatory capital requirements, federal regulations limit capital distributions and certain discretionary bonus payments to management if the institution does not hold a “capital conservation buffer”
consisting of 2.5% of common equity Tier 1 capital to risk-weighted assets above the amount necessary to meet its minimum risk-based capital requirements.
Through subsequent rulemaking, the federal banking agencies provided certain forms of relief to banking organizations that are not subject to the advanced approaches capital rule (i.e., banks with $250 billion or more in total assets or $10 billion or more in total foreign exposures). Under the rule, non-advanced approaches banking organizations such as the Bank will apply a simpler regulatory capital treatment for mortgage servicing assets (“MSAs”); certain deferred tax assets (“DTAs”) arising from temporary differences; investments in the capital of unconsolidated financial institutions other than those currently applied; and capital issued by a consolidated subsidiary of a banking organization and held by third parties (often referred to as minority interest) that is includable in regulatory capital. In addition, certain general requirements of the regulation have been eliminated in respect of non-advanced approaches institutions, including: (i) the capital rule’s 10 percent common equity Tier 1 capital deduction threshold that applies individually to MSAs, temporary difference DTAs, and significant investments in the capital of unconsolidated financial institutions in the form of common stock; (ii) the aggregate 15 percent common equity Tier 1 capital deduction threshold that subsequently applies on a collective basis across such items; (iii) the 10 percent common equity Tier 1 capital deduction threshold for non-significant investments in the capital of unconsolidated financial institutions; and (iv) the deduction treatment for significant investments in the capital of unconsolidated financial institutions not in the form of common stock. Accordingly, non-advanced approaches banking organizations deduct from common equity Tier 1 capital any amount of MSAs, temporary difference DTAs, and investments in the capital of unconsolidated financial institutions that individually exceeds 25 percent of common equity Tier 1 capital.
In August 2020, the federal banking agencies issued a final rule providing banking institutions that had adopted the CECL accounting standard in the 2020 calendar year with the option to delay for two years the estimated impact of CECL on regulatory capital, followed by a three-year transition period to phase out the aggregate amount of the capital benefit provided during the initial two-year delay (i.e., a five-year transition in total). In connection with its adoption of CECL on January 1, 2020, the Company elected to utilize the five-year CECL transition. Further information regarding the impact of CECL can be found in Note 3 "Held to Maturity Debt Securities", Note 5 "Loans Receivable and Allowance for Credit Losses", and Note 16 "Allowance for Credit Losses on Off-Balance Sheet Credit Exposures".
The following table shows the Bank’s Tier 1 leverage ratio, common equity Tier 1 risk-based capital ratio, Tier 1 risk-based capital ratio, and total risk-based capital ratio, as of December 31, 2024:
| | | | | | | | | | | | | | | | | | | | | | | |
| | As of December 31, 2024 |
| | Capital | | Percent of Assets(1) | | Capital Requirements (1) | | Capital Requirements with Capital Conservation Buffer (1) |
| | (Dollars in thousands) |
| Tier 1 leverage capital | $ | 2,265,907 | | | 9.72 | % | | 4.00 | % | | 4.00 | % |
| Common equity Tier 1 risk-based capital | 2,265,907 | | | 11.42 | | | 4.50 | | | 7.00 | |
| Tier 1 risk-based capital | 2,265,907 | | | 11.42 | | | 6.00 | | | 8.50 | |
| Total risk-based capital | 2,458,799 | | | 12.40 | | | 8.00 | | | 10.50 | |
(1) For purposes of calculating regulatory Tier 1 leverage capital, assets are based on adjusted total leverage assets. In calculating common equity Tier 1 risk-based capital, Tier 1 risk-based capital and total risk-based capital, assets are based on total risk-weighted assets.
As of December 31, 2024, the Bank was considered “well capitalized” under FDIC guidelines.
Stress Testing. As part of the regulatory relief provided by the Economic Growth, Regulatory Relief, and Consumer Protection Act of 2018 (“Economic Growth Act”), the asset threshold requiring IDIs to conduct and report to their primary federal bank regulators annual company-run stress tests was raised from $10 billion to $250 billion in total consolidated assets and the requirement was made “periodic” rather than annual. The Economic Growth Act also provided that bank holding companies with under $100 billion in assets were no longer subject to stress testing requirements. The amendments also provide the Federal Reserve with discretion to subject bank holding companies with more than $100 billion in total assets to enhanced supervision. Notwithstanding these amendments, the federal banking agencies indicated through interagency guidance that the capital planning and risk management practices of institutions with total assets less than $100 billion would continue to be reviewed through the regular supervisory process. As part of its risk management processes, the Bank routinely stress tests the
Bank’s capital under a variety of economic stress scenarios and manages its capital position accordingly. As a result of these amendments, the Bank and the Company currently are not subject to company-run stress testing requirements.
The Volcker Rule. A provision of the Dodd-Frank Act prohibits IDIs and their holding companies from engaging in proprietary trading except in limited circumstances, and it prohibits them from owning equity interests in excess of three percent of Tier 1 Capital in private equity and hedge funds (known as the “Volcker Rule”). The Volcker Rule and its implementing regulations prohibit banking entities from: (1) engaging in short-term proprietary trading for their own accounts; and (2) having certain ownership interests in and relationships with hedge funds or private equity funds, which are referred to as “covered funds.” Banking entities also are required to establish internal compliance programs that are consistent with the extent to which an entity engages in activities covered by the Volcker Rule.
The Volcker Rule was revised in 2019 to simplify and streamline compliance requirements for firms that do not have significant trading activities and enhances requirements for firms that do. Under the amended regulations, compliance requirements are based on the amount of assets and liabilities that a bank trades. Firms with significant trading activities (i.e., those with $20 billion or more in trading assets and liabilities), have heightened compliance obligations.
In addition, with respect to the Volcker Rule's prohibition on banking entities' investing in or sponsoring “covered funds,” the current framework excludes several funds from the definition of the “covered fund,” allows IDIs to invest in certain foreign public funds and exempts the activities of qualifying foreign excluded funds from the Volcker Rule’s prohibitions. Although we have benefited from significantly reduced compliance obligations due to the level of our trading assets being below the $20 billion threshold, we remain subject to the modified rules and requirements related to covered funds.
Activity Restrictions on State-Chartered Banks. Federal law and FDIC regulations generally limit the activities and investments of state-chartered FDIC insured banks and their subsidiaries to those permissible for national banks and their subsidiaries, unless such activities and investments are specifically exempted by law or consented to by the FDIC.
Before making a new investment or engaging in a new activity that is not permissible for a national bank or otherwise permissible under federal law or FDIC regulations, an insured bank must seek approval from the FDIC to make such investment or engage in such activity. The FDIC will not approve the activity unless the bank meets its minimum capital requirements and the FDIC determines that the activity does not present a significant risk to the DIF. Certain activities of subsidiaries that are engaged in activities permitted for national banks only through a “financial subsidiary” are subject to additional restrictions.
Federal law permits a state-chartered savings bank to engage, through financial subsidiaries, in any activity in which a national bank may engage through a financial subsidiary and on substantially the same terms and conditions. In general, the law permits a national bank that is well-capitalized and well-managed to conduct, through a financial subsidiary, any activity permitted for a financial holding company other than insurance underwriting, insurance investments, real estate investment or development or merchant banking. The total assets of all such financial subsidiaries may not exceed the lesser of 45% of the bank’s total assets or $50 billion. The bank must have policies and procedures to assess the financial subsidiary’s risk and protect the bank from such risk and potential liability, must not consolidate the financial subsidiary’s assets with the bank’s, and must exclude from its own assets and equity all equity investments, including retained earnings, in the financial subsidiary. The Bank currently meets all conditions necessary to establish and engage in permitted activities through financial subsidiaries.
Federal Home Loan Bank ("FHLB") System. The Bank is a member of the FHLB system which consists of eleven regional FHLBs, each subject to supervision and regulation by the Federal Housing Finance Agency ("FHFA"). The FHLB provides a central credit facility primarily for member institutions. As a member of the FHLBNY, the Bank is required to purchase and hold shares of capital stock in the FHLBNY in an amount as required by that FHLBNY’s capital plan and minimum capital requirements. The Bank is in compliance with these requirements. The Bank has received dividends on its FHLBNY stock, although no assurance can be given that these dividends will continue to be paid. For the year ended December 31, 2024, dividends paid by the FHLBNY to the Bank totaled $8.3 million.
Deposit Insurance. As a member institution of the FDIC, deposit accounts at the Bank are generally insured by the DIF up to a maximum of $250,000 for each separately insured depositor per account ownership category.
Banks of greater than $10 billion, such as the Bank, are assessed based on a rate derived from a scorecard which assesses certain factors such as examination ratings and financial measures related to the bank’s ability to withstand stress and measures of loss severity to the DIF if the bank should fail. The Bank has exceeded $10 billion in assets for four consecutive calendar quarters and is now classified as a large institution for deposit insurance assessment purposes, resulting in a higher FDIC insurance premium.
Under current FDIC rules, effective January 1, 2023, the assessment range (inclusive of possible adjustments) for institutions with greater than $10.0 billion of total assets is established at 2.5 to 45 basis points. In addition, the FDIC approved
a final rule to implement a special assessment to recover the loss to the DIF associated with protecting uninsured depositors following the closures of Silicon Valley Bank and Signature Bank. As a result of this rule, the FDIC issued a special assessment of $775,000 for the year ended December 31, 2023.
Under the final rule, the assessment base for an IDI is equal to the IDI’s estimated uninsured deposits as of December 31, 2023, adjusted to exclude the first $5 billion in uninsured deposits. In March 2024, the FDIC issued an update to the special assessment estimate, increasing the estimated loss assessment by approximately 25%. As a result of this update, the Bank accrued an additional $195,000 for the special assessment for the year ended December 31, 2024. The FDIC has been collecting the special assessment at an annual rate of 13.4 basis points since the first quarterly assessment period of 2024, and the FDIC is anticipated to collect the special assessment for eight quarterly assessment periods. The FDIC may end the collection early, extend the special assessment period beyond the anticipated eight-quarter collection period or impose a one-time final shortfall special assessment. Any significant increases in insurance premiums could have an adverse effect on the Company’s operating expenses and results of operations.
Insurance of deposits may be terminated by the FDIC upon a finding that the institution has engaged or is engaging in unsafe and unsound practices, is in an unsafe or unsound condition to continue operations, or has violated any applicable law, regulation, order or condition imposed by the FDIC or written agreement entered into with the FDIC. Management does not know of any practice, condition or violation that might lead to termination of deposit insurance.
Brokered Deposits. The Federal Deposit Insurance Act and FDIC regulations thereunder limit the ability of banks to accept, renew or rollover brokered deposits unless the institution is well capitalized under the prompt corrective action framework discussed in greater detail below, or unless it is adequately capitalized and obtains a waiver from the FDIC. Less-than-well-capitalized banks also are subject to restrictions on the interest rates that they may pay on deposits. The characterization of deposits as “brokered” may result in the imposition of higher deposit assessments on such deposits. In December 2020, the FDIC issued a final rule amending its regulations governing brokered deposits. The rule sought to clarify and modernize the FDIC’s regulatory framework for brokered deposits. Notable aspects of the 2020 rule included: (1) the establishment of bright-line standards for determining whether an entity meets the statutory definition of “deposit broker”; (2) the identification of a number of business relationships in which the agent or nominee is automatically not deemed to be a “deposit broker” because their primary purpose is not the placement of funds with depository institutions (the “primary purpose exception”); (3) the establishment of a more transparent application process for entities that seek the “primary purpose exception,” but do not qualify as one of the identified business relationships to which the exception is automatically applicable; and (4) the clarification that third parties that have an exclusive deposit-placement arrangement with only one IDI is not considered a “deposit broker.” The final rule took effect in April 2021 and full compliance with the rule has been required since January 1, 2022. Further, as mandated by the Economic Growth Act, the FDIC’s brokered deposit regulations provide a limited exception for reciprocal deposits for banks that are well managed and well capitalized (or adequately capitalized and have obtained a waiver from the FDIC as mentioned above). Under the limited exception, qualified banks can be exempt from treatment as “brokered” deposits up to $5 billion or 20 percent of the institution’s total liabilities in reciprocal deposits (which are defined as deposits received by a financial institution through a deposit placement network with the same maturity (if any) and in the same aggregate amount as deposits placed by the institution in other network member banks).
Enforcement. The FDIC has extensive enforcement authority over insured state-chartered savings banks, including the Bank. This enforcement authority includes, among other things, the ability to assess civil money penalties, issue cease and desist orders and remove directors and officers. In general, these enforcement actions may be initiated in response to violations of law or regulation or to engagement in unsafe or unsound practices.
Transactions with Affiliates. Transactions between an insured bank, such as the Bank, and any of its affiliates are governed by Sections 23A and 23B of the Federal Reserve Act, made applicable to the Bank through the Federal Deposit Insurance Act, and the Federal Reserve Act's implementing regulation, Regulation W. An affiliate of a bank includes any company or entity that controls, is controlled by or is under common control with the bank. A subsidiary of a bank that is not also a depository institution, financial subsidiary or other entity defined by the regulation generally is not treated as an affiliate of the bank for purposes of Sections 23A and 23B and Regulation W.
Among other things, Section 23A:
•Limits the extent to which a bank or its subsidiaries may engage in “covered transactions” with any one affiliate to an amount equal to 10% of such bank’s capital stock and surplus, and limits all such transactions with all affiliates to an amount equal to 20% of such capital stock and surplus; and
•Requires that all "covered transactions" be on terms and conditions that are consistent with safe and sound banking practices.
The term “covered transaction” includes the making of loans, purchase of assets, issuance of guarantees and other similar types of transactions. Further, most loans by a bank to any of its affiliates must be secured by collateral in amounts ranging from 100 to 130 percent of the loan amounts. In addition, a transaction between a bank and an affiliate, including covered transactions, the sale of assets and the furnishing of services by a bank to an affiliate must be on terms and under circumstances that are substantially the same, or at least as favorable to the bank, as those prevailing at the time for comparable transactions with or involving a non-affiliate.
Prohibitions Against Tying Arrangements. Banks are subject to statutory prohibitions on certain tying arrangements. A depository institution is prohibited, subject to certain exceptions, from extending credit to or offering any other service, or fixing or varying the consideration for such extension of credit or service, on the condition that the customer obtain some additional service from the institution or its affiliates or that the customer not obtain services of a competitor of the institution.
Privacy and Data Security Standards. Applicable regulations require the Bank to disclose its privacy policies, including identifying with whom it shares customers' “non-public personal information” at the time of establishing the customer relationship and annually thereafter.
Federal regulations also require the Company and the Bank to provide their customers with initial and annual notices that accurately reflect their privacy policies and practices. In addition, the Company and the Bank are required to provide customers with the ability to “opt-out” of having the Company and the Bank share their non-public personal information with unaffiliated third parties before they can disclose such information, subject to certain exceptions.
The federal banking agencies, including the FDIC, have adopted guidelines for establishing information security standards for implementing safeguards under the supervision of the board of directors. These guidelines, as well as guidance provided by the FDIC, increasingly focus on risk management and processes related to information technology and the use of third parties in the provision of financial services.
In November 2021, the federal financial regulatory agencies published a final rule that will impose upon banking organizations and their service providers new notification requirements for significant cybersecurity incidents. The final rule took effect on April 1, 2022 and full compliance was required as of May 1, 2022. The final rule requires banking organizations to notify their primary federal regulator as soon as possible and no later than 36 hours after the discovery of a “computer-security incident” that rises to the level of a “notification incident” within the meaning attributed to those terms by the final rule. Banks’ service providers are required under the final rule to notify any affected bank to or on behalf of which the service provider provides services “as soon as possible” after determining that it has experienced an incident that materially disrupts or degrades, or is reasonably likely to materially disrupt or degrade, covered services provided to such bank for as much as four hours. On March 9, 2022, the SEC proposed amendments, which took effect on September 5, 2023, to enhance and standardize disclosures regarding cybersecurity incidents, risk management, and response strategies from public companies subject to reporting requirements under the Exchange Act. The SEC also adopted a final rule that took effect in December 2023, requiring public companies to disclose material cybersecurity incidents within four business days of occurrence and to disclose material information regarding cybersecurity risk management, strategy and governance on an annual basis.
Community Reinvestment Act ("CRA") and Fair Lending Laws. All FDIC insured institutions have a responsibility under the CRA and its implementing regulations to help meet the credit needs of their entire communities, including low- and moderate-income neighborhoods and borrowers. In connection with its examination of a state-chartered savings bank, the FDIC is required to assess the institution’s record of compliance with the CRA. Among other things, the current CRA regulations in effect rate an institution based upon its actual performance in meeting community needs. In particular, the current examination and evaluation process in effect focuses on three tests:
•A lending test, to evaluate the institution’s record of making home mortgage, small business, small farm, and consumer loans, if applicable, in its assessment area(s), with consideration given towards, among other factors, borrower characteristics and geographic distribution;
•An investment test, to evaluate the institution’s record of helping to meet the credit needs of its assessment area(s) through qualified investments characterized as a lawful investment, deposit, membership share, or grant that has as its primary purpose community development; and
•A service test, to evaluate the institution’s systems for delivering retail banking services through its branches, ATMs and other offices and access facilities, including the distribution of its branches, ATMs and other offices/access facilities, and the institution’s record of opening and closing branches.
An institution’s failure to comply with the provisions of the CRA could, at a minimum, result in regulatory restrictions on its activities, including, but not limited to, engaging in acquisitions and mergers. The Bank received a “Satisfactory” CRA rating in its last completed federal examination, dated June 21, 2021.
On October 24, 2023, the FDIC, the Federal Reserve Board and the Office of the Comptroller of the Currency (“OCC”) issued a final rule to strengthen and modernize the CRA regulations. Under the final rule, banks with assets of at least $2 billion as of December 31 in both of the prior two calendar years will be considered a "large bank." The agencies will evaluate large banks under four performance tests: the Retail Lending Test; the Retail Services and Products Test; the Community Development Financing Test; and the Community Development Services Test. Under the regulations, the applicability date for the majority of the provisions is January 1, 2026, and additional requirements will be applicable under the regulations on January 1, 2027. On March 29, 2024, a federal court in the Northern District of Texas issued a preliminary injunction against the new CRA regulations, enjoining the federal banking agencies from enforcing the regulations against the plaintiff bank industry trade groups, and extending the regulations’ implementation dates day-for-day for each day the injunction is in place.
In addition, the Equal Credit Opportunity Act and the Fair Housing Act prohibit lenders from discriminating in their lending practices on the basis of the borrower’s characteristics as specified in those statutes. An institution’s failure to comply with the Equal Credit Opportunity Act and/or the Fair Housing Act could result in enforcement actions by the FDIC, or the CFPB, as well as other federal or state regulatory agencies and the Department of Justice.
Safety and Soundness Standards. Each federal banking agency, including the FDIC, has adopted guidelines establishing general standards relating to internal controls, information and internal audit systems, loan documentation, credit underwriting, interest rate exposure, asset growth, asset quality, earnings, compensation, fees and benefits. In general, the guidelines require, among other things, appropriate systems and practices to identify and manage the risks and exposures specified in the guidelines. The guidelines prohibit excessive compensation as an unsafe and unsound practice and describe compensation as excessive when the amounts paid are unreasonable or disproportionate to the services performed by an executive officer, employee, director, or principal stockholder. In addition, FDIC regulations require a bank that is given notice by the FDIC that is not satisfying any of such safety and soundness standards to submit a compliance plan to the FDIC. If, after being so notified, a bank fails to submit an acceptable compliance plan or fails in any material respect to implement an accepted compliance plan, the FDIC may issue an order directing corrective and other actions of the type to a significantly undercapitalized institution under the "prompt corrective action" provisions discussed below. If a bank fails to comply with such an order, the FDIC may seek enforcement through judicial proceedings and to impose civil monetary penalties.
The Dodd-Frank Act requires the federal banking agencies and the SEC to establish joint regulations or guidelines for specified entities, such as us, having at least $1 billion in total assets (including the Company and the Bank), to prohibit incentive-based payment arrangements that encourage inappropriate risk-taking by providing an executive officer, employee, director or principal shareholder with excessive compensation, fees, or benefits or that could lead to material financial loss to the entity. In 2016, the federal regulatory agencies approved a proposed joint rulemaking to implement this provision of the Dodd-Frank Act, and in May 2024, several federal banking agencies reproposed the incentive compensation regulation, although not all agencies required by Dodd-Frank to participate in the rulemaking signed on to the proposal in 2024.
In October 2022, the SEC adopted final rules implementing the incentive-based compensation recovery (“clawback”) provisions of the Dodd-Frank Act. The final rules direct stock exchanges to require listed companies to implement clawback policies to recover incentive-based compensation from current or former executive officers in the event of material noncompliance with any financial reporting requirement under the securities laws and to disclose their clawback policies and their actions under those policies. The Company has adopted a clawback policy in conformance with this requirement.
Prompt Corrective Action. Federal law requires the FDIC and the other federal banking regulators to promptly resolve the problems of undercapitalized institutions. Federal law also establishes five categories, consisting of “well capitalized,” “adequately capitalized,” “undercapitalized,” “significantly undercapitalized” and “critically undercapitalized.” The FDIC’s regulations define the five capital categories as follows:
An institution will be treated as “well capitalized” if:
•it has a leverage ratio of 5% or greater;
•it has a common equity Tier 1 capital ratio of 6.5% or greater;
•it has a Tier 1 risk-based capital ratio of 8% or greater;
•it has a total risk-based capital ratio of 10% or greater; and
•it is not subject to any written agreement, order or capital directive, or prompt corrective action directive issued by the FDIC to meet and maintain a specific capital level for any capital measure.
An institution will be treated as “adequately capitalized” if:
•it has a leverage ratio of 4% or greater;
•it has a common equity Tier 1 capital ratio of 4.5% or greater;
•it has a Tier 1 risk-based capital ratio of 6% or greater; and
•it has a total risk-based capital ratio of 8% or greater.
An institution will be treated as “undercapitalized” if:
•it has a leverage ratio of less than 4%;
•it has a common equity Tier 1 capital ratio of less than 4.5%;
•it has a Tier 1 risk-based capital ratio of less than 6%; or
•it has a total risk-based capital ratio of less than 8%.
An institution will be treated as “significantly undercapitalized” if:
•it has a leverage ratio of less than 3%;
•it has a common equity Tier 1 capital ratio of less than 3%;
•it has a Tier 1 risk-based capital ratio of less than 4%; or
•it has a total risk-based capital ratio of less than 6%.
An institution that has a tangible capital to total assets ratio equal to or less than 2% would be deemed “critically undercapitalized.” The FDIC is required, with some exceptions, to appoint a receiver or conservator for an insured state bank if that bank is critically undercapitalized. The FDIC may also appoint a conservator or receiver for an insured state bank on the basis of the institution’s financial condition or upon the occurrence of certain events, including:
•Insolvency, or when the assets of the bank are less than its liabilities to depositors and others;
•Substantial dissipation of assets or earnings through violations of law or unsafe or unsound practices;
•Existence of an unsafe or unsound condition to transact business;
•Likelihood that the bank will be unable to meet the demands of its depositors or to pay its obligations in the normal course of business; and
•Insufficient capital, or the incurring or likely incurring of losses that will substantially deplete all of the institution’s capital with no reasonable prospect of replenishment of capital without federal assistance.
Consumer Financial Protection. The Dodd-Frank Act established the CFPB to be responsible for interpreting and enforcing federal consumer financial laws, as defined by the Dodd-Frank Act, that, among other things, govern the provision of deposit accounts along with mortgage origination and servicing. Some federal consumer financial laws enforced by the CFPB that the Bank must comply with include the Equal Credit Opportunity Act, the Truth in Lending Act ("TILA"), the Truth in Savings Act, the Home Mortgage Disclosure Act, the Real Estate Settlement Procedures Act, the Fair Debt Collection Practices Act, and the Fair Credit Reporting Act. The CFPB is also authorized to prevent any institution under its authority from engaging in an unfair, deceptive, or abusive act or practice in connection with consumer financial products and services.
Under TILA, as implemented by Regulation Z, mortgage lenders are required to make a reasonable and good faith determination, based on verified and documented information, that a consumer applying for a mortgage loan has a reasonable ability to repay the loan according to its terms. Alternatively, the mortgage lender can originate “qualified mortgages,” which are entitled to a presumption that the creditor making the loan satisfied the ability-to-repay requirements. In general, a qualified mortgage is a mortgage loan without negative amortization, interest-only payments, balloon payments, or terms exceeding 30 years.
The CFPB has exclusive examination and primary enforcement authority with respect to compliance with federal consumer financial laws and regulations by institutions under its supervision and is authorized, individually or jointly with the federal bank regulatory agencies, to conduct investigations to determine whether any person is, or has, engaged in conduct that violates such laws or regulations. The CFPB may bring an administrative enforcement proceeding or civil action in Federal district court. In addition, in accordance with a memorandum of understanding entered into between the CFPB and the Department of Justice, the two agencies have agreed to coordinate efforts related to enforcing the fair lending laws, which includes information sharing and conducting joint investigations. Because the Bank has exceeded $10 billion in assets, it is subject to the supervisory and enforcement authority of the CFPB related to federal consumer financial laws and regulations.
The Dodd-Frank Act also permits states to adopt stricter consumer protection laws and state attorneys general to enforce consumer protection regulations issued by the CFPB. As a result of these aspects of the Dodd-Frank Act, the Bank is operating in a stringent consumer compliance environment and is incurring additional costs related to consumer protection compliance, including but not limited to potential costs associated with CFPB examinations. The CFPB, other financial regulatory agencies, as well as the Department of Justice have recently pursued a number of enforcement actions against depository institutions with respect to compliance with consumer protection and fair lending laws.
Anti-Money Laundering. The Bank must comply with the anti-money laundering and countering the financing of terrorism (“AML/CFT”) provisions of the Bank Secrecy Act (“BSA”) as amended by the USA PATRIOT Act and implementing regulations issued by the FDIC and the Financial Crimes Enforcement Network (“FinCEN”) of the U.S. Department of the Treasury. The USA PATRIOT Act gives the federal government powers to address terrorist threats through enhanced domestic security measures, expanded surveillance powers, increased information sharing, and broadened AML/CFT requirements.
The bank regulatory agencies have increased the regulatory scrutiny of the AML/CFT programs maintained by financial institutions. Significant penalties and fines, as well as other supervisory orders may be imposed on a financial institution for non-compliance with these requirements. In addition, the federal bank regulatory agencies must consider the effectiveness of financial institutions' efforts to combat money laundering when these institutions seek to engage in a merger transaction. The Bank has adopted policies and procedures which are in compliance with these requirements.
On January 1, 2021, Congress passed the Anti-Money Laundering Act of 2020 ("AML Act"), part of the National Defense Authorization Act, which enacted the most significant overhaul of the BSA since the USA PATRIOT Act. On September 29, 2022, FinCEN issued a final rule implementing the amendments with respect to the reporting of beneficial ownership, the first rule required under the AML Act. On December 22, 2023, FINCEN issued a final rule governing access to its newly-created beneficial ownership database, which will require banks to implement certain safeguards related to accessing information stored in the database, among other things.
Loans to Bank Insiders. A bank’s loans to its and its affiliates’ executive officers, directors, any owner of 10% or more of its stock (each, an insider) and any entities controlled by any such person (each, an insider’s related interest) are subject to the conditions and limitations imposed by Section 22(h) of the Federal Reserve Act, applied to state nonmember banks by the Federal Deposit Insurance Act, and the Federal Reserve Board’s Regulation O. Under these restrictions, the aggregate amount of the loans to any insider and the insider’s related interests may not exceed the loans-to-one-borrower limit applicable to national banks, which is comparable to the loans-to-one-borrower limit applicable to loans by the Bank. All loans by a bank to all insiders and insiders’ related interests in the aggregate may not exceed the bank’s unimpaired capital and unimpaired surplus. With certain exceptions, loans to an executive officer, other than loans for the education of the officer’s children and certain loans secured by the officer’s residence may not exceed at any one time the higher of 2.5% of the bank’s unimpaired capital and unimpaired surplus or $25,000, but in no event may be more than $100,000. Regulation O also requires that any proposed loan to an insider or a related interest of that insider be approved in advance by a majority of the board of directors of the bank, with any interested directors not participating in the voting, if such loan, when aggregated with any existing loans to that insider and the insider’s related interests, would exceed either (1) $500,000, or (2) the greater of $25,000 or 5% of the bank’s unimpaired capital and surplus.
Generally, loans to insiders and their related interests must be made on substantially the same terms as, and follow credit underwriting procedures that are not less stringent than, those prevailing at the time for comparable transactions with other persons, and may not involve more than the normal risk of payment or present other unfavorable features. An exception may be made for extensions of credit made pursuant to a benefit or compensation plan of a bank that is widely available to employees of the bank and that does not give any preference to insiders of the bank over other employees of the bank.
In addition, federal law prohibits extensions of credit to a bank’s insiders and their related interests by any other institution that has a correspondent banking relationship with the bank, unless such extension of credit is on substantially the same terms as those prevailing at the time for comparable transactions with other persons and does not involve more than the normal risk of repayment or present other unfavorable features.
As of December 31, 2024, the Bank had aggregate loans and loan commitments of $98.8 million to its directors, or to its immediate family members and related interests. These loans and loan commitments were made on substantially the same terms, including interest rates and collateral, as those prevailing for comparable transactions with the general public and do not involve more than the normal risk of repayment or present other unfavorable features.
As of December 31, 2024, the Bank had aggregate loans and loan commitments totaling $3.5 million to its executive officers or their related entities. These loans and loan commitments were made on substantially the same terms, including
interest rates and collateral, as those prevailing for comparable transactions with the general public and do not involve more than the normal risk of repayment or present other unfavorable features.
Climate-Related Risk Management and Regulation. In recent years, the federal banking agencies have increased their focus on climate-related risks impacting the operations of banks, the communities they serve, and the broader financial system. In October 2023, the federal banking agencies finalized principles for climate-related financial risk management, intended for financial institutions with over $100 billion in total consolidated assets. The agencies did note, however, that all financial institutions, regardless of size, may have material exposures to climate-related financial risks. As the agencies continue to develop climate-related regulatory guidance, and emphasize management of climate-related risks and controls, we may be required to expend significant capital and incur compliance, operating, maintenance and remediation costs in order to conform to such requirements. On December 21, 2023, the New York State Department of Financial Services ("NYDFS") published final guidance regarding the assessment and management of material climate-related financial and operational risks for financial institutions including those with New York State-licensed branches, regardless of size. NYDFS recommends and expects institutions such as the Bank to, among other things, incorporate climate-related risks management as part of its corporate governance, internal controls, risk management process, data aggregation and reporting, and climate scenario analysis. Other states in which the Bank operates, including but not limited to New Jersey and Pennsylvania, may also enact legislation or regulation that place requirements on the Bank to address climate-related risks.
Income on Interchange Fees. The Bank, together with its affiliates, exceeded $10 billion in assets in 2020 and became subject to the interchange fee cap mandated by the Dodd-Frank Act in July 2021. As such, the fees the Bank may receive for an electronic debit transaction are capped at the statutory limit. Historically, the Bank had been exempt from the interchange fee cap under the “small issuer” exemption, which applies to any debit card issuer with total worldwide assets (together with those of its affiliates) of less than $10 billion as of the end of the previous calendar year. Pursuant to Federal Reserve Board regulations mandated by the Dodd-Frank Act, interchange fees on debit card transactions are limited to a maximum of $0.21 per transaction plus 5 basis points of the transaction amount. A debit card issuer may recover an additional one cent per transaction for fraud prevention purposes if the issuer complies with certain fraud-related requirements prescribed by the Federal Reserve Board.
Digital Asset Regulation. The federal banking agencies have issued interpretive guidance and statements regarding the engagement by banking organizations in certain digital asset activities. On April 7, 2022, the FDIC issued a financial institution letter also requiring its supervised institutions to provide notice and obtain supervisory feedback prior to engaging in any crypto-related activities.
On January 3, 2023, the federal banking agencies issued additional guidance in the form of a joint statement addressing digital asset-related risks to banking organizations. That statement noted the recent volatility and exposure of vulnerabilities in the digital asset sector and indicated that the agencies are continuing to assess whether or how the digital asset-related activities of banking organizations can be conducted in a safe and sound manner and in compliance with all applicable laws and regulations. The statement stressed that each agency has developed, and expects banking organizations to follow, supervisory processes for evaluating proposed and existing digital asset activities. Under the new presidential administration the federal banking agencies are expected to take a different approach that allows banks to engage in more activities related to digital assets. Currently the extent of any expansion in this sector and its potential impact is difficult to determine.
Although the federal banking agencies have not developed formal regulations governing the digital asset activities of banking organizations, the supervisory framework summarized above dictates that, in order to effectively identify and manage digital asset-related risks and obtain supervisory non-objection to the proposed engagement in digital asset activities, banking organizations must implement appropriate risk management practices, including with respect to board and management oversight, policies and procedures, risk assessments, internal controls and monitoring.
Holding Company Regulation
Federal Regulation. The Company is regulated as a bank holding company, and as such, is subject to examination, regulation and periodic reporting under the BHCA, as administered by the Federal Reserve Board.
The Federal Reserve Board has adopted capital adequacy guidelines for bank holding companies on a consolidated basis. The Dodd-Frank Act directed the Federal Reserve Board to issue consolidated capital requirements for depository institution holding companies that are not less stringent, both quantitatively and in terms of components of capital, than those applicable to institutions themselves. The previously discussed final rule regarding regulatory capital requirements implemented the Dodd-Frank Act as to bank holding company capital standards. Consolidated regulatory capital requirements identical to those applicable to the subsidiary banks applied to bank holding companies (with greater than $1 billion of assets) as of January 1, 2015. The rule limits a banking organization’s capital distributions and certain discretionary bonus payments if the banking
organization does not hold a “capital conservation buffer” of 2.5% in addition to the amount necessary to meet its minimum risk-based capital requirements.
In the first quarter of 2020, U.S. federal regulatory authorities issued an interim final rule providing banking institutions that adopt CECL during the 2020 calendar year with the option to delay for two years the estimated impact of CECL on regulatory capital, followed by a three-year transition period to phase out the aggregate amount of the capital benefit provided during the initial two-year delay (i.e., a five-year transition in total). In connection with its adoption of CECL on January 1, 2020, the Company elected to utilize the five-year CECL transition.
The following table shows the Company’s Tier 1 leverage capital ratio, common equity Tier 1 risk-based capital ratio, Tier 1 risk-based capital ratio and the total risk-based capital ratio as of December 31, 2024.
| | | | | | | | | | | | | | | | | | | | | | | |
| | As of December 31, 2024 |
| | Capital | | Percent of Assets(1) | | Capital Requirements (1) | | Capital Requirements with Capital Conservation Buffer (1) |
| | (Dollars in thousands) |
| Tier 1 leverage capital | $ | 1,984,052 | | | 8.50 | % | | 4.00 | % | | 4.00 | % |
| Common equity Tier 1 risk-based capital | 1,984,052 | | | 9.98 | | | 4.50 | | | 7.00 | |
| Tier 1 risk-based capital | 1,984,052 | | | 9.98 | | | 6.00 | | | 8.50 | |
| Total risk-based capital | 2,614,625 | | | 13.15 | | | 8.00 | | | 10.50 | |
(1) For purposes of calculating regulatory Tier 1 leverage capital, assets are based on adjusted total leverage assets. In calculating common equity Tier 1 capital, Tier 1 risk-based capital and total risk-based capital, assets are based on total risk-weighted assets.
As of December 31, 2024, the Company was “well capitalized” under Federal Reserve Board guidelines.
Regulations of the Federal Reserve Board provide that a bank holding company must serve as a source of strength to any of its subsidiary banks and must not conduct its activities in an unsafe or unsound manner. Federal Reserve Board policies generally provide that bank holding companies should pay dividends only out of current earnings and only if the prospective rate of earnings retention in the holding company appears consistent with the organization’s capital needs, asset quality and overall financial condition. Federal Reserve Board guidance sets forth the supervisory expectation that bank holding companies will inform and consult with Federal Reserve Board staff in advance of issuing a dividend that exceeds earnings for the quarter, and should inform the Federal Reserve Board and should eliminate, defer or significantly reduce dividends if: (i) net income available to stockholders for the past four quarters, net of dividends previously paid during that period, is not sufficient to fully fund the dividends; (ii) prospective rate of earnings retention is not consistent with the bank holding company’s capital needs and overall current and prospective financial condition; or (iii) the bank holding company will not meet, or is in danger of not meeting, its minimum regulatory capital adequacy ratios. Under the prompt corrective action provisions discussed above, a bank holding company parent of an undercapitalized subsidiary bank would be directed to guarantee, within limitations, the capital restoration plan that is required of such an undercapitalized bank. If the undercapitalized bank fails to file an acceptable capital restoration plan or fails to implement an accepted plan, the Federal Reserve Board may prohibit the bank holding company parent of the undercapitalized bank from paying any dividends or making any other form of capital distribution without the prior approval of the Federal Reserve Board.
As a bank holding company, the Company is required to obtain the prior approval of the Federal Reserve Board to acquire all, or substantially all, of the assets of any bank or bank holding company. Prior Federal Reserve Board approval will be required for the Company to acquire direct or indirect ownership or control of any voting securities of any bank or bank holding company if, after giving effect to such acquisition, it would, directly or indirectly, own or control more than 5% of any class of voting shares of such bank or bank holding company.
Federal Reserve Board regulations require a bank holding company to give the Federal Reserve Board prior written notice of any purchase or redemption of its outstanding equity securities if the gross consideration for the purchase or redemption, when combined with the net consideration paid for all such purchases or redemptions during the preceding 12 months will be equal to 10% or more of the company’s consolidated net worth. The Federal Reserve Board may disapprove such a purchase or redemption if it determines that the proposal would constitute an unsafe and unsound practice, or would violate any law, regulation, Federal Reserve Board order or directive, or any condition imposed by, or written agreement with, the Federal Reserve Board. The regulations provide that such notice and approval is not required for a bank holding company that would be treated as “well capitalized” under applicable regulations of the Federal Reserve Board, is well-managed, and that is not the
subject of any unresolved supervisory issues. Notwithstanding the aforementioned regulations, Federal Reserve Board guidance indicates that bank holding companies should inform Federal Reserve staff of certain proposed repurchases of common stock, sufficiently in advance to allow for supervisory review and possible objection.
In addition, a bank holding company which does not opt to become a financial holding company under applicable federal law is generally prohibited from engaging in, or acquiring direct or indirect control of any company engaged in non-banking activities. One of the principal exceptions to this prohibition is for activities found by the Federal Reserve Board to be so closely related to banking or managing or controlling banks as to be permissible. Some of the principal activities that the Federal Reserve Board has determined by regulation to be so closely related to banking as to be permissible are:
•Making or servicing loans;
•Performing certain data processing services;
•Providing discount brokerage services, or acting as fiduciary, investment or financial advisor;
•Leasing personal or real property;
•Making investments in corporations or projects designed primarily to promote community welfare; and
•Acquiring a savings and loan association.
Bank holding companies that qualify and opt to become financial holding companies may engage in activities that are financial in nature or incident to activities which are financial in nature. Financial holding companies may engage in a broader array of activities including insurance and investment banking.
Bank holding companies may qualify to become a financial holding company if at the time of the election and on a continuing basis:
•Each of its depository institution subsidiaries is “well capitalized”;
•Each of its depository institution subsidiaries is “well managed”; and
•Each of its depository institution subsidiaries has at least a “Satisfactory” Community Reinvestment Act rating at its most recent examination.
Under federal law, depository institutions are liable to the FDIC for losses suffered or anticipated by the FDIC in connection with the default of a commonly controlled depository institution or any assistance provided by the FDIC to such an institution in danger of default. This law would potentially be applicable to the Company if it ever acquired as a separate subsidiary a depository institution in addition to the Bank.
New Jersey Regulation. Under the New Jersey Banking Act, a company owning or controlling a savings bank is regulated as a bank holding company. The New Jersey Banking Act defines the terms “company” and “bank holding company” as such terms are defined under the BHCA. Each bank holding company controlling a New Jersey chartered bank or savings bank must file certain reports with the Commissioner and is subject to examination by the Commissioner.
Acquisition of Control. Under federal law and under the New Jersey Banking Act, no person may acquire control of the Company or the Bank without first obtaining approval of such acquisition of control from the Federal Reserve Board and the Commissioner.
Effective in September 2020, the Federal Reserve Board adopted a final rule to codify and simplify its interpretations and opinions regarding regulatory presumptions of control for purposes of the BHCA. The amended control rule has had, and will likely continue to have a meaningful impact on control determinations related to investments in banks and bank holding companies and investments by bank holding companies in nonbank companies.
Federal Securities Laws. The Company’s common stock is registered with the SEC under the Securities Exchange Act of 1934, as amended. The Company is subject to information, proxy solicitation, insider trading restrictions and other requirements under the Securities Exchange Act of 1934.
Investment Adviser Regulation. Beacon is an investment adviser registered with the SEC. As such, it is required to make certain filings with and is subject to periodic examination by the SEC.
Delaware Corporate Law. The Company is incorporated under the laws of the State of Delaware. As a result, the rights of its stockholders are governed by the Delaware General Corporate Law and the Company’s Certificate of Incorporation and Bylaws.
TAXATION
Federal Taxation
General. The Company is subject to federal income taxation in the same general manner as other corporations, with some exceptions discussed below. The following discussion of federal taxation is intended only to summarize certain pertinent federal income tax matters and is not a comprehensive description of the tax rules applicable to the Company.
The Inflation Reduction Act, which was signed into law on August 16, 2022, among other things, implements a new alternative minimum tax of 15% on corporations with profits in excess of $1 billion, a 1% excise tax on stock repurchases, and several tax incentives to promote clean energy and climate initiatives. These provisions were effective beginning January 1, 2023. Based on its analysis of the provisions, the Company does not expect the provisions of the Inflation Reduction Act to have a material impact on its consolidated financial statements.
Method of Accounting. For federal income tax purposes, the Company currently reports its income and expenses on the accrual method of accounting and uses a tax year ending December 31 for filing its consolidated federal income tax returns.
Bad Debt Reserves. Prior to the Small Business Protection Act of 1996 (the “1996 Act”), the Bank was permitted to establish a reserve for bad debts and to make annual additions to the reserve. These additions could, within specified formula limits, be deducted in arriving at taxable income. The Bank was required to use the direct charge-off method to compute its bad debt deduction beginning with its 1996 federal income tax return. Savings institutions were required to recapture any excess reserves over those established as of December 31, 1987 (base year reserve).
Taxable Distributions and Recapture. Prior to the 1996 Act, bad debt reserves created prior to January 1, 1988 were subject to recapture into taxable income should the Bank fail to meet certain asset and definitional tests. Federal legislation has eliminated these recapture rules. Retained earnings as of December 31, 2024 included approximately $51.8 million for which no provisions for income tax had been made. This amount represents an allocation of income to bad debt deductions for tax purposes only. Events that would result in taxation of these reserves include failure to qualify as a bank for tax purposes, distributions in complete or partial liquidation, stock redemptions and excess distributions to shareholders. As of December 31, 2024, the Bank had an unrecognized tax liability of $14.0 million with respect to this item.
Net Operating Loss Carryovers. Under the general rule, for tax periods ending December 31, 2017 and prior, a financial institution may carry back net operating losses to the preceding two taxable years and forward to the succeeding 20 taxable years. As of December 31, 2018, the Company had approximately $1.1 million of Federal Net Operating Losses ("NOLs"). These NOLs were generated by entities the Company acquired in previous years and are subject to an annual Code Section 382 limitation. The Tax Act limits the NOL deduction for a given year to 80% of taxable income, effective with respect to losses arising in tax years beginning after December 31, 2017. It also repealed the pre-enactment carryback provision for NOLs and provides for the indefinite carryforward of NOLs arising in tax years ending after December 31, 2017.
Corporate Dividends-Received Deduction. The Company may exclude from its income 100% of dividends received from the Bank as a member of the same affiliated group of corporations.
State Taxation
New Jersey State Taxation. The Company and the Bank filed a combined New Jersey Corporation Business Tax return. Generally, the income of financial institutions in New Jersey, which is calculated based on federal taxable income subject to certain adjustments, is subject to New Jersey tax. The Company and the Bank are subject to the corporation business tax at 9% of apportioned taxable income. As a result of legislation that New Jersey enacted on June 28, 2024, the Company and the Bank are subject to an additional temporary surtax ("Corporate Transit Fee") for corporate taxpayers that have New Jersey allocated taxable net income over $10 million, effective for tax years 2024 through 2028.
Pennsylvania State Taxation. The Bank is subject to Pennsylvania Mutual Thrift Institutions Tax. Mutual thrift institutions tax is imposed at the rate of 11.5% on net taxable income of mutual thrift institutions in Pennsylvania, including savings banks without capital stock, building and loan associations, savings and loan associations, and savings institutions having capital stock.
New York State Taxation. In 2014, New York State enacted significant and comprehensive reforms to its corporate tax system that went into effect January 1, 2015. The legislation resulted in significant changes to the method of calculating income taxes for banks, including changes to future period tax rates, rules relating to the sourcing of income, and the elimination of the banking corporation tax so that banking corporations are taxed under New York State’s corporate franchise tax. The corporate franchise tax is based on the combined entire net income of the Company and its affiliates allocable and apportionable to New York State and taxed at a rate of 7.25%. The amount of revenues that are sourced to New York State
under the new legislation can be expected to fluctuate over time. In addition, the Company and its affiliates are subject to the Metropolitan Transportation Authority (“MTA”) Surcharge allocable to business activities carried on in the Metropolitan Commuter Transportation District. The MTA surcharge for 2024 is 30.0% of a recomputed New York State franchise tax, calculated using a 7.25% tax rate on allocated and apportioned net income.
Connecticut Taxation. The Company and its affiliates will be subject to Connecticut Corporate income tax based upon allocable and apportionable net income taxed at a rate of 7.5%, as a result of the Lakeland acquisition.
Item 1A. Risk Factors.
In the ordinary course of operating our business, we are exposed to a variety of risks inherent to the financial services industry. The following discusses the significant risk factors that could affect our business and operations. If any of the following conditions or events actually occur, our business, financial condition or results of operations could be negatively affected, the market price of your investment in the Company’s common stock could decline, and you could lose all or a part of your investment in the Company’s common stock. The Company's risk factors are categorized as follows:
•Risks Related to the Recent Merger with Lakeland
•Risks Related to the Economy, Financial Markets, and Interest Rates
•Risks Related to Regulatory, Compliance, Environmental and Legal Matters
•Risks Related to the Business Environment and Operations.
•Risks Related to Technology and Security
•Risks Related to Our Common Stock
Risks Related to the Recent Merger with Lakeland
The ongoing integration of Lakeland with the Company may be more difficult, costly or time-consuming than expected, and the Company may fail to realize the anticipated benefits of the merger.
The Company completed its acquisition of Lakeland on May 16, 2024. To realize the anticipated benefits and cost savings from the merger, the Company must successfully integrate and combine the Company’s and Lakeland’s businesses in a manner that permits those cost savings to be realized without adversely affecting current revenues and future growth. If the Company is not able to successfully achieve these objectives, the anticipated benefits of the merger may not be realized fully or at all, or may take longer to realize than expected. It is possible that the integration process could result in the loss of key employees, the disruption of the Company’s ongoing businesses or inconsistencies in standards, controls, procedures and policies that adversely affect the Company’s ability to maintain relationships with clients, customers, depositors and employees or to achieve the anticipated benefits and cost savings of the merger. If the Company is unable to retain key employees, including management, who are critical to the successful integration and future operations of the Company, the Company could face disruptions in its operations, loss of existing customers, loss of key information, expertise or know-how and unanticipated additional recruitment costs. The Company’s integration efforts may also divert management attention and resources.
In addition, the actual cost savings of the merger could be less than anticipated, and integration may result in additional and unforeseen expenses, including costs related to requirements of regulatory agencies. An inability to realize the full extent of the anticipated benefits of the merger, as well as any delays encountered in the integration process, could have an adverse effect upon the business, financial condition and results of operations of the Company.
The regulatory approvals received for the merger of the Company and Lakeland include conditions and commitments that could in the future have adverse effects on the Company.
The approvals received by the Company and the Bank from the bank regulatory authorities to consummate the merger with Lakeland were subject to certain regulatory conditions which continue to apply following the closing of the merger. The regulatory conditions include, but are not limited to: for three years following consummation of the merger, the Bank must maintain regulatory capital ratios at or above 8.50% for Tier 1 Leverage Capital and 11.25% for Total Risk Based Capital; and the Bank must maintain its commercial real estate concentrations (as a percent of capital and reserves) at levels at or below those forecasted in the pro forma financial projections that the Bank submitted to the FDIC. The failure to continue to comply with the regulatory conditions could result in supervisory and enforcement actions against the Company and the Bank, including the issuance of a cease and desist order or the imposition of civil money penalties, and could constrain the Company’s business operations, which could materially and adversely affect our business, financial condition, results of operations and prospects.
As a result of the merger, the Bank has become subject to additional requirements imposed by the DOJ.
On September 29, 2022, the U.S. District Court for the District of New Jersey approved a consent order entered into by Lakeland Bank with the DOJ to resolve allegations of violations of the Fair Housing Act and Equal Credit Opportunity Act within the Newark, New Jersey-Pennsylvania Metro Division, as constituted in 2015 (the “DOJ Consent Order”). The DOJ Consent Order required Lakeland Bank to, among other things, invest $12 million over five years in a loan subsidy fund to increase credit opportunities to residents of majority-Black and Hispanic census tracts in Essex, Morris, Somerset, Sussex and Union Counties, New Jersey (the “Newark Lending Area”), and devote a minimum of $400,000 over five years toward community development partnership contributions in the Newark Lending Area, and $150,000 per year over five years toward advertising, community outreach, and credit repair and education in the Newark Lending Area. The DOJ Consent Order also required Lakeland Bank to establish two new full-service branches in majority-Black and Hispanic census tracts: one in Newark, New Jersey and one in the Newark Lending Area. In addition, Lakeland Bank was required to continue to maintain its full-time Community Development Officer position to oversee these efforts throughout the term of the consent order.
As required by the terms of the DOJ Consent Order, the Bank, as the resulting institution in the bank merger, assumed all obligations of Lakeland Bank under the DOJ Consent Order. Although the Bank is committed to full compliance with the DOJ Consent Order, achieving such compliance has required and will require significant management attention from the Bank and has caused and may continue to cause the Bank to incur significant costs and expenses. Actions taken to achieve compliance with the DOJ Consent Order may affect the Bank’s business or financial performance and may require the Bank to reallocate resources away from existing businesses or to undertake significant changes to its business, operations, products and services and risk management practices. In addition, although the DOJ Consent Order resolved all claims by the DOJ against Lakeland Bank, the Company and the Bank could be subject to other enforcement actions relating to the alleged violations resolved by the DOJ Consent Order as well as relating to any failure or delay to comply with one or more of the terms of the DOJ Consent Order.
The combined company's human capital may be affected by inability to retain personnel successfully.
The success of the merger will depend in part on the combined company’s ability to manage its human capital and retain the talent and dedication of key employees. It is possible that these employees may decide not to remain with the Company going forward. If the Company is unable to retain key employees, including management, who are critical to the successful integration and future operations of the Company, the Company could face disruptions in its operations, loss of existing customers, loss of key information, expertise or know-how and unanticipated additional recruitment costs. In addition, if key employees terminate their employment, the Company’s human capital and business activities may be adversely affected, and management’s attention may be diverted from successfully hiring suitable replacements, all of which may cause the Company’s business to suffer. The Company also may not be able to locate or retain suitable replacements for any key employees who leave.
Risks Related to the Economy, Financial Markets, and Interest Rates
Changes to the underlying drivers of our net interest income could adversely affect our results of operations and financial condition.
Our financial condition and results of operations are significantly affected by changes in market interest rates, and the degree to which these changes disparately impact short-term and long-term interest rates and influence the behavior of our customer base. Our results of operations substantially depend on our net interest income, which is the difference between the interest income we earn on our interest earning assets and the interest expense we pay on our interest-bearing liabilities. A flattening yield curve, or one that inverts, could negatively impact our net interest margin and earnings.
As the Federal Reserve has maintained higher interest rates, our interest-bearing liabilities may continue to be subject to repricing or maturing more quickly than our interest-earning assets. Persistent elevated short-term rates continue to require us to increase the rates we pay on our deposits and borrowed funds more quickly than we can increase the interest rates we earn on our loans and investments, resulting in a negative effect on interest spreads and net interest income. In addition, the effect of high rates continue to be compounded as deposit customers move funds into higher yielding accounts or are lost to competitors offering higher rates on their deposit products. We are unable to predict whether current rates will persist or if the Federal Reserve will cut interest rates going forward. Should market interest rates fall below current levels, our net interest income could also be negatively affected if competitive pressures prevent us from reducing rates on our deposits, while the yields on our assets decrease through loan prepayments and interest rate adjustments.
Changes in interest rates also affect the value of our interest-earning assets, and particularly our securities portfolio. Generally, the value of securities fluctuates inversely with changes in interest rates. As of December 31, 2024, our available for sale debt securities portfolio totaled $2.77 billion. Unrealized gains and losses on securities available for sale are reported as a
separate component of stockholders’ equity. Therefore, decreases in the fair value of securities available for sale resulting from increases in interest rates could have an adverse effect on our stockholders’ equity.
Volatility and uncertainty related to inflation and the effects of inflation, which may lead to increased costs for businesses and consumers and potentially contribute to poor business and economic conditions generally, may also heighten or contribute to some of the risks discussed herein. For example, higher inflation, or volatility and uncertainty related to inflation, could increase operating costs for the Company and reduce profitability, reduce demand for the Company’s products, adversely affect the creditworthiness of the Company’s borrowers or result in lower values for the Company’s investment securities and other interest-earning assets.
A general economic slowdown or uncertainty that produces either reduced returns or excessive market volatility could adversely impact our overall profitability, including our wealth management fee income and our access to capital and liquidity.
A general economic slowdown could affect our core banking business. As of December 31, 2024, various economic indicators suggested that real gross domestic product had expanded throughout 2024. The unemployment rate had increased, on net, but remained low relative to historic levels. Consumer price inflation, as measured by the 12-month change in the price index for personal consumption expenditures, had moved lower compared to its peak level in 2023. Despite improved projections, unforeseen adverse changes in the economy and a possible recession could negatively affect the ability of our borrowers to repay their loans or force us to offer lower interest rates to encourage new borrowing activity.
Uncertainty and market volatility could affect the value of the assets under management in our wealth management business resulting in lower fee income. Conditions that produce extended market volatility could affect our ability to provide our clients with an adequate return, thereby impacting our ability to attract new clients or causing existing clients to seek more stable investment opportunities with alternative wealth advisors.
Furthermore, market volatility could adversely impact our access to capital and liquidity.
If our allowance for credit losses is not sufficient to cover actual loan losses, our earnings could decrease.
We make various assumptions and judgments about the collectability of our loan portfolio, including the creditworthiness of our borrowers and the value of the real estate and other assets serving as collateral for the repayment of many of our loans. In determining the amount of the allowance for credit losses, we rely on our loan monitoring program, our loan quality reviews, our credit risk rating process, loan portfolio trends, our experience, our evaluation of economic conditions and our selection of a reasonable and supportable forecast, among other factors. The Company measures projected credit losses over the estimated life of the asset by applying quantitative and qualitative loss factors we derive using a macroeconomic forecast that we deem most likely to occur. If our assumptions prove to be incorrect, or if delinquencies or non-accrual and non-performing loans increase, the allowance for credit losses may not be sufficient to cover losses inherent in our loan portfolio, resulting in additions to our allowance. Material additions to the allowance would materially decrease our net income. In addition, bank regulators periodically review our allowance for credit losses and may require us to increase our provision for credit losses or recognize further loan charge-offs.
Commercial real estate, commercial and industrial and construction loans expose us to increased risk and earnings volatility.
We consider our commercial real estate loans, commercial and industrial loans and construction loans to be higher risk categories in our loan portfolio. These loans are particularly sensitive to economic conditions. As of December 31, 2024, our portfolio of commercial real estate loans, including multi-family loans, totaled $10.61 billion, or 57.5% of total loans, our commercial and industrial loans totaled $4.61 billion, or 25.0% of portfolio loans, and our construction loans totaled $823.5 million, or 4.5% of total loans.
Commercial real estate loans generally involve a higher degree of credit risk because they typically have larger balances and are more affected by adverse conditions in the economy, such as vacancy rates and changes in rental rates. Payments on loans secured by commercial real estate also often depend on the successful operation and management of the businesses that occupy these properties or the financial stability of tenants occupying the properties. Furthermore, these loans may be affected by factors outside the borrower’s control, such as adverse conditions in the real estate market or the economy, declining rents, tenant defaults, or changes in government regulation. As of December 31, 2024, our CRE office portfolio totaled $884.1 million dollars, with approximately 13% being loans in New York. In our CRE multi-family portfolio,loans that are collateralized by rent stabilized apartments comprise less than 0.80% of the total loan portfolio and are all performing. In the case of commercial and industrial loans, although we strive to maintain high credit standards and limit exposure to any one borrower, the collateral for these loans often consists of accounts receivable, inventory and equipment. This type of collateral typically does not yield substantial recovery in the event we need to foreclose on it and may rapidly deteriorate, disappear, or be misdirected in advance of foreclosure. This adds to the potential that our charge-offs will be volatile, which could significantly
negatively affect our earnings in any quarter. In addition, some of our construction loans may pose higher risk than the levels expected at origination, as projects may stall, interest reserves may be inadequate, absorption may be slower than projected or sales prices or rents may be lower than forecasted. In addition, many of our borrowers have more than one commercial real estate or construction loan outstanding with us. Consequently, an adverse development with respect to one loan or one credit relationship may expose the Company to significantly greater risk of loss.
The failure to address the federal debt ceiling in a timely manner, downgrades of the U.S. credit rating and uncertain credit and financial market conditions may affect the stability of securities issued or guaranteed by the federal government, which may affect the valuation or liquidity of our investment securities portfolio and increase future borrowing costs.
As a result of uncertain political, credit and financial market conditions, including the potential consequences of the federal government defaulting on its obligations for a period of time due to federal debt ceiling limitations or other unresolved political issues, investments in financial instruments issued or guaranteed by the federal government pose credit default and liquidity risks. Given that future deterioration in the U.S. credit and financial markets is a possibility, no assurance can be made that losses or significant deterioration in the fair value of our U.S. government issued or guaranteed investments will not occur. Downgrades to the U.S. credit rating could affect the stability of securities issued or guaranteed by the federal government and the valuation or liquidity of our portfolio of such investment securities and could result in our counterparties requiring additional collateral for our borrowings. Further, unless and until U.S. political, credit and financial market conditions have been sufficiently resolved or stabilized, it may increase our future borrowing costs.
Risks Related to Regulatory, Compliance, Environmental and Legal Matters
We operate in a highly regulated environment and may be adversely affected by changes in laws and regulations.
We are subject to extensive regulation, supervision and examination by various regulatory authorities, but primarily by the New Jersey Department of Banking and Insurance, our chartering authority, and by the FDIC, as insurer of our deposits. As a bank holding company, we are subject to regulation and oversight by the Federal Reserve Board. Such regulation and supervision governs the activities in which a bank and its holding company may engage and is intended primarily for the protection of the insurance fund and depositors. Following the bank failures in early 2023, regulators have increasingly focused on banks’ sources of liquidity, deposit mixes and concentration within certain sectors. These regulatory authorities have extensive discretion in connection with their supervisory and enforcement activities, including the ability to require that we hold additional capital, restrict our operations, modify the classification of our assets, increase our allowance for credit losses, and strengthen the management of risks posed by our reliance on third party vendors. Any change in such regulation and oversight, whether in the form of regulatory policy, regulations, or legislation, could have a material impact on the Company’s operations.
The potential exists for additional federal or state laws and regulations regarding capital requirements, lending and funding practices and, liquidity standards, and bank regulatory agencies are expected to remain active in responding to concerns and trends that may be identified in our examinations, which may include the potential for the issuance of formal enforcement orders. Further, actions taken to date, as well as potential actions, may not provide the level of beneficial effects necessary to offset their cost to us. In addition, new laws, regulations, and other regulatory changes could further increase our costs of regulatory compliance and of doing business, and otherwise affect our operations. New laws, regulations, and other regulatory changes, may also significantly affect the markets in which we do business, the markets for and value of our loans and investments, and our ongoing operations, costs and profitability.
As a larger financial institution, we are subject to additional regulation and increased supervision.
The Company's total assets were $24.05 billion as of December 31, 2024. Banks with assets in excess of $10 billion are subject to requirements imposed by the Dodd-Frank Act and its implementing regulations including being subject to the examination authority of the Consumer Financial Protection Bureau to assess our compliance with federal consumer financial laws, the imposition of higher FDIC premiums, reduced debit card interchange fees, and enhanced risk management frameworks, all of which increase operating costs and reduce earnings.
As we continue to grow in size, we can expect greater regulatory scrutiny and expectations requiring us to invest significant management attention and make additional investments in staff and other resources to comply with applicable regulatory expectations. While we cannot predict what effect any presently contemplated or future changes in the laws or regulations or their interpretations may have on us, these changes could be material.
Changes resulting from updated regulations and laws could include increased regulatory oversight, higher capital requirements or changes in the way regulatory capital is calculated, and the impositions of additional restrictions through regulatory changes or supervisory or enforcement activities, each of which could have a material impact on our business.
The fiscal, monetary and regulatory policies of the federal government and its agencies could have an adverse effect on our results of operations.
In addition to being affected by general economic conditions, our earnings and growth are affected by the policies of the FRB. An important function of the FRB is to regulate the money supply and credit environment. Among the instruments used by the FRB to implement these objectives are open market purchases and sales of U.S. Government securities, adjustments of the discount rate and changes in banks’ reserve requirements against bank deposits. These instruments are used in varying combinations to influence overall economic growth and the distribution of credit, bank loans, investments and deposits. Their use also affects interest rates charged on loans or paid on deposits. The FRB’s policies determine in large part the cost of funds for lending and investing and the return earned on those loans and investments, both of which affect our net interest margin. Its policies can also adversely affect borrowers, potentially increasing the risk that they may fail to repay their loans. The monetary policies and regulations of the FRB have had a significant effect on the overall economy and the operating results of financial institutions in the past and are expected to continue to do so in the future.
Additionally, Congress and the administration through executive orders controls fiscal policy through decisions on taxation and expenditures. Depending on industries and markets involved, changes to tax law and increased or reduced public expenditures could affect us directly or the business operations of our customers.
Changes in FRB and other governmental policies, fiscal policy, and our regulatory environment generally are beyond our control, and we are unable to predict what changes may occur or the manner in which any future changes may affect our business, financial condition and results of operations.
We face regulatory scrutiny based on our commercial real estate lending.
The FDIC, the OCC and the FRB (collectively, the “Agencies”) have issued joint guidance entitled “Concentrations in Commercial Real Estate Lending, Sound Risk Management Practices” (the “CRE Guidance”). Although the CRE Guidance does not establish specific lending limits, it provides that a bank’s commercial real estate lending exposure may receive increased supervisory scrutiny where total non-owner occupied commercial real estate loans, including loans secured by multi-family buildings, investor commercial real estate and construction and land loans (“CRE Loans”), represent 300% or more of an institution’s total risk-based capital and the outstanding balance of the CRE Loan portfolio has increased by 50% or more during the preceding 36 months. Our level of CRE Loans equaled 460.2% of total risk-based capital as of December 31, 2024, while our CRE Loan portfolio has increased by 72.2% during the preceding 36 months, primarily as a result of the addition of Lakeland. Based on the size of our CRE Loan portfolio as a percentage of capital, regulatory oversight of our management of this CRE concentration is elevated.
In December 2015, the Agencies released a statement on prudent risk management for commercial real estate lending (the “2015 Statement”). In the 2015 Statement, the Agencies express concerns about easing commercial real estate underwriting standards, direct financial institutions to maintain underwriting discipline and exercise risk management practices to identify, measure and monitor lending risks, and indicate that the Agencies will continue “to pay special attention” to commercial real estate lending activities and concentrations going forward. If our regulators were to impose restrictions on the amount of commercial real estate loans we can hold in our loan portfolio, or require higher capital ratios as a result of the level of commercial real estate loans held, our earnings or our ability to engage in certain merger and acquisition activity could be adversely affected.
On December 18, 2023, the FDIC issued an advisory entitled “Managing Commercial Real Estate Concentrations in a Challenging Economic Environment” (the “2023 Advisory”), replacing an advisory issued in 2008 and updating previously issued guidance. The 2023 Advisory expresses concerns regarding challenges in the CRE market and identifies key risk-management actions to help institutions with market conditions, including maintaining strong capital levels, ensuring appropriate credit loss allowances, closely managing loan portfolios, maintaining updated financial and analytical information, bolstering loan workout infrastructure, and maintaining adequate liquidity and diverse funding sources. The FDIC stated that it will “expect each board of directors and management team to strive for strong capital and appropriate allowance for credit loss levels, and to implement robust credit risk-management practices.” If the FDIC were to scrutinize our board and management actions and require certain capital levels or specific practices, our earnings could be adversely affected and our cost of compliance could increase.
Future acquisitions may be delayed, impeded, or prohibited due to regulatory issues.
Future acquisitions by the Company, particularly those of financial institutions, are subject to approval by a variety of federal and state regulatory agencies (collectively, "regulatory approvals"). Regulatory approvals could be delayed, impeded, restrictively conditioned or denied due to existing or new issues the Company has, or may have, with regulatory agencies, including, without limitation, issues related to BSA/AML compliance, CRA compliance, fair lending laws, fair housing laws,
consumer protection laws, unfair, deceptive, or abusive acts or practices regulations, and other similar laws and regulations. We may fail to pursue or complete strategic and competitively significant acquisition opportunities as a result of our inability, or perceived or anticipated inability, to obtain regulatory approvals in a timely manner, under reasonable conditions or at all. The regulatory approvals may contain conditions on the completion of a merger which would adversely affect our business following the closing, or which were not anticipated or cannot be met. Difficulties associated with potential acquisitions that may result from these factors could have a material adverse impact on our business, and, in turn, our financial condition and results of operations.
We may experience impairments of goodwill or other intangible assets in the future.
As of December 31, 2024, our consolidated balance sheet included goodwill of $624.1 million and other intangible assets of $195.2 million. Our business acquisitions, including our acquisition of Lakeland, typically result in goodwill and other intangible assets, which affect the amount of future amortization expense and potential impairment expense. We make estimates and assumptions in valuing such intangible assets that affect our consolidated financial statements. In accordance with GAAP, our goodwill and indefinite-lived intangible assets are not amortized, but are tested for impairment annually, or more frequently if events or changes in circumstances indicate that an asset might be impaired. Impairment testing incorporates the current market price of our common stock, the estimated fair value of our assets and liabilities, and certain information of similar companies. Impairment testing may be based on valuation models that estimate fair value. In preparing the valuation models, we consider a number of factors, including operating results, business plans, economic conditions, future cash flows, and transactions and market data. There are inherent uncertainties related to these factors and our judgment in applying them to the impairment analyses. It is possible that future impairment testing could result in the identification of a decline in the fair value of our goodwill or other intangible assets, which may be less than the carrying value. If we determine that impairment exists at a given point in time, our earnings and the book value of goodwill or other related intangible asset will be reduced by the amount of the impairment. If we record an impairment loss related to our goodwill or other intangible assets, it could have a material adverse effect on our business, financial condition, results of operations and the trading price of our securities. Notwithstanding the foregoing, the results of impairment testing on our goodwill or other intangible assets have no impact on our tangible book value or regulatory capital levels.
Climate change and related governmental action may materially affect the Company’s business and results of operations.
The effects of climate change continue to create a level of concern for the state of the global environment. State legislatures and federal and state regulatory agencies have proposed, and may propose in the future, initiatives, legislation, and regulations to supplement the global effort to combat climate change. Similar and even more expansive initiatives are expected, including potentially increasing supervisory expectations with respect to banks’ risk management practices, accounting for the effects of climate change in stress testing scenarios and systemic risk assessments, revising expectations for credit portfolio concentrations based on climate-related factors, and encouraging investment by banks in climate-related initiatives and lending to communities disproportionately impacted by the effects of climate change. The lack of empirical data surrounding the credit and other financial risks posed by climate change render it impossible to predict specifically how climate change may impact the financial condition and operations of the Company; however, the physical effects of climate change may also directly impact the Company. Specifically, unpredictable and more frequent weather disasters may adversely impact the value of real property securing certain loans in our portfolios. Further, the effects of climate change may negatively impact regional and local economic activity, which could lead to an adverse effect on our customers and impact our ability to raise and invest capital in potentially impacted communities. The effects of changing strategies, policies, and investments as the global community transitions to a lower-carbon economy will impose additional operational and compliance burdens, and may result in market trends that alter business opportunities. Compliance with any additional disclosure rules will require additional resources. Overall, climate change, its effects, and the resulting unknown impact could have a material adverse impact on our financial condition and results of operations.
Risks Related to Business Environment, Operations and Strategy.
We have incurred, and may incur in the future, significant costs related to acquisitions by merger and subsequent integration activities.
We have incurred and expect to incur certain non-recurring costs associated with mergers. These costs include financial advisory, legal, accounting, consulting and other advisory fees, severance/employee benefit-related costs, public company filing fees and other regulatory fees, printing costs, and other related costs.
We may incur substantial costs in connection with the integration of acquired companies. There are many processes, policies, procedures, operations, technologies, and systems that may need to be integrated, including purchasing, accounting and finance, payroll, compliance, treasury management, branch operations, vendor management, risk management, lines of
business, pricing, and benefits. While we have assumed that a certain level of costs will be incurred, there are many factors beyond our control that could affect the total amount or the timing of the integration costs. Moreover, many of the costs that may be incurred are, by their nature, difficult to estimate accurately. These integration costs may result in us taking charges against earnings, the amount and timing of which are uncertain at present.
Our continuing concentration of business in a relatively confined region may increase our risk.
Our success is significantly affected by general economic conditions in our market area. Unlike some larger banks that are more geographically diversified, we provide banking, financial, and wealth management services to customers mostly located in our primary markets. Consequently, a downturn in economic conditions in our local markets would have a significant impact on our loan portfolios, the ability of borrowers to meet their loan payment obligations and the value of the collateral securing our loans. Adverse local economic conditions caused by inflation, recession, unemployment, state or local government action, or other factors beyond our control would impact these local economic conditions and could negatively affect the financial results of our business.
Acts of terrorism, severe weather, natural disasters, public health issues, geopolitical and other external events could impact our ability to conduct business.
Our business is subject to risk from external events that could affect the stability of our deposit base, impair the ability of borrowers to repay outstanding loans, impair the value of collateral securing loans, cause significant property damage, result in loss of revenue, disrupt business operations and/or cause us to incur additional expenses. For example, financial institutions have been, and continue to be, targets of terrorist threats aimed at compromising their operating and communication systems. The metropolitan New York and Philadelphia areas remain central targets for potential acts of terrorism, including cyber terrorism, which could affect not only our operations but those of our customers. Additionally, there could be sudden increases in customer transaction volume, electrical, telecommunications or other major physical infrastructure outages, natural disasters, events arising from local or larger scale geopolitical, political or social matters, including terrorist acts, and cyber-attacks from both private and state actors. The emergence of widespread health emergencies or pandemics, similar to the spread of COVID-19, could lead to regional quarantines, business shutdowns, labor shortages, disruptions to supply chains, and overall economic instability. Events such as these may become more common in the future and could cause significant damage such as disruption of power and communication services, impact the stability of our facilities and result in additional expenses, impair the ability of our borrowers to repay their loans, reduce the value of collateral securing the repayment of our loans, which could result in the loss of revenue. While we have established and regularly test disaster recovery procedures, the occurrence of any such event could have a material adverse effect on our business, operations and financial condition. Additionally, financial markets may be adversely affected by any current or anticipated impact of military conflict, including continuing war between Russia and Ukraine, conflicts and military tension in the Middle East, Africa, and Asia, terrorism, cyber-attacks from nation states and non-state actors on financial institutions or other geopolitical events.
We may not be able to detect money laundering and other illegal or improper activities fully or on a timely basis, which could expose us to additional liability and could have a material adverse effect on us.
We are required to comply with anti-money laundering, anti-terrorism and other laws and regulations in the United States. These laws and regulations require us, among other things, to adopt and enforce “know-your-customer” policies and procedures and to report suspicious and large transactions to applicable regulatory authorities. These laws and regulations have become increasingly complex and detailed, require improved systems and sophisticated monitoring and compliance personnel and have become the subject of enhanced government supervision.
While we have adopted policies, procedures and systems aimed at detecting and preventing the use of our banking network for money laundering and related activities, those policies and procedures may not completely eliminate instances in which we may be used by customers to engage in money laundering and other illegal or improper activities. To the extent we fail to fully comply with applicable laws and regulations, the FDIC, along with other banking agencies, has the authority to impose fines and other penalties and sanctions on us, including restricting our ability to grow through acquisition. In addition, our business and reputation could suffer if customers use our banking network for money laundering or illegal or improper purposes.
Our funding sources may prove insufficient or costly to support our future growth. A lack of liquidity could adversely affect our financial condition and results of operations and result in regulatory limits being placed on the Company.
We must maintain sufficient funds to respond to the needs of depositors and borrowers. Deposits have traditionally been our primary source of funding for our lending and investment activities. We also receive funds from loan repayments, investment maturities and income on other interest-earning assets. While we emphasize the generation of low-cost core deposits as a source of funding, there is strong competition for such deposits in our market area. Additionally, deposit balances can
decrease if customers perceive alternative investments as providing a better risk/return tradeoff. Further, the demand for deposits may be reduced due to a variety of factors such as negative trends in the banking sector, the level of and/or composition of our uninsured deposits, demographic patterns, changes in customer preferences, reductions in consumers' disposable income, the monetary policy of the FRB or regulatory actions that decrease customer access to particular products. Accordingly, as a part of our liquidity management, we must use several funding sources in addition to deposits and repayments and maturities of loans and investments. As we continue to grow, we may become more dependent on these sources, which may include Federal Home Loan Bank of New York and Federal Reserve Bank advances, federal funds purchased and brokered certificates of deposit. Adverse operating results or changes in industry conditions could lead to difficulty or an inability to access these additional funding sources.
Our financial flexibility will be severely constrained if we are unable to maintain our access to funding or if adequate financing is not available to accommodate future growth at acceptable costs. Further, if we are required to rely more heavily on more expensive funding sources to support liquidity and future growth, our revenues may not increase proportionately to cover our increased costs. Our net interest margin and profitability would also be adversely affected. Alternatively, we may need to sell a portion of our investment and/or loan portfolio to raise funds, which, depending upon market conditions, could result in us realizing a loss on the sale of such assets.
Any decline in available funding could adversely impact our ability to originate loans, invest in securities, pay our expenses, or fulfill obligations such as repaying our borrowings or meeting deposit withdrawal demands, any of which could have a material adverse impact on our liquidity, business, financial condition and results of operations. A lack of liquidity could also result in increased regulatory scrutiny and potential restrictions imposed on us by regulators.
Strong competition within our market area may limit our growth and profitability.
Competition in the banking and financial services industry is intense and increasing with entrants into our market providing new and innovative technology-driven financial solutions. Our profitability depends upon our continued ability to successfully compete in our market area. We compete with commercial banks, savings institutions, mortgage banking firms, credit unions, finance companies, investment advisers, wealth managers, mutual funds, insurance companies, online lenders, large non-bank participants, and brokerage and investment banking firms operating both locally and elsewhere.
Over the past decade, our local markets have experienced the effects of substantial banking consolidation, and large out-of-state competitors have grown significantly. Many of these competitors have substantially greater resources and lending limits than we do, and may offer certain deposit and loan pricing, services or credit criteria that we do not or cannot provide. There are also a number of strong, locally-based competitors with large capital positions in our market who may deploy aggressive strategies to drive growth, acquire our customers and win market share.
Furthermore, key components of the financial services value chain have been replicated by digital innovation. As customer preferences and expectations continue to evolve, technology has lowered barriers to entry and made it possible for non-banks to offer products and services traditionally provided by banks, such as automatic transfer and automatic payment systems. In addition, some of the largest technology firms are engaging in joint ventures with the largest banks to provide and or expand financial service offerings with a technological sophistication and breadth of marketing that smaller institutions do not have. Many of our competitors have fewer regulatory constraints and may have lower cost structures. Additionally, due to their size, many competitors may be able to achieve economies of scale and, as a result, may offer a broader range of products and services as well as better pricing for those products and services than we can. The adoption of these Fintech solutions within our market area may cause greater and faster disruption to our business model if we are unable to keep pace with, or invest wisely in, these enabling technologies.
The Company’s models used for business planning purposes could perform poorly or provide inadequate information.
We use quantitative models to assist in measuring risks and estimating or predicting certain financial values, among other uses. These models are used throughout many of our business lines, and we rely on them, along with our business judgment, for many decision-making processes.
Models generally evaluate the performance of various factors under anticipated future conditions, relying on historical data to help build the model and in part on assumptions as to the future, often with respect to macro-economic conditions, in order to generate the output. The models used may not accurately account for all variables and may fail to predict outcomes accurately and/or may overstate or understate certain effects. Poorly designed, implemented, or managed models or misused models, including in the choice of relevant historical data or future-looking assumptions, present the risk that our business decisions that consider information based on such models will be adversely affected due to inadequate or inaccurate information, which may damage the Company’s reputation and adversely affect its reported financial condition and results of operations. We rely on historical data to help build models. We seek to incorporate appropriate historical data in our models, but the range of market values and behaviors reflected in any period of historical data we incorporate into our models may turn out to be inappropriate
for the future period being modeled. In such case, our ability to manage risk would be limited and our risk exposure and losses could be significantly greater than our models indicated. Even if the underlying assumptions used in our models are adequate, the models may be deficient due to errors in computer code, use of bad data during development or input into the model during model use, or the use of a model for a purpose outside the scope of the model’s design. As a result, our models may not fully capture or express the risks the Company faces. If the models fail to produce reliable results on an ongoing basis, we may not make appropriate risk management, capital planning, or other business or financial decisions. Furthermore, strategies that we employ to manage and govern the risks associated with its use of models may not be effective or fully reliable, and as a result, the Company may realize losses or other lapses.
Finally, information we provide to our regulators based on poorly designed or implemented models could also be inaccurate or misleading. Some of the decisions that our regulators make, including those related to capital distributions to our stockholders, could be adversely affected due to their perception that the quality of the models used to generate the relevant information is insufficient.
We may need to raise additional capital in the future and such capital may not be available when needed or at all.
Federal regulatory agencies have the authority to change the Company’s and Bank’s capital requirements and new accounting rules could have a negative impact on our regulatory capital ratios. Accordingly, we may need to raise additional capital in the future to provide us with sufficient capital resources to meet our commitments and business needs. We may also need to raise additional capital to support our continued growth. If we raise capital through the issuance of additional shares of our common stock or other securities, it would dilute the ownership interests of existing shareholders and may dilute the per share book value of our common stock. New investors may also have rights, preferences and privileges senior to our current shareholders, which may adversely impact our current shareholders. Our ability to raise additional capital, if needed, or at attractive prices, will depend on, among other things, conditions in the capital markets at that time, which are outside of our control, and our financial performance. An inability to raise additional capital on acceptable terms when needed could have a material adverse effect on our business, financial condition and results of operations.
Risks Related to Technology and Security
A cyber-attack, data breach, or a technology failure of ours could adversely affect our ability to conduct our business or manage our exposure to risk, result in the disclosure or misuse of confidential or proprietary information, increase our costs to maintain and update our operational and security systems and infrastructure, and adversely impact our results of operations, liquidity and financial condition, as well as cause reputational harm.
Our business is highly dependent on the security and efficacy of our infrastructure, computer and data management systems to provide secure processing, transmission, storage and retrieval of confidential and proprietary information.
Cyber security risks for financial institutions have significantly increased in recent years in part because of the proliferation of new technologies, including artificial intelligence, the use of technologies to conduct financial transactions, and coordinated efforts by nation-states to use cyber-attacks to obtain information or disrupt financial institutions in rival states. Financial institutions have been subject to, and are likely to continue to be the target of, cyber-attacks and supply chain attacks which could materially disrupt network access or business operations or create regulatory compliance risks.
We have experienced cyber security events in the past, although not material, and we anticipate that, as a larger bank, we could experience further events. We have implemented and are continuing to develop countermeasures against potential cyber-attacks, including through internal cybersecurity policies, restrictions on information sharing, attribution techniques (including research and development on forensic capabilities, digital forensics provided by a security operations center, and obtaining threat intelligence), developing cyber deterrence and security norms, and spreading education and awareness to employees, customers, and third parties. Nevertheless, there can be no assurance that we will not suffer material losses or other material adverse consequences relating to technology failure, cyber-attacks or other information or security breaches.
In addition, there have been instances where financial institutions have been victims of fraudulent activity in which criminals pose as customers to initiate wire and automated clearinghouse transactions from customer accounts. Although we have policies and procedures in place to verify the authenticity of our customers, there can be no assurance that such policies and procedures will prevent all fraudulent transfers. Such activity could result in financial liability and harm to our reputation.
Misuse of our technology by our employees could also result in fraudulent, improper or unauthorized activities on behalf of customers or improper use of confidential information. We may not be able to prevent employee errors or misconduct, and the precautions we take to detect these types of activity might not be effective in all cases. Employee errors or misconduct could subject us to civil claims for negligence or regulatory enforcement actions, including fines and restrictions on our business.
As cyber threats and other fraudulent activity continues to evolve, we may be required to expend significant additional resources to continue to modify and enhance our protective measures, or to investigate and remediate any information security vulnerabilities or incidents. Any of these matters could result in our loss of customers and business opportunities, significant disruption to our operations and business, misappropriation or destruction of our confidential information and/or that of our customers, or damage to our customers’ computers or systems, and could result in a violation of applicable privacy laws and other laws, litigation exposure, regulatory fines, penalties or intervention, loss of confidence in our security measures, reputational damage, reimbursement or other compensatory costs, and additional compliance costs. In addition, any of the matters described above could adversely impact our results of operations and financial condition.
For information on our cybersecurity risk management, strategy and governance, see Item 1C – Cybersecurity.
We rely on third-party providers and other suppliers for a number of services that are important to our business. A breach, failure, interruption, cessation of an important service by any third-party could have a material adverse effect on our business, as well as cause reputational harm.
We are dependent for most of our technology, including our core operating system, on third-party providers. The Bank collects, processes and stores sensitive consumer data by utilizing computer systems and telecommunications networks operated by third-party service providers, which are integral to our business. We handle a substantial volume of customer and other financial transactions every day. Our financial, accounting, data processing, check processing, electronic funds transfer, loan processing, online and mobile banking, automated teller machines, or ATMs, backup or other operating or security systems and infrastructure may fail to operate properly or become disabled or damaged because of a number of factors including events that are wholly or partially beyond our control.
We have taken measures to implement data backups of our systems and other safeguards to support our operations, but our ability to conduct business may be adversely affected by any significant disruptions to third-parties with whom we interact. In addition, our ability to implement backup systems and other safeguards with respect to third-party systems is more limited than with our own systems. If these third-parties were to discontinue providing services to us, we may experience significant disruption to our business. In addition, each of these third-parties faces the risk of cyber-attack, information breach or loss, or technology failure. If any of our third-party service providers experience such difficulties, or if there is any other disruption in our relationships with them, we may be required to find alternative sources of such services. If any of our third-party service providers experience a breach or cyber-attack of their information systems, it could adversely affect our ability to process transactions, service our clients or manage our exposure to risk and could result in the disclosure of sensitive, personal customer information, which could have a material adverse impact on our business through damage to our reputation, loss of business, remedial costs, additional regulatory scrutiny or exposure to civil litigation and possible financial liability. Assurance cannot be provided that we could negotiate terms with alternative service sources that are as favorable or could obtain services with similar functionality as found in existing systems without the need to expend substantial resources, if at all, thereby resulting in a material adverse impact on our business and results of operations.
We continuously update these systems to support our operations and growth. This updating entails significant costs and creates risks associated with implementing new systems and integrating them with existing ones. Operational risk exposures could adversely impact our results of operations, liquidity, and financial condition, and cause reputational harm. Insurance coverage may not be available for such losses, or where available, such losses may exceed insurance limits. This risk of loss also includes the potential legal actions that could arise because of an operational deficiency or because of noncompliance with applicable regulatory standards, adverse business decisions or their implementation, and customer attrition due to potential negative publicity. While we maintain a risk management program that is designed to minimize risk, we could suffer losses, face regulatory action, and suffer damage to our reputation because of our failure to properly anticipate and manage these risks.
Failure to keep pace with technological changes could adversely affect our business.
The financial services industry is continually undergoing rapid technological change with frequent introductions of new technology-driven products and services. The effective use of technology increases efficiency and enables financial institutions to better serve customers, reduce costs and create capacity. For instance, as private and state-sponsored hackers and malicious actors increasingly leverage the power of artificial intelligence to conduct cyber-attacks and other fraudulent activity, financial institutions can adopt and learn to use the same technology in order to detect attempts and defend themselves. Adaptation to the current cybersecurity landscape requires resilience, flexibility, and collaboration in the face of increased threats enabled by technological advances. Our future success depends, in part, upon our ability to address the needs of our customers by using technology to provide products and services that will satisfy customer demands, as well as to create additional efficiencies in our operations. Many of our competitors have substantially greater resources to invest in technological improvements. We may not be able to effectively implement new technology-driven products and services or be successful in marketing these products and services to our customers, or attract sufficient human capital to engage in rapid implementation and marketing.
Failure to successfully keep pace with technological change affecting the financial services industry and sustain a robust information security program through talent and human capital could have a material adverse impact on our business and, in turn, our financial condition and results of operations.
Risks Related to Our Common Stock
Anti-takeover provisions could negatively impact our shareholders.
Certain provisions in the Company's Certificate of Incorporation and Bylaws, as well as federal banking laws, regulatory approval requirements, and Delaware law, could make it more difficult for a third party to acquire the Company, even if doing so would be perceived to be beneficial to our shareholders.
There may be future sales or other dilution of the Company's equity, which may adversely affect the market price of our common stock.
The Company is generally not restricted from issuing additional common stock, including any securities that are convertible into or exchangeable for, or that represent the right to receive, common stock. The issuance of any additional shares of common stock or preferred stock or securities convertible into, exchangeable for or that represent the right to receive common stock or the exercise of such securities could be substantially dilutive to shareholders of our common stock. Holders of our shares of common stock have no preemptive rights that entitle holders to purchase their pro rata share of any offering of shares of any class or series. The market price of our common stock could decline as a result of offerings or because of sales of shares of our common stock made after offerings or the perception that such sales could occur. Because our decision to issue securities in any future offering will depend on market conditions and other factors beyond our control, we cannot predict or estimate the amount, timing or nature of our future offerings. Thus, our shareholders bear the risk of our future offerings reducing the market price of our common stock and diluting their stock holdings in us.
The Company relies on dividends from our subsidiaries for most of our revenue.
The Company is a bank holding company and our operations are conducted by our subsidiaries from which we receive dividends. The ability of our subsidiaries to pay dividends is subject to legal and regulatory limitations, profitability, financial condition, capital expenditures and other cash flow requirements. The ability of the Bank to pay cash dividends to the Company is limited by its obligation to maintain sufficient capital and by other restrictions on its cash dividends that are applicable to state member banks in the Federal Reserve System. If the Bank is not permitted to pay cash dividends to the Company, it is unlikely that we would be able to pay cash dividends on our common stock.
Item 1B. Unresolved Staff Comments
There are no unresolved comments from the staff of the SEC to report.
Item 1C. Cybersecurity
Cybersecurity risk management and strategy
Our risk management program is designed to identify, assess, and mitigate risks across various aspects of the Company, including financial, operational, regulatory, reputational, and legal risks. This includes cybersecurity, a critical component of our broader enterprise risk management program given the increasing reliance on technology by customers, vendors, agents, and our own employees and the ever-evolving risk of cyber threats. Our Chief Information Security Officer leads the Information Security team that administers the Company's information security program, which covers cybersecurity risk. The Chief Information Security Officer reports to the Chief Digital & Innovation Officer, and works alongside the Chief Risk Officer who provides an effective second line of defense on technological and security risk management. Our cybersecurity program aims to address risks through a cross-functional approach that focuses on confidentiality, security, and availability of information vital to protecting our customers, employees, stakeholders, and the Company as a whole.
Our objective for managing cybersecurity risk is to avoid or minimize the impacts of external threat events or other efforts to penetrate, disrupt, or misuse our critical systems or gain unauthorized access to sensitive information. The structure of our information security program is designed to address applicable laws, regulatory guidance, and industry best practices, including Section 501 (b) of the Gramm-Leach-Bliley Act and its implementing regulations, the Federal Financial Institutions Examination Council (“FFIEC”) Information Technology Examination Handbook, FFIEC Business Continuity Planning Handbook, FFIEC Cybersecurity Assessment Tool, and the Center for Internet Security Critical Security Controls. In addition, we leverage certain industry and government associations, vendors, third-party benchmarking, audits, and threat intelligence
feeds to facilitate and promote program effectiveness. Our Chief Information Security Officer, Chief Digital & Innovation Officer, and our Chief Risk Officer, along with key members of their teams, regularly collaborate with peer banks, industry groups, and policymakers to discuss cybersecurity trends, issues, and emerging risks and identify best practices.
We employ a "defense in depth" methodology, which focuses on protecting information systems, products and services by deploying multiple layers of security controls in order to mitigate risks. We leverage human capital, customer input, responsive processes, and effective technology as part of our efforts to manage and maintain cybersecurity controls, data access standards, risk management standards, and encryption standards. We also employ a variety of preventative and detective tools designed to monitor, block, and provide alerts regarding suspicious activity, as well as to report on suspected advanced persistent threats. We have established processes and systems designed to mitigate cybersecurity risk, including an acceptable-use policy and terms of acceptance that all employees must review and abide by, regular and on-going education and training for employees, information notices, and recovery and resilience tests. We engage in regular assessments of our infrastructure, software systems, network architecture, and data repositories, using internal cybersecurity experts and external specialists and vendors. We require critical third-party vendors to establish incident response and reporting to our information security team and to maintain business continuity plans. We also actively monitor our e-mail gateways for malicious phishing email campaigns and monitor remote connections as a significant portion of our workforce has the option to work remotely. Remote workers are required to login to our network through a secure virtual private network with password and multi-factor authentication in order to minimize security risks while working outside the office. The Information Security Department consistently identifies vulnerabilities with our systems, implements protective updates and patches, and monitors the status of remediation efforts. Regular reports on these activities are provided to management committees to ensure transparency and oversight of our cybersecurity practices.
We maintain a Corporate Incident Response Plan (“CIRP”) that provides a documented set of protocols for responding to actual or potential cybersecurity incidents, including timely detection and analysis, containment and elimination, and recovery and improvement following an incident. The CIRP provides for notification of appropriate information breach or cybersecurity incidents and escalation to the Company's appointed Incident Management Team, which would be composed of an Incident Response Lead and team members from information technology, information security, enterprise risk management, corporate security, compliance, and legal teams, among others. The Incident Management Team would leverage the expertise of team members to work together to respond to the incident and take appropriate measures. The Senior Risk Committee would oversee the team and receive quarterly reporting on the incident and any relevant updates. The CIRP is coordinated through Incident Management Teams that involve the Bank’s Incident Management Lead, Chief Digital & Innovation Officer, Chief Information Security Officer, and other key departments. The CIRP facilitates coordination across multiple parts of our organization and is evaluated by the Chief Risk Officer and legal department at least annually.
Board and management governance
Our Chief Information Security Officer is accountable for managing our enterprise information security department and administering our information security program. The responsibilities of this department include cybersecurity risk assessment, defense operations, incident response, vulnerability assessment, threat intelligence, identity governance administration, third-party risk management, and business resilience to ensure confidentiality, availability, and integrity of technological assets, as well as maintenance of policies, procedures, and standards. The foregoing responsibilities are covered on a day-to-day basis by a first line of defense function, and our second line of defense function, including the Chief Information Security Officer and Chief Risk Officer, provides guidance, oversight, monitoring and challenge of the first line’s activities. The second line of defense function is separated from the first line of defense function through organizational structure and ultimately reports directly to the Chief Risk Officer. The department as a whole, consists of information security professionals with varying degrees of education and experience. Individuals within the department are generally subject to professional education and certification requirements. Our Chief Information Security Officer has substantial relevant expertise and formal training in the areas of information security and cybersecurity risk management.
Our board of directors has approved committees including the Risk Committee, which oversees overall risk management activities and policies including those related to technological and cybersecurity risks, and the Technology Committee, which oversees the Company’s technology strategy and approach to technology-related risks. The Risk and Technology Committees of the board are comprised of independent directors and receive regular reports from management, including the Chief Information Security Officer and Chief Risk Officer, on risk management, cybersecurity risks, actions taken to mitigate them, and technology and risk strategies. The Technology Committee reviews and approves our information security and technology budgets, policies, and strategies quarterly. The Risk Committee reviews our technology and cybersecurity risk profile on a regular basis.
The Company has also formed management committees including the Management Risk Committee, which focuses on multiple aspects of risk management including information technology, and the Technology Steering Committee, which focuses on technology and cybersecurity policy within the Bank. These management committees provide oversight and governance of our technology and information security programs. The management committees are chaired by managers within the information technology and information security departments and include the Chief Risk Officer, Chief Information Security
Officer, and Chief Digital & Innovation Officer as well as their direct reports and other key departmental managers from throughout the entire company. The management committees meet at least quarterly to provide oversight of key risk management strategies, standards, policies, practices, controls, and mitigation and prevention efforts employed to manage security risks, especially those related to cybersecurity and technology risks. More frequent meetings occur from time to time in accordance with the CIRP in order to facilitate timely informing, monitoring, and response efforts. The Chief Information Security Officer reports summaries of key issues, including significant cybersecurity and/or privacy incidents, discussed at committee meetings and the actions taken to the Technology Steering Committee of the board on a monthly basis (or more frequently as may be required by the CIRP).
Notwithstanding our defensive measures and processes, the threat posed by cyber-attacks remains elevated. Our internal systems, processes, and controls are designed to mitigate loss from cyberattacks and, while we have experienced cybersecurity incidents in the past, to date, risks from cybersecurity threats have not to our knowledge materially affected the Company. For further discussion of risks from cybersecurity threats, see the section captioned “Risks Related to Technology and Security” in Item 1A. Risk Factors.
Item 2. Properties
Property
As of December 31, 2024, the Bank conducted business through 140 full-service branch offices located throughout New Jersey, as well as Bucks, Lehigh and Northampton counties in Pennsylvania and Orange, Nassau and Queens counties in New York. Additionally, the Bank maintains satellite loan production offices throughout New Jersey, as well as in Bethlehem, Philadelphia and Plymouth Meeting, Pennsylvania and Nassau and Orange County, New York. The aggregate net book value of premises and equipment was $119.6 million as of December 31, 2024.
The Company’s executive offices are located in a leased facility at 239 Washington Street, Jersey City, New Jersey, which is also the Bank’s Main Office. The Company's and Bank’s administrative offices are located in a leased facility at 111 Wood Avenue South, Iselin, New Jersey.
Item 3. Legal Proceedings
The Company is involved in various legal actions and claims arising in the normal course of its business. Liabilities for loss contingencies arising from such litigation and claims are recorded when it is probable that a liability has been incurred and the amount can be reasonably estimated.
As a result of a pending claim, a $1.4 million charge was recorded in the fourth quarter of 2024 for estimated contingent litigation reserves, which increased our total contingent litigation reserves to $2.0 million as of December 31, 2024.
Item 4. Mine Safety Disclosures
Not applicable.
PART II
Item 5. Market For Registrant’s Common Equity and Related Stockholder Matters and Issuer Purchases of Equity Securities.
The Company’s common stock trades on the New York Stock Exchange (“NYSE”) under the symbol “PFS.” Trading in the Company’s common stock commenced on January 16, 2003.
As of February 3, 2025, there were 137,565,966 shares of the Company’s common stock issued and 130,489,493 shares outstanding, and approximately 6,178 stockholders of record.
On January 28, 2025, the board of directors declared a quarterly cash dividend of $0.24 per common share which was paid on February 28, 2025, to stockholders of record as of the close of business on February 14, 2025. The Company’s board of directors intends to review the payment of dividends quarterly and plans to continue to maintain a regular quarterly cash dividend in the future, subject to financial condition, results of operations, tax considerations, industry standards, economic conditions, regulatory restrictions, including those that affect the payment of dividends by the Bank to the Company; and other relevant factors.
Stock Performance Graph
Set forth below is a stock performance graph comparing (a) the cumulative total return on the Company’s common stock for the period December 31, 2019 through December 31, 2024, (b) the cumulative total return on stocks included in the Russell 2000 Index over such period, and (c) the cumulative total return of the S&P U.S. SmallCap Banks Index over such period. This Index, produced by S&P Global, contains all thrift institutions traded on the NYSE and NASDAQ stock exchange. Cumulative return assumes the reinvestment of dividends and is expressed in dollars based on an assumed investment of $100 on December 31, 2019.
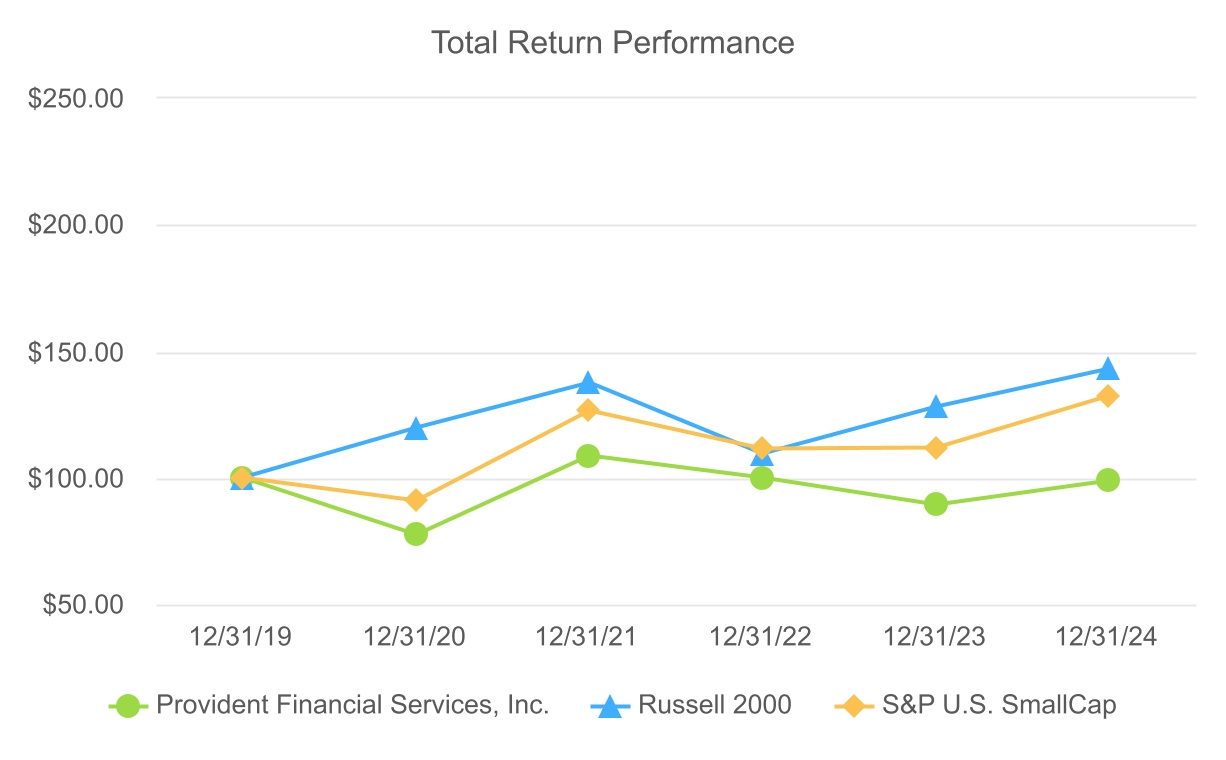
| | | | | | | | | | | | | | | | | | | | | | | | | | | | | | | | | | | | | | |
| | | Period Ending |
| Index | | 12/31/2019 | | 12/31/2020 | | 12/31/2021 | | 12/31/2022 | | 12/31/2023 | | 12/31/2024 |
| Provident Financial Services, Inc. | | 100.00 | | | 77.47 | | | 108.82 | | | 100.08 | | | 89.28 | | | 98.86 | |
| Russell 2000 Index | | 100.00 | | | 119.96 | | | 137.74 | | | 109.59 | | | 128.14 | | | 142.93 | |
| S&P U.S. SmallCap Banks Index | | 100.00 | | | 90.82 | | | 126.43 | | | 111.47 | | | 112.03 | | | 132.44 | |
The following table reports information regarding purchases of the Company’s common stock during the fourth quarter of 2024 under the stock repurchase plan approved by the Company’s board of directors:
ISSUER PURCHASES OF EQUITY SECURITIES
The Company repurchased 748 shares of its common stock at a cost of $14,000 during the fourth quarter of 2024 under the stock repurchase program approved by the Company’s board of directors. The Company repurchased 89,569 shares of its common stock at a cost of $1.3 million in 2024. As of December 31, 2024, 3.1 million shares were eligible for repurchase under the board approved stock repurchase program.
| | | | | | | | | | | | | | | | | | | | | | | | | | |
| Period | | Total Number of Shares Purchased | | Average Price Paid per Share | | Total Number of Shares Purchased as Part of Publicly Announced Programs(1) (2) | | Maximum Number of Shares that May Yet Be Purchased Under the Programs (1) (2) |
| October 1, 2024 through October 31, 2024 | | 644 | | | $ | 17.83 | | | 644 | | | 3,072,955 | |
| November 1, 2024 through November 30, 2024 | | 104 | | | 21.40 | | | 104 | | | 3,072,851 | |
| December 1, 2024 through December 31, 2024 | | — | | | — | | | — | | | 3,072,851 | |
| Total | | 748 | | | $ | 18.33 | | | 748 | | | |
(1) On December 28, 2020, the Company’s board of directors approved the purchase of up to 3,900,000 shares of its common stock under a ninth general repurchase program to commence upon completion of the eighth repurchase program. The repurchase program has no expiration date.
(2) On April 25, 2024, shares available for stock awards and stock options under the Amended and Restated Long-Term Incentive Plan were reserved for issuance under the new 2024 Equity Plan. The new plan authorized the issuance of up to 2,100,000 shares of Company common stock to be issued as stock awards.
Item 6. [Reserved]
Item 7. Management’s Discussion and Analysis of Financial Condition and Results of Operations
General
The Company conducts business through its subsidiary, the Bank, a community- and customer-oriented bank currently operating full-service branches and loan production offices throughout New Jersey, as well as in Bethlehem, Philadelphia and Plymouth Meeting, Pennsylvania and Nassau and Orange County, New York. The Bank also provides fiduciary and wealth management services through its wholly owned subsidiary, Beacon Trust Company and insurance services through its wholly owned subsidiary, Provident Protection Plus, Inc.
Strategy
Established in 1839, the Bank is the oldest New Jersey-chartered bank in the state. The Bank offers a full range of commercial and retail loan and deposit products and emphasizes personal service and convenience.
The Bank’s strategy is to grow profitably through a commitment to credit quality and expanding market share by acquiring, retaining, and expanding customer relationships, while carefully managing interest rate risk.
The Bank continues to maintain a diversified loan portfolio with an emphasis on commercial mortgage, multi-family, construction, and commercial loans in its efforts to reduce interest rate risk. These types of loans generally have adjustable rates that initially are higher than residential mortgage loans and generally have a higher rate of credit risk. The Bank’s lending policy focuses on quality underwriting standards and close monitoring of the loan portfolio. As of December 31, 2024, these commercial loan types accounted for 85.9% of the loan portfolio and retail loans accounted for 14.1%. The Company intends to continue to focus on commercial mortgage, multi-family, construction, and commercial lending relationships.
The Company’s relationship banking strategy focuses on increasing core accounts and expanding relationships through its branch network, mobile banking, online banking and other digital services. The Company continues to evaluate opportunities to increase market share by expanding within existing and contiguous markets. Savings and demand deposit accounts are generally a stable, relatively inexpensive source of funds. As of December 31, 2024, savings and demand deposits were 83.0% of total deposits.
The Company’s results of operations are primarily dependent upon net interest income, the difference between interest earned on interest-earning assets and the interest paid on interest-bearing liabilities. In a rapidly rising interest rate environment, changes in interest rates have an adverse effect on net interest income as the Company’s interest-bearing assets and interest-bearing liabilities reprice or mature at different times or relative interest rates. The Company generates non-interest income such as income from retail and business account fees, loan servicing fees, loan origination fees, loan level swap fees, appreciation in the cash surrender value of Bank-owned life insurance, income from loan or securities sales, fees from wealth management services, investment product sales, insurance brokerage fees and other fees. The Company’s operating expenses consist primarily of compensation and benefits expense, occupancy and equipment expense, data processing expense, the amortization of intangible assets, marketing and advertising expense and other general and administrative expenses. The Company’s results of operations are also affected by general economic conditions, changes in market interest rates, changes in asset quality, changes in asset values, actions of regulatory agencies and government policies.
Acquisitions
Lakeland Bancorp
On May 16, 2024, the Company completed its merger with Lakeland Bancorp, Inc. ("Lakeland"), which added $10.59 billion to total assets, $7.91 billion to total loans, $8.62 billion to total deposits and 68 full-service banking offices in New Jersey and New York. The Company closed 13 of the acquired Lakeland banking offices and 9 legacy Bank branches in the third quarter of 2024 due to geographic overlap.
Under the merger agreement, each share of Lakeland common stock was converted into the right to receive 0.8319 shares of the Company's common stock, a total of 54,356,954 shares converted, plus cash in lieu of fractional shares. The total consideration paid for the acquisition of Lakeland was $876.8 million. In connection with the acquisition, Lakeland Bank, a wholly owned subsidiary of Lakeland, was merged with and into the Bank.
Critical Accounting Policies
The Company considers certain accounting policies to be critically important to the fair presentation of its financial condition and results of operations. These policies require management to make complex judgments on matters which by their nature have elements of uncertainty. The sensitivity of the Company’s consolidated financial statements to these critical accounting policies, and the assumptions and estimates applied, could have a significant impact on its financial condition and results of operations. These assumptions, estimates and judgments made by management can be influenced by a number of factors, including the general economic environment. The Company has identified the allowance for credit losses on loans and the acquisition method of accounting as critical accounting policies.
Allowance for Credit Losses on Loans
On January 1, 2020, the Company adopted ASU 2016-13, "Measurement of Credit Losses on Financial Instruments,” which replaces the incurred loss methodology with the CECL methodology. It also applies to off-balance sheet credit exposures, including loan commitments and lines of credit. The adoption of the new standard resulted in the Company recording a $7.9 million increase to the allowance for credit losses and a $3.2 million liability for off-balance sheet credit exposures. The adoption of the standard did not result in a change to the Company's results of operations upon adoption as it was recorded as an $8.3 million cumulative effect adjustment, net of income taxes, to retained earnings.
The allowance for credit losses is a valuation account that reflects management’s evaluation of the current expected credit losses in the loan portfolio. The Company maintains the allowance for credit losses through provisions for credit losses that are charged to income. Charge-offs against the allowance for credit losses are taken on loans where management determines that the collection of loan principal and interest is unlikely. Recoveries made on loans that have been charged-off are credited to the allowance for credit losses.
The calculation of the allowance for credit losses is a critical accounting policy of the Company. Management estimates the allowance balance using relevant available information, from internal and external sources, related to past events, current conditions, and a reasonable and supportable forecast. Historical credit loss experience for both the Company and peers provides the basis for the estimation of expected credit losses, where observed credit losses are converted to probability of default rate (“PDR”) curves through the use of segment-specific loss given default (“LGD”) risk factors that convert default rates to loss severity based on industry-level, observed relationships between the two variables for each segment, primarily due to the nature of the underlying collateral. These risk factors were assessed for reasonableness against the Company’s own loss experience and adjusted in certain cases when the relationship between the Company’s historical default and loss severity deviate from that of the wider industry. The historical PDR curves, together with corresponding economic conditions, establish a quantitative relationship between economic conditions and loan performance through an economic cycle.
Using the historical relationship between economic conditions and loan performance, management’s expectation of future loan performance is incorporated using an externally developed economic forecast. This forecast is applied over a period that management has determined to be reasonable and supportable. Beyond the period over which management can develop or source a reasonable and supportable forecast, the model will revert to long-term average economic conditions using a straight-line, time-based methodology. The Company's current forecast period is six quarters, with a four-quarter reversion period to historical average macroeconomic factors. The Company's economic forecast is approved by the Company's ACL Committee.
The allowance for credit losses is measured on a collective (pool) basis, with both a quantitative and qualitative analysis that is applied on a quarterly basis, when similar risk characteristics exist. The respective quantitative allowance for each loan segment is measured using an econometric, discounted PDR/LGD modeling methodology in which distinct, segment-specific multi-variate regression models are applied to an external economic forecast. Under the discounted cash flows methodology, expected credit losses are estimated over the effective life of the loans by measuring the difference between the net present value of modeled cash flows and amortized cost basis. Contractual cash flows over the contractual life of the loans are the basis for modeled cash flows, adjusted for modeled defaults and expected prepayments and discounted at the loan-level effective interest rate. The contractual term excludes expected extensions, renewals and modifications unless either of the following applies at the reporting date: management has a reasonable expectation that a modification will be executed with an individual borrower; or when an extension or renewal option is included in the original contract and is not unconditionally cancellable by the Company. Management will assess the likelihood of the option being exercised by the borrower and appropriately extend the maturity for modeling purposes.
The Company considers qualitative adjustments to credit loss estimates for information not already captured in the quantitative component of the loss estimation process. Qualitative factors are based on portfolio concentration levels, model imprecision, changes in industry conditions, changes in the Company’s loan review process, changes in the Company’s loan policies and procedures, and economic forecast uncertainty.
One of the most significant judgments involved in estimating the Company’s allowance for credit losses relates to the macroeconomic forecasts used to estimate expected credit losses over the forecast period. As of December 31, 2024, the model incorporated Moody’s baseline economic forecast, as adjusted for qualitative factors, as well as an extensive review of classified loans and loans that were classified as impaired with a specific reserve assigned to those loans. The allowance estimation process resulted in a total provision of $83.6 million for the year ended December 31, 2024, and an overall coverage ratio of 104 basis points. Of the $83.6 million provision for the year, $60.1 million was recorded as part of the Lakeland merger in accordance with GAAP requirements for accounting for business combinations. Management believes the allowance for credit losses accurately represents the estimated inherent losses, factoring in the qualitative adjustment and other assumptions, including the selection of the baseline forecast within the model. If the Company used a more severe outlook, the provision would have risen by approximately $16.0 million, leading to an overall coverage ratio of approximately 112 basis points.
Portfolio segment is defined as the level at which an entity develops and documents a systematic methodology to determine its allowance for credit losses. Management developed segments for estimating loss based on type of borrower and collateral which is generally based upon federal call report segmentation. The segments have been combined or sub-segmented as needed to ensure loans of similar risk profiles are appropriately pooled. As of December 31, 2024, the portfolio and class segments for the Company’s loan portfolio were:
•Mortgage Loans – Residential, Commercial Real Estate, Multi-Family and Construction
•Commercial Loans – Commercial Owner-Occupied and Commercial Non-Owner Occupied
•Consumer Loans – First Lien Home Equity and Other Consumer
The allowance for credit losses on loans individually evaluated for impairment is based upon loans that have been identified through the Company’s normal loan monitoring process. This process includes the review of delinquent and problem loans at the Company’s Credit, Credit Risk Management and Allowance Committees; or which may be identified through the Company’s loan review process. Generally, the Company only evaluates loans individually for impairment if the loan is non-accrual, non-homogeneous and the balance is greater than $1.0 million.
For all classes of loans deemed collateral-dependent, the Company estimates expected credit losses based on the fair value of the collateral less any selling costs. If the loan is not collateral dependent, the allowance for credit losses related to individually assessed loans is based on discounted expected cash flows using the loan’s initial effective interest rate.
Loans acquired that have experienced more-than-insignificant deterioration in credit quality since their origination are considered PCD loans. The Company evaluates acquired loans for deterioration in credit quality based on any of, but not limited to, the following: (1) non-accrual status; (2) modification designation; (3) risk ratings of special mention, substandard or
doubtful; (4) watchlist credits; and (5) delinquency status, including loans that are current on acquisition date, but had been previously delinquent. At the acquisition date, an estimate of expected credit losses is made for groups of PCD loans with similar risk characteristics and individual PCD loans without similar risk characteristics. Subsequent to the acquisition date, the initial allowance for credit losses on PCD loans will increase or decrease based on future evaluations, with changes recognized in the provision for credit losses.
Management believes the primary risks inherent in the portfolio are a general decline in the economy, a decline in real estate market values, rising unemployment or a protracted period of elevated unemployment, increasing vacancy rates in commercial investment properties and possible increases in interest rates in the absence of economic improvement. Any one or a combination of these events may adversely affect borrowers’ ability to repay the loans, resulting in increased delinquencies, credit losses and higher levels of provisions. Management considers it important to maintain the ratio of the allowance for credit losses to total loans at an acceptable level given current and forecasted economic conditions, interest rates and the composition of the portfolio.
The CECL approach to calculate the allowance for credit losses on loans is significantly influenced by the composition, characteristics and quality of the Company’s loan portfolio, as well as the prevailing economic conditions and forecast utilized. Although management believes that the Company has established and maintained the allowance for credit losses at appropriate levels, additions may be necessary if future economic and other conditions differ substantially from the current operating environment and economic forecast. Management evaluates its estimates and assumptions on an ongoing basis giving consideration to forecasted economic factors, historical loss experience and other factors. The model includes both quantitative and qualitative components. Such estimates and assumptions are adjusted when facts and circumstances dictate. As future events and their effects cannot be determined with precision, actual results could differ significantly from these estimates. Changes in estimates resulting from continuing changes in the economic environment will be reflected in the financial statements in future periods, and to the extent actual losses are higher than management estimates, additional provision for credit losses on loans could be required and could adversely affect our earnings or financial position in future periods. In addition, various regulatory agencies periodically review the adequacy of the Company’s allowance for credit losses as an integral part of their examination process. Such agencies may require the Company to recognize additions to the allowance or additional write-downs based on their judgments about information available to them at the time of their examination. Although management uses the best information available, the level of the allowance for credit losses remains an estimate that is subject to significant judgment and short-term volatility.
Material changes to these and other relevant factors create greater volatility to the allowance for credit losses, and therefore, greater volatility to the Company’s reported earnings. For the year ended December 31, 2024, the increase in provision was primarily attributable to an initial CECL provision for credit losses on loans of $60.1 million, recorded as part of the Lakeland merger.
Acquisition Method of Accounting
The acquisition method of accounting requires that acquired assets and liabilities in a business combination be recorded at their fair values as of the acquisition date. This method often involves estimates, all of which are inherently subjective. ASC 805 provides for a period of time during which the acquirer may adjust provisional amounts recognized at the acquisition date to their subsequently determined acquisition-date fair values, referred to as the "measurement period." Adjustments during the measurement period are not limited to just those relating to assets acquired and liabilities assumed but apply to all aspects of business combination accounting (e.g., the consideration transferred). Measurement-period adjustments are calculated as if they were known at the acquisition date but are recognized in the reporting period in which they are determined. For further information, see Note 2 on business combinations.
Analysis of Net Interest Income
Net interest income represents the difference between income on interest-earning assets and expense on interest-bearing liabilities. Net interest income depends on the relative amounts of interest-earning assets and interest-bearing liabilities and the rates of interest earned on such assets and paid on such liabilities.
Average Balance Sheet. The following table sets forth certain information for the years ended December 31, 2024, 2023 and 2022. For the periods indicated, the total dollar amount of interest income from average interest-earning assets and the resultant yields, as well as the interest expense on average interest-bearing liabilities are expressed both in dollars and rates. No tax equivalent adjustments were made. Average balances are daily averages.
| | | | | | | | | | | | | | | | | | | | | | | | | | | | | | | | | | | | | | | | | | | | | | | | | | | | | |
| | For the Years Ended December 31, |
| | 2024 | | 2023 | | 2022 |
| | Average Outstanding Balance | | Interest Earned/ Paid | | Average Yield/ Cost | | Average Outstanding Balance | | Interest Earned/ Paid | | Average Yield/ Cost | | Average Outstanding Balance | | Interest Earned/ Paid | | Average Yield/ Cost |
| | (Dollars in thousands) |
| Interest-earning assets: | | | | | | | | | | | | | | | | | |
| Deposits | $ | 36,932 | | | $ | 7,062 | | | 5.23 | % | | $ | 65,991 | | | $ | 3,421 | | | 5.18 | % | | $ | 102,505 | | | $ | 809 | | | 0.79 | % |
| Federal funds sold and short-term investments | — | | | — | | | — | | | 255 | | | 12 | | | 4.55 | | | 84,969 | | | 1,208 | | | 1.42 | |
| Held to maturity debt securities, net | 344,903 | | | 8,885 | | | 2.58 | | | 375,436 | | | 9,362 | | | 2.49 | | | 407,236 | | | 9,894 | | | 2.43 | |
| Available for sale debt securities | 2,323,158 | | | 77,617 | | | 3.32 | | | 1,745,105 | | | 40,678 | | | 2.33 | | | 1,975,641 | | | 34,612 | | | 1.75 | |
| Equity securities, at fair value | 12,367 | | | — | | | — | | | 1,020 | | | — | | | — | | | 999 | | | — | | | — | |
| Federal Home Loan Bank NY stock | 85,358 | | | 8,278 | | | 9.70 | | | 81,797 | | | 6,112 | | | 7.47 | | | 42,658 | | | 2,008 | | | 4.71 | |
Net loans(2) | 15,600,431 | | | 944,296 | | | 6.05 | | | 10,367,620 | | | 556,235 | | | 5.37 | | | 9,798,822 | | | 417,650 | | | 4.26 | |
| Total interest-earning assets | 18,403,149 | | | 1,046,138 | | | 5.68 | | | 12,637,224 | | | 615,820 | | | 4.87 | | | 12,412,830 | | | 466,181 | | | 3.76 | |
| Non-interest earning assets | 1,978,999 | | | | | | | 1,278,243 | | | | | | | 1,230,019 | | | | | |
| Total assets | $ | 20,382,148 | | | | | | | $ | 13,915,467 | | | | | | | $ | 13,642,849 | | | | | |
| Interest-bearing liabilities: | | | | | | | | | | | | | | | | | |
| Savings deposits | $ | 1,502,852 | | | $ | 3,443 | | | 0.23 | % | | $ | 1,282,062 | | | $ | 2,184 | | | 0.17 | % | | $ | 1,492,046 | | | $ | 1,276 | | | 0.09 | % |
| Demand deposits | 8,480,380 | | | 245,874 | | | 2.90 | | | 5,747,671 | | | 125,471 | | | 2.18 | | | 6,076,653 | | | 32,047 | | | 0.53 | |
| Time deposits | 2,367,144 | | | 100,206 | | | 4.23 | | | 994,901 | | | 31,804 | | | 3.20 | | | 690,140 | | | 5,381 | | | 0.78 | |
| Borrowed funds | 1,983,674 | | | 73,523 | | | 3.71 | | | 1,636,572 | | | 55,856 | | | 3.41 | | | 756,275 | | | 9,310 | | | 1.23 | |
| Subordinated debentures | 262,275 | | | 22,478 | | | 8.57 | | | 10,588 | | | 1,051 | | | 9.92 | | | 10,381 | | | 615 | | | 5.92 | |
| Total interest-bearing liabilities | 14,596,325 | | | 445,524 | | | 3.05 | | | 9,671,794 | | | 216,366 | | | 2.24 | | | 9,025,495 | | | 48,629 | | | 0.54 | |
| Non-interest bearing liabilities: | | | | | | | | | | | | | | | | | |
| Non-interest bearing deposits | 3,120,571 | | | | | | | 2,328,557 | | | | | | | 2,749,562 | | | | | |
| Other non-interest bearing liabilities | 385,727 | | | | | | | 270,587 | | | | | | | 249,702 | | | | | |
| Total non-interest bearing liabilities | 3,506,298 | | | | | | | 2,599,144 | | | | | | | 2,999,264 | | | | | |
| Total liabilities | 18,102,623 | | | | | | | 12,270,938 | | | | | | | 12,024,759 | | | | | |
| Stockholders’ equity | 2,279,525 | | | | | | | 1,644,529 | | | | | | | 1,618,090 | | | | | |
| Total liabilities and equity | $ | 20,382,148 | | | | | | | $ | 13,915,467 | | | | | | | $ | 13,642,849 | | | | | |
| Net interest income | | | $ | 600,614 | | | | | | | $ | 399,454 | | | | | | | $ | 417,552 | | | |
| Net interest rate spread | | | | | 2.63 | % | | | | | | 2.63 | % | | | | | | 3.22 | % |
| Net interest earning assets | $ | 3,806,824 | | | | | | | $ | 2,965,430 | | | | | | | $ | 3,387,335 | | | | | |
Net interest margin(3) | | | | | 3.26 | % | | | | | | 3.16 | % | | | | | | 3.37 | % |
| Ratio of interest-earning assets to total interest-bearing liabilities | 1.26x | | | | | | 1.31x | | | | | | 1.38x | | | | |
(1) Average outstanding balance amounts are at amortized cost.
(2) Average outstanding balances are net of the allowance for credit losses, deferred loan fees and expenses, and loan premiums and discounts and include non-accrual loans.
(3) Net interest income divided by average interest-earning assets.
Rate/Volume Analysis. The following table presents the extent to which changes in interest rates and changes in the volume of interest-earning assets and interest-bearing liabilities have affected interest income and interest expense during the periods indicated. Information is provided in each category with respect to: (i) changes attributable to changes in volume (changes in volume multiplied by prior rate); (ii) changes attributable to changes in rate (changes in rate multiplied by prior volume); and (iii) the net change. The changes attributable to the combined impact of volume and rate have been allocated proportionately to the changes due to volume and the changes due to rate.
| | | | | | | | | | | | | | | | | | | | | | | | | | | | | | | | | | | |
| | Years Ended December 31, |
| | 2024 vs. 2023 | | 2023 vs. 2022 |
| | Increase/(Decrease) Due to | | Total Increase/ (Decrease) | | Increase/(Decrease) Due to | | Total Increase/ (Decrease) |
| | Volume | | Rate | | Volume | | Rate | |
| | (In thousands) |
| Interest-earning assets: | | | | | | | | | | | |
| Deposits, Federal funds sold and short-term investments | $ | (9,867) | | | $ | 13,497 | | | $ | 3,630 | | | $ | (8,646) | | | $ | 10,061 | | | $ | 1,415 | |
| Investment securities | (780) | | | 303 | | | (477) | | | (787) | | | 254 | | | (533) | |
| Securities available for sale | 16,177 | | | 20,762 | | | 36,939 | | | (4,387) | | | 10,454 | | | 6,067 | |
| Federal Home Loan Bank Stock | 276 | | | 1,890 | | | 2,166 | | | 2,501 | | | 1,604 | | | 4,105 | |
| Loans | 309,447 | | | 78,614 | | | 388,061 | | | 25,394 | | | 113,191 | | | 138,585 | |
| Total interest-earning assets | 315,253 | | | 115,066 | | | 430,319 | | | 14,075 | | | 135,564 | | | 149,639 | |
| Interest-bearing liabilities: | | | | | | | | | | | |
| Savings deposits | 419 | | | 840 | | | 1,259 | | | (202) | | | 1,110 | | | 908 | |
| Demand deposits | 71,237 | | | 49,167 | | | 120,404 | | | (1,827) | | | 95,250 | | | 93,423 | |
| Time deposits | 55,383 | | | 13,019 | | | 68,402 | | | 3,294 | | | 23,130 | | | 26,424 | |
| Borrowed funds | 12,571 | | | 5,096 | | | 17,667 | | | 18,450 | | | 28,096 | | | 46,546 | |
| Subordinated debentures | 21,590 | | | (163) | | | 21,427 | | | 13 | | | 423 | | | 436 | |
| Total interest-bearing liabilities | 161,200 | | | 67,959 | | | 229,159 | | | 19,728 | | | 148,009 | | | 167,737 | |
| Net interest income | $ | 154,053 | | | $ | 47,107 | | | $ | 201,160 | | | $ | (5,653) | | | $ | (12,445) | | | $ | (18,098) | |
There were no out-of-period items and/or adjustments that had a material impact on the rate/volume analysis for the periods aforementioned in the table above.
Comparison of Financial Condition as of December 31, 2024 and December 31, 2023
Total assets as of December 31, 2024 were $24.05 billion, a $9.84 billion increase from December 31, 2023. The increase in total assets was primarily due to the addition of Lakeland.
The Company’s loan held for investment portfolio totaled $18.66 billion as of December 31, 2024 and $10.87 billion as of December 31, 2023. The loan portfolio consists of the following (dollars in thousands):
| | | | | | | | | | | |
| 2024 | | 2023 |
| Mortgage loans: | | | |
| Commercial | $ | 7,228,078 | | | 4,512,411 | |
| Multi-family | 3,382,933 | | | 1,812,500 | |
| Construction | 823,503 | | | 653,246 | |
| Residential | 2,010,637 | | | 1,177,698 | |
| Total mortgage loans | 13,445,151 | | | 8,143,113 | |
Commercial loans (1) | 4,608,600 | | | 2,440,621 | |
| Consumer loans | 613,819 | | | 299,164 | |
| Total gross loans | 18,667,570 | | | 10,882,898 | |
| Premiums on purchased loans | 1,338 | | | 1,474 | |
| Net deferred fees and unearned discounts | (9,538) | | | (12,456) | |
| Total loans | $ | 18,659,370 | | | 10,871,916 | |
(1) Commercial loans consist of owner-occupied real estate and commercial & industrial loans.
As part of the merger with Lakeland, we acquired $7.91 billion in loans, net of purchase accounting adjustments. For the year ended December 31, 2024, the Company experienced net increases of $1.57 billion in multi-family loans, $2.17 billion in commercial loans and $2.72 billion in commercial mortgage loans, partially offset by net decreases of $170.3 million in construction loans and net decreases in residential mortgage and consumer loans of $845.7 million and $314.7 million, respectively. Commercial loans, consisting of commercial real estate, multi-family, commercial and construction loans, represented 85.9% of the loan portfolio at December 31, 2024, compared to 86.5% at December 31, 2023. Retail loans, which consist of one- to four-family residential mortgage and consumer loans, such as fixed-rate home equity loans and lines of credit, totaled $2.62 billion and accounted for 14.1% of the loan portfolio as of December 31, 2024, compared to $1.46 billion, or 13.5%, of the loan portfolio as of December 31, 2023. For the year ended December 31, 2024, loan fundings, including advances on lines of credit, totaled $4.82 billion, compared with $3.34 billion for 2023.
The Bank’s lending activities, though concentrated in the communities surrounding its offices, extend predominantly throughout New Jersey, eastern Pennsylvania and Nassau and Orange County, New York. This geographic concentration subjects the Company’s loan portfolio to the general economic conditions within these states. The risks created by this concentration have been considered by management in the determination of the appropriateness of the allowance for credit losses.
We consider our commercial real estate loans to be higher risk categories in our loan portfolio. These loans are particularly sensitive to economic conditions. As of December 31, 2024, our portfolio of commercial real estate loans, including multi-family and construction loans, totaled $11.43 billion, or 61.92% of total loans.
The Company believes the CRE loans it originates are appropriately collateralized under its credit standards. Collateral properties include multi-family apartment buildings, warehouse/distribution buildings, shopping centers, office buildings, mixed-use buildings, hotels/motels, senior living, apartment buildings, residential and commercial tract developments, and raw land or lots to be developed into single-family homes. The primary source of repayment on the permanent loan portion of these loans is generally expected to come from the cash flow stream of the underlying leases which are dependent on the successful operations of the respective tenants. The primary source of the repayment on the construction portfolio is dependent on the successful completion of the project and the related sale, permanent financing or lease of the real property collateral. As a result, the performance of these loans is generally impacted by fluctuations in collateral values, the ability of the borrower to obtain permanent financing, and, in the case of loans to residential builder/developers, volatility in consumer demand.
The table below summarizes the collateral concentrations of CRE loans on a gross basis, not including any purchase accounting adjustments ("PAA") as of December 31, 2024 (dollars in thousands):
| | | | | | | | | | | |
| Amount | | Percentage of Total |
| Multi-family | $ | 3,901,860 | | | 33.5 | % |
| Retail | 2,563,414 | | | 22.1 | |
| Industrial | 2,202,543 | | | 19.0 | |
| Office | 892,842 | | | 7.7 | |
| Mixed | 831,853 | | | 7.2 | |
| Special use property | 616,149 | | | 5.3 | |
| Residential | 400,607 | | | 3.5 | |
| Hotel | 125,956 | | | 1.1 | |
| Land | 65,904 | | | 0.6 | |
| Total CRE, multi-family and construction loans | $ | 11,601,128 | | | 100.0 | % |
The determination of collateral value is critically important when financing real estate. As a result, obtaining current and objectively prepared appraisals is a major part of the underwriting process. The Company engages a variety of professional firms to supply appraisals, market studies and feasibility reports, environmental assessments and project site inspections to complement its internal resources to underwrite and monitor these credit exposures.
However, in periods of economic uncertainty where real estate market conditions may change rapidly, more current appraisals are obtained when warranted by conditions such as a borrower’s deteriorating financial condition, their possible inability to perform on the loan or other indicators of increasing risk of reliance on collateral value as the sole source of repayment of the loan. Annual appraisals are generally obtained for loans graded substandard or worse where real estate is a material portion of the collateral value and/or the income from the real estate or sale of the real estate is the primary source of debt service.
Appraisals are, in substantially all cases, reviewed by a third-party to determine the reasonableness of the appraised value. The third-party reviewer will challenge whether or not the data used is appropriate and relevant, form an opinion as to the appropriateness of the appraisal methods and techniques used, and determine if overall the analysis and conclusions of the appraiser can be relied upon. Additionally, the third-party reviewer provides a detailed report of that analysis. Further review may be conducted by credit or lending teams, including the Bank’s commercial workout team as conditions warrant. These additional steps of review are undertaken to confirm that the underlying appraisal and the third-party analysis can be relied upon. If differences arise, management addresses those with the reviewer and determines an appropriate resolution in accordance with its lending policy. Both the appraisal process and the appraisal review process can be less reliable in establishing accurate collateral values during and following periods of economic weakness due to the lack of comparable sales and the limited availability of financing to support an active market of potential purchasers.
The table below summarizes the Company’s commercial real estate portfolio as of December 31, 2024, as segregated by the geographic region in which the property is located (dollars in thousands):
| | | | | | | | | | | |
| Amount | | Percentage of Total |
| New Jersey | $ | 7,087,027 | | | 61.1 | % |
| New York | 1,797,415 | | | 15.5 | |
| Pennsylvania | 1,586,518 | | | 13.7 | |
| Other states | 1,130,168 | | | 9.7 | |
| Total commercial real estate loans | $ | 11,601,128 | | | 100.0 | % |
The Company participates in loans originated by other banks, including participations designated as Shared National Credits (“SNCs”). The Company’s gross commitments and outstanding balances as a participant in SNCs were $168.4 million and $86.8 million, respectively, as of December 31, 2024.
As of December 31, 2024, the Company’s allowance for credit losses related to the loan portfolio was 1.04% of total loans, compared to 0.99% of total loans as of December 31, 2023. For the year ended December 31, 2024, the Company recorded a provision of $83.6 million for credit losses related to loans, compared to $28.2 million for the year ended December
31, 2023. The Company had net charge-offs of $14.6 million for the year ended December 31, 2024, compared to net charge-offs of $8.1 million in 2023. The increase in the allowance for credit losses on loans was due to an $83.6 million provision for credit losses on loans, which included an initial CECL provision of $60.1 million on loans acquired from Lakeland, and a $17.2 million allowance recorded through goodwill related to PCD loans acquired from Lakeland, partially offset by net charge-offs of $14.6 million.
Total non-performing loans as of December 31, 2024 were $72.1 million, or 0.39% of total loans, compared with $49.6 million, or 0.46% of total loans as of December 31, 2023. As of December 31, 2024, impaired loans totaled $55.4 million with related specific reserves of $7.5 million, compared with impaired loans totaling $42.3 million with related specific reserves of $2.9 million as of December 31, 2023. Within total impaired loans, there were $39.0 million of loans for which the present value of expected future cash flows or current collateral valuations exceeded the carrying amounts of the loans and for which no specific reserves were required in accordance with GAAP.
Non-performing commercial mortgage loans increased $15.7 million to $20.9 million as of December 31, 2024, from $5.2 million as of December 31, 2023. As of December 31, 2024, non-performing commercial mortgage loans consisted of 17 loans. Of these 17 loans, nine loans totaling $5.9 million were PCD loans. The largest non-performing commercial mortgage loan was a $7.3 million loan secured by a first mortgage on a retail building located in Atlantic City, New Jersey.
Non-performing commercial loans decreased $17.2 million, to $24.2 million as of December 31, 2024, from $41.5 million as of December 31, 2023. Non-performing commercial loans as of December 31, 2024 consisted of 65 loans, of which 16 loans were under 90 days past-due. Of these non-performing commercial loans, 37 were PCD loans totaling $4.9 million. The largest non-performing commercial loan relationship consisted of three loans with aggregate outstanding balances of $4.1 million as of December 31, 2024. These loans are secured by all business assets.
Non-performing construction loans increased $12.5 million to $13.2 million as of December 31, 2024, from $771,000 as of December 31, 2023. Non-performing construction loans as of December 31, 2024 consisted of two loans, of which one was a PCD loan. There were two non-performing construction loans in 2023. The largest non-performing construction loan was a $12.3 million loan residential development project in Jackson, New Jersey secured by a first mortgage on the land and completed and to-be completed housing units.
Non-performing multi-family mortgage loans consisted of six loans totaling $7.5 million as of December 31, 2024, compared to one non-performing multi-family mortgage loan totaling $744,000 as of December 31, 2023. Of these six loans, four loans totaling $2.1 million were PCD loans. The largest non-performing multi-family mortgage loan was a $3.7 million loan secured by a first mortgage on residential condominium units in Brooklyn, New York.
As of December 31, 2024, the Company held $9.5 million of foreclosed assets, compared with $11.7 million as of December 31, 2023. Foreclosed assets are carried at the lower of the outstanding loan balance at the time of foreclosure or fair value, less estimated costs to sell. During the year ended December 31, 2024, there were four properties sold with an aggregate carrying value of $861,000 and one write-down of a foreclosed commercial property of $1.3 million. Foreclosed assets at December 31, 2024 consisted primarily of commercial real estate.
Non-performing assets totaled $81.5 million, or 0.34% of total assets as of December 31, 2024, compared to $61.3 million, or 0.43% of total assets as of December 31, 2023. If the non-accrual loans had performed in accordance with their original terms, interest income would have increased by $2.8 million during the year ended December 31, 2024. The amount of cash basis interest income that was recognized on impaired loans during the year ended December 31, 2024 was not material.
Total deposits increased $8.33 billion during the year ended December 31, 2024, to $18.62 billion. As part of the merger with Lakeland, we acquired $8.62 billion in total deposits. Total savings and demand deposit accounts increased $6.26 billion to $15.46 billion as of December 31, 2024, while total time deposits increased $2.07 billion to $3.17 billion as of December 31, 2024. The increase in savings and demand deposits was largely attributable to a $3.13 billion increase in interest-bearing demand deposits, a $1.59 billion increase in non-interest-bearing demand deposits, a $1.04 billion increase in money market deposits and a $504.0 million increase in savings deposits. The increase in time deposits consisted of a $1.98 billion increase in retail time deposits and a $91.1 million increase in brokered time deposits. During the year ended December 31, 2024, our Certificate of Deposit Account Registry Services ("CDARS") product increased $51.7 million to $215.6 million as of December 31, 2024, from $163.9 million as of December 31, 2023.
Within total deposits, brokered deposits totaled $1.40 billion as of December 31, 2024, compared to $689.3 million as of December 31, 2023. Our brokered deposits are made up primarily of ICS deposits and CDARS. Both of these services are provided by the bank to increase the level of customers' deposit insurance. Our estimated uninsured and uncollateralized deposits at December 31, 2024 totaled $4.42 billion, or 23.7%. Our total estimated uninsured deposits, including collateralized deposits as of December 31, 2024 was $9.87 billion. Within time deposits, $637.2 million or 20.1% was uninsured as of December 31, 2024.
Borrowed funds increased $50.4 million during the year ended December 31, 2024, to $2.02 billion. The increase in borrowings was largely due to the addition of Lakeland. Borrowed funds represented 8.4% of total assets at December 31, 2024, a decrease from 13.9% at December 31, 2023.
Stockholders’ equity increased $910.6 million during the year ended December 31, 2024 to $2.60 billion, primarily due to common stock issued for the purchase of Lakeland, net income earned for the period and a slight improvement in unrealized losses on available for sale debt securities, partially offset by cash dividends paid to stockholders. For the year ended December 31, 2024, common stock repurchases totaled 89,569 shares at an average cost of $14.90 per share, all of which were made in connection with withholding to cover income taxes on the vesting of stock-based compensation. At December 31, 2024, approximately 3.1 million shares remained eligible for repurchase under the current stock repurchase authorization.
Comparison of Operating Results for the Years Ended December 31, 2024 and December 31, 2023
General. Net income for the year ended December 31, 2024 totaled $115.5 million, or $1.05 per basic and diluted share, compared to $128.4 million, or $1.72 per basic and $1.71 per diluted share, for the year ended December 31, 2023.
Earnings for the year ended December 31, 2024 reflect the impact of the May 16, 2024 merger with Lakeland, which added $10.59 billion to total assets, $7.91 billion to loans, and $8.62 billion to deposits, net of purchase accounting adjustments. The merger with Lakeland significantly impacted provisions for credit losses in 2024 due to the initial Current Expected Credit Loss ("CECL") provisions recorded on acquired loans in the second quarter. Transaction costs related to our merger with Lakeland totaled $20.2 million and $56.9 million, for the three months and year ended December 31, 2024, respectively, compared with transaction costs of $2.5 million and $7.8 million for the respective 2023 periods. Additionally, the Company realized a $2.8 million loss related to the sale of subordinated debt issued by Lakeland from the Provident investment portfolio, during the second quarter of 2024.
Net Interest Income. Net interest income increased $201.2 million to $600.6 million for 2024, from $399.5 million for 2023. The net interest margin increased 10 basis points to 3.26% for 2024, compared to 3.16% for 2023. Net interest income for the year ended December 31, 2024 was favorably impacted by the net assets acquired from Lakeland, combined with the favorable repricing of adjustable rate loans and higher market rates on new loan originations, partially offset by the unfavorable repricing of both deposits and borrowings.
Interest income increased $430.3 million to $1.05 billion for 2024, compared to $615.8 million for 2023. The increase in interest income was primarily driven by assets acquired from Lakeland, combined with favorable repricing of adjustable-rate loans and an increase in rates on new loan originations. Average interest-earning assets increased $5.75 billion to $18.40 billion for 2024, compared to $12.64 billion for 2023. The increase in average earning assets was primarily due to a $5.23 billion increase in average outstanding loan balances to $15.60 billion for 2024, combined with a $578.1 million increase in average available for sale debt securities. The yield on interest-earning assets increased 81 basis points to 5.68% for 2024, from 4.87% for 2023. The weighted average yield on total loans increased 68 basis points to 6.05% for 2024 and the weighted average yield on available for sale debt securities increased 99 basis points to 3.32% for 2024, from 2.33% for 2023. The weighted average yield on FHLBNY stock increased to 9.70% for 2024, compared to 7.47% for 2023.
Interest expense increased $229.2 million to $445.5 million for 2024, from $216.4 million for 2023. The increase in interest expense was primarily attributable to liabilities acquired from Lakeland, combined with an increase in the cost of interest-bearing liabilities. The average rate paid on interest-bearing liabilities increased 81 basis points to 3.05% for 2024, compared to 2023. The average rate paid on interest-bearing deposits increased 84 basis points to 2.83% for 2024, from 1.99% for 2023. The average rate paid on borrowings increased 30 basis points to 3.71% for 2024, from 3.41% for 2023. The average balance of interest-bearing liabilities increased $4.92 billion to $14.60 billion for 2024, compared to $9.67 billion for 2023. Average outstanding borrowings increased $347.1 million to $1.98 billion for 2024, compared to 2023. Average non-interest bearing demand deposits increased $792.0 million to $3.12 billion for 2024, from $2.33 billion for 2023. Average interest-bearing deposits increased $4.33 billion to $12.35 billion for 2024, from $8.02 billion for 2023. Within average interest-bearing deposits, average interest-bearing core deposits increased $2.95 billion to $9.98 billion for 2024, while average time deposits increased $1.37 billion to $2.37 billion for 2024.
Provision for Credit Losses. Provisions for credit losses are charged to operations in order to maintain the allowance for credit losses at a level management considers necessary to absorb projected credit losses that may arise over the expected term of each loan in the portfolio. In determining the level of the allowance for credit losses, management estimates the allowance balance using relevant available information from internal and external sources relating to past events, current conditions and a reasonable and supportable forecast. The amount of the allowance is based on estimates, and the ultimate losses may vary from such estimates as more information becomes available or later events change. Management assesses the adequacy of the allowance for credit losses on a quarterly basis and makes provisions for credit losses, if necessary, in order to maintain the valuation of the allowance.
For the year ended December 31, 2024, the Company recorded an $83.6 million provision for credit losses on loans, compared to a $28.2 million provision for 2023. The Company, for the year ended December 31, 2024, had net loan charge-offs of $14.6 million, compared to net charge-offs of $8.1 million for 2023. Total charge-offs for the year ended December 31, 2024 were $17.8 million, compared to $10.4 million for the year ended December 31, 2023. Recoveries for the year ended December 31, 2024, were $3.3 million, compared to $2.3 million for the year ended December 31, 2023. The increased provision for credit losses on loans for the year ended December 31, 2024 was primarily attributable to an initial CECL provision for credit losses on loans of $60.1 million recorded as part of the Lakeland merger in accordance with GAAP requirements for accounting for business combinations, combined with some economic forecast deterioration over the current twelve-month period within our CECL model, compared to last year.
Non-Interest Income. For the year ended December 31, 2024, non-interest income totaled $94.1 million, an increase of $14.3 million, compared to 2023. Fee income increased $9.7 million to $34.1 million for the year ended December 31, 2024, compared to 2023, primarily due to the addition of Lakeland. BOLI income increased $5.2 million to $11.7 million for the year ended December 31, 2024, compared to 2023, primarily due to an increase in benefit claims, combined with an increase in income related to the addition of Lakeland's BOLI, while wealth management income increased $2.9 million to $30.5 million for the year ended December 31, 2024, compared to 2023, mainly due to an increase in the average market value of assets under management during the period. Additionally, insurance agency income increased $2.3 million to $16.2 million for the year ended December 31, 2024, compared to $13.9 million for 2023, largely due to increases in contingent commissions, retention revenue and new business activity. Partially offsetting these increases in non-interest income, net gains on securities transactions decreased $3.0 million for the year ended December 31, 2024, primarily due to a $2.8 million loss related to the sale from the Provident investment portfolio of subordinated debt issued by Lakeland. Additionally, other income decreased $2.8 million to $4.5 million for the year ended December 31, 2024, compared to $7.3 million for 2023, primarily due to a $2.0 million gain from the sale of a foreclosed commercial property recorded in the prior year, combined with a decrease in gains on sales of SBA loans in the current year.
Non-Interest Expense. Non-interest expense totaled $457.5 million for the year ended December 31, 2024, an increase of $182.2 million, compared to $275.3 million for the year ended December 31, 2023. Compensation and benefits expense increased $69.8 million to $218.3 million for the year ended December 31, 2024, compared to $148.5 million for 2023. The increase in compensation and benefits expense was primarily attributable to the addition of Lakeland. Merger-related expenses increased $49.0 million to $56.9 million for the year ended December 31, 2024, compared to $7.8 million for 2023. Amortization of intangibles increased $26.0 million to $28.9 million for the year ended December 31, 2024, compared to $3.0 million for 2023, largely due to core deposit intangible amortization related to the addition of Lakeland. Net occupancy expense increased $12.7 million to $45.0 million for the year ended December 31, 2024, compared to 2023, primarily due to increases in depreciation and maintenance expense related to the addition of Lakeland, while data processing expense increased $12.6 million to $35.6 million for the year ended December 31, 2024, compared to $23.0 million for 2023, primarily due to additional software and hardware expenses related to the addition of Lakeland. Other operating expenses increased $7.3 million to $54.7 million for the year ended December 31, 2024, compared to $47.4 million for 2023, primarily due to increases in consulting and other professional service expenses, while FDIC insurance increased $4.4 million to $13.0 million for the year ended December 31, 2024, primarily due to the addition of Lakeland.
Income Tax Expense. For the year ended December 31, 2024, the Company's income tax expense was $34.1 million with an effective tax rate of 22.8%, compared with $47.4 million with an effective tax rate of 27.0% for the year ended December 31, 2023. The decrease in tax expense for the year ended December 31, 2024, compared with last year was largely due to a $10.0 million tax benefit related to the revaluation of deferred tax assets to reflect the imposition by the State of New Jersey of a 2.5% Corporate Transit Fee, effective January 1, 2024, combined with a decrease in taxable income as a result of the initial CECL provision for credit losses on loans of $60.1 million recorded in accordance with GAAP requirements for accounting for business combinations and additional expenses from the Lakeland merger.
Comparison of Operating Results for the Years Ended December 31, 2023 and December 31, 2022
General. Net income for the year ended December 31, 2023 was $128.4 million, compared to $175.6 million for the year ended December 31, 2022. For the year ended December 31, 2023, basic and diluted earnings per share were $1.72 and $1.71 per share, respectively, compared to basic and diluted earnings per share of $2.35, for the year ended December 31, 2022.
Earnings for the year ended December 31, 2023 was largely impacted by a decrease in net interest income, primarily attributable to a decrease in lower-costing deposits and an increase in borrowings, combined with unfavorable repricing of both deposits and borrowings, in addition to increased provisions for credit losses primarily due to a worsened economic forecast compared to the prior year. Transaction costs related to our pending merger with Lakeland totaled $7.8 million, for the year ended December 31, 2023, compared with transaction costs of $4.1 million for the respective 2022 period. In addition, prior year earnings for the year ended December 31, 2022, included an $8.6 million gain on the sale of a foreclosed property.
Net Interest Income. Net interest income decreased $18.1 million to $399.5 million for 2023, from $417.6 million for 2022. The interest rate spread decreased 59 basis points to 2.63% for 2023, from 3.22% for 2022. The net interest margin decreased 21 basis points to 3.16% for 2023, compared to 3.37% for 2022. The decrease in net interest income for the year ended December 31, 2023, was primarily due to a decrease in lower-costing deposits and an increase in borrowings, combined with unfavorable repricing of both deposits and borrowings, partially offset by originations of new loans and the favorable repricing of adjustable-rate loans. For the year ended December 31, 2023, fees related to the forgiveness of PPP loans decreased $1.4 million to $7,000, compared to $1.4 million for the year ended December 31, 2022.
Interest income increased $149.6 million to $615.8 million for 2023, compared to $466.2 million for 2022. The increase in interest income was primarily driven by the favorable repricing of adjustable-rate loans and an increase in rates on new loan originations. Average interest-earning assets increased $224.4 million to $12.64 billion for 2023, compared to $12.41 billion for 2022. The increase in average earning assets was primarily due to a $568.8 million increase in average outstanding loan balances to $10.37 billion for 2023, which was largely attributable to commercial loan originations, partially offset by a $230.5 million decrease in average available for sale debt securities. The yield on interest-earning assets increased 111 basis points to 4.87% for 2023, from 3.76% for 2022. The weighted average yield on total loans increased 111 basis points to 5.37% for 2023 and the weighted average yield on available for sale debt securities increased 58 basis points to 2.33% for 2023, from 1.75% for 2022. The weighted average yield on FHLBNY stock increased to 7.47% for 2023, compared to 4.71% for 2022.
Interest expense increased $167.7 million to $216.4 million for 2023, from $48.6 million for 2022. The increase in interest expense was primarily attributable to an increase in the cost of interest-bearing liabilities, along with an increase in average interest-bearing liabilities. The average rate paid on interest-bearing liabilities increased 170 basis points to 2.24% for 2023, compared to 2022. The average rate paid on interest-bearing deposits increased 152 basis points to 1.99% for 2023, from 0.47% for 2022. The average rate paid on borrowings increased 218 basis points to 3.41% for 2023, from 1.23% for 2022. The average balance of interest-bearing liabilities increased $646.3 million to $9.67 billion for 2023, compared to $9.03 billion for 2022. Average outstanding borrowings increased $880.3 million to $1.64 billion for 2023, compared to 2022. Average non-interest bearing demand deposits decreased $421.0 million to $2.33 billion for 2023, from $2.75 billion for 2022. Average interest-bearing deposits decreased $234.2 million to $8.02 billion for 2023, from $8.26 billion for 2022. Within average interest-bearing deposits, average interest-bearing core deposits decreased $539.0 million to $7.03 billion for 2023, while average time deposits increased $304.8 million to $994.9 million for 2023.
Provision for Credit Losses. Provisions for credit losses are charged to operations in order to maintain the allowance for credit losses at a level management considers necessary to absorb projected credit losses that may arise over the expected term of each loan in the portfolio. In determining the level of the allowance for credit losses, management estimates the allowance balance using relevant available information from internal and external sources relating to past events, current conditions and a reasonable and supportable forecast. The amount of the allowance is based on estimates, and the ultimate losses may vary from such estimates as more information becomes available or later events change. Management assesses the adequacy of the allowance for credit losses on a quarterly basis and makes provisions for credit losses, if necessary, in order to maintain the valuation of the allowance.
For the year ended December 31, 2023, the Company recorded a $27.9 million provision for credit losses on loans, compared to a $8.4 million provision for 2022. The Company, for the year ended December 31, 2023, had net loan charge-offs of $8.1 million, compared to net charge-offs of $1.1 million for 2022. Total charge-offs for the year ended December 31, 2023 were $10.4 million, compared to $6.5 million for the year ended December 31, 2022. Recoveries for the year ended December 31, 2023, were $2.3 million, compared to $5.4 million for the year ended December 31, 2022. The increase in the year-over-year provision for credit losses was primarily attributable to a worsened economic forecast and related deterioration in the projected commercial property price indices used in our CECL model.
Non-Interest Income. For the year ended December 31, 2023, non-interest income totaled $79.8 million, a decrease of $8.0 million, compared to the same period in 2022. Other income decreased $6.9 million to $7.3 million for the year ended December 31, 2023, compared to $14.2 million for the same period in 2022, primarily due to an $8.6 million gain realized in the prior year on the sale of a foreclosed commercial office property, partially offset by an increase in gains on sales of SBA loans. Additionally, fee income decreased $3.7 million to $24.4 million for the year ended December 31, 2023, compared to the same period in 2022, primarily due to a decrease in commercial loan prepayment fees. Partially offsetting these decreases in non-interest income, insurance agency income increased $2.5 million to $13.9 million for the year ended December 31, 2023, compared to $11.4 million for the same period in 2022, largely due to increases in retention revenue and new business activity. BOLI income increased $494,000 to $6.5 million for the year ended December 31, 2023, compared to the same period in 2022, largely due to greater equity valuations, partially offset by a decrease in benefit claims recognized.
Non-Interest Expense. Non-interest expense totaled $275.6 million for the year ended December 31, 2023, an increase of $18.8 million, compared to $256.8 million for the year ended December 31, 2022. Other operating expense increased $8.5
million to $47.4 million for the year ended December 31, 2023, compared to $38.9 million for the year ended December 31, 2022. The increase in other operating expenses was largely due to a $3.0 million charge for contingent litigation reserves, combined with a $2.0 million write-down of a foreclosed property and an increase in professional fees. Merger-related expense increased $3.7 million to $7.8 million for the year ended December 31, 2023, compared to 2022. The Company recorded a $264,000 provision for credit losses for off-balance sheet credit exposures, compared to a $3.4 million negative provision last year. The $3.6 million increase in the provision for credit losses for off-balance sheet credit exposures for the year was primarily due to a period over period decrease in line of credit utilization, combined with a period over period increase in loans approved and awaiting closing. FDIC insurance expense increased $3.4 million to $8.6 million for the year ended December 31, 2023, compared to $5.2 million for the trailing year, primarily due to an increase in the assessment rate and the FDIC special assessment. Data processing expense increased $1.3 million to $23.0 million for the year ended December 31, 2023, mainly due to an increase in software service and core processing expenses. Compensation and benefits expense increased $1.3 million to $148.5 million for the year ended December 31, 2023, compared to $147.2 million for the year ended December 31, 2022, primarily due to increases in salary expense, employee medical benefits and post-retirement benefit expense, partially offset by decreases in the accrual for incentive compensation and stock-based compensation. Partially offsetting these increases, net occupancy expense decreased $2.3 million to $32.3 million for the year ended December 31, 2023, compared to the same period in 2022, mainly due to decreases in depreciation and maintenance expenses.
Income Tax Expense. For the year ended December 31, 2023, the Company's income tax expense was $47.4 million with an effective tax rate of 27.0%, compared with $64.5 million with an effective tax rate of 26.8% for the year ended December 31, 2022. The decrease in tax expense for the year ended December 31, 2023, compared with the same period last year was largely the result of a decrease in taxable income.
Liquidity and Capital Resources
Liquidity refers to the Company’s ability to generate adequate amounts of cash to meet financial obligations to its depositors, to fund loans and securities purchases and operating expenses. Sources of funds include scheduled amortization of loans, loan prepayments, scheduled maturities of unpledged investments, cash flows from mortgage-backed securities and the ability to borrow funds from the FHLBNY, FRBNY and approved broker-dealers.
Cash flows from loan payments and maturing investment securities are fairly predictable sources of funds. Changes in interest rates, local economic conditions and the competitive marketplace can influence loan prepayments, prepayments on mortgage-backed securities and deposit flows. For each of the years ended December 31, 2024 and 2023, loan repayments totaled $4.88 billion and $2.68 billion, respectively.
The Company has continued to monitor and focus on depositor behavior and borrowing capacity with the FHLBNY and FRBNY, with current borrowing capacity of $2.57 billion and $3.79 billion, respectively at December 31, 2024. Our estimated uninsured and uncollateralized deposits at December 31, 2024 totaled $4.42 billion, or 23.7% of deposits. Our total estimated uninsured deposits, including collateralized deposits as of December 31, 2024 was $9.87 billion.
Commercial real estate loans, multi-family loans, commercial loans, one- to four-family residential loans and consumer loans are the primary investments of the Company. Purchasing securities for the investment portfolio is a secondary use of funds and the investment portfolio is structured to complement and facilitate the Company’s lending activities and ensure adequate liquidity. Loan originations and purchases totaled $4.82 billion for the year ended December 31, 2024, compared to $3.34 billion for the year ended December 31, 2023. Purchases for the investment portfolio totaled $422.4 million for the year ended December 31, 2024, compared to $57.2 million for the year ended December 31, 2023. As of December 31, 2024, the Bank had outstanding loan commitments to borrowers of $2.73 billion, including undisbursed home equity lines and personal credit lines of $382.1 million.
Total deposits increased $8.33 billion for the year ended December 31, 2024. Deposit activity is affected by changes in interest rates, competitive pricing and product offerings in the marketplace, local economic conditions, customer confidence and other factors such as stock market volatility. Certificate of deposit accounts that are scheduled to mature within one year totaled $3.05 billion as of December 31, 2024. Based on its current pricing strategy and customer retention experience, the Bank expects to retain a significant share of these accounts. The Bank manages liquidity on a daily basis and expects to have sufficient cash to meet all of its funding requirements.
As of December 31, 2024, the Bank exceeded all minimum regulatory capital requirements. As of December 31, 2024, the Bank’s leverage (Tier 1) capital ratio was 9.72%. FDIC regulations require banks to maintain a minimum leverage ratio of Tier 1 capital to adjusted total assets of 4.00%. As of December 31, 2024, the Bank’s total risk-based capital ratio was 12.40%. A bank is considered to be well-capitalized if it has a leverage (Tier 1) capital ratio of at least 5.00% and a total risk-based capital ratio of at least 10.00%. The total capital to risk-weighted assets requirement, taking into account the capital conservation buffer, is 10.50%.
Off-balance sheet commitments consist of unused commitments to borrowers for term loans, unused lines of credit and outstanding letters of credit. Total off-balance sheet obligations were $2.73 billion as of December 31, 2024, an increase of $644.7 million, from $2.09 billion as of December 31, 2023.
Contractual obligations consist of certificate of deposit liabilities. Total certificate of deposits as of December 31, 2024 were $3.17 billion, an increase of $2.07 billion, compared to $1.10 billion as of December 31, 2023. There were no security purchases in 2024 and 2023 which settled in January 2025 or January 2024, respectively.
Item 7A. Quantitative and Qualitative Disclosures About Market Risk
Qualitative Analysis. Interest rate risk is the exposure of a bank’s current and future earnings and capital to changes in interest rates. The guidelines of the Company’s interest rate risk policy seek to limit the exposure to changes in interest rates that affect the underlying economic value of assets and liabilities, earnings and capital. To minimize interest rate risk, the Company generally sells all 20- and 30-year fixed-rate residential mortgage loans at origination. The Company retains residential fixed rate mortgages with terms of 15 years or less and biweekly payment residential mortgages with a term of 30 years or less. Commercial real estate loans generally have interest rates that reset in five years, and other commercial loans such as construction loans and commercial lines of credit reset with changes in the Prime rate, the Federal Funds rate, LIBOR or SOFR. Investment securities purchases generally have maturities of five years or less, and mortgage-backed securities have weighted average lives between three and five years.
The Asset/Liability Committee meets at least monthly, or more often as needed, to review the impact of interest rate changes on net interest income, net interest margin, net income and the economic value of equity. The Asset/Liability Committee reviews a variety of strategies that project changes in asset or liability mix and the impact of those changes on projected net interest income, net income and the economic value of equity.
The Company’s strategy for liabilities has been to maintain a stable core-funding base by focusing on core deposit account acquisition and increasing products and services per household. Certificate of deposit accounts as a percentage of total deposits were 17.0% as of December 31, 2024, compared to 10.6% as of December 31, 2023. Certificate of deposit accounts are generally short-term. As of December 31, 2024, 96.1% of all certificates of deposit had maturities of one year or less compared to 93.1% as of December 31, 2023. The Company’s ability to retain maturing time deposit accounts is the result of its strategy to remain competitively priced within its marketplace. The Company’s pricing strategy may vary depending upon current funding needs and the ability of the Company to fund operations through alternative sources, primarily by accessing short-term lines of credit with the FHLBNY during periods of pricing dislocation.
Quantitative Analysis. Current and future sensitivity to changes in interest rates are measured through the use of balance sheet and income simulation models. The analysis estimates changes in net interest income using flat rates as a base, a most likely rate forecast and rising and declining interest rate forecasts. Changes in net interest income and net income for the forecast period, generally twelve to twenty-four months, are measured and compared to policy limits for acceptable change. The Company periodically reviews historical deposit re-pricing activity and makes modifications to certain assumptions used in its income simulation model regarding the interest rate sensitivity of deposits without maturity dates. These modifications are made to reflect more closely the most likely results under the various interest rate change scenarios. Since it is inherently difficult to predict the sensitivity of interest bearing deposits to changes in interest rates, the changes in net interest income due to changes in interest rates cannot be precisely predicted. There are a variety of reasons that may cause actual results to vary considerably from the predictions presented below which include, but are not limited to, the timing, magnitude, and frequency of changes in interest rates, interest rate spreads, prepayments, and actions taken in response to such changes. Specific assumptions used in the simulation model include:
•Parallel yield curve shifts for market rates;
•Current asset and liability spreads to market interest rates are fixed;
•Traditional savings and interest-bearing demand accounts move at 10% of the rate ramp in either direction;
•Retail Money Market and Business Money Market accounts move at 25% and 75% of the rate ramp in either direction, respectively; and
•Higher-balance demand deposit tiers and promotional demand accounts move at 50% to 75% of the rate ramp in either direction.
The following table sets forth the results of the twelve month projected net interest income model as of December 31, 2024. | | | | | | | | | | | | | | | | | | | | |
| Change in Interest Rates in Basis Points - (Rate Ramp) | | Net Interest Income |
| Amount | | Change | | Percent Change |
| (Dollars in thousands) |
| -300 | | $ | 769,050 | | | $ | (710) | | | (0.1) | % |
| -200 | | 767,087 | | | (2,673) | | | (0.3) | |
| -100 | | 767,848 | | | (1,912) | | | (0.2) | |
| Static | | 769,760 | | | — | | | — | |
| +100 | | 767,494 | | | (2,266) | | | (0.3) | |
| | | | | | |
The interest rate risk position of the Company remains slightly asset sensitive. The preceding table indicates that, as of December 31, 2024, in the event of a 100 basis point increase in interest rates, whereby rates ramp up evenly over a twelve-month period, there would be a 0.3% or $2.3 million decrease to net interest income. In the event of a 300 basis point decrease in interest rates, whereby rates ramp down evenly over a twelve-month period, the Company would experience a 0.1%, or $710,000 decrease in net interest income. In this downward rate scenario, rates on deposits have a repricing floor of zero.
Another measure of interest rate sensitivity is to model changes in economic value of equity through the use of immediate and sustained interest rate shocks. The following table illustrates the economic value of equity model results as of December 31, 2024.
| | | | | | | | | | | | | | | | | | | | | | | | | | | | | | | | |
| Change in Interest Rates in Basis Points | | Present Value of Equity | | Present Value of Equity as Percent of Present Value of Assets |
Amount | |
Change | | Percent Change | | Present Value Ratio | | Percent Change |
| (Dollars in thousands) | | | | |
| -300 | | $ | 2,948,544 | | | $ | (373,412) | | | (11.2) | % | | (11.2) | % | | 11.5 | % |
| -200 | | 3,108,374 | | | (213,582) | | | (6.4) | | | (6.4) | | | 12.3 | |
| -100 | | 3,230,258 | | | (91,698) | | | (2.8) | | | (2.8) | | | 13.0 | |
| Flat | | 3,321,956 | | | — | | | — | | | — | | | 13.5 | |
| +100 | | 3,357,980 | | | 36,024 | | | 1.1 | | | 1.1 | | | 13.9 | |
| | | | | | | | | | |
The preceding table indicates that as of December 31, 2024, in the event of an immediate and sustained 100 basis point increase in interest rates, the Company would experience a 1.1%, or $36.0 million increase in the present value of equity. If rates were to decrease 300 basis points, the present value of equity would decrease 11.2% or $373.4 million.
Certain shortcomings are inherent in the methodologies used in the above interest rate risk measurements. Modeling changes in net interest income requires the use of certain assumptions regarding prepayment and deposit decay rates, which may or may not reflect future loan prepayment and deposit withdrawal activity. While management believes such assumptions are reasonable, there can be no assurance that assumed prepayment rates and decay rates will approximate actual future loan prepayment and deposit withdrawal activity. Moreover, the net interest income table presented assumes that the composition of interest sensitive assets and liabilities existing at the beginning of a period remains constant over the period being measured and also assumes that a particular change in interest rates is reflected uniformly across the yield curve regardless of the duration to maturity or repricing of specific assets and liabilities. Accordingly, although the net interest income table provides an indication of the Company’s interest rate risk exposure at a particular point in time, such measurement is not intended to and does not provide a precise forecast of the effect of changes in market interest rates on the Company’s net interest income and will differ from actual results.
Item 8. Financial Statements and Supplementary Data
The following are included in this item:
A.Report of Independent Registered Public Accounting Firm
B.Report of Independent Registered Public Accounting Firm on Internal Control Over Financial Reporting
C.Consolidated Financial Statements:
(1) Consolidated Statements of Financial Condition as of December 31, 2024 and 2023
(2) Consolidated Statements of Income for the years ended December 31, 2024, 2023 and 2022
(3) Consolidated Statements of Comprehensive Income for the years ended December 31, 2024, 2023 and 2022
(4) Consolidated Statements of Changes in Stockholders’ Equity for the years ended December 31, 2024, 2023 and 2022
(5) Consolidated Statements of Cash Flows for the years ended December 31, 2024, 2023 and 2022
(6) Notes to Consolidated Financial Statements
D.Provident Financial Services, Inc., Condensed Financial Statements:
(1) Condensed Statement of Financial Condition as of December 31, 2024 and 2023
(2) Condensed Statement of Income for the years ended December 31, 2024, 2023 and 2022
(3) Condensed Statement of Cash Flows for the years ended December 31, 2024, 2023 and 2022
The supplementary data required by this Item is provided in Note 19 of the Notes to Consolidated Financial Statements.
Report of Independent Registered Public Accounting Firm
To the Stockholders and Board of Directors
Provident Financial Services, Inc.:
Opinion on the Consolidated Financial Statements
We have audited the accompanying consolidated statements of financial condition of Provident Financial Services, Inc. and subsidiaries (the Company) as of December 31, 2024 and 2023, the related consolidated statements of income, comprehensive income, changes in stockholders’ equity, and cash flows for each of the years in the three-year period ended December 31, 2024, and the related notes (collectively, the consolidated financial statements). In our opinion, the consolidated financial statements present fairly, in all material respects, the financial position of the Company as of December 31, 2024 and 2023, and the results of its operations and its cash flows for each of the years in the three-year period ended December 31, 2024, in conformity with U.S. generally accepted accounting principles.
We also have audited, in accordance with the standards of the Public Company Accounting Oversight Board (United States) (PCAOB), the Company’s internal control over financial reporting as of December 31, 2024, based on criteria established in Internal Control – Integrated Framework (2013) issued by the Committee of Sponsoring Organizations of the Treadway Commission, and our report dated February 28, 2025 expressed an unqualified opinion on the effectiveness of the Company’s internal control over financial reporting.
Basis for Opinion
These consolidated financial statements are the responsibility of the Company’s management. Our responsibility is to express an opinion on these consolidated financial statements based on our audits. We are a public accounting firm registered with the PCAOB and are required to be independent with respect to the Company in accordance with the U.S. federal securities laws and the applicable rules and regulations of the Securities and Exchange Commission and the PCAOB.
We conducted our audits in accordance with the standards of the PCAOB. Those standards require that we plan and perform the audit to obtain reasonable assurance about whether the consolidated financial statements are free of material misstatement, whether due to error or fraud. Our audits included performing procedures to assess the risks of material misstatement of the consolidated financial statements, whether due to error or fraud, and performing procedures that respond to those risks. Such procedures included examining, on a test basis, evidence regarding the amounts and disclosures in the consolidated financial statements. Our audits also included evaluating the accounting principles used and significant estimates made by management, as well as evaluating the overall presentation of the consolidated financial statements. We believe that our audits provide a reasonable basis for our opinion.
Critical Audit Matters
The critical audit matters communicated below are matters arising from the current period audit of the consolidated financial statements that were communicated or required to be communicated to the audit committee and that: (1) relate to accounts or disclosures that are material to the consolidated financial statements and (2) involved our especially challenging, subjective, or complex judgments. The communication of critical audit matters does not alter in any way our opinion on the consolidated financial statements, taken as a whole, and we are not, by communicating the critical audit matters below, providing separate opinions on the critical audit matters or on the accounts or disclosures to which they relate.
Fair value measurement of acquired loans in the Lakeland Bancorp, Inc. merger
As discussed in Note 2 to the consolidated financial statements, the Company completed its merger with Lakeland Bancorp, Inc. on May 16, 2024. The transaction was accounted for as a business combination using the acquisition method of accounting. Accordingly, the assets acquired and liabilities assumed were measured at fair value at the date of acquisition, including acquired loans with a fair value of $7.91 billion. The fair value of these acquired loans was based on a discounted cash flow methodology. Monthly principal and interest cash flows, adjusted for prepayments, were discounted to present value using a discount rate based on the relative risk of the cash flows. A qualitative adjustment for expected credit losses was also applied to these discounted cash flows to arrive at the calculated fair value of the loans.
We identified the fair value measurement of the acquired loans at the date of acquisition as a critical audit matter. A high degree of audit effort, including specialized skills and knowledge, and subjective and complex auditor judgment was involved in the assessment of the fair value measurement due to significant measurement uncertainty. Specifically, the
assessment of the fair value measurement encompassed the evaluation of the fair value methodology and the discount rate used in the discounted cash flow methodology.
The following are the primary procedures we performed to address this critical audit matter. We evaluated the design and tested the operating effectiveness of certain internal controls related to the Company’s fair value measurement of the acquired loans at the date of acquisition, including controls related to (1) the development of the fair value methodology for acquired loans, and (2) the determination of the discount rate used in the fair value estimate. We involved valuation professionals with specialized skills and knowledge, who assisted in:
•evaluating the fair value methodology for compliance with U.S. generally accepted accounting principles
•developing an independent assumption of the discount rates for these acquired loans using implied rating by vintage and coupon of the acquired loans and yields from market research, and
•developing an independent estimate of the fair value for these acquired loans using the independently developed assumption of the discount rates and additional assumptions from market research, and comparing the results to the Company's fair value estimate.
Assessment of the allowance for credit losses on loans evaluated on a collective basis
As discussed in Notes 1 and 5 to the consolidated financial statements, the Company’s allowance for credit losses on loans evaluated on a collective basis (the collective ACL on loans) was $186.0 million of a total allowance for credit losses of $193.4 million as of December 31, 2024. The collective ACL on loans includes the measure of expected credit losses on a collective basis for loans that share similar risk characteristics. The Company uses a discounted cash flow methodology where the respective quantitative allowance for each loan segment is measured by comparing the present value of expected principal and interest cash flows projected using an econometric, probability of default (PD) and loss given default (LGD) modeling methodology to the amortized cost. Historical credit loss experience for both the Company and peers provides the basis for the estimation of expected credit losses, where observed credit losses are converted to probability of default rate curves using segment-specific loss given default risk factors that convert default rates to loss severity based on industry-level, observed relationships between the two variables for each segment. Using the historical relationship between the economic conditions and loan performance, management’s expectation of future loan performance is incorporated using an externally developed economic forecast that is applied over a period that has been determined to be reasonable and supportable. After the reasonable and supportable forecast period, the Company reverts to the long-term average of selected economic factors on a straight-line basis over a reversion period. Contractual cash flows over the contractual life of the loans are the basis for modeled cash flows, adjusted for modeled defaults and expected prepayments and discounted at the loan-level effective interest rate. The Company considers qualitative adjustments to credit loss estimates for information not already captured in the quantitative component of the loss estimation process.
We identified the assessment of the collective ACL on loans as a critical audit matter. A high degree of audit effort, including specialized skills and knowledge, and subjective and complex auditor judgment was involved in the assessment of the collective ACL on loans due to significant measurement uncertainty. Specifically, the assessment encompassed the evaluation of the collective ACL on loans methodology, including the methods and models used to estimate (1) the PD and LGD and their significant assumptions, including the selected external economic forecast and macroeconomic factors, and (2) certain qualitative adjustments and their significant assumptions. The assessment also included an evaluation of the conceptual soundness of the PD and LGD models. In addition, auditor judgment was required to evaluate the sufficiency of audit evidence obtained.
The following are the primary procedures we performed to address this critical audit matter. We evaluated the design and tested the operating effectiveness of certain internal controls related to the Company’s measurement of the collective ACL on loans estimate, including controls over the:
•continued use and appropriateness of changes made to the collective ACL on loans methodology
•performance monitoring of the PD and LGD models
•identification and determination of the significant assumptions used in the PD and LGD models
•development of the qualitative adjustments, including the significant assumptions used in the measurement of the qualitative adjustments
•analysis of the collective ACL on loan results, trends and ratios.
We evaluated the Company’s process to develop the collective ACL on loans estimate by testing certain sources of data and assumptions that the Company used and considered the relevance and reliability of such data and assumptions. In addition, we involved credit risk professionals with specialized skills and knowledge, who assisted in:
•evaluating the Company’s collective ACL on loans methodology for compliance with U.S. generally accepted accounting principles
•evaluating judgments made by the Company relative to the development and performance monitoring of the PD and LGD models by comparing them to relevant Company-specific metrics and trends and the applicable industry and regulatory practices
•assessing the conceptual soundness and design of the PD and LGD models by inspecting the Company’s model documentation to determine whether the models are suitable for their intended use
•assessing the selected economic forecast and macroeconomic variables used by comparing it to the Company’s business environment and relevant industry practices
•evaluating the methodology used to develop the qualitative adjustments and the effect of those adjustments on the collective ACL on loans compared with relevant credit risk factors and consistency with credit trends and identified limitations of the underlying quantitative model.
We also evaluated the cumulative results of the procedures performed to assess the sufficiency of the audit evidence obtained related to the collective ACL on loans by evaluating the:
•cumulative results of the audit procedures
•qualitative aspects of the Company’s accounting practices
•potential bias in the accounting estimate.
/s/ KPMG LLP
We have not been able to determine the specific year that we began serving as the Company’s auditor; however, we are aware that we have served as the Company’s auditor since at least 1997.
New York, New York
February 28, 2025
Report of Independent Registered Public Accounting Firm
To the Stockholders and Board of Directors
Provident Financial Services, Inc.:
Opinion on Internal Control Over Financial Reporting
We have audited Provident Financial Services, Inc. and subsidiaries' (the Company) internal control over financial reporting as of December 31, 2024, based on criteria established in Internal Control – Integrated Framework (2013) issued by the Committee of Sponsoring Organizations of the Treadway Commission. In our opinion, the Company maintained, in all material respects, effective internal control over financial reporting as of December 31, 2024, based on criteria established in Internal Control – Integrated Framework (2013) issued by the Committee of Sponsoring Organizations of the Treadway Commission.
We also have audited, in accordance with the standards of the Public Company Accounting Oversight Board (United States) (PCAOB), the consolidated statements of financial condition of the Company as of December 31, 2024 and 2023, the related consolidated statements of income, comprehensive income, changes in stockholders’ equity, and cash flows for each of the years in the three-year period ended December 31, 2024, and the related notes (collectively, the consolidated financial statements), and our report dated February 28, 2025 expressed an unqualified opinion on those consolidated financial statements.
Basis for Opinion
The Company’s management is responsible for maintaining effective internal control over financial reporting and for its assessment of the effectiveness of internal control over financial reporting, included in the accompanying Management's Report on Internal Control Over Financial Reporting. Our responsibility is to express an opinion on the Company’s internal control over financial reporting based on our audit. We are a public accounting firm registered with the PCAOB and are required to be independent with respect to the Company in accordance with the U.S. federal securities laws and the applicable rules and regulations of the Securities and Exchange Commission and the PCAOB.
We conducted our audit in accordance with the standards of the PCAOB. Those standards require that we plan and perform the audit to obtain reasonable assurance about whether effective internal control over financial reporting was maintained in all material respects. Our audit of internal control over financial reporting included obtaining an understanding of internal control over financial reporting, assessing the risk that a material weakness exists, and testing and evaluating the design and operating effectiveness of internal control based on the assessed risk. Our audit also included performing such other procedures as we considered necessary in the circumstances. We believe that our audit provides a reasonable basis for our opinion.
Definition and Limitations of Internal Control Over Financial Reporting
A company’s internal control over financial reporting is a process designed to provide reasonable assurance regarding the reliability of financial reporting and the preparation of financial statements for external purposes in accordance with generally accepted accounting principles. A company’s internal control over financial reporting includes those policies and procedures that (1) pertain to the maintenance of records that, in reasonable detail, accurately and fairly reflect the transactions and dispositions of the assets of the company; (2) provide reasonable assurance that transactions are recorded as necessary to permit preparation of financial statements in accordance with generally accepted accounting principles, and that receipts and expenditures of the company are being made only in accordance with authorizations of management and directors of the company; and (3) provide reasonable assurance regarding prevention or timely detection of unauthorized acquisition, use, or disposition of the company’s assets that could have a material effect on the financial statements.
Because of its inherent limitations, internal control over financial reporting may not prevent or detect misstatements. Also, projections of any evaluation of effectiveness to future periods are subject to the risk that controls may become inadequate because of changes in conditions, or that the degree of compliance with the policies or procedures may deteriorate.
/s/ KPMG LLP
New York, New York
February 28, 2025
PROVIDENT FINANCIAL SERVICES, INC. AND SUBSIDIARY
Consolidated Statements of Financial Condition
December 31, 2024 and 2023
(Dollars in Thousands, except share data) | | | | | | | | | | | |
| December 31, 2024 | | December 31, 2023 |
| ASSETS | | | |
| Cash and due from banks | $ | 205,914 | | | $ | 180,241 | |
| Short-term investments | 25 | | | 14 | |
| Total cash and cash equivalents | 205,939 | | | 180,255 | |
| Available for sale debt securities, at fair value | 2,768,915 | | | 1,690,112 | |
| Held to maturity debt securities, (net of $14,000 allowance as of December 31, 2024 and $31,000 as of December 31, 2023, respectively) | 327,623 | | | 363,080 | |
| Equity securities, at fair value | 19,110 | | | 1,270 | |
| Federal Home Loan Bank and other stock | 112,767 | | | 79,217 | |
| Loans held for sale | 162,453 | | | 1,785 | |
| Loans held for investment | 18,659,370 | | | 10,871,916 | |
| Less allowance for credit losses | 193,432 | | | 107,200 | |
| Net loans | 18,628,391 | | | 10,766,501 | |
| Foreclosed assets, net | 9,473 | | | 11,651 | |
| Banking premises and equipment, net | 119,622 | | | 70,998 | |
| Accrued interest receivable | 91,160 | | | 58,966 | |
| Goodwill and other intangible assets | 819,230 | | | 457,942 | |
| Bank-owned life insurance | 405,893 | | | 243,050 | |
| Other assets | 543,702 | | | 287,768 | |
| Total assets | $ | 24,051,825 | | | $ | 14,210,810 | |
| LIABILITIES AND STOCKHOLDERS’ EQUITY | | | |
| Deposits: | | | |
| Demand deposits | $ | 13,775,991 | | | $ | 8,020,889 | |
| Savings deposits | 1,679,667 | | | 1,175,683 | |
| Certificates of deposit of $250 thousand or more | 789,342 | | | 218,549 | |
| Other time deposits | 2,378,813 | | | 877,393 | |
| Total deposits | 18,623,813 | | | 10,292,514 | |
| Mortgage escrow deposits | 42,247 | | | 36,838 | |
| Borrowed funds | 2,020,435 | | | 1,970,033 | |
| Subordinated debentures | 401,608 | | | 10,695 | |
| Other liabilities | 362,515 | | | 210,134 | |
| Total liabilities | 21,450,618 | | | 12,520,214 | |
| Stockholders’ Equity: | | | |
| Preferred stock, $0.01 par value, 50,000,000 shares authorized, none issued | — | | | — | |
| Common stock, $0.01 par value, 200,000,000 shares authorized, 137,565,966 shares issued and 130,489,493 shares outstanding as of December 31, 2024, and 75,537,186 shares outstanding as of December 31, 2023 | 1,376 | | | 832 | |
| Additional paid-in capital | 1,834,495 | | | 989,058 | |
| Retained earnings | 989,111 | | | 974,542 | |
| Accumulated other comprehensive (loss) income, net of tax | (135,355) | | | (141,115) | |
| Treasury stock | (88,420) | | | (127,825) | |
| Unallocated common stock held by the Employee Stock Ownership Plan | — | | | (4,896) | |
| Common stock acquired by deferred compensation plans | — | | | (2,694) | |
| Deferred compensation plans | — | | | 2,694 | |
| Total stockholders’ equity | 2,601,207 | | | 1,690,596 | |
| Total liabilities and stockholders’ equity | $ | 24,051,825 | | | $ | 14,210,810 | |
See accompanying notes to consolidated financial statements.
PROVIDENT FINANCIAL SERVICES, INC. AND SUBSIDIARY
Consolidated Statements of Income
Years Ended December 31, 2024, 2023 and 2022
(Dollars in Thousands, except share data)
| | | | | | | | | | | | | | | | | |
| | Years ended December 31, |
| | 2024 | | 2023 | | 2022 |
| Interest and dividend income: | | | | | |
| Real estate secured loans | $ | 655,868 | | | $ | 408,942 | | | $ | 304,321 | |
| Commercial loans | 251,793 | | | 128,854 | | | 98,961 | |
| Consumer loans | 36,635 | | | 18,439 | | | 14,368 | |
| Available for sale debt securities and Federal Home Loan Bank stock | 85,895 | | | 46,790 | | | 36,619 | |
| Held to maturity debt securities | 8,885 | | | 9,362 | | | 9,894 | |
| Deposits, federal funds sold and other short-term investments | 7,062 | | | 3,433 | | | 2,018 | |
| Total interest and dividend income | 1,046,138 | | | 615,820 | | | 466,181 | |
| Interest expense: | | | | | |
| Deposits | 349,523 | | | 159,459 | | | 38,704 | |
| Borrowed funds | 73,523 | | | 55,856 | | | 9,310 | |
| Subordinated debentures | 22,478 | | | 1,051 | | | 615 | |
| Total interest expense | 445,524 | | | 216,366 | | | 48,629 | |
| Net interest income | 600,614 | | | 399,454 | | | 417,552 | |
| Provision charge for credit losses | 87,564 | | | 28,168 | | | 5,004 | |
| Net interest income after provision for credit losses | 513,050 | | | 371,286 | | | 412,548 | |
| Non-interest income: | | | | | |
| Fees | 34,114 | | | 24,396 | | | 28,128 | |
| Wealth management income | 30,533 | | | 27,669 | | | 27,870 | |
| Insurance agency income | 16,201 | | | 13,934 | | | 11,440 | |
| Bank-owned life insurance | 11,709 | | | 6,482 | | | 5,988 | |
| | | | | |
| | | | | |
| | | | | |
| Net (loss) gain on securities transactions | (2,986) | | | 30 | | | 181 | |
| Other income | 4,542 | | | 7,318 | | | 14,182 | |
| Total non-interest income | 94,113 | | | 79,829 | | | 87,789 | |
| Non-interest expense: | | | | | |
| Compensation and employee benefits | 218,341 | | | 148,497 | | | 147,203 | |
| Net occupancy expense | 45,014 | | | 32,271 | | | 34,566 | |
| Data processing expense | 35,579 | | | 22,993 | | | 21,729 | |
| FDIC Insurance | 12,964 | | | 8,578 | | | 5,195 | |
| Advertising and promotion expense | 5,146 | | | 4,822 | | | 5,191 | |
| Amortization of intangibles | 28,931 | | | 2,952 | | | 3,292 | |
| Merger-related expenses | 56,867 | | | 7,826 | | | 4,128 | |
| Other operating expenses | 54,706 | | | 47,397 | | | 38,927 | |
| Total non-interest expense | 457,548 | | | 275,336 | | | 260,231 | |
| Income before income tax expense | 149,615 | | | 175,779 | | | 240,106 | |
| Income tax expense | 34,090 | | | 47,381 | | | 64,458 | |
| Net income | $ | 115,525 | | | $ | 128,398 | | | $ | 175,648 | |
| Basic earnings per share | $ | 1.05 | | | $ | 1.72 | | | $ | 2.35 | |
| Average basic shares outstanding | 109,668,911 | | | 74,844,489 | | | 74,700,623 | |
| Diluted earnings per share | $ | 1.05 | | | $ | 1.71 | | | $ | 2.35 | |
| Average diluted shares outstanding | 109,712,732 | | | 74,873,256 | | | 74,782,370 | |
See accompanying notes to consolidated financial statements.
PROVIDENT FINANCIAL SERVICES, INC. AND SUBSIDIARY
Consolidated Statements of Comprehensive Income
Years Ended December 31, 2024, 2023 and 2022
(Dollars in Thousands)
| | | | | | | | | | | | | | | | | |
| | Years ended December 31, |
| | 2024 | | 2023 | | 2022 |
| Net income | $ | 115,525 | | | $ | 128,398 | | | $ | 175,648 | |
| Other comprehensive income, net of tax: | | | | | |
| Unrealized gains and losses on available for sale debt securities: | | | | | |
| Net unrealized gains (losses) arising during the period | 7,841 | | | 32,125 | | | (186,361) | |
| Reclassification adjustment for losses (gains) included in net income | 2,087 | | | — | | | (42) | |
| Total | 9,928 | | | 32,125 | | | (186,403) | |
| | | | | |
| | | | | |
| | | | | |
| | | | | |
| Unrealized (losses) on derivatives designated as cash flow hedges: | | | | | |
| Net unrealized gains arising during the period | 3,179 | | | 2,388 | | | 19,201 | |
| Reclassification adjustment for gains included in net income | (9,557) | | | (12,948) | | | (3,297) | |
| Total | (6,378) | | | (10,560) | | | 15,904 | |
| Amortization related to post-retirement obligations | 2,210 | | | 2,365 | | | (1,409) | |
| Total other comprehensive income (loss), net of tax | 5,760 | | | 23,930 | | | (171,908) | |
| Total comprehensive income | $ | 121,285 | | | $ | 152,328 | | | $ | 3,740 | |
See accompanying notes to consolidated financial statements.
PROVIDENT FINANCIAL SERVICES, INC. AND SUBSIDIARY
Consolidated Statement of Changes in Stockholders’ Equity for the Years Ended December 31, 2024, 2023 and 2022
(Dollars in Thousands)
| | | | | | | | | | | | | | | | | | | | | | | | | | | | | | | | | | | | | | | | | | | | | | | | | | | | | |
| COMMON STOCK | | ADDITIONAL PAID-IN CAPITAL | | RETAINED EARNINGS | | ACCUMULATED OTHER COMPREHENSIVE INCOME | | TREASURY STOCK | | UNALLOCATED ESOP SHARES | | COMMON STOCK ACQUIRED BY DEFERRED COMP PLANS | | DEFERRED COMPENSATION PLANS | | TOTAL STOCKHOLDERS’ EQUITY |
| Balance as of December 31, 2021 | $ | 832 | | | $ | 969,815 | | | $ | 814,533 | | | $ | 6,863 | | | $ | (79,603) | | | $ | (15,344) | | | $ | (3,984) | | | $ | 3,984 | | | $ | 1,697,096 | |
| Net income | — | | | — | | | 175,648 | | | — | | | — | | | — | | | — | | | — | | | 175,648 | |
| Other comprehensive income, net of tax | — | | | — | | | — | | | (171,908) | | | — | | | — | | | — | | | — | | | (171,908) | |
| | | | | | | | | | | | | | | | | |
| Cash dividends paid ($0.96 per share) | — | | | — | | | (72,023) | | | — | | | — | | | — | | | — | | | — | | | (72,023) | |
| | | | | | | | | | | | | | | | | |
| Distributions from deferred comp plans | — | | | 176 | | | — | | | — | | | — | | | — | | | 557 | | | (557) | | | 176 | |
| Purchases of treasury stock | — | | | — | | | — | | | — | | | (46,530) | | | — | | | — | | | — | | | (46,530) | |
| Purchase of employee restricted shares to fund statutory tax withholding | — | | | — | | | — | | | — | | | (1,021) | | | — | | | — | | | — | | | (1,021) | |
| | | | | | | | | | | | | | | | | |
| | | | | | | | | | | | | | | | | |
| Option exercises | — | | | — | | | — | | | — | | | — | | | — | | | — | | | — | | | — | |
| Allocation of Employee Stock Ownership Plan ("ESOP") shares | — | | | 1,542 | | | — | | | — | | | — | | | 5,118 | | | — | | | — | | | 6,660 | |
| Allocation of Stock Award Plan ("SAP") shares | — | | | 9,407 | | | — | | | — | | | — | | | — | | | — | | | — | | | 9,407 | |
| Allocation of stock options | — | | | 198 | | | — | | | — | | | — | | | — | | | — | | | — | | | 198 | |
| Balance as of December 31, 2022 | $ | 832 | | | $ | 981,138 | | | $ | 918,158 | | | $ | (165,045) | | | $ | (127,154) | | | $ | (10,226) | | | $ | (3,427) | | | $ | 3,427 | | | $ | 1,597,703 | |
PROVIDENT FINANCIAL SERVICES, INC. AND SUBSIDIARY
Consolidated Statement of Changes in Stockholders’ Equity for the Years Ended December 31, 2024, 2023 and 2022 (Continued)
(Dollars in Thousands)
| | | | | | | | | | | | | | | | | | | | | | | | | | | | | | | | | | | | | | | | | | | | | | | | | | | | | |
| COMMON STOCK | | ADDITIONAL PAID-IN CAPITAL | | RETAINED EARNINGS | | ACCUMULATED OTHER COMPREHENSIVE INCOME (LOSS) | | TREASURY STOCK | | UNALLOCATED ESOP SHARES | | COMMON STOCK ACQUIRED BY DEFERRED COMP PLANS | | DEFERRED COMPENSATION PLANS | | TOTAL STOCKHOLDERS’ EQUITY |
| Balance as of December 31, 2022 | $ | 832 | | | $ | 981,138 | | | $ | 918,158 | | | $ | (165,045) | | | $ | (127,154) | | | $ | (10,226) | | | $ | (3,427) | | | $ | 3,427 | | | $ | 1,597,703 | |
| Net income | — | | | — | | | 128,398 | | | — | | | — | | | — | | | — | | | — | | | 128,398 | |
| Other comprehensive loss, net of tax | — | | | — | | | — | | | 23,930 | | | — | | | — | | | — | | | — | | | 23,930 | |
| Cumulative effect of adopting Accounting Standards Update ("ASU") No. 2022-02, net of tax | — | | | — | | | 433 | | | — | | | — | | | — | | | — | | | — | | | 433 | |
| Cash dividends paid ($0.96 per share) | — | | | — | | | (72,447) | | | — | | | — | | | — | | | — | | | — | | | (72,447) | |
| | | | | | | | | | | | | | | | | |
| | | | | | | | | | | | | | | | | |
| Distributions from deferred comp plans | — | | | 152 | | | — | | | — | | | — | | | — | | | 733 | | | (733) | | | 152 | |
| Purchases of treasury stock | — | | | — | | | — | | | — | | | — | | | — | | | — | | | — | | | — | |
| Purchase of employee restricted shares to fund statutory tax withholding | — | | | — | | | — | | | — | | | (1678) | | | — | | | — | | | — | | | (1,678) | |
| | | | | | | | | | | | | | | | | |
| | | | | | | | | | | | | | | | | |
| Option exercises | — | | | (217) | | | — | | | — | | | 1,007 | | | — | | | — | | | — | | | 790 | |
| Allocation of ESOP shares | — | | | 272 | | | — | | | — | | | — | | | 5,330 | | | — | | | — | | | 5,602 | |
| Allocation of SAP shares | — | | | 7,569 | | | — | | | — | | | — | | | — | | | — | | | — | | | 7,569 | |
| Allocation of stock options | — | | | 144 | | | — | | | — | | | — | | | — | | | — | | | — | | | 144 | |
| Balance as of December 31, 2023 | $ | 832 | | | $ | 989,058 | | | $ | 974,542 | | | $ | (141,115) | | | $ | (127,825) | | | $ | (4,896) | | | $ | (2,694) | | | $ | 2,694 | | | $ | 1,690,596 | |
PROVIDENT FINANCIAL SERVICES, INC. AND SUBSIDIARY
Consolidated Statement of Changes in Stockholders’ Equity for the Years Ended December 31, 2024, 2023 and 2022 (Continued)
(Dollars in Thousands)
| | | | | | | | | | | | | | | | | | | | | | | | | | | | | | | | | | | | | | | | | | | | | | | | | | | | | |
| COMMON STOCK | | ADDITIONAL PAID-IN CAPITAL | | RETAINED EARNINGS | | ACCUMULATED
OTHER
COMPREHENSIVE INCOME (LOSS) | | TREASURY STOCK | | UNALLOCATED ESOP SHARES | | COMMON STOCK ACQUIRED BY DEFERRED COMP PLANS | | DEFERRED COMPENSATION PLANS | | TOTAL STOCKHOLDERS’ EQUITY |
| Balance as of December 31, 2023 | $ | 832 | | | $ | 989,058 | | | $ | 974,542 | | | $ | (141,115) | | | $ | (127,825) | | | $ | (4,896) | | | $ | (2,694) | | | $ | 2,694 | | | $ | 1,690,596 | |
| Net income | — | | | — | | | 115,525 | | | — | | | — | | | — | | | — | | | — | | | 115,525 | |
| Other comprehensive loss, net of tax | — | | | — | | | — | | | 5,760 | | | — | | | — | | | — | | | — | | | 5,760 | |
| Cash dividends paid ($0.96 per share) | — | | | — | | | (100,956) | | | — | | | — | | | — | | | — | | | — | | | (100,956) | |
| | | | | | | | | | | | | | | | | |
| Distributions from deferred comp plans | — | | | 102 | | | — | | | — | | | — | | | — | | | 2,694 | | | (2,694) | | | 102 | |
| Reclass of stock award shares | — | | | (40,728) | | | — | | | — | | | 40,728 | | | — | | | — | | | — | | | — | |
| Purchase of employee restricted shares to fund statutory tax withholding | — | | | — | | | — | | | — | | | (1,323) | | | — | | | — | | | — | | | (1,323) | |
| | | | | | | | | | | | | | | | | |
| Shares issued due to acquisition | 544 | | | 876,234 | | | — | | | — | | | — | | | — | | | — | | | — | | | 876,778 | |
| Option exercises | — | | | — | | | — | | | — | | | — | | | — | | | — | | | — | | | — | |
| Allocation of ESOP shares | — | | | 235 | | | — | | | — | | | — | | | 4,896 | | | — | | | — | | | 5,131 | |
| Allocation of SAP shares | — | | | 9,517 | | | — | | | — | | | — | | | — | | | — | | | — | | | 9,517 | |
| Allocation of stock options | — | | | 77 | | | — | | | — | | | — | | | — | | | — | | | — | | | 77 | |
| Balance as of December 31, 2024 | $ | 1,376 | | | $ | 1,834,495 | | | $ | 989,111 | | | $ | (135,355) | | | $ | (88,420) | | | $ | — | | | $ | — | | | $ | — | | | $ | 2,601,207 | |
See accompanying notes to consolidated financial statements.
PROVIDENT FINANCIAL SERVICES, INC. AND SUBSIDIARY
Consolidated Statements of Cash Flows
Years Ended December 31, 2024, 2023 and 2022
(Dollars in Thousands)
| | | | | | | | | | | | | | | | | | | | | | | | | | | | | |
| | Years Ended December 31, | | | | | | | | | | | | |
| | 2024 | | 2023 | | 2022 | | | | | | | | | | | | |
| Cash flows from operating activities: | | | | | | | | | | | | | | | | | |
| Net income | $ | 115,525 | | | $ | 128,398 | | | $ | 175,648 | | | | | | | | | | | | | |
| Adjustments to reconcile net income to net cash provided by operating activities: | | | | | | | | | | | | | | | | | |
| Depreciation and amortization expense | 41,499 | | | 11,695 | | | 13,076 | | | | | | | | | | | | | |
| | | | | | | | | | | | | | | | | |
| Provision charge for credit losses | 87,564 | | | 28,168 | | | 5,004 | | | | | | | | | | | | | |
| | | | | | | | | | | | | | | | | |
| Deferred tax (benefit) expense | (12,271) | | | 2,725 | | | 2,220 | | | | | | | | | | | | | |
| Amortization of operating lease right-of-use assets | 13,088 | | | 10,495 | | | 10,617 | | | | | | | | | | | | | |
| Income on Bank-owned life insurance | (11,709) | | | (6,482) | | | (5,988) | | | | | | | | | | | | | |
| Net amortization of premiums and discounts on securities | 7,135 | | | 8,326 | | | 12,673 | | | | | | | | | | | | | |
| Accretion of net deferred loan fees | (7,201) | | | (8,724) | | | (9,262) | | | | | | | | | | | | | |
| Amortization of premiums on purchased loans, net | 314 | | | 206 | | | 270 | | | | | | | | | | | | | |
| Originations of loans held for sale | (70,045) | | | (19,371) | | | (22,295) | | | | | | | | | | | | | |
| Loans transferred to held for sale | 151,281 | | | — | | | — | | | | | | | | | | | | | |
| Proceeds from sales of loans originated for sale | 62,416 | | | 22,895 | | | 20,521 | | | | | | | | | | | | | |
| ESOP expense | 2,601 | | | 3,086 | | | 4,140 | | | | | | | | | | | | | |
| Allocation of stock award shares | 9,517 | | | 7,569 | | | 9,407 | | | | | | | | | | | | | |
| Allocation of stock options | 77 | | | 144 | | | 198 | | | | | | | | | | | | | |
| | | | | | | | | | | | | | | | | |
| Net gain on sale of loans | (1,758) | | | (2,019) | | | (1,515) | | | | | | | | | | | | | |
| Net loss (gain) on securities transactions | 2,986 | | | (30) | | | (181) | | | | | | | | | | | | | |
| | | | | | | | | | | | | | | | | |
| Net loss (gain) on sale of premises and equipment | — | | | 154 | | | (22) | | | | | | | | | | | | | |
| Net gain on sale of foreclosed assets | (214) | | | (2,854) | | | (8,541) | | | | | | | | | | | | | |
| | | | | | | | | | | | | | | | | |
| Net change in balance sheet: | | | | | | | | | | | | | | | | | |
| Increase in accrued interest receivable | (4,953) | | | (7,063) | | | (9,913) | | | | | | | | | | | | | |
| | | | | | | | | | | | | | | | | |
| Decrease (increase) in other assets | 23,214 | | | 25,085 | | | (56,291) | | | | | | | | | | | | | |
| Increase (decrease) in other liabilities | 17,315 | | | (29,007) | | | 60,544 | | | | | | | | | | | | | |
| Net cash provided by operating activities | 426,381 | | | 173,396 | | | 200,310 | | | | | | | | | | | | | |
| Cash flows from investing activities: | | | | | | | | | | | | | | | | | |
| Net increase in loans | (193,990) | | | (625,691) | | | (649,216) | | | | | | | | | | | | | |
| Proceeds from sales of loans held for investment | — | | | 2,017 | | | — | | | | | | | | | | | | | |
| Proceeds from sales of foreclosed assets | 708 | | | 4,340 | | | 16,155 | | | | | | | | | | | | | |
| Proceeds from maturities, calls and paydowns of investment securities held to maturity | 51,782 | | | 40,816 | | | 73,841 | | | | | | | | | | | | | |
| Purchases of investment securities held to maturity | (18,363) | | | (17,099) | | | (27,043) | | | | | | | | | | | | | |
| Proceeds from sales of securities available for sale | 566,942 | | | — | | | — | | | | | | | | | | | | | |
| Proceeds from maturities calls and paydowns of securities available for sale | 335,256 | | | 189,542 | | | 278,779 | | | | | | | | | | | | | |
| Purchases of securities available for sale | (403,999) | | | (40,089) | | | (290,426) | | | | | | | | | | | | | |
| | | | | | | | | | | | | | | | | |
| | | | | | | | | | | | | | | | | |
| Proceeds from redemption of Federal Home Loan Bank stock | 205,066 | | | 212,527 | | | 162,987 | | | | | | | | | | | | | |
| Purchases of Federal Home Loan Bank stock | (237,964) | | | (223,190) | | | (197,251) | | | | | | | | | | | | | |
| Cash received, net of cash consideration paid for acquisition | 194,548 | | | — | | | — | | | | | | | | | | | | | |
| BOLI claim benefits received | 8,995 | | | 3,873 | | | 970 | | | | | | | | | | | | | |
| Purchases of loans | — | | | (9,263) | | | (6,971) | | | | | | | | | | | | | |
| Proceeds from sales of premises and equipment | — | | | 105 | | | 22 | | | | | | | | | | | | | |
| Purchases of premises and equipment | (1,307) | | | (7,488) | | | (9,411) | | | | | | | | | | | | | |
| Net cash provided by (used in) investing activities | 507,674 | | | (469,600) | | | (647,564) | | | | | | | | | | | | | |
| Cash flows from financing activities: | | | | | | | | | | | | | | | | | |
| Net decrease in deposits | (291,625) | | | (270,510) | | | (670,988) | | | | | | | | | | | | | |
| (Decrease) increase in mortgage escrow deposits | (122) | | | 1,133 | | | 1,265 | | | | | | | | | | | | | |
| Purchase of treasury stock | — | | | — | | | (46,530) | | | | | | | | | | | | | |
| Purchase of employee restricted shares to fund statutory tax withholding | (1,323) | | | (1,678) | | | (1,021) | | | | | | | | | | | | | |
| Cash dividends paid to stockholders | (100,956) | | | (72,447) | | | (72,023) | | | | | | | | | | | | | |
| | | | | | | | | | | | | | | | | |
| Stock options exercised | — | | | 790 | | | — | | | | | | | | | | | | | |
| Proceeds from long-term borrowings | 635,900 | | | 534,807 | | | 3,982,100 | | | | | | | | | | | | | |
| Repayments of long-term borrowings | (1,390,028) | | | (58,443) | | | (3,252,556) | | | | | | | | | | | | | |
| Net increase (decrease) in short-term borrowings | 18,603 | | | 156,299 | | | (18,948) | | | | | | | | | | | | | |
| Proceeds from subordinated debentures | 221,180 | | | — | | | — | | | | | | | | | | | | | |
| Net cash (used in) provided by financing activities | (908,371) | | | 289,951 | | | (78,701) | | | | | | | | | | | | | |
| Net increase (decrease) in cash and cash equivalents | 25,684 | | | (6,253) | | | (525,955) | | | | | | | | | | | | | |
| Cash and cash equivalents at beginning of period | 180,185 | | | 186,438 | | | 685,163 | | | | | | | | | | | | | |
| Restricted cash at beginning of period | 70 | | | 70 | | | 27,300 | | | | | | | | | | | | | |
| Total cash, cash equivalents and restricted cash at beginning of period | 180,255 | | | 186,508 | | | 712,463 | | | | | | | | | | | | | |
| Cash and cash equivalents at end of period | 205,869 | | | 180,185 | | | 186,438 | | | | | | | | | | | | | |
| Restricted cash at end of period | 70 | | | 70 | | | 70 | | | | | | | | | | | | | |
| Total cash, cash equivalents and restricted cash at end of period | $ | 205,939 | | | 180,255 | | | 186,508 | | | | | | | | | | | | | |
| Cash paid during the period for: | | | | | | | | | | | | | | | | | |
| Interest on deposits and borrowings | $ | 397,282 | | | 210,345 | | | 46,896 | | | | | | | | | | | | | |
| Income taxes | $ | 36,184 | | | 46,461 | | | 51,050 | | | | | | | | | | | | | |
| Non cash investing activities: | | | | | | | | | | | | | | | | | |
| Initial recognition of operating lease right-of-use assets | $ | 14,742 | | | — | | | — | | | | | | | | | | | | | |
| Initial recognition of operating lease liabilities | $ | 14,742 | | | — | | | — | | | | | | | | | | | | | |
| Transfer of loans receivable to foreclosed assets | $ | — | | | 15,131 | | | 1,208 | | | | | | | | | | | | | |
| Acquisitions: | | | | | | | | | | | | | | | | | |
| Non-cash assets acquired at fair value: | | | | | | | | | | | | | | | | | |
| Investment securities | $ | 1,632,106 | | | — | | | — | | | | | | | | | | | | | |
| Loans held for sale | 1,494 | | | — | | | — | | | | | | | | | | | | | |
| Loans held for investment | 7,889,138 | | | — | | | — | | | | | | | | | | | | | |
| Bank-owned life insurance | 160,646 | | | — | | | — | | | | | | | | | | | | | |
| Goodwill and other intangible assets | 390,361 | | | — | | | — | | | | | | | | | | | | | |
| Bank premises and equipment | 60,578 | | | — | | | — | | | | | | | | | | | | | |
| Other assets | 263,722 | | | — | | | — | | | | | | | | | | | | | |
| Total non-cash assets acquired at fair value | $ | 10,398,045 | | | — | | | — | | | | | | | | | | | | | |
| | | | | | | | | | | | | | | | | |
| Liabilities assumed: | | | | | | | | | | | | | | | | | |
| Deposits | 8,622,924 | | | — | | | — | | | | | | | | | | | | | |
| Borrowings and subordinated debt | 785,927 | | | — | | | — | | | | | | | | | | | | | |
| Subordinated debentures | 166,366 | | | — | | | — | | | | | | | | | | | | | |
| Other liabilities | 140,598 | | | — | | | — | | | | | | | | | | | | | |
| Total liabilities assumed | $ | 9,715,815 | | | — | | | — | | | | | | | | | | | | | |
| | | | | | | | | | | | | | | | | |
| Common stock issued for acquisitions | $ | 876,779 | | | $ | — | | | — | | | | | | | | | | | | | |
| | | | | | | | | | | | | | | | | |
| | | | | | | | | | | | | | | | | |
| | | | | | | | | | | | | | | | | |
| | | | | | | | | | | | | | | | | |
| | | | | | | | | | | | | | | | | |
| | | | | | | | | | | | | | | | | |
| | | | | | | | | | | | | | | | | |
| | | | | | | | | | | | | | | | | |
| | | | | | | | | | | | | | | | | |
| | | | | | | | | | | | | | | | | |
| | | | | | | | | | | | | | | | | |
| | | | | | | | | | | | | | | | | |
| | | | | | | | | | | | | | | | | |
See accompanying notes to consolidated financial statements.
PROVIDENT FINANCIAL SERVICES, INC. AND SUBSIDIARY
NOTES TO CONSOLIDATED FINANCIAL STATEMENTS
(1) Summary of Significant Accounting Policies
Principles of Consolidation
The consolidated financial statements include the accounts of Provident Financial Services, Inc. (the “Company”), Provident Bank (the “Bank”) and their wholly owned subsidiaries. All intercompany balances and transactions have been eliminated in consolidation. Certain reclassifications have been made in the consolidated financial statements to conform with current year classifications.
Business
The Company, through the Bank, provides a full range of banking services to individual and business customers through branch offices in New Jersey, Queens and Nassau Counties, New York and eastern Pennsylvania. The Bank is subject to competition from other financial institutions and to the regulations of certain federal and state agencies, and undergoes periodic examinations by those regulatory authorities.
Basis of Financial Statement Presentation
The consolidated financial statements of the Company have been prepared in conformity with U.S. generally accepted accounting principles (“GAAP”). In preparing the consolidated financial statements, management is required to make estimates and assumptions about future events. These estimates and the underlying assumptions affect the reported amounts of assets and liabilities and disclosures about contingent assets and liabilities as of the dates of the consolidated statements of financial condition, and revenues and expenses for the periods then ended. Such estimates are used in connection with the determination of the allowance for credit losses, evaluation of goodwill for impairment, evaluation of the need for valuation allowances on deferred tax assets, determination of liabilities related to retirement and other post-retirement benefits, and valuation estimates of assets acquired and liabilities assumed in connection with the merger with Lakeland, among others. These estimates and assumptions are based on management’s best estimates and judgment. Management evaluates its estimates and assumptions on an ongoing basis using historical experience and other factors, including the currently forecasted economic environment, which management believes to be reasonable under the circumstances. Such estimates and assumptions are adjusted when facts and circumstances dictate. As future events and their effects cannot be determined with precision, actual results could differ significantly from these estimates. Changes in estimates will be reflected in the financial statements in future periods.
Segment Reporting
We conduct our operations through a single business segment. Substantially all of our interest and fees on loans and long-lived assets relate to our operations. Pursuant to FASB ASC 280, Segment Reporting, operating segments represent components of an enterprise for which separate financial information is available that is regularly evaluated by the chief operating decision maker in determining how to allocate resources and in assessing performance. The chief operating decision maker uses a variety of measures to assess the performance of the business as a whole, depending on the nature of the activity. The Company generates revenue from several business channels. Those streams are organized by the types of partners we work with to reach our customers, with success principally measured based on interest and fees on loans, loan receivables, active accounts and other sales metrics. Detailed profitability information of the nature that could be used to allocate resources and assess the performance and operations for each sales platform individually, however, is not used by our chief operating decision maker. Expense activities, including funding costs, credit losses and operating expenses, are not measured for each platform but instead are managed for the Company as a whole.
Cash and Cash Equivalents
For purposes of reporting cash flows, cash and cash equivalents include cash and due from banks, Federal funds sold and commercial paper with original maturity dates less than 90 days.
Securities
Securities include held to maturity debt securities and available for sale debt securities. The available for sale debt securities portfolio is carried at estimated fair value, with any unrealized gains or losses, net of taxes, reported as accumulated
other comprehensive income or loss in Stockholders’ Equity. Estimated fair values are provided by reputable and widely used pricing services who maintain pricing methodologies appropriate for varying security classes using valuation techniques that are in accordance with GAAP. Securities which the Company has the positive intent and ability to hold to maturity are classified as held to maturity debt securities and carried at amortized cost.
On January 1, 2020, the Company adopted the current expected credit loss ("CECL") methodology which replaces the incurred loss methodology with an expected loss methodology. Management measures expected credit losses on held to maturity debt securities on a collective basis by security type. Management classifies the held to maturity debt securities portfolio into the following security types:
•Government-agency obligations;
•Mortgage-backed securities;
•State and municipal obligations; and
•Corporate obligations.
All of the agency obligations held by the Company are issued by U.S. government entities and agencies. These securities are either explicitly or implicitly guaranteed by the U.S. government, are highly rated by major rating agencies and have a long history of no credit losses. The majority of the state and municipal and corporate obligations carry credit ratings from the rating
agencies as of December 31, 2024 that were no lower than an A rating and the Company had no securities rated BBB or worse
by Moody’s Ratings ("Moody's").
Premiums on securities are amortized into income using a method that approximates the interest method over the remaining period to the earliest call date or contractual maturity, adjusted for anticipated prepayments. Discounts on securities are accreted into income over the remaining period to the contractual maturity, adjusted for anticipated prepayments. Interest income is recognized on an accrual basis, while dividend income is recognized when earned. Realized gains and losses are recognized when securities are sold or called based on the specific identification method. Accrued interest receivable on held to maturity debt securities are excluded from the estimate of credit losses. See Notes 3 and 4 for additional information on investment securities.
Equity Securities
The Company holds equity securities that are traded in active markets with readily determinable fair value using quoted market prices.
Fair Value of Financial Instruments
GAAP establishes a fair value hierarchy that prioritizes the inputs to valuation techniques used to measure fair value. The hierarchy gives the highest priority to unadjusted quoted prices in active markets for identical assets or liabilities (level 1 measurements) and the lowest priority to unobservable inputs (level 3 measurements). A financial instrument’s level within the fair value hierarchy is based on the lowest level of input that is significant to the fair value measurement.
Federal Home Loan Bank of New York Stock
The Bank, as a member of the Federal Home Loan Bank of New York (“FHLBNY”), is required to hold shares of capital stock of the FHLBNY at cost based on a specified formula. The Bank carries this investment at cost, which approximates fair value.
Loans
Loans receivable are carried at unpaid principal balances plus unamortized premiums, purchase accounting mark-to-market adjustments and certain deferred loan origination costs, less certain deferred direct loan origination fees, unaccreted discounts, and the allowance for credit losses.
The Bank defers loan origination fees and certain direct loan origination costs and accretes or amortizes such amounts as an adjustment to the yield over the contractual lives of the related loans using the interest method. Premiums and discounts, purchase accounting mark-to-market adjustments on loans purchased are amortized or accreted as an adjustment of yield over the contractual lives of the related loans, adjusted for prepayments when applicable, using the effective interest method.
Loans are generally placed on non-accrual status when they are past due 90 days or more as to contractual obligations or when other circumstances indicate that collection is questionable. When a loan is placed on non-accrual status, any interest accrued but not received is reversed against interest income. Payments received on a non-accrual loan are either applied to the outstanding principal balance or recorded as interest income, depending on an assessment of the ability to collect the loan. A non-accrual loan is restored to accrual status when principal and interest payments become less than 90 days past due and its future collectability is reasonably assured.
An impaired loan is defined as a loan for which it is probable, based on current information, that the Bank will not collect all amounts due under the contractual terms of the loan agreement. Impaired loans are individually assessed to determine that each loan’s carrying value is not in excess of the fair value of the related collateral or the present value of the expected future cash flows. Residential mortgage and consumer loans are deemed smaller balance homogeneous loans which are evaluated collectively for impairment and are therefore excluded from the population of impaired loans.
Purchased credit deteriorated (“PCD”) loans are loans acquired that have experienced more-than-insignificant deterioration in credit quality since origination.
Allowance for Credit Losses on Loans
On January 1, 2020, the Company adopted ASU 2016-13, "Measurement of Credit Losses on Financial Instruments,” which replaced the incurred loss methodology with the CECL methodology. The allowance for credit losses is a valuation account that reflects management’s evaluation of the current expected credit losses in the loan portfolio. The Company maintains the allowance for credit losses through provisions for credit losses that are charged to income. Charge-offs against the allowance for credit losses are taken on loans where management determines that the collection of loan principal and interest is unlikely. Recoveries made on loans that have been charged-off are credited to the allowance for credit losses.
The allowance for credit losses is a valuation account that reflects management’s evaluation of the current expected credit losses in the loan portfolio. The Company maintains the allowance for credit losses through provisions for credit losses that are charged to income. Charge-offs against the allowance for credit losses are taken on loans where management determines that the collection of loan principal and interest is unlikely. Recoveries made on loans that have been charged-off are credited to the allowance for credit losses.
The calculation of the allowance for credit losses is a critical accounting policy of the Company. Management estimates the allowance using relevant available information, from internal and external sources, related to past events, current conditions, and a reasonable and supportable forecast. Historical credit loss experience for both the Company and peers provides the basis for the estimation of expected credit losses, where observed credit losses are converted to probability of default rate (“PDR”) curves through the use of segment-specific loss given default (“LGD”) risk factors that convert default rates to loss severity based on industry-level, observed relationships between the two variables for each segment, primarily due to the nature of the underlying collateral. These risk factors were assessed for reasonableness against the Company’s own loss experience and adjusted in certain cases when the relationship between the Company’s historical default and loss severity deviate from that of the wider industry. The historical PDR curves, together with corresponding economic conditions, establish a quantitative relationship between economic conditions and loan performance through an economic cycle.
Using the historical relationship between economic conditions and loan performance, management’s expectation of future loan performance is incorporated using an externally developed economic forecast. This forecast is applied over a period that management has determined to be reasonable and supportable. Beyond the period over which management can develop or source a reasonable and supportable forecast, the model will revert to long-term average economic conditions using a straight-line, time-based methodology. The Company's current forecast period is six quarters, with a four-quarter reversion period to historical average macroeconomic factors. The Company's economic forecast is approved by the Company's ACL Committee.
The allowance for credit losses is measured on a collective (pool) basis, with both a quantitative and qualitative analysis that is applied on a quarterly basis, when similar risk characteristics exist. The respective quantitative allowance for each loan segment is measured using an econometric, discounted PDR/LGD modeling methodology in which distinct, segment-specific multi-variate regression models are applied to an external economic forecast. Under the discounted cash flows methodology, expected credit losses are estimated over the effective life of the loans by measuring the difference between the net present value of modeled cash flows and amortized cost basis. Contractual cash flows over the contractual life of the loans are the basis for modeled cash flows, adjusted for modeled defaults and expected prepayments and discounted at the loan-level effective interest rate. The contractual term excludes expected extensions, renewals and modifications unless either of the following applies at the reporting date: management has a reasonable expectation that a modification will be executed with an individual
borrower; or when an extension or renewal option is included in the original contract and is not unconditionally cancellable by the Company. Management will assess the likelihood of the option being exercised by the borrower and appropriately extend the maturity for modeling purposes.
The Company considers qualitative adjustments to credit loss estimates for information not already captured in the quantitative component of the loss estimation process. Qualitative factors are based on portfolio concentration levels, model imprecision, changes in industry conditions, changes in the Company’s loan review process, changes in the Company’s loan policies and procedures, and economic forecast uncertainty.
One of the most significant judgments involved in estimating the Company’s allowance for credit losses on loans relates to the macroeconomic forecasts used to estimate expected credit losses over the forecast period. As of December 31, 2024, the model incorporated Moody’s baseline economic forecast, as adjusted for qualitative factors, as well as an extensive review of classified loans and loans that were classified as impaired with a specific reserve assigned to those loans. The allowance estimation process resulted in a total provision on loans of $83.6 million for the year ended December 31, 2024, and an overall coverage ratio of 104 basis points. Of the $83.6 million provision for the year, $60.1 million was recorded as part of the Lakeland merger in accordance with GAAP requirements for accounting for business combinations. Management believes the allowance for credit losses accurately represents the estimated inherent losses, factoring in the qualitative adjustment and other assumptions, including the selection of the baseline forecast within the model. If the Company used a more severe outlook, the provision would have risen by approximately $16.0 million, leading to an overall coverage ratio of approximately 112 basis points.
Portfolio segment is defined as the level at which an entity develops and documents a systematic methodology to determine its allowance for credit losses. Management developed segments for estimating loss based on type of borrower and collateral which is generally based upon federal call report segmentation. The segments have been combined or sub-segmented as needed to ensure loans of similar risk profiles are appropriately pooled. As of December 31, 2024, the portfolio and class segments for the Company’s loan portfolio were:
•Mortgage Loans – Residential, Commercial Real Estate, Multi-Family and Construction
•Commercial Loans – Commercial Owner-Occupied and Commercial Non-Owner Occupied
•Consumer Loans – First Lien Home Equity and Other Consumer
The allowance for credit losses on loans individually evaluated for impairment is based upon loans that have been identified through the Company’s normal loan monitoring process. This process includes the review of delinquent and problem loans at the Company’s Delinquency, Credit, Credit Risk Management and Allowance Committees; or which may be identified through the Company’s loan review process. Generally, the Company only evaluates loans individually for impairment if the loan is non-accrual, non-homogeneous and the balance is greater than $1.0 million. In instances where the loan is under $1.0 million, but part of a relationship over $1.0 million, all loans in the relationship would be evaluated individually for impairment.
For all classes of loans deemed collateral-dependent, the Company estimates expected credit losses based on the fair value of the collateral less any selling costs. If the loan is not collateral dependent, the allowance for credit losses related to individually assessed loans is based on discounted expected cash flows using the loan’s initial effective interest rate.
For loans acquired that have experienced more-than-insignificant deterioration in credit quality since their origination are considered PCD loans. The Company evaluates acquired loans for deterioration in credit quality based on any of, but not limited to, the following: (1) non-accrual status; (2) modification designation; (3) risk ratings of special mention, substandard or doubtful; (4) watchlist credits; and (5) delinquency status, including loans that are current on acquisition date, but had been previously delinquent. At the acquisition date, an estimate of expected credit losses is made for groups of PCD loans with similar risk characteristics and individual PCD loans without similar risk characteristics. Subsequent to the acquisition date, the initial allowance for credit losses on PCD loans will increase or decrease based on future evaluations, with changes recognized in the provision for credit losses.
Management believes the primary risks inherent in the portfolio are a general decline in the economy, a decline in real estate market values, rising unemployment or a protracted period of elevated unemployment, increasing vacancy rates in commercial investment properties and possible increases in interest rates in the absence of economic improvement. Any one or a combination of these events may adversely affect borrowers’ ability to repay the loans, resulting in increased delinquencies, credit losses and higher levels of provisions. Management considers it important to maintain the ratio of the allowance for
credit losses to total loans at an acceptable level given current and forecasted economic conditions, interest rates and the composition of the portfolio.
The CECL approach to calculate the allowance for credit losses on loans is significantly influenced by the composition, characteristics, and quality of the Company’s loan portfolio, as well as the prevailing economic conditions and forecast utilized. Material changes to these and other relevant factors creates greater volatility to the allowance for credit losses, and therefore, greater volatility to the Company’s reported earnings. Although management believes that the Company has established and maintained the allowance for credit losses at appropriate levels, additions may be necessary if future economic and other conditions differ substantially from the current operating environment and economic forecast. Management evaluates its estimates and assumptions on an ongoing basis giving consideration to forecasted economic factors, historical loss experience and other factors. The model includes both quantitative and qualitative components. Such estimates and assumptions are adjusted when facts and circumstances dictate. As future events and their effects cannot be determined with precision, actual results could differ significantly from these estimates. Changes in estimates resulting from continuing changes in the economic environment will be reflected in the financial statements in future periods, and to the extent actual losses are higher than management estimates, additional provision for credit losses on loans could be required and could adversely affect our earnings or financial position in future periods. In addition, various regulatory agencies periodically review the adequacy of the Company’s allowance for credit losses as an integral part of their examination process. Such agencies may require the Company to recognize additions to the allowance or additional write-downs based on their judgments about information available to them at the time of their examination. Although management uses the best information available, the level of the allowance for credit losses remains an estimate that is subject to significant judgment and short-term volatility. See Note 5 to the Consolidated Financial Statements for more information on the allowance for credit losses on loans.
Material changes to these and other relevant factors creates greater volatility to the allowance for credit losses, and therefore, greater volatility to the Company’s reported earnings. For the year ended December 31, 2024, the increase in provision was primarily attributable to an initial CECL provision for credit losses on loans of $60.1 million recorded as part of the Lakeland merger in accordance with GAAP requirements for accounting for business combinations, combined with some economic forecast deterioration over the current twelve-month period within our CECL model, compared to last year.
Foreclosed Assets
Assets acquired through foreclosure or deed in lieu of foreclosure are carried at the lower of the outstanding loan balance at the time of foreclosure or fair value, less estimated costs to sell. Fair value is generally based on recent appraisals. When an asset is acquired, the excess of the loan balance over fair value, less estimated costs to sell, is charged to the allowance for credit losses. A reserve for foreclosed assets may be established to provide for possible write-downs and selling costs that occur subsequent to foreclosure. Foreclosed assets are carried net of the related reserve. Operating results from real estate owned, including rental income, operating expenses, and gains and losses realized from the sales of real estate owned, are recorded as incurred.
Banking Premises and Equipment
Land is carried at cost. Banking premises, furniture, fixtures and equipment are carried at cost, less accumulated depreciation, computed using the straight-line method based on their estimated useful lives. Leasehold improvements, carried at cost, net of accumulated depreciation, are amortized over the terms of the leases or the estimated useful lives of the assets, whichever are shorter, using the straight-line method. Maintenance and repairs are charged to expense as incurred.
Income Taxes
The Company uses the asset and liability method of accounting for income taxes. Under this method, deferred tax assets and liabilities are recognized for the estimated future tax consequences attributable to differences between the financial statement carrying amounts of existing assets and liabilities and their respective tax bases. Deferred tax assets and liabilities are measured using enacted tax rates in effect for the year in which those temporary differences are expected to be recovered or settled. The effect on deferred tax assets and liabilities of a change in tax rates is recognized in tax expense in the period that includes the enactment date. Deferred tax assets and liabilities are reported as a component of Other Assets on the Consolidated Statements of Financial Condition. The determination of whether deferred tax assets will be realizable is predicated on estimates of future taxable income. Such estimates are subject to management’s judgment. A valuation reserve is established when management is unable to conclude that it is more likely than not that it will realize deferred tax assets based on the nature
and timing of these items. The Company recognizes, when applicable, interest and penalties related to unrecognized tax benefits in the provision for income taxes.
Trust Assets
Trust assets consisting of securities and other property (other than cash on deposit held by the Bank in fiduciary or agency capacities for customers of the Bank’s wholly owned subsidiary, Beacon) are not included in the accompanying consolidated statements of financial condition because such properties are not assets of the Bank.
Intangible Assets
Intangible assets of the Bank consist of goodwill, core deposit premiums, customer relationship premium and mortgage servicing rights. Goodwill represents the excess of the purchase price over the estimated fair value of identifiable net assets acquired through purchase acquisitions. In accordance with GAAP, goodwill with an indefinite useful life is not amortized, but is evaluated for impairment on an annual basis, or more frequently if events or changes in circumstances indicate potential impairment between annual measurement dates. As permitted by GAAP, the Company prepares a qualitative assessment in determining whether goodwill may be impaired. The factors considered in the assessment include macroeconomic conditions, industry and market conditions and overall financial performance of the Company, including share price, among others. The Company completed its annual qualitative assessment of goodwill as of July 1, 2024. Based upon its assessment of goodwill, the Company concluded that no further quantitative analysis was warranted.
Core deposit premiums represent the intangible value of depositor relationships assumed in previous purchase acquisitions and are amortized on an accelerated basis over 8.8 years, while the core deposit premiums related to SB One and Lakeland are amortized over its estimated useful life of 10.0 years. Customer relationship premiums represent the intangible value of customer relationships assumed in the purchase acquisitions of Beacon Trust Company, The MDE Group, Inc., Tirschwell & Loewy, Inc., and SB One Bank and are amortized on an accelerated basis over 12.0 years, 10.4 years, 10.0 years, and 13.0 years, respectively. Mortgage servicing rights are recorded when purchased or when originated mortgage loans are sold, with servicing rights retained. Mortgage servicing rights are amortized on an accelerated method based upon the estimated lives of the related loans, adjusted for prepayments. Mortgage servicing rights are carried at the lower of amortized cost or fair value.
Bank-owned Life Insurance
Bank-owned life insurance is accounted for using the cash surrender value method and is recorded at its realizable value.
Employee Benefit Plans
The Bank maintains a pension plan which covers full-time employees hired prior to April 1, 2003, the date on which the pension plan was frozen. The Bank’s policy is to fund at least the minimum contribution required by the Employee Retirement Income Security Act of 1974. GAAP requires an employer to: (a) recognize in its statement of financial condition the over-funded or under-funded status of a defined benefit post-retirement plan measured as the difference between the fair value of plan assets and the benefit obligation; (b) measure a plan’s assets and its obligations that determine its funded status at the end of the employer’s fiscal year (with limited exceptions); and (c) recognize as a component of other comprehensive income, net of tax, the actuarial gains and losses and the prior service costs and credits that arise during the period.
The Bank has a 401(k) plan, and in connection with the merger with Lakeland assumed the Lakeland Bancorp, Inc. Salary Savings 401(k) and Trust Plan, both of which cover substantially all employees of the Bank. The Bank may provide a matching contribution to eligible participants. The Bank’s matching contribution, if any, is determined by the board of directors in its sole discretion. In 2024, the board of directors approved a matching contribution of 25% of the first 6% of eligible compensation contributed by participants in the Provident Bank 401(k) plan.
The Bank has an Employee Stock Ownership Plan (“ESOP”). The funds borrowed by the ESOP from the Company to purchase the Company’s common stock are being repaid from the Bank’s contributions and dividends paid on unallocated ESOP shares over a period of up to 30 years. The Company’s common stock not allocated to participants is recorded as a reduction of stockholders’ equity at cost. Compensation expense for the ESOP is based on the average price of the Company’s stock during each quarter and the amount of shares allocated during the quarter. The Bank made the final repayment on borrowed funds in December 2024 and a final allocation of shares will be made to participants.
The Bank has an Equity Plan designed to provide competitive compensation for demonstrated performance and to align the interests of participants directly to increases in shareholder value. The Equity Plan provides for performance-vesting grants as well as time-vesting grants. Time-vesting stock awards, stock options and performance vesting stock awards that are based on a performance condition, such as return on average assets, are valued on the closing stock price on the date of grant. Performance-vesting stock awards and options that are based on a market condition, such as total shareholder return, would be valued using a generally accepted statistical technique to simulate future stock prices for the Bank and the components of the peer group which the Bank would be measured against.
Expense related to time-vesting stock awards and stock options is based on the fair value of the common stock on the date of the grant and on the fair value of the stock options on the date of the grant, respectively, and is recognized ratably over the vesting period of the awards. Performance vesting stock awards and stock options are either dependent upon a market condition or a performance condition. A market condition performance metric is tied to a stock price, either on an absolute basis, or a relative basis against peers, while a performance-condition is based on internal operations, such as earnings per share. The expense related to a market condition performance-vesting stock award or stock option requires an initial Monte Carlo simulation to determine grant date fair value, which will be recognized as a compensation expense regardless of actual payout, assuming that the executive is still employed at the end of the requisite service period. If pre-vesting termination (forfeiture) occurs, then any expense recognized to date can be reversed. The grant date fair value is recognized ratably over the performance period. The expense related to a performance condition stock award or stock option is based on the fair value of the award on the date of grant, adjusted periodically based upon the number of awards or options expected to be earned, recognized over the performance period.
In connection with the First Sentinel acquisition in July 2004, the Company assumed the First Savings Bank Directors’ Deferred Fee Plan (the “DDFP”). The DDFP was frozen prior to the acquisition. The Company recorded a deferred compensation equity instrument and corresponding contra-equity account for the value of the shares held by the DDFP at the July 14, 2004 acquisition date. Effective November 1, 2023, the DDFP was terminated and final distributions were made on or about November 1, 2024. As of December 31, 2024, there were no shares held by the DDFP.
The Bank maintains a non-qualified plan that provides supplemental benefits to certain executives who are prevented from receiving the full benefits contemplated by the 401(k) Plan’s and the ESOP’s benefit formulas under tax law limits for tax-qualified plans. In addition, and in connection with the merger with Lakeland, the Bank assumed the Lakeland Bancorp, Inc. Elective Deferral Plan (“LEDP”). The LEDP was frozen effective December 31, 2024 and effective January 1, 2025, the board of directors approved the Provident Bank Non-Qualified Supplemental DC Plan, to allow certain Bank executives to defer a portion of their compensation.
Post-retirement Benefits Other Than Pensions
The Bank provides post-retirement health care and life insurance plans to certain of its employees. The life insurance coverage is noncontributory to the participant. Participants contribute to the cost of medical coverage based on the employee’s length of service with the Bank. The costs of such benefits are accrued based on actuarial assumptions from the date of hire to the date the employee is fully eligible to receive the benefits. On December 31, 2002, the Bank eliminated post-retirement healthcare benefits for employees with less than 10 years of service. GAAP requires an employer to: (a) recognize in its statement of financial condition the over-funded or under-funded status of a defined benefit post-retirement plan measured as the difference between the fair value of plan assets and the benefit obligation; (b) measure a plan’s assets and its obligations that determine its funded status as of the end of the employer’s fiscal year (with limited exceptions); and (c) recognize as a component of other comprehensive income, net of tax, the actuarial gains and losses and the prior service costs and credits that arise during the period.
Derivatives
The Company records all derivatives on the statements of financial condition at fair value. The accounting for changes in the fair value of derivatives depends on the intended use of the derivative, whether the Company has elected to designate a derivative in a hedging relationship and apply hedge accounting and whether the hedging relationship has satisfied the criteria necessary to apply hedge accounting. The Company has interest rate derivatives resulting from a service provided to certain qualified borrowers in a loan related transaction which, therefore, are not used to manage interest rate risk in the Company’s assets or liabilities. As such, all changes in fair value of the Company’s derivatives are recognized directly in earnings.
The Company also uses interest rate swaps as part of its interest rate risk management strategy. Interest rate swaps designated as cash flow hedges, and which satisfy hedge accounting requirements, involve the receipt of variable amounts from a counterparty in exchange for the Company making fixed-rate payments over the life of the agreements without the exchange of the underlying notional amount. These derivatives were used to hedge the variable cash outflows associated with FHLBNY borrowings and brokered demand deposits. The change in the fair value of these derivatives is recorded in accumulated other comprehensive income, and is subsequently reclassified into earnings in the period that the hedged forecasted transaction affects earnings.
Comprehensive Income
Comprehensive income is divided into net income and other comprehensive income (loss). Other comprehensive income (loss) includes items previously recorded directly to equity, such as unrealized gains and losses on available for sale debt securities, unrealized gains and losses on derivatives that are designated as cash flow hedges and amortization related to post-retirement obligations. Comprehensive income is presented in a separate Consolidated Statement of Comprehensive Income.
Earnings Per Share
Basic earnings per share is computed by dividing income available to common stockholders by the weighted average number of shares outstanding for the period. Diluted earnings per share reflects the potential dilution that could occur if securities or other contracts to issue common stock (such as stock options) were exercised or resulted in the issuance of common stock. These potentially dilutive shares would then be included in the weighted average number of shares outstanding for the period using the treasury stock method. Shares issued and shares reacquired during the period are weighted for the portion of the period that they were outstanding.
Impact of Recent Accounting Pronouncements
Accounting Pronouncements Adopted in 2024
In November 2023, FASB issued ASU No. 2023-07, "Segment Reporting (Topic 280): Improvements to Reportable Segment Disclosures”. The amendments in this ASU require public entities to disclose detailed information about a reportable segment’s expenses on both an annual and interim basis. ASU No. 2023-07 is effective for fiscal years beginning after December 15, 2023 and interim periods within fiscal years beginning after December 15, 2024, with early adoption in the interim period permitted. The amendments in ASU No. 2023-07 should be applied retrospectively to all periods presented in the financial statements. Upon transition, the segment expense categories and amounts disclosed in the prior periods should be based on the significant segment expense categories identified and disclosed in the period of adoption. The adoption of ASU No. 2023-07 did not have a significant impact on the Company's consolidated financial statements, other than enhanced disclosures.
Accounting Pronouncements Not Yet Adopted
In December 2023, FASB issued ASU 2023-09, “Income Taxes (Topic 740): Improvements to Income Tax Disclosures”. The amendments in this ASU require improved annual income tax disclosures surrounding rate reconciliation, income taxes paid, and other disclosures. This update will be effective for financial statements issued for fiscal years beginning after December 15, 2024, with early adoption in the interim period permitted. The Company does not expect the adoption of this guidance to have a significant impact on the Company’s consolidated financial statements.
In November 2024, FASB issued ASU 2024-03, "Income Statement – Reporting Comprehensive Income – Expense Disaggregation Disclosures". This ASU requires disaggregated information about certain income statement line items in a tabular format in the notes to the financial statements. This update will be effective for financial statements issued for fiscal years beginning after December 15, 2026, with early adoption in the interim period permitted. The Company does not expect the adoption of this guidance to have a significant impact on the Company’s consolidated financial statements.
(2) Business Combinations
Lakeland Bancorp, Inc. Merger Agreement
On May 16, 2024, the Company completed its merger with Lakeland Bancorp, Inc. ("Lakeland"), which added $10.59 billion to total assets, $7.91 billion to total loans, $8.62 billion to total deposits and 68 full-service banking offices in
New Jersey and New York. The Company closed 13 of the acquired Lakeland banking offices and nine legacy Bank branches in the third quarter of 2024 due to geographic overlap.
Under the merger agreement, each share of Lakeland common stock was converted into the right to receive 0.8319 shares of the Company's common stock, a total of 54,356,954 shares converted, plus cash in lieu of fractional shares. The total consideration paid for the acquisition of Lakeland was $876.8 million. In connection with the acquisition, Lakeland Bank, a wholly owned subsidiary of Lakeland, was merged with and into the Bank.
The acquisition was accounted for under the acquisition method of accounting. Under this method of accounting, the purchase price has been allocated to the respective assets acquired and liabilities assumed based upon their estimated fair values, net of tax. The excess of consideration paid over the estimated fair value of the net assets acquired initially totaled $190.9 million and was recorded as goodwill. In accordance with ASC 805, the Company recorded a measurement period adjustment and decreased goodwill by $10.5 million related to finalizing the valuation. After this adjustment, goodwill totaled $180.4 million.
The following table summarizes the estimated fair values of the assets acquired and the liabilities assumed at the merger date, net of cash consideration paid (in thousands):
| | | | | | | | |
| | As of May 16, 2024 |
| Assets acquired: | | |
| Cash and cash equivalents, net | | $ | 194,548 | |
| Available for sale debt securities | | 1,585,993 | |
| | |
| Federal Home Loan Bank stock | | 46,113 | |
| Loans held for sale | | 1,494 | |
| Loans held for investment | | 7,906,326 | |
| Allowance for credit losses on PCD loans | | (17,188) | |
| Loans, net | | 7,889,138 | |
| Bank-owned life insurance | | 160,646 | |
| Banking premises and equipment | | 60,578 | |
| Accrued interest receivable | | 27,241 | |
| Goodwill | | 180,446 | |
| Other intangibles assets | | 209,915 | |
| | |
| Other assets | | 236,481 | |
| Total assets acquired | | $ | 10,592,593 | |
| | |
| Liabilities assumed: | | |
| Deposits | | $ | 8,622,924 | |
| Mortgage escrow deposits | | 5,532 | |
| Borrowed funds | | 785,927 | |
| Subordinated debentures | | 166,366 | |
| Other liabilities | | 135,066 | |
| Total liabilities assumed | | $ | 9,715,815 | |
| | |
| Net assets acquired | | $ | 876,779 | |
The Company finalized its review of the acquired assets and liabilities, as a result of which certain adjustments to the recorded carrying values and goodwill were made.
Fair Value Measurement of Assets Assumed and Liabilities Assumed
The methods used to determine the fair value of the assets acquired and liabilities assumed in the Lakeland acquisition were as follows:
Securities Available for Sale
The estimated fair values of the available for sale debt securities, primarily comprised of U.S. government agency mortgage-backed securities and U.S. government agency and municipal bonds carried on Lakeland's balance sheet was confirmed using open market pricing provided by multiple independent securities brokers. Management reviewed trade prices and open market quotes used in pricing the securities and a fair value discount of $249.7 million was recorded on the investments.
Loans
Loans acquired from Lakeland were recorded at fair value, and there was no carryover related allowance for loan and lease losses. The fair values of loans acquired from Lakeland were estimated using the discounted cash flow method based on the remaining maturity and repricing terms. Monthly principal and interest cash flows, adjusted for prepayments, were then discounted to present value using a discount rate based on the relative risk of the cash flows. A qualitative adjustment for expected credit losses was also applied to these discounted cash flows to arrive at the calculated fair value of the loans. The fair value of the acquired loans, not including allowance for credit losses on PCD loans, totaled $7.91 billion.
For loans acquired without evidence of more-than-insignificant deterioration in credit quality since origination ("Non-PCD" loans), the Company recorded interest rate loan fair value and credit fair value adjustments. Loans were grouped into pools based on similar characteristics, such as loan type, fixed or adjustable interest rates, payment type, index rate and caps/floors, and non-accrual status. The loans were valued at the sub-pool level and were pooled at the summary level based on loan type. Market rates for similar loans were obtained from various internal and external data sources and reviewed by management for reasonableness. The average of these market rates was used as the fair value interest rate that a market participant would utilize. A present value approach was utilized to calculate the interest rate fair value discount of $297.2 million. The Company used historical annual average charge-off percentages for banking institutions identified as peers of the Company and Lakeland combined as a market-participant proxy to develop the life-of-loan loss rates per loan type for the Non-PCD loans. The loss rates were then applied to the principal balance to arrive at the projected credit losses for each period, which resulted in a credit fair value discount of $82.4 million.
Loans acquired that have experienced more-than-insignificant deterioration in credit quality since origination are considered purchased credit deteriorated (“PCD”) loans. The Company evaluated acquired loans for deterioration in credit quality based on any of, but not limited to, the following: (1) non-accrual status; (2) modifications for borrowers experiencing financial difficulty; (3) risk ratings of watch, special mention, substandard or doubtful; and (4) loans greater than 59 days past due. At the acquisition date, an estimate of expected credit losses was made for groups of PCD loans with similar risk characteristics and individual PCD loans without similar risk characteristics.
This estimate of credit losses was calculated using management's best estimate of projected losses over the remaining life of the loans. This represents the portion of the loan balances that has been deemed uncollectible based on the Company’s expectations of future cash flows for each respective PCD loan pool. The expected lifetime losses were calculated using historical losses observed at the Bank, Lakeland and peer banks. A $17.2 million allowance for credit losses was recorded on PCD loans. The interest rate fair value adjustment related to PCD loans will be substantially recognized as interest income on a level yield amortization or straight line method over the expected life of the loans.
The table below illustrates the fair value adjustments made to the amortized cost basis in order to present the fair value of the loans acquired (in thousands):
| | | | | | | | |
| Gross amortized cost basis as of May 16, 2024 | | $ | 8,323,589 | |
| Interest rate fair value adjustment on all loans | | (330,540) | |
| Credit fair value adjustment on non-PCD loans | | (82,359) | |
| Charge-offs on PCD Loans at acquisition | | (4,364) | |
| Allowance for credit losses on PCD loans | | (17,188) | |
| Fair value of acquired loans, net, as of May 16, 2024 | | $ | 7,889,138 | |
The table below is a summary of the PCD loans that were acquired from Lakeland as of the closing date (in thousands):
| | | | | | | | |
| Gross amortized cost basis as of May 16, 2024 | | $ | 564,147 | |
| Charge-offs on PCD Loans at acquisition | | (4,364) | |
| Interest component of expected cash flows (accretable difference) | | (33,365) | |
| | |
| Allowance for credit losses on PCD loans | | (17,188) | |
| Net PCD loans | | $ | 509,230 | |
Banking Premises and Equipment
The Company acquired 68 branches from Lakeland, 29 of which were owned premises. The Company closed 13 of the acquired banking offices in the third quarter of 2024. The fair value of Lakeland’s premises was determined based upon independent third-party appraisals performed by licensed appraisers in the market in which the premises are located.
Core Deposit Intangible
The fair value of the core deposit intangible was measured using a discounted cash flow approach by comparing the all-in cost of less rate sensitive deposits against an alternative funding source. The discounted cash flow approach is used because there is no reliable market participant data to support a market approach nor is there an effective measure to utilize the cost approach. To calculate the value of core deposits, deposit account servicing costs (net of deposit fee income) and interest expense on deposits were compared to the cost of alternative funding sources by using an average of Federal Home Loan Bank of New York ("FHLBNY") advance rates and brokered CD rates as disclosed by market sources. The projected cash flows were developed using projected deposit attrition rates. The discount rate was calculated using the Capital Assets Pricing Model.
The core deposit intangible totaled $209.2 million and is being amortized over its estimated life of approximately 10 years based on dollar weighted deposit runoff on an annualized basis. The core deposit intangible is evaluated annually for impairment.
Goodwill
As noted above, the acquisition was accounted for under the acquisition method of accounting. Under this method of accounting, the purchase price has been allocated to the respective assets acquired and liabilities assumed based upon their estimated fair values, net of tax. The excess of consideration paid over the estimated fair value of the net assets acquired was recorded as goodwill, and initially totaled $190.9 million. ASC 805 provides for a period of time during which the acquirer may adjust provisional amounts recognized at the acquisition date to their subsequently determined acquisition-date fair values, referred to as the "measurement period." Adjustments during the measurement period are not limited to just those relating to assets acquired and liabilities assumed but apply to all aspects of business combination accounting (e.g., the consideration transferred). Measurement-period adjustments are calculated as if they were known at the acquisition date, but are recognized in the reporting period in which they are determined. Prior period information is not revised, including the effect on earnings of any amounts they would have recorded in previous periods if the accounting had been completed at the acquisition date. In accordance with ASC 805, the Company recorded a measurement period adjustment which decreased goodwill by $10.5 million to $180.4 million related to finalizing the valuation of subordinated debentures and taxes. Goodwill is not deductible for tax purposes and will be evaluated annually for impairment.
Bank Owned Life Insurance ("BOLI")
Lakeland's BOLI cash surrender value was $160.6 million with no fair value adjustment required.
Time Deposits
The fair value adjustment for time deposits represents a discount from the value of the contractual repayments of fixed-maturity deposits using prevailing market interest rates for similar-term time deposits. The time deposit discount of approximately $1.2 million is being amortized into income on a straight-line method over the contractual life of the deposits.
Borrowings
The fair value of FHLBNY advances was determined based on a discounted cash flow analysis using a discount rate derived from FHLBNY rates as of May 16, 2024. The cash flows of the advances were projected based on the scheduled payments of each advance. The borrowings discount of approximately $5.1 million is being amortized into income on a straight-line method over the contractual life of the borrowings.
Subordinated Debentures
At the valuation date, Lakeland had three outstanding trust preferred issuances and a subordinated debt issuance with an initial aggregate balance of $180.2 million, all of which was assumed by the Company on May 16, 2024. The fair value of trust preferred and subordinated debt issuances was determined based on a discounted cash flow analysis using a discount rate commensurate with yields and terms of comparable issuances. The valuation was based on the probability of paying cash flows through the remaining contractual term of the trust preferred issuance and the cash flows through the exercise of the call option date. In accordance with ASC 805, the Company recorded a measurement period adjustment which decreased subordinated debt by $13.8 million to $166.4 million, related to finalizing the valuation. related to finalizing the valuation of subordinated debentures.
Merger-Related Expenses
Merger-related expenses, which is a separate line in non-interest expense on the Consolidated Statements of Income, totaled $56.9 million, for the year ended December 31, 2024, compared with transaction costs of $4.1 million for the respective 2023 period.
(3) Held to Maturity Debt Securities
The following tables present the amortized cost, gross unrealized gains, gross unrealized losses and the estimated fair value for held to maturity debt securities, excluding allowances for credit losses of $14,000 and $31,000, as of December 31, 2024 and 2023 (in thousands):
| | | | | | | | | | | | | | | | | | | | | | | | | |
| | 2024 |
| | Amortized cost | | Gross unrealized gains | | Gross unrealized losses | | | | Fair value |
| | | | | | | | | |
| Government-agency obligations | $ | 9,999 | | | — | | | (292) | | | | | 9,707 | |
| | | | | | | | | |
| State and municipal obligations | 311,118 | | | 689 | | | (14,133) | | | | | 297,674 | |
| Corporate obligations | 6,520 | | | — | | | (168) | | | | | 6,352 | |
| $ | 327,637 | | | 689 | | | (14,593) | | | | | 313,733 | |
| | | | | | | | | | | | | | | | | | | | | | | | | | | |
| | 2023 |
| | Amortized cost | | Gross unrealized gains | | Gross unrealized losses | | | | Fair value |
| Treasury obligations | $ | 5,146 | | | 1 | | | — | | | | | 5,147 | |
| Government-agency obligations | 11,058 | | | — | | | (652) | | | | | 10,406 | |
| | | | | | | | | |
| State and municipal obligations | 339,816 | | | 244 | | | (9,700) | | | | | 330,360 | |
| Corporate obligations | 7,091 | | | — | | | (403) | | | | | 6,688 | |
| $ | 363,111 | | | 245 | | | (10,755) | | | | | 352,601 | |
Accrued interest on held to maturity debt securities, which is excluded from the amortized cost, totaled $2.9 million and $3.1 million as of December 31, 2024 and December 31, 2023, respectively, and is presented within total accrued interest receivable on the consolidated statements of financial condition.
The amortized cost and fair value of held to maturity debt securities as of December 31, 2024 by contractual maturity, excluding allowances for credit losses of $14,000, as of December 31, 2024 are shown below (in thousands). Expected maturities may differ from contractual maturities due to prepayment or early call privileges of the issuer.
| | | | | | | | | | | |
| | 2024 |
| | Amortized cost | | Fair value |
| Due in one year or less | $ | 44,861 | | | 44,506 | |
| Due after one year through five years | 168,560 | | | 165,304 | |
| Due after five years through ten years | 96,148 | | | 89,996 | |
| Due after ten years | 18,068 | | | 13,927 | |
| $ | 327,637 | | | 313,733 | |
The Company generally purchases securities for long-term investment purposes, and differences between carrying and fair values may fluctuate during the investment period. Held to maturity debt securities having a carrying value of $269.6 million and $317.6 million as of December 31, 2024 and 2023, respectively, were pledged to secure municipal deposits.
During 2024, the Company recognized no gross gains while losses totaled $1,200 related to calls on securities in the held to maturity debt securities portfolio, with total proceeds from the calls totaling $5.5 million. There were no sales of securities from the held to maturity debt securities portfolio for the year ended December 31, 2024.
For 2023, the Company recognized gains of $45,000 and losses of $15,000 related to calls on securities in the held to maturity debt securities portfolio, with total proceeds from the calls totaling $11.6 million. There were no sales of securities from the held to maturity debt securities portfolio for the year ended December 31, 2023.
For the 2022 period, the Company recognized gains of $123,000 and no losses related to calls on certain securities in the held to maturity debt securities portfolio, with total proceeds from the calls totaling $39.2 million. There were no sales of securities from the held to maturity debt securities portfolio for the year ended December 31, 2022.
The number of securities in an unrealized loss position as of December 31, 2024 totaled 512, compared with 372 as of December 31, 2023. The increase in the number of securities in an unrealized loss position as of December 31, 2024 was due to higher current market interest rates on the intermediate part of the curve compared to rates as of December 31, 2023.
Management measures expected credit losses on held to maturity debt securities on a collective basis by security type. Management classifies the held to maturity debt securities portfolio into the following security types:
•Government-agency obligations;
•Mortgage-backed securities;
•State and municipal obligations; and
•Corporate obligations.
All of the agency obligations held by the Company are issued by U.S. government entities and agencies. These securities are either explicitly or implicitly guaranteed by the U.S. government, are highly rated by major rating agencies and have a long history of no credit losses. The majority of the state and municipal and corporate obligations carry credit ratings from the rating agencies as of December 31, 2024 that were no lower than an A rating and the Company had no securities rated BBB or worse by Moody’s.
Credit Quality Indicators. The following table provides the amortized cost of held to maturity debt securities by credit rating as of December 31, 2024 (in thousands):
| | | | | | | | | | | | | | | | | | | | | | | | | | | | | | | | | | | | | | |
| | December 31, 2024 |
| Total Portfolio | | AAA | | AA | | A | | BBB | | Not Rated | | Total |
| | | | | | | | | | | | |
| Government-agency obligations | | $ | 9,999 | | | — | | | — | | | — | | | — | | | 9,999 | |
| | | | | | | | | | | | |
| State and municipal obligations | | 44,821 | | | 234,212 | | | 28,735 | | | — | | | 3,350 | | | 311,118 | |
| Corporate obligations | | 501 | | | 2,013 | | | 3,981 | | | — | | | 25 | | | 6,520 | |
| | $ | 55,321 | | | 236,225 | | | 32,716 | | | — | | | 3,375 | | | 327,637 | |
| | | | | | | | | | | | |
| | December 31, 2023 |
| Total Portfolio | | AAA | | AA | | A | | BBB | | Not Rated | | Total |
| Treasury obligations | | $ | 5,146 | | | — | | | — | | | — | | | — | | | 5,146 | |
| Government-agency obligations | | 11,058 | | | — | | | — | | | — | | | — | | | 11,058 | |
| | | | | | | | | | | | |
| State and municipal obligations | | 43,749 | | | 156,438 | | | 137,231 | | | — | | | 2,398 | | | 339,816 | |
| Corporate obligations | | 504 | | | 2,510 | | | 4,052 | | | — | | | 25 | | | 7,091 | |
| | $ | 60,457 | | | 158,948 | | | 141,283 | | | — | | | 2,423 | | | 363,111 | |
| | | | | | | | | | | | |
Credit quality indicators are metrics that provide information regarding the relative credit risk of debt securities. As of December 31, 2024, the held to maturity debt securities portfolio was comprised of 17% rated AAA, 72% rated AA, 10% rated A, and less than 1% either below an A rating or not rated by Moody’s Investors Service or Standard and Poor’s. Securities not explicitly rated, such as U.S. government issued mortgage-backed securities, were grouped where possible under the credit rating of the issuer of the security.
(4) Available for Sale Debt Securities
The following tables present the amortized cost, gross unrealized gains, gross unrealized losses and the fair value for available for sale debt securities as of December 31, 2024 and 2023 (in thousands):
| | | | | | | | | | | | | | | | | | | | | | | |
| | 2024 |
| | Amortized cost | | Gross unrealized gains | | Gross unrealized losses | | Fair
value |
| U.S. Treasury obligations | $ | 348,621 | | | 317 | | | (18,340) | | | 330,598 | |
| Government-agency obligations | 105,965 | | | 1,461 | | | (191) | | | 107,235 | |
| Mortgage-backed securities | 2,243,725 | | | 4,982 | | | (186,548) | | | 2,062,159 | |
| Asset-backed securities | 47,203 | | | 645 | | | (285) | | | 47,563 | |
| State and municipal obligations | 126,766 | | | 243 | | | (10,092) | | | 116,917 | |
| Corporate obligations | 103,415 | | | 3,958 | | | (2,930) | | | 104,443 | |
| $ | 2,975,695 | | | 11,606 | | | (218,386) | | | 2,768,915 | |
| | | | | | | | | | | | | | | | | | | | | | | |
| | 2023 |
| | Amortized cost | | Gross unrealized gains | | Gross unrealized losses | | Fair
value |
| U.S. Treasury obligations | $ | 276,618 | | | — | | | (22,740) | | | 253,878 | |
| Government-agency obligations | 26,310 | | | 1,188 | | | — | | | 27,498 | |
| Mortgage-backed securities | 1,462,159 | | | 377 | | | (176,927) | | | 1,285,609 | |
| Asset-backed securities | 31,809 | | | 594 | | | (168) | | | 32,235 | |
| State and municipal obligations | 64,454 | | | — | | | (7,870) | | | 56,584 | |
| Corporate obligations | 40,448 | | | — | | | (6,140) | | | 34,308 | |
| $ | 1,901,798 | | | 2,159 | | | (213,845) | | | 1,690,112 | |
Accrued interest on available for sale debt securities, which is excluded from the amortized cost, totaled $9.7 million and $4.9 million as of December 31, 2024 and December 31, 2023, respectively, and is presented within total accrued interest receivable on the consolidated statements of financial condition.
Available for sale debt securities having a carrying value of $863.9 million and $1.13 billion as of December 31, 2024 and 2023, respectively, were pledged as collateral for municipal deposits and repurchase agreements.
The amortized cost and fair value of available for sale debt securities as of December 31, 2024, by contractual maturity, are shown below (in thousands). Expected maturities may differ from contractual maturities due to prepayment or early call privileges of the issuer.
| | | | | | | | | | | |
| | 2024 |
| | Amortized cost | | Fair value |
| Due in one year or less | $ | 141,817 | | | 141,426 | |
| Due after one year through five years | 308,423 | | | 290,212 | |
| Due after five years through ten years | 116,395 | | | 114,993 | |
| Due after ten years | 71,796 | | | 65,051 | |
| $ | 638,431 | | | 611,682 | |
Investments which pay principal on a periodic basis, which are primarily related to mortgage-backed securities, totaling $2.34 billion at amortized cost and $2.16 billion at fair value are excluded from the table above as their expected lives are likely to be shorter than the contractual maturity date due to principal prepayments.
During 2024, proceeds from sales on securities in the available for sale debt securities portfolio totaled $569.9 million with no gains and $3.0 million of losses recognized, of which $2.8 million was related to the sale of subordinated debt issued by Lakeland from its investment portfolio. There were no sales of securities from the available for sale debt securities portfolio for the year ended December 31, 2023. During 2024, proceeds from calls on securities in the available for sale debt securities portfolio totaled $780,000 with no gains and no losses recognized. For 2023, proceeds from calls on securities in the available for sale debt securities portfolio totaled $2.3 million with no gains and no losses recognized.
The number of securities in an unrealized loss position as of December 31, 2024 totaled 646, compared with 436 as of December 31, 2023. The increase in the number of securities in an unrealized loss position as of December 31, 2024 was primarily due to the addition of Lakeland securities, combined with higher current market interest rates on the intermediate part of the curve compared to rates as of December 31, 2023.
(5) Loans Receivable and Allowance for Credit Losses
Loans held for investment as of December 31, 2024 and 2023 are summarized as follows (in thousands):
| | | | | | | | | | | |
| 2024 | | 2023 |
| Mortgage loans: | | | |
| Commercial | $ | 7,228,078 | | | 4,512,411 | |
| Multi-family | 3,382,933 | | | 1,812,500 | |
| Construction | 823,503 | | | 653,246 | |
| Residential | 2,010,637 | | | 1,164,956 | |
| Total mortgage loans | 13,445,151 | | | 8,143,113 | |
| Commercial loans | 4,608,600 | | | 2,440,621 | |
| Consumer loans | 613,819 | | | 299,164 | |
| Total gross loans | 18,667,570 | | | 10,882,898 | |
| | | |
| Premiums on purchased loans | 1,338 | | | 1,474 | |
| | | |
| Net deferred fees | (9,538) | | | (12,456) | |
| Total loans | $ | 18,659,370 | | | 10,871,916 | |
As of December 31, 2024 and December 31, 2023, the Company had loans held for sale of $162.5 million and $1.8 million, respectively. In December of 2024, $151.3 million of the Bank's commercial loan portfolio was reclassified from loans held for investment into the held for sale portfolio as a result of a decision to exit the non-relationship equipment lease financing business.
Accrued interest on loans totaled $78.5 million and $50.9 million as of December 31, 2024 and December 31, 2023, respectively, and is presented within total accrued interest receivable on the consolidated statements of financial condition.
As of December 31, 2024, the Bank had aggregate loans and loan commitments of $98.8 million to its directors, or to its immediate family members and related interests. These loans and loan commitments were made on substantially the same terms, including interest rates and collateral, as those prevailing for comparable transactions with the general public and do not involve more than the normal risk of repayment or present other unfavorable features.
As of December 31, 2024, the Bank had aggregate loans and loan commitments totaling $3.5 million to its executive officers or their related entities. These loans and loan commitments were made on substantially the same terms, including interest rates and collateral, as those prevailing for comparable transactions with the general public and do not involve more than the normal risk of repayment or present other unfavorable features.
Premiums and discounts on purchased loans are amortized or accreted over the lives of the loans as an adjustment to yield. Required reductions due to loan prepayments are charged against or credited to interest income, as appropriate. For the years ended December 31, 2024, 2023 and 2022, as a result of prepayments and normal amortization, interest income decreased $314,000, $206,000 and $270,000, respectively.
The following tables summarize the aging of loans held for investment by portfolio segment and class of loans (in thousands):
| | | | | | | | | | | | | | | | | | | | | | | | | | | | | | | | | | | | | | | | | | | | | | | |
| | As of December 31, 2024 | | |
| | 30-59
Days | | 60-89
Days | | 90 days or more past due and
accruing | | Non-accrual | | Total
Past Due | | Current | | Total Loans Receivable | | Non-accrual loans with no related allowance |
| Mortgage loans: | | | | | | | | | | | | | | | |
| Commercial | $ | 8,538 | | | 3,954 | | | — | | | 20,883 | | | 33,375 | | | 7,194,703 | | | 7,228,078 | | | 13,575 | |
| Multi-family | — | | | — | | | — | | | 7,498 | | | 7,498 | | | 3,375,435 | | | 3,382,933 | | | 7,498 | |
| Construction | — | | | — | | | — | | | 13,246 | | | 13,246 | | | 810,257 | | | 823,503 | | | 13,246 | |
| Residential | 6,388 | | | 5,049 | | | — | | | 4,535 | | | 15,972 | | | 1,994,665 | | | 2,010,637 | | | 4,535 | |
| Total mortgage loans | 14,926 | | | 9,003 | | | — | | | 46,162 | | | 70,091 | | | 13,375,060 | | | 13,445,151 | | | 38,854 | |
| Commercial loans | 4,248 | | | 2,377 | | | — | | | 24,243 | | | 30,868 | | | 4,577,732 | | | 4,608,600 | | | 15,164 | |
| Consumer loans | 3,152 | | | 856 | | | — | | | 1,656 | | | 5,664 | | | 608,155 | | | 613,819 | | | 1,656 | |
| Total gross loans | $ | 22,326 | | | 12,236 | | | — | | | 72,061 | | | 106,623 | | | 18,560,947 | | | 18,667,570 | | | 55,674 | |
| | | | | | | | | | | | | | | | | | | | | | | | | | | | | | | | | | | | | | | | | | | | | | | |
| | As of December 31, 2023 | | |
| | 30-59
Days | | 60-89
Days | | 90 days or more past due and
accruing | | Non-accrual | | Total
Past Due | | Current | | Total Loans Receivable | | Non-accrual loans with no related allowance |
| Mortgage loans: | | | | | | | | | | | | | | | |
| Commercial | $ | 825 | | | — | | | — | | | 5,151 | | | 5,976 | | | 4,506,435 | | | 4,512,411 | | | 5,151 | |
| Multi-family | 3,815 | | | 1,635 | | | — | | | 744 | | | 6,194 | | | 1,806,306 | | | 1,812,500 | | | 744 | |
| Construction | — | | | — | | | — | | | 771 | | | 771 | | | 652,475 | | | 653,246 | | | 771 | |
| Residential | 3,429 | | | 1,208 | | | — | | | 853 | | | 5,490 | | | 1,159,466 | | | 1,164,956 | | | 853 | |
| Total mortgage loans | 8,069 | | | 2,843 | | | — | | | 7,519 | | | 18,431 | | | 8,124,682 | | | 8,143,113 | | | 7,519 | |
| Commercial loans | 998 | | | 198 | | | — | | | 41,487 | | | 42,683 | | | 2,397,938 | | | 2,440,621 | | | 36,281 | |
| Consumer loans | 875 | | | 275 | | | — | | | 633 | | | 1,783 | | | 297,381 | | | 299,164 | | | 633 | |
| Total gross loans | $ | 9,942 | | | 3,316 | | | — | | | 49,639 | | | 62,897 | | | 10,820,001 | | | 10,882,898 | | | 44,433 | |
Included in loans receivable are loans for which the accrual of interest income has been discontinued due to deterioration in the financial condition of the borrowers. Generally, accrued interest is written off by reversing interest income during the quarter the loan is moved from an accrual to a non-accrual status. The principal amount of non-accrual loans was $72.1 million and $49.6 million as of December 31, 2024 and 2023, respectively. There were no loans 90-days or greater past due and still accruing interest as of December 31, 2024 and 2023.
If the non-accrual loans had performed in accordance with their original terms, interest income would have increased by $2.8 million, $1.6 million and $1.0 million, for the years ended December 31, 2024, 2023 and 2022, respectively.
The activity in the allowance for credit losses for the years ended December 31, 2024, 2023 and 2022 is as follows (in thousands):
| | | | | | | | | | | | | | | | | |
| | Years Ended December 31, |
| | 2024 | | 2023 | | 2022 |
| Balance at beginning of period | $ | 107,200 | | | 88,023 | | | 80,740 | |
| Initial allowance related to PCD loans | 17,188 | | | — | | | — | |
Provision charge for credit losses on loans (1) | 83,604 | | | 27,900 | | | 8,400 | |
| | | | | |
| Cumulative effect of adopting ASU 2022-02 | — | | | (594) | | | — | |
| Recoveries of loans previously charged off | 3,263 | | | 2,292 | | | 5,431 | |
| Loans charged off | (17,823) | | | (10,421) | | | (6,548) | |
| Balance at end of period | $ | 193,432 | | | 107,200 | | | 88,023 | |
(1) The provision charge for credit losses on loans for the year ended December 31, 2024 includes a $60.1 million charge recorded as part of the Lakeland merger in accordance with GAAP requirements for accounting for business combinations.
The activity in the allowance for credit losses by portfolio segment for the years ended December 31, 2024 and 2023 are as follows (in thousands):
| | | | | | | | | | | | | | | | | | | | | | | | | | | |
| | For the Year Ended December 31, 2024 |
| | Mortgage loans | | Commercial loans (1) | | Consumer loans | | | | | | Total Portfolio Segments |
| Balance at beginning of period | $ | 73,407 | | | 31,475 | | | 2,318 | | | | | | | 107,200 | |
| Initial allowance related to PCD loans | 10,628 | | | 6,070 | | | 490 | | | | | | | 17,188 | |
| Provision charge for credit losses on loans | 61,274 | | | 20,011 | | | 2,319 | | | | | | | 83,604 | |
| | | | | | | | | | | |
| | | | | | | | | | | |
| Recoveries of loans previously charged off | 86 | | | 2,621 | | | 556 | | | | | | | 3,263 | |
| Loans charged off | (808) | | | (16,535) | | | (480) | | | | | | | (17,823) | |
| Balance at end of period | $ | 144,587 | | | 43,642 | | | 5,203 | | | | | | | 193,432 | |
(1) The provision charge for credit losses on loans for the year ended December 31, 2024 includes a $2.8 million benefit to the allowance as a result of the $151.3 transfer from the commercial loans loans held for investment portfolio into the loans held for sale portfolio.
| | | | | | | | | | | | | | | | | | | | | | | | | | | | | |
| | For the Year Ended December 31, 2023 |
| | Mortgage loans | | Commercial loans | | Consumer loans | | | | | | Total Portfolio Segments |
| Balance at beginning of period | $ | 58,218 | | | 27,413 | | | 2,392 | | | | | | | 88,023 | |
| Cumulative effect of adopting ASU 2022-02 | (510) | | | (43) | | | (41) | | | | | | | (594) | |
| Provision charge (benefit) for credit losses on loans | 16,877 | | | 11,159 | | | (136) | | | | | | | 27,900 | |
| | | | | | | | | | | |
| | | | | | | | | | | |
| Recoveries of loans previously charged off | 546 | | | 1,309 | | | 437 | | | | | | | 2,292 | |
| Loans charged off | (1,724) | | | (8,363) | | | (334) | | | | | | | (10,421) | |
| Balance at end of period | $ | 73,407 | | | 31,475 | | | 2,318 | | | | | | | 107,200 | |
For the year ended December 31, 2024, the Company recorded an $83.6 million provision for credit losses on loans, compared with a provision for credit losses of $27.9 million for the year ended December 31, 2023. The increase in the year-over-year provision for credit losses was primarily attributable to an initial CECL provision for credit losses on loans of $60.1 million recorded as part of the Lakeland merger in accordance with GAAP requirements for accounting for business combinations, combined with some economic forecast deterioration over the current twelve-month period within our CECL model, compared to last year.
The following table summarizes the Company's gross charge-offs recorded for the year ended December 31, 2024 by year of origination (in thousands):
| | | | | | | | | | | | | | | | | | | | | | | |
| 2024 | 2023 | 2022 | 2021 | 2020 | Prior to 2020 | Total Loans |
| | | | | | | |
| Mortgage loans: | | | | | | | |
| Commercial | $ | — | | — | | — | | — | | — | | 801 | | 801 | |
| | | | | | | |
| | | | | | | |
| Residential | — | | — | | 7 | | — | | — | | — | | 7 | |
| Total mortgage loans | — | | — | | 7 | | — | | — | | 801 | | 808 | |
| Commercial loans | — | | 1,434 | | 2,731 | | 10,259 | | 1,775 | | 335 | | 16,535 | |
Consumer loans (1) | 25 | | 8 | | 9 | | 4 | | — | | 35 | | 81 | |
| Total gross loans | $ | 25 | | 1,442 | | 2,746 | | 10,263 | | 1,775 | | 1,172 | | 17,425 | |
(1) During the year ended December 31, 2024, charge-offs on consumer overdraft accounts totaled $398,000, which are not included in the table above.
The following table summarizes the Company's gross charge-offs recorded for the year ended December 31, 2023 by year of origination (in thousands):
| | | | | | | | | | | | | | | | | | | | | | | |
| 2023 | 2022 | 2021 | 2020 | 2019 | Prior to 2019 | Total Loans |
| | | | | | | |
| Mortgage loans: | | | | | | | |
| Commercial | $ | — | | — | | — | | — | | — | | 1,700 | | 1,700 | |
| | | | | | | |
| | | | | | | |
| Residential | — | | — | | — | | — | | — | | 24 | | 24 | |
| Total mortgage loans | — | | — | | — | | — | | — | | 1,724 | | 1,724 | |
| Commercial loans | — | | — | | — | | 5,000 | | — | | 3,363 | | 8,363 | |
Consumer loans (1) | 24 | | — | | — | | — | | — | | 13 | | 37 | |
| Total gross loans | $ | 24 | | — | | — | | 5,000 | | — | | 5,100 | | 10,124 | |
(1) During the year ended December 31, 2023, charge-offs on consumer overdraft accounts totaled $297,000, which are not included in the table above.
The Company defines an impaired loan as a non-accrual, non-homogeneous loan greater than $1.0 million, or which, based on current information, it is not expected to collect all amounts due under the contractual terms of the loan agreement. As of December 31, 2024, there were 26 impaired loans totaling $55.4 million, with related specific reserves of $7.5 million that were individually evaluated for impairment.
A financial asset is considered collateral-dependent when the debtor is experiencing financial difficulty and repayment is expected to be provided substantially through the sale or operation of the collateral. For all classes of loans deemed collateral-dependent, the Company estimates expected credit losses based on the collateral’s fair value less any selling costs. A specific allocation of the allowance for credit losses is established for each collateral-dependent loan with a carrying balance greater than the collateral’s fair value, less estimated selling costs. In most cases, the Company records a partial charge-off to reduce the loan’s carrying value to the collateral’s fair value less estimated selling costs. The Company uses third-party appraisals to determine the fair value of the underlying collateral in its analysis of collateral-dependent loans. A third-party appraisal is generally ordered as soon as a loan is designated as a collateral-dependent loan and updated annually, or more frequently if required. At each fiscal quarter end, if a loan is designated as collateral-dependent and the third-party appraisal has not yet been received, an evaluation of all available collateral is made using the best information available at the time, including rent rolls, borrower financial statements and tax returns, prior appraisals, management’s knowledge of the market and collateral, and internally prepared collateral valuations based upon market assumptions regarding vacancy and capitalization rates, each as and where applicable. Once the appraisal is received and reviewed, the specific reserves are adjusted to reflect the appraised value and evaluated for charge offs. The Company believes there have not been any significant time lapses since the receipt of the most recent appraisals.
As of December 31, 2024, the Company had collateral-dependent impaired loans with a fair value of $11.0 million secured by commercial real estate. As of December 31, 2023, the Company had collateral-dependent impaired loans with a fair value of $24.1 million secured by commercial real estate.
Loan modifications to borrowers experiencing financial difficulty may include interest rate reductions, principal or interest forgiveness, forbearance, term extensions, and other actions intended to minimize economic loss and to avoid foreclosure or repossession of collateral. In addition, management attempts to obtain additional collateral or guarantor support when modifying such loans. If the borrower has demonstrated performance under the previous terms and our underwriting process shows the borrower has the capacity to continue to perform under the restructured terms, the loan will continue to accrue interest. Non-accruing restructured loans may be returned to accrual status when there has been a sustained period of repayment performance (generally six consecutive months of payments) and both principal and interest are deemed collectible.
The following illustrates the most common loan modifications by loan classes offered by the Company that are required to be disclosed pursuant to the requirements of ASU 2022-02:
| | | | | | | | |
| Loan Classes | | Modification types |
| Commercial | | Term extension, interest rate reductions, payment delay, or combination thereof. These modifications extend the term of the loan, lower the payment amount, or otherwise delay payments during a defined period for the purpose of providing borrowers additional time to return to compliance with the original loan term. |
| | |
| Residential Mortgage/ Home Equity | | Forbearance period greater than six months. These modifications require reduced or no payments during the forbearance period for the purpose of providing borrowers additional time to return to compliance with the original loan term, as well as term extension and rate adjustment. These modifications extend the term of the loan and provides for an adjustment to the interest rate, which reduces the monthly payment requirement. |
| | |
| Automobile/ Direct Installment | | Term extension greater than three months. These modifications extend the term of the loan, which reduces the monthly payment requirement. |
| | |
Effective January 1, 2023, the Company adopted ASU 2022-02, “Financial Instruments - Credit Losses (Topic 326): Troubled Debt Restructurings and Vintage Disclosures” (“ASU 2022-02”), which eliminated the accounting guidance for TDRs while enhancing disclosure requirements for certain loan refinancing and restructurings by creditors when a borrower is experiencing financial difficulty. This guidance was applied on a modified retrospective basis. Upon adoption of this guidance, the Company no longer establishes a specific reserve for loan modifications to borrowers experiencing financial difficulty. Instead, these loan modifications are included in their respective pool and a projected loss rate is applied to the current loan balance to arrive at the quantitative and qualitative baseline portion of the allowance for credit losses. As a result, the Company recorded a $594,000 reduction to the allowance for credit losses, which resulted in a $433,000 cumulative effect adjustment increase, net of tax, to retained earnings.
The following table presents the amortized cost basis of loan modifications made to borrowers experiencing financial difficulty for the year ended December 31, 2024 (in thousands):
| | | | | | | | | | | | | | | | | | | | |
| Year Ended December 31, 2024 |
| Term Extension | Interest Rate Change | Interest Rate Change and Term Extension | Change in Payment Type (1) | Total | % of Total Class of Loans and Leases |
| | | | | | |
| Mortgage loans: | | | | | | |
| Commercial | $ | — | | — | | 3,072 | | 2,852 | | 5,924 | | 0.08 | % |
| Multi-family | — | | 1,297 | | — | | — | | 1,297 | | 0.04 | |
| | | | | | |
| | | | | | |
| Total mortgage loans | — | | 1,297 | | 3,072 | | 2,852 | | 7,221 | | 0.05 | |
| Commercial loans | — | | 12,814 | | 8,466 | | — | | 21,280 | | 0.46 | |
| | | | | | |
| Total gross loans | $ | — | | 14,111 | | 11,538 | | 2,852 | | 28,501 | | 0.15 | % |
(1) The change in payment type reflects a change from monthly principal and interest payments to interest only monthly payments.
The following table presents the amortized cost basis of loan modifications made to borrowers experiencing financial difficulty for the year ended December 31, 2023 (in thousands):
| | | | | | | | | | | | | | | | | |
| Year Ended December 31, 2023 |
| Term Extension | Interest Rate Change | Interest Rate Change and Term Extension | Total | % of Total Class of Loans and Leases |
| | | | | |
| Mortgage loans: | | | | | |
| | | | | |
| Multi-family | $ | — | | — | | 1,508 | | 1,508 | | 0.08 | % |
| | | | | |
| | | | | |
| Total mortgage loans | — | | — | | 1,508 | | 1,508 | | 0.02 | |
| Commercial loans | 3,771 | | — | | 1,250 | | 5,021 | | 0.21 | |
| | | | | |
| Total gross loans | $ | 3,771 | | — | | 2,758 | | 6,529 | | 0.06 | % |
The following table presents the financial effect of loan modifications made to borrowers experiencing financial difficulty for the year ended December 31, 2024 (in thousands):
| | | | | | | | |
| Weighted Average Months of Term Reduction | Weighted Average Rate Increase |
| Mortgage loans: | | |
| Commercial | 2 | 2.40 | % |
| Multi-family | 0 | 5.00 | % |
| | |
| | |
| Total mortgage loans | 1 | 5.00 | |
| Commercial loans | 2 | 2.22 | |
| | |
| Total gross loans | 3 | 3.03 | % |
The following table presents the financial effect of loan modifications made to borrowers experiencing financial difficulty for the year ended December 31, 2023 (in thousands):
| | | | | | | | |
| Weighted Average Months of Term Extension | Weighted Average Rate Increase |
| Mortgage loans: | | |
| | |
| Multi-family | 2 | 2.23 | % |
| | |
| | |
| Total mortgage loans | 2 | 2.23 | |
| Commercial loans | 10 | 0.20 | |
| | |
| Total gross loans | 9 | 0.61 | % |
There were no loan modifications made to borrowers experiencing financial difficulty that subsequently defaulted during the years ended December 31, 2024 and December 31, 2023, respectively.
The following table presents the aging analysis of loan modifications made to borrowers experiencing financial difficulty for the year ended December 31, 2024 (in thousands):
| | | | | | | | | | | | | | | | | | | | |
| Current | 30-59 Days Past Due | 60-89 Days Past Due | 90 days or more Past Due | Non- Accrual | Total |
| | | | | | |
| Mortgage loans: | | | | | | |
| Commercial | $ | 5,924 | | — | | — | | — | | — | | 5,924 | |
| Multi-family | 481 | | 94 | | — | | 320 | | 402 | | 1,297 | |
| | | | | | |
| | | | | | |
| Total mortgage loans | 6,405 | | 94 | | — | | 320 | | 402 | | 7,221 | |
| Commercial loans | 15,340 | | — | | — | | 88 | | 5,852 | | 21,280 | |
| | | | | | |
| Total gross loans | $ | 21,745 | | 94 | | — | | 408 | | 6,254 | | 28,501 | |
The following table presents the aging analysis of loan modifications made to borrowers experiencing financial difficulty for the year ended December 31, 2023 (in thousands):
| | | | | | | | | | | | | | | | | | | | |
| Current | 30-59 Days Past Due | 60-89 Days Past Due | 90 days or more Past Due | Non- Accrual | Total |
| | | | | | |
| Mortgage loans: | | | | | | |
| | | | | | |
| Multi-family | $ | 1,508 | | — | | — | | — | | — | | 1,508 | |
| | | | | | |
| | | | | | |
| Total mortgage loans | 1,508 | | — | | — | | — | | — | | 1,508 | |
| Commercial loans | 5,021 | | — | | — | | — | | — | | 5,021 | |
| | | | | | |
| Total gross loans | $ | 6,529 | | — | | — | | — | | — | | 6,529 | |
Loans acquired by the Company that experienced more-than-insignificant deterioration in credit quality after origination, are classified as PCD loans. As of December 31, 2024, the balance of PCD loans totaled $620.4 million with a related allowance for credit losses of $15.2 million. The balance of PCD loans as of December 31, 2023, was $165.1 million with a related allowance for credit losses of $1.7 million.
In connection with the Lakeland merger, the Company evaluated acquired loans for deterioration in credit quality based on any of, but not limited to, the following: (1) non-accrual status; (2) modifications for borrowers experiencing financial difficulty; (3) risk ratings of watch, special mention, substandard or doubtful; and (4) loans greater than 59 days past due. At the acquisition date, an estimate of expected credit losses is made for groups of PCD loans with similar risk characteristics and individual PCD loans without similar risk characteristics.
Additionally for PCD loans, an allowance for credit losses was calculated using management's best estimate of projected losses over the remaining life of the loans. This represents the portion of the loan balances that has been deemed uncollectible based on the Company’s expectations of future cash flows for each respective PCD loan pool, given the outlook and forecasts inclusive of related fiscal and regulatory interventions. The expected lifetime losses were calculated using historical losses observed at the Bank, Lakeland and peer banks. A $17.2 million allowance for credit losses was recorded on PCD loans acquired from Lakeland. The interest rate fair value adjustment related to PCD loans will be substantially recognized as interest income on a level yield or straight line method over the expected life of the loans.
The table below is a summary of the PCD loans that were acquired from Lakeland as of the closing date (in thousands):
| | | | | | | | |
| Gross amortized cost basis as of May 16, 2024 | | $ | 564,147 | |
| Charge-offs on PCD Loans at acquisition | | (4,364) | |
| Interest component of expected cash flows (accretable difference) | | (33,365) | |
| | |
| Allowance for credit losses on PCD loans | | (17,188) | |
| Net PCD loans | | $ | 509,230 | |
Management utilizes an internal nine-point risk rating system to summarize its loan portfolio into categories with similar risk characteristics. Loans deemed to be “acceptable quality” are rated 1 through 4, with a rating of 1 established for loans with minimal risk. Loans that are deemed to be of “questionable quality” are rated 5 (watch) or 6 (special mention). Loans with adverse classifications (substandard, doubtful or loss) are rated 7, 8 or 9, respectively. Commercial mortgage, commercial, multi-family and construction loans are rated individually, and each lending officer is responsible for risk rating loans in their portfolio. These risk ratings are then reviewed by the department manager and/or the Chief Lending Officer and by the Credit Department. The risk ratings are also reviewed periodically through loan review examinations which are currently performed by independent third-parties. Reports by the independent third-parties are presented to the Audit Committee of the Board of Directors.
The following table summarizes the Company's gross loans held for investment by year of origination and internally assigned credit grades (in thousands):
| | | | | | | | | | | | | | | | | | | | | | | | | | | | | | | | | | | | | | | | | | | | | | | | | | | | | | | | |
| | Gross Loans Held for Investment by Year of Origination
as of December 31, 2024 |
| | 2024 | | 2023 | | 2022 | | 2021 | | 2020 | | Prior to 2020 | | Revolving Loans | | Revolving loans to term loans | | Total Loans |
| Commercial Mortgage | | | | | | | | | | | | | | | | | | |
| Special mention | | $ | 262 | | | 4,377 | | | 10,150 | | | 9,127 | | | 14,569 | | | 69,525 | | | 4,461 | | | — | | | 112,471 | |
| Substandard | | 3,044 | | | 73 | | | 10,952 | | | — | | | 21,051 | | | 50,870 | | | — | | | — | | | 85,990 | |
| Doubtful | | — | | | — | | | — | | | — | | | — | | | — | | | — | | | — | | | — | |
| Loss | | — | | | — | | | — | | | — | | | — | | | — | | | — | | | — | | | — | |
| Total criticized and classified | | 3,306 | | | 4,450 | | | 21,102 | | | 9,127 | | | 35,620 | | | 120,395 | | | 4,461 | | | — | | | 198,461 | |
| Pass/Watch | | 417,991 | | | 904,924 | | | 1,623,911 | | | 997,658 | | | 884,295 | | | 2,063,646 | | | 126,297 | | | 10,895 | | | 7,029,617 | |
| Total Commercial Mortgage | | $ | 421,297 | | | 909,374 | | | 1,645,013 | | | 1,006,785 | | | 919,915 | | | 2,184,041 | | | 130,758 | | | 10,895 | | | 7,228,078 | |
| | | | | | | | | | | | | | | | | | |
| Multi-family | | | | | | | | | | | | | | | | | | |
| Special mention | | $ | — | | | — | | | — | | | — | | | — | | | 16,472 | | | | | | | 16,472 | |
| Substandard | | — | | | 1,560 | | | — | | | 1,043 | | | — | | | 5,439 | | | | | | | 8,042 | |
| Doubtful | | — | | | — | | | — | | | — | | | — | | | — | | | — | | | — | | | — | |
| Loss | | — | | | — | | | — | | | — | | | — | | | — | | | — | | | — | | | — | |
| Total criticized and classified | | — | | | 1,560 | | | — | | | 1,043 | | | — | | | 21,911 | | | — | | | — | | | 24,514 | |
| Pass/Watch | | 363,254 | | | 478,184 | | | 701,811 | | | 460,979 | | | 460,161 | | | 882,291 | | | 10,181 | | | 1,558 | | | 3,358,419 | |
| Total Multi-Family | | $ | 363,254 | | | 479,744 | | | 701,811 | | | 462,022 | | | 460,161 | | | 904,202 | | | 10,181 | | | 1,558 | | | 3,382,933 | |
| | | | | | | | | | | | | | | | | | |
| Construction | | | | | | | | | | | | | | | | | | |
| Special mention | | $ | — | | | 1,064 | | | — | | | — | | | — | | | — | | | | | | | 1,064 | |
| Substandard | | — | | | — | | | — | | | 12,346 | | | — | | | — | | | | | | | 12,346 | |
| Doubtful | | — | | | — | | | — | | | — | | | — | | | — | | | — | | | — | | | — | |
| Loss | | — | | | — | | | — | | | — | | | — | | | — | | | — | | | — | | | — | |
| Total criticized and classified | | — | | | 1,064 | | | — | | | 12,346 | | | — | | | — | | | — | | | — | | | 13,410 | |
| Pass/Watch | | 104,009 | | | 309,034 | | | 260,190 | | | 110,100 | | | 24,017 | | | 2,743 | | | — | | | — | | | 810,093 | |
| Total Construction | | $ | 104,009 | | | 310,098 | | | 260,190 | | | 122,446 | | | 24,017 | | | 2,743 | | | — | | | — | | | 823,503 | |
| | | | | | | | | | | | | | | | | | |
Residential (1) | | | | | | | | | | | | | | | | | | |
| Special mention | | $ | 403 | | | 1,356 | | | 344 | | | — | | | — | | | 2,836 | | | — | | | — | | | 4,939 | |
| Substandard | | — | | | 764 | | | 689 | | | 1,119 | | | — | | | 1,963 | | | — | | | — | | | 4,535 | |
| Doubtful | | — | | | — | | | — | | | — | | | — | | | — | | | — | | | — | | | — | |
| | | | | | | | | | | | | | | | | | | | | | | | | | | | | | | | | | | | | | | | | | | | | | | | | | | | | | | | |
| | Gross Loans Held for Investment by Year of Origination
as of December 31, 2024 |
| | 2024 | | 2023 | | 2022 | | 2021 | | 2020 | | Prior to 2020 | | Revolving Loans | | Revolving loans to term loans | | Total Loans |
| Loss | | — | | | — | | | — | | | — | | | — | | | — | | | — | | | — | | | — | |
| Total criticized and classified | | 403 | | | 2,120 | | | 1,033 | | | 1,119 | | | — | | | 4,799 | | | — | | | — | | | 9,474 | |
| Pass/Watch | | 140,382 | | | 348,493 | | | 428,269 | | | 333,150 | | | 276,703 | | | 474,166 | | | — | | | — | | | 2,001,163 | |
| Total Residential | | $ | 140,785 | | | 350,613 | | | 429,302 | | | 334,269 | | | 276,703 | | | 478,965 | | | — | | | — | | | 2,010,637 | |
| | | | | | | | | | | | | | | | | | |
| Total Mortgage | | | | | | | | | | | | | | | | | | |
| Special mention | | $ | 665 | | | 6,797 | | | 10,494 | | | 9,127 | | | 14,569 | | | 88,833 | | | 4,461 | | | — | | | 134,946 | |
| Substandard | | 3,044 | | | 2,397 | | | 11,641 | | | 14,508 | | | 21,051 | | | 58,272 | | | — | | | — | | | 110,913 | |
| Doubtful | | — | | | — | | | — | | | — | | | — | | | — | | | — | | | — | | | — | |
| Loss | | — | | | — | | | — | | | — | | | — | | | — | | | — | | | — | | | — | |
| Total criticized and classified | | 3,709 | | | 9,194 | | | 22,135 | | | 23,635 | | | 35,620 | | | 147,105 | | | 4,461 | | | — | | | 245,859 | |
| Pass/Watch | | 1,025,636 | | | 2,040,635 | | | 3,014,181 | | | 1,901,887 | | | 1,645,176 | | | 3,422,846 | | | 136,478 | | | 12,453 | | | 13,199,292 | |
| Total Mortgage | | $ | 1,029,345 | | | 2,049,829 | | | 3,036,316 | | | 1,925,522 | | | 1,680,796 | | | 3,569,951 | | | 140,939 | | | 12,453 | | | 13,445,151 | |
| | | | | | | | | | | | | | | | | | |
| Commercial | | | | | | | | | | | | | | | | | | |
| Special mention | | $ | 298 | | | 2,612 | | | 3,084 | | | 5,804 | | | 9,493 | | | 26,924 | | | 20,030 | | | 4,761 | | | 73,006 | |
| Substandard | | 6,887 | | | 5,023 | | | 62,028 | | | 28,208 | | | 23,130 | | | 21,170 | | | 31,787 | | | 1,746 | | | 179,979 | |
| Doubtful | | — | | | — | | | — | | | — | | | — | | | — | | | — | | | — | | | — | |
| Loss | | — | | | — | | | — | | | — | | | — | | | — | | | — | | | — | | | — | |
| Total criticized and classified | | 7,185 | | | 7,635 | | | 65,112 | | | 34,012 | | | 32,623 | | | 48,094 | | | 51,817 | | | 6,507 | | | 252,985 | |
| Pass/Watch | | 747,299 | | | 427,445 | | | 697,899 | | | 390,770 | | | 256,421 | | | 678,154 | | | 1,089,408 | | | 68,219 | | | 4,355,615 | |
| Total Commercial | | $ | 754,484 | | | 435,080 | | | 763,011 | | | 424,782 | | | 289,044 | | | 726,248 | | | 1,141,225 | | | 74,726 | | | 4,608,600 | |
| | | | | | | | | | | | | | | | | | |
Consumer (1) | | | | | | | | | | | | | | | | | | |
| Special mention | | $ | — | | | — | | | 3 | | | — | | | 124 | | | 109 | | | 725 | | | — | | | 961 | |
| Substandard | | — | | | 95 | | | — | | | 9 | | | — | | | 321 | | | 950 | | | — | | | 1,375 | |
| Doubtful | | — | | | — | | | — | | | — | | | — | | | — | | | — | | | — | | | — | |
| Loss | | — | | | — | | | — | | | — | | | — | | | — | | | — | | | — | | | — | |
| Total criticized and classified | | — | | | 95 | | | 3 | | | 9 | | | 124 | | | 430 | | | 1,675 | | | — | | | 2,336 | |
| Pass/Watch | | 31,975 | | | 45,605 | | | 59,669 | | | 40,080 | | | 9,433 | | | 83,728 | | | 327,107 | | | 13,886 | | | 611,483 | |
| Total Consumer | | $ | 31,975 | | | 45,700 | | | 59,672 | | | 40,089 | | | 9,557 | | | 84,158 | | | 328,782 | | | 13,886 | | | 613,819 | |
| | | | | | | | | | | | | | | | | | |
| Total Loans | | | | | | | | | | | | | | | | | | |
| Special mention | | $ | 963 | | | 9,409 | | | 13,581 | | | 14,931 | | | 24,186 | | | 115,866 | | | 25,216 | | | 4,761 | | | 208,913 | |
| Substandard | | 9,931 | | | 7,515 | | | 73,669 | | | 42,725 | | | 44,181 | | | 79,763 | | | 32,737 | | | 1,746 | | | 292,267 | |
| Doubtful | | — | | | — | | | — | | | — | | | — | | | — | | | — | | | — | | | — | |
| Loss | | — | | | — | | | — | | | — | | | — | | | — | | | — | | | — | | | — | |
| Total criticized and classified | | 10,894 | | | 16,924 | | | 87,250 | | | 57,656 | | | 68,367 | | | 195,629 | | | 57,953 | | | 6,507 | | | 501,180 | |
| Pass/Watch | | 1,804,910 | | | 2,513,685 | | | 3,771,749 | | | 2,332,737 | | | 1,911,030 | | | 4,184,728 | | | 1,552,993 | | | 94,558 | | | 18,166,390 | |
| Total Loans | | $ | 1,815,804 | | | 2,530,609 | | | 3,858,999 | | | 2,390,393 | | | 1,979,397 | | | 4,380,357 | | | 1,610,946 | | | 101,065 | | | 18,667,570 | |
| (1) For residential and consumer loans, the Company assigns internal credit grades based on the delinquency status of each loan. |
| | | | | | | | | | | | | | | | | | | | | | | | | | | | | | | | | | | | | | | | | | | | | | | | | | | | | | | | |
| | Gross Loans Held for Investment by Year of Origination
as of December 31, 2023 |
| | 2023 | | 2022 | | 2021 | | 2020 | | 2019 | | Prior to 2019 | | Revolving Loans | | Revolving loans to term loans | | Total Loans |
| Commercial Mortgage | | | | | | | | | | | | | | | | | | |
| Special mention | | $ | — | | | 10,926 | | | 3,048 | | | 28,511 | | | 10,558 | | | 24,598 | | | 4,500 | | | — | | | 82,141 | |
| Substandard | | 482 | | | — | | | — | | | — | | | — | | | 9,599 | | | 434 | | | — | | | 10,515 | |
| Doubtful | | — | | | — | | | — | | | — | | | — | | | — | | | — | | | — | | | — | |
| Loss | | — | | | — | | | — | | | — | | | — | | | — | | | — | | | — | | | — | |
| Total criticized and classified | | 482 | | | 10,926 | | | 3,048 | | | 28,511 | | | 10,558 | | | 34,197 | | | 4,934 | | | — | | | 92,656 | |
| Pass/Watch | | 628,709 | | | 883,149 | | | 677,464 | | | 470,257 | | | 470,971 | | | 1,166,205 | | | 90,760 | | | 32,240 | | | 4,419,755 | |
| Total Commercial Mortgage | | $ | 629,191 | | | 894,075 | | | 680,512 | | | 498,768 | | | 481,529 | | | 1,200,402 | | | 95,694 | | | 32,240 | | | 4,512,411 | |
| | | | | | | | | | | | | | | | | | |
| Multi-family | | | | | | | | | | | | | | | | | | |
| Special mention | | $ | — | | | — | | | — | | | — | | | — | | | 9,500 | | | — | | | — | | | 9,500 | |
| Substandard | | 3,253 | | | — | | | — | | | — | | | — | | | — | | | — | | | — | | | 3,253 | |
| Doubtful | | — | | | — | | | — | | | — | | | — | | | — | | | — | | | — | | | — | |
| Loss | | — | | | — | | | — | | | — | | | — | | | — | | | — | | | — | | | — | |
| Total criticized and classified | | 3,253 | | | — | | | — | | | — | | | — | | | 9,500 | | | — | | | — | | | 12,753 | |
| Pass/Watch | | 340,842 | | | 172,244 | | | 184,136 | | | 271,878 | | | 230,456 | | | 592,470 | | | 6,115 | | | 1,606 | | | 1,799,747 | |
| Total Multi-Family | | $ | 344,095 | | | 172,244 | | | 184,136 | | | 271,878 | | | 230,456 | | | 601,970 | | | 6,115 | | | 1,606 | | | 1,812,500 | |
| | | | | | | | | | | | | | | | | | |
| Construction | | | | | | | | | | | | | | | | | | |
| Special mention | | $ | — | | | — | | | — | | | — | | | — | | | — | | | — | | | — | | | — | |
| Substandard | | — | | | — | | | — | | | — | | | — | | | 771 | | | — | | | — | | | 771 | |
| Doubtful | | — | | | — | | | — | | | — | | | — | | | — | | | — | | | — | | | — | |
| Loss | | — | | | — | | | — | | | — | | | — | | | — | | | — | | | — | | | — | |
| Total criticized and classified | | — | | | — | | | — | | | — | | | — | | | 771 | | | — | | | — | | | 771 | |
| Pass/Watch | | 41,209 | | | 342,890 | | | 185,034 | | | 68,603 | | | 1,339 | | | 13,400 | | | — | | | — | | | 652,475 | |
| Total Construction | | $ | 41,209 | | | 342,890 | | | 185,034 | | | 68,603 | | | 1,339 | | | 14,171 | | | — | | | — | | | 653,246 | |
| | | | | | | | | | | | | | | | | | |
Residential (1) | | | | | | | | | | | | | | | | | | |
| Special mention | | $ | — | | | — | | | — | | | — | | | — | | | 1,208 | | | — | | | — | | | 1,208 | |
| Substandard | | — | | | — | | | — | | | — | | | — | | | 1,285 | | | — | | | — | | | 1,285 | |
| Doubtful | | — | | | — | | | — | | | — | | | — | | | — | | | — | | | — | | | — | |
| Loss | | — | | | — | | | — | | | — | | | — | | | — | | | — | | | — | | | — | |
| Total criticized and classified | | — | | | — | | | — | | | — | | | — | | | 2,493 | | | — | | | — | | | 2,493 | |
| Pass/Watch | | 96,259 | | | 141,683 | | | 200,111 | | | 195,964 | | | 89,654 | | | 438,792 | | | — | | | — | | | 1,162,463 | |
| Total Residential | | $ | 96,259 | | | 141,683 | | | 200,111 | | | 195,964 | | | 89,654 | | | 441,285 | | | — | | | — | | | 1,164,956 | |
| | | | | | | | | | | | | | | | | | |
| Total Mortgage | | | | | | | | | | | | | | | | | | |
| | | | | | | | | | | | | | | | | | | | | | | | | | | | | | | | | | | | | | | | | | | | | | | | | | | | | | | | |
| | Gross Loans Held for Investment by Year of Origination
as of December 31, 2023 |
| | 2023 | | 2022 | | 2021 | | 2020 | | 2019 | | Prior to 2019 | | Revolving Loans | | Revolving loans to term loans | | Total Loans |
| Special mention | | $ | — | | | 10,926 | | | 3,048 | | | 28,511 | | | 10,558 | | | 35,306 | | | 4,500 | | | — | | | 92,849 | |
| Substandard | | 3,735 | | | — | | | — | | | — | | | — | | | 11,655 | | | 434 | | | — | | | 15,824 | |
| Doubtful | | — | | | — | | | — | | | — | | | — | | | — | | | — | | | — | | | — | |
| Loss | | — | | | — | | | — | | | — | | | — | | | — | | | — | | | — | | | — | |
| Total criticized and classified | | 3,735 | | | 10,926 | | | 3,048 | | | 28,511 | | | 10,558 | | | 46,961 | | | 4,934 | | | — | | | 108,673 | |
| Pass/Watch | | 1,107,019 | | | 1,539,966 | | | 1,246,745 | | | 1,006,702 | | | 792,420 | | | 2,210,867 | | | 96,875 | | | 33,846 | | | 8,034,440 | |
| Total Mortgage | | $ | 1,110,754 | | | 1,550,892 | | | 1,249,793 | | | 1,035,213 | | | 802,978 | | | 2,257,828 | | | 101,809 | | | 33,846 | | | 8,143,113 | |
| | | | | | | | | | | | | | | | | | |
| Commercial | | | | | | | | | | | | | | | | | | |
| Special mention | | $ | 450 | | | 17,008 | | | 9,338 | | | 2,409 | | | 152 | | | 22,752 | | | 23,333 | | | 687 | | | 76,129 | |
| Substandard | | 686 | | | — | | | 20,262 | | | 9,235 | | | 2,034 | | | 11,313 | | | 10,736 | | | 508 | | | 54,774 | |
| Doubtful | | 7,011 | | | — | | | — | | | — | | | — | | | — | | | — | | | — | | | 7,011 | |
| Loss | | — | | | — | | | — | | | — | | | — | | | — | | | — | | | — | | | — | |
| Total criticized and classified | | 8,147 | | | 17,008 | | | 29,600 | | | 11,644 | | | 2,186 | | | 34,065 | | | 34,069 | | | 1,195 | | | 137,914 | |
| Pass/Watch | | 358,578 | | | 316,015 | | | 318,416 | | | 131,647 | | | 143,677 | | | 491,406 | | | 471,962 | | | 71,006 | | | 2,302,707 | |
| Total Commercial | | $ | 366,725 | | | 333,023 | | | 348,016 | | | 143,291 | | | 145,863 | | | 525,471 | | | 506,031 | | | 72,201 | | | 2,440,621 | |
| | | | | | | | | | | | | | | | | | |
Consumer (1) | | | | | | | | | | | | | | | | | | |
| Special mention | | $ | — | | | — | | | — | | | — | | | — | | | 97 | | | 178 | | | — | | | 275 | |
| Substandard | | — | | | — | | | — | | | — | | | 9 | | | 146 | | | 389 | | | 90 | | | 634 | |
| Doubtful | | — | | | — | | | — | | | — | | | — | | | — | | | — | | | — | | | — | |
| Loss | | — | | | — | | | — | | | — | | | — | | | — | | | — | | | — | | | — | |
| Total criticized and classified | | — | | | — | | | — | | | — | | | 9 | | | 243 | | | 567 | | | 90 | | | 909 | |
| Pass/Watch | | 29,083 | | | 26,098 | | | 18,101 | | | 3,459 | | | 14,375 | | | 85,383 | | | 108,431 | | | 13,325 | | | 298,255 | |
| Total Consumer | | $ | 29,083 | | | 26,098 | | | 18,101 | | | 3,459 | | | 14,384 | | | 85,626 | | | 108,998 | | | 13,415 | | | 299,164 | |
| | | | | | | | | | | | | | | | | | |
| Total Loans | | | | | | | | | | | | | | | | | | |
| Special mention | | $ | 450 | | | 27,934 | | | 12,386 | | | 30,920 | | | 10,710 | | | 58,155 | | | 28,011 | | | 687 | | | 169,253 | |
| Substandard | | 4,421 | | | — | | | 20,262 | | | 9,235 | | | 2,043 | | | 23,114 | | | 11,559 | | | 598 | | | 71,232 | |
| Doubtful | | 7,011 | | | — | | | — | | | — | | | — | | | — | | | — | | | — | | | 7,011 | |
| Loss | | — | | | — | | | — | | | — | | | — | | | — | | | — | | | — | | | — | |
| Total criticized and classified | | 11,882 | | | 27,934 | | | 32,648 | | | 40,155 | | | 12,753 | | | 81,269 | | | 39,570 | | | 1,285 | | | 247,496 | |
| Pass/Watch | | 1,494,680 | | | 1,882,079 | | | 1,583,262 | | | 1,141,808 | | | 950,472 | | | 2,787,656 | | | 677,268 | | | 118,177 | | | 10,635,402 | |
| Total Loans | | $ | 1,506,562 | | | 1,910,013 | | | 1,615,910 | | | 1,181,963 | | | 963,225 | | | 2,868,925 | | | 716,838 | | | 119,462 | | | 10,882,898 | |
(1) For residential and consumer loans, the Company assigns internal credit grades based on the delinquency status of each loan.
(6) Banking Premises and Equipment
A summary of banking premises and equipment as of December 31, 2024 and 2023 is as follows (in thousands):
| | | | | | | | | | | |
| 2024 | | 2023 |
| Land | $ | 27,627 | | | 13,394 | |
| Banking premises | 128,931 | | | 72,905 | |
| Furniture, fixtures and equipment | 80,269 | | | 56,082 | |
| Leasehold improvements | 59,084 | | | 45,154 | |
| Construction in progress | 4,870 | | | 5,331 | |
| Total banking premises and equipment | 300,781 | | | 192,866 | |
| Less accumulated depreciation and amortization | 181,159 | | | 121,868 | |
| Net banking premises and equipment | $ | 119,622 | | | 70,998 | |
Depreciation expense for the years ended December 31, 2024, 2023 and 2022 amounted to $12.6 million, $8.7 million and $9.8 million, respectively.
(7) Goodwill and Other Intangible Assets
Goodwill and other intangible assets as of December 31, 2024 and 2023 are summarized as follows (in thousands): | | | | | | | | | | | |
| 2024 | | 2023 |
| Goodwill | $ | 624,069 | | | 443,623 | |
| Core deposit premiums | 184,238 | | | 1,901 | |
| Customer relationship and other intangibles | 9,819 | | | 11,867 | |
| | | |
| Mortgage servicing rights | 1,104 | | | 551 | |
| Total goodwill and other intangible assets | $ | 819,230 | | | 457,942 | |
Amortization expense of intangible assets for the years ended December 31, 2024, 2023 and 2022 is as follows (in thousands): | | | | | | | | | | | | | | | | | |
| 2024 | | 2023 | | 2022 |
| Core deposit premiums | $ | 26,827 | | | 544 | | | 730 | |
| | | | | |
| Customer relationship and other intangibles | 2,047 | | | 2,335 | | | 2,488 | |
| Mortgage servicing rights | 57 | | | 73 | | | 74 | |
| Total amortization expense of intangible assets | $ | 28,931 | | | 2,952 | | | 3,292 | |
Scheduled amortization of core deposit premiums and customer relationship intangibles for each of the next five years is as follows (in thousands):
| | | | | | | | |
| Year ended December 31, | | Scheduled Amortization |
| 2025 | | $ | 37,140 | |
| 2026 | | 33,283 | |
| 2027 | | 29,543 | |
| 2028 | | 25,817 | |
| 2029 | | 21,148 | |
(8) Deposits
Deposits as of December 31, 2024 and 2023 are summarized as follows (in thousands):
| | | | | | | | | | | | | | | | | | | | | | | |
| 2024 | | Weighted average interest rate | | 2023 | | Weighted average interest rate |
| Savings deposits | $ | 1,679,667 | | | 0.22 | % | | $ | 1,175,683 | | | 0.21 | % |
| Money market accounts | 3,364,564 | | | 2.67 | | | 2,325,364 | | | 2.67 | |
NOW accounts (1) | 6,622,642 | | | 2.64 | | | 3,492,184 | | | 2.77 | |
| Non-interest bearing deposits | 3,788,785 | | | — | | | 2,203,341 | | | — | |
Certificates of deposit (2) | 3,168,155 | | | 4.10 | | | 1,095,942 | | | 3.85 | |
| Total deposits | $ | 18,623,813 | | | | | $ | 10,292,514 | | | |
(1) The Bank's insured cash sweep product totaled $1.16 billion and $520.2 million as of December 31, 2024 and December 31, 2023, respectively, and are reported within NOW accounts.
(2)Time deposits equal to or in excess of $250,000 were $789.0 million and $218.5 million as of December 31, 2024 and December 31, 2023, respectively. Additionally, the Bank's reciprocal Certificate of Deposit Account Registry Service product totaled $3.5 million and $3.3 million as of December 31, 2024 and December 31, 2023, respectively.
Within total deposits, brokered deposits totaled $251.5 million and $165.7 million as of December 31, 2024 and December 31, 2023, respectively.
Scheduled maturities of certificates of deposit accounts as of December 31, 2024 and 2023 are as follows (in thousands):
| | | | | | | | | | | |
| 2024 | | 2023 |
| Within one year | $ | 3,045,860 | | | 1,020,285 | |
| One to three years | 110,684 | | | 63,866 | |
| Three to five years | 11,608 | | | 11,773 | |
| Five years and thereafter | 3 | | | 18 | |
| $ | 3,168,155 | | | 1,095,942 | |
Interest expense on deposits for the years ended December 31, 2024, 2023 and 2022 is summarized as follows (in thousands):
| | | | | | | | | | | | | | | | | |
| | Years ended December 31, |
| | 2024 | | 2023 | | 2022 |
| Savings deposits | $ | 3,443 | | | 2,184 | | | 1,276 | |
| NOW and money market accounts | 245,874 | | | 125,471 | | | 32,048 | |
| Certificates of deposits | 100,206 | | | 31,804 | | | 5,380 | |
| $ | 349,523 | | | 159,459 | | | 38,704 | |
(9) Borrowed Funds
Borrowed funds as of December 31, 2024 and 2023 are summarized as follows (in thousands):
| | | | | | | | | | | |
| 2024 | | 2023 |
| Securities sold under repurchase agreements | $ | 113,224 | | | 72,161 | |
| FHLBNY line of credit | 385,000 | | | 148,000 | |
| FHLBNY advances | 1,518,497 | | | 1,299,836 | |
| FRBNY BTFP borrowing | — | | | 450,000 | |
| Purchase accounting adjustment ("PAA") on borrowed funds | 3,714 | | | 36 | |
| Total borrowed funds | $ | 2,020,435 | | | 1,970,033 | |
Total long-term borrowings totaled $513.9 million and $534.8 million as of December 31, 2024 and December 31, 2023, respectively, while total short-term borrowings totaled $1.51 billion and $1.44 billion for the same periods.
As of December 31, 2024, FHLBNY advances were at fixed rates and mature between January 2025 and September 2027, and as of December 31, 2023, FHLBNY advances were at fixed rates and mature between January 2024 and September 2027. These advances are secured by loans receivable under a blanket collateral agreement.
In March 2023, the Company established a facility under the Bank Term Funding Program ("BTFP" or "Program") with the Federal Reserve Bank of New York ("FRBNY"). The Company elected to participate in the BTFP due to significant cost savings compared to other wholesale funding sources. The funding was used to pay off existing wholesale borrowings. The ability to prepay at any time without penalty also enhanced our ability to manage our interest rate risk position. The balance was fully paid off in November of 2024.
Scheduled maturities of FHLBNY advances, FRBNY BTFP borrowings and lines of credit, including purchase accounting adjustments resulting from the Lakeland acquisition as of December 31, 2024 are as follows (in thousands):
| | | | | |
| | 2024 |
| Due in one year or less | $ | 1,268,262 | |
| Due after one year through two years | 160,235 | |
| Due after two years through three years | 475,000 | |
| Due after three years through four years | — | |
| Due after four years through five years | — | |
| Thereafter | — | |
| Purchase accounting adjustment on borrowed funds | 3,714 | |
| Total FHLBNY advances, FRBNY BTFP borrowings and overnight borrowings | $ | 1,907,211 | |
Scheduled maturities of securities sold under repurchase agreements as of December 31, 2024 are as follows (in thousands):
| | | | | |
| | 2024 |
| Due in one year or less | $ | 113,224 | |
| |
| |
| |
| |
| Thereafter | — | |
| Total securities sold under repurchase agreements | $ | 113,224 | |
The following tables set forth certain information as to borrowed funds for the years ended December 31, 2024 and 2023 (in thousands): | | | | | | | | | | | | | | | | | |
| Maximum balance | | Average balance | | Weighted average interest rate |
| 2024 | | | | | |
| Securities sold under repurchase agreements | $ | 117,323 | | | 102,043 | | | 2.03 | % |
| FHLBNY overnight borrowings | 567,000 | | | 115,902 | | | 5.45 | |
| FHLBNY advances | 1,518,497 | | | 1,290,836 | | | 3.41 | |
| FRBNY BTFP Borrowing | 550,000 | | | 472,077 | | | 4.78 | |
| 2023 | | | | | |
| Securities sold under repurchase agreements | $ | 99,669 | | | 87,227 | | | 1.69 | % |
| FHLBNY overnight borrowings | 500,000 | | | 262,289 | | | 5.29 | |
| FHLBNY advances | 1,592,277 | | | 1,282,124 | | | 3.14 | |
| FRBNY BTFP Borrowing | 450,000 | | | 4,932 | | | 4.83 | |
Securities sold under repurchase agreements include arrangements with deposit customers of the Bank to sweep funds into short-term borrowings. The Bank uses available for sale debt securities to pledge as collateral for the repurchase agreements. As of December 31, 2024 and December 31, 2023, the fair value of securities pledged to secure public deposits, repurchase agreements, lines of credit and FHLB advances, totaled $1.12 billion and $924.6 million, respectively. Additionally, as of December 31, 2024, there was no par value of securities pledged to secure BTFP, since the plan was fully paid off in November of 2024, compared to a par value of securities pledged to secure BTFP of $589.1 million as of December 31, 2023.
Interest expense on borrowings for the years ended December 31, 2024, 2023 and 2022 amounted to $74.9 million, $56.0 million and $9.5 million, respectively, while amortization expense related to purchase accounting for the years ended December 31, 2024, 2023 and 2022 amounted to a benefit of $1.4 million, $105,000 and $188,000, respectively.
(10) Subordinated Debentures
On May 9, 2024, the Company issued $225.0 million of 9.00% Fixed-to-Floating Rate subordinated notes (the "Notes") due 2034, resulting in net proceeds of $221.2 million. The Notes bear interest at an initial rate of 9.00% per annum, payable semi-annually in arrears on May 15 and November 15 of each year, commencing on November 15, 2024. The last interest payment date for the fixed rate period will be May 15, 2029. From and including May 15, 2029 to, but excluding May 15, 2034 or the date of earlier redemption, the Notes will bear interest at a floating rate per annum equal to the Benchmark rate (which is expected to be three-month term Secured Overnight Financing Rate ("SOFR")), each as defined in and subject to the provisions of the Indenture, plus 476.5 basis points, payable quarterly in arrears on February 15, May 15, August 15, and November 15 of each year, commencing on August 15, 2029. The debt is included in Tier 2 capital for the Company. Debt issuance costs totaled $3.8 million and are being amortized to maturity. Amortization expense on these costs for the year ended December 31, 2024 amounted to $490,000.
On May 16, 2024, the Company assumed Lakeland’s obligations with respect to $150.0 million aggregate principal amount of fixed-to-floating rate subordinated notes due September 15, 2031, with an initial quarterly call option of September 15, 2026. The Notes bear interest at a rate of 2.875% until September 15, 2026, and will then reset quarterly to the then current Benchmark rate, which is expected to be the three-month term SOFR plus a spread of 220 basis points. The debt is included in Tier 2 capital for the Company.
1st Constitution Capital Trust II, a non-consolidated subsidiary of the Company acquired as part of the Lakeland acquisition and a Delaware statutory business trust established on June 15, 2006, issued $18.0 million of variable rate capital trust pass-through securities to investors. In accordance with FASB ASC 810, Consolidation, 1st Constitution Capital Trust II is not included in our consolidated financial statements. The debt is included in Tier 2 capital for the Company.
Lakeland Bancorp Capital Trust II, a non-consolidated subsidiary of the Company acquired as part of the Lakeland acquisition and a Delaware statutory business trust established in June 2003, issued $20.0 million of variable rate capital trust pass-through
securities to investors. In accordance with FASB ASC 810, Consolidation, Lakeland Bancorp Capital Trust II is not included in our consolidated financial statements. The debt is included in Tier 2 capital for the Company.
Lakeland Bancorp Capital Trust IV, a non-consolidated subsidiary of the Company acquired as part of the Lakeland acquisition and a Delaware statutory business trust established in May 2007, issued $20.0 million of variable rate capital trust pass-through securities to investors. In accordance with FASB ASC 810, Consolidation, Lakeland Bancorp Capital Trust IV is not included in our consolidated financial statements. On August 3, 2015, Lakeland acquired and extinguished $10.0 million of Lakeland Bancorp Capital Trust IV debentures. The debt is included in Tier 2 capital for the Company.
Sussex Capital Trust II, a non-consolidated subsidiary of the Company acquired as part of the SB One acquisition and a Delaware statutory business trust established on June 28, 2007, issued $12.5 million of variable rate capital trust pass-through securities to investors. In accordance with FASB ASC 810, Consolidation, Sussex Capital Trust II is not included in our consolidated financial statements. The debt is included in Tier 2 capital for the Company.
Subordinated debentures as of December 31, 2024 and 2023 totaled $401.6 million and $10.7 million, respectively.
(11) Benefit Plans
Pension and Post-retirement Benefits
The Bank has a noncontributory defined benefit pension plan covering its full-time employees who had attained age 21 with at least one year of service as of April 1, 2003. The pension plan was frozen on April 1, 2003. All participants in the pension plan are 100% vested. The pension plan’s assets are invested in investment funds and group annuity contracts currently managed by the Principal Financial Group and Allmerica Financial. Based on the measurement date of December 31, 2024, no contributions will be made to the pension plan in 2025.
In addition to pension benefits, certain health care and life insurance benefits are currently made available to certain of the Bank’s retired employees. The costs of such benefits are accrued based on actuarial assumptions from the date of hire to the date the employee is fully eligible to receive the benefits. Effective January 1, 2003, eligibility for retiree health care benefits was frozen as to new entrants and benefits were eliminated for employees with less than ten years of service as of December 31, 2002. Effective January 1, 2007, eligibility for retiree life insurance benefits was frozen as to new entrants and retiree life insurance benefits were eliminated for employees with less than ten years of service as of December 31, 2006.
The following table sets forth information regarding the pension plan and post-retirement healthcare and life insurance plans (in thousands):
| | | | | | | | | | | | | | | | | | | | | | | | | | | | | | | | | | | |
| | Pension | | Post-retirement |
| | 2024 | | 2023 | | 2022 | | 2024 | | 2023 | | 2022 |
| Change in benefit obligation: | | | | | | | | | | | |
| Benefit obligation at beginning of year | $ | 24,423 | | | 24,550 | | | 32,517 | | | 11,344 | | | 12,095 | | | 16,748 | |
| Service cost | — | | | — | | | — | | | 11 | | | 13 | | | 28 | |
| Interest cost | 1,154 | | | 1,208 | | | 855 | | | 540 | | | 600 | | | 443 | |
| Actuarial (gain) loss | (65) | | | (149) | | | (48) | | | (10) | | | (357) | | | 140 | |
| Benefits paid | (1,639) | | | (1,648) | | | (1,658) | | | (681) | | | (658) | | | (933) | |
| Change in actuarial assumptions | (1,275) | | | 462 | | | (7,116) | | | (111) | | | (349) | | | (4,331) | |
| Benefit obligation at end of year | $ | 22,598 | | | 24,423 | | | 24,550 | | | 11,093 | | | 11,344 | | | 12,095 | |
| Change in plan assets: | | | | | | | | | | | |
| Fair value of plan assets at beginning of year | $ | 52,734 | | | 47,930 | | | 58,451 | | | — | | | — | | | — | |
| Actual (loss) return on plan assets | 4,775 | | | 6,452 | | | (8,863) | | | — | | | — | | | — | |
| Employer contributions | — | | | — | | | — | | | 681 | | | 658 | | | 933 | |
| Benefits paid | (1,639) | | | (1,648) | | | (1,658) | | | (681) | | | (658) | | | (933) | |
| Fair value of plan assets at end of year | 55,870 | | | 52,734 | | | 47,930 | | | — | | | — | | | — | |
| Funded status at end of year | $ | 33,272 | | | 28,311 | | | 23,380 | | | (11,093) | | | (11,344) | | | (12,095) | |
For the years ended December 31, 2024 and 2023, the Company, in the measurement of its pension plan and post-retirement obligations updated its mortality assumptions to the PRI 2012 mortality table with the fully generational projection scale MP 2021 issued by The Society of Actuaries ("SOA") in October 2021. The prepaid pension benefits of $33.3 million and the unfunded post-retirement healthcare and life insurance benefits of $11.1 million as of December 31, 2024 are included in Other assets and Other liabilities, respectively, in the Consolidated Statements of Financial Condition.
The components of accumulated other comprehensive loss (income) related to the pension plan and other post-retirement benefits, on a pre-tax basis, as of December 31, 2024 and 2023 are summarized in the following table (in thousands):
| | | | | | | | | | | | | | | | | | | | | | | |
| | Pension | | Post-retirement |
| | 2024 | | 2023 | | 2024 | | 2023 |
| Unrecognized prior service cost | $ | — | | | — | | | — | | | — | |
| Unrecognized net actuarial loss (income) | 2,573 | | | 5,633 | | | (8,381) | | | (10,378) | |
| Total accumulated other comprehensive loss (income) | $ | 2,573 | | | 5,633 | | | (8,381) | | | (10,378) | |
Net periodic (benefit) increase cost for the years ending December 31, 2024, 2023 and 2022, included the following components (in thousands):
| | | | | | | | | | | | | | | | | | | | | | | | | | | | | | | | | | | |
| | Pension | | Post-retirement |
| | 2024 | | 2023 | | 2022 | | 2024 | | 2023 | | 2022 |
| Service cost | $ | — | | | — | | | — | | | 11 | | | 13 | | | 28 | |
| Interest cost | 1,154 | | | 1,208 | | | 855 | | | 540 | | | 600 | | | 443 | |
| Return on plan assets | (3,112) | | | (2,824) | | | (3,456) | | | — | | | — | | | — | |
| Amortization of: | | | | | | | | | | | |
| Net loss (gain) | 57 | | | 709 | | | — | | | (2,118) | | | (2,130) | | | (1,304) | |
| | | | | | | | | | | |
| Unrecognized prior service cost | — | | | — | | | — | | | — | | | — | | | — | |
| | | | | | | | | | | |
| Net periodic (benefit) increase cost | $ | (1,901) | | | (907) | | | (2,601) | | | (1,567) | | | (1,517) | | | (833) | |
The weighted average actuarial assumptions used in the plan determinations as of December 31, 2024, 2023 and 2022 were as follows: | | | | | | | | | | | | | | | | | | | | | | | | | | | | | | | | | | | |
| | Pension | | Post-retirement |
| | 2024 | | 2023 | | 2022 | | 2024 | | 2023 | | 2022 |
| Discount rate | 5.50 | % | | 4.90 | % | | 5.10 | % | | 5.50 | % | | 4.90 | % | | 5.10 | % |
| Rate of compensation increase | — | | | — | | | — | | | — | | | — | | | — | |
| Expected return on plan assets | 6.00 | | | 6.00 | | | 6.00 | | | — | | | — | | | — | |
| Medical and life insurance benefits cost rate of increase | — | | | — | | | — | | | 5.00 | | | 5.50 | | | 6.00 | |
The Company provides its actuary with certain rate assumptions used in measuring the benefit obligation. The most significant of these is the discount rate used to calculate the period-end present value of the benefit obligations, and the expense to be included in the following year’s financial statements. A lower discount rate will result in a higher benefit obligation and expense, while a higher discount rate will result in a lower benefit obligation and expense. The discount rate assumption was determined based on a cash flow-yield curve model specific to the Company’s pension and post-retirement plans. The Company compares this rate to certain market indices, such as long-term treasury bonds, or the Citigroup pension liability indices, for reasonableness. A discount rate of 5.50% was selected for the December 31, 2024 measurement date.
Assumed health care cost trend rates have a significant effect on the amounts reported for health care plans. A 1% change in the assumed health care cost trend rate would have had the following effects on post-retirement benefits as of December 31, 2024 (in thousands):
| | | | | | | | | | | |
| 1% increase | | 1% decrease |
| Effect on total service cost and interest cost | $ | 60 | | | (55) | |
| Effect on post-retirement benefits obligation | $ | 1,100 | | | (950) | |
Estimated future benefit payments, which reflect expected future service, as appropriate for the next five years, are as follows (in thousands):
| | | | | | | | | | | |
| Pension | | Post-retirement |
| 2025 | $ | 1,759 | | | 751 | |
| 2026 | 1,769 | | | 756 | |
| 2027 | 1,786 | | | 777 | |
| 2028 | 1,791 | | | 785 | |
| 2029 | 1,803 | | | 800 | |
The weighted-average asset allocation of pension plan assets as of December 31, 2024 and 2023 were as follows:
| | | | | | | | | | | | | | |
| Asset Category | | 2024 | | 2023 |
| Domestic equities | | 37 | % | | 38 | % |
| Foreign equities | | 11 | % | | 11 | % |
| Fixed income | | 50 | % | | 49 | % |
| Real estate | | 2 | % | | 2 | % |
| Cash | | — | % | | — | % |
| Total | | 100 | % | | 100 | % |
The Company’s expected return on pension plan assets assumption is based on historical investment return experience and evaluation of input from the Plan's Investment Consultant and the Company's Benefits Committee which manages the pension plan’s assets. The expected return on pension plan assets is also impacted by the target allocation of assets, which is based on the Company’s goal of earning the highest rate of return while maintaining risk at acceptable levels.
Management strives to have pension plan assets sufficiently diversified so that adverse or unexpected results from one security class will not have a significant detrimental impact on the entire portfolio. The target allocation of assets and acceptable ranges around the targets are as follows:
| | | | | | | | | | | | | | |
| Asset Category | | Target | | Allowable Range |
| Domestic equities | | 37 | % | | 30-41% |
| Foreign equities | | 11 | % | | 5-13% |
| Fixed income | | 50 | % | | 40-65% |
| Real estate | | 2 | % | | 0-4% |
| Cash | | — | % | | 0% |
| Total | | 100 | % | | |
The Company anticipates that the long-term asset allocation on average will approximate the targeted allocation. Actual asset allocations are the result of investment decisions by a third-party investment manager.
The following tables present the assets that are measured at fair value on a recurring basis by level within the GAAP fair value hierarchy as reported on the statements of net assets available for Plan benefits as of December 31, 2024 and 2023, respectively (in thousands):
Financial assets and liabilities are classified in their entirety based on the lowest level of input that is significant to the fair value measurement.
| | | | | | | | | | | | | | | | | | | | | | | |
| | Fair value measurements as of December 31, 2024 |
| Total | | (Level 1) | | (Level 2) | | (Level 3) |
| Group annuity contracts | $ | 73 | | | — | | | 73 | | | — | |
| Mutual funds: | | | | | | | |
| Fixed income | 27,740 | | | 27,740 | | | — | | | — | |
| International equity | 6,042 | | | 6,042 | | | — | | | — | |
| Large U.S. equity | 1,654 | | | 1,654 | | | — | | | — | |
| Small/Mid U.S. equity | 1,127 | | | 1,127 | | | — | | | — | |
| Total mutual funds | 36,563 | | | 36,563 | | | — | | | — | |
| | | | | | | |
| Pooled separate accounts | 19,234 | | | — | | | 19,234 | | | — | |
| | | | | | | |
| Total Plan assets | $ | 55,870 | | | 36,563 | | | 19,307 | | | — | |
| | | | | | | | | | | | | | | | | | | | | | | |
| | Fair value measurements as of December 31, 2023 |
| Total | | (Level 1) | | (Level 2) | | (Level 3) |
| Group annuity contracts | $ | 76 | | | — | | | 76 | | | — | |
| Mutual funds: | | | | | | | |
| Fixed income | 25,728 | | | 25,728 | | | — | | | — | |
| International equity | 5,713 | | | 5,713 | | | — | | | — | |
| Large U.S. equity | 1,577 | | | 1,577 | | | — | | | — | |
| Small/Mid U.S. equity | 1,114 | | | 1,114 | | | — | | | — | |
| Total mutual funds | 34,132 | | | 34,132 | | | — | | | — | |
| | | | | | | |
| | | | | | | |
| | | | | | | |
| | | | | | | |
| Pooled separate accounts | 18,526 | | | — | | | 18,526 | | | — | |
| Total Plan assets | $ | 52,734 | | | 34,132 | | | 18,602 | | | — | |
401(k) Plan
The Bank has a 401(k) plan, and in connection with the merger with Lakeland assumed the Lakeland Bancorp, Inc. Salary Savings 401(k) and Trust Plan, both of which cover substantially all employees of the Bank. For 2024, 2023 and 2022, the Bank matched 25% of the first 6% contributed by the participants. The contribution percentage is determined by the board of directors in its sole discretion. The Bank’s aggregate contributions to the 401(k) Plan for 2024, 2023 and 2022 were $2.5 million, $1.3 million and $1.2 million, respectively.
Supplemental Executive Retirement Plan
The Bank maintains a non-qualified supplemental retirement plan for certain senior officers of the Bank. This unfunded plan, which was frozen as of April 1, 2003, provides benefits in excess of the benefits permitted to be paid by the pension plan under provisions of the tax law. Amounts expensed under this supplemental retirement plan amounted to $76,000, $73,000 and $73,000 for the years 2024, 2023 and 2022, respectively. As of December 31, 2024 and 2023, $1.6 million and $1.6 million, respectively, were recorded in Other liabilities on the Consolidated Statements of Financial Condition for this supplemental retirement plan. In connection with this supplemental retirement plan, an increase of $57,000, net of tax, was recorded in other comprehensive income (loss) for 2024, while there was no change recorded in other comprehensive income (loss) for 2023, while an increase of $283,000, net of tax, was recorded for 2022.
Retirement Plan for the Board of Directors of Provident Bank
The Bank maintains a Retirement Plan for the board of directors of the Bank, a non-qualified plan that provides cash payments for up to 10 years to eligible retired board members based on age and length of service requirements. The maximum payment under this plan to a board member, who terminates service on or after the age of 72 with at least ten years of service on the board, is forty quarterly payments of $2,500. The Bank may suspend payments under this plan if it does not meet Federal Deposit Insurance Corporation or New Jersey Department of Banking and Insurance minimum capital requirements. The Bank may terminate this plan at any time although such termination may not reduce or eliminate any benefit previously accrued to a board member without his or her consent. The plan was amended in December 2005 to terminate benefits under this plan for any directors who had less than ten years of service on the board of directors of the Bank as of December 31, 2006.
The plan further provides that, in the event of a change in control (as defined in the plan), the undistributed balance of a director’s accrued benefit will be distributed to him or her within 60 days of the change in control. The Bank paid $10,000, $5,000, and $5,000 to former board members under this plan for each of the years ended December 31, 2024, 2023 and 2022, respectively. As of December 31, 2024 and 2023, $776,000 and $128,000, respectively, were recorded in other liabilities on the Consolidated Statements of Financial Condition for this retirement plan. A minimal increase of $500, net of tax, was recorded in other comprehensive income for 2024, while there was a decrease of $7,000, net of tax, recorded in other comprehensive income for 2023 and an increase of $11,000 recorded in 2022, respectively, in connection with this plan.
Employee Stock Ownership Plan
The ESOP is a tax-qualified plan designed to invest primarily in the Company’s common stock that provides employees with the opportunity to receive a funded retirement benefit from the Bank, based primarily on the value of the Company’s common stock. The ESOP purchased 4,769,464 shares of the Company’s common stock at an average price of $17.09 per share with the proceeds of a loan from the Company to the ESOP. As of December 31, 2024, there was no outstanding loan principal, as the Bank made the final repayment on borrowed funds in December 2024. A final allocation of shares will be made to participants in May.
For the years ending December 31, 2024 and 2023, 286,564 shares and 311,946 shares from the ESOP were released, respectively. As of December 31, 2024, there were no remaining unallocated ESOP shares held in suspense, as final repayment was made in December. ESOP compensation expense for the years ended December 31, 2024, 2023 and 2022 was $2.6 million, $3.1 million and $4.1 million, respectively.
Non-Qualified Supplemental Defined Contribution Plan (“the Supplemental Employee Stock Ownership Plan”)
Effective January 1, 2004, the Bank established a deferred compensation plan for executive management and key employees of the Bank, known as Provident Bank Non-Qualified Supplemental Employee Stock Ownership Plan (the “Supplemental ESOP”). The Supplemental ESOP was amended and restated as the Non-Qualified Supplemental Defined Contribution Plan (the “Supplemental DC Plan”), effective January 1, 2010. The Supplemental DC Plan is a non-qualified plan that provides additional benefits to certain executives whose benefits under the 401(k) Plan and ESOP are limited by tax law limitations applicable to tax-qualified plans. The Supplemental DC Plan requires a contribution by the Bank for each participant who also participates in the 401(k) Plan and ESOP equal to the amount that would have been contributed under the terms of the 401(k) Plan and ESOP but for the tax law limitations, less the amount actually contributed under the 401(k) Plan and ESOP.
The Supplemental DC Plan provides for a phantom stock allocation for qualified contributions that may not be accrued in the qualified ESOP and for matching contributions that may not be accrued in the qualified 401(k) Plan due to tax law limitations. Under the Supplemental 401(k) provision, the estimated expense (benefit) for the years ending December 31, 2024, 2023 and 2022 was $37,000, $262,000 and $312,000, respectively, and included the matching contributions plus interest credited at an annual rate equal to the ten-year bond-equivalent yield on U.S. Treasury securities. Under the Supplemental ESOP provision, the estimated expense for the years ending December 31, 2024, 2023 and 2022 was $23,000, $432,000 and $144,000, respectively. The phantom equity is treated as equity awards (expensed at the time of allocation) and not liability awards which would require periodic adjustment to market, as participants do not have an option to take their distribution in cash.
2024 Equity Plan
Upon stockholders’ approval of the 2024 Equity Plan on April 25, 2024, shares available for stock awards and stock options under the Amended and Restated Long-Term Incentive Plan were reserved for issuance under the new 2024 Equity Plan. No additional grants of stock awards and stock options will be made under the Amended and Restated Long-Term Incentive Plan. The new plan authorized the issuance of up to 2,100,000 shares of Company common stock to be issued as stock awards. As of December 31, 2024, 2,271,833 shares remain available for grant under the plan. Shares previously awarded under prior equity incentive plans that are subsequently forfeited or expire may also be issued under this new plan.
Stock Awards
As a general rule, restricted stock grants are held in escrow for the benefit of the award recipient until vested. Awards outstanding generally vest in three annual installments, commencing one year from the date of the award. Additionally, certain
awards are three-year performance-vesting awards, which may or may not vest depending upon the attainment of certain corporate financial targets. Expense attributable to stock awards amounted to $8.4 million, $7.6 million and $9.4 million for the years ended December 31, 2024, 2023 and 2022, respectively.
A summary status of the granted but unvested stock awards as of December 31, and changes during the year, is presented below: | | | | | | | | | | | | | | | | | |
| | Restricted Stock Awards |
| | 2024 | | 2023 | | 2022 |
| Outstanding at beginning of year | 1,053,092 | | | 1,023,130 | | | 900,483 | |
| Granted | 901,360 | | | 427,053 | | | 447,526 | |
| Forfeited | (428,307) | | | (328,761) | | | (105,556) | |
| Vested | (63,307) | | | (68,330) | | | (219,323) | |
| Outstanding at the end of year | 1,462,838 | | | 1,053,092 | | | 1,023,130 | |
As of December 31, 2024, unrecognized compensation cost relating to unvested restricted stock totaled $8.8 million. This amount will be recognized over a remaining weighted average period of 1.6 years.
Restricted Stock Units ("RSUs")
RSUs earn dividend equivalents (equal to cash dividends paid on the Company's common share) over the applicable performance or service period. Dividend equivalents, per the terms of the agreements, are accumulated and paid to the grantee on the quarterly dividend date, or forfeited if the applicable performance or service conditions are not met.
As part of the Lakeland acquisition, 302,805 shares were acquired on May 16, 2024. During the year, 3,414 shares vested and 2,843 shares were forfeited. Outstanding shares at the end of the year totaled 296,548, with unrecognized compensation cost relating to unvested RSUs totaling $3.2 million. This amount will be recognized over a remaining weighted average period of 1.9 years.
Stock Options
Each stock option granted entitles the holder to purchase one share of the Company’s common stock at an exercise price not less than the fair value of a share of the Company’s common stock at the date of grant. Options generally vest over a five-year period from the date of grant and expire no later than 10 years following the grant date. Additionally, certain options are three-year performance-vesting options, which may or may not vest depending upon the attainment of certain corporate financial targets.
A summary of the status of the granted but unexercised stock options as of December 31, 2024, 2023 and 2022, and changes during the year is presented below:
| | | | | | | | | | | | | | | | | | | | | | | | | | | | | | | | | | | |
| | 2024 | | 2023 | | 2022 |
| | Number of stock options | | Weighted average exercise price | | Number of stock options | | Weighted average exercise price | | Number of stock options | | Weighted average exercise price |
| Outstanding at beginning of year | 548,925 | | | $ | 19.37 | | | 600,806 | | | $ | 19.01 | | | 566,453 | | | $ | 18.73 | |
| Granted | — | | | — | | | — | | | — | | | 34,353 | | | 23.70 | |
| Exercised | — | | | — | | | (51,881) | | | 15.23 | | | — | | | — | |
| Forfeited | — | | | — | | | — | | | — | | | — | | | — | |
| Expired | (80,762) | | | 16.38 | | | — | | | — | | | — | | | — | |
| Outstanding at the end of year | 468,163 | | | $ | 19.89 | | | 548,925 | | | $ | 19.37 | | | 600,806 | | | $ | 19.01 | |
The total fair value of options vesting during 2024, 2023 and 2022 was $133,000, $198,000 and $195,000, respectively.
Compensation expense of approximately $11,000 and $77,000 is projected for 2025 and 2026 respectively, on stock options outstanding as of December 31, 2024. After March 2025, there are no unvested stock options expensed.
The following table summarizes information about stock options outstanding as of December 31, 2024:
| | | | | | | | | | | | | | | | | | | | | | | | | | | | | |
| | Options Outstanding | | Options Exercisable |
| Range of exercise prices | Number of options outstanding | | Average remaining contractual life | | Weighted average exercise price | | Number of options exercisable | | Weighted average exercise price |
| $18.34-18.70 | 142,299 | | | 1.1 | | $ | 18.53 | | | 142,299 | | | $ | 18.53 | |
| $20.62-27.25 | 325,864 | | | 4.8 | | $ | 23.20 | | | 314,413 | | | $ | 23.19 | |
The stock options outstanding and stock options exercisable as of December 31, 2024, both had an aggregate intrinsic value of $48,000.
The expense related to stock options is based on the fair value of the options at the date of the grant and is recognized ratably over the vesting period of the options.
Compensation expense related to the Company’s stock option plan totaled $77,000, $144,000 and $198,000 for 2024, 2023 and 2022, respectively.
The estimated fair values were determined on the dates of grant using the Black-Scholes Option pricing model. The fair value of the Company’s stock option awards are expensed on a straight-line basis over the vesting period of the stock option. The risk-free rate is based on the implied yield on a U.S. Treasury bond with a term approximating the expected term of the option. The expected volatility computation is based on historical volatility over a period approximating the expected term of the option. The dividend yield is based on the annual dividend payment per share, divided by the grant date stock price. The expected option term is a function of the option life and the vesting period.
There were no options granted during 2024 or 2023.
(12) Income Taxes
The current and deferred amounts of income tax expense (benefit) for the years ended December 31, 2024, 2023 and 2022 are as follows (in thousands):
| | | | | | | | | | | | | | | | | |
| | Years ended December 31, |
| | 2024 | | 2023 | | 2022 |
| Current: | | | | | |
| Federal | $ | 30,510 | | | 31,972 | | | 41,379 | |
| State | 15,851 | | | 12,684 | | | 20,859 | |
| Total current income tax expense | 46,361 | | | 44,656 | | | 62,238 | |
| Deferred: | | | | | |
| Federal | (1,406) | | | 905 | | | 1,825 | |
| State | (10,865) | | | 1,820 | | | 395 | |
| Total deferred income tax expense | (12,271) | | | 2,725 | | | 2,220 | |
| Total income tax expense | $ | 34,090 | | | 47,381 | | | 64,458 | |
The Company recorded a deferred tax (benefit) expense of ($5.0) million, $11.1 million and ($68.2) million during 2024, 2023 and 2022, respectively, related to the unrealized gains (losses) on available for sale debt securities, which is reported in accumulated other comprehensive income (loss), net of tax. The Company recorded a deferred tax (benefit) expense of ($2.0) million, ($3.9) million and $6.2 million in 2024, 2023 and 2022, respectively, related to the unrealized gains (losses) on cash flow hedge advances, which is reported in accumulated other comprehensive income (losses), net of tax. Also, the Company recorded a deferred tax expense (benefit) of $1.1 million, $884,000 and $(517,000) in 2024, 2023 and 2022, respectively,
related to the amortization of post-retirement benefit obligations, which is reported in accumulated other comprehensive income (loss), net of tax.
A reconciliation between the amount of reported total income tax expense and the amount computed by multiplying the applicable statutory income tax rate is as follows (in thousands): | | | | | | | | | | | | | | | | | |
| | Years ended December 31, |
| | 2024 | | 2023 | | 2022 |
| Tax expense at statutory rates | $ | 31,419 | | | 36,932 | | | 50,422 | |
| Increase (decrease) in taxes resulting from: | | | | | |
| State tax, net of federal income tax benefit | 11,027 | | | 11,313 | | | 16,791 | |
| Rate Change | (7,008) | | | — | | | — | |
| Tax-exempt interest income | (2,861) | | | (2,514) | | | (2,590) | |
| Bank-owned life insurance | (2,459) | | | (1,361) | | | (1,257) | |
| | | | | |
| | | | | |
| Other, net | 3,972 | | | 3,011 | | | 1,092 | |
| Total income tax expense | $ | 34,090 | | | 47,381 | | | 64,458 | |
The net deferred tax asset is included in other assets in the Consolidated Statements of Financial Condition. The tax effects of temporary differences that give rise to significant portions of the deferred tax assets and deferred tax liabilities as of December 31, 2024 and 2023 are as follows (in thousands):
| | | | | | | | | | | |
| 2024 | | 2023 |
| Deferred tax assets: | | | |
| Allowance for credit losses on loans | $ | 54,931 | | | 28,404 | |
| Allowance for credit loss on off-balance sheet ("OBS") credit exposure | 1,998 | | | 924 | |
| Post-retirement benefit | 5,485 | | | 5,758 | |
| Deferred compensation | 2,926 | | | 384 | |
| | | |
| | | |
| | | |
| Purchase accounting adjustments | 105,950 | | | — | |
| Depreciation | 4,836 | | | 1,126 | |
| SERP | 1,991 | | | 1,137 | |
| ESOP | — | | | 402 | |
| Stock-based compensation | 3,694 | | | 2,963 | |
| | | |
| Non-accrual interest | 807 | | | 172 | |
| | | |
| | | |
| State Net Operating Loss ("NOL") | 2,268 | | | — | |
| Federal NOL | 1,389 | | | 160 | |
| Unrealized losses on available for sale debt securities | 66,646 | | | 57,198 | |
| | | |
| | | |
| Lease liability | 18,489 | | | 15,914 | |
| Other | 4,666 | | | 112 | |
| Total gross deferred tax assets | 276,076 | | | 114,654 | |
| | | |
| Deferred tax liabilities: | | | |
| | | |
| Pension expense | 10,161 | | | 8,997 | |
| Contingent consideration | 436 | | | 283 | |
| Deferred loan costs | 17,668 | | | 11,376 | |
| Investment securities, principally due to accretion of discounts | 71 | | | 66 | |
| Purchase accounting adjustments | — | | | 371 | |
| Intangibles | 2,151 | | | 1,620 | |
| | | |
| Originated mortgage servicing rights | 129 | | | 147 | |
| | | |
| Pension liability adjustments | 2,546 | | | 1,459 | |
| Net unrealized gain on hedging activities | 1,641 | | | 3,674 | |
| Lease right-of-use asset | 17,648 | | | 15,084 | |
| | | |
| Total gross deferred tax liabilities | 52,451 | | | 43,077 | |
| Net deferred tax asset | $ | 223,625 | | | 71,577 | |
Retained earnings as of December 31, 2024 includes approximately $51.8 million for which no provision for income tax has been made. This amount represents an allocation of income to bad debt deductions for tax purposes only. Events that would result in taxation of these reserves include the failure to qualify as a bank for tax purposes, distributions in complete or partial liquidation, stock redemptions and excess distributions to stockholders. As of December 31, 2024, the Company had an unrecognized tax liability of $14.7 million with respect to this reserve.
As a result of the Beacon acquisition in 2011 and the Lakeland acquisition in 2024, the Company acquired federal net operating loss carryforwards. There are approximately $6.6 million of NOL carryforwards available to offset future taxable income as of December 31, 2024. If not utilized, $653,000 of carryforward will expire in 2031, but the balance can be carried forward indefinitely subject to an 80% limitation on utilization. The federal NOLs are subject to annual Code Section 382 limitation in the amount of approximately $197,000. The Company has a state NOL carryforward of $61.9 million, as a result of the Lakeland acquisition. These net operating losses are subject to an annual limitation of approximately $30 million under IRS section 382. Management has determined that it is more likely than not that it will realize the net deferred tax asset based upon the nature and timing of the items listed above. In order to fully realize the net deferred tax asset, the Company will need to generate future taxable income. Management has projected that the Company will generate sufficient taxable income to utilize the net deferred tax asset; however, there can be no assurance that such levels of taxable income will be generated.
The Company’s policy is to report interest and penalties, if any, related to unrecognized tax benefits in income tax expense. The Company did not have any liabilities for uncertain tax positions as of December 31, 2024 and 2023.
The Company and its subsidiaries file a consolidated U.S. Federal income tax return. For tax periods prior to December 31, 2018, New Jersey tax law does not and has not allowed for a taxpayer to file a tax return on a combined or consolidated basis with another member of the affiliated group where there is common ownership. The Company and its subsidiaries is required to file a combined New Jersey state income tax return on apportioned and allocated income. Also, the Company and its subsidiaries file a combined tax income tax return in New York State, New York City, and will file a Connecticut income tax return based upon apportioned and allocated income. The Company, through its bank subsidiary, files a Pennsylvania Mutual Thrift Institution Tax return.
The Company's Federal and Pennsylvania Mutual Thrift Institutions tax returns are open for examination from 2021. The Company's New York State tax returns are open for examination from 2021. The Company's New Jersey State tax returns are open for examination from 2020.
(13) Commitments and Concentrations of Credit Risk
In the normal course of conducting its business, the Bank extends credit to meet the financing needs of its customers through commitments. Commitments and contingent liabilities, such as commitments to extend credit (including loan commitments of $2.73 billion and $2.09 billion as of December 31, 2024 and 2023, respectively, and undisbursed home equity and personal credit lines of $382.1 million and $273.0 million, as of December 31, 2024 and 2023, respectively, are not reflected in the accompanying consolidated financial statements. These instruments involve elements of credit and interest rate risk in excess of the amount recognized in the consolidated financial statements. The Bank uses the same credit policies and collateral requirements in making commitments and conditional obligations as it does for on-balance sheet loans. Commitments generally have fixed expiration dates or other termination clauses and may require payment of a fee. Since the commitments may expire without being drawn upon, the total commitment amounts do not necessarily represent future cash requirements.
The Bank evaluates each customer’s creditworthiness on a case-by-case basis. The amount of collateral obtained, if deemed necessary by the Bank upon extension of credit, is based on management’s credit evaluation of the borrower.
The Bank grants residential real estate loans on single- and multi-family dwellings to borrowers primarily in New Jersey. Its borrowers’ abilities to repay their obligations are dependent upon various factors, including the borrowers’ income and net worth, cash flows generated by the underlying collateral and value of the underlying collateral. Such factors are dependent upon various economic conditions and individual circumstances beyond the Bank’s control; the Bank is therefore subject to risk of loss. The Bank believes that its lending policies and procedures adequately minimize the potential exposure to such risks and that adequate provisions for loan losses are provided for all known and inherent risks. Collateral and/or guarantees are required for virtually all loans.
A substantial portion of the Bank’s loans are to borrowers operating in or, are secured by real estate located in New Jersey, our primary market area. Accordingly, the collectability of a substantial portion of the Bank’s loan portfolio may be susceptible to changes in local real estate market conditions and the regional business environment.
(14) Contingencies
The Company is involved in various legal actions and claims arising in the normal course of its business. Liabilities for loss contingencies arising from such litigation and claims are recorded when it is probable that a liability has been incurred and the amount can be reasonably estimated.
As a result of a pending claim, a $1.4 million charge was recorded in the fourth quarter of 2024 for estimated contingent litigation reserves, which increased the Company's total contingent litigation reserves to $2.0 million as of December 31, 2024.
(15) Regulatory Capital Requirements
FDIC regulations require banks to maintain minimum levels of regulatory capital. Under the regulations in effect as of December 31, 2024, the Bank is required to maintain: (1) a Tier 1 capital to total assets leverage ratio of 4.0%; (2) a common equity Tier 1 capital to risk-based assets ratio of 4.5%; (3) a Tier 1 capital to risk-based assets ratio of 6.0%; and (4) a total capital to risk-based assets ratio of 8.0%. In addition to establishing the minimum regulatory capital requirements, the regulations limit capital distributions and certain discretionary bonus payments to management if the institution does not hold a “capital conservation buffer” consisting of 2.5% of common equity Tier 1 capital to risk-weighted asset above the amount necessary to meet its minimum risk-based capital requirements.
Under its prompt corrective action regulations, the FDIC is required to take certain supervisory actions (and may take additional discretionary actions) with respect to an undercapitalized institution. Such actions could have a direct material effect on an institution’s financial statements. The regulations establish a framework for the classification of savings institutions into five categories: well capitalized; adequately capitalized; undercapitalized, significantly undercapitalized; and critically undercapitalized. Generally, an institution is considered well capitalized if it has: a leverage (Tier 1) capital ratio of at least 5.00%; a common equity Tier 1 risk-based capital ratio of 6.50%; a Tier 1 risk-based capital ratio of at least 8.00%; and a total risk-based capital ratio of at least 10.00%.
In the first quarter of 2020, U.S. federal regulatory authorities issued an interim final rule providing banking institutions that adopt CECL during the 2020 calendar year with the option to delay for two years the estimated impact of CECL on regulatory capital, followed by a three-year transition period to phase out the aggregate amount of the capital benefit provided during the initial two-year delay (i.e., a five-year transition in total). In connection with its adoption of CECL on January 1, 2020, the Company elected to utilize the five-year CECL transition.
The foregoing capital ratios are based in part on specific quantitative measures of assets, liabilities and certain off-balance sheet items as calculated under regulatory accounting practices. Capital amounts and classifications are also subject to qualitative judgments by the FDIC about capital components, risk weightings and other factors.
As of December 31, 2024 and 2023, the Bank exceeded all minimum capital adequacy requirements to which it is subject. Further, the most recent FDIC notification categorized the Bank as a well-capitalized institution under the prompt corrective action regulations. There have been no conditions or events since that notification that management believes have changed the Bank’s capital classification.
The Company is regulated as a bank holding company, and as such, is subject to examination, regulation and periodic reporting under the Bank Holding Company Act, as administered by the Federal Reserve Board (“FRB”). The FRB has adopted capital adequacy guidelines for bank holding companies on a consolidated basis substantially similar to those of the FDIC for the Bank. As of December 31, 2024 and 2023, the Company was “well capitalized” under FRB guidelines. Regulations of the FRB provide that a bank holding company must serve as a source of strength to any of its subsidiary banks and must not conduct its activities in an unsafe or unsound manner. Under the prompt corrective action provisions discussed above, a bank holding company parent of an undercapitalized subsidiary bank would be directed to guarantee, within limitations, the capital restoration plan that is required of such an undercapitalized bank. If the undercapitalized bank fails to file an acceptable capital restoration plan or fails to implement an accepted plan, the FRB may prohibit the bank holding company parent of the undercapitalized bank from paying any dividend or making any other form of capital distribution without the prior approval of the FRB.
The following table shows the Company’s actual capital amounts and ratios as of December 31, 2024 and 2023, compared to the FRB minimum capital adequacy requirements and the FRB requirements for classification as a well-capitalized institution (dollars in thousands).
| | | | | | | | | | | | | | | | | | | | | | | | | | | | | | | | | | | | | | | | | | | | | | | |
| | Actual capital | | FRB minimum capital
adequacy requirements | | FRB minimum capital adequacy requirements with capital conservation buffer | | To be well-capitalized under prompt corrective action provisions |
| | Amount | | Ratio | | Amount | | Ratio | | Amount | | Ratio | | Amount | | Ratio |
| As of December 31, 2024 | | | | | | | | | | | | | | | |
| Tier 1 leverage capital | $ | 1,984,052 | | | 8.50 | % | | $ | 933,491 | | | 4.00 | % | | $ | 933,491 | | | 4.00 | % | | $ | 1,166,864 | | | 5.00 | % |
| Common equity Tier 1 risk-based capital | 1,984,052 | | | 9.98 | | | 894,957 | | | 4.50 | | | 1,392,156 | | | 7.00 | | | 1,292,716 | | | 6.50 | |
| Tier 1 risk-based capital | 1,984,052 | | | 9.98 | | | 1,193,276 | | | 6.00 | | | 1,690,475 | | | 8.50 | | | 1,591,035 | | | 8.00 | |
| Total risk-based capital | 2,614,625 | | | 13.15 | | | 1,591,035 | | | 8.00 | | | 2,088,233 | | | 10.50 | | | 1,988,794 | | | 10.00 | |
| | | | | | | | | | | | | | | | | | | | | | | | | | | | | | | | | | | | | | | | | | | | | | | |
| | Actual capital | | FRB minimum capital adequacy requirements | | FRB minimum capital
adequacy requirements with capital conservation buffer | | To be well-capitalized under prompt corrective action provisions |
| | Amount | | Ratio | | Amount | | Ratio | | Amount | | Ratio | | Amount | | Ratio |
| As of December 31, 2023 | | | | | | | | | | | | | | | |
| Tier 1 leverage capital | $ | 1,396,512 | | | 10.22 | % | | $ | 546,662 | | | 4.00 | % | | $ | 546,662 | | | 4.00 | % | | $ | 683,327 | | | 5.00 | % |
| Common equity Tier 1 risk-based capital | 1,383,625 | | | 11.45 | | | 543,720 | | | 4.50 | | | 845,786 | | | 7.00 | | | 785,373 | | | 6.50 | |
| Tier 1 risk-based capital | 1,396,512 | | | 11.56 | | | 724,959 | | | 6.00 | | | 1,027,026 | | | 8.50 | | | 966,612 | | | 8.00 | |
| Total risk-based capital | 1,496,545 | | | 12.39 | | | 966,612 | | | 8.00 | | | 1,268,679 | | | 10.50 | | | 1,208,266 | | | 10.00 | |
The following table shows the Bank’s actual capital amounts and ratios as of December 31, 2024 and 2023, compared to the FDIC minimum capital adequacy requirements and the FDIC requirements for classification as a well-capitalized institution (dollars in thousands).
| | | | | | | | | | | | | | | | | | | | | | | | | | | | | | | | | | | | | | | | | | | | | | | |
| | Actual capital | | FDIC minimum capital
adequacy requirements | | FDIC minimum capital adequacy requirements with capital conservation buffer | | To be well-capitalized under prompt corrective action provisions |
| | Amount | | Ratio | | Amount | | Ratio | | Amount | | Ratio | | Amount | | Ratio |
| As of December 31, 2024 | | | | | | | | | | | | | | | |
| Tier 1 leverage capital | $ | 2,265,907 | | | 9.72 | % | | $ | 932,593 | | | 4.00 | % | | $ | 932,593 | | | 4.00 | % | | $ | 1,165,742 | | | 5.00 | % |
| Common equity Tier 1 risk-based capital | 2,265,907 | | | 11.42 | | | 892,544 | | | 4.50 | | | 1,388,402 | | | 7.00 | | | 1,289,231 | | | 6.50 | |
| Tier 1 risk-based capital | 2,265,907 | | | 11.42 | | | 1,190,059 | | | 6.00 | | | 1,685,917 | | | 8.50 | | | 1,586,745 | | | 8.00 | |
| Total risk-based capital | 2,458,799 | | | 12.40 | | | 1,586,745 | | | 8.00 | | | 2,082,603 | | | 10.50 | | | 1,983,432 | | | 10.00 | |
| | | | | | | | | | | | | | | | | | | | | | | | | | | | | | | | | | | | | | | | | | | | | | | |
| | Actual capital | | FDIC minimum capital adequacy requirements | | FRB minimum capital
adequacy requirements with capital conservation buffer | | To be well-capitalized under prompt corrective action provisions |
| | Amount | | Ratio | | Amount | | Ratio | | Amount | | Ratio | | Amount | | Ratio |
| As of December 31, 2023 | | | | | | | | | | | | | | | |
| Tier 1 leverage capital | $ | 1,343,223 | | | 9.84 | % | | $ | 546,168 | | | 4.00 | % | | $ | 546,168 | | | 4.00 | % | | $ | 682,709 | | | 5.00 | % |
| Common equity Tier 1 risk-based capital | 1,343,223 | | | 11.12 | | | 543,465 | | | 4.50 | | | 845,390 | | | 7.00 | | | 785,005 | | | 6.50 | |
| Tier 1 risk-based capital | 1,343,223 | | | 11.12 | | | 724,620 | | | 6.00 | | | 1,026,545 | | | 8.50 | | | 966,160 | | | 8.00 | |
| Total risk-based capital | 1,443,256 | | | 11.95 | | | 966,160 | | | 8.00 | | | 1,268,085 | | | 10.50 | | | 1,207,700 | | | 10.00 | |
(16) Allowance for Credit Losses on Off-Balance Sheet Credit Exposures
Management analyzes the Company's exposure to credit losses for both on-balance sheet and off-balance sheet activity using a consistent methodology for the quantitative framework as well as the qualitative framework. For purposes of estimating the allowance for credit losses for off-balance sheet credit exposures, the exposure at default includes an estimated drawdown of unused credit based on historical credit utilization factors and current loss factors, resulting in a proportionate amount of expected credit losses.
For the years ended December 31, 2024, 2023 and 2022, the Company recorded a $4.0 million provision, a $264,000 provision and a $3.4 million negative provision for credit losses for off-balance sheet credit exposures, respectively.
The allowance for credit losses for off-balance sheet credit exposures was $7.4 million and $3.4 million as of December 31, 2024 and 2023, respectively, and are included in Other liabilities on the Consolidated Statements of Financial Condition.
(17) Fair Value Measurements
The Company utilizes fair value measurements to record fair value adjustments to certain assets and liabilities and to determine fair value disclosures. The determination of fair values of financial instruments often requires the use of estimates. Where quoted market values in an active market are not readily available, the Company utilizes various valuation techniques to estimate fair value.
Fair value is an estimate of the price that would be received to sell an asset or paid to transfer a liability in an orderly transaction between market participants at the measurement date. However, in many instances fair value estimates may not be substantiated by comparison to independent markets and may not be realized in an immediate sale of the financial instrument.
GAAP establishes a fair value hierarchy that prioritizes the inputs to valuation techniques used to measure fair value. The hierarchy gives the highest priority to unadjusted quoted prices in active markets for identical assets or liabilities (Level 1 measurements) and the lowest priority to unobservable inputs (Level 3 measurements). The three levels of fair value hierarchy are as follows:
| | | | | |
| Level 1: | Unadjusted quoted market prices in active markets that are accessible at the measurement date for identical, unrestricted assets or liabilities; |
| |
| Level 2: | Quoted prices in markets that are not active, or inputs that are observable either directly or indirectly, for substantially the full term of the asset or liability; and |
| |
| Level 3: | Prices or valuation techniques that require inputs that are both significant to the fair value measurement and unobservable (i.e., supported by little or no market activity). |
A financial instrument’s level within the fair value hierarchy is based on the lowest level of input that is significant to the fair value measurement.
The valuation techniques are based upon the unpaid principal balance only, and exclude any accrued interest or dividends at the measurement date. Interest income and expense and dividend income are recorded within the consolidated statements of income depending on the nature of the instrument using the effective interest method based on acquired discount or premium.
Assets Measured at Fair Value on a Recurring Basis
The valuation techniques described below were used to measure fair value of financial instruments in the table below on a recurring basis as of December 31, 2024 and December 31, 2023.
Available for Sale Debt Securities, at Fair Value
For available for sale debt securities, fair value was estimated using a market approach. The majority of the Company’s securities are fixed income instruments that are not quoted on an exchange, but are traded in active markets. Prices for these instruments are obtained through third-party data service providers or dealer market participants with whom the Company has historically transacted both purchases and sales of securities. Prices obtained from these sources include market quotations and matrix pricing. Matrix pricing, a Level 2 input, is a mathematical technique used principally to value certain securities by
benchmarking to comparable securities. The Company evaluates the quality of Level 2 matrix pricing through comparison to similar assets with greater liquidity and evaluation of projected cash flows. As management is responsible for the determination of fair value, it performs quarterly analyses on the prices received from the pricing service to determine whether the prices are reasonable estimates of fair value. Specifically, management compares the prices received from the pricing service to a secondary pricing source. Additionally, management compares changes in the reported market values and returns to relevant market indices to test the reasonableness of the reported prices. The Company’s internal price verification procedures and review of fair value methodology documentation provided by independent pricing services has generally not resulted in an adjustment in the prices obtained from the pricing service. The Company also holds debt instruments issued by the U.S. government that are traded in active markets with readily accessible quoted market prices that are considered Level 1 within the fair value hierarchy.
Equity Securities, at Fair Value
The Company holds equity securities that are traded in active markets with readily accessible quoted market prices that are considered Level 1 inputs.
Derivatives
The Company records all derivatives on the statements of financial condition at fair value. The accounting for changes in the fair value of derivatives depends on the intended use of the derivative, whether the Company has elected to designate a derivative in a hedging relationship and apply hedge accounting and whether the hedging relationship has satisfied the criteria necessary to apply hedge accounting. The Company has interest rate derivatives resulting from a service provided to certain qualified borrowers in a loan related transaction which, therefore, are not used to manage interest rate risk in the Company’s assets or liabilities. As such, all changes in fair value of these derivatives are recognized directly in earnings.
The Company also uses interest rate swaps as part of its interest rate risk management strategy. Interest rate swaps designated as cash flow hedges, and which satisfy hedge accounting requirements, involve the receipt of variable amounts from a counterparty in exchange for the Company making fixed-rate payments over the life of the agreements without the exchange of the underlying notional amount. These derivatives were used to hedge the variable cash outflows associated with FHLBNY borrowings and brokered demand deposits. The change in the fair value of these derivatives is recorded in accumulated other comprehensive income (loss), and is subsequently reclassified into earnings in the period that the forecasted transactions affect earnings.
The fair value of the Company's derivatives is determined using discounted cash flow analysis using observable market-based inputs, which are considered Level 2 inputs.
Assets Measured at Fair Value on a Non-Recurring Basis
The valuation techniques described below were used to estimate fair value of financial instruments measured on a non-recurring basis as of December 31, 2024 and 2023.
Collateral Dependent Impaired Loans
For loans measured for impairment based on the fair value of the underlying collateral, fair value was estimated using a market approach. The Company measures the fair value of collateral underlying impaired loans primarily through obtaining independent appraisals that rely upon quoted market prices for similar assets in active markets. These appraisals include adjustments, on an individual case-by-case basis, to comparable assets based on the appraisers’ market knowledge and experience, as well as adjustments for estimated costs to sell between 5% and 10%. Management classifies these loans as Level 3 within the fair value hierarchy.
Foreclosed Assets
Assets acquired through foreclosure or deed in lieu of foreclosure are carried at the lower of the outstanding loan balance at the time of foreclosure or fair value, less estimated selling costs, which range between 5% and 10%. Fair value is generally based on independent appraisals that rely upon quoted market prices for similar assets in active markets. These appraisals include adjustments, on an individual case basis, to comparable assets based on the appraisers’ market knowledge and experience, and are classified as Level 3. When an asset is acquired, the excess of the loan balance over fair value less estimated selling costs is charged to the allowance for credit losses. A reserve for foreclosed assets may be established to provide for possible write-downs and selling costs that occur subsequent to foreclosure. Foreclosed assets are carried net of the
related reserve. Operating results from real estate owned, including rental income, operating expenses, and gains and losses realized from the sales of real estate owned, are recorded as incurred.
There were no changes to the valuation techniques for fair value measurements during the years ended December 31, 2024 and 2023.
The following tables present the assets and liabilities reported on the consolidated statements of financial condition at their fair value as of December 31, 2024 and 2023, by level within the fair value hierarchy (in thousands):
| | | | | | | | | | | | | | | | | | | | | | | |
| | | | Fair Value Measurements at Reporting Date Using: |
| | December 31, 2024 | | Quoted Prices in Active Markets for Identical Assets (Level 1) | | Significant Other Observable Inputs (Level 2) | | Significant Unobservable Inputs (Level 3) |
| Measured on a recurring basis: | | | | | | | |
| Available for sale debt securities: | | | | | | | |
| U.S. Treasury obligations | $ | 330,598 | | | 330,598 | | | — | | | — | |
| Government-agency obligations | 107,235 | | | — | | | 107,235 | | | — | |
| Mortgage-backed securities | 2,062,159 | | | — | | | 2,062,159 | | | — | |
| Asset-backed securities | 47,563 | | | — | | | 47,563 | | | — | |
| State and municipal obligations | 116,917 | | | — | | | 116,917 | | | — | |
| Corporate obligations | 104,443 | | | — | | | 104,443 | | | — | |
| Total available for sale debt securities | $ | 2,768,915 | | | 330,598 | | | 2,438,317 | | | — | |
| Equity Securities | 19,110 | | | 19,110 | | | — | | | — | |
| Derivative assets | 188,940 | | | — | | | 188,940 | | | — | |
| $ | 2,976,965 | | | 349,708 | | | 2,627,257 | | | — | |
| | | | | | | |
| Derivative liabilities | $ | 172,601 | | | — | | | 172,601 | | | — | |
| | | | | | | |
| Measured on a non-recurring basis: | | | | | | | |
| Loans measured for impairment based on the fair value of the underlying collateral | $ | 11,023 | | | — | | | — | | | 11,023 | |
| Foreclosed assets | 9,473 | | | — | | | — | | | 9,473 | |
| $ | 20,496 | | | — | | | — | | | 20,496 | |
| | | | | | | | | | | | | | | | | | | | | | | |
| | | | Fair Value Measurements at Reporting Date Using: |
| | December 31, 2023 | | Quoted Prices in Active Markets for Identical Assets (Level 1) | | Significant Other Observable Inputs (Level 2) | | Significant Unobservable Inputs (Level 3) |
| Measured on a recurring basis: | | | | | | | |
| Available for sale debt securities: | | | | | | | |
| U.S. Treasury obligations | $ | 253,878 | | | 253,878 | | | — | | | — | |
| Agency obligations | 27,498 | | | — | | | 27,498 | | | — | |
| Mortgage-backed securities | 1,285,609 | | | — | | | 1,285,609 | | | — | |
| Asset-backed securities | 32,235 | | | — | | | 32,235 | | | — | |
| State and municipal obligations | 56,584 | | | — | | | 56,584 | | | — | |
| Corporate obligations | 34,308 | | | — | | | 34,308 | | | — | |
| Total available for sale debt securities | $ | 1,690,112 | | | 253,878 | | | 1,436,234 | | | — | |
| Equity Securities | 1,270 | | | 1,270 | | | — | | | — | |
| Derivative assets | 101,754 | | | — | | | 101,754 | | | — | |
| $ | 1,793,136 | | | 255,148 | | | 1,537,988 | | | — | |
| | | | | | | |
| Derivative liabilities | $ | 88,835 | | | — | | | 88,835 | | | — | |
| | | | | | | |
| Measured on a non-recurring basis: | | | | | | | |
| Loans measured for impairment based on the fair value of the underlying collateral | $ | 24,139 | | | — | | | — | | | 24,139 | |
| Foreclosed assets | 11,651 | | | — | | | — | | | 11,651 | |
| $ | 35,790 | | | — | | | — | | | 35,790 | |
There were no transfers between Level 1, Level 2 and Level 3 during the years ended December 31, 2024 and 2023.
Other Fair Value Disclosures
The Company is required to disclose estimated fair value of financial instruments, both assets and liabilities on and off balance sheet, for which it is practicable to estimate fair value. The following is a description of valuation methodologies used for those assets and liabilities.
Cash and Cash Equivalents
For cash and due from banks, federal funds sold and short-term investments, the carrying amount approximates fair value. As of December 31, 2024 and December 31, 2023, $70,000 was included in cash and cash equivalents, representing cash collateral pledged to secure loan level swaps and risk participation agreements.
Held to Maturity Debt Securities
For held to maturity debt securities, fair value was estimated using a market approach. The majority of the Company’s securities are fixed income instruments that are not quoted on an exchange, but are traded in active markets. Prices for these instruments are obtained through third party data service providers or dealer market participants with whom the Company has historically transacted both purchases and sales of securities. Prices obtained from these sources include market quotations and matrix pricing. Matrix pricing, a Level 2 input, is a mathematical technique used principally to value certain securities by benchmarking to comparable securities. Management evaluates the quality of Level 2 matrix pricing through comparison to similar assets with greater liquidity and evaluation of projected cash flows. As management is responsible for the determination of fair value, it performs quarterly analyses on the prices received from the pricing service to determine whether the prices are reasonable estimates of fair value. Specifically, management compares the prices received from the pricing service to a secondary pricing source. Additionally, management compares changes in the reported market values and returns to relevant market indices to test the reasonableness of the reported prices. The Company’s internal price verification procedures and review of fair value methodology documentation provided by independent pricing services has generally not resulted in adjustment in the prices obtained from the pricing service. The Company also holds debt instruments issued by the U.S.
government and U.S. government-sponsored agencies that are traded in active markets with readily accessible quoted market prices that are considered Level 1 within the fair value hierarchy.
Federal Home Loan Bank of New York Stock
The carrying value of FHLBNY stock is its cost. The fair value of FHLBNY stock is based on redemption at par value. The Company classifies the estimated fair value as Level 1 within the fair value hierarchy.
Loans
Fair values are estimated for portfolios of loans with similar financial characteristics. Loans are segregated by type such as commercial mortgage, residential mortgage, commercial, construction and consumer. Each loan category is further segmented into fixed and adjustable rate interest terms and into performing and non-performing categories. The fair value of performing loans was estimated using a combination of techniques, including a discounted cash flow model that utilizes a discount rate that reflects the Company’s current pricing for loans with similar characteristics and remaining maturity, adjusted by an amount for estimated credit losses inherent in the portfolio at the balance sheet date (i.e. exit pricing). The rates take into account the expected yield curve, as well as an adjustment for prepayment risk, when applicable. The Company classifies the estimated fair value of its loan portfolio as Level 3.
The fair value for significant non-performing loans was based on recent external appraisals of collateral securing such loans, adjusted for the timing of anticipated cash flows. The Company classifies the estimated fair value of its non-performing loan portfolio as Level 3.
Deposits
The fair value of deposits with no stated maturity, such as non-interest bearing demand deposits and savings deposits, was equal to the amount payable on demand and classified as Level 1. The estimated fair value of certificates of deposit was based on the discounted value of contractual cash flows. The discount rate was estimated using the Company’s current rates offered for deposits with similar remaining maturities. The Company classifies the estimated fair value of its certificates of deposit portfolio as Level 2.
Borrowed Funds
The fair value of borrowed funds was estimated by discounting future cash flows using rates available for debt with similar terms and maturities and is classified by the Company as Level 2 within the fair value hierarchy.
Limitations
Fair value estimates are made at a specific point in time, based on relevant market information and information about the financial instrument. These estimates do not reflect any premium or discount that could result from offering for sale at one time the Company’s entire holdings of a particular financial instrument. Because no market exists for a significant portion of the Company’s financial instruments, fair value estimates are based on judgments regarding future expected loss experience, current economic conditions, risk characteristics of various financial instruments, and other factors. These estimates are subjective in nature and involve uncertainties and matters of significant judgment and, therefore, cannot be determined with precision. Changes in assumptions could significantly affect the estimates.
Fair value estimates are based on existing on- and off-balance sheet financial instruments without attempting to estimate the value of anticipated future business and the value of assets and liabilities that are not considered financial instruments.
Significant assets and liabilities that are not considered financial assets or liabilities include goodwill and other intangibles, deferred tax assets and premises and equipment. In addition, the tax ramifications related to the realization of the unrealized gains and losses can have a significant effect on fair value estimates and have not been considered in the estimates.
The following tables present the Company’s financial instruments at their carrying and fair values as of December 31, 2024 and December 31, 2023. Fair values are presented by level within the fair value hierarchy:
| | | | | | | | | | | | | | | | | | | | | | | | | | | | | |
| | | | Fair Value Measurements as of December 31, 2024 Using: |
| (Dollars in thousands) | Carrying value | | Fair value | | Quoted Prices in Active Markets for Identical Assets (Level 1) | | Significant Other Observable Inputs (Level 2) | | Significant Unobservable Inputs (Level 3) |
| Financial assets: | | | | | | | | | |
| Cash and cash equivalents | $ | 205,939 | | | 205,939 | | | 205,939 | | | — | | | — | |
| Available for sale debt securities: | | | | | | | | | |
| U.S. Treasury obligations | 330,598 | | | 330,598 | | | 330,598 | | | — | | | — | |
| Government-agency obligations | 107,235 | | | 107,235 | | | — | | | 107,235 | | | — | |
| Mortgage-backed securities | 2,062,159 | | | 2,062,159 | | | — | | | 2,062,159 | | | — | |
| Asset-backed securities | 47,563 | | | 47,563 | | | — | | | 47,563 | | | — | |
| State and municipal obligations | 116,917 | | | 116,917 | | | — | | | 116,917 | | | — | |
| Corporate obligations | 104,443 | | | 104,443 | | | — | | | 104,443 | | | — | |
| Total available for sale debt securities | $ | 2,768,915 | | | 2,768,915 | | | 330,598 | | | 2,438,317 | | | — | |
| Held to maturity debt securities, net of allowance for credit losses: | | | | | | | | | |
| | | | | | | | | |
| Government-agency obligations | $ | 9,999 | | | 9,707 | | | — | | | 9,707 | | | — | |
| | | | | | | | | |
| State and municipal obligations | 311,106 | | | 297,674 | | | — | | | 297,674 | | | — | |
| Corporate obligations | 6,518 | | | 6,352 | | | — | | | 6,352 | | | — | |
| Total held to maturity debt securities, net of allowance for credit losses | $ | 327,623 | | | 313,733 | | | — | | | 313,733 | | | — | |
| FHLBNY and other stock | 112,767 | | | 112,767 | | | 112,767 | | | — | | | — | |
| Equity Securities | 19,110 | | | 19,110 | | | 19,110 | | | — | | | — | |
| Loans, net of allowance for credit losses | 18,628,391 | | | 18,442,167 | | | — | | | — | | | 18,442,167 | |
| Derivative assets | 188,940 | | | 188,940 | | | — | | | 188,940 | | | — | |
| | | | | | | | | |
| Financial liabilities: | | | | | | | | | |
| Deposits other than certificates of deposits | $ | 15,455,658 | | | 15,455,658 | | | 15,455,658 | | | — | | | — | |
| Certificates of deposit | 3,168,155 | | | 3,168,216 | | | — | | | 3,168,216 | | | — | |
| Total deposits | $ | 18,623,813 | | | 18,623,874 | | | 15,455,658 | | | 3,168,216 | | | — | |
| Borrowings | 2,020,435 | | | 2,017,013 | | | — | | | 2,017,013 | | | — | |
| Subordinated Debentures | 401,608 | | | 423,675 | | | — | | | 423,675 | | | — | |
| Derivative liabilities | 172,601 | | | 172,601 | | | — | | | 172,601 | | | — | |
| | | | | | | | | | | | | | | | | | | | | | | | | | | | | |
| | | | Fair Value Measurements as of December 31, 2023 Using: |
| (Dollars in thousands) | Carrying value | | Fair value | | Quoted Prices in Active Markets for Identical Assets (Level 1) | | Significant Other Observable Inputs (Level 2) | | Significant Unobservable Inputs (Level 3) |
| Financial assets: | | | | | | | | | |
| Cash and cash equivalents | $ | 180,255 | | | 180,255 | | | 180,255 | | | — | | | — | |
| Available for sale debt securities: | | | | | | | | | |
| U.S. Treasury obligations | 253,878 | | | 253,878 | | | 253,878 | | | — | | | — | |
| Government-agency obligations | 27,498 | | | 27,498 | | | — | | | 27,498 | | | — | |
| Mortgage-backed securities | 1,285,609 | | | 1,285,609 | | | — | | | 1,285,609 | | | — | |
| Asset-backed securities | 32,235 | | | 32,235 | | | — | | | 32,235 | | | — | |
| State and municipal obligations | 56,584 | | | 56,584 | | | — | | | 56,584 | | | — | |
| Corporate obligations | 34,308 | | | 34,308 | | | — | | | 34,308 | | | — | |
| Total available for sale debt securities | $ | 1,690,112 | | | 1,690,112 | | | 253,878 | | | 1,436,234 | | | — | |
| Held to maturity debt securities: | | | | | | | | | |
| US Treasury obligations | $ | 5,146 | | | 5,146 | | | 5,146 | | | — | | | — | |
| Government-agency obligations | 11,058 | | | 10,406 | | | 10,406 | | | — | | | — | |
| | | | | | | | | |
| State and municipal obligations | 339,789 | | | 330,360 | | | — | | | 330,360 | | | — | |
| Corporate obligations | 7,087 | | | 6,688 | | | — | | | 6,688 | | | — | |
| Total held to maturity debt securities, net of allowance for credit losses | $ | 363,080 | | | 352,600 | | | 15,552 | | | 337,048 | | | — | |
| FHLBNY stock | 79,217 | | | 79,217 | | | 79,217 | | | — | | | — | |
| Equity Securities | 1,270 | | | 1,270 | | | 1,270 | | | — | | | — | |
| Loans, net of allowance for credit losses | 10,766,501 | | | 10,437,204 | | | — | | | — | | | 10,437,204 | |
| Derivative assets | 101,754 | | | 101,754 | | | — | | | 101,754 | | | — | |
| | | | | | | | | |
| Financial liabilities: | | | | | | | | | |
| Deposits other than certificates of deposits | $ | 9,196,572 | | | 9,196,572 | | | 9,196,572 | | | — | | | — | |
| Certificates of deposit | 1,095,942 | | | 1,093,125 | | | — | | | 1,093,125 | | | — | |
| Total deposits | $ | 10,292,514 | | | 10,289,697 | | | 9,196,572 | | | 1,093,125 | | | — | |
| Borrowings | 1,970,033 | | | 1,960,174 | | | — | | | 1,960,174 | | | — | |
| Subordinated Debentures | 10,695 | | | 9,198 | | | — | | | 9,198 | | | — | |
| Derivative liabilities | 88,835 | | | 88,835 | | | — | | | 88,835 | | | — | |
(18) Earnings Per Share
The following is a reconciliation of the outstanding shares used in the basic and diluted earnings per share calculations.
| | | | | | | | | | | | | | | | | |
| For the Year Ended December 31, |
| | 2024 | | 2023 | | 2022 |
| (In thousands, except per share data) |
| Net income | $ | 115,525 | | | 128,398 | | | 175,648 | |
| Basic weighted average common shares outstanding | 109,668,911 | | | 74,844,489 | | | 74,700,623 | |
| Plus: | | | | | |
| Dilutive shares | 43,821 | | | 28,767 | | | 81,747 | |
| Diluted weighted average common shares outstanding | 109,712,732 | | | 74,873,256 | | | 74,782,370 | |
| Earnings per share: | | | | | |
| Basic | $ | 1.05 | | | 1.72 | | | 2.35 | |
| Diluted | $ | 1.05 | | | 1.71 | | | 2.35 | |
Anti-dilutive stock options and awards totaling 1,447,878 shares, 1,222,890 shares and 884,333 shares as of December 31, 2024, 2023 and 2022, respectively, were excluded from the earnings per share calculations.
(19) Parent-only Financial Information
The condensed financial statements of Provident Financial Services, Inc. (parent company only) are presented below:
Condensed Statements of Financial Condition
(Dollars in Thousands)
| | | | | | | | | | | |
| December 31, 2024 | | December 31, 2023 |
| Assets | | | |
| Cash and due from banks | $ | 47,677 | | | 7,948 | |
| Available for sale debt securities, at fair value | 1,241 | | | 1,084 | |
| Investment in subsidiary | 2,883,062 | | | 1,652,767 | |
| Due from subsidiary—SAP | 61,836 | | | 28,677 | |
| ESOP loan | — | | | 6,411 | |
| Other assets | 13,382 | | | 4,571 | |
| Total assets | $ | 3,007,198 | | | 1,701,458 | |
| Liabilities and Stockholders’ Equity | | | |
| | | |
| Other liabilities | 4,383 | | | 167 | |
| Subordinated Debentures | 401,608 | | | 10,695 | |
| Total stockholders’ equity | 2,601,207 | | | 1,690,596 | |
| Total liabilities and stockholders’ equity | $ | 3,007,198 | | | 1,701,458 | |
Condensed Statements of Operations
(Dollars in Thousands) | | | | | | | | | | | | | | | | | |
| | For the Years Ended December 31, |
| | 2024 | | 2023 | | 2022 |
| Dividends from subsidiary | $ | 105,406 | | | 61,213 | | | 109,013 | |
| Interest income | 324 | | | 529 | | | 785 | |
| Investment gain | 157 | | | 169 | | | 178 | |
| Total income | 105,887 | | | 61,911 | | | 109,976 | |
| Interest expense on subordinated debentures | 22,478 | | | 1,051 | | | 615 | |
| Non-interest expense | 2,156 | | | 2,200 | | | 1,451 | |
| Total expense | 24,634 | | | 3,251 | | | 2,066 | |
| Income before income tax expense | 81,253 | | | 58,660 | | | 107,910 | |
| Income tax expense | — | | | 247 | | | — | |
| Income before undistributed net income of subsidiary | 81,253 | | | 58,413 | | | 107,910 | |
| Earnings in excess of dividends (equity in undistributed net income) of subsidiary | 34,272 | | | 69,985 | | | 67,738 | |
| Net income | $ | 115,525 | | | 128,398 | | | 175,648 | |
Condensed Statements of Cash Flows
(Dollars in Thousands) | | | | | | | | | | | | | | | | | |
| | For the Years Ended December 31, |
| | 2024 | | 2023 | | 2022 |
| Cash flows from operating activities: | | | | | |
| Net income | $ | 115,525 | | | 128,398 | | | 175,648 | |
| Adjustments to reconcile net income to net cash provided by operating activities | | | | | |
| Earnings in excess of dividends (equity in undistributed net income) of subsidiary | (34,272) | | | (69,985) | | | (67,738) | |
| ESOP allocation | 2,601 | | | 3,086 | | | 4,140 | |
| SAP allocation | 9,517 | | | 7,569 | | | 9,407 | |
| Stock option allocation | 77 | | | 144 | | | 198 | |
| (Increase) decrease in due from subsidiary—SAP | (33,159) | | | 5,762 | | | 3,847 | |
| Increase (decrease) in other assets | 30,364 | | | (11,317) | | | (13,817) | |
| Decrease (increase) in other liabilities | 4,216 | | | (45) | | | (142) | |
| Net cash provided by (used in) operating activities | 94,869 | | | 63,612 | | | 111,543 | |
| Cash flows from investing activities: | | | | | |
| | | | | |
| Cash received, net of cash consideration paid for acquisition | — | | | — | | | — | |
| Net decrease in ESOP loan | 6,411 | | | 6,817 | | | 6,387 | |
| Net cash provided by investing activities | 6,411 | | | 6,817 | | | 6,387 | |
| Cash flows from financing activities: | | | | | |
| Purchases of treasury stock | — | | | — | | | (46,530) | |
| Purchase of employee restricted shares to fund statutory tax withholding | (1,323) | | | (1,678) | | | (1,021) | |
| Cash dividends paid | (100,956) | | | (72,447) | | | (72,023) | |
| Reclassification of stock award shares | 40,728 | | | — | | | — | |
| Shares issued dividend reinvestment plan | — | | | — | | | — | |
| Stock options exercised | — | | | 790 | | | — | |
| Net cash used in financing activities | (61,551) | | | (73,335) | | | (119,574) | |
| Net increase (decrease) in cash and cash equivalents | 39,729 | | | (2,906) | | | (1,644) | |
| Cash and cash equivalents at beginning of period | 7,948 | | | 10,854 | | | 12,498 | |
| Cash and cash equivalents at end of period | $ | 47,677 | | | 7,948 | | | 10,854 | |
(20) Other Comprehensive Income (Loss)
The following table presents the components of other comprehensive (loss) income both gross and net of tax, for the years ended December 31, 2024, 2023 and 2022 (in thousands):
| | | | | | | | | | | | | | | | | | | | | | | | | | | | | | | | | | | | | | | | | | | | | | | | | | | | | |
| | For the Years Ended December 31, |
| | 2024 | | 2023 | | 2022 |
| | Before Tax | | Tax Effect | | After Tax | | Before Tax | | Tax Effect | | After Tax | | Before Tax | | Tax Effect | | After Tax |
| Components of Other Comprehensive Income ( Loss): | | | | | | | | | | | | | | | | | |
| Unrealized losses on available for sale debt securities: | | | | | | | | | | | | | | | | | |
| Net (losses) gains arising during the period | $ | 11,216 | | | (3,375) | | | 7,841 | | | 43,250 | | | (11,125) | | | 32,125 | | | (254,591) | | | 68,230 | | | (186,361) | |
| Reclassification adjustment for gains included in net income | 2,986 | | | (899) | | | 2,087 | | | — | | | — | | | — | | | (58) | | | 16 | | | (42) | |
| Total | 14,202 | | | (4,274) | | | 9,928 | | | 43,250 | | | (11,125) | | | 32,125 | | | (254,649) | | | 68,246 | | | (186,403) | |
| | | | | | | | | | | | | | | | | |
| | | | | | | | | | | | | | | | | |
| | | | | | | | | | | | | | | | | |
| | | | | | | | | | | | | | | | | |
| Unrealized gains (losses) on derivatives designated as cash flow hedges: | | | | | | | | | | | | | | | | | |
| Net (losses) gains arising during the period | 4,547 | | | (1,368) | | | 3,179 | | | 3,288 | | | (900) | | | 2,388 | | | 26,231 | | | (7,030) | | | 19,201 | |
| Reclassification adjustment for gains included in net income | (13,670) | | | 4,113 | | | (9,557) | | | (17,713) | | | 4,765 | | | (12,948) | | | (4,504) | | | 1,207 | | | (3,297) | |
| Total | (9,123) | | | 2,745 | | | (6,378) | | | (14,425) | | | 3,865 | | | (10,560) | | | 21,727 | | | (5,823) | | | 15,904 | |
| Amortization related to post-retirement obligations | 3,162 | | | (952) | | | 2,210 | | | 3,249 | | | (884) | | | 2,365 | | | (1,926) | | | 517 | | | (1,409) | |
| Total other comprehensive (loss) income | $ | 8,241 | | | (2,481) | | | 5,760 | | | 32,074 | | | (8,144) | | | 23,930 | | | (234,848) | | | 62,940 | | | (171,908) | |
The following table presents the changes in the components of accumulated other comprehensive (loss) income, net of tax, for the years ended December 31, 2024 and 2023 (in thousands):
| | | | | | | | | | | | | | | | | | | | | | | | | | | | | | | | | | | | | | | | | | | | | | | | | | |
| | | Changes in Accumulated Other Comprehensive Income by Component, net of tax For the Years Ended December 31, |
| | 2024 | | 2023 |
| | Unrealized Losses on Available for Sale Debt Securities | | Post-Retirement
Obligations | | Unrealized Gains on Derivatives (cash flow hedges) | | Accumulated
Other
Comprehensive
Income (Loss) | | Unrealized Gains (Losses) on Available for Sale Debt Securities | | Post-Retirement
Obligations | | Unrealized Gains (Losses) on Derivatives (cash flow hedges) | | Accumulated
Other
Comprehensive
Income (Loss) |
| Balance at the beginning of the period | | $ | (154,489) | | | 3,937 | | | 9,437 | | | (141,115) | | | (186,614) | | | 1,572 | | | 19,997 | | | (165,045) | |
| Current period change in other comprehensive (loss) income | | 9,928 | | | 2,210 | | | (6,378) | | | 5,760 | | | 32,125 | | | 2,365 | | | (10,560) | | | 23,930 | |
| | | | | | | | | | | | | | | | |
| | | | | | | | | | | | | | | | |
| Balance at the end of the period | | $ | (144,561) | | | 6,147 | | | 3,059 | | | (135,355) | | | (154,489) | | | 3,937 | | | 9,437 | | | (141,115) | |
The following table summarizes the reclassifications out of accumulated other comprehensive (loss) income for the years ended December 31, 2024, 2023 and 2022 (in thousands):
| | | | | | | | | | | | | | | | | | | | | | | | | | | | | | | | |
| | Reclassifications Out of Accumulated Other Comprehensive
Income (Loss) |
| | Amount reclassified from AOCI for the years ended December 31, | | Affected line item in the Consolidated
Statement of Income |
| | 2024 | | 2023 | | 2022 | | |
| Details of AOCI: | | | | | | | | |
| Available for sale debt securities: | | | | | | | | |
| Realized net gains on the sale of securities available for sale | | $ | (2,986) | | | — | | | (58) | | | Net gain on securities transactions |
| | 899 | | | — | | | 16 | | | Income tax expense |
| | (2,087) | | | — | | | (42) | | | Net of tax |
| | | | | | | | |
| Cash flow hedges: | | | | | | | | |
| Unrealized gains (losses) on derivatives designated as cash flow hedges | | (13,670) | | | (17,713) | | | (4,504) | | | Interest expense |
| | 4,113 | | | 4,765 | | | 1,207 | | | Income tax expense |
| | (9,557) | | | (12,948) | | | (3,297) | | | |
| | | | | | | | |
| | | | | | | | |
| | | | | | | | |
| | | | | | | | |
| | | | | | | | |
| Post-retirement obligations: | | | | | | | | |
| Amortization of actuarial (gains) losses | | (2,061) | | | (1,421) | | | (1,304) | | | Compensation and employee benefits (1) |
| | 620 | | | 384 | | | 349 | | | Income tax expense |
| | (1,441) | | | (1037) | | | (955) | | | Net of tax |
| | | | | | | | |
| | | | | | | | |
| | | | | | | | |
| | | | | | | | |
| Total reclassifications | | $ | (13,085) | | | (13,985) | | | (4,293) | | | Net of tax |
| | | | | | | | | | |
(1) This item is included in the computation of net periodic benefit cost. See Note 11. Benefit Plans
(21) Derivative and Hedging Activities
The Company is exposed to certain risks arising from both its business operations and economic conditions. The Company principally manages its exposures to a wide variety of business and operational risks through the management of its core business activities. The Company manages economic risks, including interest rate, liquidity, and credit risk, primarily by managing the amount, sources, and duration of its assets and liabilities.
Non-designated Hedges. Derivatives not designated in qualifying hedging relationships are not speculative and result from a service the Company provides to certain qualified commercial borrowers in loan related transactions which, therefore, are not used to manage interest rate risk in the Company’s assets or liabilities. The Company may execute interest rate swaps with qualified commercial banking customers to facilitate their respective risk management strategies. Those interest rate swaps are simultaneously hedged by offsetting interest rate swaps that the Company executes with a third party, such that the Company minimizes its net risk exposure resulting from such transactions. The interest rate swap agreement which the Company executes with the commercial borrower is collateralized by the borrower's commercial real estate financed by the Company. As the Company has not elected to apply hedge accounting and these interest rate swaps do not meet the hedge accounting requirements, changes in the fair value of both the customer swaps and the offsetting swaps are recognized directly in earnings. As of December 31, 2024 and 2023, the Company had 482 and 154 interest rate swaps with an aggregate notional amount of $4.54 billion and $2.30 billion, respectively.
The Company periodically enters into risk participation agreements ("RPAs"), with the Company functioning as either the lead institution, or as a participant when another company is the lead institution on a commercial loan. These RPAs are entered into to manage the credit exposure on interest rate contracts associated with these loan participation agreements. Under the RPAs, the Company will either receive or make a payment in the event the borrower defaults on the related interest rate contract. The Company has minimum collateral posting thresholds with certain of its risk participation counterparties, and has posted collateral of $70,000 against the potential risk of default by the borrower under these agreements. As of December 31, 2024 and 2023 the Company had 9 and 12 credit derivatives with aggregate notional amounts of $79.2 million and $142.8 million, respectively, from participations in interest rate swaps as part of these loan participation arrangements. As of December 31, 2024, the asset and liability positions of these fair value credit derivatives were insignificant, compared to $17,000 and $8,000, respectively, as of December 31, 2023 .
Cash Flow Hedges of Interest Rate Risk. The Company’s objective in using interest rate derivatives is to add stability to interest expense and to manage its exposure to interest rate movements. To accomplish this objective, the Company primarily uses interest rate swaps as part of its interest rate risk management strategy. Interest rate swaps designated as cash flow hedges involve the receipt of variable payment amounts from a counterparty in exchange for the Company making fixed-rate payments over the life of the agreements without exchange of the underlying notional amount.
Changes in the fair value of derivatives designated and that qualify as cash flow hedges of interest rate risk are recorded in accumulated other comprehensive income and are subsequently reclassified into earnings in the period that the hedged forecasted transaction affects earnings. During the years ended December 31, 2024, 2023 and 2022, such derivatives were used to hedge the variable cash outflows associated with FHLBNY borrowings and brokered demand deposits.
Amounts reported in accumulated other comprehensive income related to derivatives will be reclassified to interest expense as interest payments are made on the Company’s borrowings or demand deposits. During the next twelve months, the Company estimates that $4.6 million will be reclassified as a reduction to interest expense. As of December 31, 2024, the Company had 6 outstanding interest rate derivatives with an aggregate notional amount of $300.0 million that was designated as a cash flow hedge of interest rate risk.
The Company is party to master netting arrangements with its financial institution counterparties; however, the Company does not offset assets and liabilities under these arrangements for financial statement presentation purposes. The master netting arrangements provide for a single net settlement of all swap agreements, as well as collateral, in the event of default on, or termination of, any one contract. Collateral, usually in the form of cash or marketable investment securities, is posted by or received from the counterparty with net liability or asset positions, respectively, in accordance with contract thresholds. Master repurchase agreements which include “right of set-off” provisions generally have a legally enforceable right to offset recognized amounts. In such cases, the collateral would be used to settle the fair value of the swap or repurchase agreement should the Company be in default. The total amount of collateral held or pledged cannot exceed the net derivative fair values with the counterparty.
The tables below present a gross presentation, the effects of offsetting, and a net presentation of the Company’s financial instruments that are eligible for offset in the Consolidated Statements of Condition as of December 31, 2024 and December 31, 2023 (in thousands).
| | | | | | | | | | | | | | | | | | | | | | | | | | | | | | | | | | | | | | |
| | Fair Values of Derivative Instruments as of December 31, 2024 |
| | Asset Derivatives | | Liability Derivatives |
| | Notional Amount | | Consolidated Statements of Financial Condition | | Fair value (1) | | Notional Amount | | Consolidated Statements of Financial Condition | | Fair value (1) |
| Derivatives not designated as a hedging instrument: | | | | | | | | | | | | |
| Interest rate products | | $ | 2,272,162 | | | Other assets | | $ | 174,196 | | | $ | 2,272,162 | | | Other liabilities | | $ | 174,344 | |
| Credit contracts | | 11,662 | | | Other assets | | — | | | 67,560 | | | Other liabilities | | — | |
| Total derivatives not designated as a hedging instrument | | | | | | 174,196 | | | | | | | 174,344 | |
| | | | | | | | | | | | |
| Derivatives designated as a hedging instrument: | | | | | | | | | | | | |
| Interest rate products | | 225,000 | | | Other assets | | 5,136 | | | 75,000 | | | Other liabilities | | 204 | |
| | | | | | | | | | | | |
| Total gross derivative amounts recognized on the balance sheet | | | | | | 179,332 | | | | | | | 174,548 | |
| | | | | | | | | | | | |
| Gross amounts offset on the balance sheet | | | | | | — | | | | | | | — | |
| Net derivative amounts presented on the balance sheet | | | | | | $ | 179,332 | | | | | | | $ | 174,548 | |
| | | | | | | | | | | | |
| Gross amounts not offset on the balance sheet: | | | | | | | | | | | | |
| Financial instruments - institutional counterparties | | | | | | $ | 2,255 | | | | | | | $ | 2,255 | |
| Cash collateral - institutional counterparties | | | | | | 174,904 | | | | | | | — | |
| Net derivatives not offset | | | | | | $ | 2,173 | | | | | | | $ | 172,293 | |
| | | | | | | | | | | | | | | | | | | | | | | | | | | | | | | | | | | | | | |
| | Fair Values of Derivative Instruments as of December 31, 2023 |
| | Asset Derivatives | | Liability Derivatives |
| | Notional Amount | | Consolidated Statements of Financial Condition | | Fair value (1) | | Notional Amount | | Consolidated Statements of Financial Condition | | Fair value (1) |
| Derivatives not designated as a hedging instrument: | | | | | | | | | | | | |
| Interest rate products | | $ | 1,152,200 | | | Other assets | | $ | 89,261 | | | $ | 1,152,200 | | | Other liabilities | | $ | 89,461 | |
| Credit contracts | | 46,359 | | | Other assets | | 17 | | | 96,462 | | | Other liabilities | | 8 | |
| Total derivatives not designated as a hedging instrument | | | | | | 89,278 | | | | | | | 89,469 | |
| | | | | | | | | | | | |
| Derivatives designated as a hedging instrument: | | | | | | | | | | | | |
| Interest rate products | | 330,000 | | | Other assets | | 15,886 | | | 125,000 | | | Other liabilities | | 1,365 | |
| | | | | | | | | | | | |
| Total gross derivative amounts recognized on the balance sheet | | | | | | 105,164 | | | | | | | 90,834 | |
| | | | | | | | | | | | |
| Gross amounts offset on the balance sheet | | | | | | — | | | | | | | — | |
| Net derivative amounts presented on the balance sheet | | | | | | $ | 105,164 | | | | | | | $ | 90,834 | |
| | | | | | | | | | | | |
| Gross amounts not offset on the balance sheet: | | | | | | | | | | | | |
| Financial instruments - institutional counterparties | | | | | | $ | — | | | | | | | — | |
| Cash collateral - institutional counterparties | | | | | | 101,328 | | | | | | | — | |
| Net derivatives not offset | | | | | | $ | 3,836 | | | | | | | $ | 90,834 | |
(1) The fair values related to interest rate products in the above net derivative tables show the total value of assets and liabilities, which include accrued interest receivable and accrued interest payable for the periods ended December 31, 2024 and December 31, 2023.
The table below presents the effect of the Company’s derivative financial instruments on the Consolidated Statements of Income for the years ended December 31, 2024, 2023 and 2022 (in thousands).
| | | | | | | | | | | | | | | | | | | | | | | | | | |
| | | | Gain recognized in Income on derivatives |
| | | | For the Year Ended December 31, |
| | Consolidated Statements of Income | | 2024 | | 2023 | | 2022 |
| Derivatives not designated as hedging instruments: | | | | | | | | |
| Interest rate products | | Other income | | $ | 435 | | | 133 | | | 722 | |
| Credit contracts | | Other income | | 30 | | | (7) | | | (49) | |
| Total derivatives not designated as hedging instruments | | | | $ | 465 | | | 126 | | | 673 | |
| | | | | | | | |
| Derivatives designated as hedging instruments: | | | | (Gain) Loss recognized in Expense on derivatives |
| | | | | | | | |
| | | | | | | | |
| Interest rate products | | Interest (income) expense | | $ | (13,670) | | | (17,713) | | | (4,504) | |
| Total derivatives designated as a hedging instruments | | | | $ | (13,670) | | | (17,713) | | | (4,504) | |
The Company has agreements with certain of its dealer counterparties which contain a provision that if the Company defaults on any of its indebtedness, including a default where repayment of the indebtedness has not been accelerated by the lender, then the Company could also be deemed in default on its derivative obligations. In addition, the Company has agreements with certain of its dealer counterparties which contain a provision that if the Company fails to maintain its status as a well or adequately capitalized institution, then the counterparty could terminate the derivative positions and the Company would be required to settle its obligations under the agreements.
As of December 31, 2024, the Company had five dealer counterparties and the Company was in a net asset position with respect to all of its counterparties.
(22) Revenue Recognition
The Company generates revenue from several business channels. The guidance in ASU 2014-09, Revenue from Contracts with Customers (Topic 606) does not apply to revenue associated with financial instruments, including interest income on loans and investments, which comprise the majority of the Company's revenue. For the years ended December 31, 2024, 2023 and 2022 the out-of-scope revenue related to financial instruments were 92%, 89% and 84% of the Company's total revenue, respectively. Revenue-generating activities that are within the scope of Topic 606, are components of non-interest income. These revenue streams can generally be classified into wealth management revenue, insurance agency income and banking service charges and other fees.
The following table presents non-interest income, segregated by revenue streams in-scope and out-of-scope of Topic 606, for the years ended December 31, 2024, 2023 and 2022:
| | | | | | | | | | | | | | | | | | | | | | | |
| | | December 31, |
| (in-thousands) | | | | | 2024 | | 2023 | | 2022 |
| Non-interest income | | | | | | | | | |
| In-scope of Topic 606: | | | | | | | | | |
| Wealth management fees | | | | | $ | 30,533 | | | 27,669 | | | 27,870 | |
| Insurance agency income | | | | | 16,201 | | | 13,934 | | | 11,440 | |
| Banking service charges and other fees: | | | | | | | | | |
| Service charges on deposit accounts | | | | | 16,903 | | | 12,959 | | | 12,553 | |
| Debit card and ATM fees | | | | | 4,651 | | | 2,963 | | | 3,124 | |
| Total banking service charges and other fees | | | | | 21,554 | | | 15,922 | | | 15,677 | |
| Total in-scope non-interest income | | | | | 68,288 | | | 57,525 | | | 54,987 | |
| Total out-of-scope non-interest income | | | | | 25,825 | | | 22,304 | | | 32,802 | |
| Total non-interest income | | | | | $ | 94,113 | | | 79,829 | | | 87,789 | |
Wealth management fee income represents fees earned from customers as consideration for asset management, investment advisory and trust services. The Company’s performance obligation is generally satisfied monthly and the resulting fees are recognized monthly. The fee is generally based upon the average market value of the assets under management ("AUM") for the month and the applicable fee rate. The monthly accrual of wealth management fees is recorded in other assets on the Company's Consolidated Statements of Financial Condition. Fees are received from the customer on a monthly basis. The Company does not earn performance-based incentives. To a lesser extent, optional services such as tax return preparation and estate settlement are also available to existing customers. The Company’s performance obligation for these transaction-based services is generally satisfied, and related revenue recognized, at either a point in time when the service is completed, or in the case of estate settlement, over a relatively short period of time, as each service component is completed.
Insurance agency income, consisting of commissions and fees, is generally recognized as of the effective date of the insurance policy. Commission revenues related to installment billings are recognized on the invoice date. Subsequent commission adjustments are recognized upon the receipt of notification from insurance companies concerning matters necessitating such adjustments. Profit-sharing contingent commissions are recognized when determinable, which is generally when such commissions are received from insurance companies, or when the Company receives formal notification of the amount of such payments.
Service charges on deposit accounts include overdraft service fees, account analysis fees and other deposit related fees. These fees are generally transaction-based, or time-based services. The Company's performance obligation for these services is generally satisfied, and revenue recognized, at the time the transaction is completed, or the service rendered. Fees for these services are generally received from the customer either at the time of transaction, or monthly. Debit card and ATM fees are generally transaction-based. Debit card revenue is primarily comprised of interchange fees earned when a customer's Company card is processed through a card payment network. ATM fees are largely generated when a Company cardholder uses a non-Company ATM, or a non-Company cardholder uses a Company ATM. The Company's performance obligation for these services is satisfied when the service is rendered. Payment is generally received at time of transaction or monthly.
Out-of-scope non-interest income primarily consists of Bank-owned life insurance and net fees on loan level interest rate swaps, along with gains and losses on the sale of loans and foreclosed real estate, loan prepayment fees and loan servicing fees. None of these revenue streams are subject to the requirements of Topic 606.
(23) Leases
The following table represents the consolidated statements of financial condition classification of the Company’s right-of use-assets and lease liabilities as of December 31, 2024 and December 31, 2023 (in thousands):
| | | | | | | | | | | | | | | | | | | | |
| | Classification | | December 31, 2024 | | December 31, 2023 |
| Lease Right-of-Use Assets: | | | | | | |
| Operating lease right-of-use assets | | Other assets | | $ | 62,258 | | | $ | 56,907 | |
| Lease Liabilities: | | | | | | |
| Operating lease liabilities | | Other liabilities | | $ | 65,226 | | | $ | 60,039 | |
The calculated amount of the right-of-use assets and lease liabilities in the table above are impacted by the length of the lease term and the discount rate used to present value the minimum lease payments. The Company’s lease agreements often include one or more options to renew at the Company’s discretion. If at lease inception the Company considers the exercising of a renewal option to be reasonably certain, the Company will include the extended term in the calculation of the right-of-use asset and lease liability. Regarding the discount rate, Topic 842 requires the use of the rate implicit in the lease whenever this rate is readily determinable. As this rate is rarely determinable, the Company utilizes its incremental borrowing rate at lease inception based upon the term of the lease. For operating leases existing prior to January 1, 2019, the rate for the remaining lease term as of January 1, 2019 was applied.
All of the leases in which the Company is the lessee are classified as operating leases and are primarily comprised of real estate property for branches and administrative offices with terms extending through 2046.
As of December 31, 2024, the weighted-average remaining lease term and the weighted-average discount rate for the Company's operating leases were 7.3 years and 3.23%, respectively.
The following table represents lease costs and other lease information for the Company's operating leases. The variable lease cost primarily represents variable payments such as common area maintenance and utilities (in thousands):
| | | | | | | | | | | | | | |
| | Year ended December 31, 2024 | | Year ended December 31, 2023 |
| Lease Costs | | | |
| Operating lease cost | | $ | 13,088 | | | 10,495 | |
| | | | |
| Variable lease cost | | 3,057 | | | 3,193 | |
| | | | |
| Total Lease Cost | | $ | 16,145 | | | 13,688 | |
| | | | | | | | | | | | | | |
| Cash paid for amounts included in the measurement of lease liabilities (in thousands): | | Year ended December 31, 2024 | | Year ended December 31, 2023 |
| | | | |
| Operating cash flows from operating leases | | $ | 12,818 | | | 9,904 | |
| | | | |
During the year ended December 31, 2024, the Company added 39 new lease obligations related to the Lakeland merger. The Company recorded a $14.7 million right-of-use asset and lease liability for these lease obligations.
Future minimum payments for operating leases with initial or remaining terms of one year or more as of December 31, 2024 were as follows (in thousands):
| | | | | | | | |
| | Operating Leases |
| Years ended: | |
| 2025 | | $ | 13,170 | |
| 2026 | | 11,715 | |
| 2027 | | 10,203 | |
| 2028 | | 8,742 | |
| 2029 | | 7,431 | |
| Thereafter | | 22,239 | |
| Total future minimum lease payments | 73,500 | |
| Amounts representing interest | | 8,274 | |
| Present value of net future minimum lease payments | $ | 65,226 | |
(24) Segment Reporting
We conduct our operations through a single business segment. Substantially all of our interest and fees on loans and long-lived assets relate to our operations. Pursuant to FASB ASC 280, Segment Reporting, operating segments represent components of an enterprise for which separate financial information is available that is regularly evaluated by the chief operating decision maker in determining how to allocate resources and in assessing performance. The chief operating decision maker uses a variety of measures to assess the performance of the business as a whole, depending on the nature of the activity. The Company generates revenue from several business channels. Those streams are organized by the types of partners we work with to reach our customers, with success principally measured based on interest and fees on loans, loan receivables, active accounts and other sales metrics. Detailed profitability information of the nature that could be used to allocate resources and assess the performance and operations for each sales platform individually, however, is not used by our chief operating decision maker. Expense activities, including funding costs, credit losses and operating expenses, are not measured for each platform but instead are managed for the Company as a whole.
The following table represents segment information for the years ended December 31, 2024, 2023 and 2022:
| | | | | | | | | | | | | | | | | |
| Years ended December 31, |
| 2024 | | 2023 | | 2022 |
| Interest income on loans | $ | 944,296 | | | 556,235 | | | 417,650 | |
| Interest income on cash and debt securities | 101,842 | | | 59,585 | | | 48,531 | |
| Total interest income | 1,046,138 | | | 615,820 | | | 466,181 | |
| Total interest expense | 445,524 | | | 216,366 | | | 48,629 | |
| Net interest income | 600,614 | | | 399,454 | | | 417,552 | |
| | | | | |
| Provision for credit losses | 87,564 | | | 28,168 | | | 5,004 | |
| Net interest income after provision | 513,050 | | | 371,286 | | | 412,548 | |
| | | | | |
| Non interest income: | | | | | |
| Wealth management income | 30,533 | | | 27,669 | | | 27,870 | |
| Insurance Agency Income | 16,201 | | | 13,934 | | | 11,440 | |
Other non-interest income (1) | 47,379 | | | 38,226 | | | 48,479 | |
| Total non-interest income | 94,113 | | | 79,829 | | | 87,789 | |
| | | | | |
| Non interest expense: | | | | | |
| Compensation and employee benefits | 218,341 | | | 148,497 | | | 147,203 | |
| Net occupancy expense | 45,014 | | | 32,271 | | | 34,566 | |
| Data processing expense | 35,579 | | | 22,993 | | | 21,729 | |
Other non interest expense (2) | 158,614 | | | 71,575 | | | 56,733 | |
| Total non-interest expense | 457,548 | | | 275,336 | | | 260,231 | |
| | | | | |
| Income tax expense | 34,090 | | | 47,381 | | | 64,458 | |
| | | | | |
| Net income | $ | 115,525 | | | $ | 128,398 | | | $ | 175,648 | |
(1) Other non-interest income items includes fees and commissions, BOLI and other miscellaneous income.
(2) Other non-interest expense items includes merger-related expenses, amortization of intangibles and other miscellaneous expenses.
Our segment assets represent our total assets as presented on the Consolidated Statements of Financial Position.
(25) Subsequent Events
The Company has evaluated subsequent events from the date of the Consolidated Financial Statements, and accompanying Notes thereto, through the date of issuance, and determined that there were no other significant events identified requiring recognition or disclosure.
Item 9. Changes in and Disagreements With Accountants on Accounting and Financial Disclosure
None.
Item 9A. Controls and Procedures
Evaluation of Disclosure Controls and Procedures
Anthony J. Labozzetta, the Company’s Principal Executive Officer, and Thomas M. Lyons, the Company’s Principal Financial Officer, conducted an evaluation of the effectiveness of the Company’s disclosure controls and procedures (as defined in Rule 13a-15(e) and 15d-15(e) under the Securities Exchange Act of 1934, as amended) as of December 31, 2024. Based upon their evaluation, they each found that the Company’s disclosure controls and procedures were effective as of that date.
Management’s Report on Internal Control Over Financial Reporting
The management of the Company is responsible for establishing and maintaining adequate internal control over financial reporting. The Company’s internal control system is a process designed to provide reasonable assurance to the Company’s management and board of directors regarding the preparation and fair presentation of published financial statements.
The Company’s internal control over financial reporting includes policies and procedures that pertain to the maintenance of records that, in reasonable detail, accurately and fairly reflect transactions and dispositions of assets; provide reasonable assurances that transactions are recorded as necessary to permit preparation of financial statements in accordance with GAAP, and that receipts and expenditures are being made only in accordance with authorizations of management and the directors of the Company; and provide reasonable assurance regarding prevention or timely detection of unauthorized acquisition, use or disposition of the Company’s assets that could have a material effect on its financial statements.
All internal control systems, no matter how well designed, have inherent limitations. Therefore, even those systems determined to be effective can provide only reasonable assurance with respect to financial statement preparation and presentation. Also, projections of any evaluation of effectiveness to future periods are subject to the risk that controls may become inadequate because of changes in conditions, or that the degree of compliance with the policies or procedures may deteriorate.
Management assessed the effectiveness of the Company’s internal control over financial reporting as of December 31, 2024. In making this assessment, we used the criteria set forth by the Committee of Sponsoring Organizations of the Treadway Commission in Internal Control-Integrated Framework (2013).
Based on the assessment management believes that, as of December 31, 2024, the Company’s internal control over financial reporting is effective based on those criteria.
Report of Independent Registered Public Accounting Firm
The Company’s independent registered public accounting firm that audited the consolidated financial statements has issued an audit report on the effectiveness of the Company’s internal control over financial reporting as of December 31, 2024. This report appears on page 73 of this Annual Report on Form 10-K.
Changes in Internal Control Over Financial Reporting
During the last quarter of the year under report, there was no change in the Company’s internal control over financial reporting that has materially affected, or is reasonably likely to materially affect, the Company’s internal control over financial reporting.
Item 9B. Other Information
(a) During the year ended December 31, 2024, none of the Company’s directors or executive officers adopted or terminated any contract, instruction or written plan for the purchase or sale of Company securities that was intended to satisfy the affirmative defense conditions of Rule 10b5-1(c) or any "non-Rule 10b5-1 trading arrangement," as that term is used in SEC regulations.
Item 9C. Disclosure Regarding Jurisdictions that Prevent Inspections
None.
PART III
Item 10. Directors, Executive Officers and Corporate Governance
Information required by this item regarding directors, executive officers and corporate governance is incorporated herein by reference to the Proxy Statement to be filed for the Annual Meeting of Stockholders to be held on April 24, 2025.
Item 11. Executive Compensation
The information required by this item is incorporated herein by reference to the Proxy Statement to be filed for the Annual Meeting of Stockholders to be held on April 24, 2025.
Item 12. Security Ownership of Certain Beneficial Owners and Management and Related Stockholder Matters
The information required by this item is incorporated herein by reference to the Proxy Statement to be filed for the Annual Meeting of Stockholders to be held on April 24, 2025.
Securities Authorized for Issuance Under Equity Compensation Plans
Set forth below is information as of December 31, 2024 regarding equity compensation plans categorized by those plans that have been approved by the Company's stockholders. There are no plans that have not been approved by the Company's stockholders. | | | | | | | | | | | | | | | | | |
| Plan | Number of Securities to be Issued Upon Exercise of Outstanding Options and Rights(1) | | Weighted Average Exercise Price(2) | | Number of Securities Remaining Available For Issuance Under Plan (3) |
| Equity compensation plans approved by stockholders | 468,163 | | | $ | 19.89 | | | 2,271,833 | |
| | | | | |
| Total | 468,163 | | | 19.89 | | | 2,271,833 | |
________________________
1.Consists of outstanding stock options to purchase 468,163 shares of common stock granted under the Company’s stock-based compensation plans.
2.The weighted average exercise price reflects: an exercise price of $18.34 for 65,972 stock options granted in 2015; an exercise price of $18.70 for 76,327 stock options granted in 2016; an exercise price of $26.31 for 42,857 stock options granted in 2017; an exercise price of $25.58 for 43,123 stock options granted in 2018; an exercise price of $27.25 for 41,685 stock options granted in 2019; an exercise price of $20.62 for 107,240 stock options granted in 2020; an exercise price of $20.66 for 56,605 stock options granted in 2021; and an exercise price of $23.70 for 34,353 stock options granted in 2022 under the Company’s stock-based compensation plans. There were no new grants in 2023 and 2024.
3.Represents the number of available shares that may be granted as stock options and other stock awards under the Company’s stock-based compensation plans.
Item 13. Certain Relationships and Related Transactions, and Director Independence
The information required by this item is incorporated herein by reference to the Proxy Statement to be filed for the Annual Meeting of Stockholders to be held on April 24, 2025.
Item 14. Principal Accountant Fees and Services
The information required by this item is incorporated herein by reference to the Proxy Statement to be filed for the Annual Meeting of Stockholders to be held on April 24, 2025.
PART IV
Item 15. Exhibits and Financial Statement Schedules
The exhibits and financial statement schedules filed as a part of this Annual Report on Form 10-K are as follows:
(a)(1) Financial Statements
(a)(2) Financial Statement Schedules
No financial statement schedules are filed because the required information is not applicable or is included in the consolidated financial statements or related notes.
(a)(3) Exhibits
| | | | | |
| 2.1 | |
| |
| 2.2 | |
| |
| 2.3 | |
| |
| 3.1 | |
| |
| 3.2 | |
| |
| 4.1 | |
| |
| 4.2 | |
| |
| 4.3 | |
| |
| 4.4 | |
| |
| | | | | |
| 10.1 | |
| |
| 10.2 | |
| |
| 10.3 | |
| |
| 10.4 | |
| |
| 10.5 | |
| |
| 10.6 | |
| |
| 10.7 | |
| |
| 10.8 | |
| |
| 10.9 | |
| |
| 10.10 | |
| |
| 10.11 | |
| |
| 10.12 | |
| |
| 10.13 | |
| |
| 10.14 | |
| |
| 10.15 | |
| |
| 10.16 | |
| |
| 10.17 | |
| |
| | | | | |
| 10.18 | |
| |
| 10.19 | |
| |
| 10.20 | |
| |
| 10.21 | |
| |
| 10.22 | |
| |
| 10.23 | |
| |
| 10.24 | |
| |
| 10.25 | |
| |
| 10.26 | |
| |
| 10.27 | |
| |
| 10.28 | |
| |
| 10.29 | |
| |
| 19 | |
| |
| 21 | |
| |
| 23 | |
| |
| 31.1 | |
| |
| 31.2 | |
| |
| 32 | |
| |
| 101 | The following materials from the Company’s Annual Report to Stockholders on Form 10-K for the year ended December 31, 2024, formatted in iXBRL (Inline Extensible Business Reporting Language): (i) the Consolidated Statements of Financial Condition, (ii) the Consolidated Statements of Operations, (iii) the Consolidated Statements of Comprehensive Income, (iv) the Consolidated Statements of Changes in Stockholder’s Equity, (v) the Consolidated Statements of Cash Flows and (vi) the Notes to Consolidated Financial Statements. |
| | | | | |
| 101.INS | XBRL Instance Document |
| |
| 101.SCH | XBRL Taxonomy Extension Schema Document |
| |
| 101.CAL | XBRL Taxonomy Extension Calculation Linkbase Document |
| |
| 101.DEF | XBRL Taxonomy Extension Definition Linkbase Document |
| |
| 101.LAB | XBRL Taxonomy Extension Labels Linkbase Document |
| |
| 101.PRE | XBRL Taxonomy Extension Presentation Linkbase Document |
| |
| 104 | Cover Page Interactive Data File (formatted in iXBRL and contained in exhibit 101). |
Item 16. Form 10-K Summary
Not applicable.
SIGNATURES
Pursuant to the requirements of Section 13 or 15(d) of the Securities Exchange Act of 1934, the registrant has duly caused this report to be signed on its behalf by the undersigned, thereunto duly authorized.
| | | | | | | | | | | | | | |
| | PROVIDENT FINANCIAL SERVICES, INC. |
| | | | |
| Date: | February 28, 2025 | By: | | /s/ Anthony J. Labozzetta |
| | | | Anthony J. Labozzetta |
| | | | President and Chief Executive Officer (Principal Executive Officer) |
Pursuant to the requirements of the Securities Exchange Act of 1934, this report has been signed below by the following persons on behalf of the registrant and in the capacities and on the dates indicated. | | | | | | | | | | | | | | | | | | | | |
| By: | | /s/ Anthony J. Labozzetta | | By: | | /s/ Thomas M. Lyons |
| | Anthony J. Labozzetta, President and Chief Executive Officer (Principal Executive Officer) | | | | Thomas M. Lyons, Senior Executive Vice President and Chief Financial Officer (Principal Financial Officer) |
| | | | | | |
| Date: | | February 28, 2025 | | Date: | | February 28, 2025 |
| | | | | | |
| | /s/ Christopher Martin | | By: | | /s/ Thomas J. Shara |
| | Christopher Martin Executive Chairman | | | | Thomas J. Shara Executive Vice Chairman |
| | | | | | |
| | February 28, 2025 | | Date: | | February 28, 2025 |
| | | | | | |
| By: | | /s/ Adriano M. Duarte | | By: | | /s/ James P. Dunigan |
| | Adriano M. Duarte Executive Vice President and Chief Accounting Officer (Principal Accounting Officer) | | | | James P. Dunigan, Director |
| | | | | | |
| Date: | | February 28, 2025 | | Date: | | February 28, 2025 |
| | | | | | |
| By: | | /s/ Frank L. Fekete | | By: | | /s/ Brian M. Flynn |
| | Frank L. Fekete, Director | | | | Brian M. Flynn, Director |
| | | | | | |
| Date: | | February 28, 2025 | | Date: | | February 28, 2025 |
| | | | | | |
| By: | | /s/ Ursuline F. Foley | | By: | | /s/ Brian A. Gragnolati |
| | Ursuline F. Foley, Director | | | | Brian A. Gragnolati Director |
| | | | | | |
| Date: | | February 28, 2025 | | Date: | | February 28, 2025 |
| | | | | | |
| By: | | /s/ James E. Hanson II | | By: | | /s/ Matthew K. Harding |
| | James E. Hanson II, Director | | | | Matthew K. Harding, Director |
| | | | | | |
| Date: | | February 28, 2025 | | Date: | | February 28, 2025 |
| | | | | | |
| By: | | /s/ Edward J. Leppert | | By: | | /s/ Nadine Leslie |
| | Edward J. Leppert,
Director | | | | Nadine Leslie,
Director |
| | | | | | |
| Date: | | February 28, 2025 | | Date: | | February 28, 2025 |
| | | | | | |
| By: | | /s/ Robert E. McCracken | | | | /s/ John Pugliese |
| | Robert E. McCracken,
Director | | | | John Pugliese,
Director |
| | | | | | |
| Date: | | February 28, 2025 | | Date: | | February 28, 2025 |
| | | | | | |