Exhibit 99.2
Management’s Responsibility for Financial Reporting
The management of the Company is responsible for the preparation of the accompanying consolidated financial statements. These financial statements have been prepared in accordance with Canadian generally accepted accounting principles and, where appropriate, include estimates based on careful judgment. Management has determined these amounts on a reasonable basis in order to ensure that the financial statements are presented fairly, in all material respects. Financial information contained elsewhere in this annual report is consistent with the consolidated financial statements.
PreMD maintains a system of internal accounting and administrative controls that are designed to provide reasonable assurance, at a reasonable cost, that the financial information is accurate and reliable and that the assets are appropriately accounted for and adequately safeguarded.
The Board of Directors is responsible for ensuring that management fulfills its responsibilities for financial reporting and internal control. The Board carries out this responsibility through an Audit Committee, which includes three non-management directors, and meets periodically with management and the external auditors, Ernst & Young LLP. The auditors have unrestricted access to the Audit Committee. The Audit Committee reviews PreMD’s quarterly and annual consolidated financial statements and recommends their approval by the Board. The Committee also recommends the appointment of the external auditors who are appointed at PreMD’s Annual Meeting.
The consolidated financial statements have been audited by Ernst & Young, on behalf of the shareholders, in accordance with Canadian generally accepted auditing standards.
 |  |
Brent Norton | Ron Hosking |
President and Chief Executive Officer | Vice President, Finance, and Chief Financial Officer |
| Toronto, Canada | |
| March 28, 2007 |
Report of Independent Auditors
To the Shareholders of PreMD Inc.
We have audited the consolidated balance sheets of PreMD Inc. as at December 31, 2006 and 2005 and the consolidated statements of loss and deficit and cash flows for each of the years in the three-year period ended December 31, 2006. These financial statements are the responsibility of the Company’s management. Our responsibility is to express an opinion on these financial statements based on our audits.
We conducted our audits in accordance with Canadian generally accepted auditing standards and the standards of the Public Company Accounting Oversight Board (United States). Those standards require that we plan and perform the audit to obtain reasonable assurance whether the financial statements are free of material misstatement. We were not engaged to perform an audit of the Company’s internal control over financial reporting. Our audits included consideration of internal control over financial reporting as a basis for designing audit procedures that are appropriate in the circumstances, but not for the purpose of expressing an opinion on the effectiveness of the Company’s internal control over financial reporting. Accordingly, we express no such opinion. An audit includes examining, on a test basis, evidence supporting the amounts and disclosures in the financial statements. An audit also includes assessing the accounting principles used and significant estimates made by management, as well as evaluating the overall financial statement presentation. We believe that our audits provide a reasonable basis for our opinion.
In our opinion, these consolidated financial statements present fairly, in all material respects, the financial position of PreMD Inc. as at December 31, 2006 and 2005 and the results of its operations and its cash flows for each of the years in the three-year period ended December 31, 2006 in conformity with Canadian generally accepted accounting principles, which differ in certain respects from accounting principles generally accepted in the United States of America (see note 10 (as restated) to the consolidated financial statements).

Chartered Accountants
Toronto, Canada
March 28, 2007
28 PREMD 2006 ANNUAL REPORT
PreMD Inc.
Incorporated under the laws of Canada
Consolidated Balance Sheets
[In Canadian dollars]
2006 | 2005 | ||||||
| As at December 31 | $ | $ | |||||
ASSETS | |||||||
Current | |||||||
| Cash and cash equivalents | 112,577 | 773,199 | |||||
| Short-term investments | 3,163,482 | 7,905,883 | |||||
Accounts receivable [note 3] | 11,221 | 881,891 | |||||
| Inventory | 179,219 | 36,306 | |||||
| Prepaid expenses and other receivables | 570,773 | 317,264 | |||||
| Investment tax credits receivable | 200,000 | 200,000 | |||||
Total current assets | 4,237,272 | 10,114,543 | |||||
Deferred financing fees, net of accumulated amortization of $174,863 [2005 - $43,059] [note 5] | 347,589 | 477,725 | |||||
Capital assets, net [note 4[a]] | 312,410 | 410,636 | |||||
Intangible assets, net of accumulated amortization of $915,027 [2005 - $856,970] [note 4[b] and 8[a]] | 382,229 | 290,286 | |||||
5,279,500 | 11,293,190 | ||||||
LIABILITIES AND SHAREHOLDERS’ EQUITY (DEFICIENCY) | |||||||
Current | |||||||
| Accounts payable | 963,990 | 291,125 | |||||
| Accrued liabilities | 932,372 | 655,113 | |||||
Current portion of deferred revenue [note 8[a]] | - | 311,915 | |||||
Total current liabilities | 1,896,362 | 1,258,153 | |||||
Convertible debentures [note 6] | 6,350,680 | 5,893,340 | |||||
Deferred revenue [note 8[a]] | - | 2,297,400 | |||||
Total liabilities | 8,247,042 | 9,448,893 | |||||
Commitments [note 8] | |||||||
Shareholders’ equity (deficiency) | |||||||
Capital stock [note 6] | 25,263,480 | 24,449,826 | |||||
Contributed surplus [note 6] | 2,521,915 | 1,840,979 | |||||
Equity component of convertible debentures [note 5] | 2,239,385 | 2,393,145 | |||||
Warrants [notes 5, 6[c] and 8[b][ii]] | 1,170,020 | 1,373,718 | |||||
| Deficit | (34,162,342 | ) | (28,213,371 | ) | |||
Total shareholders’ equity (deficiency) | (2,967,542 | ) | 1,844,297 | ||||
5,279,500 | 11,293,190 | ||||||
See accompanying notes
On behalf of the Board:
 |  |
Brent Norton, MD, MBA | Stephen A. Wilgar |
Director | Director |
29 PREMD 2006 ANNUAL REPORT
Consolidated Statements of Loss and Deficit
[In Canadian dollars]
2006 | 2005 | 2004 | ||||||||
| Years ended December 31 | $ | $ | $ | |||||||
REVENUE | ||||||||||
Product sales [note 3] | 6,513 | 425,730 | 183,258 | |||||||
License revenue [note 3] | 3,328,827 | 1,153,308 | 302,080 | |||||||
3,335,340 | 1,579,038 | 485,338 | ||||||||
| Cost of product sales, including amortization of nil [2005 - $3,456; 2004 - $6,600] | 36,824 | 428,650 | 190,214 | |||||||
Gross profit | 3,298,516 | 1,150,388 | 295,124 | |||||||
EXPENSES | ||||||||||
| Research and development | 4,773,762 | 3,120,276 | 2,612,770 | |||||||
| General and administration | 3,024,811 | 2,690,790 | 3,346,720 | |||||||
Interest on convertible debentures [notes 5 and 6] | 677,723 | 228,481 | - | |||||||
Imputed interest on convertible debentures [note 5] | 819,609 | 255,529 | - | |||||||
Amortization [notes 4[a], [b] and 5] | 319,205 | 252,804 | 224,428 | |||||||
| Loss (gain) on foreign exchange | 97,746 | (35,734 | ) | 8,731 | ||||||
9,712,856 | 6,512,146 | 6,192,649 | ||||||||
RECOVERIES AND OTHER INCOME | ||||||||||
| Investment tax credits | 200,000 | 198,923 | 205,000 | |||||||
| Interest | 265,369 | 173,130 | 123,626 | |||||||
465,369 | 372,053 | 328,626 | ||||||||
Net loss for the year | (5,948,971 | ) | (4,989,705 | ) | (5,568,899 | ) | ||||
| Deficit, beginning of year | (28,213,371 | ) | (23,223,666 | ) | (17,654,767 | ) | ||||
Deficit, end of year | (34,162,342 | ) | (28,213,371 | ) | (23,223,666 | ) | ||||
Basic and diluted loss per share | $ | (0.27 | ) | $ | (0.23 | ) | $ | (0.26 | ) | |
Weighted average number of common shares outstanding | 21,663,698 | 21,487,008 | 21,276,497 | |||||||
See accompanying notes
30 PREMD 2006 ANNUAL REPORT
Consolidated Statements of Cash Flows
[In Canadian dollars]
2006 | 2005 | 2004 | ||||||||
| Years ended December 31 | $ | $ | $ | |||||||
OPERATING ACTIVITIES | ||||||||||
| Net loss for the year | (5,948,971 | ) | (4,989,705 | ) | (5,568,899 | ) | ||||
| Add (deduct) items not involving cash | ||||||||||
Amortization | 319,205 | 256,260 | 231,028 | |||||||
Stock-based compensation costs included in | ||||||||||
Research and development expense | 156,920 | 147,085 | 123,925 | |||||||
General and administration expense | 383,767 | 421,812 | 476,164 | |||||||
Loss (gain) on sale of capital asset | (1,743 | ) | - | 6,098 | ||||||
Imputed interest on convertible debenture | 819,609 | 255,529 | - | |||||||
Interest on convertible debenture paid in common shares | 281,462 | - | - | |||||||
Loss (gain) on foreign exchange | 97,748 | (35,734 | ) | 8,731 | ||||||
Net change in non-cash working capital balances related to operations [note 9] | 1,422,730 | (1,061,397 | ) | 535,284 | ||||||
| Increase (decrease) in deferred revenue | (2,609,315 | ) | (301,885 | ) | 2,818,100 | |||||
Cash used in operating activities | (5,078,588 | ) | (5,308,035 | ) | (1,369,569 | ) | ||||
INVESTING ACTIVITIES | ||||||||||
| Short-term investments | 4,589,356 | (3,065,568 | ) | 1,678,190 | ||||||
| Purchase of trademark | (150,000 | ) | - | - | ||||||
| Purchase of capital assets | (24,965 | ) | (130,310 | ) | (164,789 | ) | ||||
| Sale of capital assets | 3,000 | - | 628 | |||||||
Cash provided by (used in) investing activities | 4,417,391 | (3,195,878 | ) | 1,514,029 | ||||||
FINANCING ACTIVITIES | ||||||||||
Issuance of convertible debentures [note 5] | - | 9,827,616 | - | |||||||
Financing fees [note 5] | (51,399 | ) | (861,328 | ) | - | |||||
| Issuance of capital stock, net of issue costs | - | 198,400 | 33,373 | |||||||
Cash provided by (used in) financing activities | (51,399 | ) | 9,164,688 | 33,373 | ||||||
Effect of exchange rate changes on cash and cash equivalents | 51,974 | (127,034 | ) | - | ||||||
Net increase (decrease) in cash and cash equivalents during the year | (660,622 | ) | 533,741 | 177,833 | ||||||
| Cash and cash equivalents, beginning of year | 773,199 | 239,458 | 61,625 | |||||||
Cash and cash equivalents, end of year | 112,577 | 773,199 | 239,458 | |||||||
Represented by | ||||||||||
| Cash | 112,577 | 773,199 | 173,302 | |||||||
| Cash equivalents | - | - | 66,156 | |||||||
112,577 | 773,199 | 239,458 | ||||||||
Supplemental cash flow information | ||||||||||
| Cash paid during the year for interest | 396,261 | 228,481 | - | |||||||
See accompanying notes
31 PREMD 2006 ANNUAL REPORT
Notes to Consolidated Financial Statements
December 31, 2006 [In Canadian dollars, unless otherwise noted]
1. NATURE OF THE COMPANY
PreMD Inc. [the “Company”] operates in a single business segment and is a predictive medicine company dedicated to improving health outcomes with non-invasive or minimally-invasive tools for the early detection of life-threatening diseases, particularly cardiovascular disease and cancer. The Company develops easy-to-use, accurate and cost-effective tests designed for use in a point-of-care setting, in a laboratory, in the life insurance industry, and, eventually, at home, and licenses the global marketing rights to third parties.
The Company currently owns patents for a test used to measure skin cholesterol and has in-licensed the technologies for tests to detect the presence of a cancer-specific marker for use in colorectal, lung and breast cancer. In addition, the Company has patents and patents pending for color measurement in biological reactions and has a right of first refusal on certain genomics-related technologies in the predictive medicine field.
2. SIGNIFICANT ACCOUNTING POLICIES
New pronouncements
The Canadian Institute of Chartered Accountants [“CICA”] released five new standards related to financial instruments and hedging. The Company is currently evaluating the impact on its consolidated financial statements of adopting these standards on January 1, 2007. These standards are effective for years beginning on or after October 1, 2006 and include the following sections:
[a] Section 3855 of the CICA Handbook, “Financial Instruments - Recognition and Measurement”, describes the standards for recognizing and measuring financial assets, financial liabilities and non-financial derivatives. This section requires that:
| • | All financial assets be measured at fair value, with some exceptions, such as loans and receivables and investments that are classified as held-to-maturity; |
| • | All financial liabilities be measured at fair value if they are derivatives or classified as held-for-trading purposes. Other financial liabilities are measured at their carrying value; and |
| • | All derivative financial instruments be measured at fair value, even when they are part of a hedging relationship. |
[b] Section 3865 of the CICA Handbook, “Hedges”, describes when and how hedge accounting can be used. Hedging is an activity used by a company to change an exposure to one or more risks by creating an offset between:
| • | Changes in the fair value of a hedged item and a hedging item; and |
| • | Changes resulting from risk exposure relating to a hedged item and a hedging item. |
Hedge accounting ensures that all gains, losses, revenues and expenses from the derivative and the item it hedges are recorded in the income statement in the same period.
[c] Section 1530 of the CICA Handbook, “Comprehensive Income”, describes how to report and disclose comprehensive income and its components. Comprehensive income is the change in a company’s net assets that results from transactions, events and circumstances from sources other than the company’s shareholders. It includes items that would not normally be included in net earnings, such as unrealized gains or losses on available-for-sale investments. Adopting this section will require the Company to start reporting the following items in the consolidated financial statements: comprehensive income and its components, and accumulated other comprehensive income and its components.
[d] Section 3250 of the CICA Handbook, “Surplus”, was changed and reissued as Section 3251, “Equity”. The changes in how to report and disclose equity and changes in equity are consistent with the new requirements of Section 1530, “Comprehensive Income”.
32 PREMD 2006 ANNUAL REPORT
[e] Section 3861 of the CICA Handbook, “Financial Instruments - Disclosure and Presentation”, establishes standards for presentation of financial instruments as non-financial derivatives and identifies disclosure requirements. Adopting this section would impact the classification of a financial instrument, or its component parts, as a liability or as an equity instrument in accordance with the substance of the contractual arrangement on initial recognition.
The consolidated financial statements have been prepared by management in accordance with Canadian generally accepted accounting principles [“Canadian GAAP”] consistently applied within the framework of the significant accounting policies summarized below. The significant differences between Canadian GAAP and United States generally accepted accounting principles [“U.S. GAAP”] are described and reconciled in note 10.
Basis of consolidation
The accompanying consolidated financial statements include the accounts of the Company and its wholly-owned subsidiaries, PreMD International Inc., Berne, incorporated under the laws of Switzerland, and 6211178 Canada Inc., incorporated under the laws of Canada. All significant intercompany transactions and balances have been eliminated upon consolidation.
Foreign currency translation
The Company’s functional currency is the Canadian dollar. Foreign operations are considered integrated and are translated into Canadian dollars using the temporal method. Monetary items are translated using the exchange rate in effect at the year end and non-monetary items are translated at historical exchange rates. Revenue and expenses are translated at the average rate for the year, except for amortization of capital assets which is translated at the same exchange rates as the assets to which they relate. Exchange gains or losses are included in the determination of net loss for the year.
Use of estimates
The preparation of consolidated financial statements in conformity with Canadian GAAP requires management to make estimates and assumptions that affect the reported amounts of assets and liabilities and the disclosure of contingent assets and liabilities at the date of the consolidated financial statements and the reported amounts of revenue and expenses during the reporting periods. Actual results could differ materially from those estimates.
Cash and cash equivalents
Cash and cash equivalents comprise cash on hand and highly liquid investments that are readily convertible into cash with maturities of less than 90 days when purchased. There were no cash equivalents as at December 31, 2006 and 2005, but as at December 31, 2004, cash equivalents were comprised of funds with an average interest rate of 2.9%.
Short-term investments
Short-term investments are carried at the lower of cost and market value. Market value approximates cost. Short-term investments as at December 31, 2006 were comprised of money market funds and fixed income securities with interest rates of approximately 4.5% [2005 - 3.6%]. Short-term investments are comprised of highly liquid investments with maturity periods greater than 90 days but less than one year when purchased.
Financial instruments
The carrying values of cash and cash equivalents, short-term investments, accounts receivable, other receivables, accounts payable and accrued liabilities are considered to approximate their respective fair values due to their short-term nature.
The fair values of the equity and warrant components of the convertible debentures are recorded as “equity component of convertible debentures” and “warrants”, respectively, net of the allocated financing costs. The carrying value of the convertible debentures is recorded as a liability and is being accreted to its maturity value through charges to income for the imputed interest [note 5].
33 PREMD 2006 ANNUAL REPORT
Notes to Consolidated Financial Statements
December 31, 2006 [In Canadian dollars, unless otherwise noted]
Inventory
Inventory of raw materials is valued at the lower of cost and replacement cost. Inventories of finished goods are valued at the lower of cost and net realizable value, determined on a first-in, first-out basis.
Deferred financing fees
Financing costs relating to the issue of convertible debentures are pro-rated between the liability and the equity and warrant components of the debentures [note 5]. The expenses related to the liability component are deferred and are amortized on a straight-line basis over the term of the debentures. Should the debentures be converted prior to maturity, the unamortized balance of financing costs will be transferred to capital stock. The “equity component of convertible debentures” and the “warrants” are recorded net of the respective allocated financing costs.
Capital assets
Capital assets are recorded at acquisition cost less accumulated amortization.
Purchases of molds required for the manufacture of products are capitalized and amortized over the useful life of the assets on the basis of units produced. The amortization expense for molds is recorded as a cost of product sales.
The Company provides for amortization on the declining balance basis, unless otherwise indicated, at rates which are expected to charge operations with the cost of the assets over their estimated useful lives as follows:
| Manufacturing equipment | useful life on basis of units produced |
| Computer equipment | 30% |
| Furniture and equipment | 20% |
| Research instrumentation | 30% |
| Laboratory equipment | 20% |
| Leasehold improvements | straight-line over the term of the lease |
Intangible assets
Patents, patent rights and trademarks acquired by the Company are recorded at acquisition cost and are amortized on a declining balance basis at 20% per year. The Company evaluates the carrying value of intangible assets for potential impairment when events or changes in circumstances indicate that the carrying value may not be recoverable. An impairment loss is recognized when the carrying amount of an intangible asset exceeds the sum of the undiscounted cash flows expected to result from its use.
Indemnifications
Many of the Company’s agreements, specifically those related to financing, clinical trials, research and development and supply arrangements, include indemnification provisions where the Company agrees to indemnify and hold harmless the counterparty against possible claims by third parties. Potential payments under these provisions relate to personal injury resulting from clinical trials and from breach of fundamental representation and warranty terms in the agreements with respect to matters such as corporate status, title of assets, consents to transfer, employment matters, litigation and other potential material liabilities. None of the indemnification provisions absorb the credit risk of the counterparties’ assets or liabilities. The maximum potential amount of future payments that the Company could be required to make under these indemnification provisions is not reasonably quantifiable as certain indemnifications are not subject to a monetary limitation. The Company also maintains product liability insurance to cover claims related to its clinical trials and sales of products. At December 31, 2006, management believes there is only a remote possibility that the indemnification provisions would require any material cash payment.
34 PREMD 2006 ANNUAL REPORT
The Company indemnifies its directors and officers against any and all claims or losses reasonably incurred in the performance of their service to the Company to the extent permitted by law. The Company has acquired and maintains liability insurance for its directors and officers.
Revenue recognition
The Company earned 100% of its revenue from one customer under the terms of two contracts [note 8[a]. These contracts outlined the terms for all products and services provided to the customer, and were considered multiple revenue arrangements. Under the terms of Emerging Issues Committee No. 142 - “Revenue Arrangements with Multiple Deliverables”, products and services under these contracts are separated into units of accounting for revenue recognition purposes.
Non-refundable, up-front payments received from licensees are deferred and recognized in income on a straight-line basis over the respective terms of the agreements. Milestone payments received from licensees are recorded as income in the period when the respective measurable milestones are achieved and collectability is assured. Royalty revenues are based on sales by licensees and are recorded as income in the period earned and reported by the licensees.
Revenue from sales of products to licensees is recognized when the title passes to the licensee and when the products are shipped.
Interest income is recognized as earned.
Research and development and related investment tax credits
Research and development expenditures include related salaries, subcontractor fees, product development expenses including patent costs, clinical trials costs and an allocation of administrative expenses and corporate costs specifically attributable to research and development. Research and development excludes any costs associated with the acquisition of capital assets and acquired technology. Research and development expenditures are charged to expenses as incurred unless management believes a development cost meets the generally accepted criteria for deferral. All development costs incurred to date have been expensed. Reimbursements for specific expenditures received through collaborative funding have been applied against research and development expenses.
Investment tax credits earned as a result of incurring qualified scientific research and experimental development expenses are recorded when the amounts are readily determinable. The amounts are recorded as follows:
| • | For capital assets - as a reduction of the cost of the related asset; and |
| • | For operating expenses - as a recovery within the consolidated statements of loss and deficit. |
Stock-based compensation
The Company has two stock-based compensation plans for employees, directors and consultants, which are described in note 6[d]. Certain of the stock options granted vest over a fixed term and others vest based on performance upon the achievement of certain milestones.
Canadian GAAP requires that options issued be accounted for using the fair value method of accounting. Non-cash compensation expense for fixed-term options is recorded over the term of the vesting period, whereas compensation expense for performance options is recorded when it is determined that achievement of the milestone is likely. Prior to 2003, no compensation expense was recognized for stock options granted to employees. For stock options awarded to employees prior to January 1, 2003 but subsequent to January 1, 2002, pro forma disclosure of net loss and loss per share is provided as if these awards were accounted for using the fair value method. Consideration paid on the exercise of stock options and warrants is credited to capital stock.
35 PREMD 2006 ANNUAL REPORT
Notes to Consolidated Financial Statements
December 31, 2006 [In Canadian dollars, unless otherwise noted]
Shares issued to employees under the share purchase plan are accounted for as direct awards of stock and are recognized as a non-cash compensation expense in the consolidated statements of loss and deficit [note 6[e]].
Income taxes
The Company applies the asset and liability method of accounting for income taxes. Under this method, future income tax assets and liabilities are determined based on differences between the financial reporting and tax bases of assets and liabilities and are measured using the substantively enacted tax rates and laws that are expected to be in effect when the differences are expected to reverse. Valuation allowances are provided if it is more likely than not that some or all of the future tax assets will not be realized.
Loss per share
Loss per share has been calculated on the basis of net loss for the year divided by the weighted average number of common shares outstanding during the year. Diluted loss per share reflects the dilution that would occur if outstanding stock options and warrants were exercised or converted into common shares using the treasury stock method. The inclusion of the Company’s stock options, the conversion feature of the convertible debentures and the warrants in the computation of diluted loss per share would have an anti-dilutive effect on loss per share. Therefore, stock options and warrants have been excluded from the calculation of diluted loss per share. Consequently, there is no difference between basic loss per share and diluted loss per share.
3. ECONOMIC DEPENDENCE AND CONCENTRATION OF CREDIT RISK
Revenues earned by the Company in fiscal years 2004 to 2006 were from one customer. These revenues were pursuant to a license agreement that was terminated on December 28, 2006 [note 8[a]]. All amounts due to the Company from this customer had been collected prior to the year end. As at December 31, 2005, substantially all the accounts receivable were due from this customer.
4. CAPITAL AND INTANGIBLE ASSETS
[a] Capital assets consist of the following:
| 2006 | ||||||||||
Accumulated | Net book | |||||||||
Cost | amortization | value | ||||||||
$ | $ | $ | ||||||||
| Manufacturing equipment | 20,585 | 10,056 | 10,529 | |||||||
| Computer equipment | 299,947 | 218,529 | 81,418 | |||||||
| Furniture and equipment | 65,609 | 48,373 | 17,236 | |||||||
| Research instrumentation | 666,460 | 515,576 | 150,884 | |||||||
| Laboratory equipment | 61,437 | 24,023 | 37,414 | |||||||
| Leasehold improvements | 39,983 | 25,054 | 14,929 | |||||||
1,154,021 | 841,611 | 312,410 | ||||||||
36 PREMD 2006 ANNUAL REPORT
| 2005 | ||||||||||
| Accumulated | Net book | |||||||||
| Cost | amortization | value | ||||||||
| $ | $ | $ | ||||||||
| Manufacturing equipment | 20,585 | 10,056 | 10,529 | |||||||
| Computer equipment | 293,388 | 185,361 | 108,027 | |||||||
| Furniture and equipment | 65,609 | 44,064 | 21,545 | |||||||
| Research instrumentation | 669,183 | 452,701 | 216,482 | |||||||
| Laboratory equipment | 60,496 | 14,787 | 45,709 | |||||||
| Leasehold improvements | 23,159 | 14,815 | 8,344 | |||||||
| 1,132,420 | 721,784 | 410,636 | ||||||||
Amortization expense on capital assets amounted to $121,934 in 2006 [2005 - $140,629; 2004 - $140,313].
[b] Intangible assets consist of the following:
| 2006 | ||||||||||
Accumulated | Net book | |||||||||
Cost | amortization | value | ||||||||
$ | $ | $ | ||||||||
| Patents and patent rights | 1,147,256 | 915,027 | 232,229 | |||||||
| Trademarks | 150,000 | - | 150,000 | |||||||
1,297,256 | 915,027 | 382,229 | ||||||||
| 2005 | ||||||||||
| Accumulated | Net book | |||||||||
| Cost | amortization | value | ||||||||
| $ | $ | $ | ||||||||
| Patents and patent rights | 1,147,256 | 856,970 | 290,286 | |||||||
| 1,147,256 | 856,970 | 290,286 | ||||||||
Amortization expense on intangible assets amounted to $58,057 in 2006 [2005 - $72,572; 2004 - $90,715].
5. CONVERTIBLE DEBENTURES
On August 30, 2005, the Company completed a financing, by way of a private placement of convertible debentures maturing on August 30, 2009, for gross proceeds of $9,827,616 [US$8,210,000] less issue fees and expenses of $913,000 (resulting in net proceeds of $8,915,000). The unsecured debentures bear interest at an annual rate of 7% [effective rate of 12.75%on the liability component], payable quarterly in cash or common shares at the Company’s option. The number of common shares issuable in satisfaction of interest payments is dependent on the trading price of the shares at the time of the applicable interest payment date. The debentures are convertible into common shares at any time during the term, at the option of the holder, at $3.47 per share (subject to adjustment). If all the debentures were converted into common shares, it would result in the issuance of an additional 2,882,195 common shares. Purchasers of the convertible debentures also received warrants to purchase 1,288,970 common shares at any time before August 30, 2010 at an exercise price of $3.57 per share (subject to adjustment). At any time after one year from the date of issuance of the warrants, the warrants may also be exercised by means of a cashless exercise by the holder. On August 25, 2006, $475,441 [US$430,000] of the debentures were converted into 150,877 common shares of the Company, which resulted in a reclassification of $357,304 of the liability, $140,137 of the equity component of the convertible debentures and $22,000 of the deferred financing fees to share capital.
37 PREMD 2006 ANNUAL REPORT
Notes to Consolidated Financial Statements
December 31, 2006 [In Canadian dollars, unless otherwise noted]
Of the total amount of the financing, $5,917,209 was recorded as a liability using the residual method. The fair value of the equity component of the convertible debentures at the date of grant is estimated at $2,393,145 [net of expenses of $228,292], using the Black-Scholes option pricing model. The fair value of the warrants is estimated at $1,176,718 [net of expenses of $112,252], determined using the Black-Scholes option pricing model. Additional financing expenses of $51,399 were incurred in 2006, of which $13,623 was allocated to the equity component of the convertible debenture and $6,698 was allocated to warrants based on their relative fair values. The assumptions used to calculate the fair value of the equity component and the warrants are as follows:
| Equity | |||||||
| component | Warrants | ||||||
| Expected volatility | 42.7 | % | 41.7 | % | |||
| Risk-free interest rate | 3.35 | % | 3.35 | % | |||
| Expected option life | 4 years | 5 years | |||||
| Dividend yield | nil | nil | |||||
The table below presents a summary of the offering:
| Deferred | ||||||||||
| financing | ||||||||||
| Proceeds | fees | Net | ||||||||
| $ | $ | $ | ||||||||
| Issuance of convertible debenture | 9,827,616 | 861,328 | 8,966,288 | |||||||
| Equity component of convertible debentures | (2,621,437 | ) | (228,292 | ) | (2,393,145 | ) | ||||
| Warrants | (1,288,970 | ) | (112,252 | ) | (1,176,718 | ) | ||||
Liability component of convertible debenture | 5,917,209 | 520,784 | 5,396,425 | |||||||
The liability component is being accreted over time by a charge to the consolidated statements of loss and deficit for imputed interest at an effective rate of 12.75% and, at maturity, will be equal to the face value of the debentures. All cash repayments, default payments or redemptions of the principal under the debentures shall be made in U.S. dollars.
The table below presents a reconciliation of the valuation of the liability component from date of issue to December 31, 2006:
| $ | ||||
| Issuance of convertible debentures, August 30, 2005 | 5,917,209 | |||
| Changes in foreign exchange rates | (279,398 | ) | ||
| Imputed interest | 255,529 | |||
| Balance, December 31, 2005 | 5,893,340 | |||
| Conversion to common shares | (357,304 | ) | ||
| Changes in foreign exchange rates | (4,965 | ) | ||
| Imputed interest | 819,609 | |||
Balance, December 31, 2006 | 6,350,680 | |||
The amortization of the deferred financing fees amounted to $139,214 for 2006 [2005 - 43,059; 2004 - nil].
38 PREMD 2006 ANNUAL REPORT
6. CAPITAL STOCK AND CONTRIBUTED SURPLUS
[a] Authorized
The authorized capital stock of the Company consists of an unlimited number of common shares, without nominal or par value, and an unlimited number of preferred shares, issuable in series.
[b] Issued and outstanding shares
| Stated | Contributed | ||||||||||||
| Number | value | surplus | Total | ||||||||||
| Common shares | $ | $ | $ | $ | |||||||||
Balance, December 31, 2003 | 21,260,902 | 24,056,853 | 723,993 | 24,780,846 | |||||||||
Expiry of warrants [notes 6[c] and 8[b][ii]] | - | - | 115,200 | 115,200 | |||||||||
Stock-based compensation expense [note 6[d]] | - | - | 488,994 | 488,994 | |||||||||
Issued under share purchase plan [note 6[e]] | 1,830 | 7,595 | - | 7,595 | |||||||||
Issued on exercise of options [note 6[d]] | 8,150 | 23,368 | - | 23,368 | |||||||||
| Issued on cashless exercise of options | 27,713 | 94,500 | - | 94,500 | |||||||||
| Repayment of share purchase loans | 15,000 | 10,005 | - | 10,005 | |||||||||
Balance, December 31, 2004 | 21,313,595 | 24,192,321 | 1,328,187 | 25,520,508 | |||||||||
Expiry of warrants [note 6[c]] | - | - | 3,000 | 3,000 | |||||||||
Stock-based compensation expense [note 6[d]] | - | - | 509,792 | 509,792 | |||||||||
Issued under share purchase plan [note 6[e]] | 23,167 | 59,105 | - | 59,105 | |||||||||
Issued on exercise of options [note 6[d]] | 31,000 | 78,400 | - | 78,400 | |||||||||
| Repayment of share purchase loans | 180,000 | 120,000 | - | 120,000 | |||||||||
Balance, December 31, 2005 | 21,547,762 | 24,449,826 | 1,840,979 | 26,290,805 | |||||||||
Expiry of warrants [note 8[b][i]] | - | - | 197,000 | 197,000 | |||||||||
Stock-based compensation expense [note 6[d]] | - | - | 483,936 | 483,936 | |||||||||
Issued under share purchase plan [note 6[e]] | 25,910 | 56,751 | - | 56,751 | |||||||||
Issued as payment for interest [note 5] | 133,674 | 281,462 | - | 281,462 | |||||||||
Issued on conversion of debenture [note 5] | 150,877 | 475,441 | - | 475,441 | |||||||||
Balance, December 31, 2006 | 21,858,223 | 25,263,480 | 2,521,915 | 27,785,395 | |||||||||
On September 13, 2004, an executive of the Company exercised, on a cashless basis, 75,000 options to acquire common shares of the Company at $2.15 per share. The Company issued 27,713 common shares to the executive with an aggregate value equal to the difference between the exercise price of the options and the fair market value of the Company’s common shares [$94,500] on September 13, 2004. The Toronto Stock Exchange and the Board of Directors of the Company approved this cashless exercise.
[c] Warrants
Pursuant to the issue of convertible debentures on August 30, 2005, the Company granted warrants to purchase 1,288,970 common shares at any time before August 30, 2010 at an exercise price of $3.57 per share [note 5].
39 PREMD 2006 ANNUAL REPORT
Notes to Consolidated Financial Statements
December 31, 2006 [In Canadian dollars, unless otherwise noted]
Pursuant to a research collaboration agreement dated October 31, 2000, the Company granted warrants to purchase up to 50,000 common shares at an exercise price of $4.50 per share; these warrants were issued in annual increments of 10,000 warrants exercisable immediately and expiring in one year. As of October 31, 2005, all warrants expired unexercised.
The status of warrants as at December 31, 2006, 2005 and 2004 and changes during the years ended on those dates is presented below:
| 2006 | 2005 | 2004 | |||||||||||||||||
Weighted | Weighted | Weighted | |||||||||||||||||
average | average | average | |||||||||||||||||
Number of | exercise | Number of | exercise | Number of | exercise | ||||||||||||||
warrants | price | warrants | price | warrants | price | ||||||||||||||
# | $ | # | $ | # | $ | ||||||||||||||
Outstanding, beginning of year | 1,388,970 | 3.60 | 110,000 | 4.05 | 185,000 | 4.23 | |||||||||||||
| Granted | - | - | 1,288,970 | 3.57 | 10,000 | 4.50 | |||||||||||||
| Expired or forfeited | (100,000 | ) | 4.00 | (10,000 | ) | 4.50 | (85,000 | ) | 4.50 | ||||||||||
Outstanding, end of year | 1,288,970 | 3.57 | 1,388,970 | 3.60 | 110,000 | 4.05 | |||||||||||||
[d] Options
Under the 1998 Stock Option Plan, the Company grants options to its employees, directors and consultants. The Company may issue options for up to 3,500,000 common shares. As at December 31, 2006, 3,189,517 options had been issued, of which 2,920,304 remain outstanding under this plan, and the remaining 310,483 are eligible to be issued. The exercise price of each option granted may not be less than the market price of the Company’s stock on the date of the grant and no option may have a term exceeding 10 years.
Certain of the options vest over a fixed term and others vest based on performance upon the achievement of certain milestones. A summary of the status of the two types of options is presented below:
Fixed stock options
Fixed stock options vest on an annual basis over a period of up to five years. The status of fixed stock options as at December 31, 2006, 2005 and 2004 and changes during the years ended on those dates is presented below:
| 2006 | 2005 | 2004 | |||||||||||||||||
Weighted | Weighted | Weighted | |||||||||||||||||
average | average | average | |||||||||||||||||
Number | exercise | Number | exercise | Number | exercise | ||||||||||||||
of shares | price | of shares | price | of shares | price | ||||||||||||||
# | $ | # | $ | # | $ | ||||||||||||||
Outstanding, beginning of year | 2,297,785 | 3.41 | 1,954,285 | 3.54 | 1,757,035 | 3.45 | |||||||||||||
| Granted | 896,500 | 1.48 | 549,500 | 3.02 | 406,000 | 3.79 | |||||||||||||
| Exercised | - | - | (31,000 | ) | 2.53 | (33,613 | ) | 2.24 | |||||||||||
| Expired or forfeited | (454,981 | ) | 3.08 | (175,000 | ) | 3.79 | (175,137 | ) | 3.50 | ||||||||||
Outstanding, end of year | 2,739,304 | 2.83 | 2,297,785 | 3.41 | 1,954,285 | 3.54 | |||||||||||||
Options exercisable end of year | 1,461,783 | 3.47 | 1,458,114 | 3.49 | 1,258,957 | 3.52 | |||||||||||||
40 PREMD 2006 ANNUAL REPORT
The following table presents information about fixed stock options outstanding at December 31, 2006:
Weighted | Weighted | Weighted | ||||||||||||||
average | average | average | ||||||||||||||
Number | remaining | exercise | Number | exercise | ||||||||||||
Range of exercise prices | outstanding | life | price | exercisable | price | |||||||||||
$ | # | [in years] | $ | # | $ | |||||||||||
1.25 - 1.40 | 735,500 | 4.14 | 1.31 | - | - | |||||||||||
2.20 - 2.95 | 1,056,304 | 2.20 | 2.88 | 633,783 | 2.86 | |||||||||||
3.20 - 3.97 | 218,000 | 2.77 | 3.58 | 168,200 | 3.48 | |||||||||||
4.00 - 4.09 | 709,500 | 1.24 | 4.01 | 643,800 | 4.01 | |||||||||||
6.05 | 20,000 | 0.43 | 6.05 | 16,000 | 6.05 | |||||||||||
2,739,304 | 2.51 | 2.83 | 1,461,783 | 3.47 | ||||||||||||
The assumptions used to calculate the fair value of stock-based compensation expense using the Black-Scholes option pricing model are approximately as follows:
2006 | 2005 | 2004 | ||||||||
| Expected volatility | 43.9 | % | 42.2 | % | 50.1 | % | ||||
| Risk-free interest rate | 3.97 | % | 3.66 | % | 3.79 | % | ||||
| Expected life | 5 years | 5 years | 5 years | |||||||
Dividend yield assumption used for all years presented was nil.
The Black-Scholes option pricing model, used by the Company to calculate option values, as well as other accepted option valuation models were developed to estimate the fair value of freely tradable, fully transferable options without vesting restrictions, which significantly differ from the Company’s stock option awards. These models also require highly subjective assumptions, including future stock price volatility and expected time until exercise, which greatly affect the calculated values. Accordingly, management believes that these models do not necessarily provide a reliable single measure of the fair value of the Company’s stock option awards.
Performance stock options
Performance stock options vest immediately upon the achievement of certain milestones as determined by the Board of Directors at the time of issuance. The performance stock option milestones include criteria measured by product-related goals and corporate goals. Product-related goals include product development, completion of clinical trials, regulatory submissions, regulatory approvals, signing of marketing partners and commercial launch of the Company’s products. The corporate goals include successful investor and public relations activities related to media publications and investor analyst coverage, as well as financial goals including completion of financings and government grants.
41 PREMD 2006 ANNUAL REPORT
Notes to Consolidated Financial Statements
December 31, 2006 [In Canadian dollars, unless otherwise noted]
The status of performance stock options as at December 31, 2006, 2005 and 2004 and changes during the years ended on those dates is presented below:
December 31, 2006 | December 31, 2005 | December 31, 2004 | |||||||||||||||||
Weighted | Weighted | Weighted | |||||||||||||||||
average | average | average | |||||||||||||||||
Number | exercise | Number | exercise | Number | exercise | ||||||||||||||
of shares | price | of shares | price | of shares | price | ||||||||||||||
# | $ | # | $ | # | $ | ||||||||||||||
Outstanding, beginning of year | 176,000 | 3.46 | 176,000 | 3.46 | 214,750 | 3.54 | |||||||||||||
| Granted | 120,000 | 2.35 | - | - | - | - | |||||||||||||
| Exercised | - | - | - | - | (2,250 | ) | 3.45 | ||||||||||||
| Expired or forfeited | (115,000 | ) | 3.17 | - | - | (36,500 | ) | 3.93 | |||||||||||
Outstanding, end of year | 181,000 | 2.91 | 176,000 | 3.46 | 176,000 | 3.46 | |||||||||||||
Options exercisable end of year | 34,700 | 4.00 | 85,825 | 3.29 | 85,825 | 3.29 | |||||||||||||
The following table presents information about performance stock options outstanding at December 31, 2006:
Weighted | Weighted | Weighted | ||||||||||||||
average | average | average | ||||||||||||||
Number | remaining | exercise | Number | exercise | ||||||||||||
Range of exercise prices | outstanding | life | price | exercisable | price | |||||||||||
$ | # | [in years] | $ | # | $ | |||||||||||
2.35 | 120,000 | 4.83 | 2.35 | - | - | |||||||||||
4.00 | 61,000 | 0.13 | 4.00 | 34,700 | 4.00 | |||||||||||
181,000 | 3.24 | 2.91 | 34,700 | 4.00 | ||||||||||||
Pro forma impact of stock-based compensation
The table below presents pro forma net loss and basic and diluted loss per common share as if stock options granted to employees between January 1, 2002 and December 31, 2002 had been determined based on the fair value method.
2006 | 2005 | 2004 | ||||||||
$ | $ | $ | ||||||||
| Net loss as reported | (5,948,971 | ) | (4,989,705 | ) | (5,568,899 | ) | ||||
| Estimated stock-based compensation expenses | (50,610 | ) | (116,286 | ) | (223,830 | ) | ||||
Pro forma net loss | (5,999,581 | ) | (5,105,991 | ) | (5,792,729 | ) | ||||
Pro forma basic and diluted loss per common share | $ | (0.28 | ) | $ | (0.24 | ) | $ | (0.27 | ) | |
The assumptions used to calculate the fair value of stock-based compensation expense using the Black-Scholes option pricing model are approximately as follows: expected volatility of 54.3%; risk-free interest rate of 4.06%; dividend yield of nil; and expected life of the options of five years.
[e] Share purchase plan
The Company implemented a share purchase plan effective March 22, 1999, as amended on May 25, 2005. Pursuant to the terms of the plan, the Company will match the value of the common shares purchased by its employees or directors by issuing from treasury an equal number of common shares, up to a maximum value of the lesser of 50% of the maximum allowable
42 PREMD 2006 ANNUAL REPORT
annual contribution for registered retirement savings plans [being $9,000 as at December 31, 2006 or 9% of the employee’s annual salary]. The maximum number of common shares which may be issued by the Company pursuant to the share purchase plan is 350,000. Under the plan, the Company issued 25,910 common shares to employees and directors during the year ended December 31, 2006 and 23,167 and 1,830 common shares during the years ended December 31, 2005 and 2004, respectively.
7. INCOME TAXES
[a] Significant components of the Company’s future tax assets are as follows:
2006 | 2005 | ||||||
$ | $ | ||||||
Future tax assets | |||||||
| Federal tax loss carryforwards | 3,045,000 | 2,450,000 | |||||
| Ontario tax loss carryforwards | 2,170,000 | 1,612,000 | |||||
| Investment tax credits | 2,061,000 | 1,700,000 | |||||
| Financing and share issue costs | 194,000 | 263,000 | |||||
| SR&ED expenditures | 3,684,000 | 3,380,000 | |||||
| Capital assets | 95,000 | 99,000 | |||||
| Deferred revenue | - | 684,000 | |||||
| Future tax assets before valuation allowance | 11,249,000 | 10,188,000 | |||||
| Valuation allowance | 11,249,000 | 10,188,000 | |||||
Net future tax assets | - | - | |||||
No net future tax assets have been recognized in the consolidated financial statements as the realization of the net future tax assets does not meet the more likely than not recognition criteria.
[b] The Company has accumulated tax losses for federal and provincial purposes in Canada. The Company also has unclaimed federal scientific research investment tax credits. The losses and investment tax credits can be used to offset future years’ Canadian taxable income, the benefit of which has not been recorded in the accounts.
The approximate tax losses and investment tax credits expire as follows:
| Investment | ||||||||||
| Federal | Ontario | tax credits | ||||||||
| $ | $ | $ | ||||||||
| 2007 | 1,062,000 | 1,340,000 | - | |||||||
| 2008 | 1,562,000 | 1,562,000 | - | |||||||
| 2009 | 2,887,000 | 2,887,000 | 18,000 | |||||||
| 2010 | 2,018,000 | 2,018,000 | 247,000 | |||||||
| 2011 | - | - | 337,000 | |||||||
| 2012 | - | - | 297,000 | |||||||
| 2013 | - | - | 397,000 | |||||||
| 2014 | 494,000 | 494,000 | 423,000 | |||||||
| 2015 | 2,178,000 | 2,178,000 | 464,000 | |||||||
| 2016 | 5,024,000 | 5,024,000 | 458,000 | |||||||
| 15,225,000 | 15,503,000 | 2,641,000 | ||||||||
43 PREMD 2006 ANNUAL REPORT
Notes to Consolidated Financial Statements
December 31, 2006 [In Canadian dollars, unless otherwise noted]
[c] The Company has available scientific research and experimental development [“SR&ED”] expenditures for income tax purposes which may be carried forward indefinitely to reduce future years’ taxable income. The total of such expenditures accumulated to December 31, 2006 was approximately $11,162,000. The potential income tax benefits associated with these expenditures have not been recorded in the accounts.
[d] The Company is entitled to receive provincial investment tax credits relating to SR&ED expenditures incurred, the benefits of which have been accrued in the accounts.
[e] The following is a reconciliation of the provision for (recovery of) income taxes between those that are expected, based on substantially enacted rates, to those currently reported:
| 2006 | 2005 | 2004 | |||||||||||||||||
$ | % | $ | % | $ | % | ||||||||||||||
| Loss before income taxes | (5,948,971 | ) | (4,989,705 | ) | (5,568,899 | ) | |||||||||||||
| Expected recovery of income taxes | (2,148,768 | ) | (36.1 | ) | (1,802,281 | ) | (36.1 | ) | (2,011,486 | ) | (36.1 | ) | |||||||
| Permanent differences | 526,482 | 8.8 | 299,044 | 6.0 | 268,428 | 4.8 | |||||||||||||
| Change in valuation allowance | 1,622,286 | 27.3 | 1,503,237 | 30.1 | 1,743,058 | 31.3 | |||||||||||||
- | - | - | - | - | - | ||||||||||||||
8. COMMITMENTS
[a] Commercialization agreements
Pursuant to an agreement dated May 10, 2002, as amended on December 20, 2002 and December 9, 2005, the Company licensed to McNeil Consumer Healthcare [“McNeil”] the right to market and distribute the Company’s test for coronary artery disease in Canada and for the insurance laboratory field in the United States and Mexico. The term of the agreement was 15 years and required McNeil to purchase the Company’s skin cholesterol test and to pay ongoing royalties to the Company based on McNeil’s sales, in addition to a series of financial milestone payments of up to $3,300,000, which were to be based on McNeil’s achievement of specified annual sales levels of the licensed products.
On May 28, 2004, as amended on December 9, 2005, the Company signed an additional marketing agreement with McNeil and completed an exclusive worldwide licensing agreement to sell the Company’s skin cholesterol tests under the brand name PREVU* Skin Sterol Test. The agreement had a minimum term of 10 years. Under the financial terms of the agreement, the Company received a non-refundable $3,000,000 up-front payment.
On December 28, 2006, the agreements with McNeil were terminated and the balance of the deferred revenue, which had been received as an up-front payment, of $2,297,400 was recorded as license revenue. In addition, the Company received additional license revenue of $221,000 related to annual minimum sales levels and purchased other assets from McNeil for $221,000, including the PREVU* trademark for $150,000.
[b] Research and collaboration agreements
The Company has entered into agreements with various clinical sites to conduct clinical trials on its technologies. The Company is committed, upon the progressive completion of the trials, to make further payments of approximately $305,000.
44 PREMD 2006 ANNUAL REPORT
The Company has acquired or is developing in collaboration with others a number of technologies that will require the Company to make payments upon the successful achievement of certain technological milestones. Additionally, in connection with the development of the technologies, the Company has entered into research agreements whereby a minimum fee will be paid for research and development to be carried out by other parties. The Company is committed, upon the successful achievement of future operating performance milestones, to make further payments of approximately $225,000 to these parties.
[i] Pursuant to agreements [the “ColorectAlertTM License Agreements”] dated March 27, 1998, May 1, 1998, and October 23, 2001 between the Company and Dr. A.K.M. Shamsuddin [the “ColorectAlertTM Inventor”], the Company acquired a license, including the three existing United States and Japanese patents, for a technology that detects a carbohydrate marker associated with cancerous and pre-cancerous conditions [“ColorectAlertTM”]. Pursuant to the terms of the agreements, the Company is required to make payments upon achieving certain research and development milestones as well as royalty payments based on revenues from sales of this technology. As at December 31, 2006, the Company had made milestone payments under the ColorectAlertTM License Agreements of approximately $328,000. Future milestone payments, upon completion of specific milestones, could amount to as much as $120,000. In addition, the Company granted warrants to purchase up to 100,000 common shares at exercise prices ranging from $3.50 to $4.50 per share to the ColorectAlertTM Inventor. These warrants expired unexercised on October 19, 2006,and the fair value of $197,000 was reclassified from warrants to contributed surplus [note 6[b]].
Subsequent to the year end, on January 5, 2007, the Company settled litigation relating to the ColorectAlertTM License Agreements. Under the terms of the settlement with Dr. Shamsuddin and Med-11 AG, the Company agreed to pay $175,000 to Med-11 AG [“Med-11”] and amended the agreements to replace Dr. Shamsuddin with Med-11 as the licensor. This amount was expensed in 2006 as general and administration expense. The amendment also reduced the royalty payable by the Company from 10% to 7.5% on its revenues from products utilizing the patents and eliminated all future milestone payments that the Company may have been required to pay under the initial agreements.
[ii] The Company entered into an agreement [the “Procyon License Agreement”] with Ambrilia Biopharma, Inc. (formerly, Procyon Biopharma Inc.) [“Procyon”] dated March 19, 2001, as amended, whereby the Company has the right to complete the development, clinical trials and regulatory submission for the technology and is entitled to develop, manufacture, market and distribute the ColoPathTM technology exclusively on a global basis. Pursuant to the terms of the Procyon License Agreement, all new patents will be owned by the Company. Procyon is entitled to payments based on the completion of certain research and development milestones as well as a royalty payment based on sales of all mucus-based colorectal cancer tests. As at December 31, 2006, the Company had made milestone payments under the Procyon License Agreement of $125,000. Future milestone payments, upon completion of specific milestones, could amount to as much as $225,000. The Procyon License Agreement does not have a fixed termination date and it may be terminated upon written agreement of the parties, if the Company has not at that time engaged in any clinical work or product development in connection with the research and development of ColorectAlertTM or ColoPathTM or met minimum levels of sales of these products. In addition, the Company granted Procyon warrants to purchase up to 75,000 common shares at an exercise price of $4.50 per share in connection with this agreement. These warrants expired unexercised on March 19, 2004, and the fair value of $108,000 was reclassified from warrants to contributed surplus [note 6[b]].
[c] Key man life insurance
A subsidiary of the Company, 6211178 Canada Inc. [the “Subsidiary”], owns life insurance policies for the CEO in the amount of $8,000,000, with the Subsidiary as the named beneficiary. In the event of the CEO’s death, the Subsidiary shall use 75% of the insurance proceeds to purchase the CEO’s common shares in the Company from his estate. Pursuant to the terms of the insurance agreement, on January 1 of each year, the Subsidiary shall ensure that the amount of the insurance policy is not less than 100% of the fair market value of the CEO’s common shares at that date. The Company owns an additional life insurance policy for the CEO in the amount of $3,000,000.
45 PREMD 2006 ANNUAL REPORT
Notes to Consolidated Financial Statements
December 31, 2006 [In Canadian dollars, unless otherwise noted]
[d] Operating leases and other commitments
The Company has contractual commitments and future minimum annual lease payments under operating leases for its office premises and laboratory facilities as follows:
| $ | ||||
| 2007 | 226,000 | |||
| 2008 | 135,000 | |||
| 2009 | 19,000 | |||
| 2010 and thereafter | - | |||
| 380,000 | ||||
9. CONSOLIDATED STATEMENTS OF CASH FLOWS
The net change in non-cash working capital balances related to operations consists of the following:
2006 | 2005 | 2004 | ||||||||
$ | $ | $ | ||||||||
| Accounts receivable | 870,670 | (659,543 | ) | (211,648 | ) | |||||
| Inventory | (142,913 | ) | 231,194 | (267,500 | ) | |||||
| Prepaid expenses and other receivables | (253,509 | ) | (180,249 | ) | 186,774 | |||||
| Investment tax credits receivable | - | 189,000 | (209,000 | ) | ||||||
| Accounts payable and accrued liabilities | 948,482 | (641,799 | ) | 1,036,658 | ) | |||||
1,422,730 | (1,061,397 | ) | 535,284 | |||||||
Excluded from the consolidated statements of cash flows for the years ended December 31, 2006 was the issuance of common shares paid as consideration for interest on the convertible debentures of $281,462 and a foreign exchange adjustment of $1,642. There was no impact on the years ended December 31, 2005 and 2004.
The Company did not pay any amounts for income taxes from 2004 to 2006.
46 PREMD 2006 ANNUAL REPORT
10. RECONCILIATION OF CANADIAN TO UNITED STATES GENERALLY ACCEPTED ACCOUNTING PRINCIPLES
The Company prepares its consolidated financial statements in accordance with Canadian GAAP, which, as applied in these consolidated financial statements, conforms in all material respects to U.S. GAAP, except as follows:
2006 | 2005 | 2004 | ||||||||
$ | $ | $ | ||||||||
| [note b] | ||||||||||
Net loss for the year [Canadian GAAP] | (5,948,971 | ) | (4,989,705 | ) | (5,568,899 | ) | ||||
| Adjustments | ||||||||||
Amortization of acquired technology [a] | 58,057 | 72,572 | 90,715 | |||||||
Mark-to-market adjustment on derivative [b] | 54,088 | 28,807 | - | |||||||
Amortization of deferred financing fees [c] | (50,043 | ) | (15,798 | ) | - | |||||
Net loss and comprehensive loss for the year | ||||||||||
[U.S. GAAP] [e] | (5,886,869 | ) | (4,904,124 | ) | (5,478,184 | ) | ||||
Basic and diluted loss per share | ||||||||||
[U.S. GAAP] | $ | (0.27 | ) | $ | (0.23 | ) | $ | (0.26 | ) | |
Weighted average number of common shares outstanding | ||||||||||
| Basic and diluted | 21,663,698 | 21,487,008 | 21,276,497 | |||||||
Basic loss per common share is determined using the weighted average number of common shares outstanding during the years. As a result of the net losses for the years ended December 31, 2006, 2005 and 2004, the potential dilutive effect of the exercise of stock options and warrants was anti-dilutive, and therefore, it was not included in the calculation of diluted loss per share.
Consolidated balance sheet items, which would differ under U.S. GAAP, are as follows:
2006 | 2005 | 2004 | ||||||||
$ | $ | $ | ||||||||
ASSETS | ||||||||||
Intangible assets, net [a] | 150,000 | - | - | |||||||
Deferred financing fees [c] | 475,851 | 686,653 | - | |||||||
5,167,639 | 11,211,832 | 6,633,221 | ||||||||
LIABILITIES AND SHAREHOLDERS’ EQUITY | ||||||||||
Derivative liability [b] | 2,402,244 | 2,592,630 | - | |||||||
10,649,286 | 12,041,523 | 4,499,237 | ||||||||
Shareholders’ equity | ||||||||||
| Capital stock | 29,981,717 | 29,182,269 | 28,924,764 | |||||||
Additional paid-in capital [d] | 5,167,851 | 4,735,952 | 3,049,442 | |||||||
Deficit [a] [b] [c] | (40,631,215 | ) | (34,747,912 | ) | (29,840,222 | ) | ||||
(5,481,647 | ) | (829,691 | ) | 2,133,984 | ||||||
5,167,639 | 11,211,832 | 6,633,221 | ||||||||
47 PREMD 2006 ANNUAL REPORT
Notes to Consolidated Financial Statements
December 31, 2006 [In Canadian dollars, unless otherwise noted]
[a] Intangible assets
Under U.S. GAAP, the Company’s patents and patent rights, which are primarily comprised of patents and know-how which require regulatory approval to be commercialized and which have no proven alternative future uses, are considered in-process research and development and are immediately expensed upon acquisition in accordance with Statement of Financial Accounting Standards [“SFAS”] No. 2, “Accounting for Research and Development Costs”. The Company’s patents and patent rights do not have an alternative future use given their specialized nature and limited alternative use. Under Canadian GAAP, the patents and patent rights are considered to be a development asset that is capitalized and amortized over its expected useful life.
[b] Convertible debentures
During 2006, the Company determined that the conversion feature of the convertible debentures met the definition of a derivative underFAS133,“Accounting for Derivative Instruments and Hedging Activities”, as amended, and should be recorded on the balance sheet as a derivative liability with subsequent changes in value recorded through earnings. Previously, the fair value assigned to the conversion feature of the convertible debenture was recorded as a liability and accreted to its maturity value through charges to income for the imputed interest at an effective rate of 3.52%. As a result, the previously reported difference relating to the imputed interest on the liability component of $154,900 no longer exists. The elimination of the imputed interest is partially offset by the mark-to-market gain of the derivative liability of $28,807, as well as a reduction in the amortization of the deferred financing fees (see [c] below). The net impact of these three adjustments increases the net loss for2005 under U.S. GAAP by $122,527 from amounts previously reported and also increases basic and diluted loss per share of $0.22 previously reported to $0.24.The restated pro forma basic and diluted loss per share increases from $0.23 previously reported to $0.24 [see note f].
The impact of these adjustments on the balance sheet under U.S. GAAP is as follows:
| • | The fair value of the conversion feature of $2,621,437, as at August 30, 2005, being the same value as the equity component under Canadian GAAP, was reclassified from convertible debentures to derivative liability; |
| • | The derivative liability was revalued to $2,592,630 as at December 31, 2005 which represents a mark-to-market gain of $28,807. |
In accordance with Accounting Principles Board [“APB”] Opinion No. 14, a value is assigned to the warrants when they are detachable from the convertible debentures. As a result, there is no difference in the value assigned to warrants under Canadian and U.S. GAAP.
On August 25, 2006, $461,235 [US$430,000] of the debentures were converted into 150,877 common shares of the Company, which resulted in a reclassification of $357,304 of the liability component of the convertible debentures, $136,298 of the derivative liability and $32,367 of the deferred financing fees to share capital. These amounts differ slightly from the amounts reported under Canadian GAAP described in note 5.
[c] Deferred financing fees
Under U.S. GAAP, financing fees relating to the issue of convertible debentures are pro-rated between the liability (exclusive of the fair value assigned to the conversion feature) and the warrant components of the debentures. Under Canadian GAAP, the financing fees are allocated between the liability and the equity and the warrant components. The expenses related to the liability component are deferred and amortized over the term of the debentures whereas the expenses related to the equity and warrant components are netted against their respective fair values. The resulting difference is that the financing fees allocated to the liability component under U.S. GAAP are higher than under Canadian GAAP, and therefore, additional amortization expense is recorded.
As a result of the 2005 restatement discussed in [b] above, the Company determined that the deferred financing fees allocated to the liability and warrant components as at August 30, 2005 were restated to $706,289 and $155,039, respectively
48 PREMD 2006 ANNUAL REPORT
(previously reported as $748,493 and $112,834, respectively). The unamortized portion of deferred financing fees as at December 31, 2005 has been restated to $647,423, a decrease of $39,230 from the previously reported amount of $686,653. Amortization of deferred financing fees under U.S. GAAP for fiscal 2005 has decreased $3,566 to $15,798 from the previously reported amount of $19,364. Furthermore, additional paid-in capital has decreased by $42,787 to $4,693,165 to reflect the additional deferred financing fees netted against the warrants when compared to Canadian GAAP.
[d] Stock options
Prior to 2003, the Company did not recognize compensation expense relating to stock options under Canadian or U.S. GAAP. Effective January 1, 2003, the Company adopted the provisions of SFAS No. 123 [“SFAS 123”], which aligned with the provisions of CICA Handbook Section 3870. Prior to January 1, 2003, the Company recognized compensation expense for the fixed and performance stock options granted to employees in accordance with APB Opinion No. 25 [“APB 25”]. APB 25 required the Company to recognize compensation expense relating to the intrinsic value of the options when the market price of the underlying stock is greater than the exercise price of the stock options on the grant date. Compensation expense recorded prior to January 1, 2003 was recorded as additional paid-in capital and was reclassified to capital stock upon exercising of the actual options. Under Canadian GAAP, there was no recognition of compensation expense related to employee options prior to January 1, 2003.
[e] Comprehensive income
SFAS No. 130, “Reporting Comprehensive Income”, establishes standards for the reporting and display of comprehensive income and its components in general purpose financial statements. Comprehensive income is defined as the change in net assets of a business enterprise during a period from transactions and other events and circumstances from non-owner sources, and includes all changes in equity during a period. For the years presented, the Company did not have any material transactions that would otherwise have had an impact on comprehensive income. As such, net loss for the year under U.S. GAAP is equal to comprehensive income.
[f] SFAS 123 pro forma disclosures
SFAS 123 requires pro forma disclosures of net loss and loss per share as if the fair value method, as opposed to the intrinsic value-based method, of accounting for employee stock options had been applied for performance stock options granted prior to January 1, 2003.
The following tables present the Company’s net loss and loss per share on a pro forma basis using the fair value method as determined by the Black-Scholes option pricing model:
2006 | 2005 | 2004 | ||||||||
$ | $ | $ | ||||||||
| [note b] | ||||||||||
Net loss for the year | ||||||||||
| U.S. GAAP - as reported | (5,886,869 | ) | (4,904,124 | ) | (5,478,184 | ) | ||||
Pro forma stock-based compensation expense [d] | (45,888 | ) | (225,923 | ) | (376,879 | ) | ||||
Net loss under U.S. GAAP - pro forma | (5,932,757 | ) | (5,130,047 | ) | (5,855,063 | ) | ||||
Basic and diluted loss per share [U.S. GAAP] | ||||||||||
| As reported | $ | (0.27 | ) | $ | (0.24 | ) | $ | (0.26 | ) | |
| Pro forma | $ | (0.27 | ) | $ | (0.24 | ) | $ | (0.28 | ) | |
Weighted average number of common shares outstanding | ||||||||||
| Basic and diluted | 21,663,698 | 21,487,008 | 21,276,497 | |||||||
49 PREMD 2006 ANNUAL REPORT
Notes to Consolidated Financial Statements
December 31, 2006 [In Canadian dollars, unless otherwise noted]
The assumptions used to calculate the fair value of stock-based compensation expense for performance stock options granted in the respective years prior to 2003 using the Black-Scholes option pricing model are as follows:
| High | Low | ||||||
| Expected volatility | 62.3 | % | 55.5 | % | |||
| Risk-free interest rate | 6.19 | % | 4.56 | % | |||
| Expected option life | 5 years | 5 years | |||||
| Dividend yield | Nil | Nil | |||||
[g] Additional consolidated balance sheet information
Accounts payable and accrued liabilities consisted primarily of amounts owing to trade creditors of $1,208,702 [2005 -$573,818; 2004 - $1,352,014] and accruals related to clinical trials of $512,660 [2005 - $372,420; 2004 - $236,023] and a litigation settlement of $175,000 [nil in 2005 and 2004].
In accordance with Canadian GAAP, the Company’s cash and cash equivalents and short-term investments are carried at the lower of cost or market based on quoted market prices. Under U.S. GAAP, these investments would have been classified as held-to-maturity and would have been recorded at amortized cost. There is no significant difference between cost under Canadian GAAP and amortized cost under U.S. GAAP.
[h] Recent accounting developments
The Company has adopted SFAS No. 123(R), “Share-Based Payment” onamodifiedprospectivebasis.SFASNo.123(R)is a revision of SFAS 123 and supersedes APB 25andrequires all share-based payments to employees to be recognized in the financial statements based on their fair values. The Company has reviewed its policies and determined that there is no material impact on the consolidated financial statements as a result of the Company adopting this pronouncement.
In July 2006, the Financial Accounting Standards Board [“FASB”] issued FIN 48, “Accounting for Uncertainty in Income Taxes, an interpretation of FASB Statement 109”. FIN 48 is effective for years beginning after December 15, 2006. The Company is currently reviewing this standard, but has not yet determined its impact on the consolidated financial statements.
11. COMPARATIVE CONSOLIDATED FINANCIAL STATEMENTS
The comparative consolidated financial statements for the years ended December 31, 2005 and 2004 have been reclassified from statements previously presented to conform to the presentation of the 2006 consolidated financial statements.
12. SUBSEQUENT EVENT
On March 28, 2007, the Company issued, by way of private placement, approximately 2,917,268 common shares and 1,458,634 common share purchase warrants at $1.33 per unit for gross proceeds of approximately $3.9 million. Each common share purchase warrant expires in March 2010 and entitles the holder to acquireone common shareat a price of $1.66 per share.
50 PREMD 2006 ANNUAL REPORT
Corporate Governance
MESSAGE FROM THE CHAIRMAN
Dear Fellow Shareholders,
As the Message to Shareholders from Dr. Brent Norton, President and Chief Executive Officer, makes clear, 2006 was a year that presented more than a typical year’s share of business challenges, but also a year in which PreMD made enormous progress in our core mission: developing products that can reduce the human toll of life-threatening cardiovascular disease and cancer through predictive medicine.
Although, as a result of these business challenges, PreMD did not achieve the financial progress we anticipated at the beginning of the year, we fully expect that in 2007 the Company and its shareholders will begin to see the rewards of the increased pace of commercialization of our products and technologies.
It may therefore be appropriate to emphasize that the Company’s fundamental strengths are undiminished, and that our business potential has never been greater. First in this regard, let me point to the proprietary technologies and products the Company has been developing. These technologies and products are being developed in collaboration with the leading institutions and individual researchers in their associated disease fields. These assets are not merely proprietary, they are unique. Second, with reference to the commercial potential of our products and technologies, let me simply point you to the statistics on the incidence of disease, which continue to reflect the terrible human cost.
Against this backdrop, I can assure you that we are driven and passionate about being successful in our mission. Further, by maintaining significant personal investments in PreMD, our management, directors and other insiders ensure that we share common objectives and strategies, and that our interests are aligned with those of our shareholders. Through our majority-independent Board of Directors, PreMD’s corporate governance processes fully reflect the highest contemporary standards mandated by securities regulators in both Canada and the United States. Over the course of 2006, PreMD’s directors recorded a 93% average attendance at six Board meetings.
On behalf of the Board of Directors, I extend my thanks for your continuing trust and support. In closing, let me reiterate my confidence, which is shared throughout the Board, management and staff of PreMD, that this Company has a great future as a leader in the emerging field of predictive medicine, and that we remain focused on delivering on that potential.
Sincerely,

Stephen A. Wilgar
Chairman of the Board
51 PREMD 2006 ANNUAL REPORT
Corporate Governance
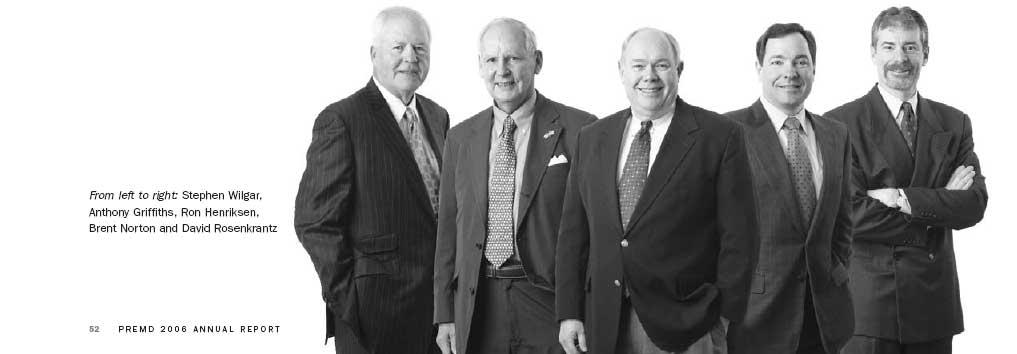
BOARD OF DIRECTORS
Stephen A. Wilgar, BA, MBA1,3 | Ron Henriksen, MBA2,3 |
Chairman | Chief Investment Officer, Twilight Ventures, LLC |
• Past President, Warner-Lambert Canada, Asia, Australia | • Presently serves on the Board of Directors of |
and Latin America | QLT, Inc., Cytori Therapeutics and Semafore |
• Presently serves on the Board of Directors of AIM | Pharmaceuticals Inc. |
PowerGen Corporation (Chairman), Team EMS and | |
Electrohome Ltd. | Brent Norton, MD, MBA |
President and Chief Executive Officer, PreMD | |
Anthony F. Griffiths, BA, MBA1,2,3 | |
Consultant and Corporate Director | David Rosenkrantz, P.ENG.1,2,4 |
President, Patica Securities Limited | |
• Presently serves on the Board of Directors of Russel | |
Metals Inc. (Chairman), Alliance Atlantis | • Presently serves on the Board of Directors of Stellar |
Communications Inc., Vitran Corporation Inc., Hub | Pharmaceuticals Inc., Carfinco Income Fund, and |
International Limited, Fairfax Financial Holdings Limited, | Medisystem Technologies Inc. (Lead Director) |
Novadaq Technologies Inc., Jaguar Mining Inc., | |
Cunningham Lindsey Group Inc., Northbridge Financial | |
Corporation and Odyssey Re Holdings Corp. |
| 1 | - Audit Committee |
| 2 | - Compensation and Corporate Governance Committee |
| 3 | - Nominating Committee |
| 4 | - Chairman of the Audit Committee |
52 PREMD 200
Management Listing and Scientific Advisory Board
SCIENTIFIC ADVISORY BOARD (SAB) | MANAGEMENT |
John Bienenstock, FRCP, FRCPC, FRSC Chairman Professor (and former Dean) Departments of Medicine and Pathology Faculty of Health Sciences McMaster University Hamilton, Ontario Herbert A. Fritsche, Jr., PhD Professor, Biochemist and Chief of Clinical Chemistry Department of Pathology and Laboratory Medicine University of Texas M.D. Anderson Cancer Center Houston, Texas Norman Marcon, MD, FRCPC Gastroenterologist and Past-Chief Division of Gastroenterology St. Michael’s Hospital Associate Professor of Medicine University of Toronto Toronto, Ontario Dennis L. Sprecher, MD Director, Dyslipidemia Discovery Medicine GlaxoSmithKline Adjunct Professor University of Pennsylvania Department of Cardiology, University of Pennsylvania Medical Center Presbyterian Philadelphia, Pennsylvania Cardiologist, Adjunct Staff (formerly head of Preventative Cardiology) The Cleveland Clinic Foundation Cleveland, Ohio | Brent Norton, MD, MBA President and Chief Executive Officer Michael Evelegh, PhD Executive Vice President, Clinical and Regulatory Affairs Ron Hosking, CA Vice President, Finance, and Chief Financial Officer Tim Currie, BA Vice President, Corporate Development Laila Gurney, B.Sc., M.Sc., RAC Director, Clinical, Quality and Regulatory Affairs Peter Horsewood, B.Sc., PhD Director, Scientific Affairs |
53 PREMD 2006 ANNUAL REPORT
Corporate Information
CORPORATE HEADQUARTERS PreMD Inc. 4211 Yonge Street, Suite 615 Toronto, Ontario M2P 2A9 www.premdinc.com info@premdinc.com STOCK LISTING Toronto Stock Exchange: PMD American Stock Exchange: PME TRANSFER AGENT AND REGISTRAR Equity Transfer Services Inc. 200 University Avenue, Suite 400 Toronto, Ontario www.equitytransfer.com T: 416.361.0930 AUDITORS Ernst & Young LLP, Chartered Accountants Ernst & Young Tower Toronto-Dominion Centre Toronto, Ontario LEGAL COUNSEL Aird & Berlis LLP 181 Bay Street, Suite 1800 BCE Place Toronto, Ontario | INVESTOR RELATIONS (IR) Current stock prices, financial reports, recent press releases and annual reports are accessible on PreMD’s corporate website. The IR department may be contacted at info@premdinc.com or 416.222.3449. ANNUAL MEETING AND WEBCAST Shareholders are invited to attend the Company’s annual meeting on Thursday, May 24, 2007 at 4 p.m. (ET) at the Toronto Stock Exchange, TSX Broadcast Centre, The Exchange Tower, 130 King Street West, Toronto, Ontario M5X 1J2. A live audio webcast will be available at www.premdinc.com. TRADEMARKS • PREVU* • Cholesterol 1,2,3TM • ColorectAlertTM • LungAlertTM • ColoPathTM |
Mintz, Levin, Cohn, Ferris, Glovsky and Popeo PC
One Financial Center
Boston, Massachusetts