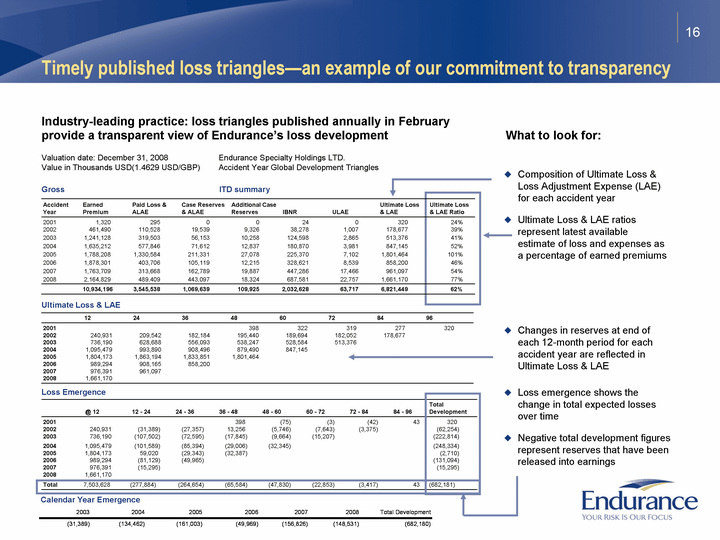
| 16 Timely published loss triangles-an example of our commitment to transparency Industry-leading practice: loss triangles published annually in February provide a transparent view of Endurance's loss development Composition of Ultimate Loss & Loss Adjustment Expense (LAE) for each accident year Ultimate Loss & LAE ratios represent latest available estimate of loss and expenses as a percentage of earned premiums What to look for: Loss emergence shows the change in total expected losses over time Negative total development figures represent reserves that have been released into earnings Changes in reserves at end of each 12-month period for each accident year are reflected in Ultimate Loss & LAE Accident Year Earned Premium Paid Loss & ALAE Case Reserves & ALAE Additional Case Reserves IBNR ULAE Ultimate Loss & LAE Ultimate Loss & LAE Ratio 2001 1,320 295 0 0 24 0 320 24% 2002 461,490 110,528 19,539 9,326 38,278 1,007 178,677 39% 2003 1,241,128 319,503 56,153 10,258 124,598 2,865 513,376 41% 2004 1,635,212 577,846 71,612 12,837 180,870 3,981 847,145 52% 2005 1,788,208 1,330,584 211,331 27,078 225,370 7,102 1,801,464 101% 2006 1,878,301 403,706 105,119 12,215 328,621 8,539 858,200 46% 2007 1,763,709 313,668 162,789 19,887 447,286 17,466 961,097 54% 2008 2,164,829 489,409 443,097 18,324 687,581 22,757 1,661,170 77% 10,934,196 3,545,538 1,069,639 109,925 2,032,628 63,717 6,821,449 62% Gross ITD summary Endurance Specialty Holdings LTD. Accident Year Global Development Triangles Valuation date: December 31, 2008 Value in Thousands USD(1.4629 USD/GBP) Ultimate Loss & LAE 12 24 36 48 60 72 84 96 2001 398 322 319 277 320 2002 240,931 209,542 182,184 195,440 189,694 182,052 178,677 2003 736,190 628,688 556,093 538,247 528,584 513,376 2004 1,095,479 993,890 908,496 879,490 847,145 2005 1,804,173 1,863,194 1,833,851 1,801,464 2006 989,294 908,165 858,200 2007 976,391 961,097 2008 1,661,170 @ 12 12 - 24 24 - 36 36 - 48 48 - 60 60 - 72 72 - 84 84 - 96 Total Development 2001 398 (75) (3) (42) 43 320 2002 240,931 (31,389) (27,357) 13,256 (5,746) (7,643) (3,375) (62,254) 2003 736,190 (107,502) (72,595) (17,845) (9,664) (15,207) (222,814) 2004 1,095,479 (101,589) (85,394) (29,006) (32,345) (248,334) 2005 1,804,173 59,020 (29,343) (32,387) (2,710) 2006 989,294 (81,129) (49,965) (131,094) 2007 976,391 (15,295) (15,295) 2008 1,661,170 Total 7,503,628 (277,884) (264,654) (65,584) (47,830) (22,853) (3,417) 43 (682,181) Loss Emergence Calendar Year Emergence |

