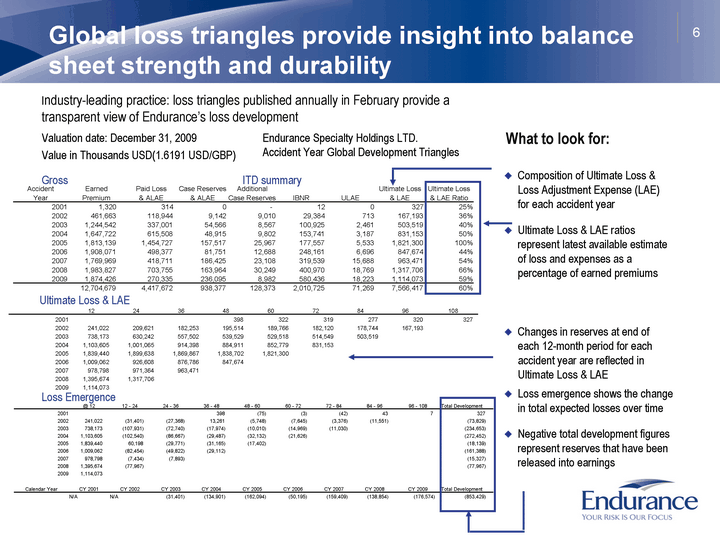
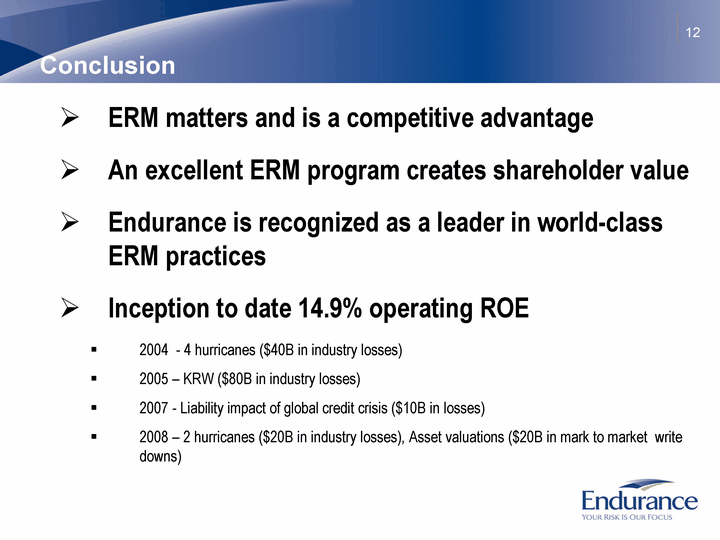
| 12 24 36 48 60 72 84 96 108 2001 398 322 319 277 320 327 2002 241,022 209,621 182,253 195,514 189,766 182,120 178,744 167,193 2003 738,173 630,242 557,502 539,529 529,518 514,549 503,519 2004 1,103,605 1,001,065 914,398 884,911 852,779 831,153 2005 1,839,440 1,899,638 1,869,867 1,838,702 1,821,300 2006 1,009,062 926,608 876,786 847,674 2007 978,798 971,364 963,471 2008 1,395,674 1,317,706 2009 1,114,073 @ 12 12 - 24 24 - 36 36 - 48 48 - 60 60 - 72 72 - 84 84 - 96 96 - 108 Total Development 2001 398 (75) (3) (42) 43 7 327 2002 241,022 (31,401) (27,368) 13,261 (5,748) (7,645) (3,376) (11,551) (73,829) 2003 738,173 (107,931) (72,740) (17,974) (10,010) (14,969) (11,030) (234,653) 2004 1,103,605 (102,540) (86,667) (29,487) (32,132) (21,626) (272,452) 2005 1,839,440 60,198 (29,771) (31,165) (17,402) (18,139) 2006 1,009,062 (82,454) (49,822) (29,112) (161,388) 2007 978,798 (7,434) (7,893) (15,327) 2008 1,395,674 (77,967) (77,967) 2009 1,114,073 Calendar Year CY 2001 CY 2002 CY 2003 CY 2004 CY 2005 CY 2006 CY 2007 CY 2008 CY 2009 Total Development N/A N/A (31,401) (134,901) (162,094) (50,195) (159,409) (138,854) (176,574) (853,429) Accident Earned Paid Loss Case Reserves Additional Ultimate Loss Ultimate Loss Year Premium & ALAE & ALAE Case Reserves IBNR ULAE & LAE & LAE Ratio 2001 1,320 314 0 - 12 0 327 25% 2002 461,663 118,944 9,142 9,010 29,384 713 167,193 36% 2003 1,244,542 337,001 54,566 8,567 100,925 2,461 503,519 40% 2004 1,647,722 615,508 48,915 9,802 153,741 3,187 831,153 50% 2005 1,813,139 1,454,727 157,517 25,967 177,557 5,533 1,821,300 100% 2006 1,908,071 498,377 81,751 12,688 248,161 6,696 847,674 44% 2007 1,769,969 418,711 186,425 23,108 319,539 15,688 963,471 54% 2008 1,983,827 703,755 163,964 30,249 400,970 18,769 1,317,706 66% 2009 1,874,426 270,335 236,095 8,982 580,436 18,223 1,114,073 59% 12,704,679 4,417,672 938,377 128,373 2,010,725 71,269 7,566,417 60% 6 Global loss triangles provide insight into balance sheet strength and durability Industry-leading practice: loss triangles published annually in February provide a transparent view of Endurance's loss development Composition of Ultimate Loss & Loss Adjustment Expense (LAE) for each accident year Ultimate Loss & LAE ratios represent latest available estimate of loss and expenses as a percentage of earned premiums What to look for: Loss emergence shows the change in total expected losses over time Negative total development figures represent reserves that have been released into earnings Changes in reserves at end of each 12-month period for each accident year are reflected in Ultimate Loss & LAE Gross ITD summary Endurance Specialty Holdings LTD. Accident Year Global Development Triangles Valuation date: December 31, 2009 Value in Thousands USD(1.6191 USD/GBP) Ultimate Loss & LAE Loss Emergence |
