Risk Review – Portfolio Expected Risk Curve
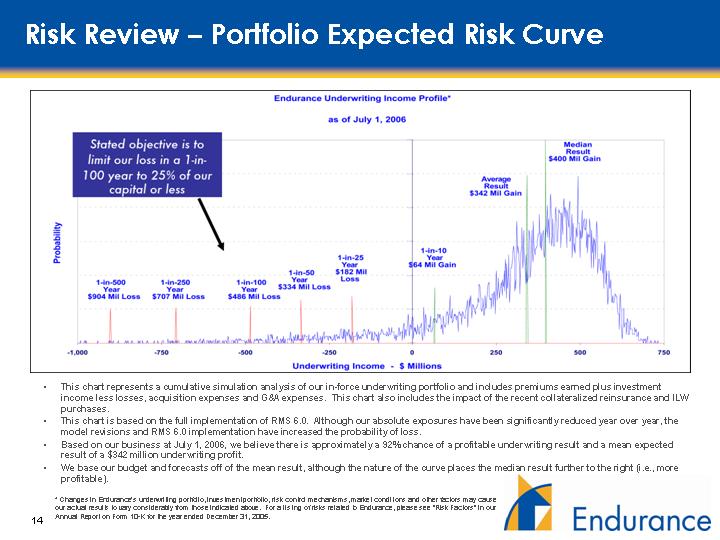
This chart represents a cumulative simulation analysis of our in-force underwriting portfolio and includes premiums earned plus investment income less losses, acquisition expenses and G&A expenses. This chart also includes the impact of the recent collateralized reinsurance and ILW purchases.
This chart represents a cumulative simulation analysis of our in-force underwriting portfolio and includes premiums earned plus investment income less losses, acquisition expenses and G&A expenses. This chart also includes the impact of the recent collateralized reinsurance and ILW purchases.
This chart is based on the full implementation of RMS 6.0. Although our absolute exposures have been significantly reduced year over year, the model revisions and RMS 6.0 implementation have increased the probability of loss.
Based on our business at July 1, 2006, we believe there is approximately a 92% chance of a profitable underwriting result and a mean expected result of a $342 million underwriting profit.
* Changes in Endurance’s underwriting portfolio, investment portfolio, risk control mechanisms, market conditions and other factors may cause our actual results to vary considerably from those indicated above. For a listing of risks related to Endurance, please see “Risk Factors” in our Annual Report on Form 10-K for the year ended December 31, 2005.
Endurance Underwriting Income Profile
Endurance Underwriting Income Profile
As of July 1, 2006
Stated objective is to limit our loss in a 1-in-100 year to 25% of our capital
Or less
Probability
1-in-500 Year $904 Mill Loss
1-in-250 Year $707 Mil Loss
1-in-100 Year $486 Mil Loss
1-in-50 Year $334 Mil Loss
1-in-25 Year $182 Mil Loss
1-in-10 Year $64 Mil Gain
Average Result $342 Mil Gain
Median Result $400 Mil Gain