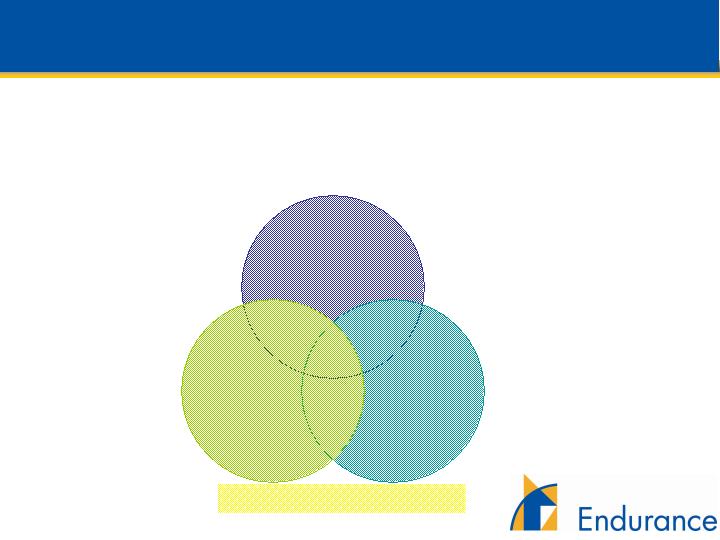
Reinsurance - Expanding Product Offering
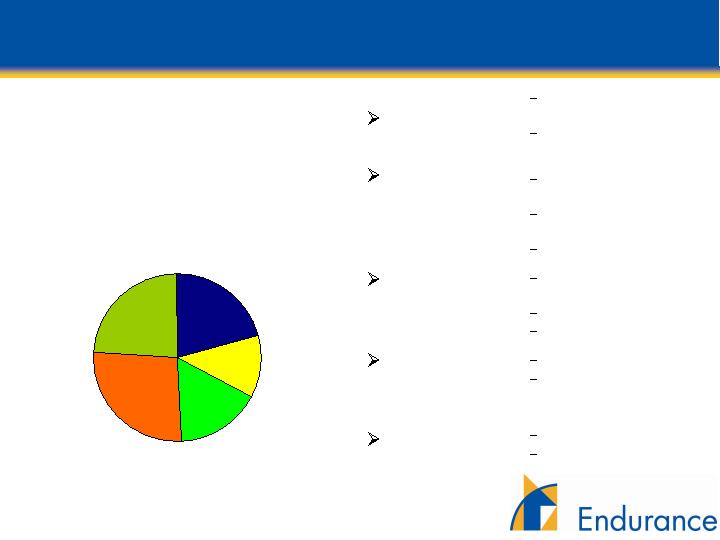
Reinsurance Total Written
Premiums of $1.2 billion*
By Line of Business
Catastrophe
Property
Casualty
Agriculture
Marine
Aerospace
Surety and
Other Specialty
Industry leading tools and
technology
Leader in Bermuda
Covers all perils
Highly specialized relationships
Auto liability, D&O, workers comp
and clash
Non-renewed large proportional
contracts in 1Q07
Multiple peril crop insurance
Industry leading tools and
technology
Covers brown and blue water hull
Provides aviation and space
coverages
Other unique opportunities
including growing surety business
* Includes deposit premiums, based on the twelve months ended March 31, 2007
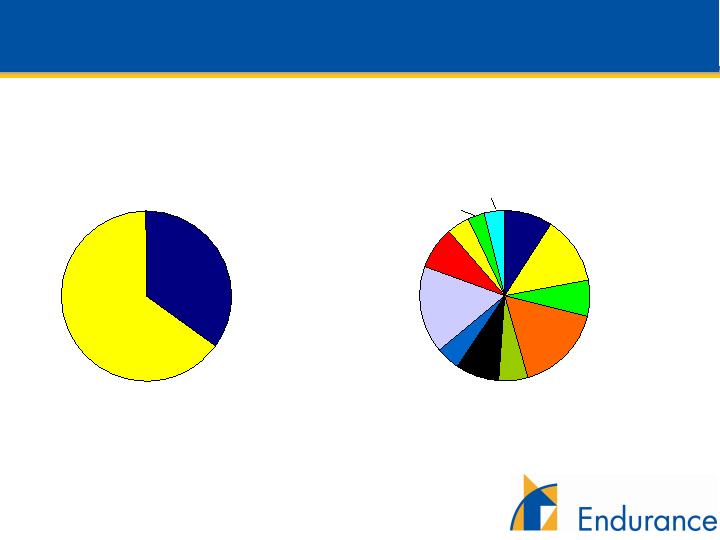
Catastrophe
25.7%
Property
19.2%
Agriculture
12.4%
Casualty
25.3%
Marine
6.5%
Aerospace
5.0%
Surety and
other specialty
5.8%
6
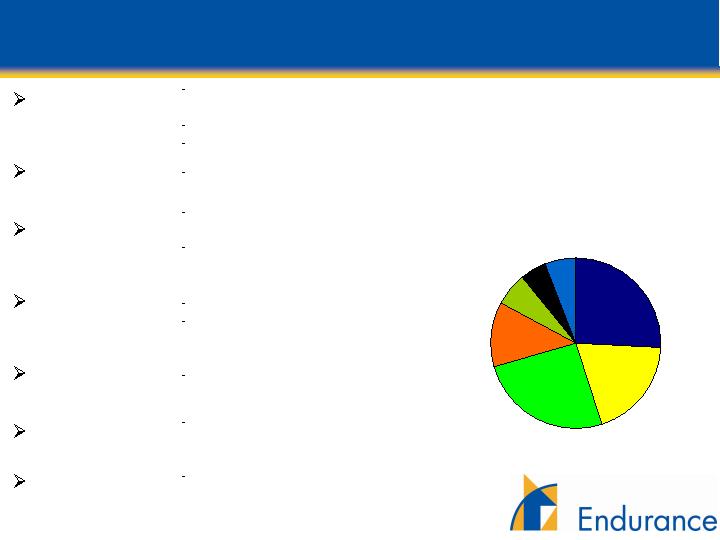
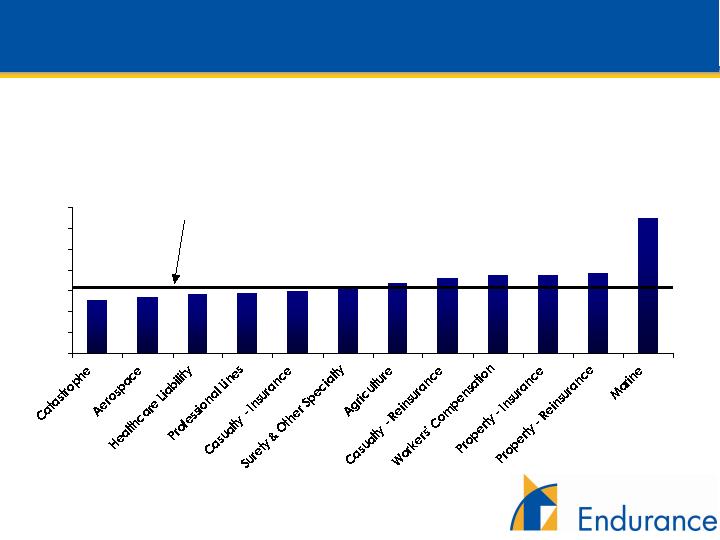
Insurance - Our Fastest Growing Segment
Insurance Total Written
Premiums of $644 million*
By Line of Business
Casualty
Professional
Lines
Healthcare
Liability
Property
Workers’
Compensation
Large account excess
liability written in Bermuda
Small account casualty
written in US
Includes E&O and D&O
products
Financial institutions
specialists
Leader in Bermuda
Hospital professional
liability
Strong relationships
Leader in Bermuda market
Written out of US and UK
Growing US specialty
business
Opportunistic strategy
Converted from
reinsurance in 2006
Casualty
20.8%
Professional
Lines
12.1%
Healthcare
Liability
16.3%
Property
26.7%
Workers’
Compensation
24.1%
* Based on the twelve months ended March 31, 2007
7
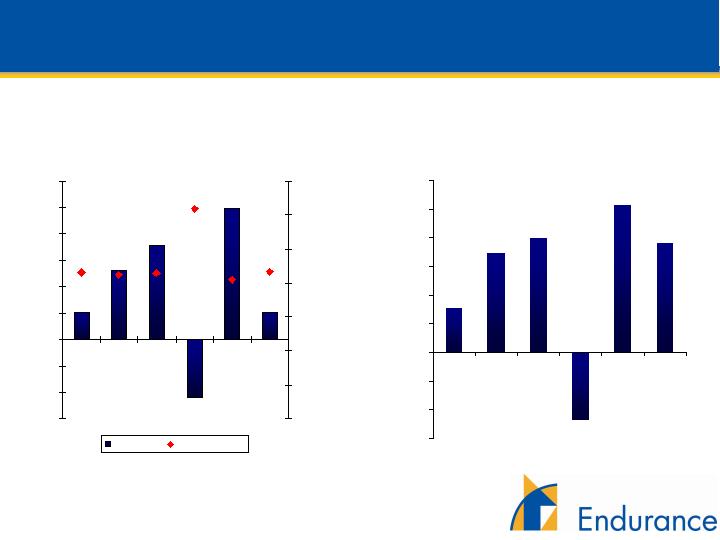
Strong Risk Management Focus -
Portfolio Expected Risk Curve (January 1, 2007)
Stated tolerance is to limit
our loss in a 1-in-100 year
to 25% of our capital or
less, our current level is
12.1% of capital
Median Result
$381 Mil Gain
The above chart represents a cumulative analysis of our in-force underwriting portfolio on a full year basis based on thousands of potential
scenarios. Loss years are driven largely by the occurrence of natural catastrophes and incorrect pricing of other property and casualty exposures.
The operating income depicted includes net premiums earned plus net investment income, acquisition expenses and G&A expenses. Forecasted
investment income, acquisition and G&A expenses are held constant across all scenarios. Losses included above are net of reinsurance including
collateralized reinsurance and ILW purchases. Our stated objective is to maintain a risk management tolerance that limits our loss in a 1-in-100 year
year to be no more than 25% of our equity capital. We base our budget and forecasts on the average result, although the nature of the curve places
the median result further to the right.
Changes in Endurance’s underwriting portfolio, investment portfolio, risk control mechanisms, market conditions and other factors may
cause actual results to vary considerably from those indicated by our value at risk curve. For a listing of risks related to Endurance
and its future performance, please see “Risk Factors” in our Annual Report on Form 10K for the year ended December 31, 2006.
Endurance Operating Income Profile
as of January 1, 2007
-1,000
-750
-500
-250
0
250
500
750
Operating Income - $ Millions
Year
$500 Mil Loss
1-in-250
$396 Mil Loss
1-in-100
$287 Mil Loss
1-in-50
$172 Mil Loss
1-in-25
$66 Mil Loss
1-in-10
$91 Mil Gain
Average
$341 Mil Gain
Year
Year
Year
Year
Year
Result
1-in-500
8

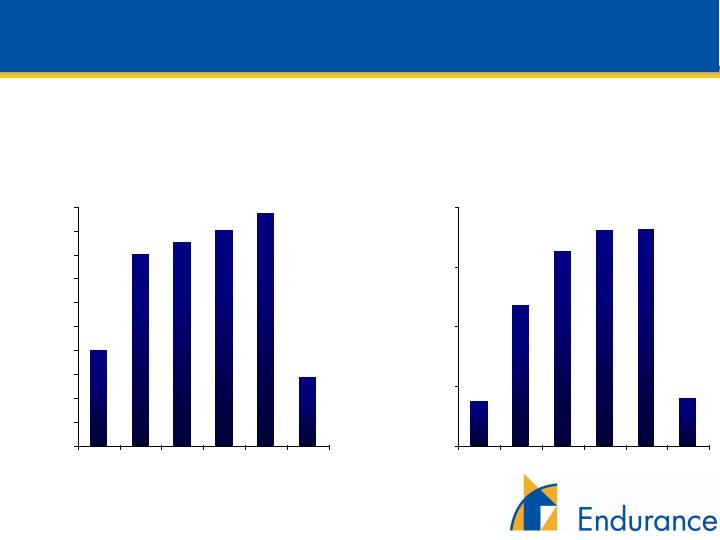
Impact of 2006 Risk Management Initiatives
Annual Aggregate Risk Curve Comparison
July 1, 2006 to
January 1, 2007 to
$
%
(in millions)
June 30, 2007
December 31, 2007
Change
Change
Median Result
$400
$381
($19)
(5.0%)
Average Result
342
341
(1)
(0.3%)
1 in 10 year annual gain
64
91
27
29.7%
1 in 25 year annual loss
(182)
(66)
116
(175.8%)
1 in 50 year annual loss
(334)
(172)
162
(94.2%)
1 in 100 year annual loss
(486)
(287)
199
(69.3%)
1 in 250 year annual loss
(707)
(396)
311
(78.5%)
1 in 500 year annual loss
(904)
(500)
404
(80.8%)
Changes in Endurance’s underwriting portfolio, investment portfolio, risk control mechanisms, market conditions and other factors may cause actual results
to vary considerably from those indicated by our value at risk curve. For a listing of risks related to Endurance and its future performance, please see
“Risk Factors” in our Annual Report on Form 10K for the year ended December 31, 2006.
9
Portfolio Changes – Property Catastrophe LOB
77,000,000
57,000,000
32,000,000
18,000,000
Florida
1,359,000,000
1,380,000,000
1,434,000,000
1,721,000,000
Total
US Property Catastrophe Portfolio*
158,000,000
36,000,000
104,000,000
173,000,000
642,000,000
906,000,000
2004
140,000,000
33,000,000
75,000,000
220,000,000
551,000,000
663,000,000
2005
42,000,000
54,000,000
National
46,000,000
44,000,000
Regional [ex Florida]
165,000,000
155,000,000
Total
Written Premiums
339,000,000
310,000,000
Florida
710,000,000
692,000,000
Regional [ex Florida]
310,000,000
378,000,000
National
Wind Exposed Limits
2007
2006
Risk
Measure
Portfolio shifted away from higher attaching complex
national account style risks towards lower attaching
smaller regional risks.
Reduced exposure to extreme
tail events, Increased
exposure to smaller events.
* Endurance is exposed to natural catastrophe perils in other portions of its business and the above
amounts do not represent Endurance’s full portfolio at risk to hurricane losses. Endurance’s actual results
may vary considerably from those indicated above. For a listing of risks related to Endurance and its
future performance, please see “Risk Factors” in our Annual Report on Form 10-K for the year ended
December 31, 2006.
10

Catastrophe Risk – 2004 and 2005 “Then and Now”
300,000,000
70,000,000
0
0
0
30,000,000
200,000,000
2007
Portfolio*
966,000,000
0
107,000,000
162,000,000
61,000,000
304,000,000
332,000,000
Actual
Losses
2005 Hurricanes
2004 Hurricanes
0
2,000,000
Energy
0
14,000,000
Fortune 1000 All Risk
75,000,000
0
Middle Market DIC
500,000,000
204,000,000
Total
Insurance
0
8,000,000
Marine
75,000,000
111,000,000
Property
350,000,000
69,000,000
Catastrophe
Reinsurance
2007
Portfolio*
Actual
Losses
Business
Unit
The result of the portfolio shift is to reduce the company’s exposure to extreme tail events while
increasing the company’s exposure to smaller personal lines events such as the 2004 hurricanes.
*These columns represent estimates of expected losses with our current portfolio were the 2004 and 2005
hurricane seasons to be experienced in 2007. There are numerous factors that could impact this estimate
and cause Endurance’s actual results to be significantly different from the results listed above. For a listing of
risks related to Endurance and its future performance, please see “Risk Factors” in our Annual Report on
Form 10-K for the year ended December 31, 2006.
11
Diversification Has Led to Stable Premium Growth
$798.8
$1,602.0
$1,711.4
$1,812.2
$1,948.6
$576.5
$0
$200
$400
$600
$800
$1,000
$1,200
$1,400
$1,600
$1,800
$2,000
2002
2003
2004
2005
2006
1Q07
Gross Written Premiums*
Net Earned Premiums*
(in millions)
$369.5
$1,173.9
$1,632.6
$1,818.9
$401.7
$1,803.4
$0
$500
$1,000
$1,500
$2,000
2002
2003
2004
2005
2006
1Q07
(in millions)
* Includes deposit premiums
12
Overall Underwriting Has Been Strong
90.3%
93.7%
94.1%
95.8%
162.4%
67.4%
63.9%
71.0%
84.3%
79.9%
74.4%
73.0%
0%
25%
50%
75%
100%
125%
150%
175%
Inception to Date Underwriting Ratio*
* Underwriting ratio is defined as losses and acquisition expenses
divided by earned premium, as of 3/31/07.
Inception to Date Underwriting
Ratio is 85.1%*
13
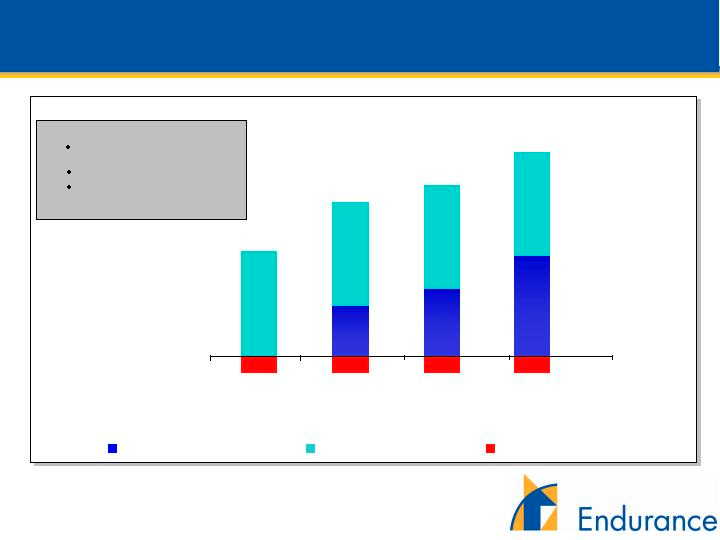
Strong Financial Performance
$102.1
$263.4
$355.6
($220.5)
$498.1
$101.8
86.7%
84.7%
85.8%
81.5%
123.5%
86.2%
-$300
-$200
-$100
$0
$100
$200
$300
$400
$500
$600
2002
2003
2004
2005
2006
1Q07
0.0%
20.0%
40.0%
60.0%
80.0%
100.0%
120.0%
140.0%
Net Income
Combined Ratio
Net Income and Combined Ratio
(in millions)
7.8%
17.3%
19.9%
-11.9%
25.7%
19.0%
-15%
-10%
-5%
0%
5%
10%
15%
20%
25%
30%
2002
2003
2004
2005
2006
1Q07
Annualized Operating
Return on Average Equity
Inception to 12/31/06 combined ratio of 94.4%
Inception to 12/31/06 ROE of 12%
14
Efficient Capital Management
$1,115
$1,300
$1,213
$1,309
$1,318
$1,306
$102
$345
$650
$364
$780
$861
$200
$200
$200
$192
$103
$391
$447
$447
$447
$0
$500
$1,000
$1,500
$2,000
$2,500
$3,000
2002
2003
2004
2005
2006
1Q07
Common Share Capital
Retained Earnings
Preferred Equity
Debt
Strong and Flexible
Capital Structure
$, Millions
$1,409
$1,748
$2,254
$2,320
$2,745
$100
$20
$92
$52
$10
$30
$21
$50
$62
$66
$17
$0
$20
$40
$60
$80
$100
$120
$140
$160
2002
2003
2004
2005
2006
1Q07
Repurchases
Dividends
$, Millions
$520 Million of
Capital Returned
to Shareholders
$100
$41
$142
$113
$76
$47
$2,814
15
Sensitivity of ROE
* The Return on Equity Sensitivity Analysis is purely illustrative and should not be construed
as guidance for future performance. Changes in Endurance’s underwriting portfolio, investment portfolio, risk
control mechanisms, market conditions and other factors may cause our actual results to vary considerably from
those indicated above. For a listing of risks related to Endurance, please see “Risk Factors” in our Annual Report
on Form 10-K for the year ended December 31, 2006.
Operating Assumptions
2.8:1.0 Investment Leverage at
4.75% yield
0.85:1.0 Operating Leverage
Interest expense and preferred
dividends of 2.2% of common
equity
ROE = 11.1%
ROE = 19.6%
ROE = 23.9%
ROE = 17.5%
ROE from Underwriting Activity
ROE from Investing Activity
Financing Costs
Return On Equity Sensitivity Analysis*
2.2%
2.2%
2.2%
2.2%
13.3%
6.4%
8.5%
12.8%
13.3%
13.3%
13.3%
100%
Combined
Ratio
92.5%
Combined
Ratio
90%
Combined
Ratio
85%
Combined
Ratio
16

Conclusion
Disciplined technical underwriting culture with focus on
underwriting margin and risk adjusted returns
Well positioned with strong management team, diversified
portfolio, and excellent financial strength
Committed to generate 15%+ ROE through cycles with
demonstrated ability to generate shareholder value
17