
Endurance Specialty Holdings Ltd.
Third Quarter 2007

Forward Looking Statements
Statements contained in this presentation that are not based on current or historical fact are forward-looking in nature. Such forward-looking statements are based on current plans, estimates and expectations and are made pursuant to the Private Securities Litigation Reform Act of 1995. Forward-looking statements are based on known and unknown risks, assumptions, uncertainties and other factors. The Company’s actual results, performance, or achievements may differ materially from
any future results, performance, or achievements expressed or implied by such forward-looking statements. The Company undertakes no obligation to publicly update or revise any forward-looking statement.
2
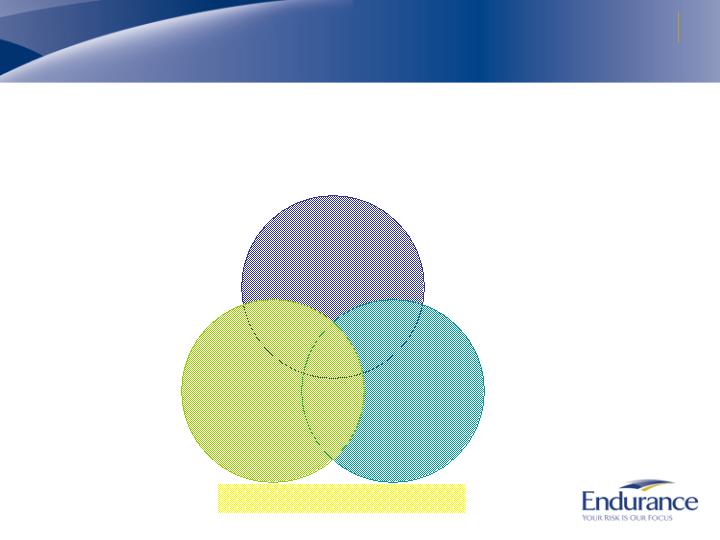
Philosophy & Strategy
Endurance was built in the aftermath of 9/11 to be an underwriter of volatile
specialty risks – key to our business are the following principles:
Focus on business segments that
reward our specialized knowledge
and relationships
Supported by
investments in enabling
technology and
disciplined, technical
underwriting approach
Portfolio managed with key risk
management concepts –
diversification, value at risk and
data quality
Portfolio
Management
Technology and
Discipline
Specialization
Capital Management
3
Seasoned Management Team
5
2
2
4
4
4
2
2
5
4
5
Years of
Endurance
Experience
25
Executive Vice President, Endurance Specialty Holdings Ltd.
Tom Bell
21
Chief Investment Officer
Mark Silverstein
18
General Counsel
John Del Col
22
President, Endurance Services Limited
John O’Connor
32
President and Chief Executive Officer, global insurance operations
Michael Fujii
26
President and Chief Executive Officer, global reinsurance operations
William Jewett
34
Chief Operating Officer
Daniel Izard
22
Chief Actuary and Chief Risk Officer
Michael Angelina
16
Chief Underwriting Officer
David Cash
13
Chief Financial Officer
Michael McGuire
28
Chairman, President & Chief Executive Officer
Kenneth LeStrange
Years of
Industry Experience
Position
Name
Executive Team has proven its ability to execute challenging strategies
Built a culture focused on risk and capital management
4
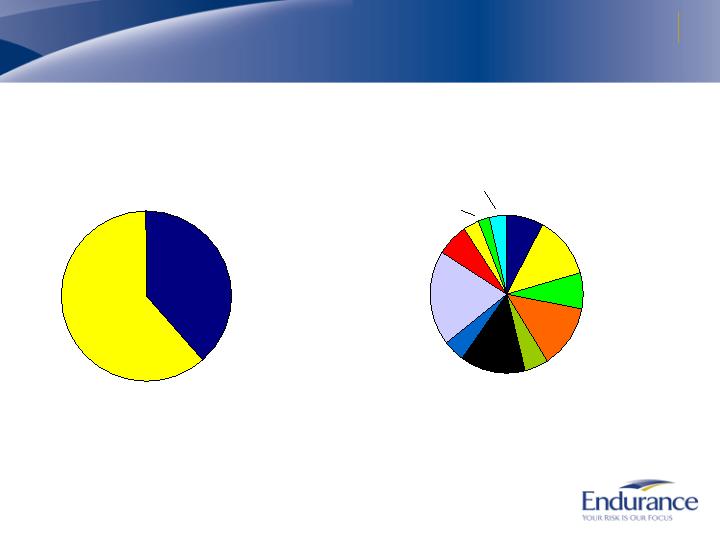
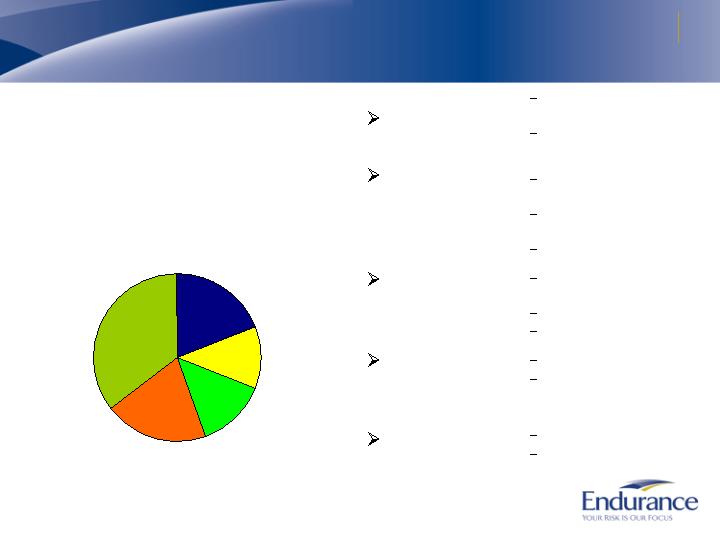
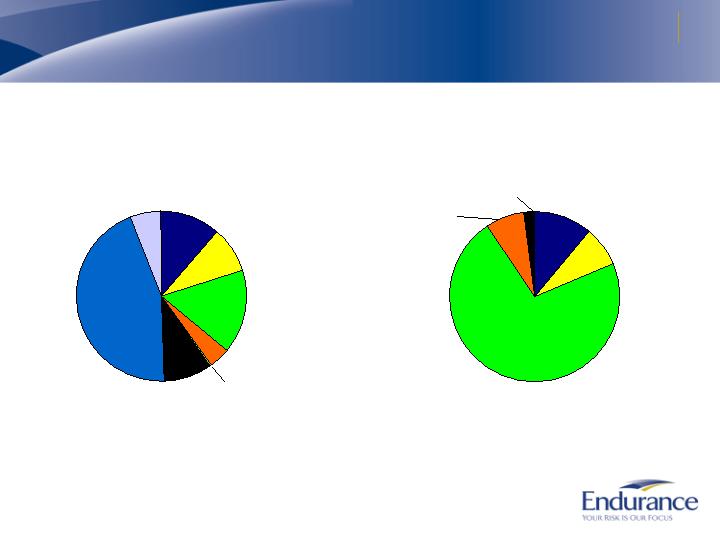
Maintain a Diversified Book of Business
Total Written Premiums of $1.83 Billion*
Insurance
39%
Reinsurance
61%
By Segment
* Includes deposit premiums, based on the twelve months ended September 30, 2007
By Line of Business
Property - Insurance
Property - Reinsurance
Casualty -
Reinsurance
Casualty - Insurance
Healthcare Liability
Workers’
Compensation
Professional Lines
Catastrophe
Agriculture
Marine
Aerospace
Surety and Other Specialty
5
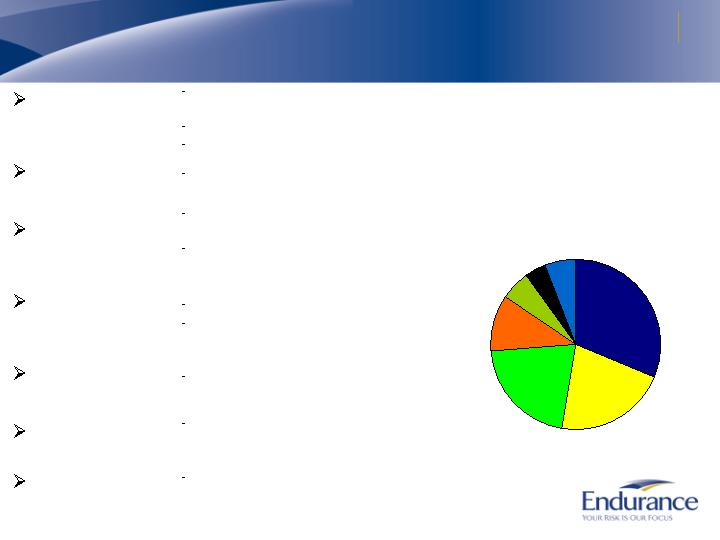
Reinsurance – Disciplined Approach to the Market
Reinsurance Total Written
Premiums of $1.1 billion*
By Line of Business
Catastrophe
Property
Casualty
Agriculture
Marine
Aerospace
Surety and
Other Specialty
Industry leading tools and
technology
Leader in Bermuda
Covers all perils
Highly specialized relationships
Auto liability, D&O, workers comp
and clash
Non-renewed large proportional
contracts in 1Q07
Multiple peril crop insurance
Industry leading tools and
technology
Covers brown and blue water hull
Provides aviation and space
coverages
Other unique opportunities
including growing surety business
* Includes deposit premiums, based on the twelve months ended September 30, 2007
Catastrophe
31.3%
Property
21.2%
Agriculture
10.9%
Casualty
21.1%
Marine
5.6%
Aerospace
4.0%
Surety and
other specialty
5.9%
6
Insurance - Our Fastest Growing Segment
Insurance Total Written
Premiums of $706 million*
By Line of Business
Casualty
Professional
Lines
Healthcare
Liability
Property
Workers’
Compensation
Large account excess
liability written in Bermuda
Small account casualty
written in US
Includes E&O and D&O
products
Financial institutions
specialists
Leader in Bermuda
Hospital professional
liability
Strong relationships
Leader in Bermuda market
Written out of US and UK
Growing US specialty
business
Opportunistic strategy
Converted from
reinsurance in 2006
Casualty
19.2%
Professional
Lines
11.9%
Healthcare
Liability
13.3%
Property
19.9%
Workers’
Compensation
35.7%
* Based on the twelve months ended September 30, 2007
7
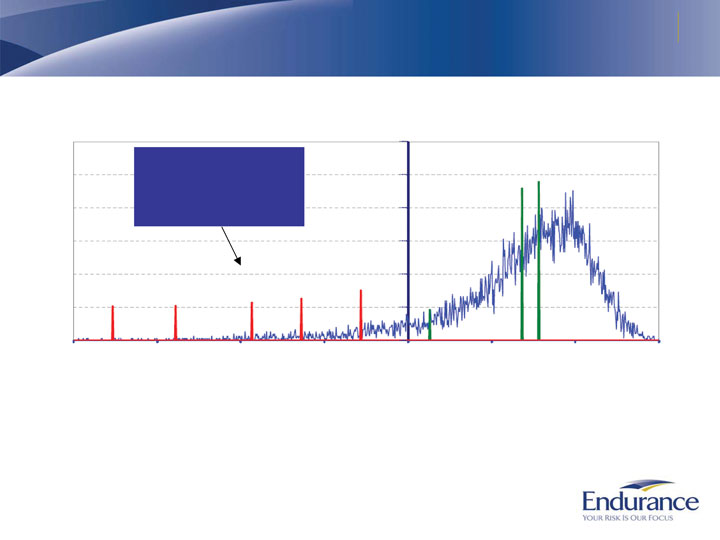
Strong Risk Management Focus -
Portfolio Expected Risk Curve (July 1, 2007)
Stated tolerance is to limit
our loss in a 1-in-100 year
to 25% of our capital or
less, our current level is
21.5% of capital
The above chart represents a cumulative analysis of our in-force underwriting portfolio on a full year basis based on thousands of potential
scenarios. Loss years are driven largely by the occurrence of natural catastrophes and incorrect pricing of other property and casualty exposures.
The operating income depicted includes net premiums earned plus net investment income, acquisition expenses and G&A expenses. Forecasted
investment income, acquisition and G&A expenses are held constant across all scenarios. Losses included above are net of reinsurance including
collateralized reinsurance and ILW purchases. Our stated objective is to maintain a risk management tolerance that limits our loss in a 1-in-100 year
year to be no more than 25% of our equity capital. We base our budget and forecasts on the average result, although the nature of the curve places
the median result further to the right.
Changes in Endurance's underwriting portfolio, investment portfolio, risk control mechanisms, market conditions and other factors may cause actual results
to vary considerably from those indicated by our value at risk curve. For a listing of risks related to Endurance and its future performance, please see
"Risk Factors" in our Annual Report on Form 10K for the year ended December 31, 2006.
Probability
1-in-500
Year
$884 Mil
Loss
1-in-250
Year
$694 Mil
Loss
1-in-100
Year
$468 Mil
Loss
1-in-50
Year
$319 Mil
Loss
1-in-25
Year
$141 Mil
Loss
1-in-10
Year
$64 Mil
Loss
Average
Result
$342 Mil
Gain
Median
Result
$391Mil
Gain
-1,000
-750
-500
-250
0
250
500
750
Operating Result - $ Millions
Endurance Operating Income Profile
as of July 1, 2007
8
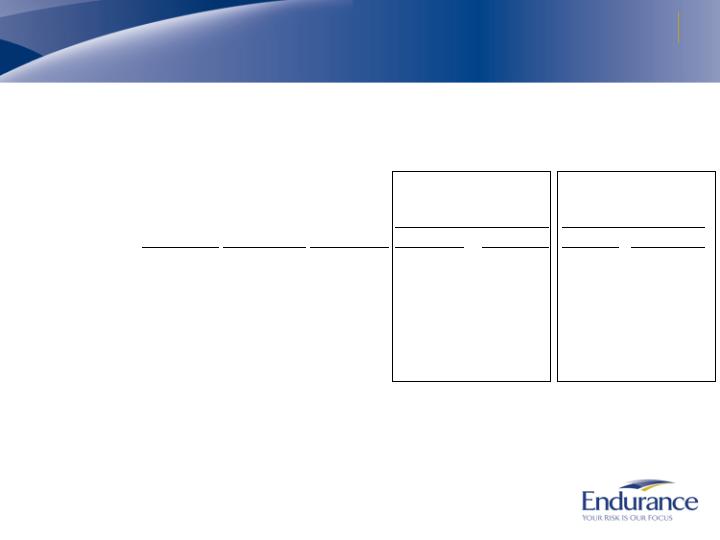
Changes in Portfolio Expected Risk Curve
Changes in Endurance's underwriting portfolio, investment portfolio, risk control mechanisms, market conditions and other factors may cause actual results
to vary considerably from those indicated by our value at risk curve. For a listing of risks related to Endurance and its future performance, please see
"Risk Factors" in our Annual Report on Form 10K for the year ended December 31, 2006.
Change from
Change from
July 1, 2006 - June 30, 2007 to
Jan. 1, 2007 - Dec. 31, 2007
July 1, 2007 - June 30, 2008
July 1, 2007 - June 30, 2008
July 1, 2006 -
Jan. 1, 2007 -
July 1, 2007 -
$
%
$
%
(in millions)
June 30, 2007
Dec. 31, 2007
June 30, 2008
Change
Change
Change
Change
Median Result
$400
$381
$391
($9)
(2.3%)
$10
2.6%
Average Result
342
341
342
0
0.0%
1
0.3%
1 in 10 year annual gain
64
91
64
0
0.0%
(27)
(42.2%)
1 in 25 year annual loss
(182)
(66)
(141)
41
(29.1%)
(75)
53.2%
1 in 50 year annual loss
(334)
(172)
(319)
15
(4.7%)
(147)
46.1%
1 in 100 year annual loss
(486)
(287)
(468)
18
(3.8%)
(181)
38.7%
1 in 250 year annual loss
(707)
(396)
(694)
13
(1.9%)
(298)
42.9%
1 in 500 year annual loss
(904)
(500)
(884)
20
(2.3%)
(384)
43.4%
9

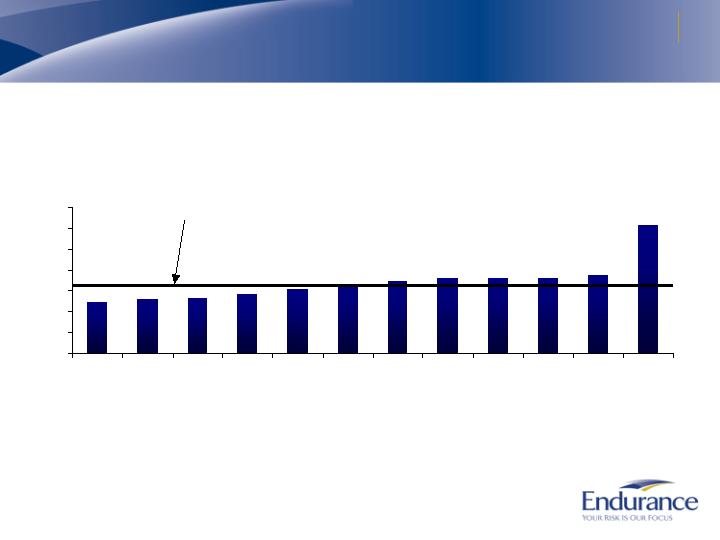
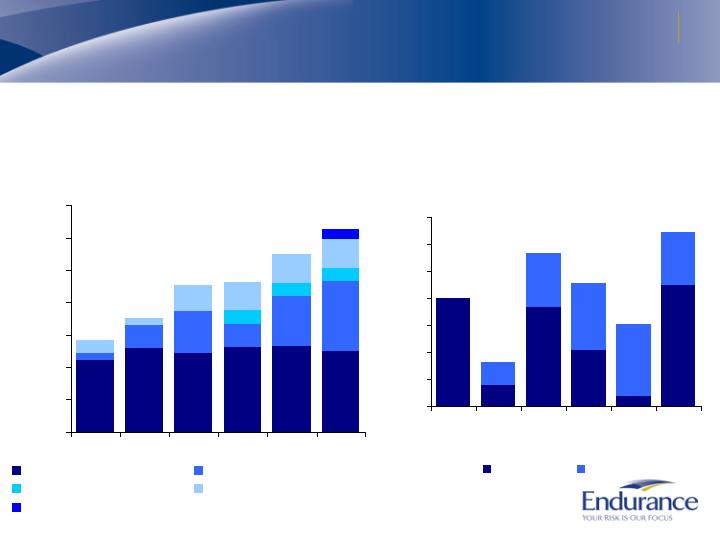
Diversification Has Led to Stable Premium Growth
$798.8
$1,602.0
$1,711.4
$1,812.2
$1,948.6
$1,527.1
$0
$200
$400
$600
$800
$1,000
$1,200
$1,400
$1,600
$1,800
$2,000
2002
2003
2004
2005
2006
3Q07
YTD
Gross Written Premiums*
Net Earned Premiums*
(in millions)
$369.5
$1,173.9
$1,632.6
$1,818.9
$1,256.5
$1,803.4
$0
$500
$1,000
$1,500
$2,000
2002
2003
2004
2005
2006
3Q07
YTD
(in millions)
* Includes deposit premiums
10
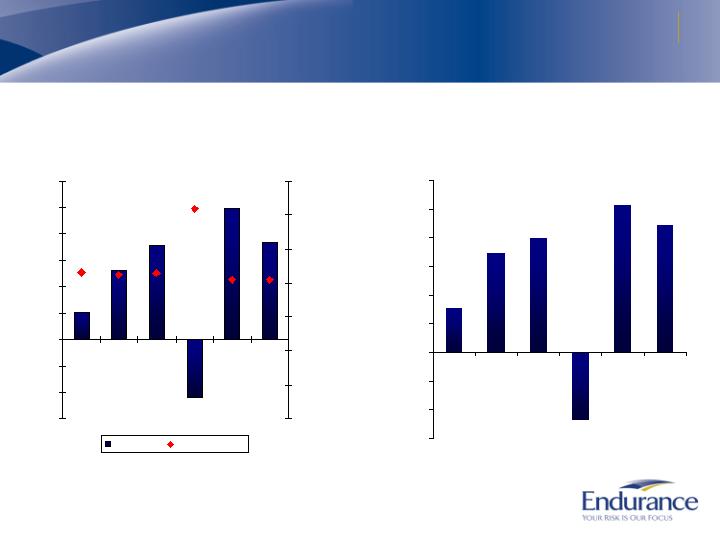
Overall Underwriting Has Been Strong
90.1%
90.3%
90.6%
93.6%
153.7%
65.5%
60.7%
66.5%
86.3%
81.7%
77.6%
70.6%
0%
25%
50%
75%
100%
125%
150%
175%
Inception to Date Underwriting Ratio*
* Underwriting ratio is defined as losses and acquisition expenses divided by earned
premium, as of 9/30/07 and is before deposit accounting adjustments.
Inception to Date Underwriting
Ratio is 83.3%*
Catastrophe
Healthcare
Liability
Aerospace
Professional
Lines
Casualty -
Insurance
Surety &
Other
Specialty
Agriculture
Casualty -
Reinsurance
Property -
Insurance
Workers'
Compensation
Property -
Reinsurance
Marine
11
Strong Financial Performance
$102.1
$263.4
$355.6
($220.5)
$498.1
$368.6
81.6%
84.7%
85.8%
81.5%
123.5%
86.2%
-$300
-$200
-$100
$0
$100
$200
$300
$400
$500
$600
2002
2003
2004
2005
2006
3Q07
YTD
0.0%
20.0%
40.0%
60.0%
80.0%
100.0%
120.0%
140.0%
Net Income
Combined Ratio
Net Income and Combined Ratio
(in millions)
7.8%
17.3%
19.9%
-11.9%
25.7%
22.2%
-15%
-10%
-5%
0%
5%
10%
15%
20%
25%
30%
2002
2003
2004
2005
2006
3Q07
YTD
Annualized Operating
Return on Average Equity
Inception to 9/30/07 combined ratio of 92.9%
Inception to 9/30/07 ROE of 14.6%
12
High Quality Investment Portfolio
Total Investment Portfolio of $5.8 Billion*
Cash and
Other
11.3%
Mortgage-backed
44.6%
By Investment Type
* As of September 30, 2007
Fixed Maturity Ratings
$5.1 Billion*
U.S. Government
and agencies
9.1%
Corporate
15.8%
Foreign Government
3.7%
Asset-backed
9.3%
Alternatives
5.9%
U.S. Government
and agencies
11.0%
AAA/Aaa and
agency RMBS
72.2%
BBB or Below
2.0%
AA/Aa
7.3%
A/A
7.5%
Municipals
0.3%
13
Efficient Capital Management
$1,115
$1,300
$1,213
$1,309
$1,318
$1,239
$102
$345
$650
$364
$780
$1,087
$200
$200
$200
$192
$103
$391
$447
$447
$447
$150
$0
$500
$1,000
$1,500
$2,000
$2,500
$3,000
$3,500
2002
2003
2004
2005
2006
3Q07
Common Share Capital
Retained Earnings
Preferred Equity
Debt
Contingent Equity
Strong and Flexible
Capital Structure
$, Millions
$1,409
$1,748
$2,254
$2,320
$2,745
$100
$20
$92
$52
$10
$112
$21
$50
$62
$66
$49
$0
$25
$50
$75
$100
$125
$150
$175
2002
2003
2004
2005
2006
3Q07
YTD
Repurchases
Dividends
$, Millions
$633 Million of
Capital Returned
to Shareholders
$100
$41
$142
$113
$76
$161
$3,123
14
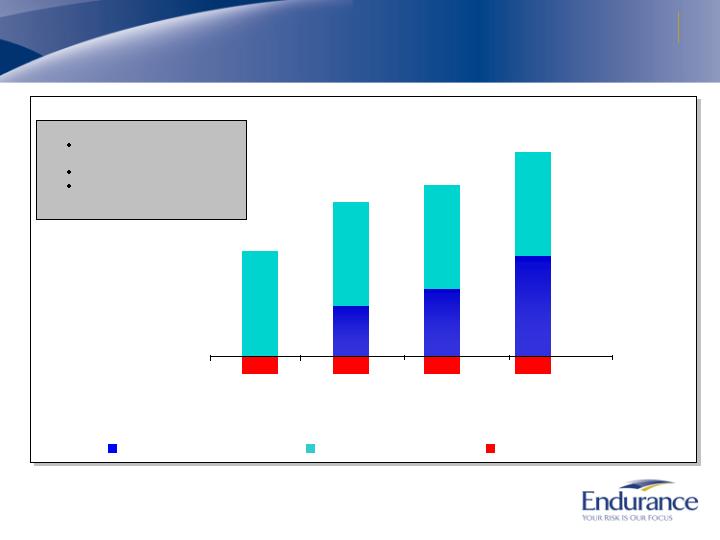
Sensitivity of ROE
* The Return on Equity Sensitivity Analysis is purely illustrative and should not be construed
as guidance for future performance. Changes in Endurance’s underwriting portfolio, investment portfolio, risk
control mechanisms, market conditions and other factors may cause our actual results to vary considerably from
those indicated above. For a listing of risks related to Endurance, please see “Risk Factors” in our Annual Report
on Form 10-K for the year ended December 31, 2006.
Operating Assumptions
2.6:1.0 Investment Leverage at
4.75% yield
0.75:1.0 Operating Leverage
Interest expense and preferred
dividends of 2.2% of common
equity
ROE = 10.2%
ROE = 17.7%
ROE = 21.5%
ROE = 15.8%
ROE from Underwriting Activity
ROE from Investing Activity
Financing Costs
Return On Equity Sensitivity Analysis*
2.2%
2.2%
2.2%
2.2%
12.4%
5.6%
7.5%
11.3%
12.4%
12.4%
12.4%
100%
Combined
Ratio
92.5%
Combined
Ratio
90%
Combined
Ratio
85%
Combined
Ratio
15
Conclusion
Disciplined technical underwriting culture with focus on
underwriting margin and risk adjusted returns
Well positioned with strong management team, diversified portfolio, and excellent financial strength
Create shareholder value through active capital
management coupled with strong returns to generate 15%+ ROE through underwriting cycles
16