
Forward Looking Statements
Statements contained in this presentation that are not based on
current or historical fact are forward-looking in nature. Such forward-
looking statements are based on current plans, estimates and
expectations and are made pursuant to the Private Securities
Litigation Reform Act of 1995. Forward-looking statements are based
on known and unknown risks, assumptions, uncertainties and other
factors. The Company’s actual results, performance, or achievements
may differ materially from any future results, performance, or
achievements expressed or implied by such forward-looking
statements. The Company undertakes no obligation to publicly update
or revise any forward-looking statement.
2

Overview
3

Return driven focus
Underwriting margin
Capital management
Specialized segment underwriting supported by centralized, leading
edge technical resources
Diversification
Micro-cycle management
Data, analysis driven
Execution excellence
Endurance Strategy
4

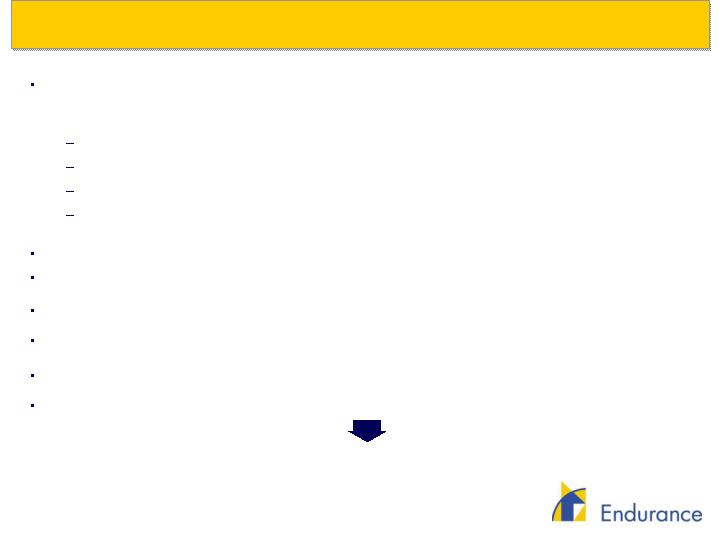
Established one of the leading insurance/reinsurance markets in the
industry
Global reinsurance
Bermuda based insurance products
Property insurance U.K./Europe
U.S. based specialty insurance
Management team with strong execution skills
Manages the key drivers of financial performance
Organic development of specialty lines of business
Strong capital management experience
Completed three value enhancing acquisitions without legacy risk
Delivering sustainable, industry leading returns on equity and increases
in shareholder value
Generated a return on equity of 17% in 2003 and 20% in 2004
Goal is to generate 15%+ growth in book value throughout the P&C
cycle
What We Have Achieved
5
What We Have Achieved (cont’d)
Proven track record of significant
shareholder value creation
6
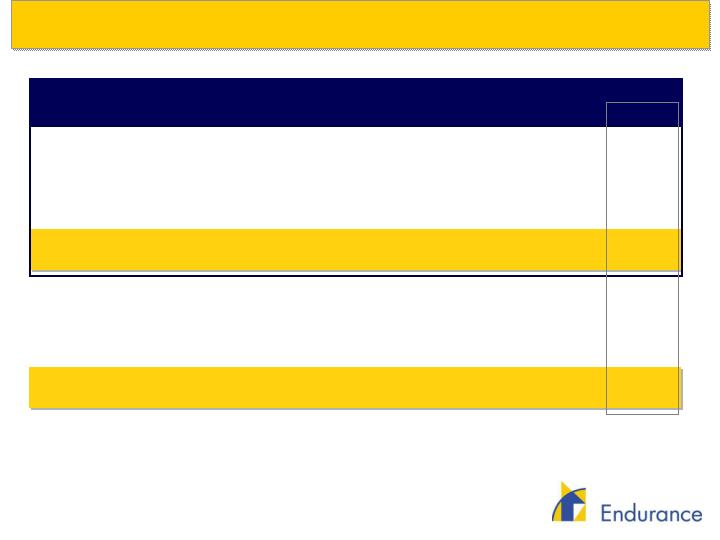
Exceeded all financial objectives in 2003 and 2004
FY 2003
FY 2004
Gross premiums
$1.6 billion
$1.7 billion
Assets
$3.5 billion
$5.2 billion
Shareholders’ equity
$1.6 billion
$1.9 billion
Net income
$263 million
$356 million
Developed strong, technical, underwriting based culture
Built strong systems, controls, and infrastructure
Successfully executed three acquisitions
Implemented value-enhancing capital management initiatives
One of handful of companies to be upgraded by A.M. Best in 2003
“Positive Outlook” by Standard & Poor’s

Our Value Creation Levers
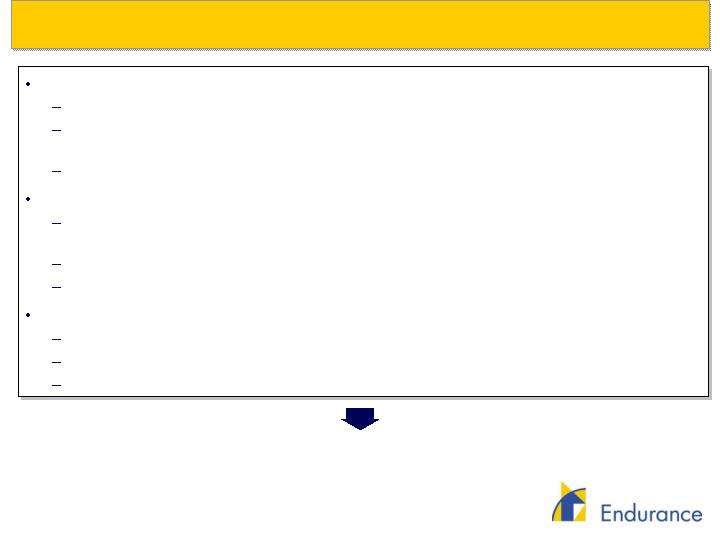
Specialist underwriting driven culture built around deep infrastructure,
intellectual capital and technical skills
Strong execution
Portfolio approach achieves capital efficiency and lower volatility of
results
Scaleable systems
Proactively allocate capital by line of business to maximize return
through changing market conditions
Focus on profit, not revenue
7

Underwriting & Strategy
8
Strategy
Identify business segments with sufficient opportunities to apply expertise
Only underwrite risks that are susceptible to underwriting and actuarial
analysis
Reallocate capital as different businesses become relatively less attractive
Culture
Understand the risk correlations within each segment and across portfolio
to determine required margins
Identify risks within each segment that meet return thresholds
Apply technical resources at the front end to evaluate and select business
Control
Focus on target returns, not premiums
Monitor underwriting decisions on a live basis
Monitor emergence of results to corroborate assumptions
Underwriting Philosophy
Philosophy that is disciplined, consistent
and embraced by underwriting teams
9

Severity Driven Risks
Property-Cat & Per Risk Treaty
Severity Driven Casualty Treaty
Excess Casualty
Professional Liability / E&O
Healthcare
Aviation
North American Direct Property
Underwriters: 34
Actuaries and Cat modelers: 17
Total Staff: 122
Non-U.S. Risks
International Property Treaty
International Casualty Treaty
European Direct Property
Marine and Energy
Underwriters: 27
Actuaries and Cat modelers: 5
Total Staff: 55
Frequency Driven Risks
Property Reinsurance
Casualty Reinsurance
Eight specialty reinsurance
segments
Underwriters: 41
Actuaries and Cat modelers: 12
Total Staff: 123
Endurance Specialty
Insurance Ltd.
(Bermuda)
Endurance Reinsurance
Corporation of America
(U.S.)
Endurance Worldwide
Insurance Limited
(U.K.)
Lines of Business: 2004 GPW = $1,711M
Risk Exposure: 2004 GPW = $1,711M
The Platforms and Business Lines
10
Underwriting – Summary Results
($ in thousands)
2004 Underwriting Results
Gross Written Premiums
Net Earned Premiums
Unearned Prem. Reserves
GAAP Combined Ratio
Stat. Combined Ratio
Property
Per Risk
Treaty
$441,370
$253,881
$464,024
95.1
%
95.5
%
Property
Catastrophe
$247,009
$55,947
$234,961
47.7
%
48.4
%
Property
Individual
Risk
$112,900
$58,096
$102,780
68.1
%
67.2
%
Casualty
Treaty
$441,256
$282,948
$378,894
102.5
%
101.4
%
Casualty
Individual
Risk
$246,802
$114,452
$235,621
82.1
%
80.3
%
Aerospace
and Other
Specialty
$222,020
$132,281
$216,320
90.3
%
90.2
%
Total
$1,711,357
$897,605
$1,632,600
85.8
%
85.4
%
2003 Underwriting Results
Gross Written Premiums
Net Earned Premiums
GAAP Combined Ratio
Stat. Combined Ratio
$296,551
$469,290
93.9
%
91.2
%
$174,158
$183,594
38.5
%
37.7
%
$65,408
$85,863
58.6
%
56.7
%
$284,843
$390,265
97.5
%
95.7
%
$173,266
$214,392
89.1
%
87.8
%
$179,721
$258,593
99.5
%
98.2
%
$1,173,947
$1,601,997
84.7
%
83.5
%
11

Price Monitoring
12
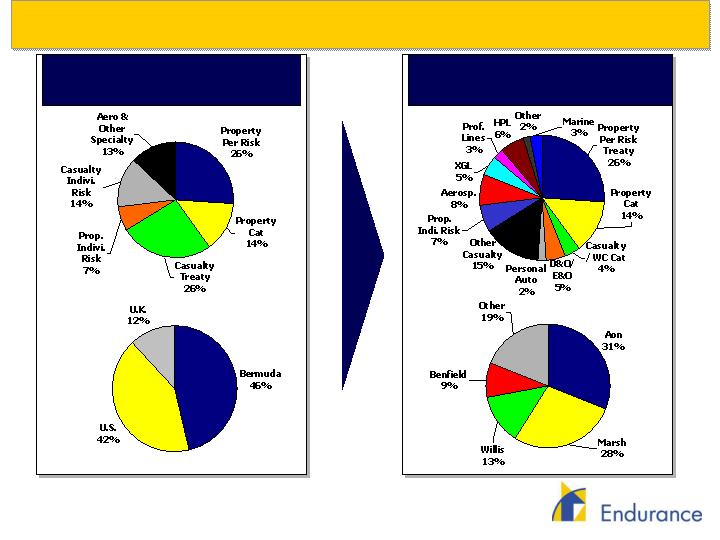
SEC Segment & Subs. Distribution
2004 Premiums = $1,711 mm
Risk Exposures
Major Lines & Distribution
2004 Premiums = $1,711 mm
13

Risk Review – Portfolio Expected Risk Curve
In-Force Portfolio as of December 31, 2004
Endurance – Underwriting Income Profile
Underwriting Income - Amounts in Millions of USD
Expected
Result
U/W Ratio
80.1%
$353 M
Profit
U/W
Ratio
93.7%
1-in-10
Year
$119 M
Profit
U/W
Ratio
104.2%
1-in-25
Year
$63 M
Loss
U/W
Ratio
112.0%
1-in-50
Year
$201 M
Loss
U/W
Ratio
120.0%
1-in-100
Year
$342 M
Loss
U/W
Ratio
131.1%
1-in-250
Year
$542 M
Loss
U/W
Ratio
141.1%
1-in-500
Year
$722 M
Loss
14

Financial Review
15

($ in thousands)
Year Ended
Year Ended
Year Ended
December 31, 2002
December 31, 2003
December 31, 2004
Income Statement
Balance Sheet
Summary Financial Performance
16
Total Investments and Cash
$1,663,249
$2,674,232
$3,940,353
Reserve for Losses & Loss Exp.
200,840
833,158
1,549,661
Reserve for Unearned Prem.
403,305
824,685
897,605
Total Shareholders’ Equity
1,217,500
1,644,815
1,862,455
Debt / Total Capitalization
13.6%
5.9%
17.4%
Gross Written Premiums
$798,760
$1,601,997
$1,711,357
Net Earned Premiums
369,489
1,173,947
1,632,600
Operating income
93,024
247,938
348,443
Combined Ratio
86.2%
84.7%
85.8%
Operating ROAE
7.8%
17.3%
19.9%
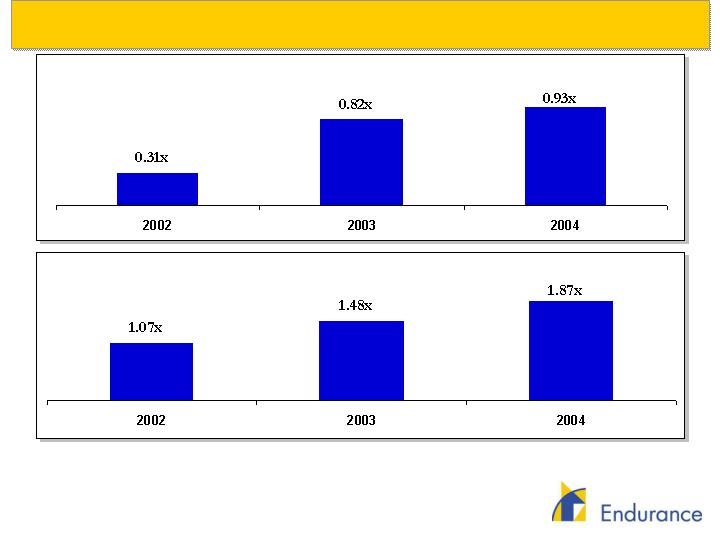
Optimizing Operating Leverage
Operating Leverage (a)
Investment Leverage (b)
(a)
Operating leverage is calculated by dividing net premiums earned by average equity.
(b)
Investment leverage is calculated by dividing average invested assets by average equity.
17
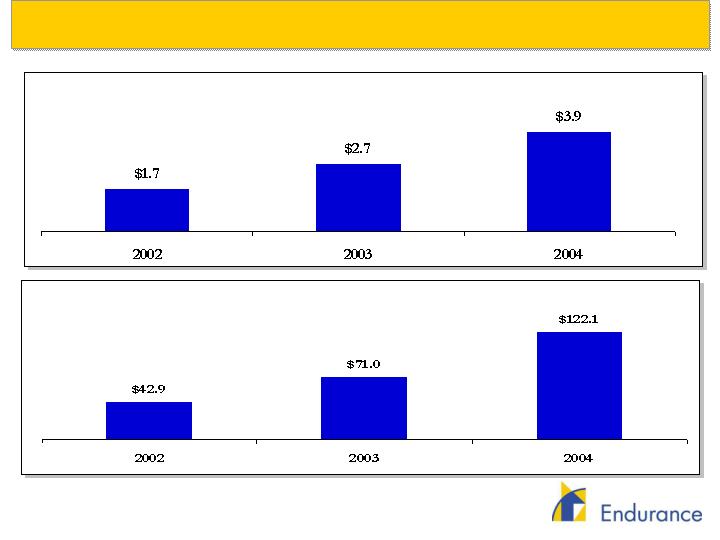
Investment Income Growth
Cash and Invested Assets ($, billions)
Investment Income ($, millions)
18
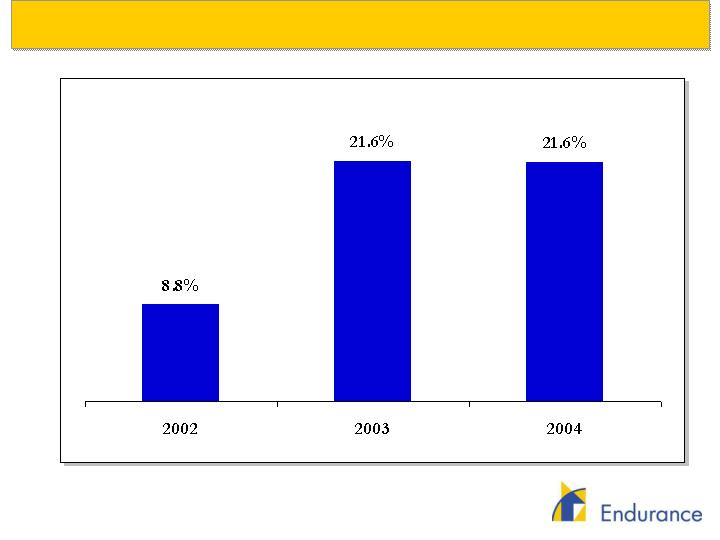
Return on Beginning Equity
19

1.9:1.0 Investment Leverage
at 3.80% yield
Achieving Our Targets
Mid to High Teens Returns
0.9:1.0 Operating Leverage
Operating Assumptions
Unlevered Return On Capital
ROE Component Build-Up
16% +
9.0%
7.2%
90.0% Combined Ratio
20

Capital Management Strategy
Increasing capital utilization
Strong organic growth
5 renewal rights/team transactions
Understanding capital utilization
Catastrophe exposure
Actuarial
Rating agency
Reducing Cost of Capital
$850 million multi-year debt facility
$250 million 30-year debt transaction
Significant increase in float (secondary, Aon block trade)
Returning excess capital
$212 million in stock repurchased
3.2 million share repurchase authorization
$71 million in dividends paid as of 12/31/2004
21

The best measure of shareholder value creation is growth in book
value per share
The price book multiple cannot be controlled
P/B versus ROE regression is biased towards stock buybacks
Stock buybacks above book value depress book value per share
growth due to premium offset by reducing shares outstanding
Investors have no more than a two to three year time horizon
Breakeven point for P/B multiple for a buyback is two to three times
expected ROE
Above that point, better to pay a special dividend
Analysis favors dividends when stock trades above 1.3x to 1.4x book
Dividends Versus Stock Buyback Philosophy
22

Conclusion
23

Conclusion
Exceeded all strategic and financial objectives
Built strong, technical, underwriting based culture that is focused on
profit, not revenue
Created robust controls, systems, and infrastructure
Value enhancement through capital management and enhancing
acquisitions
Goal is to generate 15%+ growth in book value throughout the cycle
Demonstrated ability to create significant shareholder value with
significant future upside
24