
Endurance Specialty Holdings Ltd.
Goldman Sachs Small Cap Growth Conference
Kenneth J. LeStrange
Chief Executive Officer
March 10, 2005

Forward Looking Statements
Statements contained in this presentation that are not based on
current or historical fact are forward-looking in nature. Such forward-
looking statements are based on current plans, estimates and
expectations and are made pursuant to the Private Securities
Litigation Reform Act of 1995. Forward-looking statements are based
on known and unknown risks, assumptions, uncertainties and other
factors. The Company’s actual results, performance, or achievements
may differ materially from any future results, performance, or
achievements expressed or implied by such forward-looking
statements. The Company undertakes no obligation to publicly update
or revise any forward-looking statement.
2
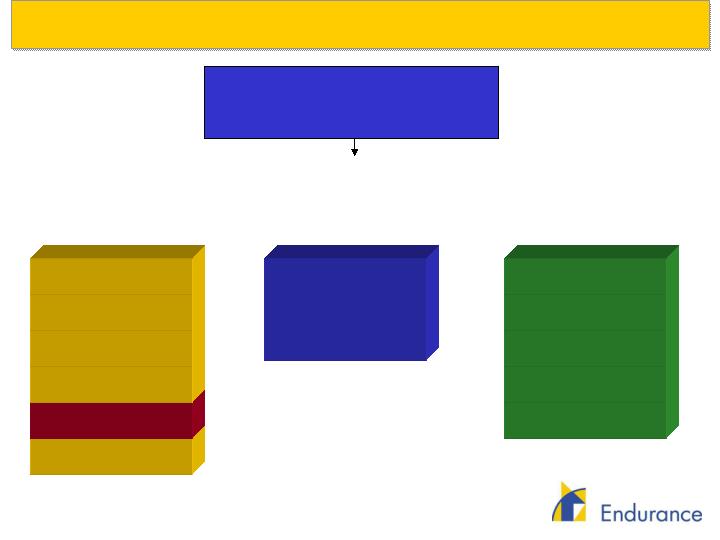
Return driven focus
Underwriting margin
Capital management
Specialized segment underwriting supported by centralized, leading
edge technical resources
Diversification
Micro-cycle management
Data, analysis driven
Execution excellence
Endurance Strategy
3
Established one of the leading insurance/reinsurance markets in the
industry
Global reinsurance
Bermuda based insurance products
Property insurance U.K./Europe
U.S. based specialty insurance
Management team with strong execution skills
Manages the key drivers of financial performance
Organic development of specialty lines of business
Strong capital management experience
Completed three value enhancing acquisitions without legacy risk
Delivering sustainable, industry leading returns on equity and increases
in shareholder value
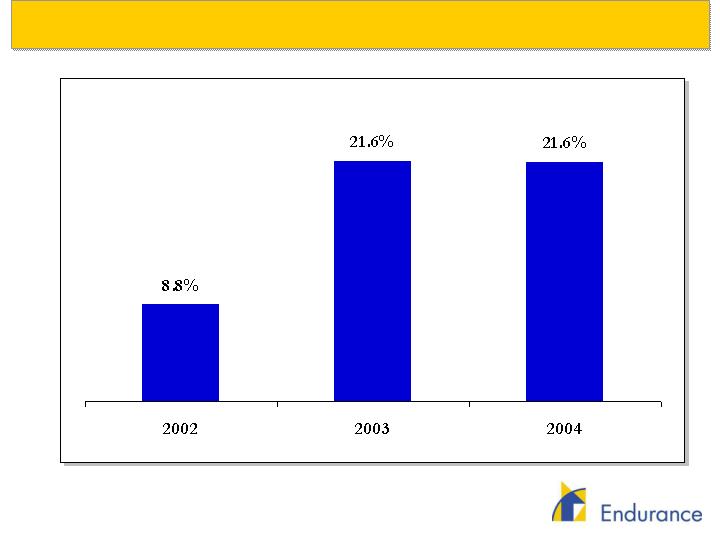
Generated a return on equity of 17% in 2003 and 20% in 2004
Goal is to generate 15%+ growth in book value throughout the P&C
cycle
What We Have Achieved
4
What We Have Achieved (cont’d)
Proven track record of significant
shareholder value creation
5
Exceeded all financial objectives in 2003 and 2004
FY 2003
FY 2004
Gross premiums
$1.6 billion
$1.7 billion
Assets
$3.5 billion
$5.2 billion
Shareholders’ equity
$1.6 billion
$1.9 billion
Net income
$263 million
$356 million
Developed strong, technical, underwriting based culture
Built strong systems, controls, and infrastructure
Successfully executed three acquisitions
Implemented value-enhancing capital management initiatives
One of handful of companies to be upgraded by A.M. Best in 2003
“Positive Outlook” by Standard & Poor’s

Endurance Specialty Insurance, Ltd. – 2002 (Bermuda)
LASALLE RE
PORTFOLIO ACQUISITION
PROPERTY CATASTROPHE REINSURANCE
CASUALTY REINSURANCE
AVIATION REINSURANCE
HEALTHCARE INSURANCE
PROFESSIONAL LINES INSURANCE
EXCESS CASUALTY INSURANCE
PROPERTY INSURANCE
6
2003
- IPO 2/28/03
ESIL
Endurance Reinsurance
Corporation of America
(New York)
Endurance Specialty
Insurance Ltd.
(Bermuda)
Endurance Worldwide
Insurance Ltd.
(London)
PROPERTY TREATY REINSURANCE
PROPERTY INSURANCE
HARTFORD RE
PORTFOLIO ACQUISITION
PROPERTY REINSURANCE
CASUALTY REINSURANCE
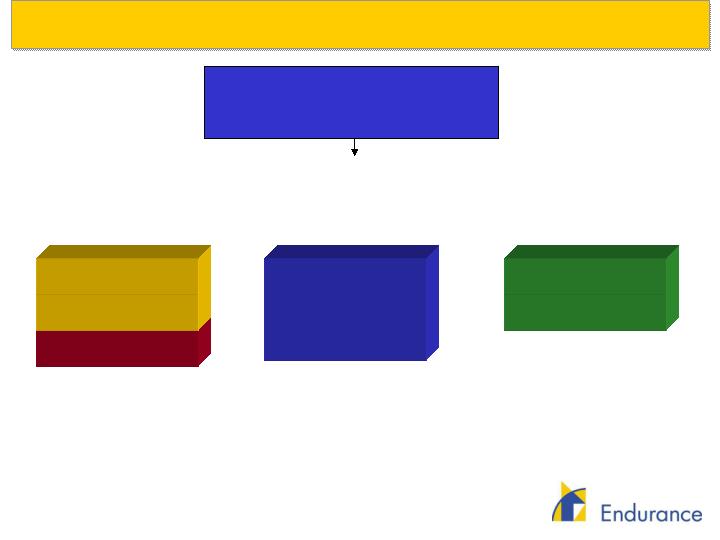
ENDURANCE SPECIALTY HOLDINGS LTD.
7
2004
- IPO 2/28/03
Endurance Reinsurance
Corporation of America
(New York)
Endurance Specialty
Insurance Ltd.
(Bermuda)
Endurance Worldwide
Insurance Ltd.
(London)
PERSONAL ACCIDENT REINSURANCE
CASUALTY REINSURANCE
AGRICULTRUAL REINSURANCE
XL SURETY REINSURANCE
ACQUISITION
MARINE REINSURANCE
PERSONAL ACCIDENT REINSURANCE
PROPERTY REINSURANCE
CASUALTY REINSURANCE
MARINE REINSURANCE
PROPERTY TREATY REINSURANCE
PROPERTY INSURANCE
ENDURANCE SPECIALTY HOLDINGS LTD.
ESIL
8

2005
ENDURANCE SPECIALTY HOLDINGS LTD.
- IPO 2/28/03
Endurance Reinsurance
Corporation of America
(New York)
Endurance Specialty
Insurance Ltd.
(Bermuda)
Endurance Worldwide
Insurance Ltd.
(London)
ERCA
ESIL
EWIL
SPECIALTY INSURANCE
Endurance Specialty
Insurance US
(California)
CASUALTY INSURANCE
PROPERTY INSURANCE
9
Our Value Creation Levers
Specialist underwriting driven culture built around deep infrastructure,
intellectual capital and technical skills
Strong execution
Portfolio approach achieves capital efficiency and lower volatility of
results
Scaleable systems
Proactively allocate capital by line of business to maximize return
through changing market conditions
Focus on profit, not revenue
10
Strategy
Identify business segments with sufficient opportunities to apply expertise
Only underwrite risks that are susceptible to underwriting and actuarial
analysis
Reallocate capital as different businesses become relatively less attractive
Culture
Understand the risk correlations within each segment and across portfolio
to determine required margins
Identify risks within each segment that meet return thresholds
Apply technical resources at the front end to evaluate and select business
Control
Focus on target returns, not premiums
Monitor underwriting decisions on a live basis
Monitor emergence of results to corroborate assumptions
Underwriting Philosophy
Philosophy that is disciplined, consistent
and embraced by underwriting teams
11

Risk Review – Portfolio Expected Risk Curve
In-Force Portfolio as of December 31, 2004
Endurance – Underwriting Income Profile
Underwriting Income - Amounts in Millions of USD
Expected
Result
U/W Ratio
80.1%
$353 M
Profit
U/W
Ratio
93.7%
1-in-10
Year
$119 M
Profit
U/W
Ratio
104.2%
1-in-25
Year
$63 M
Loss
U/W
Ratio
112.0%
1-in-50
Year
$201 M
Loss
U/W
Ratio
120.0%
1-in-100
Year
$342 M
Loss
U/W
Ratio
131.1%
1-in-250
Year
$542 M
Loss
U/W
Ratio
141.1%
1-in-500
Year
$722 M
Loss
12
($ in thousands)
Year Ended Year Ended Year Ended
December 31, 2002 December 31, 2003 December 31, 2004
Income Statement
Balance Sheet
Summary Financial Performance
13
Total Investments and Cash
$1,663,249
$2,674,232
$3,940,353
Reserve for Losses & Loss Exp.
200,840
833,158
1,549,661
Reserve for Unearned Prem.
403,305
824,685
897,605
Total Shareholders’ Equity
1,217,500
1,644,815
1,862,455
Debt / Total Capitalization
13.6%
5.9%
17.4%
Gross Written Premiums
$798,760
$1,601,997
$1,711,357
Net Earned Premiums
369,489
1,173,947
1,632,600
Operating income
93,024
247,938
348,443
Combined Ratio
86.2%
84.7%
85.8%
Operating ROAE
7.8%
17.3%
19.9%
Return on Beginning Equity
14

Conclusion
Exceeded all strategic and financial objectives
Built strong, technical, underwriting based culture that is focused on
profit, not revenue
Created robust controls, systems, and infrastructure
Value enhancement through capital management and enhancing
acquisitions
Goal is to generate 15%+ growth in book value throughout the cycle
Demonstrated ability to create significant shareholder value with
significant future upside
15