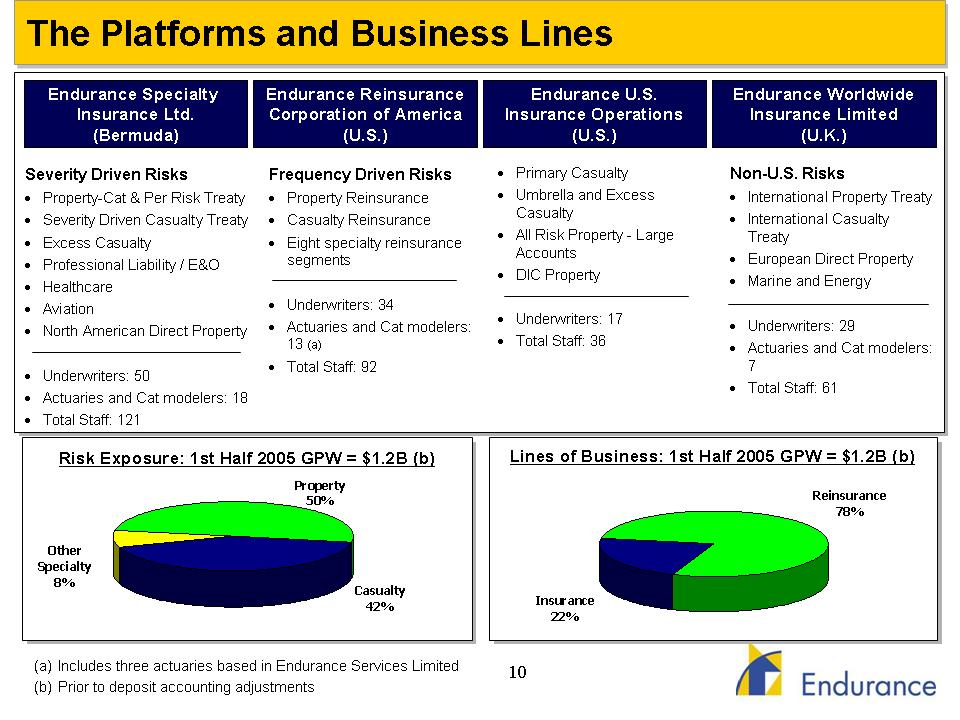
The Platforms and Business Lines Underwriting Endurance Specialty Insurance Ltd. (Bermuda) Endurance Reinsurance Corporation of America (U.S.) Endurance U.S. Insurance Operations (U.S.) Endurance Worldwide Insurance Limited (U.K.) Severity Driven Risks o Property-Cat & Per Risk Treaty o Severity Driven Casualty Treaty o Excess Casualty o Professional Liability / E&O o Healthcare o Aviation o North American Direct Property o Underwriters: 50 o Actuaries and Cat modelers: 18 o Total Staff: 121 Frequency Driven Risks o Property Reinsurance o Casualty Reinsurance o Eight specialty reinsurance segments o Underwriters: 34 o Actuaries and Cat modelers: 13 (a) o Total Staff: 92 o Primary Casualty o Umbrella and Excess Casualty o All Risk Property - Large Accounts o DIC Property o Underwriters: 17 o Total Staff: 36 Non-U.S. Risks o International Property Treaty o International Casualty Treaty o European Direct Property o Marine and Energy o Underwriters: 29 o Actuaries and Cat modelers: 7 o Total Staff: 61 Risk Exposure: 1st Half 2005 GPW = $1.2B (b) Lines of Business: 1st Half 2005 GPW = $1.2B (b) Property Reinsurance 50% 78% Other Specialty 8% Casualty Insurance 42% 22% (a) Includes three actuaries based in Endurance Services Limited (b) Prior to deposit accounting adjustments 10
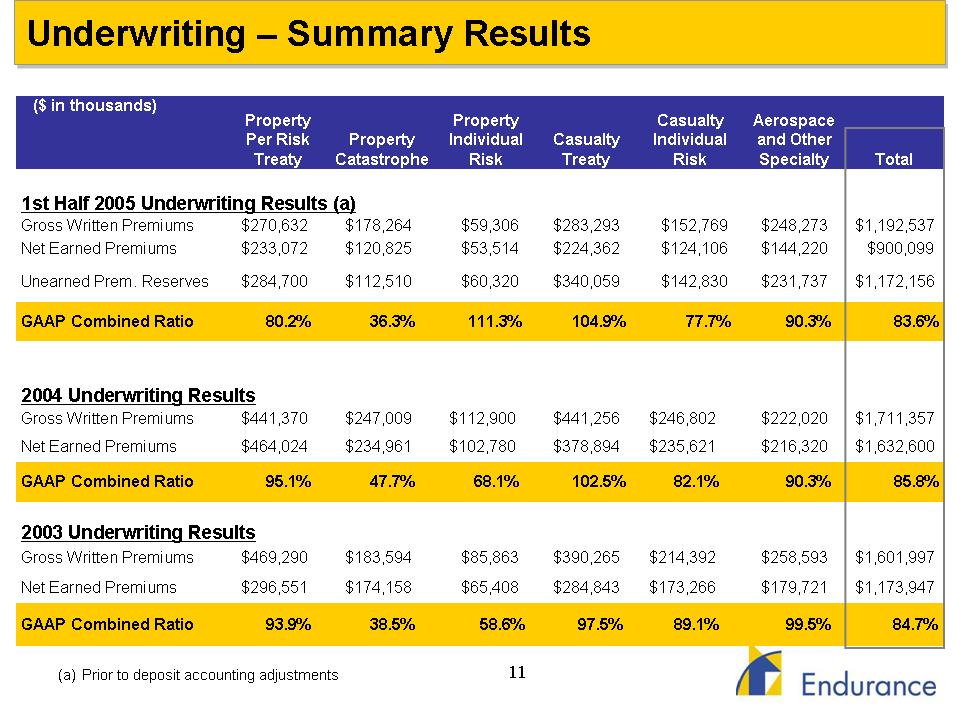
Underwriting - Summary Results ($ in thousands) Property Per Risk Treaty Property Catastrophe Property Individual Risk Casualty Treaty Casualty Individual Risk Aerospace and Other Specialty Total 1st Half 2005 Underwriting Results (a) Gross Written Premiums $270,632 $178,264 $59,306 $283,293 $152,769 $248,273 $1,192,537 Net Earned Premiums $233,072 $120,825 $53,514 $224,362 $124,106 $144,220 $900,099 Unearned Prem. Reserves $284,700 $112,510 $60,320 $340,059 $142,830 $231,737 $1,172,156 GAAP Combined Ratio 80.2% 36.3% 111.3% 104.9% 77.7% 90.3% 83.6% 2004 Underwriting Results Gross Written Premiums $441,370 $247,009 $112,900 $441,256 $246,802 $222,020 $1,711,357 Net Earned Premiums $464,024 $234,961 $102,780 $378,894 $235,621 $216,320 $1,632,600 GAAP Combined Ratio 95.1% 47.7% 68.1% 102.5% 82.1% 90.3% 85.8% 2003 Underwriting Results Gross Written Premiums $469,290 $183,594 $85,863 $390,265 $214,392 $258,593 $1,601,997 Net Earned Premiums $296,551 $174,158 $65,408 $284,843 $173,266 $179,721 $1,173,947 GAAP Combined Ratio 93.9% 38.5% 58.6% 97.5% 89.1% 99.5% 84.7% (a) Prior to deposit accounting adjustments 11

Price Monitoring Price Monitoring Review of Expected Underwriting Ratios by Quarter Review of Expected Underwriting Ratios by Quarter Direct - Property Direct - Casualty 120% 120% 100% 100% 80% 80% Underwriting Ratio 60% Underwriting Ratio 60% 40% 40% U/W Ratio - Price Monitor [Actual] U/W Ratio - Price Monitor [Actual] 20% 20% U/W Ratio - Price Monitor [Smoothed] U/W Ratio - Price Monitor [Smoothed] 0% 0% Q1- Q2- Q3- Q4- Q1- Q2- Q3- Q4- Q1- Q2- Q3- Q4- Q1- Q2- Q1- Q2- Q3- Q4- Q1- Q2- Q3- Q4- Q1- Q2- Q3- Q4- Q1- Q2- 02 02 02 02 03 03 03 03 04 04 04 04 05 05 02 02 02 02 03 03 03 03 04 04 04 04 05 05 Quarter of Inception Quarter of Inception 12
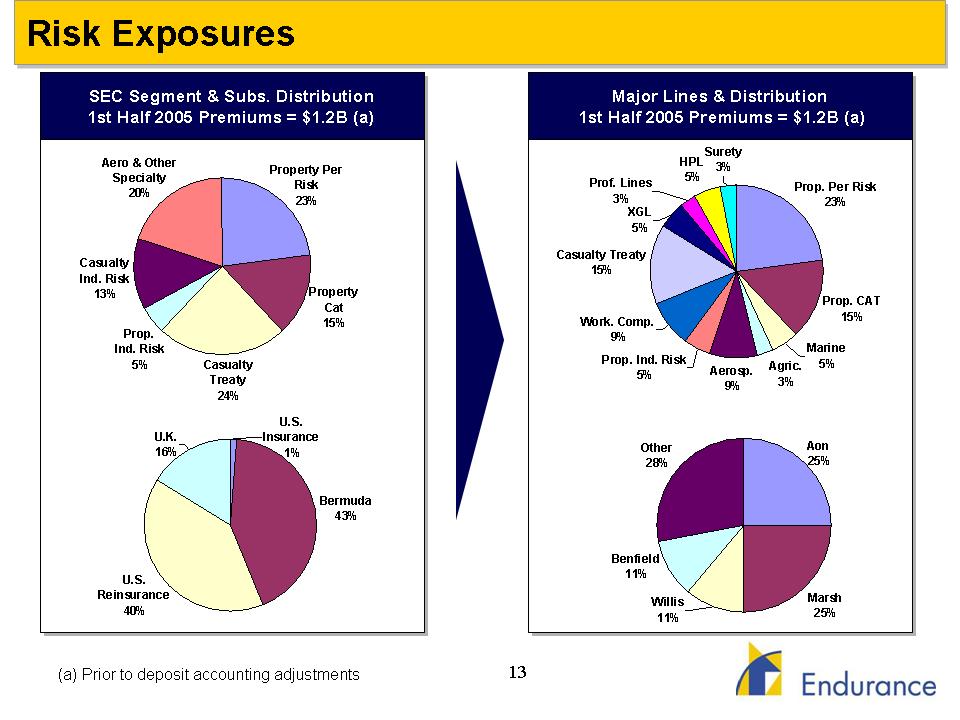
Risk Exposures SEC Segment & Subs. Distribution Major Lines & Distribution 1st Half 2005 Premiums = $1.2B (a) 1st Half 2005 Premiums = $1.2B (a) Surety 3% Aero & Other Specialty 20% HPL 5% Property Per Risk 23% Casualty Ind. Risk 13% Prof. Lines 3% Prop. Per Risk 23% XGL 5% Treaty Casualty 15% Property Prop. CAT Property Cat 15% 15% Work. Comp. 9% Prop. Ind. Risk Marine 5% Casualty Prop. Ind. Risk 5% Aerosp. Agric. Treaty 5% 9% 3% 24% U.S. U.K. Insurance Other Aon 16% 1% 28% 25% Bermuda 43% Benfield 11% U.S. Reinsurance Marsh Willis 40% 25% 11% (a) Prior to deposit accounting adjustments
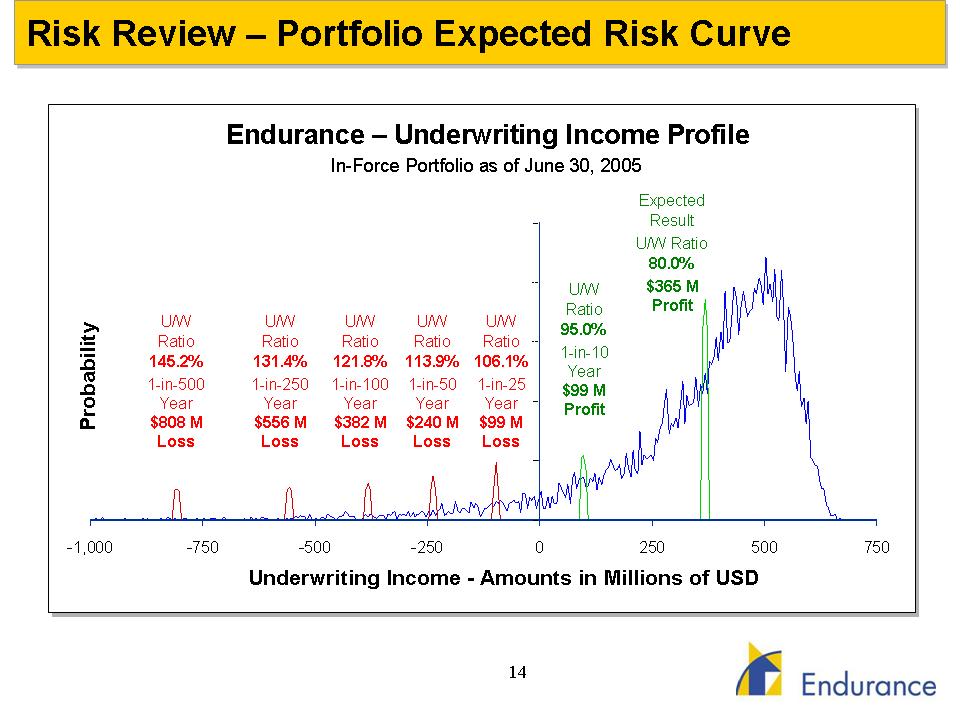
Risk Review - Portfolio Expected Risk Curve Endurance - Underwriting Income Profile In-Force Portfolio as of June 30, 2005 Profit Probability U/W Ratio 145.2% 1-in-500 Year $808 M Loss U/W Ratio 131.4% 1-in-250 Year $556 M Loss U/W Ratio 121.8% 1-in-100 Year $382 M Loss U/W Ratio 113.9% 1-in-50 Year $240 M Loss U/W Ratio 106.1% 1-in-25 Year $99 M Loss U/W Ratio 95.0% 1-in-10 Year $99 M Profit Expected Result U/W Ratio 80.0% $365 M Profit - -1,000 -750 -500 -250 0 250 500 750 Underwriting Income - Amounts in Millions of USD
Financial Review
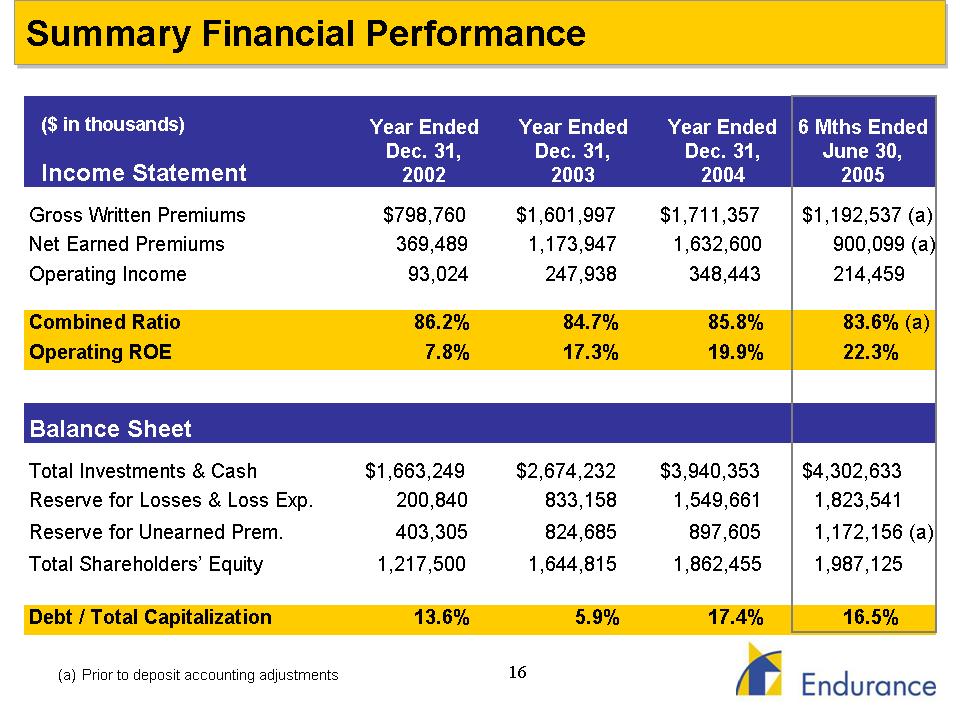
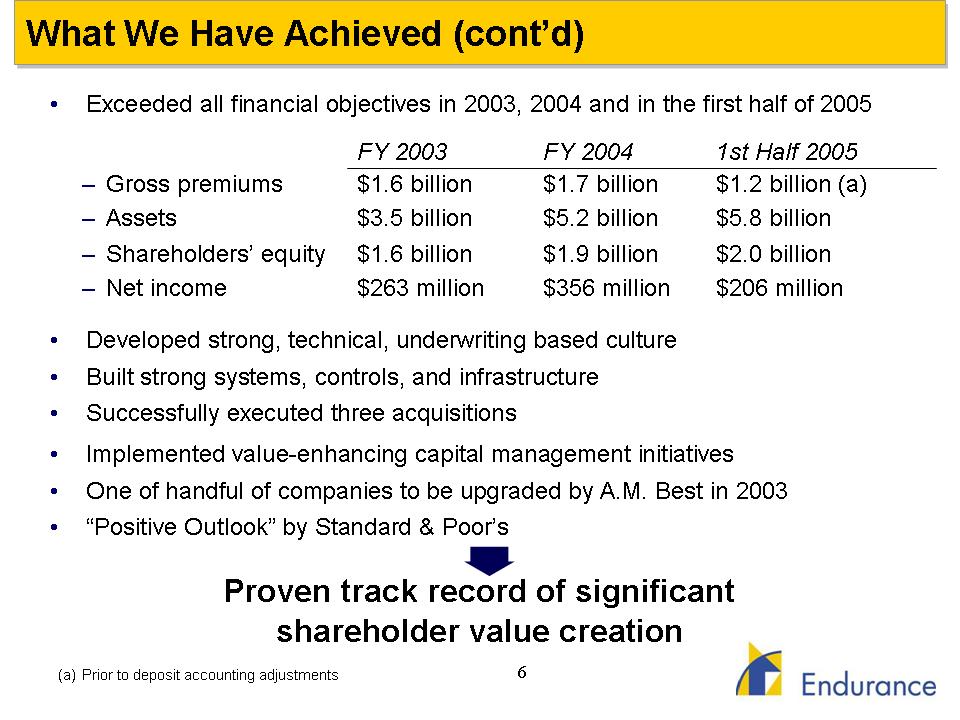
Summary Financial Performance ($ in thousands) Income Statement Year Ended Dec. 31, 2002 Year Ended Dec. 31, 2003 Year Ended Dec. 31, 2004 6 Mths Ended June 30, 2005 Gross Written Premiums $798,760 $1,601,997 $1,711,357 $1,192,537 (a) Net Earned Premiums 369,489 1,173,947 1,632,600 900,099 (a) Operating Income 93,024 247,938 348,443 214,459 Combined Ratio 86.2% 84.7% 85.8% 83.6% (a) Operating ROE 7.8% 17.3% 19.9% 22.3% Balance Sheet Total Investments & Cash $1,663,249 $2,674,232 $3,940,353 $4,302,633 Reserve for Losses & Loss Exp. 200,840 833,158 1,549,661 1,823,541 Reserve for Unearned Prem. 403,305 824,685 897,605 1,172,156 (a) Total Shareholders’ Equity 1,217,500 1,644,815 1,862,455 1,987,125 Debt / Total Capitalization 13.6% 5.9% 17.4% 16.5% (a) Prior to deposit accounting adjustments 16
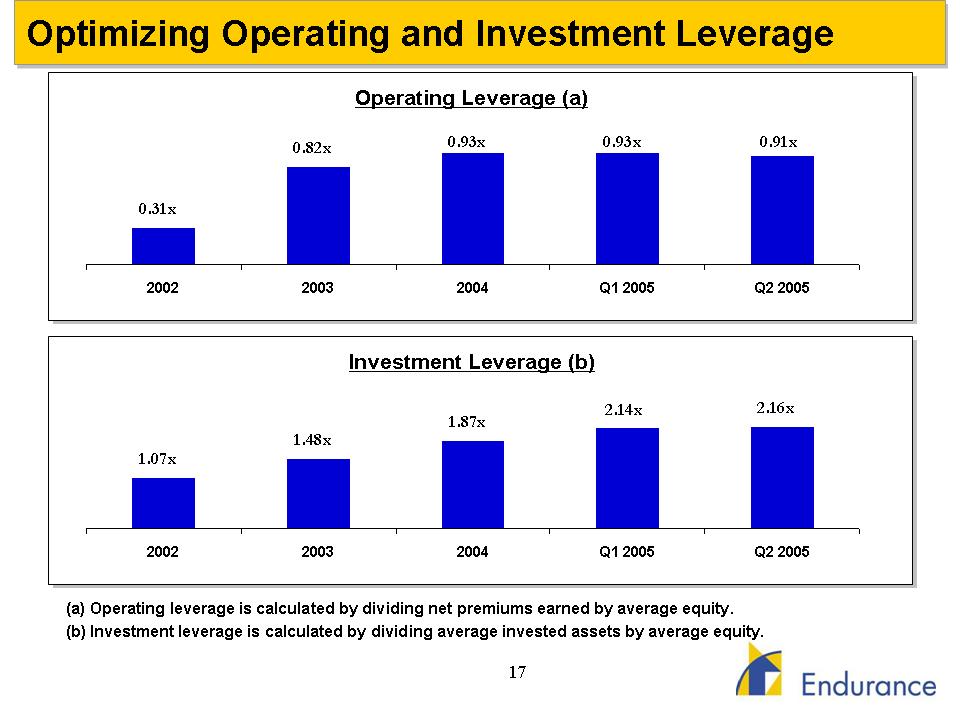
Optimizing Operating and Investment Leverage Operating Leverage (a) 0.82x 0.93x 0.93x 0.91x 0.31x 2002 2003 2004 Q1 2005 Q2 2005 Investment Leverage (b) 2.14x 2.16x 1.87x 1.48x 1.07x 2002 2003 2004 Q1 2005 Q2 2005 (a) Operating leverage is calculated by dividing net premiums earned by average equity. (b) Investment leverage is calculated by dividing average invested assets by average equity.
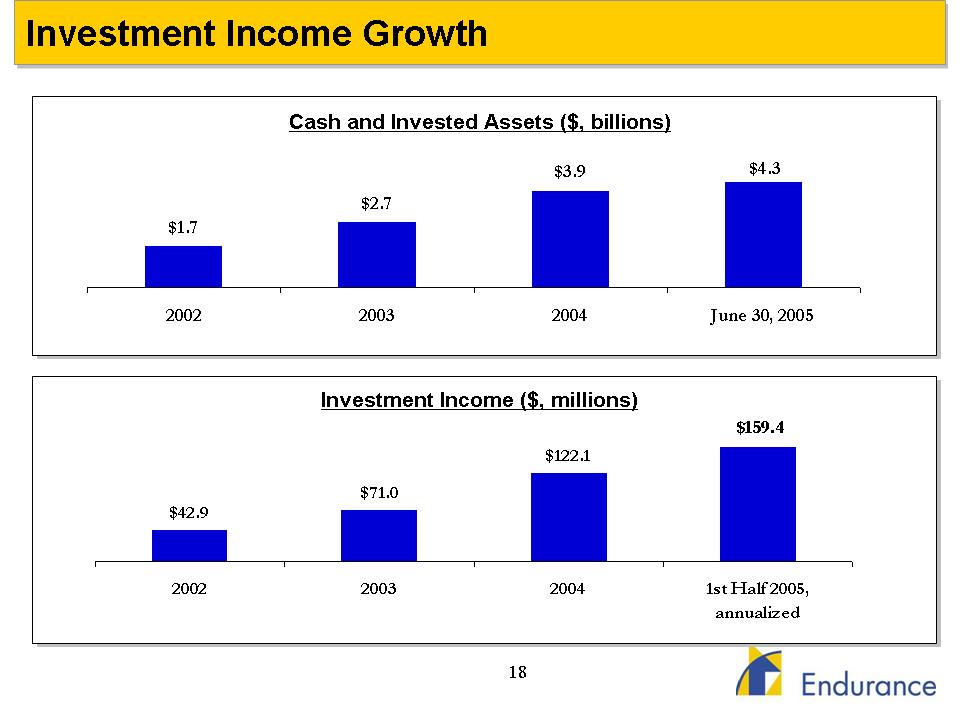
Investment Income Growth Cash and Invested Assets ($, billions) $3.9 $4.3 $2.7 $1.7 2002 2003 2004 June 30, 2005 Investment Income ($, millions) $159.4 $122.1 $71.0 $42.9 2002 2003 2004 1st Half 2005, annualized
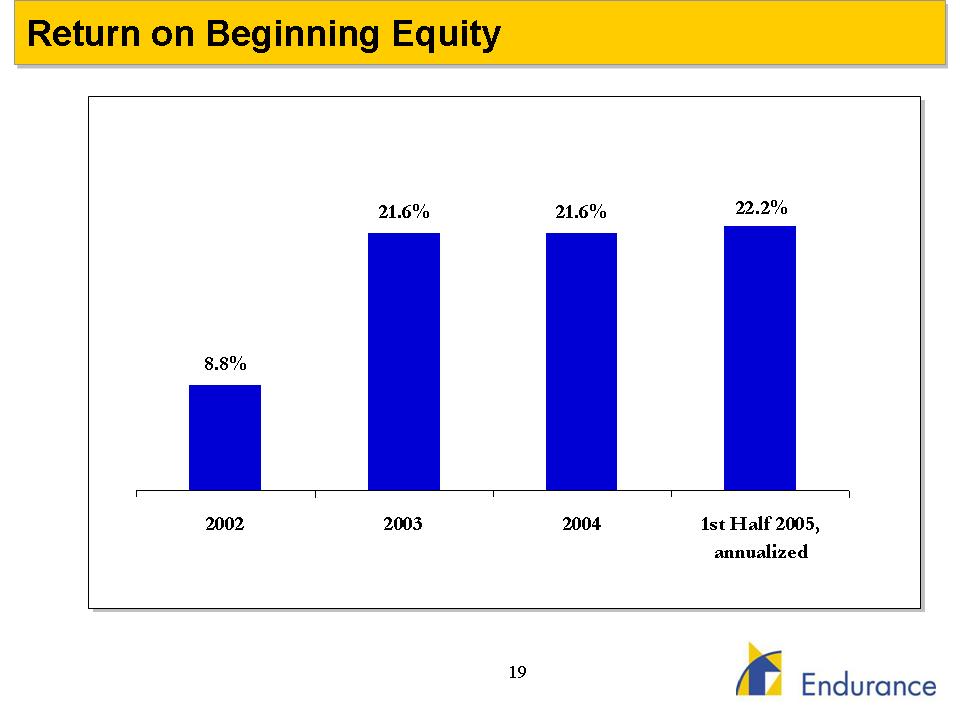
Return on Beginning Equity 21.6% 21.6% 22.2% 8.8% 2002 2003 2004 1st Half 2005, annualized
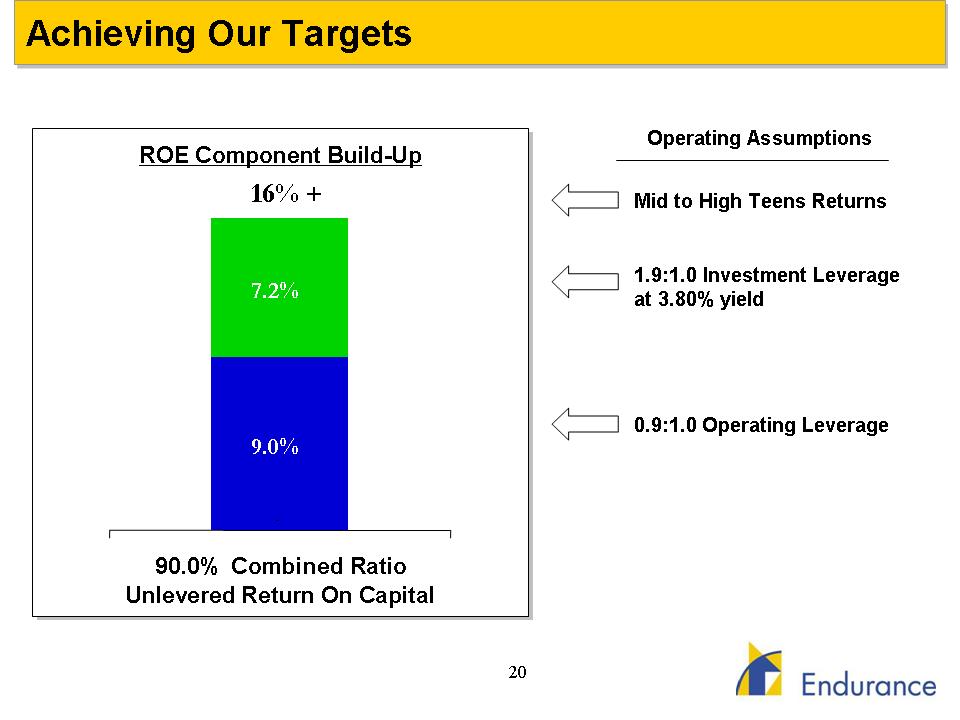
Achieving Our Targets Operating Assumptions ROE Component Build-Up 16% + Mid to High Teens Returns 1.9:1.0 Investment Leverage 7.2% at 3.80% yield 0.9:1.0 Operating Leverage 9.0% --- 90.0% Combined Ratio Unlevered Return On Capital

Capital Management Strategy o Increasing capital utilization o Strong organic growth o 5 renewal rights/team transactions o Understanding capital utilization o Catastrophe exposure o Actuarial o Rating agency o Reducing Cost of Capital o $925 million multi-year debt facility o $250 million 30-year debt transaction o Significant increase in float (secondary, Aon block trade) o Returning excess capital o $264 million in stock repurchased as of 6/30/2005 o 3.2 million share repurchase authorization o $101 million in dividends paid as of 6/30/2005
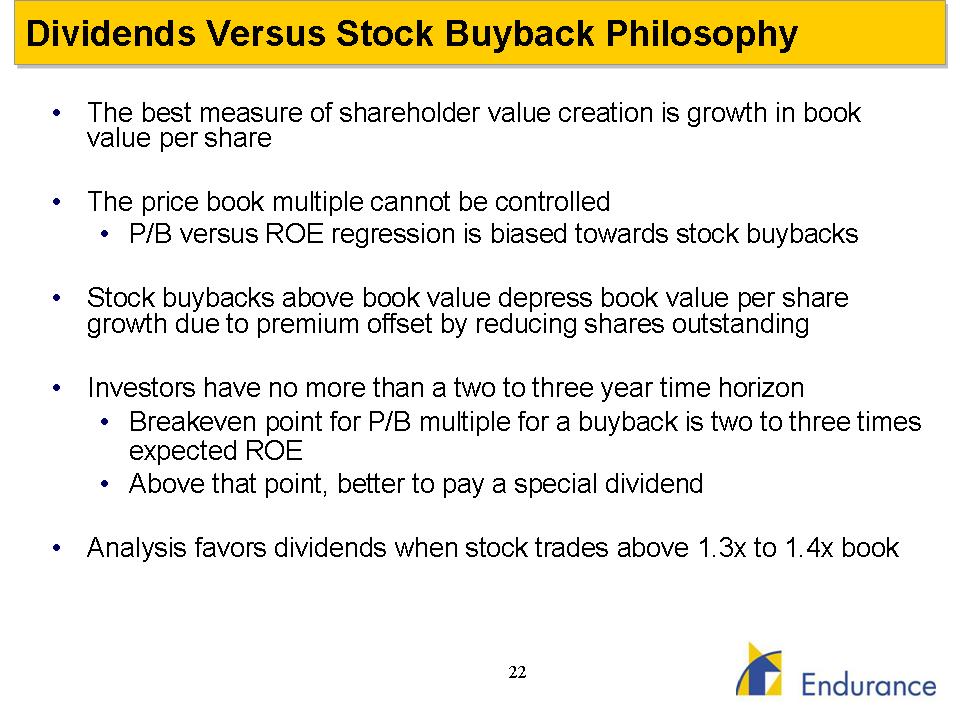
Dividends Versus Stock Buyback Philosophy o The best measure of shareholder value creation is growth in book value per share o The price book multiple cannot be controlled o P/B versus ROE regression is biased towards stock buybacks o Stock buybacks above book value depress book value per share growth due to premium offset by reducing shares outstanding o Investors have no more than a two to three year time horizon o Breakeven point for P/B multiple for a buyback is two to three times expected ROE o Above that point, better to pay a special dividend o Analysis favors dividends when stock trades above 1.3x to 1.4x book
Conclusion
Conclusion o Exceeded all strategic and financial objectives o Built strong, technical, underwriting based culture that is focused on profit, not revenue o Created robust controls, systems, and infrastructure o Value enhancement through capital management and enhancing acquisitions o Goal is to generate 15%+ growth in book value throughout the cycle o Demonstrated ability to create significant shareholder value with significant future upside