This report is for information purposes only. It should be read in conjunction with other documents filed by Endurance Specialty Holdings Ltd. pursuant to the Securities Act of 1933 and the Securities Exchange Act of 1934.
Financial Supplement Table of Contents
| | | |
| | | Page |
i. | Basis of Presentation | i |
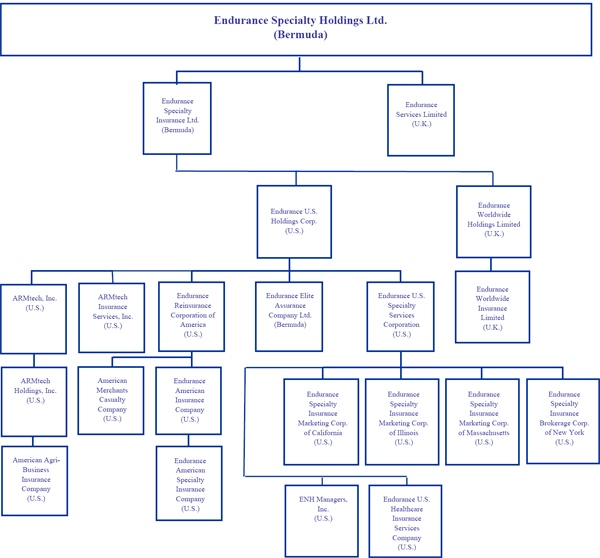
ii. | Organizational Chart of Corporate Structure | ii |
| | | |
I. | Financial Highlights | 1 |
| | | |
II. | Consolidated Financial Statements | |
| a. | Consolidated Statements of Income - Quarterly | 2 |
| b. | Consolidated Statements of Income - Prior Years | 3 |
| c. | Consolidated Balance Sheets | 4 |
| d. | Endurance Operating Income Profile | 5 |
| e. | Segment Distribution | 7 |
| f. | Segment Data | 8 |
| g. | Deposit Accounting Adjustment Impacts on Segment Data | 14 |
| | | |
III. | Other Financial Information | |
| a. | Return on Equity Analysis | 15 |
| b. | ROE Component Analysis - Operating and Investment Leverage | 16 |
| c. | Investment Portfolio Information | 17 |
| d. | Structured Securities Detail | 18 |
| | | |
IV. | Loss Reserve Analysis | |
| a. | Activity in Reserve for Losses and Loss Expenses | 19 |
| b. | Activity in Reserve for Losses and Loss Expenses by Segment | 20 |
| c. | Activity in Reserve for Losses and Loss Expenses by Development Tail | 21 |
| d. | Analysis of Unpaid Losses and Loss Expense | 22 |
| | | |
V. | Shareholder Return Analysis | |
| a. | Weighted Average Dilutive Shares Outstanding | 23 |
| b. | Operating Income Reconciliation | 24 |
| c. | Dilutive Shares Sensitivity Analysis | 25 |
| d. | Book Value Per Share Analysis | 26 |
| e. | Growth in Book Value Per Share Analysis | 27 |
| | | |
VI. | Regulation G | 28 |
| | | |
Application of the Safe Harbor of the Private Securities Litigation Reform Act of 1995:
Some of the statements in this financial supplement may include forward-looking statements which reflect our current views with respect to future events and financial performance. Such statements may include forward-looking statements both with respect to us in general and the insurance and reinsurance sectors specifically, both as to underwriting and investment matters. Statements which include the words “expect,” “intend,” “plan,” “believe,” “project,” “anticipate,” “seek,” “will,” and similar statements of a future or forward-looking nature identify forward-looking statements in this financial supplement for purposes of the U.S. federal securities laws or otherwise. We intend these forward-looking statements to be covered by the safe harbor provisions for forward-looking statements in the Private Securities Litigation Reform Act of 1995. Readers are cautioned not to place undue reliance on these forward-looking statements, which speak only to the date on which they are made. We undertake no obligation to publicly update or review any forward looking statement, when as a result of new information, future developments or otherwise.
All forward-looking statements address matters that involve risks and uncertainties. Accordingly, there are or may be important factors that could cause actual results to differ from those indicated in the forward-looking statements. These factors include, but are not limited to, competition, possible terrorism or the outbreak of war, the frequency or severity of unpredictable catastrophic events, changes in demand for insurance or reinsurance, rating agency actions, uncertainties in our reserving process, a change in our tax status, acceptance of our products, the availability of reinsurance or retrocessional coverage, retention of key personnel, political conditions, the impact of current regulatory investigations, changes in accounting policies, changes in general economic conditions and other factors described in our Annual Report on Form 10-K for the year ended December 31, 2007.

ENDURANCE SPECIALTY HOLDINGS LTD.
BASIS OF PRESENTATION
DEFINITIONS AND PRESENTATION
| |
• | All financial information contained herein is unaudited, except the balance sheet and income statement data for the years ended December 31, 2007, December 31, 2006 and December 31, 2005, which was derived from the Company’s audited financial statements. |
| |
• | Unless otherwise noted, all data is in thousands, except for per share, percentage and ratio information. |
| |
• | As used in this financial supplement, “common shares” refers to our ordinary shares and class A shares, collectively. |
| |
• | Endurance Specialty Holdings Ltd., along with others in the industry, uses underwriting ratios as measures of performance. The loss ratio is the ratio of claims and claims adjustment expense to earned premiums. The acquisition expense ratio is the ratio of underwriting expenses (commissions, taxes, licenses and fees, as well as other underwriting expenses) to earned premiums. The general and administrative expense ratio is the ratio of general and administrative expenses to earned premiums. The combined ratio is the sum of the loss ratio, the acquisition expense ratio and the general and administrative expense ratio. These ratios are relative measurements that describe for every $100 of net premiums earned, the cost of losses and expenses, respectively. The combined ratio presents the total cost per $100 of earned premium. A combined ratio below 100% demonstrates underwriting profit; a combined ratio above 100% demonstrates underwriting loss. |
| |
• | GAAP combined ratios differ from statutory combined ratios primarily due to the deferral of certain third party acquisition expenses for GAAP reporting purposes and the use of net premiums earned rather than net premiums written in the denominator when calculating the acquisition expense and the general & administrative expense ratios. |
| |
• | NM - Not meaningful; NA - Not Applicable; LTM - Latest twelve months. |

i
ENDURANCE SPECIALTY HOLDINGS LTD.
CORPORATE ORGANIZATION CHART

ii
ENDURANCE SPECIALTY HOLDINGS LTD.
CONSOLIDATED FINANCIAL HIGHLIGHTS
| | | | | | | | | | | | | | |
| | | | QUARTER ENDED
MARCH 31, | | Previous
Quarter
Change |
| | | |
| |
| | | | 2008 | | 2007 | |
| | | |
| |
| |
|
|
| | | | | | | | | | | | | | |
HIGHLIGHTS | | Net income | | | $ | 77,811 | | | | $ | 101,835 | | (23.6 | )% |
| | Net income available to common shareholders | | | | 73,936 | | | | | 97,960 | | (24.5 | )% |
| | Operating income[a] | | | | 89,527 | | | | | 105,196 | | (14.9 | )% |
| | Operating income available to common shareholders[a] | | | | 85,652 | | | | | 101,321 | | (15.5 | )% |
| | Operating cash flow | | | | 142,738 | | | | | 121,805 | | 17.2 | % |
| | Gross premiums written | | | | 868,591 | | | | | 573,291 | | 51.5 | % |
| | Net premiums earned | | | | 372,043 | | | | | 377,045 | | (1.3 | )% |
| | Total assets | | | | 7,875,211 | | | | | 7,190,463 | | 9.5 | % |
| | Total shareholders’ equity | | | | 2,538,174 | | | | | 2,366,546 | | 7.3 | % |
| | | | | | | | | | | | | | | |
PER SHARE
AND SHARES DATA | | Basic earnings per common share | | | | | | | | | | | | |
| | Net income (as reported) | | | $ | 1.26 | | | | $ | 1.47 | | (14.5 | )% |
| | Operating income (as reported)[a] | | | $ | 1.46 | | | | $ | 1.52 | | (4.3 | )% |
| | Diluted earnings per common share | | | | | | | | | | | | |
| | Net income (as reported) | | | $ | 1.15 | | | | $ | 1.36 | | (15.7 | )% |
| | Operating income (as reported)[a] | | | $ | 1.33 | | | | $ | 1.41 | | (5.5 | )% |
As Reported | | Weighted average common shares outstanding | | | | 58,823 | | | | | 66,613 | | (11.7 | )% |
| | Weighted average common shares outstanding and dilutive potential common shares | | | | 64,503 | | | | | 72,073 | | (10.5 | )% |
Book Value Per
Common Share | | Book value[b] | | | $ | 39.83 | | | | $ | 32.77 | | 21.5 | % |
| | Diluted book value (treasury stock method)[b] | | | $ | 36.00 | | | | $ | 30.19 | | 19.2 | % |
| | | | | | | | | | | | | | |
| | | | | | | | | | | | | | | |
FINANCIAL RATIOS | | Return on average common equity (ROAE), net income[c] | | | | 3.2 | % | | | | 4.6 | % | (1.4 | ) |
| | ROAE, operating income[a][c] | | | | 3.7 | % | | | | 4.8 | % | (1.1 | ) |
| | Return on beg. common equity (ROBE), net income[c] | | | | 3.2 | % | | | | 4.7 | % | (1.5 | ) |
| | ROBE, operating income[a] | | | | 3.7 | % | | | | 4.8 | % | (1.1 | ) |
| | Annualized ROAE, net income[c] | | | | 12.7 | % | | | | 18.4 | % | (5.7 | ) |
| | Annualized ROAE, operating income[a] [c] | | | | 14.7 | % | | | | 19.0 | % | (4.3 | ) |
| | Annualized ROBE, net income | | | | 12.8 | % | | | | 18.7 | % | (5.9 | ) |
| | Annualized ROBE, operating income[a] | | | | 14.8 | % | | | | 19.3 | % | (4.5 | ) |
| | Annualized investment yield | | | | 3.4 | % | | | | 5.5 | % | (2.1 | ) |
| | | | | | | | | | | | | | |
| | Loss ratio | | | | 50.9 | % | | | | 55.9 | % | (5.0 | ) |
GAAP | | Acquisition expense ratio | | | | 20.0 | % | | | | 17.9 | % | 2.1 | |
| | General and administrative expense ratio | | | | 13.5 | % | | | | 12.9 | % | 0.6 | |
| | | | | | | | | | | | | | |
| | Combined ratio | | | | 84.4 | % | | | | 86.7 | % | (2.3 | ) |
STAT | | Acquisition expense ratio | | | | 12.9 | % | | | | 15.9 | % | (3.0 | ) |
| | General and administrative expense ratio | | | | 7.7 | % | | | | 9.8 | % | (2.1 | ) |
| | | | | | | | | | | | | | |
| | Combined ratio | | | | 71.5 | % | | | | 81.6 | % | (10.1 | ) |
| | | | | | | | | | | | | | |
| |
|
[a] | Operating income represents after-tax operational results excluding, as applicable, after-tax net realized capital gains or losses and after-tax net foreign exchange gains or losses. Please see page 24 for a reconciliation to net income. |
| |
[b] | For detailed calculations please refer to page 26. |
| |
[c] | Average common equity is calculated as the arithmetic average of the beginning and ending common equity balances for the stated periods, which excludes the $200 million liquidation value of the preferred shares. |

1
ENDURANCE SPECIALTY HOLDINGS LTD.
CONSOLIDATED STATEMENTS OF INCOME - QUARTERLY


