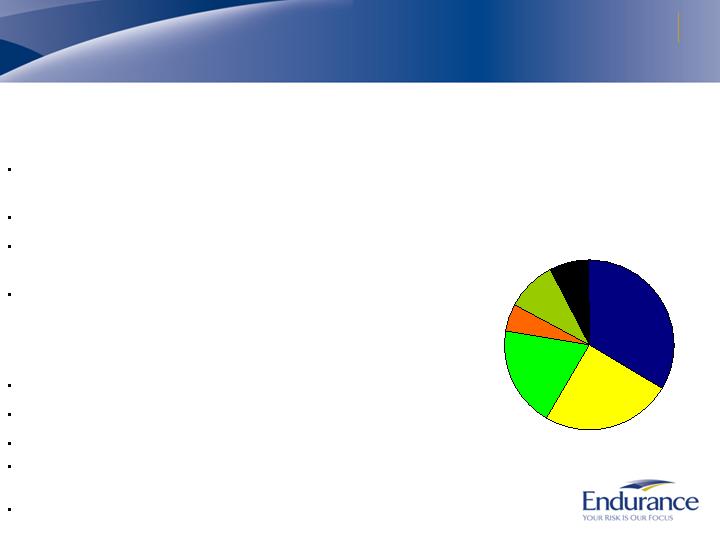
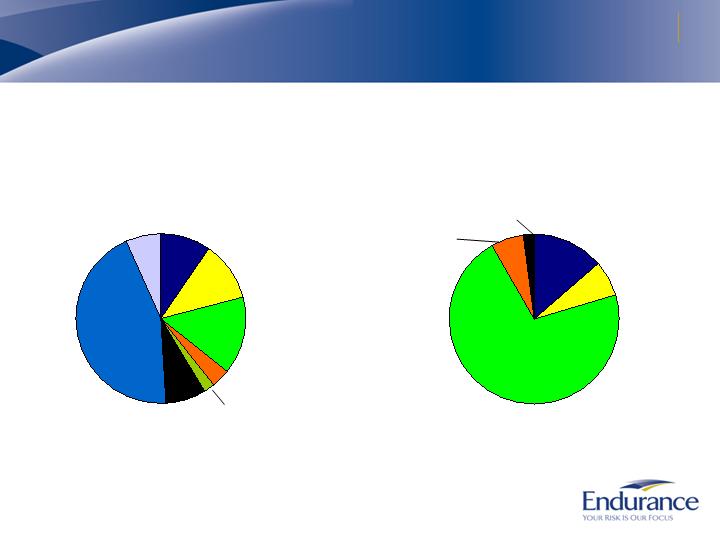
Reinsurance Segment Differentiation
Reinsurance Total Written
Premiums of $924 million*
By Line of Business
* Includes deposit premiums, based on the 12 months ended March 31, 2008
Catastrophe
33.6%
Property
24.7%
Agriculture
5.3%
Casualty
19.3%
Aerospace and Marine
9.7%
Surety and other specialty
7.4%
Endurance differentiates its
reinsurance by:
Focusing on clients that are leading experts in their
specialty
Having industry experts lead each business unit
Leading market in performance of value added claims
and underwriting audits
Strategically located in key global reinsurance markets
(Bermuda, NY, London, Zurich, Singapore)
Property catastrophe business
Leading underwriter of world wide catastrophe risk
Proprietary modeling technology
Cycle exists, but market remains technically driven
Peak exposures include US Wind, CA Earthquake,
European Wind/Flood
Excellent long term profitability even with large cats
8

Insurance Segment Differentiation
Insurance Total Written
Premiums of $1.2 billion*
By Line of Business
Casualty
10.5%
Professional
Lines
7.5%
Healthcare
Liability
7.6%
Property
11.7%
Workers’
Compensation
24.1%
Agriculture
38.6%
* Based on the 12 months ended March 31, 2008
Technology, expertise and distribution will
allow us to optimize cycle performance
Bermuda
Excess casualty, D&O and healthcare:
Leading market providers
Mature portfolio
Volatile classes of casualty insurance require highly
specialized underwriting and have produced strong
historical results
U.S. Based Insurance
Specialty excess and surplus insurance, workers
compensation and agriculture
Diversification, capital utilization and return potential
significantly enhanced by ARMtech acquisition
Specialized teams of underwriters added to further
expand and diversify E&S operations
UK Property Business
Lead Market for UK Middle Market Property Insurance
New Construction Unit
9

A History of Innovative Acquisitions
Endurance has completed several attractive transactions since its
inception
Avoid legacy issues
Accretive to earnings
Key acquisition criteria
Insurance or reinsurance business
Can be effectively integrated
Endurance controls acquired business
Failure will not threaten viability of Endurance
Quickly accretive to earnings
Provides specialty expertise
Transfers minimal legacy liabilities
Does not create significant risk aggregations
LaSalle Re
Property Cat
Renewal Rights
$170M in premium
Hart Re
Reinsurance Business
Renewal Rights
$800M in premium
XL Re
Surety Business
Renewal Rights
$45M in premium
ARMtech
Agriculture Business
Acquisition
$500M+ in premium
2002
2003
2004
2007
10
Agriculture Insurance/Reinsurance Case Study
Agriculture industry
Fast growing part of the economy
Core product is MPCI (multi peril crop insurance) which is part of federal crop insurance
program
Underwriting is specialized, technical and data intensive
Intrinsically profitable
Reinsurance has steadily become more competitive over last four years
Insurance results are typically better than reinsurance
ARMtech overview
5th largest writer of Ag insurance in the U.S.
Industry leading customer service and technology
Serves approximately 100,000 customers
Geographically diversified portfolio of MPCI business with some concentration in Texas
Offers both revenue and yield products
Is most significantly impacted by drought risk which is lightly correlated with Endurance
book of business
Opportunistic purchaser of reinsurance
Reduces volatility
Proprietary federal cessions technology
Purchases excess of loss and quota share from third parties at attractive terms
11
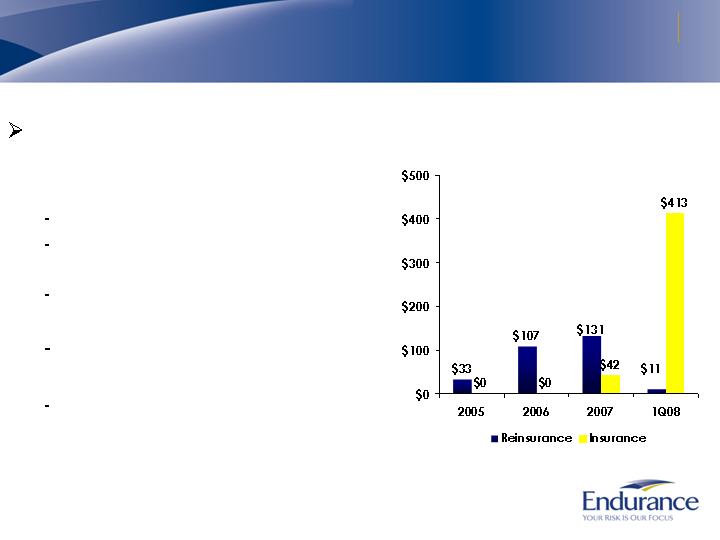
Agriculture Insurance/Reinsurance Case Study, Continued
Effectively switched from
being a reinsurance to an
insurance provider
Meaningful book of business
Higher profitability with lower
volatility
More sustainable book of
business; 100,000 customers
Insurance rates are set by
federal program
Reinsurance rates impacted by
competitive forces
(in millions)
Gross Written Premiums*
* Includes deposit premiums
12
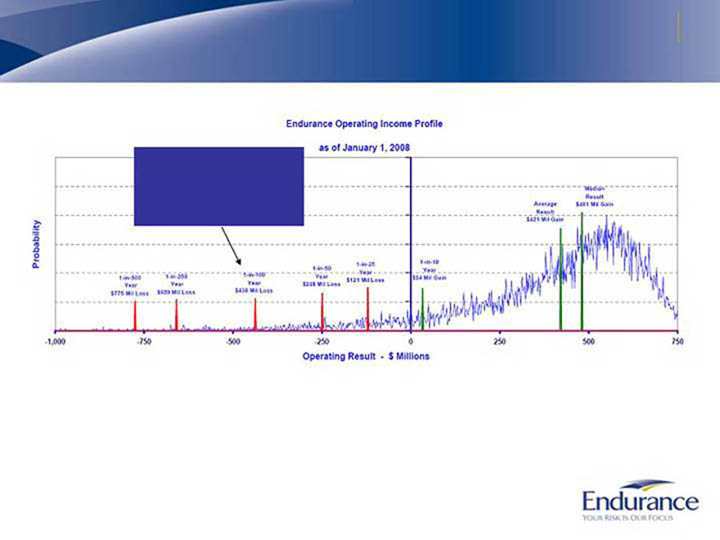
Strong Risk Management Focus -
Portfolio Expected Risk Curve (January 1, 2008)
Stated tolerance is to limit
our loss in a 1-in-100 year
to 25% of our capital or
less, our current level is
18.7% of capital
The above chart represents a cumulative analysis of our in-force underwriting portfolio on a full year basis based on thousands of
potential scenarios. Loss years are driven largely by the occurrence of natural catastrophes and incorrect pricing of other property and
casualty exposures. The operating income depicted includes net premiums earned plus net investment income, acquisition expenses
and G&A expenses. The operating income depicted excludes the effects of income tax (expenses) benefits, amortization of intangibles
and interest expense. Forecasted investment income, acquisition and G&A expenses are held constant across all scenarios. Losses
included above are net of reinsurance including collateralized reinsurance and ILW purchases. Our stated objective is to maintain a risk
management tolerance that limits our loss in a 1-in-100 year year to be no more than 25% of our equity capital.
Changes in Endurance's underwriting portfolio, investment portfolio, risk control mechanisms, market conditions and other factors may cause actual results to
vary considerably from those indicated by our value at risk curve. For a listing of risks related to Endurance and its future performance, please see "Risk Factors"
in our Annual Report on Form 10-K for the year ended December 31, 2007.
13
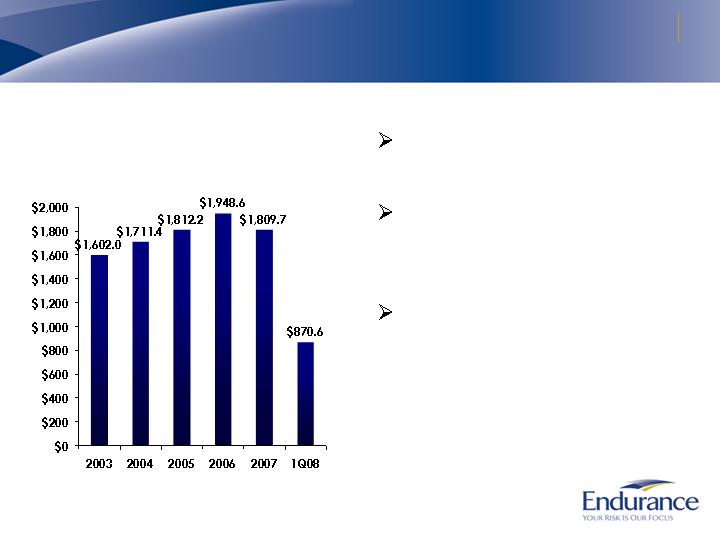
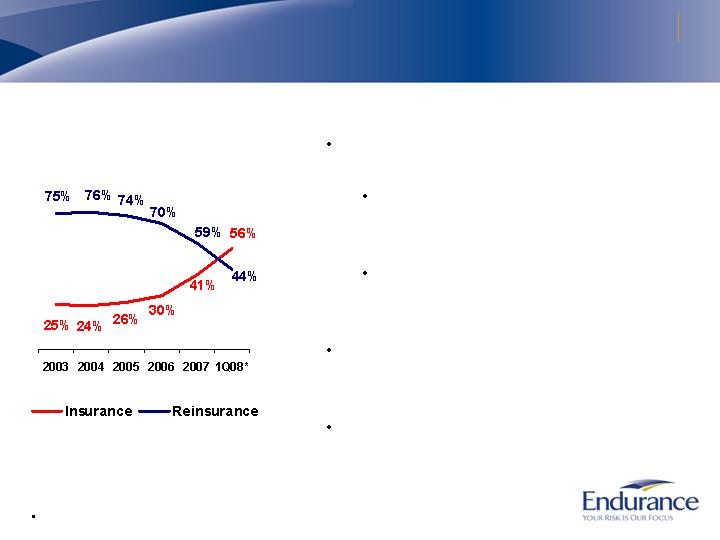
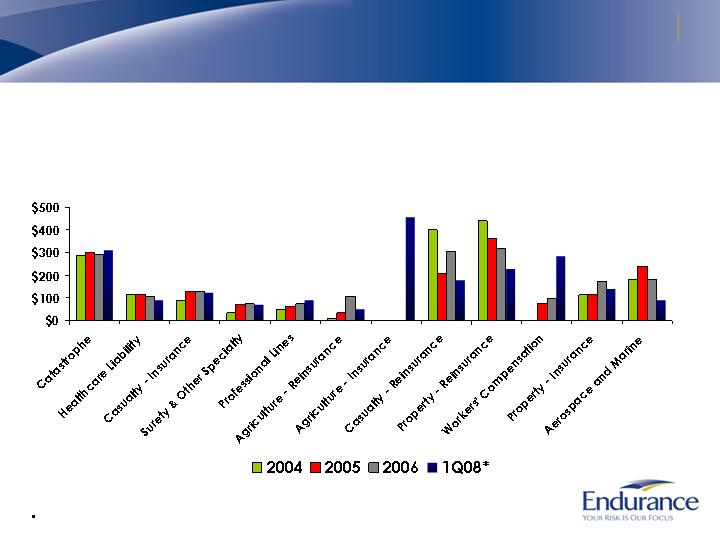
Portfolio Management Has Generated Stable Premiums
Gross Written Premiums*
(in millions)
* Includes deposit premiums
Premiums have been fairly
stable with modest growth
Underlying product mix has
shifted significantly over
time
Actively managing the
portfolio by entering new
attractive business while
exiting or reducing
premiums in less attractive
lines
14
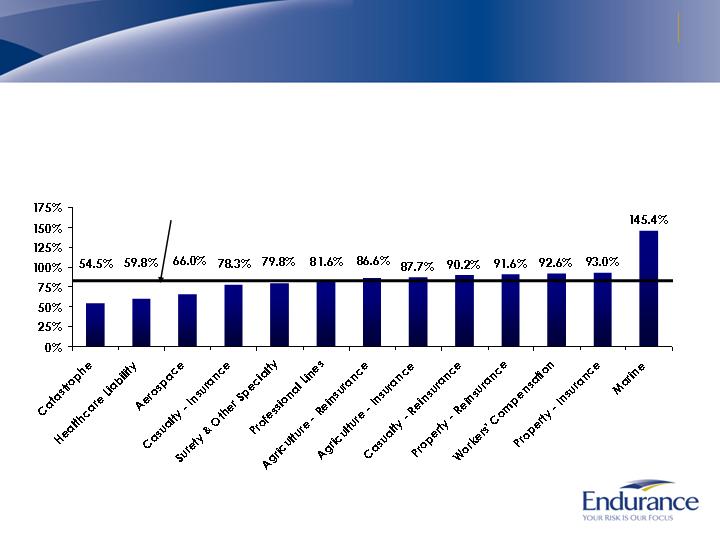
Overall Underwriting Has Been Strong
Inception to Date Underwriting Ratio*
* Underwriting ratio is defined as losses and acquisition expenses divided by earned
premium, from inception through 3/31/08 and is before deposit accounting adjustments.
Inception to Date Underwriting
Ratio is 81.6%*
15
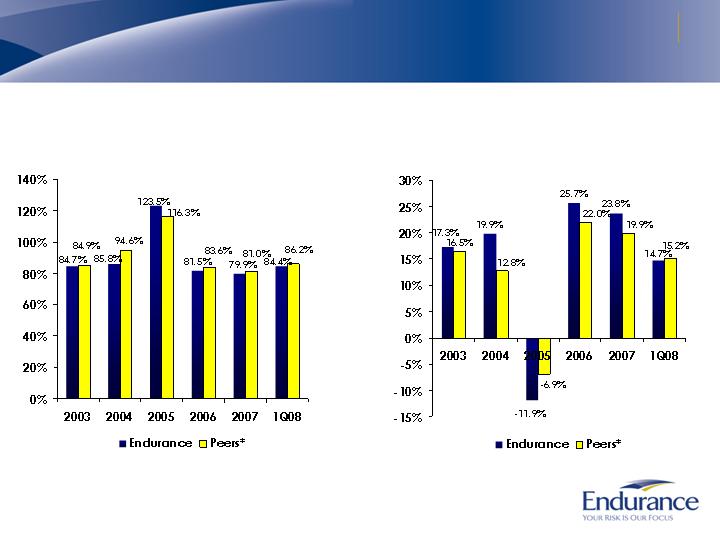
Strong Financial Performance
Combined Ratio
Annualized Operating
Return on Average Equity
Inception to 3/31/08 combined ratio of 91.3%
Inception to 3/31/08 ROE of 15.1%
* Composite peer median based on SNL data, peers include; Platinum, Allied World, Arch, Ren Re,
IPC re, Axis, Transatlantic, Everest, Partner Re, Montpelier and Max Re
16
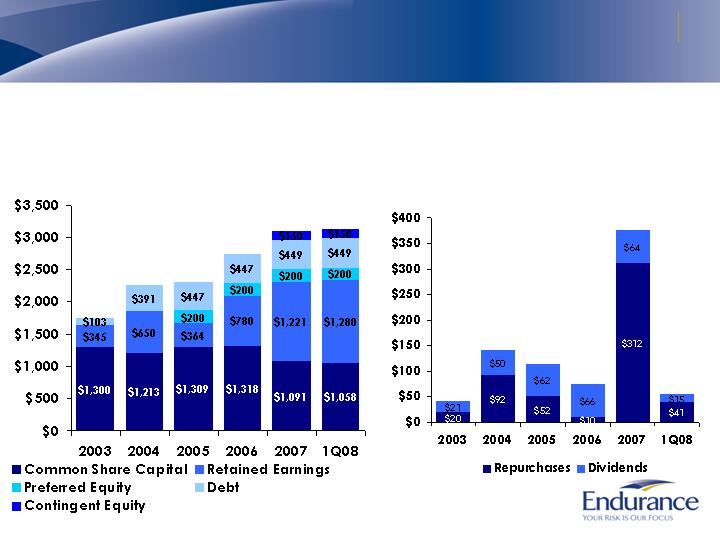
Results of Capital Management
Strong and Flexible
Capital Structure
$, Millions
$1,748
$2,254
$2,320
$2,745
$, Millions
$894 Million of Capital
Returned to Shareholders
(Inception to date)
$41
$142
$113
$76
$376
$3,111
$3,137
$56
17
High Quality Investment Portfolio
Total Investment Portfolio of $5.6 Billion*
Cash and Other
9.8%
Mortgage-backed
44.5%
By Investment Type
* As of March 31, 2008
Fixed Maturity Ratings
$4.7 Billion*
U.S. Government
and agencies
11.3%
Corporate
14.6%
Foreign Government
3.5%
Asset-backed
7.4%
Alternatives
6.6%
U.S. Government
and agencies
13.6%
AAA/Aaa and
agency RMBS
71.1%
BBB or Below
1.8%
AA/Aa
6.6%
A/A
6.9%
Municipals
2.3%
18
Conclusion
Managing the micro cycles within the insurance/reinsurance
industry
Shrinking portions of our portfolio as we non-renew business that no
longer meets our price targets
Growing in select areas where profit margins remain strong
Continue to execute on attractive acquisition opportunities
that create shareholder value
Well positioned with strong management team, diversified
product portfolio, and excellent financial strength
Creating shareholder value through strong underwriting and
investment returns coupled with active capital management
to generate 15%+ ROE through underwriting cycles
Achieved inception to date ROE of 15.1%
19