Endurance Specialty Holdings Ltd.
Wellesley House, 90 Pitts Bay Rd.
Pembroke HM 08, Bermuda
Investor Relations
Phone: (441) 278-0988
Fax: (441) 278-0493
email: investorrelations@endurance.bm
This report is for information purposes only. It should be read in conjunction with other documents filed by Endurance Specialty Holdings Ltd. pursuant to the Securities Act of 1933 and the Securities Exchange Act of 1934.
Financial Supplement Table of Contents
Application of the Safe Harbor of the Private Securities Litigation Reform Act of 1995:
Some of the statements in this financial supplement may include forward-looking statements which reflect our current views with respect to future events and financial performance. Such statements may include forward-looking statements both with respect to us in general and the insurance and reinsurance sectors specifically, both as to underwriting and investment matters. Statements which include the words “expect,” “intend,” “plan,” “believe,” “project,” “anticipate,” “seek,” “will,” and similar statements of a future or forward-looking nature identify forward-looking statements in this financial supplement for purposes of the U.S. federal securities laws or otherwise. We intend these forward-looking statements to be covered by the safe harbor provisions for forward-looking statements in the Private Securities Litigation Reform Act of 1995. Readers are cautioned not to place undue reliance on these forward-looking statements, which speak only to the date on which they are made. We undertake no obligation to publicly update or review any forward looking statement, when as a result of new information, future developments or otherwise.
All forward-looking statements address matters that involve risks and uncertainties. Accordingly, there are or may be important factors that could cause actual results to differ from those indicated in the forward-looking statements. These factors include, but are not limited to, competition, possible terrorism or the outbreak of war, the frequency or severity of unpredictable catastrophic events, changes in demand for insurance or reinsurance, rating agency actions, uncertainties in our reserving process, a change in our tax status, acceptance of our products, the availability of reinsurance or retrocessional coverage, retention of key personnel, political conditions, the impact of current regulatory investigations, changes in accounting policies, changes in general economic conditions and other factors described in our Annual Report on Form 10-K for the year ended December 31, 2007.

ENDURANCE SPECIALTY HOLDINGS LTD.
BASIS OF PRESENTATION
DEFINITIONS AND PRESENTATION
| |
• | All financial information contained herein is unaudited, except the balance sheet and income statement data for the years ended December 31, 2007, December 31, 2006 and December 31, 2005, which was derived from the Company’s audited financial statements. |
| |
• | Unless otherwise noted, all data is in thousands, except for per share, percentage and ratio information. |
| |
• | As used in this financial supplement, “common shares” refers to our ordinary shares and class A shares, collectively. |
| |
• | Endurance Specialty Holdings Ltd., along with others in the industry, uses underwriting ratios as measures of performance. The loss ratio is the ratio of claims and claims adjustment expense to earned premiums. The acquisition expense ratio is the ratio of underwriting expenses (commissions, taxes, licenses and fees, as well as other underwriting expenses) to earned premiums. The general and administrative expense ratio is the ratio of general and administrative expenses to earned premiums. The combined ratio is the sum of the loss ratio, the acquisition expense ratio and the general and administrative expense ratio. These ratios are relative measurements that describe for every $100 of net premiums earned, the cost of losses and expenses, respectively. The combined ratio presents the total cost per $100 of earned premium. A combined ratio below 100% demonstrates underwriting profit; a combined ratio above 100% demonstrates underwriting loss. |
| |
• | GAAP combined ratios differ from statutory combined ratios primarily due to the deferral of certain third party acquisition expenses for GAAP reporting purposes and the use of net premiums earned rather than net premiums written in the denominator when calculating the acquisition expense and the general & administrative expense ratios. |
| |
• | NM - Not meaningful; NA - Not Applicable; LTM - Latest twelve months. |
i
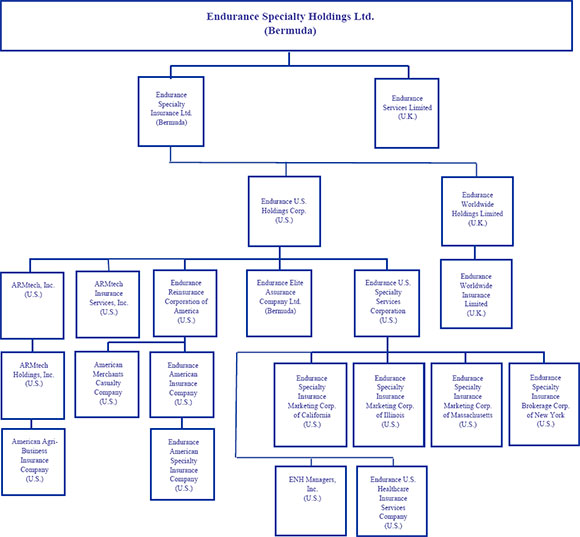
ENDURANCE SPECIALTY HOLDINGS LTD.
CORPORATE ORGANIZATION CHART
ii
ENDURANCE SPECIALTY HOLDINGS LTD.
CONSOLIDATED FINANCIAL HIGHLIGHTS
| | | | | | | | | | | | | | | | | | | | | | | | |
| | | QUARTER ENDED
JUNE 30, | | SIX MONTHS ENDED
JUNE 30, | | Previous
Quarter
Change | | Previous
Year to Date
Change | |
| | |
| |
| | | |
| | | 2008 | | 2007 | | 2008 | | 2007 | | | |
| | |
| |
| |
| |
| |
| |
| |
| | | | | | | | | | | | | | | | | | | | | | | | |
HIGHLIGHTS | Net income | | | $ | 103,338 | | | $ | 135,341 | | | $ | 181,149 | | | $ | 237,176 | | | (23.6 | )% | | (23.6 | )% |
| Net income available to common shareholders | | | | 99,463 | | | | 131,466 | | | | 173,399 | | | | 229,426 | | | (24.3 | )% | | (24.4 | )% |
| Operating income[a] | | | | 102,678 | | | | 141,177 | | | | 192,205 | | | | 246,373 | | | (27.3 | )% | | (22.0 | )% |
| Operating income available to common shareholders[a] | | | | 98,803 | | | | 137,302 | | | | 184,455 | | | | 238,623 | | | (28.0 | )% | | (22.7 | )% |
| Operating cash flow | | | | 127,085 | | | | 118,870 | | | | 269,823 | | | | 240,675 | | | 6.9 | % | | 12.1 | % |
| Gross premiums written | | | | 518,063 | | | | 506,803 | | | | 1,386,654 | | | | 1,080,094 | | | 2.2 | % | | 28.4 | % |
| Net premiums earned | | | | 453,085 | | | | 417,551 | | | | 825,128 | | | | 794,596 | | | 8.5 | % | | 3.8 | % |
| Total assets | | | | 7,884,286 | | | | 7,225,847 | | | | 7,884,286 | | | | 7,225,847 | | | 9.1 | % | | 9.1 | % |
| Total shareholders’ equity | | | | 2,533,895 | | | | 2,379,846 | | | | 2,533,895 | | | | 2,379,846 | | | 6.5 | % | | 6.5 | % |
|
|
|
|
|
|
|
|
|
|
|
|
|
|
|
|
|
|
|
|
|
|
|
|
|
PER SHARE | Basic earnings per common share | | | | | | | | | | | | | | | | | | | | | | | |
AND SHARES DATA | Net income (as reported) | | | $ | 1.70 | | | $ | 2.01 | | | $ | 2.95 | | | $ | 3.47 | | | (15.3 | )% | | (14.9 | )% |
| Operating income (as reported)[a] | | | $ | 1.69 | | | $ | 2.10 | | | $ | 3.14 | | | $ | 3.61 | | | (19.5 | )% | | (13.0 | )% |
| Diluted earnings per common share | | | | | | | | | | | | | | | | | | | | | | | |
| Net income (as reported) | | | $ | 1.56 | | | $ | 1.85 | | | $ | 2.70 | | | $ | 3.22 | | | (15.8 | )% | | (16.1 | )% |
| Operating income (as reported)[a] | | | $ | 1.55 | | | $ | 1.94 | | | $ | 2.87 | | | $ | 3.35 | | | (19.9 | )% | | (14.2 | )% |
As Reported | Weighted average common shares outstanding | | | | 58,558 | | | | 65,531 | | | | 58,691 | | | | 66,069 | | | (10.6 | )% | | (11.2 | )% |
| Weighted average common shares outstanding and dilutive potential common shares | | | | 63,712 | | | | 70,930 | | | | 64,196 | | | | 71,294 | | | (10.2 | )% | | (10.0 | )% |
Book Value Per | Book value[b] | | | $ | 39.97 | | | $ | 33.67 | | | $ | 39.97 | | | $ | 33.67 | | | 18.7 | % | | 18.7 | % |
Common Share | Diluted book value (treasury stock method)[b] | | | $ | 36.72 | | | $ | 30.56 | | | $ | 36.72 | | | $ | 30.56 | | | 20.1 | % | | 20.1 | % |
|
|
|
|
|
|
|
|
|
|
|
|
|
|
|
|
|
|
|
|
|
|
|
|
|
FINANCIAL RATIOS | Return on average common equity (ROAE), net income[c] | | | | 4.3 | % | | | 6.0 | % | | | 7.5 | % | | | 10.7 | % | | (1.8 | ) | | (3.3 | ) |
| ROAE, operating income[a] [c] | | | | 4.2 | % | | | 6.3 | % | | | 7.9 | % | | | 11.2 | % | | (2.1 | ) | | (3.2 | ) |
| Return on beg. common equity (ROBE), net income[c] | | | | 4.3 | % | | | 6.1 | % | | | 7.5 | % | | | 10.9 | % | | (1.8 | ) | | (3.4 | ) |
| ROBE, operating income[a] | | | | 4.2 | % | | | 6.3 | % | | | 8.0 | % | | | 11.4 | % | | (2.1 | ) | | (3.4 | ) |
| Annualized ROAE, net income[c] | | | | 17.0 | % | | | 24.2 | % | | | 14.9 | % | | | 21.5 | % | | (7.2 | ) | | (6.5 | ) |
| Annualized ROAE, operating income[a] [c] | | | | 16.9 | % | | | 25.3 | % | | | 15.9 | % | | | 22.3 | % | | (8.4 | ) | | (6.4 | ) |
| Annualized ROBE, net income | | | | 17.0 | % | | | 24.3 | % | | | 15.0 | % | | | 21.9 | % | | (7.3 | ) | | (6.9 | ) |
| Annualized ROBE, operating income[a] | | | | 16.9 | % | | | 25.3 | % | | | 16.0 | % | | | 22.7 | % | | (8.4 | ) | | (6.8 | ) |
| Annualized investment yield | | | | 4.4 | % | | | 5.7 | % | | | 3.9 | % | | | 5.5 | % | | (1.3 | ) | | (1.6 | ) |
| | | | | | | | | | | | | | | | | | | | | | | | |
| Loss ratio | | | | 60.7 | % | | | 49.6 | % | | | 56.3 | % | | | 52.6 | % | | 11.1 | | | 3.7 | |
GAAP | Acquisition expense ratio | | | | 16.7 | % | | | 17.7 | % | | | 18.2 | % | | | 17.8 | % | | (1.0 | ) | | 0.4 | |
| General and administrative expense ratio | | | | 11.6 | % | | | 11.7 | % | | | 12.4 | % | | | 12.3 | % | | (0.1 | ) | | 0.1 | |
| | |
|
|
|
| |
|
| |
|
|
|
| |
|
| |
|
| |
|
| |
| Combined ratio | | | | 89.0 | % | | | 79.0 | % | | | 86.9 | % | | | 82.7 | % | | 10.0 | | | 4.2 | |
STAT | Acquisition expense ratio | | | | 18.2 | % | | | 19.1 | % | | | 15.1 | % | | | 17.4 | % | | (0.9 | ) | | (2.3 | ) |
| General and administrative expense ratio | | | | 12.5 | % | | | 10.8 | % | | | 9.7 | % | | | 9.9 | % | | 1.7 | | | (0.2 | ) |
| | |
|
|
|
| |
|
| |
|
|
|
| |
|
| |
|
| |
|
| |
| Combined ratio | | | | 91.4 | % | | | 79.5 | % | | | 81.1 | % | | | 79.9 | % | | 11.9 | | | 1.2 | |
| | | | | | | | | | | | | | | | | | | | | | | | |
| |
|
|
[a] | Operating income represents after-tax operational results excluding, as applicable, after-tax net realized capital gains or losses and after-tax net foreign exchange gains or losses. Please see page 31 for a reconciliation to net income. |
| |
[b] | For detailed calculations please refer to page 33. |
| |
[c] | Average common equity is calculated as the arithmetic average of the beginning and ending common equity balances for the stated periods, which excludes the $200 million liquidation value of the preferred shares. |
1
ENDURANCE SPECIALTY HOLDINGS LTD.
CONSOLIDATED STATEMENTS OF INCOME - QUARTERLY
| | | | | | | | | | | | | | | | | | | | | | | | | | | | | | | |
| | QUARTER ENDED | |
| |
| |
| | JUNE 30, 2008 | | MAR. 31, 2008 | | DEC. 31, 2007 | | SEPT. 30, 2007 | | JUNE 30, 2007 | | JUNE 30, 2006 | |
| |
| |
| |
| |
| |
| |
| |
UNDERWRITING REVENUES | | | | | | | | | | | | | | | | | | | |
Gross premiums written | | | $ | 518,063 | | | | $ | 868,591 | | | | $ | 277,750 | | | | $ | 423,271 | | | | $ | 506,803 | | | | $ | 451,253 | | |
Premiums ceded | | | | (48,678 | ) | | | | (227,804 | ) | | | | (62,282 | ) | | | | (45,655 | ) | | | | (58,577 | ) | | | | (42,575 | ) | |
| | |
|
| | | |
|
| | | |
|
| | | |
|
| | | |
|
| | | |
|
| | |
Net premiums written | | | $ | 469,385 | | | | $ | 640,787 | | | | $ | 215,468 | | | | $ | 377,616 | | | | $ | 448,226 | | | | $ | 408,678 | | |
Change in unearned premiums | | | | (16,300 | ) | | | | (268,744 | ) | | | | 184,994 | | | | | 22,126 | | | | | (30,675 | ) | | | | (2,000 | ) | |
| | |
|
| | | |
|
| | | |
|
| | | |
|
| | | |
|
| | | |
|
| | |
Net premiums earned | | | $ | 453,085 | | | | $ | 372,043 | | | | $ | 400,462 | | | | $ | 399,742 | | | | $ | 417,551 | | | | $ | 406,678 | | |
Other underwriting income (loss) | | | | 1,933 | | | | | (740 | ) | | | | 9,044 | | | | | 1,697 | | | | | (3,203 | ) | | | | (1,992 | ) | |
| | |
|
| | | |
|
| | | |
|
| | | |
|
| | | |
|
| | | |
|
| | |
Total underwriting revenues | | | $ | 455,018 | | | | $ | 371,303 | | | | $ | 409,506 | | | | $ | 401,439 | | | | $ | 414,348 | | | | $ | 404,686 | | |
| | |
|
| | | |
|
| | | |
|
| | | |
|
| | | |
|
| | | |
|
| | |
UNDERWRITING EXPENSES | | | | | | | | | | | | | | | | | | | | | | | | | | | | | | | |
Losses and loss expenses | | | $ | 275,325 | | | | $ | 189,502 | | | | $ | 144,852 | | | | $ | 186,456 | | | | $ | 207,179 | | | | $ | 269,445 | | |
Acquisition expenses | | | | 75,636 | | | | | 74,374 | | | | | 89,501 | | | | | 76,604 | | | | | 73,941 | | | | | 79,197 | | |
General and administrative expenses | | | | 52,493 | | | | | 50,044 | | | | | 64,655 | | | | | 55,121 | | | | | 48,664 | | | | | 46,068 | | |
| | |
|
| | | |
|
| | | |
|
| | | |
|
| | | |
|
| | | |
|
| | |
Total underwriting expenses | | | $ | 403,454 | | | | $ | 313,920 | | | | $ | 299,008 | | | | $ | 318,181 | | | | $ | 329,784 | | | | $ | 394,710 | | |
| | |
|
| | | |
|
| | | |
|
| | | |
|
| | | |
|
| | | |
|
| | |
Underwriting income | | | $ | 51,564 | | | | $ | 57,383 | | | | $ | 110,498 | | | | $ | 83,258 | | | | $ | 84,564 | | | | $ | 9,976 | | |
| | |
|
| | | |
|
| | | |
|
| | | |
|
| | | |
|
| | | |
|
| | |
OTHER OPERATING REVENUE | | | | | | | | | | | | | | | | | | | | | | | | | | | | | | | |
Net investment income | | | $ | 60,482 | | | | $ | 46,878 | | | | $ | 65,310 | | | | $ | 62,605 | | | | $ | 78,548 | | | | $ | 60,291 | | |
Interest expense | | | | (7,534 | ) | | | | (7,534 | ) | | | | (7,532 | ) | | | | (7,533 | ) | | | | (7,531 | ) | | | | (7,459 | ) | |
Amortization of intangibles | | | | (2,637 | ) | | | | (2,688 | ) | | | | (1,905 | ) | | | | (1,127 | ) | | | | (1,127 | ) | | | | (1,158 | ) | |
| | |
|
| | | |
|
| | | |
|
| | | |
|
| | | |
|
| | | |
|
| | |
Total other operating revenue | | | $ | 50,311 | | | | $ | 36,656 | | | | $ | 55,873 | | | | $ | 53,945 | | | | $ | 69,890 | | | | $ | 51,674 | | |
| | |
|
| | | |
|
| | | |
|
| | | |
|
| | | |
|
| | | |
|
| | |
INCOME BEFORE OTHER ITEMS | | | $ | 101,875 | | | | $ | 94,039 | | | | $ | 166,371 | | | | $ | 137,203 | | | | $ | 154,454 | | | | $ | 61,650 | | |
| | | | | | | | | | | | | | | | | | | | | | | | | | | | | | | |
OTHER | | | | | | | | | | | | | | | | | | | | | | | | | | | | | | | |
Net foreign exchange gains (losses) | | | $ | 5,621 | | | | ($ | 3,107 | ) | | | ($ | 6,729 | ) | | | ($ | 700 | ) | | | $ | 2,072 | | | | $ | 11,997 | | |
Net realized losses on investments | | | | (4,013 | ) | | | | (11,484 | ) | | | | (4,125 | ) | | | | (3,055 | ) | | | | (9,038 | ) | | | | (8,729 | ) | |
Income tax expense | | | | (145 | ) | | | | (1,637 | ) | | | | (2,987 | ) | | | | (2,047 | ) | | | | (12,147 | ) | | | | (868 | ) | |
| | |
|
| | | |
|
| | | |
|
| | | |
|
| | | |
|
| | | |
|
| | |
NET INCOME | | | $ | 103,338 | | | | $ | 77,811 | | | | $ | 152,530 | | | | $ | 131,401 | | | | $ | 135,341 | | | | $ | 64,050 | | |
Preferred dividends | | | | (3,875 | ) | | | | (3,875 | ) | | | | (3,875 | ) | | | | (3,875 | ) | | | | (3,875 | ) | | | | (3,875 | ) | |
| | |
|
| | | |
|
| | | |
|
| | | |
|
| | | |
|
| | | |
|
| | |
NET INCOME AVAILABLE TO COMMON SHAREHOLDERS | | | $ | 99,463 | | | | $ | 73,936 | | | | $ | 148,655 | | | | $ | 127,526 | | | | $ | 131,466 | | | | $ | 60,175 | | |
| | |
|
| | | |
|
| | | | |
| | | |
|
| | | |
|
| | | | |
| | |
| | | | | | | | | | | | | | | | | | | | | | | | | | | | | | | |
KEY RATIOS/PER SHARE DATA | | | | | | | | | | | | | | | | | | | | | | | | | | | | | | | |
| | | | | | | | | | | | | | | | | | | | | | | | | | | | | | | |
Loss ratio | | | | 60.7 | % | | | | 50.9 | % | | | | 36.2 | % | | | | 46.6 | % | | | | 49.6 | % | | | | 66.3 | % | |
Acquisition expense ratio | | | | 16.7 | % | | | | 20.0 | % | | | | 22.3 | % | | | | 19.2 | % | | | | 17.7 | % | | | | 19.5 | % | |
General and administrative expense ratio | | | | 11.6 | % | | | | 13.5 | % | | | | 16.2 | % | | | | 13.8 | % | | | | 11.7 | % | | | | 11.3 | % | |
| | |
|
| | | |
|
| | | |
|
| | | |
|
| | | |
|
| | | |
|
| | |
Combined ratio | | | | 89.0 | % | | | | 84.4 | % | | | | 74.7 | % | | | | 79.6 | % | | | | 79.0 | % | | | | 97.1 | % | |
| | |
|
| | | |
|
| | | | |
| | | |
|
| | | |
|
| | | | |
| | |
| | | | | | | | | | | | | | | | | | | | | | | | | | | | | | | |
Weighted average basic shares outstanding | | | | 58,558 | | | | | 58,823 | | | | | 62,225 | | | | | 64,468 | | | | | 65,531 | | | | | 66,398 | | |
Weighted average dilutive shares outstanding | | | | 63,712 | | | | | 64,503 | | | | | 68,326 | | | | | 70,431 | | | | | 70,930 | | | | | 71,109 | | |
| | | | | | | | | | | | | | | | | | | | | | | | | | | | | | | |
Basic earnings per common share | | | $ | 1.70 | | | | $ | 1.26 | | | | $ | 2.39 | | | | $ | 1.98 | | | | $ | 2.01 | | | | $ | 0.91 | | |
Diluted earnings per common share | | | $ | 1.56 | | | | $ | 1.15 | | | | $ | 2.18 | | | | $ | 1.81 | | | | $ | 1.85 | | | | $ | 0.85 | | |
| | | | | | | | | | | | | | | | | | | | | | | | | | | | | | | |
ROAE, net income[a] | | | | 4.3 | % | | | | 3.2 | % | | | | 6.4 | % | | | | 5.7 | % | | | | 6.0 | % | | | | 3.5 | % | |
| |
|
|
[a] | Average common equity is calculated as the arithmetic average of the beginning and ending equity balances for the stated periods, which excludes the $200 million liquidation value of the preferred shares. |
2
ENDURANCE SPECIALTY HOLDINGS LTD.
CONSOLIDATED STATEMENTS OF INCOME - YTD
| | | | | | | | | | | | | | | | | | | | | | | | | | |
| | SIX MONTHS ENDED | | YEAR ENDED | |
| |
| |
| |
| | JUNE 30, 2008 | | JUNE 30, 2007 | | JUNE 30, 2006 | | DEC. 31, 2007 | | DEC. 31, 2006 | |
| |
| |
| |
| |
| |
| |
UNDERWRITING REVENUES | | | | | | | | | | | | | | | | | | | | | | | | | | |
Gross premiums written | | | $ | 1,386,654 | | | | $ | 1,080,094 | | | | $ | 1,022,634 | | | | $ | 1,781,115 | | | | $ | 1,789,642 | | |
Premiums ceded | | | | (276,482 | ) | | | | (98,203 | ) | | | | (70,947 | ) | | | | (206,140 | ) | | | | (204,078 | ) | |
| | |
|
| | | |
|
| | | |
|
| | | |
|
| | | |
|
| | |
Net premiums written | | | $ | 1,110,172 | | | | $ | 981,891 | | | | $ | 951,687 | | | | $ | 1,574,975 | | | | $ | 1,585,564 | | |
Change in unearned premiums | | | | (285,044 | ) | | | | (187,295 | ) | | | | (124,803 | ) | | | | 19,825 | | | | | 53,010 | | |
| | |
|
| | | |
|
| | | |
|
| | | |
|
| | | |
|
| | |
Net premiums earned | | | $ | 825,128 | | | | $ | 794,596 | | | | $ | 826,884 | | | | $ | 1,594,800 | | | | $ | 1,638,574 | | |
Other underwriting income (loss) | | | | 1,193 | | | | | (9,139 | ) | | | | 1,509 | | | | | 1,602 | | | | | 1,390 | | |
| | |
|
| | | |
|
| | | |
|
| | | |
|
| | | |
|
| | |
Total underwriting revenues | | | $ | 826,321 | | | | $ | 785,457 | | | | $ | 828,393 | | | | $ | 1,596,402 | | | | $ | 1,639,964 | | |
| | |
|
| | | |
|
| | | |
|
| | | |
|
| | | |
|
| | |
UNDERWRITING EXPENSES | | | | | | | | | | | | | | | | | | | | | | | | | | |
Losses and loss expenses | | | $ | 464,827 | | | | $ | 417,773 | | | | $ | 508,177 | | | | $ | 749,081 | | | | $ | 827,630 | | |
Acquisition expenses | | | | 150,010 | | | | | 141,471 | | | | | 154,445 | | | | | 307,576 | | | | | 317,489 | | |
General and administrative expenses | | | | 102,537 | | | | | 97,493 | | | | | 89,959 | | | | | 217,269 | | | | | 190,373 | | |
| | |
|
| | | |
|
| | | |
|
| | | |
|
| | | |
|
| | |
Total underwriting expenses | | | $ | 717,374 | | | | $ | 656,737 | | | | $ | 752,581 | | | | $ | 1,273,926 | | | | $ | 1,335,492 | | |
| | |
|
| | | |
|
| | | |
|
| | | |
|
| | | |
|
| | |
Underwriting income | | | $ | 108,947 | | | | $ | 128,720 | | | | $ | 75,812 | | | | $ | 322,476 | | | | $ | 304,472 | | |
| | |
|
| | | |
|
| | | |
|
| | | |
|
| | | |
|
| | |
OTHER OPERATING REVENUE | | | | | | | | | | | | | | | | | | | | | | | | | | |
Net investment income | | | $ | 107,360 | | | | $ | 153,361 | | | | $ | 121,835 | | | | $ | 281,276 | | | | $ | 257,449 | | |
Interest expense | | | | (15,068 | ) | | | | (15,060 | ) | | | | (14,985 | ) | | | | (30,125 | ) | | | | (30,041 | ) | |
Amortization of intangibles | | | | (5,325 | ) | | | | (2,254 | ) | | | | (2,316 | ) | | | | (5,286 | ) | | | | (4,600 | ) | |
| | |
|
| | | |
|
| | | |
|
| | | |
|
| | | |
|
| | |
Total other operating revenue | | | $ | 86,967 | | | | $ | 136,047 | | | | $ | 104,534 | | | | $ | 245,865 | | | | $ | 222,808 | | |
| | |
|
| | | |
|
| | | |
|
| | | |
|
| | | |
|
| | |
INCOME BEFORE OTHER ITEMS | | | $ | 195,914 | | | | $ | 264,767 | | | | $ | 180,346 | | | | $ | 568,341 | | | | $ | 527,280 | | |
|
OTHER | | | | | | | | | | | | | | | | | | | | | | | | | | |
Net foreign exchange gains (losses) | | | $ | 2,514 | | | | ($ | 541 | ) | | | $ | 14,883 | | | | ($ | 7,970 | ) | | | $ | 21,021 | | |
Net realized losses on investments | | | | (15,497 | ) | | | | (11,122 | ) | | | | (12,059 | ) | | | | (18,302 | ) | | | | (20,342 | ) | |
Income tax expense | | | | (1,782 | ) | | | | (15,928 | ) | | | | (12,084 | ) | | | | (20,962 | ) | | | | (29,833 | ) | |
| | |
|
| | | |
|
| | | |
|
| | | |
|
| | | |
|
| | |
NET INCOME | | | $ | 181,149 | | | | $ | 237,176 | | | | $ | 171,086 | | | | $ | 521,107 | | | | $ | 498,126 | | |
Preferred dividends | | | | (7,750 | ) | | | | (7,750 | ) | | | | (7,750 | ) | | | | (15,500 | ) | | | | (15,500 | ) | |
| | |
|
| | | |
|
| | | |
|
| | | |
|
| | | |
|
| | |
NET INCOME AVAILABLE TO COMMON SHAREHOLDERS | | | $ | 173,399 | | | | $ | 229,426 | | | | $ | 163,336 | | | | $ | 505,607 | | | | $ | 482,626 | | |
| | |
|
| | | |
|
| | | |
|
| | | |
|
| | | |
|
| | |
| | | | | | | | | | | | | | | | | | | | | | | | | | |
KEY RATIOS/PER SHARE DATA | | | | | | | | | | | | | | | | | | | | | | | | | | |
Loss ratio | | | | 56.3 | % | | | | 52.6 | % | | | | 61.5 | % | | | | 47.0 | % | | | | 50.5 | % | |
Acquisition expense ratio | | | | 18.2 | % | | | | 17.8 | % | | | | 18.7 | % | | | | 19.3 | % | | | | 19.4 | % | |
General and administrative expense ratio | | | | 12.4 | % | | | | 12.3 | % | | | | 10.9 | % | | | | 13.6 | % | | | | 11.6 | % | |
| | |
|
| | | |
|
| | | |
|
| | | |
|
| | | |
|
| | |
Combined ratio | | | | 86.9 | % | | | | 82.7 | % | | | | 91.1 | % | | | | 79.9 | % | | | | 81.5 | % | |
| | |
|
| | | |
|
| | | |
|
| | | |
|
| | | |
|
| | |
| | | | | | | | | | | | | | | | | | | | | | | | | | |
Weighted average basic shares outstanding | | | | 58,691 | | | | | 66,069 | | | | | 66,421 | | | | | 64,697 | | | | | 66,436 | | |
Weighted average dilutive shares outstanding | | | | 64,196 | | | | | 71,294 | | | | | 71,243 | | | | | 70,540 | | | | | 71,755 | | |
|
Basic earnings per common share | | | $ | 2.95 | | | | $ | 3.47 | | | | $ | 2.46 | | | | $ | 7.82 | | | | $ | 7.26 | | |
Diluted earnings per common share | | | $ | 2.70 | | | | $ | 3.22 | | | | $ | 2.29 | | | | $ | 7.17 | | | | $ | 6.73 | | |
|
ROAE, net income [a] | | | | 7.5 | % | | | | 10.7 | % | | | | 9.6 | % | | | | 22.9 | % | | | | 25.6 | % | |
| | | | | | | | | | | | | | | | | | | | | | | | | | |
| |
|
|
| |
[a] | Average common equity is calculated as the arithmetic average of the beginning and ending equity balances for the stated periods, which excludes the $200 million liquidation value of the preferred shares. |
3
ENDURANCE SPECIALTY HOLDINGS LTD.
CONSOLIDATED BALANCE SHEETS
| | | | | | | | | | | | | | | | | | | | | | | | | | | | | | | |
| | | | | | | | | | | | | | | | | | | |
| | JUNE 30, 2008 | | MAR. 31, 2008 | | DEC. 31, 2007 | | SEPT. 30, 2007 | | JUNE 30, 2007 | | MAR. 31, 2007 | |
| |
| |
| |
| |
| |
| |
| |
ASSETS | | | | | | | | | | | | | | | | | | | | | | | | | | | | | | | |
Cash and cash equivalents | | | $ | 656,158 | | | | $ | 549,692 | | | | $ | 567,825 | | | | $ | 600,042 | | | | $ | 625,662 | | | | $ | 518,800 | | |
Fixed maturity investments available for sale, at fair value | | | | 4,604,653 | | | | | 4,710,467 | | | | | 4,660,236 | | | | | 4,803,808 | | | | | 4,728,942 | | | | | 4,838,405 | | |
Other investments | | | | 366,886 | | | | | 369,347 | | | | | 358,128 | | | | | 343,926 | | | | | 281,241 | | | | | 267,721 | | |
Premiums receivable, net | | | | 1,101,610 | | | | | 1,088,998 | | | | | 723,832 | | | | | 768,162 | | | | | 839,106 | | | | | 808,064 | | |
Deferred acquisition costs | | | | 194,390 | | | | | 184,646 | | | | | 168,968 | | | | | 212,000 | | | | | 198,537 | | | | | 186,374 | | |
Securities lending collateral | | | | 153,062 | | | | | 241,343 | | | | | 173,041 | | | | | 195,727 | | | | | 173,884 | | | | | 217,698 | | |
Prepaid reinsurance premiums | | | | 205,454 | | | | | 268,442 | | | | | 122,594 | | | | | 92,466 | | | | | 99,446 | | | | | 92,722 | | |
Losses recoverable | | | | 270,053 | | | | | 150,665 | | | | | 187,354 | | | | | 96,008 | | | | | 66,377 | | | | | 55,579 | | |
Accrued investment income | | | | 37,930 | | | | | 33,650 | | | | | 38,543 | | | | | 36,075 | | | | | 40,443 | | | | | 36,792 | | |
Goodwill and intangible assets | | | | 205,635 | | | | | 208,202 | | | | | 206,632 | | | | | 69,388 | | | | | 70,456 | | | | | 69,415 | | |
Deferred tax assets | | | | 14,788 | | | | | 17,702 | | | | | — | | | | | 46,926 | | | | | 57,993 | | | | | 61,385 | | |
Receivable on pending investment sales, net | | | | — | | | | | 1,427 | | | | | 2,783 | | | | | 53,061 | | | | | — | | | | | — | | |
Other assets | | | | 73,667 | | | | | 50,630 | | | | | 60,791 | | | | | 50,852 | | | | | 43,760 | | | | | 37,508 | | |
| | |
|
| | | |
|
| | | |
|
| | | |
|
| | | |
|
| | | |
|
| | |
TOTAL ASSETS | | | $ | 7,884,286 | | | | $ | 7,875,211 | | | | $ | 7,270,727 | | | | $ | 7,368,441 | | | | $ | 7,225,847 | | | | $ | 7,190,463 | | |
| | |
|
| | | |
|
| | | |
|
| | | |
|
| | | |
|
| | | |
|
| | |
| | | | | | | | | | | | | | | | | | | | | | | | | | | | | | | |
LIABILITIES | | | | | | | | | | | | | | | | | | | | | | | | | | | | | | | |
Reserve for losses and loss expenses | | | $ | 3,080,274 | | | | $ | 2,928,427 | | | | $ | 2,892,224 | | | | $ | 2,841,810 | | | | $ | 2,767,525 | | | | $ | 2,790,183 | | |
Reserve for unearned premiums | | | | 1,222,830 | | | | | 1,269,318 | | | | | 855,085 | | | | | 999,046 | | | | | 1,027,229 | | | | | 987,748 | | |
Deposit liabilities | | | | 89,718 | | | | | 105,115 | | | | | 108,943 | | | | | 130,272 | | | | | 143,073 | | | | | 155,380 | | |
Reinsurance balances payable | | | | 272,901 | | | | | 224,223 | | | | | 162,899 | | | | | 153,815 | | | | | 194,012 | | | | | 147,745 | | |
Securities lending payable | | | | 153,062 | | | | | 241,343 | | | | | 173,041 | | | | | 195,727 | | | | | 173,884 | | | | | 217,698 | | |
Debt | | | | 448,793 | | | | | 448,978 | | | | | 448,753 | | | | | 447,235 | | | | | 447,213 | | | | | 447,192 | | |
Investments pending settlement, net | | | | — | | | | | — | | | | | — | | | | | — | | | | | 31,767 | | | | | 14,448 | | |
Deferred tax liability | | | | — | | | | | — | | | | | 922 | | | | | — | | | | | — | | | | | — | | |
Other liabilities | | | | 82,813 | | | | | 119,633 | | | | | 116,601 | | | | | 74,915 | | | | | 61,298 | | | | | 63,523 | | |
| | |
|
| | | |
|
| | | |
|
| | | |
|
| | | |
|
| | | |
|
| | |
TOTAL LIABILITIES | | | $ | 5,350,391 | | | | $ | 5,337,037 | | | | $ | 4,758,468 | | | | $ | 4,842,820 | | | | $ | 4,846,001 | | | | $ | 4,823,917 | | |
| | |
|
| | | |
|
| | | |
|
| | | |
|
| | | |
|
| | | |
|
| | |
SHAREHOLDERS’ EQUITY | | | | | | | | | | | | | | | | | | | | | | | | | | | | | | | |
Preferred shares Series A, non-cumulative | | | $ | 8,000 | | | | $ | 8,000 | | | | $ | 8,000 | | | | $ | 8,000 | | | | $ | 8,000 | | | | $ | 8,000 | | |
Common shares | | | | 59,642 | | | | | 60,098 | | | | | 60,364 | | | | | 64,081 | | | | | 64,591 | | | | | 65,968 | | |
Additional paid-in capital | | | | 1,107,219 | | | | | 1,127,594 | | | | | 1,165,300 | | | | | 1,355,468 | | | | | 1,378,685 | | | | | 1,431,623 | | |
Accumulated other comprehensive (loss) income | | | | (5,282 | ) | | | | 62,705 | | | | | 57,725 | | | | | 10,652 | | | | | (47,525 | ) | | | | (131 | ) | |
Retained earnings | | | | 1,364,316 | | | | | 1,279,777 | | | | | 1,220,870 | | | | | 1,087,420 | | | | | 976,095 | | | | | 861,086 | | |
| | |
|
| | | |
|
| | | |
|
| | | |
|
| | | |
|
| | | |
|
| | |
TOTAL SHAREHOLDERS’ EQUITY | | | $ | 2,533,895 | | | | $ | 2,538,174 | | | | $ | 2,512,259 | | | | $ | 2,525,621 | | | | $ | 2,379,846 | | | | $ | 2,366,546 | | |
| | |
|
| | | |
|
| | | |
|
| | | |
|
| | | |
|
| | | |
|
| | |
TOTAL LIABILITIES AND SHAREHOLDERS’ EQUITY | | | $ | 7,884,286 | | | | $ | 7,875,211 | | | | $ | 7,270,727 | | | | $ | 7,368,441 | | | | $ | 7,225,847 | | | | $ | 7,190,463 | | |
| | |
|
| | | |
|
| | | |
|
| | | |
|
| | | |
|
| | | |
|
| | |
|
Book value per common share | | | $ | 39.97 | | | | $ | 39.83 | | | | $ | 38.94 | | | | $ | 36.21 | | | | $ | 33.67 | | | | $ | 32.77 | | |
Diluted book value per common share (treasury stock method) | | | $ | 36.72 | | | | $ | 36.00 | | | | $ | 35.05 | | | | $ | 32.81 | | | | $ | 30.56 | | | | $ | 30.19 | | |
| | | | | | | | | | | | | | | | | | | | | | | | | | | | | | | |
RATIOS | | | | | | | | | | | | | | | | | | | | | | | | | | | | | | | |
Debt-to-capital | | | | 15.0 | % | | | | 15.0 | % | | | | 15.2 | % | | | | 15.0 | % | | | | 15.8 | % | | | | 15.9 | % | |
4
ENDURANCE SPECIALTY HOLDINGS LTD.
Annual Aggregate Risk Curve
Endurance Operating Income Profile
as of July 1, 2008
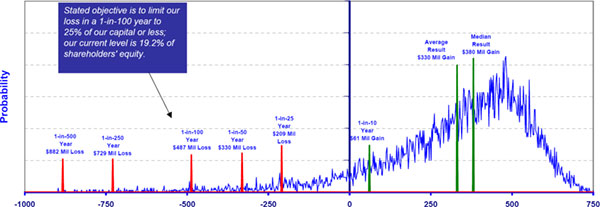
Operating Result - $ Millions
The above chart represents a cumulative analysis of our in-force underwriting portfolio on a full year basis based on thousands of potential scenarios. Loss years are driven largely by the occurrence of natural catastrophes and incorrect pricing of other property and casualty exposures. The operating income depicted includes net premiums earned plus net investment income, acquisition expenses and G&A expenses. The operating income depicted excludes the effects of income tax (expenses) benefits, amortization of intangibles and interest expense. Forecasted investment income, acquisition and G&A expenses are held constant across all scenarios. Losses included above are net of reinsurance. Our stated objective is to maintain a risk management tolerance that limits our loss in a 1-in-100 year year to be no more than 25% of our shareholders' equity.
Changes in Endurance’s underwriting portfolio, investment portfolio, risk control mechanisms, market conditions and other factors may cause actual results to vary considerably from those indicated by our value at risk curve. For a listing of risks related to Endurance and its future performance, please see “Risk Factors” in our Annual Report on Form 10-K for the year ended December 31, 2007.
5
ENDURANCE SPECIALTY HOLDINGS LTD.
Annual Aggregate Risk Curve
Annual Aggregate Risk Curve Comparison
| | | | | | | | | | | | | | | | | | | | |
| | | | | | | | Change from July 1, 2007 - June 30,
2008 to July 1, 2008 - June 30, 2009 | | Change from Jan. 1, 2008 - Dec. 31,
2008 to July 1, 2008 - June 30, 2009 | |
| | | | | | | |
| |
| |
(in millions) | | July 1, 2007 -
June 30, 2008 | | Jan. 1, 2008 -
Dec. 31, 2008 | | July 1, 2008 -
June 30, 2009 | | $
Change | | %
Change | | $
Change | | %
Change | |
| |
| |
| |
| |
| |
| |
| |
| |
| | | | | | | | | | | | | | | | | | | | |
Median Result | | $ | 391 | | $ | 481 | | $ | 380 | | ($ | 11 | ) | (2.9 | %) | ($ | 101 | ) | (26.6 | %) |
Average Result | | | 342 | | | 421 | | | 330 | | | (12 | ) | (3.6 | %) | | (91 | ) | (27.6 | %) |
| | | | | | | | | | | | | | | | | | | | |
1 in 10 year annual gain | | | 64 | | | 34 | | | 61 | | | (3 | ) | (4.9 | %) | | 27 | | 44.3 | % |
1 in 25 year annual loss | | | (141 | ) | | (121 | ) | | (209 | ) | | (68 | ) | 32.5 | % | | (88 | ) | 42.1 | % |
1 in 50 year annual loss | | | (319 | ) | | (248 | ) | | (330 | ) | | (11 | ) | 3.3 | % | | (82 | ) | 24.8 | % |
1 in 100 year annual loss | | | (468 | ) | | (438 | ) | | (487 | ) | | (19 | ) | 3.9 | % | | (49 | ) | 10.1 | % |
1 in 250 year annual loss | | | (694 | ) | | (659 | ) | | (729 | ) | | (35 | ) | 4.8 | % | | (70 | ) | 9.6 | % |
1 in 500 year annual loss | | | (884 | ) | | (775 | ) | | (882 | ) | | 2 | | (0.2 | %) | | (107 | ) | 12.1 | % |
Changes in Endurance’s underwriting portfolio, investment portfolio, risk control mechanisms, market conditions and other factors may cause actual results to vary considerably from those indicated by our value at risk curve. For a listing of risks related to Endurance and its future performance, please see “Risk Factors” in our Annual Report on Form 10-K for the year ended December 31, 2007.
6
ENDURANCE SPECIALTY HOLDINGS LTD.
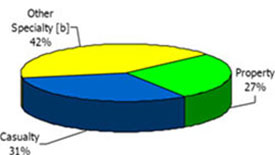
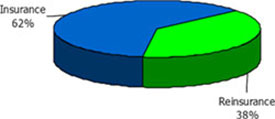
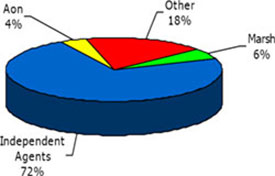
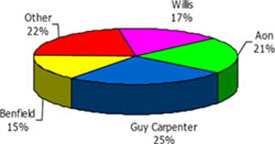
SEGMENT DISTRIBUTION
FOR THE SIX MONTHS ENDED JUNE 30, 2008
| | |
Gross Premiums Written = $1,389 million [a] |
|
| | |
Source of Business | | Business Segments |
| | |
| | 
|
| | |
Broker Distribution - Insurance | | Broker Distribution - Reinsurance |
| | |
| | 
|
| |
|
|
| |
[a] | Prior to deposit accounting adjustments. |
| |
[b] | Other specialty includes the agriculture line in the Insurance segment and agriculture, marine, aerospace and surety and other in the Reinsurance segment. |
7
ENDURANCE SPECIALTY HOLDINGS LTD.
CONSOLIDATED SEGMENT DATA
FOR THE QUARTER ENDED JUNE 30, 2008
| | | | | | | | | | | | | | | | | | | | | | | | | | |
| | Insurance | | Reinsurance | | Total
Company
Sub-total | | Deposit
Accounting
Adjustment [a] | | Reported
Totals | |
| |
| |
| |
| |
| |
| |
UNDERWRITING REVENUES | | | | | | | | | | | | | | | | |
Gross premiums written | | | $ | 271,973 | | | | $ | 246,386 | | | | $ | 518,359 | | | | ($ | 296 | ) | | | $ | 518,063 | | |
| | |
|
| | | |
|
| | | |
|
| | | |
|
| | | |
|
| | |
Net premiums written | | | $ | 234,390 | | | | $ | 235,291 | | | | $ | 469,681 | | | | ($ | 296 | ) | | | $ | 469,385 | | |
| | |
|
| | | |
|
| | | |
|
| | | |
|
| | | |
|
| | |
Net premiums earned | | | $ | 245,383 | | | | $ | 210,001 | | | | $ | 455,384 | | | | ($ | 2,299 | ) | | | $ | 453,085 | | |
Other underwriting income | | | | — | | | | | — | | | | | — | | | | | 1,933 | | | | | 1,933 | | |
| | |
|
| | | |
|
| | | |
|
| | | |
|
| | | |
|
| | |
Total underwriting revenues | | | $ | 245,383 | | | | $ | 210,001 | | | | $ | 455,384 | | | | ($ | 366 | ) | | | $ | 455,018 | | |
| | |
|
| | | |
|
| | | |
|
| | | |
|
| | | |
|
| | |
| | | | | | | | | | | | | | | | | | | | | | | | | | |
UNDERWRITING EXPENSES | | | | | | | | | | | | | | | | | | | | | | | | | | |
Losses and loss expenses | | | $ | 188,171 | | | | $ | 86,737 | | | | $ | 274,908 | | | | $ | 417 | | | | $ | 275,325 | | |
Acquisition expenses | | | | 29,000 | | | | | 47,499 | | | | | 76,499 | | | | | (863 | ) | | | | 75,636 | | |
General and administrative expenses | | | | 25,071 | | | | | 27,422 | | | | | 52,493 | | | | | — | | | | | 52,493 | | |
| | |
|
| | | |
|
| | | |
|
| | | |
|
| | | |
|
| | |
Total expenses | | | $ | 242,242 | | | | $ | 161,658 | | | | $ | 403,900 | | | | ($ | 446 | ) | | | $ | 403,454 | | |
| | |
|
| | | |
|
| | | |
|
| | | |
|
| | | |
|
| | |
| | | | | | | | | | | | | | | | | | | | | | | | | | |
UNDERWRITING INCOME | | | $ | 3,141 | | | | $ | 48,343 | | | | $ | 51,484 | | | | $ | 80 | | | | $ | 51,564 | | |
| | |
|
| | | |
|
| | | |
|
| | | |
|
| | | |
|
| | |
| | | | | | | | | | | | | | | | | | | | | | | | | | |
GAAP RATIOS | | | | | | | | | | | | | | | | | | | | | | | | | | |
Loss ratio | | | | 76.7 | % | | | | 41.3 | % | | | | 60.4 | % | | | | | | | | | 60.7 | % | |
Acquisition expense ratio | | | | 11.8 | % | | | | 22.6 | % | | | | 16.8 | % | | | | | | | | | 16.7 | % | |
General and administrative expense ratio | | | | 10.2 | % | | | | 13.1 | % | | | | 11.5 | % | | | | | | | | | 11.6 | % | |
| | |
|
| | | |
|
| | | |
|
| | | | | | | | |
|
| | |
Combined ratio | | | | 98.7 | % | | | | 77.0 | % | | | | 88.7 | % | | | | | | | | | 89.0 | % | |
| | |
|
| | | |
|
| | | |
|
| | | | | | | | |
|
| | |
| | | | | | | | | | | | | | | | | | | | | | | | | | |
STATUTORY RATIOS | | | | | | | | | | | | | | | | | | | | | | | | | | |
Loss ratio | | | | 76.7 | % | | | | 41.3 | % | | | | 60.4 | % | | | | | | | | | 60.7 | % | |
Acquisition expense ratio | | | | 13.8 | % | | | | 22.6 | % | | | | 18.2 | % | | | | | | | | | 18.2 | % | |
General and administrative expense ratio | | | | 13.4 | % | | | | 11.7 | % | | | | 12.5 | % | | | | | | | | | 12.5 | % | |
| | |
|
| | | |
|
| | | |
|
| | | | | | | | |
|
| | |
Combined ratio | | | | 103.9 | % | | | | 75.6 | % | | | | 91.1 | % | | | | | | | | | 91.4 | % | |
| | |
|
| | | |
|
| | | |
|
| | | | | | | | |
|
| | |
| |
[a] | For internal management reporting purposes, underwriting results by segment are presented on the basis of applying reinsurance accounting to all reinsurance contracts written. However, for financial statement presentation purposes, management determined that certain reinsurance contracts written during the period were more appropriately accounted for under the deposit method of accounting specified by AICPA SOP 98-7 whereby net premiums due on such contracts were recorded as deposit liabilities. The adjustment herein reconciles the Company’s underwriting results by segment to the Company’s financial statement presentation. |
8
ENDURANCE SPECIALTY HOLDINGS LTD.
CONSOLIDATED FINANCIAL RATIOS
FOR THE QUARTER ENDED JUNE 30, 2008
| | | | | | | | | | | | | | | | |
| | Insurance | | Reinsurance | | Total
Company
Sub-total | | Deposit
Accounting
Adjustment [a] | | Reported
Totals | |
| |
|
| |
|
| |
|
| |
|
| |
|
| |
AS REPORTED | | | | | | | | | | | | | | | | |
| | | | | | | | | | | | | | | | |
GAAP RATIOS | | | | | | | | | | | | | | | | |
Loss ratio | | | 76.7 | % | | 41.3 | % | | 60.4 | % | | | | | 60.7 | % |
Acquisition expense ratio | | | 11.8 | % | | 22.6 | % | | 16.8 | % | | | | | 16.7 | % |
General and administrative expense ratio | | | 10.2 | % | | 13.1 | % | | 11.5 | % | | | | | 11.6 | % |
| |
|
| |
|
| |
|
| |
|
| |
|
| |
Combined ratio | | | 98.7 | % | | 77.0 | % | | 88.7 | % | | NM | | | 89.0 | % |
| |
|
| |
|
| |
|
| |
|
| |
|
| |
| | | | | | | | | | | | | | | | |
EFFECT OF PRIOR ACCIDENT YEAR RESERVE DEVELOPMENT
FAVORABLE / (UNFAVORABLE) | | | | | | | | | | |
| | | | | | | | | | | | | | | | |
GAAP RATIOS | | | | | | | | | | | | | | | | |
Loss ratio | | | 10.4 | % | | 15.7 | % | | 12.9 | % | | NM | | | 12.4 | % |
| |
|
| |
|
| |
|
| |
|
| |
|
| |
| | | | | | | | | | | | | | | | |
NET OF PRIOR ACCIDENT YEAR RESERVE DEVELOPMENT | | | | | | | | | | |
| | | | | | | | | | | | | | | | |
GAAP RATIOS | | | | | | | | | | | | | | | | |
Loss ratio | | | 87.1 | % | | 57.0 | % | | 73.3 | % | | | | | 73.1 | % |
Acquisition expense ratio | | | 11.8 | % | | 22.6 | % | | 16.8 | % | | | | | 16.7 | % |
General and administrative expense ratio | | | 10.2 | % | | 13.1 | % | | 11.5 | % | | | | | 11.6 | % |
| |
|
| |
|
| |
|
| |
|
| |
|
| |
Combined ratio | | | 109.1 | % | | 92.7 | % | | 101.6 | % | | NM | | | 101.4 | % |
| |
|
| |
|
| |
|
| |
|
| |
|
| |
| |
[a] | For internal management reporting purposes, underwriting results by segment are presented on the basis of applying reinsurance accounting to all reinsurance contracts written. However, for financial statement presentation purposes, management determined that certain reinsurance contracts written during the period were more appropriately accounted for under the deposit method of accounting specified by AICPA SOP 98-7 whereby net premiums due on such contracts were recorded as deposit liabilities. The adjustment herein reconciles the Company’s loss ratio by segment to the Company’s financial statement presentation. |
9
ENDURANCE SPECIALTY HOLDINGS LTD.
INSURANCE SEGMENT DATA
| | | | | | | | | | | | | | | | | | | | | | | | | | | | | | | |
| | FOR THE QUARTERS ENDED | |
| |
| |
| | JUNE 30, 2008 | | MAR. 31, 2008 | | DEC. 31, 2007 | | SEPT. 30, 2007 | | JUNE 30, 2007 | | JUNE 30, 2006 | |
| |
| |
| |
| |
| |
| |
| |
UNDERWRITING REVENUES | | | | | | | | | | | | | | | | | | | | | | | | | | | | | | | |
Gross premiums written | | | $ | 271,973 | | | | $ | 585,134 | | | | $ | 216,510 | | | | $ | 180,046 | | | | $ | 197,967 | | | | $ | 159,223 | | |
| | |
|
| | | |
|
| | | |
|
| | | |
|
| | | |
|
| | | |
|
| | |
Net premiums written | | | $ | 234,390 | | | | $ | 356,141 | | | | $ | 154,476 | | | | $ | 137,404 | | | | $ | 152,000 | | | | $ | 123,181 | | |
| | |
|
| | | |
|
| | | |
|
| | | |
|
| | | |
|
| | | |
|
| | |
Net premiums earned | | | $ | 245,383 | | | | $ | 167,982 | | | | $ | 137,060 | | | | $ | 130,640 | | | | $ | 124,057 | | | | $ | 88,353 | | |
| | |
|
| | | |
|
| | | |
|
| | | |
|
| | | |
|
| | | |
|
| | |
| | | | | | | | | | | | | | | | | | | | | | | | | | | | | | | |
UNDERWRITING EXPENSES | | | | | | | | | | | | | | | | | | | | | | | | | | | | | | | |
Losses and loss expenses | | | $ | 188,171 | | | | $ | 130,950 | | | | $ | 93,553 | | | | $ | 69,709 | | | | $ | 63,422 | | | | $ | 70,168 | | |
Acquisition expenses | | | | 29,000 | | | | | 23,117 | | | | | 22,145 | | | | | 19,542 | | | | | 16,528 | | | | | 6,532 | | |
General and administrative expenses | | | | 25,071 | | | | | 20,561 | | | | | 27,200 | | | | | 21,988 | | | | | 18,592 | | | | | 13,823 | | |
| | |
|
| | | |
|
| | | |
|
| | | |
|
| | | |
|
| | | |
|
| | |
Total expenses | | | $ | 242,242 | | | | $ | 174,628 | | | | $ | 142,898 | | | | $ | 111,239 | | | | $ | 98,542 | | | | $ | 90,523 | | |
| | |
|
| | | |
|
| | | |
|
| | | |
|
| | | |
|
| | | |
|
| | |
| | | | | | | | | | | | | | | | | | | | | | | | | | | | | | | |
UNDERWRITING INCOME (LOSS) | | | $ | 3,141 | | | | ($ | 6,646 | ) | | | ($ | 5,838 | ) | | | $ | 19,401 | | | | $ | 25,515 | | | | ($ | 2,170 | ) | |
| | |
|
| | | |
|
| | | |
|
| | | |
|
| | | |
|
| | | |
|
| | |
| | | | | | | | | | | | | | | | | | | | | | | | | | | | | | | |
GAAP RATIOS | | | | | | | | | | | | | | | | | | | | | | | | | | | | | | | |
Loss ratio | | | | 76.7 | % | | | | 78.0 | % | | | | 68.3 | % | | | | 53.4 | % | | | | 51.1 | % | | | | 79.4 | % | |
Acquisition expense ratio | | | | 11.8 | % | | | | 13.8 | % | | | | 16.2 | % | | | | 14.9 | % | | | | 13.3 | % | | | | 7.4 | % | |
General and administrative expense ratio | | | | 10.2 | % | | | | 12.2 | % | | | | 19.8 | % | | | | 16.8 | % | | | | 15.0 | % | | | | 15.7 | % | |
| | |
|
| | | |
|
| | | |
|
| | | |
|
| | | |
|
| | | |
|
| | |
Combined ratio | | | | 98.7 | % | | | | 104.0 | % | | | | 104.3 | % | | | | 85.1 | % | | | | 79.4 | % | | | | 102.5 | % | |
| | |
|
| | | |
|
| | | |
|
| | | |
|
| | | |
|
| | | |
|
| | |
| | | | | | | | | | | | | | | | | | | | | | | | | | | | | | | |
STATUTORY RATIOS | | | | | | | | | | | | | | | | | | | | | | | | | | | | | | | |
Loss ratio | | | | 76.7 | % | | | | 78.0 | % | | | | 68.3 | % | | | | 53.4 | % | | | | 51.1 | % | | | | 79.4 | % | |
Acquisition expense ratio | | | | 13.8 | % | | | | 7.7 | % | | | | 16.9 | % | | | | 17.4 | % | | | | 13.9 | % | | | | 8.6 | % | |
General and administrative expense ratio | | | | 13.4 | % | | | | 5.5 | % | | | | 18.1 | % | | | | 15.9 | % | | | | 12.0 | % | | | | 9.3 | % | |
| | |
|
| | | |
|
| | | |
|
| | | |
|
| | | |
|
| | | |
|
| | |
Combined ratio | | | | 103.9 | % | | | | 91.2 | % | | | | 103.3 | % | | | | 86.7 | % | | | | 77.0 | % | | | | 97.3 | % | |
| | |
|
| | | |
|
| | | |
|
| | | |
|
| | | |
|
| | | |
|
| | |
10
ENDURANCE SPECIALTY HOLDINGS LTD.
REINSURANCE SEGMENT DATA
| | | | | | | | | | | | | | | | | | | | | | | | | | | | | | | |
| | FOR THE QUARTERS ENDED | |
| |
| |
| | JUNE 30, 2008 | | MAR. 31, 2008 | | DEC. 31, 2007 | | SEPT. 30, 2007 | | JUNE 30, 2007 | | JUNE 30, 2006 | |
| |
| |
| |
| |
| |
| |
| |
UNDERWRITING REVENUES | | | | | | | | | | | | | | | | | | | | | | | | | | | | | | | |
Gross premiums written | | | $ | 246,386 | | | | $ | 285,478 | | | | $ | 66,039 | | | | $ | 243,787 | | | | $ | 328,815 | | | | $ | 338,142 | | |
| | |
|
| | | |
|
| | | |
|
| | | |
|
| | | |
|
| | | |
|
| | |
Net premiums written | | | $ | 235,291 | | | | $ | 286,667 | | | | $ | 65,791 | | | | $ | 240,774 | | | | $ | 316,205 | | | | $ | 331,609 | | |
| | |
|
| | | |
|
| | | |
|
| | | |
|
| | | |
|
| | | |
|
| | |
Net premiums earned | | | $ | 210,001 | | | | $ | 205,735 | | | | $ | 267,772 | | | | $ | 275,776 | | | | $ | 324,318 | | | | $ | 368,496 | | |
| | |
|
| | | |
|
| | | |
|
| | | |
|
| | | |
|
| | | |
|
| | |
| | | | | | | | | | | | | | | | | | | | | | | | | | | | | | | |
UNDERWRITING EXPENSES | | | | | | | | | | | | | | | | | | | | | | | | | | | | | | | |
Losses and loss expenses | | | $ | 86,737 | | | | $ | 61,202 | | | | $ | 42,134 | | | | $ | 119,798 | | | | $ | 171,172 | | | | $ | 240,276 | | |
Acquisition expenses | | | | 47,499 | | | | | 51,157 | | | | | 70,641 | | | | | 58,478 | | | | | 64,555 | | | | | 86,371 | | |
General and administrative expenses | | | | 27,422 | | | | | 29,483 | | | | | 37,455 | | | | | 33,133 | | | | | 30,072 | | | | | 32,245 | | |
| | |
|
| | | |
|
| | | |
|
| | | |
|
| | | |
|
| | | |
|
| | |
Total expenses | | | $ | 161,658 | | | | $ | 141,842 | | | | $ | 150,230 | | | | $ | 211,409 | | | | $ | 265,799 | | | | $ | 358,892 | | |
| | |
|
| | | |
|
| | | |
|
| | | |
|
| | | |
|
| | | |
|
| | |
| | | | | | | | | | | | | | | | | | | | | | | | | | | | | | | |
UNDERWRITING INCOME | | | $ | 48,343 | | | | $ | 63,893 | | | | $ | 117,542 | | | | $ | 64,367 | | | | $ | 58,519 | | | | $ | 9,604 | | |
| | |
|
| | | |
|
| | | |
|
| | | |
|
| | | |
|
| | | |
|
| | |
| | | | | | | | | | | | | | | | | | | | | | | | | | | | | | | |
GAAP RATIOS | | | | | | | | | | | | | | | | | | | | | | | | | | | | | | | |
Loss ratio | | | | 41.3 | % | | | | 29.7 | % | | | | 15.7 | % | | | | 43.5 | % | | | | 52.8 | % | | | | 65.2 | % | |
Acquisition expense ratio | | | | 22.6 | % | | | | 24.9 | % | | | | 26.4 | % | | | | 21.2 | % | | | | 19.9 | % | | | | 23.4 | % | |
General and administrative expense ratio | | | | 13.1 | % | | | | 14.3 | % | | | | 14.0 | % | | | | 12.0 | % | | | | 9.3 | % | | | | 8.8 | % | |
| | |
|
| | | |
|
| | | |
|
| | | |
|
| | | |
|
| | | |
|
| | |
Combined ratio | | | | 77.0 | % | | | | 68.9 | % | | | | 56.1 | % | | | | 76.7 | % | | | | 82.0 | % | | | | 97.4 | % | |
| | |
|
| | | |
|
| | | |
|
| | | |
|
| | | |
|
| | | |
|
| | |
| | | | | | | | | | | | | | | | | | | | | | | | | | | | | | | |
STATUTORY RATIOS | | | | | | | | | | | | | | | | | | | | | | | | | | | | | | | |
Loss ratio | | | | 41.3 | % | | | | 29.7 | % | | | | 15.7 | % | | | | 43.5 | % | | | | 52.8 | % | | | | 65.2 | % | |
Acquisition expense ratio | | | | 22.6 | % | | | | 19.4 | % | | | | 47.1 | % | | | | 27.4 | % | | | | 21.8 | % | | | | 22.6 | % | |
General and administrative expense ratio | | | | 11.7 | % | | | | 10.3 | % | | | | 56.9 | % | | | | 13.8 | % | | | | 9.5 | % | | | | 9.7 | % | |
| | |
|
| | | |
|
| | | |
|
| | | |
|
| | | |
|
| | | |
|
| | |
Combined ratio | | | | 75.6 | % | | | | 59.4 | % | | | | 119.7 | % | | | | 84.7 | % | | | | 84.1 | % | | | | 97.5 | % | |
| | |
|
| | | |
|
| | | |
|
| | | |
|
| | | |
|
| | | |
|
| | |
| |
Note: | For internal management reporting purposes, underwriting results by segment are presented on the basis of applying reinsurance accounting to all reinsurance contracts written. Ho for financial statement presentation purposes, management determined that certain reinsurance contracts written during the period were more appropriately accounted for under the deposit method of accounting specified by AICPA SOP 98-7 whereby net premiums due on such contracts were recorded as deposit liabilities. For the impact of deposit accounting segment results, refer to page 20. |
11
ENDURANCE SPECIALTY HOLDINGS LTD.
SEGMENT GROSS PREMIUMS WRITTEN BY LINE OF BUSINESS
| | | | | | | | | | | | | | | | | | | | | | | | | | | | | | | |
| | FOR THE QUARTERS ENDED | |
| |
| |
| | JUNE 30, 2008 | | MAR. 31, 2008 | | DEC. 31, 2007 | | SEPT. 30, 2007 | | JUNE 30, 2007 | | JUNE 30, 2006 | |
| |
| |
| |
| |
| |
| |
| |
INSURANCE SEGMENT | | | | | | | | | | | | | | | | | | | | | | | | | | | | | | | |
Property | | | $ | 52,360 | | | | $ | 31,183 | | | | $ | 37,905 | | | | $ | 28,379 | | | | $ | 40,835 | | | | $ | 52,591 | | |
Casualty | | | | 38,737 | | | | | 25,124 | | | | | 25,851 | | | | | 30,133 | | | | | 42,343 | | | | | 42,877 | | |
Healthcare liability | | | | 25,485 | | | | | 16,492 | | | | | 15,256 | | | | | 30,262 | | | | | 28,054 | | | | | 31,047 | | |
Workers’ compensation | | | | 69,888 | | | | | 83,480 | | | | | 73,054 | | | | | 70,398 | | | | | 57,142 | | | | | 6,431 | | |
Agriculture | | | | 50,921 | | | | | 413,419 | | | | | 42,242 | | | | | — | | | | | — | | | | | | | |
Professional lines | | | | 34,582 | | | | | 15,436 | | | | | 22,202 | | | | | 20,874 | | | | | 29,593 | | | | | 26,277 | | |
| | |
|
| | | |
|
| | | |
|
| | | |
|
| | | |
|
| | | |
|
| | |
TOTAL INSURANCE | | | $ | 271,973 | | | | $ | 585,134 | | | | $ | 216,510 | | | | $ | 180,046 | | | | $ | 197,967 | | | | $ | 159,223 | | |
| | |
|
| | | |
|
| | | |
|
| | | |
|
| | | |
|
| | | |
|
| | |
| | | | | | | | | | | | | | | | | | | | | | | | | | | | | | | |
REINSURANCE SEGMENT | | | | | | | | | | | | | | | | | | | | | | | | | | | | | | | |
Casualty | | | $ | 36,244 | | | | $ | 69,301 | | | | $ | 15,301 | | | | $ | 66,006 | | | | $ | 27,788 | | | | $ | 77,188 | | |
Property | | | | 34,886 | | | | | 36,248 | | | | | 14,212 | | | | | 112,407 | | | | | 65,476 | | | | | 49,998 | | |
Catastrophe | | | | 130,217 | | | | | 105,234 | | | | | 13,499 | | | | | 43,684 | | | | | 147,506 | | | | | 102,763 | | |
Agriculture | | | | 5,822 | | | | | 10,911 | | | | | 7,230 | | | | | 6,917 | | | | | 24,118 | | | | | 42,373 | | |
Aerospace and Marine | | | | 24,250 | | | | | 36,536 | | | | | 11,660 | | | | | 9,179 | | | | | 32,483 | | | | | 40,120 | | |
Surety and other specialty | | | | 14,967 | | | | | 27,248 | | | | | 4,137 | | | | | 5,594 | | | | | 31,444 | | | | | 25,700 | | |
| | |
|
| | | |
|
| | | |
|
| | | |
|
| | | |
|
| | | |
|
| | |
TOTAL REINSURANCE | | | $ | 246,386 | | | | $ | 285,478 | | | | $ | 66,039 | | | | $ | 243,787 | | | | $ | 328,815 | | | | $ | 338,142 | | |
| | |
|
| | | |
|
| | | |
|
| | | |
|
| | | |
|
| | | |
|
| | |
| | | | | | | | | | | | | | | | | | | | | | | | | | | | | | | |
TOTAL COMPANY SUBTOTAL | | | $ | 518,359 | | | | $ | 870,612 | | | | $ | 282,549 | | | | $ | 423,833 | | | | $ | 526,782 | | | | $ | 497,365 | | |
DEPOSIT ACCOUNTING ADJUSTMENT[a] | | | | (296 | ) | | | | (2,021 | ) | | | | (4,799 | ) | | | | (562 | ) | | | | (19,979 | ) | | | | (46,112 | ) | |
| | |
|
| | | |
|
| | | |
|
| | | |
|
| | | |
|
| | | |
|
| | |
REPORTED TOTALS | | | $ | 518,063 | | | | $ | 868,591 | | | | $ | 277,750 | | | | $ | 423,271 | | | | $ | 506,803 | | | | $ | 451,253 | | |
| | |
|
| | | |
|
| | | |
|
| | | |
|
| | | |
|
| | | |
|
| | |
| |
[a] | For internal management reporting purposes, underwriting results by segment are presented on the basis of applying reinsurance accounting to all reinsurance contracts written. However, for financial statement presentation purposes, management determined that certain reinsurance contracts written during the period were more appropriately accounted for under the deposit method of accounting specified by AICPA SOP 98-7 whereby net premiums due on such contracts were recorded as deposit liabilities. The adjustment herein reconciles the Company’s gross premiums written by segment to the Company’s financial statement presentation. |
12
ENDURANCE SPECIALTY HOLDINGS LTD.
SEGMENT NET PREMIUMS WRITTEN BY LINE OF BUSINESS
| | | | | | | | | | | | | | | | | | | | | | | | | | | | | | | |
| | FOR THE QUARTERS ENDED | |
| |
|
| | JUNE 30, 2008 | | MAR. 31, 2008 | | DEC. 31, 2007 | | SEPT. 30, 2007 | | JUNE 30, 2007 | | JUNE 30, 2006 | |
| |
| |
| |
| |
| |
| |
| |
INSURANCE SEGMENT | | | | | | | | | | | | | | | | | | | |
Property | | | $ | 36,641 | | | | $ | 15,003 | | | | $ | 16,827 | | | | $ | 7,689 | | | | $ | 17,262 | | | | $ | 26,699 | | |
Casualty | | | | 34,953 | | | | | 15,113 | | | | | 16,144 | | | | | 16,467 | | | | | 26,815 | | | | | 33,113 | | |
Healthcare liability | | | | 25,169 | | | | | 16,492 | | | | | 15,256 | | | | | 30,262 | | | | | 28,054 | | | | | 31,047 | | |
Workers’ compensation | | | | 63,482 | | | | | 75,906 | | | | | 66,428 | | | | | 64,131 | | | | | 52,999 | | | | | 6,045 | | |
Agriculture | | | | 44,193 | | | | | 222,400 | | | | | 21,115 | | | | | — | | | | | — | | | | | — | | |
Professional lines | | | | 29,952 | | | | | 11,227 | | | | | 18,706 | | | | | 18,855 | | | | | 26,870 | | | | | 26,277 | | |
| | |
|
| | | |
|
| | | |
|
| | | |
|
| | | |
|
| | | |
|
| | |
TOTAL INSURANCE | | | $ | 234,390 | | | | $ | 356,141 | | | | $ | 154,476 | | | | $ | 137,404 | | | | $ | 152,000 | | | | $ | 123,181 | | |
| | |
|
| | | |
|
| | | |
|
| | | |
|
| | | |
|
| | | |
|
| | |
| | | | | | | | | | | | | | | | | | | | | | | | | | | | | | | |
REINSURANCE SEGMENT | | | | | | | | | | | | | | | | | | | | | | | | | | | | | | | |
Casualty | | | $ | 36,273 | | | | $ | 70,503 | | | | $ | 14,908 | | | | $ | 65,946 | | | | $ | 27,610 | | | | $ | 76,004 | | |
Property | | | | 34,886 | | | | | 36,220 | | | | | 14,212 | | | | | 112,398 | | | | | 67,074 | | | | | 49,998 | | |
Catastrophe | | | | 122,231 | | | | | 105,156 | | | | | 13,499 | | | | | 41,025 | | | | | 137,720 | | | | | 99,238 | | |
Agriculture | | | | 5,187 | | | | | 10,911 | | | | | 7,230 | | | | | 7,028 | | | | | 22,018 | | | | | 42,373 | | |
Aerospace and Marine | | | | 21,916 | | | | | 36,626 | | | | | 11,805 | | | | | 8,390 | | | | | 31,030 | | | | | 38,555 | | |
Surety and other specialty | | | | 14,798 | | | | | 27,251 | | | | | 4,137 | | | | | 5,987 | | | | | 30,753 | | | | | 25,441 | | |
| | |
|
| | | |
|
| | | |
|
| | | |
|
| | | |
|
| | | |
|
| | |
TOTAL REINSURANCE | | | $ | 235,291 | | | | $ | 286,667 | | | | $ | 65,791 | | | | $ | 240,774 | | | | $ | 316,205 | | | | $ | 331,609 | | |
| | |
|
| | | |
|
| | | |
|
| | | |
|
| | | |
|
| | | |
|
| | |
| | | | | | | | | | | | | | | | | | | | | | | | | | | | | | | |
TOTAL COMPANY SUBTOTAL | | | $ | 469,681 | | | | $ | 642,808 | | | | $ | 220,267 | | | | $ | 378,178 | | | | $ | 468,205 | | | | $ | 454,790 | | |
DEPOSIT ACCOUNTING ADJUSTMENT[a] | | | | (296 | ) | | | | (2,021 | ) | | | | (4,799 | ) | | | | (562 | ) | | | | (19,979 | ) | | | | (46,112 | ) | |
| | |
|
| | | |
|
| | | |
|
| | | |
|
| | | |
|
| | | |
|
| | |
REPORTED TOTALS | | | $ | 469,385 | | | | $ | 640,787 | | | | $ | 215,468 | | | | $ | 377,616 | | | | $ | 448,226 | | | | $ | 408,678 | | |
| | |
|
| | | |
|
| | | |
|
| | | |
|
| | | |
|
| | | |
|
| | |
| |
[a] | For internal management reporting purposes, underwriting results by segment are presented on the basis of applying reinsurance accounting to all reinsurance contracts written. However, for financial statement presentation purposes, management determined that certain reinsurance contracts written during the period were more appropriately accounted for under the deposit method of accounting specified by AICPA SOP 98-7 whereby net premiums due on such contracts were recorded as deposit liabilities. The adjustment herein reconciles the Company’s gross premiums written by segment to the Company’s financial statement presentation. |
13
ENDURANCE SPECIALTY HOLDINGS LTD.
CONSOLIDATED SEGMENT DATA
FOR THE SIX MONTHS ENDED JUNE 30, 2008
| | | | | | | | | | | | | | | | | | | | | | |
| | Insurance | | Reinsurance | | Total
Company
Sub-total | | Deposit
Accounting
Adjustment [a] | | Reported
Totals | |
| |
| |
| |
| |
| |
| |
UNDERWRITING REVENUES | | | | | | | | | | | | | | | | |
Gross premiums written | | | $ | 857,107 | | | | $ | 531,864 | | | $ | 1,388,971 | | | ($ | 2,317 | ) | | $ | 1,386,654 | |
| | |
|
| | | |
|
| | |
|
| | |
|
| | |
|
| |
Net premiums written | | | $ | 590,531 | | | | $ | 521,958 | | | $ | 1,112,489 | | | ($ | 2,317 | ) | | $ | 1,110,172 | |
| | |
|
| | | |
|
| | |
|
| | |
|
| | |
|
| |
Net premiums earned | | | $ | 413,364 | | | | $ | 415,737 | | | $ | 829,101 | | | ($ | 3,973 | ) | | $ | 825,128 | |
Other underwriting income | | | | — | | | | | — | | | | — | | | | 1,193 | | | | 1,193 | |
| | |
|
| | | |
|
| | |
|
| | |
|
| | |
|
| |
Total underwriting revenues | | | $ | 413,364 | | | | $ | 415,737 | | | $ | 829,101 | | | ($ | 2,780 | ) | | $ | 826,321 | |
| | |
|
| | | |
|
| | |
|
| | |
|
| | |
|
| |
| | | | | | | | | | | | | | | | | | | | | | |
UNDERWRITING EXPENSES | | | | | | | | | | | | | | | | | | | | | | |
Losses and loss expenses | | | $ | 319,122 | | | | $ | 147,937 | | | $ | 467,059 | | | ($ | 2,232 | ) | | $ | 464,827 | |
Acquisition expenses | | | | 52,117 | | | | | 98,655 | | | | 150,772 | | | | (762 | ) | | | 150,010 | |
General and administrative expenses | | | | 45,632 | | | | | 56,905 | | | | 102,537 | | | | — | | | | 102,537 | |
| | |
|
| | | |
|
| | |
|
| | |
|
| | |
|
| |
Total expenses | | | $ | 416,871 | | | | $ | 303,497 | | | $ | 720,368 | | | ($ | 2,994 | ) | | $ | 717,374 | |
| | |
|
| | | |
|
| | |
|
| | |
|
| | |
|
| |
| | | | | | | | | | | | | | | | | | | | | | |
UNDERWRITING (LOSS) INCOME | | | ($ | 3,507 | ) | | | $ | 112,240 | | | $ | 108,733 | | | $ | 214 | | | $ | 108,947 | |
| | |
|
| | | |
|
| | |
|
| | |
|
| | |
|
| |
| | | | | | | | | | | | | | | | | | | | | | |
GAAP RATIOS | | | | | | | | | | | | | | | | | | | | | | |
Loss ratio | | | | 77.2 | % | | | | 35.6 | % | | | 56.3 | % | | | | | | | 56.3 | % |
Acquisition expense ratio | | | | 12.6 | % | | | | 23.7 | % | | | 18.2 | % | | | | | | | 18.2 | % |
General and administrative expense ratio | | | | 11.0 | % | | | | 13.7 | % | | | 12.4 | % | | | | | | | 12.4 | % |
| | |
|
| | | |
|
| | |
|
| | | | | | |
|
| |
Combined ratio | | | | 100.8 | % | | | | 73.0 | % | | | 86.9 | % | | | | | | | 86.9 | % |
| | |
|
| | | |
|
| | |
|
| | | | | | |
|
| |
| | | | | | | | | | | | | | | | | | | | | | |
STATUTORY RATIOS | | | | | | | | | | | | | | | | | | | | | | |
Loss ratio | | | | 77.2 | % | | | | 35.6 | % | | | 56.3 | % | | | | | | | 56.3 | % |
Acquisition expense ratio | | | | 10.1 | % | | | | 20.8 | % | | | 15.1 | % | | | | | | | 15.1 | % |
General and administrative expense ratio | | | | 8.7 | % | | | | 10.9 | % | | | 9.7 | % | | | | | | | 9.7 | % |
| | |
|
| | | |
|
| | |
|
| | | | | | |
|
| |
Combined ratio | | | | 96.0 | % | | | | 67.3 | % | | | 81.1 | % | | | | | | | 81.1 | % |
| | |
|
| | | |
|
| | |
|
| | | | | | |
|
| |
| |
[a] | For internal management reporting purposes, underwriting results by segment are presented on the basis of applying reinsurance accounting to all reinsurance contracts written. However, for financial statement presentation purposes, management determined that certain reinsurance contracts written during the period were more appropriately accounted for under the deposit method of accounting specified by AICPA SOP 98-7 whereby net premiums due on such contracts were recorded as deposit liabilities. The adjustment herein reconciles the Company’s underwriting results by segment to the Company’s financial statement presentation. |
14
ENDURANCE SPECIALTY HOLDINGS LTD.
CONSOLIDATED FINANCIAL RATIOS
FOR THE SIX MONTHS ENDED JUNE 30, 2008
| | | | | | | | | | | |
| | Insurance | | Reinsurance | | Total
Company
Sub-total | | Deposit
Accounting
Adjustment [a] | | Reported
Totals | |
| |
| |
| |
| |
| |
| |
AS REPORTED | | | | | | | | | | | |
| | | | | | | | | | | |
GAAP RATIOS | | | | | | | | | | | |
Loss ratio | | 77.2 | % | 35.6 | % | 56.3 | % | | | 56.3 | % |
Acquisition expense ratio | | 12.6 | % | 23.7 | % | 18.2 | % | | | 18.2 | % |
General and administrative expense ratio | | 11.0 | % | 13.7 | % | 12.4 | % | | | 12.4 | % |
| |
| |
| |
| |
| |
| |
Combined ratio | | 100.8 | % | 73.0 | % | 86.9 | % | NM | | 86.9 | % |
| |
| |
| |
| |
| |
| |
| | | | | | | | | | | |
EFFECT OF PRIOR ACCIDENT YEAR RESERVE DEVELOPMENT FAVORABLE / (UNFAVORABLE) | | | | | | | | | | | |
| | | | | | | | | | | |
GAAP RATIOS | | | | | | | | | | | |
Loss ratio | | 7.1 | % | 16.5 | % | 11.8 | % | NM | | 11.8 | % |
| |
| |
| |
| |
| |
| |
| | | | | | | | | | | |
NET OF PRIOR ACCIDENT YEAR RESERVE DEVELOPMENT | | | | | | | | | | | |
| | | | | | | | | | | |
GAAP RATIOS | | | | | | | | | | | |
Loss ratio | | 84.3 | % | 52.1 | % | 68.1 | % | | | 68.1 | % |
Acquisition expense ratio | | 12.6 | % | 23.7 | % | 18.2 | % | | | 18.2 | % |
General and administrative expense ratio | | 11.0 | % | 13.7 | % | 12.4 | % | | | 12.4 | % |
| |
| |
| |
| |
| |
| |
Combined ratio | | 107.9 | % | 89.5 | % | 98.7 | % | NM | | 98.7 | % |
| |
| |
| |
| |
| |
| |
| |
[a] | For internal management reporting purposes, underwriting results by segment are presented on the basis of applying reinsurance accounting to all reinsurance contracts written. However, for financial statement presentation purposes, management determined that certain reinsurance contracts written during the period were more appropriately accounted for under the deposit method of accounting specified by AICPA SOP 98-7 whereby net premiums due on such contracts were recorded as deposit liabilities. The adjustment herein reconciles the Company’s loss ratio by segment to the Company’s financial statement presentation. |
15
ENDURANCE SPECIALTY HOLDINGS LTD.
INSURANCE SEGMENT DATA
| | | | | | | | | | | | | | | | | | | | | | | | | | |
| | FOR THE SIX MONTHS ENDED | | FOR THE YEARS ENDED | |
| |
| |
| |
| | JUNE 30, 2008 | | JUNE 30, 2007 | | JUNE 30, 2006 | | DEC. 31, 2007 | | DEC. 31, 2006 | |
| |
| |
| |
| |
| |
| |
UNDERWRITING REVENUES | | | | | | | | | | | | | | | | | | | | | | | | | | |
Gross premiums written | | | $ | 857,107 | | | | $ | 345,000 | | | | $ | 239,380 | | | | $ | 741,556 | | | | $ | 576,745 | | |
| | |
|
| | | |
|
| | | |
|
| | | |
|
| | | |
|
| | |
Net premiums written | | | $ | 590,531 | | | | $ | 260,089 | | | | $ | 179,873 | | | | $ | 551,970 | | | | $ | 416,637 | | |
| | |
|
| | | |
|
| | | |
|
| | | |
|
| | | |
|
| | |
Net premiums earned | | | $ | 413,364 | | | | $ | 234,382 | | | | $ | 178,779 | | | | $ | 502,082 | | | | $ | 371,762 | | |
| | |
|
| | | |
|
| | | |
|
| | | |
|
| | | |
|
| | |
| | | | | | | | | | | | | | | | | | | | | | | | | | |
UNDERWRITING EXPENSES | | | | | | | | | | | | | | | | | | | | | | | | | | |
Losses and loss expenses | | | $ | 319,122 | | | | $ | 126,951 | | | | $ | 111,775 | | | | $ | 290,213 | | | | $ | 252,310 | | |
Acquisition expenses | | | | 52,117 | | | | | 30,354 | | | | | 12,655 | | | | | 72,044 | | | | | 32,528 | | |
General and administrative expenses | | | | 45,632 | | | | | 40,809 | | | | | 21,782 | | | | | 89,996 | | | | | 49,524 | | |
| | |
|
| | | |
|
| | | |
|
| | | |
|
| | | |
|
| | |
Total expenses | | | $ | 416,871 | | | | $ | 198,114 | | | | $ | 146,212 | | | | $ | 452,253 | | | | $ | 334,362 | | |
| | |
|
| | | |
|
| | | |
|
| | | |
|
| | | |
|
| | |
| | | | | | | | | | | | | | | | | | | | | | | | | | |
UNDERWRITING (LOSS) INCOME | | | ($ | 3,507 | ) | | | $ | 36,268 | | | | $ | 32,567 | | | | $ | 49,829 | | | | $ | 37,400 | | |
| | |
|
| | | |
|
| | | |
|
| | | |
|
| | | |
|
| | |
| | | | | | | | | | | | | | | | | | | | | | | | | | |
GAAP RATIOS | | | | | | | | | | | | | | | | | | | | | | | | | | |
Loss ratio | | | | 77.2 | % | | | | 54.2 | % | | | | 62.5 | % | | | | 57.8 | % | | | | 67.9 | % | |
Acquisition expense ratio | | | | 12.6 | % | | | | 13.0 | % | | | | 7.1 | % | | | | 14.4 | % | | | | 8.7 | % | |
General and administrative expense ratio | | | | 11.0 | % | | | | 17.3 | % | | | | 12.2 | % | | | | 17.9 | % | | | | 13.3 | % | |
| | |
|
| | | |
|
| | | |
|
| | | |
|
| | | |
|
| | |
Combined ratio | | | | 100.8 | % | | | | 84.5 | % | | | | 81.8 | % | | | | 90.1 | % | | | | 89.9 | % | |
| | |
|
| | | |
|
| | | |
|
| | | |
|
| | | |
|
| | |
| | | | | | | | | | | | | | | | | | | | | | | | | | |
STATUTORY RATIOS | | | | | | | | | | | | | | | | | | | | | | | | | | |
Loss ratio | | | | 77.2 | % | | | | 54.2 | % | | | | 62.5 | % | | | | 57.8 | % | | | | 67.9 | % | |
Acquisition expense ratio | | | | 10.1 | % | | | | 16.1 | % | | | | 8.3 | % | | | | 16.6 | % | | | | 13.9 | % | |
General and administrative expense ratio | | | | 8.7 | % | | | | 15.6 | % | | | | 10.2 | % | | | | 16.4 | % | | | | 10.5 | % | |
| | |
|
| | | |
|
| | | |
|
| | | |
|
| | | |
|
| | |
Combined ratio | | | | 96.0 | % | | | | 85.9 | % | | | | 81.0 | % | | | | 90.8 | % | | | | 92.3 | % | |
| | |
|
| | | |
|
| | | |
|
| | | |
|
| | | |
|
| | |
16
ENDURANCE SPECIALTY HOLDINGS LTD.
REINSURANCE SEGMENT DATA
| | | | | | | | | | | | | | | | | | | | | | | | | | |
| | FOR THE SIX MONTHS ENDED | | FOR THE YEARS ENDED | |
| |
| |
| |
| | JUNE 30, 2008 | | JUNE 30, 2007 | | JUNE 30, 2006 | | DEC. 31, 2007 | | DEC. 31, 2006 | |
| |
| |
| |
| |
| |
| |
UNDERWRITING REVENUES | | | | | | | | | | | | | | | | | | | | | | | | | | |
Gross premiums written | | | $ | 531,864 | | | | $ | 758,288 | | | | $ | 928,515 | | | | $ | 1,068,114 | | | | $ | 1,371,889 | | |
| | |
|
| | | |
|
| | | |
|
| | | |
|
| | | |
|
| | |
Net premiums written | | | $ | 521,958 | | | | $ | 744,996 | | | | $ | 917,075 | | | | $ | 1,051,560 | | | | $ | 1,327,919 | | |
| | |
|
| | | |
|
| | | |
|
| | | |
|
| | | |
|
| | |
Net premiums earned | | | $ | 415,737 | | | | $ | 615,713 | | | | $ | 755,033 | | | | $ | 1,159,261 | | | | $ | 1,447,167 | | |
| | |
|
| | | |
|
| | | |
|
| | | |
|
| | | |
|
| | |
| | | | | | | | | | | | | | | | | | | | | | | | | | |
UNDERWRITING EXPENSES | | | | | | | | | | | | | | | | | | | | | | | | | | |
Losses and loss expenses | | | $ | 147,937 | | | | $ | 340,871 | | | | $ | 468,674 | | | | $ | 502,804 | | | | $ | 696,962 | | |
Acquisition expenses | | | | 98,655 | | | | | 125,973 | | | | | 176,066 | | | | | 255,091 | | | | | 341,194 | | |
General and administrative expenses | | | | 56,905 | | | | | 56,684 | | | | | 68,177 | | | | | 127,273 | | | | | 140,849 | | |
| | |
|
| | | |
|
| | | |
|
| | | |
|
| | | |
|
| | |
Total expenses | | | $ | 303,497 | | | | $ | 523,528 | | | | $ | 712,917 | | | | $ | 885,168 | | | | $ | 1,179,005 | | |
| | |
|
| | | |
|
| | | |
|
| | | |
|
| | | |
|
| | |
| | | | | | | | | | | | | | | | | | | | | | | | | | |
UNDERWRITING INCOME | | | $ | 112,240 | | | | $ | 92,185 | | | | $ | 42,116 | | | | $ | 274,093 | | | | $ | 268,162 | | |
| | |
|
| | | |
|
| | | |
|
| | | |
|
| | | |
|
| | |
| | | | | | | | | | | | | | | | | | | | | | | | | | |
GAAP RATIOS | | | | | | | | | | | | | | | | | | | | | | | | | | |
Loss ratio | | | | 35.6 | % | | | | 55.4 | % | | | | 62.1 | % | | | | 43.4 | % | | | | 48.2 | % | |
Acquisition expense ratio | | | | 23.7 | % | | | | 20.5 | % | | | | 23.3 | % | | | | 22.0 | % | | | | 23.6 | % | |
General and administrative expense ratio | | | | 13.7 | % | | | | 9.1 | % | | | | 9.0 | % | | | | 11.0 | % | | | | 9.7 | % | |
| | |
|
| | | |
|
| | | |
|
| | | |
|
| | | |
|
| | |
Combined ratio | | | | 73.0 | % | | | | 85.0 | % | | | | 94.4 | % | | | | 76.4 | % | | | | 81.5 | % | |
| | |
|
| | | |
|
| | | |
|
| | | |
|
| | | |
|
| | |
| | | | | | | | | | | | | | | | | | | | | | | | | | |
STATUTORY RATIOS | | | | | | | | | | | | | | | | | | | | | | | | | | |
Loss ratio | | | | 35.6 | % | | | | 55.4 | % | | | | 62.1 | % | | | | 43.4 | % | | | | 48.2 | % | |
Acquisition expense ratio | | | | 20.8 | % | | | | 18.2 | % | | | | 20.5 | % | | | | 22.1 | % | | | | 23.5 | % | |
General and administrative expense ratio | | | | 10.9 | % | | | | 7.6 | % | | | | 7.4 | % | | | | 12.1 | % | | | | 10.6 | % | |
| | |
|
| | | |
|
| | | |
|
| | | |
|
| | | |
|
| | |
Combined ratio | | | | 67.3 | % | | | | 81.2 | % | | | | 90.0 | % | | | | 77.6 | % | | | | 82.3 | % | |
| | |
|
| | | |
|
| | | |
|
| | | |
|
| | | |
|
| | |
| |
Note: | For internal management reporting purposes, underwriting results by segment are presented on the basis of applying reinsurance accounting to all reinsurance contracts written. However, for financial statement presentation purposes, management determined that certain reinsurance contracts written during the period were more appropriately accounted for under the deposit method of accounting specified by AICPA SOP 98-7 whereby net premiums due on such contracts were recorded as deposit liabilities. For the impact of deposit accounting on segment results, refer to page 21. |
17
ENDURANCE SPECIALTY HOLDINGS LTD.
SEGMENT GROSS PREMIUMS WRITTEN BY LINE OF BUSINESS
| | | | | | | | | | | | | | | | | | | | | | | | | | |
| | FOR THE SIX MONTHS ENDED | | FOR THE YEARS ENDED | |
| |
| |
| |
| | JUNE 30, 2008 | | JUNE 30, 2007 | | JUNE 30, 2006 | | DEC. 31, 2007 | | DEC. 31, 2006 | |
| |
| |
| |
| |
| |
| |
INSURANCE SEGMENT | | | | | | | | | | | | | | | | |
Property | | | $ | 83,542 | | | | $ | 67,877 | | | | $ | 81,164 | | | | $ | 134,161 | | | | $ | 173,292 | | |
Casualty | | | | 63,861 | | | | | 69,140 | | | | | 64,664 | | | | | 125,124 | | | | | 128,933 | | |
Healthcare liability | | | | 41,978 | | | | | 46,843 | | | | | 52,109 | | | | | 92,361 | | | | | 106,988 | | |
Workers' compensation | | | | 153,367 | | | | | 118,775 | | | | | 6,431 | | | | | 262,228 | | | | | 93,779 | | |
Agriculture | | | | 464,340 | | | | | — | | | | | — | | | | | 42,242 | | | | | — | | |
Professional lines | | | | 50,019 | | | | | 42,365 | | | | | 35,012 | | | | | 85,440 | | | | | 73,753 | | |
| | |
|
| | | |
|
| | | |
|
| | | |
|
| | | |
|
| | |
TOTAL INSURANCE | | | $ | 857,107 | | | | $ | 345,000 | | | | $ | 239,380 | | | | $ | 741,556 | | | | $ | 576,745 | | |
| | |
|
| | | |
|
| | | |
|
| | | |
|
| | | |
|
| | |
| | | | | | | | | | | | | | | | | | | | | | | | | | |
REINSURANCE SEGMENT | | | | | | | | | | | | | | | | | | | | | | | | | | |
Casualty | | | $ | 105,545 | | | | $ | 119,725 | | | | $ | 262,767 | | | | $ | 201,032 | | | | $ | 400,111 | | |
Property | | | | 71,134 | | | | | 102,177 | | | | | 172,478 | | | | | 228,796 | | | | | 318,883 | | |
Catastrophe | | | | 235,451 | | | | | 288,005 | | | | | 223,459 | | | | | 345,187 | | | | | 291,755 | | |
Agriculture | | | | 16,734 | | | | | 117,179 | | | | | 92,904 | | | | | 131,325 | | | | | 107,104 | | |
Aerospace and Marine | | | | 60,785 | | | | | 72,042 | | | | | 120,065 | | | | | 92,882 | | | | | 180,203 | | |
Surety and other specialty | | | | 42,215 | | | | | 59,160 | | | | | 56,842 | | | | | 68,892 | | | | | 73,833 | | |
| | |
|
| | | |
|
| | | |
|
| | | |
|
| | | |
|
| | |
TOTAL REINSURANCE | | | $ | 531,864 | | | | $ | 758,288 | | | | $ | 928,515 | | | | $ | 1,068,114 | | | | $ | 1,371,889 | | |
| | |
|
| | | |
|
| | | |
|
| | | |
|
| | | |
|
| | |
| | | | | | | | | | | | | | | | | | | | | | | | | | |
TOTAL COMPANY SUBTOTAL | | | $ | 1,388,971 | | | | $ | 1,103,288 | | | | $ | 1,167,895 | | | | $ | 1,809,670 | | | | $ | 1,948,634 | | |
DEPOSIT ACCOUNTING ADJUSTMENT[a] | | | | (2,317 | ) | | | | (23,194 | ) | | | | (145,261 | ) | | | | (28,555 | ) | | | | (158,992 | ) | |
| | |
|
| | | |
|
| | | |
|
| | | |
|
| | | |
|
| | |
REPORTED TOTALS | | | $ | 1,386,654 | | | | $ | 1,080,094 | | | | $ | 1,022,634 | | | | $ | 1,781,115 | | | | $ | 1,789,642 | | |
| | |
|
| | | |
|
| | | |
|
| | | |
|
| | | |
|
| | |
| |
[a] | For internal management reporting purposes, underwriting results by segment are presented on the basis of applying reinsurance accounting to all reinsurance contracts written. However, for financial statement presentation purposes, management determined that certain reinsurance contracts written during the period were more appropriately accounted for under the deposit method of accounting specified by AICPA SOP 98-7 whereby net premiums due on such contracts were recorded as deposit liabilities. The adjustment herein reconciles the Company's gross premiums written by segment to the Company's financial statement presentation. |
18
ENDURANCE SPECIALTY HOLDINGS LTD.
SEGMENT NET PREMIUMS WRITTEN BY LINE OF BUSINESS
| | | | | | | | | | | | | | | | | | | | | | | | | | |
| | FOR THE SIX MONTHS ENDED | | FOR THE YEARS ENDED | |
| |
| |
| |
| | JUNE 30, 2008 | | JUNE 30, 2007 | | JUNE 30, 2006 | | DEC. 31, 2007 | | DEC. 31, 2006 | |
| |
| |
| |
| |
| |
| |
INSURANCE SEGMENT | | | | | | | | | | | | | | | | | | | | | | | | | | |
Property | | | $ | 51,644 | | | | $ | 23,389 | | | | $ | 37,389 | | | | $ | 47,905 | | | | $ | 61,290 | | |
Casualty | | | | 50,066 | | | | | 44,577 | | | | | 49,318 | | | | | 77,188 | | | | | 89,817 | | |
Healthcare liability | | | | 41,661 | | | | | 46,843 | | | | | 52,109 | | | | | 92,361 | | | | | 106,988 | | |
Workers' compensation | | | | 139,387 | | | | | 107,809 | | | | | 6,044 | | | | | 238,369 | | | | | 86,867 | | |
Agriculture | | | | 266,593 | | | | | — | | | | | — | | | | | 21,115 | | | | | — | | |
Professional lines | | | | 41,180 | | | | | 37,471 | | | | | 35,013 | | | | | 75,032 | | | | | 71,675 | | |
| | |
|
|
|
|
|
|
|
|
|
|
|
|
| | |
|
| | | |
|
| | |
TOTAL INSURANCE | | | $ | 590,531 | | | | $ | 260,089 | | | | $ | 179,873 | | | | $ | 551,970 | | | | $ | 416,637 | | |
| | |
|
|
|
|
|
|
|
|
|
|
|
|
| | |
|
| | | |
|
| | |
| | | | | | | | | | | | | | | | | | | | | | | | | | |
REINSURANCE SEGMENT | | | | | | | | | | | | | | | | | | | | | | | | | | |
Casualty | | | $ | 106,775 | | | | $ | 119,532 | | | | $ | 256,054 | | | | $ | 200,385 | | | | $ | 396,663 | | |
Property | | | | 71,107 | | | | | 103,601 | | | | | 172,478 | | | | | 230,211 | | | | | 310,795 | | |
Catastrophe | | | | 227,386 | | | | | 277,904 | | | | | 223,458 | | | | | 332,428 | | | | | 270,126 | | |
Agriculture | | | | 16,099 | | | | | 115,079 | | | | | 92,904 | | | | | 129,337 | | | | | 106,262 | | |
Aerospace and Marine | | | | 58,542 | | | | | 70,419 | | | | | 118,501 | | | | | 90,613 | | | | | 173,586 | | |
Surety and other specialty | | | | 42,049 | | | | | 58,461 | | | | | 53,680 | | | | | 68,586 | | | | | 70,487 | | |
| | |
|
|
|
|
|
|
|
|
|
|
|
|
| | |
|
| | | |
|
| | |
TOTAL REINSURANCE | | | $ | 521,958 | | | | $ | 744,996 | | | | $ | 917,075 | | | | $ | 1,051,560 | | | | $ | 1,327,919 | | |
| | |
|
|
|
|
|
|
|
|
|
|
|
|
| | |
|
| | | |
|
| | |
| | | | | | | | | | | | | | | | | | | | | | | | | | |
TOTAL COMPANY SUBTOTAL | | | $ | 1,112,489 | | | | $ | 1,005,085 | | | | $ | 1,096,948 | | | | $ | 1,603,530 | | | | $ | 1,744,556 | | |
DEPOSIT ACCOUNTING ADJUSTMENT[a] | | | | (2,317 | ) | | | | (23,194 | ) | | | | (145,261 | ) | | | | (28,555 | ) | | | | (158,992 | ) | |
| | |
|
|
|
|
|
|
|
|
|
|
|
|
| | |
|
| | | |
|
| | |
REPORTED TOTALS | | | $ | 1,110,172 | | | | $ | 981,891 | | | | $ | 951,687 | | | | $ | 1,574,975 | | | | $ | 1,585,564 | | |
| | |
|
|
|
|
|
|
|
|
|
|
|
|
| | |
|
| | | |
|
| | |
| |
[a] | For internal management reporting purposes, underwriting results by segment are presented on the basis of applying reinsurance accounting to all reinsurance contracts written. However, for financial statement presentation purposes, management determined that certain reinsurance contracts written during the period were more appropriately accounted for under the deposit method of accounting specified by AICPA SOP 98-7 whereby net premiums due on such contracts were recorded as deposit liabilities. The adjustment herein reconciles the Company's gross premiums written by segment to the Company's financial statement presentation. |
19
ENDURANCE SPECIALTY HOLDINGS LTD.
DEPOSIT ACCOUNTING ADJUSTMENT IMPACTS ON SEGMENT DATA
FOR THE QUARTER ENDED JUNE 30, 2008
| | | | | | | | | | | | | | | | | | | | | | | | | | | | | | | |
| | Includes Deposit Accounting Adjustments | | Excludes Deposit Accounting Adjustments | |
| |
| |
| |
| | Insurance | | Reinsurance | | Total
Company | | Insurance | | Reinsurance | | Total
Company | |
| |
| |
| |
| |
| |
| |
| |
UNDERWRITING REVENUES | | | | | | | | | | | | | | | | | | | | | | | | | | | | | | | |
Gross premiums written | | | $ | 271,973 | | | | $ | 246,090 | | | | $ | 518,063 | | | | $ | 271,973 | | | | $ | 246,386 | | | | $ | 518,359 | | |
| | |
|
| | | |
|
| | | |
|
| | | |
|
| | | |
|
| | | |
|
| | |
Net premiums written | | | $ | 234,390 | | | | $ | 234,995 | | | | $ | 469,385 | | | | $ | 234,390 | | | | $ | 235,291 | | | | $ | 469,681 | | |
| | |
|
| | | |
|
| | | |
|
| | | |
|
| | | |
|
| | | |
|
| | |
Net premiums earned | | | $ | 245,383 | | | | $ | 207,702 | | | | $ | 453,085 | | | | $ | 245,383 | | | | $ | 210,001 | | | | $ | 455,384 | | |
Other underwriting income | | | | — | | | | | 1,933 | | | | | 1,933 | | | | | — | | | | | — | | | | | — | | |
| | |
|
| | | |
|
| | | |
|
| | | |
|
| | | |
|
| | | |
|
| | |
Total underwriting revenues | | | $ | 245,383 | | | | $ | 209,635 | | | | $ | 455,018 | | | | $ | 245,383 | | | | $ | 210,001 | | | | $ | 455,384 | | |
| | |
|
| | | |
|
| | | |
|
| | | |
|
| | | |
|
| | | |
|
| | |
| | | | | | | | | | | | | | | | | | | | | | | | | | | | | | | |
UNDERWRITING EXPENSES | | | | | | | | | | | | | | | | | | | | | | | | | | | | | | | |
Losses and loss expenses | | | $ | 188,171 | | | | $ | 87,154 | | | | $ | 275,325 | | | | $ | 188,171 | | | | $ | 86,737 | | | | $ | 274,908 | | |
Acquisition expenses | | | | 29,000 | | | | | 46,636 | | | | | 75,636 | | | | | 29,000 | | | | | 47,499 | | | | | 76,499 | | |
General and administrative expenses | | | | 25,071 | | | | | 27,422 | | | | | 52,493 | | | | | 25,071 | | | | | 27,422 | | | | | 52,493 | | |
| | |
|
| | | |
|
| | | |
|
| | | |
|
| | | |
|
| | | |
|
| | |
Total expenses | | | $ | 242,242 | | | | $ | 161,212 | | | | $ | 403,454 | | | | $ | 242,242 | | | | $ | 161,658 | | | | $ | 403,900 | | |
| | |
|
| | | |
|
| | | |
|
| | | |
|
| | | |
|
| | | |
|
| | |
| | | | | | | | | | | | | | | | | | | | | | | | | | | | | | | |
UNDERWRITING INCOME | | | $ | 3,141 | | | | $ | 48,423 | | | | $ | 51,564 | | | | $ | 3,141 | | | | $ | 48,343 | | | | $ | 51,484 | | |
| | |
|
| | | |
|
| | | |
|
| | | |
|
| | | |
|
| | | |
|
| | |
| | | | | | | | | | | | | | | | | | | | | | | | | | | | | | | |
GAAP RATIOS | | | | | | | | | | | | | | | | | | | | | | | | | | | | | | | |
Loss ratio | | | | 76.7 | % | | | | 42.0 | % | | | | 60.7 | % | | | | 76.7 | % | | | | 41.3 | % | | | | 60.4 | % | |
Acquisition expense ratio | | | | 11.8 | % | | | | 22.4 | % | | | | 16.7 | % | | | | 11.8 | % | | | | 22.6 | % | | | | 16.8 | % | |
General and administrative expense ratio | | | | 10.2 | % | | | | 13.2 | % | | | | 11.6 | % | | | | 10.2 | % | | | | 13.1 | % | | | | 11.5 | % | |
| | |
|
| | | |
|
| | | |
|
| | | |
|
| | | |
|
| | | |
|
| | |
Combined ratio | | | | 98.7 | % | | | | 77.6 | % | | | | 89.0 | % | | | | 98.7 | % | | | | 77.0 | % | | | | 88.7 | % | |
| | |
|
| | | |
|
| | | |
|
| | | |
|
| | | |
|
| | | |
|
| | |
20
ENDURANCE SPECIALTY HOLDINGS LTD.
DEPOSIT ACCOUNTING ADJUSTMENT IMPACTS ON SEGMENT DATA
FOR THE SIX MONTHS ENDED JUNE 30, 2008
| | | | | | | | | | | | | | | | | | | | | | | | | | | | | | | |
| | Includes Deposit Accounting Adjustments | | Excludes Deposit Accounting Adjustments | |
| |
| |
| |
| | Insurance | | Reinsurance | | Total
Company | | Insurance | | Reinsurance | | Total
Company | |
| |
| |
| |
| |
| |
| |
| |
UNDERWRITING REVENUES | | | | | | | | | | | | | | | | | | | | | | | | | | | | | | | |
Gross premiums written | | | $ | 857,107 | | | | $ | 529,547 | | | | $ | 1,386,654 | | | | $ | 857,107 | | | | $ | 531,864 | | | | $ | 1,388,971 | | |
| | |
|
| | | |
|
| | | |
|
| | | |
|
| | | |
|
| | | |
|
| | |
Net premiums written | | | $ | 590,531 | | | | $ | 519,641 | | | | $ | 1,110,172 | | | | $ | 590,531 | | | | $ | 521,958 | | | | $ | 1,112,489 | | |
| | |
|
| | | |
|
| | | |
|
| | | |
|
| | | |
|
| | | |
|
| | |
Net premiums earned | | | $ | 413,364 | | | | $ | 411,764 | | | | $ | 825,128 | | | | $ | 413,364 | | | | $ | 415,737 | | | | $ | 829,101 | | |
Other underwriting income | | | | — | | | | | 1,193 | | | | | 1,193 | | | | | — | | | | | — | | | | | — | | |
| | |
|
| | | |
|
| | | |
|
| | | |
|
| | | |
|
| | | |
|
| | |
Total underwriting revenues | | | $ | 413,364 | | | | $ | 412,957 | | | | $ | 826,321 | | | | $ | 413,364 | | | | $ | 415,737 | | | | $ | 829,101 | | |
| | |
|
| | | |
|
| | | |
|
| | | |
|
| | | |
|
| | | |
|
| | |
| | | | | | | | | | | | | | | | | | | | | | | | | | | | | | | |
UNDERWRITING EXPENSES | | | | | | | | | | | | | | | | | | | | | | | | | | | | | | | |
Losses and loss expenses | | | $ | 319,122 | | | | $ | 145,705 | | | | $ | 464,827 | | | | $ | 319,122 | | | | $ | 147,937 | | | | $ | 467,059 | | |
Acquisition expenses | | | | 52,117 | | | | | 97,893 | | | | | 150,010 | | | | | 52,117 | | | | | 98,655 | | | | | 150,772 | | |
General and administrative expenses | | | | 45,632 | | | | | 56,905 | | | | | 102,537 | | | | | 45,632 | | | | | 56,905 | | | | | 102,537 | | |
| | |
|
| | | |
|
| | | |
|
| | | |
|
| | | |
|
| | | |
|
| | |
Total expenses | | | $ | 416,871 | | | | $ | 300,503 | | | | $ | 717,374 | | | | $ | 416,871 | | | | $ | 303,497 | | | | $ | 720,368 | | |
| | |
|
| | | |
|
| | | |
|
| | | |
|
| | | |
|
| | | |
|
| | |
| | | | | | | | | | | | | | | | | | | | | | | | | | | | | | | |
UNDERWRITING (LOSS) INCOME | | | ($ | 3,507 | ) | | | $ | 112,454 | | | | $ | 108,947 | | | | ($ | 3,507 | ) | | | $ | 112,240 | | | | $ | 108,733 | | |
| | |
|
| | | |
|
| | | |
|
| | | |
|
| | | |
|
| | | |
|
| | |
| | | | | | | | | | | | | | | | | | | | | | | | | | | | | | | |
GAAP RATIOS | | | | | | | | | | | | | | | | | | | | | | | | | | | | | | | |
Loss ratio | | | | 77.2 | % | | | | 35.4 | % | | | | 56.3 | % | | | | 77.2 | % | | | | 35.6 | % | | | | 56.3 | % | |
Acquisition expense ratio | | | | 12.6 | % | | | | 23.8 | % | | | | 18.2 | % | | | | 12.6 | % | | | | 23.7 | % | | | | 18.2 | % | |
General and administrative expense ratio | | | | 11.0 | % | | | | 13.8 | % | | | | 12.4 | % | | | | 11.0 | % | | | | 13.7 | % | | | | 12.4 | % | |
| | |
|
| | | |
|
| | | |
|
| | | |
|
| | | |
|
| | | |
|
| | |
Combined ratio | | | | 100.8 | % | | | | 73.0 | % | | | | 86.9 | % | | | | 100.8 | % | | | | 73.0 | % | | | | 86.9 | % | |
| | |
|
| | | |
|
| | | |
|
| | | |
|
| | | |
|
| | | |
|
| | |
21
ENDURANCE SPECIALTY HOLDINGS LTD.
RETURN ON EQUITY ANALYSIS
| | | | | | | |
| | FOR THE SIX MONTHS
ENDED JUNE 30, 2008 | |
| |
| |
| | | | | | |
Average common equity[a] | | | $ | 2,323,077 | | |
| | | | | | |
Net premiums earned | | | $ | 825,128 | | |
Combined ratio | | | | 86.9 | % | |
Operating margin | | | | 13.1 | % | |
Premium leverage | | | | 0.36 | x | |
| | | | | | | |
Implied ROAE from underwriting activity | | | | 4.7 | % | | |
| | | | | | | |
| | | | | | |
Average cash and invested assets at amortized cost | | | $ | 5,576,372 | | |
Investment leverage | | | | 2.40 | x | |
Year to date investment income yield, pretax | | | | 1.9 | % | |
| | | | | | | |
Implied ROAE from investment activity | | | | 4.6 | % | | |
| | | | | | | |
| | | | | | |
| | | | | | | |
Financing Costs [b] | | | | (1.0 | )% | | |
| | | | | | | |
| | | | | | |
| | | | | | | |
Implied Pre-tax Operating ROAE, for period [c] | | | | 8.4 | % | | |
| | | | | | | |
| | | | | | |
| | | | | | | |
Implied Pre-tax Operating ROAE, annualized [c] | | | | 16.8 | % | | |
| | | | | | | |
| |
|
[a] | Average common equity is calculated as the arithmetic average of the beginning and ending common equity balances for the stated periods, which excludes the $200 million liquidation value of the preferred shares. |
| |
[b] | Financing costs include interest expense and preferred dividends. |
| |
[c] | Implied pre-tax Operating ROAE considers only the main components of the Company’s return on equity -- underwriting and investment returns. As such, it differs from operating ROE primarily due to the exclusion of tax on underwriting and investment profits and the tax-effected impact of amortization and interest expense. |
22
ENDURANCE SPECIALTY HOLDINGS LTD.
ANNUALIZED OPERATING & INVESTMENT LEVERAGE
| | | | | | | | | | | | | | | | | | | | | | | | | | | | | | | | | | | | |
| | FOR THE QUARTERS ENDED | | YEARS ENDED DECEMBER 31, | |
| |
| |
| |
| | JUNE 30, 2008 | | MAR. 31, 2008 | | DEC. 31, 2007 | | SEPT. 30, 2007 | | 2007 | | 2006 | |
| |
| |
| |
| |
| |
| |
| | | | | | | | | | | | | | | | | | | | | | | | | | | | | | | |
Average common equity[a] | | | $ | 2,336,035 | | | | $ | 2,325,217 | | | | $ | 2,318,940 | | | | $ | 2,252,734 | | | | $ | 2,215,885 | | | | $ | 1,885,209 | | |
| | | | | | | | | | | | | | | | | | | | | | | | | | | | | | | |
Net premiums earned | | | $ | 453,085 | | | | $ | 372,043 | | | | $ | 400,462 | | | | $ | 399,742 | | | | $ | 1,594,800 | | | | $ | 1,638,574 | | |
| | | | | | | | | | | | | | | | | | | | | | | | | | | | | | | |
Operating leverage | | | | 0.19 | x | | | | 0.16 | x | | | | 0.17 | x | | | | 0.18 | x | | | | 0.72 | x | | | | 0.87 | x | |
| | | | | | | | | | | | | | | | | | | | | | | | | | | | | | | |
| | | | | | | | | | | | | | | | | | | | | | | | | | | | | | | | | | | | |
Annualized operating leverage | | | | 0.78 | x | | | | | 0.64 | x | | | | | 0.69 | x | | | | | 0.71 | x | | | | | 0.72 | x | | | | | 0.87 | x | |
| | | | | | | | | | | | | | | | | | | | | | | | | | | | | | | | | | | | |
| | | | | | | | | | | | | | | | | | | | | | | | | | | | | | | |
Avg. cash and invested assets at amortized cost | | | $ | 5,593,901 | | | | $ | 5,579,783 | | | | $ | 5,691,919 | | | | $ | 5,751,342 | | | | $ | 5,559,204 | | | | $ | 5,275,481 | | |
| | | | | | | | | | | | | | | | | | | | | | | | | | | | | | | |
| | | | | | | | | | | | | | | | | | | | | | | | | | | | | | | | | | | | |
Investment leverage | | | | 2.39 | x | | | | | 2.40 | x | | | | | 2.45 | x | | | | | 2.55 | x | | | | | 2.51 | x | | | | | 2.80 | x | |
| | | | | | | | | | | | | | | | | | | | | | | | | | | | | | | | | | | | |
[a] Average common equity is calculated as the arithmetic average of the beginning and ending equity balances for the stated periods and excludes the $200 million liquidation value of the preferred shares.
23
ENDURANCE SPECIALTY HOLDINGS LTD.
INVESTMENT PORTFOLIO
AS OF JUNE 30, 2008
| | | | | | | |
Type of Investment | | Fair Value | | Percentage | |
| |
| |
| |
Cash and equivalents [a] | | $ | 654,326 | | | 11.6 | % |
U.S. government and agencies | | | 723,561 | | | 12.9 | % |
Corporate securities | | | 808,101 | | | 14.3 | % |
Foreign government | | | 195,652 | | | 3.5 | % |
Municipals | | | 124,351 | | | 2.2 | % |
Asset-backed securities | | | 363,823 | | | 6.5 | % |
Mortgage-backed securities | | | 2,389,165 | | | 42.5 | % |
Other investments [b] | | | 366,886 | | | 6.5 | % |
| |
|
| |
|
| |
Total | | $ | 5,625,865 | | | 100.0 | % |
| |
|
| |
|
| |
| | | | | | | |
Ratings [e] | | Fair Value | | Percentage | |
| |
| |
| |
U.S. Government and agencies notes | | $ | 723,561 | | | 14.6 | % |
AAA/Aaa | | | 3,114,330 | | | 62.6 | % |
AA/Aa | | | 338,683 | | | 6.8 | % |
A/A | | | 340,023 | | | 6.8 | % |
BBB | | | 24,510 | | | 0.5 | % |
Below BBB | | | 62,788 | | | 1.3 | % |
Not Rated | | | 758 | | | 0.0 | % |
Other investments [b] | | | 366,886 | | | 7.4 | % |
| |
|
| |
|
| |
Total | | $ | 4,971,539 | | | 100.0 | % |
| | | | | | | |
| |
|
| |
|
| |
|
Performance | | | JUNE 30, 2008 | |
| | |
| |
Yield [c] | | | | | | 3.9 | % |
Duration [d] | | | | | | 3.0 | |
| | | | | | | | | | | | | | | | | | | | | |
Investment Income | | Quarter Ended
June 30, 2008 | | Quarter Ended
Mar. 31, 2008 | | Quarter Ended
Dec. 31, 2007 | | Quarter Ended
Sept. 30, 2007 | |
| |
| |
| |
| |
| |
Other Investments | | | ($ | 519 | ) | | | ($ | 16,112 | ) | | | ($ | 898 | ) | | | ($ | 3,489 | ) | |
| | |
|
| | | |
|
| | | |
|
| | | |
|
| | |
Total net investment income | | | $ | 60,482 | | | | $ | 46,878 | | | | $ | 65,310 | | | | $ | 62,605 | | |
| | |
|
| | | |
|
| | | |
|
| | | |
|
| | |
| | |
Note: | [a] | Cash and equivalents are shown net of investments pending settlement. |
| | |
| [b] | Other investments includes investments in alternative and high yield bank loan funds. |
| | |
| [c] | Annualized earned yield excludes realized and unrealized gains and losses on fixed maturity investments. |
| | |
| [d] | Duration excludes other investments and operating cash. |
| | |
| [e] | Excludes cash and equivalents. |
24
ENDURANCE SPECIALTY HOLDINGS LTD.
STRUCTURED SECURITIES DETAIL
AS OF JUNE 30, 2008
| | | | | | | | | | | | |
Securitized (RMBS, CMBS, ABS and CDO) securities ratings | | Fair Value | | Percentage | | Percentage of
Investment Portfolio |
|
| |
| |
|
|
U.S. Government and agencies | | | $ | 1,185,215 | | | 43.1 | % | | 21.1 | % |
AAA/Aaa | | | | 1,512,905 | | | 54.9 | % | | 26.9 | % |
AA/Aa | | | | 12,255 | | | 0.4 | % | | 0.2 | % |
A/A | | | | 10,112 | | | 0.4 | % | | 0.2 | % |
BBB | | | | 22,110 | | | 0.8 | % | | 0.4 | % |
Below BBB | | | | 10,391 | | | 0.4 | % | | 0.2 | % |
| | |
|
| |
|
| |
|
| |
Total | | | $ | 2,752,988 | | | 100.0 | % | | 49.0 | % |
| | |
|
| |
|
| |
|
| |
| | | | | | | | | | | | |
Structured securities sectors (RMBS, CMBS, ABS and
CDO) | Fair Value | | Percentage | | Percentage |
| | |
|
| |
|
| |
|
| |
Commercial | | | $ | 741,269 | | | 26.9 | % | | 13.2 | % |
Residential | | | | 1,684,253 | | | 61.2 | % | | 30.0 | % |
Consumer | | | | 327,466 | | | 11.9 | % | | 5.8 | % |
| | |
|
| |
|
| |
|
| |
Total | | | $ | 2,752,988 | | | 100.0 | % | | 49.0 | % |
| | |
|
| |
|
| |
|
| |
Spread Duration | 3.67 years | | | | | | | | | | |
| | | | | | | | | | | | | |
Subprime collateralized securities | | | Fair Value | | Percentage | | Percentage | |
| | |
| |
| |
| |
AAA | | | | $ | 399 | | | 98.0 | % | | 0.0 | % |
BBB and below | | | | | 8 | | | 2.0 | % | | 0.0 | % |
| | |
|
|
|
| |
|
| |
|
| |
Total | | | | $ | 407 | | | 100.0 | % | | 0.0 | % |
| | |
|
|
|
| |
|
| |
|
| |
Spread Duration | 2.04 years | | | | | | | | | | | | |
| | | | | | | | | | | | | |
Collateralized debt obligations (CDO’s) | | | Fair Value | | Percentage | | Percentage | |
| | |
| |
| |
| |
AAA/Aaa | | | | $ | — | | | — | | | — | |
AA/Aa | | | | | 144 | | | 3.6 | % | | — | |
A/A | | | | | 1,315 | | | 32.4 | % | | — | |
BBB | | | | | 1,919 | | | 47.3 | % | | — | |
Below BBB | | | | | 675 | | | 16.7 | % | | — | |
| | |
|
|
|
| |
|
| |
|
| |
Total | | | | $ | 4,053 | | | 100.0 | % | | — | |
| | |
|
|
|
| |
|
| |
|
| |
| | | | | | | | | | | | | |
Collateralized debt obligations (CDO’s) | | | Fair Value | | Percentage | | Percentage | |
| | |
| |
| |
| |
Commercial | | | | $ | 4,050 | | | 99.9 | % | | — | |
Residential | | | | | 3 | | | 0.1 | % | | — | |
| | |
|
|
|
| |
|
| |
|
| |
Total | | | | $ | 4,053 | | | 100.0 | % | | — | |
| | |
|
|
|
| |
|
| |
|
| |
Spread Duration | 3.85 years | | | | | | | | | | | | |
25
ENDURANCE SPECIALTY HOLDINGS LTD.
ACTIVITY IN RESERVE FOR LOSSES AND LOSS EXPENSES
| | | | | | | | | | | | | | | | | | | | | | | | | | |
| | FOR THE QUARTER ENDED |
| |
|
| | JUNE 30, 2008 | | MAR. 31, 2008 | | DEC. 31, 2007 | | SEPT. 30, 2007 | | JUNE 30, 2007 | |
| |
| |
| |
| |
| |
| |
|
Incurred related to: | | | | | | | | | | | | | | | | | | | | | | | | | | |
Current year | | | $ | 331,507 | | | | $ | 230,456 | | | | $ | 183,253 | | | | $ | 223,946 | | | | $ | 234,768 | | |
Prior years | | | | (56,182 | ) | | | | (40,954 | ) | | | | (38,401 | ) | | | | (37,490 | ) | | | | (27,589 | ) | |
| | |
|
| | | |
|
| | | |
|
| | | |
|
| | | |
|
| | |
Total incurred | | | $ | 275,325 | | | | $ | 189,502 | | | | $ | 144,852 | | | | $ | 186,456 | | | | $ | 207,179 | | |
| | |
|
| | | |
|
| | | |
|
| | | |
|
| | | |
|
| | |
|
Paid related to: | | | | | | | | | | | | | | | | | | | | | | | | | | |
Current year | | | ($ | 16,906 | ) | | | ($ | 587 | ) | | | ($ | 42,814 | ) | | | ($ | 24,416 | ) | | | ($ | 15,896 | ) | |
Prior years | | | | (347,670 | ) | | | | (127,272 | ) | | | | (172,362 | ) | | | | (134,212 | ) | | | | (232,921 | ) | |
| | |
|
| | | |
|
| | | |
|
| | | |
|
| | | |
|
| | |
Total paid | | | ($ | 364,576 | ) | | | ($ | 127,859 | ) | | | ($ | 215,176 | ) | | | ($ | 158,628 | ) | | | ($ | 248,817 | ) | |
| | |
|
| | | |
|
| | | |
|
| | | |
|
| | | |
|
| | |
26
ENDURANCE SPECIALTY HOLDINGS LTD.
ACTIVITY IN RESERVE FOR LOSSES AND LOSS EXPENSES BY SEGMENT
(FAVORABLE) ADVERSE PRIOR ACCIDENT YEAR DEVELOPMENT DURING THE PERIODS ENDED JUNE 30, 2008
| | | | | | | | | | | | | | | | | | | | | | | | | | |
| | Insurance | | Reinsurance | | Total
Company
Sub-total | | Deposit
Accounting
Adjustment [a] | | Total
Company | |
| |
| |
| |
| |
| |
| |
| | | | | | | | | | | | | | | | |
Incurred related to prior years | | | | | | | | | | | | | | | | |
Quarter ended March 31, 2008 | | | ($ | 3,743 | ) | | | ($ | 35,498 | ) | | | ($ | 39,241 | ) | | | $ | 1,713 | | | | ($ | 40,954 | ) | |
Quarter ended June 30, 2008 | | | | (25,583 | ) | | | | (33,025 | ) | | | | (58,608 | ) | | | | (2,426 | ) | | | | (56,182 | ) | |
| | |
|
| | | |
|
| | | |
|
| | | |
|
| | | |
|
| | |
| |
Six months ended June 30, 2008 | | | ($ | 29,326 | ) | | | ($ | 68,523 | ) | | | ($ | 97,849 | ) | | | ($ | 713 | ) | | | ($ | 97,136 | ) | |
| | |
|
| | | |
|
| | | |
|
| | | |
|
| | | |
|
| | |
|
(FAVORABLE) ADVERSE PRIOR ACCIDENT YEAR DEVELOPMENT DURING THE YEAR ENDED DEC. 31, 2007 |
|
| | Insurance | | Reinsurance | | Total
Company
Sub-total | | Deposit
Accounting
Adjustment [a] | | Total
Company | |
| |
| |
| |
| |
| |
| |
| | | | | | | | | | | | | | | | | | | | | | | | | | |
Incurred related to prior years | | | | | | | | | | | | | | | | | | | | | | | | | | |
Quarter ended March 31, 2007 | | | ($ | 26,507 | ) | | | ($ | 23,072 | ) | | | ($ | 49,579 | ) | | | $ | 6,328 | | | | ($ | 55,907 | ) | |
Quarter ended June 30, 2007 | | | | (18,725 | ) | | | | (8,441 | ) | | | | (27,166 | ) | | | | 423 | | | | | (27,589 | ) | |
Quarter ended Sept. 30, 2007 | | | | (25,101 | ) | | | | (8,112 | ) | | | | (33,213 | ) | | | | 4,277 | | | | | (37,490 | ) | |
Quarter ended Dec. 31, 2007 | | | | (10,080 | ) | | | | (34,783 | ) | | | | (44,863 | ) | | | | (6,462 | ) | | | | (38,401 | ) | |
| | |
|
| | | |
|
| | | |
|
| | | |
|
| | | |
|
| | |
Year ended December 31, 2007 | | | ($ | 80,413 | ) | | | ($ | 74,408 | ) | | | ($ | 154,821 | ) | | | $ | 4,566 | | | | ($ | 159,387 | ) | |
| | |
|
| | | |
|
| | | |
|
| | | |
|
| | | |
|
| | |
| | | | | | | | | | | | | | | | | | | | | | | | | | |
(FAVORABLE) ADVERSE PRIOR ACCIDENT YEAR DEVELOPMENT DURING THE YEAR ENDED DECEMBER 31, 2006 |
| | | | | | | | | | | | | | | | | | | | | | | | | | |
| | Insurance | | Reinsurance | | Total
Company
Sub-total | | Deposit
Accounting
Adjustment [a] | | Total
Company | |
| |
| |
| |
| |
| |
| |
| | | | | | | | | | | | | | | | | | | | | | | | | | |
Incurred related to prior years | | | | | | | | | | | | | | | | | | | | | | | | | | |
Quarter ended March 31, 2006 | | | ($ | 27,855 | ) | | | ($ | 16,946 | ) | | | ($ | 44,801 | ) | | | ($ | 2,260 | ) | | | ($ | 42,541 | ) | |
Quarter ended June 30, 2006 | | | | (13,068 | ) | | | | 41,537 | | | | | 28,469 | | | | | 6,887 | | | | | 21,582 | | |
Quarter ended September 30, 2006 | | | | (5,941 | ) | | | | (7,376 | ) | | | | (13,317 | ) | | | | (3,277 | ) | | | | (10,040 | ) | |
Quarter ended December 31, 2006 | | | | (7,523 | ) | | | | (22,204 | ) | | | | (29,727 | ) | | | | (2,987 | ) | | | | (26,740 | ) | |
| | |
|
| | | |
|
| | | |
|
| | | |
|
| | | |
|
| | |
Year ended December 31, 2006 | | | ($ | 54,387 | ) | | | ($ | 4,989 | ) | | | ($ | 59,376 | ) | | | ($ | 1,637 | ) | | | ($ | 57,739 | ) | |
| | |
|
| | | |
|
| | | |
|
| | | |
|
| | | |
|
| | |
| |
[a] | For internal management reporting purposes, underwriting results by segment are presented on the basis of applying reinsurance accounting to all reinsurance contracts written. However, for financial statement presentation purposes, management determined that certain reinsurance contracts written during the period were more appropriately accounted for under the deposit method of accounting specified by AICPA SOP 98-7 whereby net premiums due on such contracts were recorded as deposit liabilities. The adjustment herein reconciles the Company’s underwriting results by segment to the Company’s financial statement presentation. |
27
ENDURANCE SPECIALTY HOLDINGS LTD.
ACTIVITY IN RESERVE FOR LOSSES AND LOSS EXPENSES BY DEVELOPMENT TAIL
(FAVORABLE) ADVERSE PRIOR ACCIDENT YEAR DEVELOPMENT
| | | | | | | | | | | | | | | | | | | | | | | | | | | | | | | |
| | FOR THE QUARTERS ENDED | | FOR THE
YEAR ENDED
DEC. 31, 2007 | |
| |
|
|
|
|
|
|
|
|
| | |
| | JUNE 30, 2008 | | MAR. 31, 2008 | | DEC. 31, 2007 | | SEPT. 30, 2007 | | JUNE 30, 2007 | | |
| |
| |
| |
| |
| |
| |
| |
INSURANCE SEGMENT | | | | | | | | | | | | | | | | | | | |
Short tail[a} | | | ($ | 7,423 | ) | | | ($ | 1,896 | ) | | | $ | 1,340 | | | | ($ | 1,003 | ) | | | ($ | 15,172 | ) | | | ($ | 30,933 | ) | |
Long tail[b] | | | | (18,160 | ) | | | | (1,847 | ) | | | | (11,420 | ) | | | | (24,098 | ) | | | | (3,553 | ) | | | | (49,480 | ) | |
Other[c] | | | | — | | | | | — | | | | | — | | | | | — | | | | | — | | | | | — | | |
| | |
|
| | | |
|
| | | |
|
| | | |
|
| | | |
|
| | | |
|
| | |
TOTAL INSURANCE | | | | (25,583 | ) | | | | (3,743 | ) | | | | (10,080 | ) | | | | (25,101 | ) | | | | (18,725 | ) | | | | (80,413 | ) | |
| | |
|
| | | |
|
| | | |
|
| | | |
|
| | | |
|
| | | |
|
| | |
|
REINSURANCE SEGMENT | | | | | | | | | | | | | | | | | | | | | | | | | | | | | | | |
Short tail[a} | | | | (10,316 | ) | | | | (31,880 | ) | | | | (30,577 | ) | | | | (12,953 | ) | | | | (10,114 | ) | | | | (69,227 | ) | |
Long tail[b] | | | | 1,187 | | | | | (101 | ) | | | | (89 | ) | | | | (2,269 | ) | | | | 1,106 | | | | | (6,450 | ) | |
Other[c] | | | | (23,896 | ) | | | | (3,517 | ) | | | | (4,117 | ) | | | | 7,110 | | | | | 567 | | | | | 1,269 | | |
| | |
|
| | | |
|
| | | |
|
| | | |
|
| | | |
|
| | | |
|
| | |
TOTAL REINSURANCE | | | | (33,025 | ) | | | | (35,498 | ) | | | | (34,783 | ) | | | | (8,112 | ) | | | | (8,441 | ) | | | | (74,408 | ) | |
| | |
|
| | | |
|
| | | |
|
| | | |
|
| | | |
|
| | | |
|
| | |
| | | | | | | | | | | | | | | | | | | | | | | | | | | | | | | |
TOTAL COMPANY SUBTOTAL | | | | (58,608 | ) | | | | (39,241 | ) | | | | (44,863 | ) | | | | (33,213 | ) | | | | (27,166 | ) | | | | (154,821 | ) | |
DEPOSIT ACCOUNTING ADJUSTMENT[d] | | | | (2,426 | ) | | | | 1,713 | | | | | (6,462 | ) | | | | 4,277 | | | | | 423 | | | | | 4,566 | | |
| | |
|
| | | |
|
| | | |
|
| | | |
|
| | | |
|
| | | |
|
| | |
| | | | | | | | | | | | | | | | | | | | | | | | | | | | | | | |
REPORTED TOTALS | | | ($ | 56,182 | ) | | | ($ | 40,954 | ) | | | ($ | 38,401 | ) | | | ($ | 37,490 | ) | | | ($ | 27,589 | ) | | | ($ | 159,387 | ) | |
| | |
|
| | | |
|
| | | |
|
| | | |
|
| | | |
|
| | | |
|
| | |
| |
[a] | Short tail business is that for which development typically emerges within a period of several quarters. The Company’s short tail line of business in the Insurance segment includes its property line of business. The Company’s short tail lines in its Reinsurance segment include property, catastrophe, marine, aerospace and surety. |
| |
[b] | Long tail business is that for which development emerges over many years. The Company’s long tail lines of business in the Insurance segment includes casualty, healthcare liability, workers’ compensation and professional lines. The Company’s long tail line of business in the Reinsurance segment includes casualty. |
| |
[c] | The Company writes certain specialty lines of business for which the loss emergence is considered to be unique in nature and thus, has been included as other. The Company’s other lines of business included in the Insurance segment is agriculture and in the Reinsurance segment are agriculture, personal accident, and other. |
| |
[d] | For internal management reporting purposes, underwriting results by segment are presented on the basis of applying reinsurance accounting to all reinsurance contracts written. However, for financial statement presentation purposes, management determined that certain reinsurance contracts written during the period were more appropriately accounted for under the deposit method of accounting specified by AICPA SOP 98-7 whereby net premiums due on such contracts were recorded as deposit liabilities. The adjustment herein reconciles the Company’s underwriting results by segment to the Company’s financial statement presentation. |
28
ENDURANCE SPECIALTY HOLDINGS LTD.
ANALYSIS OF UNPAID LOSSES AND LOSS EXPENSE
| | | | | | | | | | | | | | | | | | | | | | | | | | | | | | | | | | | | | | | | | | |
| | Insurance | | Reinsurance | | Total
Company | | Deposit
Accounting
Adjustment [a] | | Reported
Totals | |
| |
| |
| |
| |
| |
|
| | Short Tail | | Long Tail | | Other | | Total | | Short Tail | | Long Tail | | Other | | Total | | | | | | | |
AT JUNE 30, 2008 | | | | | | | | | | | | | | | | | | | | | | | | | | | | | | | | | | | | | | | | | | |
Case reserves | | | $ | 76,961 | | | $ | 100,219 | | $ | 253,067 | | $ | 430,247 | | | $ | 445,073 | | | | $ | 257,920 | | | $ | 6,338 | | $ | 709,331 | | $ | 1,139,578 | | | ($ | 41,900 | ) | | $ | 1,097,678 | |
Total reserves | | | $ | 112,959 | | | $ | 1,129,238 | | $ | 271,389 | | $ | 1,513,586 | | | $ | 729,039 | | | | $ | 839,848 | | | $ | 83,252 | | $ | 1,652,139 | | $ | 3,165,725 | | | ($ | 85,451 | ) | | $ | 3,080,274 | |
Case reserves / Total reserves | | | | 68.1 | % | | | 8.9 | % | | 93.2 | % | | 28.4 | % | | | 61.0 | % | | | | 30.7 | % | | | 7.6 | % | | 42.9 | % | | 36.0 | % | | | 49.0 | % | | | 35.6 | % |
| | | | | | | | | | | | | | | | | | | | | | | | | | | | | | | | | | | | | | | | | | |
IBNR / Total reserves | | | | 31.9 | % | | | 91.1 | % | | 6.8 | % | | 71.6 | % | | | 39.0 | % | | | | 69.3 | % | | | 92.4 | % | | 57.1 | % | | 64.0 | % | | | 51.0 | % | | | 64.4 | % |
| | | | | | | | | | | | | | | | | | | | | | | | | | | | | | | | | | | | | | | | | | |
AT MAR. 31, 2008 | | | | | | | | | | | | | | | | | | | | | | | | | | | | | | | | | | | | | | | | | | |
Case reserves | | | $ | 91,447 | | | $ | 75,515 | | $ | 21,520 | | $ | 188,482 | | | $ | 476,650 | | | | $ | 245,327 | | | $ | 8,199 | | $ | 730,176 | | $ | 918,658 | | | ($ | 51,541 | ) | | $ | 867,117 | |
Total reserves | | | $ | 127,760 | | | $ | 1,050,603 | | $ | 83,274 | | $ | 1,261,637 | | | $ | 750,966 | | | | $ | 837,407 | | | $ | 177,810 | | $ | 1,766,183 | | $ | 3,027,820 | | | ($ | 99,393 | ) | | $ | 2,928,427 | |
Case reserves / Total reserves | | | | 71.6 | % | | | 7.2 | % | | 25.8 | % | | 14.9 | % | | | 63.5 | % | | | | 29.3 | % | | | 4.6 | % | | 41.3 | % | | 30.3 | % | | | 51.9 | % | | | 29.6 | % |
| | | | | | | | | | | | | | | | | | | | | | | | | | | | | | | | | | | | | | | | | | |
IBNR / Total reserves | | | | 28.4 | % | | | 92.8 | % | | 74.2 | % | | 85.1 | % | | | 36.5 | % | | | | 70.7 | % | | | 95.4 | % | | 58.7 | % | | 69.7 | % | | | 48.1 | % | | | 70.4 | % |
| | | | | | | | | | | | | | | | | | | | | | | | | | | | | | | | | | | | | | | | | | |
AT DEC. 31, 2007 | | | | | | | | | | | | | | | | | | | | | | | | | | | | | | | | | | | | | | | | | | |
Case reserves | | | $ | 88,197 | | | $ | 57,282 | | $ | 64,259 | | $ | 209,738 | | | $ | 507,230 | | | | $ | 244,276 | | | $ | 8,784 | | $ | 760,290 | | $ | 970,028 | | | ($ | 52,131 | ) | | $ | 917,897 | |
Total reserves | | | $ | 122,643 | | | $ | 968,891 | | $ | 91,092 | | $ | 1,182,626 | | | $ | 794,983 | | | | $ | 839,744 | | | $ | 177,835 | | $ | 1,812,562 | | $ | 2,995,188 | | | ($ | 102,964 | ) | | $ | 2,892,224 | |
Case reserves / Total reserves | | | | 71.9 | % | | | 5.9 | % | | 70.5 | % | | 17.7 | % | | | 63.8 | % | | | | 29.1 | % | | | 4.9 | % | | 41.9 | % | | 32.4 | % | | | 50.6 | % | | | 31.7 | % |
| | | | | | | | | | | | | | | | | | | | | | | | | | | | | | | | | | | | | | | | | | |
IBNR / Total reserves | | | | 28.1 | % | | | 94.1 | % | | 29.5 | % | | 82.3 | % | | | 36.2 | % | | | | 70.9 | % | | | 95.1 | % | | 58.1 | % | | 67.6 | % | | | 49.4 | % | | | 68.3 | % |
| | | | | | | | | | | | | | | | | | | | | | | | | | | | | | | | | | | | | | | | | | |
AT SEPT. 30, 2007 | | | | | | | | | | | | | | | | | | | | | | | | | | | | | | | | | | | | | | | | | | |
Case reserves | | | $ | 116,106 | | | $ | 46,092 | | | — | | $ | 162,198 | | | $ | 577,103 | | | | $ | 244,289 | | | $ | 18,260 | | $ | 839,652 | | $ | 1,001,850 | | | ($ | 67,709 | ) | | $ | 934,141 | |
Total reserves | | | $ | 145,657 | | | $ | 899,080 | | | — | | $ | 1,044,737 | | | $ | 923,945 | | | | $ | 837,817 | | | $ | 161,607 | | $ | 1,923,369 | | $ | 2,968,106 | | | ($ | 126,296 | ) | | $ | 2,841,810 | |
Case reserves / Total reserves | | | | 79.7 | % | | | 5.1 | % | | — | | | 15.5 | % | | | 62.5 | % | | | | 29.2 | % | | | 11.3 | % | | 43.7 | % | | 33.8 | % | | | 53.6 | % | | | 32.9 | % |
| | | | | | | | | | | | | | | | | | | | | | | | | | | | | | | | | | | | | | | | | | |
IBNR / Total reserves | | | | 20.3 | % | | | 94.9 | % | | — | | | 84.5 | % | | | 37.5 | % | | | | 70.8 | % | | | 88.7 | % | | 56.3 | % | | 66.2 | % | | | 46.4 | % | | | 67.1 | % |
| | | | | | | | | | | | | | | | | | | | | | | | | | | | | | | | | | | | | | | | | | |
AT JUNE 30, 2007 | | | | | | | | | | | | | | | | | | | | | | | | | | | | | | | | | | | | | | | | | | |
Case reserves | | | $ | 100,339 | | | $ | 49,928 | | | — | | $ | 150,267 | | | $ | 614,638 | | | | $ | 234,964 | | | $ | 9,267 | | $ | 858,869 | | $ | 1,009,136 | | | ($ | 65,639 | ) | | $ | 943,497 | |
Total reserves | | | $ | 134,405 | | | $ | 832,868 | | | — | | $ | 967,273 | | | $ | 974,941 | | | | $ | 833,779 | | | $ | 126,404 | | $ | 1,935,124 | | $ | 2,902,397 | | | ($ | 134,872 | ) | | $ | 2,767,525 | |
Case reserves / Total reserves | | | | 74.7 | % | | | 6.0 | % | | — | | | 15.5 | % | | | 63.0 | % | | | | 28.2 | % | | | 7.3 | % | | 44.4 | % | | 34.8 | % | | | 48.7 | % | | | 34.1 | % |
| | | | | | | | | | | | | | | | | | | | | | | | | | | | | | | | | | | | | | | | | | |
IBNR / Total reserves | | | | 25.3 | % | | | 94.0 | % | | — | | | 84.5 | % | | | 37.0 | % | | | | 71.8 | % | | | 92.7 | % | | 55.6 | % | | 65.2 | % | | | 51.3 | % | | | 65.9 | % |
| |
|
[a] | For internal management reporting purposes, underwriting results by segment are presented on the basis of applying reinsurance accounting to all reinsurance contracts written. However, for financial statement presentation purposes, management determined that certain reinsurance contracts written during the period were more appropriately accounted for under the deposit method of accounting specified by AICPA SOP 98-7 whereby net premiums due on such contracts were recorded as deposit liabilities. The adjustment herein reconciles the Company’s underwriting results by segment to the Company’s financial statement presentation. |
29
ENDURANCE SPECIALTY HOLDINGS LTD.
DILUTIVE SHARES FOR EPS CALCULATION
| | | | | | | | | | | | | | | |
| | | | QUARTERS ENDED
JUNE 30, | | SIX MONTHS ENDED
JUNE 30, | |
| | | |
| |
| |
| | | | 2008 | | 2007 | | 2008 | | 2007 | |
| | | |
| |
| |
| |
| |
| | | | | | | | | | | | | | | |
DILUTIVE SHARES
OUTSTANDING: | | Average market price per share | | $ | 35.05 | | $ | 38.09 | | $ | 37.19 | | $ | 36.64 | |
AS REPORTED | | Basic weighted average common shares outstanding | | | 58,558 | | | 65,531 | | | 58,691 | | | 66,069 | |
| | | | | | | | | | | | | | | |
| | Add: weighted avg. unvested restricted share units | | | 1,360 | | | 804 | | | 1,263 | | | 771 | |
| | Weighted average exercise price per share | | | — | | | — | | | — | | | — | |
| | Proceeds from unrecognized restricted share unit expense | | $ | 28,186 | | $ | 26,420 | | $ | 28,186 | | $ | 26,420 | |
| | Less: restricted share units bought back via treasury method | | | (804 | ) | | (694 | ) | | (758 | ) | | (721 | ) |
| | | | | | | | | | | | | | | |
| | Add: weighted avg. dilutive warrants outstanding | | | 6,413 | | | 7,202 | | | 6,718 | | | 7,202 | |
| | Weighted average exercise price per share | | $ | 15.37 | | $ | 16.37 | | $ | 15.37 | | $ | 16.37 | |
| | Less: warrants bought back via treasury method | | | (2,812 | ) | | (3,096 | ) | | (2,777 | ) | | (3,218 | ) |
| | | | | | | | | | | | | | | |
| | Add: weighted avg. dilutive options outstanding | | | 2,029 | | | 2,284 | | | 2,034 | | | 2,385 | |
| | Weighted average exercise price per share | | $ | 17.81 | | $ | 18.33 | | $ | 17.81 | | $ | 18.30 | |
| | Proceeds from unrecognized option expense | | $ | 48 | | $ | 87 | | $ | 48 | | $ | 87 | |
| | Less: options bought back via treasury method | | | (1,032 | ) | | (1,101 | ) | | (975 | ) | | (1,194 | ) |
| | | |
|
| |
|
| |
|
| |
|
| |
| | Weighted average dilutive shares outstanding | | | 63,712 | | | 70,930 | | | 64,196 | | | 71,294 | |
| | | |
|
| |
|
| |
|
| |
|
| |
| | | | | | | | | | | | | | | |
|
| |
Note: | Warrants, options and unvested restricted share units that are anti-dilutive are not included in the calculation of diluted shares outstanding. Warrants, options and unvested restricted share units are anti-dilutive for earnings per share in any period in which there is a net loss and the anti-dilution is reflected in the calculations above as additional treasury method repurchases. Restricted share units are included in the calculation of basic and diluted weighted shares outstanding. The treasury stock method assumes that the proceeds received from the exercise of options or warrants will be used to repurchase the Company’s common shares at the average market price during the period of calculation. SFAS No. 123R also requires that any unrecognized stock based compensation expense that will be recorded in future periods be included as proceeds for purposes of the treasury stock repurchases. |
30
ENDURANCE SPECIALTY HOLDINGS LTD.
OPERATING INCOME RECONCILIATION
EARNINGS PER SHARE INFORMATION - AS REPORTED, GAAP
| | | | | | | | | | | | | |
| | QUARTERS ENDED
JUNE 30, | | SIX MONTHS ENDED
JUNE 30, | |
| |
| |
| |
| | 2008 | | 2007 | | 2008 | | 2007 | |
| |
| |
| |
| |
| |
Net income | | $ | 103,338 | | $ | 135,341 | | $ | 181,149 | | $ | 237,176 | |
Add (Less) after-tax items: | | | | | | | | | | | | | |
Net foreign exchange gains | | | (4,071 | ) | | (1,914 | ) | | (4,081 | ) | | (372 | ) |
Net realized losses on investments | | | 3,411 | | | 7,750 | | | 15,137 | | | 9,569 | |
| |
|
| |
|
| |
|
| |
|
| |
Operating income before preferred dividends | | $ | 102,678 | | $ | 141,177 | | $ | 192,205 | | $ | 246,373 | |
Preferred dividends | | | (3,875 | ) | | (3,875 | ) | | (7,750 | ) | | (7,750 | ) |
| |
|
| |
|
| |
|
| |
|
| |
Operating income available to common shareholders | | $ | 98,803 | | $ | 137,302 | | $ | 184,455 | | $ | 238,623 | |
| |
|
| |
|
| |
|
| |
|
| |
| | | | | | | | | | | | | |
Weighted average common shares outstanding | | | | | | | | | | | | | |
Basic | | | 58,558 | | | 65,531 | | | 58,691 | | | 66,069 | |
Dilutive | | | 63,712 | | | 70,930 | | | 64,196 | | | 71,294 | |
| | | | | | | | | | | | | |
Basic per common share data | | | | | | | | | | | | | |
Net income available to common shareholders | | $ | 1.70 | | $ | 2.01 | | $ | 2.95 | | $ | 3.47 | |
Add (Less) after-tax items: | | | | | | | | | | | | | |
Net foreign exchange gains | | | (0.07 | ) | | (0.03 | ) | | (0.07 | ) | | (0.01 | ) |
Net realized losses on investments | | | 0.06 | | | 0.12 | | | 0.26 | | | 0.15 | |
| |
|
| |
|
| |
|
| |
|
| |
Operating income available to common shareholders | | $ | 1.69 | | $ | 2.10 | | $ | 3.14 | | $ | 3.61 | |
| |
|
| |
|
| |
|
| |
|
| |
| | | | | | | | | | | | | |
Diluted per common share data | | | | | | | | | | | | | |
Net income available to common shareholders | | $ | 1.56 | | $ | 1.85 | | $ | 2.70 | | $ | 3.22 | |
Add (Less) after-tax items: | | | | | | | | | | | | | |
Net foreign exchange gains | | | (0.06 | ) | | (0.02 | ) | | (0.06 | ) | | (0.01 | ) |
Net realized losses on investments | | | 0.05 | | | 0.11 | | | 0.23 | | | 0.14 | |
| |
|
| |
|
| |
|
| |
|
| |
Operating income available to common shareholders | | $ | 1.55 | | $ | 1.94 | | $ | 2.87 | | $ | 3.35 | |
| |
|
| |
|
| |
|
| |
|
| |
31
ENDURANCE SPECIALTY HOLDINGS LTD.
DILUTIVE SHARES SENSITIVITY ANALYSIS
| | | | | | | | | | | | | | | | | | | | | | | | | | | | | | | | |
DILUTIVE SHARES OUSTANDING | |
| |
Market Price per Share | |
| |
$ | 24.00 | | $ | 25.00 | | $ | 26.00 | | $ | 27.00 | | $ | 28.00 | | $ | 29.00 | | $ | 30.00 | | $ | 31.00 | | $ | 32.00 | | $ | 33.00 | | $ | 34.00 | |
|
|
|
|
|
|
|
|
|
|
|
|
|
|
|
|
|
|
|
|
|
|
|
|
|
|
|
|
|
|
|
|
|
| 62,372 | | | 62,588 | | | 62,788 | | | 62,972 | | | 63,144 | | | 63,304 | | | 63,453 | | | 63,592 | | | 63,723 | | | 63,846 | | | 63,961 | |
32
ENDURANCE SPECIALTY HOLDINGS LTD.
BOOK VALUE PER SHARE
| | | | | | | | | | | | | | |
| | | | JUNE 30, | | | |
| | | |
| | DEC. 31,
2007 | |
| | | | 2008 | | 2007 | | |
| | | |
| |
| |
| |
|
DILUTIVE COMMON SHARES OUTSTANDING: | | Price per share at period end | | $ | 30.79 | | $ | 40.04 | | $ | 41.73 | |
AS-IF CONVERTED [a] | | Basic common shares outstanding[b] | | | 58,398 | | | 64,734 | | | 59,384 | |
| | Add: unvested restricted shares and restricted share units | | | 1,260 | | | 1,142 | | | 1,041 | |
| | Add: dilutive warrants outstanding | | | 6,095 | | | 7,202 | | | 7,095 | |
| | Weighted average exercise price per share | | $ | 15.37 | | $ | 16.37 | | $ | 15.87 | |
| | Add: dilutive options outstanding | | | 2,022 | | | 2,192 | | | 2,045 | |
| | Weighted average exercise price per share | | $ | 17.81 | | $ | 18.34 | | $ | 18.12 | |
| | | | | | | | | | | | |
| | Book Value[c] | | $ | 2,333,895 | | $ | 2,179,846 | | $ | 2,312,259 | |
| | Add: proceeds from converted warrants | | | 93,676 | | | 117,902 | | | 112,593 | |
| | Add: proceeds from converted options | | | 36,003 | | | 40,199 | | | 37,059 | |
| | | |
|
| |
|
| |
|
| |
| | Pro forma book value | | $ | 2,463,574 | | $ | 2,337,947 | | $ | 2,461,911 | |
| | Dilutive shares outstanding | | | 67,775 | | | 75,271 | | | 69,564 | |
| | | | | | | | | | | | | | |
| | | Basic book value per common share | | $ | 39.97 | | $ | 33.67 | | $ | 38.94 | | |
| | | Diluted book value per common share | | $ | 36.35 | | $ | 31.06 | | $ | 35.39 | | |
| | | | | | | | | | | | | | |
|
|
|
|
|
|
|
|
|
|
|
|
|
DILUTIVE COMMON SHARES OUTSTANDING: | | Price per share at period end | | $ | 30.79 | | $ | 40.04 | | $ | 41.73 | |
TREASURY STOCK METHOD | | Basic common shares outstanding[b] | | | 58,398 | | | 64,734 | | | 59,384 | |
| | Add: unvested restricted shares and restricted share units | | | 1,260 | | | 1,142 | | | 1,041 | |
| | Add: dilutive warrants outstanding | | | 6,095 | | | 7,202 | | | 7,095 | |
| | Weighted average exercise price per share | | $ | 15.37 | | $ | 16.37 | | $ | 15.87 | |
| | Less: warrants bought back via treasury method | | | (3,042 | ) | | (2,945 | ) | | (2,698 | ) |
| | Add: dilutive options outstanding | | | 2,022 | | | 2,192 | | | 2,045 | |
| | Weighted average exercise price per share | | $ | 17.81 | | $ | 18.34 | | $ | 18.12 | |
| | Less: options bought back via treasury method | | | (1,170 | ) | | (1,004 | ) | | (889 | ) |
| | | |
|
| |
|
| |
|
| |
| | Dilutive shares outstanding | | | 63,563 | | | 71,321 | | | 65,978 | |
| | | | | | | | | | | | | | |
| | | Basic book value per common share | | $ | 39.97 | | $ | 33.67 | | $ | 38.94 | | |
| | | Diluted book value per common share | | $ | 36.72 | | $ | 30.56 | | $ | 35.05 | | |
| | | | | | | | | | | | | | |
| |
|
|
[a] | The as-if converted method assumes that the proceeds received upon exercise of options and warrants will be retained by the Company and the resulting common shares from exercise will remain outstanding. |
| |
[b] | Basic common shares includes vested restricted share units. |
| |
[c] | Excludes the $200 million liquidation value of the preferred shares. |
33
ENDURANCE SPECIALTY HOLDINGS LTD.
SHAREHOLDER RETURN ANALYSIS
| | | | | | | | | | | | | | | | | | | | | |
| | SIX MONTHS
JUNE 30, 2008 | | YEARS ENDED DECEMBER 31, | |
| | |
| |
| | | 2007 | | 2006 | | 2005 | | 2004 | | 2003 | |
| |
| |
| |
| |
| |
| |
| |
Net income (loss) available to common shareholders | | | $ | 173,399 | | | $ | 505,607 | | $ | 482,626 | | ($ | 223,204 | ) | $ | 355,584 | | $ | 263,437 | |
| | | | | | | | | | | | | | | | | | | | | |
Dividends paid to common shareholders | | | | (29,943 | ) | | | (64,353 | ) | | (66,262 | ) | | (61,695 | ) | | (50,346 | ) | | (20,505 | ) |
| | | | | | | | | | | | | | | | | | | | | |
Shareholders’ equity[a] | | | | 2,333,895 | | | | 2,312,259 | | | 2,097,874 | | | 1,672,543 | | | 1,862,455 | | | 1,644,815 | |
| | | | | | | | | | | | | | | | | | | | | |
Return on beginning equity | | | | 7.5 | % | | | 24.1 | % | | 28.9 | % | | (12.0 | )% | | 21.6 | % | | 21.6 | % |
| | | | | | | | | | | | | | | | | | | | | |
Dividend payout ratio[b] | | | | 1.3 | % | | | 3.1 | % | | 4.0 | % | | 3.3 | % | | 3.1 | % | | 1.7 | % |
| | | | | | | | | | | | | | | | | | | | | |
| | | | | | | | | | | | | | | | | | | | | |
Dilutive common shares outstanding | | | | 63,563 | | | | 65,978 | | | 72,654 | | | 72,173 | | | 66,729 | | | 68,445 | |
| | | | | | | | | | | | | | | | | | | | | |
Diluted book value per common share
(treasury stock method) | | | $ | 36.72 | | | $ | 35.05 | | $ | 28.87 | | $ | 23.17 | | $ | 27.91 | | $ | 24.03 | |
| | | | | | | | | | | | | | | | | | | | | |
| |
Change in diluted book value per common share | | | | 4.8 | % | | | 21.4 | % | | 24.6 | % | | (17.0 | )% | | 16.1 | % | | 10.6 | % |
| |
| | | | | | | | | | | | | | | | | | | | | |
| |
Total return to common shareholders [c] | | | | 6.1 | % | | | 24.5 | % | | 28.6 | % | | (13.7 | )% | | 19.2 | % | | 12.3 | % |
| |
| |
[a] | Excludes the $200 million liquidation value of the preferred shares. |
| |
[b] | Dividend payout ratio is calculated as dividends paid divided by beginning shareholders’ equity. |
| |
[c] | Total return to common shareholders is calculated as the sum of the change in diluted book value per common share and the dividend payout ratio. |
34
ENDURANCE SPECIALTY HOLDINGS LTD.
REGULATION G
In presenting the Company’s results, management has included and discussed certain non-GAAP measures. Management believes that these non-GAAP measures, which may be defined differently by other companies, better explain the Company’s results of operations in a manner that allows for a more complete understanding of the underlying trends in the Company’s business. However, these measures should not be viewed as a substitute for those determined in accordance with GAAP.
Operating income is an internal performance measure used by the Company in the management of its operations. Operating income represents after-tax operational results excluding, as applicable, after-tax net realized capital gains or losses and after-tax net foreign exchange gains or losses because the amount of these gains or losses is heavily influenced by, and fluctuates in part, according to the availability of market opportunities. The Company believes these amounts are largely independent of its business and underwriting process and including them distorts the analysis of trends in its operations. In addition to presenting net income determined in accordance with GAAP, the Company believes that showing operating income enables investors, analysts, rating agencies and other users of its financial information to more easily analyze the Company’s results of operations in a manner similar to how management analyzes the Company’s underlying business performance. Operating income should not be viewed as a substitute for GAAP net income. Please see page 31 for a reconciliation of operating income to net income.
Return on Average Equity (ROAE) is comprised using the average common equity calculated as the arithmetic average of the beginning and ending common equity balances for stated periods. Return on Beginning Equity (ROBE) is comprised using the beginning common equity for stated periods. The Company presents various measures of Return on Equity that are commonly recognized as a standard of performance by investors, analysts, rating agencies and other users of its financial information.
Investment yield is provided by the Company’s investment managers and is calculated by dividing net investment income by average invested assets at amortized cost. The Company utilizes and presents the investment yield in order to better disclose the performance of the Company’s investments and to show the components of the Company’s ROE.
The Company has included diluted book value per common share because it takes into account the effect of dilutive securities; therefore, the Company believes it is a better measure of calculating shareholder returns than book value per common share. Please see page 33 for a reconciliation of diluted book value per common share to basic book value per common share.
35